Bingham Farms, MI Map & Demographics
Bingham Farms Map
Bingham Farms Overview
$85,353
PER CAPITA INCOME
$250,001
AVG FAMILY INCOME
$197,273
AVG HOUSEHOLD INCOME
57.0%
WAGE / INCOME GAP [ % ]
43.0¢/ $1
WAGE / INCOME GAP [ $ ]
0.45
INEQUALITY / GINI INDEX
1,623
TOTAL POPULATION
625
MALE POPULATION
998
FEMALE POPULATION
62.63
MALES / 100 FEMALES
159.68
FEMALES / 100 MALES
68.9
MEDIAN AGE
2.8
AVG FAMILY SIZE
3.3
AVG HOUSEHOLD SIZE
500
LABOR FORCE [ PEOPLE ]
34.2%
PERCENT IN LABOR FORCE
3.2%
UNEMPLOYMENT RATE
Bingham Farms Area Codes
Income in Bingham Farms
Income Overview in Bingham Farms
Per Capita Income in Bingham Farms is $85,353, while median incomes of families and households are $250,001 and $197,273 respectively.
| Characteristic | Number | Measure |
| Per Capita Income | 1,623 | $85,353 |
| Median Family Income | 322 | $250,001 |
| Mean Family Income | 322 | $311,015 |
| Median Household Income | 474 | $197,273 |
| Mean Household Income | 474 | $253,394 |
| Income Deficit | 322 | $0 |
| Wage / Income Gap (%) | 1,623 | 57.00% |
| Wage / Income Gap ($) | 1,623 | 43.00¢ per $1 |
| Gini / Inequality Index | 1,623 | 0.45 |
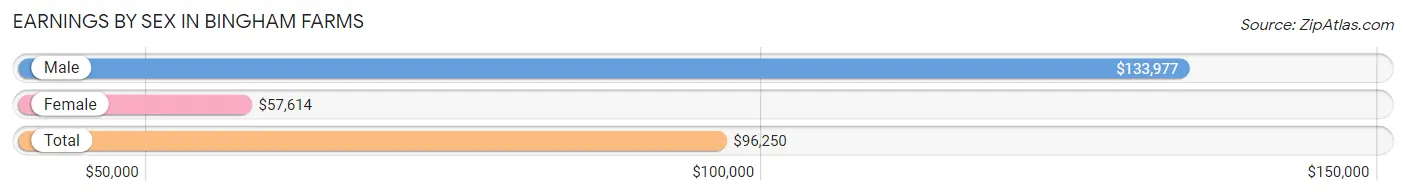
Earnings by Sex in Bingham Farms
Average Earnings in Bingham Farms are $96,250, $133,977 for men and $57,614 for women, a difference of 57.0%.
| Sex | Number | Average Earnings |
| Male | 289 (52.5%) | $133,977 |
| Female | 261 (47.4%) | $57,614 |
| Total | 550 (100.0%) | $96,250 |
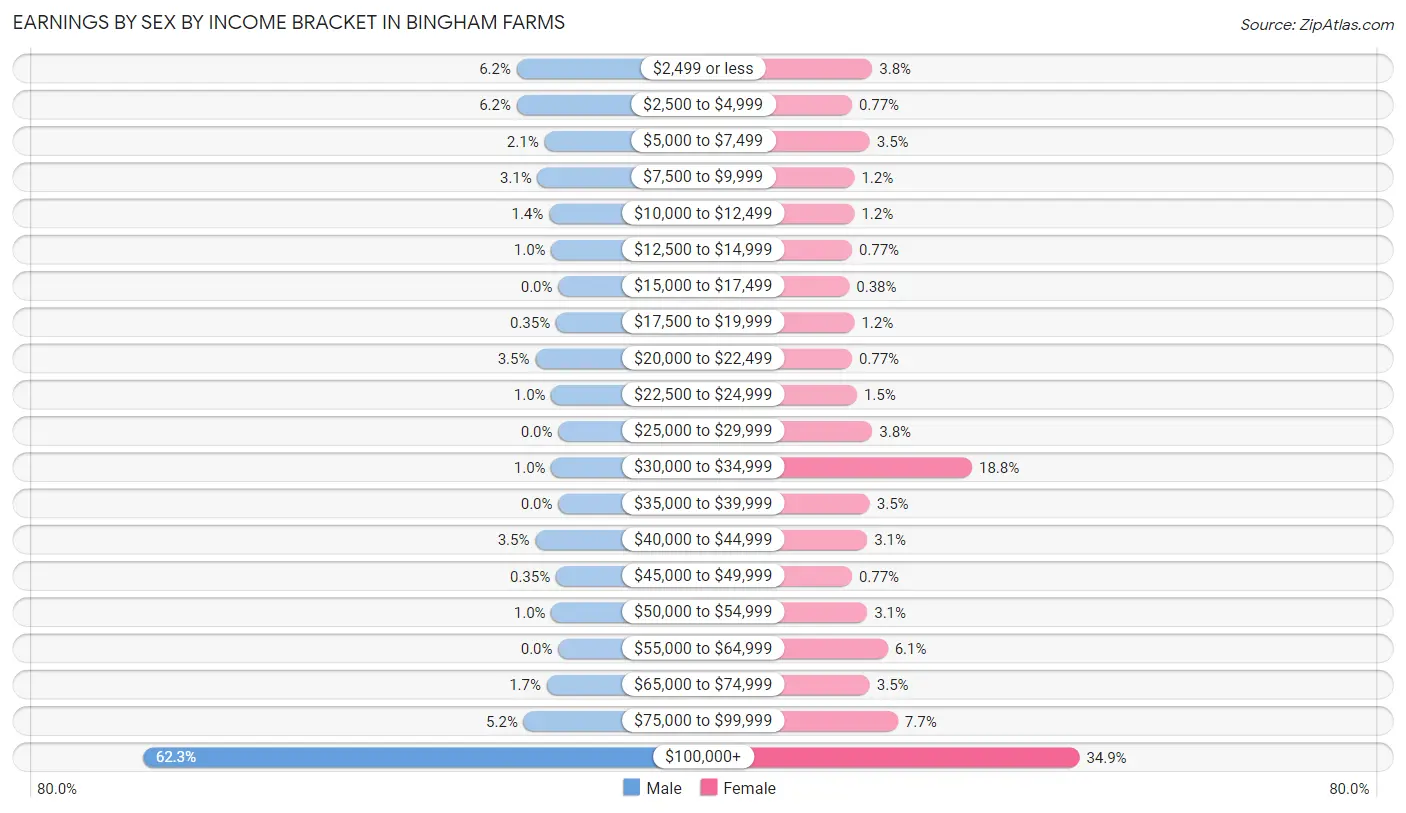
Earnings by Sex by Income Bracket in Bingham Farms
The most common earnings brackets in Bingham Farms are $100,000+ for men (180 | 62.3%) and $100,000+ for women (91 | 34.9%).
| Income | Male | Female |
| $2,499 or less | 18 (6.2%) | 10 (3.8%) |
| $2,500 to $4,999 | 18 (6.2%) | 2 (0.8%) |
| $5,000 to $7,499 | 6 (2.1%) | 9 (3.5%) |
| $7,500 to $9,999 | 9 (3.1%) | 3 (1.1%) |
| $10,000 to $12,499 | 4 (1.4%) | 3 (1.1%) |
| $12,500 to $14,999 | 3 (1.0%) | 2 (0.8%) |
| $15,000 to $17,499 | 0 (0.0%) | 1 (0.4%) |
| $17,500 to $19,999 | 1 (0.4%) | 3 (1.1%) |
| $20,000 to $22,499 | 10 (3.5%) | 2 (0.8%) |
| $22,500 to $24,999 | 3 (1.0%) | 4 (1.5%) |
| $25,000 to $29,999 | 0 (0.0%) | 10 (3.8%) |
| $30,000 to $34,999 | 3 (1.0%) | 49 (18.8%) |
| $35,000 to $39,999 | 0 (0.0%) | 9 (3.5%) |
| $40,000 to $44,999 | 10 (3.5%) | 8 (3.1%) |
| $45,000 to $49,999 | 1 (0.4%) | 2 (0.8%) |
| $50,000 to $54,999 | 3 (1.0%) | 8 (3.1%) |
| $55,000 to $64,999 | 0 (0.0%) | 16 (6.1%) |
| $65,000 to $74,999 | 5 (1.7%) | 9 (3.5%) |
| $75,000 to $99,999 | 15 (5.2%) | 20 (7.7%) |
| $100,000+ | 180 (62.3%) | 91 (34.9%) |
| Total | 289 (100.0%) | 261 (100.0%) |
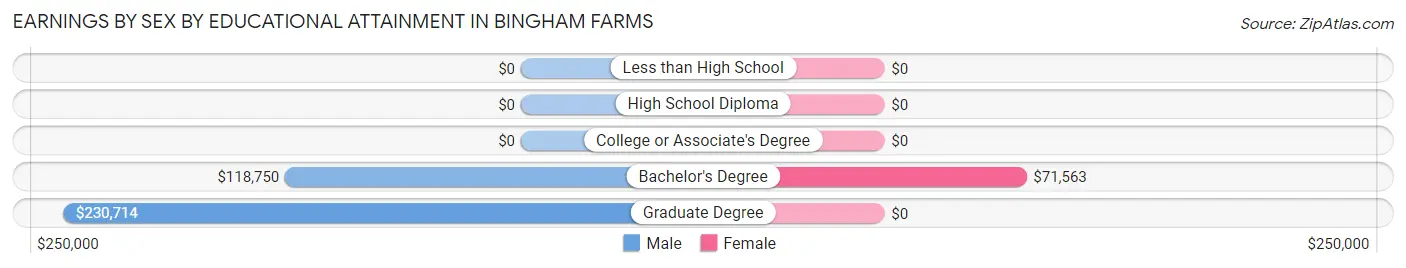
Earnings by Sex by Educational Attainment in Bingham Farms
Average earnings in Bingham Farms are $156,875 for men and $58,068 for women, a difference of 63.0%. Men with an educational attainment of graduate degree enjoy the highest average annual earnings of $230,714, while those with bachelor's degree education earn the least with $118,750. Women with an educational attainment of bachelor's degree earn the most with the average annual earnings of $71,563, while those with bachelor's degree education have the smallest earnings of $71,563.
| Educational Attainment | Male Income | Female Income |
| Less than High School | - | - |
| High School Diploma | - | - |
| College or Associate's Degree | - | - |
| Bachelor's Degree | $118,750 | $71,563 |
| Graduate Degree | $230,714 | $0 |
| Total | $156,875 | $58,068 |
Family Income in Bingham Farms
Family Income Brackets in Bingham Farms
According to the Bingham Farms family income data, there are 185 families falling into the $200,000+ income range, which is the most common income bracket and makes up 57.5% of all families.
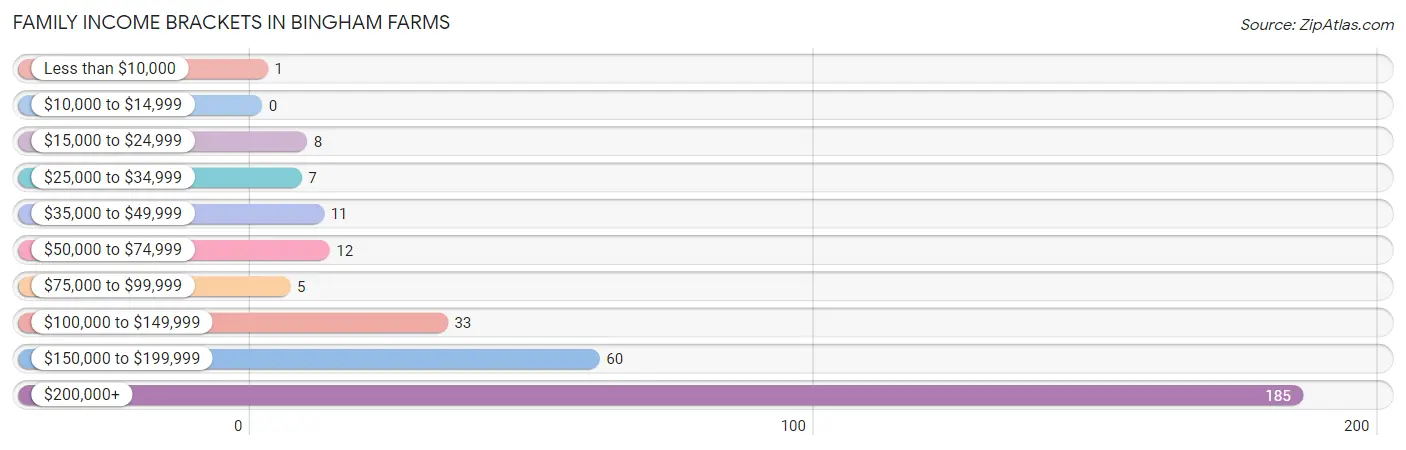
| Income Bracket | # Families | % Families |
| Less than $10,000 | 1 | 0.3% |
| $10,000 to $14,999 | 0 | 0.0% |
| $15,000 to $24,999 | 8 | 2.5% |
| $25,000 to $34,999 | 7 | 2.2% |
| $35,000 to $49,999 | 11 | 3.4% |
| $50,000 to $74,999 | 12 | 3.7% |
| $75,000 to $99,999 | 5 | 1.6% |
| $100,000 to $149,999 | 33 | 10.2% |
| $150,000 to $199,999 | 60 | 18.6% |
| $200,000+ | 185 | 57.5% |
Family Income by Famaliy Size in Bingham Farms
3-person families (28 | 8.7%) account for the highest median family income in Bingham Farms with $250,001 per family, while 2-person families (216 | 67.1%) have the highest median income of $112,500 per family member.
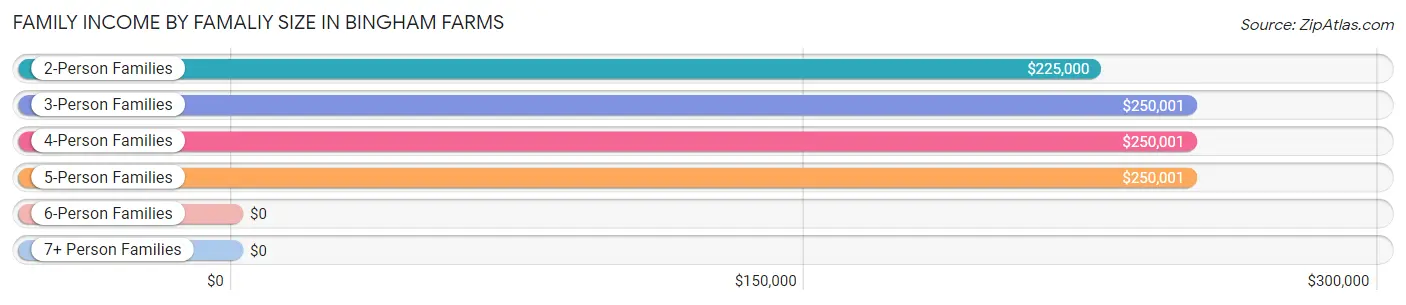
| Income Bracket | # Families | Median Income |
| 2-Person Families | 216 (67.1%) | $225,000 |
| 3-Person Families | 28 (8.7%) | $250,001 |
| 4-Person Families | 53 (16.5%) | $250,001 |
| 5-Person Families | 15 (4.7%) | $250,001 |
| 6-Person Families | 10 (3.1%) | $0 |
| 7+ Person Families | 0 (0.0%) | $0 |
| Total | 322 (100.0%) | $250,001 |
Family Income by Number of Earners in Bingham Farms
The median family income in Bingham Farms is $250,001, with families comprising 2 earners (110) having the highest median family income of $250,001, while families with 1 earner (111) have the lowest median family income of $161,094, accounting for 34.2% and 34.5% of families, respectively.
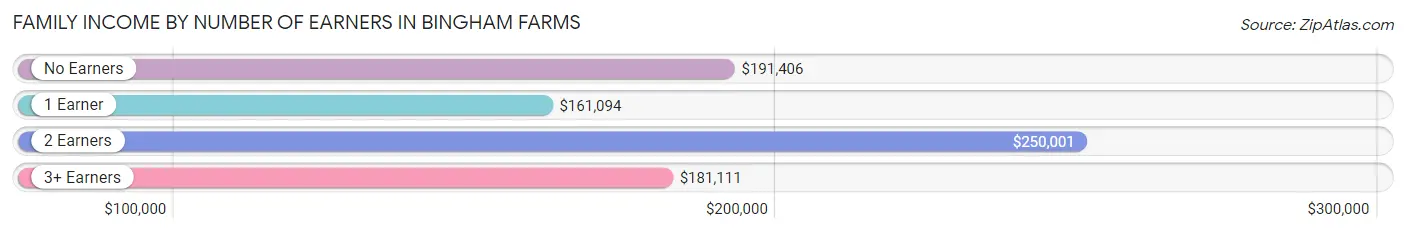
| Number of Earners | # Families | Median Income |
| No Earners | 73 (22.7%) | $191,406 |
| 1 Earner | 111 (34.5%) | $161,094 |
| 2 Earners | 110 (34.2%) | $250,001 |
| 3+ Earners | 28 (8.7%) | $181,111 |
| Total | 322 (100.0%) | $250,001 |
Household Income in Bingham Farms
Household Income Brackets in Bingham Farms
With 234 households falling in the category, the $200,000+ income range is the most frequent in Bingham Farms, accounting for 49.4% of all households. In contrast, only 1 households (0.2%) fall into the less than $10,000 income bracket, making it the least populous group.
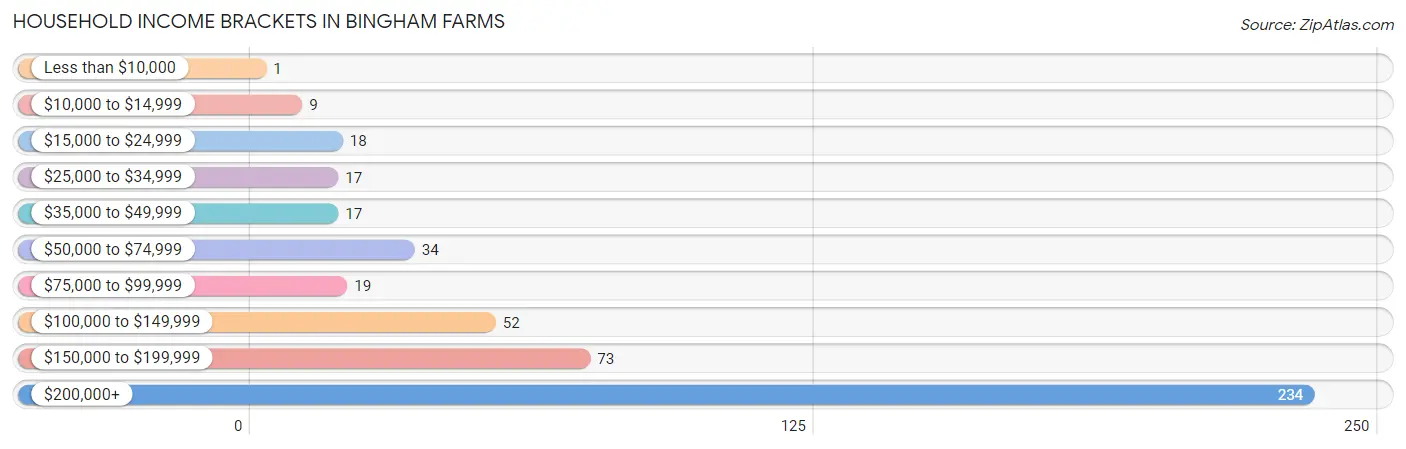
| Income Bracket | # Households | % Households |
| Less than $10,000 | 1 | 0.2% |
| $10,000 to $14,999 | 9 | 1.9% |
| $15,000 to $24,999 | 18 | 3.8% |
| $25,000 to $34,999 | 17 | 3.6% |
| $35,000 to $49,999 | 17 | 3.6% |
| $50,000 to $74,999 | 34 | 7.2% |
| $75,000 to $99,999 | 19 | 4.0% |
| $100,000 to $149,999 | 52 | 11.0% |
| $150,000 to $199,999 | 73 | 15.4% |
| $200,000+ | 234 | 49.4% |
Household Income by Householder Age in Bingham Farms
The median household income in Bingham Farms is $197,273, with the highest median household income of $250,001 found in the 45 to 64 years age bracket for the primary householder. A total of 168 households (35.4%) fall into this category.
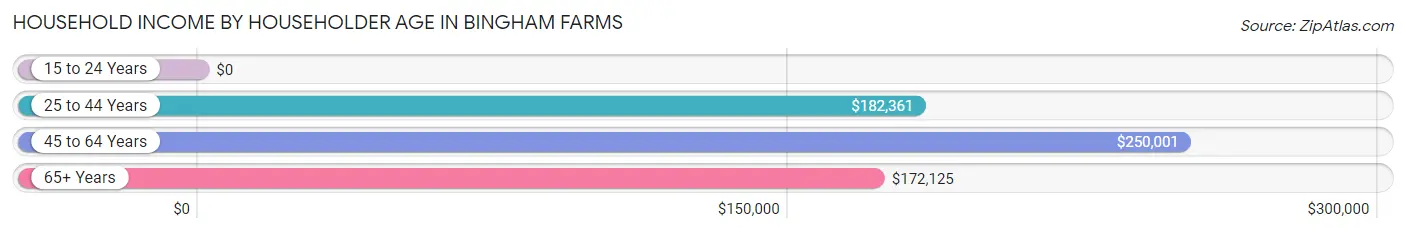
| Income Bracket | # Households | Median Income |
| 15 to 24 Years | 0 (0.0%) | $0 |
| 25 to 44 Years | 41 (8.6%) | $182,361 |
| 45 to 64 Years | 168 (35.4%) | $250,001 |
| 65+ Years | 265 (55.9%) | $172,125 |
| Total | 474 (100.0%) | $197,273 |
Poverty in Bingham Farms
Income Below Poverty by Sex and Age in Bingham Farms
With 11.2% poverty level for males and 38.1% for females among the residents of Bingham Farms, 75 year old and over males and 75 year old and over females are the most vulnerable to poverty, with 52 males (31.3%) and 338 females (70.6%) in their respective age groups living below the poverty level.
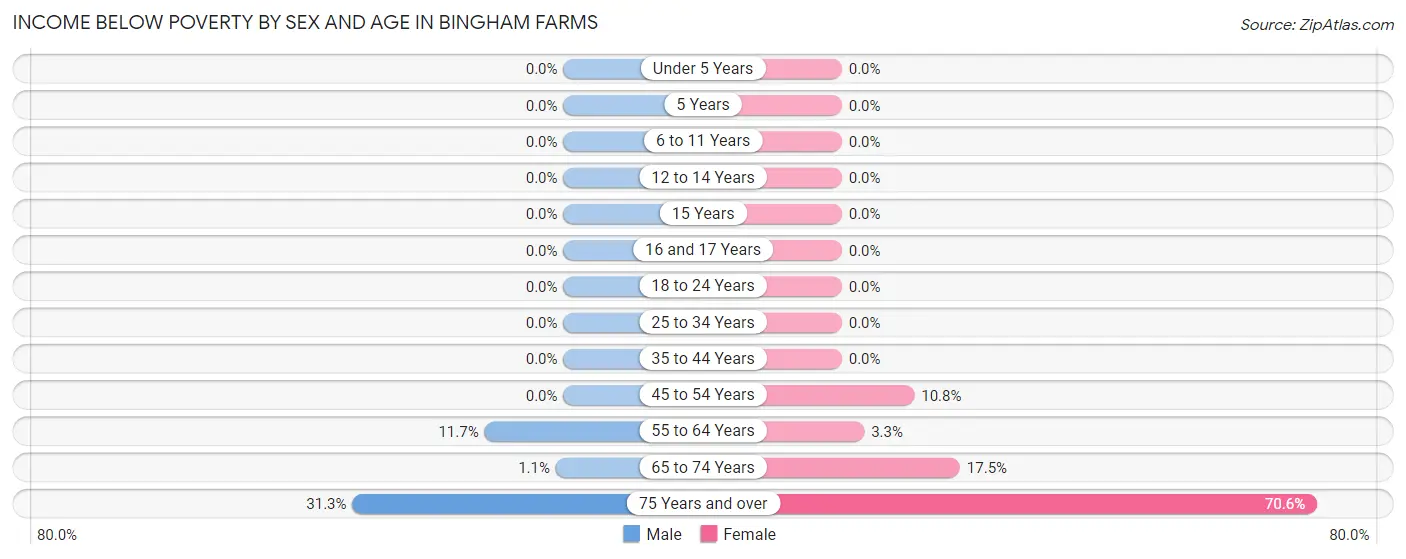
| Age Bracket | Male | Female |
| Under 5 Years | 0 (0.0%) | 0 (0.0%) |
| 5 Years | 0 (0.0%) | 0 (0.0%) |
| 6 to 11 Years | 0 (0.0%) | 0 (0.0%) |
| 12 to 14 Years | 0 (0.0%) | 0 (0.0%) |
| 15 Years | 0 (0.0%) | 0 (0.0%) |
| 16 and 17 Years | 0 (0.0%) | 0 (0.0%) |
| 18 to 24 Years | 0 (0.0%) | 0 (0.0%) |
| 25 to 34 Years | 0 (0.0%) | 0 (0.0%) |
| 35 to 44 Years | 0 (0.0%) | 0 (0.0%) |
| 45 to 54 Years | 0 (0.0%) | 7 (10.8%) |
| 55 to 64 Years | 13 (11.7%) | 5 (3.3%) |
| 65 to 74 Years | 1 (1.1%) | 20 (17.5%) |
| 75 Years and over | 52 (31.3%) | 338 (70.6%) |
| Total | 66 (11.2%) | 370 (38.1%) |
Income Above Poverty by Sex and Age in Bingham Farms
According to the poverty statistics in Bingham Farms, males aged under 5 years and females aged under 5 years are the age groups that are most secure financially, with 100.0% of males and 100.0% of females in these age groups living above the poverty line.
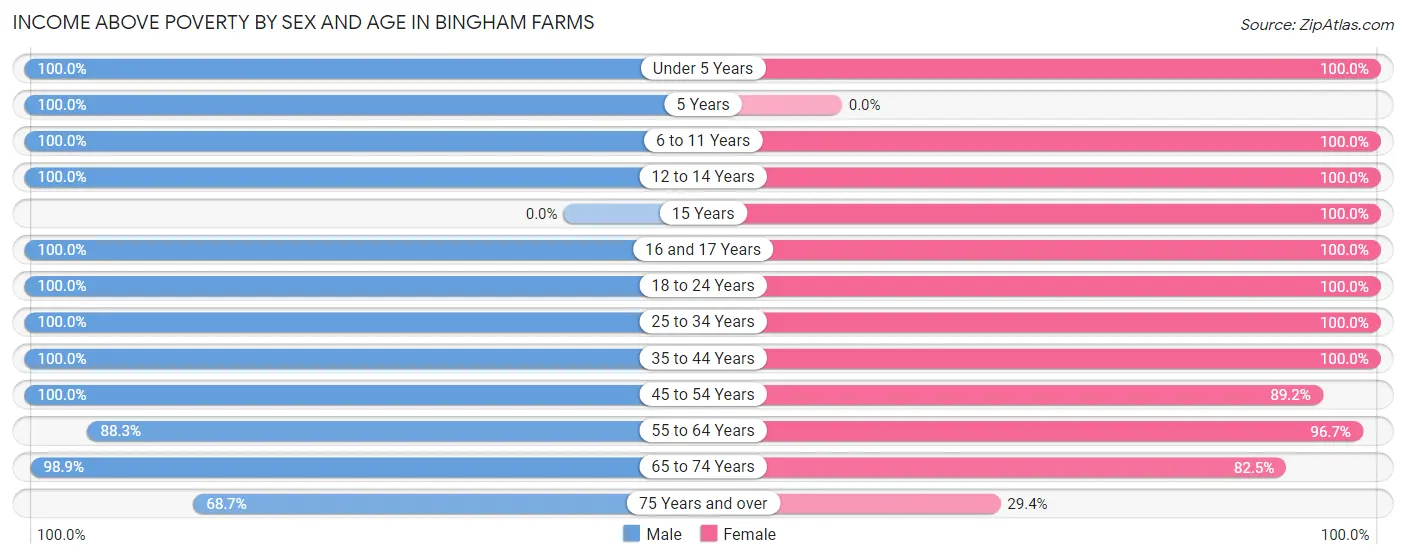
| Age Bracket | Male | Female |
| Under 5 Years | 1 (100.0%) | 2 (100.0%) |
| 5 Years | 1 (100.0%) | 0 (0.0%) |
| 6 to 11 Years | 48 (100.0%) | 32 (100.0%) |
| 12 to 14 Years | 33 (100.0%) | 20 (100.0%) |
| 15 Years | 0 (0.0%) | 23 (100.0%) |
| 16 and 17 Years | 27 (100.0%) | 13 (100.0%) |
| 18 to 24 Years | 18 (100.0%) | 7 (100.0%) |
| 25 to 34 Years | 21 (100.0%) | 28 (100.0%) |
| 35 to 44 Years | 30 (100.0%) | 39 (100.0%) |
| 45 to 54 Years | 47 (100.0%) | 58 (89.2%) |
| 55 to 64 Years | 98 (88.3%) | 145 (96.7%) |
| 65 to 74 Years | 88 (98.9%) | 94 (82.5%) |
| 75 Years and over | 114 (68.7%) | 141 (29.4%) |
| Total | 526 (88.8%) | 602 (61.9%) |
Income Below Poverty Among Married-Couple Families in Bingham Farms
The poverty statistics for married-couple families in Bingham Farms show that 0.4% or 1 of the total 285 families live below the poverty line. Families with no children have the highest poverty rate of 0.5%, comprising of 1 families. On the other hand, families with 1 or 2 children have the lowest poverty rate of 0.0%, which includes 0 families.
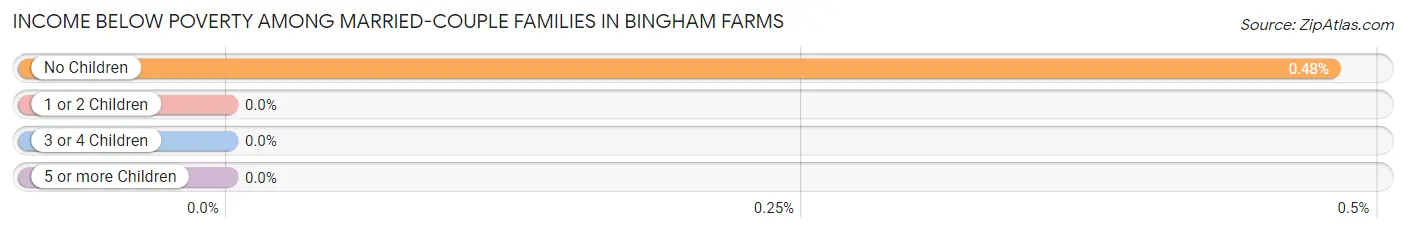
| Children | Above Poverty | Below Poverty |
| No Children | 207 (99.5%) | 1 (0.5%) |
| 1 or 2 Children | 57 (100.0%) | 0 (0.0%) |
| 3 or 4 Children | 20 (100.0%) | 0 (0.0%) |
| 5 or more Children | 0 (0.0%) | 0 (0.0%) |
| Total | 284 (99.7%) | 1 (0.4%) |
Income Below Poverty Among Single-Parent Households in Bingham Farms
| Children | Single Father | Single Mother |
| No Children | 0 (0.0%) | 0 (0.0%) |
| 1 or 2 Children | 0 (0.0%) | 0 (0.0%) |
| 3 or 4 Children | 0 (0.0%) | 0 (0.0%) |
| 5 or more Children | 0 (0.0%) | 0 (0.0%) |
| Total | 0 (0.0%) | 0 (0.0%) |
Income Below Poverty Among Married-Couple vs Single-Parent Households in Bingham Farms
| Children | Married-Couple Families | Single-Parent Households |
| No Children | 1 (0.5%) | 0 (0.0%) |
| 1 or 2 Children | 0 (0.0%) | 0 (0.0%) |
| 3 or 4 Children | 0 (0.0%) | 0 (0.0%) |
| 5 or more Children | 0 (0.0%) | 0 (0.0%) |
| Total | 1 (0.4%) | 0 (0.0%) |
Race in Bingham Farms
The most populous races in Bingham Farms are White / Caucasian (1,385 | 85.3%), Black / African American (124 | 7.6%), and Two or more Races (51 | 3.1%).
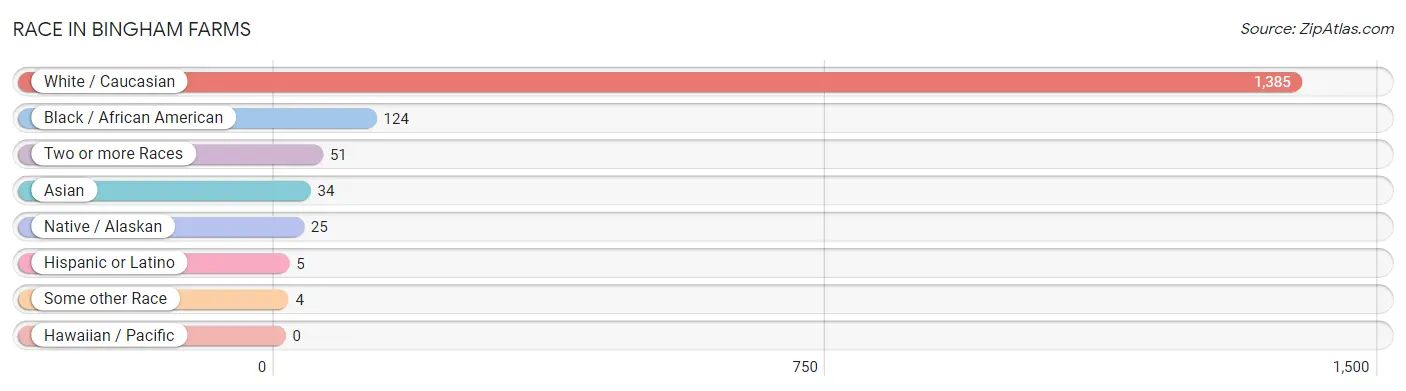
| Race | # Population | % Population |
| Asian | 34 | 2.1% |
| Black / African American | 124 | 7.6% |
| Hawaiian / Pacific | 0 | 0.0% |
| Hispanic or Latino | 5 | 0.3% |
| Native / Alaskan | 25 | 1.5% |
| White / Caucasian | 1,385 | 85.3% |
| Two or more Races | 51 | 3.1% |
| Some other Race | 4 | 0.3% |
| Total | 1,623 | 100.0% |
Ancestry in Bingham Farms
The most populous ancestries reported in Bingham Farms are German (199 | 12.3%), English (167 | 10.3%), Irish (85 | 5.2%), Polish (82 | 5.1%), and Italian (70 | 4.3%), together accounting for 37.2% of all Bingham Farms residents.
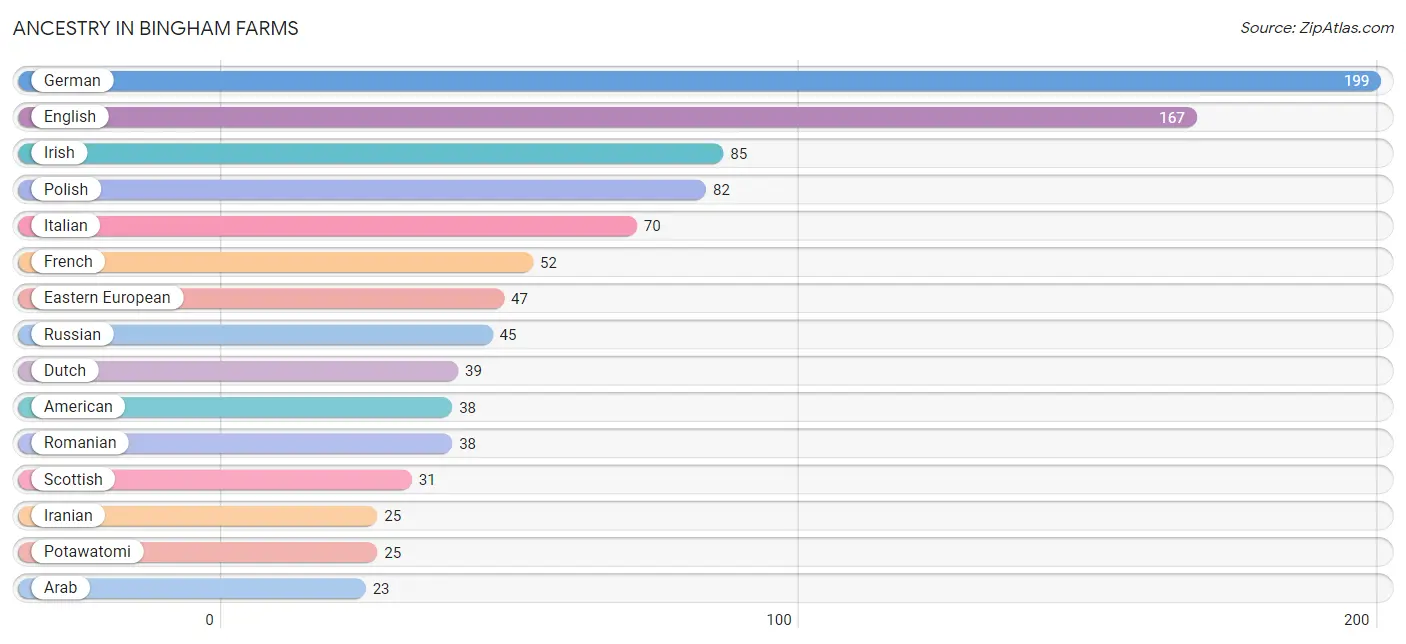
| Ancestry | # Population | % Population |
| Albanian | 2 | 0.1% |
| Alsatian | 3 | 0.2% |
| American | 38 | 2.3% |
| Arab | 23 | 1.4% |
| Armenian | 12 | 0.7% |
| Assyrian / Chaldean / Syriac | 7 | 0.4% |
| Austrian | 5 | 0.3% |
| Belgian | 8 | 0.5% |
| Bhutanese | 17 | 1.1% |
| British | 9 | 0.5% |
| Bulgarian | 4 | 0.3% |
| Canadian | 7 | 0.4% |
| Czech | 4 | 0.3% |
| Danish | 3 | 0.2% |
| Dutch | 39 | 2.4% |
| Eastern European | 47 | 2.9% |
| English | 167 | 10.3% |
| Estonian | 4 | 0.3% |
| European | 15 | 0.9% |
| Finnish | 3 | 0.2% |
| French | 52 | 3.2% |
| French Canadian | 7 | 0.4% |
| German | 199 | 12.3% |
| Greek | 15 | 0.9% |
| Hungarian | 12 | 0.7% |
| Indian (Asian) | 19 | 1.2% |
| Iranian | 25 | 1.5% |
| Iraqi | 4 | 0.3% |
| Irish | 85 | 5.2% |
| Italian | 70 | 4.3% |
| Jamaican | 4 | 0.3% |
| Lebanese | 1 | 0.1% |
| Lithuanian | 1 | 0.1% |
| Maltese | 1 | 0.1% |
| Mexican | 4 | 0.3% |
| Norwegian | 19 | 1.2% |
| Pakistani | 4 | 0.3% |
| Peruvian | 1 | 0.1% |
| Polish | 82 | 5.1% |
| Portuguese | 3 | 0.2% |
| Potawatomi | 25 | 1.5% |
| Romanian | 38 | 2.3% |
| Russian | 45 | 2.8% |
| Scandinavian | 3 | 0.2% |
| Scotch-Irish | 15 | 0.9% |
| Scottish | 31 | 1.9% |
| Serbian | 9 | 0.5% |
| South American | 1 | 0.1% |
| Sri Lankan | 3 | 0.2% |
| Swedish | 3 | 0.2% |
| Syrian | 3 | 0.2% |
| Thai | 8 | 0.5% |
| Welsh | 16 | 1.0% | View All 53 Rows |
Immigrants in Bingham Farms
The most numerous immigrant groups reported in Bingham Farms came from Europe (141 | 8.7%), Western Europe (125 | 7.7%), Germany (121 | 7.5%), Asia (64 | 3.9%), and South Central Asia (25 | 1.5%), together accounting for 29.3% of all Bingham Farms residents.
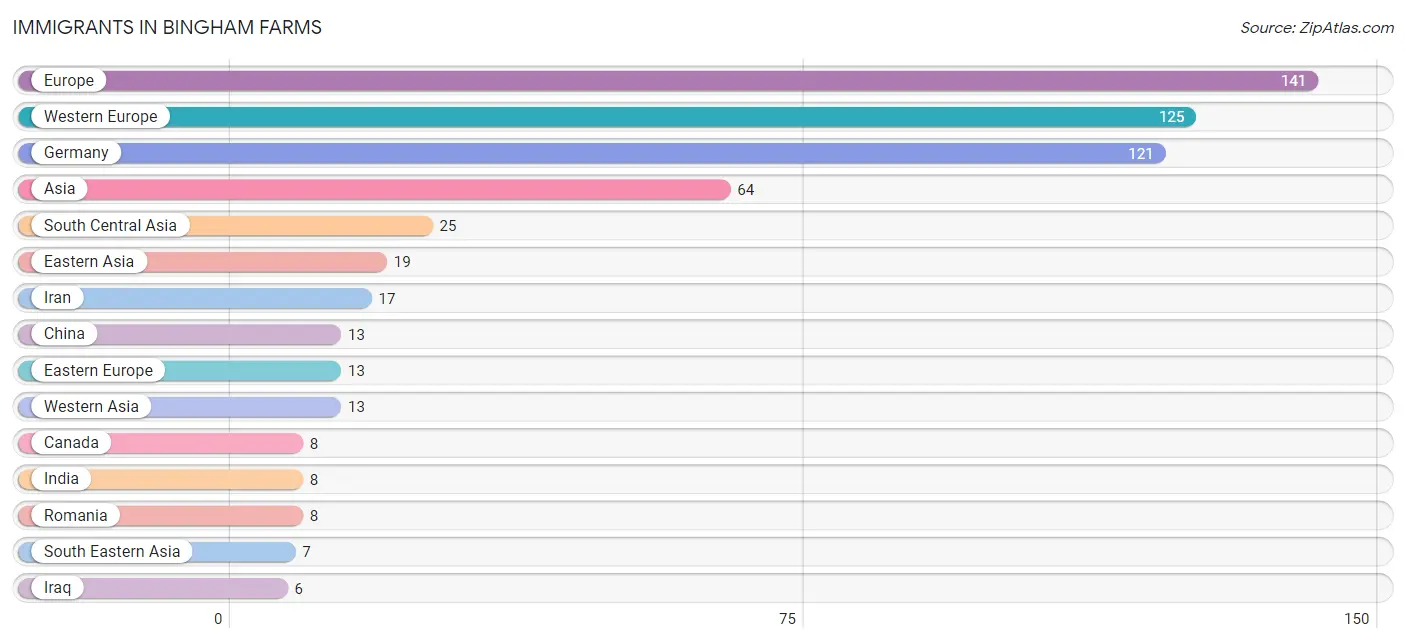
| Immigration Origin | # Population | % Population |
| Albania | 2 | 0.1% |
| Asia | 64 | 3.9% |
| Canada | 8 | 0.5% |
| China | 13 | 0.8% |
| Eastern Asia | 19 | 1.2% |
| Eastern Europe | 13 | 0.8% |
| Europe | 141 | 8.7% |
| France | 4 | 0.3% |
| Germany | 121 | 7.5% |
| Hong Kong | 3 | 0.2% |
| India | 8 | 0.5% |
| Iran | 17 | 1.1% |
| Iraq | 6 | 0.4% |
| Japan | 6 | 0.4% |
| Latin America | 1 | 0.1% |
| Lebanon | 3 | 0.2% |
| Northern Europe | 3 | 0.2% |
| Peru | 1 | 0.1% |
| Romania | 8 | 0.5% |
| Russia | 3 | 0.2% |
| Scotland | 3 | 0.2% |
| South America | 1 | 0.1% |
| South Central Asia | 25 | 1.5% |
| South Eastern Asia | 7 | 0.4% |
| Thailand | 4 | 0.3% |
| Vietnam | 3 | 0.2% |
| Western Asia | 13 | 0.8% |
| Western Europe | 125 | 7.7% | View All 28 Rows |
Sex and Age in Bingham Farms
Sex and Age in Bingham Farms
The most populous age groups in Bingham Farms are 85 Years and over (98 | 15.7%) for men and 85 Years and over (358 | 35.9%) for women.
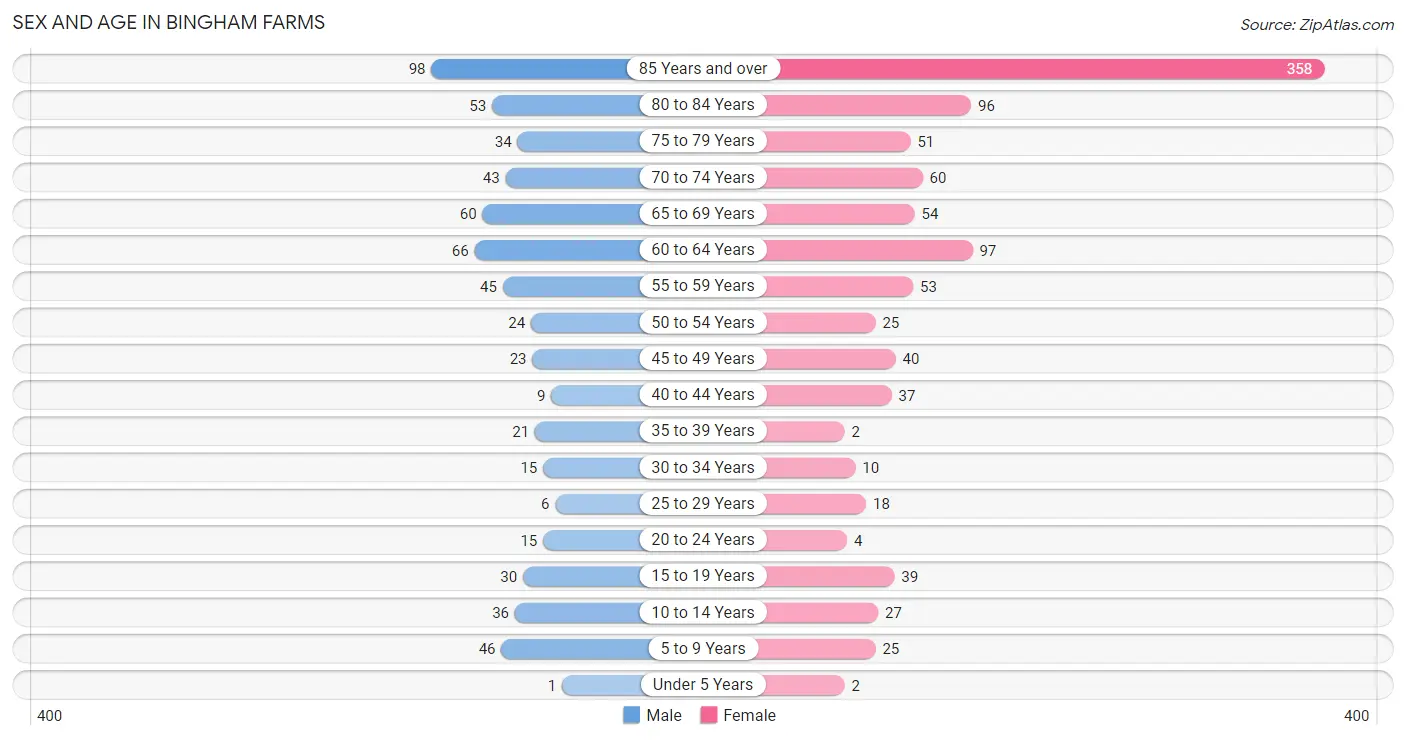
| Age Bracket | Male | Female |
| Under 5 Years | 1 (0.2%) | 2 (0.2%) |
| 5 to 9 Years | 46 (7.4%) | 25 (2.5%) |
| 10 to 14 Years | 36 (5.8%) | 27 (2.7%) |
| 15 to 19 Years | 30 (4.8%) | 39 (3.9%) |
| 20 to 24 Years | 15 (2.4%) | 4 (0.4%) |
| 25 to 29 Years | 6 (1.0%) | 18 (1.8%) |
| 30 to 34 Years | 15 (2.4%) | 10 (1.0%) |
| 35 to 39 Years | 21 (3.4%) | 2 (0.2%) |
| 40 to 44 Years | 9 (1.4%) | 37 (3.7%) |
| 45 to 49 Years | 23 (3.7%) | 40 (4.0%) |
| 50 to 54 Years | 24 (3.8%) | 25 (2.5%) |
| 55 to 59 Years | 45 (7.2%) | 53 (5.3%) |
| 60 to 64 Years | 66 (10.6%) | 97 (9.7%) |
| 65 to 69 Years | 60 (9.6%) | 54 (5.4%) |
| 70 to 74 Years | 43 (6.9%) | 60 (6.0%) |
| 75 to 79 Years | 34 (5.4%) | 51 (5.1%) |
| 80 to 84 Years | 53 (8.5%) | 96 (9.6%) |
| 85 Years and over | 98 (15.7%) | 358 (35.9%) |
| Total | 625 (100.0%) | 998 (100.0%) |
Families and Households in Bingham Farms
Median Family Size in Bingham Farms
The median family size in Bingham Farms is 2.79 persons per family, with married-couple families (285 | 88.5%) accounting for the largest median family size of 2.83 persons per family. On the other hand, single male/father families (3 | 0.9%) represent the smallest median family size with 2.00 persons per family.
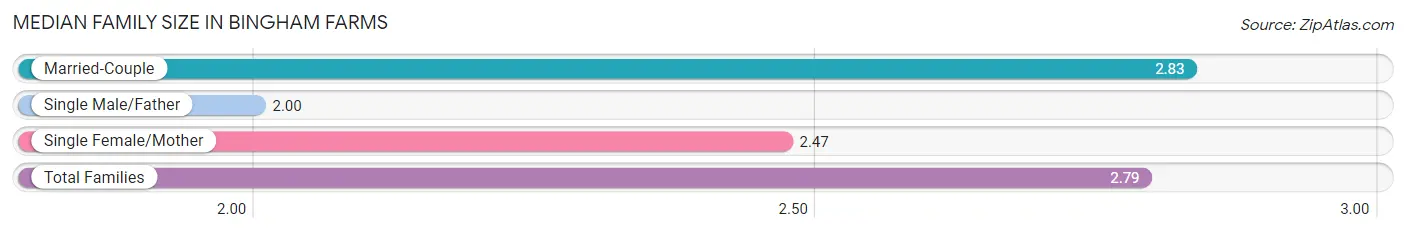
| Family Type | # Families | Family Size |
| Married-Couple | 285 (88.5%) | 2.83 |
| Single Male/Father | 3 (0.9%) | 2.00 |
| Single Female/Mother | 34 (10.6%) | 2.47 |
| Total Families | 322 (100.0%) | 2.79 |
Median Household Size in Bingham Farms
The median household size in Bingham Farms is 3.30 persons per household, with non-family households (152 | 32.1%) accounting for the largest median household size of 4.38 persons per household. single male/father households (3 | 0.6%) represent the smallest median household size with 2.00 persons per household.
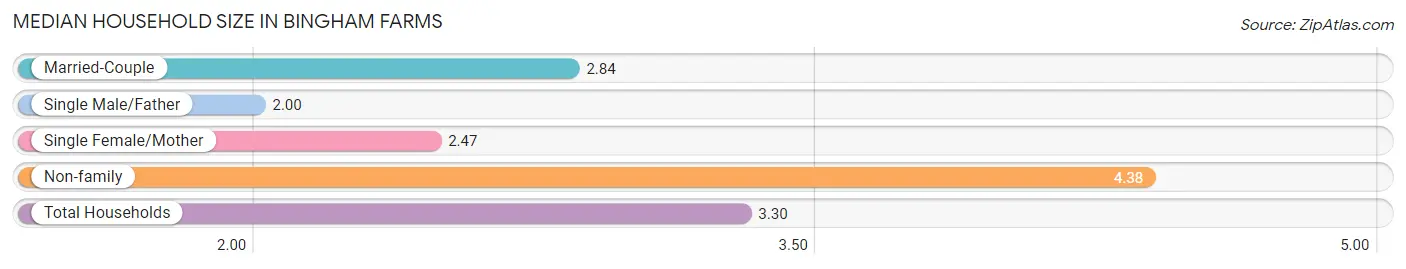
| Household Type | # Households | Household Size |
| Married-Couple | 285 (60.1%) | 2.84 |
| Single Male/Father | 3 (0.6%) | 2.00 |
| Single Female/Mother | 34 (7.2%) | 2.47 |
| Non-family | 152 (32.1%) | 4.38 |
| Total Households | 474 (100.0%) | 3.30 |
Household Size by Marriage Status in Bingham Farms
Out of a total of 474 households in Bingham Farms, 322 (67.9%) are family households, while 152 (32.1%) are nonfamily households. The most numerous type of family households are 2-person households, comprising 216, and the most common type of nonfamily households are 1-person households, comprising 106.
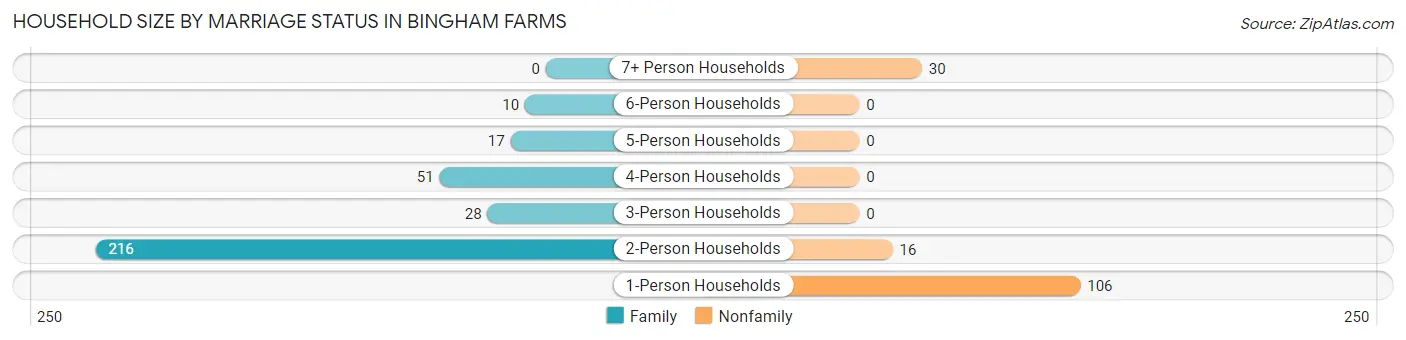
| Household Size | Family Households | Nonfamily Households |
| 1-Person Households | - | 106 (22.4%) |
| 2-Person Households | 216 (45.6%) | 16 (3.4%) |
| 3-Person Households | 28 (5.9%) | 0 (0.0%) |
| 4-Person Households | 51 (10.8%) | 0 (0.0%) |
| 5-Person Households | 17 (3.6%) | 0 (0.0%) |
| 6-Person Households | 10 (2.1%) | 0 (0.0%) |
| 7+ Person Households | 0 (0.0%) | 30 (6.3%) |
| Total | 322 (67.9%) | 152 (32.1%) |
Female Fertility in Bingham Farms
Fertility by Age in Bingham Farms
Average fertility rate in Bingham Farms is 6.0 births per 1,000 women. Women in the age bracket of 20 to 34 years have the highest fertility rate with 31.0 births per 1,000 women. Women in the age bracket of 20 to 34 years acount for 100.0% of all women with births.
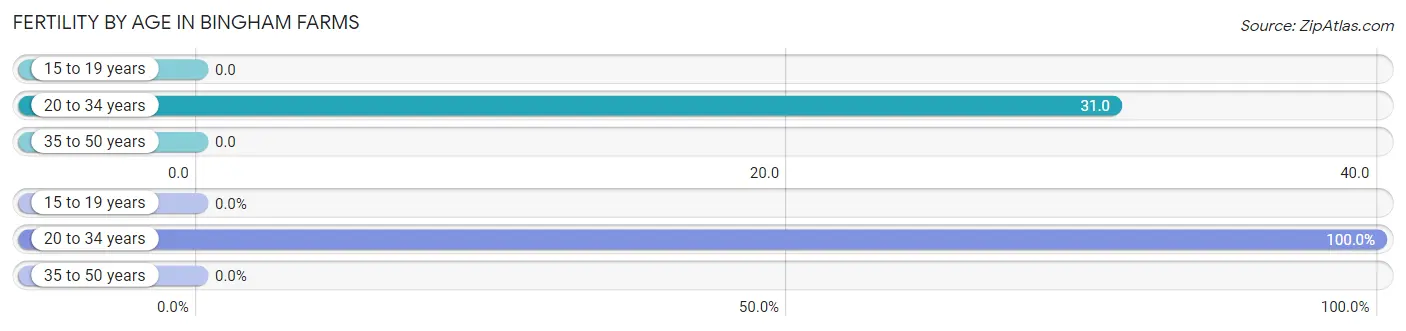
| Age Bracket | Women with Births | Births / 1,000 Women |
| 15 to 19 years | 0 (0.0%) | 0.0 |
| 20 to 34 years | 1 (100.0%) | 31.0 |
| 35 to 50 years | 0 (0.0%) | 0.0 |
| Total | 1 (100.0%) | 6.0 |
Fertility by Age by Marriage Status in Bingham Farms
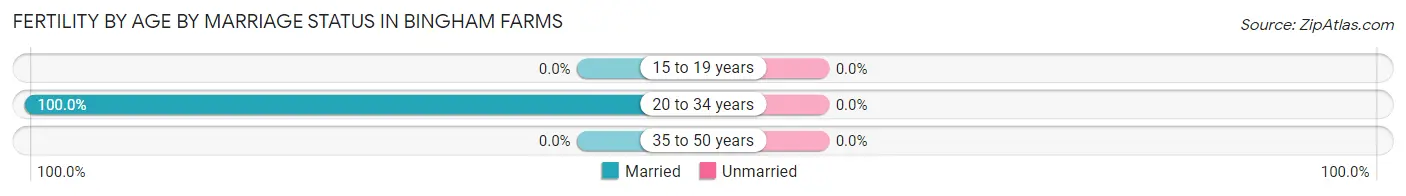
| Age Bracket | Married | Unmarried |
| 15 to 19 years | 0 (0.0%) | 0 (0.0%) |
| 20 to 34 years | 1 (100.0%) | 0 (0.0%) |
| 35 to 50 years | 0 (0.0%) | 0 (0.0%) |
| Total | 1 (100.0%) | 0 (0.0%) |
Fertility by Education in Bingham Farms
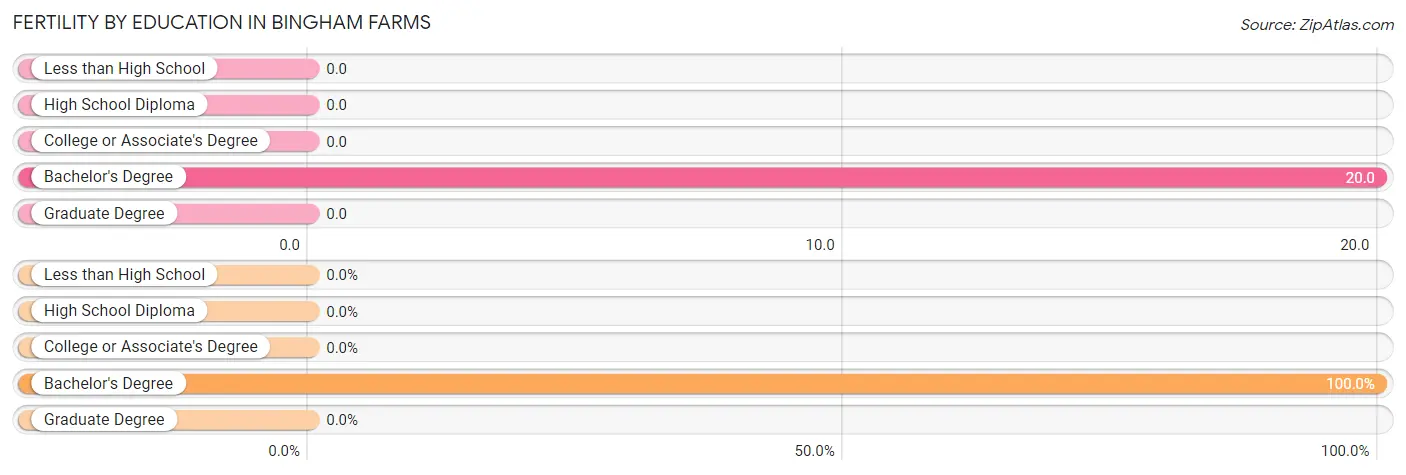
| Educational Attainment | Women with Births | Births / 1,000 Women |
| Less than High School | 0 (0.0%) | 0.0 |
| High School Diploma | 0 (0.0%) | 0.0 |
| College or Associate's Degree | 0 (0.0%) | 0.0 |
| Bachelor's Degree | 1 (100.0%) | 20.0 |
| Graduate Degree | 0 (0.0%) | 0.0 |
| Total | 1 (100.0%) | 6.0 |
Fertility by Education by Marriage Status in Bingham Farms
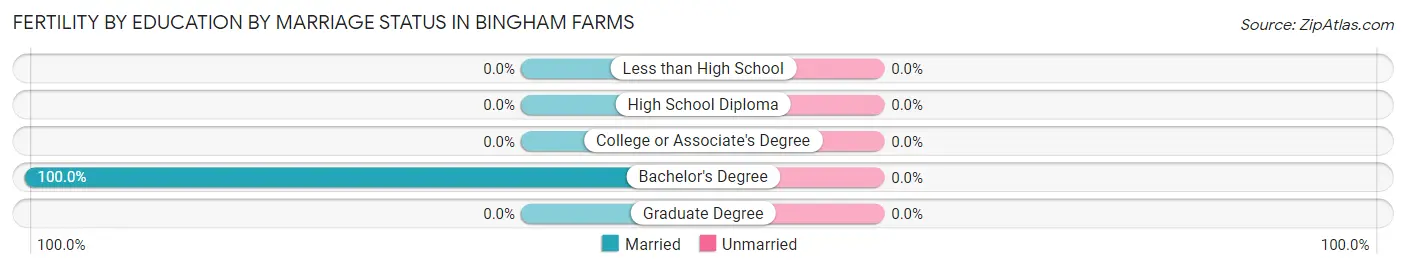
| Educational Attainment | Married | Unmarried |
| Less than High School | 0 (0.0%) | 0 (0.0%) |
| High School Diploma | 0 (0.0%) | 0 (0.0%) |
| College or Associate's Degree | 0 (0.0%) | 0 (0.0%) |
| Bachelor's Degree | 1 (100.0%) | 0 (0.0%) |
| Graduate Degree | 0 (0.0%) | 0 (0.0%) |
| Total | 1 (100.0%) | 0 (0.0%) |
Employment Characteristics in Bingham Farms
Employment by Class of Employer in Bingham Farms
Among the 473 employed individuals in Bingham Farms, private company employees (299 | 63.2%), not-for-profit organizations (93 | 19.7%), and self-employed (incorporated) (44 | 9.3%) make up the most common classes of employment.
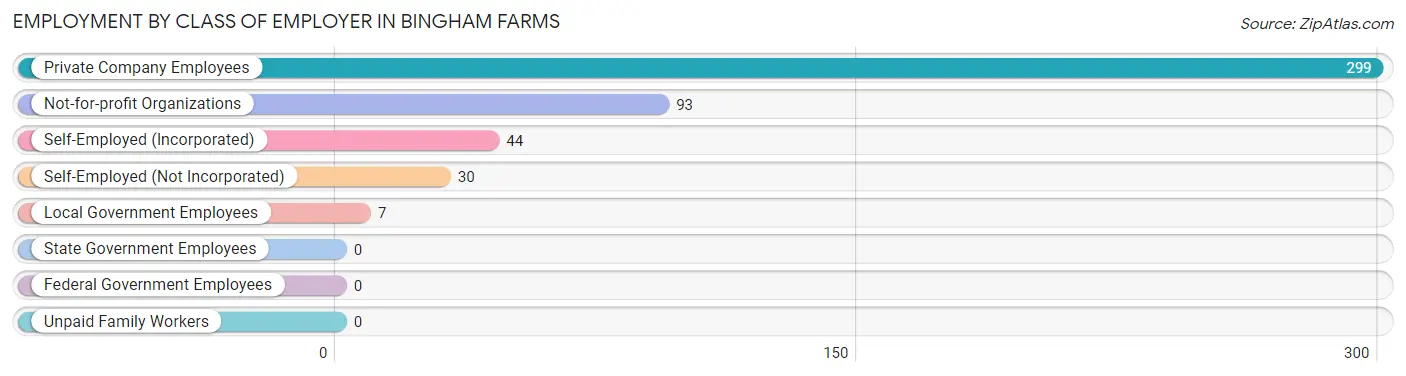
| Employer Class | # Employees | % Employees |
| Private Company Employees | 299 | 63.2% |
| Self-Employed (Incorporated) | 44 | 9.3% |
| Self-Employed (Not Incorporated) | 30 | 6.3% |
| Not-for-profit Organizations | 93 | 19.7% |
| Local Government Employees | 7 | 1.5% |
| State Government Employees | 0 | 0.0% |
| Federal Government Employees | 0 | 0.0% |
| Unpaid Family Workers | 0 | 0.0% |
| Total | 473 | 100.0% |
Employment Status by Age in Bingham Farms
According to the labor force statistics for Bingham Farms, out of the total population over 16 years of age (1,463), 34.2% or 500 individuals are in the labor force, with 3.2% or 16 of them unemployed. The age group with the highest labor force participation rate is 30 to 34 years, with 88.0% or 22 individuals in the labor force. Within the labor force, the 30 to 34 years age range has the highest percentage of unemployed individuals, with 22.7% or 5 of them being unemployed.
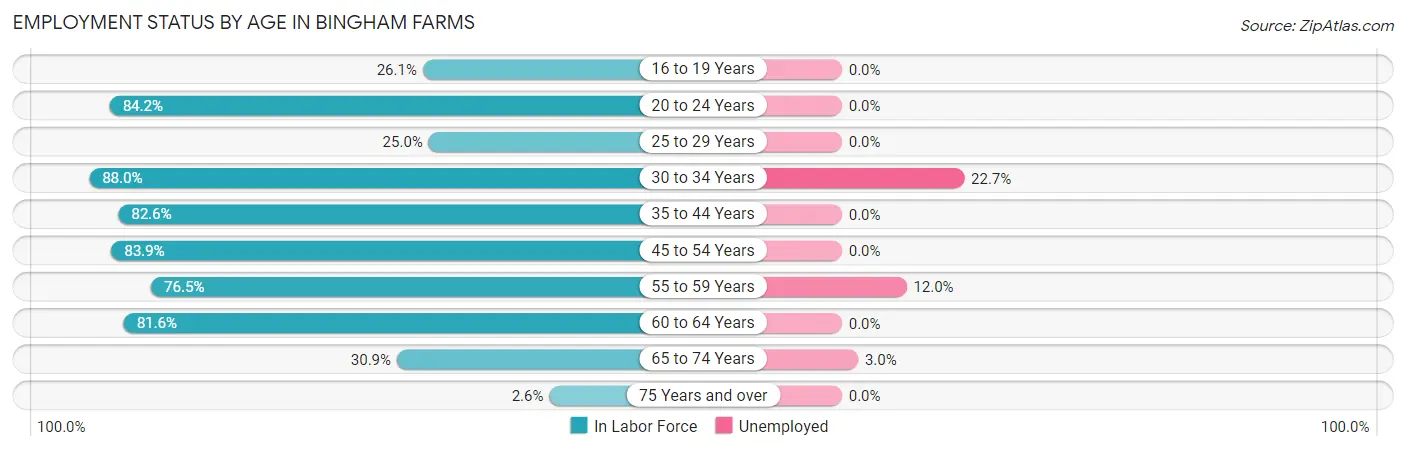
| Age Bracket | In Labor Force | Unemployed |
| 16 to 19 Years | 12 (26.1%) | 0 (0.0%) |
| 20 to 24 Years | 16 (84.2%) | 0 (0.0%) |
| 25 to 29 Years | 6 (25.0%) | 0 (0.0%) |
| 30 to 34 Years | 22 (88.0%) | 5 (22.7%) |
| 35 to 44 Years | 57 (82.6%) | 0 (0.0%) |
| 45 to 54 Years | 94 (83.9%) | 0 (0.0%) |
| 55 to 59 Years | 75 (76.5%) | 9 (12.0%) |
| 60 to 64 Years | 133 (81.6%) | 0 (0.0%) |
| 65 to 74 Years | 67 (30.9%) | 2 (3.0%) |
| 75 Years and over | 18 (2.6%) | 0 (0.0%) |
| Total | 500 (34.2%) | 16 (3.2%) |
Employment Status by Educational Attainment in Bingham Farms
According to labor force statistics for Bingham Farms, 78.8% of individuals (387) out of the total population between 25 and 64 years of age (491) are in the labor force, with 3.6% or 14 of them being unemployed. The group with the highest labor force participation rate are those with the educational attainment of high school diploma, with 100.0% or 7 individuals in the labor force. Within the labor force, individuals with college / associate degree education have the highest percentage of unemployment, with 31.0% or 9 of them being unemployed.
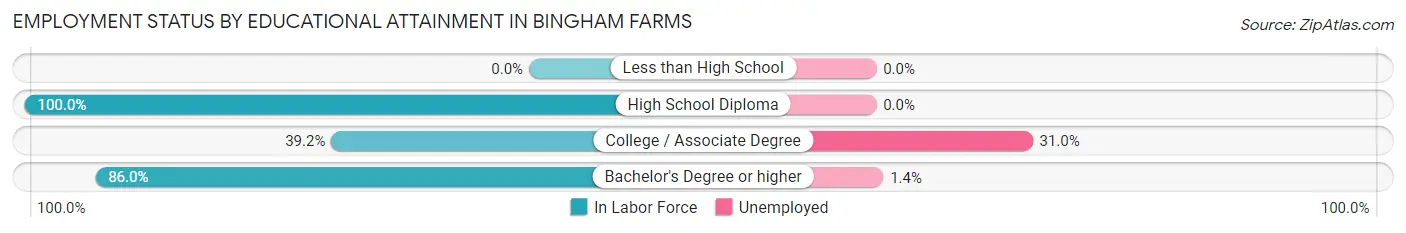
| Educational Attainment | In Labor Force | Unemployed |
| Less than High School | 0 (0.0%) | 0 (0.0%) |
| High School Diploma | 7 (100.0%) | 0 (0.0%) |
| College / Associate Degree | 29 (39.2%) | 23 (31.0%) |
| Bachelor's Degree or higher | 351 (86.0%) | 6 (1.4%) |
| Total | 387 (78.8%) | 18 (3.6%) |
Employment Occupations by Sex in Bingham Farms
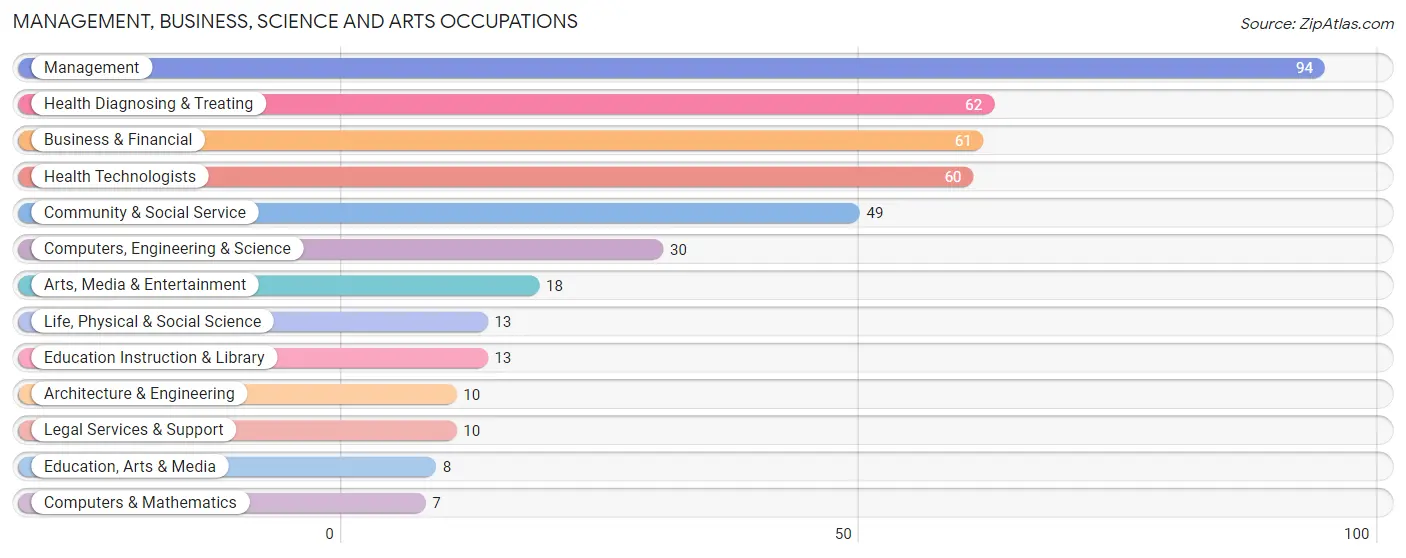
Management, Business, Science and Arts Occupations
The most common Management, Business, Science and Arts occupations in Bingham Farms are Management (94 | 19.4%), Health Diagnosing & Treating (62 | 12.8%), Business & Financial (61 | 12.6%), Health Technologists (60 | 12.4%), and Community & Social Service (49 | 10.1%).
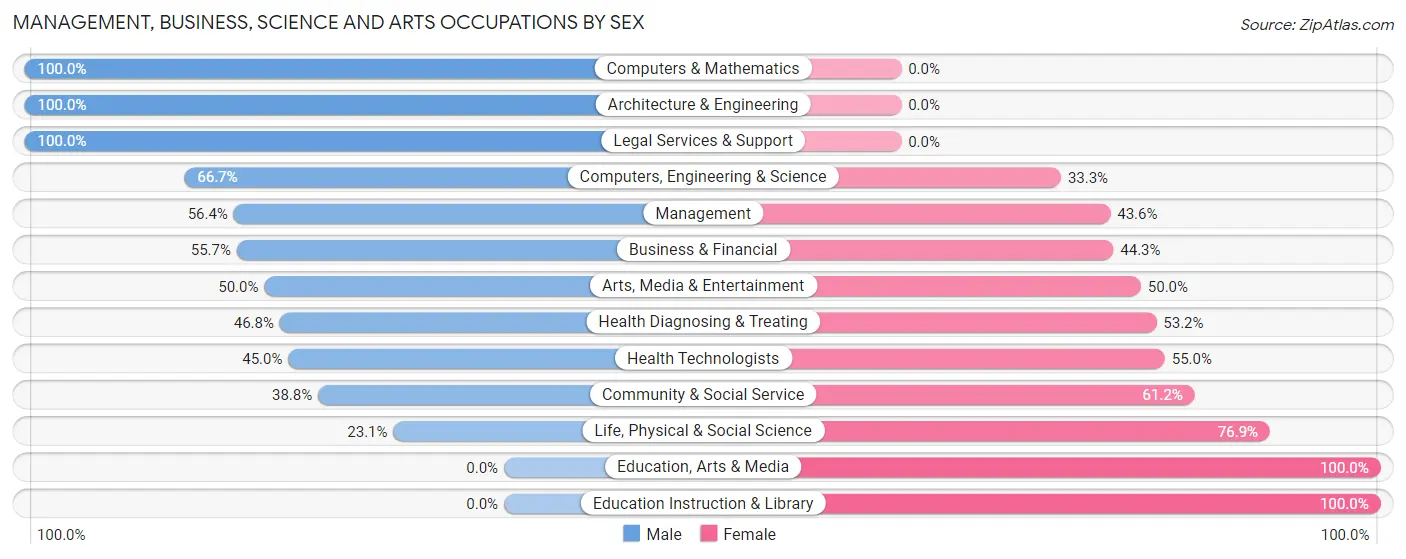
Management, Business, Science and Arts Occupations by Sex
Within the Management, Business, Science and Arts occupations in Bingham Farms, the most male-oriented occupations are Computers & Mathematics (100.0%), Architecture & Engineering (100.0%), and Legal Services & Support (100.0%), while the most female-oriented occupations are Education, Arts & Media (100.0%), Education Instruction & Library (100.0%), and Life, Physical & Social Science (76.9%).
| Occupation | Male | Female |
| Management | 53 (56.4%) | 41 (43.6%) |
| Business & Financial | 34 (55.7%) | 27 (44.3%) |
| Computers, Engineering & Science | 20 (66.7%) | 10 (33.3%) |
| Computers & Mathematics | 7 (100.0%) | 0 (0.0%) |
| Architecture & Engineering | 10 (100.0%) | 0 (0.0%) |
| Life, Physical & Social Science | 3 (23.1%) | 10 (76.9%) |
| Community & Social Service | 19 (38.8%) | 30 (61.2%) |
| Education, Arts & Media | 0 (0.0%) | 8 (100.0%) |
| Legal Services & Support | 10 (100.0%) | 0 (0.0%) |
| Education Instruction & Library | 0 (0.0%) | 13 (100.0%) |
| Arts, Media & Entertainment | 9 (50.0%) | 9 (50.0%) |
| Health Diagnosing & Treating | 29 (46.8%) | 33 (53.2%) |
| Health Technologists | 27 (45.0%) | 33 (55.0%) |
| Total (Category) | 155 (52.4%) | 141 (47.6%) |
| Total (Overall) | 245 (50.6%) | 239 (49.4%) |
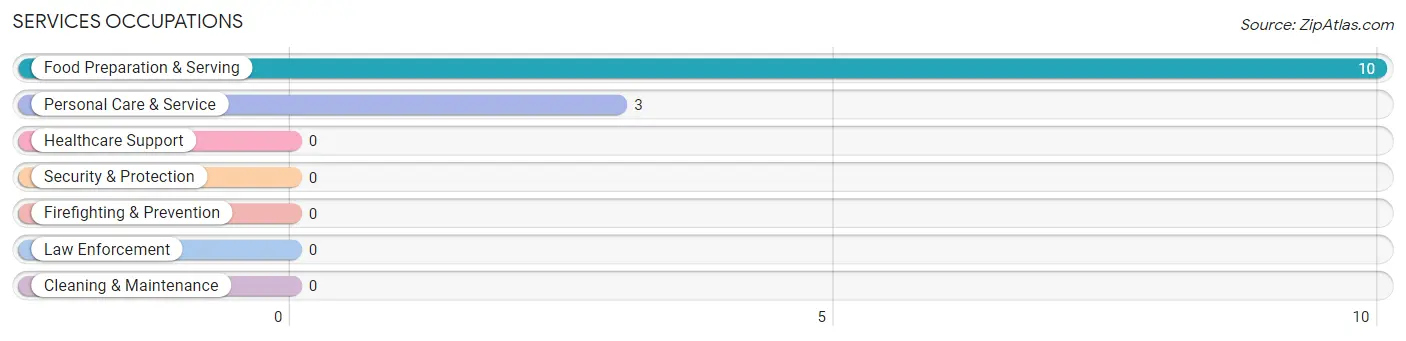
Services Occupations
The most common Services occupations in Bingham Farms are Food Preparation & Serving (10 | 2.1%), and Personal Care & Service (3 | 0.6%).
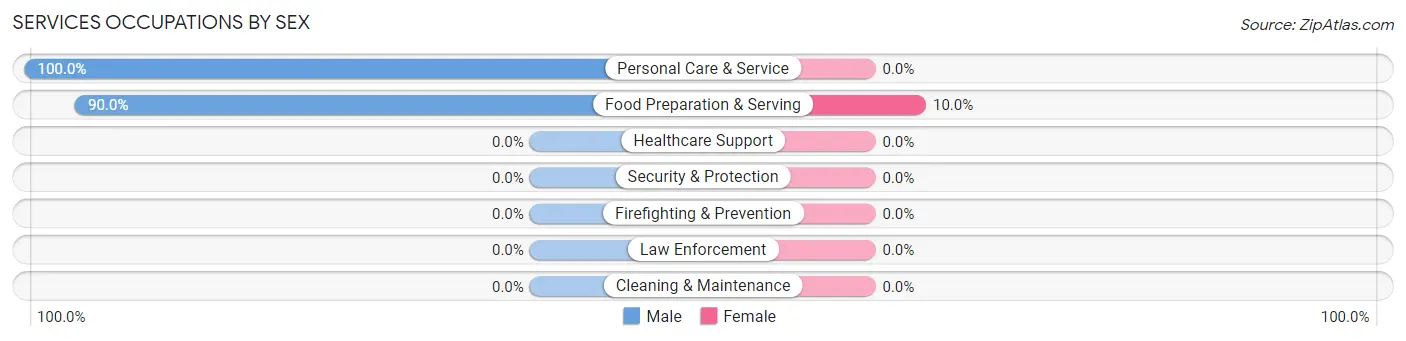
Services Occupations by Sex
| Occupation | Male | Female |
| Healthcare Support | 0 (0.0%) | 0 (0.0%) |
| Security & Protection | 0 (0.0%) | 0 (0.0%) |
| Firefighting & Prevention | 0 (0.0%) | 0 (0.0%) |
| Law Enforcement | 0 (0.0%) | 0 (0.0%) |
| Food Preparation & Serving | 9 (90.0%) | 1 (10.0%) |
| Cleaning & Maintenance | 0 (0.0%) | 0 (0.0%) |
| Personal Care & Service | 3 (100.0%) | 0 (0.0%) |
| Total (Category) | 12 (92.3%) | 1 (7.7%) |
| Total (Overall) | 245 (50.6%) | 239 (49.4%) |
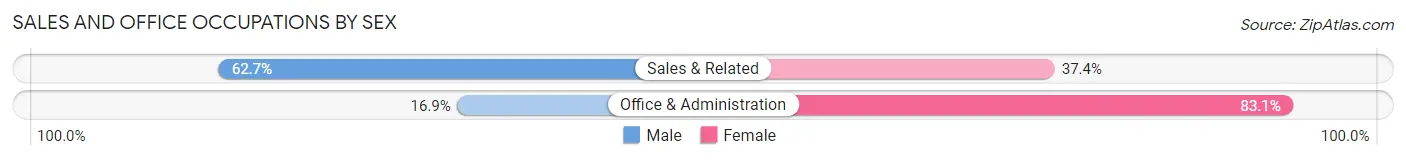
Sales and Office Occupations
The most common Sales and Office occupations in Bingham Farms are Sales & Related (83 | 17.2%), and Office & Administration (65 | 13.4%).
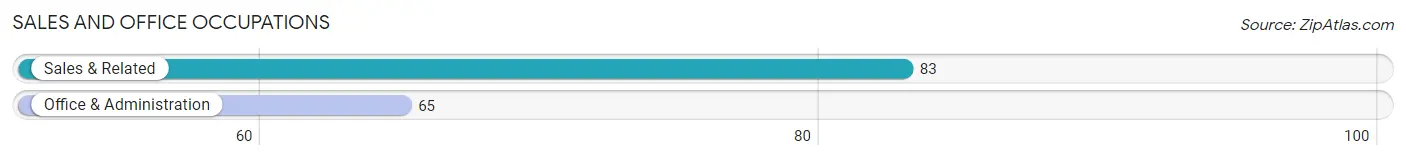
Sales and Office Occupations by Sex
| Occupation | Male | Female |
| Sales & Related | 52 (62.6%) | 31 (37.3%) |
| Office & Administration | 11 (16.9%) | 54 (83.1%) |
| Total (Category) | 63 (42.6%) | 85 (57.4%) |
| Total (Overall) | 245 (50.6%) | 239 (49.4%) |
Natural Resources, Construction and Maintenance Occupations
The most common Natural Resources, Construction and Maintenance occupations in Bingham Farms are Installation, Maintenance & Repair (12 | 2.5%), and Construction & Extraction (8 | 1.7%).
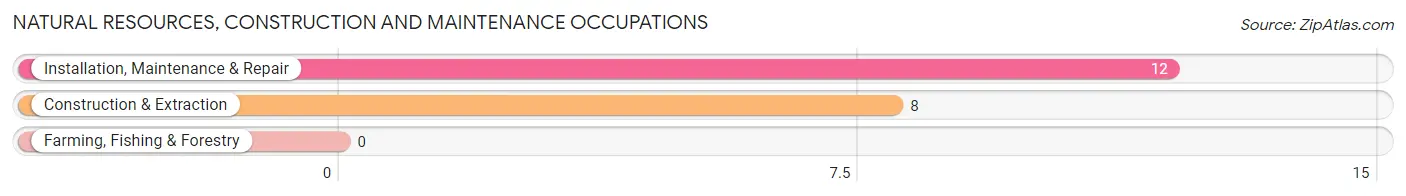
Natural Resources, Construction and Maintenance Occupations by Sex
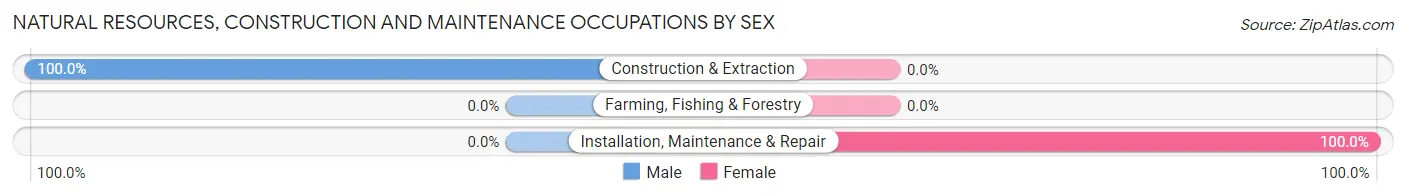
| Occupation | Male | Female |
| Farming, Fishing & Forestry | 0 (0.0%) | 0 (0.0%) |
| Construction & Extraction | 8 (100.0%) | 0 (0.0%) |
| Installation, Maintenance & Repair | 0 (0.0%) | 12 (100.0%) |
| Total (Category) | 8 (40.0%) | 12 (60.0%) |
| Total (Overall) | 245 (50.6%) | 239 (49.4%) |
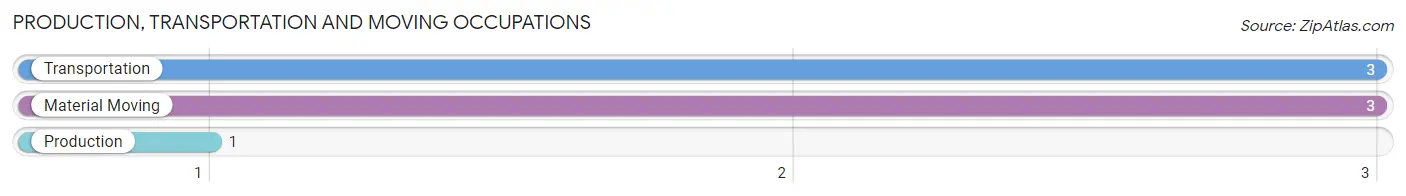
Production, Transportation and Moving Occupations
The most common Production, Transportation and Moving occupations in Bingham Farms are Transportation (3 | 0.6%), Material Moving (3 | 0.6%), and Production (1 | 0.2%).
Production, Transportation and Moving Occupations by Sex
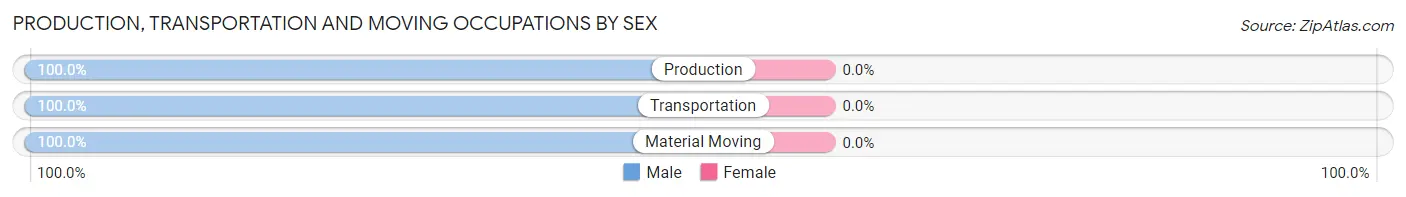
| Occupation | Male | Female |
| Production | 1 (100.0%) | 0 (0.0%) |
| Transportation | 3 (100.0%) | 0 (0.0%) |
| Material Moving | 3 (100.0%) | 0 (0.0%) |
| Total (Category) | 7 (100.0%) | 0 (0.0%) |
| Total (Overall) | 245 (50.6%) | 239 (49.4%) |
Employment Industries by Sex in Bingham Farms
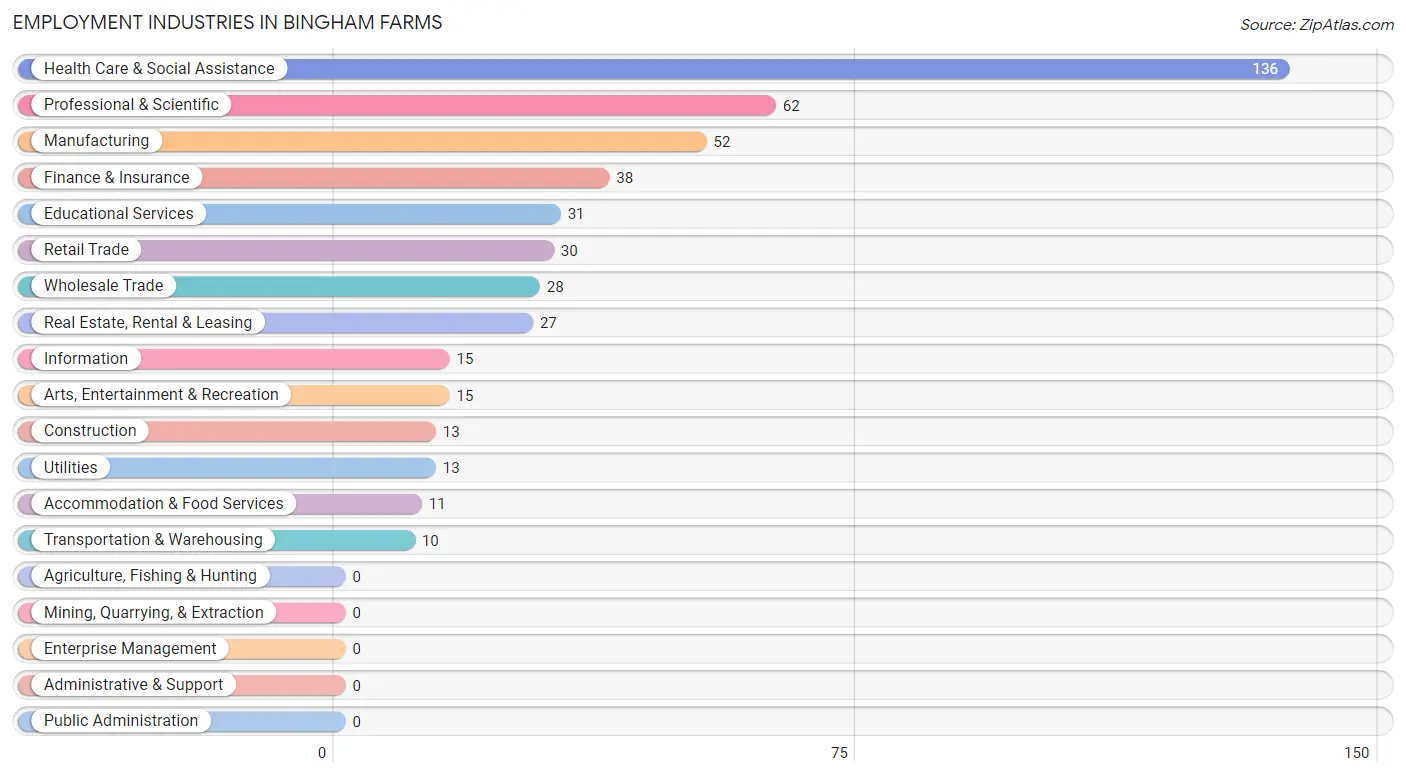
Employment Industries in Bingham Farms
The major employment industries in Bingham Farms include Health Care & Social Assistance (136 | 28.1%), Professional & Scientific (62 | 12.8%), Manufacturing (52 | 10.7%), Finance & Insurance (38 | 7.9%), and Educational Services (31 | 6.4%).
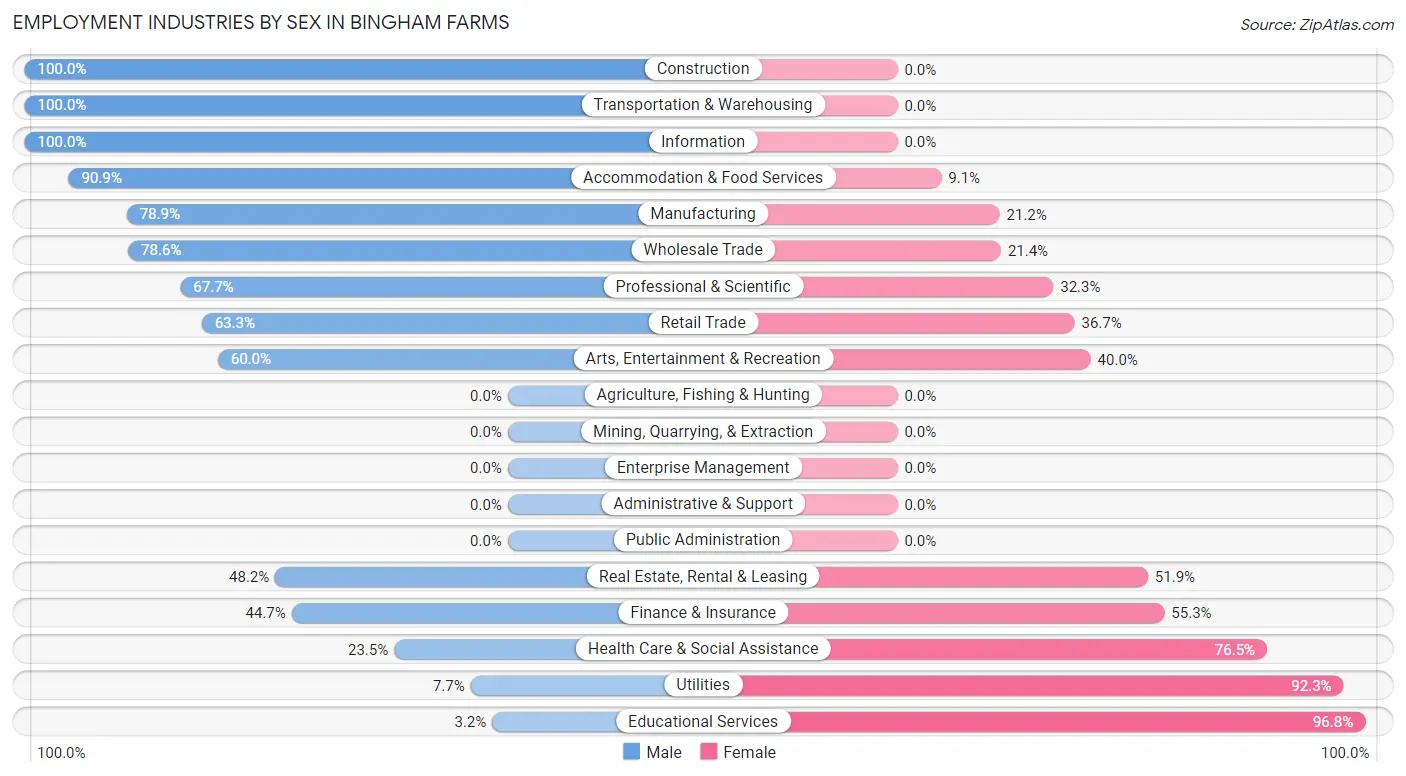
Employment Industries by Sex in Bingham Farms
The Bingham Farms industries that see more men than women are Construction (100.0%), Transportation & Warehousing (100.0%), and Information (100.0%), whereas the industries that tend to have a higher number of women are Educational Services (96.8%), Utilities (92.3%), and Health Care & Social Assistance (76.5%).
| Industry | Male | Female |
| Agriculture, Fishing & Hunting | 0 (0.0%) | 0 (0.0%) |
| Mining, Quarrying, & Extraction | 0 (0.0%) | 0 (0.0%) |
| Construction | 13 (100.0%) | 0 (0.0%) |
| Manufacturing | 41 (78.8%) | 11 (21.1%) |
| Wholesale Trade | 22 (78.6%) | 6 (21.4%) |
| Retail Trade | 19 (63.3%) | 11 (36.7%) |
| Transportation & Warehousing | 10 (100.0%) | 0 (0.0%) |
| Utilities | 1 (7.7%) | 12 (92.3%) |
| Information | 15 (100.0%) | 0 (0.0%) |
| Finance & Insurance | 17 (44.7%) | 21 (55.3%) |
| Real Estate, Rental & Leasing | 13 (48.1%) | 14 (51.8%) |
| Professional & Scientific | 42 (67.7%) | 20 (32.3%) |
| Enterprise Management | 0 (0.0%) | 0 (0.0%) |
| Administrative & Support | 0 (0.0%) | 0 (0.0%) |
| Educational Services | 1 (3.2%) | 30 (96.8%) |
| Health Care & Social Assistance | 32 (23.5%) | 104 (76.5%) |
| Arts, Entertainment & Recreation | 9 (60.0%) | 6 (40.0%) |
| Accommodation & Food Services | 10 (90.9%) | 1 (9.1%) |
| Public Administration | 0 (0.0%) | 0 (0.0%) |
| Total | 245 (50.6%) | 239 (49.4%) |
Education in Bingham Farms
School Enrollment in Bingham Farms
The most common levels of schooling among the 235 students in Bingham Farms are high school (84 | 35.7%), elementary school (62 | 26.4%), and middle school (42 | 17.9%).
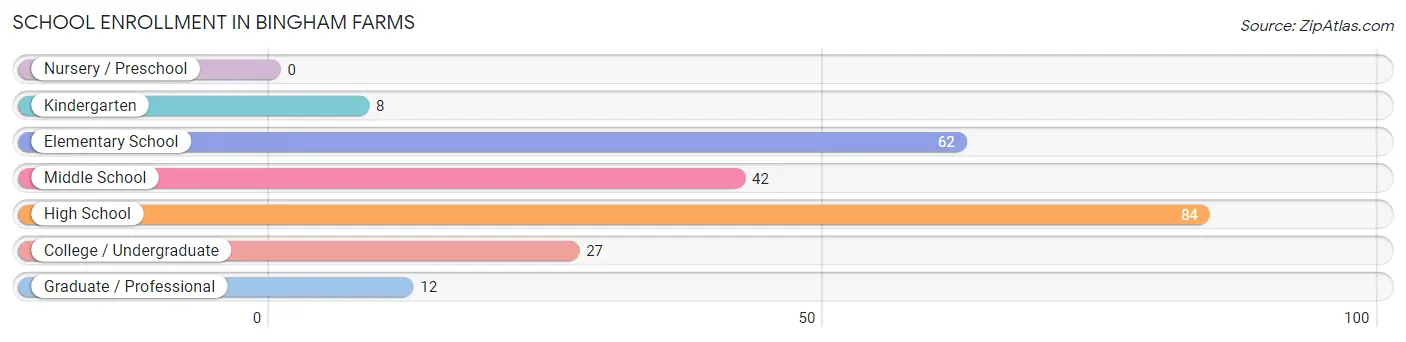
| School Level | # Students | % Students |
| Nursery / Preschool | 0 | 0.0% |
| Kindergarten | 8 | 3.4% |
| Elementary School | 62 | 26.4% |
| Middle School | 42 | 17.9% |
| High School | 84 | 35.7% |
| College / Undergraduate | 27 | 11.5% |
| Graduate / Professional | 12 | 5.1% |
| Total | 235 | 100.0% |
School Enrollment by Age by Funding Source in Bingham Farms
Out of a total of 235 students who are enrolled in schools in Bingham Farms, 66 (28.1%) attend a private institution, while the remaining 169 (71.9%) are enrolled in public schools. The age group of 25 to 34 year olds has the highest likelihood of being enrolled in private schools, with 6 (66.7% in the age bracket) enrolled. Conversely, the age group of 20 to 24 year olds has the lowest likelihood of being enrolled in a private school, with 17 (89.5% in the age bracket) attending a public institution.
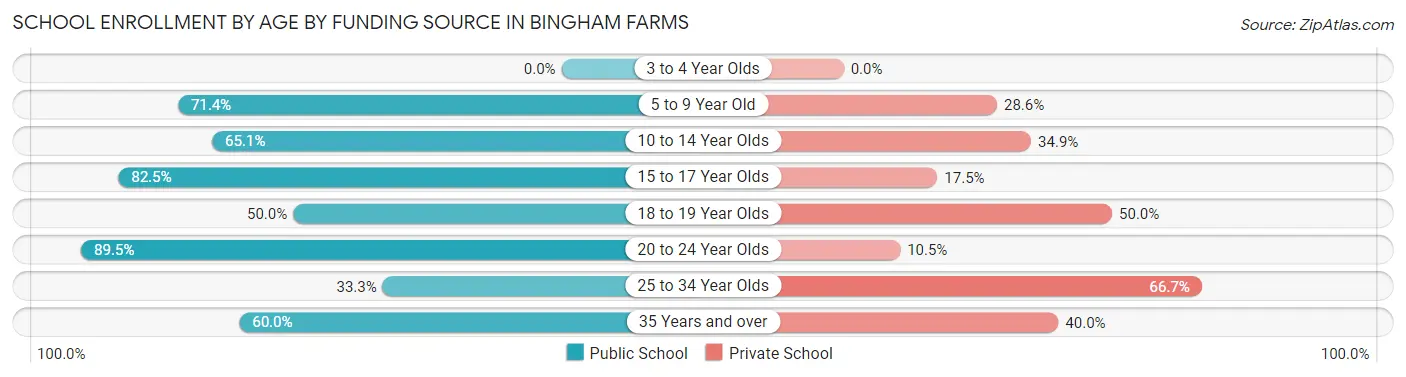
| Age Bracket | Public School | Private School |
| 3 to 4 Year Olds | 0 (0.0%) | 0 (0.0%) |
| 5 to 9 Year Old | 50 (71.4%) | 20 (28.6%) |
| 10 to 14 Year Olds | 41 (65.1%) | 22 (34.9%) |
| 15 to 17 Year Olds | 52 (82.5%) | 11 (17.5%) |
| 18 to 19 Year Olds | 3 (50.0%) | 3 (50.0%) |
| 20 to 24 Year Olds | 17 (89.5%) | 2 (10.5%) |
| 25 to 34 Year Olds | 3 (33.3%) | 6 (66.7%) |
| 35 Years and over | 3 (60.0%) | 2 (40.0%) |
| Total | 169 (71.9%) | 66 (28.1%) |
Educational Attainment by Field of Study in Bingham Farms
Business (198 | 19.5%), education (153 | 15.1%), arts & humanities (124 | 12.2%), science & technology (118 | 11.6%), and engineering (110 | 10.8%) are the most common fields of study among 1,015 individuals in Bingham Farms who have obtained a bachelor's degree or higher.
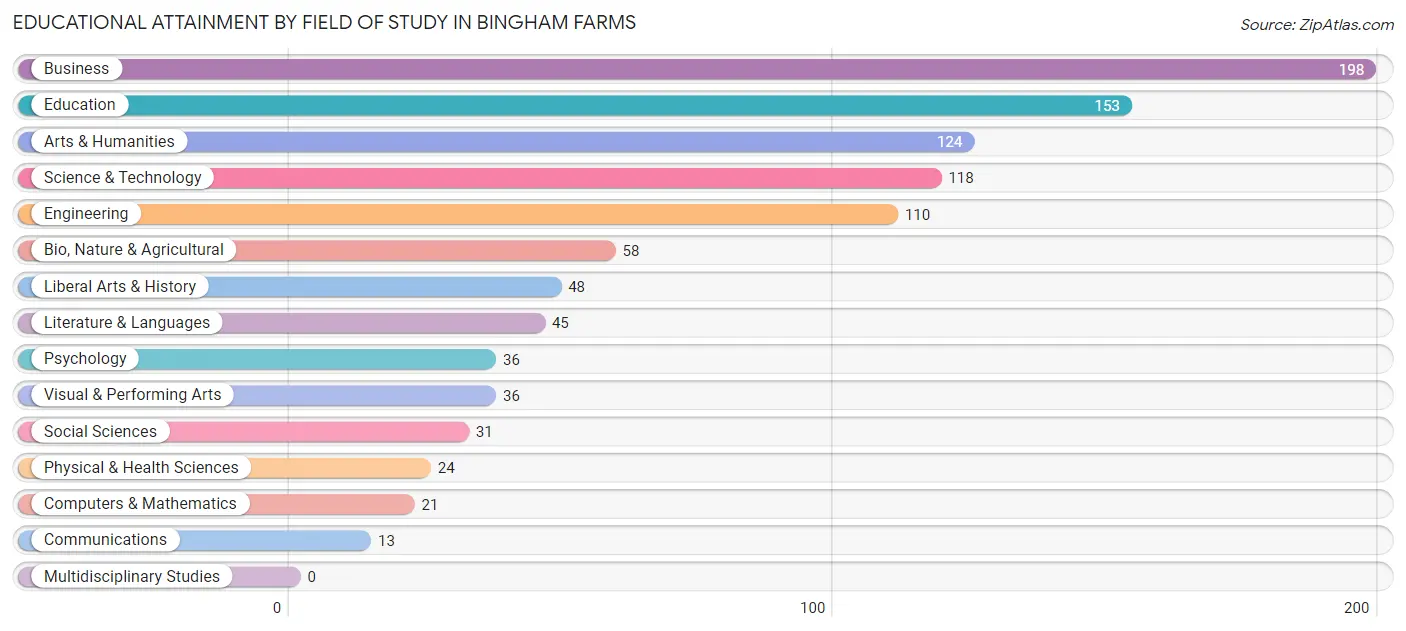
| Field of Study | # Graduates | % Graduates |
| Computers & Mathematics | 21 | 2.1% |
| Bio, Nature & Agricultural | 58 | 5.7% |
| Physical & Health Sciences | 24 | 2.4% |
| Psychology | 36 | 3.5% |
| Social Sciences | 31 | 3.0% |
| Engineering | 110 | 10.8% |
| Multidisciplinary Studies | 0 | 0.0% |
| Science & Technology | 118 | 11.6% |
| Business | 198 | 19.5% |
| Education | 153 | 15.1% |
| Literature & Languages | 45 | 4.4% |
| Liberal Arts & History | 48 | 4.7% |
| Visual & Performing Arts | 36 | 3.5% |
| Communications | 13 | 1.3% |
| Arts & Humanities | 124 | 12.2% |
| Total | 1,015 | 100.0% |
Transportation & Commute in Bingham Farms
Vehicle Availability by Sex in Bingham Farms
The most prevalent vehicle ownership categories in Bingham Farms are males with 2 vehicles (122, accounting for 49.8%) and females with 2 vehicles (97, making up 53.5%).
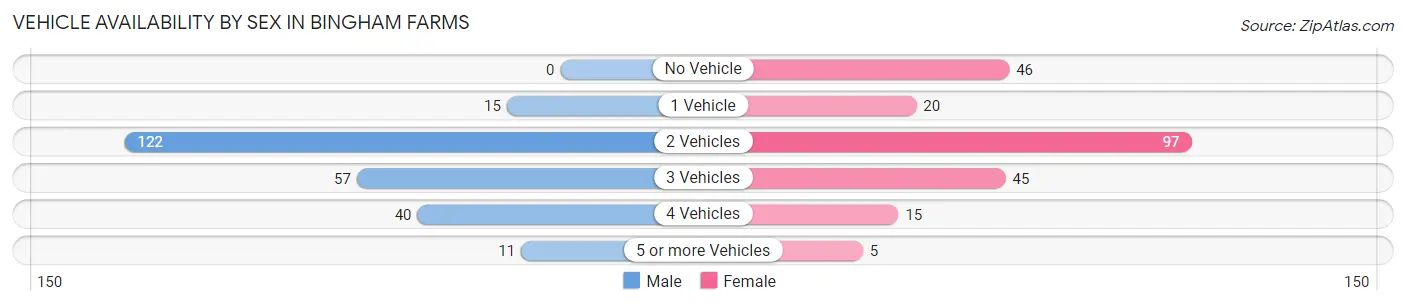
| Vehicles Available | Male | Female |
| No Vehicle | 0 (0.0%) | 46 (20.2%) |
| 1 Vehicle | 15 (6.1%) | 20 (8.8%) |
| 2 Vehicles | 122 (49.8%) | 97 (42.5%) |
| 3 Vehicles | 57 (23.3%) | 45 (19.7%) |
| 4 Vehicles | 40 (16.3%) | 15 (6.6%) |
| 5 or more Vehicles | 11 (4.5%) | 5 (2.2%) |
| Total | 245 (100.0%) | 228 (100.0%) |
Commute Time in Bingham Farms
The most frequently occuring commute durations in Bingham Farms are 20 to 24 minutes (84 commuters, 28.4%), 15 to 19 minutes (53 commuters, 17.9%), and 30 to 34 minutes (47 commuters, 15.9%).
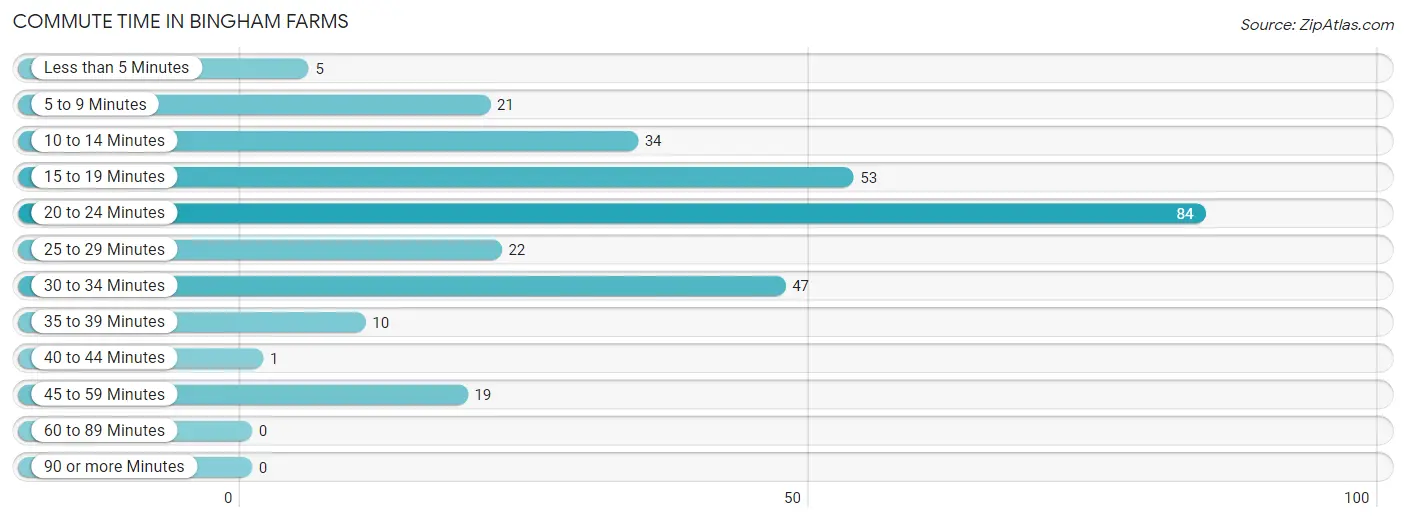
| Commute Time | # Commuters | % Commuters |
| Less than 5 Minutes | 5 | 1.7% |
| 5 to 9 Minutes | 21 | 7.1% |
| 10 to 14 Minutes | 34 | 11.5% |
| 15 to 19 Minutes | 53 | 17.9% |
| 20 to 24 Minutes | 84 | 28.4% |
| 25 to 29 Minutes | 22 | 7.4% |
| 30 to 34 Minutes | 47 | 15.9% |
| 35 to 39 Minutes | 10 | 3.4% |
| 40 to 44 Minutes | 1 | 0.3% |
| 45 to 59 Minutes | 19 | 6.4% |
| 60 to 89 Minutes | 0 | 0.0% |
| 90 or more Minutes | 0 | 0.0% |
Commute Time by Sex in Bingham Farms
The most common commute times in Bingham Farms are 20 to 24 minutes (49 commuters, 30.4%) for males and 20 to 24 minutes (35 commuters, 25.9%) for females.
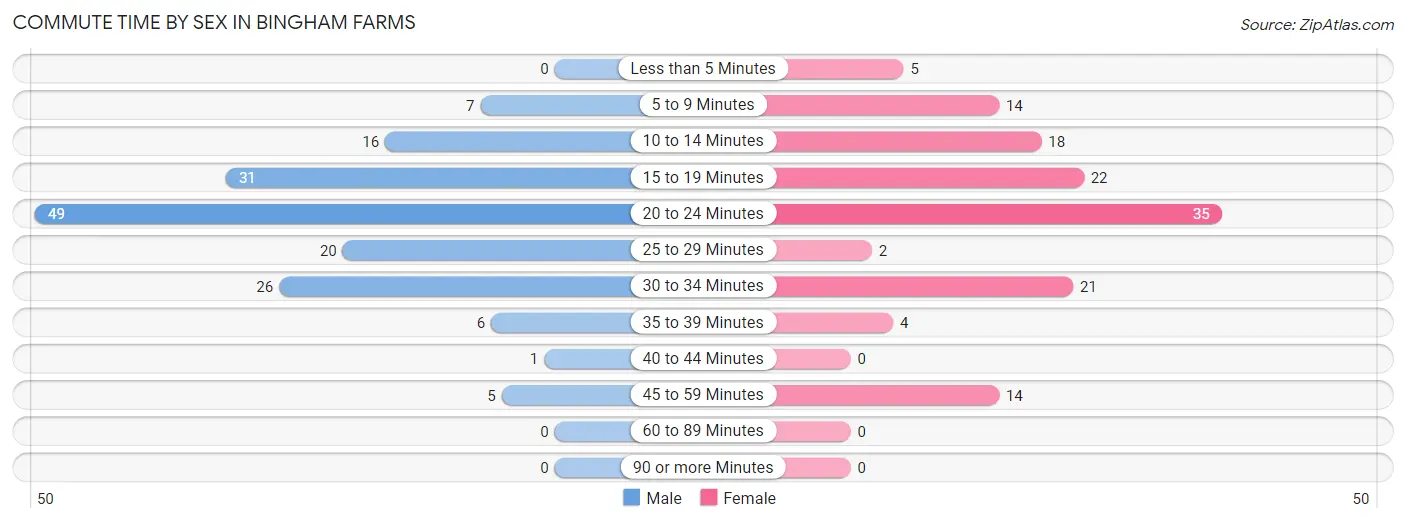
| Commute Time | Male | Female |
| Less than 5 Minutes | 0 (0.0%) | 5 (3.7%) |
| 5 to 9 Minutes | 7 (4.3%) | 14 (10.4%) |
| 10 to 14 Minutes | 16 (9.9%) | 18 (13.3%) |
| 15 to 19 Minutes | 31 (19.3%) | 22 (16.3%) |
| 20 to 24 Minutes | 49 (30.4%) | 35 (25.9%) |
| 25 to 29 Minutes | 20 (12.4%) | 2 (1.5%) |
| 30 to 34 Minutes | 26 (16.2%) | 21 (15.6%) |
| 35 to 39 Minutes | 6 (3.7%) | 4 (3.0%) |
| 40 to 44 Minutes | 1 (0.6%) | 0 (0.0%) |
| 45 to 59 Minutes | 5 (3.1%) | 14 (10.4%) |
| 60 to 89 Minutes | 0 (0.0%) | 0 (0.0%) |
| 90 or more Minutes | 0 (0.0%) | 0 (0.0%) |
Time of Departure to Work by Sex in Bingham Farms
The most frequent times of departure to work in Bingham Farms are 7:30 AM to 7:59 AM (37, 23.0%) for males and 8:00 AM to 8:29 AM (37, 27.4%) for females.
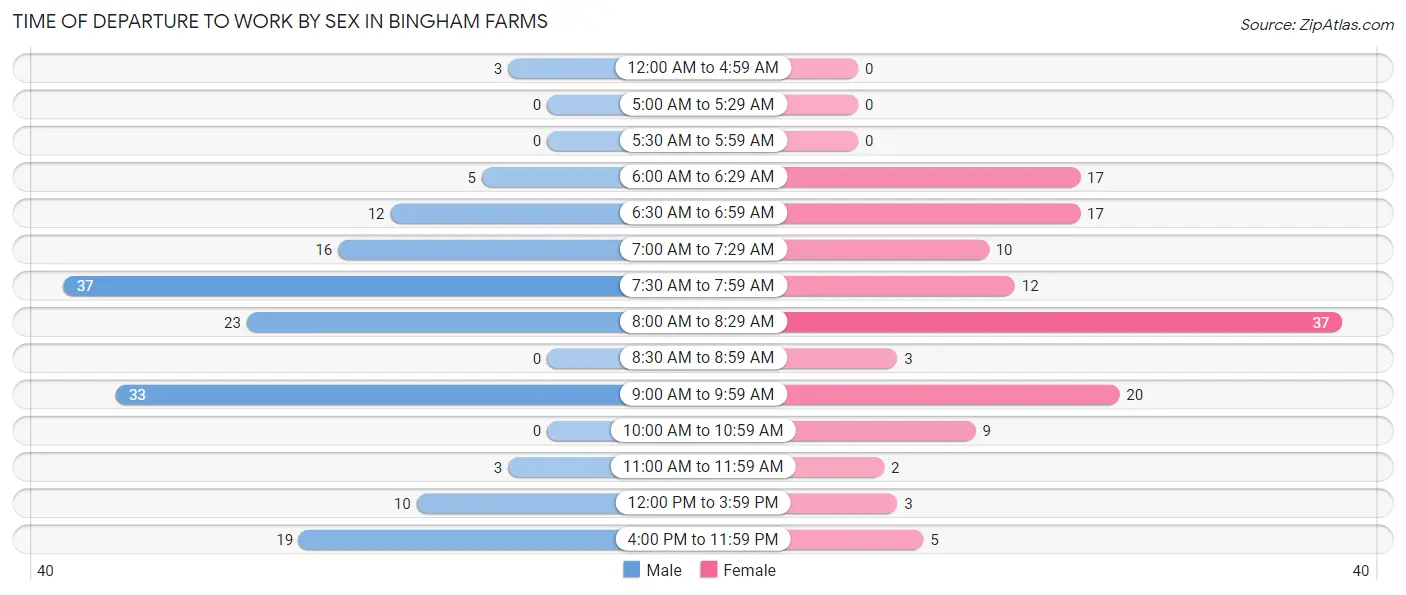
| Time of Departure | Male | Female |
| 12:00 AM to 4:59 AM | 3 (1.9%) | 0 (0.0%) |
| 5:00 AM to 5:29 AM | 0 (0.0%) | 0 (0.0%) |
| 5:30 AM to 5:59 AM | 0 (0.0%) | 0 (0.0%) |
| 6:00 AM to 6:29 AM | 5 (3.1%) | 17 (12.6%) |
| 6:30 AM to 6:59 AM | 12 (7.4%) | 17 (12.6%) |
| 7:00 AM to 7:29 AM | 16 (9.9%) | 10 (7.4%) |
| 7:30 AM to 7:59 AM | 37 (23.0%) | 12 (8.9%) |
| 8:00 AM to 8:29 AM | 23 (14.3%) | 37 (27.4%) |
| 8:30 AM to 8:59 AM | 0 (0.0%) | 3 (2.2%) |
| 9:00 AM to 9:59 AM | 33 (20.5%) | 20 (14.8%) |
| 10:00 AM to 10:59 AM | 0 (0.0%) | 9 (6.7%) |
| 11:00 AM to 11:59 AM | 3 (1.9%) | 2 (1.5%) |
| 12:00 PM to 3:59 PM | 10 (6.2%) | 3 (2.2%) |
| 4:00 PM to 11:59 PM | 19 (11.8%) | 5 (3.7%) |
| Total | 161 (100.0%) | 135 (100.0%) |
Housing Occupancy in Bingham Farms
Occupancy by Ownership in Bingham Farms
Of the total 474 dwellings in Bingham Farms, owner-occupied units account for 444 (93.7%), while renter-occupied units make up 30 (6.3%).
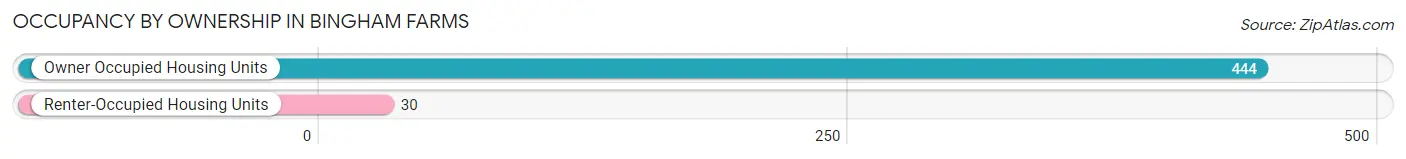
| Occupancy | # Housing Units | % Housing Units |
| Owner Occupied Housing Units | 444 | 93.7% |
| Renter-Occupied Housing Units | 30 | 6.3% |
| Total Occupied Housing Units | 474 | 100.0% |
Occupancy by Household Size in Bingham Farms
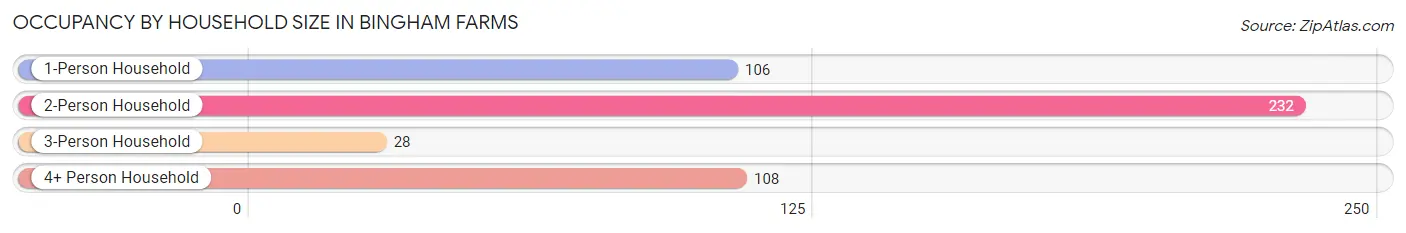
| Household Size | # Housing Units | % Housing Units |
| 1-Person Household | 106 | 22.4% |
| 2-Person Household | 232 | 48.9% |
| 3-Person Household | 28 | 5.9% |
| 4+ Person Household | 108 | 22.8% |
| Total Housing Units | 474 | 100.0% |
Occupancy by Ownership by Household Size in Bingham Farms
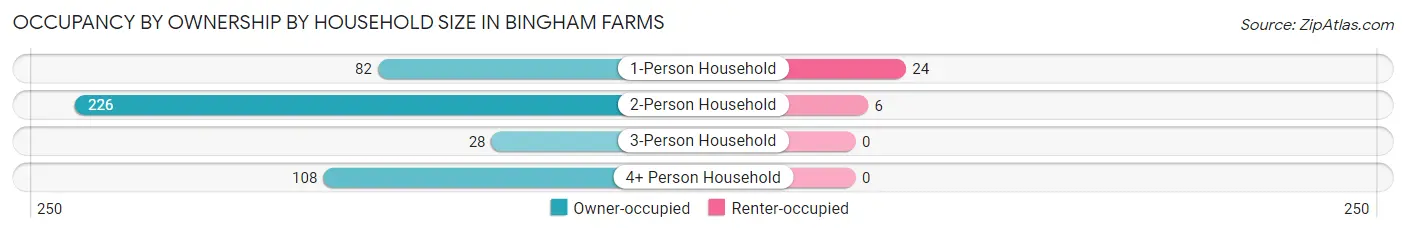
| Household Size | Owner-occupied | Renter-occupied |
| 1-Person Household | 82 (77.4%) | 24 (22.6%) |
| 2-Person Household | 226 (97.4%) | 6 (2.6%) |
| 3-Person Household | 28 (100.0%) | 0 (0.0%) |
| 4+ Person Household | 108 (100.0%) | 0 (0.0%) |
| Total Housing Units | 444 (93.7%) | 30 (6.3%) |
Occupancy by Educational Attainment in Bingham Farms
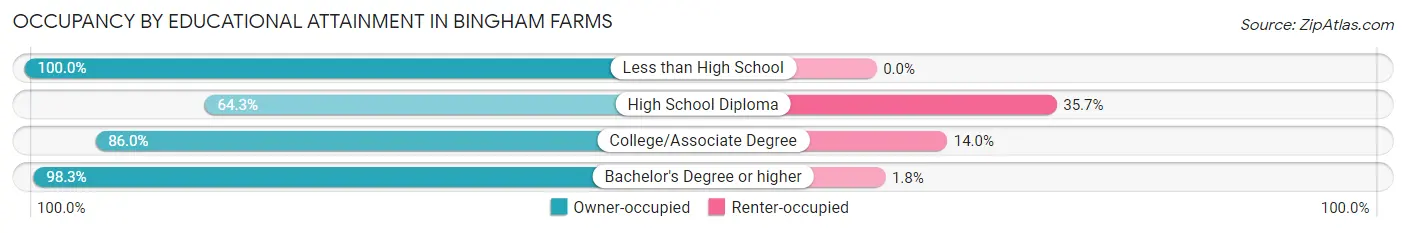
| Household Size | Owner-occupied | Renter-occupied |
| Less than High School | 3 (100.0%) | 0 (0.0%) |
| High School Diploma | 18 (64.3%) | 10 (35.7%) |
| College/Associate Degree | 86 (86.0%) | 14 (14.0%) |
| Bachelor's Degree or higher | 337 (98.3%) | 6 (1.8%) |
Occupancy by Age of Householder in Bingham Farms
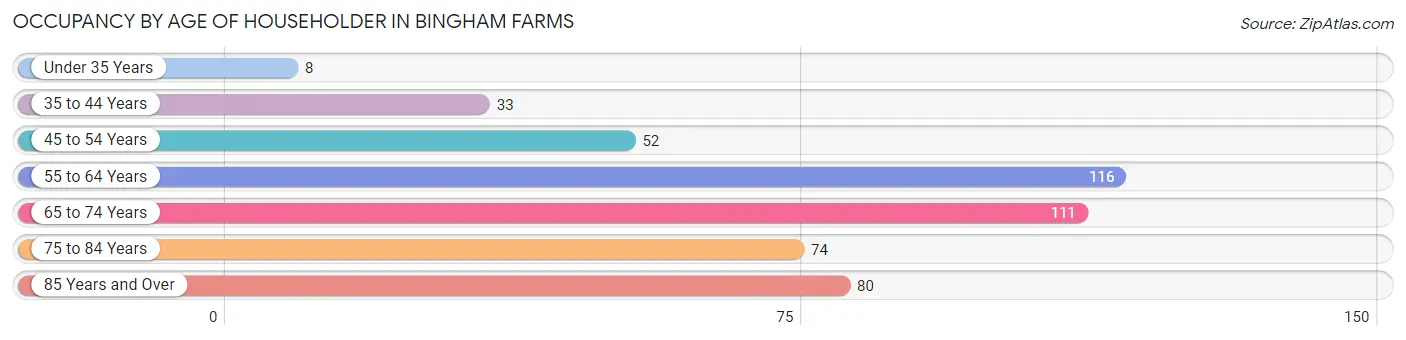
| Age Bracket | # Households | % Households |
| Under 35 Years | 8 | 1.7% |
| 35 to 44 Years | 33 | 7.0% |
| 45 to 54 Years | 52 | 11.0% |
| 55 to 64 Years | 116 | 24.5% |
| 65 to 74 Years | 111 | 23.4% |
| 75 to 84 Years | 74 | 15.6% |
| 85 Years and Over | 80 | 16.9% |
| Total | 474 | 100.0% |
Housing Finances in Bingham Farms
Median Income by Occupancy in Bingham Farms
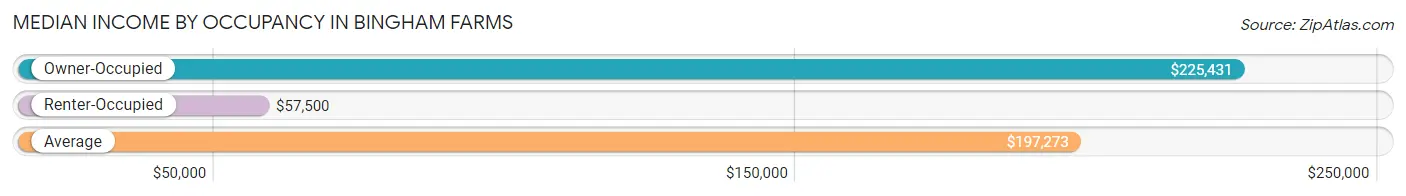
| Occupancy Type | # Households | Median Income |
| Owner-Occupied | 444 (93.7%) | $225,431 |
| Renter-Occupied | 30 (6.3%) | $57,500 |
| Average | 474 (100.0%) | $197,273 |
Occupancy by Householder Income Bracket in Bingham Farms
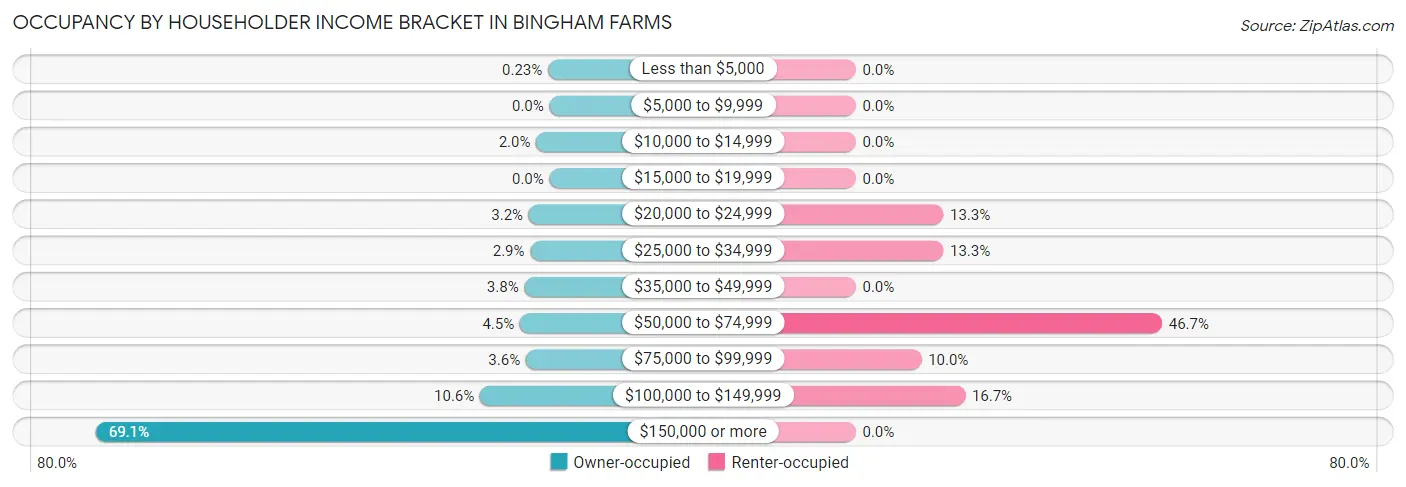
| Income Bracket | Owner-occupied | Renter-occupied |
| Less than $5,000 | 1 (0.2%) | 0 (0.0%) |
| $5,000 to $9,999 | 0 (0.0%) | 0 (0.0%) |
| $10,000 to $14,999 | 9 (2.0%) | 0 (0.0%) |
| $15,000 to $19,999 | 0 (0.0%) | 0 (0.0%) |
| $20,000 to $24,999 | 14 (3.2%) | 4 (13.3%) |
| $25,000 to $34,999 | 13 (2.9%) | 4 (13.3%) |
| $35,000 to $49,999 | 17 (3.8%) | 0 (0.0%) |
| $50,000 to $74,999 | 20 (4.5%) | 14 (46.7%) |
| $75,000 to $99,999 | 16 (3.6%) | 3 (10.0%) |
| $100,000 to $149,999 | 47 (10.6%) | 5 (16.7%) |
| $150,000 or more | 307 (69.1%) | 0 (0.0%) |
| Total | 444 (100.0%) | 30 (100.0%) |
Monthly Housing Cost Tiers in Bingham Farms
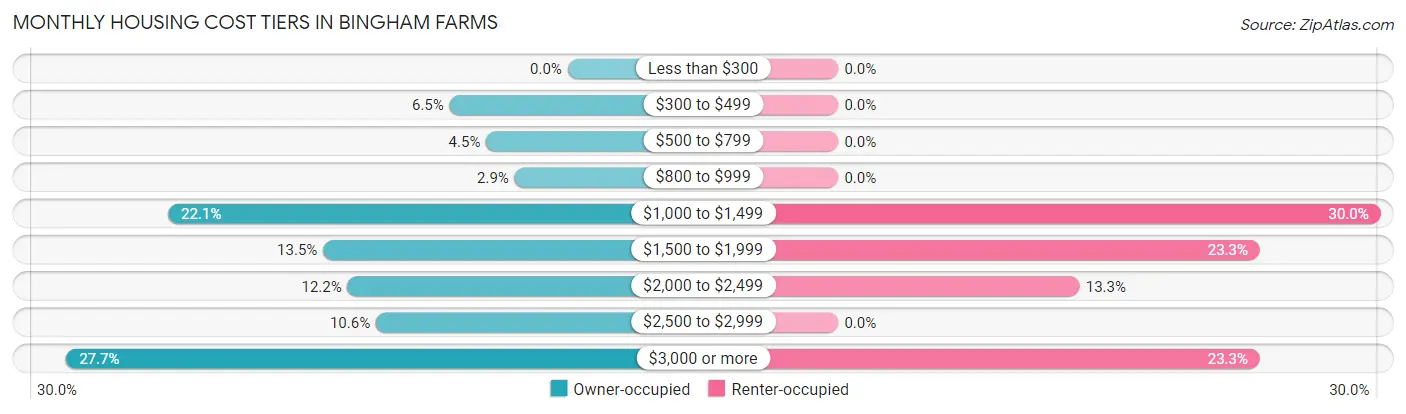
| Monthly Cost | Owner-occupied | Renter-occupied |
| Less than $300 | 0 (0.0%) | 0 (0.0%) |
| $300 to $499 | 29 (6.5%) | 0 (0.0%) |
| $500 to $799 | 20 (4.5%) | 0 (0.0%) |
| $800 to $999 | 13 (2.9%) | 0 (0.0%) |
| $1,000 to $1,499 | 98 (22.1%) | 9 (30.0%) |
| $1,500 to $1,999 | 60 (13.5%) | 7 (23.3%) |
| $2,000 to $2,499 | 54 (12.2%) | 4 (13.3%) |
| $2,500 to $2,999 | 47 (10.6%) | 0 (0.0%) |
| $3,000 or more | 123 (27.7%) | 7 (23.3%) |
| Total | 444 (100.0%) | 30 (100.0%) |
Physical Housing Characteristics in Bingham Farms
Housing Structures in Bingham Farms
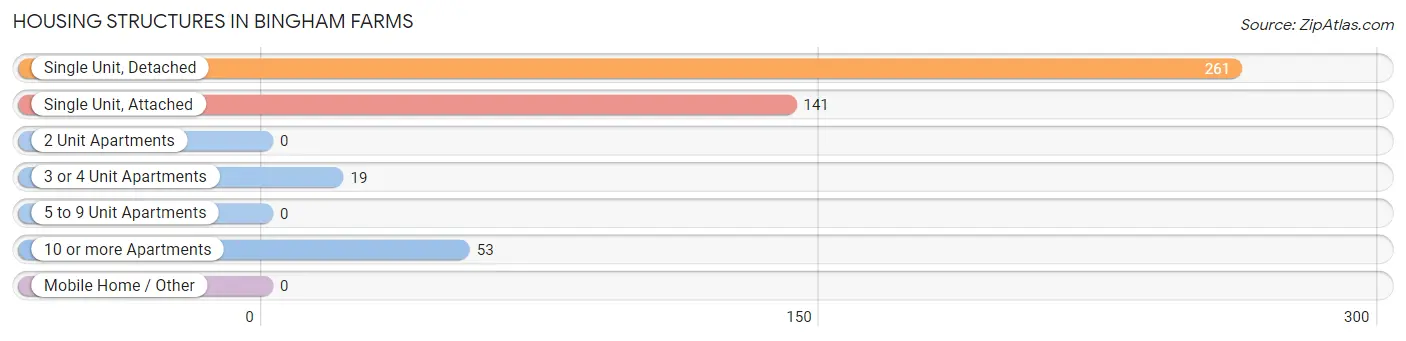
| Structure Type | # Housing Units | % Housing Units |
| Single Unit, Detached | 261 | 55.1% |
| Single Unit, Attached | 141 | 29.7% |
| 2 Unit Apartments | 0 | 0.0% |
| 3 or 4 Unit Apartments | 19 | 4.0% |
| 5 to 9 Unit Apartments | 0 | 0.0% |
| 10 or more Apartments | 53 | 11.2% |
| Mobile Home / Other | 0 | 0.0% |
| Total | 474 | 100.0% |
Housing Structures by Occupancy in Bingham Farms
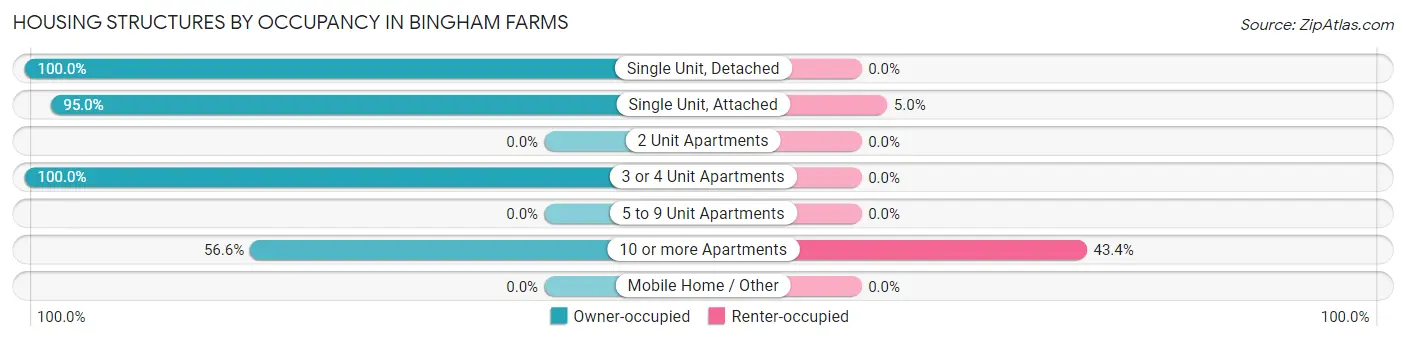
| Structure Type | Owner-occupied | Renter-occupied |
| Single Unit, Detached | 261 (100.0%) | 0 (0.0%) |
| Single Unit, Attached | 134 (95.0%) | 7 (5.0%) |
| 2 Unit Apartments | 0 (0.0%) | 0 (0.0%) |
| 3 or 4 Unit Apartments | 19 (100.0%) | 0 (0.0%) |
| 5 to 9 Unit Apartments | 0 (0.0%) | 0 (0.0%) |
| 10 or more Apartments | 30 (56.6%) | 23 (43.4%) |
| Mobile Home / Other | 0 (0.0%) | 0 (0.0%) |
| Total | 444 (93.7%) | 30 (6.3%) |
Housing Structures by Number of Rooms in Bingham Farms
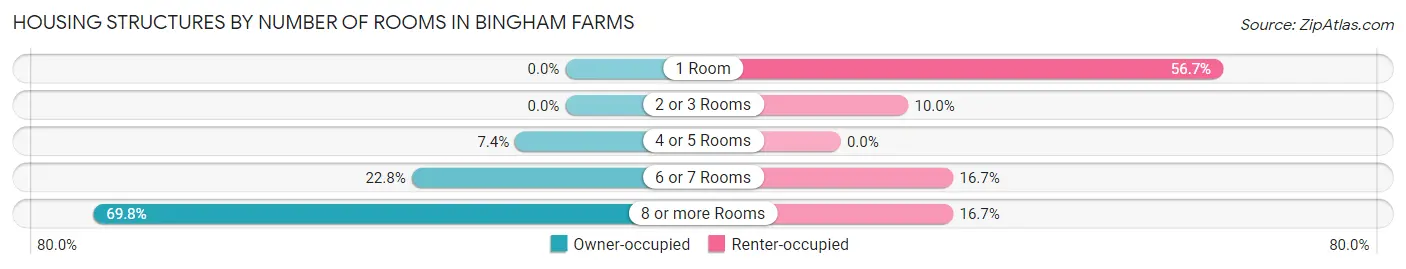
| Number of Rooms | Owner-occupied | Renter-occupied |
| 1 Room | 0 (0.0%) | 17 (56.7%) |
| 2 or 3 Rooms | 0 (0.0%) | 3 (10.0%) |
| 4 or 5 Rooms | 33 (7.4%) | 0 (0.0%) |
| 6 or 7 Rooms | 101 (22.8%) | 5 (16.7%) |
| 8 or more Rooms | 310 (69.8%) | 5 (16.7%) |
| Total | 444 (100.0%) | 30 (100.0%) |
Housing Structure by Heating Type in Bingham Farms
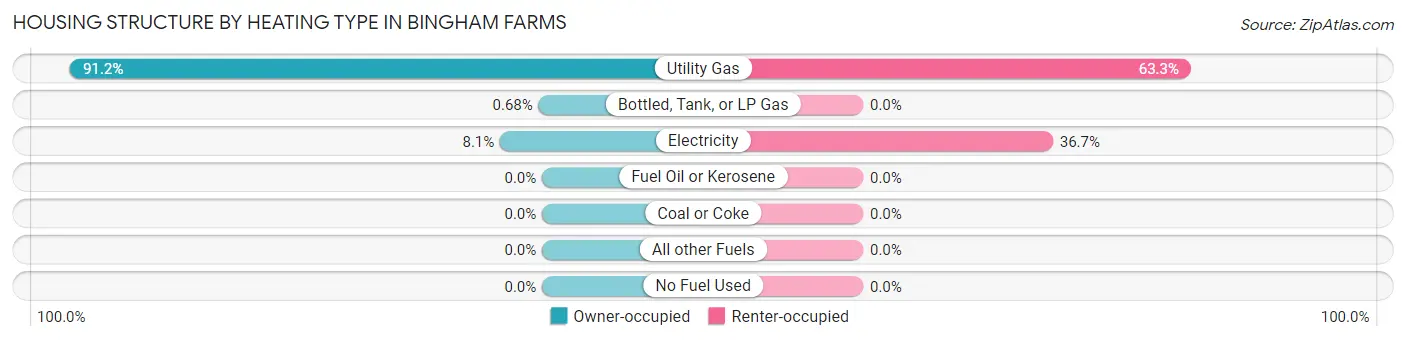
| Heating Type | Owner-occupied | Renter-occupied |
| Utility Gas | 405 (91.2%) | 19 (63.3%) |
| Bottled, Tank, or LP Gas | 3 (0.7%) | 0 (0.0%) |
| Electricity | 36 (8.1%) | 11 (36.7%) |
| Fuel Oil or Kerosene | 0 (0.0%) | 0 (0.0%) |
| Coal or Coke | 0 (0.0%) | 0 (0.0%) |
| All other Fuels | 0 (0.0%) | 0 (0.0%) |
| No Fuel Used | 0 (0.0%) | 0 (0.0%) |
| Total | 444 (100.0%) | 30 (100.0%) |
Household Vehicle Usage in Bingham Farms
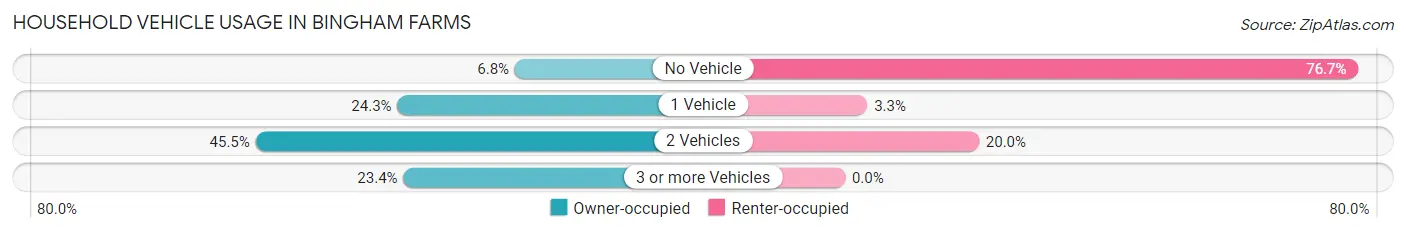
| Vehicles per Household | Owner-occupied | Renter-occupied |
| No Vehicle | 30 (6.8%) | 23 (76.7%) |
| 1 Vehicle | 108 (24.3%) | 1 (3.3%) |
| 2 Vehicles | 202 (45.5%) | 6 (20.0%) |
| 3 or more Vehicles | 104 (23.4%) | 0 (0.0%) |
| Total | 444 (100.0%) | 30 (100.0%) |
Real Estate & Mortgages in Bingham Farms
Real Estate and Mortgage Overview in Bingham Farms
| Characteristic | Without Mortgage | With Mortgage |
| Housing Units | 209 | 235 |
| Median Property Value | $506,000 | $558,600 |
| Median Household Income | $225,043 | $171 |
| Monthly Housing Costs | $1,301 | $119 |
| Real Estate Taxes | $7,458 | $5 |
Property Value by Mortgage Status in Bingham Farms
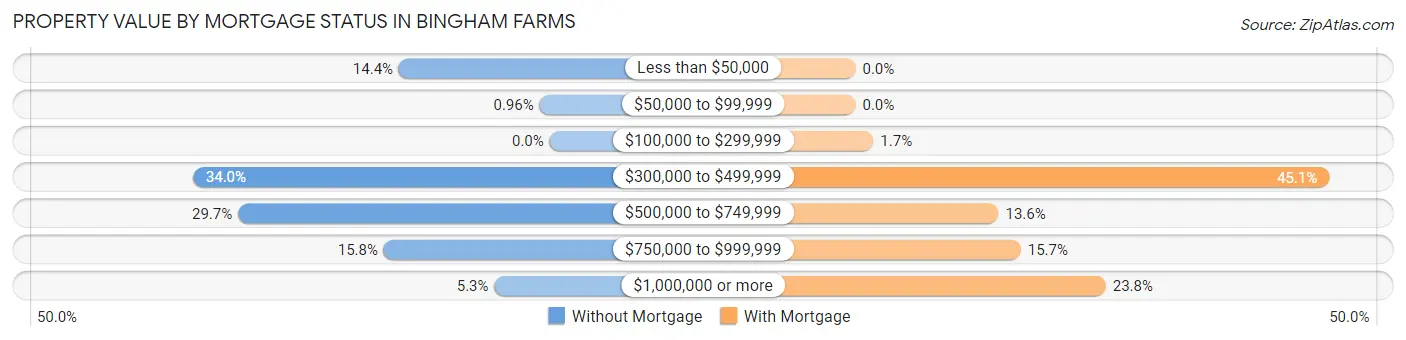
| Property Value | Without Mortgage | With Mortgage |
| Less than $50,000 | 30 (14.3%) | 0 (0.0%) |
| $50,000 to $99,999 | 2 (1.0%) | 0 (0.0%) |
| $100,000 to $299,999 | 0 (0.0%) | 4 (1.7%) |
| $300,000 to $499,999 | 71 (34.0%) | 106 (45.1%) |
| $500,000 to $749,999 | 62 (29.7%) | 32 (13.6%) |
| $750,000 to $999,999 | 33 (15.8%) | 37 (15.7%) |
| $1,000,000 or more | 11 (5.3%) | 56 (23.8%) |
| Total | 209 (100.0%) | 235 (100.0%) |
Household Income by Mortgage Status in Bingham Farms
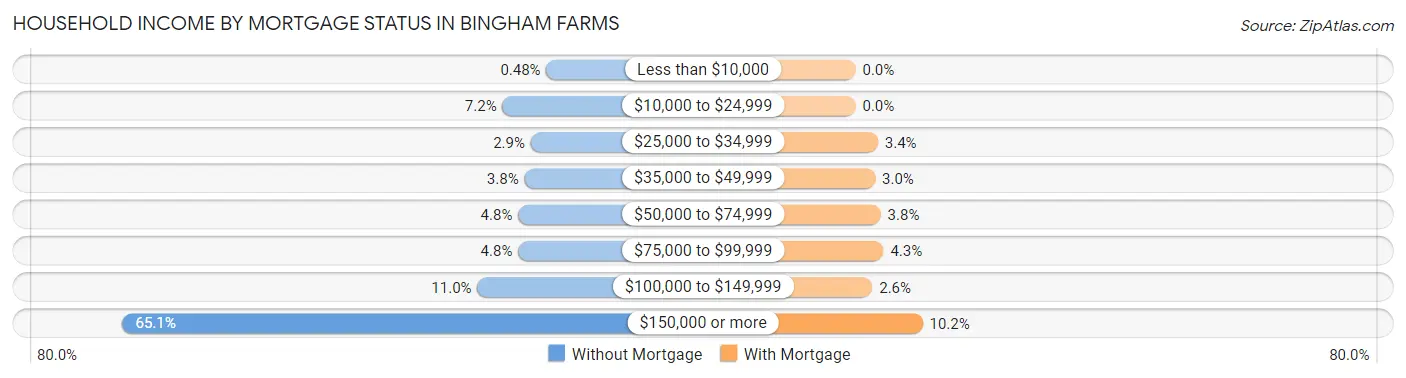
| Household Income | Without Mortgage | With Mortgage |
| Less than $10,000 | 1 (0.5%) | 0 (0.0%) |
| $10,000 to $24,999 | 15 (7.2%) | 0 (0.0%) |
| $25,000 to $34,999 | 6 (2.9%) | 8 (3.4%) |
| $35,000 to $49,999 | 8 (3.8%) | 7 (3.0%) |
| $50,000 to $74,999 | 10 (4.8%) | 9 (3.8%) |
| $75,000 to $99,999 | 10 (4.8%) | 10 (4.3%) |
| $100,000 to $149,999 | 23 (11.0%) | 6 (2.5%) |
| $150,000 or more | 136 (65.1%) | 24 (10.2%) |
| Total | 209 (100.0%) | 235 (100.0%) |
Property Value to Household Income Ratio in Bingham Farms
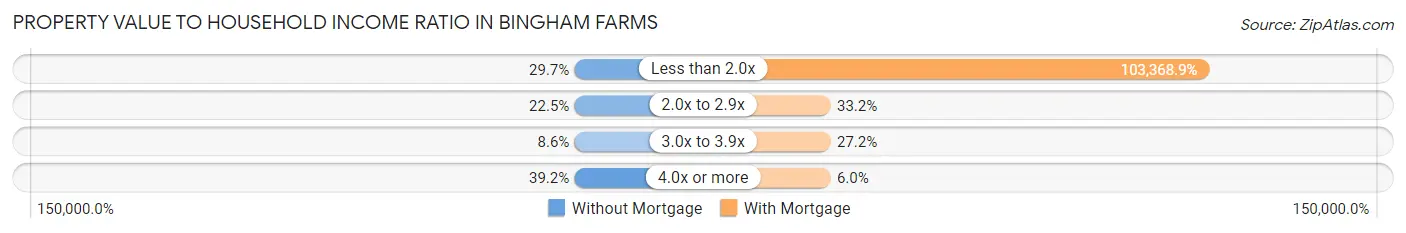
| Value-to-Income Ratio | Without Mortgage | With Mortgage |
| Less than 2.0x | 62 (29.7%) | 242,917 (103,368.9%) |
| 2.0x to 2.9x | 47 (22.5%) | 78 (33.2%) |
| 3.0x to 3.9x | 18 (8.6%) | 64 (27.2%) |
| 4.0x or more | 82 (39.2%) | 14 (6.0%) |
| Total | 209 (100.0%) | 235 (100.0%) |
Real Estate Taxes by Mortgage Status in Bingham Farms
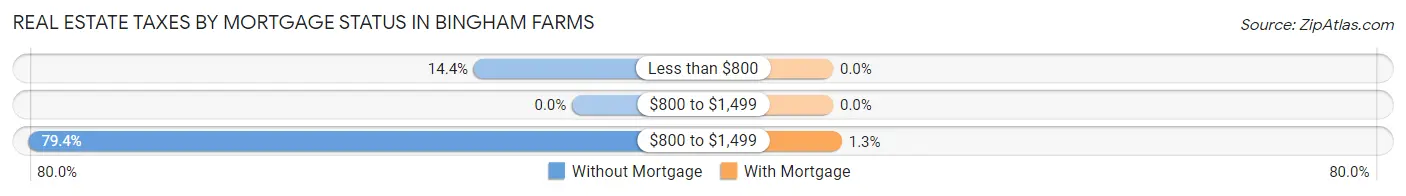
| Property Taxes | Without Mortgage | With Mortgage |
| Less than $800 | 30 (14.3%) | 0 (0.0%) |
| $800 to $1,499 | 0 (0.0%) | 0 (0.0%) |
| $800 to $1,499 | 166 (79.4%) | 3 (1.3%) |
| Total | 209 (100.0%) | 235 (100.0%) |
Health & Disability in Bingham Farms
Health Insurance Coverage by Age in Bingham Farms
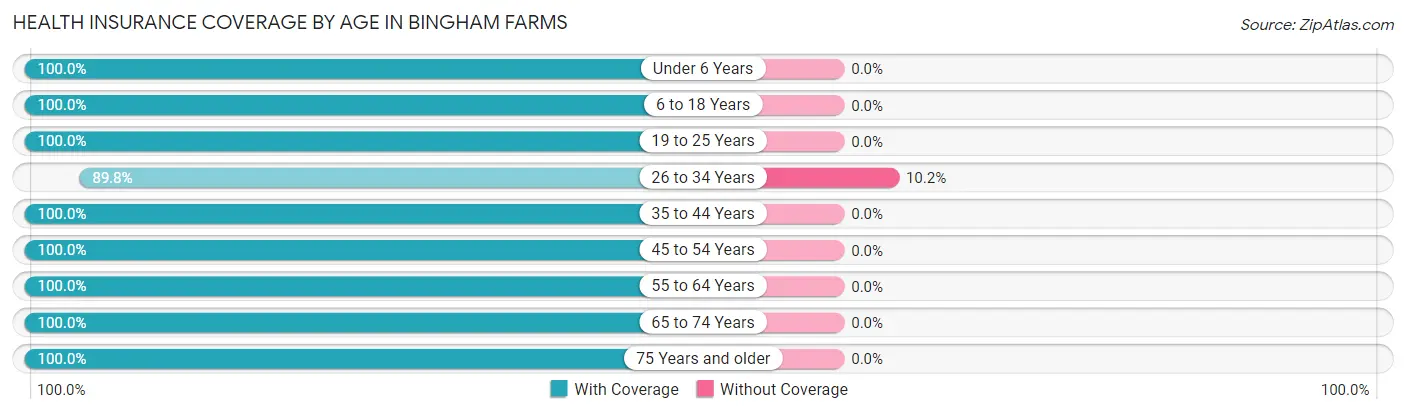
| Age Bracket | With Coverage | Without Coverage |
| Under 6 Years | 4 (100.0%) | 0 (0.0%) |
| 6 to 18 Years | 196 (100.0%) | 0 (0.0%) |
| 19 to 25 Years | 25 (100.0%) | 0 (0.0%) |
| 26 to 34 Years | 44 (89.8%) | 5 (10.2%) |
| 35 to 44 Years | 69 (100.0%) | 0 (0.0%) |
| 45 to 54 Years | 112 (100.0%) | 0 (0.0%) |
| 55 to 64 Years | 261 (100.0%) | 0 (0.0%) |
| 65 to 74 Years | 203 (100.0%) | 0 (0.0%) |
| 75 Years and older | 645 (100.0%) | 0 (0.0%) |
| Total | 1,559 (99.7%) | 5 (0.3%) |
Health Insurance Coverage by Citizenship Status in Bingham Farms
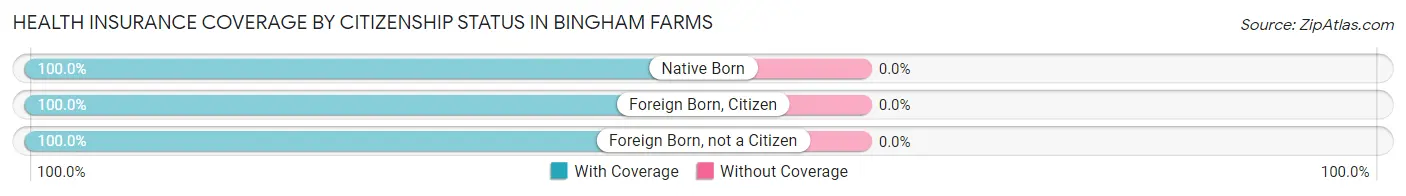
| Citizenship Status | With Coverage | Without Coverage |
| Native Born | 4 (100.0%) | 0 (0.0%) |
| Foreign Born, Citizen | 196 (100.0%) | 0 (0.0%) |
| Foreign Born, not a Citizen | 25 (100.0%) | 0 (0.0%) |
Health Insurance Coverage by Household Income in Bingham Farms
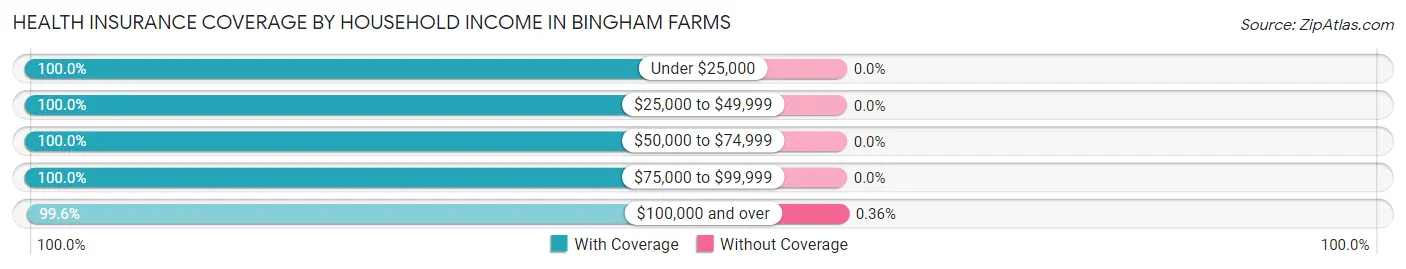
| Household Income | With Coverage | Without Coverage |
| Under $25,000 | 46 (100.0%) | 0 (0.0%) |
| $25,000 to $49,999 | 63 (100.0%) | 0 (0.0%) |
| $50,000 to $74,999 | 48 (100.0%) | 0 (0.0%) |
| $75,000 to $99,999 | 24 (100.0%) | 0 (0.0%) |
| $100,000 and over | 1,378 (99.6%) | 5 (0.4%) |
Public vs Private Health Insurance Coverage by Age in Bingham Farms
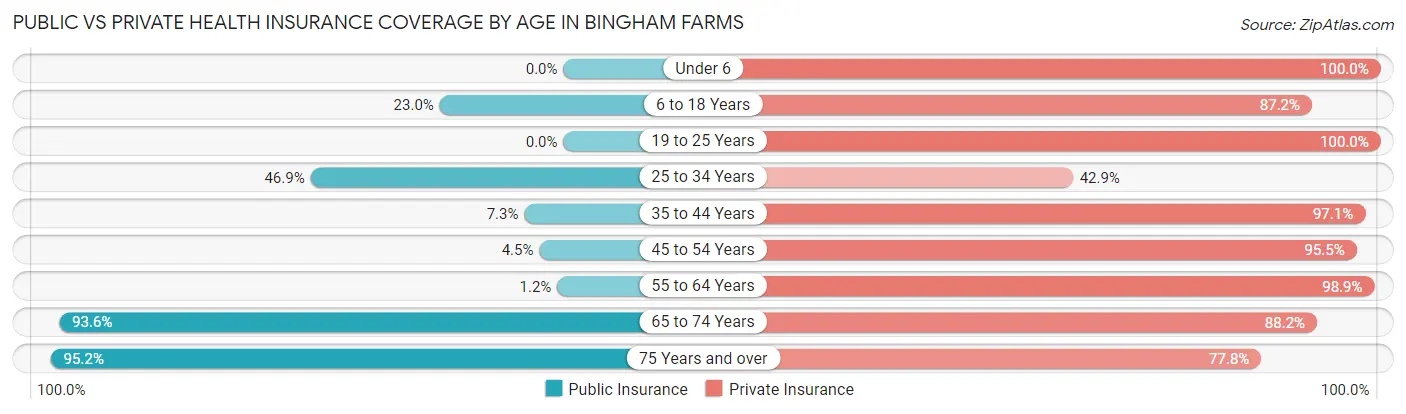
| Age Bracket | Public Insurance | Private Insurance |
| Under 6 | 0 (0.0%) | 4 (100.0%) |
| 6 to 18 Years | 45 (23.0%) | 171 (87.2%) |
| 19 to 25 Years | 0 (0.0%) | 25 (100.0%) |
| 25 to 34 Years | 23 (46.9%) | 21 (42.9%) |
| 35 to 44 Years | 5 (7.2%) | 67 (97.1%) |
| 45 to 54 Years | 5 (4.5%) | 107 (95.5%) |
| 55 to 64 Years | 3 (1.1%) | 258 (98.9%) |
| 65 to 74 Years | 190 (93.6%) | 179 (88.2%) |
| 75 Years and over | 614 (95.2%) | 502 (77.8%) |
| Total | 885 (56.6%) | 1,334 (85.3%) |
Disability Status by Sex by Age in Bingham Farms
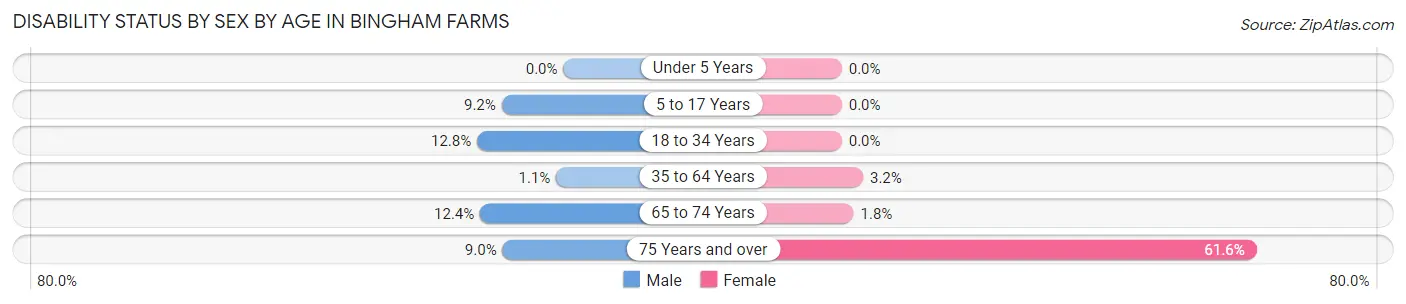
| Age Bracket | Male | Female |
| Under 5 Years | 0 (0.0%) | 0 (0.0%) |
| 5 to 17 Years | 10 (9.2%) | 0 (0.0%) |
| 18 to 34 Years | 5 (12.8%) | 0 (0.0%) |
| 35 to 64 Years | 2 (1.1%) | 8 (3.2%) |
| 65 to 74 Years | 11 (12.4%) | 2 (1.8%) |
| 75 Years and over | 15 (9.0%) | 295 (61.6%) |
Disability Class by Sex by Age in Bingham Farms
Disability Class: Hearing Difficulty
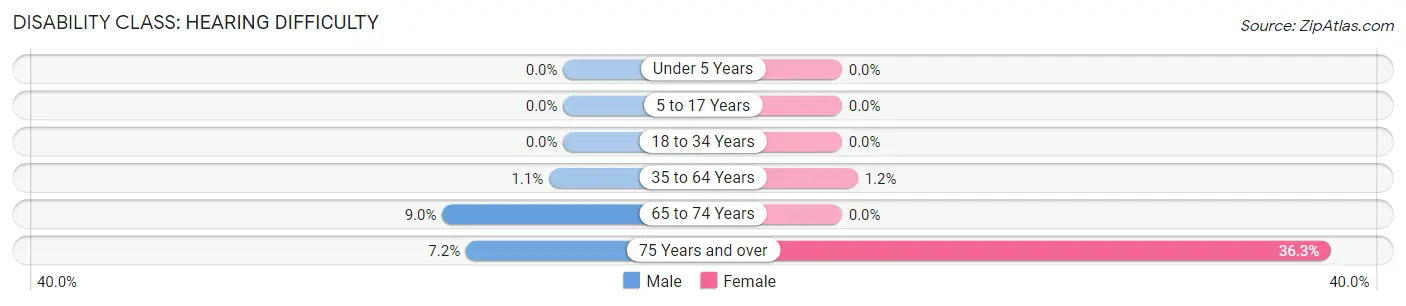
| Age Bracket | Male | Female |
| Under 5 Years | 0 (0.0%) | 0 (0.0%) |
| 5 to 17 Years | 0 (0.0%) | 0 (0.0%) |
| 18 to 34 Years | 0 (0.0%) | 0 (0.0%) |
| 35 to 64 Years | 2 (1.1%) | 3 (1.2%) |
| 65 to 74 Years | 8 (9.0%) | 0 (0.0%) |
| 75 Years and over | 12 (7.2%) | 174 (36.3%) |
Disability Class: Vision Difficulty
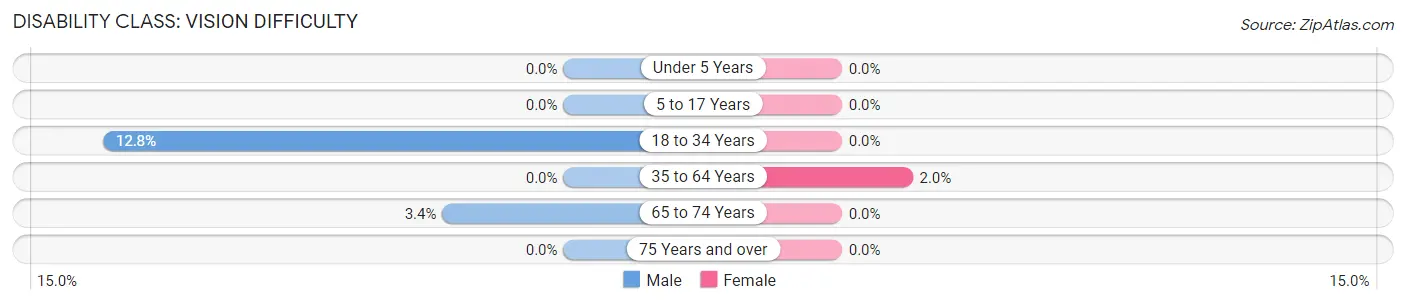
| Age Bracket | Male | Female |
| Under 5 Years | 0 (0.0%) | 0 (0.0%) |
| 5 to 17 Years | 0 (0.0%) | 0 (0.0%) |
| 18 to 34 Years | 5 (12.8%) | 0 (0.0%) |
| 35 to 64 Years | 0 (0.0%) | 5 (2.0%) |
| 65 to 74 Years | 3 (3.4%) | 0 (0.0%) |
| 75 Years and over | 0 (0.0%) | 0 (0.0%) |
Disability Class: Cognitive Difficulty
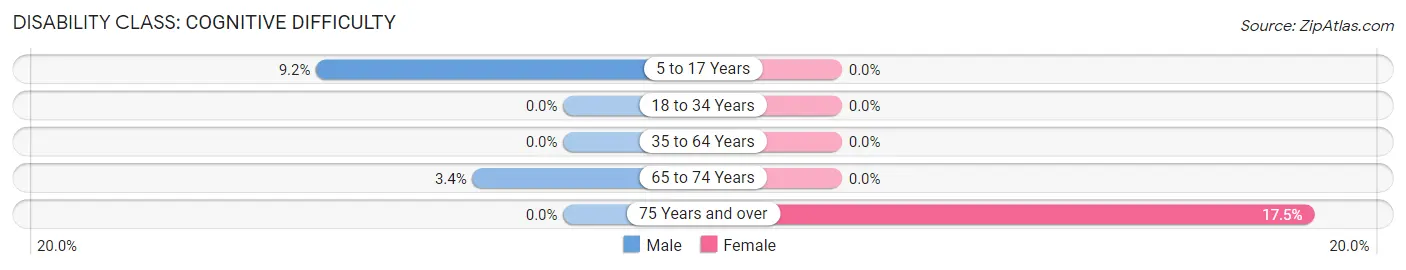
| Age Bracket | Male | Female |
| 5 to 17 Years | 10 (9.2%) | 0 (0.0%) |
| 18 to 34 Years | 0 (0.0%) | 0 (0.0%) |
| 35 to 64 Years | 0 (0.0%) | 0 (0.0%) |
| 65 to 74 Years | 3 (3.4%) | 0 (0.0%) |
| 75 Years and over | 0 (0.0%) | 84 (17.5%) |
Disability Class: Ambulatory Difficulty
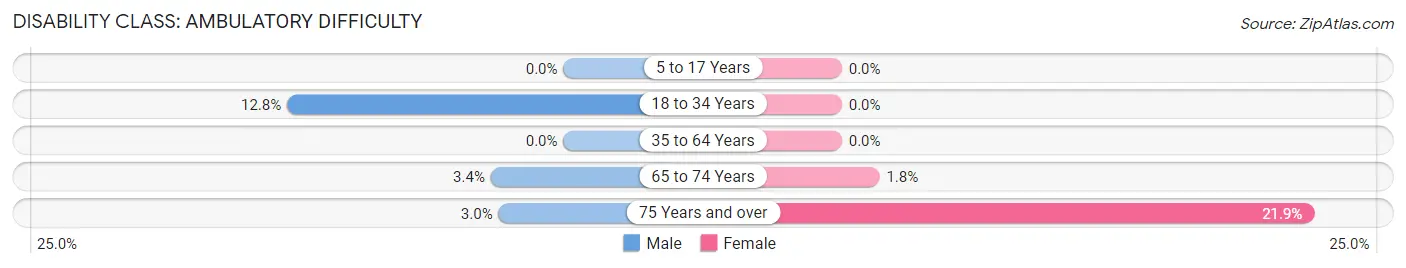
| Age Bracket | Male | Female |
| 5 to 17 Years | 0 (0.0%) | 0 (0.0%) |
| 18 to 34 Years | 5 (12.8%) | 0 (0.0%) |
| 35 to 64 Years | 0 (0.0%) | 0 (0.0%) |
| 65 to 74 Years | 3 (3.4%) | 2 (1.8%) |
| 75 Years and over | 5 (3.0%) | 105 (21.9%) |
Disability Class: Self-Care Difficulty
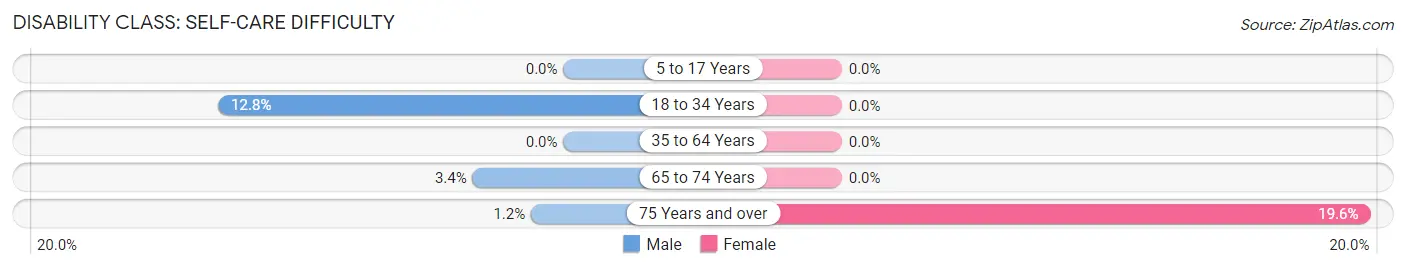
| Age Bracket | Male | Female |
| 5 to 17 Years | 0 (0.0%) | 0 (0.0%) |
| 18 to 34 Years | 5 (12.8%) | 0 (0.0%) |
| 35 to 64 Years | 0 (0.0%) | 0 (0.0%) |
| 65 to 74 Years | 3 (3.4%) | 0 (0.0%) |
| 75 Years and over | 2 (1.2%) | 94 (19.6%) |
Technology Access in Bingham Farms
Computing Device Access in Bingham Farms
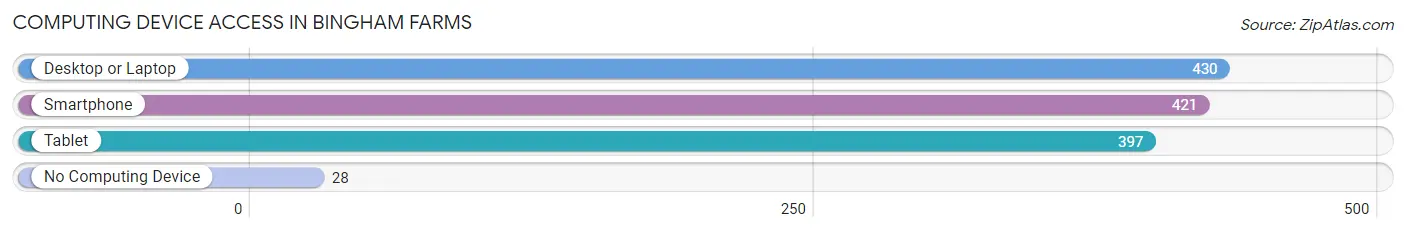
| Device Type | # Households | % Households |
| Desktop or Laptop | 430 | 90.7% |
| Smartphone | 421 | 88.8% |
| Tablet | 397 | 83.8% |
| No Computing Device | 28 | 5.9% |
| Total | 474 | 100.0% |
Internet Access in Bingham Farms
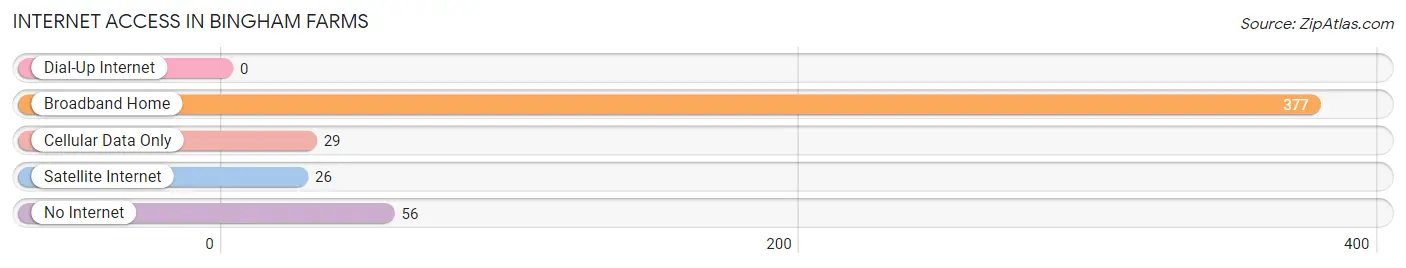
| Internet Type | # Households | % Households |
| Dial-Up Internet | 0 | 0.0% |
| Broadband Home | 377 | 79.5% |
| Cellular Data Only | 29 | 6.1% |
| Satellite Internet | 26 | 5.5% |
| No Internet | 56 | 11.8% |
| Total | 474 | 100.0% |
Bingham Farms Summary
Bingham Farms is a small village located in the state of Michigan in the United States. It is located in the southeastern corner of Oakland County, and is part of the Detroit metropolitan area. The village has a population of just over 1,000 people, and is known for its rural atmosphere and small-town charm.
History
Bingham Farms was first settled in 1825 by William Bingham, a farmer from New York. He purchased the land from the government and began to farm the area. The village was officially incorporated in 1867, and was named after William Bingham. The village was originally a farming community, but over time it has become more of a residential area.
Geography
Bingham Farms is located in the southeastern corner of Oakland County, Michigan. It is bordered by the cities of Southfield and Franklin to the north, and the cities of Birmingham and Bloomfield Hills to the south. The village is situated on the banks of the Rouge River, and is surrounded by rolling hills and wooded areas. The village covers an area of 1.2 square miles, and has a population of just over 1,000 people.
Economy
Bingham Farms is primarily a residential community, and the majority of its residents are employed in the nearby cities of Southfield and Birmingham. The village does have a few small businesses, including a few restaurants, a grocery store, and a few other retail stores. The village also has a few professional offices, such as law firms and accounting firms.
Demographics
As of the 2010 census, the population of Bingham Farms was 1,072. The racial makeup of the village was 94.3% White, 2.2% African American, 0.3% Native American, 1.2% Asian, 0.1% Pacific Islander, 0.7% from other races, and 1.4% from two or more races. The median household income was $90,917, and the median family income was $103,917.
Conclusion
Bingham Farms is a small village located in the southeastern corner of Oakland County, Michigan. It is known for its rural atmosphere and small-town charm, and has a population of just over 1,000 people. The village is primarily a residential community, and the majority of its residents are employed in the nearby cities of Southfield and Birmingham. The village has a few small businesses, and the median household income is $90,917.
Common Questions
What is Per Capita Income in Bingham Farms?
Per Capita income in Bingham Farms is $85,353.
What is the Median Family Income in Bingham Farms?
Median Family Income in Bingham Farms is $250,001.
What is the Median Household income in Bingham Farms?
Median Household Income in Bingham Farms is $197,273.
What is Income or Wage Gap in Bingham Farms?
Income or Wage Gap in Bingham Farms is 57.0%.
Women in Bingham Farms earn 43.0 cents for every dollar earned by a man.
What is Inequality or Gini Index in Bingham Farms?
Inequality or Gini Index in Bingham Farms is 0.45.
What is the Total Population of Bingham Farms?
Total Population of Bingham Farms is 1,623.
What is the Total Male Population of Bingham Farms?
Total Male Population of Bingham Farms is 625.
What is the Total Female Population of Bingham Farms?
Total Female Population of Bingham Farms is 998.
What is the Ratio of Males per 100 Females in Bingham Farms?
There are 62.63 Males per 100 Females in Bingham Farms.
What is the Ratio of Females per 100 Males in Bingham Farms?
There are 159.68 Females per 100 Males in Bingham Farms.
What is the Median Population Age in Bingham Farms?
Median Population Age in Bingham Farms is 68.9 Years.
What is the Average Family Size in Bingham Farms
Average Family Size in Bingham Farms is 2.8 People.
What is the Average Household Size in Bingham Farms
Average Household Size in Bingham Farms is 3.3 People.
How Large is the Labor Force in Bingham Farms?
There are 500 People in the Labor Forcein in Bingham Farms.
What is the Percentage of People in the Labor Force in Bingham Farms?
34.2% of People are in the Labor Force in Bingham Farms.
What is the Unemployment Rate in Bingham Farms?
Unemployment Rate in Bingham Farms is 3.2%.