Franklin, MI Map & Demographics
Franklin Map
Franklin Overview
$113,299
PER CAPITA INCOME
$181,964
AVG FAMILY INCOME
$178,167
AVG HOUSEHOLD INCOME
51.3%
WAGE / INCOME GAP [ % ]
48.7¢/ $1
WAGE / INCOME GAP [ $ ]
0.48
INEQUALITY / GINI INDEX
2,653
TOTAL POPULATION
1,302
MALE POPULATION
1,351
FEMALE POPULATION
96.37
MALES / 100 FEMALES
103.76
FEMALES / 100 MALES
48.3
MEDIAN AGE
2.9
AVG FAMILY SIZE
2.5
AVG HOUSEHOLD SIZE
1,383
LABOR FORCE [ PEOPLE ]
64.0%
PERCENT IN LABOR FORCE
2.0%
UNEMPLOYMENT RATE
Franklin Zip Codes
Franklin Area Codes
Income in Franklin
Income Overview in Franklin
Per Capita Income in Franklin is $113,299, while median incomes of families and households are $181,964 and $178,167 respectively.
| Characteristic | Number | Measure |
| Per Capita Income | 2,653 | $113,299 |
| Median Family Income | 825 | $181,964 |
| Mean Family Income | 825 | $287,730 |
| Median Household Income | 1,042 | $178,167 |
| Mean Household Income | 1,042 | $284,507 |
| Income Deficit | 825 | $0 |
| Wage / Income Gap (%) | 2,653 | 51.28% |
| Wage / Income Gap ($) | 2,653 | 48.72¢ per $1 |
| Gini / Inequality Index | 2,653 | 0.48 |
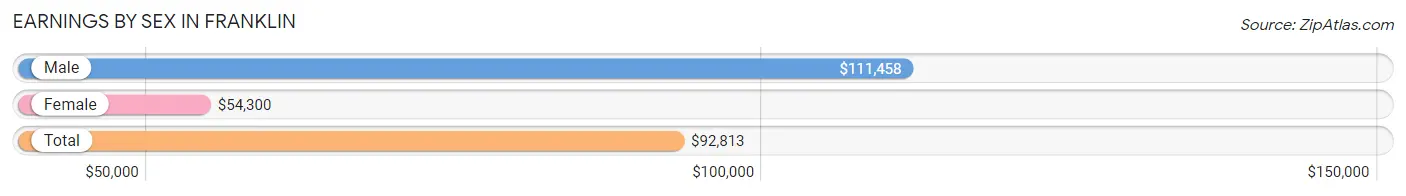
Earnings by Sex in Franklin
Average Earnings in Franklin are $92,813, $111,458 for men and $54,300 for women, a difference of 51.3%.
| Sex | Number | Average Earnings |
| Male | 879 (59.8%) | $111,458 |
| Female | 590 (40.2%) | $54,300 |
| Total | 1,469 (100.0%) | $92,813 |
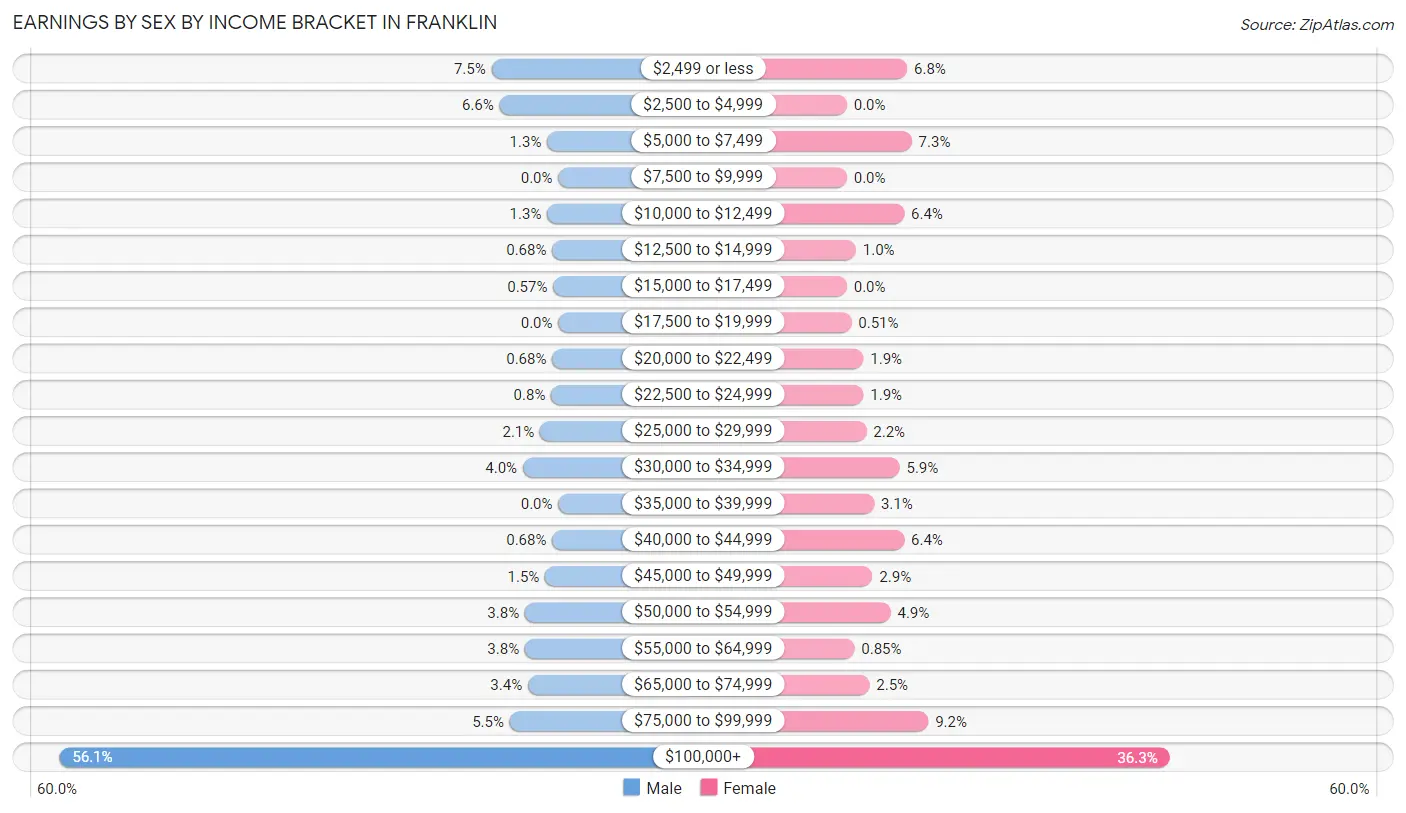
Earnings by Sex by Income Bracket in Franklin
The most common earnings brackets in Franklin are $100,000+ for men (493 | 56.1%) and $100,000+ for women (214 | 36.3%).
| Income | Male | Female |
| $2,499 or less | 66 (7.5%) | 40 (6.8%) |
| $2,500 to $4,999 | 58 (6.6%) | 0 (0.0%) |
| $5,000 to $7,499 | 11 (1.3%) | 43 (7.3%) |
| $7,500 to $9,999 | 0 (0.0%) | 0 (0.0%) |
| $10,000 to $12,499 | 11 (1.3%) | 38 (6.4%) |
| $12,500 to $14,999 | 6 (0.7%) | 6 (1.0%) |
| $15,000 to $17,499 | 5 (0.6%) | 0 (0.0%) |
| $17,500 to $19,999 | 0 (0.0%) | 3 (0.5%) |
| $20,000 to $22,499 | 6 (0.7%) | 11 (1.9%) |
| $22,500 to $24,999 | 7 (0.8%) | 11 (1.9%) |
| $25,000 to $29,999 | 18 (2.1%) | 13 (2.2%) |
| $30,000 to $34,999 | 35 (4.0%) | 35 (5.9%) |
| $35,000 to $39,999 | 0 (0.0%) | 18 (3.0%) |
| $40,000 to $44,999 | 6 (0.7%) | 38 (6.4%) |
| $45,000 to $49,999 | 13 (1.5%) | 17 (2.9%) |
| $50,000 to $54,999 | 33 (3.7%) | 29 (4.9%) |
| $55,000 to $64,999 | 33 (3.7%) | 5 (0.9%) |
| $65,000 to $74,999 | 30 (3.4%) | 15 (2.5%) |
| $75,000 to $99,999 | 48 (5.5%) | 54 (9.1%) |
| $100,000+ | 493 (56.1%) | 214 (36.3%) |
| Total | 879 (100.0%) | 590 (100.0%) |
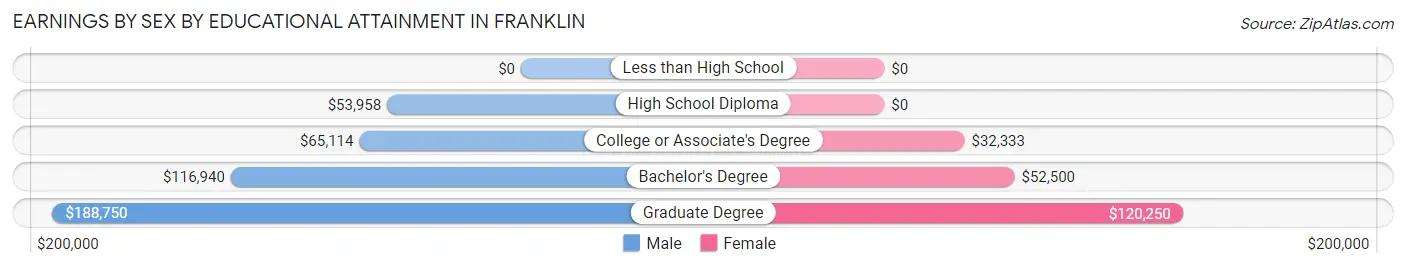
Earnings by Sex by Educational Attainment in Franklin
Average earnings in Franklin are $122,500 for men and $73,542 for women, a difference of 40.0%. Men with an educational attainment of graduate degree enjoy the highest average annual earnings of $188,750, while those with high school diploma education earn the least with $53,958. Women with an educational attainment of graduate degree earn the most with the average annual earnings of $120,250, while those with college or associate's degree education have the smallest earnings of $32,333.
| Educational Attainment | Male Income | Female Income |
| Less than High School | - | - |
| High School Diploma | $53,958 | $0 |
| College or Associate's Degree | $65,114 | $32,333 |
| Bachelor's Degree | $116,940 | $52,500 |
| Graduate Degree | $188,750 | $120,250 |
| Total | $122,500 | $73,542 |
Family Income in Franklin
Family Income Brackets in Franklin
According to the Franklin family income data, there are 395 families falling into the $200,000+ income range, which is the most common income bracket and makes up 47.9% of all families.
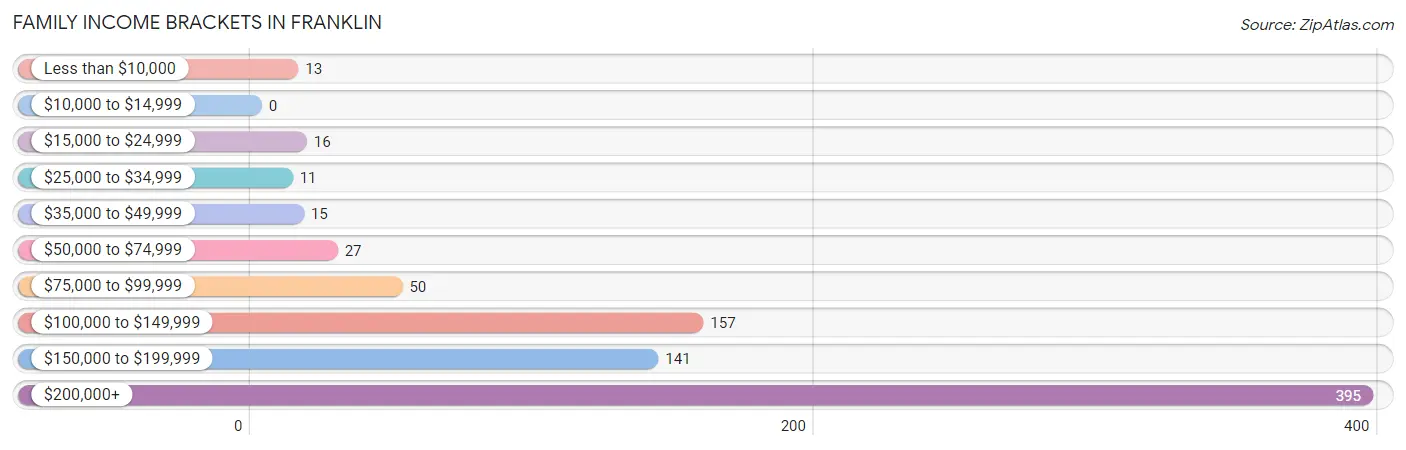
| Income Bracket | # Families | % Families |
| Less than $10,000 | 13 | 1.6% |
| $10,000 to $14,999 | 0 | 0.0% |
| $15,000 to $24,999 | 16 | 1.9% |
| $25,000 to $34,999 | 11 | 1.3% |
| $35,000 to $49,999 | 15 | 1.8% |
| $50,000 to $74,999 | 27 | 3.3% |
| $75,000 to $99,999 | 50 | 6.1% |
| $100,000 to $149,999 | 157 | 19.0% |
| $150,000 to $199,999 | 141 | 17.1% |
| $200,000+ | 395 | 47.9% |
Family Income by Famaliy Size in Franklin
4-person families (161 | 19.5%) account for the highest median family income in Franklin with $250,001 per family, while 2-person families (453 | 54.9%) have the highest median income of $90,982 per family member.
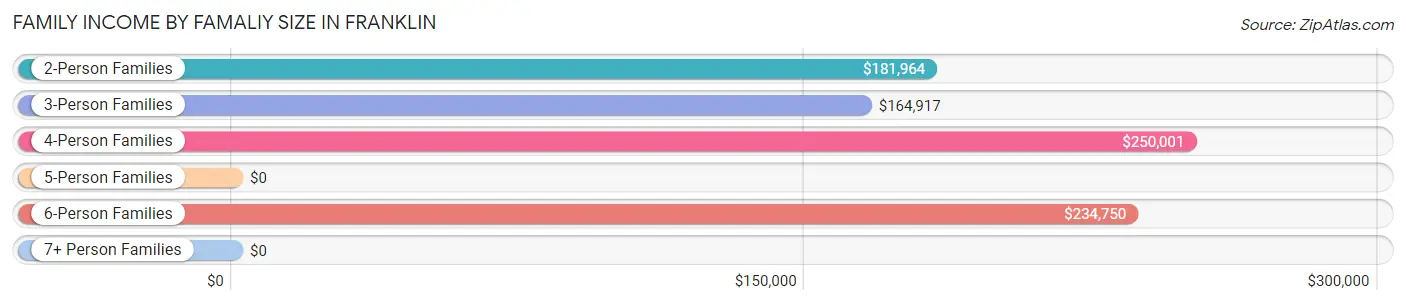
| Income Bracket | # Families | Median Income |
| 2-Person Families | 453 (54.9%) | $181,964 |
| 3-Person Families | 140 (17.0%) | $164,917 |
| 4-Person Families | 161 (19.5%) | $250,001 |
| 5-Person Families | 48 (5.8%) | $0 |
| 6-Person Families | 23 (2.8%) | $234,750 |
| 7+ Person Families | 0 (0.0%) | $0 |
| Total | 825 (100.0%) | $181,964 |
Family Income by Number of Earners in Franklin
The median family income in Franklin is $181,964, with families comprising 3+ earners (68) having the highest median family income of $250,001, while families with no earners (83) have the lowest median family income of $114,688, accounting for 8.2% and 10.1% of families, respectively.
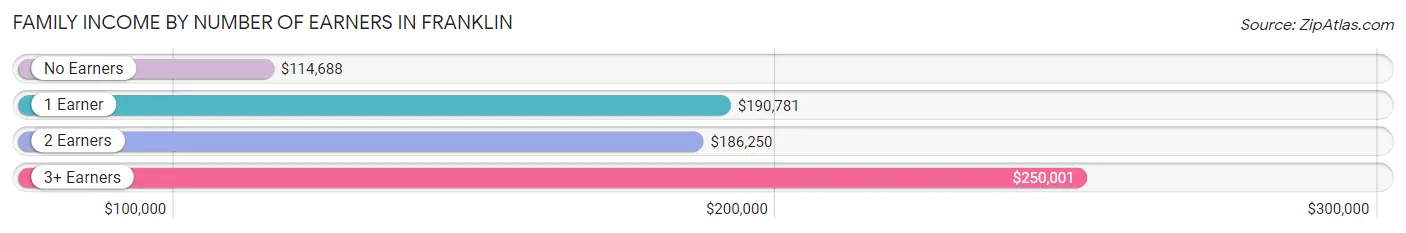
| Number of Earners | # Families | Median Income |
| No Earners | 83 (10.1%) | $114,688 |
| 1 Earner | 295 (35.8%) | $190,781 |
| 2 Earners | 379 (45.9%) | $186,250 |
| 3+ Earners | 68 (8.2%) | $250,001 |
| Total | 825 (100.0%) | $181,964 |
Household Income in Franklin
Household Income Brackets in Franklin
With 476 households falling in the category, the $200,000+ income range is the most frequent in Franklin, accounting for 45.7% of all households. In contrast, only 1 households (0.1%) fall into the $10,000 to $14,999 income bracket, making it the least populous group.
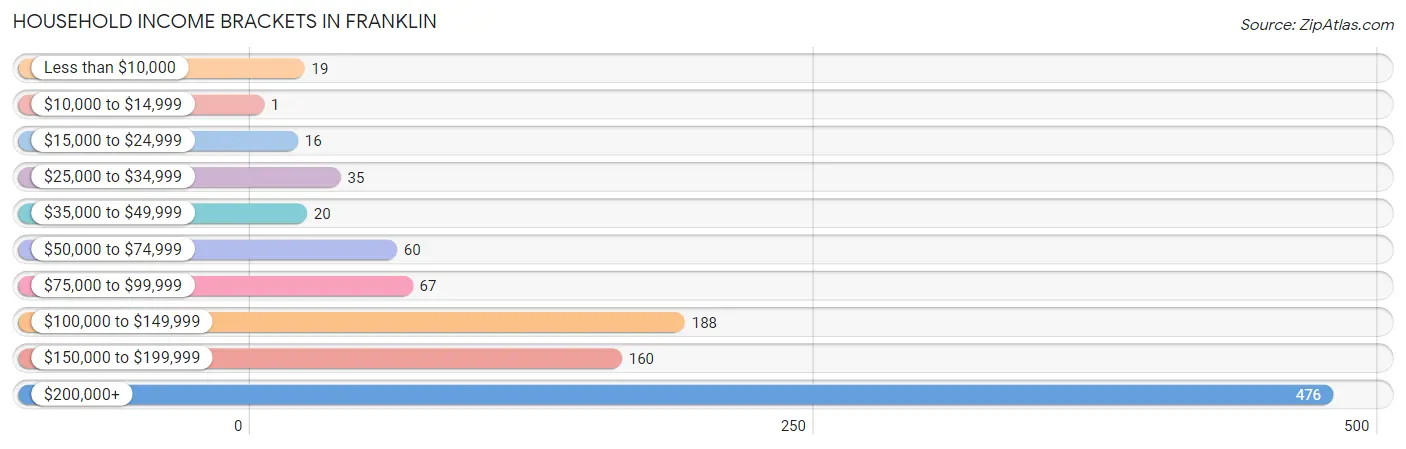
| Income Bracket | # Households | % Households |
| Less than $10,000 | 19 | 1.8% |
| $10,000 to $14,999 | 1 | 0.1% |
| $15,000 to $24,999 | 16 | 1.5% |
| $25,000 to $34,999 | 35 | 3.4% |
| $35,000 to $49,999 | 20 | 1.9% |
| $50,000 to $74,999 | 60 | 5.8% |
| $75,000 to $99,999 | 67 | 6.4% |
| $100,000 to $149,999 | 188 | 18.0% |
| $150,000 to $199,999 | 160 | 15.4% |
| $200,000+ | 476 | 45.7% |
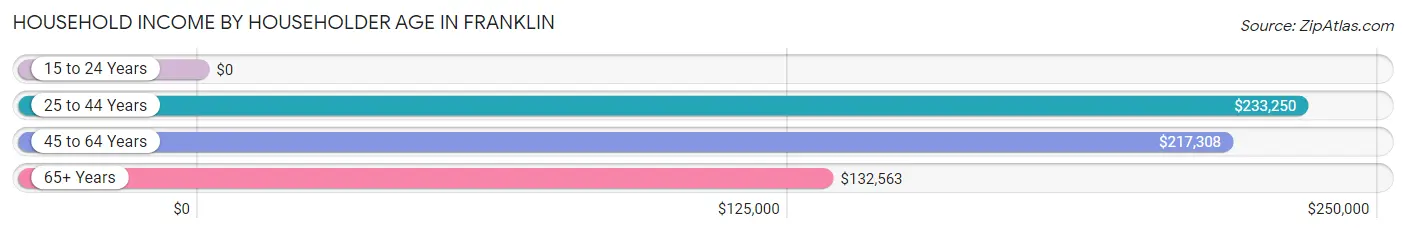
Household Income by Householder Age in Franklin
The median household income in Franklin is $178,167, with the highest median household income of $233,250 found in the 25 to 44 years age bracket for the primary householder. A total of 181 households (17.4%) fall into this category.
| Income Bracket | # Households | Median Income |
| 15 to 24 Years | 0 (0.0%) | $0 |
| 25 to 44 Years | 181 (17.4%) | $233,250 |
| 45 to 64 Years | 462 (44.3%) | $217,308 |
| 65+ Years | 399 (38.3%) | $132,563 |
| Total | 1,042 (100.0%) | $178,167 |
Poverty in Franklin
Income Below Poverty by Sex and Age in Franklin
With 2.7% poverty level for males and 2.7% for females among the residents of Franklin, 18 to 24 year old males and 65 to 74 year old females are the most vulnerable to poverty, with 18 males (15.8%) and 13 females (8.6%) in their respective age groups living below the poverty level.
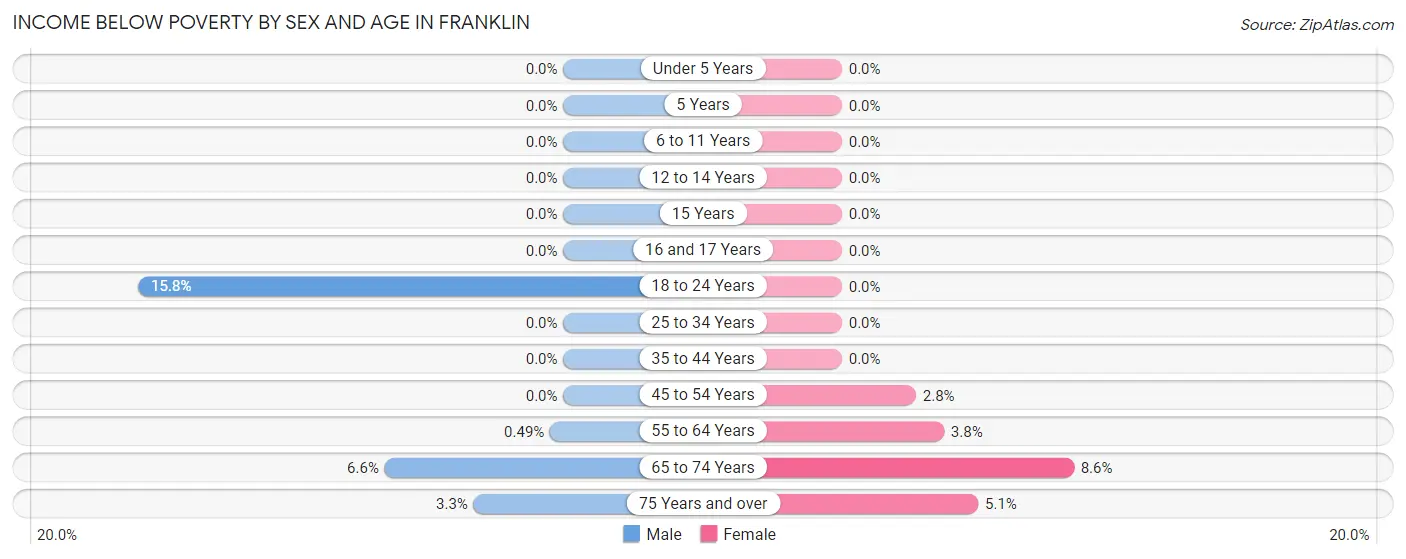
| Age Bracket | Male | Female |
| Under 5 Years | 0 (0.0%) | 0 (0.0%) |
| 5 Years | 0 (0.0%) | 0 (0.0%) |
| 6 to 11 Years | 0 (0.0%) | 0 (0.0%) |
| 12 to 14 Years | 0 (0.0%) | 0 (0.0%) |
| 15 Years | 0 (0.0%) | 0 (0.0%) |
| 16 and 17 Years | 0 (0.0%) | 0 (0.0%) |
| 18 to 24 Years | 18 (15.8%) | 0 (0.0%) |
| 25 to 34 Years | 0 (0.0%) | 0 (0.0%) |
| 35 to 44 Years | 0 (0.0%) | 0 (0.0%) |
| 45 to 54 Years | 0 (0.0%) | 5 (2.8%) |
| 55 to 64 Years | 1 (0.5%) | 10 (3.8%) |
| 65 to 74 Years | 12 (6.6%) | 13 (8.6%) |
| 75 Years and over | 4 (3.3%) | 9 (5.1%) |
| Total | 35 (2.7%) | 37 (2.7%) |
Income Above Poverty by Sex and Age in Franklin
According to the poverty statistics in Franklin, males aged under 5 years and females aged under 5 years are the age groups that are most secure financially, with 100.0% of males and 100.0% of females in these age groups living above the poverty line.
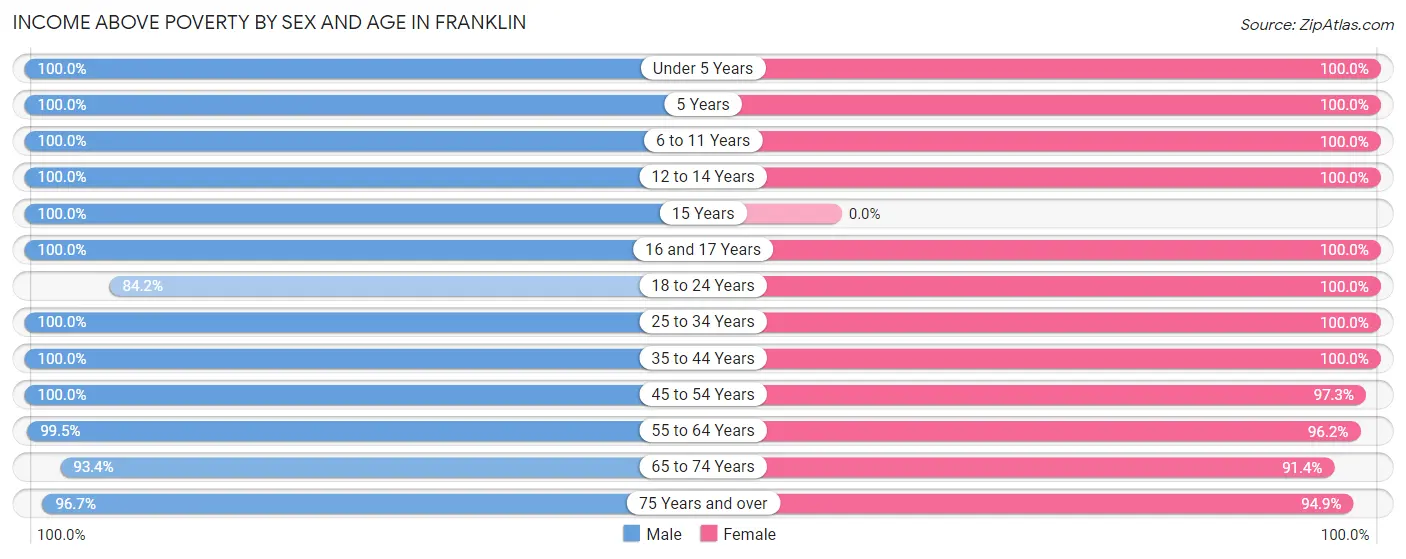
| Age Bracket | Male | Female |
| Under 5 Years | 79 (100.0%) | 84 (100.0%) |
| 5 Years | 26 (100.0%) | 27 (100.0%) |
| 6 to 11 Years | 70 (100.0%) | 70 (100.0%) |
| 12 to 14 Years | 33 (100.0%) | 76 (100.0%) |
| 15 Years | 27 (100.0%) | 0 (0.0%) |
| 16 and 17 Years | 19 (100.0%) | 32 (100.0%) |
| 18 to 24 Years | 96 (84.2%) | 62 (100.0%) |
| 25 to 34 Years | 106 (100.0%) | 80 (100.0%) |
| 35 to 44 Years | 111 (100.0%) | 145 (100.0%) |
| 45 to 54 Years | 213 (100.0%) | 177 (97.3%) |
| 55 to 64 Years | 202 (99.5%) | 254 (96.2%) |
| 65 to 74 Years | 169 (93.4%) | 138 (91.4%) |
| 75 Years and over | 116 (96.7%) | 169 (94.9%) |
| Total | 1,267 (97.3%) | 1,314 (97.3%) |
Income Below Poverty Among Married-Couple Families in Franklin
The poverty statistics for married-couple families in Franklin show that 2.1% or 16 of the total 745 families live below the poverty line. Families with no children have the highest poverty rate of 3.4%, comprising of 16 families. On the other hand, families with 1 or 2 children have the lowest poverty rate of 0.0%, which includes 0 families.
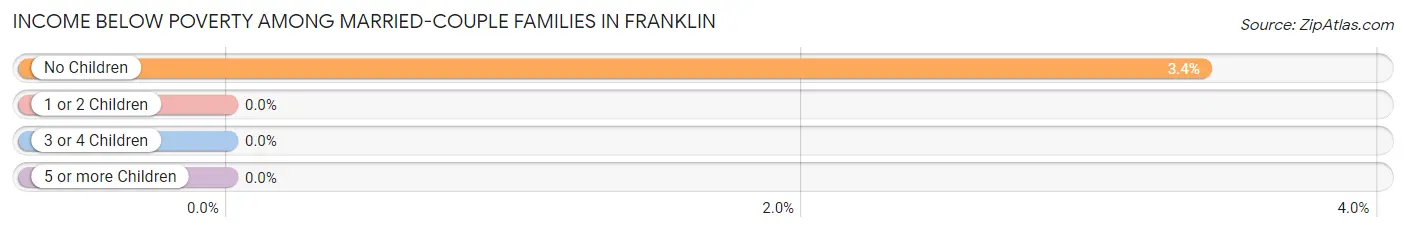
| Children | Above Poverty | Below Poverty |
| No Children | 456 (96.6%) | 16 (3.4%) |
| 1 or 2 Children | 226 (100.0%) | 0 (0.0%) |
| 3 or 4 Children | 47 (100.0%) | 0 (0.0%) |
| 5 or more Children | 0 (0.0%) | 0 (0.0%) |
| Total | 729 (97.9%) | 16 (2.1%) |
Income Below Poverty Among Single-Parent Households in Franklin
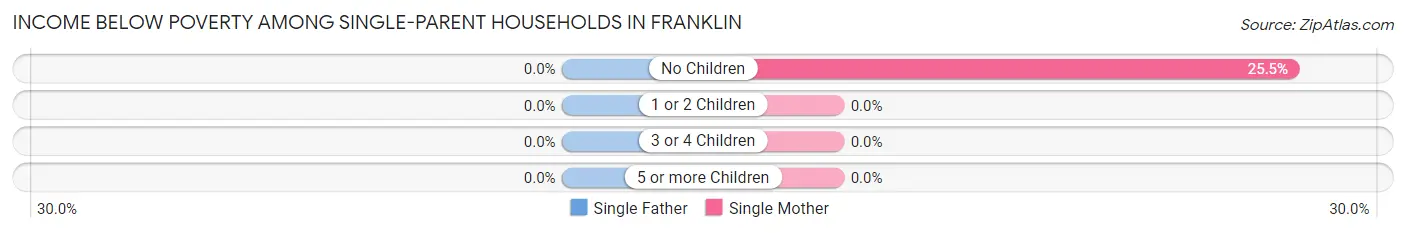
| Children | Single Father | Single Mother |
| No Children | 0 (0.0%) | 13 (25.5%) |
| 1 or 2 Children | 0 (0.0%) | 0 (0.0%) |
| 3 or 4 Children | 0 (0.0%) | 0 (0.0%) |
| 5 or more Children | 0 (0.0%) | 0 (0.0%) |
| Total | 0 (0.0%) | 13 (22.0%) |
Income Below Poverty Among Married-Couple vs Single-Parent Households in Franklin
The poverty data for Franklin shows that 16 of the married-couple family households (2.1%) and 13 of the single-parent households (16.3%) are living below the poverty level. Within the married-couple family households, those with no children have the highest poverty rate, with 16 households (3.4%) falling below the poverty line. Among the single-parent households, those with no children have the highest poverty rate, with 13 household (20.0%) living below poverty.
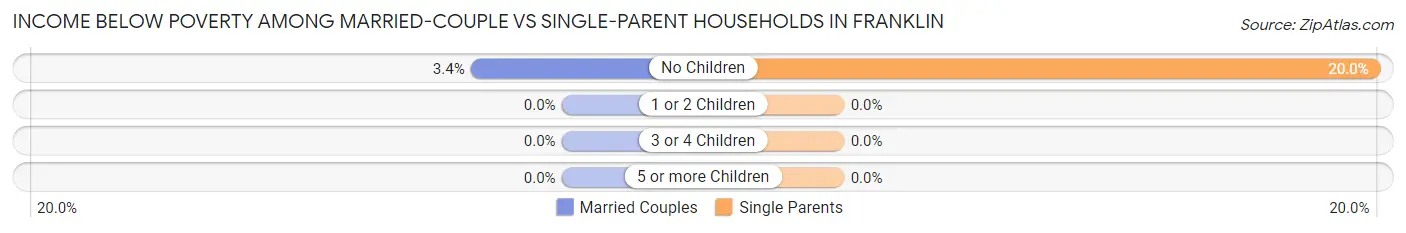
| Children | Married-Couple Families | Single-Parent Households |
| No Children | 16 (3.4%) | 13 (20.0%) |
| 1 or 2 Children | 0 (0.0%) | 0 (0.0%) |
| 3 or 4 Children | 0 (0.0%) | 0 (0.0%) |
| 5 or more Children | 0 (0.0%) | 0 (0.0%) |
| Total | 16 (2.1%) | 13 (16.3%) |
Race in Franklin
The most populous races in Franklin are White / Caucasian (1,922 | 72.5%), Black / African American (382 | 14.4%), and Asian (176 | 6.6%).
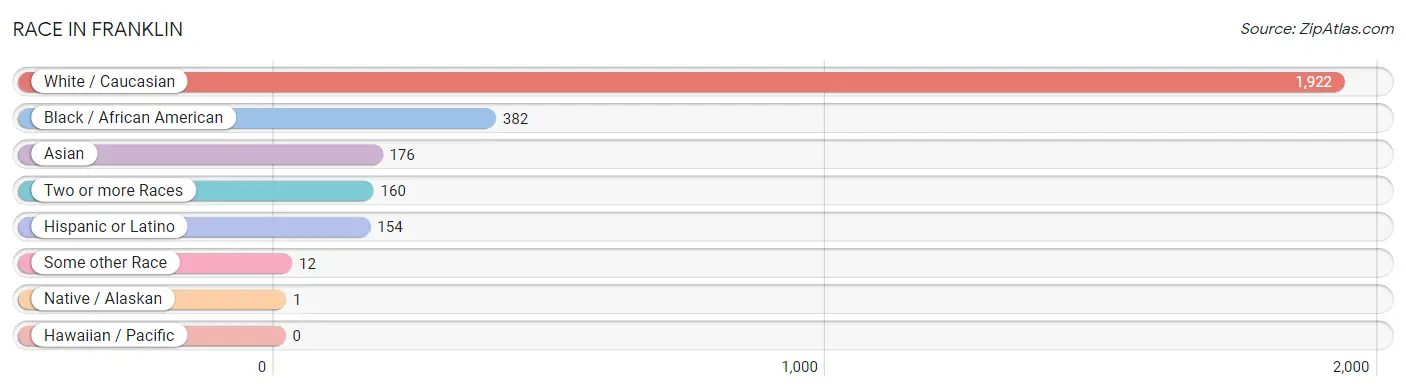
| Race | # Population | % Population |
| Asian | 176 | 6.6% |
| Black / African American | 382 | 14.4% |
| Hawaiian / Pacific | 0 | 0.0% |
| Hispanic or Latino | 154 | 5.8% |
| Native / Alaskan | 1 | 0.0% |
| White / Caucasian | 1,922 | 72.5% |
| Two or more Races | 160 | 6.0% |
| Some other Race | 12 | 0.4% |
| Total | 2,653 | 100.0% |
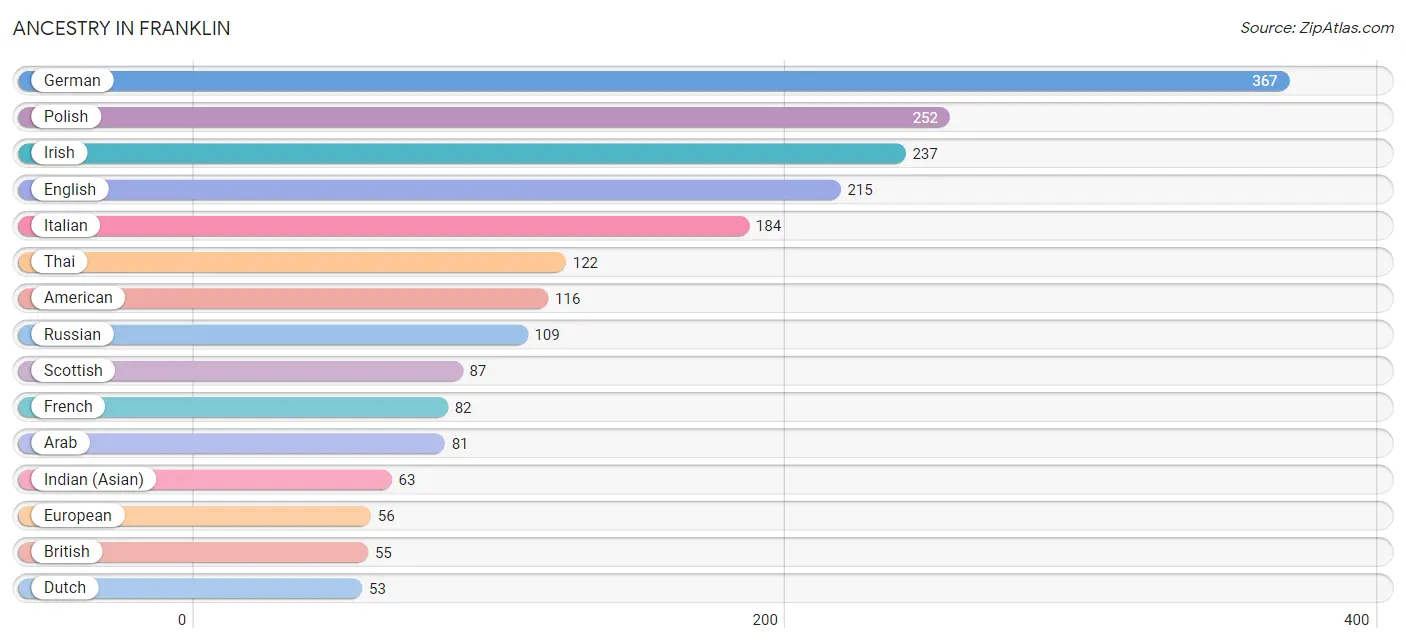
Ancestry in Franklin
The most populous ancestries reported in Franklin are German (367 | 13.8%), Polish (252 | 9.5%), Irish (237 | 8.9%), English (215 | 8.1%), and Italian (184 | 6.9%), together accounting for 47.3% of all Franklin residents.
| Ancestry | # Population | % Population |
| African | 19 | 0.7% |
| Albanian | 4 | 0.2% |
| American | 116 | 4.4% |
| Arab | 81 | 3.0% |
| Austrian | 4 | 0.2% |
| Belgian | 8 | 0.3% |
| British | 55 | 2.1% |
| Burmese | 12 | 0.4% |
| Canadian | 19 | 0.7% |
| Central American | 21 | 0.8% |
| Colombian | 5 | 0.2% |
| Croatian | 17 | 0.6% |
| Cuban | 45 | 1.7% |
| Czech | 17 | 0.6% |
| Czechoslovakian | 10 | 0.4% |
| Danish | 9 | 0.3% |
| Dutch | 53 | 2.0% |
| Eastern European | 30 | 1.1% |
| English | 215 | 8.1% |
| European | 56 | 2.1% |
| Finnish | 26 | 1.0% |
| French | 82 | 3.1% |
| French Canadian | 18 | 0.7% |
| German | 367 | 13.8% |
| Greek | 11 | 0.4% |
| Hungarian | 18 | 0.7% |
| Icelander | 5 | 0.2% |
| Indian (Asian) | 63 | 2.4% |
| Irish | 237 | 8.9% |
| Iroquois | 1 | 0.0% |
| Italian | 184 | 6.9% |
| Jamaican | 5 | 0.2% |
| Korean | 24 | 0.9% |
| Latvian | 4 | 0.2% |
| Lebanese | 51 | 1.9% |
| Lithuanian | 23 | 0.9% |
| Macedonian | 4 | 0.2% |
| Mexican | 30 | 1.1% |
| Nicaraguan | 12 | 0.4% |
| Nigerian | 27 | 1.0% |
| Northern European | 6 | 0.2% |
| Norwegian | 28 | 1.1% |
| Pakistani | 14 | 0.5% |
| Polish | 252 | 9.5% |
| Puerto Rican | 36 | 1.4% |
| Romanian | 4 | 0.2% |
| Russian | 109 | 4.1% |
| Salvadoran | 9 | 0.3% |
| Scotch-Irish | 8 | 0.3% |
| Scottish | 87 | 3.3% |
| Slovak | 7 | 0.3% |
| South African | 7 | 0.3% |
| South American | 5 | 0.2% |
| Spaniard | 16 | 0.6% |
| Spanish | 1 | 0.0% |
| Sri Lankan | 8 | 0.3% |
| Subsaharan African | 53 | 2.0% |
| Swedish | 14 | 0.5% |
| Swiss | 4 | 0.2% |
| Syrian | 5 | 0.2% |
| Thai | 122 | 4.6% |
| Ukrainian | 21 | 0.8% |
| Welsh | 24 | 0.9% | View All 63 Rows |
Immigrants in Franklin
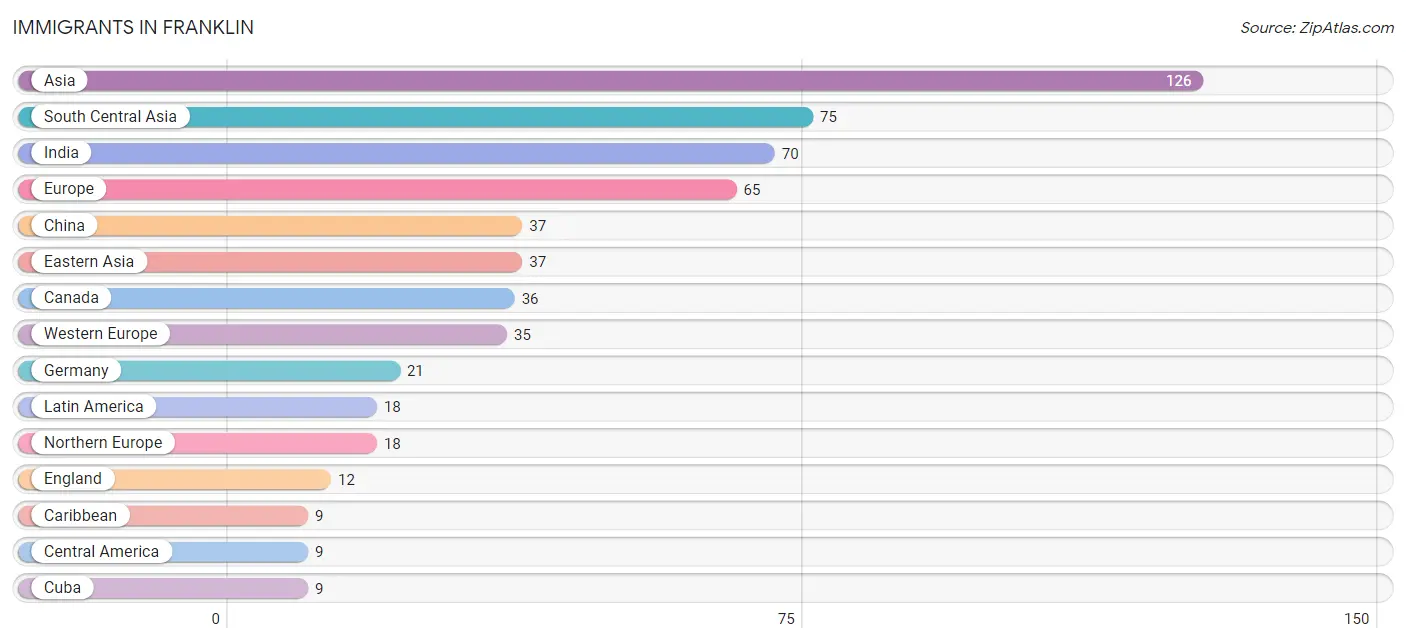
The most numerous immigrant groups reported in Franklin came from Asia (126 | 4.8%), South Central Asia (75 | 2.8%), India (70 | 2.6%), Europe (65 | 2.5%), and China (37 | 1.4%), together accounting for 14.1% of all Franklin residents.
| Immigration Origin | # Population | % Population |
| Asia | 126 | 4.8% |
| Canada | 36 | 1.4% |
| Caribbean | 9 | 0.3% |
| Central America | 9 | 0.3% |
| China | 37 | 1.4% |
| Cuba | 9 | 0.3% |
| Czechoslovakia | 5 | 0.2% |
| Eastern Asia | 37 | 1.4% |
| Eastern Europe | 9 | 0.3% |
| El Salvador | 4 | 0.2% |
| England | 12 | 0.4% |
| Europe | 65 | 2.5% |
| France | 8 | 0.3% |
| Germany | 21 | 0.8% |
| India | 70 | 2.6% |
| Iraq | 4 | 0.2% |
| Italy | 3 | 0.1% |
| Latin America | 18 | 0.7% |
| Lebanon | 5 | 0.2% |
| Mexico | 5 | 0.2% |
| Netherlands | 6 | 0.2% |
| Northern Europe | 18 | 0.7% |
| South Central Asia | 75 | 2.8% |
| South Eastern Asia | 5 | 0.2% |
| Southern Europe | 3 | 0.1% |
| Taiwan | 8 | 0.3% |
| Thailand | 4 | 0.2% |
| Uzbekistan | 5 | 0.2% |
| Vietnam | 1 | 0.0% |
| Western Asia | 9 | 0.3% |
| Western Europe | 35 | 1.3% | View All 31 Rows |
Sex and Age in Franklin
Sex and Age in Franklin
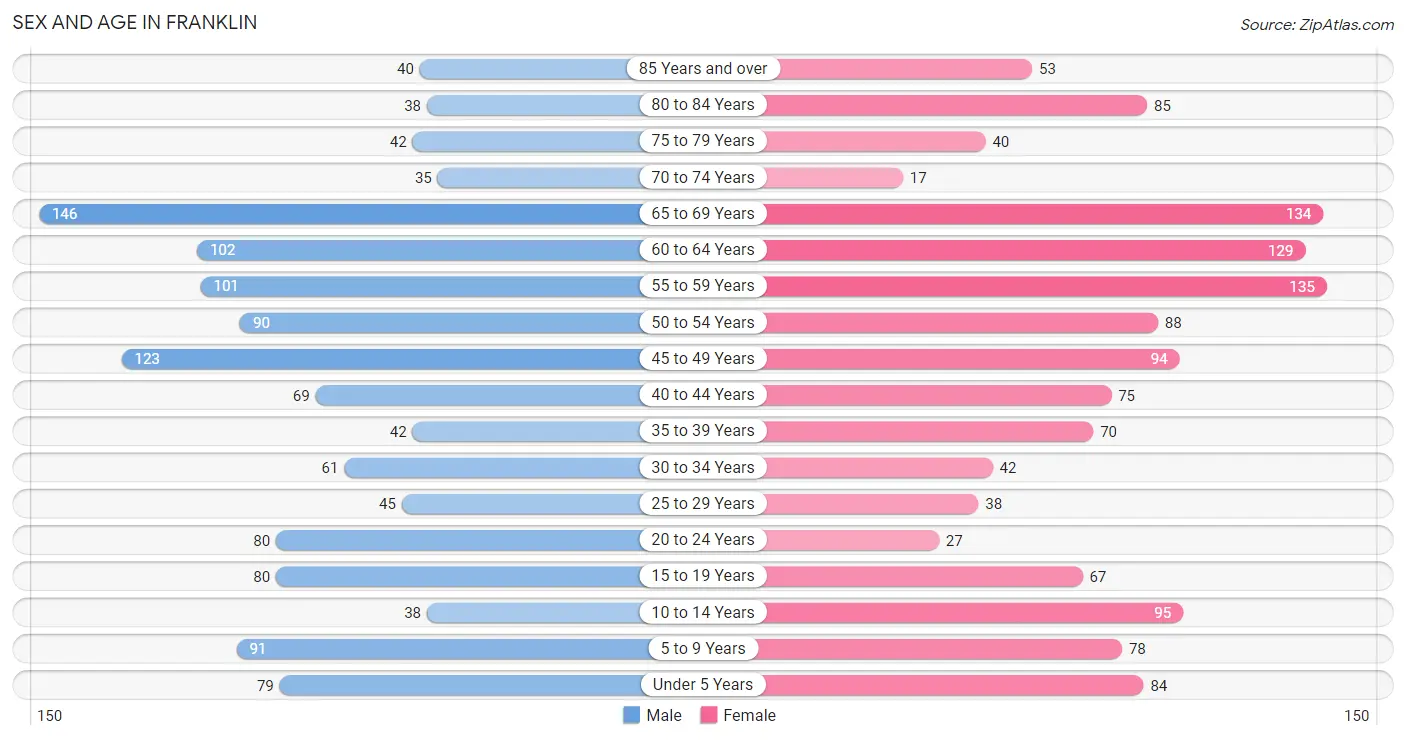
The most populous age groups in Franklin are 65 to 69 Years (146 | 11.2%) for men and 55 to 59 Years (135 | 10.0%) for women.
| Age Bracket | Male | Female |
| Under 5 Years | 79 (6.1%) | 84 (6.2%) |
| 5 to 9 Years | 91 (7.0%) | 78 (5.8%) |
| 10 to 14 Years | 38 (2.9%) | 95 (7.0%) |
| 15 to 19 Years | 80 (6.1%) | 67 (5.0%) |
| 20 to 24 Years | 80 (6.1%) | 27 (2.0%) |
| 25 to 29 Years | 45 (3.5%) | 38 (2.8%) |
| 30 to 34 Years | 61 (4.7%) | 42 (3.1%) |
| 35 to 39 Years | 42 (3.2%) | 70 (5.2%) |
| 40 to 44 Years | 69 (5.3%) | 75 (5.6%) |
| 45 to 49 Years | 123 (9.5%) | 94 (7.0%) |
| 50 to 54 Years | 90 (6.9%) | 88 (6.5%) |
| 55 to 59 Years | 101 (7.8%) | 135 (10.0%) |
| 60 to 64 Years | 102 (7.8%) | 129 (9.6%) |
| 65 to 69 Years | 146 (11.2%) | 134 (9.9%) |
| 70 to 74 Years | 35 (2.7%) | 17 (1.3%) |
| 75 to 79 Years | 42 (3.2%) | 40 (3.0%) |
| 80 to 84 Years | 38 (2.9%) | 85 (6.3%) |
| 85 Years and over | 40 (3.1%) | 53 (3.9%) |
| Total | 1,302 (100.0%) | 1,351 (100.0%) |
Families and Households in Franklin
Median Family Size in Franklin
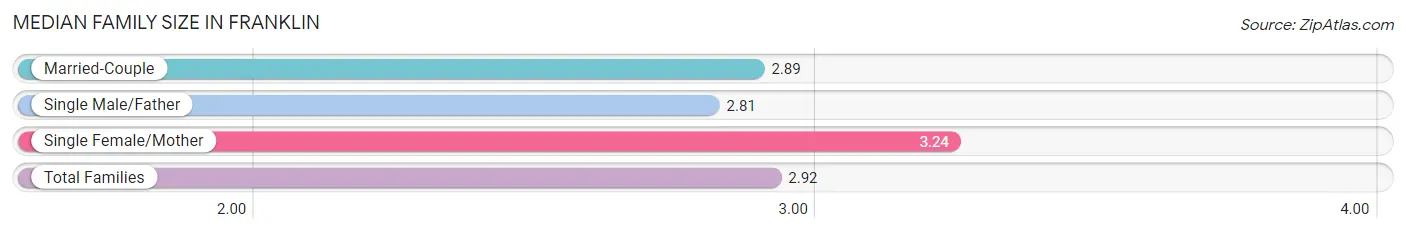
The median family size in Franklin is 2.92 persons per family, with single female/mother families (59 | 7.1%) accounting for the largest median family size of 3.24 persons per family. On the other hand, single male/father families (21 | 2.5%) represent the smallest median family size with 2.81 persons per family.
| Family Type | # Families | Family Size |
| Married-Couple | 745 (90.3%) | 2.89 |
| Single Male/Father | 21 (2.5%) | 2.81 |
| Single Female/Mother | 59 (7.1%) | 3.24 |
| Total Families | 825 (100.0%) | 2.92 |
Median Household Size in Franklin
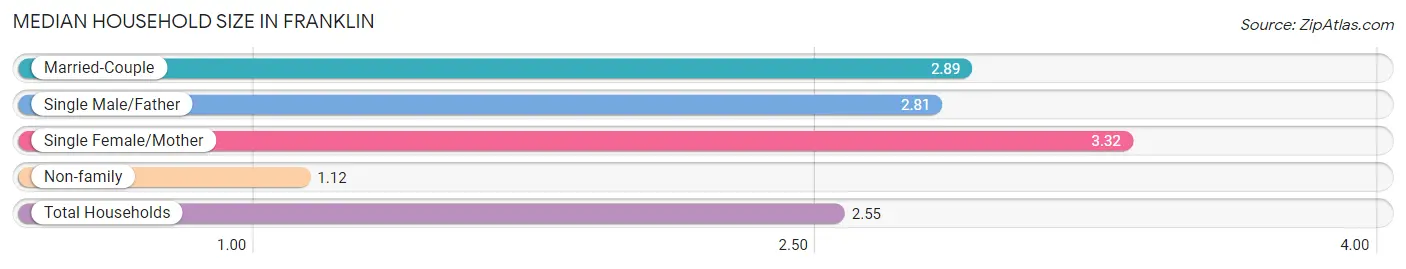
The median household size in Franklin is 2.55 persons per household, with single female/mother households (59 | 5.7%) accounting for the largest median household size of 3.32 persons per household. non-family households (217 | 20.8%) represent the smallest median household size with 1.12 persons per household.
| Household Type | # Households | Household Size |
| Married-Couple | 745 (71.5%) | 2.89 |
| Single Male/Father | 21 (2.0%) | 2.81 |
| Single Female/Mother | 59 (5.7%) | 3.32 |
| Non-family | 217 (20.8%) | 1.12 |
| Total Households | 1,042 (100.0%) | 2.55 |
Household Size by Marriage Status in Franklin
Out of a total of 1,042 households in Franklin, 825 (79.2%) are family households, while 217 (20.8%) are nonfamily households. The most numerous type of family households are 2-person households, comprising 453, and the most common type of nonfamily households are 1-person households, comprising 196.
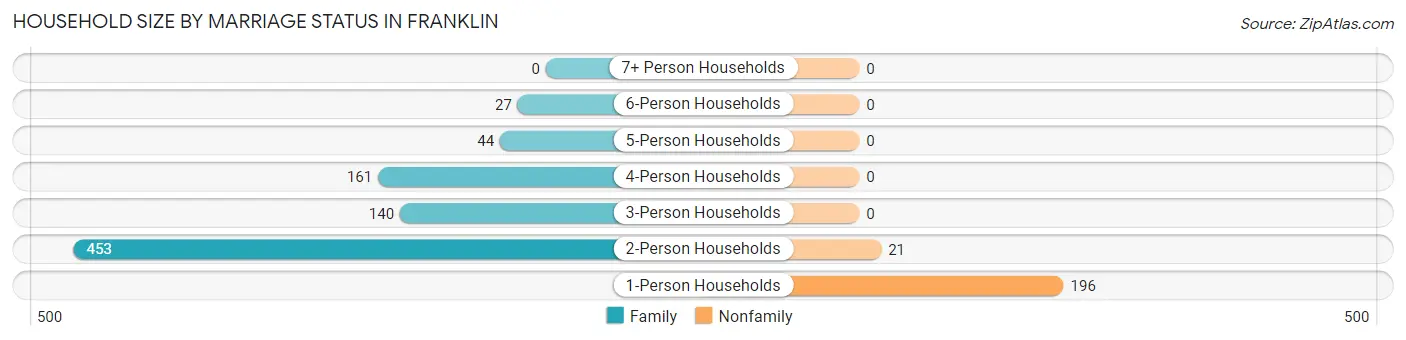
| Household Size | Family Households | Nonfamily Households |
| 1-Person Households | - | 196 (18.8%) |
| 2-Person Households | 453 (43.5%) | 21 (2.0%) |
| 3-Person Households | 140 (13.4%) | 0 (0.0%) |
| 4-Person Households | 161 (15.4%) | 0 (0.0%) |
| 5-Person Households | 44 (4.2%) | 0 (0.0%) |
| 6-Person Households | 27 (2.6%) | 0 (0.0%) |
| 7+ Person Households | 0 (0.0%) | 0 (0.0%) |
| Total | 825 (79.2%) | 217 (20.8%) |
Female Fertility in Franklin
Fertility by Age in Franklin
Average fertility rate in Franklin is 56.0 births per 1,000 women. Women in the age bracket of 20 to 34 years have the highest fertility rate with 131.0 births per 1,000 women. Women in the age bracket of 20 to 34 years acount for 58.3% of all women with births.
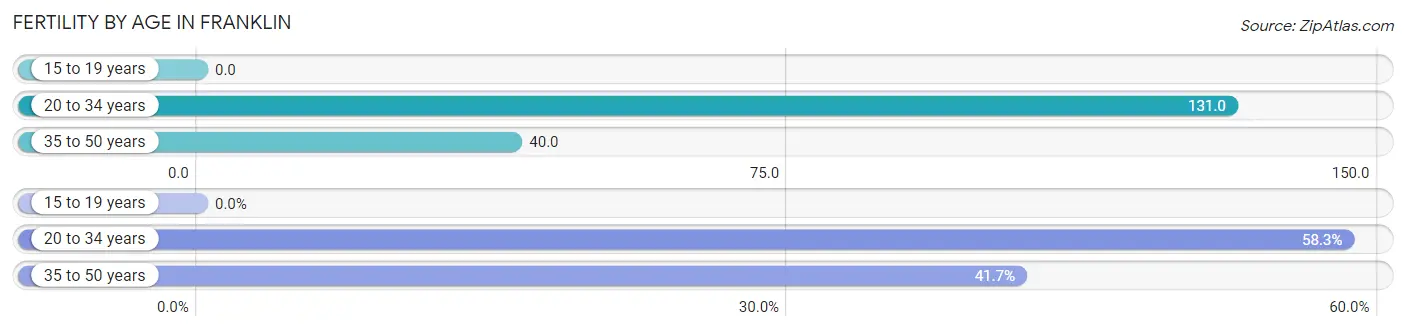
| Age Bracket | Women with Births | Births / 1,000 Women |
| 15 to 19 years | 0 (0.0%) | 0.0 |
| 20 to 34 years | 14 (58.3%) | 131.0 |
| 35 to 50 years | 10 (41.7%) | 40.0 |
| Total | 24 (100.0%) | 56.0 |
Fertility by Age by Marriage Status in Franklin
83.3% of women with births (24) in Franklin are married. The highest percentage of unmarried women with births falls into 35 to 50 years age bracket with 40.0% of them unmarried at the time of birth, while the lowest percentage of unmarried women with births belong to 20 to 34 years age bracket with 0.0% of them unmarried.
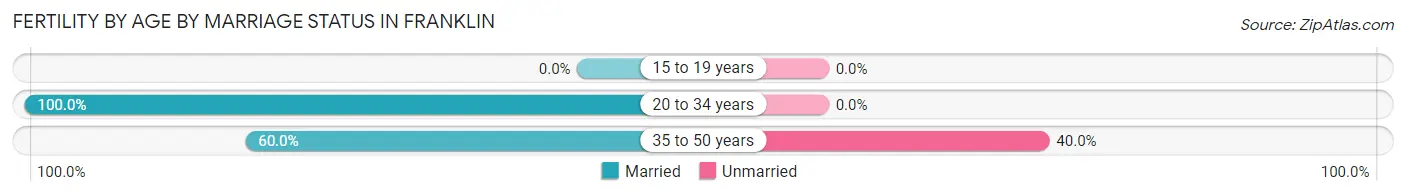
| Age Bracket | Married | Unmarried |
| 15 to 19 years | 0 (0.0%) | 0 (0.0%) |
| 20 to 34 years | 14 (100.0%) | 0 (0.0%) |
| 35 to 50 years | 6 (60.0%) | 4 (40.0%) |
| Total | 20 (83.3%) | 4 (16.7%) |
Fertility by Education in Franklin
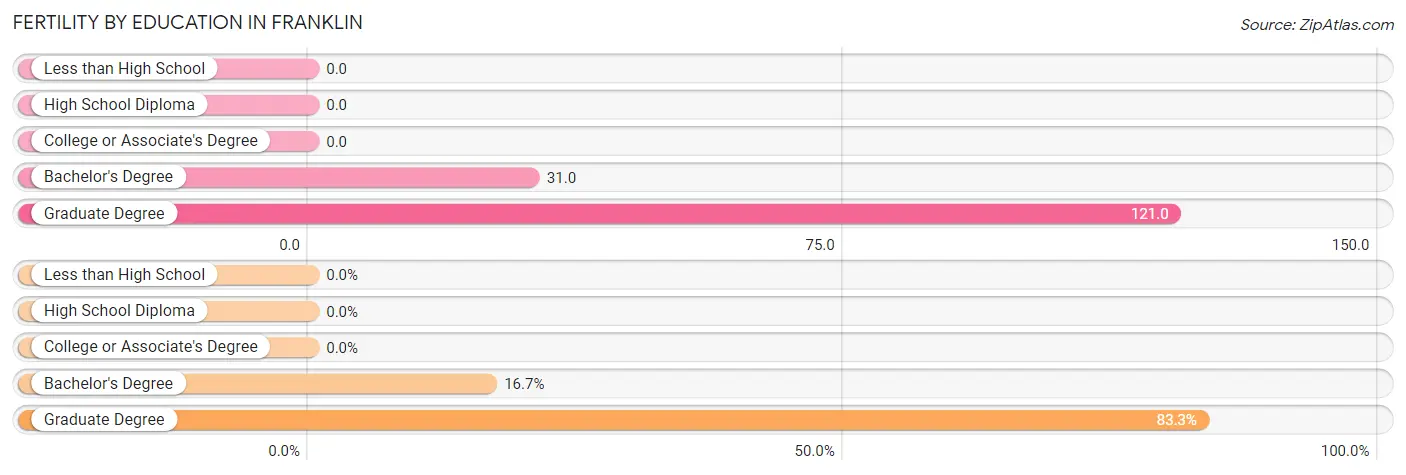
| Educational Attainment | Women with Births | Births / 1,000 Women |
| Less than High School | 0 (0.0%) | 0.0 |
| High School Diploma | 0 (0.0%) | 0.0 |
| College or Associate's Degree | 0 (0.0%) | 0.0 |
| Bachelor's Degree | 4 (16.7%) | 31.0 |
| Graduate Degree | 20 (83.3%) | 121.0 |
| Total | 24 (100.0%) | 56.0 |
Fertility by Education by Marriage Status in Franklin
16.7% of women with births in Franklin are unmarried. Women with the educational attainment of bachelor's degree are most likely to be married with 100.0% of them married at childbirth, while women with the educational attainment of graduate degree are least likely to be married with 20.0% of them unmarried at childbirth.
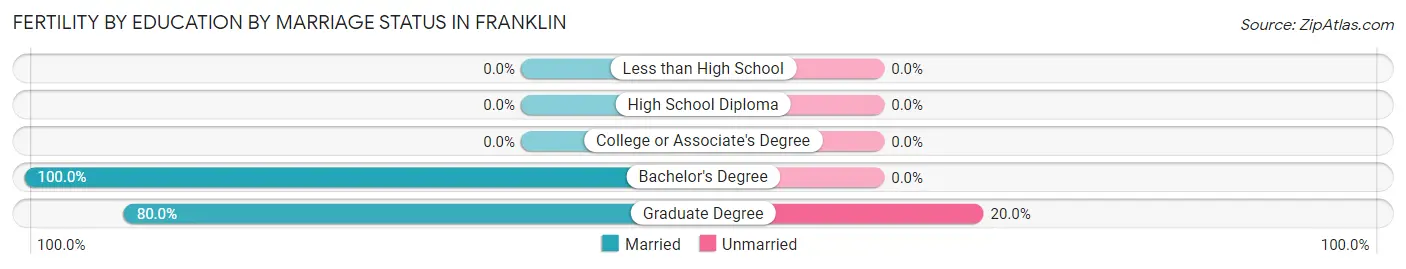
| Educational Attainment | Married | Unmarried |
| Less than High School | 0 (0.0%) | 0 (0.0%) |
| High School Diploma | 0 (0.0%) | 0 (0.0%) |
| College or Associate's Degree | 0 (0.0%) | 0 (0.0%) |
| Bachelor's Degree | 4 (100.0%) | 0 (0.0%) |
| Graduate Degree | 16 (80.0%) | 4 (20.0%) |
| Total | 20 (83.3%) | 4 (16.7%) |
Employment Characteristics in Franklin
Employment by Class of Employer in Franklin
Among the 1,351 employed individuals in Franklin, private company employees (794 | 58.8%), self-employed (incorporated) (199 | 14.7%), and self-employed (not incorporated) (152 | 11.3%) make up the most common classes of employment.
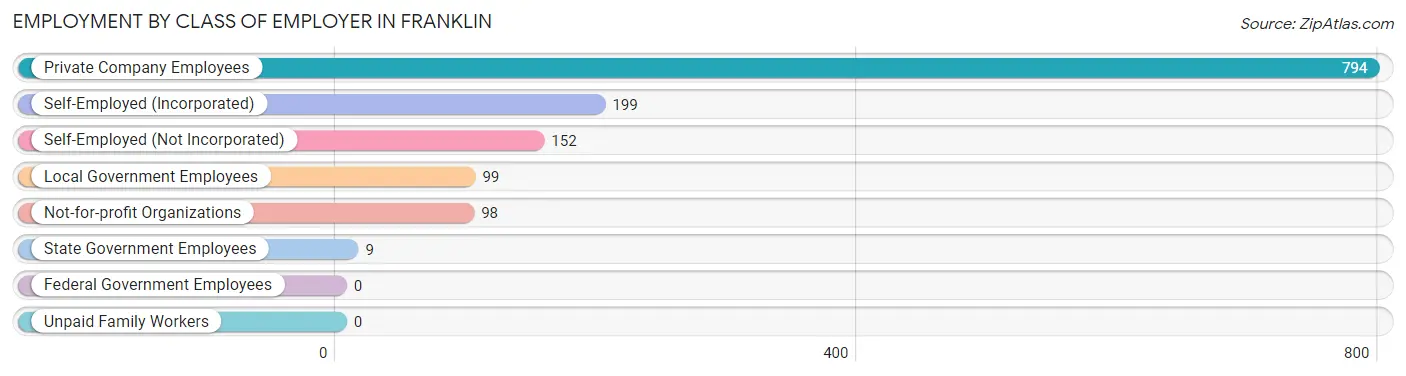
| Employer Class | # Employees | % Employees |
| Private Company Employees | 794 | 58.8% |
| Self-Employed (Incorporated) | 199 | 14.7% |
| Self-Employed (Not Incorporated) | 152 | 11.3% |
| Not-for-profit Organizations | 98 | 7.2% |
| Local Government Employees | 99 | 7.3% |
| State Government Employees | 9 | 0.7% |
| Federal Government Employees | 0 | 0.0% |
| Unpaid Family Workers | 0 | 0.0% |
| Total | 1,351 | 100.0% |
Employment Status by Age in Franklin
According to the labor force statistics for Franklin, out of the total population over 16 years of age (2,161), 64.0% or 1,383 individuals are in the labor force, with 2.0% or 28 of them unemployed. The age group with the highest labor force participation rate is 30 to 34 years, with 94.2% or 97 individuals in the labor force. Within the labor force, the 16 to 19 years age range has the highest percentage of unemployed individuals, with 9.6% or 5 of them being unemployed.
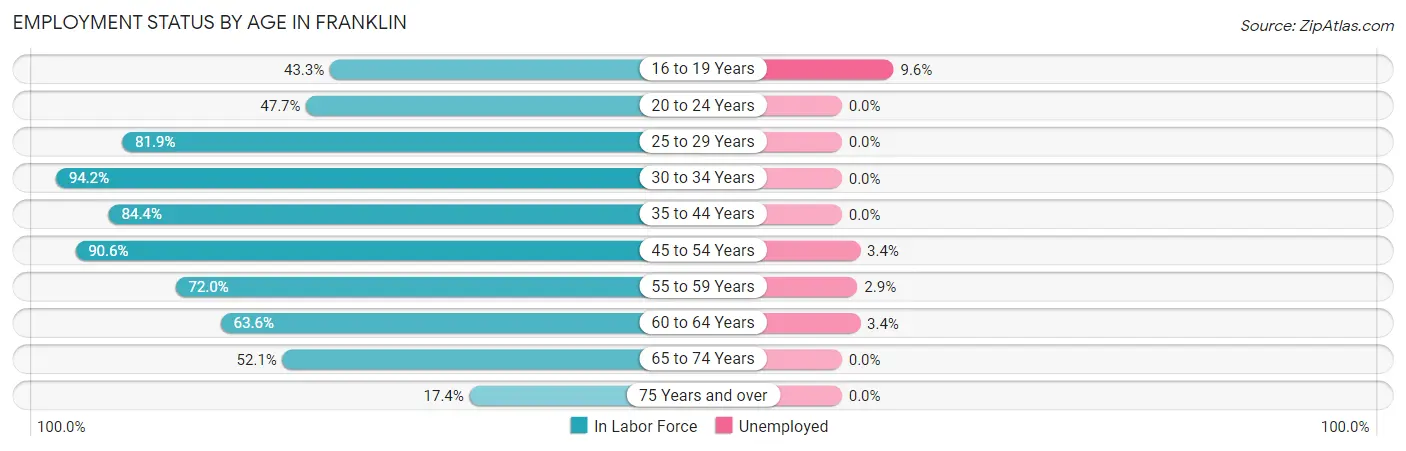
| Age Bracket | In Labor Force | Unemployed |
| 16 to 19 Years | 52 (43.3%) | 5 (9.6%) |
| 20 to 24 Years | 51 (47.7%) | 0 (0.0%) |
| 25 to 29 Years | 68 (81.9%) | 0 (0.0%) |
| 30 to 34 Years | 97 (94.2%) | 0 (0.0%) |
| 35 to 44 Years | 216 (84.4%) | 0 (0.0%) |
| 45 to 54 Years | 358 (90.6%) | 12 (3.4%) |
| 55 to 59 Years | 170 (72.0%) | 5 (2.9%) |
| 60 to 64 Years | 147 (63.6%) | 5 (3.4%) |
| 65 to 74 Years | 173 (52.1%) | 0 (0.0%) |
| 75 Years and over | 52 (17.4%) | 0 (0.0%) |
| Total | 1,383 (64.0%) | 28 (2.0%) |
Employment Status by Educational Attainment in Franklin
According to labor force statistics for Franklin, 81.0% of individuals (1,056) out of the total population between 25 and 64 years of age (1,304) are in the labor force, with 2.1% or 22 of them being unemployed. The group with the highest labor force participation rate are those with the educational attainment of high school diploma, with 100.0% or 50 individuals in the labor force. Within the labor force, individuals with high school diploma education have the highest percentage of unemployment, with 10.0% or 5 of them being unemployed.
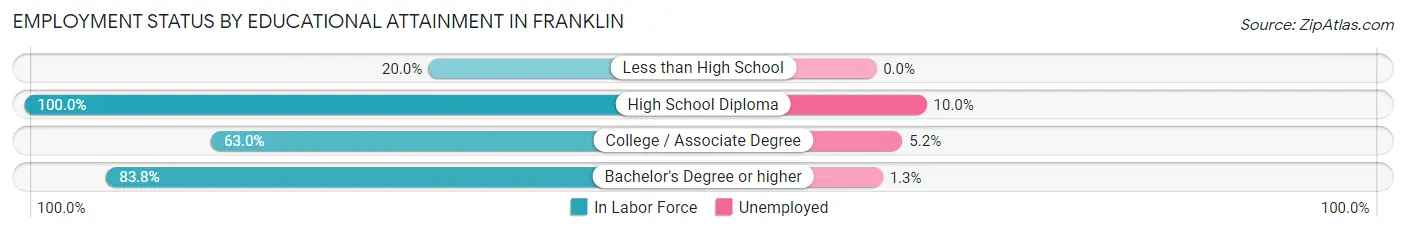
| Educational Attainment | In Labor Force | Unemployed |
| Less than High School | 4 (20.0%) | 0 (0.0%) |
| High School Diploma | 50 (100.0%) | 5 (10.0%) |
| College / Associate Degree | 97 (63.0%) | 8 (5.2%) |
| Bachelor's Degree or higher | 905 (83.8%) | 14 (1.3%) |
| Total | 1,056 (81.0%) | 27 (2.1%) |
Employment Occupations by Sex in Franklin
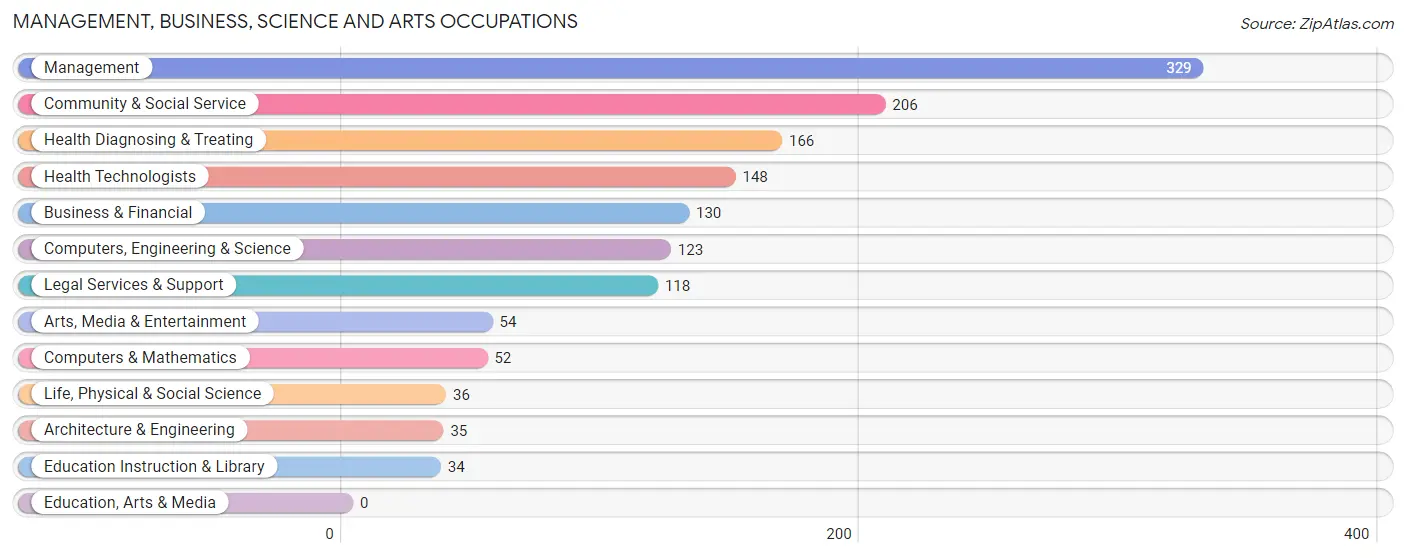
Management, Business, Science and Arts Occupations
The most common Management, Business, Science and Arts occupations in Franklin are Management (329 | 24.2%), Community & Social Service (206 | 15.2%), Health Diagnosing & Treating (166 | 12.2%), Health Technologists (148 | 10.9%), and Business & Financial (130 | 9.6%).
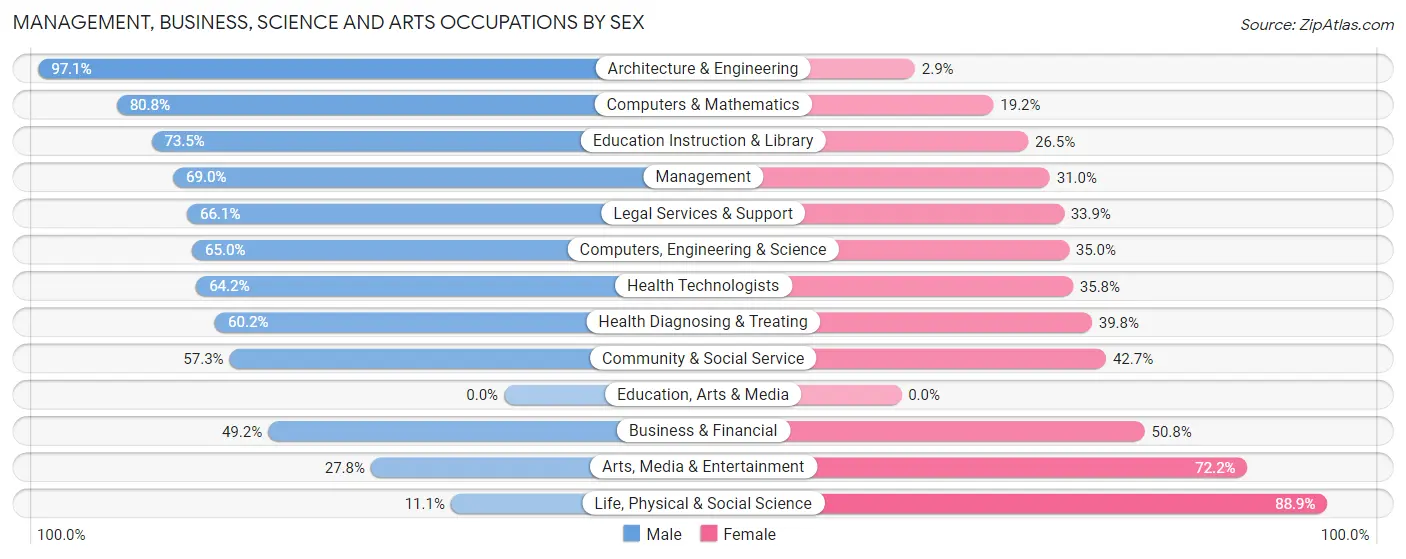
Management, Business, Science and Arts Occupations by Sex
Within the Management, Business, Science and Arts occupations in Franklin, the most male-oriented occupations are Architecture & Engineering (97.1%), Computers & Mathematics (80.8%), and Education Instruction & Library (73.5%), while the most female-oriented occupations are Life, Physical & Social Science (88.9%), Arts, Media & Entertainment (72.2%), and Business & Financial (50.8%).
| Occupation | Male | Female |
| Management | 227 (69.0%) | 102 (31.0%) |
| Business & Financial | 64 (49.2%) | 66 (50.8%) |
| Computers, Engineering & Science | 80 (65.0%) | 43 (35.0%) |
| Computers & Mathematics | 42 (80.8%) | 10 (19.2%) |
| Architecture & Engineering | 34 (97.1%) | 1 (2.9%) |
| Life, Physical & Social Science | 4 (11.1%) | 32 (88.9%) |
| Community & Social Service | 118 (57.3%) | 88 (42.7%) |
| Education, Arts & Media | 0 (0.0%) | 0 (0.0%) |
| Legal Services & Support | 78 (66.1%) | 40 (33.9%) |
| Education Instruction & Library | 25 (73.5%) | 9 (26.5%) |
| Arts, Media & Entertainment | 15 (27.8%) | 39 (72.2%) |
| Health Diagnosing & Treating | 100 (60.2%) | 66 (39.8%) |
| Health Technologists | 95 (64.2%) | 53 (35.8%) |
| Total (Category) | 589 (61.7%) | 365 (38.3%) |
| Total (Overall) | 818 (60.3%) | 539 (39.7%) |
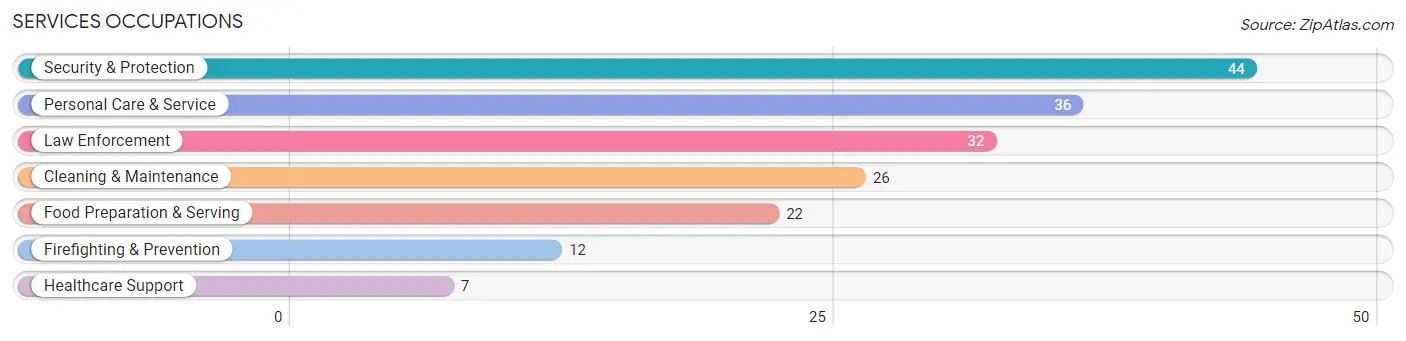
Services Occupations
The most common Services occupations in Franklin are Security & Protection (44 | 3.2%), Personal Care & Service (36 | 2.6%), Law Enforcement (32 | 2.4%), Cleaning & Maintenance (26 | 1.9%), and Food Preparation & Serving (22 | 1.6%).
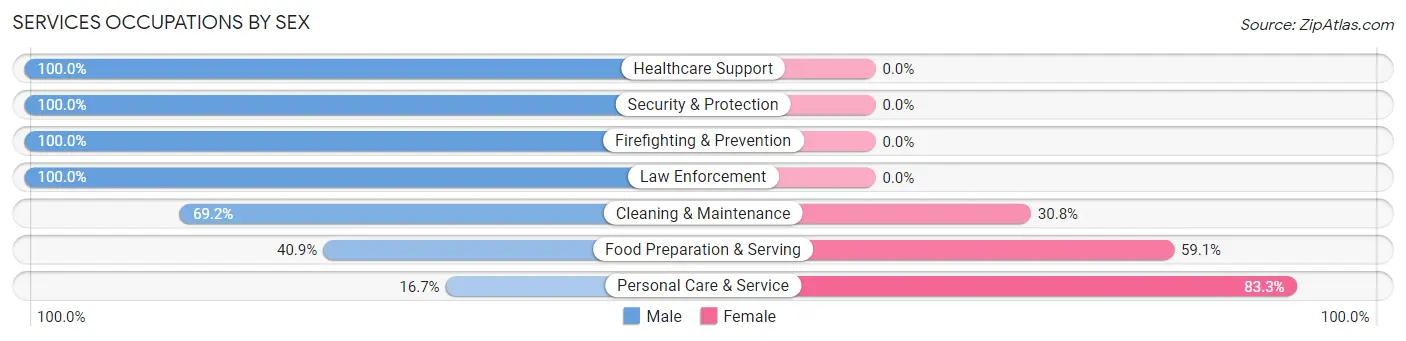
Services Occupations by Sex
Within the Services occupations in Franklin, the most male-oriented occupations are Healthcare Support (100.0%), Security & Protection (100.0%), and Firefighting & Prevention (100.0%), while the most female-oriented occupations are Personal Care & Service (83.3%), Food Preparation & Serving (59.1%), and Cleaning & Maintenance (30.8%).
| Occupation | Male | Female |
| Healthcare Support | 7 (100.0%) | 0 (0.0%) |
| Security & Protection | 44 (100.0%) | 0 (0.0%) |
| Firefighting & Prevention | 12 (100.0%) | 0 (0.0%) |
| Law Enforcement | 32 (100.0%) | 0 (0.0%) |
| Food Preparation & Serving | 9 (40.9%) | 13 (59.1%) |
| Cleaning & Maintenance | 18 (69.2%) | 8 (30.8%) |
| Personal Care & Service | 6 (16.7%) | 30 (83.3%) |
| Total (Category) | 84 (62.2%) | 51 (37.8%) |
| Total (Overall) | 818 (60.3%) | 539 (39.7%) |
Sales and Office Occupations
The most common Sales and Office occupations in Franklin are Sales & Related (149 | 11.0%), and Office & Administration (77 | 5.7%).
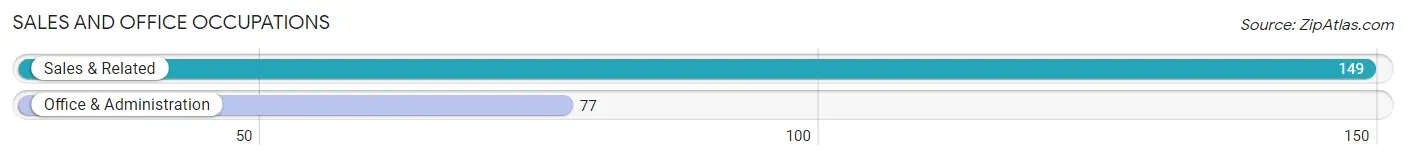
Sales and Office Occupations by Sex
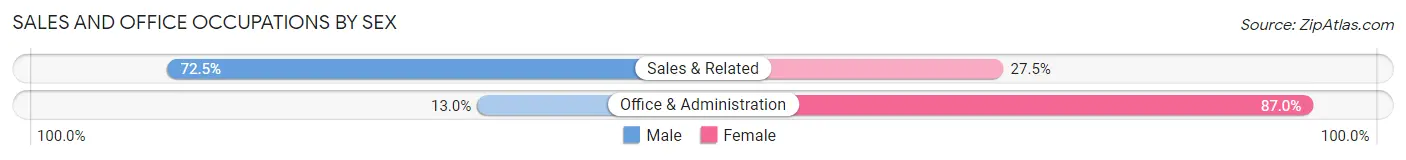
| Occupation | Male | Female |
| Sales & Related | 108 (72.5%) | 41 (27.5%) |
| Office & Administration | 10 (13.0%) | 67 (87.0%) |
| Total (Category) | 118 (52.2%) | 108 (47.8%) |
| Total (Overall) | 818 (60.3%) | 539 (39.7%) |
Natural Resources, Construction and Maintenance Occupations
The most common Natural Resources, Construction and Maintenance occupations in Franklin are , and Construction & Extraction (4 | 0.3%).
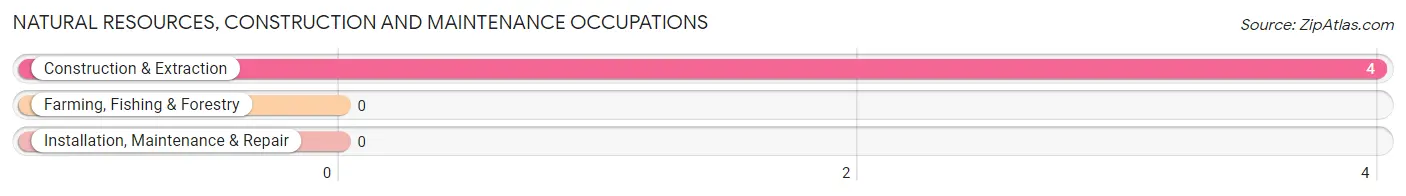
Natural Resources, Construction and Maintenance Occupations by Sex
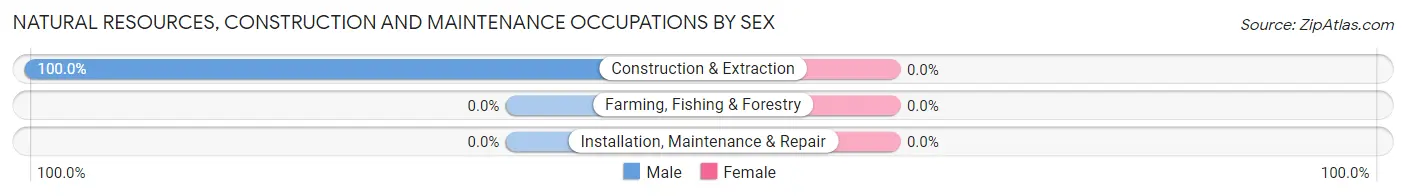
| Occupation | Male | Female |
| Farming, Fishing & Forestry | 0 (0.0%) | 0 (0.0%) |
| Construction & Extraction | 4 (100.0%) | 0 (0.0%) |
| Installation, Maintenance & Repair | 0 (0.0%) | 0 (0.0%) |
| Total (Category) | 4 (100.0%) | 0 (0.0%) |
| Total (Overall) | 818 (60.3%) | 539 (39.7%) |
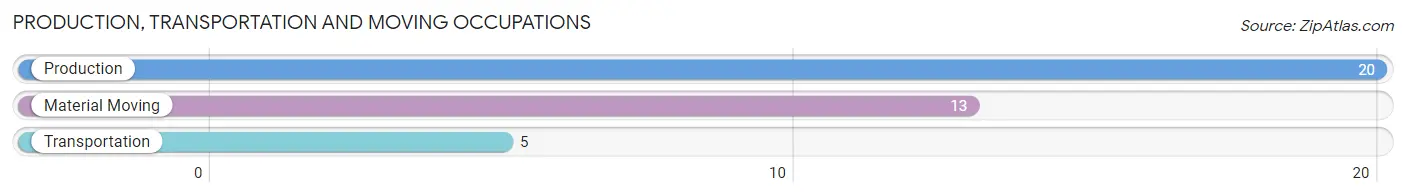
Production, Transportation and Moving Occupations
The most common Production, Transportation and Moving occupations in Franklin are Production (20 | 1.5%), Material Moving (13 | 1.0%), and Transportation (5 | 0.4%).
Production, Transportation and Moving Occupations by Sex
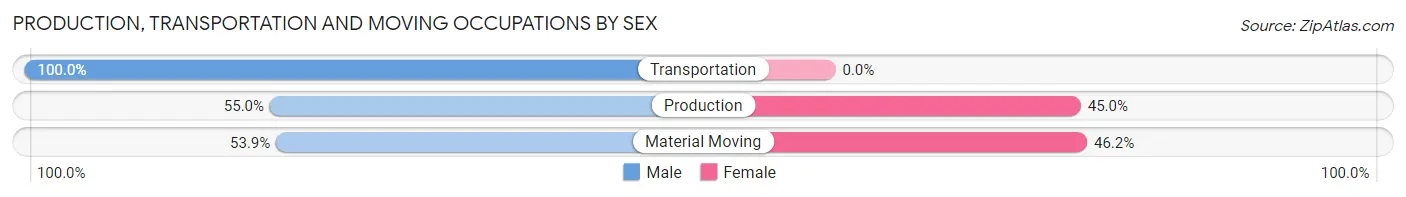
| Occupation | Male | Female |
| Production | 11 (55.0%) | 9 (45.0%) |
| Transportation | 5 (100.0%) | 0 (0.0%) |
| Material Moving | 7 (53.8%) | 6 (46.2%) |
| Total (Category) | 23 (60.5%) | 15 (39.5%) |
| Total (Overall) | 818 (60.3%) | 539 (39.7%) |
Employment Industries by Sex in Franklin
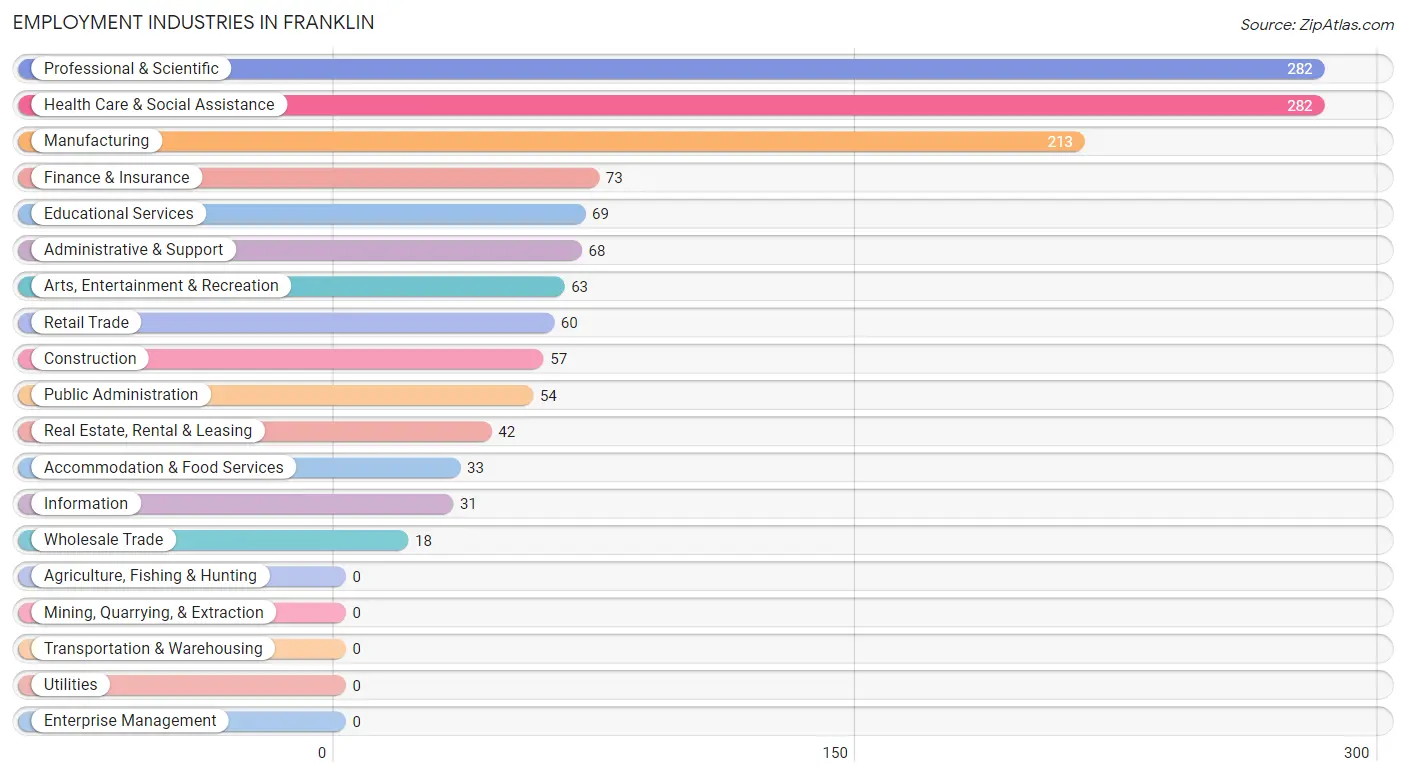
Employment Industries in Franklin
The major employment industries in Franklin include Professional & Scientific (282 | 20.8%), Health Care & Social Assistance (282 | 20.8%), Manufacturing (213 | 15.7%), Finance & Insurance (73 | 5.4%), and Educational Services (69 | 5.1%).
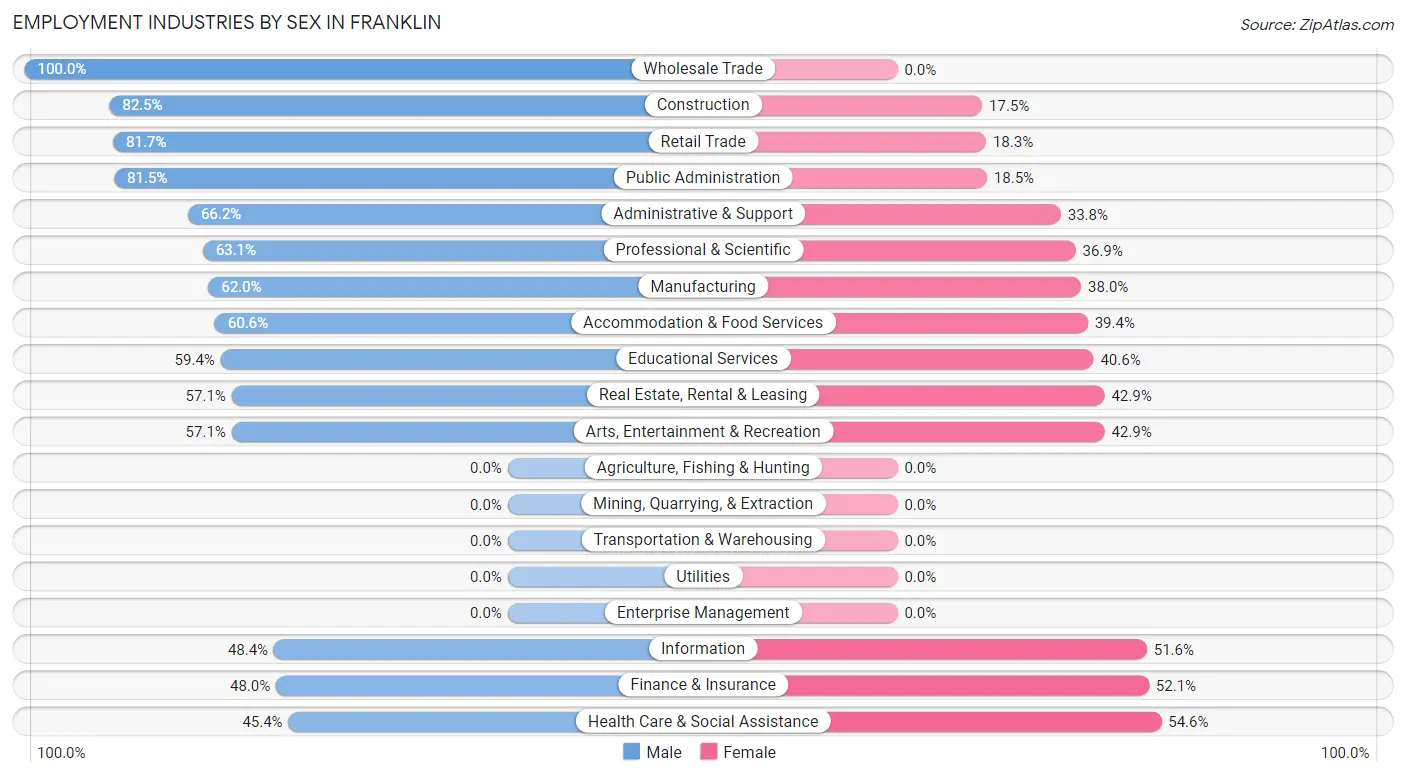
Employment Industries by Sex in Franklin
The Franklin industries that see more men than women are Wholesale Trade (100.0%), Construction (82.5%), and Retail Trade (81.7%), whereas the industries that tend to have a higher number of women are Health Care & Social Assistance (54.6%), Finance & Insurance (52.0%), and Information (51.6%).
| Industry | Male | Female |
| Agriculture, Fishing & Hunting | 0 (0.0%) | 0 (0.0%) |
| Mining, Quarrying, & Extraction | 0 (0.0%) | 0 (0.0%) |
| Construction | 47 (82.5%) | 10 (17.5%) |
| Manufacturing | 132 (62.0%) | 81 (38.0%) |
| Wholesale Trade | 18 (100.0%) | 0 (0.0%) |
| Retail Trade | 49 (81.7%) | 11 (18.3%) |
| Transportation & Warehousing | 0 (0.0%) | 0 (0.0%) |
| Utilities | 0 (0.0%) | 0 (0.0%) |
| Information | 15 (48.4%) | 16 (51.6%) |
| Finance & Insurance | 35 (47.9%) | 38 (52.0%) |
| Real Estate, Rental & Leasing | 24 (57.1%) | 18 (42.9%) |
| Professional & Scientific | 178 (63.1%) | 104 (36.9%) |
| Enterprise Management | 0 (0.0%) | 0 (0.0%) |
| Administrative & Support | 45 (66.2%) | 23 (33.8%) |
| Educational Services | 41 (59.4%) | 28 (40.6%) |
| Health Care & Social Assistance | 128 (45.4%) | 154 (54.6%) |
| Arts, Entertainment & Recreation | 36 (57.1%) | 27 (42.9%) |
| Accommodation & Food Services | 20 (60.6%) | 13 (39.4%) |
| Public Administration | 44 (81.5%) | 10 (18.5%) |
| Total | 818 (60.3%) | 539 (39.7%) |
Education in Franklin
School Enrollment in Franklin
The most common levels of schooling among the 569 students in Franklin are middle school (110 | 19.3%), elementary school (104 | 18.3%), and high school (103 | 18.1%).
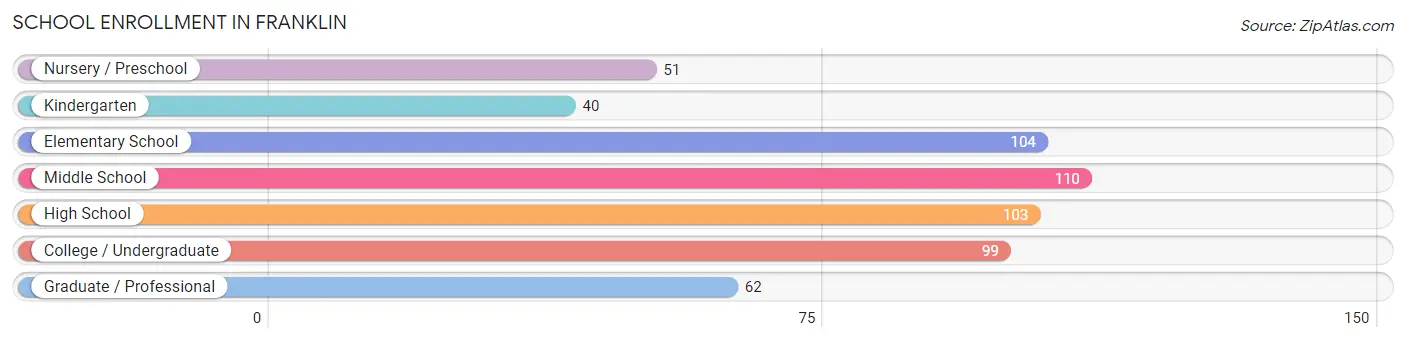
| School Level | # Students | % Students |
| Nursery / Preschool | 51 | 9.0% |
| Kindergarten | 40 | 7.0% |
| Elementary School | 104 | 18.3% |
| Middle School | 110 | 19.3% |
| High School | 103 | 18.1% |
| College / Undergraduate | 99 | 17.4% |
| Graduate / Professional | 62 | 10.9% |
| Total | 569 | 100.0% |
School Enrollment by Age by Funding Source in Franklin
Out of a total of 569 students who are enrolled in schools in Franklin, 192 (33.7%) attend a private institution, while the remaining 377 (66.3%) are enrolled in public schools. The age group of 3 to 4 year olds has the highest likelihood of being enrolled in private schools, with 38 (100.0% in the age bracket) enrolled. Conversely, the age group of 18 to 19 year olds has the lowest likelihood of being enrolled in a private school, with 52 (100.0% in the age bracket) attending a public institution.
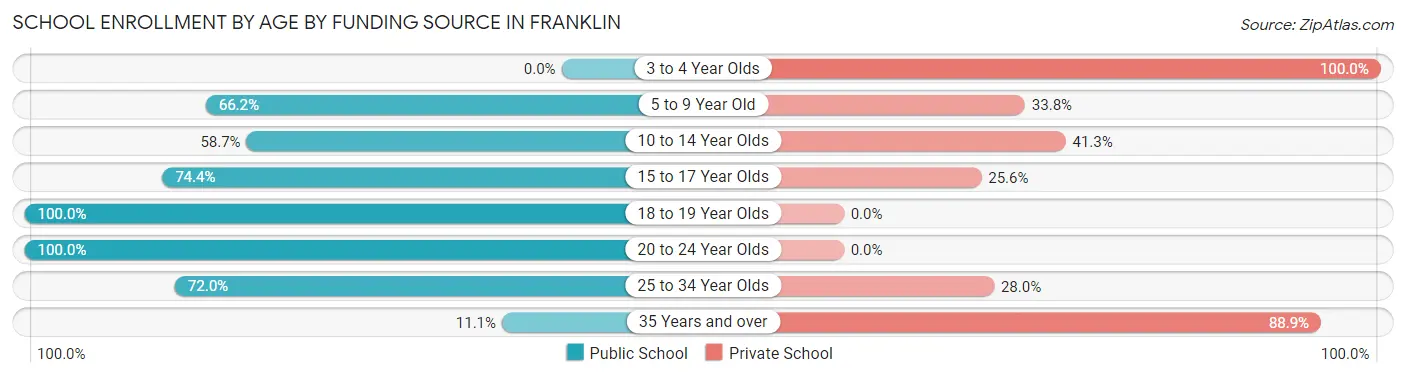
| Age Bracket | Public School | Private School |
| 3 to 4 Year Olds | 0 (0.0%) | 38 (100.0%) |
| 5 to 9 Year Old | 104 (66.2%) | 53 (33.8%) |
| 10 to 14 Year Olds | 71 (58.7%) | 50 (41.3%) |
| 15 to 17 Year Olds | 58 (74.4%) | 20 (25.6%) |
| 18 to 19 Year Olds | 52 (100.0%) | 0 (0.0%) |
| 20 to 24 Year Olds | 71 (100.0%) | 0 (0.0%) |
| 25 to 34 Year Olds | 18 (72.0%) | 7 (28.0%) |
| 35 Years and over | 3 (11.1%) | 24 (88.9%) |
| Total | 377 (66.3%) | 192 (33.7%) |
Educational Attainment by Field of Study in Franklin
Business (278 | 16.4%), education (206 | 12.2%), engineering (181 | 10.7%), bio, nature & agricultural (157 | 9.3%), and science & technology (127 | 7.5%) are the most common fields of study among 1,693 individuals in Franklin who have obtained a bachelor's degree or higher.
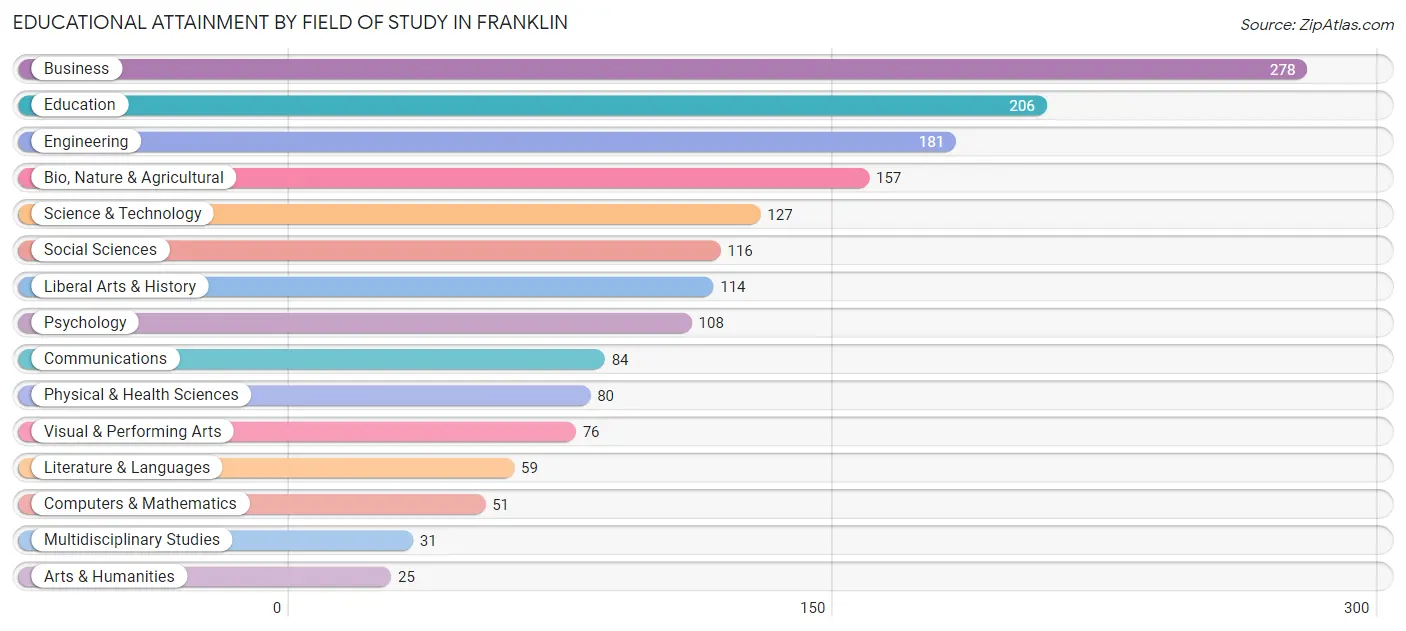
| Field of Study | # Graduates | % Graduates |
| Computers & Mathematics | 51 | 3.0% |
| Bio, Nature & Agricultural | 157 | 9.3% |
| Physical & Health Sciences | 80 | 4.7% |
| Psychology | 108 | 6.4% |
| Social Sciences | 116 | 6.9% |
| Engineering | 181 | 10.7% |
| Multidisciplinary Studies | 31 | 1.8% |
| Science & Technology | 127 | 7.5% |
| Business | 278 | 16.4% |
| Education | 206 | 12.2% |
| Literature & Languages | 59 | 3.5% |
| Liberal Arts & History | 114 | 6.7% |
| Visual & Performing Arts | 76 | 4.5% |
| Communications | 84 | 5.0% |
| Arts & Humanities | 25 | 1.5% |
| Total | 1,693 | 100.0% |
Transportation & Commute in Franklin
Vehicle Availability by Sex in Franklin
The most prevalent vehicle ownership categories in Franklin are males with 2 vehicles (504, accounting for 61.6%) and females with 2 vehicles (296, making up 94.6%).
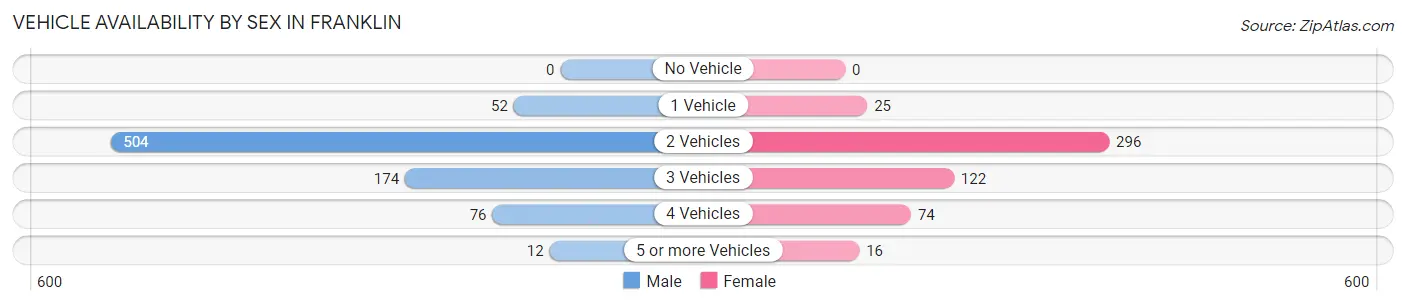
| Vehicles Available | Male | Female |
| No Vehicle | 0 (0.0%) | 0 (0.0%) |
| 1 Vehicle | 52 (6.4%) | 25 (4.7%) |
| 2 Vehicles | 504 (61.6%) | 296 (55.5%) |
| 3 Vehicles | 174 (21.3%) | 122 (22.9%) |
| 4 Vehicles | 76 (9.3%) | 74 (13.9%) |
| 5 or more Vehicles | 12 (1.5%) | 16 (3.0%) |
| Total | 818 (100.0%) | 533 (100.0%) |
Commute Time in Franklin
The most frequently occuring commute durations in Franklin are 15 to 19 minutes (214 commuters, 21.0%), 10 to 14 minutes (163 commuters, 16.0%), and 20 to 24 minutes (156 commuters, 15.3%).
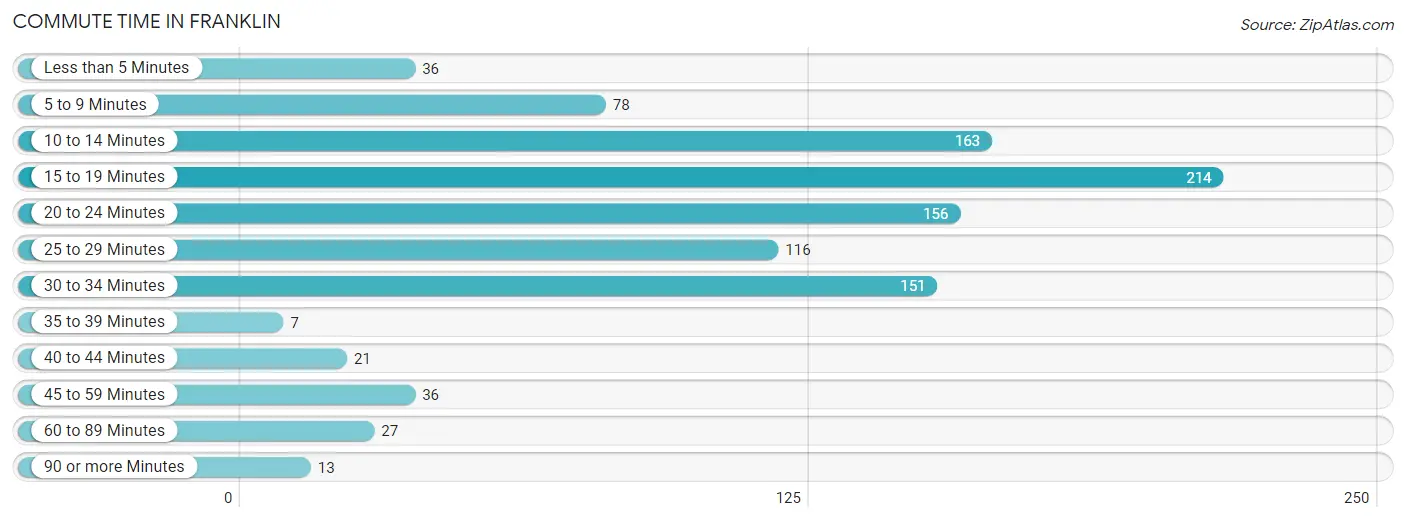
| Commute Time | # Commuters | % Commuters |
| Less than 5 Minutes | 36 | 3.5% |
| 5 to 9 Minutes | 78 | 7.7% |
| 10 to 14 Minutes | 163 | 16.0% |
| 15 to 19 Minutes | 214 | 21.0% |
| 20 to 24 Minutes | 156 | 15.3% |
| 25 to 29 Minutes | 116 | 11.4% |
| 30 to 34 Minutes | 151 | 14.8% |
| 35 to 39 Minutes | 7 | 0.7% |
| 40 to 44 Minutes | 21 | 2.1% |
| 45 to 59 Minutes | 36 | 3.5% |
| 60 to 89 Minutes | 27 | 2.6% |
| 90 or more Minutes | 13 | 1.3% |
Commute Time by Sex in Franklin
The most common commute times in Franklin are 20 to 24 minutes (124 commuters, 20.5%) for males and 15 to 19 minutes (100 commuters, 24.3%) for females.
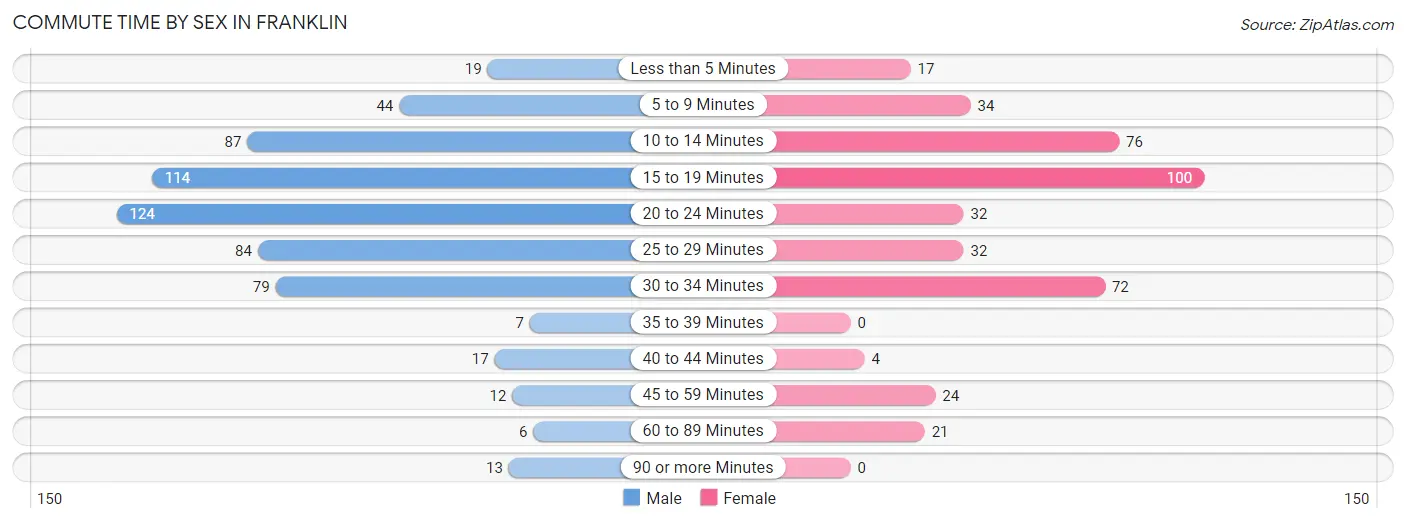
| Commute Time | Male | Female |
| Less than 5 Minutes | 19 (3.1%) | 17 (4.1%) |
| 5 to 9 Minutes | 44 (7.3%) | 34 (8.3%) |
| 10 to 14 Minutes | 87 (14.4%) | 76 (18.4%) |
| 15 to 19 Minutes | 114 (18.8%) | 100 (24.3%) |
| 20 to 24 Minutes | 124 (20.5%) | 32 (7.8%) |
| 25 to 29 Minutes | 84 (13.9%) | 32 (7.8%) |
| 30 to 34 Minutes | 79 (13.0%) | 72 (17.5%) |
| 35 to 39 Minutes | 7 (1.2%) | 0 (0.0%) |
| 40 to 44 Minutes | 17 (2.8%) | 4 (1.0%) |
| 45 to 59 Minutes | 12 (2.0%) | 24 (5.8%) |
| 60 to 89 Minutes | 6 (1.0%) | 21 (5.1%) |
| 90 or more Minutes | 13 (2.1%) | 0 (0.0%) |
Time of Departure to Work by Sex in Franklin
The most frequent times of departure to work in Franklin are 7:30 AM to 7:59 AM (93, 15.3%) for males and 9:00 AM to 9:59 AM (126, 30.6%) for females.
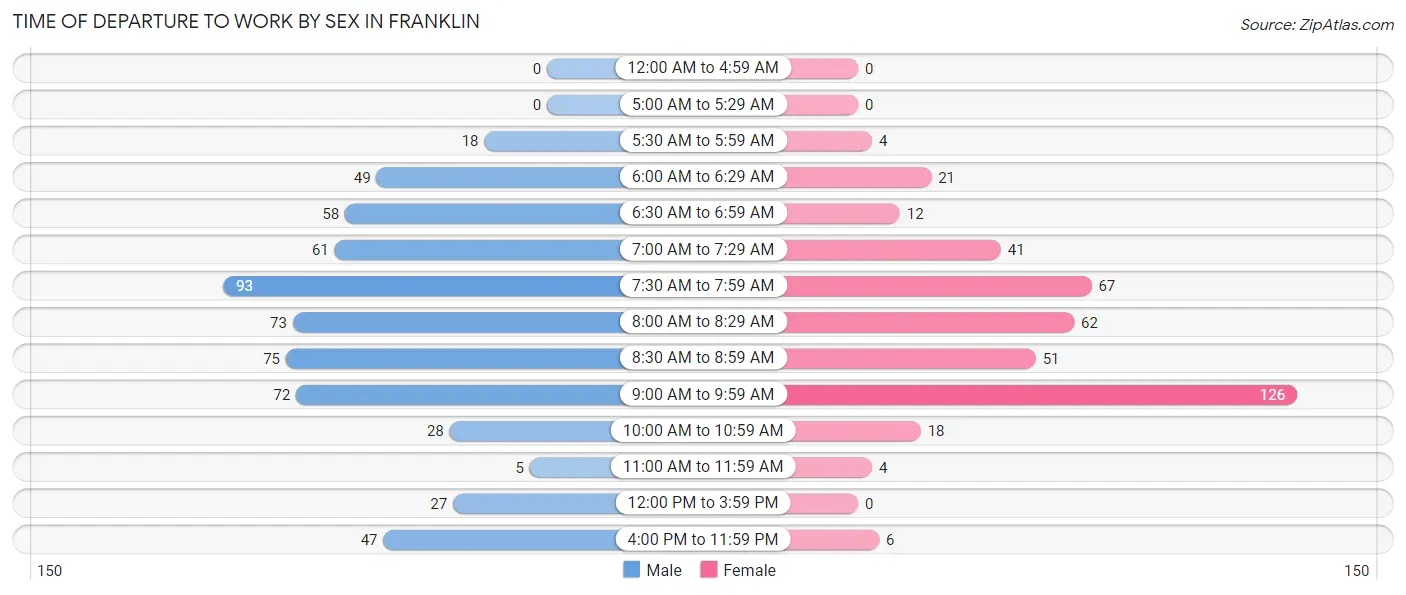
| Time of Departure | Male | Female |
| 12:00 AM to 4:59 AM | 0 (0.0%) | 0 (0.0%) |
| 5:00 AM to 5:29 AM | 0 (0.0%) | 0 (0.0%) |
| 5:30 AM to 5:59 AM | 18 (3.0%) | 4 (1.0%) |
| 6:00 AM to 6:29 AM | 49 (8.1%) | 21 (5.1%) |
| 6:30 AM to 6:59 AM | 58 (9.6%) | 12 (2.9%) |
| 7:00 AM to 7:29 AM | 61 (10.1%) | 41 (10.0%) |
| 7:30 AM to 7:59 AM | 93 (15.3%) | 67 (16.3%) |
| 8:00 AM to 8:29 AM | 73 (12.0%) | 62 (15.0%) |
| 8:30 AM to 8:59 AM | 75 (12.4%) | 51 (12.4%) |
| 9:00 AM to 9:59 AM | 72 (11.9%) | 126 (30.6%) |
| 10:00 AM to 10:59 AM | 28 (4.6%) | 18 (4.4%) |
| 11:00 AM to 11:59 AM | 5 (0.8%) | 4 (1.0%) |
| 12:00 PM to 3:59 PM | 27 (4.5%) | 0 (0.0%) |
| 4:00 PM to 11:59 PM | 47 (7.8%) | 6 (1.5%) |
| Total | 606 (100.0%) | 412 (100.0%) |
Housing Occupancy in Franklin
Occupancy by Ownership in Franklin
Of the total 1,042 dwellings in Franklin, owner-occupied units account for 971 (93.2%), while renter-occupied units make up 71 (6.8%).
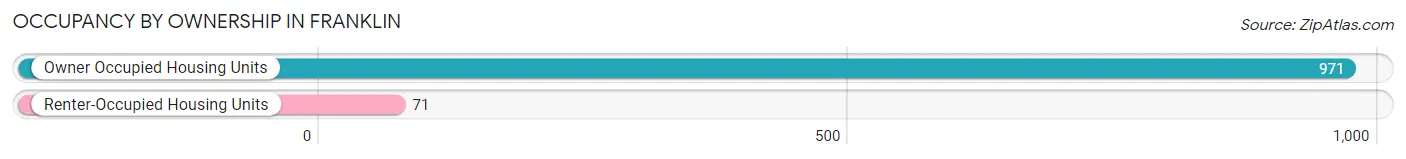
| Occupancy | # Housing Units | % Housing Units |
| Owner Occupied Housing Units | 971 | 93.2% |
| Renter-Occupied Housing Units | 71 | 6.8% |
| Total Occupied Housing Units | 1,042 | 100.0% |
Occupancy by Household Size in Franklin
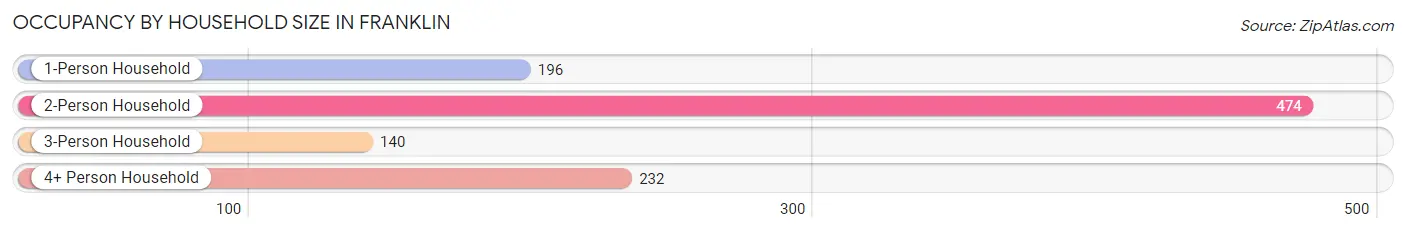
| Household Size | # Housing Units | % Housing Units |
| 1-Person Household | 196 | 18.8% |
| 2-Person Household | 474 | 45.5% |
| 3-Person Household | 140 | 13.4% |
| 4+ Person Household | 232 | 22.3% |
| Total Housing Units | 1,042 | 100.0% |
Occupancy by Ownership by Household Size in Franklin
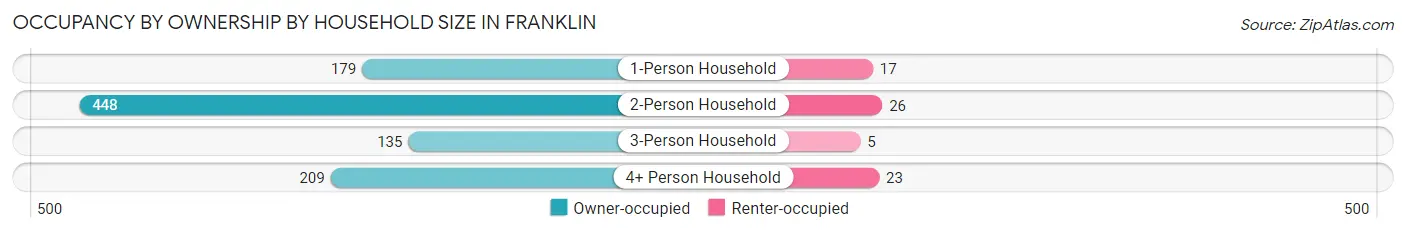
| Household Size | Owner-occupied | Renter-occupied |
| 1-Person Household | 179 (91.3%) | 17 (8.7%) |
| 2-Person Household | 448 (94.5%) | 26 (5.5%) |
| 3-Person Household | 135 (96.4%) | 5 (3.6%) |
| 4+ Person Household | 209 (90.1%) | 23 (9.9%) |
| Total Housing Units | 971 (93.2%) | 71 (6.8%) |
Occupancy by Educational Attainment in Franklin
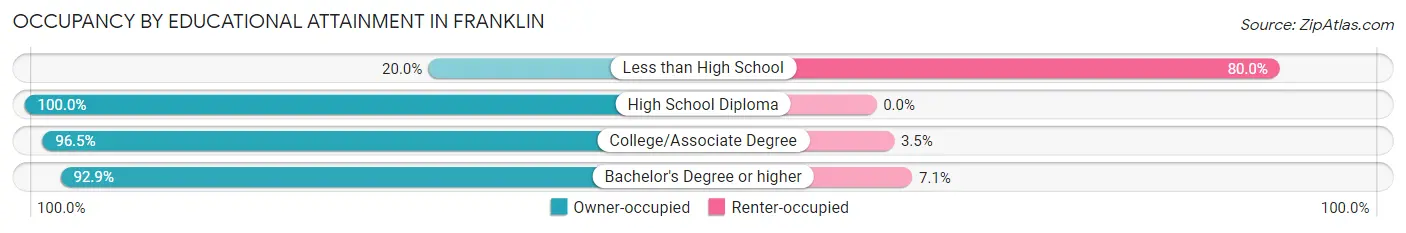
| Household Size | Owner-occupied | Renter-occupied |
| Less than High School | 1 (20.0%) | 4 (80.0%) |
| High School Diploma | 24 (100.0%) | 0 (0.0%) |
| College/Associate Degree | 137 (96.5%) | 5 (3.5%) |
| Bachelor's Degree or higher | 809 (92.9%) | 62 (7.1%) |
Occupancy by Age of Householder in Franklin
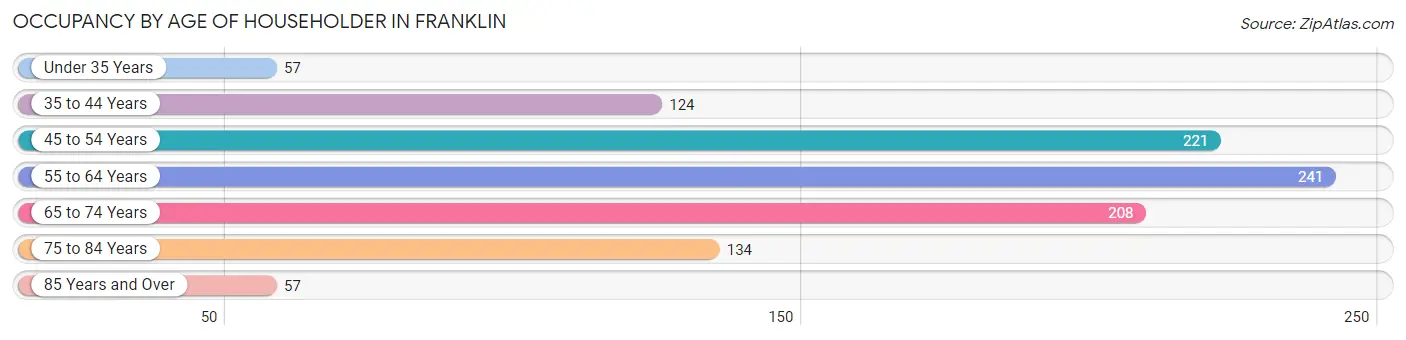
| Age Bracket | # Households | % Households |
| Under 35 Years | 57 | 5.5% |
| 35 to 44 Years | 124 | 11.9% |
| 45 to 54 Years | 221 | 21.2% |
| 55 to 64 Years | 241 | 23.1% |
| 65 to 74 Years | 208 | 20.0% |
| 75 to 84 Years | 134 | 12.9% |
| 85 Years and Over | 57 | 5.5% |
| Total | 1,042 | 100.0% |
Housing Finances in Franklin
Median Income by Occupancy in Franklin
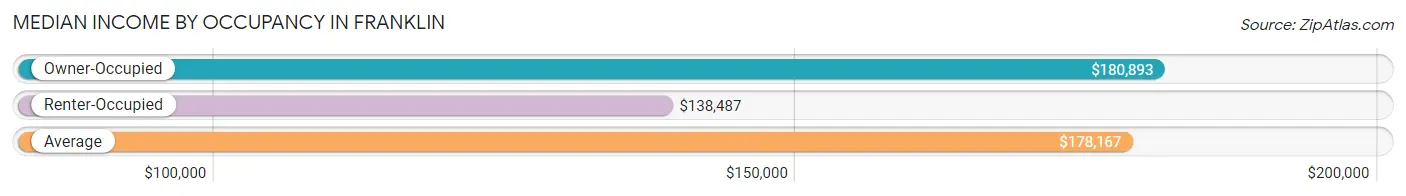
| Occupancy Type | # Households | Median Income |
| Owner-Occupied | 971 (93.2%) | $180,893 |
| Renter-Occupied | 71 (6.8%) | $138,487 |
| Average | 1,042 (100.0%) | $178,167 |
Occupancy by Householder Income Bracket in Franklin
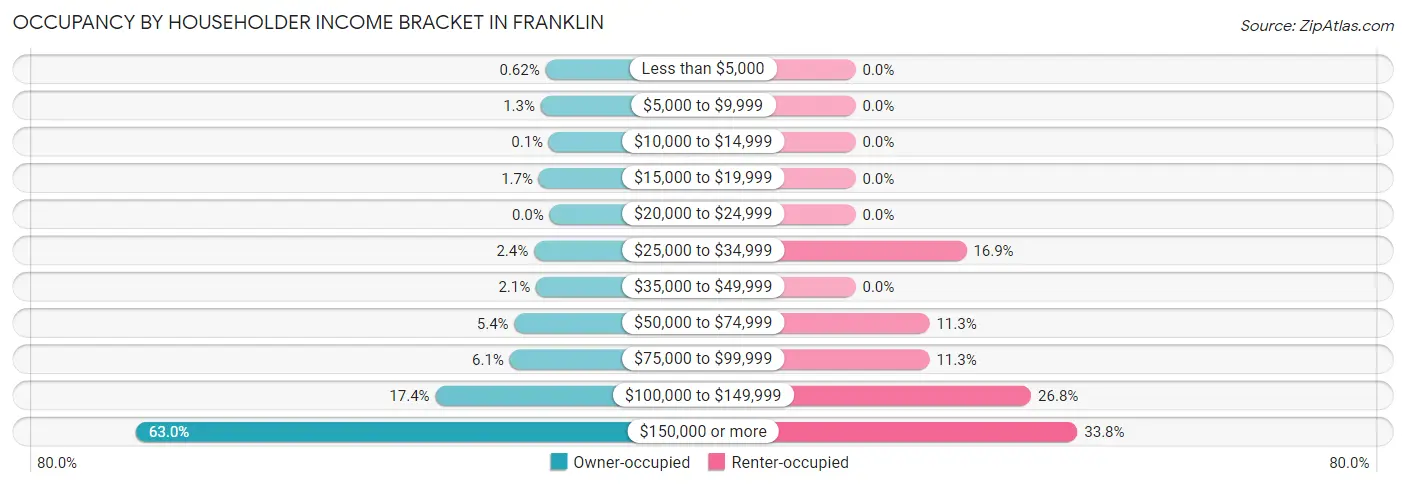
| Income Bracket | Owner-occupied | Renter-occupied |
| Less than $5,000 | 6 (0.6%) | 0 (0.0%) |
| $5,000 to $9,999 | 13 (1.3%) | 0 (0.0%) |
| $10,000 to $14,999 | 1 (0.1%) | 0 (0.0%) |
| $15,000 to $19,999 | 16 (1.7%) | 0 (0.0%) |
| $20,000 to $24,999 | 0 (0.0%) | 0 (0.0%) |
| $25,000 to $34,999 | 23 (2.4%) | 12 (16.9%) |
| $35,000 to $49,999 | 20 (2.1%) | 0 (0.0%) |
| $50,000 to $74,999 | 52 (5.4%) | 8 (11.3%) |
| $75,000 to $99,999 | 59 (6.1%) | 8 (11.3%) |
| $100,000 to $149,999 | 169 (17.4%) | 19 (26.8%) |
| $150,000 or more | 612 (63.0%) | 24 (33.8%) |
| Total | 971 (100.0%) | 71 (100.0%) |
Monthly Housing Cost Tiers in Franklin
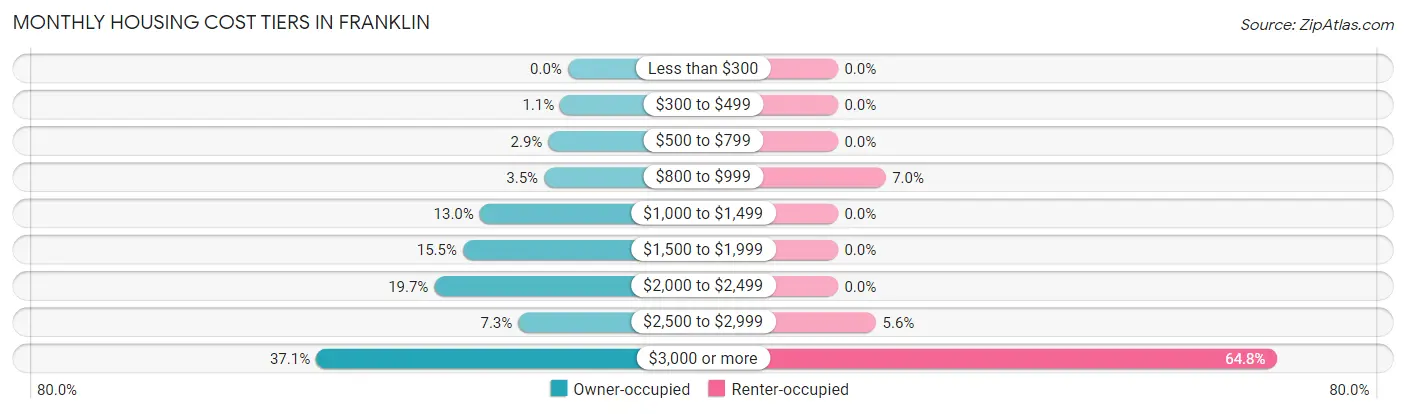
| Monthly Cost | Owner-occupied | Renter-occupied |
| Less than $300 | 0 (0.0%) | 0 (0.0%) |
| $300 to $499 | 11 (1.1%) | 0 (0.0%) |
| $500 to $799 | 28 (2.9%) | 0 (0.0%) |
| $800 to $999 | 34 (3.5%) | 5 (7.0%) |
| $1,000 to $1,499 | 126 (13.0%) | 0 (0.0%) |
| $1,500 to $1,999 | 150 (15.4%) | 0 (0.0%) |
| $2,000 to $2,499 | 191 (19.7%) | 0 (0.0%) |
| $2,500 to $2,999 | 71 (7.3%) | 4 (5.6%) |
| $3,000 or more | 360 (37.1%) | 46 (64.8%) |
| Total | 971 (100.0%) | 71 (100.0%) |
Physical Housing Characteristics in Franklin
Housing Structures in Franklin
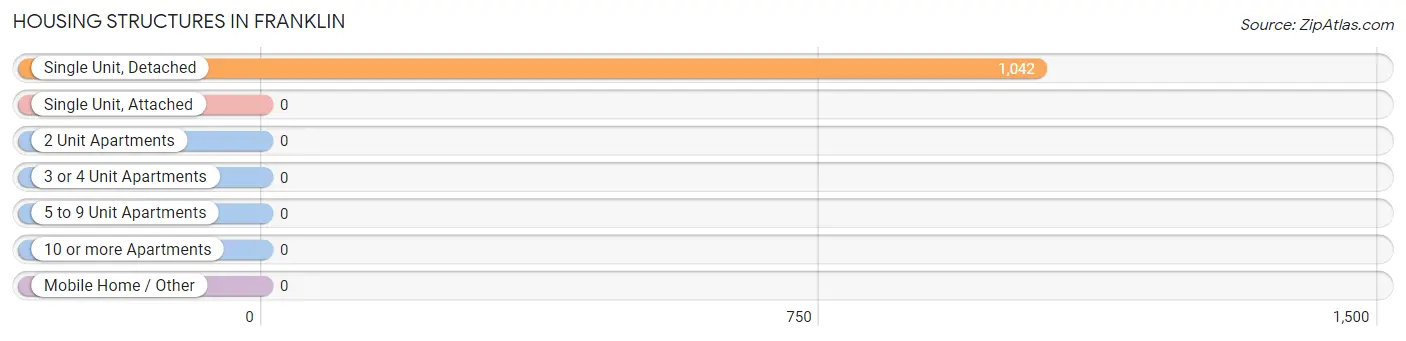
| Structure Type | # Housing Units | % Housing Units |
| Single Unit, Detached | 1,042 | 100.0% |
| Single Unit, Attached | 0 | 0.0% |
| 2 Unit Apartments | 0 | 0.0% |
| 3 or 4 Unit Apartments | 0 | 0.0% |
| 5 to 9 Unit Apartments | 0 | 0.0% |
| 10 or more Apartments | 0 | 0.0% |
| Mobile Home / Other | 0 | 0.0% |
| Total | 1,042 | 100.0% |
Housing Structures by Occupancy in Franklin
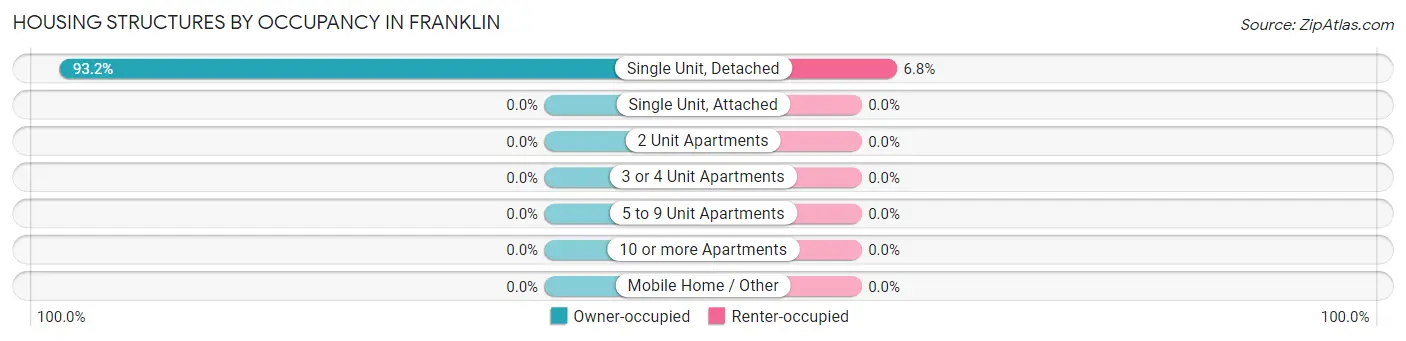
| Structure Type | Owner-occupied | Renter-occupied |
| Single Unit, Detached | 971 (93.2%) | 71 (6.8%) |
| Single Unit, Attached | 0 (0.0%) | 0 (0.0%) |
| 2 Unit Apartments | 0 (0.0%) | 0 (0.0%) |
| 3 or 4 Unit Apartments | 0 (0.0%) | 0 (0.0%) |
| 5 to 9 Unit Apartments | 0 (0.0%) | 0 (0.0%) |
| 10 or more Apartments | 0 (0.0%) | 0 (0.0%) |
| Mobile Home / Other | 0 (0.0%) | 0 (0.0%) |
| Total | 971 (93.2%) | 71 (6.8%) |
Housing Structures by Number of Rooms in Franklin
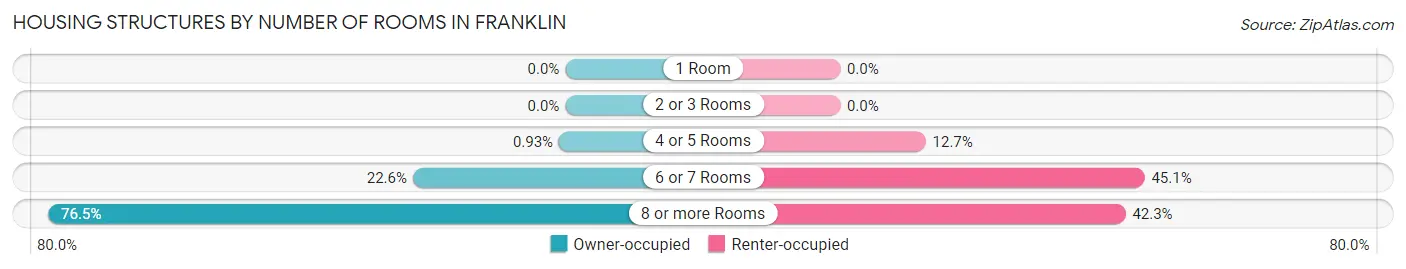
| Number of Rooms | Owner-occupied | Renter-occupied |
| 1 Room | 0 (0.0%) | 0 (0.0%) |
| 2 or 3 Rooms | 0 (0.0%) | 0 (0.0%) |
| 4 or 5 Rooms | 9 (0.9%) | 9 (12.7%) |
| 6 or 7 Rooms | 219 (22.6%) | 32 (45.1%) |
| 8 or more Rooms | 743 (76.5%) | 30 (42.2%) |
| Total | 971 (100.0%) | 71 (100.0%) |
Housing Structure by Heating Type in Franklin
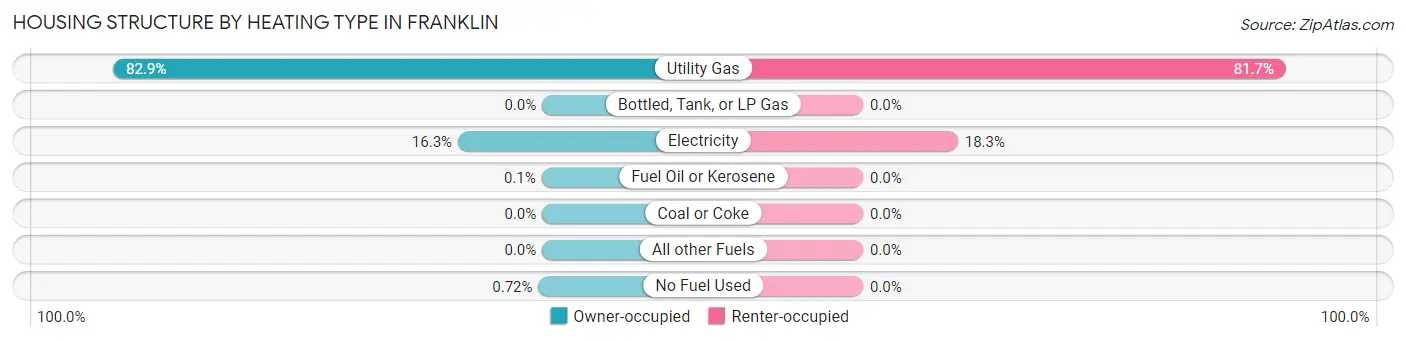
| Heating Type | Owner-occupied | Renter-occupied |
| Utility Gas | 805 (82.9%) | 58 (81.7%) |
| Bottled, Tank, or LP Gas | 0 (0.0%) | 0 (0.0%) |
| Electricity | 158 (16.3%) | 13 (18.3%) |
| Fuel Oil or Kerosene | 1 (0.1%) | 0 (0.0%) |
| Coal or Coke | 0 (0.0%) | 0 (0.0%) |
| All other Fuels | 0 (0.0%) | 0 (0.0%) |
| No Fuel Used | 7 (0.7%) | 0 (0.0%) |
| Total | 971 (100.0%) | 71 (100.0%) |
Household Vehicle Usage in Franklin
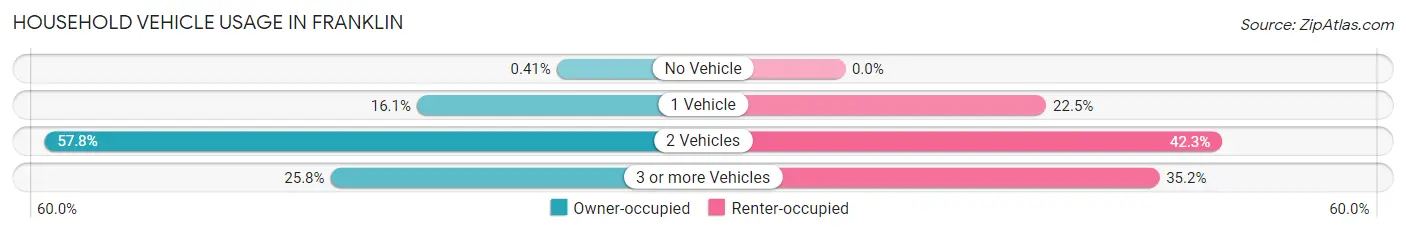
| Vehicles per Household | Owner-occupied | Renter-occupied |
| No Vehicle | 4 (0.4%) | 0 (0.0%) |
| 1 Vehicle | 156 (16.1%) | 16 (22.5%) |
| 2 Vehicles | 561 (57.8%) | 30 (42.2%) |
| 3 or more Vehicles | 250 (25.8%) | 25 (35.2%) |
| Total | 971 (100.0%) | 71 (100.0%) |
Real Estate & Mortgages in Franklin
Real Estate and Mortgage Overview in Franklin
| Characteristic | Without Mortgage | With Mortgage |
| Housing Units | 390 | 581 |
| Median Property Value | $845,800 | $643,600 |
| Median Household Income | $159,500 | $413 |
| Monthly Housing Costs | $1,501 | $313 |
| Real Estate Taxes | $10,001 | $23 |
Property Value by Mortgage Status in Franklin
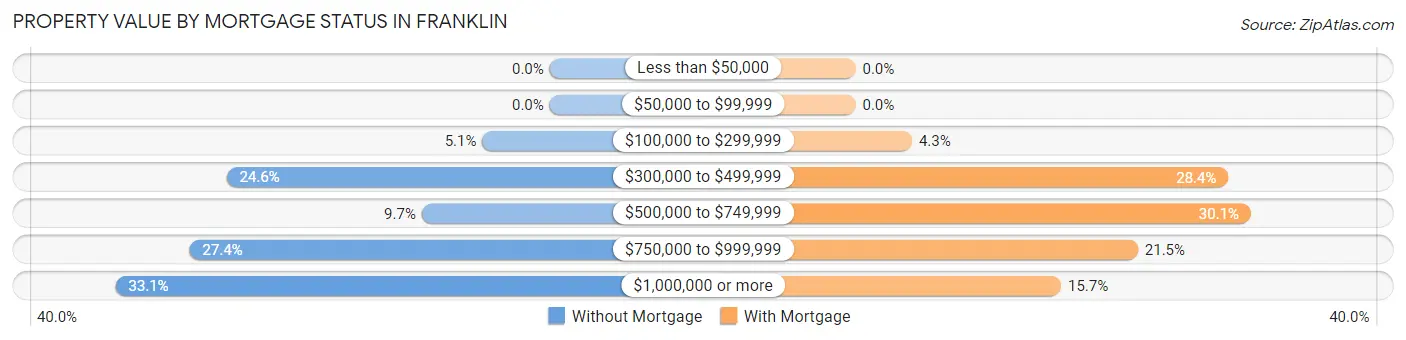
| Property Value | Without Mortgage | With Mortgage |
| Less than $50,000 | 0 (0.0%) | 0 (0.0%) |
| $50,000 to $99,999 | 0 (0.0%) | 0 (0.0%) |
| $100,000 to $299,999 | 20 (5.1%) | 25 (4.3%) |
| $300,000 to $499,999 | 96 (24.6%) | 165 (28.4%) |
| $500,000 to $749,999 | 38 (9.7%) | 175 (30.1%) |
| $750,000 to $999,999 | 107 (27.4%) | 125 (21.5%) |
| $1,000,000 or more | 129 (33.1%) | 91 (15.7%) |
| Total | 390 (100.0%) | 581 (100.0%) |
Household Income by Mortgage Status in Franklin
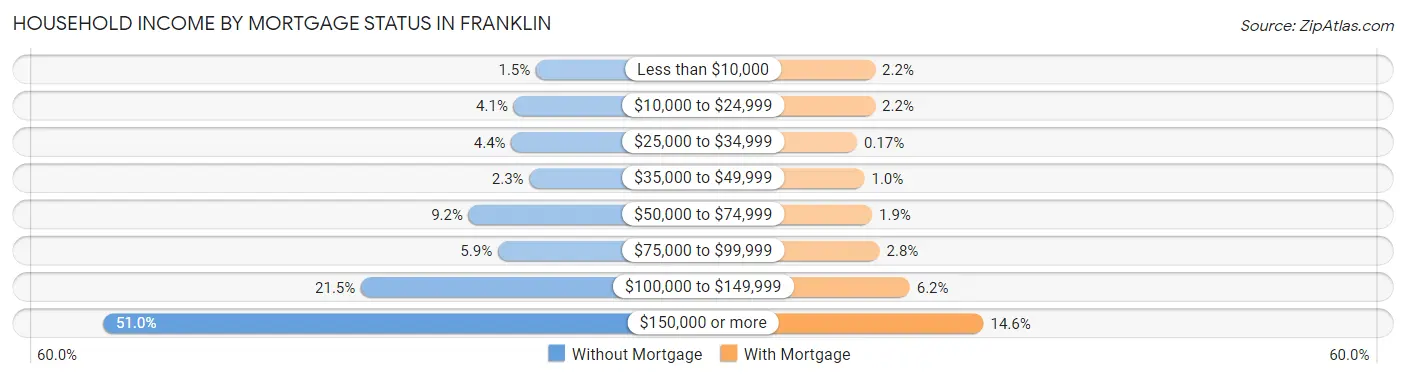
| Household Income | Without Mortgage | With Mortgage |
| Less than $10,000 | 6 (1.5%) | 13 (2.2%) |
| $10,000 to $24,999 | 16 (4.1%) | 13 (2.2%) |
| $25,000 to $34,999 | 17 (4.4%) | 1 (0.2%) |
| $35,000 to $49,999 | 9 (2.3%) | 6 (1.0%) |
| $50,000 to $74,999 | 36 (9.2%) | 11 (1.9%) |
| $75,000 to $99,999 | 23 (5.9%) | 16 (2.8%) |
| $100,000 to $149,999 | 84 (21.5%) | 36 (6.2%) |
| $150,000 or more | 199 (51.0%) | 85 (14.6%) |
| Total | 390 (100.0%) | 581 (100.0%) |
Property Value to Household Income Ratio in Franklin
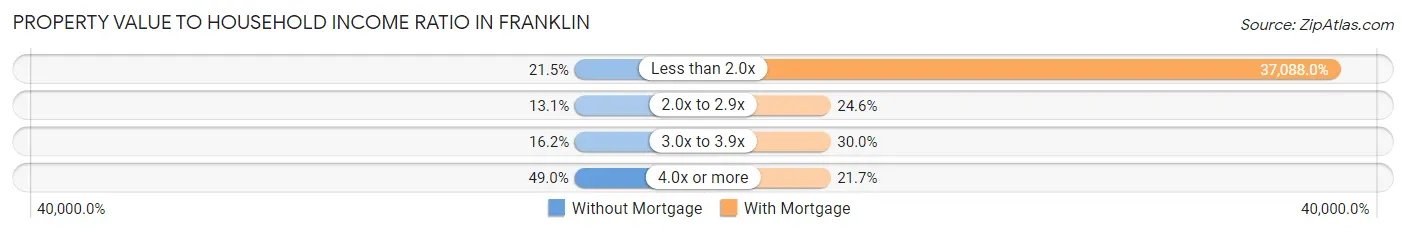
| Value-to-Income Ratio | Without Mortgage | With Mortgage |
| Less than 2.0x | 84 (21.5%) | 215,481 (37,088.0%) |
| 2.0x to 2.9x | 51 (13.1%) | 143 (24.6%) |
| 3.0x to 3.9x | 63 (16.2%) | 174 (29.9%) |
| 4.0x or more | 191 (49.0%) | 126 (21.7%) |
| Total | 390 (100.0%) | 581 (100.0%) |
Real Estate Taxes by Mortgage Status in Franklin
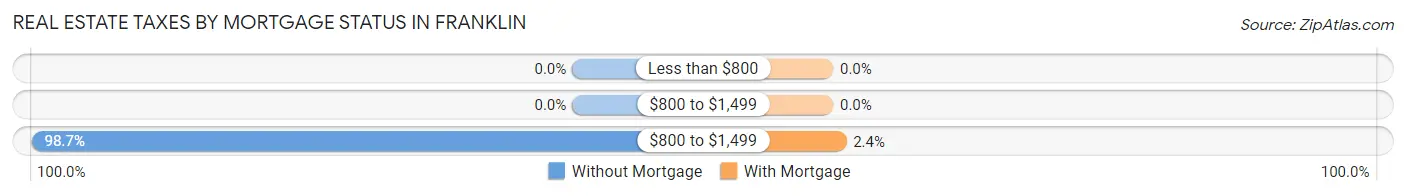
| Property Taxes | Without Mortgage | With Mortgage |
| Less than $800 | 0 (0.0%) | 0 (0.0%) |
| $800 to $1,499 | 0 (0.0%) | 0 (0.0%) |
| $800 to $1,499 | 385 (98.7%) | 14 (2.4%) |
| Total | 390 (100.0%) | 581 (100.0%) |
Health & Disability in Franklin
Health Insurance Coverage by Age in Franklin
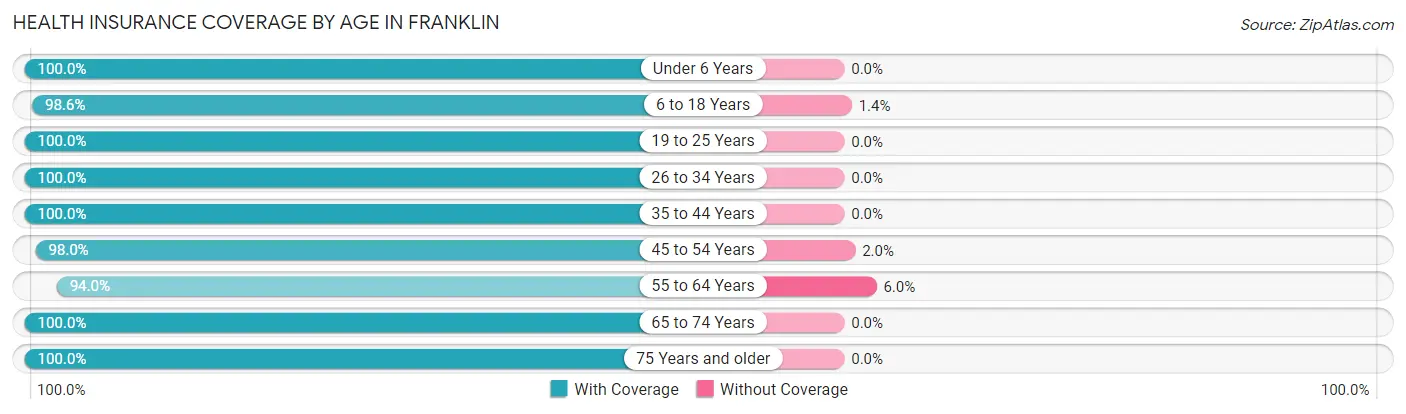
| Age Bracket | With Coverage | Without Coverage |
| Under 6 Years | 216 (100.0%) | 0 (0.0%) |
| 6 to 18 Years | 355 (98.6%) | 5 (1.4%) |
| 19 to 25 Years | 150 (100.0%) | 0 (0.0%) |
| 26 to 34 Years | 179 (100.0%) | 0 (0.0%) |
| 35 to 44 Years | 256 (100.0%) | 0 (0.0%) |
| 45 to 54 Years | 387 (98.0%) | 8 (2.0%) |
| 55 to 64 Years | 439 (94.0%) | 28 (6.0%) |
| 65 to 74 Years | 332 (100.0%) | 0 (0.0%) |
| 75 Years and older | 298 (100.0%) | 0 (0.0%) |
| Total | 2,612 (98.5%) | 41 (1.5%) |
Health Insurance Coverage by Citizenship Status in Franklin
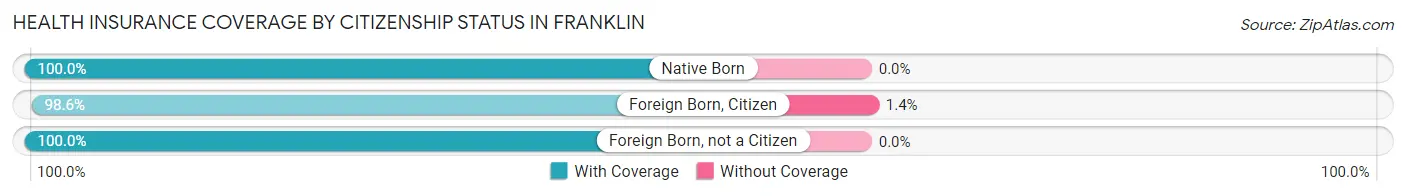
| Citizenship Status | With Coverage | Without Coverage |
| Native Born | 216 (100.0%) | 0 (0.0%) |
| Foreign Born, Citizen | 355 (98.6%) | 5 (1.4%) |
| Foreign Born, not a Citizen | 150 (100.0%) | 0 (0.0%) |
Health Insurance Coverage by Household Income in Franklin
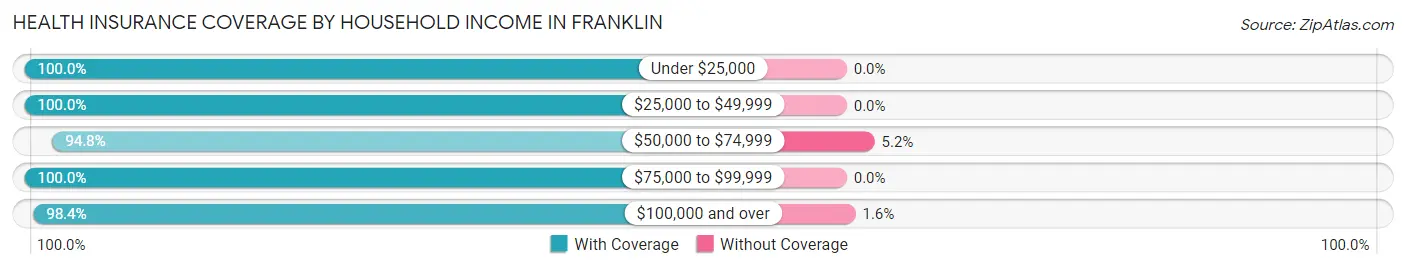
| Household Income | With Coverage | Without Coverage |
| Under $25,000 | 68 (100.0%) | 0 (0.0%) |
| $25,000 to $49,999 | 88 (100.0%) | 0 (0.0%) |
| $50,000 to $74,999 | 91 (94.8%) | 5 (5.2%) |
| $75,000 to $99,999 | 201 (100.0%) | 0 (0.0%) |
| $100,000 and over | 2,164 (98.4%) | 36 (1.6%) |
Public vs Private Health Insurance Coverage by Age in Franklin
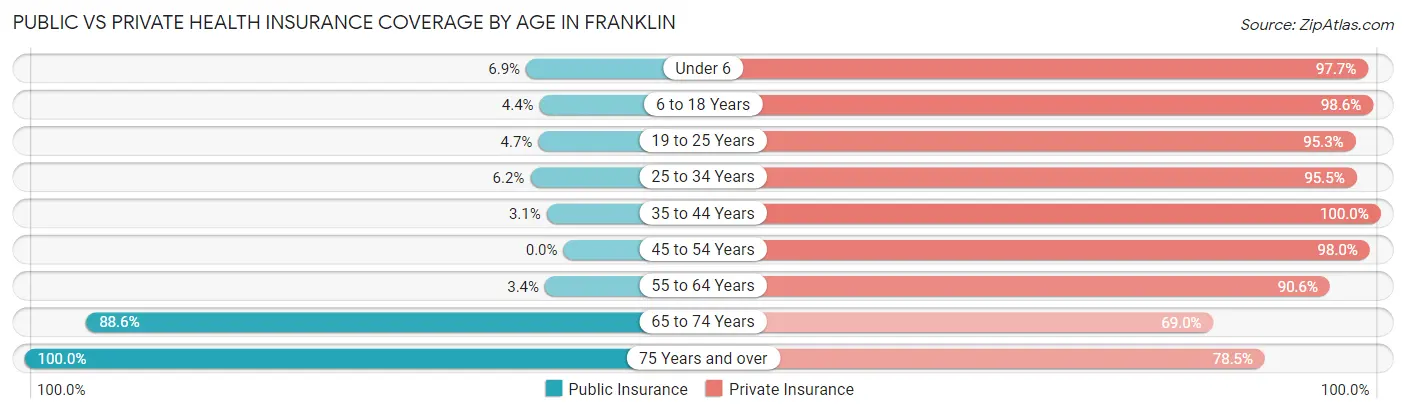
| Age Bracket | Public Insurance | Private Insurance |
| Under 6 | 15 (6.9%) | 211 (97.7%) |
| 6 to 18 Years | 16 (4.4%) | 355 (98.6%) |
| 19 to 25 Years | 7 (4.7%) | 143 (95.3%) |
| 25 to 34 Years | 11 (6.1%) | 171 (95.5%) |
| 35 to 44 Years | 8 (3.1%) | 256 (100.0%) |
| 45 to 54 Years | 0 (0.0%) | 387 (98.0%) |
| 55 to 64 Years | 16 (3.4%) | 423 (90.6%) |
| 65 to 74 Years | 294 (88.5%) | 229 (69.0%) |
| 75 Years and over | 298 (100.0%) | 234 (78.5%) |
| Total | 665 (25.1%) | 2,409 (90.8%) |
Disability Status by Sex by Age in Franklin
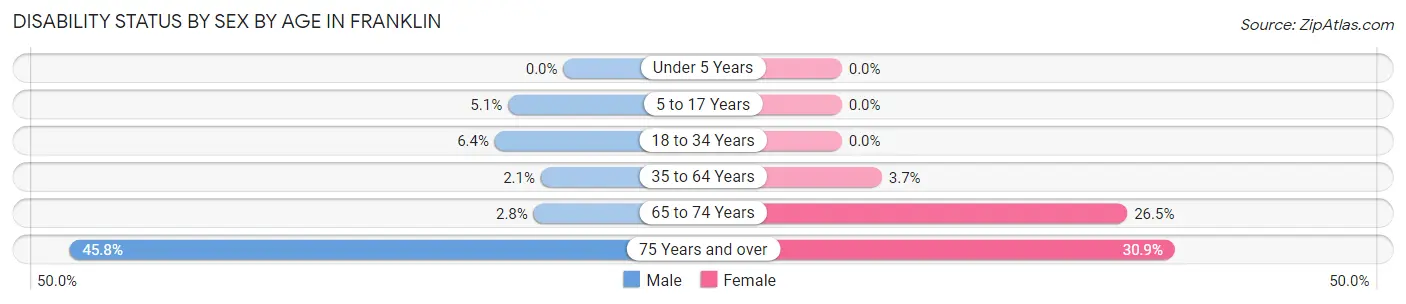
| Age Bracket | Male | Female |
| Under 5 Years | 0 (0.0%) | 0 (0.0%) |
| 5 to 17 Years | 9 (5.1%) | 0 (0.0%) |
| 18 to 34 Years | 14 (6.4%) | 0 (0.0%) |
| 35 to 64 Years | 11 (2.1%) | 22 (3.7%) |
| 65 to 74 Years | 5 (2.8%) | 40 (26.5%) |
| 75 Years and over | 55 (45.8%) | 55 (30.9%) |
Disability Class by Sex by Age in Franklin
Disability Class: Hearing Difficulty
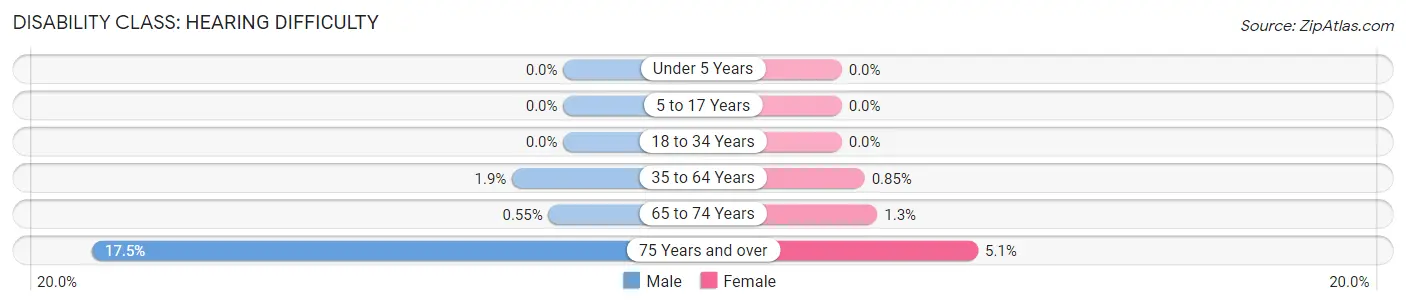
| Age Bracket | Male | Female |
| Under 5 Years | 0 (0.0%) | 0 (0.0%) |
| 5 to 17 Years | 0 (0.0%) | 0 (0.0%) |
| 18 to 34 Years | 0 (0.0%) | 0 (0.0%) |
| 35 to 64 Years | 10 (1.9%) | 5 (0.9%) |
| 65 to 74 Years | 1 (0.5%) | 2 (1.3%) |
| 75 Years and over | 21 (17.5%) | 9 (5.1%) |
Disability Class: Vision Difficulty
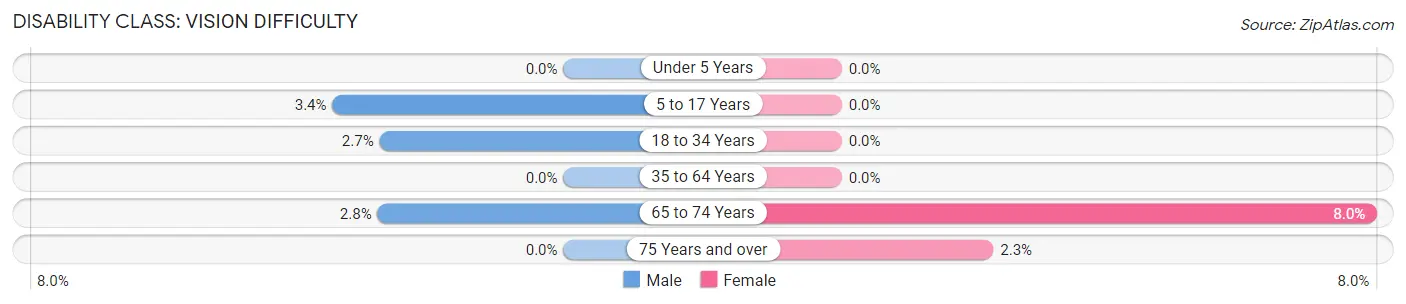
| Age Bracket | Male | Female |
| Under 5 Years | 0 (0.0%) | 0 (0.0%) |
| 5 to 17 Years | 6 (3.4%) | 0 (0.0%) |
| 18 to 34 Years | 6 (2.7%) | 0 (0.0%) |
| 35 to 64 Years | 0 (0.0%) | 0 (0.0%) |
| 65 to 74 Years | 5 (2.8%) | 12 (8.0%) |
| 75 Years and over | 0 (0.0%) | 4 (2.2%) |
Disability Class: Cognitive Difficulty
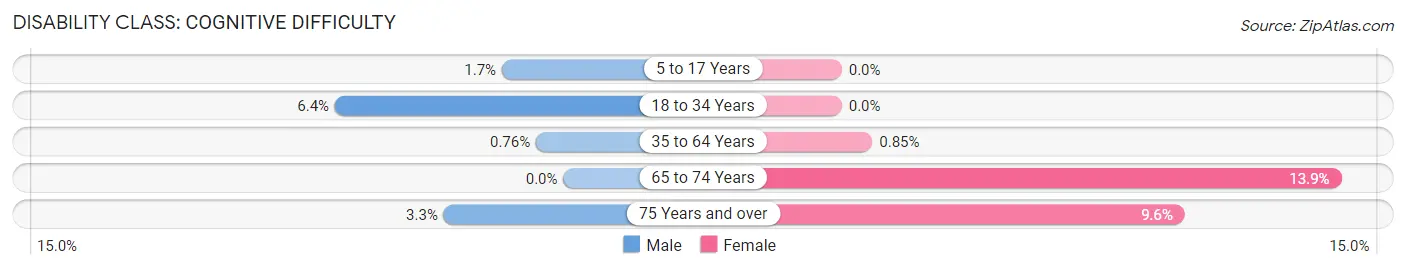
| Age Bracket | Male | Female |
| 5 to 17 Years | 3 (1.7%) | 0 (0.0%) |
| 18 to 34 Years | 14 (6.4%) | 0 (0.0%) |
| 35 to 64 Years | 4 (0.8%) | 5 (0.9%) |
| 65 to 74 Years | 0 (0.0%) | 21 (13.9%) |
| 75 Years and over | 4 (3.3%) | 17 (9.6%) |
Disability Class: Ambulatory Difficulty
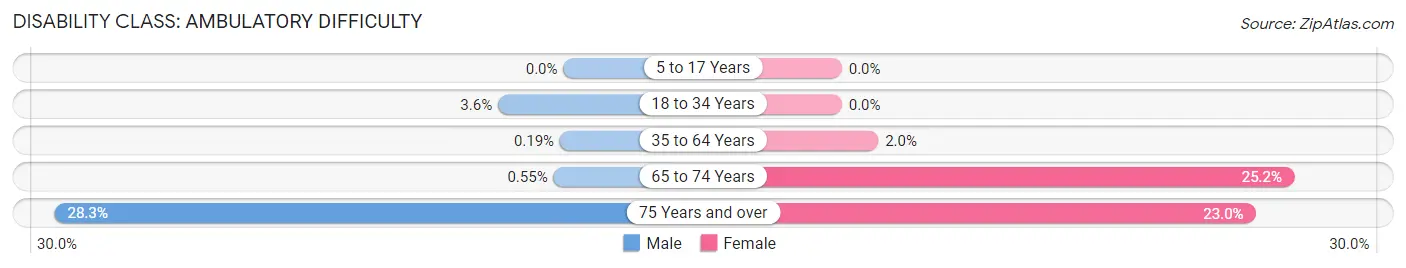
| Age Bracket | Male | Female |
| 5 to 17 Years | 0 (0.0%) | 0 (0.0%) |
| 18 to 34 Years | 8 (3.6%) | 0 (0.0%) |
| 35 to 64 Years | 1 (0.2%) | 12 (2.0%) |
| 65 to 74 Years | 1 (0.5%) | 38 (25.2%) |
| 75 Years and over | 34 (28.3%) | 41 (23.0%) |
Disability Class: Self-Care Difficulty
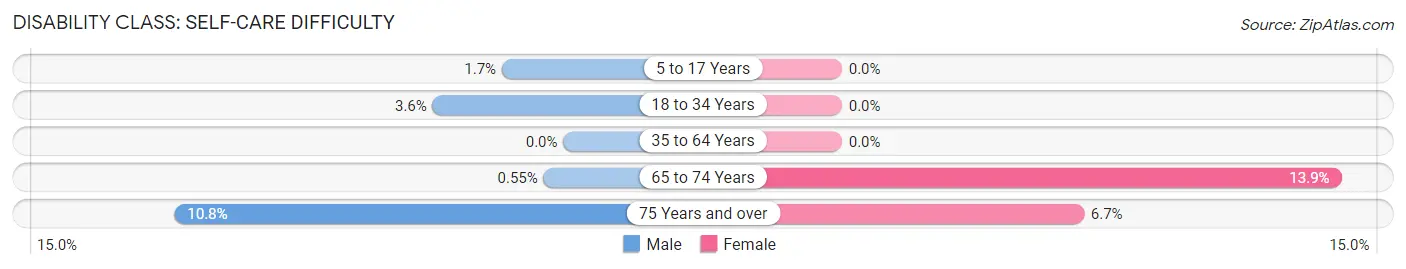
| Age Bracket | Male | Female |
| 5 to 17 Years | 3 (1.7%) | 0 (0.0%) |
| 18 to 34 Years | 8 (3.6%) | 0 (0.0%) |
| 35 to 64 Years | 0 (0.0%) | 0 (0.0%) |
| 65 to 74 Years | 1 (0.5%) | 21 (13.9%) |
| 75 Years and over | 13 (10.8%) | 12 (6.7%) |
Technology Access in Franklin
Computing Device Access in Franklin
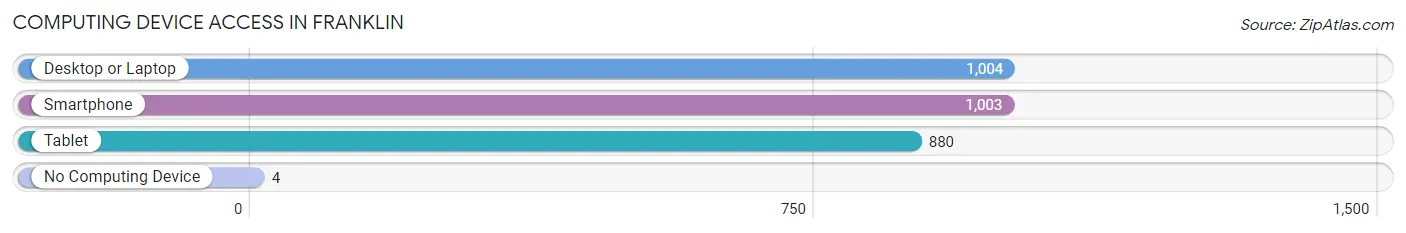
| Device Type | # Households | % Households |
| Desktop or Laptop | 1,004 | 96.4% |
| Smartphone | 1,003 | 96.3% |
| Tablet | 880 | 84.5% |
| No Computing Device | 4 | 0.4% |
| Total | 1,042 | 100.0% |
Internet Access in Franklin
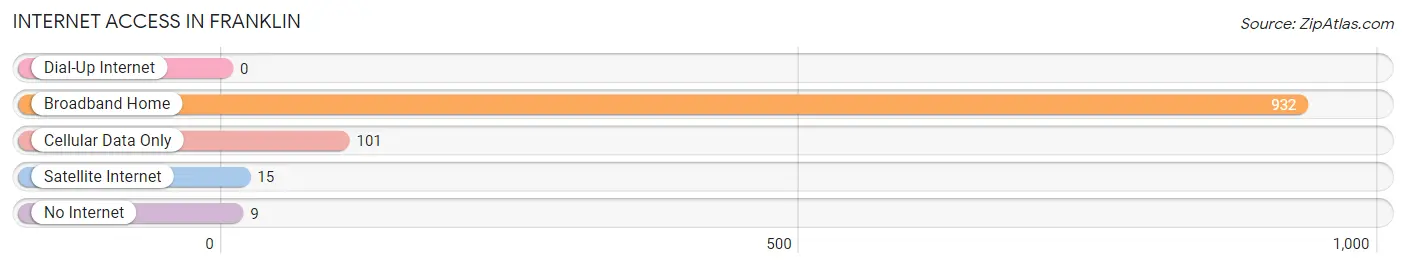
| Internet Type | # Households | % Households |
| Dial-Up Internet | 0 | 0.0% |
| Broadband Home | 932 | 89.4% |
| Cellular Data Only | 101 | 9.7% |
| Satellite Internet | 15 | 1.4% |
| No Internet | 9 | 0.9% |
| Total | 1,042 | 100.0% |
Franklin Summary
Franklin, Michigan is a small city located in the southeastern corner of the state, in Oakland County. It is a suburb of Detroit, located about 20 miles north of the city. The city was founded in 1825 and has a population of about 11,000 people.
History
Franklin was founded in 1825 by William Franklin, a settler from New York. He purchased the land from the local Native American tribes and named the settlement after himself. The city was incorporated in 1867 and was originally a farming community. In the late 19th century, the city began to grow as a result of the industrialization of Detroit. The city was home to several factories, including a paper mill, a furniture factory, and a foundry.
In the early 20th century, the city began to experience a population boom as people moved from Detroit to the suburbs. The city was also home to several large companies, including the Franklin Automobile Company, which was founded in 1915. The company was later sold to General Motors in 1925.
Geography
Franklin is located in the southeastern corner of Michigan, in Oakland County. It is bordered by the cities of Southfield, Farmington Hills, and Novi. The city is situated on the Huron River, which flows through the city. The city is also home to several parks, including Franklin Park, which is located on the banks of the river.
Economy
Franklin’s economy is largely based on the automotive industry. The city is home to several automotive suppliers, including Delphi Automotive, which is headquartered in the city. The city is also home to several other businesses, including a medical center, a shopping mall, and several restaurants.
Demographics
As of the 2010 census, the population of Franklin was 10,590. The racial makeup of the city was 79.3% White, 14.2% African American, 0.4% Native American, 2.2% Asian, and 3.9% from other races. The median household income was $50,945, and the median family income was $62,917.
Franklin is a diverse city, with a variety of cultures and backgrounds represented. The city is home to a large Jewish population, as well as a large Muslim population. The city is also home to a large number of immigrants, with the largest groups coming from India, China, and Mexico.
Franklin is a small city with a rich history and a diverse population. It is a suburb of Detroit and is home to several businesses and industries. The city is also home to several parks and recreational areas, making it a great place to live and work.
Common Questions
What is Per Capita Income in Franklin?
Per Capita income in Franklin is $113,299.
What is the Median Family Income in Franklin?
Median Family Income in Franklin is $181,964.
What is the Median Household income in Franklin?
Median Household Income in Franklin is $178,167.
What is Income or Wage Gap in Franklin?
Income or Wage Gap in Franklin is 51.3%.
Women in Franklin earn 48.7 cents for every dollar earned by a man.
What is Inequality or Gini Index in Franklin?
Inequality or Gini Index in Franklin is 0.48.
What is the Total Population of Franklin?
Total Population of Franklin is 2,653.
What is the Total Male Population of Franklin?
Total Male Population of Franklin is 1,302.
What is the Total Female Population of Franklin?
Total Female Population of Franklin is 1,351.
What is the Ratio of Males per 100 Females in Franklin?
There are 96.37 Males per 100 Females in Franklin.
What is the Ratio of Females per 100 Males in Franklin?
There are 103.76 Females per 100 Males in Franklin.
What is the Median Population Age in Franklin?
Median Population Age in Franklin is 48.3 Years.
What is the Average Family Size in Franklin
Average Family Size in Franklin is 2.9 People.
What is the Average Household Size in Franklin
Average Household Size in Franklin is 2.5 People.
How Large is the Labor Force in Franklin?
There are 1,383 People in the Labor Forcein in Franklin.
What is the Percentage of People in the Labor Force in Franklin?
64.0% of People are in the Labor Force in Franklin.
What is the Unemployment Rate in Franklin?
Unemployment Rate in Franklin is 2.0%.