Emmett, MI Map & Demographics
Emmett Map
Emmett Overview
$38,206
PER CAPITA INCOME
$83,125
AVG FAMILY INCOME
$112,656
AVG HOUSEHOLD INCOME
42.5%
WAGE / INCOME GAP [ % ]
57.5¢/ $1
WAGE / INCOME GAP [ $ ]
0.27
INEQUALITY / GINI INDEX
244
TOTAL POPULATION
123
MALE POPULATION
121
FEMALE POPULATION
101.65
MALES / 100 FEMALES
98.37
FEMALES / 100 MALES
31.6
MEDIAN AGE
2.9
AVG FAMILY SIZE
2.4
AVG HOUSEHOLD SIZE
138
LABOR FORCE [ PEOPLE ]
64.2%
PERCENT IN LABOR FORCE
5.8%
UNEMPLOYMENT RATE
Emmett Zip Codes
Emmett Area Codes
Income in Emmett
Income Overview in Emmett
Per Capita Income in Emmett is $38,206, while median incomes of families and households are $83,125 and $112,656 respectively.
| Characteristic | Number | Measure |
| Per Capita Income | 244 | $38,206 |
| Median Family Income | 58 | $83,125 |
| Mean Family Income | 58 | $89,790 |
| Median Household Income | 104 | $112,656 |
| Mean Household Income | 104 | $92,362 |
| Income Deficit | 58 | $0 |
| Wage / Income Gap (%) | 244 | 42.46% |
| Wage / Income Gap ($) | 244 | 57.54¢ per $1 |
| Gini / Inequality Index | 244 | 0.27 |
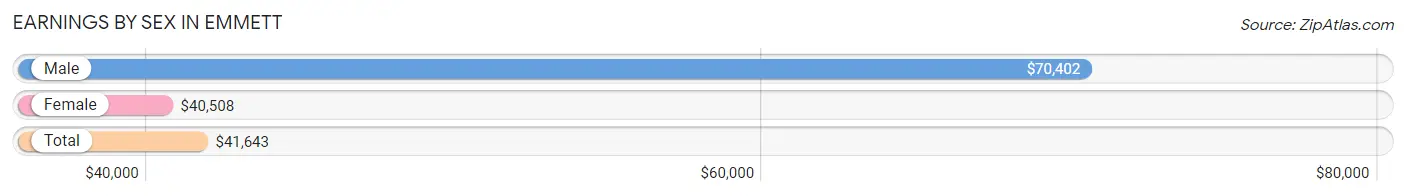
Earnings by Sex in Emmett
Average Earnings in Emmett are $41,643, $70,402 for men and $40,508 for women, a difference of 42.5%.
| Sex | Number | Average Earnings |
| Male | 83 (50.0%) | $70,402 |
| Female | 83 (50.0%) | $40,508 |
| Total | 166 (100.0%) | $41,643 |
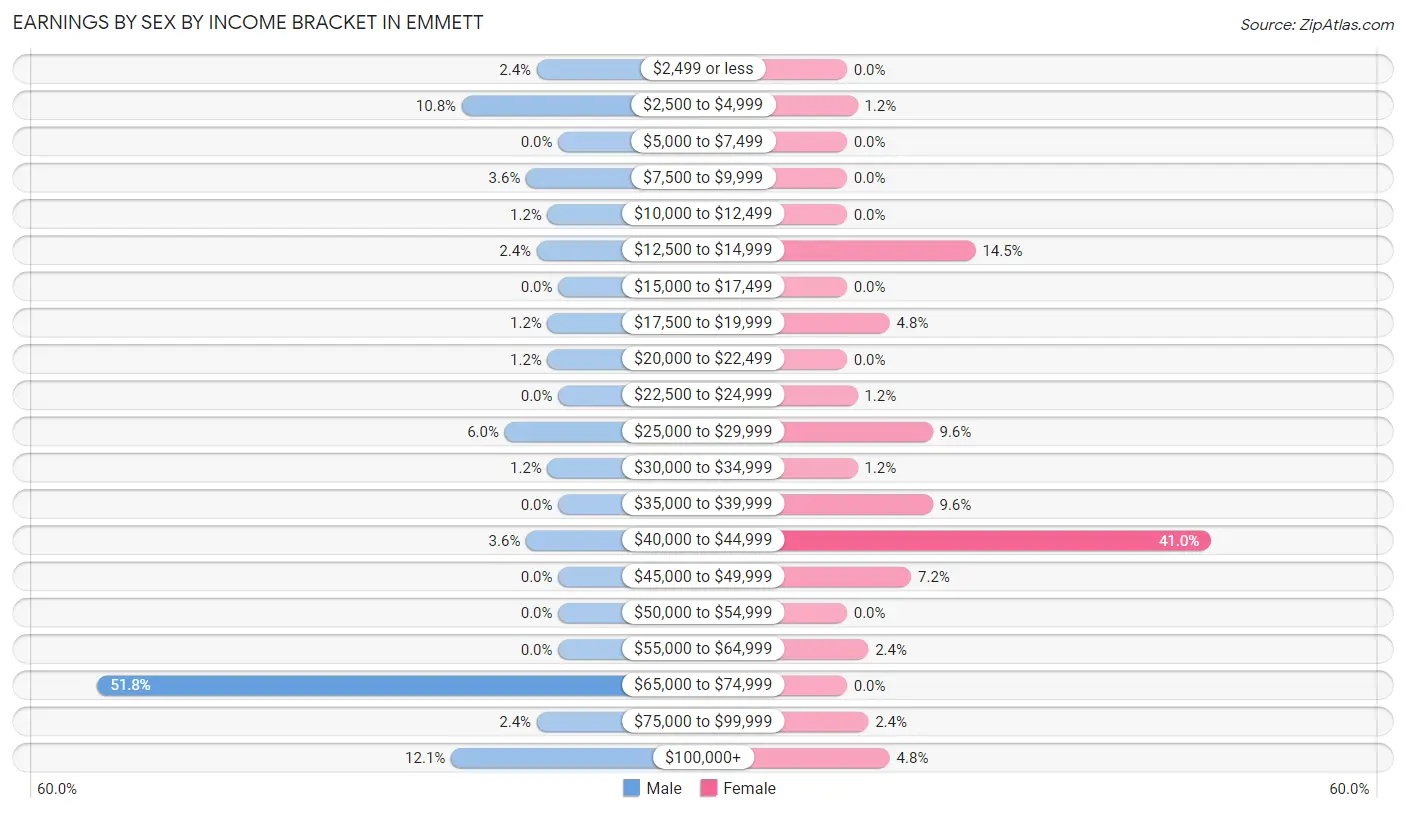
Earnings by Sex by Income Bracket in Emmett
The most common earnings brackets in Emmett are $65,000 to $74,999 for men (43 | 51.8%) and $40,000 to $44,999 for women (34 | 41.0%).
| Income | Male | Female |
| $2,499 or less | 2 (2.4%) | 0 (0.0%) |
| $2,500 to $4,999 | 9 (10.8%) | 1 (1.2%) |
| $5,000 to $7,499 | 0 (0.0%) | 0 (0.0%) |
| $7,500 to $9,999 | 3 (3.6%) | 0 (0.0%) |
| $10,000 to $12,499 | 1 (1.2%) | 0 (0.0%) |
| $12,500 to $14,999 | 2 (2.4%) | 12 (14.5%) |
| $15,000 to $17,499 | 0 (0.0%) | 0 (0.0%) |
| $17,500 to $19,999 | 1 (1.2%) | 4 (4.8%) |
| $20,000 to $22,499 | 1 (1.2%) | 0 (0.0%) |
| $22,500 to $24,999 | 0 (0.0%) | 1 (1.2%) |
| $25,000 to $29,999 | 5 (6.0%) | 8 (9.6%) |
| $30,000 to $34,999 | 1 (1.2%) | 1 (1.2%) |
| $35,000 to $39,999 | 0 (0.0%) | 8 (9.6%) |
| $40,000 to $44,999 | 3 (3.6%) | 34 (41.0%) |
| $45,000 to $49,999 | 0 (0.0%) | 6 (7.2%) |
| $50,000 to $54,999 | 0 (0.0%) | 0 (0.0%) |
| $55,000 to $64,999 | 0 (0.0%) | 2 (2.4%) |
| $65,000 to $74,999 | 43 (51.8%) | 0 (0.0%) |
| $75,000 to $99,999 | 2 (2.4%) | 2 (2.4%) |
| $100,000+ | 10 (12.0%) | 4 (4.8%) |
| Total | 83 (100.0%) | 83 (100.0%) |
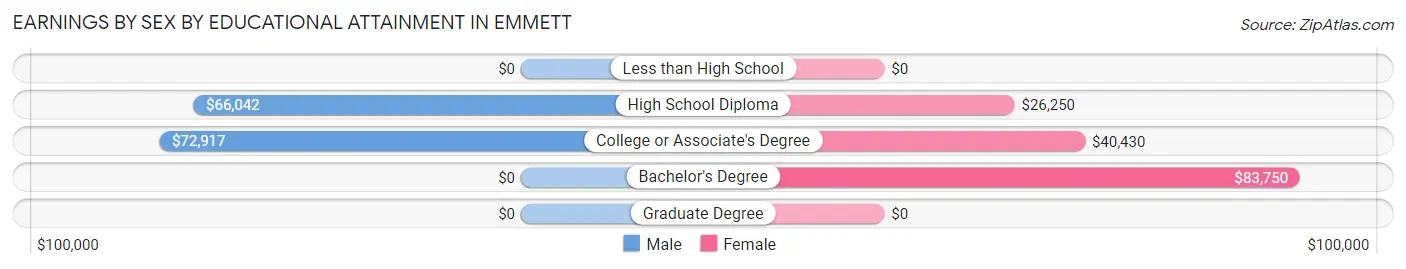
Earnings by Sex by Educational Attainment in Emmett
Average earnings in Emmett are $71,027 for men and $40,508 for women, a difference of 43.0%. Men with an educational attainment of college or associate's degree enjoy the highest average annual earnings of $72,917, while those with high school diploma education earn the least with $66,042. Women with an educational attainment of bachelor's degree earn the most with the average annual earnings of $83,750, while those with high school diploma education have the smallest earnings of $26,250.
| Educational Attainment | Male Income | Female Income |
| Less than High School | - | - |
| High School Diploma | $66,042 | $26,250 |
| College or Associate's Degree | $72,917 | $40,430 |
| Bachelor's Degree | - | - |
| Graduate Degree | - | - |
| Total | $71,027 | $40,508 |
Family Income in Emmett
Family Income Brackets in Emmett
According to the Emmett family income data, there are 18 families falling into the $100,000 to $149,999 income range, which is the most common income bracket and makes up 31.0% of all families.
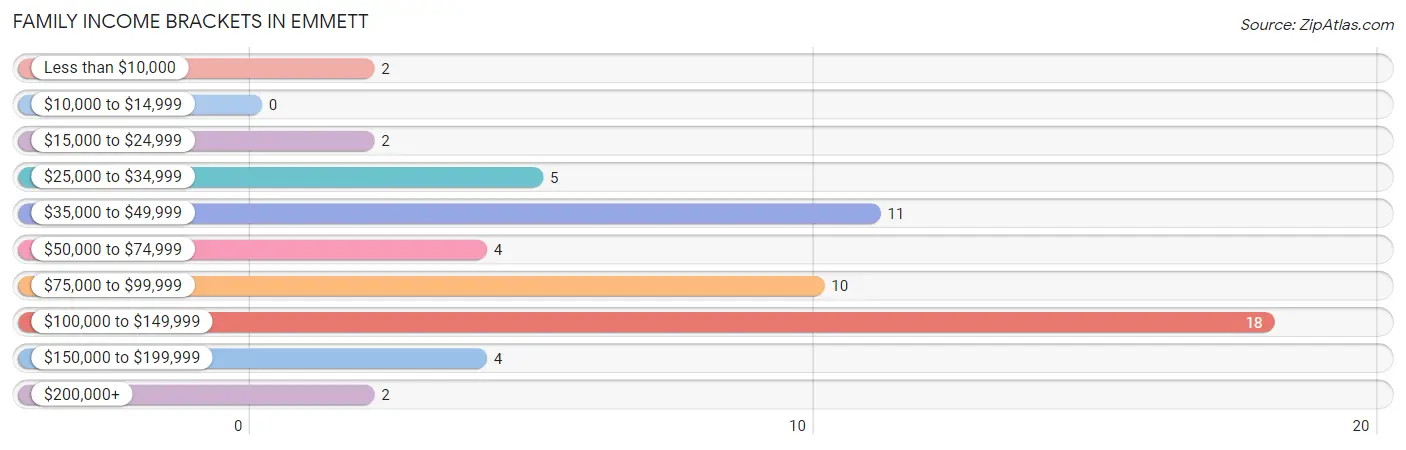
| Income Bracket | # Families | % Families |
| Less than $10,000 | 2 | 3.4% |
| $10,000 to $14,999 | 0 | 0.0% |
| $15,000 to $24,999 | 2 | 3.4% |
| $25,000 to $34,999 | 5 | 8.6% |
| $35,000 to $49,999 | 11 | 19.0% |
| $50,000 to $74,999 | 4 | 6.9% |
| $75,000 to $99,999 | 10 | 17.2% |
| $100,000 to $149,999 | 18 | 31.0% |
| $150,000 to $199,999 | 4 | 6.9% |
| $200,000+ | 2 | 3.4% |
Family Income by Famaliy Size in Emmett
3-person families (9 | 15.5%) account for the highest median family income in Emmett with $122,917 per family, while 3-person families (9 | 15.5%) have the highest median income of $40,972 per family member.
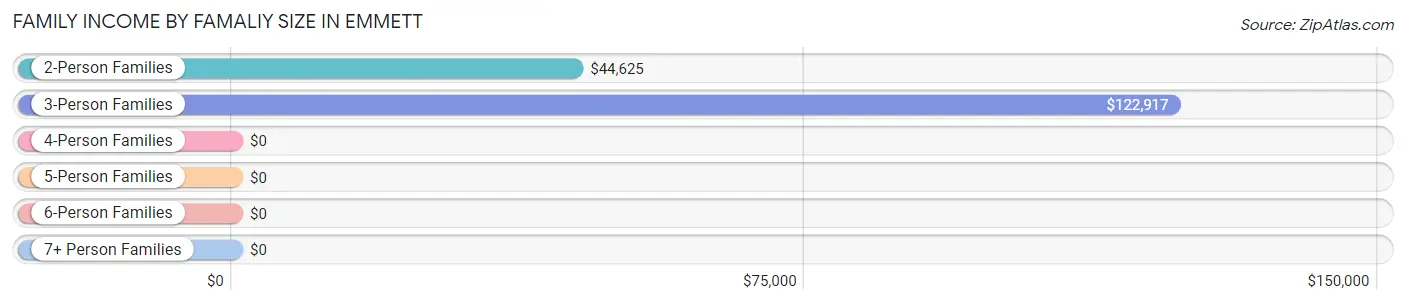
| Income Bracket | # Families | Median Income |
| 2-Person Families | 37 (63.8%) | $44,625 |
| 3-Person Families | 9 (15.5%) | $122,917 |
| 4-Person Families | 4 (6.9%) | $0 |
| 5-Person Families | 2 (3.5%) | $0 |
| 6-Person Families | 0 (0.0%) | $0 |
| 7+ Person Families | 6 (10.3%) | $0 |
| Total | 58 (100.0%) | $83,125 |
Family Income by Number of Earners in Emmett
The median family income in Emmett is $83,125, with families comprising 3+ earners (12) having the highest median family income of $131,875, while families with 1 earner (19) have the lowest median family income of $42,813, accounting for 20.7% and 32.8% of families, respectively.
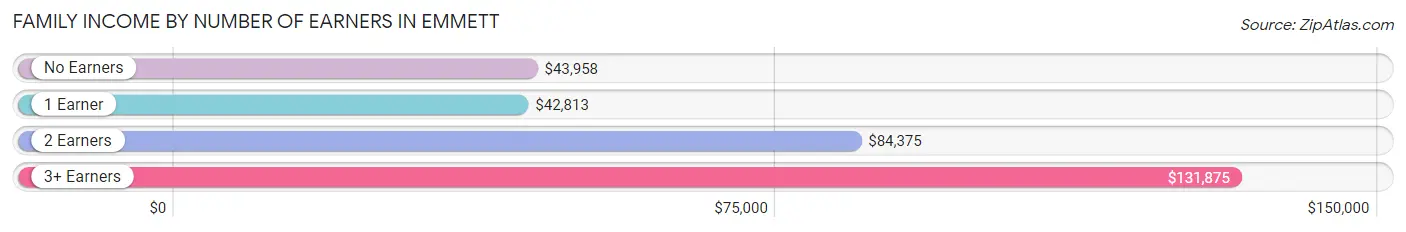
| Number of Earners | # Families | Median Income |
| No Earners | 9 (15.5%) | $43,958 |
| 1 Earner | 19 (32.8%) | $42,813 |
| 2 Earners | 18 (31.0%) | $84,375 |
| 3+ Earners | 12 (20.7%) | $131,875 |
| Total | 58 (100.0%) | $83,125 |
Household Income in Emmett
Household Income Brackets in Emmett
With 50 households falling in the category, the $100,000 to $149,999 income range is the most frequent in Emmett, accounting for 48.1% of all households.
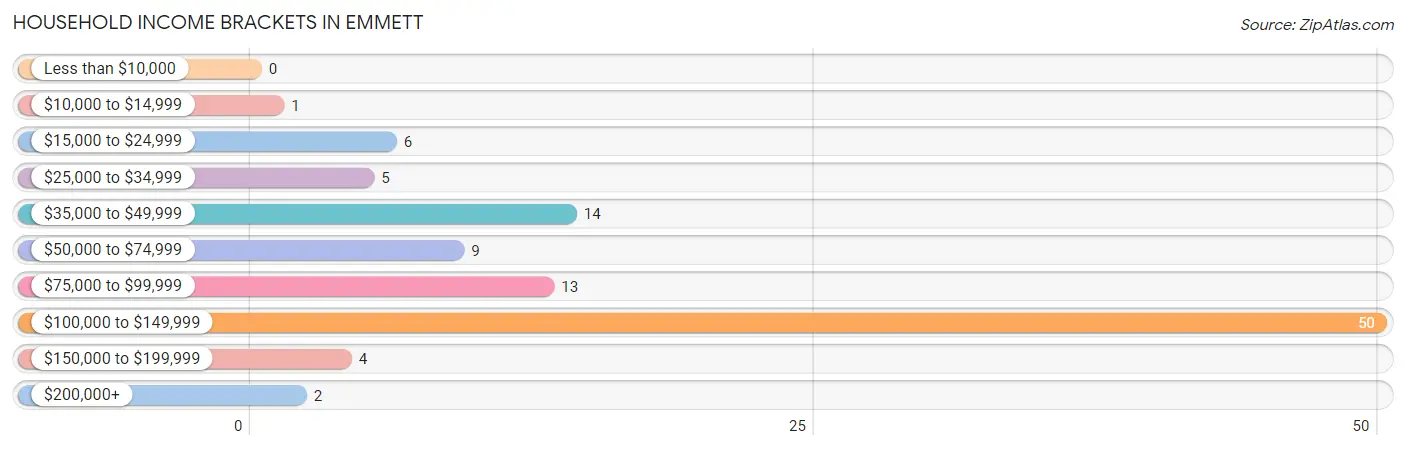
| Income Bracket | # Households | % Households |
| Less than $10,000 | 0 | 0.0% |
| $10,000 to $14,999 | 1 | 1.0% |
| $15,000 to $24,999 | 6 | 5.8% |
| $25,000 to $34,999 | 5 | 4.8% |
| $35,000 to $49,999 | 14 | 13.5% |
| $50,000 to $74,999 | 9 | 8.7% |
| $75,000 to $99,999 | 13 | 12.5% |
| $100,000 to $149,999 | 50 | 48.1% |
| $150,000 to $199,999 | 4 | 3.8% |
| $200,000+ | 2 | 1.9% |
Household Income by Householder Age in Emmett
The median household income in Emmett is $112,656, with the highest median household income of $113,633 found in the 25 to 44 years age bracket for the primary householder. A total of 45 households (43.3%) fall into this category. Meanwhile, the 15 to 24 years age bracket for the primary householder has the lowest median household income of $0, with 1 households (1.0%) in this group.
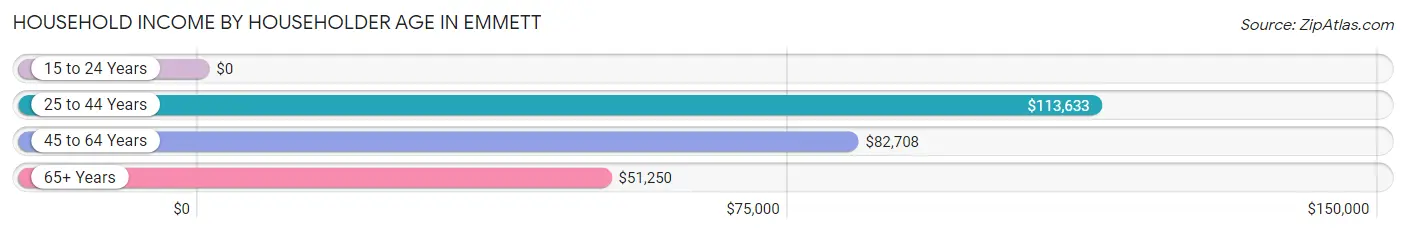
| Income Bracket | # Households | Median Income |
| 15 to 24 Years | 1 (1.0%) | $0 |
| 25 to 44 Years | 45 (43.3%) | $113,633 |
| 45 to 64 Years | 47 (45.2%) | $82,708 |
| 65+ Years | 11 (10.6%) | $51,250 |
| Total | 104 (100.0%) | $112,656 |
Poverty in Emmett
Income Below Poverty by Sex and Age in Emmett
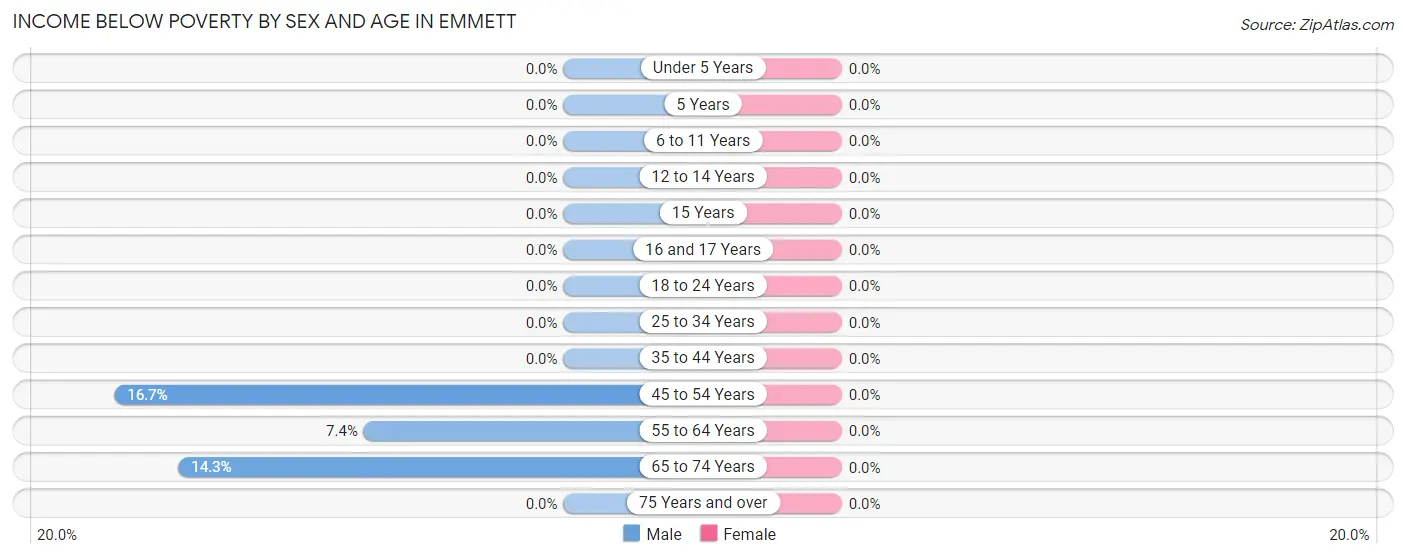
| Age Bracket | Male | Female |
| Under 5 Years | 0 (0.0%) | 0 (0.0%) |
| 5 Years | 0 (0.0%) | 0 (0.0%) |
| 6 to 11 Years | 0 (0.0%) | 0 (0.0%) |
| 12 to 14 Years | 0 (0.0%) | 0 (0.0%) |
| 15 Years | 0 (0.0%) | 0 (0.0%) |
| 16 and 17 Years | 0 (0.0%) | 0 (0.0%) |
| 18 to 24 Years | 0 (0.0%) | 0 (0.0%) |
| 25 to 34 Years | 0 (0.0%) | 0 (0.0%) |
| 35 to 44 Years | 0 (0.0%) | 0 (0.0%) |
| 45 to 54 Years | 1 (16.7%) | 0 (0.0%) |
| 55 to 64 Years | 2 (7.4%) | 0 (0.0%) |
| 65 to 74 Years | 1 (14.3%) | 0 (0.0%) |
| 75 Years and over | 0 (0.0%) | 0 (0.0%) |
| Total | 4 (3.3%) | 0 (0.0%) |
Income Above Poverty by Sex and Age in Emmett
According to the poverty statistics in Emmett, males aged under 5 years and females aged under 5 years are the age groups that are most secure financially, with 100.0% of males and 100.0% of females in these age groups living above the poverty line.
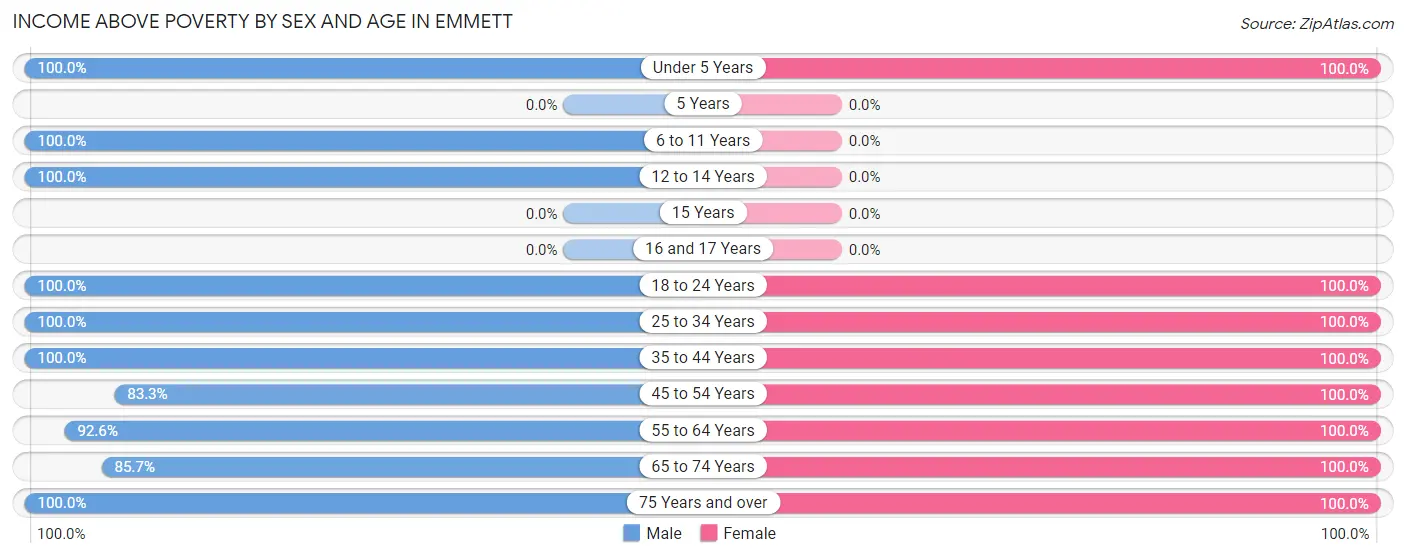
| Age Bracket | Male | Female |
| Under 5 Years | 7 (100.0%) | 8 (100.0%) |
| 5 Years | 0 (0.0%) | 0 (0.0%) |
| 6 to 11 Years | 6 (100.0%) | 0 (0.0%) |
| 12 to 14 Years | 8 (100.0%) | 0 (0.0%) |
| 15 Years | 0 (0.0%) | 0 (0.0%) |
| 16 and 17 Years | 0 (0.0%) | 0 (0.0%) |
| 18 to 24 Years | 15 (100.0%) | 2 (100.0%) |
| 25 to 34 Years | 34 (100.0%) | 52 (100.0%) |
| 35 to 44 Years | 10 (100.0%) | 4 (100.0%) |
| 45 to 54 Years | 5 (83.3%) | 8 (100.0%) |
| 55 to 64 Years | 25 (92.6%) | 43 (100.0%) |
| 65 to 74 Years | 6 (85.7%) | 2 (100.0%) |
| 75 Years and over | 3 (100.0%) | 2 (100.0%) |
| Total | 119 (96.8%) | 121 (100.0%) |
Income Below Poverty Among Married-Couple Families in Emmett
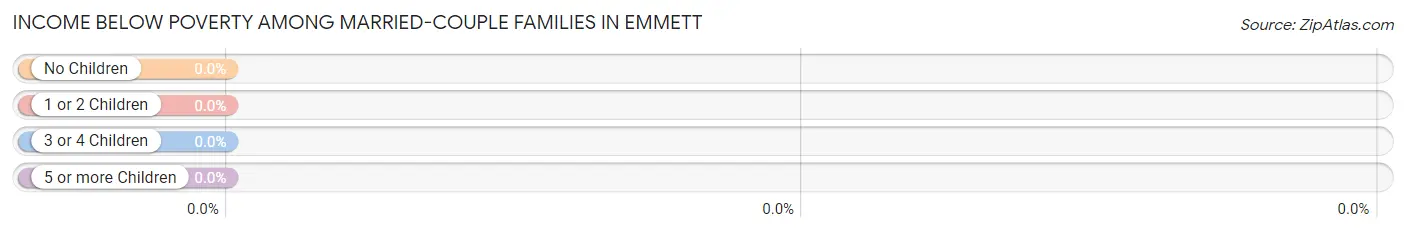
| Children | Above Poverty | Below Poverty |
| No Children | 31 (100.0%) | 0 (0.0%) |
| 1 or 2 Children | 5 (100.0%) | 0 (0.0%) |
| 3 or 4 Children | 6 (100.0%) | 0 (0.0%) |
| 5 or more Children | 0 (0.0%) | 0 (0.0%) |
| Total | 42 (100.0%) | 0 (0.0%) |
Income Below Poverty Among Single-Parent Households in Emmett
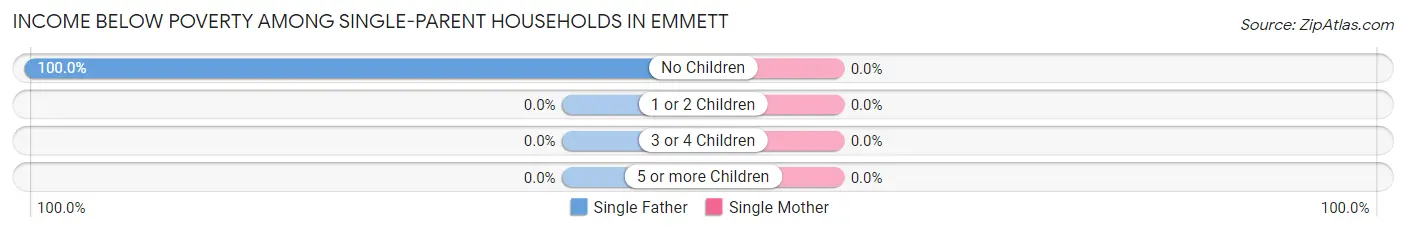
| Children | Single Father | Single Mother |
| No Children | 2 (100.0%) | 0 (0.0%) |
| 1 or 2 Children | 0 (0.0%) | 0 (0.0%) |
| 3 or 4 Children | 0 (0.0%) | 0 (0.0%) |
| 5 or more Children | 0 (0.0%) | 0 (0.0%) |
| Total | 2 (100.0%) | 0 (0.0%) |
Income Below Poverty Among Married-Couple vs Single-Parent Households in Emmett
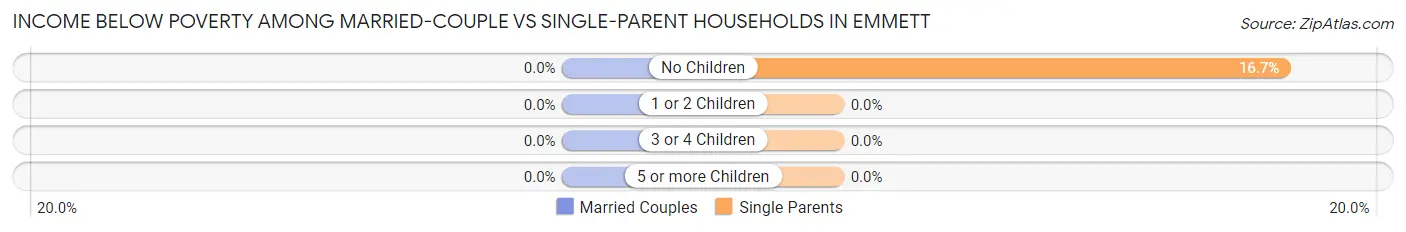
| Children | Married-Couple Families | Single-Parent Households |
| No Children | 0 (0.0%) | 2 (16.7%) |
| 1 or 2 Children | 0 (0.0%) | 0 (0.0%) |
| 3 or 4 Children | 0 (0.0%) | 0 (0.0%) |
| 5 or more Children | 0 (0.0%) | 0 (0.0%) |
| Total | 0 (0.0%) | 2 (12.5%) |
Race in Emmett
The most populous races in Emmett are White / Caucasian (234 | 95.9%), and Two or more Races (10 | 4.1%).
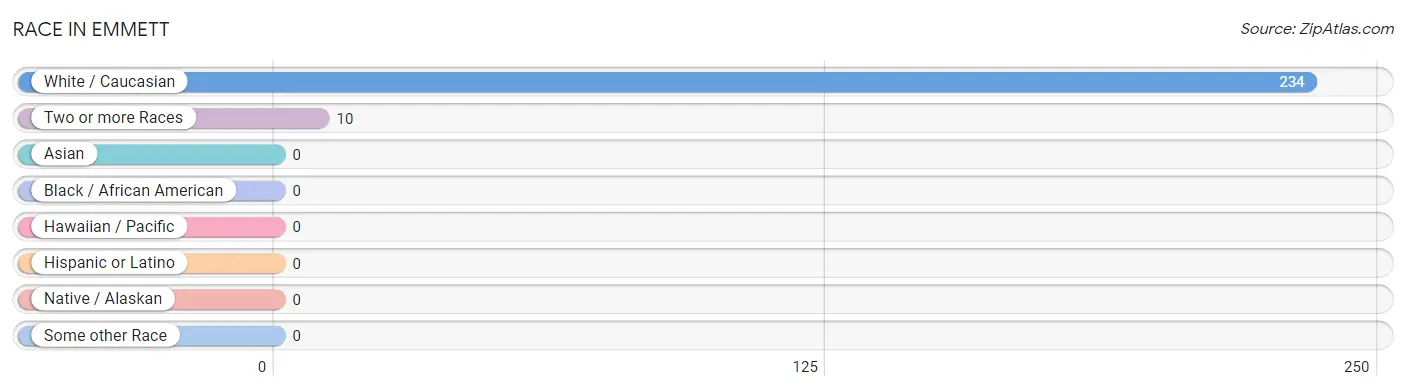
| Race | # Population | % Population |
| Asian | 0 | 0.0% |
| Black / African American | 0 | 0.0% |
| Hawaiian / Pacific | 0 | 0.0% |
| Hispanic or Latino | 0 | 0.0% |
| Native / Alaskan | 0 | 0.0% |
| White / Caucasian | 234 | 95.9% |
| Two or more Races | 10 | 4.1% |
| Some other Race | 0 | 0.0% |
| Total | 244 | 100.0% |
Ancestry in Emmett
The most populous ancestries reported in Emmett are German (65 | 26.6%), Polish (61 | 25.0%), Italian (45 | 18.4%), Irish (38 | 15.6%), and French (16 | 6.6%), together accounting for 92.2% of all Emmett residents.
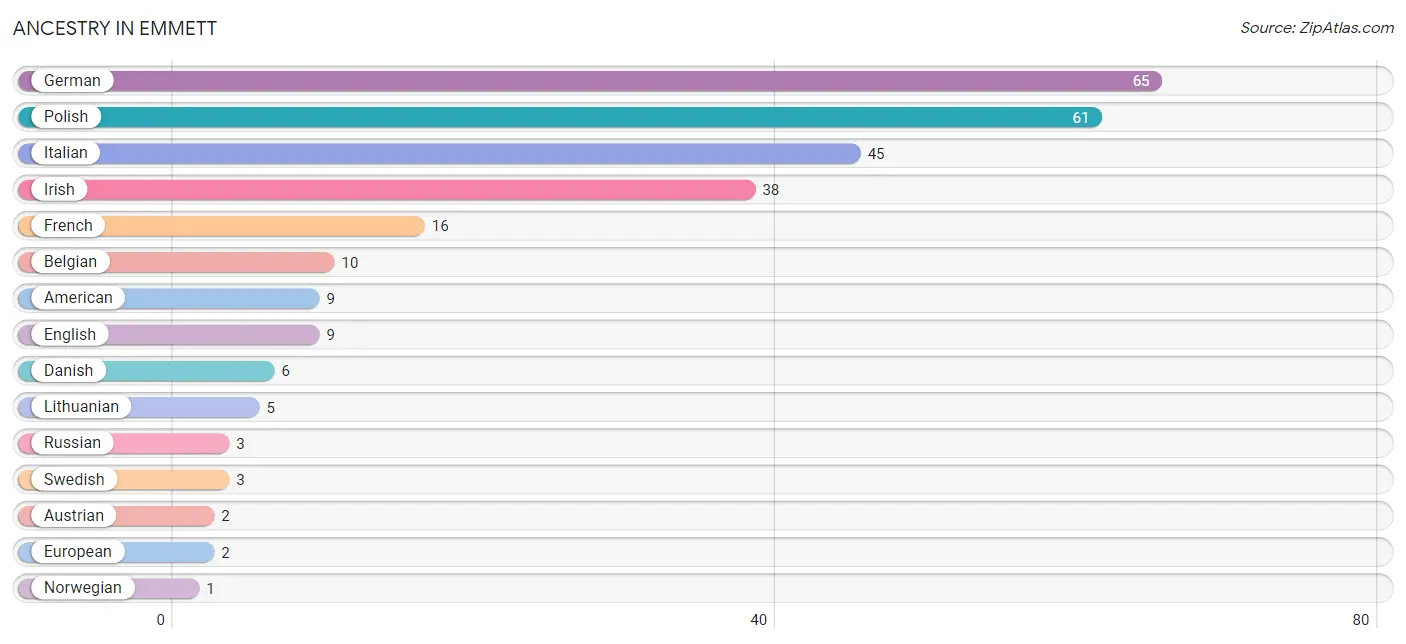
| Ancestry | # Population | % Population |
| American | 9 | 3.7% |
| Austrian | 2 | 0.8% |
| Belgian | 10 | 4.1% |
| Danish | 6 | 2.5% |
| English | 9 | 3.7% |
| European | 2 | 0.8% |
| French | 16 | 6.6% |
| German | 65 | 26.6% |
| Irish | 38 | 15.6% |
| Italian | 45 | 18.4% |
| Lithuanian | 5 | 2.1% |
| Norwegian | 1 | 0.4% |
| Polish | 61 | 25.0% |
| Russian | 3 | 1.2% |
| Scottish | 1 | 0.4% |
| Swedish | 3 | 1.2% | View All 16 Rows |
Immigrants in Emmett

| Immigration Origin | # Population | % Population | View All 0 Rows |
Sex and Age in Emmett
Sex and Age in Emmett
The most populous age groups in Emmett are 25 to 29 Years (34 | 27.6%) for men and 25 to 29 Years (36 | 29.7%) for women.
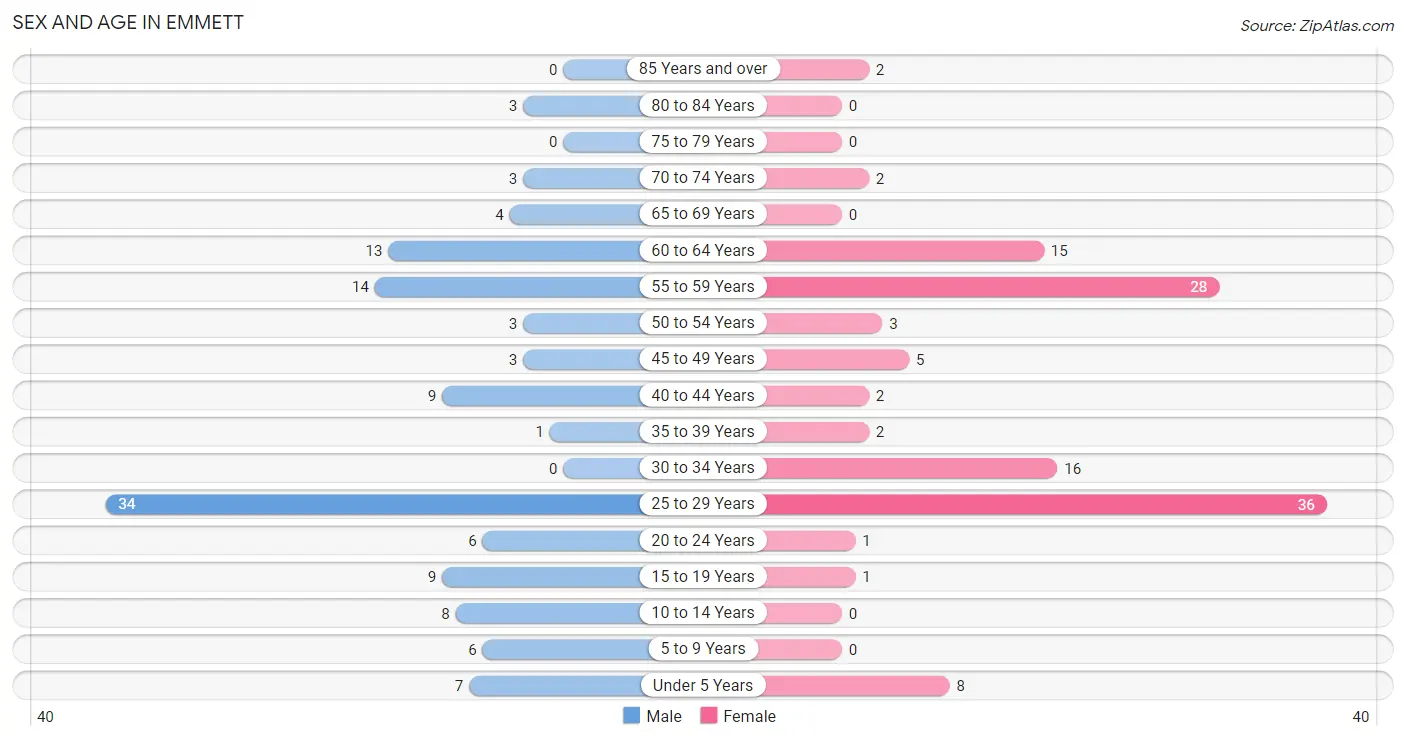
| Age Bracket | Male | Female |
| Under 5 Years | 7 (5.7%) | 8 (6.6%) |
| 5 to 9 Years | 6 (4.9%) | 0 (0.0%) |
| 10 to 14 Years | 8 (6.5%) | 0 (0.0%) |
| 15 to 19 Years | 9 (7.3%) | 1 (0.8%) |
| 20 to 24 Years | 6 (4.9%) | 1 (0.8%) |
| 25 to 29 Years | 34 (27.6%) | 36 (29.7%) |
| 30 to 34 Years | 0 (0.0%) | 16 (13.2%) |
| 35 to 39 Years | 1 (0.8%) | 2 (1.7%) |
| 40 to 44 Years | 9 (7.3%) | 2 (1.7%) |
| 45 to 49 Years | 3 (2.4%) | 5 (4.1%) |
| 50 to 54 Years | 3 (2.4%) | 3 (2.5%) |
| 55 to 59 Years | 14 (11.4%) | 28 (23.1%) |
| 60 to 64 Years | 13 (10.6%) | 15 (12.4%) |
| 65 to 69 Years | 4 (3.3%) | 0 (0.0%) |
| 70 to 74 Years | 3 (2.4%) | 2 (1.7%) |
| 75 to 79 Years | 0 (0.0%) | 0 (0.0%) |
| 80 to 84 Years | 3 (2.4%) | 0 (0.0%) |
| 85 Years and over | 0 (0.0%) | 2 (1.7%) |
| Total | 123 (100.0%) | 121 (100.0%) |
Families and Households in Emmett
Median Family Size in Emmett
The median family size in Emmett is 2.88 persons per family, with married-couple families (42 | 72.4%) accounting for the largest median family size of 3.19 persons per family. On the other hand, single male/father families (2 | 3.5%) represent the smallest median family size with 1.50 persons per family.
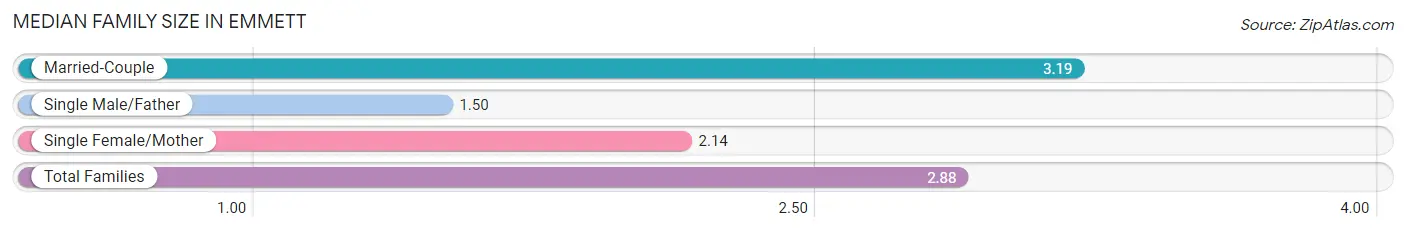
| Family Type | # Families | Family Size |
| Married-Couple | 42 (72.4%) | 3.19 |
| Single Male/Father | 2 (3.5%) | 1.50 |
| Single Female/Mother | 14 (24.1%) | 2.14 |
| Total Families | 58 (100.0%) | 2.88 |
Median Household Size in Emmett
The median household size in Emmett is 2.35 persons per household, with married-couple households (42 | 40.4%) accounting for the largest median household size of 3.19 persons per household. non-family households (46 | 44.2%) represent the smallest median household size with 1.63 persons per household.
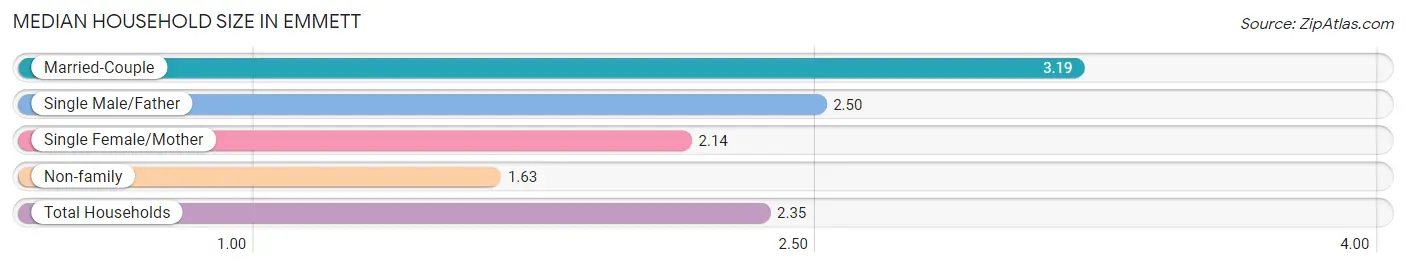
| Household Type | # Households | Household Size |
| Married-Couple | 42 (40.4%) | 3.19 |
| Single Male/Father | 2 (1.9%) | 2.50 |
| Single Female/Mother | 14 (13.5%) | 2.14 |
| Non-family | 46 (44.2%) | 1.63 |
| Total Households | 104 (100.0%) | 2.35 |
Household Size by Marriage Status in Emmett
Out of a total of 104 households in Emmett, 58 (55.8%) are family households, while 46 (44.2%) are nonfamily households. The most numerous type of family households are 2-person households, comprising 35, and the most common type of nonfamily households are 2-person households, comprising 33.
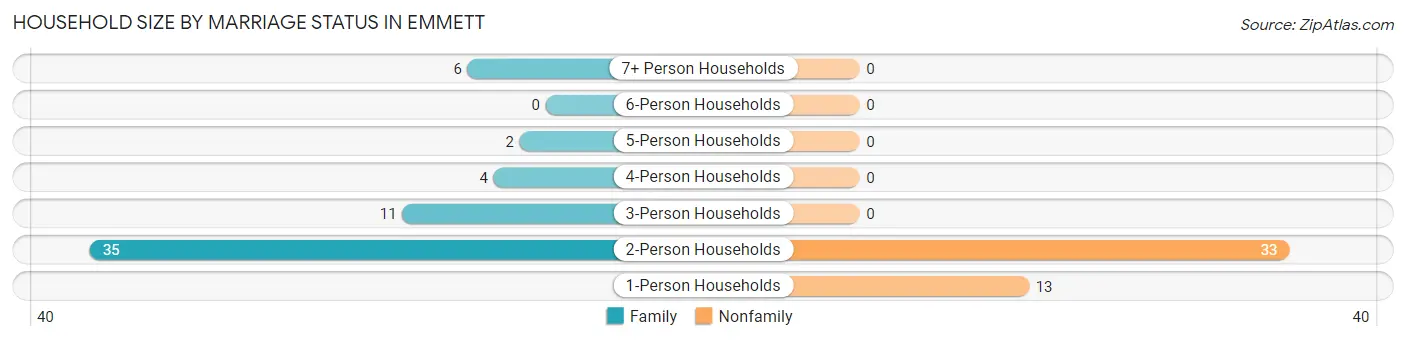
| Household Size | Family Households | Nonfamily Households |
| 1-Person Households | - | 13 (12.5%) |
| 2-Person Households | 35 (33.7%) | 33 (31.7%) |
| 3-Person Households | 11 (10.6%) | 0 (0.0%) |
| 4-Person Households | 4 (3.8%) | 0 (0.0%) |
| 5-Person Households | 2 (1.9%) | 0 (0.0%) |
| 6-Person Households | 0 (0.0%) | 0 (0.0%) |
| 7+ Person Households | 6 (5.8%) | 0 (0.0%) |
| Total | 58 (55.8%) | 46 (44.2%) |
Female Fertility in Emmett
Fertility by Age in Emmett
| Age Bracket | Women with Births | Births / 1,000 Women |
| 15 to 19 years | 0 (0.0%) | 0.0 |
| 20 to 34 years | 0 (0.0%) | 0.0 |
| 35 to 50 years | 0 (0.0%) | 0.0 |
| Total | 0 (0.0%) | 0.0 |
Fertility by Age by Marriage Status in Emmett
| Age Bracket | Married | Unmarried |
| 15 to 19 years | 0 (0.0%) | 0 (0.0%) |
| 20 to 34 years | 0 (0.0%) | 0 (0.0%) |
| 35 to 50 years | 0 (0.0%) | 0 (0.0%) |
| Total | 0 (0.0%) | 0 (0.0%) |
Fertility by Education in Emmett
| Educational Attainment | Women with Births | Births / 1,000 Women |
| Less than High School | 0 (0.0%) | 0.0 |
| High School Diploma | 0 (0.0%) | 0.0 |
| College or Associate's Degree | 0 (0.0%) | 0.0 |
| Bachelor's Degree | 0 (0.0%) | 0.0 |
| Graduate Degree | 0 (0.0%) | 0.0 |
| Total | 0 (0.0%) | 0.0 |
Fertility by Education by Marriage Status in Emmett
| Educational Attainment | Married | Unmarried |
| Less than High School | 0 (0.0%) | 0 (0.0%) |
| High School Diploma | 0 (0.0%) | 0 (0.0%) |
| College or Associate's Degree | 0 (0.0%) | 0 (0.0%) |
| Bachelor's Degree | 0 (0.0%) | 0 (0.0%) |
| Graduate Degree | 0 (0.0%) | 0 (0.0%) |
| Total | 0 (0.0%) | 0 (0.0%) |
Employment Characteristics in Emmett
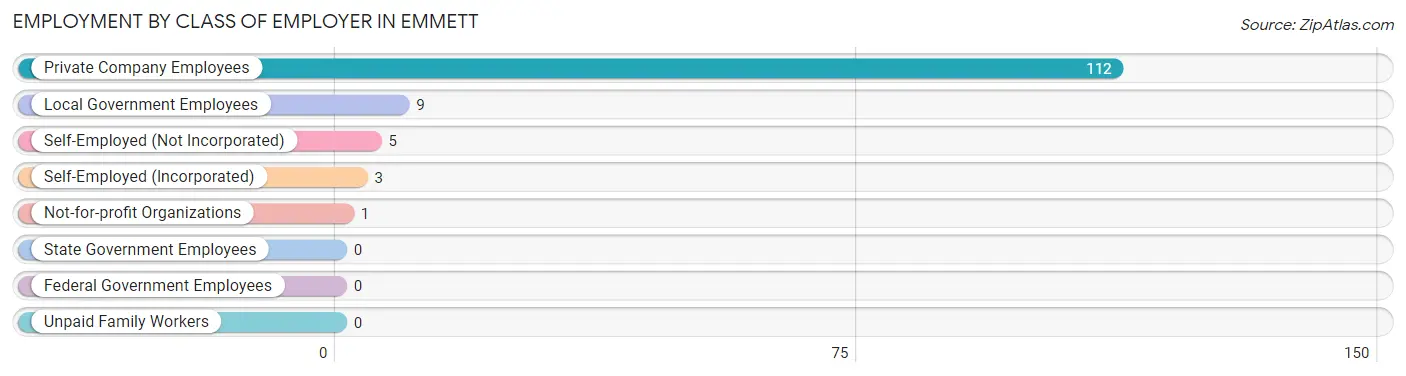
Employment by Class of Employer in Emmett
Among the 130 employed individuals in Emmett, private company employees (112 | 86.2%), local government employees (9 | 6.9%), and self-employed (not incorporated) (5 | 3.8%) make up the most common classes of employment.
| Employer Class | # Employees | % Employees |
| Private Company Employees | 112 | 86.2% |
| Self-Employed (Incorporated) | 3 | 2.3% |
| Self-Employed (Not Incorporated) | 5 | 3.8% |
| Not-for-profit Organizations | 1 | 0.8% |
| Local Government Employees | 9 | 6.9% |
| State Government Employees | 0 | 0.0% |
| Federal Government Employees | 0 | 0.0% |
| Unpaid Family Workers | 0 | 0.0% |
| Total | 130 | 100.0% |
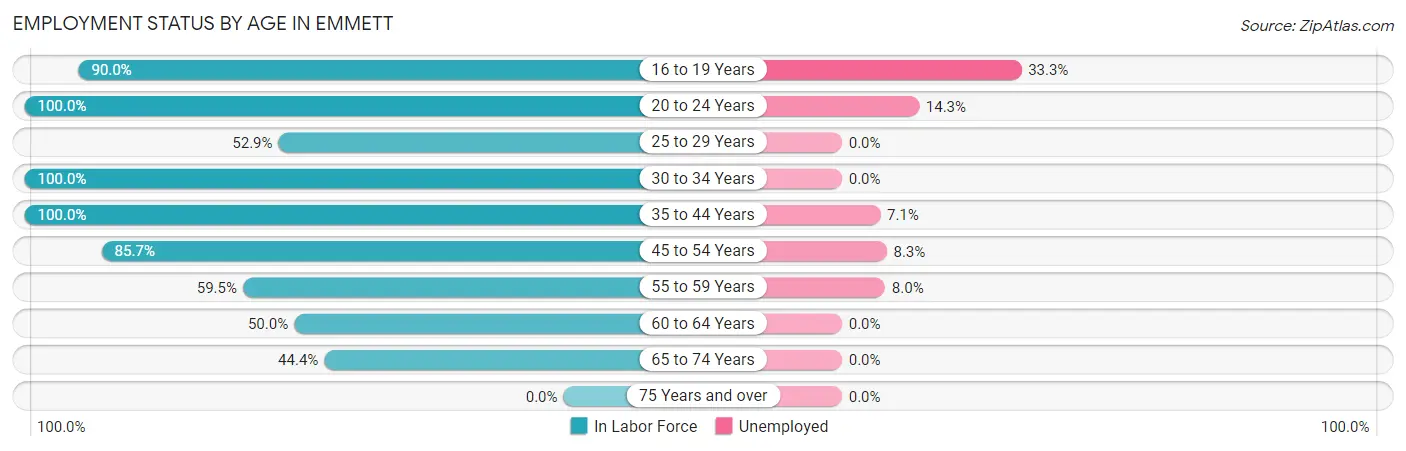
Employment Status by Age in Emmett
According to the labor force statistics for Emmett, out of the total population over 16 years of age (215), 64.2% or 138 individuals are in the labor force, with 5.8% or 8 of them unemployed. The age group with the highest labor force participation rate is 20 to 24 years, with 100.0% or 7 individuals in the labor force. Within the labor force, the 16 to 19 years age range has the highest percentage of unemployed individuals, with 33.3% or 3 of them being unemployed.
| Age Bracket | In Labor Force | Unemployed |
| 16 to 19 Years | 9 (90.0%) | 3 (33.3%) |
| 20 to 24 Years | 7 (100.0%) | 1 (14.3%) |
| 25 to 29 Years | 37 (52.9%) | 0 (0.0%) |
| 30 to 34 Years | 16 (100.0%) | 0 (0.0%) |
| 35 to 44 Years | 14 (100.0%) | 1 (7.1%) |
| 45 to 54 Years | 12 (85.7%) | 1 (8.3%) |
| 55 to 59 Years | 25 (59.5%) | 2 (8.0%) |
| 60 to 64 Years | 14 (50.0%) | 0 (0.0%) |
| 65 to 74 Years | 4 (44.4%) | 0 (0.0%) |
| 75 Years and over | 0 (0.0%) | 0 (0.0%) |
| Total | 138 (64.2%) | 8 (5.8%) |
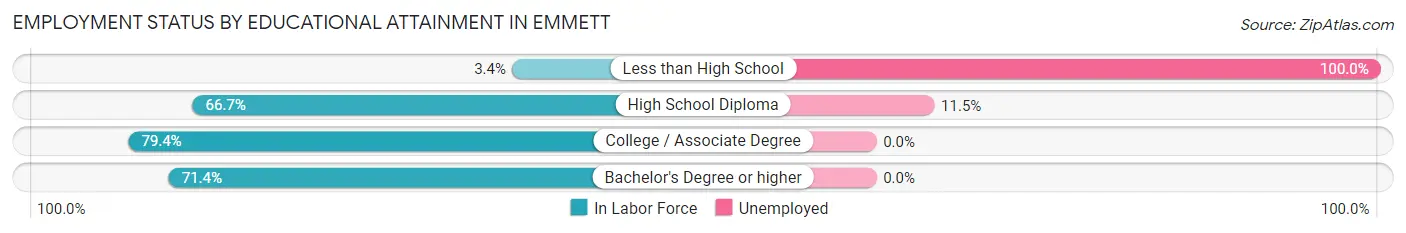
Employment Status by Educational Attainment in Emmett
According to labor force statistics for Emmett, 64.1% of individuals (118) out of the total population between 25 and 64 years of age (184) are in the labor force, with 3.4% or 4 of them being unemployed. The group with the highest labor force participation rate are those with the educational attainment of college / associate degree, with 79.4% or 81 individuals in the labor force. Within the labor force, individuals with less than high school education have the highest percentage of unemployment, with 100.0% or 1 of them being unemployed.
| Educational Attainment | In Labor Force | Unemployed |
| Less than High School | 1 (3.4%) | 29 (100.0%) |
| High School Diploma | 26 (66.7%) | 4 (11.5%) |
| College / Associate Degree | 81 (79.4%) | 0 (0.0%) |
| Bachelor's Degree or higher | 10 (71.4%) | 0 (0.0%) |
| Total | 118 (64.1%) | 6 (3.4%) |
Employment Occupations by Sex in Emmett
Management, Business, Science and Arts Occupations
The most common Management, Business, Science and Arts occupations in Emmett are Health Diagnosing & Treating (33 | 25.4%), Community & Social Service (11 | 8.5%), Management (10 | 7.7%), Arts, Media & Entertainment (9 | 6.9%), and Computers, Engineering & Science (3 | 2.3%).
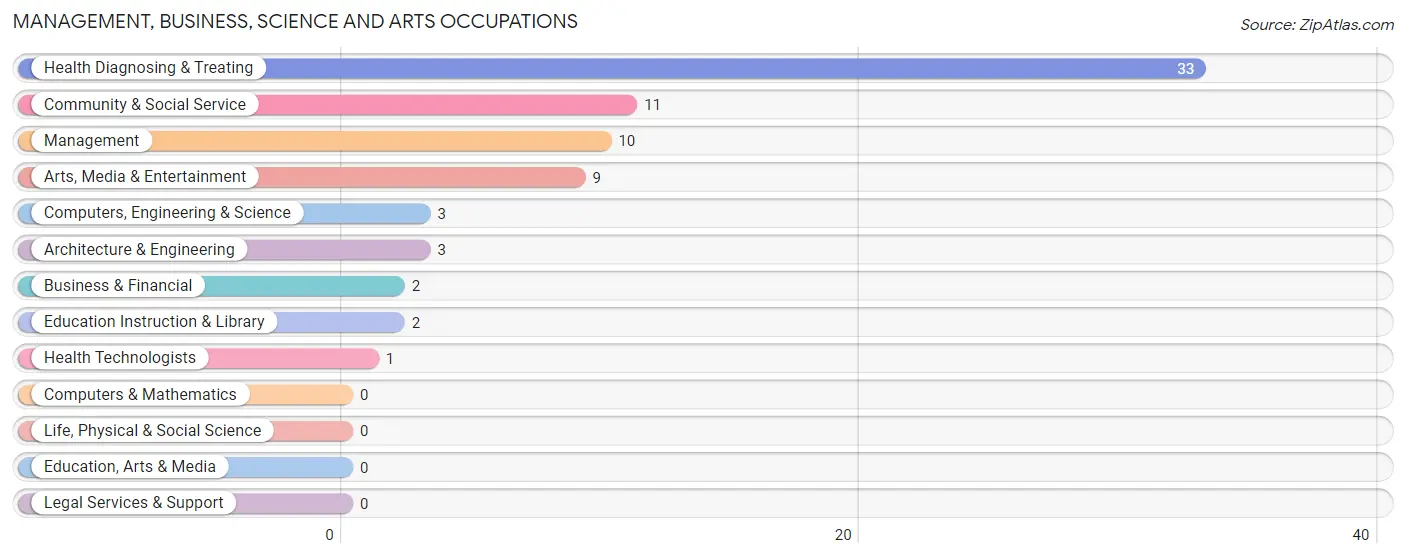
Management, Business, Science and Arts Occupations by Sex
Within the Management, Business, Science and Arts occupations in Emmett, the most male-oriented occupations are Computers, Engineering & Science (100.0%), Architecture & Engineering (100.0%), and Management (80.0%), while the most female-oriented occupations are Business & Financial (100.0%), Education Instruction & Library (100.0%), and Health Diagnosing & Treating (100.0%).
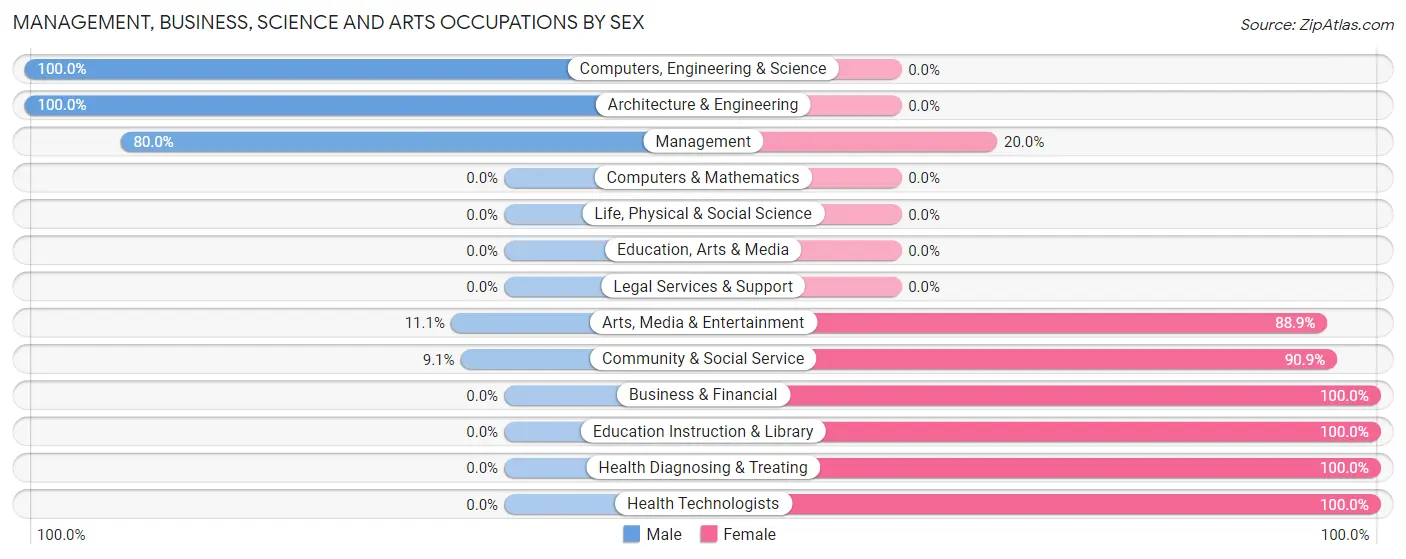
| Occupation | Male | Female |
| Management | 8 (80.0%) | 2 (20.0%) |
| Business & Financial | 0 (0.0%) | 2 (100.0%) |
| Computers, Engineering & Science | 3 (100.0%) | 0 (0.0%) |
| Computers & Mathematics | 0 (0.0%) | 0 (0.0%) |
| Architecture & Engineering | 3 (100.0%) | 0 (0.0%) |
| Life, Physical & Social Science | 0 (0.0%) | 0 (0.0%) |
| Community & Social Service | 1 (9.1%) | 10 (90.9%) |
| Education, Arts & Media | 0 (0.0%) | 0 (0.0%) |
| Legal Services & Support | 0 (0.0%) | 0 (0.0%) |
| Education Instruction & Library | 0 (0.0%) | 2 (100.0%) |
| Arts, Media & Entertainment | 1 (11.1%) | 8 (88.9%) |
| Health Diagnosing & Treating | 0 (0.0%) | 33 (100.0%) |
| Health Technologists | 0 (0.0%) | 1 (100.0%) |
| Total (Category) | 12 (20.3%) | 47 (79.7%) |
| Total (Overall) | 48 (36.9%) | 82 (63.1%) |
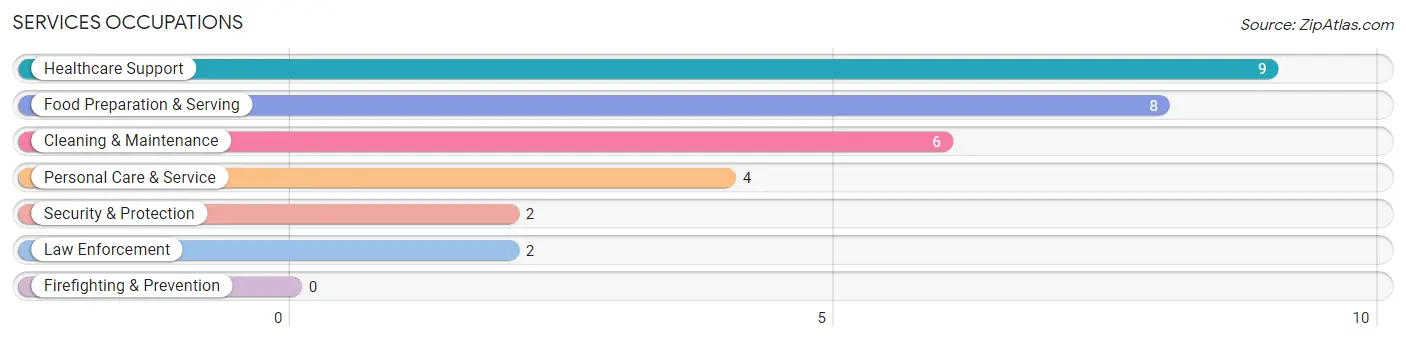
Services Occupations
The most common Services occupations in Emmett are Healthcare Support (9 | 6.9%), Food Preparation & Serving (8 | 6.1%), Cleaning & Maintenance (6 | 4.6%), Personal Care & Service (4 | 3.1%), and Security & Protection (2 | 1.5%).
Services Occupations by Sex
Within the Services occupations in Emmett, the most male-oriented occupations are Security & Protection (100.0%), Law Enforcement (100.0%), and Cleaning & Maintenance (100.0%), while the most female-oriented occupations are Healthcare Support (100.0%), and Food Preparation & Serving (100.0%).
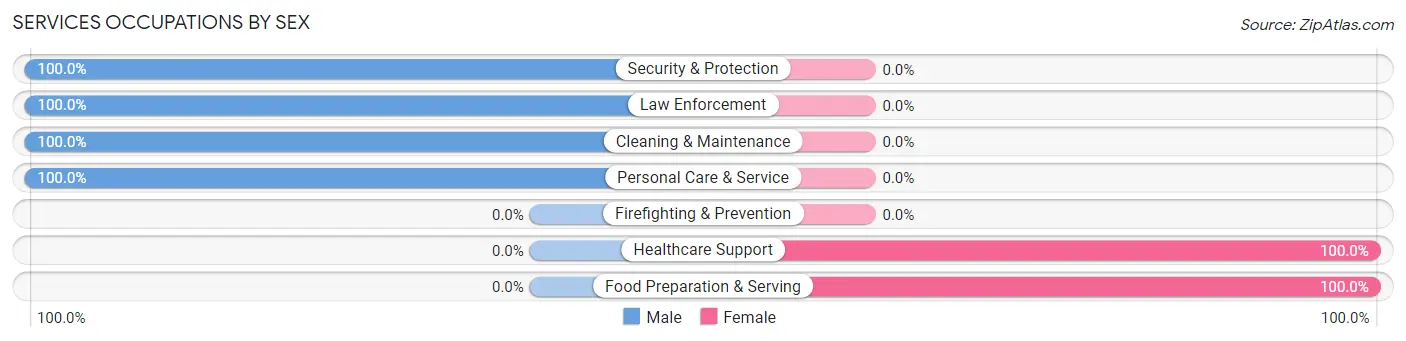
| Occupation | Male | Female |
| Healthcare Support | 0 (0.0%) | 9 (100.0%) |
| Security & Protection | 2 (100.0%) | 0 (0.0%) |
| Firefighting & Prevention | 0 (0.0%) | 0 (0.0%) |
| Law Enforcement | 2 (100.0%) | 0 (0.0%) |
| Food Preparation & Serving | 0 (0.0%) | 8 (100.0%) |
| Cleaning & Maintenance | 6 (100.0%) | 0 (0.0%) |
| Personal Care & Service | 4 (100.0%) | 0 (0.0%) |
| Total (Category) | 12 (41.4%) | 17 (58.6%) |
| Total (Overall) | 48 (36.9%) | 82 (63.1%) |
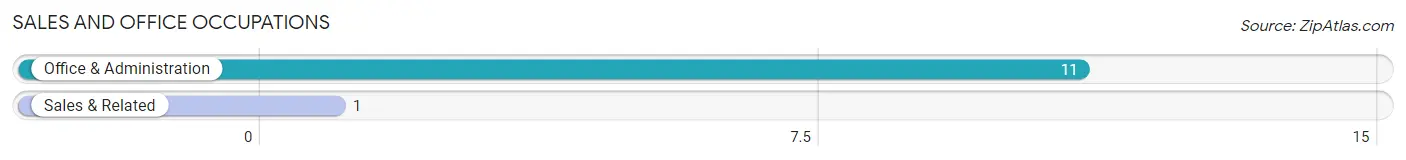
Sales and Office Occupations
The most common Sales and Office occupations in Emmett are Office & Administration (11 | 8.5%), and Sales & Related (1 | 0.8%).
Sales and Office Occupations by Sex
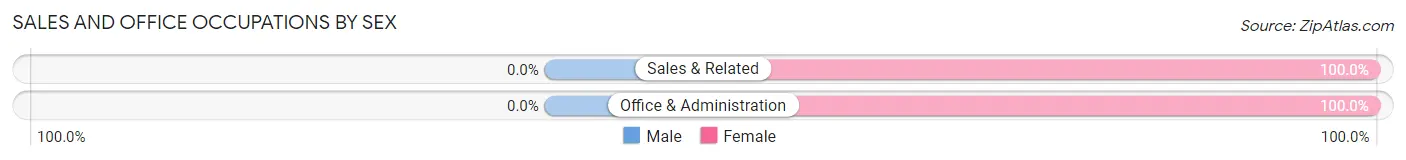
| Occupation | Male | Female |
| Sales & Related | 0 (0.0%) | 1 (100.0%) |
| Office & Administration | 0 (0.0%) | 11 (100.0%) |
| Total (Category) | 0 (0.0%) | 12 (100.0%) |
| Total (Overall) | 48 (36.9%) | 82 (63.1%) |
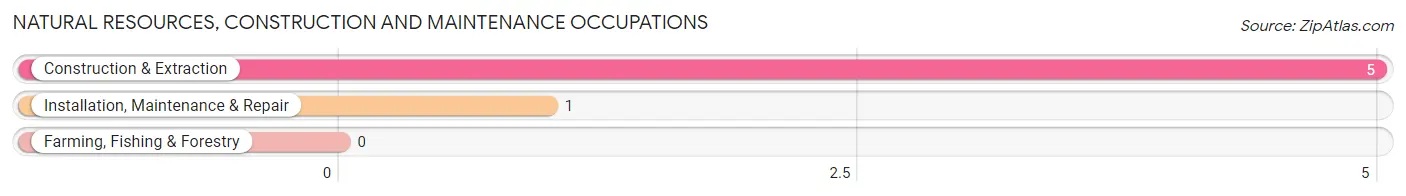
Natural Resources, Construction and Maintenance Occupations
The most common Natural Resources, Construction and Maintenance occupations in Emmett are Construction & Extraction (5 | 3.8%), and Installation, Maintenance & Repair (1 | 0.8%).
Natural Resources, Construction and Maintenance Occupations by Sex
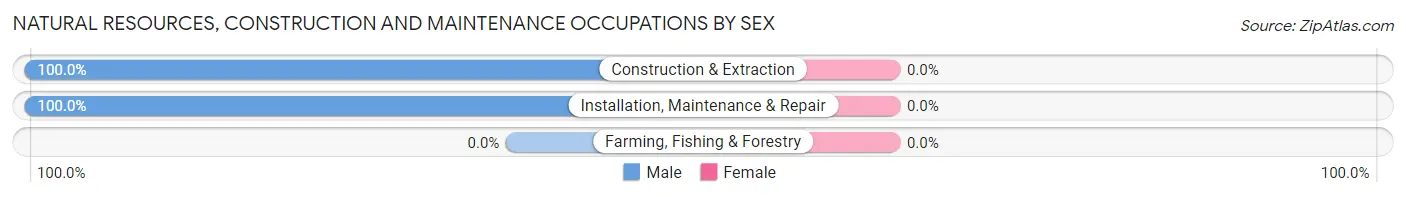
| Occupation | Male | Female |
| Farming, Fishing & Forestry | 0 (0.0%) | 0 (0.0%) |
| Construction & Extraction | 5 (100.0%) | 0 (0.0%) |
| Installation, Maintenance & Repair | 1 (100.0%) | 0 (0.0%) |
| Total (Category) | 6 (100.0%) | 0 (0.0%) |
| Total (Overall) | 48 (36.9%) | 82 (63.1%) |
Production, Transportation and Moving Occupations
The most common Production, Transportation and Moving occupations in Emmett are Material Moving (11 | 8.5%), Transportation (8 | 6.1%), and Production (5 | 3.8%).
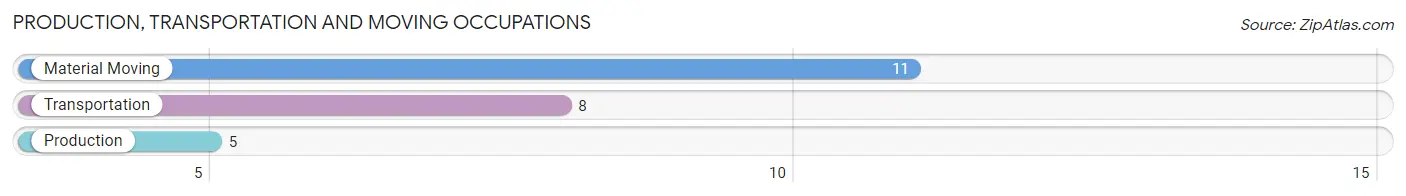
Production, Transportation and Moving Occupations by Sex
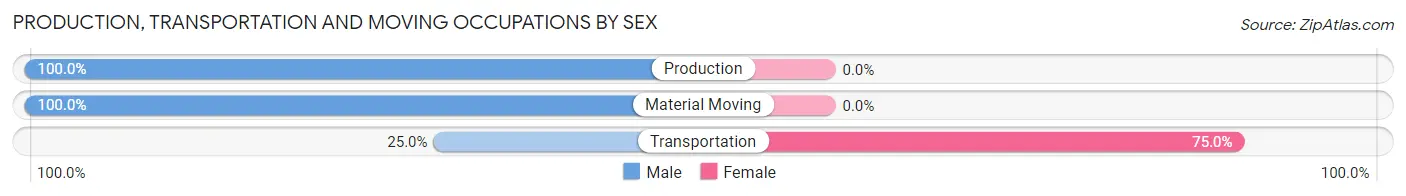
| Occupation | Male | Female |
| Production | 5 (100.0%) | 0 (0.0%) |
| Transportation | 2 (25.0%) | 6 (75.0%) |
| Material Moving | 11 (100.0%) | 0 (0.0%) |
| Total (Category) | 18 (75.0%) | 6 (25.0%) |
| Total (Overall) | 48 (36.9%) | 82 (63.1%) |
Employment Industries by Sex in Emmett
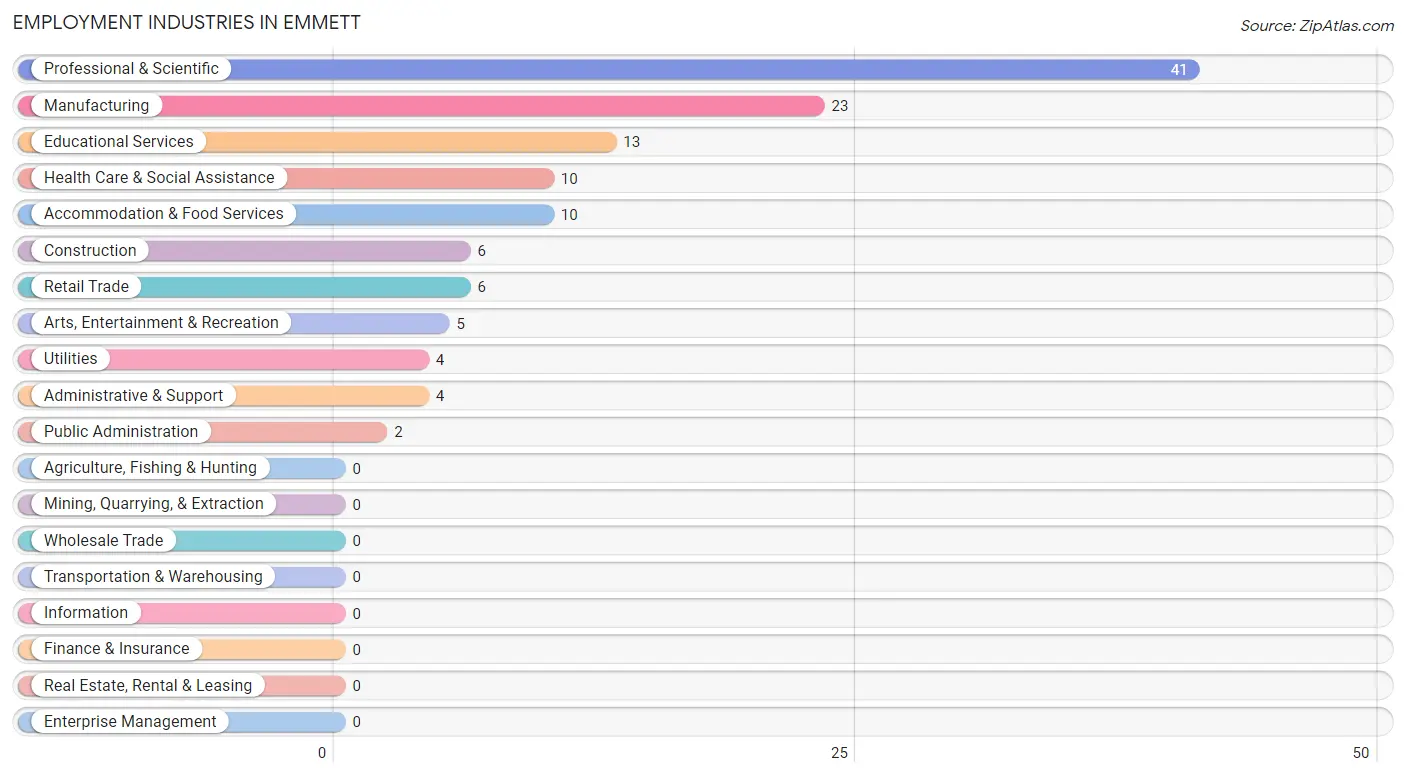
Employment Industries in Emmett
The major employment industries in Emmett include Professional & Scientific (41 | 31.5%), Manufacturing (23 | 17.7%), Educational Services (13 | 10.0%), Health Care & Social Assistance (10 | 7.7%), and Accommodation & Food Services (10 | 7.7%).
Employment Industries by Sex in Emmett
The Emmett industries that see more men than women are Arts, Entertainment & Recreation (100.0%), Public Administration (100.0%), and Construction (83.3%), whereas the industries that tend to have a higher number of women are Professional & Scientific (100.0%), Health Care & Social Assistance (90.0%), and Accommodation & Food Services (80.0%).
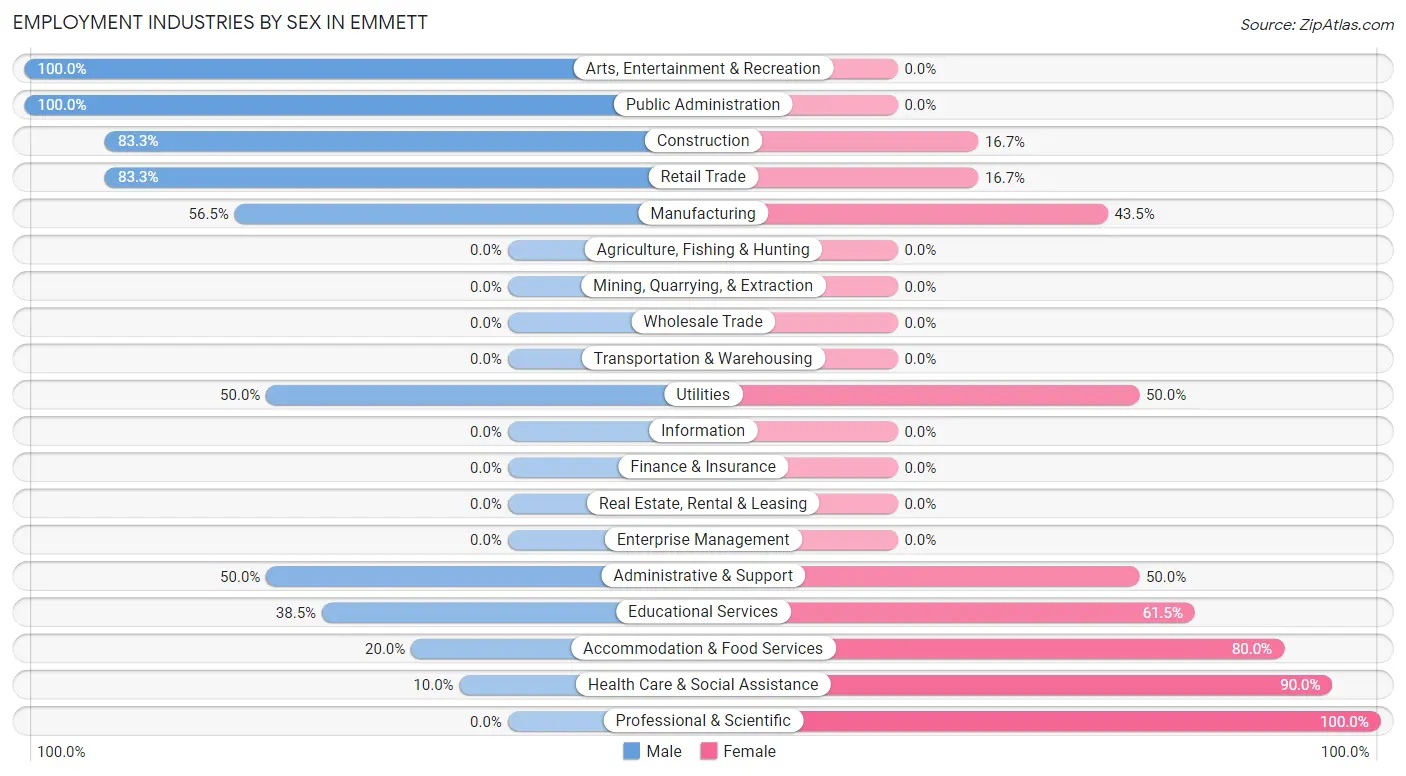
| Industry | Male | Female |
| Agriculture, Fishing & Hunting | 0 (0.0%) | 0 (0.0%) |
| Mining, Quarrying, & Extraction | 0 (0.0%) | 0 (0.0%) |
| Construction | 5 (83.3%) | 1 (16.7%) |
| Manufacturing | 13 (56.5%) | 10 (43.5%) |
| Wholesale Trade | 0 (0.0%) | 0 (0.0%) |
| Retail Trade | 5 (83.3%) | 1 (16.7%) |
| Transportation & Warehousing | 0 (0.0%) | 0 (0.0%) |
| Utilities | 2 (50.0%) | 2 (50.0%) |
| Information | 0 (0.0%) | 0 (0.0%) |
| Finance & Insurance | 0 (0.0%) | 0 (0.0%) |
| Real Estate, Rental & Leasing | 0 (0.0%) | 0 (0.0%) |
| Professional & Scientific | 0 (0.0%) | 41 (100.0%) |
| Enterprise Management | 0 (0.0%) | 0 (0.0%) |
| Administrative & Support | 2 (50.0%) | 2 (50.0%) |
| Educational Services | 5 (38.5%) | 8 (61.5%) |
| Health Care & Social Assistance | 1 (10.0%) | 9 (90.0%) |
| Arts, Entertainment & Recreation | 5 (100.0%) | 0 (0.0%) |
| Accommodation & Food Services | 2 (20.0%) | 8 (80.0%) |
| Public Administration | 2 (100.0%) | 0 (0.0%) |
| Total | 48 (36.9%) | 82 (63.1%) |
Education in Emmett
School Enrollment in Emmett
The most common levels of schooling among the 34 students in Emmett are high school (11 | 32.4%), nursery / preschool (8 | 23.5%), and elementary school (6 | 17.6%).
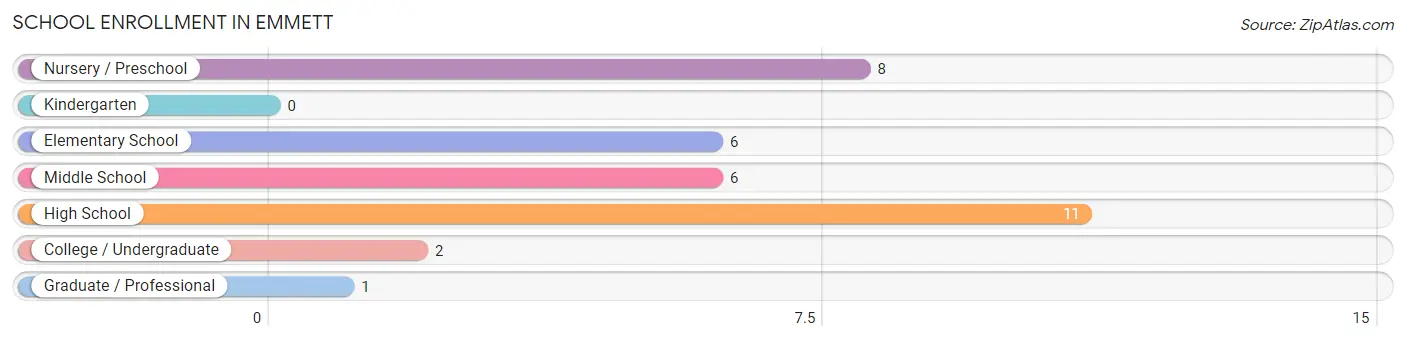
| School Level | # Students | % Students |
| Nursery / Preschool | 8 | 23.5% |
| Kindergarten | 0 | 0.0% |
| Elementary School | 6 | 17.6% |
| Middle School | 6 | 17.6% |
| High School | 11 | 32.4% |
| College / Undergraduate | 2 | 5.9% |
| Graduate / Professional | 1 | 2.9% |
| Total | 34 | 100.0% |
School Enrollment by Age by Funding Source in Emmett
Out of a total of 34 students who are enrolled in schools in Emmett, 1 (2.9%) attend a private institution, while the remaining 33 (97.1%) are enrolled in public schools. The age group of 25 to 34 year olds has the highest likelihood of being enrolled in private schools, with 1 (14.3% in the age bracket) enrolled. Conversely, the age group of 3 to 4 year olds has the lowest likelihood of being enrolled in a private school, with 8 (100.0% in the age bracket) attending a public institution.
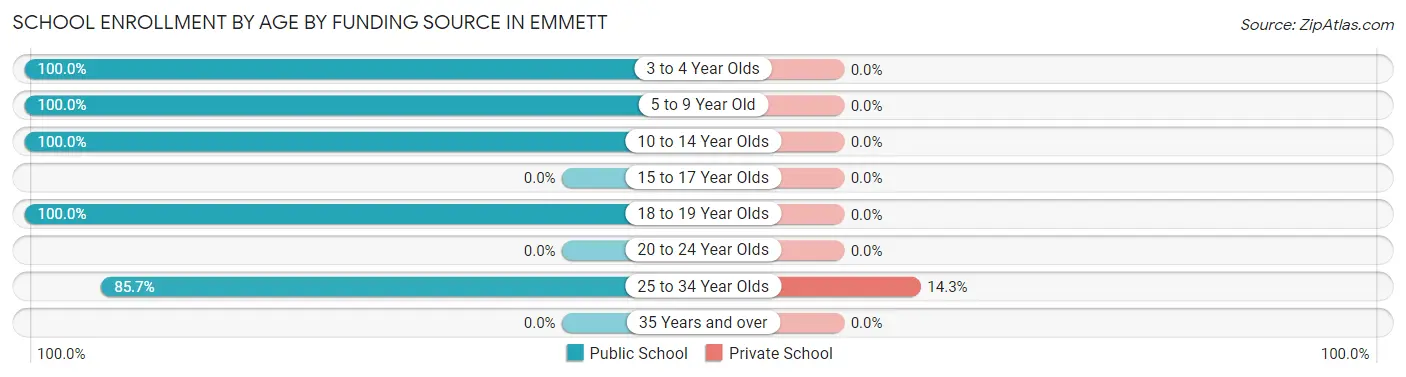
| Age Bracket | Public School | Private School |
| 3 to 4 Year Olds | 8 (100.0%) | 0 (0.0%) |
| 5 to 9 Year Old | 6 (100.0%) | 0 (0.0%) |
| 10 to 14 Year Olds | 8 (100.0%) | 0 (0.0%) |
| 15 to 17 Year Olds | 0 (0.0%) | 0 (0.0%) |
| 18 to 19 Year Olds | 5 (100.0%) | 0 (0.0%) |
| 20 to 24 Year Olds | 0 (0.0%) | 0 (0.0%) |
| 25 to 34 Year Olds | 6 (85.7%) | 1 (14.3%) |
| 35 Years and over | 0 (0.0%) | 0 (0.0%) |
| Total | 33 (97.1%) | 1 (2.9%) |
Educational Attainment by Field of Study in Emmett
Science & technology (5 | 29.4%), business (4 | 23.5%), arts & humanities (4 | 23.5%), computers & mathematics (2 | 11.8%), and education (2 | 11.8%) are the most common fields of study among 17 individuals in Emmett who have obtained a bachelor's degree or higher.
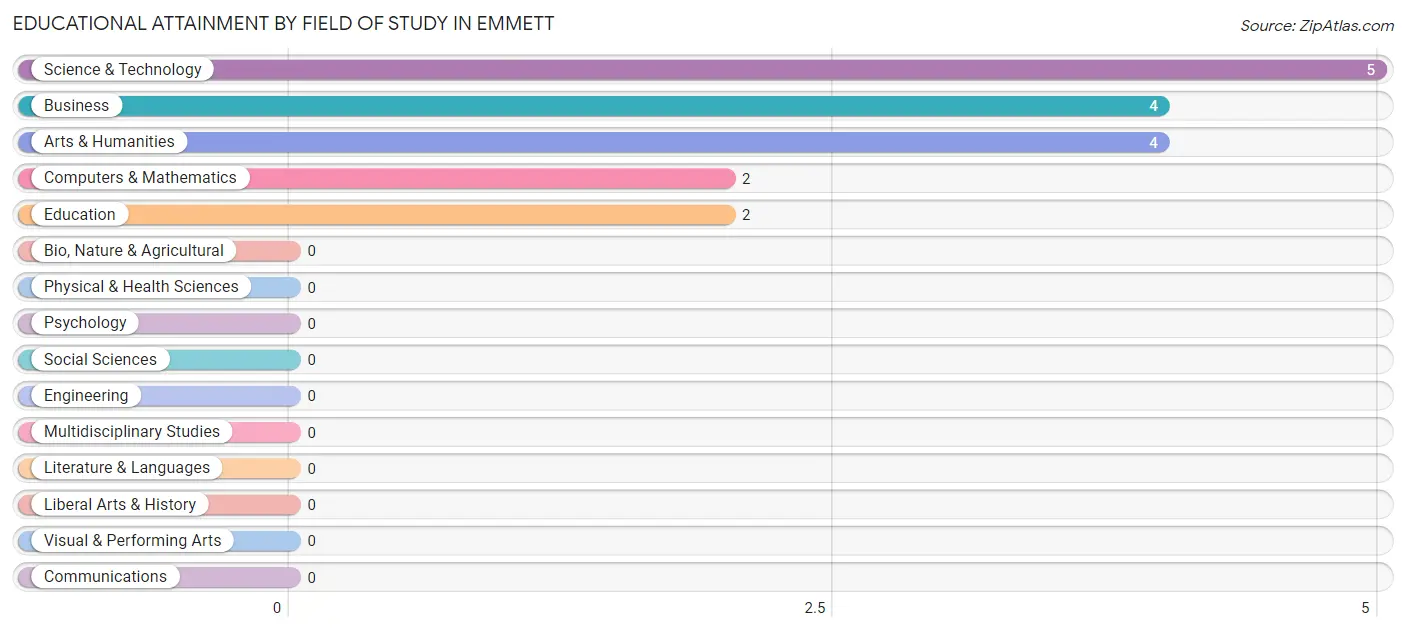
| Field of Study | # Graduates | % Graduates |
| Computers & Mathematics | 2 | 11.8% |
| Bio, Nature & Agricultural | 0 | 0.0% |
| Physical & Health Sciences | 0 | 0.0% |
| Psychology | 0 | 0.0% |
| Social Sciences | 0 | 0.0% |
| Engineering | 0 | 0.0% |
| Multidisciplinary Studies | 0 | 0.0% |
| Science & Technology | 5 | 29.4% |
| Business | 4 | 23.5% |
| Education | 2 | 11.8% |
| Literature & Languages | 0 | 0.0% |
| Liberal Arts & History | 0 | 0.0% |
| Visual & Performing Arts | 0 | 0.0% |
| Communications | 0 | 0.0% |
| Arts & Humanities | 4 | 23.5% |
| Total | 17 | 100.0% |
Transportation & Commute in Emmett
Vehicle Availability by Sex in Emmett
The most prevalent vehicle ownership categories in Emmett are males with 3 vehicles (14, accounting for 29.2%) and females with 3 vehicles (4, making up 17.1%).
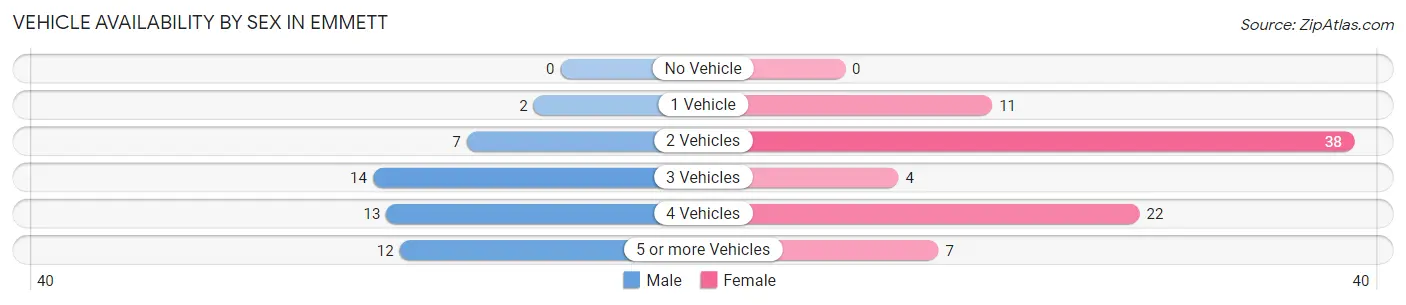
| Vehicles Available | Male | Female |
| No Vehicle | 0 (0.0%) | 0 (0.0%) |
| 1 Vehicle | 2 (4.2%) | 11 (13.4%) |
| 2 Vehicles | 7 (14.6%) | 38 (46.3%) |
| 3 Vehicles | 14 (29.2%) | 4 (4.9%) |
| 4 Vehicles | 13 (27.1%) | 22 (26.8%) |
| 5 or more Vehicles | 12 (25.0%) | 7 (8.5%) |
| Total | 48 (100.0%) | 82 (100.0%) |
Commute Time in Emmett
The most frequently occuring commute durations in Emmett are 40 to 44 minutes (38 commuters, 31.4%), 30 to 34 minutes (31 commuters, 25.6%), and 20 to 24 minutes (12 commuters, 9.9%).
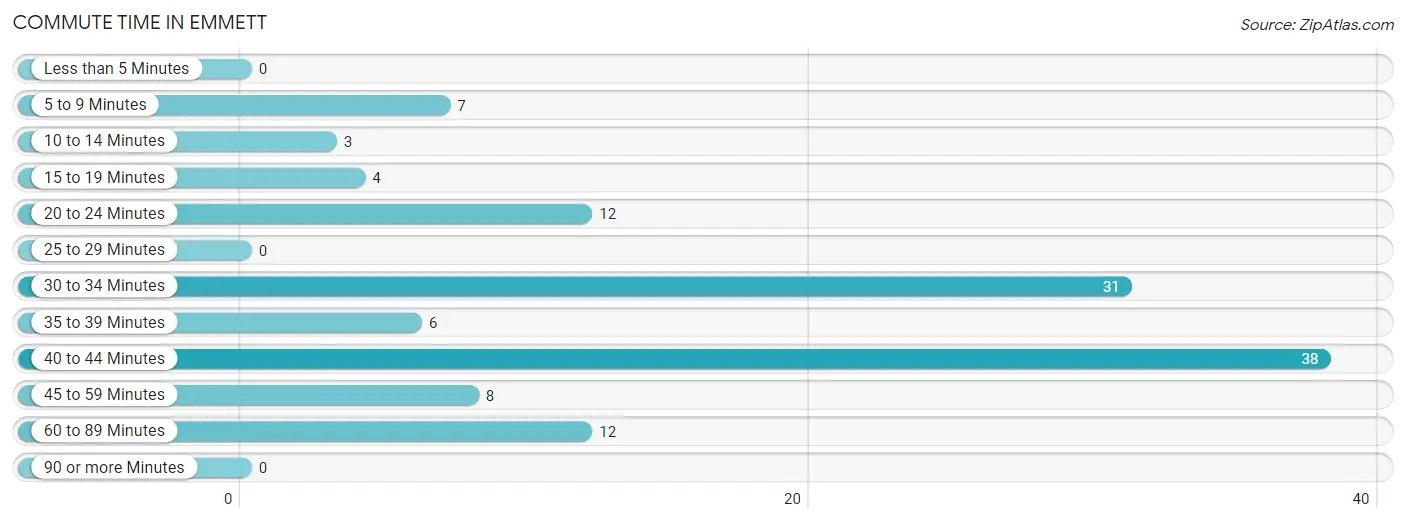
| Commute Time | # Commuters | % Commuters |
| Less than 5 Minutes | 0 | 0.0% |
| 5 to 9 Minutes | 7 | 5.8% |
| 10 to 14 Minutes | 3 | 2.5% |
| 15 to 19 Minutes | 4 | 3.3% |
| 20 to 24 Minutes | 12 | 9.9% |
| 25 to 29 Minutes | 0 | 0.0% |
| 30 to 34 Minutes | 31 | 25.6% |
| 35 to 39 Minutes | 6 | 5.0% |
| 40 to 44 Minutes | 38 | 31.4% |
| 45 to 59 Minutes | 8 | 6.6% |
| 60 to 89 Minutes | 12 | 9.9% |
| 90 or more Minutes | 0 | 0.0% |
Commute Time by Sex in Emmett
The most common commute times in Emmett are 30 to 34 minutes (15 commuters, 32.6%) for males and 40 to 44 minutes (38 commuters, 50.7%) for females.
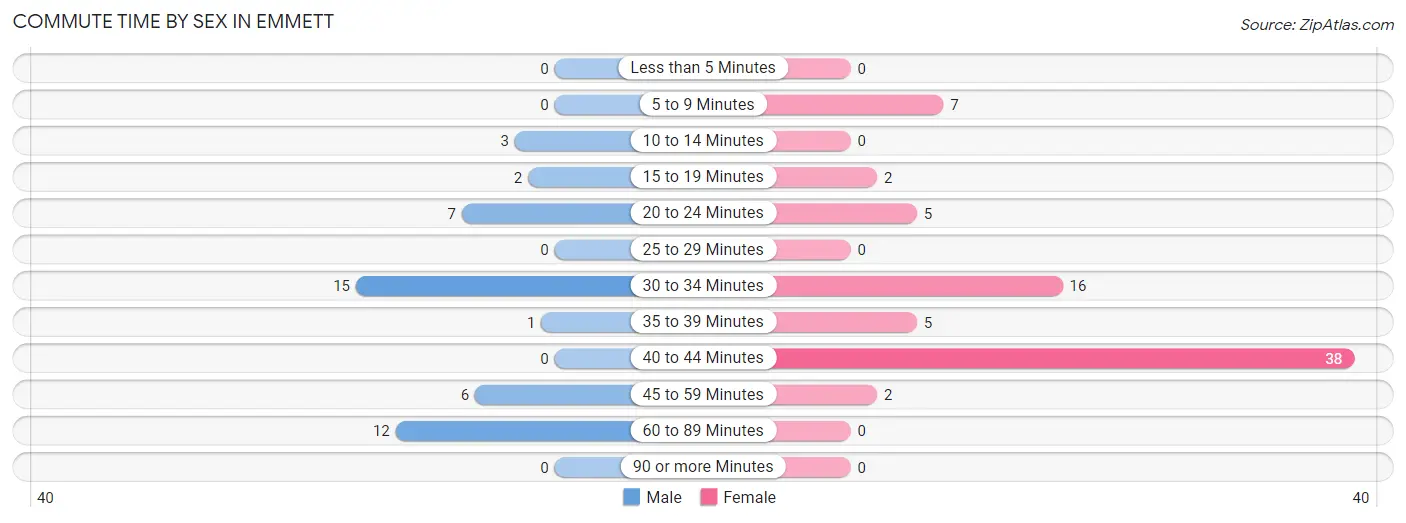
| Commute Time | Male | Female |
| Less than 5 Minutes | 0 (0.0%) | 0 (0.0%) |
| 5 to 9 Minutes | 0 (0.0%) | 7 (9.3%) |
| 10 to 14 Minutes | 3 (6.5%) | 0 (0.0%) |
| 15 to 19 Minutes | 2 (4.3%) | 2 (2.7%) |
| 20 to 24 Minutes | 7 (15.2%) | 5 (6.7%) |
| 25 to 29 Minutes | 0 (0.0%) | 0 (0.0%) |
| 30 to 34 Minutes | 15 (32.6%) | 16 (21.3%) |
| 35 to 39 Minutes | 1 (2.2%) | 5 (6.7%) |
| 40 to 44 Minutes | 0 (0.0%) | 38 (50.7%) |
| 45 to 59 Minutes | 6 (13.0%) | 2 (2.7%) |
| 60 to 89 Minutes | 12 (26.1%) | 0 (0.0%) |
| 90 or more Minutes | 0 (0.0%) | 0 (0.0%) |
Time of Departure to Work by Sex in Emmett
The most frequent times of departure to work in Emmett are 7:00 AM to 7:29 AM (14, 30.4%) for males and 5:00 AM to 5:29 AM (38, 50.7%) for females.
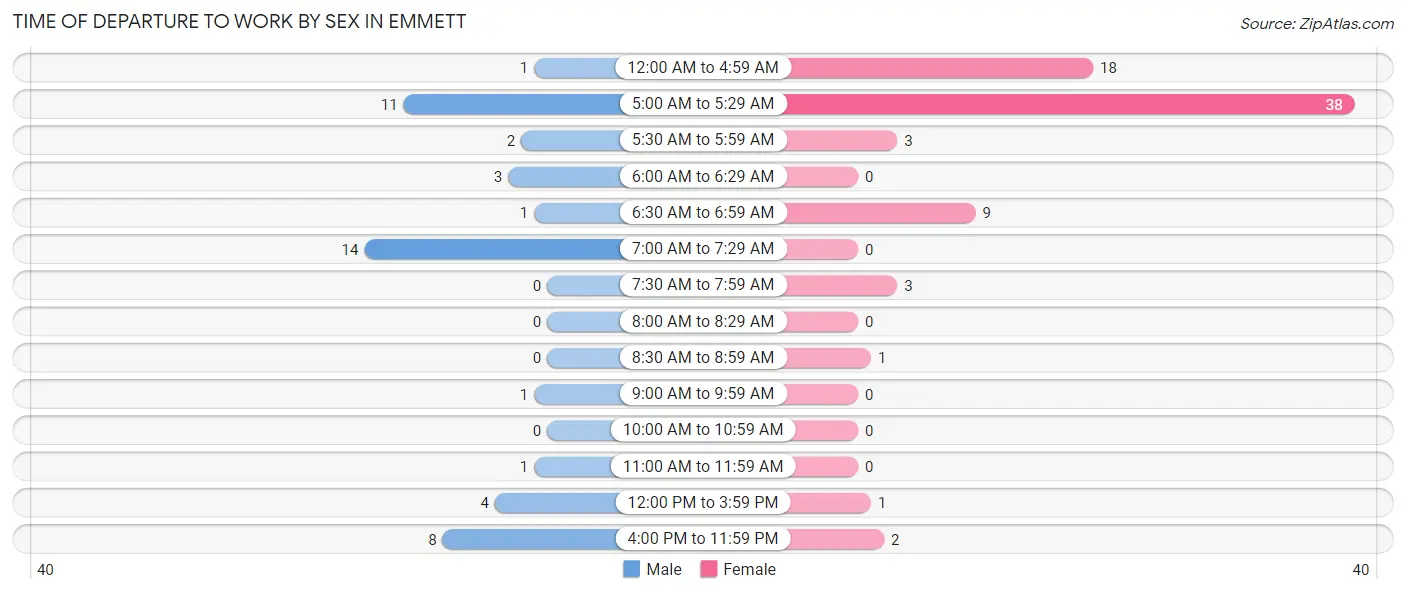
| Time of Departure | Male | Female |
| 12:00 AM to 4:59 AM | 1 (2.2%) | 18 (24.0%) |
| 5:00 AM to 5:29 AM | 11 (23.9%) | 38 (50.7%) |
| 5:30 AM to 5:59 AM | 2 (4.3%) | 3 (4.0%) |
| 6:00 AM to 6:29 AM | 3 (6.5%) | 0 (0.0%) |
| 6:30 AM to 6:59 AM | 1 (2.2%) | 9 (12.0%) |
| 7:00 AM to 7:29 AM | 14 (30.4%) | 0 (0.0%) |
| 7:30 AM to 7:59 AM | 0 (0.0%) | 3 (4.0%) |
| 8:00 AM to 8:29 AM | 0 (0.0%) | 0 (0.0%) |
| 8:30 AM to 8:59 AM | 0 (0.0%) | 1 (1.3%) |
| 9:00 AM to 9:59 AM | 1 (2.2%) | 0 (0.0%) |
| 10:00 AM to 10:59 AM | 0 (0.0%) | 0 (0.0%) |
| 11:00 AM to 11:59 AM | 1 (2.2%) | 0 (0.0%) |
| 12:00 PM to 3:59 PM | 4 (8.7%) | 1 (1.3%) |
| 4:00 PM to 11:59 PM | 8 (17.4%) | 2 (2.7%) |
| Total | 46 (100.0%) | 75 (100.0%) |
Housing Occupancy in Emmett
Occupancy by Ownership in Emmett
Of the total 104 dwellings in Emmett, owner-occupied units account for 96 (92.3%), while renter-occupied units make up 8 (7.7%).
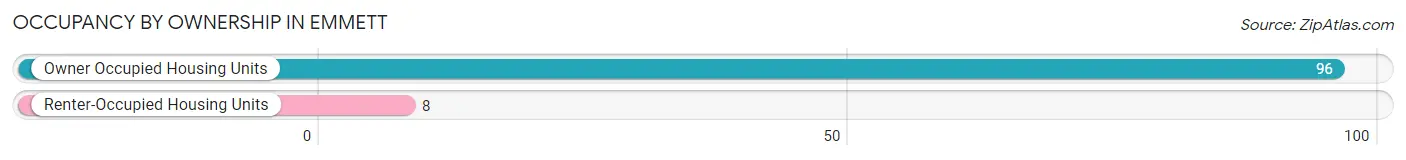
| Occupancy | # Housing Units | % Housing Units |
| Owner Occupied Housing Units | 96 | 92.3% |
| Renter-Occupied Housing Units | 8 | 7.7% |
| Total Occupied Housing Units | 104 | 100.0% |
Occupancy by Household Size in Emmett
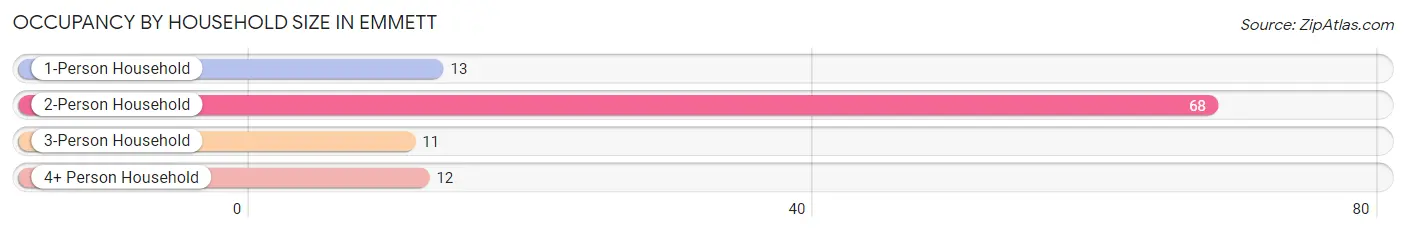
| Household Size | # Housing Units | % Housing Units |
| 1-Person Household | 13 | 12.5% |
| 2-Person Household | 68 | 65.4% |
| 3-Person Household | 11 | 10.6% |
| 4+ Person Household | 12 | 11.5% |
| Total Housing Units | 104 | 100.0% |
Occupancy by Ownership by Household Size in Emmett
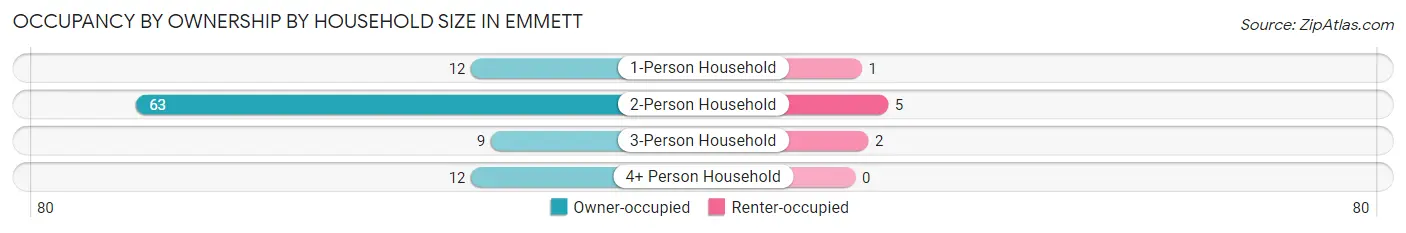
| Household Size | Owner-occupied | Renter-occupied |
| 1-Person Household | 12 (92.3%) | 1 (7.7%) |
| 2-Person Household | 63 (92.6%) | 5 (7.3%) |
| 3-Person Household | 9 (81.8%) | 2 (18.2%) |
| 4+ Person Household | 12 (100.0%) | 0 (0.0%) |
| Total Housing Units | 96 (92.3%) | 8 (7.7%) |
Occupancy by Educational Attainment in Emmett
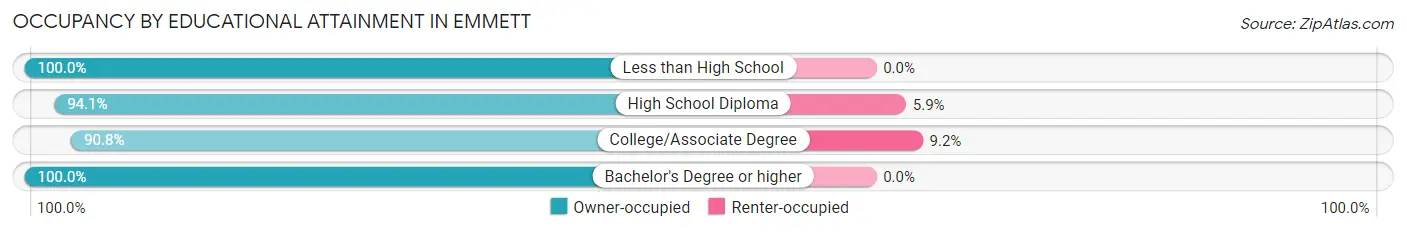
| Household Size | Owner-occupied | Renter-occupied |
| Less than High School | 1 (100.0%) | 0 (0.0%) |
| High School Diploma | 16 (94.1%) | 1 (5.9%) |
| College/Associate Degree | 69 (90.8%) | 7 (9.2%) |
| Bachelor's Degree or higher | 10 (100.0%) | 0 (0.0%) |
Occupancy by Age of Householder in Emmett
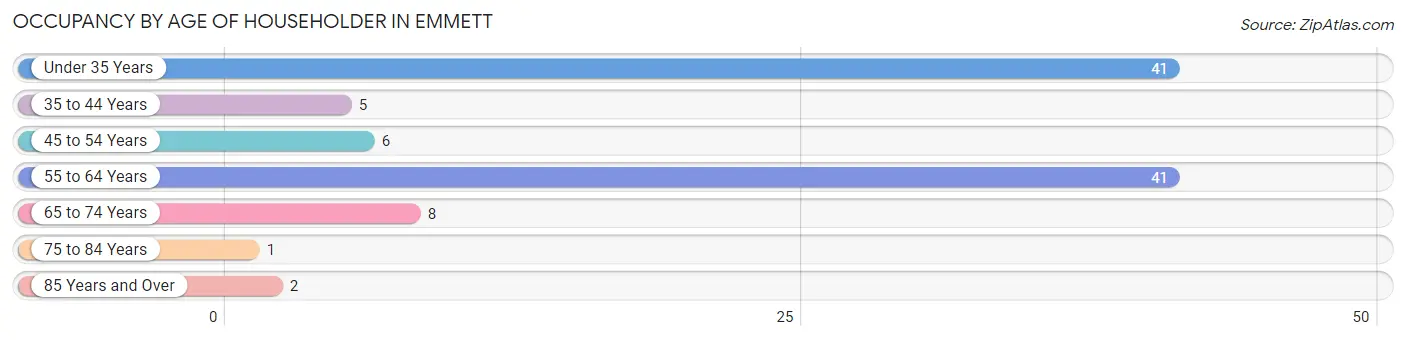
| Age Bracket | # Households | % Households |
| Under 35 Years | 41 | 39.4% |
| 35 to 44 Years | 5 | 4.8% |
| 45 to 54 Years | 6 | 5.8% |
| 55 to 64 Years | 41 | 39.4% |
| 65 to 74 Years | 8 | 7.7% |
| 75 to 84 Years | 1 | 1.0% |
| 85 Years and Over | 2 | 1.9% |
| Total | 104 | 100.0% |
Housing Finances in Emmett
Median Income by Occupancy in Emmett
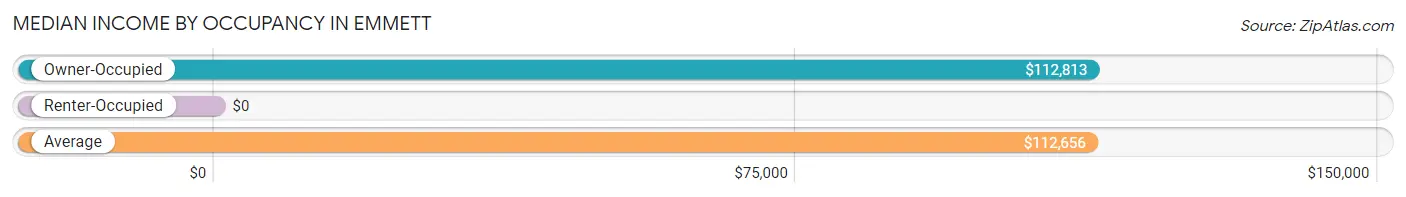
| Occupancy Type | # Households | Median Income |
| Owner-Occupied | 96 (92.3%) | $112,813 |
| Renter-Occupied | 8 (7.7%) | $0 |
| Average | 104 (100.0%) | $112,656 |
Occupancy by Householder Income Bracket in Emmett
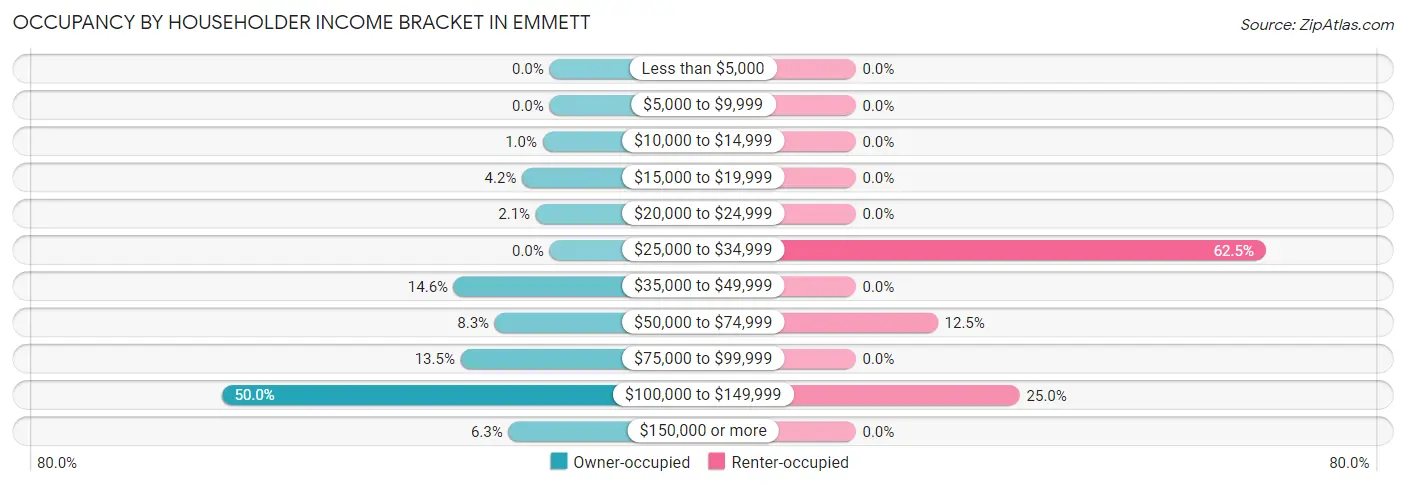
| Income Bracket | Owner-occupied | Renter-occupied |
| Less than $5,000 | 0 (0.0%) | 0 (0.0%) |
| $5,000 to $9,999 | 0 (0.0%) | 0 (0.0%) |
| $10,000 to $14,999 | 1 (1.0%) | 0 (0.0%) |
| $15,000 to $19,999 | 4 (4.2%) | 0 (0.0%) |
| $20,000 to $24,999 | 2 (2.1%) | 0 (0.0%) |
| $25,000 to $34,999 | 0 (0.0%) | 5 (62.5%) |
| $35,000 to $49,999 | 14 (14.6%) | 0 (0.0%) |
| $50,000 to $74,999 | 8 (8.3%) | 1 (12.5%) |
| $75,000 to $99,999 | 13 (13.5%) | 0 (0.0%) |
| $100,000 to $149,999 | 48 (50.0%) | 2 (25.0%) |
| $150,000 or more | 6 (6.2%) | 0 (0.0%) |
| Total | 96 (100.0%) | 8 (100.0%) |
Monthly Housing Cost Tiers in Emmett
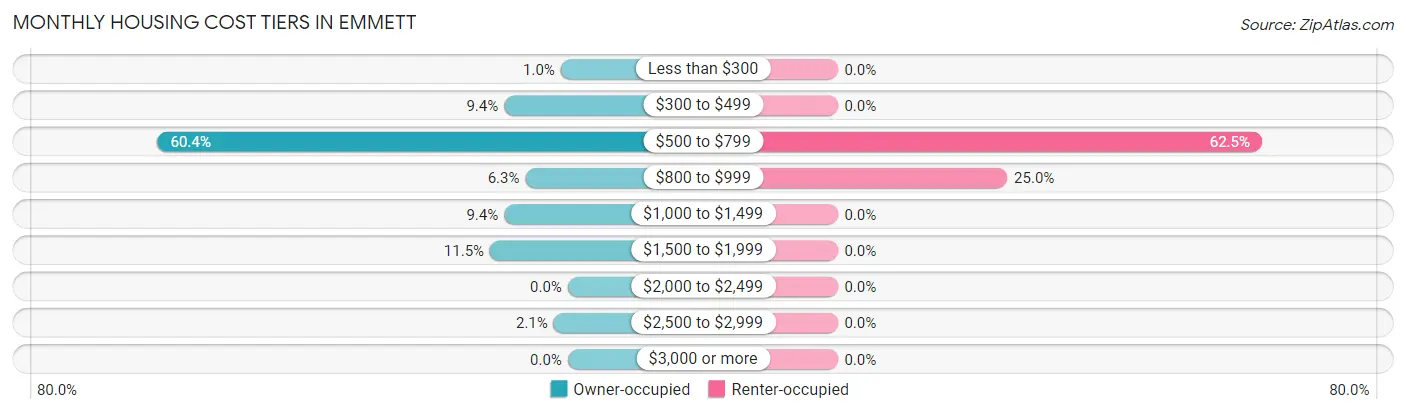
| Monthly Cost | Owner-occupied | Renter-occupied |
| Less than $300 | 1 (1.0%) | 0 (0.0%) |
| $300 to $499 | 9 (9.4%) | 0 (0.0%) |
| $500 to $799 | 58 (60.4%) | 5 (62.5%) |
| $800 to $999 | 6 (6.2%) | 2 (25.0%) |
| $1,000 to $1,499 | 9 (9.4%) | 0 (0.0%) |
| $1,500 to $1,999 | 11 (11.5%) | 0 (0.0%) |
| $2,000 to $2,499 | 0 (0.0%) | 0 (0.0%) |
| $2,500 to $2,999 | 2 (2.1%) | 0 (0.0%) |
| $3,000 or more | 0 (0.0%) | 0 (0.0%) |
| Total | 96 (100.0%) | 8 (100.0%) |
Physical Housing Characteristics in Emmett
Housing Structures in Emmett
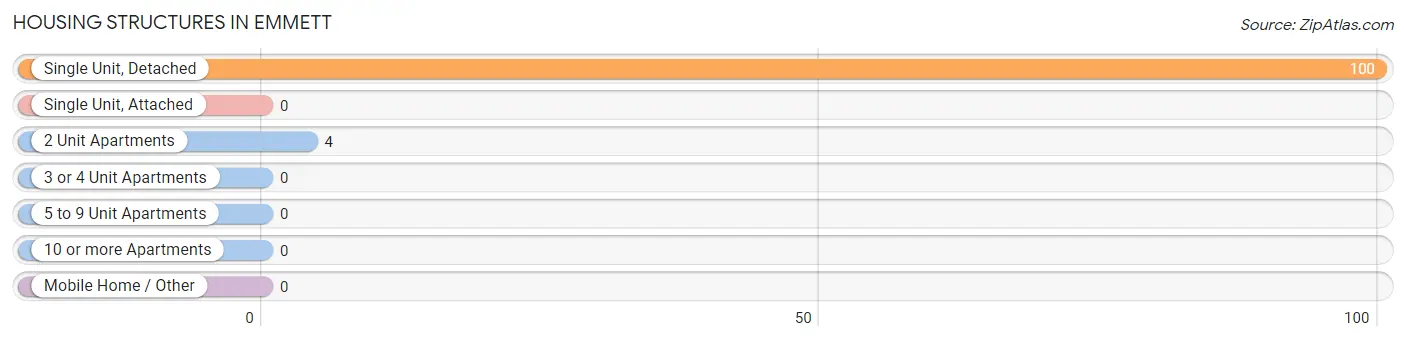
| Structure Type | # Housing Units | % Housing Units |
| Single Unit, Detached | 100 | 96.2% |
| Single Unit, Attached | 0 | 0.0% |
| 2 Unit Apartments | 4 | 3.8% |
| 3 or 4 Unit Apartments | 0 | 0.0% |
| 5 to 9 Unit Apartments | 0 | 0.0% |
| 10 or more Apartments | 0 | 0.0% |
| Mobile Home / Other | 0 | 0.0% |
| Total | 104 | 100.0% |
Housing Structures by Occupancy in Emmett
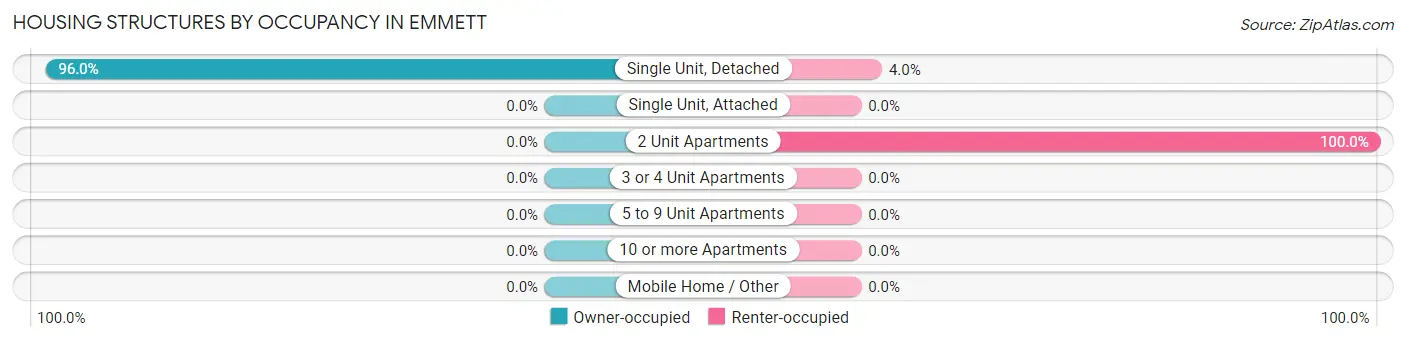
| Structure Type | Owner-occupied | Renter-occupied |
| Single Unit, Detached | 96 (96.0%) | 4 (4.0%) |
| Single Unit, Attached | 0 (0.0%) | 0 (0.0%) |
| 2 Unit Apartments | 0 (0.0%) | 4 (100.0%) |
| 3 or 4 Unit Apartments | 0 (0.0%) | 0 (0.0%) |
| 5 to 9 Unit Apartments | 0 (0.0%) | 0 (0.0%) |
| 10 or more Apartments | 0 (0.0%) | 0 (0.0%) |
| Mobile Home / Other | 0 (0.0%) | 0 (0.0%) |
| Total | 96 (92.3%) | 8 (7.7%) |
Housing Structures by Number of Rooms in Emmett
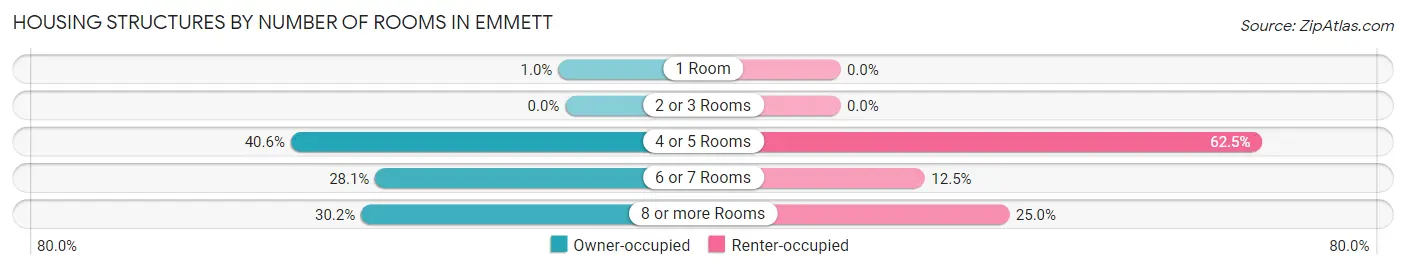
| Number of Rooms | Owner-occupied | Renter-occupied |
| 1 Room | 1 (1.0%) | 0 (0.0%) |
| 2 or 3 Rooms | 0 (0.0%) | 0 (0.0%) |
| 4 or 5 Rooms | 39 (40.6%) | 5 (62.5%) |
| 6 or 7 Rooms | 27 (28.1%) | 1 (12.5%) |
| 8 or more Rooms | 29 (30.2%) | 2 (25.0%) |
| Total | 96 (100.0%) | 8 (100.0%) |
Housing Structure by Heating Type in Emmett
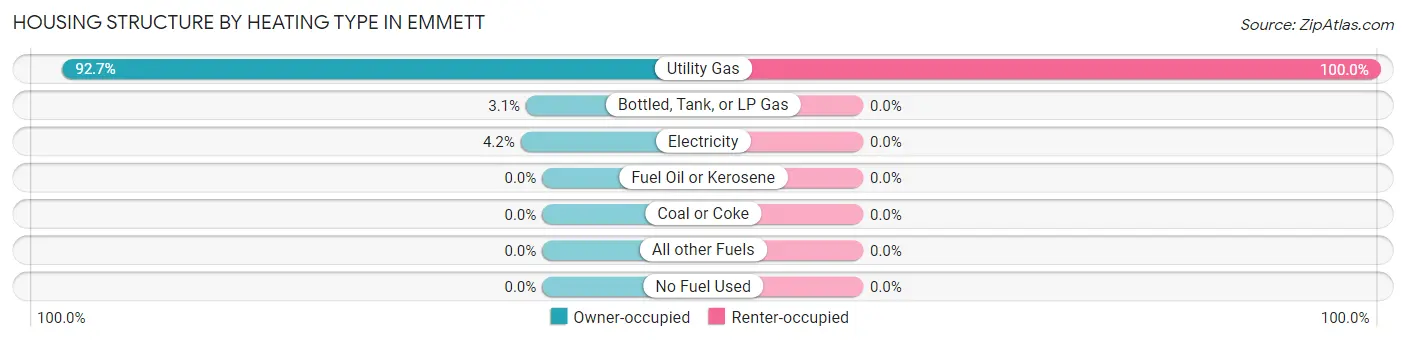
| Heating Type | Owner-occupied | Renter-occupied |
| Utility Gas | 89 (92.7%) | 8 (100.0%) |
| Bottled, Tank, or LP Gas | 3 (3.1%) | 0 (0.0%) |
| Electricity | 4 (4.2%) | 0 (0.0%) |
| Fuel Oil or Kerosene | 0 (0.0%) | 0 (0.0%) |
| Coal or Coke | 0 (0.0%) | 0 (0.0%) |
| All other Fuels | 0 (0.0%) | 0 (0.0%) |
| No Fuel Used | 0 (0.0%) | 0 (0.0%) |
| Total | 96 (100.0%) | 8 (100.0%) |
Household Vehicle Usage in Emmett
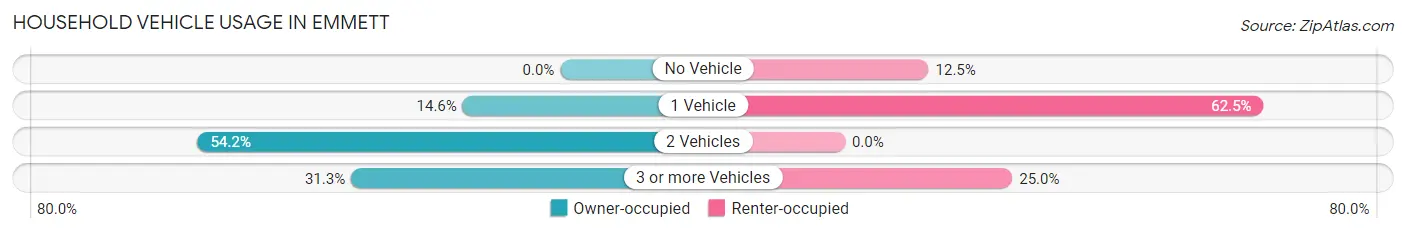
| Vehicles per Household | Owner-occupied | Renter-occupied |
| No Vehicle | 0 (0.0%) | 1 (12.5%) |
| 1 Vehicle | 14 (14.6%) | 5 (62.5%) |
| 2 Vehicles | 52 (54.2%) | 0 (0.0%) |
| 3 or more Vehicles | 30 (31.2%) | 2 (25.0%) |
| Total | 96 (100.0%) | 8 (100.0%) |
Real Estate & Mortgages in Emmett
Real Estate and Mortgage Overview in Emmett
| Characteristic | Without Mortgage | With Mortgage |
| Housing Units | 33 | 63 |
| Median Property Value | $229,500 | $117,300 |
| Median Household Income | $82,708 | $6 |
| Monthly Housing Costs | $612 | $0 |
| Real Estate Taxes | $2,656 | $32 |
Property Value by Mortgage Status in Emmett
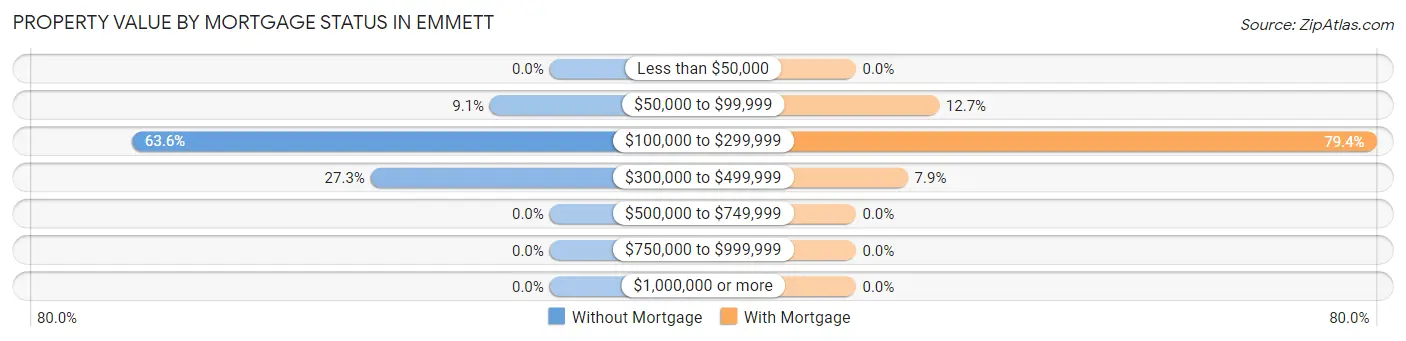
| Property Value | Without Mortgage | With Mortgage |
| Less than $50,000 | 0 (0.0%) | 0 (0.0%) |
| $50,000 to $99,999 | 3 (9.1%) | 8 (12.7%) |
| $100,000 to $299,999 | 21 (63.6%) | 50 (79.4%) |
| $300,000 to $499,999 | 9 (27.3%) | 5 (7.9%) |
| $500,000 to $749,999 | 0 (0.0%) | 0 (0.0%) |
| $750,000 to $999,999 | 0 (0.0%) | 0 (0.0%) |
| $1,000,000 or more | 0 (0.0%) | 0 (0.0%) |
| Total | 33 (100.0%) | 63 (100.0%) |
Household Income by Mortgage Status in Emmett
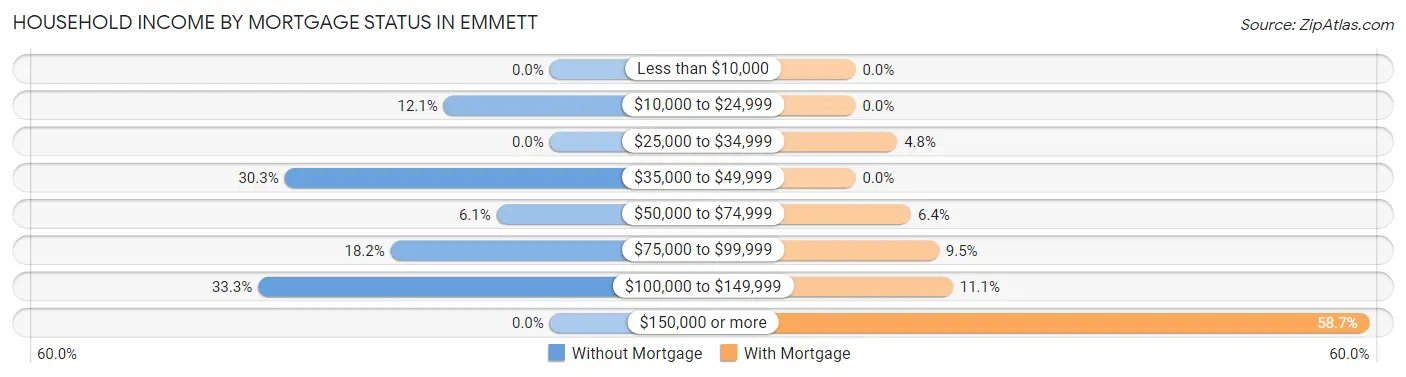
| Household Income | Without Mortgage | With Mortgage |
| Less than $10,000 | 0 (0.0%) | 0 (0.0%) |
| $10,000 to $24,999 | 4 (12.1%) | 0 (0.0%) |
| $25,000 to $34,999 | 0 (0.0%) | 3 (4.8%) |
| $35,000 to $49,999 | 10 (30.3%) | 0 (0.0%) |
| $50,000 to $74,999 | 2 (6.1%) | 4 (6.4%) |
| $75,000 to $99,999 | 6 (18.2%) | 6 (9.5%) |
| $100,000 to $149,999 | 11 (33.3%) | 7 (11.1%) |
| $150,000 or more | 0 (0.0%) | 37 (58.7%) |
| Total | 33 (100.0%) | 63 (100.0%) |
Property Value to Household Income Ratio in Emmett
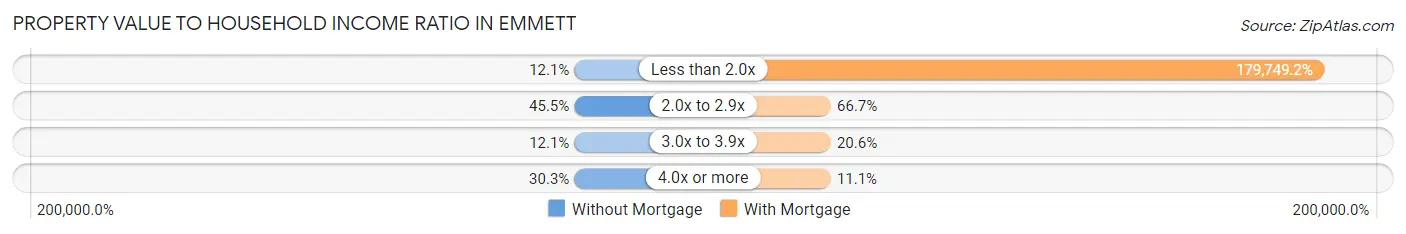
| Value-to-Income Ratio | Without Mortgage | With Mortgage |
| Less than 2.0x | 4 (12.1%) | 113,242 (179,749.2%) |
| 2.0x to 2.9x | 15 (45.5%) | 42 (66.7%) |
| 3.0x to 3.9x | 4 (12.1%) | 13 (20.6%) |
| 4.0x or more | 10 (30.3%) | 7 (11.1%) |
| Total | 33 (100.0%) | 63 (100.0%) |
Real Estate Taxes by Mortgage Status in Emmett
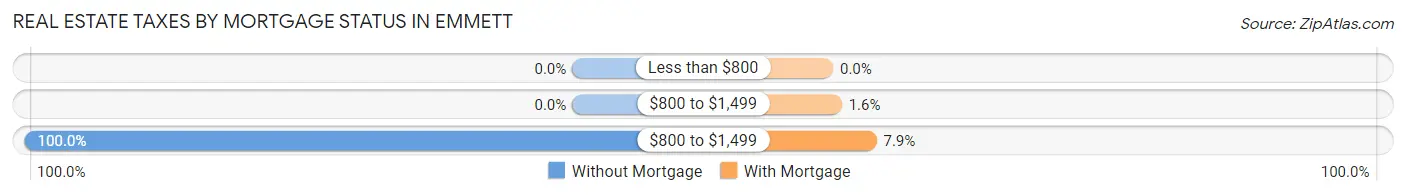
| Property Taxes | Without Mortgage | With Mortgage |
| Less than $800 | 0 (0.0%) | 0 (0.0%) |
| $800 to $1,499 | 0 (0.0%) | 1 (1.6%) |
| $800 to $1,499 | 33 (100.0%) | 5 (7.9%) |
| Total | 33 (100.0%) | 63 (100.0%) |
Health & Disability in Emmett
Health Insurance Coverage by Age in Emmett
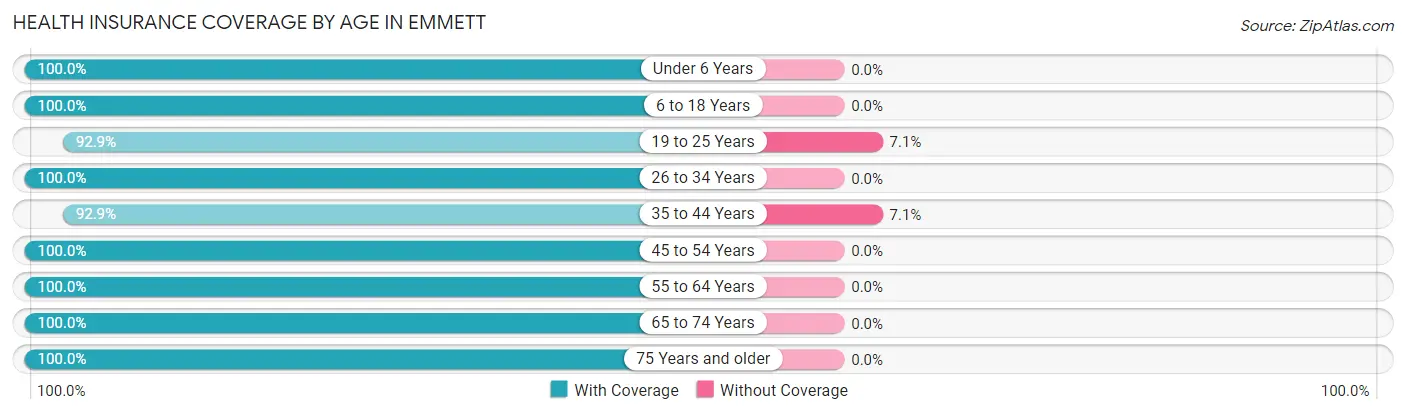
| Age Bracket | With Coverage | Without Coverage |
| Under 6 Years | 15 (100.0%) | 0 (0.0%) |
| 6 to 18 Years | 17 (100.0%) | 0 (0.0%) |
| 19 to 25 Years | 39 (92.9%) | 3 (7.1%) |
| 26 to 34 Years | 58 (100.0%) | 0 (0.0%) |
| 35 to 44 Years | 13 (92.9%) | 1 (7.1%) |
| 45 to 54 Years | 14 (100.0%) | 0 (0.0%) |
| 55 to 64 Years | 70 (100.0%) | 0 (0.0%) |
| 65 to 74 Years | 9 (100.0%) | 0 (0.0%) |
| 75 Years and older | 5 (100.0%) | 0 (0.0%) |
| Total | 240 (98.4%) | 4 (1.6%) |
Health Insurance Coverage by Citizenship Status in Emmett
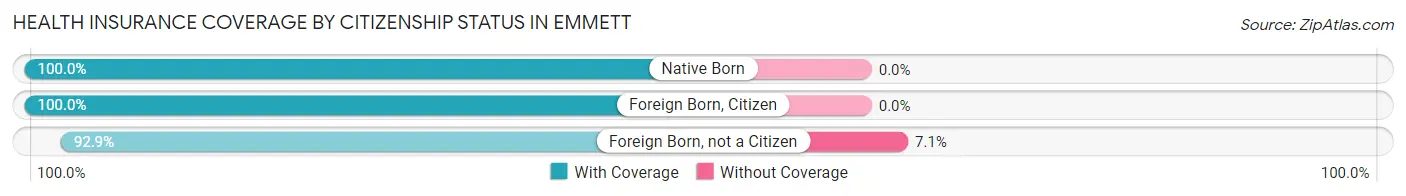
| Citizenship Status | With Coverage | Without Coverage |
| Native Born | 15 (100.0%) | 0 (0.0%) |
| Foreign Born, Citizen | 17 (100.0%) | 0 (0.0%) |
| Foreign Born, not a Citizen | 39 (92.9%) | 3 (7.1%) |
Health Insurance Coverage by Household Income in Emmett
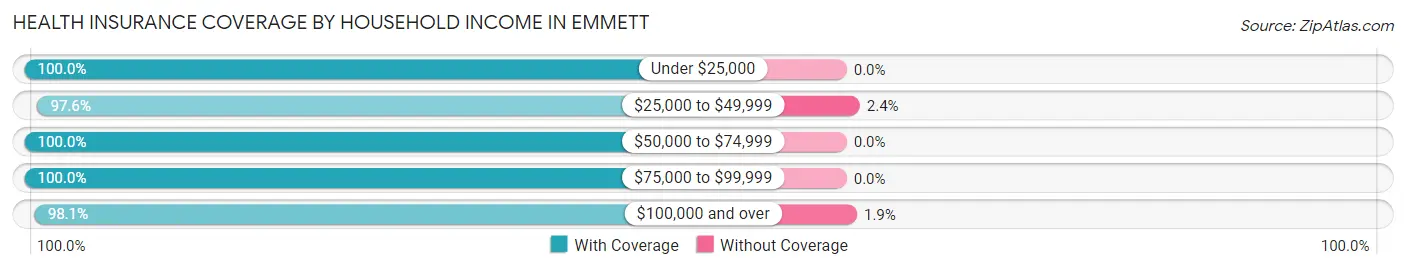
| Household Income | With Coverage | Without Coverage |
| Under $25,000 | 8 (100.0%) | 0 (0.0%) |
| $25,000 to $49,999 | 40 (97.6%) | 1 (2.4%) |
| $50,000 to $74,999 | 13 (100.0%) | 0 (0.0%) |
| $75,000 to $99,999 | 26 (100.0%) | 0 (0.0%) |
| $100,000 and over | 153 (98.1%) | 3 (1.9%) |
Public vs Private Health Insurance Coverage by Age in Emmett
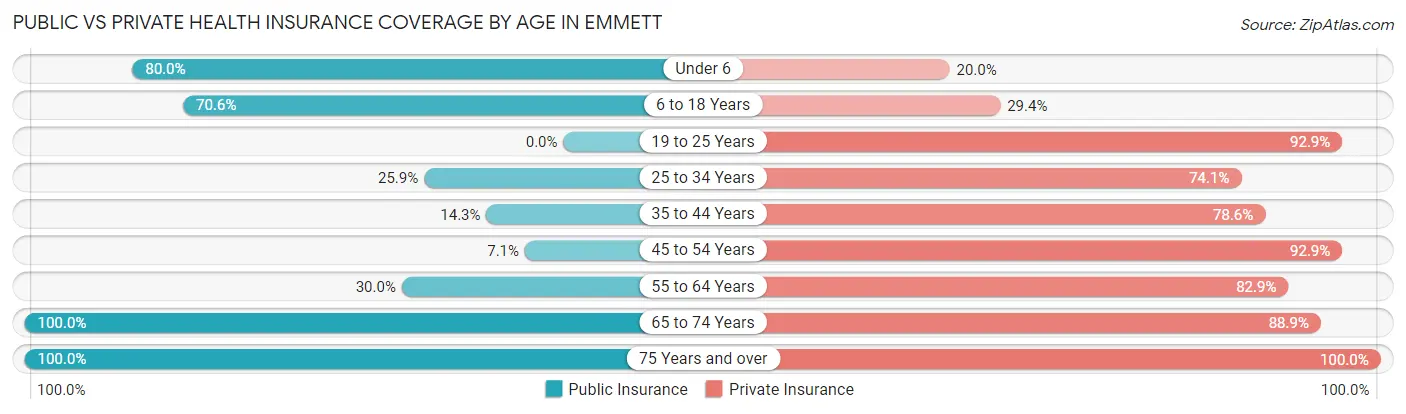
| Age Bracket | Public Insurance | Private Insurance |
| Under 6 | 12 (80.0%) | 3 (20.0%) |
| 6 to 18 Years | 12 (70.6%) | 5 (29.4%) |
| 19 to 25 Years | 0 (0.0%) | 39 (92.9%) |
| 25 to 34 Years | 15 (25.9%) | 43 (74.1%) |
| 35 to 44 Years | 2 (14.3%) | 11 (78.6%) |
| 45 to 54 Years | 1 (7.1%) | 13 (92.9%) |
| 55 to 64 Years | 21 (30.0%) | 58 (82.9%) |
| 65 to 74 Years | 9 (100.0%) | 8 (88.9%) |
| 75 Years and over | 5 (100.0%) | 5 (100.0%) |
| Total | 77 (31.6%) | 185 (75.8%) |
Disability Status by Sex by Age in Emmett
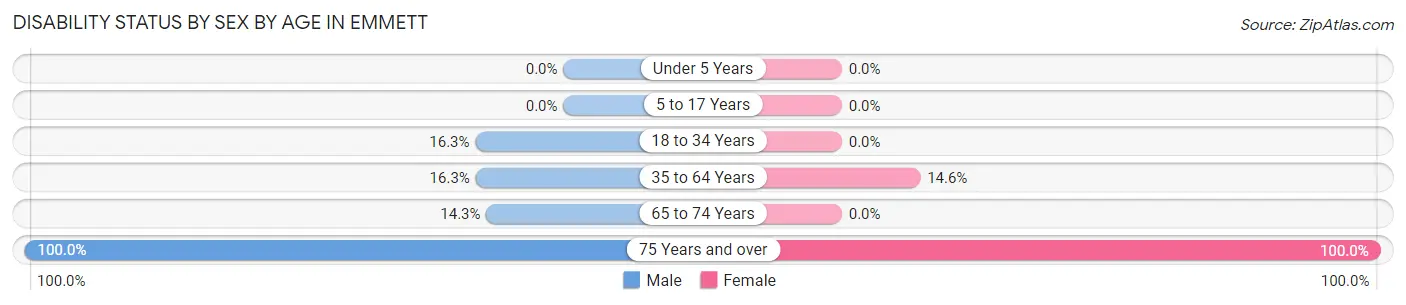
| Age Bracket | Male | Female |
| Under 5 Years | 0 (0.0%) | 0 (0.0%) |
| 5 to 17 Years | 0 (0.0%) | 0 (0.0%) |
| 18 to 34 Years | 8 (16.3%) | 0 (0.0%) |
| 35 to 64 Years | 7 (16.3%) | 8 (14.5%) |
| 65 to 74 Years | 1 (14.3%) | 0 (0.0%) |
| 75 Years and over | 3 (100.0%) | 2 (100.0%) |
Disability Class by Sex by Age in Emmett
Disability Class: Hearing Difficulty
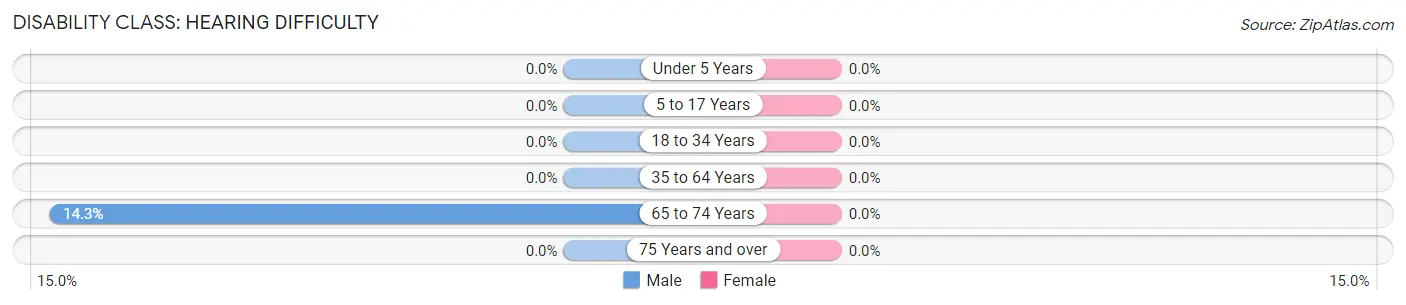
| Age Bracket | Male | Female |
| Under 5 Years | 0 (0.0%) | 0 (0.0%) |
| 5 to 17 Years | 0 (0.0%) | 0 (0.0%) |
| 18 to 34 Years | 0 (0.0%) | 0 (0.0%) |
| 35 to 64 Years | 0 (0.0%) | 0 (0.0%) |
| 65 to 74 Years | 1 (14.3%) | 0 (0.0%) |
| 75 Years and over | 0 (0.0%) | 0 (0.0%) |
Disability Class: Vision Difficulty
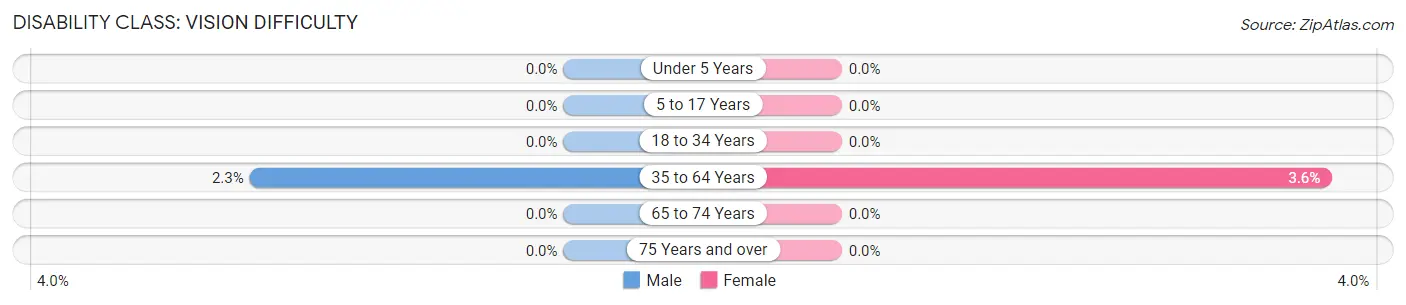
| Age Bracket | Male | Female |
| Under 5 Years | 0 (0.0%) | 0 (0.0%) |
| 5 to 17 Years | 0 (0.0%) | 0 (0.0%) |
| 18 to 34 Years | 0 (0.0%) | 0 (0.0%) |
| 35 to 64 Years | 1 (2.3%) | 2 (3.6%) |
| 65 to 74 Years | 0 (0.0%) | 0 (0.0%) |
| 75 Years and over | 0 (0.0%) | 0 (0.0%) |
Disability Class: Cognitive Difficulty
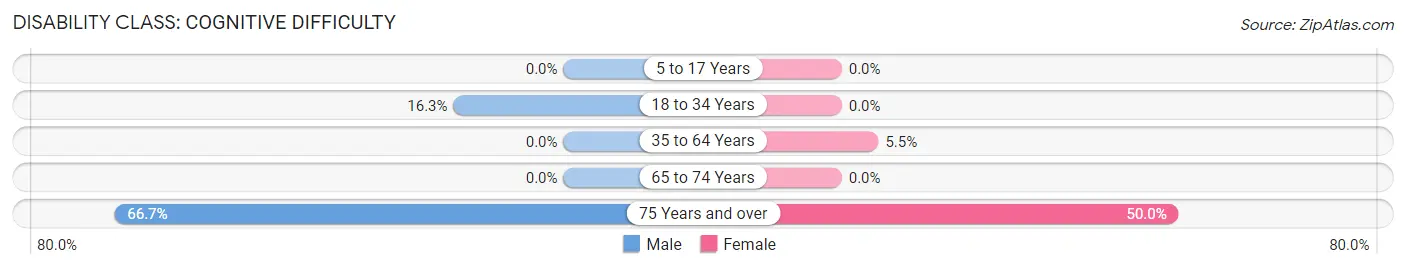
| Age Bracket | Male | Female |
| 5 to 17 Years | 0 (0.0%) | 0 (0.0%) |
| 18 to 34 Years | 8 (16.3%) | 0 (0.0%) |
| 35 to 64 Years | 0 (0.0%) | 3 (5.4%) |
| 65 to 74 Years | 0 (0.0%) | 0 (0.0%) |
| 75 Years and over | 2 (66.7%) | 1 (50.0%) |
Disability Class: Ambulatory Difficulty
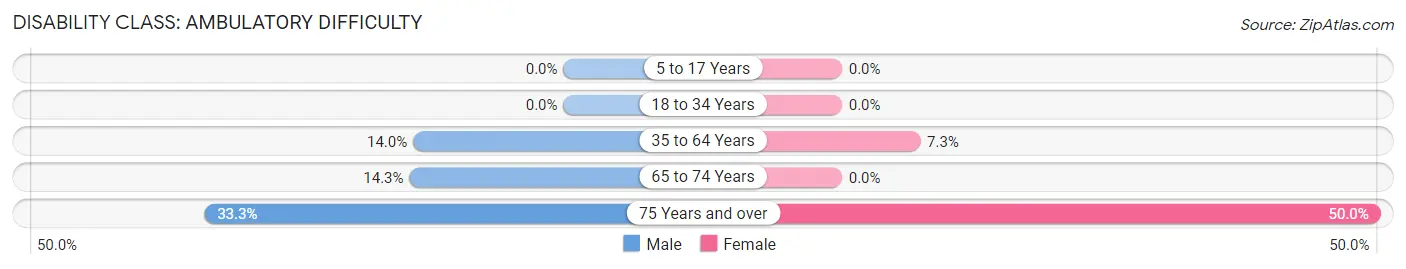
| Age Bracket | Male | Female |
| 5 to 17 Years | 0 (0.0%) | 0 (0.0%) |
| 18 to 34 Years | 0 (0.0%) | 0 (0.0%) |
| 35 to 64 Years | 6 (14.0%) | 4 (7.3%) |
| 65 to 74 Years | 1 (14.3%) | 0 (0.0%) |
| 75 Years and over | 1 (33.3%) | 1 (50.0%) |
Disability Class: Self-Care Difficulty
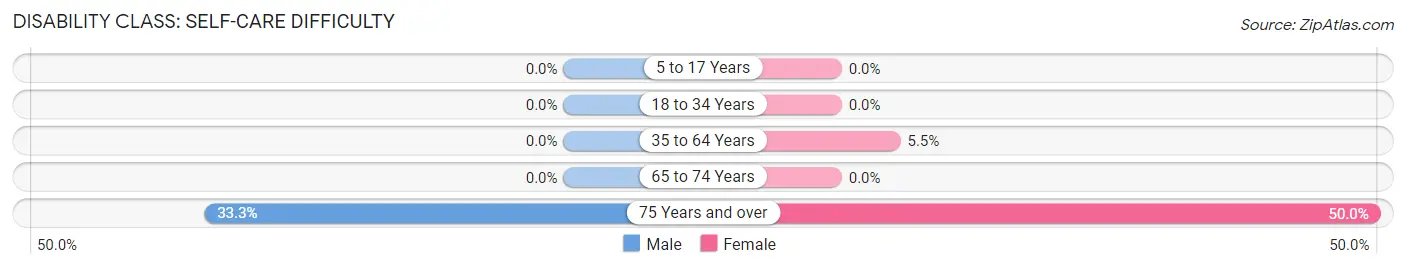
| Age Bracket | Male | Female |
| 5 to 17 Years | 0 (0.0%) | 0 (0.0%) |
| 18 to 34 Years | 0 (0.0%) | 0 (0.0%) |
| 35 to 64 Years | 0 (0.0%) | 3 (5.4%) |
| 65 to 74 Years | 0 (0.0%) | 0 (0.0%) |
| 75 Years and over | 1 (33.3%) | 1 (50.0%) |
Technology Access in Emmett
Computing Device Access in Emmett
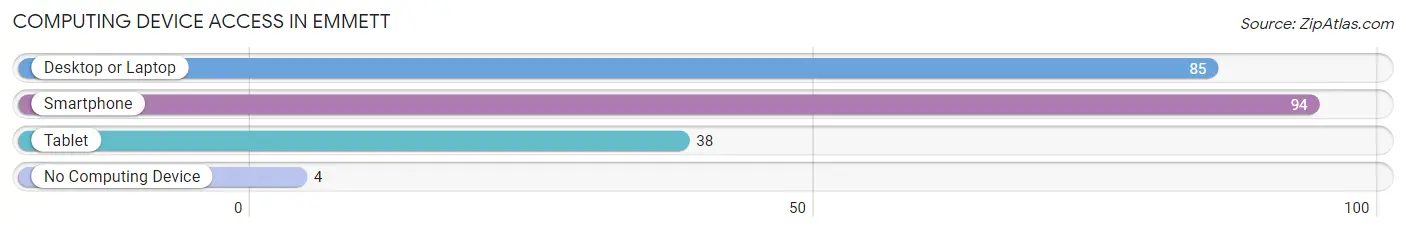
| Device Type | # Households | % Households |
| Desktop or Laptop | 85 | 81.7% |
| Smartphone | 94 | 90.4% |
| Tablet | 38 | 36.5% |
| No Computing Device | 4 | 3.8% |
| Total | 104 | 100.0% |
Internet Access in Emmett
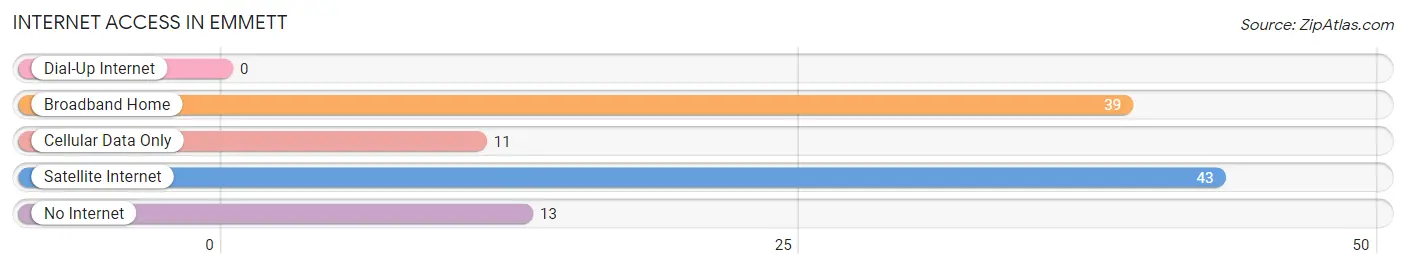
| Internet Type | # Households | % Households |
| Dial-Up Internet | 0 | 0.0% |
| Broadband Home | 39 | 37.5% |
| Cellular Data Only | 11 | 10.6% |
| Satellite Internet | 43 | 41.3% |
| No Internet | 13 | 12.5% |
| Total | 104 | 100.0% |
Emmett Summary
Emmett, Michigan is a small village located in St. Clair County, Michigan. It is situated on the banks of the St. Clair River, approximately 25 miles northeast of Detroit. The village has a population of approximately 1,500 people and covers an area of 1.2 square miles.
History
The area that is now Emmett was first settled in the early 1800s by French-Canadian fur traders. The village was originally known as “Emmett’s Landing” and was named after the first settler, William Emmett. In 1837, the village was officially incorporated as the Village of Emmett.
The village grew slowly over the years, but it was not until the late 19th century that it began to experience significant growth. This was due to the construction of the Grand Trunk Railroad, which ran through the village and provided a direct connection to Detroit. The railroad also allowed for the development of the local lumber industry, which was a major source of employment for the village.
Geography
Emmett is located in St. Clair County, Michigan, approximately 25 miles northeast of Detroit. The village is situated on the banks of the St. Clair River and covers an area of 1.2 square miles. The terrain is mostly flat, with some rolling hills in the northern part of the village.
The climate in Emmett is classified as humid continental, with hot summers and cold winters. The average annual temperature is around 50 degrees Fahrenheit, with an average high of around 70 degrees in the summer and an average low of around 30 degrees in the winter.
Economy
The economy of Emmett is largely based on agriculture and tourism. The village is home to several farms, which produce a variety of crops, including corn, soybeans, wheat, and hay. The village also has several wineries and breweries, which attract tourists from all over the region.
In addition to agriculture and tourism, Emmett also has a small manufacturing sector. The village is home to several small factories, which produce a variety of products, including furniture, clothing, and automotive parts.
Demographics
As of the 2010 census, the population of Emmett was 1,500 people. The racial makeup of the village was 97.3% White, 0.7% African American, 0.3% Native American, 0.3% Asian, and 1.3% from other races. The median household income was $45,000, and the median age was 43.
Emmett is a small, rural village with a strong sense of community. The village is home to several churches, a library, and a variety of small businesses. The village also has a strong sense of pride in its history and culture, and is a popular destination for tourists looking to experience the rural charm of Michigan.
Common Questions
What is Per Capita Income in Emmett?
Per Capita income in Emmett is $38,206.
What is the Median Family Income in Emmett?
Median Family Income in Emmett is $83,125.
What is the Median Household income in Emmett?
Median Household Income in Emmett is $112,656.
What is Income or Wage Gap in Emmett?
Income or Wage Gap in Emmett is 42.5%.
Women in Emmett earn 57.5 cents for every dollar earned by a man.
What is Inequality or Gini Index in Emmett?
Inequality or Gini Index in Emmett is 0.27.
What is the Total Population of Emmett?
Total Population of Emmett is 244.
What is the Total Male Population of Emmett?
Total Male Population of Emmett is 123.
What is the Total Female Population of Emmett?
Total Female Population of Emmett is 121.
What is the Ratio of Males per 100 Females in Emmett?
There are 101.65 Males per 100 Females in Emmett.
What is the Ratio of Females per 100 Males in Emmett?
There are 98.37 Females per 100 Males in Emmett.
What is the Median Population Age in Emmett?
Median Population Age in Emmett is 31.6 Years.
What is the Average Family Size in Emmett
Average Family Size in Emmett is 2.9 People.
What is the Average Household Size in Emmett
Average Household Size in Emmett is 2.4 People.
How Large is the Labor Force in Emmett?
There are 138 People in the Labor Forcein in Emmett.
What is the Percentage of People in the Labor Force in Emmett?
64.2% of People are in the Labor Force in Emmett.
What is the Unemployment Rate in Emmett?
Unemployment Rate in Emmett is 5.8%.