Crystal Mountain, MI Map & Demographics
Crystal Mountain Map
Crystal Mountain Overview
$52,091
PER CAPITA INCOME
$146,875
AVG FAMILY INCOME
11.6%
WAGE / INCOME GAP [ % ]
88.4¢/ $1
WAGE / INCOME GAP [ $ ]
0.47
INEQUALITY / GINI INDEX
130
TOTAL POPULATION
55
MALE POPULATION
75
FEMALE POPULATION
73.33
MALES / 100 FEMALES
136.36
FEMALES / 100 MALES
54.3
MEDIAN AGE
3.8
AVG FAMILY SIZE
2.6
AVG HOUSEHOLD SIZE
51
LABOR FORCE [ PEOPLE ]
54.8%
PERCENT IN LABOR FORCE
Income in Crystal Mountain
Income Overview in Crystal Mountain
| Characteristic | Number | Measure |
| Per Capita Income | 130 | $52,091 |
| Median Family Income | 29 | $146,875 |
| Mean Family Income | 29 | $187,690 |
| Median Household Income | 49 | $0 |
| Mean Household Income | 49 | $122,237 |
| Income Deficit | 29 | $0 |
| Wage / Income Gap (%) | 130 | 11.57% |
| Wage / Income Gap ($) | 130 | 88.43¢ per $1 |
| Gini / Inequality Index | 130 | 0.47 |
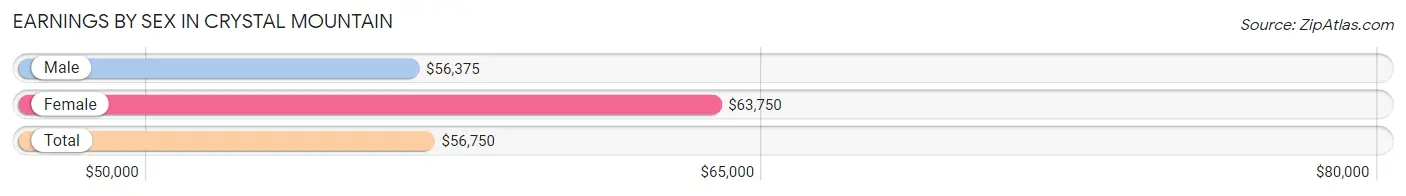
Earnings by Sex in Crystal Mountain
Average Earnings in Crystal Mountain are $56,750, $56,375 for men and $63,750 for women, a difference of 11.6%.
| Sex | Number | Average Earnings |
| Male | 17 (32.1%) | $56,375 |
| Female | 36 (67.9%) | $63,750 |
| Total | 53 (100.0%) | $56,750 |
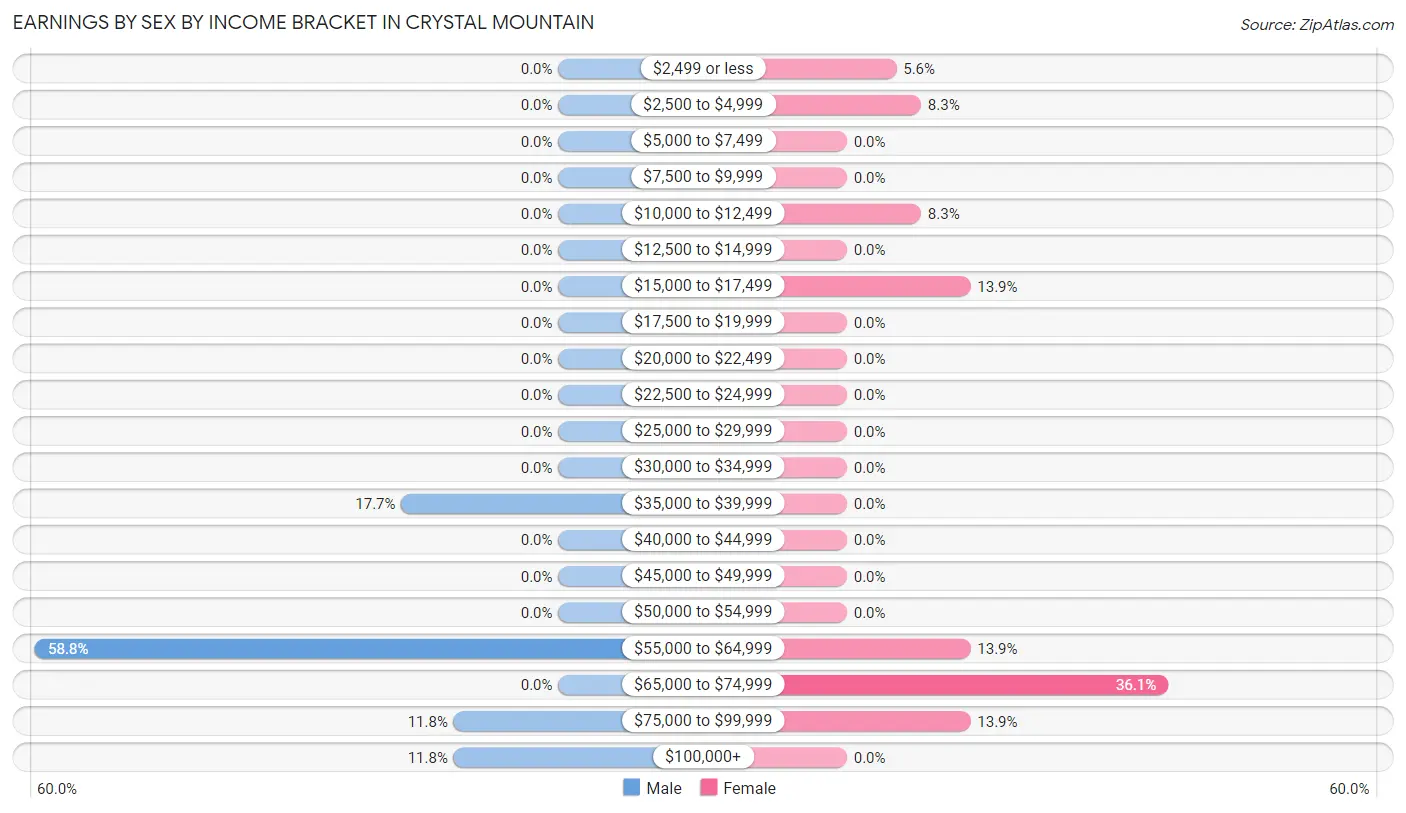
Earnings by Sex by Income Bracket in Crystal Mountain
The most common earnings brackets in Crystal Mountain are $55,000 to $64,999 for men (10 | 58.8%) and $65,000 to $74,999 for women (13 | 36.1%).
| Income | Male | Female |
| $2,499 or less | 0 (0.0%) | 2 (5.6%) |
| $2,500 to $4,999 | 0 (0.0%) | 3 (8.3%) |
| $5,000 to $7,499 | 0 (0.0%) | 0 (0.0%) |
| $7,500 to $9,999 | 0 (0.0%) | 0 (0.0%) |
| $10,000 to $12,499 | 0 (0.0%) | 3 (8.3%) |
| $12,500 to $14,999 | 0 (0.0%) | 0 (0.0%) |
| $15,000 to $17,499 | 0 (0.0%) | 5 (13.9%) |
| $17,500 to $19,999 | 0 (0.0%) | 0 (0.0%) |
| $20,000 to $22,499 | 0 (0.0%) | 0 (0.0%) |
| $22,500 to $24,999 | 0 (0.0%) | 0 (0.0%) |
| $25,000 to $29,999 | 0 (0.0%) | 0 (0.0%) |
| $30,000 to $34,999 | 0 (0.0%) | 0 (0.0%) |
| $35,000 to $39,999 | 3 (17.6%) | 0 (0.0%) |
| $40,000 to $44,999 | 0 (0.0%) | 0 (0.0%) |
| $45,000 to $49,999 | 0 (0.0%) | 0 (0.0%) |
| $50,000 to $54,999 | 0 (0.0%) | 0 (0.0%) |
| $55,000 to $64,999 | 10 (58.8%) | 5 (13.9%) |
| $65,000 to $74,999 | 0 (0.0%) | 13 (36.1%) |
| $75,000 to $99,999 | 2 (11.8%) | 5 (13.9%) |
| $100,000+ | 2 (11.8%) | 0 (0.0%) |
| Total | 17 (100.0%) | 36 (100.0%) |
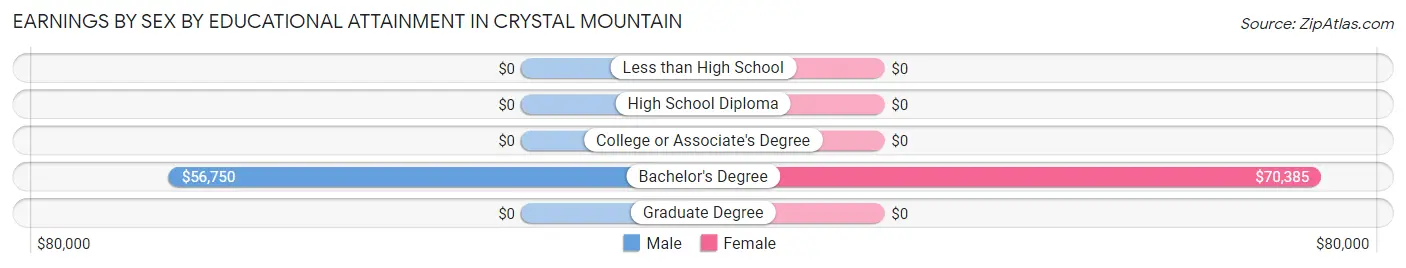
Earnings by Sex by Educational Attainment in Crystal Mountain
Average earnings in Crystal Mountain are $56,375 for men and $63,750 for women, a difference of 11.6%. Men with an educational attainment of bachelor's degree enjoy the highest average annual earnings of $56,750, while those with bachelor's degree education earn the least with $56,750. Women with an educational attainment of bachelor's degree earn the most with the average annual earnings of $70,385, while those with bachelor's degree education have the smallest earnings of $70,385.
| Educational Attainment | Male Income | Female Income |
| Less than High School | - | - |
| High School Diploma | - | - |
| College or Associate's Degree | - | - |
| Bachelor's Degree | $56,750 | $70,385 |
| Graduate Degree | - | - |
| Total | $56,375 | $63,750 |
Family Income in Crystal Mountain
Family Income Brackets in Crystal Mountain
According to the Crystal Mountain family income data, there are 12 families falling into the $100,000 to $149,999 income range, which is the most common income bracket and makes up 41.4% of all families.
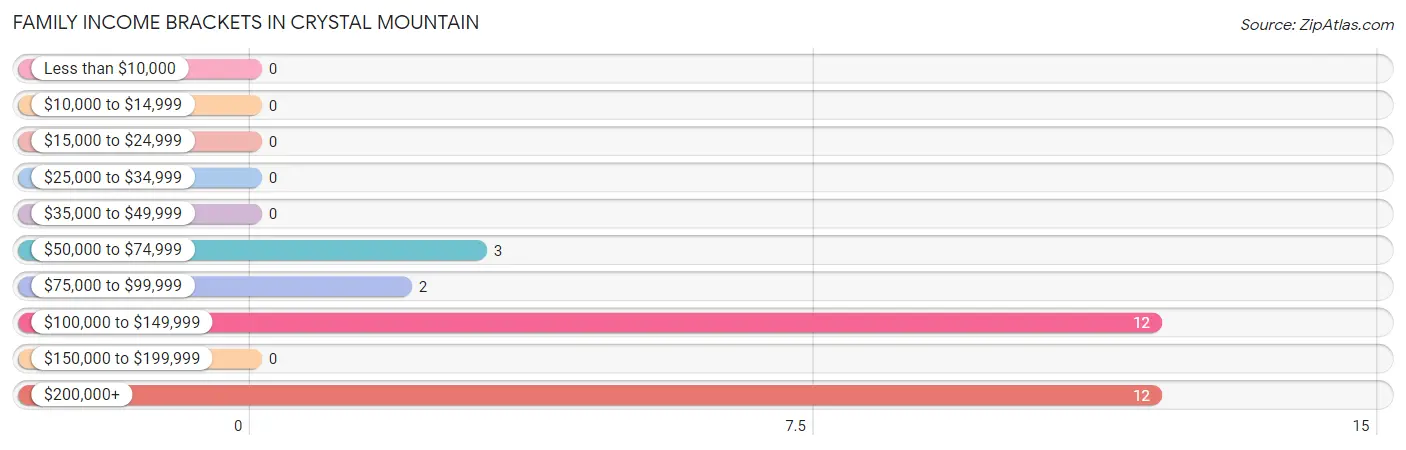
| Income Bracket | # Families | % Families |
| Less than $10,000 | 0 | 0.0% |
| $10,000 to $14,999 | 0 | 0.0% |
| $15,000 to $24,999 | 0 | 0.0% |
| $25,000 to $34,999 | 0 | 0.0% |
| $35,000 to $49,999 | 0 | 0.0% |
| $50,000 to $74,999 | 3 | 10.3% |
| $75,000 to $99,999 | 2 | 6.9% |
| $100,000 to $149,999 | 12 | 41.4% |
| $150,000 to $199,999 | 0 | 0.0% |
| $200,000+ | 12 | 41.4% |
Family Income by Famaliy Size in Crystal Mountain
2-person families (18 | 62.1%) account for the highest median family income in Crystal Mountain with $146,250 per family, while 2-person families (18 | 62.1%) have the highest median income of $73,125 per family member.
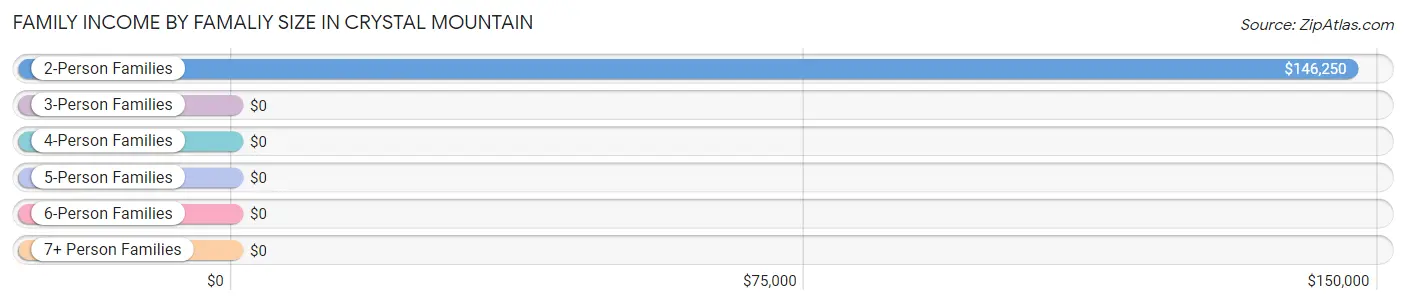
| Income Bracket | # Families | Median Income |
| 2-Person Families | 18 (62.1%) | $146,250 |
| 3-Person Families | 0 (0.0%) | $0 |
| 4-Person Families | 6 (20.7%) | $0 |
| 5-Person Families | 5 (17.2%) | $0 |
| 6-Person Families | 0 (0.0%) | $0 |
| 7+ Person Families | 0 (0.0%) | $0 |
| Total | 29 (100.0%) | $146,875 |
Family Income by Number of Earners in Crystal Mountain
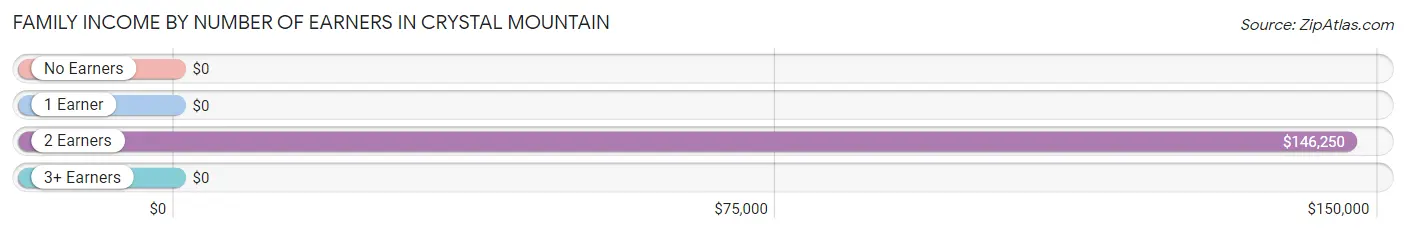
| Number of Earners | # Families | Median Income |
| No Earners | 11 (37.9%) | $0 |
| 1 Earner | 0 (0.0%) | $0 |
| 2 Earners | 12 (41.4%) | $146,250 |
| 3+ Earners | 6 (20.7%) | $0 |
| Total | 29 (100.0%) | $146,875 |
Household Income in Crystal Mountain
Household Income Brackets in Crystal Mountain
With 18 households falling in the category, the $25,000 to $34,999 income range is the most frequent in Crystal Mountain, accounting for 36.7% of all households.
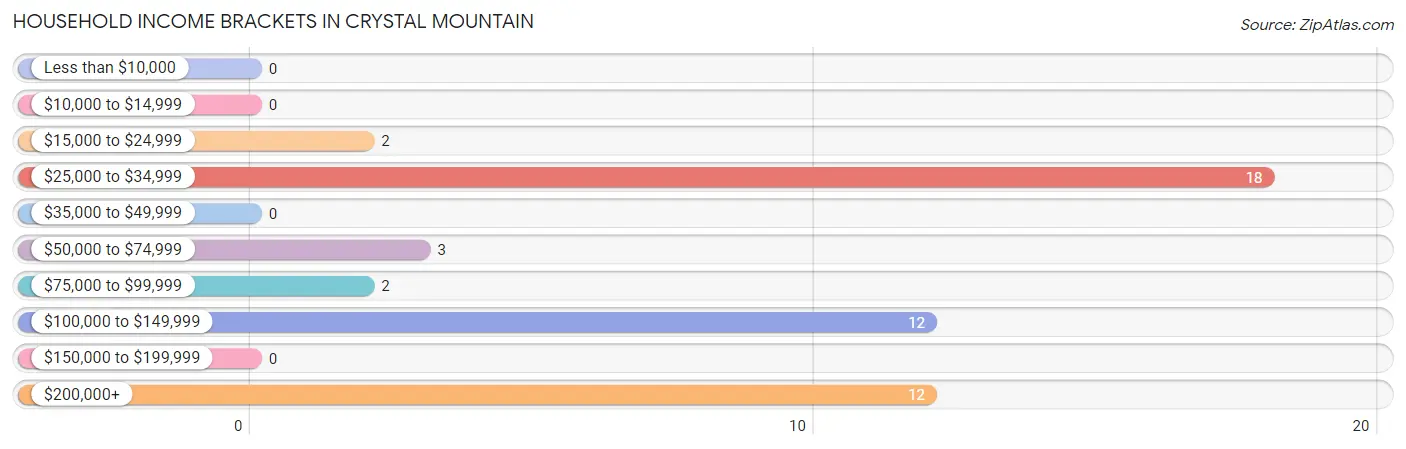
| Income Bracket | # Households | % Households |
| Less than $10,000 | 0 | 0.0% |
| $10,000 to $14,999 | 0 | 0.0% |
| $15,000 to $24,999 | 2 | 4.1% |
| $25,000 to $34,999 | 18 | 36.7% |
| $35,000 to $49,999 | 0 | 0.0% |
| $50,000 to $74,999 | 3 | 6.1% |
| $75,000 to $99,999 | 2 | 4.1% |
| $100,000 to $149,999 | 12 | 24.5% |
| $150,000 to $199,999 | 0 | 0.0% |
| $200,000+ | 12 | 24.5% |
Household Income by Householder Age in Crystal Mountain
The median household income in Crystal Mountain is $0, with the highest median household income of $149,375 found in the 45 to 64 years age bracket for the primary householder. A total of 7 households (14.3%) fall into this category.
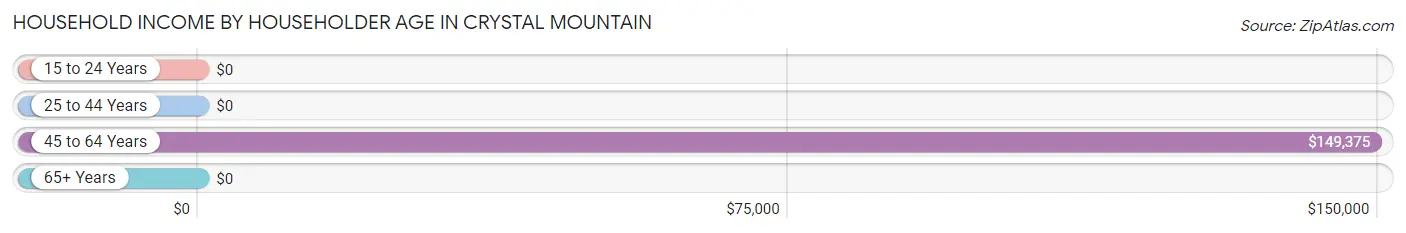
| Income Bracket | # Households | Median Income |
| 15 to 24 Years | 0 (0.0%) | $0 |
| 25 to 44 Years | 5 (10.2%) | $0 |
| 45 to 64 Years | 7 (14.3%) | $149,375 |
| 65+ Years | 37 (75.5%) | $0 |
| Total | 49 (100.0%) | $0 |
Poverty in Crystal Mountain
Income Below Poverty by Sex and Age in Crystal Mountain
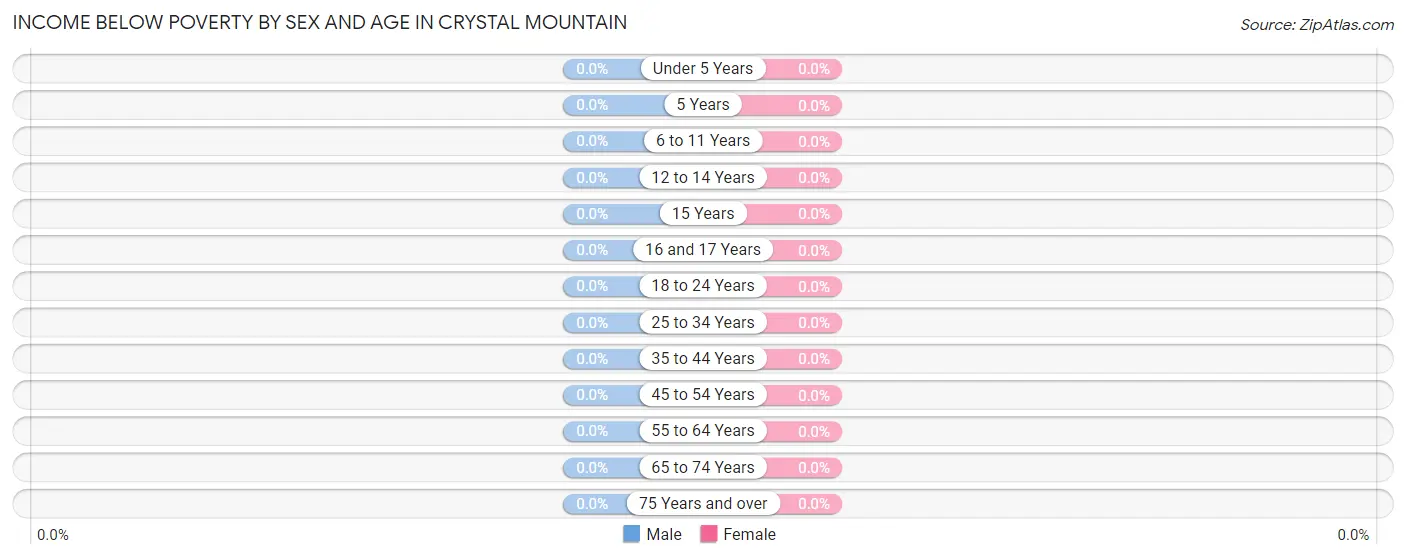
| Age Bracket | Male | Female |
| Under 5 Years | 0 (0.0%) | 0 (0.0%) |
| 5 Years | 0 (0.0%) | 0 (0.0%) |
| 6 to 11 Years | 0 (0.0%) | 0 (0.0%) |
| 12 to 14 Years | 0 (0.0%) | 0 (0.0%) |
| 15 Years | 0 (0.0%) | 0 (0.0%) |
| 16 and 17 Years | 0 (0.0%) | 0 (0.0%) |
| 18 to 24 Years | 0 (0.0%) | 0 (0.0%) |
| 25 to 34 Years | 0 (0.0%) | 0 (0.0%) |
| 35 to 44 Years | 0 (0.0%) | 0 (0.0%) |
| 45 to 54 Years | 0 (0.0%) | 0 (0.0%) |
| 55 to 64 Years | 0 (0.0%) | 0 (0.0%) |
| 65 to 74 Years | 0 (0.0%) | 0 (0.0%) |
| 75 Years and over | 0 (0.0%) | 0 (0.0%) |
| Total | 0 (0.0%) | 0 (0.0%) |
Income Above Poverty by Sex and Age in Crystal Mountain
According to the poverty statistics in Crystal Mountain, males aged 6 to 11 years and females aged 6 to 11 years are the age groups that are most secure financially, with 100.0% of males and 100.0% of females in these age groups living above the poverty line.
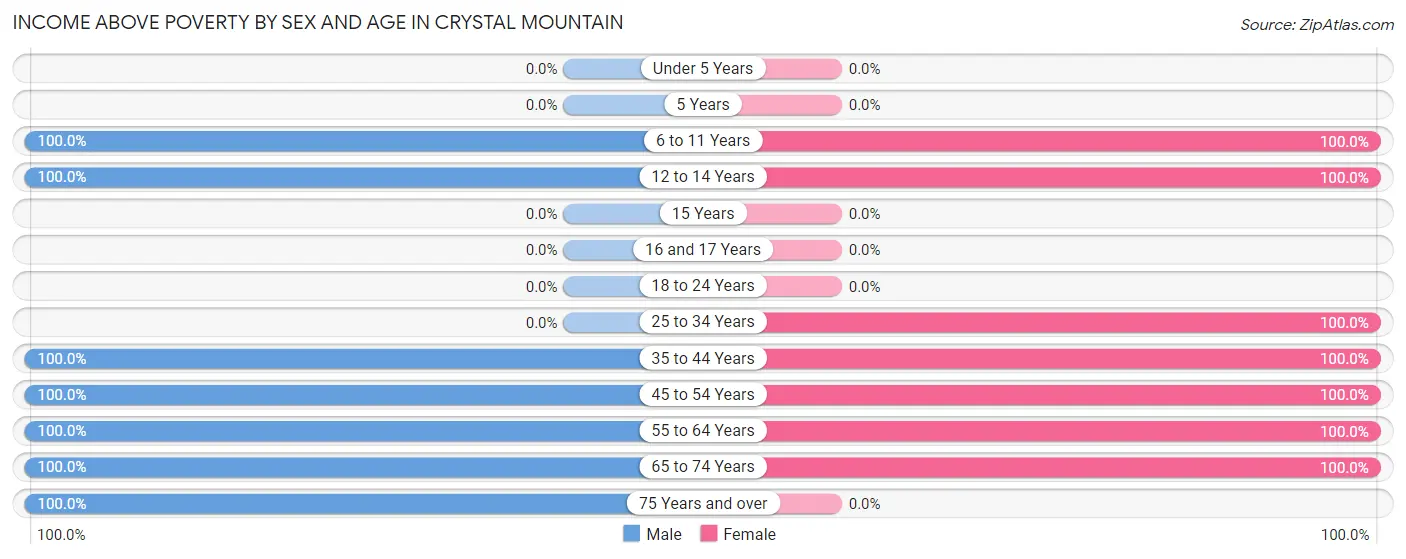
| Age Bracket | Male | Female |
| Under 5 Years | 0 (0.0%) | 0 (0.0%) |
| 5 Years | 0 (0.0%) | 0 (0.0%) |
| 6 to 11 Years | 4 (100.0%) | 24 (100.0%) |
| 12 to 14 Years | 5 (100.0%) | 4 (100.0%) |
| 15 Years | 0 (0.0%) | 0 (0.0%) |
| 16 and 17 Years | 0 (0.0%) | 0 (0.0%) |
| 18 to 24 Years | 0 (0.0%) | 0 (0.0%) |
| 25 to 34 Years | 0 (0.0%) | 13 (100.0%) |
| 35 to 44 Years | 4 (100.0%) | 5 (100.0%) |
| 45 to 54 Years | 5 (100.0%) | 3 (100.0%) |
| 55 to 64 Years | 2 (100.0%) | 7 (100.0%) |
| 65 to 74 Years | 29 (100.0%) | 19 (100.0%) |
| 75 Years and over | 6 (100.0%) | 0 (0.0%) |
| Total | 55 (100.0%) | 75 (100.0%) |
Income Below Poverty Among Married-Couple Families in Crystal Mountain
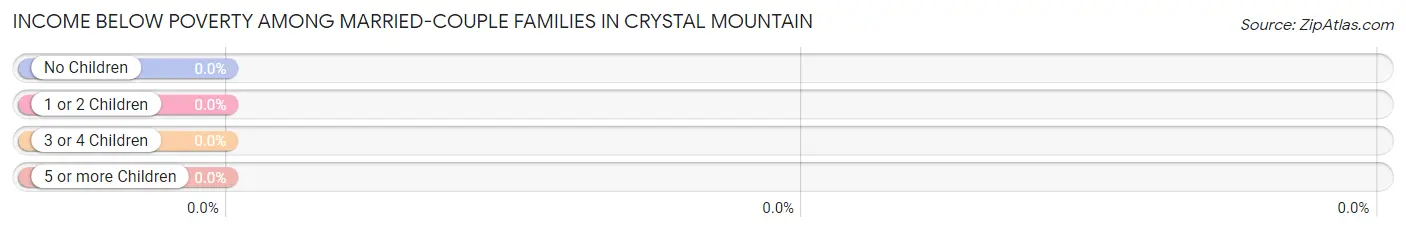
| Children | Above Poverty | Below Poverty |
| No Children | 18 (100.0%) | 0 (0.0%) |
| 1 or 2 Children | 6 (100.0%) | 0 (0.0%) |
| 3 or 4 Children | 5 (100.0%) | 0 (0.0%) |
| 5 or more Children | 0 (0.0%) | 0 (0.0%) |
| Total | 29 (100.0%) | 0 (0.0%) |
Income Below Poverty Among Single-Parent Households in Crystal Mountain
| Children | Single Father | Single Mother |
| No Children | 0 (0.0%) | 0 (0.0%) |
| 1 or 2 Children | 0 (0.0%) | 0 (0.0%) |
| 3 or 4 Children | 0 (0.0%) | 0 (0.0%) |
| 5 or more Children | 0 (0.0%) | 0 (0.0%) |
| Total | 0 (0.0%) | 0 (0.0%) |
Income Below Poverty Among Married-Couple vs Single-Parent Households in Crystal Mountain
| Children | Married-Couple Families | Single-Parent Households |
| No Children | 0 (0.0%) | 0 (0.0%) |
| 1 or 2 Children | 0 (0.0%) | 0 (0.0%) |
| 3 or 4 Children | 0 (0.0%) | 0 (0.0%) |
| 5 or more Children | 0 (0.0%) | 0 (0.0%) |
| Total | 0 (0.0%) | 0 (0.0%) |
Race in Crystal Mountain
The most populous races in Crystal Mountain are White / Caucasian (106 | 81.5%), and Two or more Races (24 | 18.5%).
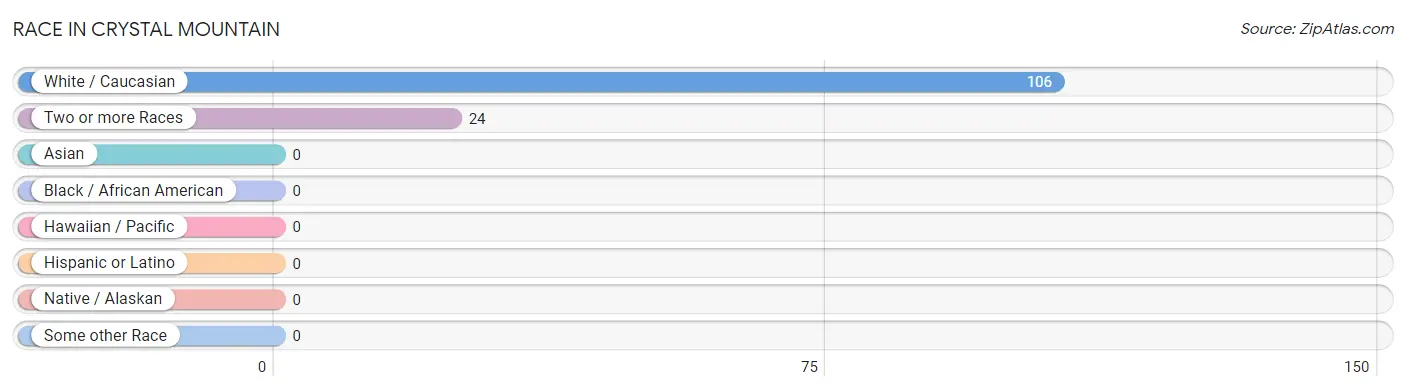
| Race | # Population | % Population |
| Asian | 0 | 0.0% |
| Black / African American | 0 | 0.0% |
| Hawaiian / Pacific | 0 | 0.0% |
| Hispanic or Latino | 0 | 0.0% |
| Native / Alaskan | 0 | 0.0% |
| White / Caucasian | 106 | 81.5% |
| Two or more Races | 24 | 18.5% |
| Some other Race | 0 | 0.0% |
| Total | 130 | 100.0% |
Ancestry in Crystal Mountain
The most populous ancestries reported in Crystal Mountain are Italian (25 | 19.2%), Irish (20 | 15.4%), English (18 | 13.9%), German (13 | 10.0%), and Scotch-Irish (6 | 4.6%), together accounting for 63.1% of all Crystal Mountain residents.
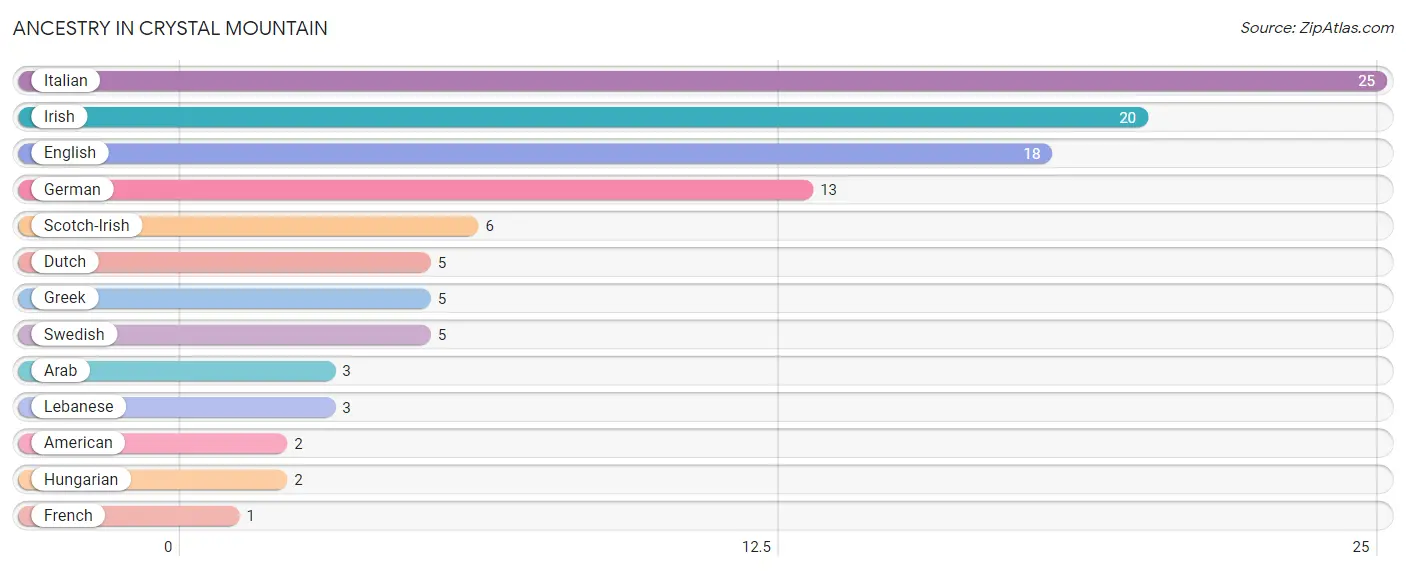
| Ancestry | # Population | % Population |
| American | 2 | 1.5% |
| Arab | 3 | 2.3% |
| Dutch | 5 | 3.8% |
| English | 18 | 13.9% |
| French | 1 | 0.8% |
| German | 13 | 10.0% |
| Greek | 5 | 3.8% |
| Hungarian | 2 | 1.5% |
| Irish | 20 | 15.4% |
| Italian | 25 | 19.2% |
| Lebanese | 3 | 2.3% |
| Scotch-Irish | 6 | 4.6% |
| Swedish | 5 | 3.8% | View All 13 Rows |
Immigrants in Crystal Mountain

| Immigration Origin | # Population | % Population | View All 0 Rows |
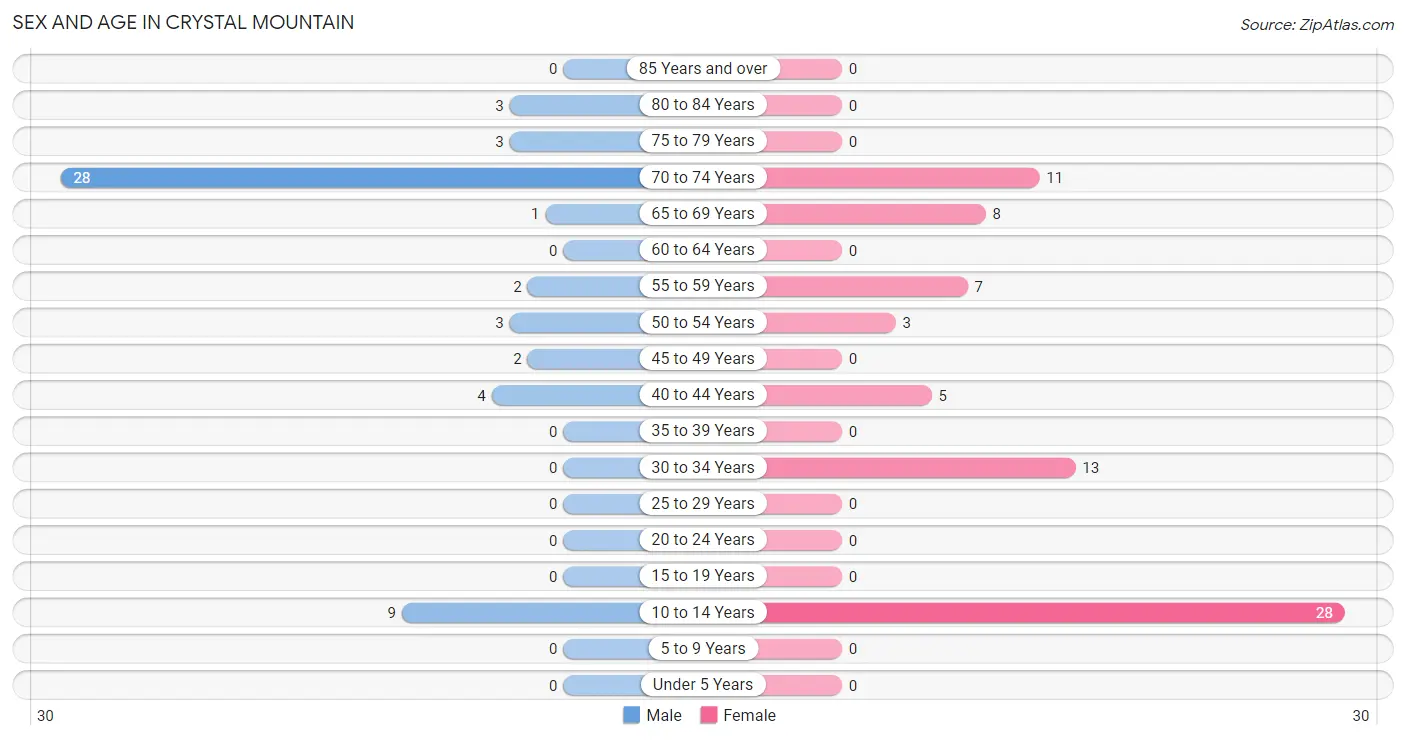
Sex and Age in Crystal Mountain
Sex and Age in Crystal Mountain
The most populous age groups in Crystal Mountain are 70 to 74 Years (28 | 50.9%) for men and 10 to 14 Years (28 | 37.3%) for women.
| Age Bracket | Male | Female |
| Under 5 Years | 0 (0.0%) | 0 (0.0%) |
| 5 to 9 Years | 0 (0.0%) | 0 (0.0%) |
| 10 to 14 Years | 9 (16.4%) | 28 (37.3%) |
| 15 to 19 Years | 0 (0.0%) | 0 (0.0%) |
| 20 to 24 Years | 0 (0.0%) | 0 (0.0%) |
| 25 to 29 Years | 0 (0.0%) | 0 (0.0%) |
| 30 to 34 Years | 0 (0.0%) | 13 (17.3%) |
| 35 to 39 Years | 0 (0.0%) | 0 (0.0%) |
| 40 to 44 Years | 4 (7.3%) | 5 (6.7%) |
| 45 to 49 Years | 2 (3.6%) | 0 (0.0%) |
| 50 to 54 Years | 3 (5.4%) | 3 (4.0%) |
| 55 to 59 Years | 2 (3.6%) | 7 (9.3%) |
| 60 to 64 Years | 0 (0.0%) | 0 (0.0%) |
| 65 to 69 Years | 1 (1.8%) | 8 (10.7%) |
| 70 to 74 Years | 28 (50.9%) | 11 (14.7%) |
| 75 to 79 Years | 3 (5.4%) | 0 (0.0%) |
| 80 to 84 Years | 3 (5.4%) | 0 (0.0%) |
| 85 Years and over | 0 (0.0%) | 0 (0.0%) |
| Total | 55 (100.0%) | 75 (100.0%) |
Families and Households in Crystal Mountain
Median Family Size in Crystal Mountain
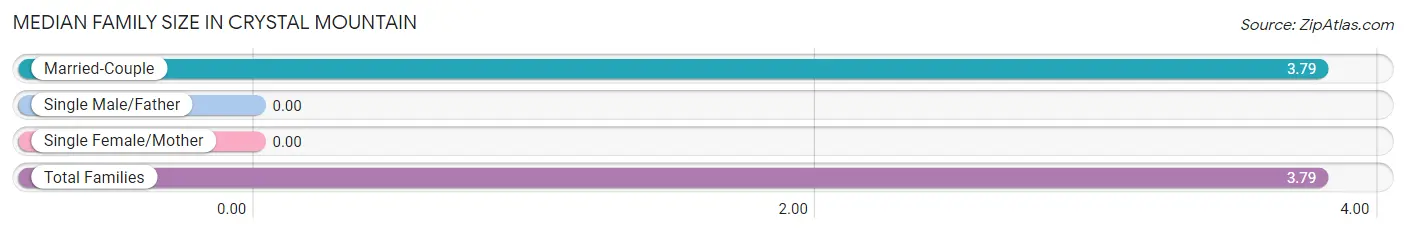
| Family Type | # Families | Family Size |
| Married-Couple | 29 (100.0%) | 3.79 |
| Single Male/Father | 0 (0.0%) | - |
| Single Female/Mother | 0 (0.0%) | - |
| Total Families | 29 (100.0%) | 3.79 |
Median Household Size in Crystal Mountain
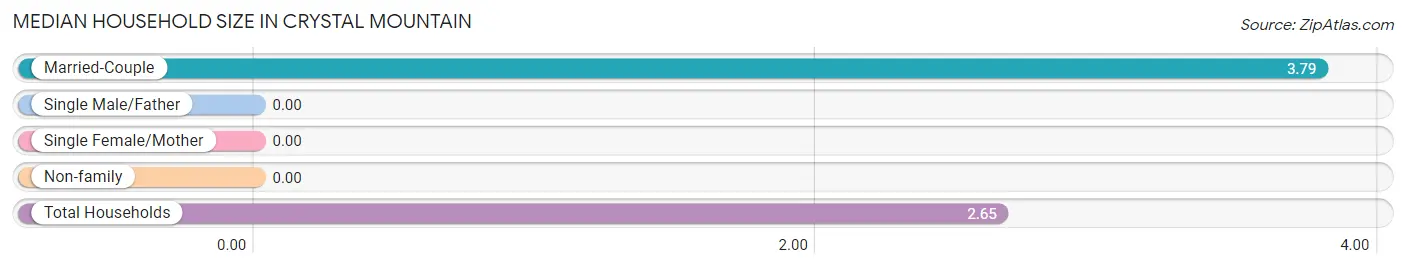
| Household Type | # Households | Household Size |
| Married-Couple | 29 (59.2%) | 3.79 |
| Single Male/Father | 0 (0.0%) | - |
| Single Female/Mother | 0 (0.0%) | - |
| Non-family | 20 (40.8%) | - |
| Total Households | 49 (100.0%) | 2.65 |
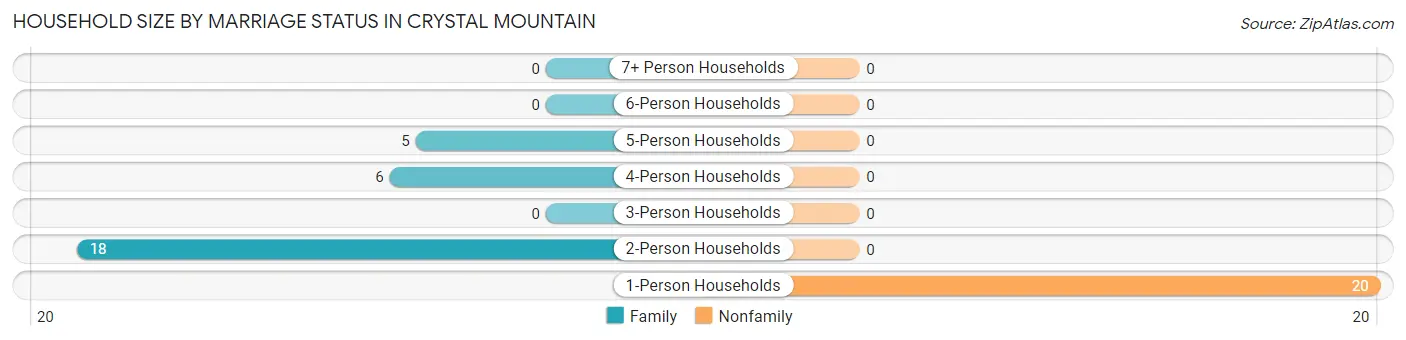
Household Size by Marriage Status in Crystal Mountain
Out of a total of 49 households in Crystal Mountain, 29 (59.2%) are family households, while 20 (40.8%) are nonfamily households. The most numerous type of family households are 2-person households, comprising 18, and the most common type of nonfamily households are 1-person households, comprising 20.
| Household Size | Family Households | Nonfamily Households |
| 1-Person Households | - | 20 (40.8%) |
| 2-Person Households | 18 (36.7%) | 0 (0.0%) |
| 3-Person Households | 0 (0.0%) | 0 (0.0%) |
| 4-Person Households | 6 (12.2%) | 0 (0.0%) |
| 5-Person Households | 5 (10.2%) | 0 (0.0%) |
| 6-Person Households | 0 (0.0%) | 0 (0.0%) |
| 7+ Person Households | 0 (0.0%) | 0 (0.0%) |
| Total | 29 (59.2%) | 20 (40.8%) |
Female Fertility in Crystal Mountain
Fertility by Age in Crystal Mountain
| Age Bracket | Women with Births | Births / 1,000 Women |
| 15 to 19 years | 0 (0.0%) | 0.0 |
| 20 to 34 years | 0 (0.0%) | 0.0 |
| 35 to 50 years | 0 (0.0%) | 0.0 |
| Total | 0 (0.0%) | 0.0 |
Fertility by Age by Marriage Status in Crystal Mountain
| Age Bracket | Married | Unmarried |
| 15 to 19 years | 0 (0.0%) | 0 (0.0%) |
| 20 to 34 years | 0 (0.0%) | 0 (0.0%) |
| 35 to 50 years | 0 (0.0%) | 0 (0.0%) |
| Total | 0 (0.0%) | 0 (0.0%) |
Fertility by Education in Crystal Mountain
| Educational Attainment | Women with Births | Births / 1,000 Women |
| Less than High School | 0 (0.0%) | 0.0 |
| High School Diploma | 0 (0.0%) | 0.0 |
| College or Associate's Degree | 0 (0.0%) | 0.0 |
| Bachelor's Degree | 0 (0.0%) | 0.0 |
| Graduate Degree | 0 (0.0%) | 0.0 |
| Total | 0 (0.0%) | 0.0 |
Fertility by Education by Marriage Status in Crystal Mountain
| Educational Attainment | Married | Unmarried |
| Less than High School | 0 (0.0%) | 0 (0.0%) |
| High School Diploma | 0 (0.0%) | 0 (0.0%) |
| College or Associate's Degree | 0 (0.0%) | 0 (0.0%) |
| Bachelor's Degree | 0 (0.0%) | 0 (0.0%) |
| Graduate Degree | 0 (0.0%) | 0 (0.0%) |
| Total | 0 (0.0%) | 0 (0.0%) |
Employment Characteristics in Crystal Mountain
Employment by Class of Employer in Crystal Mountain
Among the 48 employed individuals in Crystal Mountain, private company employees (34 | 70.8%), not-for-profit organizations (12 | 25.0%), and self-employed (incorporated) (2 | 4.2%) make up the most common classes of employment.
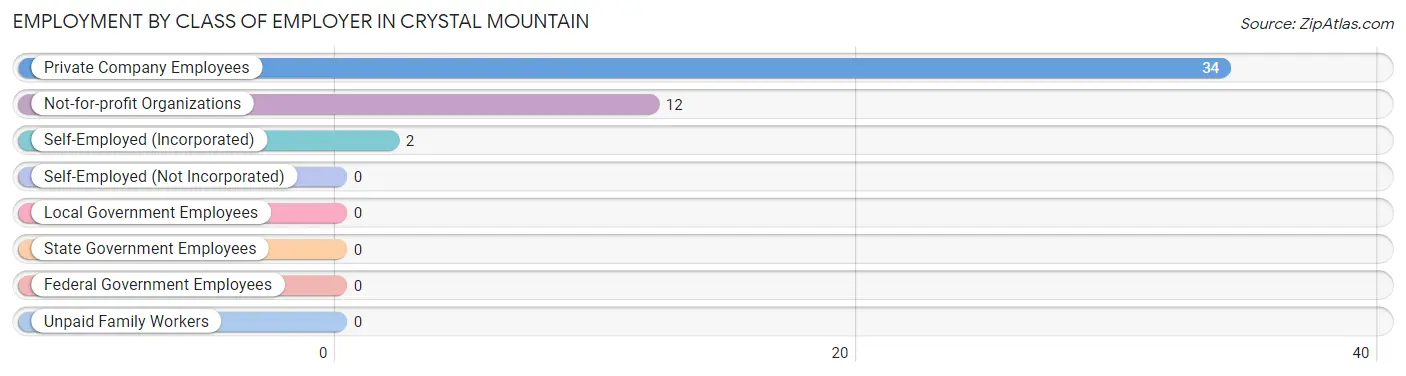
| Employer Class | # Employees | % Employees |
| Private Company Employees | 34 | 70.8% |
| Self-Employed (Incorporated) | 2 | 4.2% |
| Self-Employed (Not Incorporated) | 0 | 0.0% |
| Not-for-profit Organizations | 12 | 25.0% |
| Local Government Employees | 0 | 0.0% |
| State Government Employees | 0 | 0.0% |
| Federal Government Employees | 0 | 0.0% |
| Unpaid Family Workers | 0 | 0.0% |
| Total | 48 | 100.0% |
Employment Status by Age in Crystal Mountain
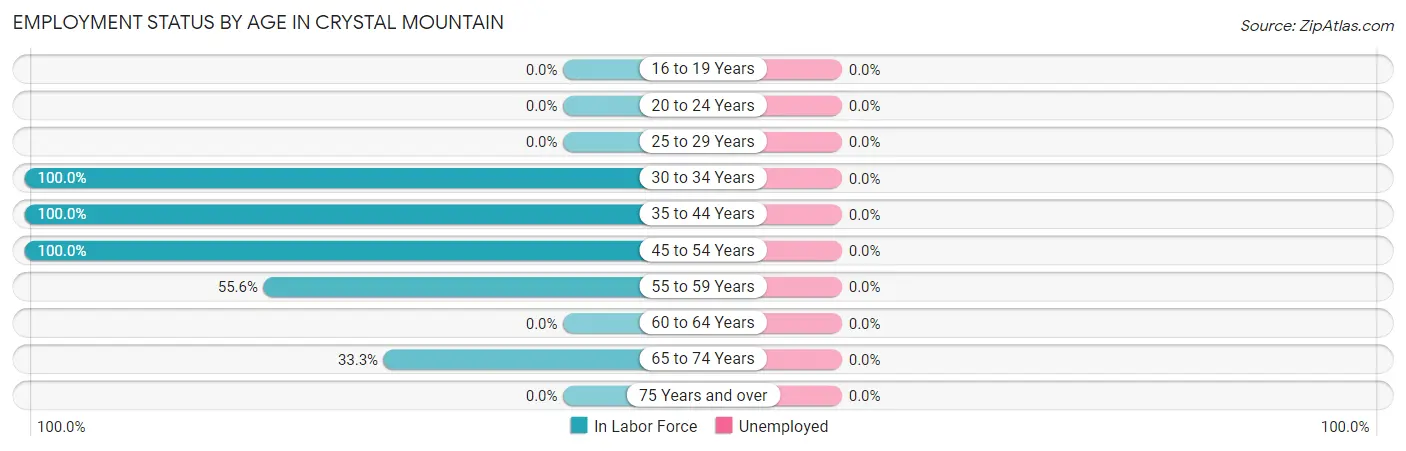
| Age Bracket | In Labor Force | Unemployed |
| 16 to 19 Years | 0 (0.0%) | 0 (0.0%) |
| 20 to 24 Years | 0 (0.0%) | 0 (0.0%) |
| 25 to 29 Years | 0 (0.0%) | 0 (0.0%) |
| 30 to 34 Years | 13 (100.0%) | 0 (0.0%) |
| 35 to 44 Years | 9 (100.0%) | 0 (0.0%) |
| 45 to 54 Years | 8 (100.0%) | 0 (0.0%) |
| 55 to 59 Years | 5 (55.6%) | 0 (0.0%) |
| 60 to 64 Years | 0 (0.0%) | 0 (0.0%) |
| 65 to 74 Years | 16 (33.3%) | 0 (0.0%) |
| 75 Years and over | 0 (0.0%) | 0 (0.0%) |
| Total | 51 (54.8%) | 0 (0.0%) |
Employment Status by Educational Attainment in Crystal Mountain
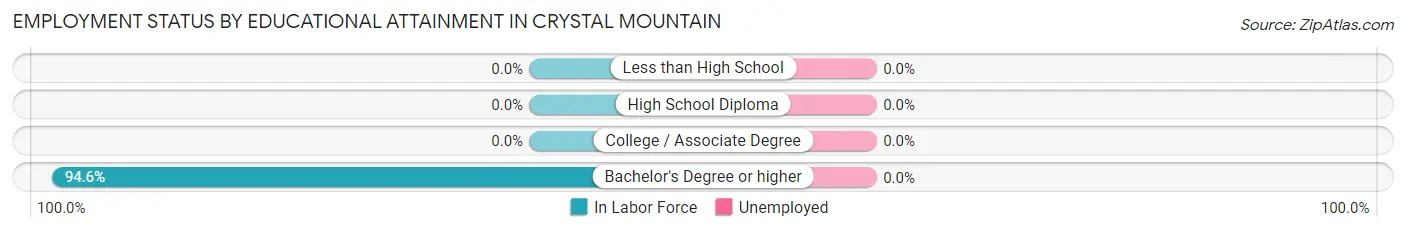
| Educational Attainment | In Labor Force | Unemployed |
| Less than High School | 0 (0.0%) | 0 (0.0%) |
| High School Diploma | 0 (0.0%) | 0 (0.0%) |
| College / Associate Degree | 0 (0.0%) | 0 (0.0%) |
| Bachelor's Degree or higher | 35 (94.6%) | 0 (0.0%) |
| Total | 35 (89.7%) | 0 (0.0%) |
Employment Occupations by Sex in Crystal Mountain
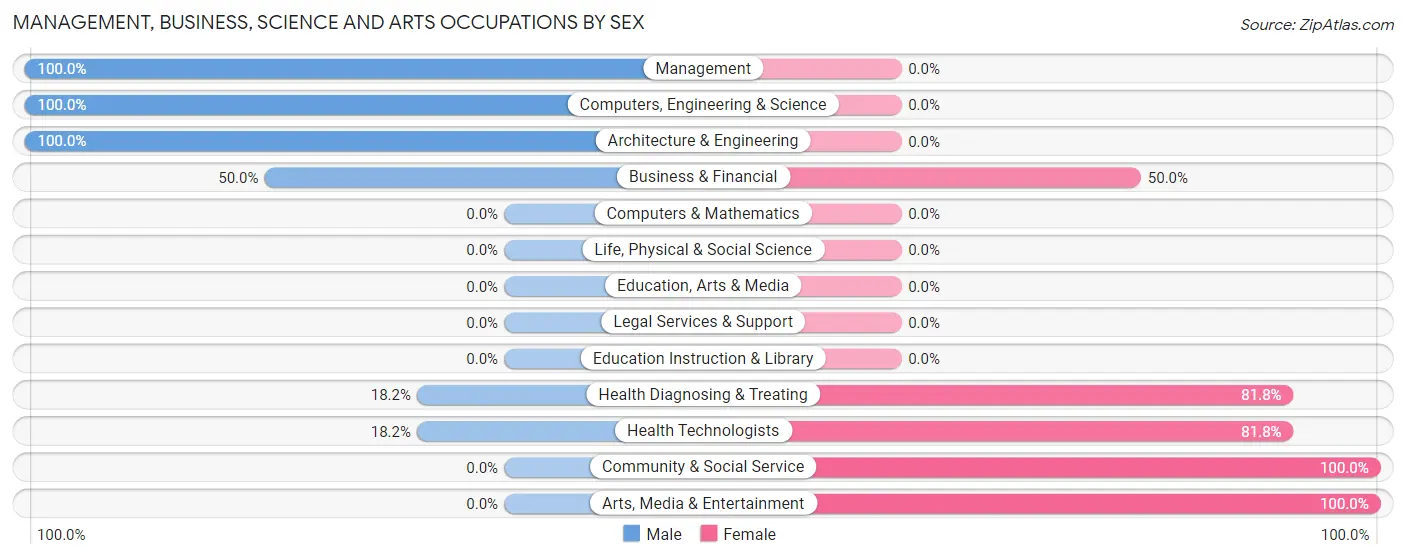
Management, Business, Science and Arts Occupations
The most common Management, Business, Science and Arts occupations in Crystal Mountain are Health Diagnosing & Treating (22 | 43.1%), Health Technologists (22 | 43.1%), Business & Financial (6 | 11.8%), Community & Social Service (3 | 5.9%), and Arts, Media & Entertainment (3 | 5.9%).
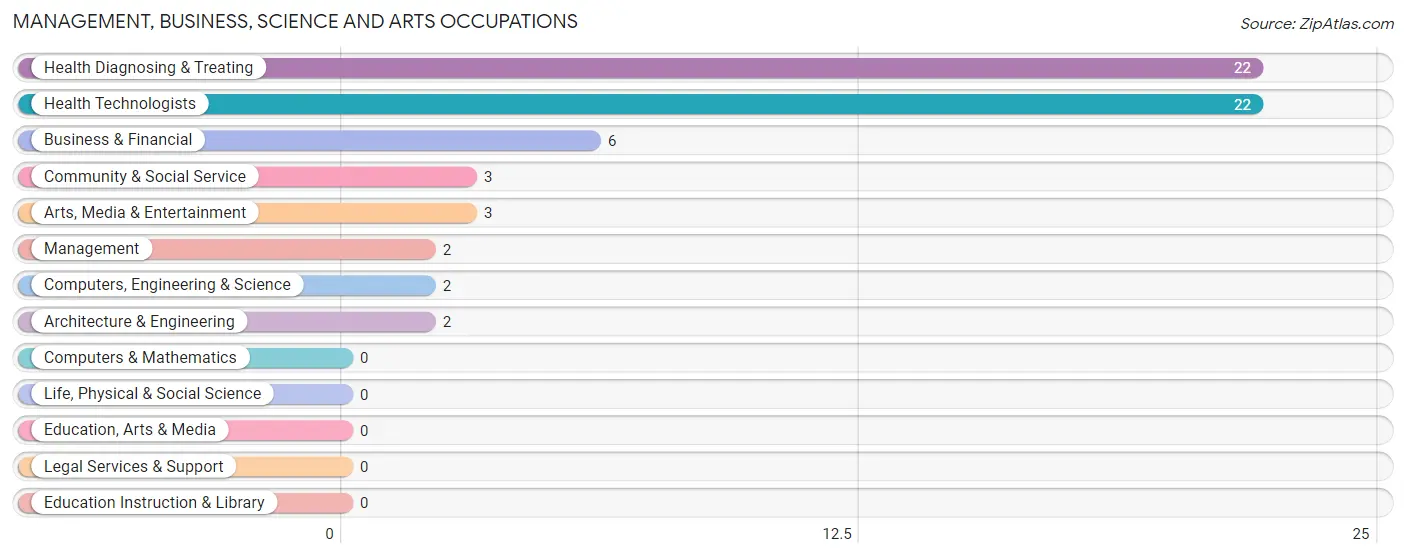
Management, Business, Science and Arts Occupations by Sex
Within the Management, Business, Science and Arts occupations in Crystal Mountain, the most male-oriented occupations are Management (100.0%), Computers, Engineering & Science (100.0%), and Architecture & Engineering (100.0%), while the most female-oriented occupations are Community & Social Service (100.0%), Arts, Media & Entertainment (100.0%), and Health Diagnosing & Treating (81.8%).
| Occupation | Male | Female |
| Management | 2 (100.0%) | 0 (0.0%) |
| Business & Financial | 3 (50.0%) | 3 (50.0%) |
| Computers, Engineering & Science | 2 (100.0%) | 0 (0.0%) |
| Computers & Mathematics | 0 (0.0%) | 0 (0.0%) |
| Architecture & Engineering | 2 (100.0%) | 0 (0.0%) |
| Life, Physical & Social Science | 0 (0.0%) | 0 (0.0%) |
| Community & Social Service | 0 (0.0%) | 3 (100.0%) |
| Education, Arts & Media | 0 (0.0%) | 0 (0.0%) |
| Legal Services & Support | 0 (0.0%) | 0 (0.0%) |
| Education Instruction & Library | 0 (0.0%) | 0 (0.0%) |
| Arts, Media & Entertainment | 0 (0.0%) | 3 (100.0%) |
| Health Diagnosing & Treating | 4 (18.2%) | 18 (81.8%) |
| Health Technologists | 4 (18.2%) | 18 (81.8%) |
| Total (Category) | 11 (31.4%) | 24 (68.6%) |
| Total (Overall) | 17 (33.3%) | 34 (66.7%) |
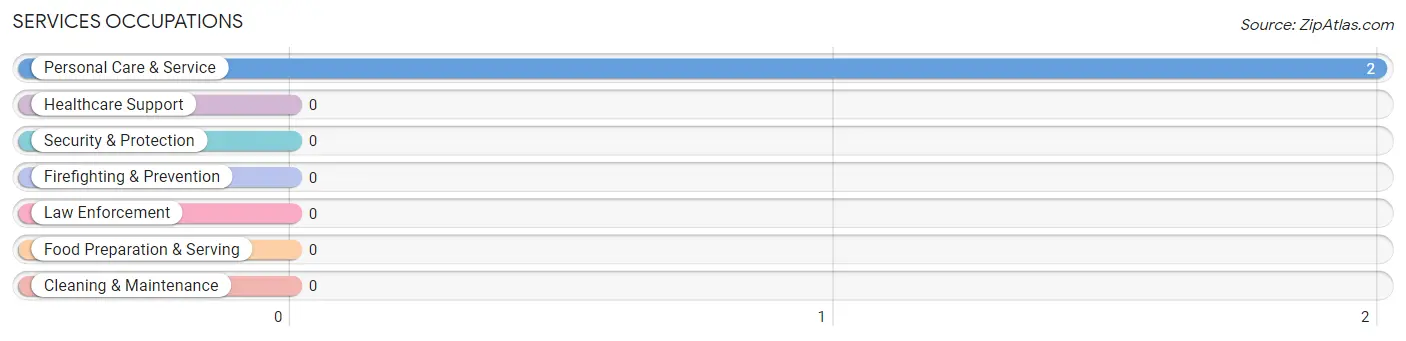
Services Occupations
The most common Services occupations in Crystal Mountain are , and Personal Care & Service (2 | 3.9%).
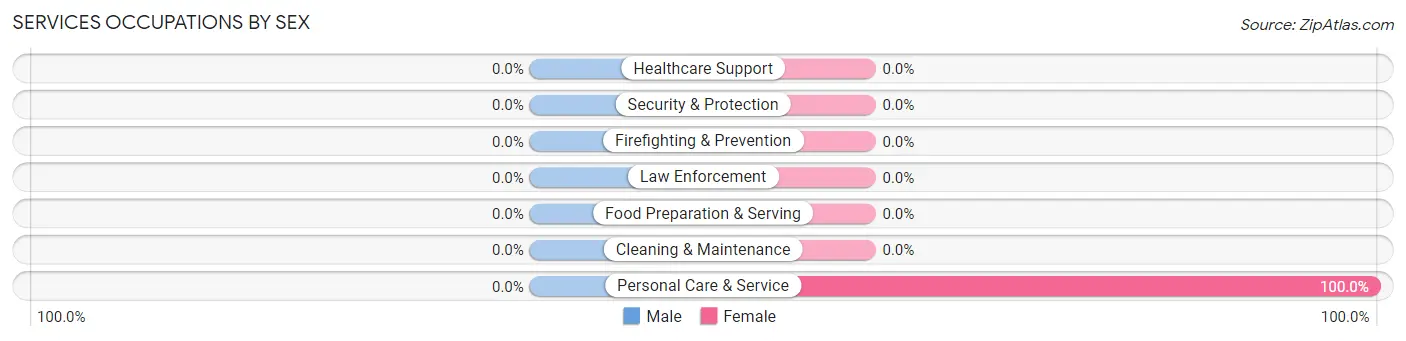
Services Occupations by Sex
| Occupation | Male | Female |
| Healthcare Support | 0 (0.0%) | 0 (0.0%) |
| Security & Protection | 0 (0.0%) | 0 (0.0%) |
| Firefighting & Prevention | 0 (0.0%) | 0 (0.0%) |
| Law Enforcement | 0 (0.0%) | 0 (0.0%) |
| Food Preparation & Serving | 0 (0.0%) | 0 (0.0%) |
| Cleaning & Maintenance | 0 (0.0%) | 0 (0.0%) |
| Personal Care & Service | 0 (0.0%) | 2 (100.0%) |
| Total (Category) | 0 (0.0%) | 2 (100.0%) |
| Total (Overall) | 17 (33.3%) | 34 (66.7%) |
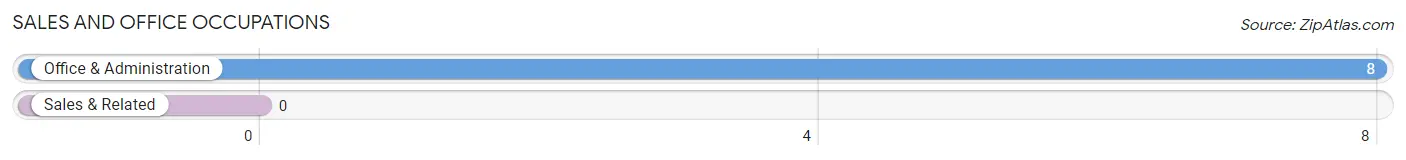
Sales and Office Occupations
The most common Sales and Office occupations in Crystal Mountain are , and Office & Administration (8 | 15.7%).
Sales and Office Occupations by Sex
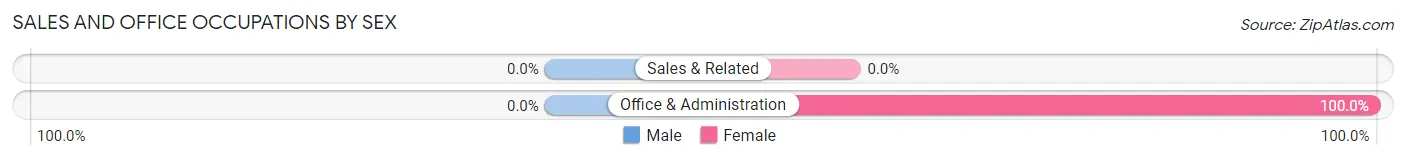
| Occupation | Male | Female |
| Sales & Related | 0 (0.0%) | 0 (0.0%) |
| Office & Administration | 0 (0.0%) | 8 (100.0%) |
| Total (Category) | 0 (0.0%) | 8 (100.0%) |
| Total (Overall) | 17 (33.3%) | 34 (66.7%) |
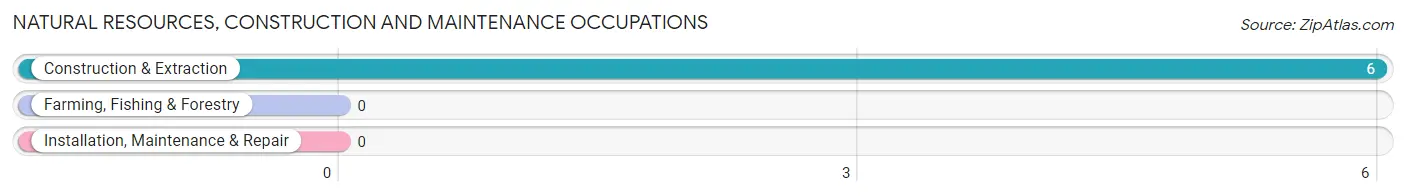
Natural Resources, Construction and Maintenance Occupations
The most common Natural Resources, Construction and Maintenance occupations in Crystal Mountain are , and Construction & Extraction (6 | 11.8%).
Natural Resources, Construction and Maintenance Occupations by Sex
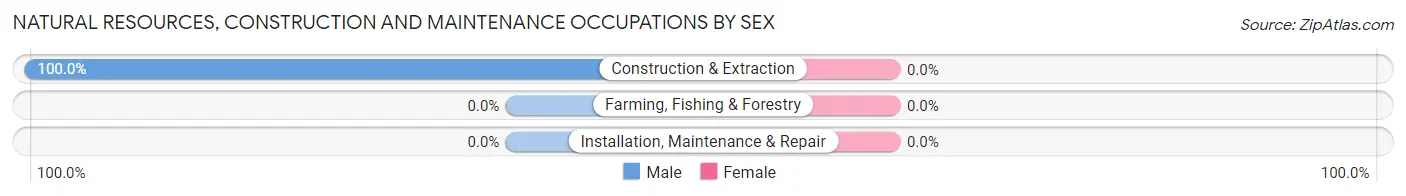
| Occupation | Male | Female |
| Farming, Fishing & Forestry | 0 (0.0%) | 0 (0.0%) |
| Construction & Extraction | 6 (100.0%) | 0 (0.0%) |
| Installation, Maintenance & Repair | 0 (0.0%) | 0 (0.0%) |
| Total (Category) | 6 (100.0%) | 0 (0.0%) |
| Total (Overall) | 17 (33.3%) | 34 (66.7%) |
Production, Transportation and Moving Occupations
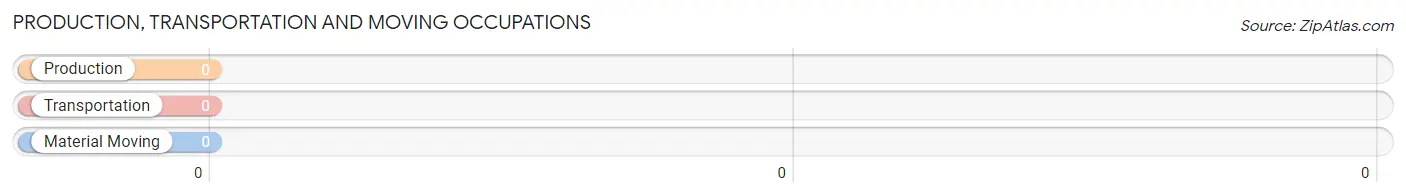
Production, Transportation and Moving Occupations by Sex
| Occupation | Male | Female |
| Production | 0 (0.0%) | 0 (0.0%) |
| Transportation | 0 (0.0%) | 0 (0.0%) |
| Material Moving | 0 (0.0%) | 0 (0.0%) |
| Total (Category) | 0 (0.0%) | 0 (0.0%) |
| Total (Overall) | 17 (33.3%) | 34 (66.7%) |
Employment Industries by Sex in Crystal Mountain
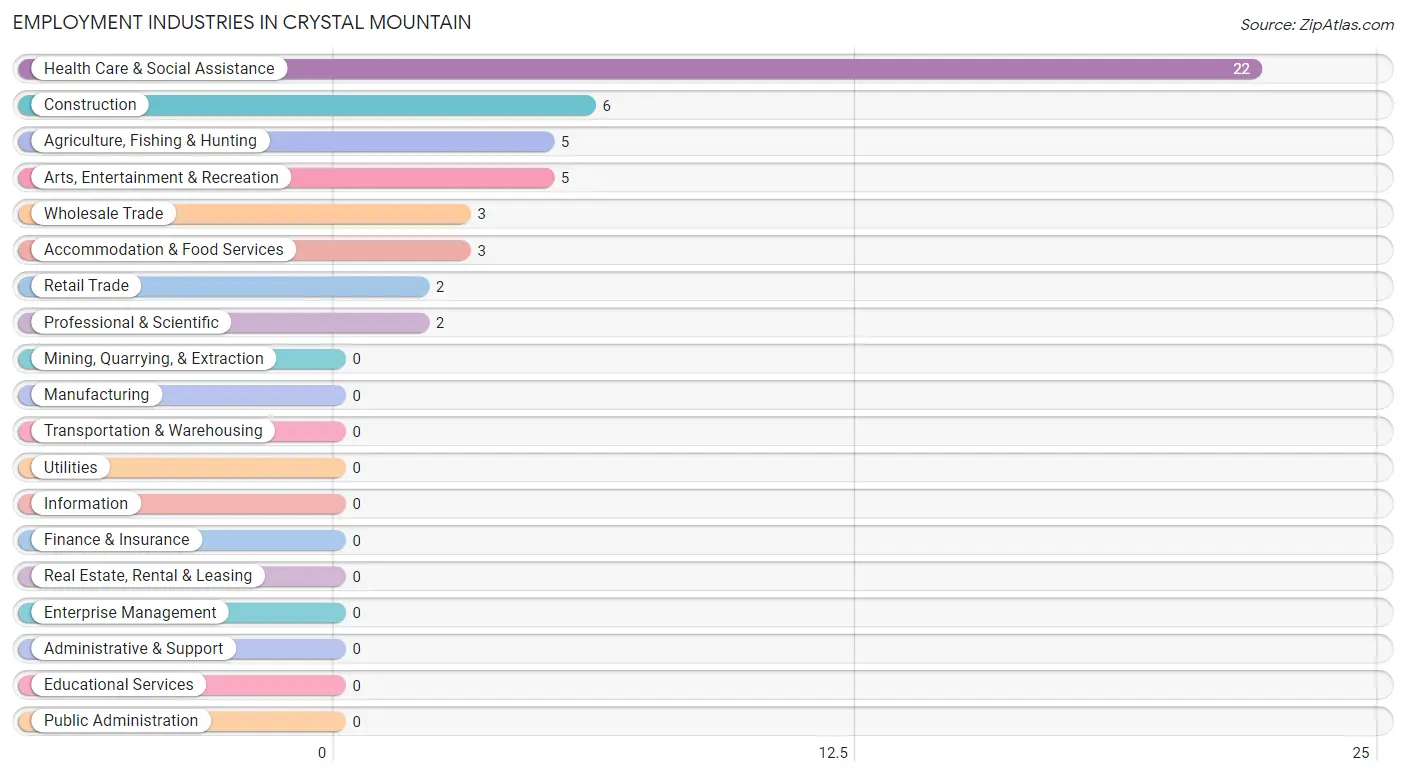
Employment Industries in Crystal Mountain
The major employment industries in Crystal Mountain include Health Care & Social Assistance (22 | 43.1%), Construction (6 | 11.8%), Agriculture, Fishing & Hunting (5 | 9.8%), Arts, Entertainment & Recreation (5 | 9.8%), and Wholesale Trade (3 | 5.9%).
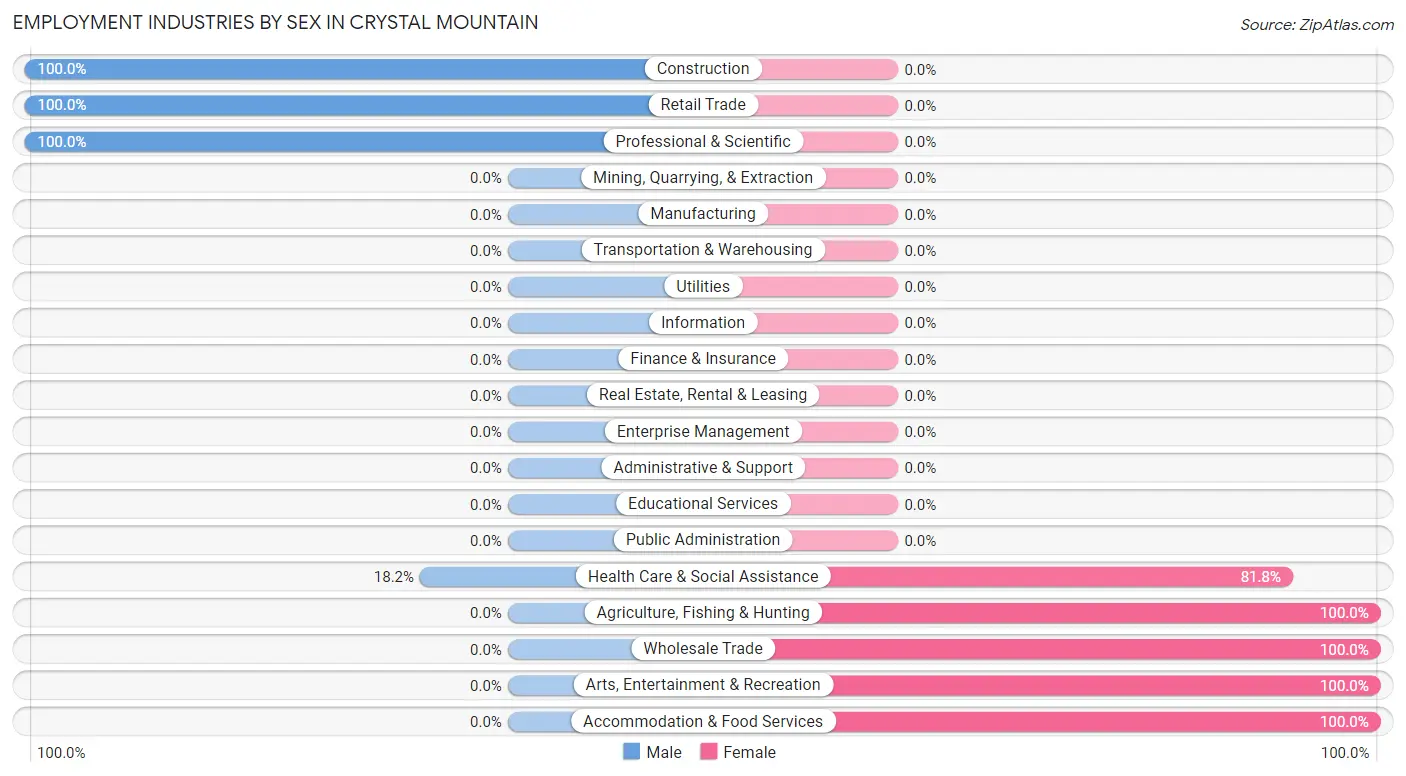
Employment Industries by Sex in Crystal Mountain
The Crystal Mountain industries that see more men than women are Construction (100.0%), Retail Trade (100.0%), and Professional & Scientific (100.0%), whereas the industries that tend to have a higher number of women are Agriculture, Fishing & Hunting (100.0%), Wholesale Trade (100.0%), and Arts, Entertainment & Recreation (100.0%).
| Industry | Male | Female |
| Agriculture, Fishing & Hunting | 0 (0.0%) | 5 (100.0%) |
| Mining, Quarrying, & Extraction | 0 (0.0%) | 0 (0.0%) |
| Construction | 6 (100.0%) | 0 (0.0%) |
| Manufacturing | 0 (0.0%) | 0 (0.0%) |
| Wholesale Trade | 0 (0.0%) | 3 (100.0%) |
| Retail Trade | 2 (100.0%) | 0 (0.0%) |
| Transportation & Warehousing | 0 (0.0%) | 0 (0.0%) |
| Utilities | 0 (0.0%) | 0 (0.0%) |
| Information | 0 (0.0%) | 0 (0.0%) |
| Finance & Insurance | 0 (0.0%) | 0 (0.0%) |
| Real Estate, Rental & Leasing | 0 (0.0%) | 0 (0.0%) |
| Professional & Scientific | 2 (100.0%) | 0 (0.0%) |
| Enterprise Management | 0 (0.0%) | 0 (0.0%) |
| Administrative & Support | 0 (0.0%) | 0 (0.0%) |
| Educational Services | 0 (0.0%) | 0 (0.0%) |
| Health Care & Social Assistance | 4 (18.2%) | 18 (81.8%) |
| Arts, Entertainment & Recreation | 0 (0.0%) | 5 (100.0%) |
| Accommodation & Food Services | 0 (0.0%) | 3 (100.0%) |
| Public Administration | 0 (0.0%) | 0 (0.0%) |
| Total | 17 (33.3%) | 34 (66.7%) |
Education in Crystal Mountain
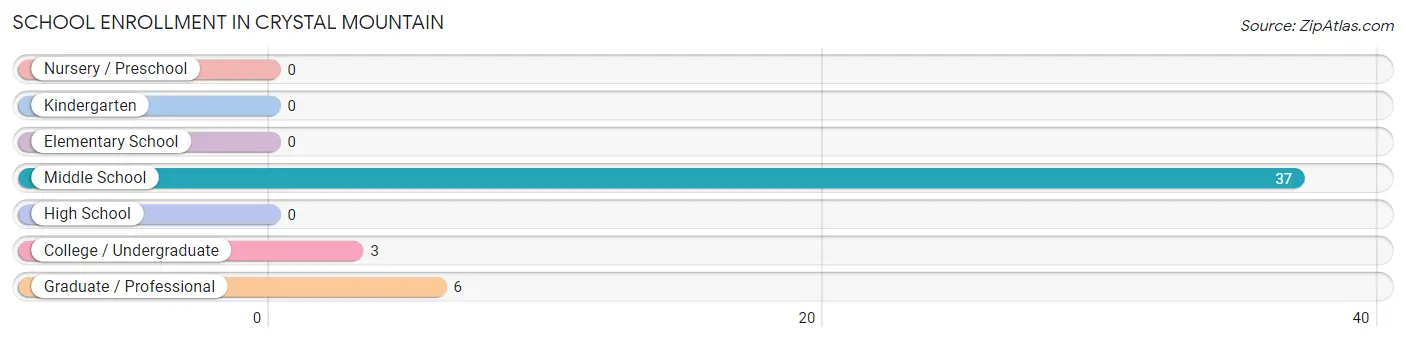
School Enrollment in Crystal Mountain
The most common levels of schooling among the 46 students in Crystal Mountain are middle school (37 | 80.4%), graduate / professional (6 | 13.0%), and college / undergraduate (3 | 6.5%).
| School Level | # Students | % Students |
| Nursery / Preschool | 0 | 0.0% |
| Kindergarten | 0 | 0.0% |
| Elementary School | 0 | 0.0% |
| Middle School | 37 | 80.4% |
| High School | 0 | 0.0% |
| College / Undergraduate | 3 | 6.5% |
| Graduate / Professional | 6 | 13.0% |
| Total | 46 | 100.0% |
School Enrollment by Age by Funding Source in Crystal Mountain
Out of a total of 46 students who are enrolled in schools in Crystal Mountain, 30 (65.2%) attend a private institution, while the remaining 16 (34.8%) are enrolled in public schools. The age group of 35 years and over has the highest likelihood of being enrolled in private schools, with 6 (66.7% in the age bracket) enrolled. Conversely, the age group of 10 to 14 year olds has the lowest likelihood of being enrolled in a private school, with 13 (35.1% in the age bracket) attending a public institution.
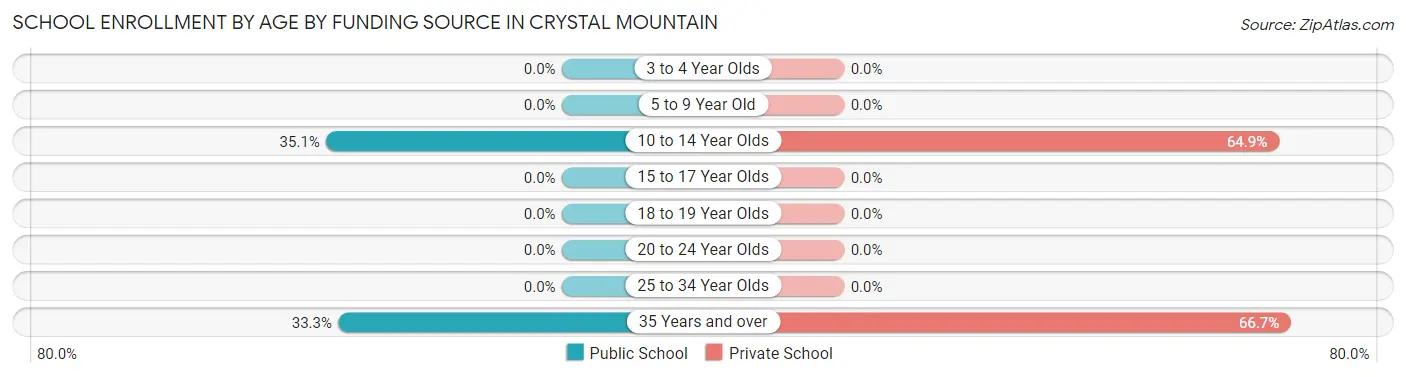
| Age Bracket | Public School | Private School |
| 3 to 4 Year Olds | 0 (0.0%) | 0 (0.0%) |
| 5 to 9 Year Old | 0 (0.0%) | 0 (0.0%) |
| 10 to 14 Year Olds | 13 (35.1%) | 24 (64.9%) |
| 15 to 17 Year Olds | 0 (0.0%) | 0 (0.0%) |
| 18 to 19 Year Olds | 0 (0.0%) | 0 (0.0%) |
| 20 to 24 Year Olds | 0 (0.0%) | 0 (0.0%) |
| 25 to 34 Year Olds | 0 (0.0%) | 0 (0.0%) |
| 35 Years and over | 3 (33.3%) | 6 (66.7%) |
| Total | 16 (34.8%) | 30 (65.2%) |
Educational Attainment by Field of Study in Crystal Mountain
Psychology (15 | 19.2%), literature & languages (12 | 15.4%), business (10 | 12.8%), education (10 | 12.8%), and science & technology (9 | 11.5%) are the most common fields of study among 78 individuals in Crystal Mountain who have obtained a bachelor's degree or higher.
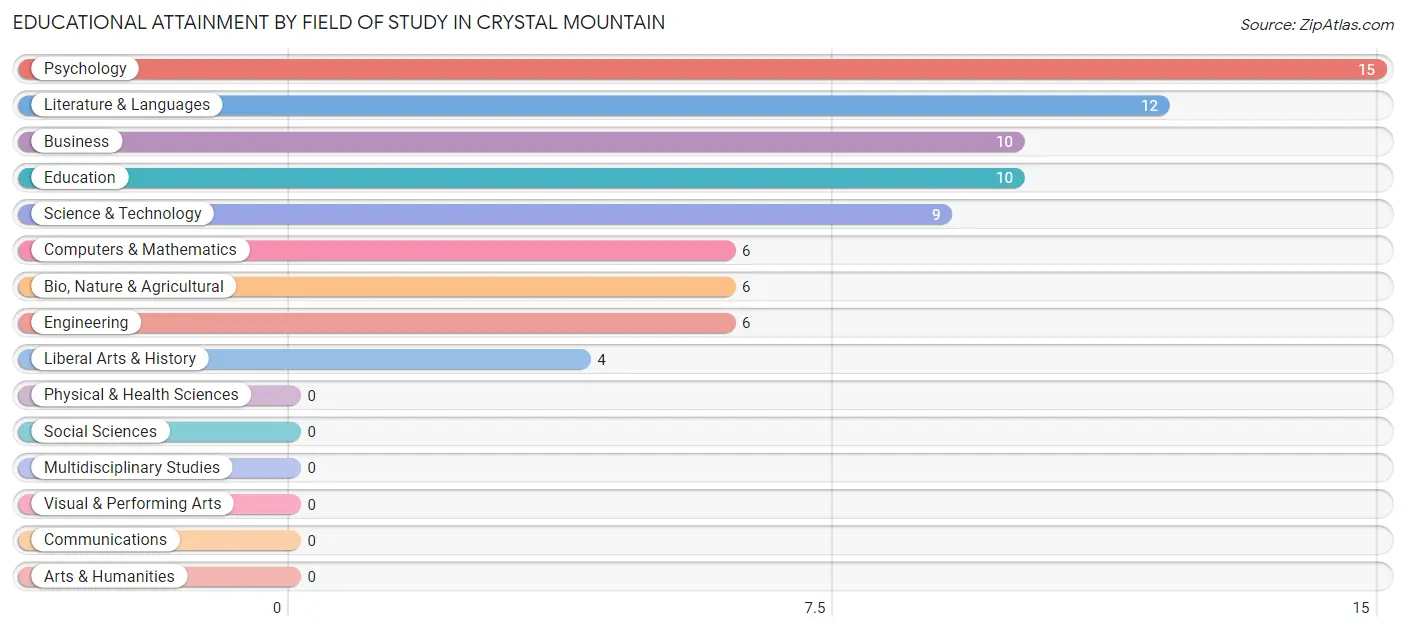
| Field of Study | # Graduates | % Graduates |
| Computers & Mathematics | 6 | 7.7% |
| Bio, Nature & Agricultural | 6 | 7.7% |
| Physical & Health Sciences | 0 | 0.0% |
| Psychology | 15 | 19.2% |
| Social Sciences | 0 | 0.0% |
| Engineering | 6 | 7.7% |
| Multidisciplinary Studies | 0 | 0.0% |
| Science & Technology | 9 | 11.5% |
| Business | 10 | 12.8% |
| Education | 10 | 12.8% |
| Literature & Languages | 12 | 15.4% |
| Liberal Arts & History | 4 | 5.1% |
| Visual & Performing Arts | 0 | 0.0% |
| Communications | 0 | 0.0% |
| Arts & Humanities | 0 | 0.0% |
| Total | 78 | 100.0% |
Transportation & Commute in Crystal Mountain
Vehicle Availability by Sex in Crystal Mountain
The most prevalent vehicle ownership categories in Crystal Mountain are males with 2 vehicles (6, accounting for 35.3%) and females with 2 vehicles (8, making up 19.4%).
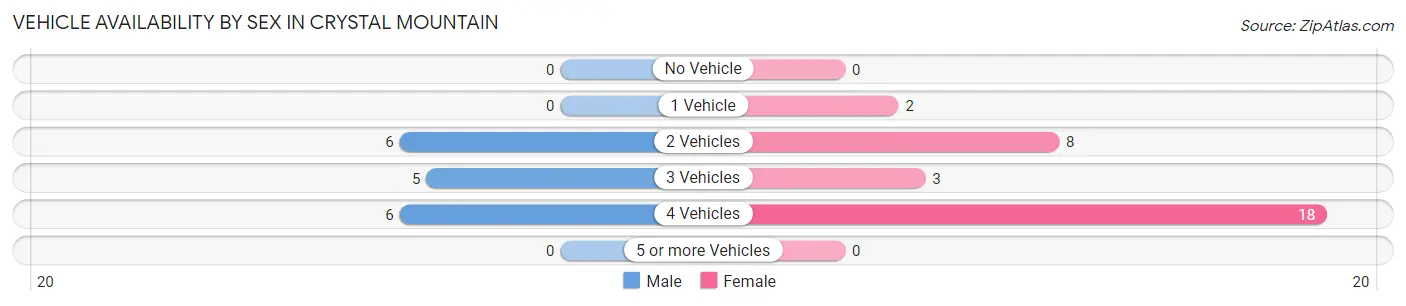
| Vehicles Available | Male | Female |
| No Vehicle | 0 (0.0%) | 0 (0.0%) |
| 1 Vehicle | 0 (0.0%) | 2 (6.5%) |
| 2 Vehicles | 6 (35.3%) | 8 (25.8%) |
| 3 Vehicles | 5 (29.4%) | 3 (9.7%) |
| 4 Vehicles | 6 (35.3%) | 18 (58.1%) |
| 5 or more Vehicles | 0 (0.0%) | 0 (0.0%) |
| Total | 17 (100.0%) | 31 (100.0%) |
Commute Time in Crystal Mountain
The most frequently occuring commute durations in Crystal Mountain are 30 to 34 minutes (21 commuters, 46.7%), 45 to 59 minutes (10 commuters, 22.2%), and 5 to 9 minutes (5 commuters, 11.1%).
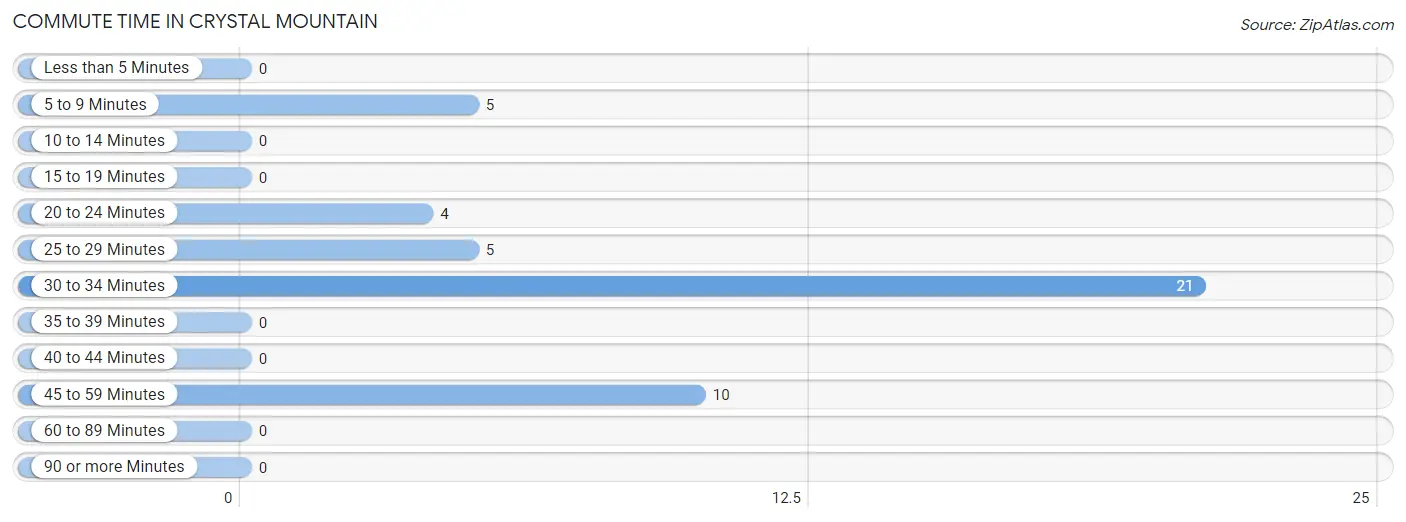
| Commute Time | # Commuters | % Commuters |
| Less than 5 Minutes | 0 | 0.0% |
| 5 to 9 Minutes | 5 | 11.1% |
| 10 to 14 Minutes | 0 | 0.0% |
| 15 to 19 Minutes | 0 | 0.0% |
| 20 to 24 Minutes | 4 | 8.9% |
| 25 to 29 Minutes | 5 | 11.1% |
| 30 to 34 Minutes | 21 | 46.7% |
| 35 to 39 Minutes | 0 | 0.0% |
| 40 to 44 Minutes | 0 | 0.0% |
| 45 to 59 Minutes | 10 | 22.2% |
| 60 to 89 Minutes | 0 | 0.0% |
| 90 or more Minutes | 0 | 0.0% |
Commute Time by Sex in Crystal Mountain
The most common commute times in Crystal Mountain are 45 to 59 minutes (10 commuters, 71.4%) for males and 30 to 34 minutes (21 commuters, 67.7%) for females.
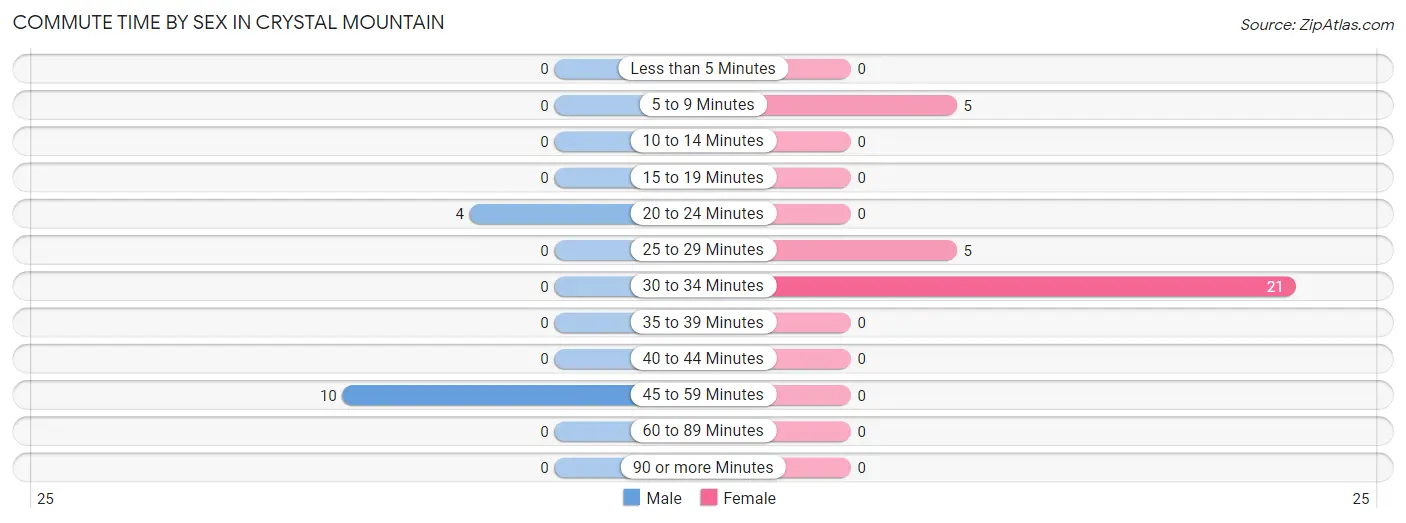
| Commute Time | Male | Female |
| Less than 5 Minutes | 0 (0.0%) | 0 (0.0%) |
| 5 to 9 Minutes | 0 (0.0%) | 5 (16.1%) |
| 10 to 14 Minutes | 0 (0.0%) | 0 (0.0%) |
| 15 to 19 Minutes | 0 (0.0%) | 0 (0.0%) |
| 20 to 24 Minutes | 4 (28.6%) | 0 (0.0%) |
| 25 to 29 Minutes | 0 (0.0%) | 5 (16.1%) |
| 30 to 34 Minutes | 0 (0.0%) | 21 (67.7%) |
| 35 to 39 Minutes | 0 (0.0%) | 0 (0.0%) |
| 40 to 44 Minutes | 0 (0.0%) | 0 (0.0%) |
| 45 to 59 Minutes | 10 (71.4%) | 0 (0.0%) |
| 60 to 89 Minutes | 0 (0.0%) | 0 (0.0%) |
| 90 or more Minutes | 0 (0.0%) | 0 (0.0%) |
Time of Departure to Work by Sex in Crystal Mountain
The most frequent times of departure to work in Crystal Mountain are 7:30 AM to 7:59 AM (12, 85.7%) for males and 4:00 PM to 11:59 PM (23, 74.2%) for females.
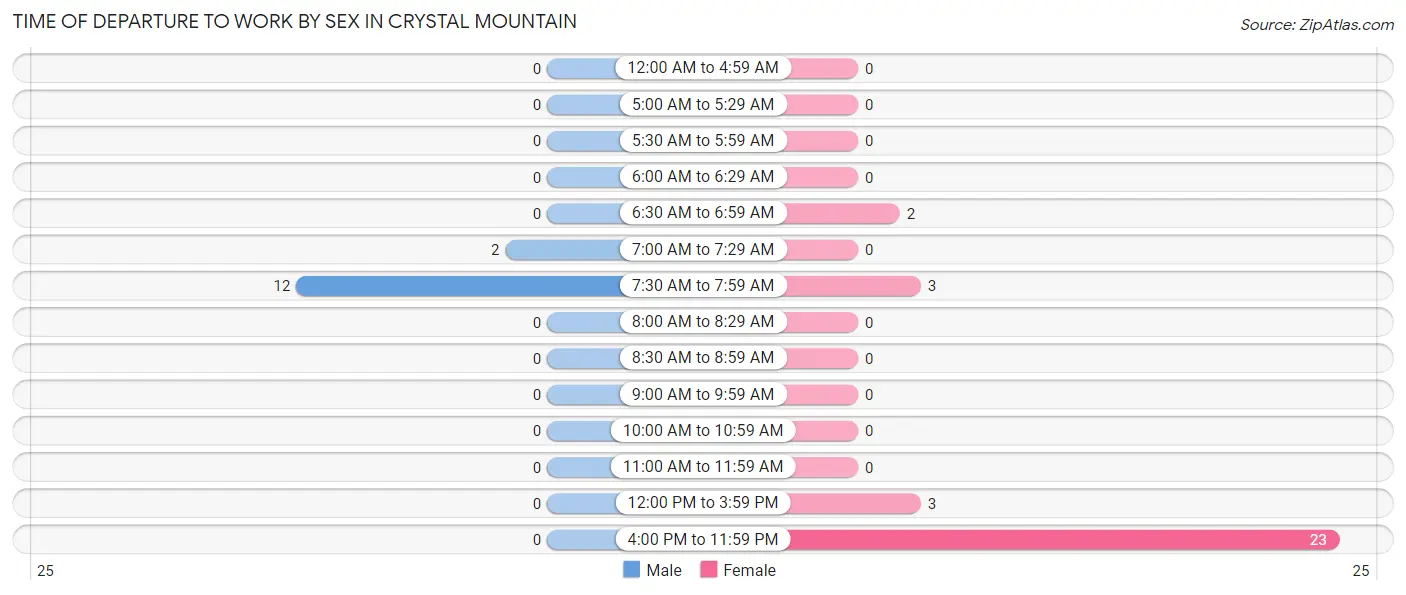
| Time of Departure | Male | Female |
| 12:00 AM to 4:59 AM | 0 (0.0%) | 0 (0.0%) |
| 5:00 AM to 5:29 AM | 0 (0.0%) | 0 (0.0%) |
| 5:30 AM to 5:59 AM | 0 (0.0%) | 0 (0.0%) |
| 6:00 AM to 6:29 AM | 0 (0.0%) | 0 (0.0%) |
| 6:30 AM to 6:59 AM | 0 (0.0%) | 2 (6.5%) |
| 7:00 AM to 7:29 AM | 2 (14.3%) | 0 (0.0%) |
| 7:30 AM to 7:59 AM | 12 (85.7%) | 3 (9.7%) |
| 8:00 AM to 8:29 AM | 0 (0.0%) | 0 (0.0%) |
| 8:30 AM to 8:59 AM | 0 (0.0%) | 0 (0.0%) |
| 9:00 AM to 9:59 AM | 0 (0.0%) | 0 (0.0%) |
| 10:00 AM to 10:59 AM | 0 (0.0%) | 0 (0.0%) |
| 11:00 AM to 11:59 AM | 0 (0.0%) | 0 (0.0%) |
| 12:00 PM to 3:59 PM | 0 (0.0%) | 3 (9.7%) |
| 4:00 PM to 11:59 PM | 0 (0.0%) | 23 (74.2%) |
| Total | 14 (100.0%) | 31 (100.0%) |
Housing Occupancy in Crystal Mountain
Occupancy by Ownership in Crystal Mountain
Of the total 49 dwellings in Crystal Mountain, owner-occupied units account for 49 (100.0%), while renter-occupied units make up 0 (0.0%).
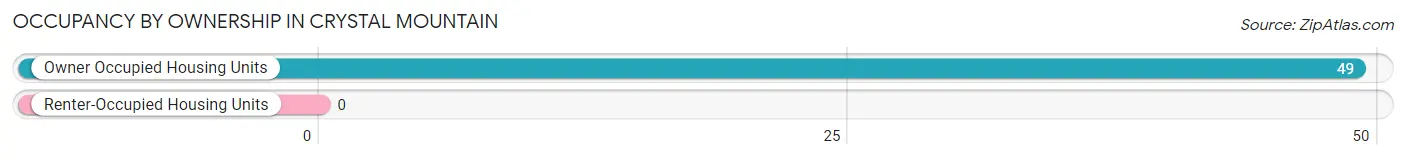
| Occupancy | # Housing Units | % Housing Units |
| Owner Occupied Housing Units | 49 | 100.0% |
| Renter-Occupied Housing Units | 0 | 0.0% |
| Total Occupied Housing Units | 49 | 100.0% |
Occupancy by Household Size in Crystal Mountain
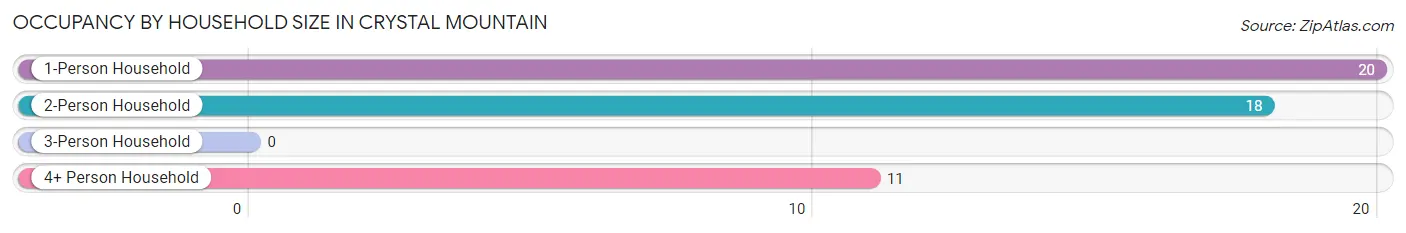
| Household Size | # Housing Units | % Housing Units |
| 1-Person Household | 20 | 40.8% |
| 2-Person Household | 18 | 36.7% |
| 3-Person Household | 0 | 0.0% |
| 4+ Person Household | 11 | 22.5% |
| Total Housing Units | 49 | 100.0% |
Occupancy by Ownership by Household Size in Crystal Mountain
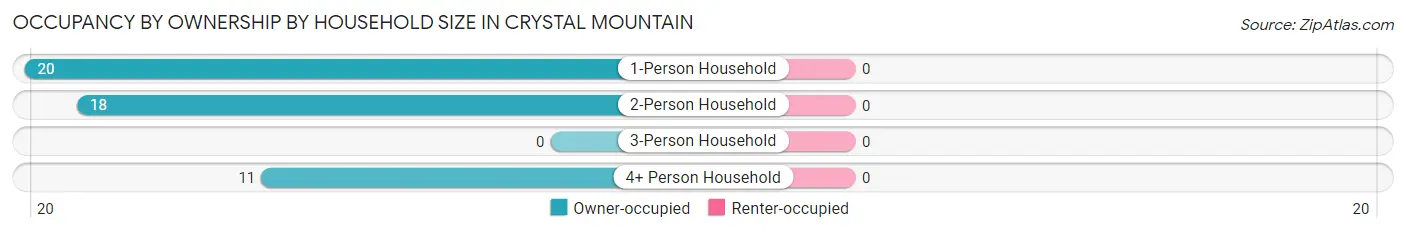
| Household Size | Owner-occupied | Renter-occupied |
| 1-Person Household | 20 (100.0%) | 0 (0.0%) |
| 2-Person Household | 18 (100.0%) | 0 (0.0%) |
| 3-Person Household | 0 (0.0%) | 0 (0.0%) |
| 4+ Person Household | 11 (100.0%) | 0 (0.0%) |
| Total Housing Units | 49 (100.0%) | 0 (0.0%) |
Occupancy by Educational Attainment in Crystal Mountain
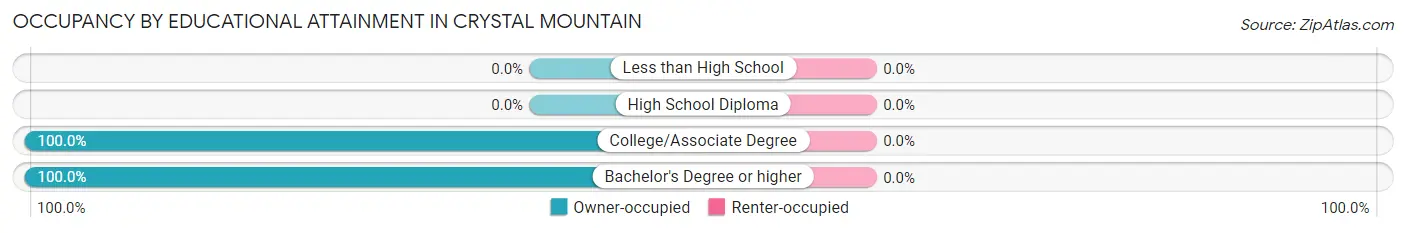
| Household Size | Owner-occupied | Renter-occupied |
| Less than High School | 0 (0.0%) | 0 (0.0%) |
| High School Diploma | 0 (0.0%) | 0 (0.0%) |
| College/Associate Degree | 20 (100.0%) | 0 (0.0%) |
| Bachelor's Degree or higher | 29 (100.0%) | 0 (0.0%) |
Occupancy by Age of Householder in Crystal Mountain
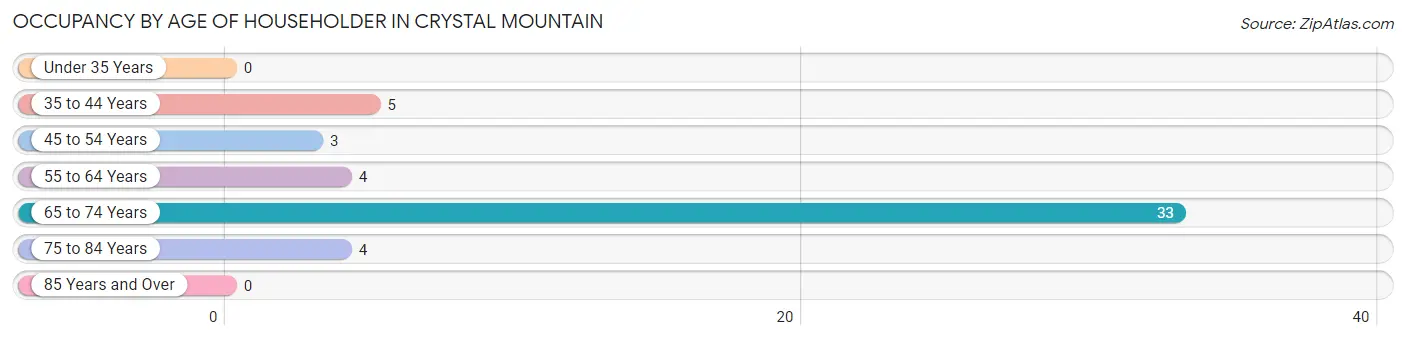
| Age Bracket | # Households | % Households |
| Under 35 Years | 0 | 0.0% |
| 35 to 44 Years | 5 | 10.2% |
| 45 to 54 Years | 3 | 6.1% |
| 55 to 64 Years | 4 | 8.2% |
| 65 to 74 Years | 33 | 67.3% |
| 75 to 84 Years | 4 | 8.2% |
| 85 Years and Over | 0 | 0.0% |
| Total | 49 | 100.0% |
Housing Finances in Crystal Mountain
Median Income by Occupancy in Crystal Mountain
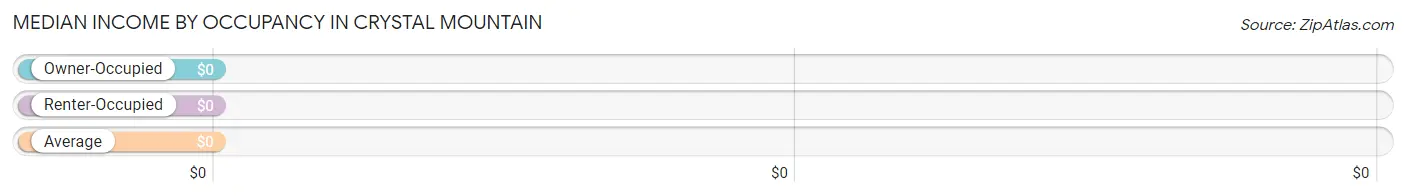
| Occupancy Type | # Households | Median Income |
| Owner-Occupied | 49 (100.0%) | $0 |
| Renter-Occupied | 0 (0.0%) | $0 |
| Average | 49 (100.0%) | $0 |
Occupancy by Householder Income Bracket in Crystal Mountain
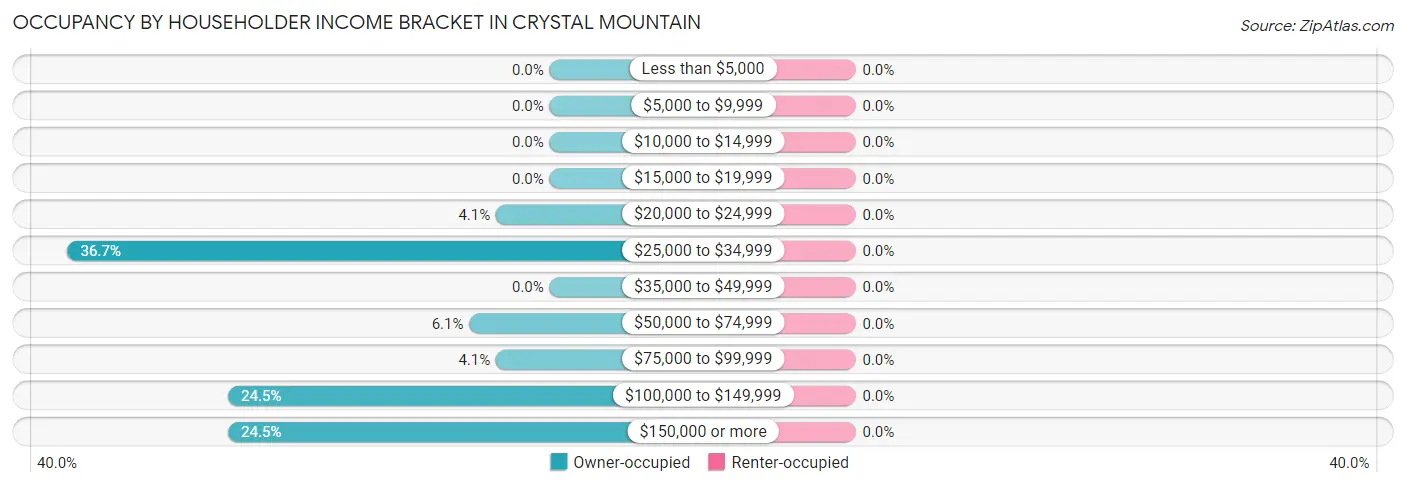
| Income Bracket | Owner-occupied | Renter-occupied |
| Less than $5,000 | 0 (0.0%) | 0 (0.0%) |
| $5,000 to $9,999 | 0 (0.0%) | 0 (0.0%) |
| $10,000 to $14,999 | 0 (0.0%) | 0 (0.0%) |
| $15,000 to $19,999 | 0 (0.0%) | 0 (0.0%) |
| $20,000 to $24,999 | 2 (4.1%) | 0 (0.0%) |
| $25,000 to $34,999 | 18 (36.7%) | 0 (0.0%) |
| $35,000 to $49,999 | 0 (0.0%) | 0 (0.0%) |
| $50,000 to $74,999 | 3 (6.1%) | 0 (0.0%) |
| $75,000 to $99,999 | 2 (4.1%) | 0 (0.0%) |
| $100,000 to $149,999 | 12 (24.5%) | 0 (0.0%) |
| $150,000 or more | 12 (24.5%) | 0 (0.0%) |
| Total | 49 (100.0%) | 0 (0.0%) |
Monthly Housing Cost Tiers in Crystal Mountain
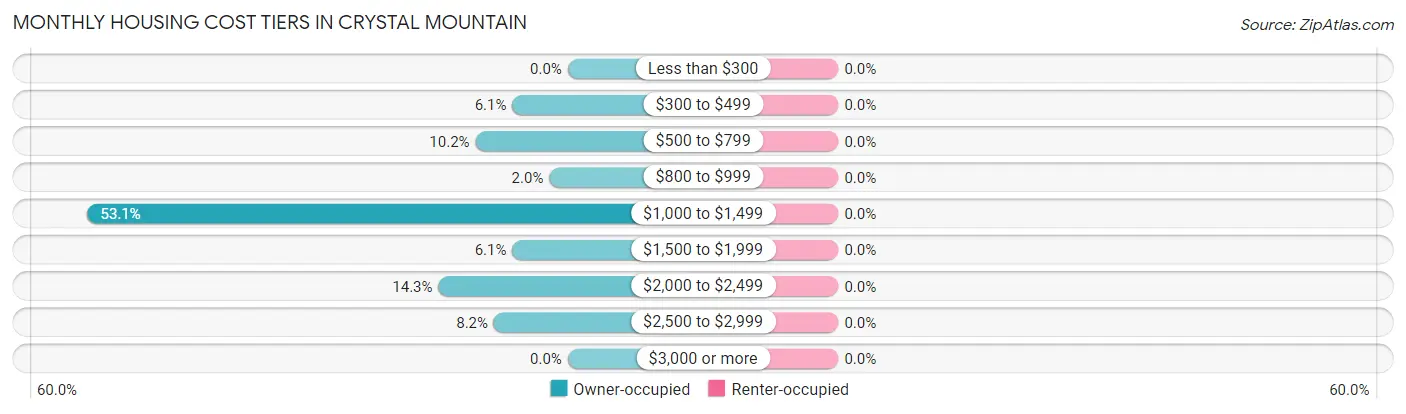
| Monthly Cost | Owner-occupied | Renter-occupied |
| Less than $300 | 0 (0.0%) | 0 (0.0%) |
| $300 to $499 | 3 (6.1%) | 0 (0.0%) |
| $500 to $799 | 5 (10.2%) | 0 (0.0%) |
| $800 to $999 | 1 (2.0%) | 0 (0.0%) |
| $1,000 to $1,499 | 26 (53.1%) | 0 (0.0%) |
| $1,500 to $1,999 | 3 (6.1%) | 0 (0.0%) |
| $2,000 to $2,499 | 7 (14.3%) | 0 (0.0%) |
| $2,500 to $2,999 | 4 (8.2%) | 0 (0.0%) |
| $3,000 or more | 0 (0.0%) | 0 (0.0%) |
| Total | 49 (100.0%) | 0 (0.0%) |
Physical Housing Characteristics in Crystal Mountain
Housing Structures in Crystal Mountain
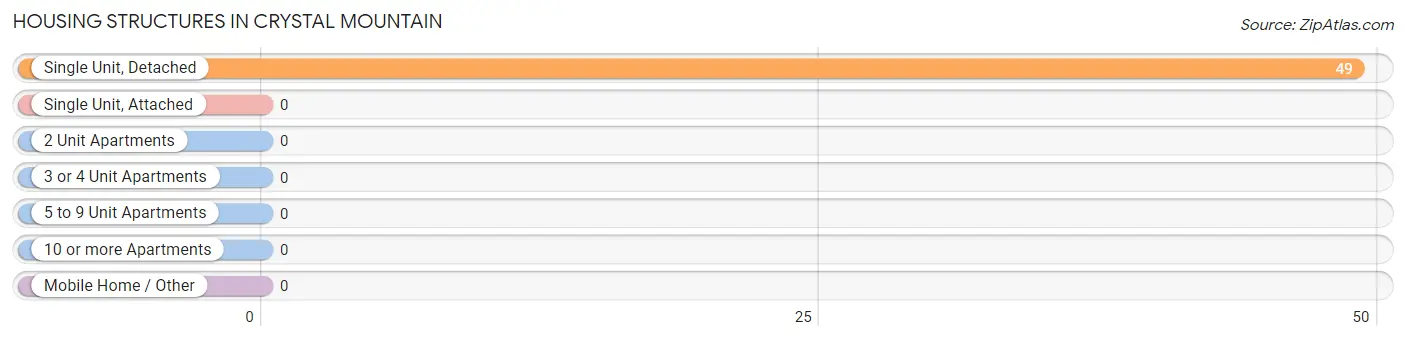
| Structure Type | # Housing Units | % Housing Units |
| Single Unit, Detached | 49 | 100.0% |
| Single Unit, Attached | 0 | 0.0% |
| 2 Unit Apartments | 0 | 0.0% |
| 3 or 4 Unit Apartments | 0 | 0.0% |
| 5 to 9 Unit Apartments | 0 | 0.0% |
| 10 or more Apartments | 0 | 0.0% |
| Mobile Home / Other | 0 | 0.0% |
| Total | 49 | 100.0% |
Housing Structures by Occupancy in Crystal Mountain
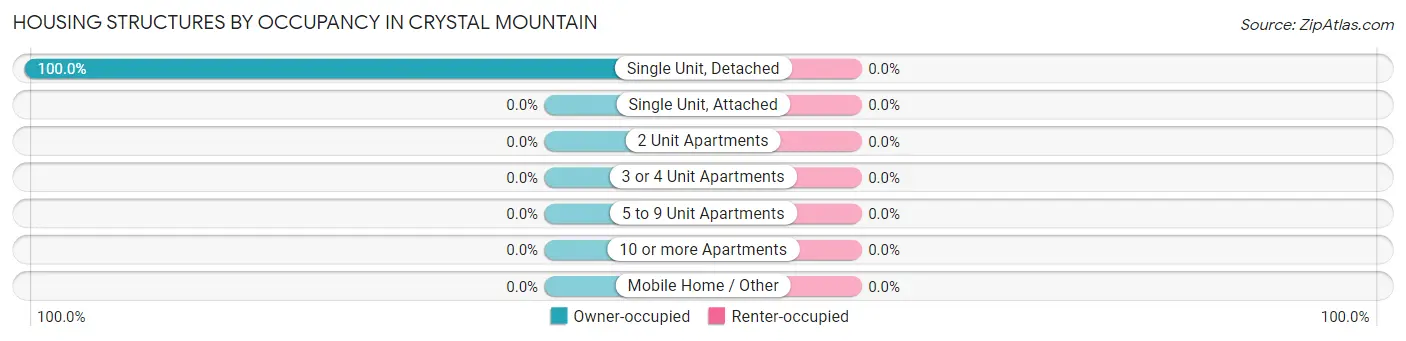
| Structure Type | Owner-occupied | Renter-occupied |
| Single Unit, Detached | 49 (100.0%) | 0 (0.0%) |
| Single Unit, Attached | 0 (0.0%) | 0 (0.0%) |
| 2 Unit Apartments | 0 (0.0%) | 0 (0.0%) |
| 3 or 4 Unit Apartments | 0 (0.0%) | 0 (0.0%) |
| 5 to 9 Unit Apartments | 0 (0.0%) | 0 (0.0%) |
| 10 or more Apartments | 0 (0.0%) | 0 (0.0%) |
| Mobile Home / Other | 0 (0.0%) | 0 (0.0%) |
| Total | 49 (100.0%) | 0 (0.0%) |
Housing Structures by Number of Rooms in Crystal Mountain
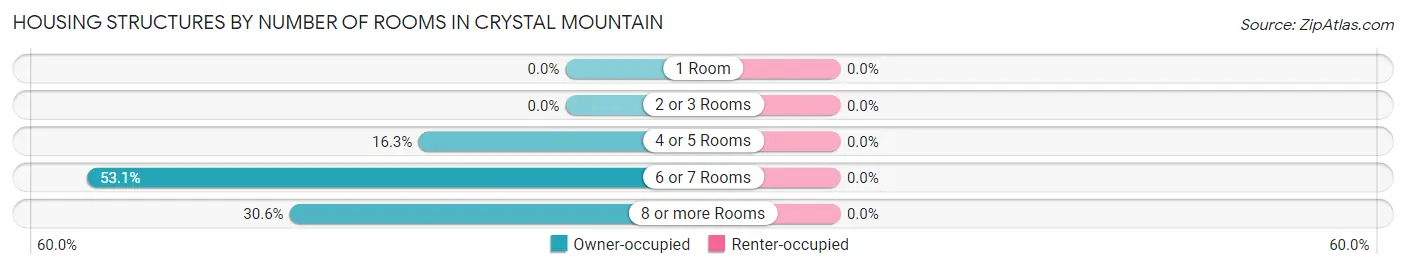
| Number of Rooms | Owner-occupied | Renter-occupied |
| 1 Room | 0 (0.0%) | 0 (0.0%) |
| 2 or 3 Rooms | 0 (0.0%) | 0 (0.0%) |
| 4 or 5 Rooms | 8 (16.3%) | 0 (0.0%) |
| 6 or 7 Rooms | 26 (53.1%) | 0 (0.0%) |
| 8 or more Rooms | 15 (30.6%) | 0 (0.0%) |
| Total | 49 (100.0%) | 0 (0.0%) |
Housing Structure by Heating Type in Crystal Mountain
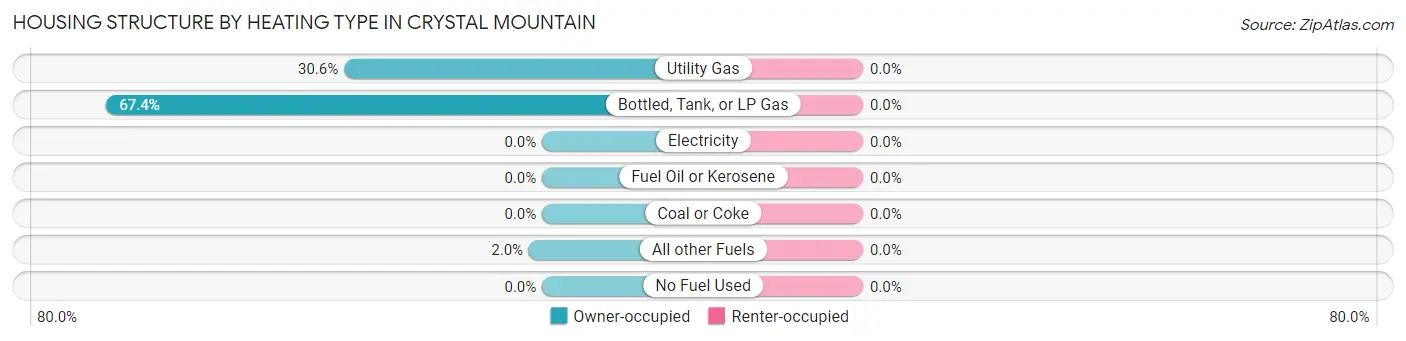
| Heating Type | Owner-occupied | Renter-occupied |
| Utility Gas | 15 (30.6%) | 0 (0.0%) |
| Bottled, Tank, or LP Gas | 33 (67.3%) | 0 (0.0%) |
| Electricity | 0 (0.0%) | 0 (0.0%) |
| Fuel Oil or Kerosene | 0 (0.0%) | 0 (0.0%) |
| Coal or Coke | 0 (0.0%) | 0 (0.0%) |
| All other Fuels | 1 (2.0%) | 0 (0.0%) |
| No Fuel Used | 0 (0.0%) | 0 (0.0%) |
| Total | 49 (100.0%) | 0 (0.0%) |
Household Vehicle Usage in Crystal Mountain
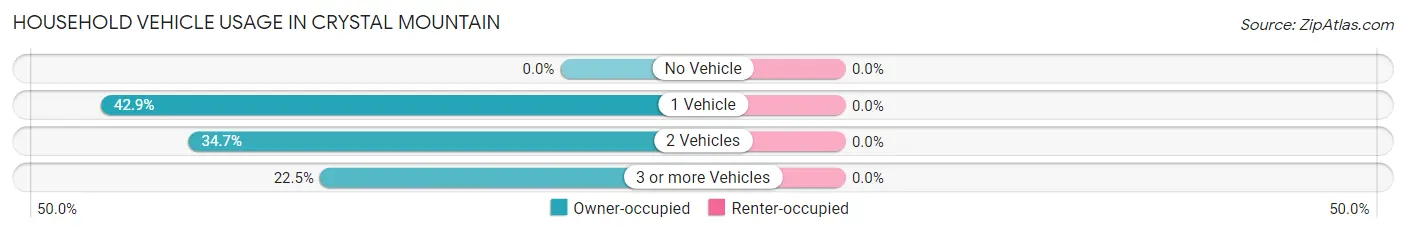
| Vehicles per Household | Owner-occupied | Renter-occupied |
| No Vehicle | 0 (0.0%) | 0 (0.0%) |
| 1 Vehicle | 21 (42.9%) | 0 (0.0%) |
| 2 Vehicles | 17 (34.7%) | 0 (0.0%) |
| 3 or more Vehicles | 11 (22.5%) | 0 (0.0%) |
| Total | 49 (100.0%) | 0 (0.0%) |
Real Estate & Mortgages in Crystal Mountain
Real Estate and Mortgage Overview in Crystal Mountain
| Characteristic | Without Mortgage | With Mortgage |
| Housing Units | 11 | 38 |
| Median Property Value | $593,800 | $440,000 |
| Median Household Income | - | - |
| Monthly Housing Costs | $583 | $0 |
| Real Estate Taxes | $3,125 | $0 |
Property Value by Mortgage Status in Crystal Mountain
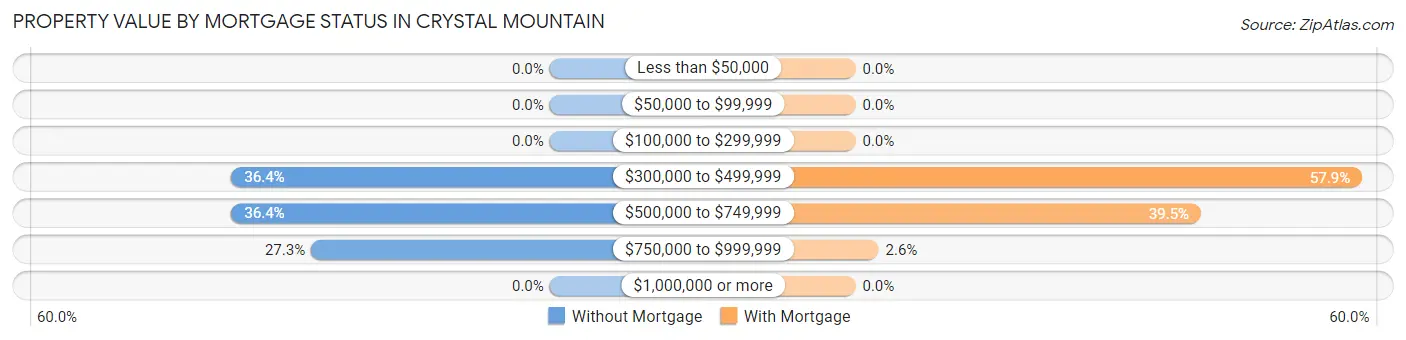
| Property Value | Without Mortgage | With Mortgage |
| Less than $50,000 | 0 (0.0%) | 0 (0.0%) |
| $50,000 to $99,999 | 0 (0.0%) | 0 (0.0%) |
| $100,000 to $299,999 | 0 (0.0%) | 0 (0.0%) |
| $300,000 to $499,999 | 4 (36.4%) | 22 (57.9%) |
| $500,000 to $749,999 | 4 (36.4%) | 15 (39.5%) |
| $750,000 to $999,999 | 3 (27.3%) | 1 (2.6%) |
| $1,000,000 or more | 0 (0.0%) | 0 (0.0%) |
| Total | 11 (100.0%) | 38 (100.0%) |
Household Income by Mortgage Status in Crystal Mountain
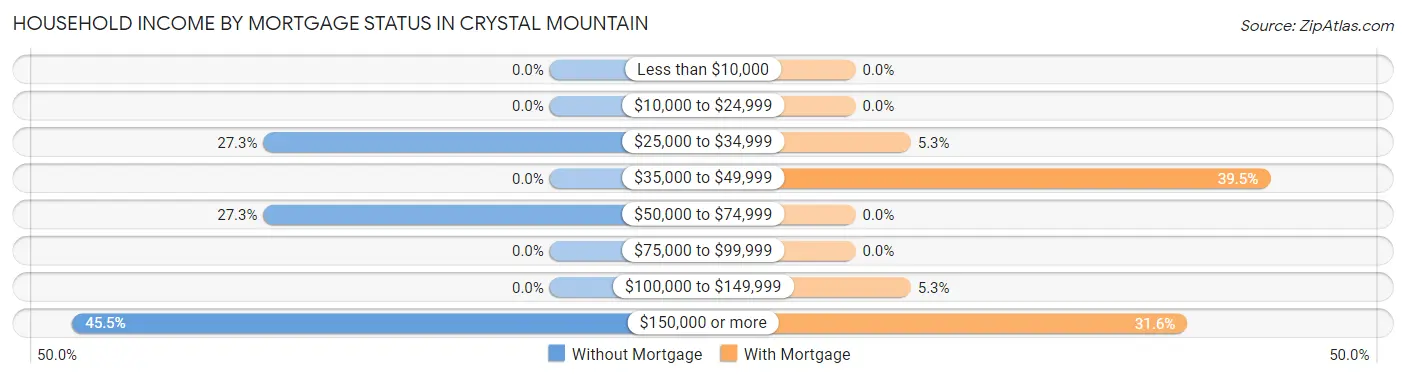
| Household Income | Without Mortgage | With Mortgage |
| Less than $10,000 | 0 (0.0%) | 0 (0.0%) |
| $10,000 to $24,999 | 0 (0.0%) | 0 (0.0%) |
| $25,000 to $34,999 | 3 (27.3%) | 2 (5.3%) |
| $35,000 to $49,999 | 0 (0.0%) | 15 (39.5%) |
| $50,000 to $74,999 | 3 (27.3%) | 0 (0.0%) |
| $75,000 to $99,999 | 0 (0.0%) | 0 (0.0%) |
| $100,000 to $149,999 | 0 (0.0%) | 2 (5.3%) |
| $150,000 or more | 5 (45.5%) | 12 (31.6%) |
| Total | 11 (100.0%) | 38 (100.0%) |
Property Value to Household Income Ratio in Crystal Mountain
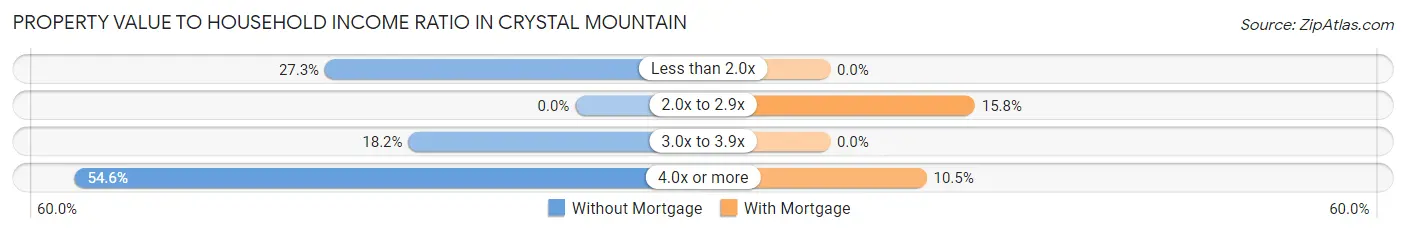
| Value-to-Income Ratio | Without Mortgage | With Mortgage |
| Less than 2.0x | 3 (27.3%) | 0 (0.0%) |
| 2.0x to 2.9x | 0 (0.0%) | 6 (15.8%) |
| 3.0x to 3.9x | 2 (18.2%) | 0 (0.0%) |
| 4.0x or more | 6 (54.5%) | 4 (10.5%) |
| Total | 11 (100.0%) | 38 (100.0%) |
Real Estate Taxes by Mortgage Status in Crystal Mountain
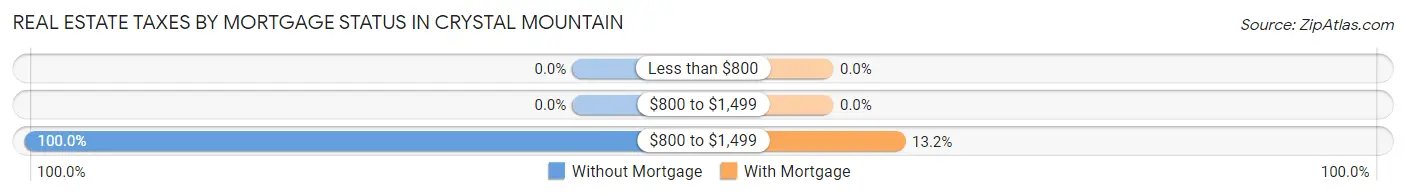
| Property Taxes | Without Mortgage | With Mortgage |
| Less than $800 | 0 (0.0%) | 0 (0.0%) |
| $800 to $1,499 | 0 (0.0%) | 0 (0.0%) |
| $800 to $1,499 | 11 (100.0%) | 5 (13.2%) |
| Total | 11 (100.0%) | 38 (100.0%) |
Health & Disability in Crystal Mountain
Health Insurance Coverage by Age in Crystal Mountain
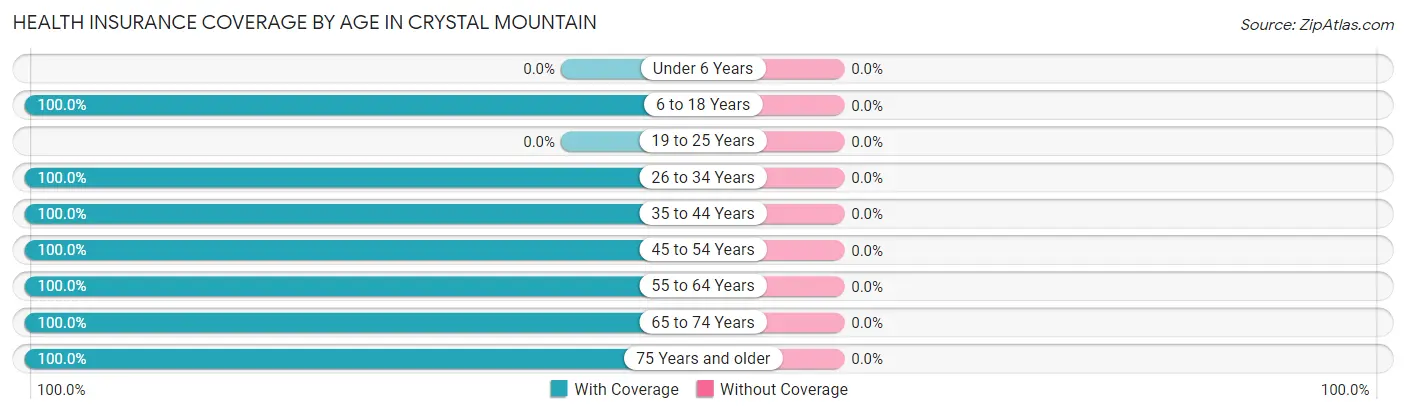
| Age Bracket | With Coverage | Without Coverage |
| Under 6 Years | 0 (0.0%) | 0 (0.0%) |
| 6 to 18 Years | 37 (100.0%) | 0 (0.0%) |
| 19 to 25 Years | 0 (0.0%) | 0 (0.0%) |
| 26 to 34 Years | 13 (100.0%) | 0 (0.0%) |
| 35 to 44 Years | 9 (100.0%) | 0 (0.0%) |
| 45 to 54 Years | 8 (100.0%) | 0 (0.0%) |
| 55 to 64 Years | 9 (100.0%) | 0 (0.0%) |
| 65 to 74 Years | 48 (100.0%) | 0 (0.0%) |
| 75 Years and older | 6 (100.0%) | 0 (0.0%) |
| Total | 130 (100.0%) | 0 (0.0%) |
Health Insurance Coverage by Citizenship Status in Crystal Mountain
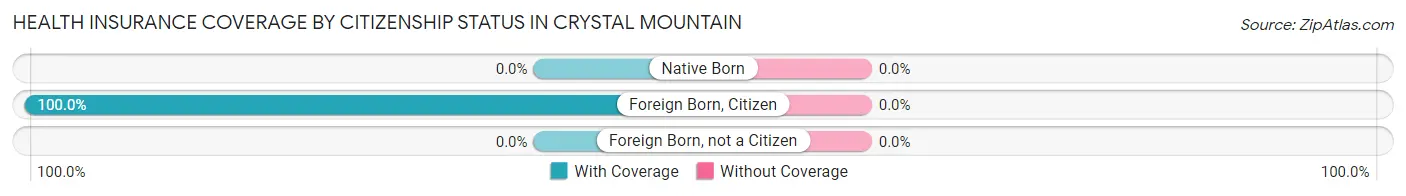
| Citizenship Status | With Coverage | Without Coverage |
| Native Born | 0 (0.0%) | 0 (0.0%) |
| Foreign Born, Citizen | 37 (100.0%) | 0 (0.0%) |
| Foreign Born, not a Citizen | 0 (0.0%) | 0 (0.0%) |
Health Insurance Coverage by Household Income in Crystal Mountain
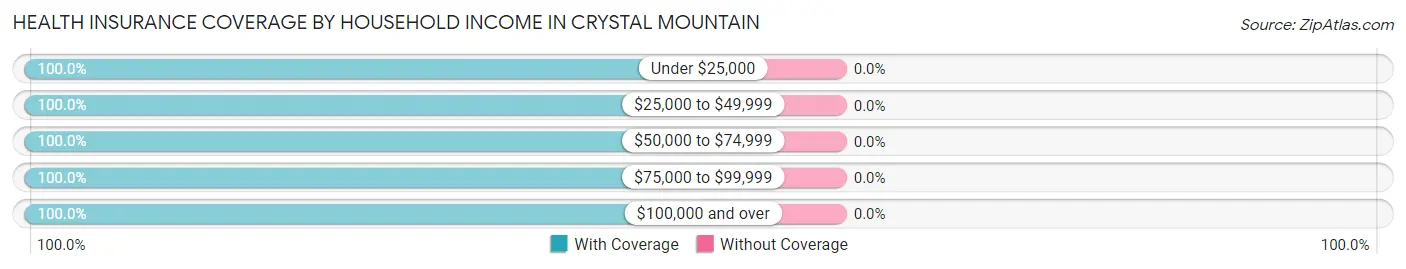
| Household Income | With Coverage | Without Coverage |
| Under $25,000 | 2 (100.0%) | 0 (0.0%) |
| $25,000 to $49,999 | 18 (100.0%) | 0 (0.0%) |
| $50,000 to $74,999 | 8 (100.0%) | 0 (0.0%) |
| $75,000 to $99,999 | 4 (100.0%) | 0 (0.0%) |
| $100,000 and over | 98 (100.0%) | 0 (0.0%) |
Public vs Private Health Insurance Coverage by Age in Crystal Mountain
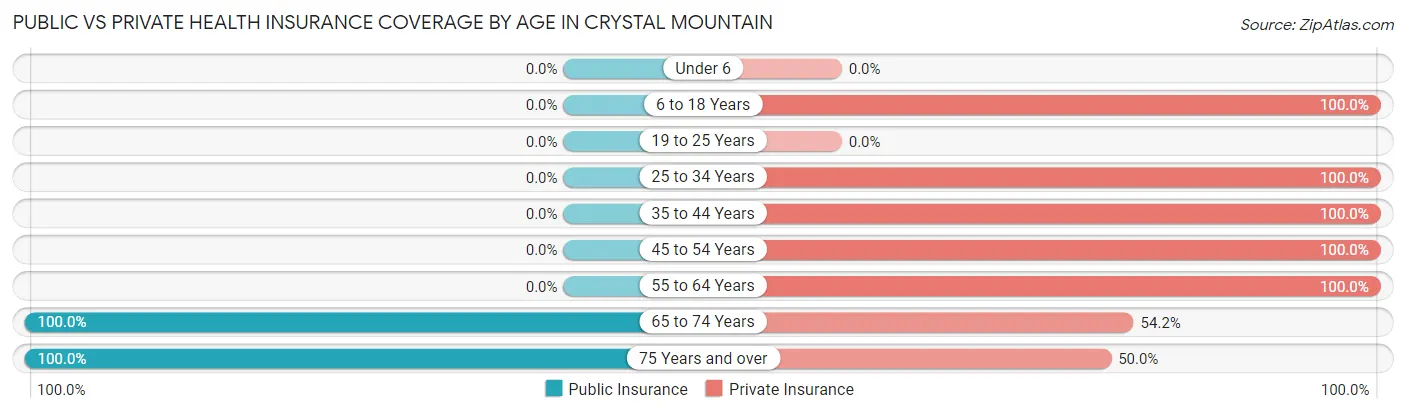
| Age Bracket | Public Insurance | Private Insurance |
| Under 6 | 0 (0.0%) | 0 (0.0%) |
| 6 to 18 Years | 0 (0.0%) | 37 (100.0%) |
| 19 to 25 Years | 0 (0.0%) | 0 (0.0%) |
| 25 to 34 Years | 0 (0.0%) | 13 (100.0%) |
| 35 to 44 Years | 0 (0.0%) | 9 (100.0%) |
| 45 to 54 Years | 0 (0.0%) | 8 (100.0%) |
| 55 to 64 Years | 0 (0.0%) | 9 (100.0%) |
| 65 to 74 Years | 48 (100.0%) | 26 (54.2%) |
| 75 Years and over | 6 (100.0%) | 3 (50.0%) |
| Total | 54 (41.5%) | 105 (80.8%) |
Disability Status by Sex by Age in Crystal Mountain
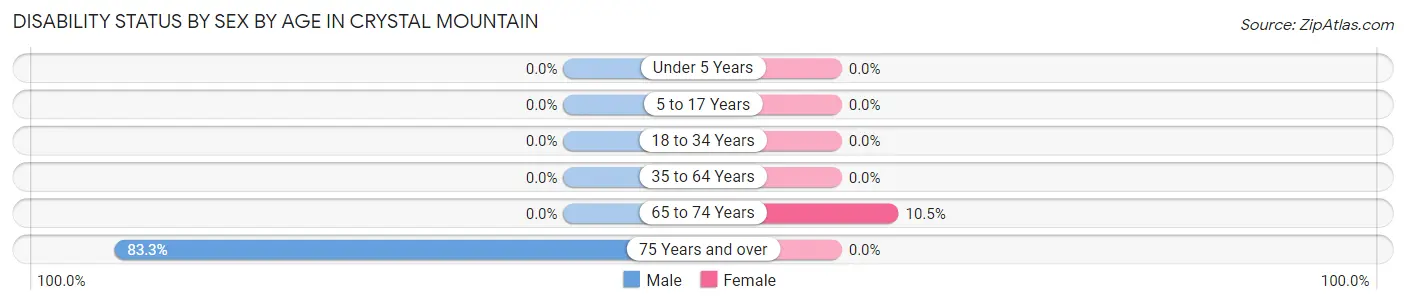
| Age Bracket | Male | Female |
| Under 5 Years | 0 (0.0%) | 0 (0.0%) |
| 5 to 17 Years | 0 (0.0%) | 0 (0.0%) |
| 18 to 34 Years | 0 (0.0%) | 0 (0.0%) |
| 35 to 64 Years | 0 (0.0%) | 0 (0.0%) |
| 65 to 74 Years | 0 (0.0%) | 2 (10.5%) |
| 75 Years and over | 5 (83.3%) | 0 (0.0%) |
Disability Class by Sex by Age in Crystal Mountain
Disability Class: Hearing Difficulty
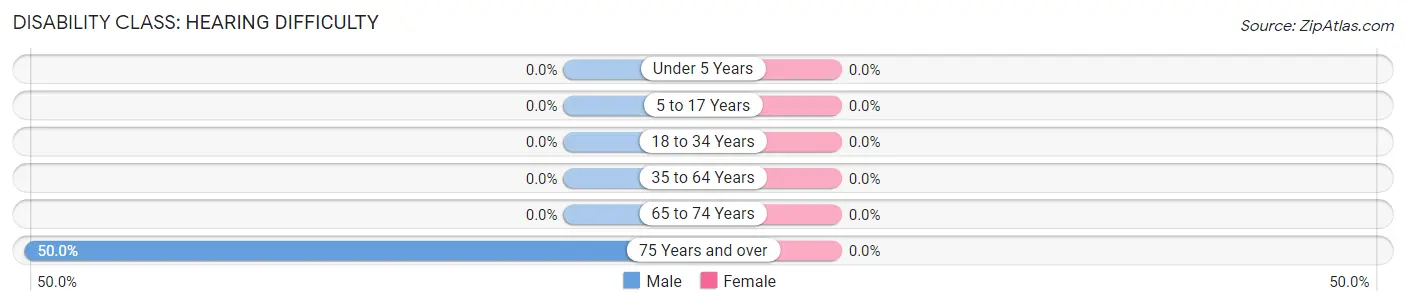
| Age Bracket | Male | Female |
| Under 5 Years | 0 (0.0%) | 0 (0.0%) |
| 5 to 17 Years | 0 (0.0%) | 0 (0.0%) |
| 18 to 34 Years | 0 (0.0%) | 0 (0.0%) |
| 35 to 64 Years | 0 (0.0%) | 0 (0.0%) |
| 65 to 74 Years | 0 (0.0%) | 0 (0.0%) |
| 75 Years and over | 3 (50.0%) | 0 (0.0%) |
Disability Class: Vision Difficulty
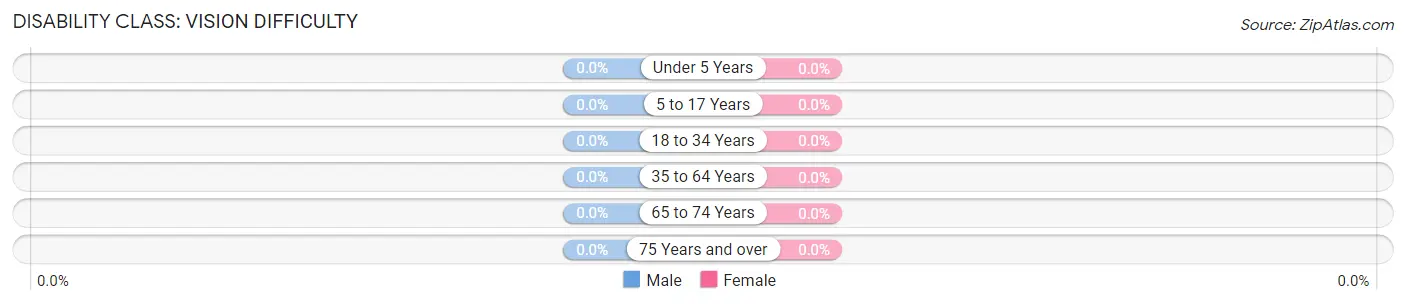
| Age Bracket | Male | Female |
| Under 5 Years | 0 (0.0%) | 0 (0.0%) |
| 5 to 17 Years | 0 (0.0%) | 0 (0.0%) |
| 18 to 34 Years | 0 (0.0%) | 0 (0.0%) |
| 35 to 64 Years | 0 (0.0%) | 0 (0.0%) |
| 65 to 74 Years | 0 (0.0%) | 0 (0.0%) |
| 75 Years and over | 0 (0.0%) | 0 (0.0%) |
Disability Class: Cognitive Difficulty
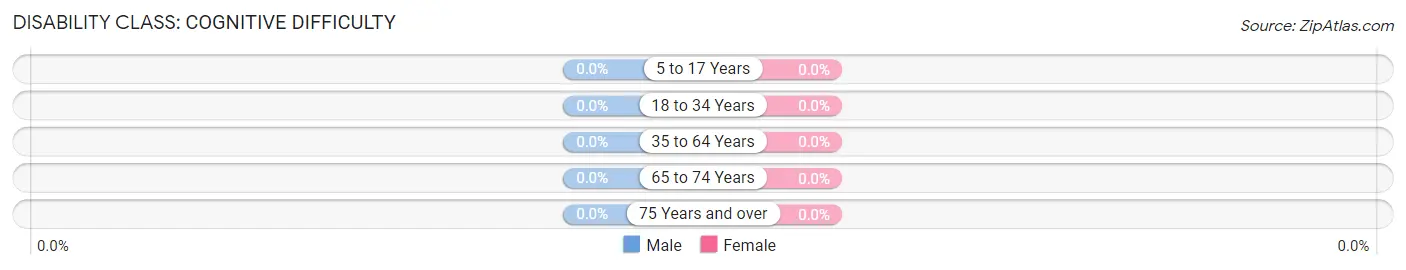
| Age Bracket | Male | Female |
| 5 to 17 Years | 0 (0.0%) | 0 (0.0%) |
| 18 to 34 Years | 0 (0.0%) | 0 (0.0%) |
| 35 to 64 Years | 0 (0.0%) | 0 (0.0%) |
| 65 to 74 Years | 0 (0.0%) | 0 (0.0%) |
| 75 Years and over | 0 (0.0%) | 0 (0.0%) |
Disability Class: Ambulatory Difficulty
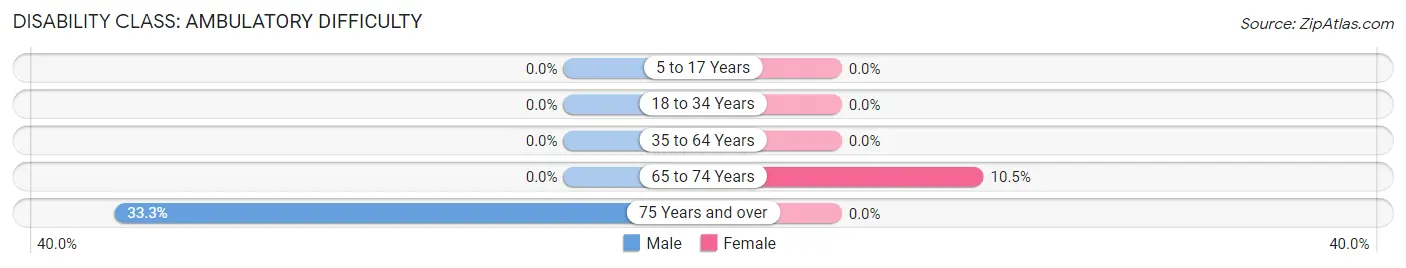
| Age Bracket | Male | Female |
| 5 to 17 Years | 0 (0.0%) | 0 (0.0%) |
| 18 to 34 Years | 0 (0.0%) | 0 (0.0%) |
| 35 to 64 Years | 0 (0.0%) | 0 (0.0%) |
| 65 to 74 Years | 0 (0.0%) | 2 (10.5%) |
| 75 Years and over | 2 (33.3%) | 0 (0.0%) |
Disability Class: Self-Care Difficulty
| Age Bracket | Male | Female |
| 5 to 17 Years | 0 (0.0%) | 0 (0.0%) |
| 18 to 34 Years | 0 (0.0%) | 0 (0.0%) |
| 35 to 64 Years | 0 (0.0%) | 0 (0.0%) |
| 65 to 74 Years | 0 (0.0%) | 0 (0.0%) |
| 75 Years and over | 0 (0.0%) | 0 (0.0%) |
Technology Access in Crystal Mountain
Computing Device Access in Crystal Mountain
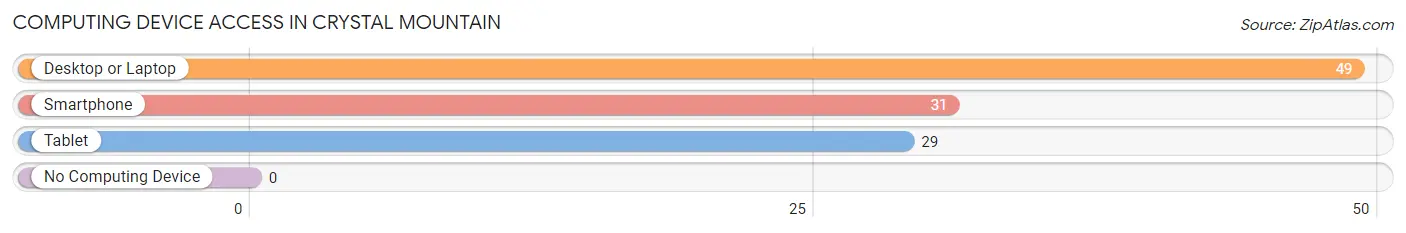
| Device Type | # Households | % Households |
| Desktop or Laptop | 49 | 100.0% |
| Smartphone | 31 | 63.3% |
| Tablet | 29 | 59.2% |
| No Computing Device | 0 | 0.0% |
| Total | 49 | 100.0% |
Internet Access in Crystal Mountain
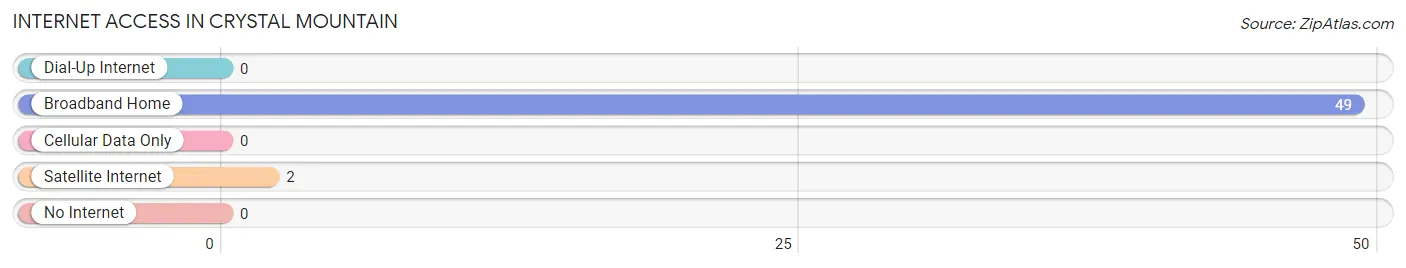
| Internet Type | # Households | % Households |
| Dial-Up Internet | 0 | 0.0% |
| Broadband Home | 49 | 100.0% |
| Cellular Data Only | 0 | 0.0% |
| Satellite Internet | 2 | 4.1% |
| No Internet | 0 | 0.0% |
| Total | 49 | 100.0% |
Crystal Mountain Summary
Mountain, MI is a small unincorporated community located in the northern part of Michigan’s Lower Peninsula. It is situated in Benzie County, approximately 20 miles south of Traverse City. The area is known for its picturesque views of Lake Michigan and the surrounding countryside.
History
The area that is now known as Crystal Mountain, MI was first settled in the late 1800s by a group of German immigrants. The settlers were attracted to the area due to its abundance of natural resources, including timber, fish, and game. The area was originally known as “Crystal Springs” due to the numerous natural springs in the area.
In the early 1900s, the area began to develop as a resort destination. The first resort, Crystal Mountain Resort, was established in the 1920s. The resort was a popular destination for vacationers from all over the Midwest. The resort was eventually sold to a group of investors in the 1950s and has since become one of the most popular ski resorts in the Midwest.
Geography
Crystal Mountain, MI is located in the northern part of Michigan’s Lower Peninsula. It is situated in Benzie County, approximately 20 miles south of Traverse City. The area is known for its picturesque views of Lake Michigan and the surrounding countryside. The area is also home to several small lakes, including Crystal Lake, which is the largest lake in the area.
The area is characterized by rolling hills and dense forests. The area is also home to several species of wildlife, including deer, bear, and turkey. The area is also home to several species of birds, including bald eagles, hawks, and owls.
Economy
The economy of Crystal Mountain, MI is largely driven by tourism. The area is home to several popular ski resorts, including Crystal Mountain Resort. The resort is a popular destination for vacationers from all over the Midwest. The resort also offers a variety of activities, including skiing, snowboarding, and tubing.
The area is also home to several small businesses, including restaurants, shops, and lodging. The area is also home to several wineries, which produce a variety of wines.
Demographics
As of the 2010 census, the population of Crystal Mountain, MI was 1,845. The population is largely white (94.3%), with a small percentage of African Americans (2.2%) and Native Americans (1.2%). The median household income in the area is $45,000. The median age in the area is 44.7 years.
Conclusion
Crystal Mountain, MI is a small unincorporated community located in the northern part of Michigan’s Lower Peninsula. It is situated in Benzie County, approximately 20 miles south of Traverse City. The area is known for its picturesque views of Lake Michigan and the surrounding countryside. The economy of the area is largely driven by tourism, with several popular ski resorts and small businesses. The population of the area is largely white, with a median household income of $45,000 and a median age of 44.7 years.
Common Questions
What is Per Capita Income in Crystal Mountain?
Per Capita income in Crystal Mountain is $52,091.
What is the Median Family Income in Crystal Mountain?
Median Family Income in Crystal Mountain is $146,875.
What is Income or Wage Gap in Crystal Mountain?
Income or Wage Gap in Crystal Mountain is 11.6%.
Women in Crystal Mountain earn 88.4 cents for every dollar earned by a man.
What is Inequality or Gini Index in Crystal Mountain?
Inequality or Gini Index in Crystal Mountain is 0.47.
What is the Total Population of Crystal Mountain?
Total Population of Crystal Mountain is 130.
What is the Total Male Population of Crystal Mountain?
Total Male Population of Crystal Mountain is 55.
What is the Total Female Population of Crystal Mountain?
Total Female Population of Crystal Mountain is 75.
What is the Ratio of Males per 100 Females in Crystal Mountain?
There are 73.33 Males per 100 Females in Crystal Mountain.
What is the Ratio of Females per 100 Males in Crystal Mountain?
There are 136.36 Females per 100 Males in Crystal Mountain.
What is the Median Population Age in Crystal Mountain?
Median Population Age in Crystal Mountain is 54.3 Years.
What is the Average Family Size in Crystal Mountain
Average Family Size in Crystal Mountain is 3.8 People.
What is the Average Household Size in Crystal Mountain
Average Household Size in Crystal Mountain is 2.6 People.
How Large is the Labor Force in Crystal Mountain?
There are 51 People in the Labor Forcein in Crystal Mountain.
What is the Percentage of People in the Labor Force in Crystal Mountain?
54.8% of People are in the Labor Force in Crystal Mountain.