West Branch, MI Map & Demographics
West Branch Map
West Branch Overview
$22,702
PER CAPITA INCOME
$51,786
AVG FAMILY INCOME
$41,741
AVG HOUSEHOLD INCOME
23.7%
WAGE / INCOME GAP [ % ]
76.3¢/ $1
WAGE / INCOME GAP [ $ ]
$10,227
FAMILY INCOME DEFICIT
0.38
INEQUALITY / GINI INDEX
2,198
TOTAL POPULATION
1,028
MALE POPULATION
1,170
FEMALE POPULATION
87.86
MALES / 100 FEMALES
113.81
FEMALES / 100 MALES
39.8
MEDIAN AGE
2.8
AVG FAMILY SIZE
2.1
AVG HOUSEHOLD SIZE
804
LABOR FORCE [ PEOPLE ]
43.3%
PERCENT IN LABOR FORCE
6.7%
UNEMPLOYMENT RATE
West Branch Zip Codes
West Branch Area Codes
Income in West Branch
Income Overview in West Branch
Per Capita Income in West Branch is $22,702, while median incomes of families and households are $51,786 and $41,741 respectively.
| Characteristic | Number | Measure |
| Per Capita Income | 2,198 | $22,702 |
| Median Family Income | 498 | $51,786 |
| Mean Family Income | 498 | $59,966 |
| Median Household Income | 978 | $41,741 |
| Mean Household Income | 978 | $48,689 |
| Income Deficit | 498 | $10,227 |
| Wage / Income Gap (%) | 2,198 | 23.72% |
| Wage / Income Gap ($) | 2,198 | 76.28¢ per $1 |
| Gini / Inequality Index | 2,198 | 0.38 |
Earnings by Sex in West Branch
Average Earnings in West Branch are $28,613, $35,368 for men and $26,979 for women, a difference of 23.7%.
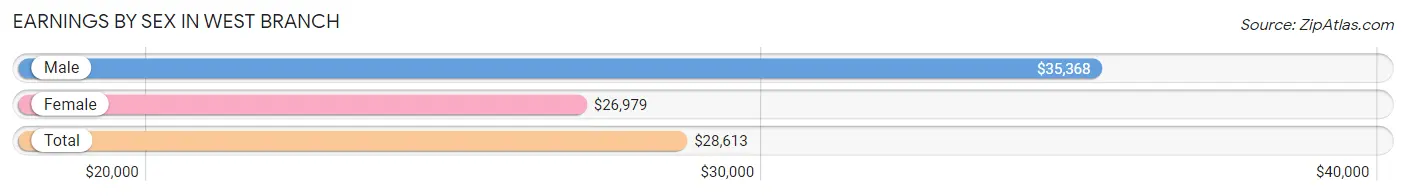
| Sex | Number | Average Earnings |
| Male | 489 (52.7%) | $35,368 |
| Female | 438 (47.2%) | $26,979 |
| Total | 927 (100.0%) | $28,613 |
Earnings by Sex by Income Bracket in West Branch
The most common earnings brackets in West Branch are $40,000 to $44,999 for men (83 | 17.0%) and $25,000 to $29,999 for women (82 | 18.7%).
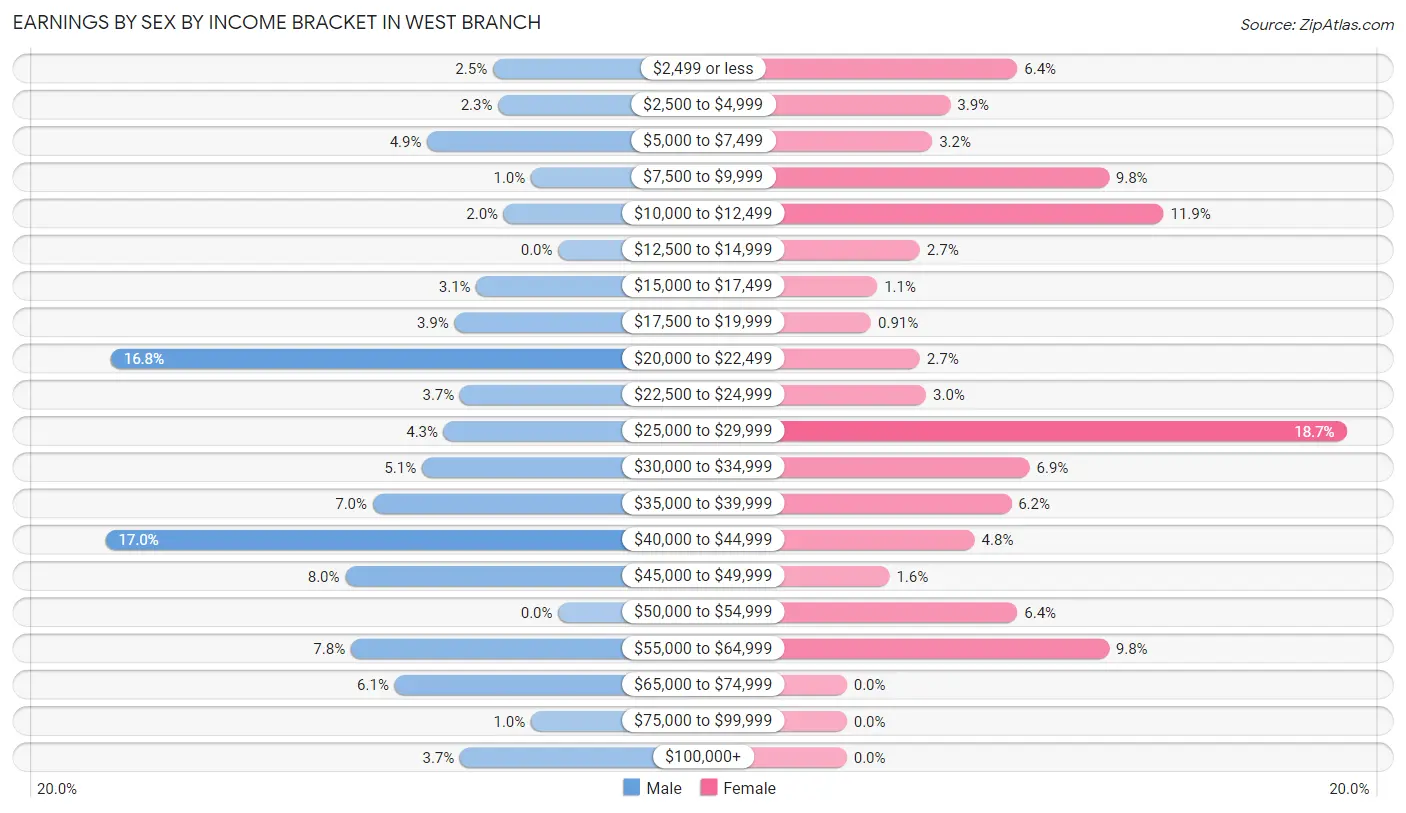
| Income | Male | Female |
| $2,499 or less | 12 (2.5%) | 28 (6.4%) |
| $2,500 to $4,999 | 11 (2.2%) | 17 (3.9%) |
| $5,000 to $7,499 | 24 (4.9%) | 14 (3.2%) |
| $7,500 to $9,999 | 5 (1.0%) | 43 (9.8%) |
| $10,000 to $12,499 | 10 (2.0%) | 52 (11.9%) |
| $12,500 to $14,999 | 0 (0.0%) | 12 (2.7%) |
| $15,000 to $17,499 | 15 (3.1%) | 5 (1.1%) |
| $17,500 to $19,999 | 19 (3.9%) | 4 (0.9%) |
| $20,000 to $22,499 | 82 (16.8%) | 12 (2.7%) |
| $22,500 to $24,999 | 18 (3.7%) | 13 (3.0%) |
| $25,000 to $29,999 | 21 (4.3%) | 82 (18.7%) |
| $30,000 to $34,999 | 25 (5.1%) | 30 (6.9%) |
| $35,000 to $39,999 | 34 (7.0%) | 27 (6.2%) |
| $40,000 to $44,999 | 83 (17.0%) | 21 (4.8%) |
| $45,000 to $49,999 | 39 (8.0%) | 7 (1.6%) |
| $50,000 to $54,999 | 0 (0.0%) | 28 (6.4%) |
| $55,000 to $64,999 | 38 (7.8%) | 43 (9.8%) |
| $65,000 to $74,999 | 30 (6.1%) | 0 (0.0%) |
| $75,000 to $99,999 | 5 (1.0%) | 0 (0.0%) |
| $100,000+ | 18 (3.7%) | 0 (0.0%) |
| Total | 489 (100.0%) | 438 (100.0%) |
Earnings by Sex by Educational Attainment in West Branch
Average earnings in West Branch are $40,488 for men and $29,872 for women, a difference of 26.2%. Men with an educational attainment of bachelor's degree enjoy the highest average annual earnings of $58,819, while those with high school diploma education earn the least with $27,917. Women with an educational attainment of graduate degree earn the most with the average annual earnings of $43,393, while those with high school diploma education have the smallest earnings of $25,682.
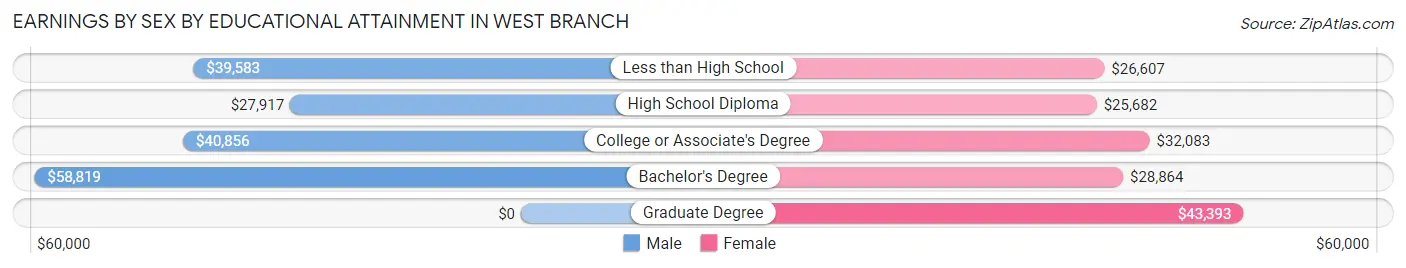
| Educational Attainment | Male Income | Female Income |
| Less than High School | $39,583 | $26,607 |
| High School Diploma | $27,917 | $25,682 |
| College or Associate's Degree | $40,856 | $32,083 |
| Bachelor's Degree | $58,819 | $28,864 |
| Graduate Degree | - | - |
| Total | $40,488 | $29,872 |
Family Income in West Branch
Family Income Brackets in West Branch
According to the West Branch family income data, there are 128 families falling into the $50,000 to $74,999 income range, which is the most common income bracket and makes up 25.7% of all families.
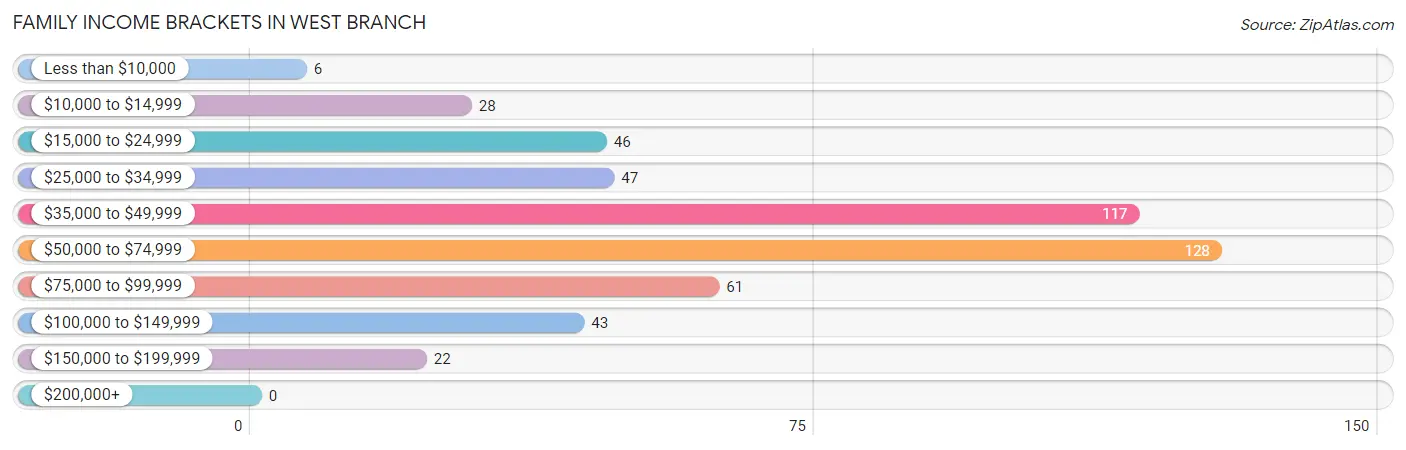
| Income Bracket | # Families | % Families |
| Less than $10,000 | 6 | 1.2% |
| $10,000 to $14,999 | 28 | 5.6% |
| $15,000 to $24,999 | 46 | 9.2% |
| $25,000 to $34,999 | 47 | 9.4% |
| $35,000 to $49,999 | 117 | 23.5% |
| $50,000 to $74,999 | 128 | 25.7% |
| $75,000 to $99,999 | 61 | 12.2% |
| $100,000 to $149,999 | 43 | 8.6% |
| $150,000 to $199,999 | 22 | 4.4% |
| $200,000+ | 0 | 0.0% |
Family Income by Famaliy Size in West Branch
5-person families (55 | 11.0%) account for the highest median family income in West Branch with $67,688 per family, while 2-person families (260 | 52.2%) have the highest median income of $22,584 per family member.
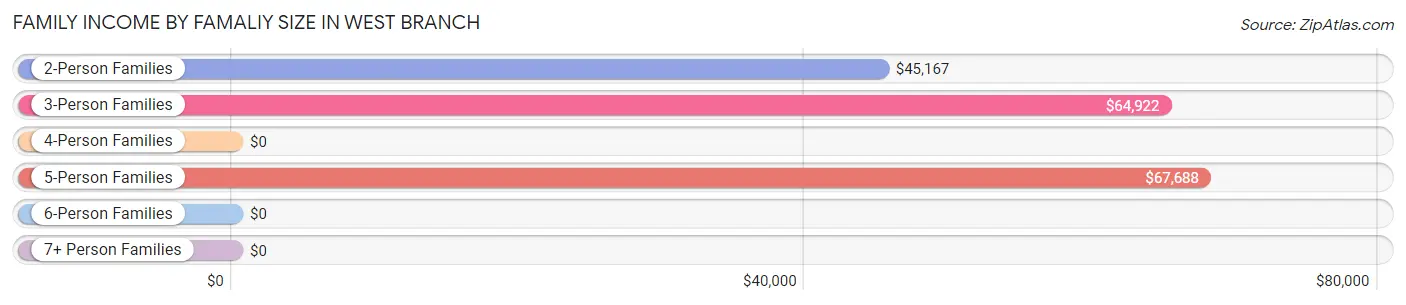
| Income Bracket | # Families | Median Income |
| 2-Person Families | 260 (52.2%) | $45,167 |
| 3-Person Families | 115 (23.1%) | $64,922 |
| 4-Person Families | 55 (11.0%) | $0 |
| 5-Person Families | 55 (11.0%) | $67,688 |
| 6-Person Families | 8 (1.6%) | $0 |
| 7+ Person Families | 5 (1.0%) | $0 |
| Total | 498 (100.0%) | $51,786 |
Family Income by Number of Earners in West Branch
The median family income in West Branch is $51,786, with families comprising 3+ earners (51) having the highest median family income of $79,063, while families with no earners (148) have the lowest median family income of $40,795, accounting for 10.2% and 29.7% of families, respectively.
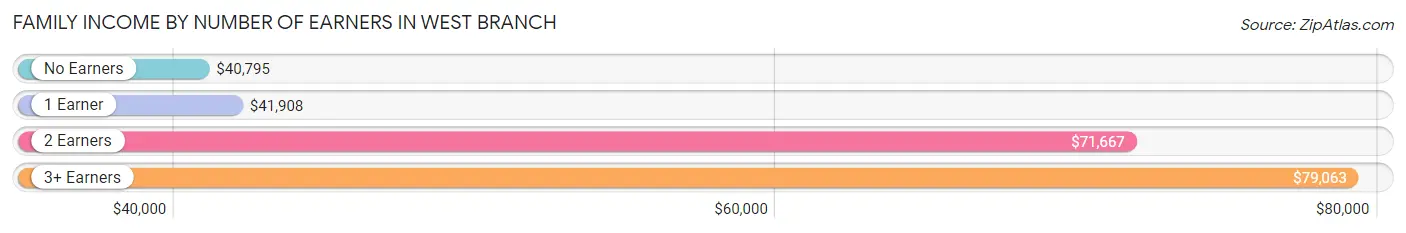
| Number of Earners | # Families | Median Income |
| No Earners | 148 (29.7%) | $40,795 |
| 1 Earner | 165 (33.1%) | $41,908 |
| 2 Earners | 134 (26.9%) | $71,667 |
| 3+ Earners | 51 (10.2%) | $79,063 |
| Total | 498 (100.0%) | $51,786 |
Household Income in West Branch
Household Income Brackets in West Branch
With 227 households falling in the category, the $15,000 to $24,999 income range is the most frequent in West Branch, accounting for 23.2% of all households.
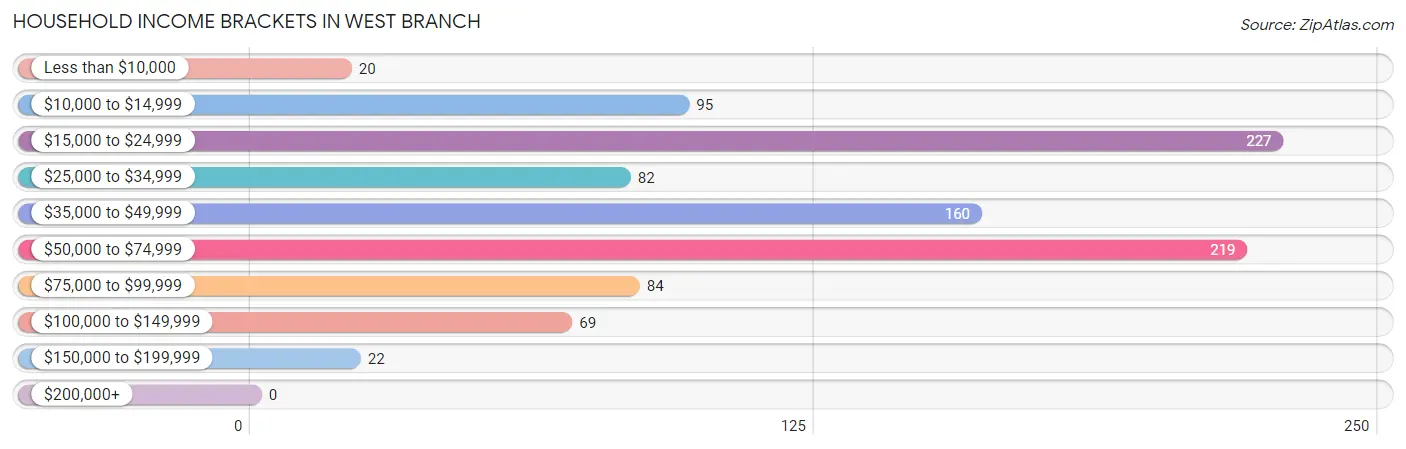
| Income Bracket | # Households | % Households |
| Less than $10,000 | 20 | 2.0% |
| $10,000 to $14,999 | 95 | 9.7% |
| $15,000 to $24,999 | 227 | 23.2% |
| $25,000 to $34,999 | 82 | 8.4% |
| $35,000 to $49,999 | 160 | 16.4% |
| $50,000 to $74,999 | 219 | 22.4% |
| $75,000 to $99,999 | 84 | 8.6% |
| $100,000 to $149,999 | 69 | 7.1% |
| $150,000 to $199,999 | 22 | 2.2% |
| $200,000+ | 0 | 0.0% |
Household Income by Householder Age in West Branch
The median household income in West Branch is $41,741, with the highest median household income of $52,188 found in the 25 to 44 years age bracket for the primary householder. A total of 311 households (31.8%) fall into this category. Meanwhile, the 15 to 24 years age bracket for the primary householder has the lowest median household income of $0, with 62 households (6.3%) in this group.
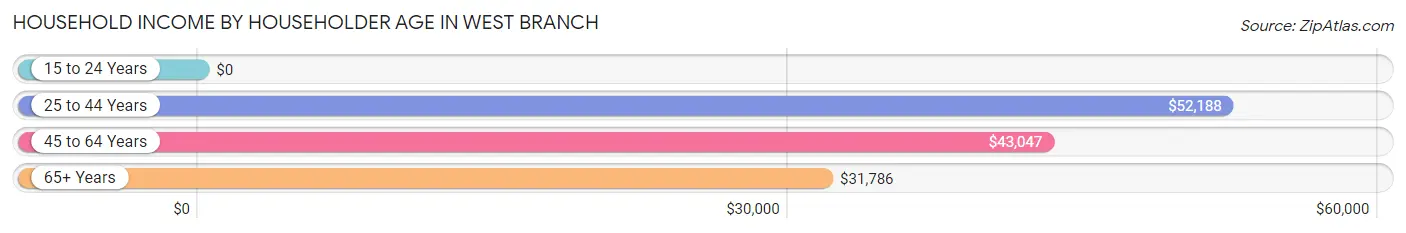
| Income Bracket | # Households | Median Income |
| 15 to 24 Years | 62 (6.3%) | $0 |
| 25 to 44 Years | 311 (31.8%) | $52,188 |
| 45 to 64 Years | 243 (24.8%) | $43,047 |
| 65+ Years | 362 (37.0%) | $31,786 |
| Total | 978 (100.0%) | $41,741 |
Poverty in West Branch
Income Below Poverty by Sex and Age in West Branch
With 21.0% poverty level for males and 18.5% for females among the residents of West Branch, under 5 year old males and 15 year old females are the most vulnerable to poverty, with 33 males (70.2%) and 8 females (100.0%) in their respective age groups living below the poverty level.
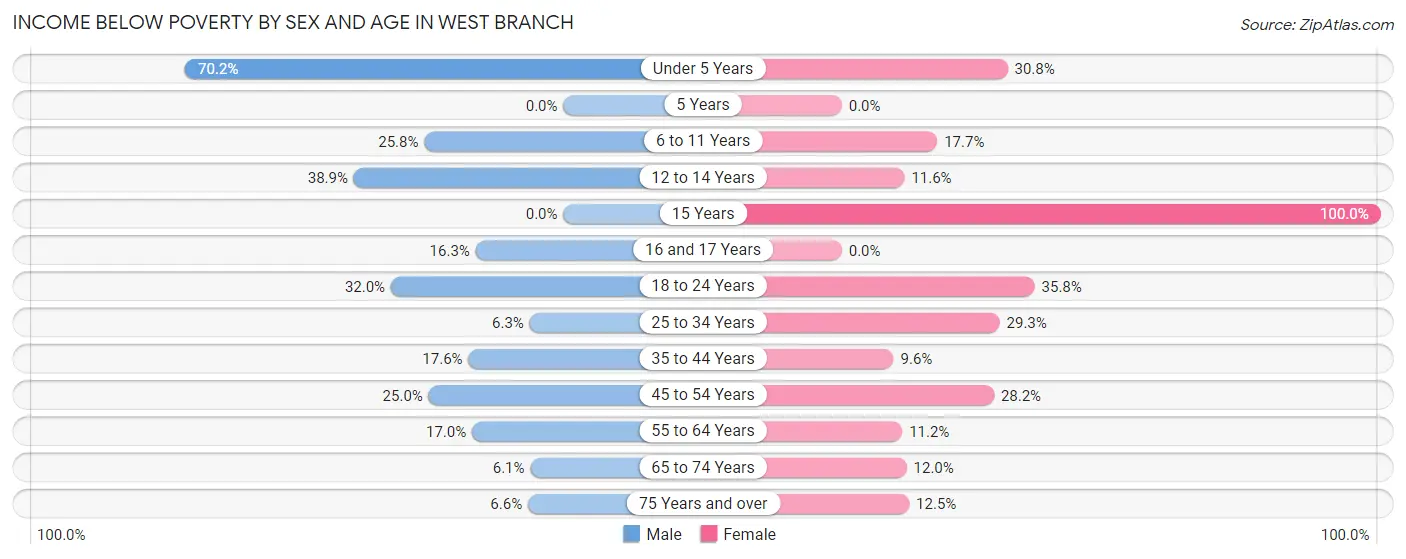
| Age Bracket | Male | Female |
| Under 5 Years | 33 (70.2%) | 12 (30.8%) |
| 5 Years | 0 (0.0%) | 0 (0.0%) |
| 6 to 11 Years | 24 (25.8%) | 14 (17.7%) |
| 12 to 14 Years | 7 (38.9%) | 5 (11.6%) |
| 15 Years | 0 (0.0%) | 8 (100.0%) |
| 16 and 17 Years | 7 (16.3%) | 0 (0.0%) |
| 18 to 24 Years | 32 (32.0%) | 34 (35.8%) |
| 25 to 34 Years | 5 (6.2%) | 41 (29.3%) |
| 35 to 44 Years | 34 (17.6%) | 10 (9.6%) |
| 45 to 54 Years | 30 (25.0%) | 24 (28.2%) |
| 55 to 64 Years | 10 (17.0%) | 13 (11.2%) |
| 65 to 74 Years | 6 (6.1%) | 19 (12.0%) |
| 75 Years and over | 4 (6.6%) | 23 (12.5%) |
| Total | 192 (21.0%) | 203 (18.5%) |
Income Above Poverty by Sex and Age in West Branch
According to the poverty statistics in West Branch, males aged 65 to 74 years and females aged 5 years are the age groups that are most secure financially, with 93.9% of males and 100.0% of females in these age groups living above the poverty line.
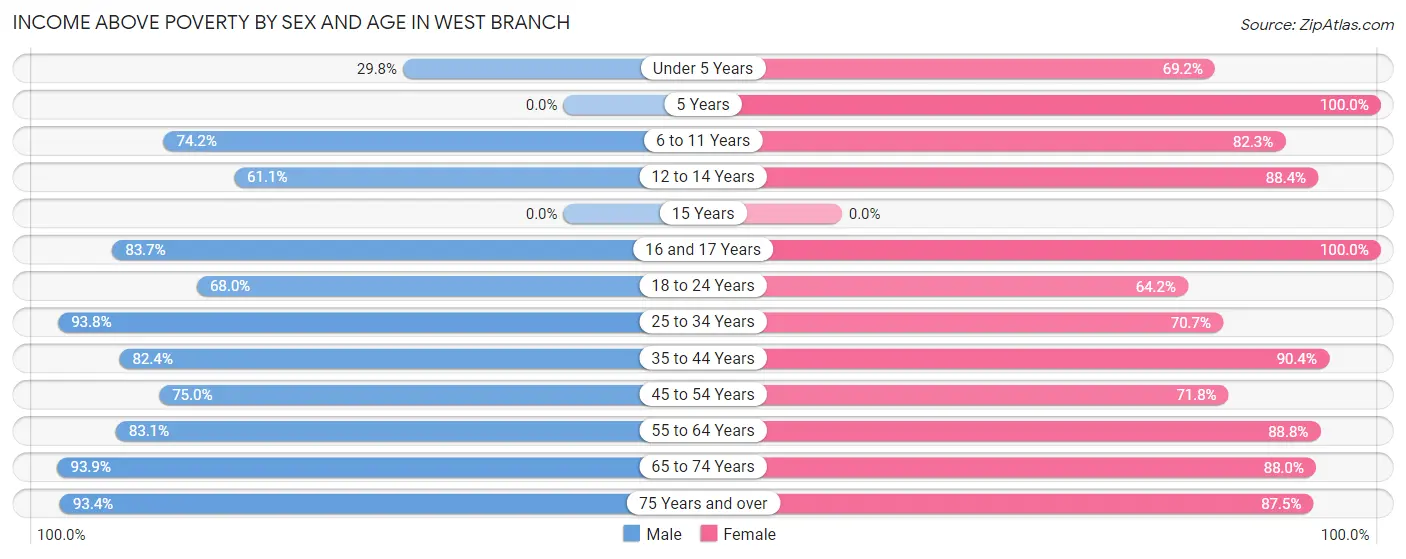
| Age Bracket | Male | Female |
| Under 5 Years | 14 (29.8%) | 27 (69.2%) |
| 5 Years | 0 (0.0%) | 9 (100.0%) |
| 6 to 11 Years | 69 (74.2%) | 65 (82.3%) |
| 12 to 14 Years | 11 (61.1%) | 38 (88.4%) |
| 15 Years | 0 (0.0%) | 0 (0.0%) |
| 16 and 17 Years | 36 (83.7%) | 36 (100.0%) |
| 18 to 24 Years | 68 (68.0%) | 61 (64.2%) |
| 25 to 34 Years | 75 (93.8%) | 99 (70.7%) |
| 35 to 44 Years | 159 (82.4%) | 94 (90.4%) |
| 45 to 54 Years | 90 (75.0%) | 61 (71.8%) |
| 55 to 64 Years | 49 (83.1%) | 103 (88.8%) |
| 65 to 74 Years | 92 (93.9%) | 139 (88.0%) |
| 75 Years and over | 57 (93.4%) | 161 (87.5%) |
| Total | 720 (78.9%) | 893 (81.5%) |
Income Below Poverty Among Married-Couple Families in West Branch
The poverty statistics for married-couple families in West Branch show that 11.7% or 38 of the total 325 families live below the poverty line. Families with 1 or 2 children have the highest poverty rate of 21.9%, comprising of 21 families. On the other hand, families with no children have the lowest poverty rate of 6.2%, which includes 12 families.
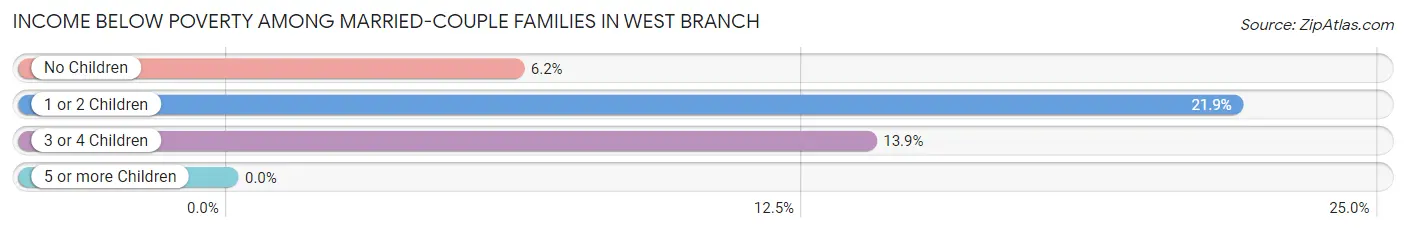
| Children | Above Poverty | Below Poverty |
| No Children | 181 (93.8%) | 12 (6.2%) |
| 1 or 2 Children | 75 (78.1%) | 21 (21.9%) |
| 3 or 4 Children | 31 (86.1%) | 5 (13.9%) |
| 5 or more Children | 0 (0.0%) | 0 (0.0%) |
| Total | 287 (88.3%) | 38 (11.7%) |
Income Below Poverty Among Single-Parent Households in West Branch
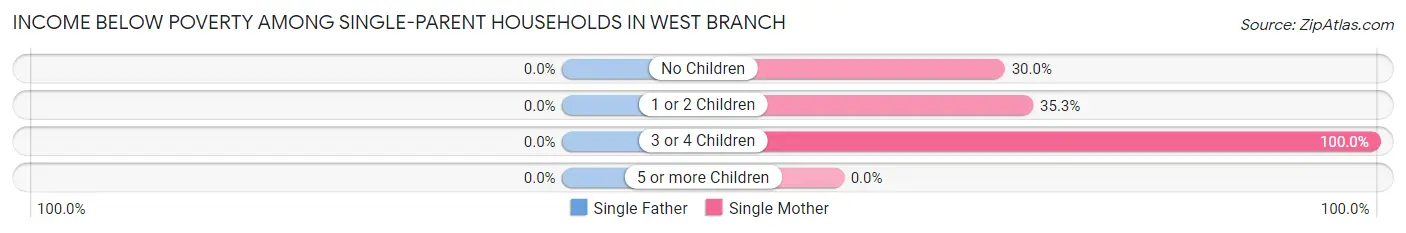
| Children | Single Father | Single Mother |
| No Children | 0 (0.0%) | 6 (30.0%) |
| 1 or 2 Children | 0 (0.0%) | 18 (35.3%) |
| 3 or 4 Children | 0 (0.0%) | 12 (100.0%) |
| 5 or more Children | 0 (0.0%) | 0 (0.0%) |
| Total | 0 (0.0%) | 36 (43.4%) |
Income Below Poverty Among Married-Couple vs Single-Parent Households in West Branch
The poverty data for West Branch shows that 38 of the married-couple family households (11.7%) and 36 of the single-parent households (20.8%) are living below the poverty level. Within the married-couple family households, those with 1 or 2 children have the highest poverty rate, with 21 households (21.9%) falling below the poverty line. Among the single-parent households, those with 3 or 4 children have the highest poverty rate, with 12 household (44.4%) living below poverty.
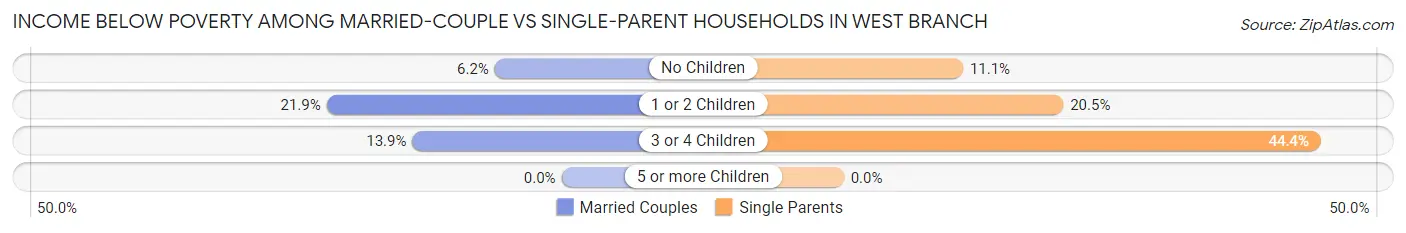
| Children | Married-Couple Families | Single-Parent Households |
| No Children | 12 (6.2%) | 6 (11.1%) |
| 1 or 2 Children | 21 (21.9%) | 18 (20.4%) |
| 3 or 4 Children | 5 (13.9%) | 12 (44.4%) |
| 5 or more Children | 0 (0.0%) | 0 (0.0%) |
| Total | 38 (11.7%) | 36 (20.8%) |
Race in West Branch
The most populous races in West Branch are White / Caucasian (1,987 | 90.4%), Hispanic or Latino (90 | 4.1%), and Asian (80 | 3.6%).
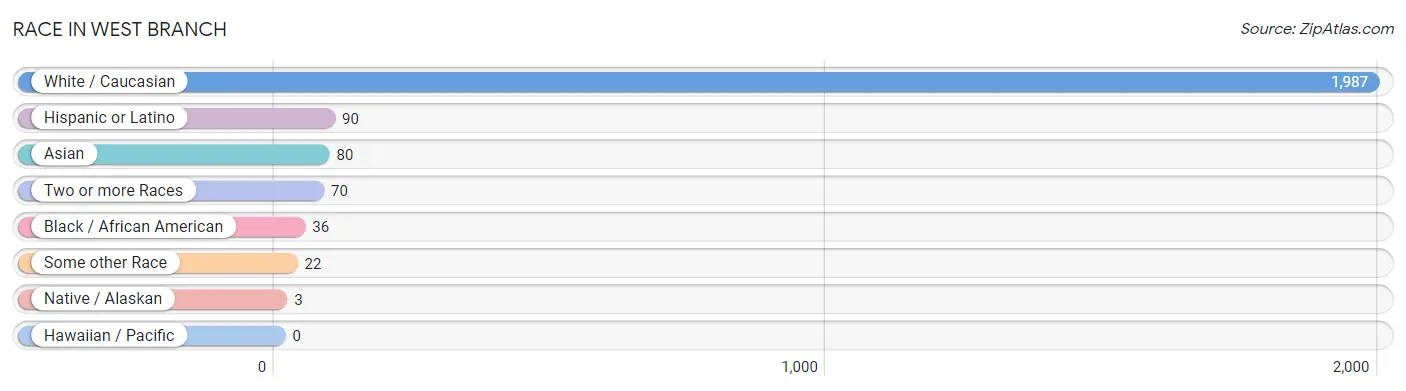
| Race | # Population | % Population |
| Asian | 80 | 3.6% |
| Black / African American | 36 | 1.6% |
| Hawaiian / Pacific | 0 | 0.0% |
| Hispanic or Latino | 90 | 4.1% |
| Native / Alaskan | 3 | 0.1% |
| White / Caucasian | 1,987 | 90.4% |
| Two or more Races | 70 | 3.2% |
| Some other Race | 22 | 1.0% |
| Total | 2,198 | 100.0% |
Ancestry in West Branch
The most populous ancestries reported in West Branch are German (626 | 28.5%), Irish (253 | 11.5%), English (214 | 9.7%), Polish (208 | 9.5%), and American (151 | 6.9%), together accounting for 66.1% of all West Branch residents.
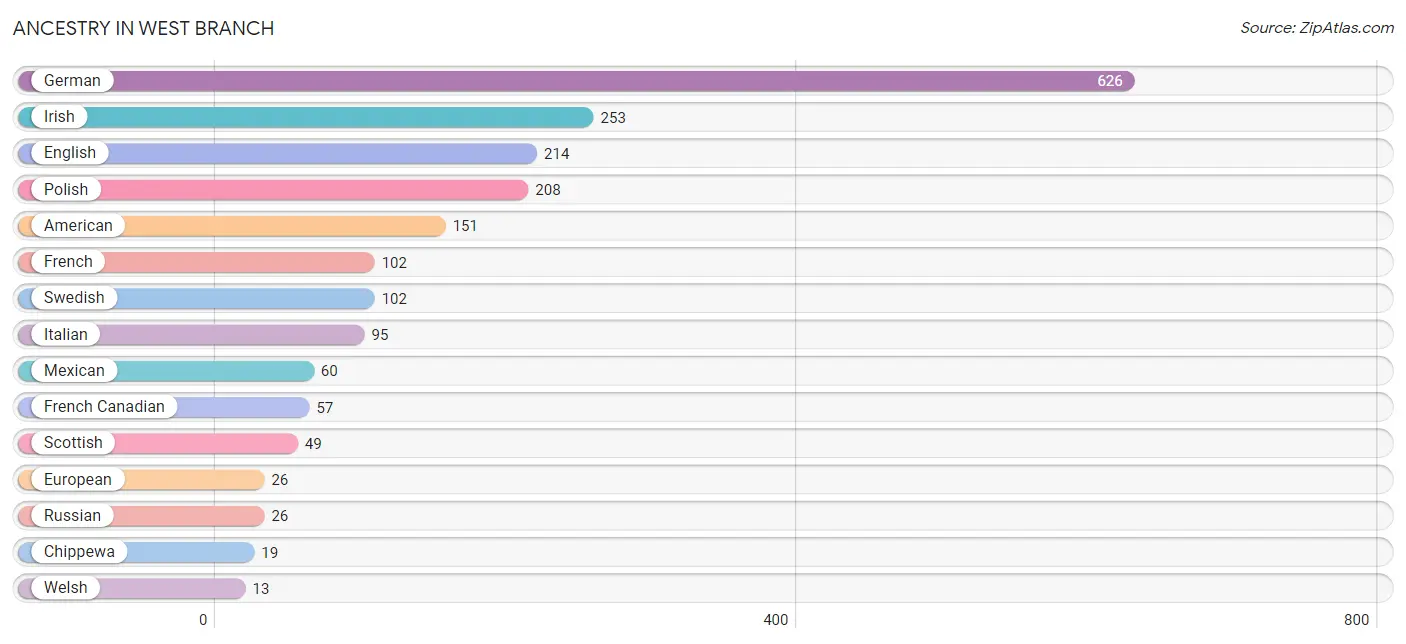
| Ancestry | # Population | % Population |
| American | 151 | 6.9% |
| Arab | 4 | 0.2% |
| Austrian | 6 | 0.3% |
| Central American | 8 | 0.4% |
| Cherokee | 8 | 0.4% |
| Chippewa | 19 | 0.9% |
| Choctaw | 3 | 0.1% |
| Danish | 12 | 0.5% |
| Dutch | 9 | 0.4% |
| English | 214 | 9.7% |
| European | 26 | 1.2% |
| Finnish | 10 | 0.4% |
| French | 102 | 4.6% |
| French Canadian | 57 | 2.6% |
| German | 626 | 28.5% |
| Guatemalan | 8 | 0.4% |
| Irish | 253 | 11.5% |
| Italian | 95 | 4.3% |
| Lebanese | 4 | 0.2% |
| Lithuanian | 1 | 0.1% |
| Mexican | 60 | 2.7% |
| Norwegian | 5 | 0.2% |
| Peruvian | 7 | 0.3% |
| Polish | 208 | 9.5% |
| Portuguese | 5 | 0.2% |
| Puerto Rican | 7 | 0.3% |
| Russian | 26 | 1.2% |
| Scandinavian | 12 | 0.5% |
| Scotch-Irish | 8 | 0.4% |
| Scottish | 49 | 2.2% |
| South American | 7 | 0.3% |
| Swedish | 102 | 4.6% |
| Welsh | 13 | 0.6% | View All 33 Rows |
Immigrants in West Branch
The most numerous immigrant groups reported in West Branch came from Asia (66 | 3.0%), Nepal (63 | 2.9%), South Central Asia (63 | 2.9%), Europe (30 | 1.4%), and Eastern Europe (17 | 0.8%), together accounting for 10.9% of all West Branch residents.
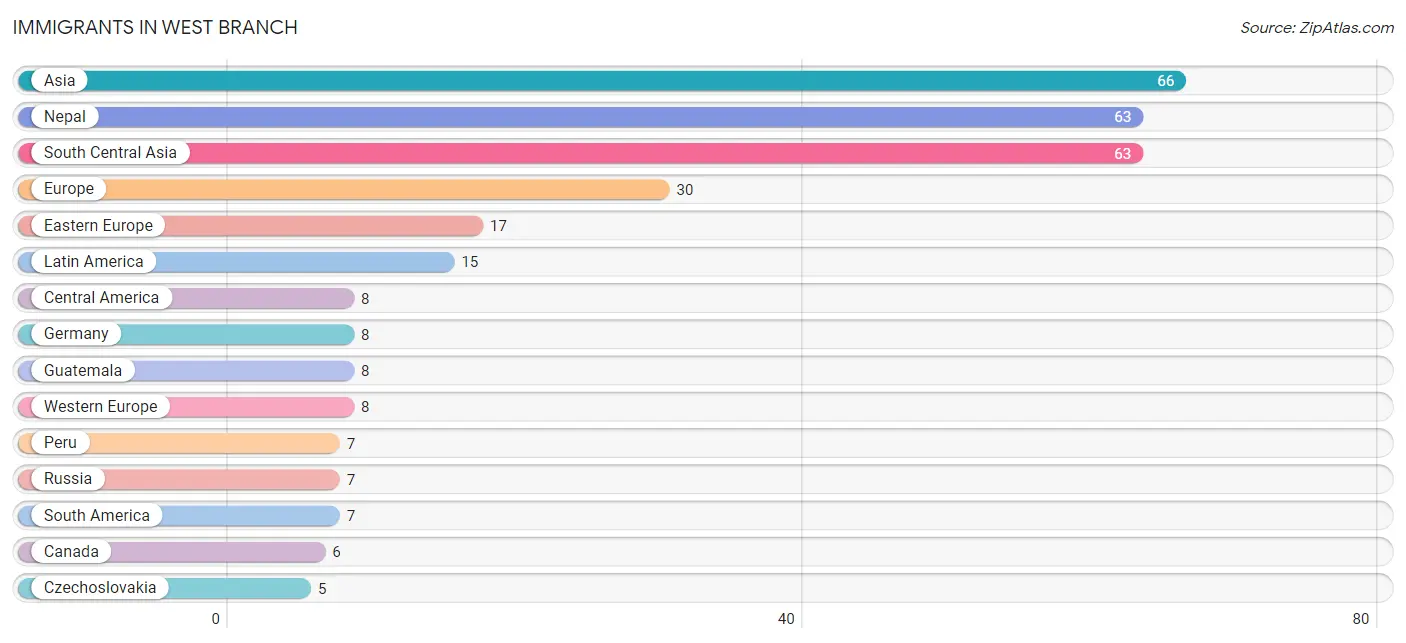
| Immigration Origin | # Population | % Population |
| Asia | 66 | 3.0% |
| Canada | 6 | 0.3% |
| Central America | 8 | 0.4% |
| Czechoslovakia | 5 | 0.2% |
| Eastern Europe | 17 | 0.8% |
| Europe | 30 | 1.4% |
| Germany | 8 | 0.4% |
| Guatemala | 8 | 0.4% |
| Latin America | 15 | 0.7% |
| Nepal | 63 | 2.9% |
| Peru | 7 | 0.3% |
| Portugal | 5 | 0.2% |
| Russia | 7 | 0.3% |
| South America | 7 | 0.3% |
| South Central Asia | 63 | 2.9% |
| South Eastern Asia | 3 | 0.1% |
| Southern Europe | 5 | 0.2% |
| Thailand | 3 | 0.1% |
| Western Europe | 8 | 0.4% | View All 19 Rows |
Sex and Age in West Branch
Sex and Age in West Branch
The most populous age groups in West Branch are 35 to 39 Years (141 | 13.7%) for men and 65 to 69 Years (100 | 8.6%) for women.
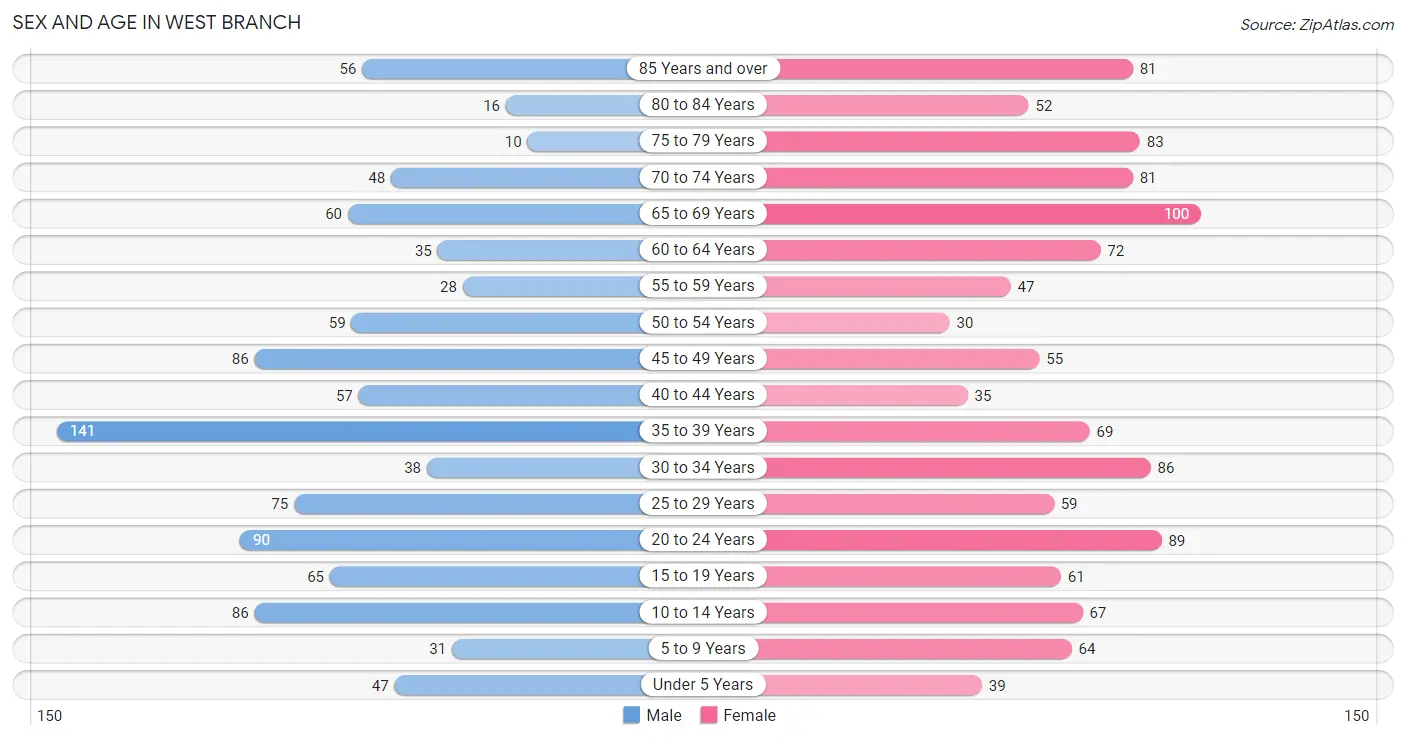
| Age Bracket | Male | Female |
| Under 5 Years | 47 (4.6%) | 39 (3.3%) |
| 5 to 9 Years | 31 (3.0%) | 64 (5.5%) |
| 10 to 14 Years | 86 (8.4%) | 67 (5.7%) |
| 15 to 19 Years | 65 (6.3%) | 61 (5.2%) |
| 20 to 24 Years | 90 (8.7%) | 89 (7.6%) |
| 25 to 29 Years | 75 (7.3%) | 59 (5.0%) |
| 30 to 34 Years | 38 (3.7%) | 86 (7.3%) |
| 35 to 39 Years | 141 (13.7%) | 69 (5.9%) |
| 40 to 44 Years | 57 (5.5%) | 35 (3.0%) |
| 45 to 49 Years | 86 (8.4%) | 55 (4.7%) |
| 50 to 54 Years | 59 (5.7%) | 30 (2.6%) |
| 55 to 59 Years | 28 (2.7%) | 47 (4.0%) |
| 60 to 64 Years | 35 (3.4%) | 72 (6.1%) |
| 65 to 69 Years | 60 (5.8%) | 100 (8.6%) |
| 70 to 74 Years | 48 (4.7%) | 81 (6.9%) |
| 75 to 79 Years | 10 (1.0%) | 83 (7.1%) |
| 80 to 84 Years | 16 (1.6%) | 52 (4.4%) |
| 85 Years and over | 56 (5.4%) | 81 (6.9%) |
| Total | 1,028 (100.0%) | 1,170 (100.0%) |
Families and Households in West Branch
Median Family Size in West Branch
The median family size in West Branch is 2.76 persons per family, with married-couple families (325 | 65.3%) accounting for the largest median family size of 2.94 persons per family. On the other hand, single female/mother families (83 | 16.7%) represent the smallest median family size with 2.40 persons per family.
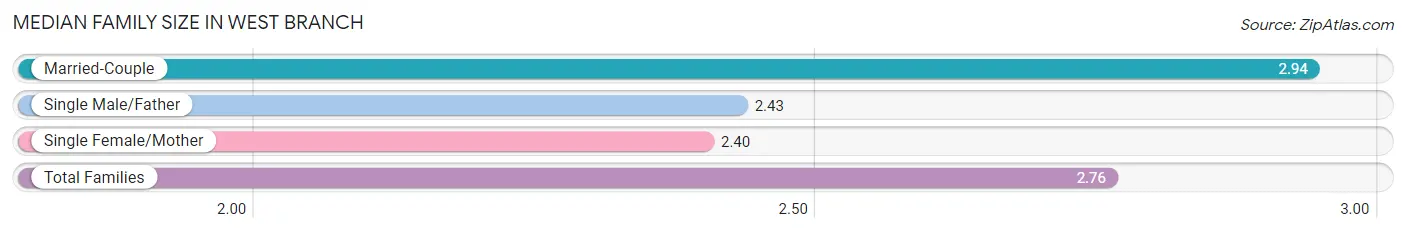
| Family Type | # Families | Family Size |
| Married-Couple | 325 (65.3%) | 2.94 |
| Single Male/Father | 90 (18.1%) | 2.43 |
| Single Female/Mother | 83 (16.7%) | 2.40 |
| Total Families | 498 (100.0%) | 2.76 |
Median Household Size in West Branch
The median household size in West Branch is 2.06 persons per household, with single female/mother households (83 | 8.5%) accounting for the largest median household size of 2.99 persons per household. non-family households (480 | 49.1%) represent the smallest median household size with 1.18 persons per household.
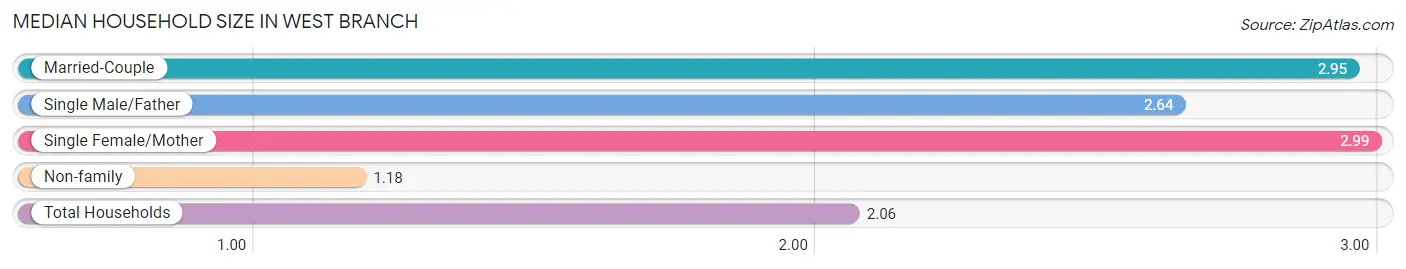
| Household Type | # Households | Household Size |
| Married-Couple | 325 (33.2%) | 2.95 |
| Single Male/Father | 90 (9.2%) | 2.64 |
| Single Female/Mother | 83 (8.5%) | 2.99 |
| Non-family | 480 (49.1%) | 1.18 |
| Total Households | 978 (100.0%) | 2.06 |
Household Size by Marriage Status in West Branch
Out of a total of 978 households in West Branch, 498 (50.9%) are family households, while 480 (49.1%) are nonfamily households. The most numerous type of family households are 2-person households, comprising 223, and the most common type of nonfamily households are 1-person households, comprising 403.
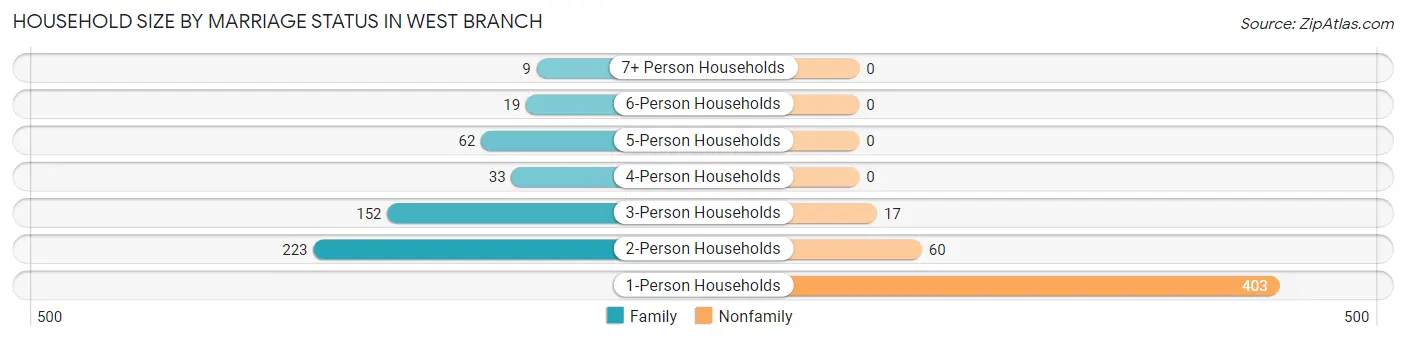
| Household Size | Family Households | Nonfamily Households |
| 1-Person Households | - | 403 (41.2%) |
| 2-Person Households | 223 (22.8%) | 60 (6.1%) |
| 3-Person Households | 152 (15.5%) | 17 (1.7%) |
| 4-Person Households | 33 (3.4%) | 0 (0.0%) |
| 5-Person Households | 62 (6.3%) | 0 (0.0%) |
| 6-Person Households | 19 (1.9%) | 0 (0.0%) |
| 7+ Person Households | 9 (0.9%) | 0 (0.0%) |
| Total | 498 (50.9%) | 480 (49.1%) |
Female Fertility in West Branch
Fertility by Age in West Branch
Average fertility rate in West Branch is 52.0 births per 1,000 women. Women in the age bracket of 20 to 34 years have the highest fertility rate with 103.0 births per 1,000 women. Women in the age bracket of 20 to 34 years acount for 100.0% of all women with births.
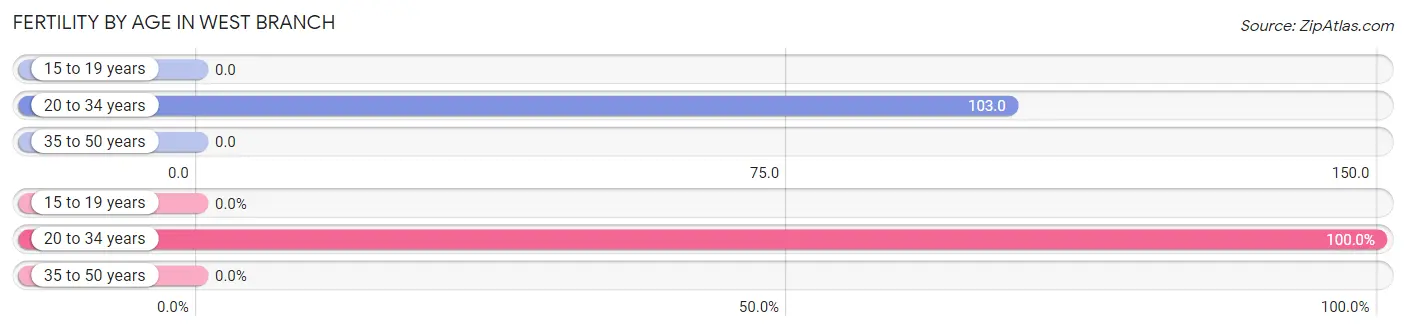
| Age Bracket | Women with Births | Births / 1,000 Women |
| 15 to 19 years | 0 (0.0%) | 0.0 |
| 20 to 34 years | 24 (100.0%) | 103.0 |
| 35 to 50 years | 0 (0.0%) | 0.0 |
| Total | 24 (100.0%) | 52.0 |
Fertility by Age by Marriage Status in West Branch
25.0% of women with births (24) in West Branch are married. The highest percentage of unmarried women with births falls into 20 to 34 years age bracket with 75.0% of them unmarried at the time of birth, while the lowest percentage of unmarried women with births belong to 20 to 34 years age bracket with 75.0% of them unmarried.
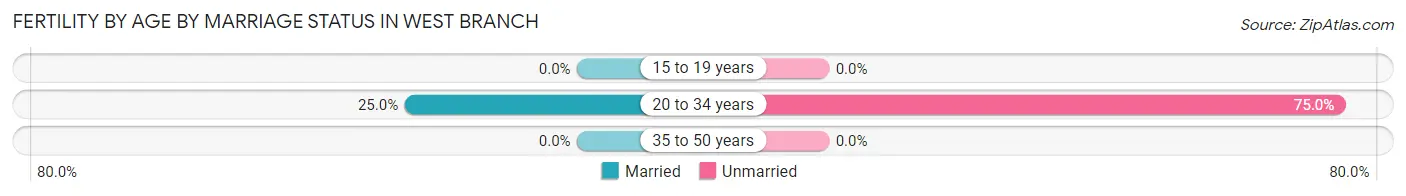
| Age Bracket | Married | Unmarried |
| 15 to 19 years | 0 (0.0%) | 0 (0.0%) |
| 20 to 34 years | 6 (25.0%) | 18 (75.0%) |
| 35 to 50 years | 0 (0.0%) | 0 (0.0%) |
| Total | 6 (25.0%) | 18 (75.0%) |
Fertility by Education in West Branch
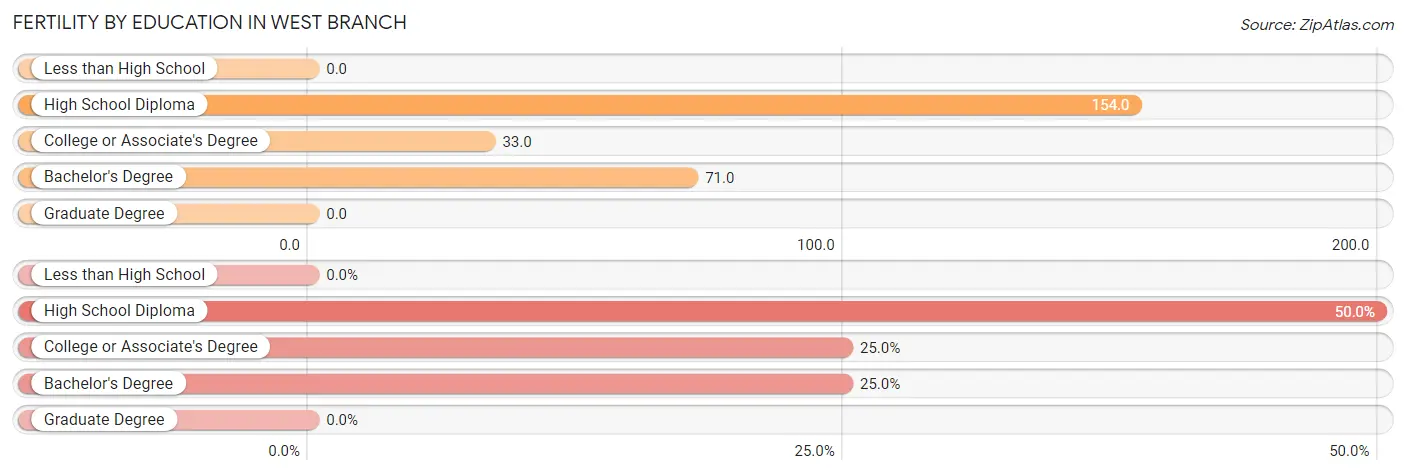
| Educational Attainment | Women with Births | Births / 1,000 Women |
| Less than High School | 0 (0.0%) | 0.0 |
| High School Diploma | 12 (50.0%) | 154.0 |
| College or Associate's Degree | 6 (25.0%) | 33.0 |
| Bachelor's Degree | 6 (25.0%) | 71.0 |
| Graduate Degree | 0 (0.0%) | 0.0 |
| Total | 24 (100.0%) | 52.0 |
Fertility by Education by Marriage Status in West Branch
75.0% of women with births in West Branch are unmarried. Women with the educational attainment of bachelor's degree are most likely to be married with 100.0% of them married at childbirth, while women with the educational attainment of high school diploma are least likely to be married with 100.0% of them unmarried at childbirth.
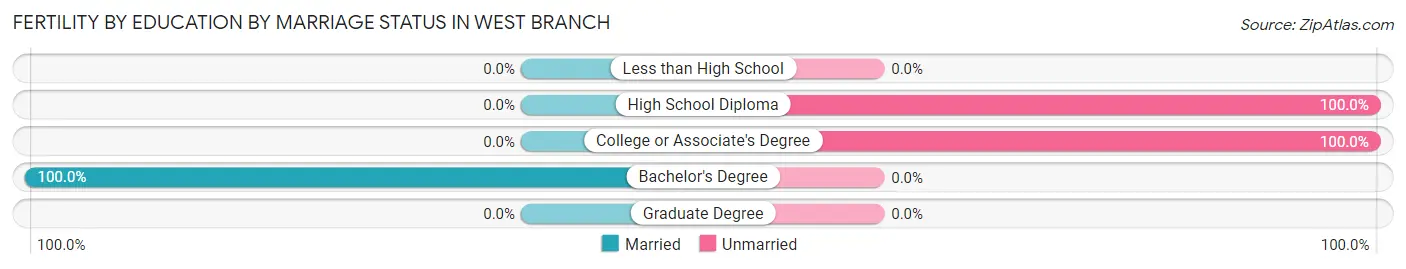
| Educational Attainment | Married | Unmarried |
| Less than High School | 0 (0.0%) | 0 (0.0%) |
| High School Diploma | 0 (0.0%) | 12 (100.0%) |
| College or Associate's Degree | 0 (0.0%) | 6 (100.0%) |
| Bachelor's Degree | 6 (100.0%) | 0 (0.0%) |
| Graduate Degree | 0 (0.0%) | 0 (0.0%) |
| Total | 6 (25.0%) | 18 (75.0%) |
Employment Characteristics in West Branch
Employment by Class of Employer in West Branch
Among the 721 employed individuals in West Branch, private company employees (537 | 74.5%), local government employees (57 | 7.9%), and state government employees (43 | 6.0%) make up the most common classes of employment.
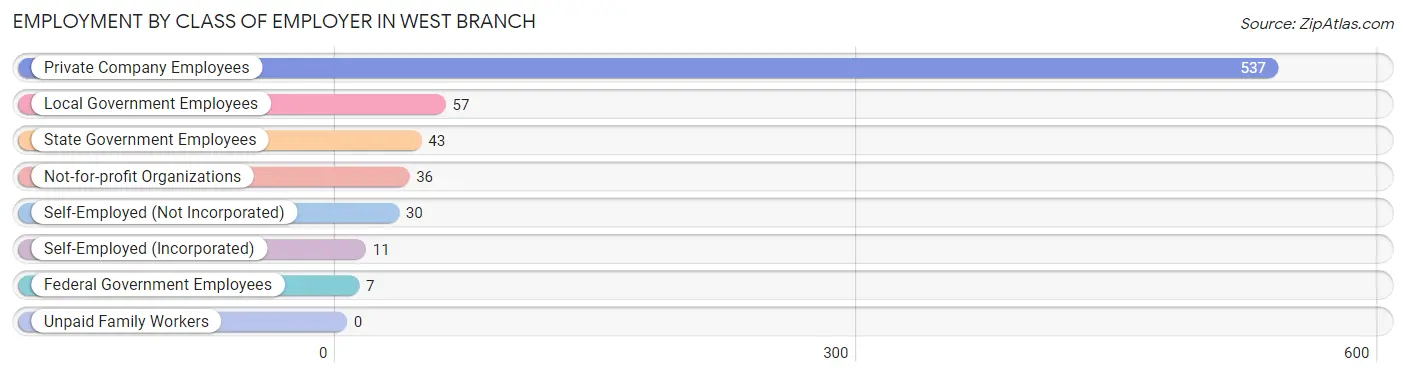
| Employer Class | # Employees | % Employees |
| Private Company Employees | 537 | 74.5% |
| Self-Employed (Incorporated) | 11 | 1.5% |
| Self-Employed (Not Incorporated) | 30 | 4.2% |
| Not-for-profit Organizations | 36 | 5.0% |
| Local Government Employees | 57 | 7.9% |
| State Government Employees | 43 | 6.0% |
| Federal Government Employees | 7 | 1.0% |
| Unpaid Family Workers | 0 | 0.0% |
| Total | 721 | 100.0% |
Employment Status by Age in West Branch
According to the labor force statistics for West Branch, out of the total population over 16 years of age (1,856), 43.3% or 804 individuals are in the labor force, with 6.7% or 54 of them unemployed. The age group with the highest labor force participation rate is 35 to 44 years, with 87.4% or 264 individuals in the labor force. Within the labor force, the 55 to 59 years age range has the highest percentage of unemployed individuals, with 12.2% or 5 of them being unemployed.
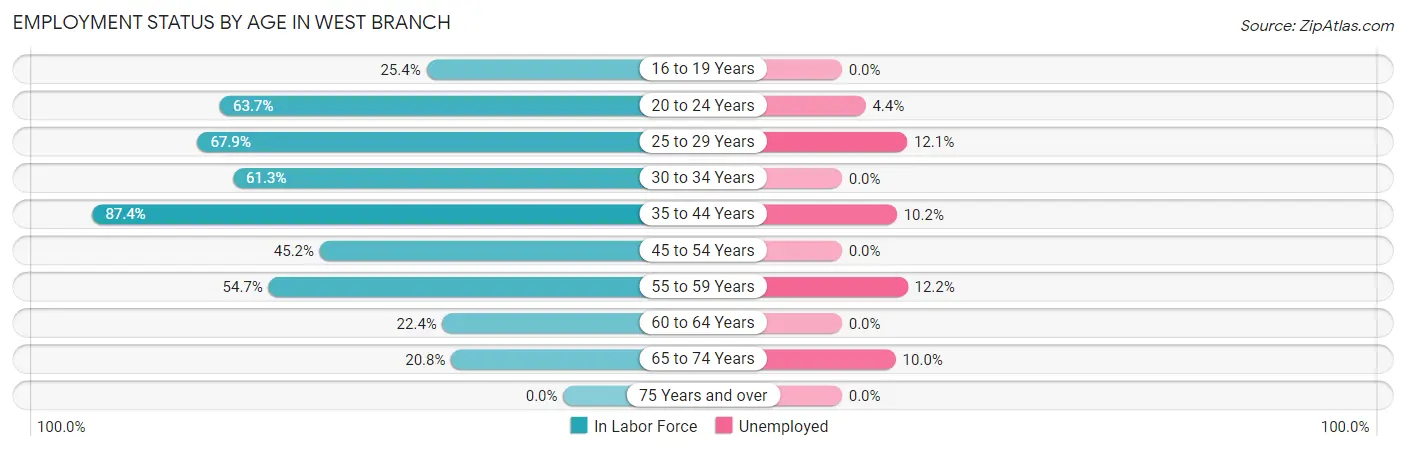
| Age Bracket | In Labor Force | Unemployed |
| 16 to 19 Years | 30 (25.4%) | 0 (0.0%) |
| 20 to 24 Years | 114 (63.7%) | 5 (4.4%) |
| 25 to 29 Years | 91 (67.9%) | 11 (12.1%) |
| 30 to 34 Years | 76 (61.3%) | 0 (0.0%) |
| 35 to 44 Years | 264 (87.4%) | 27 (10.2%) |
| 45 to 54 Years | 104 (45.2%) | 0 (0.0%) |
| 55 to 59 Years | 41 (54.7%) | 5 (12.2%) |
| 60 to 64 Years | 24 (22.4%) | 0 (0.0%) |
| 65 to 74 Years | 60 (20.8%) | 6 (10.0%) |
| 75 Years and over | 0 (0.0%) | 0 (0.0%) |
| Total | 804 (43.3%) | 54 (6.7%) |
Employment Status by Educational Attainment in West Branch
According to labor force statistics for West Branch, 61.7% of individuals (600) out of the total population between 25 and 64 years of age (972) are in the labor force, with 7.2% or 43 of them being unemployed. The group with the highest labor force participation rate are those with the educational attainment of bachelor's degree or higher, with 86.5% or 186 individuals in the labor force. Within the labor force, individuals with college / associate degree education have the highest percentage of unemployment, with 12.8% or 33 of them being unemployed.
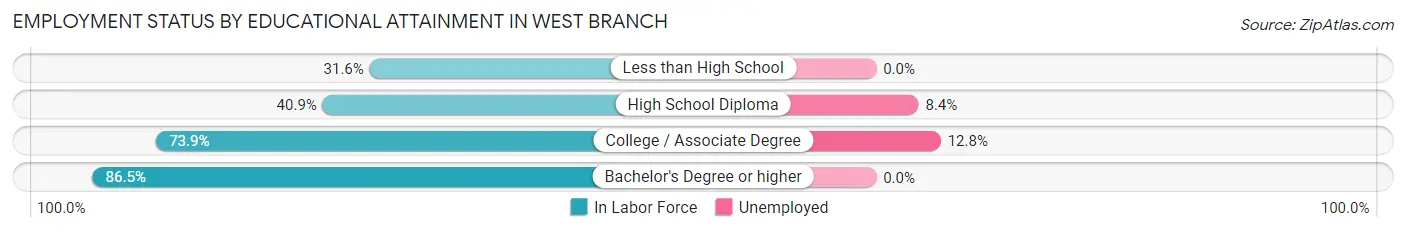
| Educational Attainment | In Labor Force | Unemployed |
| Less than High School | 37 (31.6%) | 0 (0.0%) |
| High School Diploma | 119 (40.9%) | 24 (8.4%) |
| College / Associate Degree | 258 (73.9%) | 45 (12.8%) |
| Bachelor's Degree or higher | 186 (86.5%) | 0 (0.0%) |
| Total | 600 (61.7%) | 70 (7.2%) |
Employment Occupations by Sex in West Branch
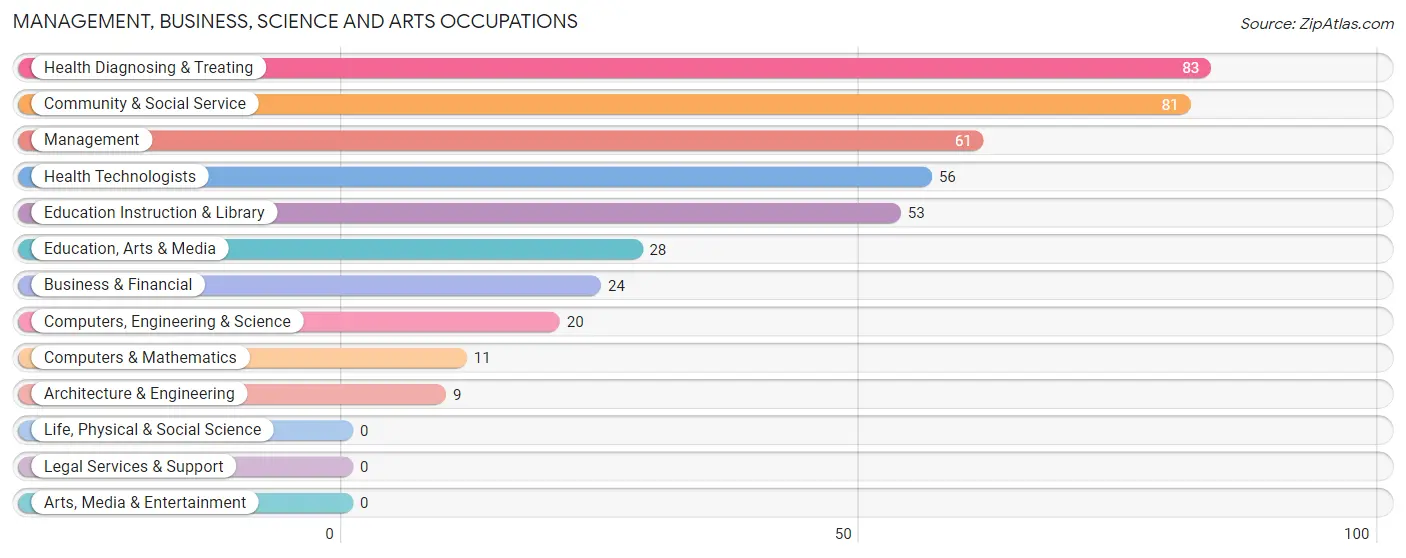
Management, Business, Science and Arts Occupations
The most common Management, Business, Science and Arts occupations in West Branch are Health Diagnosing & Treating (83 | 11.1%), Community & Social Service (81 | 10.8%), Management (61 | 8.1%), Health Technologists (56 | 7.5%), and Education Instruction & Library (53 | 7.1%).
Management, Business, Science and Arts Occupations by Sex
Within the Management, Business, Science and Arts occupations in West Branch, the most male-oriented occupations are Computers, Engineering & Science (100.0%), Computers & Mathematics (100.0%), and Architecture & Engineering (100.0%), while the most female-oriented occupations are Business & Financial (100.0%), Education, Arts & Media (85.7%), and Health Diagnosing & Treating (67.5%).
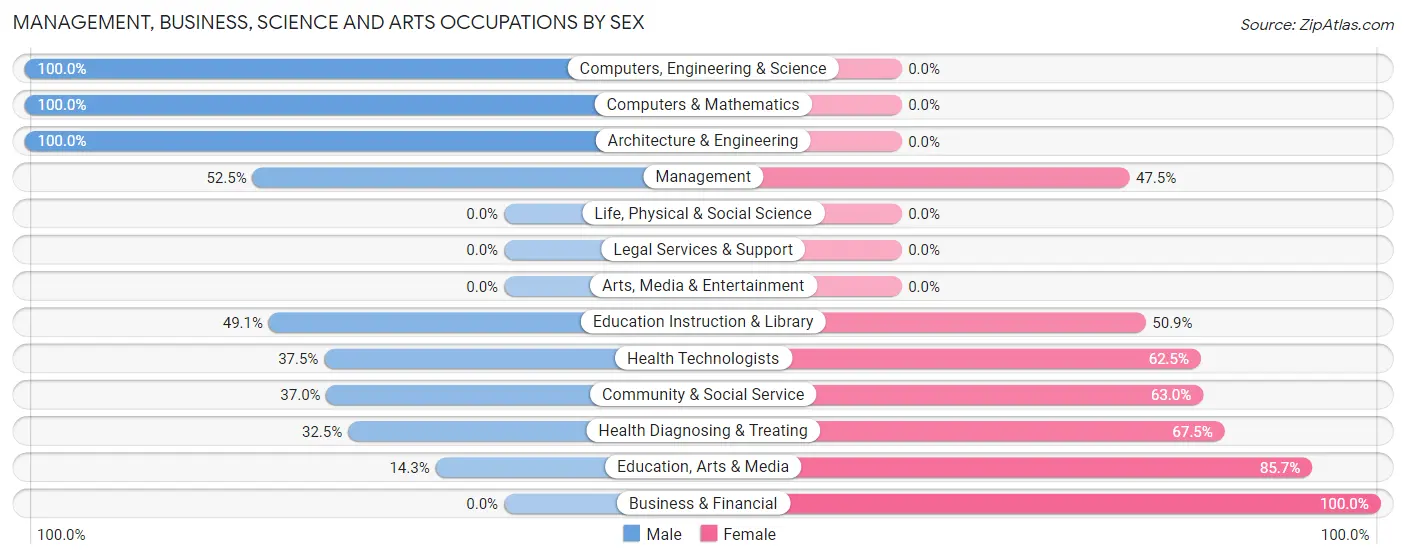
| Occupation | Male | Female |
| Management | 32 (52.5%) | 29 (47.5%) |
| Business & Financial | 0 (0.0%) | 24 (100.0%) |
| Computers, Engineering & Science | 20 (100.0%) | 0 (0.0%) |
| Computers & Mathematics | 11 (100.0%) | 0 (0.0%) |
| Architecture & Engineering | 9 (100.0%) | 0 (0.0%) |
| Life, Physical & Social Science | 0 (0.0%) | 0 (0.0%) |
| Community & Social Service | 30 (37.0%) | 51 (63.0%) |
| Education, Arts & Media | 4 (14.3%) | 24 (85.7%) |
| Legal Services & Support | 0 (0.0%) | 0 (0.0%) |
| Education Instruction & Library | 26 (49.1%) | 27 (50.9%) |
| Arts, Media & Entertainment | 0 (0.0%) | 0 (0.0%) |
| Health Diagnosing & Treating | 27 (32.5%) | 56 (67.5%) |
| Health Technologists | 21 (37.5%) | 35 (62.5%) |
| Total (Category) | 109 (40.5%) | 160 (59.5%) |
| Total (Overall) | 389 (51.9%) | 361 (48.1%) |
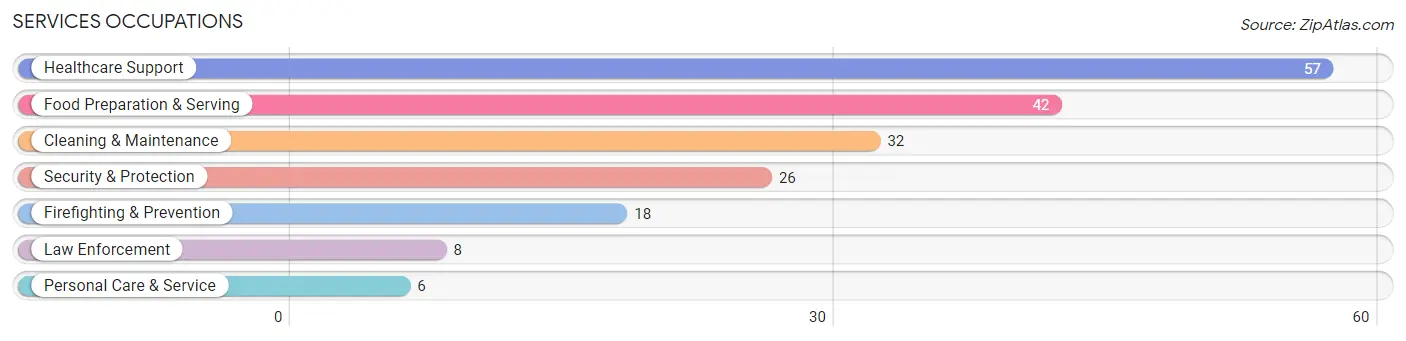
Services Occupations
The most common Services occupations in West Branch are Healthcare Support (57 | 7.6%), Food Preparation & Serving (42 | 5.6%), Cleaning & Maintenance (32 | 4.3%), Security & Protection (26 | 3.5%), and Firefighting & Prevention (18 | 2.4%).
Services Occupations by Sex
Within the Services occupations in West Branch, the most male-oriented occupations are Security & Protection (100.0%), Firefighting & Prevention (100.0%), and Law Enforcement (100.0%), while the most female-oriented occupations are Personal Care & Service (100.0%), Healthcare Support (66.7%), and Food Preparation & Serving (64.3%).
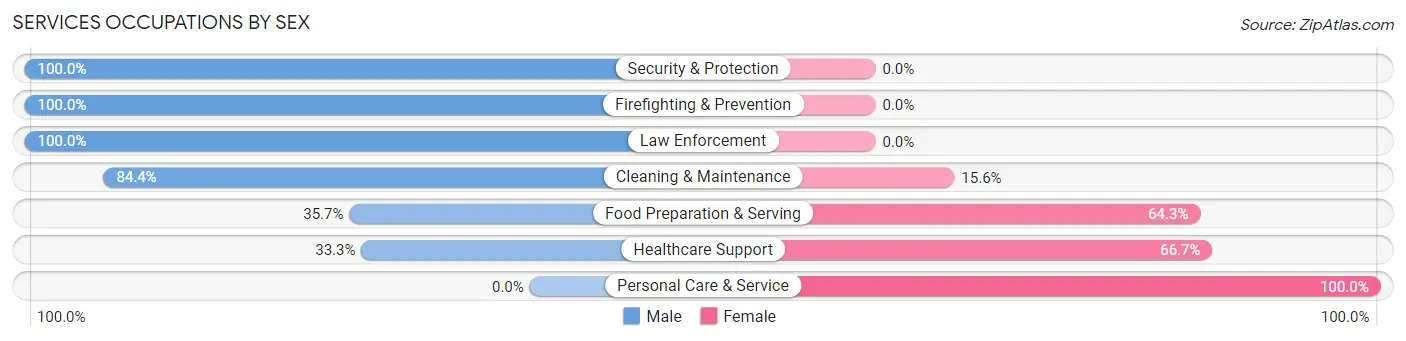
| Occupation | Male | Female |
| Healthcare Support | 19 (33.3%) | 38 (66.7%) |
| Security & Protection | 26 (100.0%) | 0 (0.0%) |
| Firefighting & Prevention | 18 (100.0%) | 0 (0.0%) |
| Law Enforcement | 8 (100.0%) | 0 (0.0%) |
| Food Preparation & Serving | 15 (35.7%) | 27 (64.3%) |
| Cleaning & Maintenance | 27 (84.4%) | 5 (15.6%) |
| Personal Care & Service | 0 (0.0%) | 6 (100.0%) |
| Total (Category) | 87 (53.4%) | 76 (46.6%) |
| Total (Overall) | 389 (51.9%) | 361 (48.1%) |
Sales and Office Occupations
The most common Sales and Office occupations in West Branch are Sales & Related (130 | 17.3%), and Office & Administration (29 | 3.9%).

Sales and Office Occupations by Sex
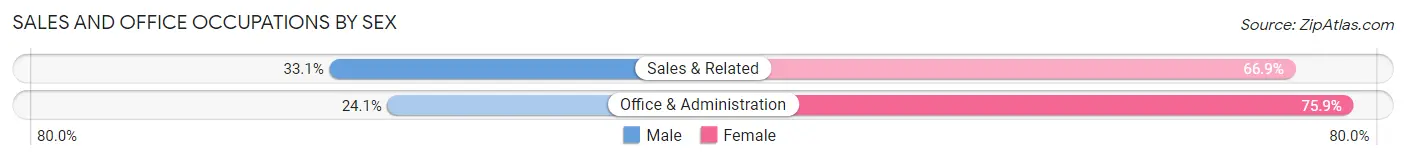
| Occupation | Male | Female |
| Sales & Related | 43 (33.1%) | 87 (66.9%) |
| Office & Administration | 7 (24.1%) | 22 (75.9%) |
| Total (Category) | 50 (31.5%) | 109 (68.5%) |
| Total (Overall) | 389 (51.9%) | 361 (48.1%) |
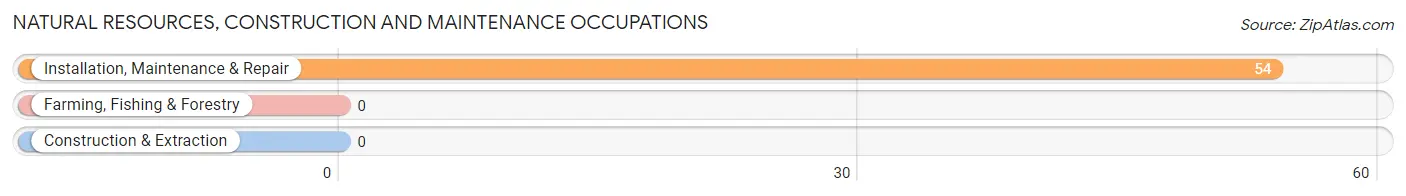
Natural Resources, Construction and Maintenance Occupations
The most common Natural Resources, Construction and Maintenance occupations in West Branch are , and Installation, Maintenance & Repair (54 | 7.2%).
Natural Resources, Construction and Maintenance Occupations by Sex
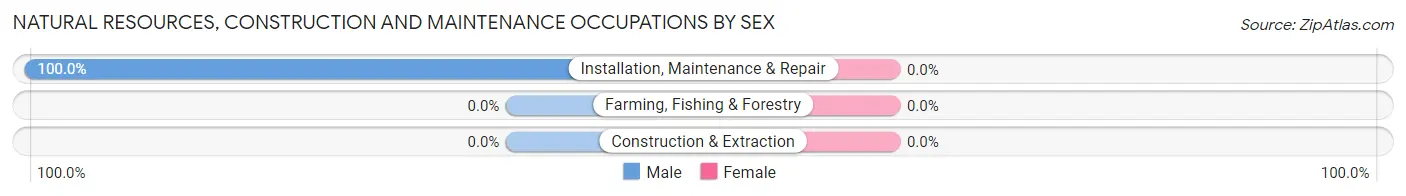
| Occupation | Male | Female |
| Farming, Fishing & Forestry | 0 (0.0%) | 0 (0.0%) |
| Construction & Extraction | 0 (0.0%) | 0 (0.0%) |
| Installation, Maintenance & Repair | 54 (100.0%) | 0 (0.0%) |
| Total (Category) | 54 (100.0%) | 0 (0.0%) |
| Total (Overall) | 389 (51.9%) | 361 (48.1%) |
Production, Transportation and Moving Occupations
The most common Production, Transportation and Moving occupations in West Branch are Production (57 | 7.6%), Material Moving (29 | 3.9%), and Transportation (19 | 2.5%).
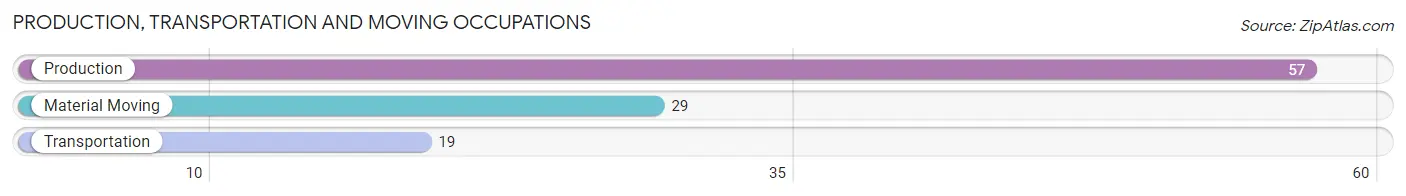
Production, Transportation and Moving Occupations by Sex
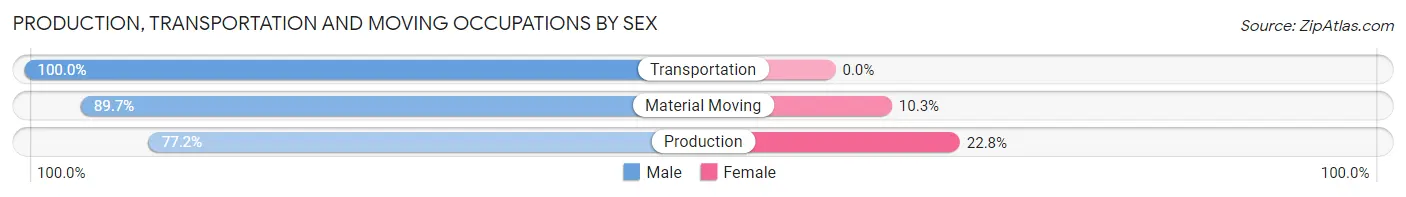
| Occupation | Male | Female |
| Production | 44 (77.2%) | 13 (22.8%) |
| Transportation | 19 (100.0%) | 0 (0.0%) |
| Material Moving | 26 (89.7%) | 3 (10.3%) |
| Total (Category) | 89 (84.8%) | 16 (15.2%) |
| Total (Overall) | 389 (51.9%) | 361 (48.1%) |
Employment Industries by Sex in West Branch
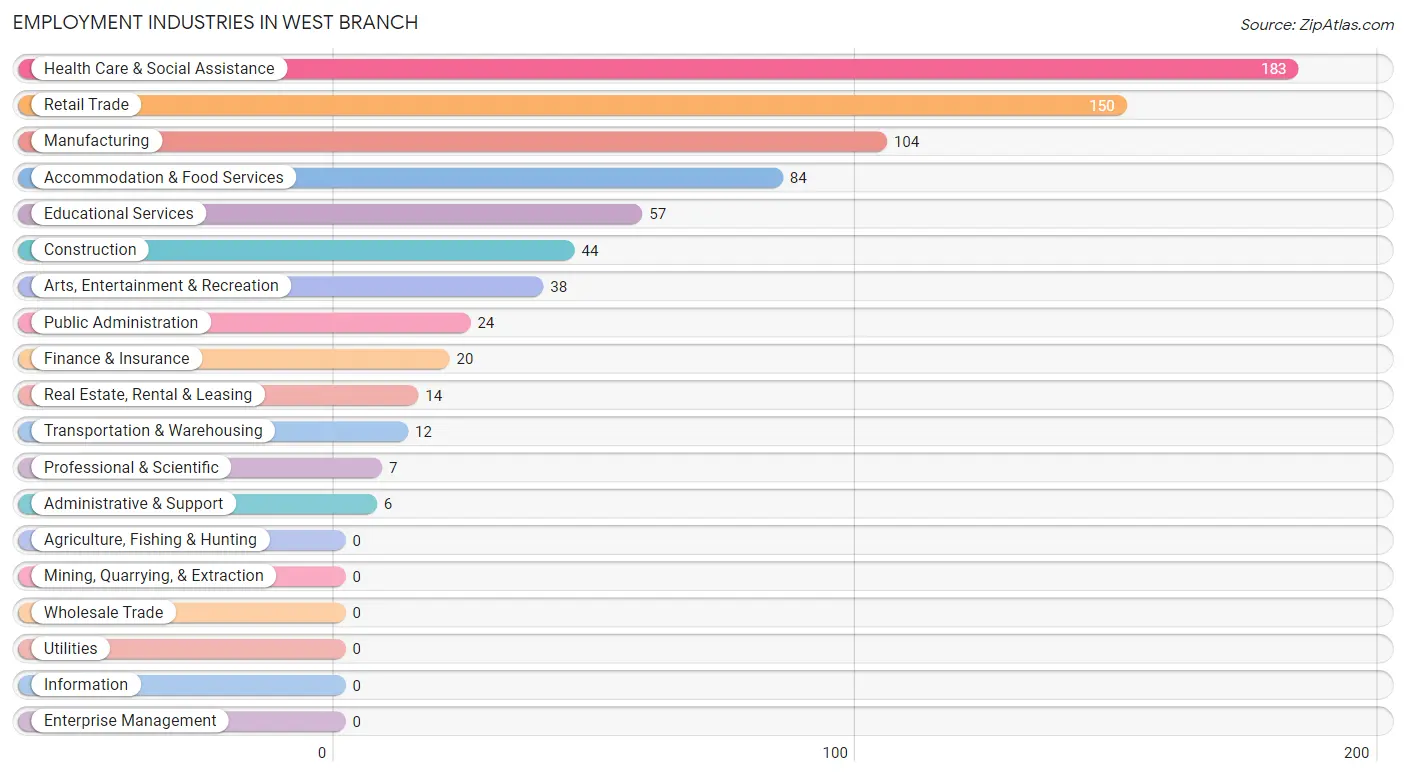
Employment Industries in West Branch
The major employment industries in West Branch include Health Care & Social Assistance (183 | 24.4%), Retail Trade (150 | 20.0%), Manufacturing (104 | 13.9%), Accommodation & Food Services (84 | 11.2%), and Educational Services (57 | 7.6%).
Employment Industries by Sex in West Branch
The West Branch industries that see more men than women are Construction (100.0%), Transportation & Warehousing (100.0%), and Professional & Scientific (100.0%), whereas the industries that tend to have a higher number of women are Finance & Insurance (100.0%), Health Care & Social Assistance (66.1%), and Accommodation & Food Services (55.9%).
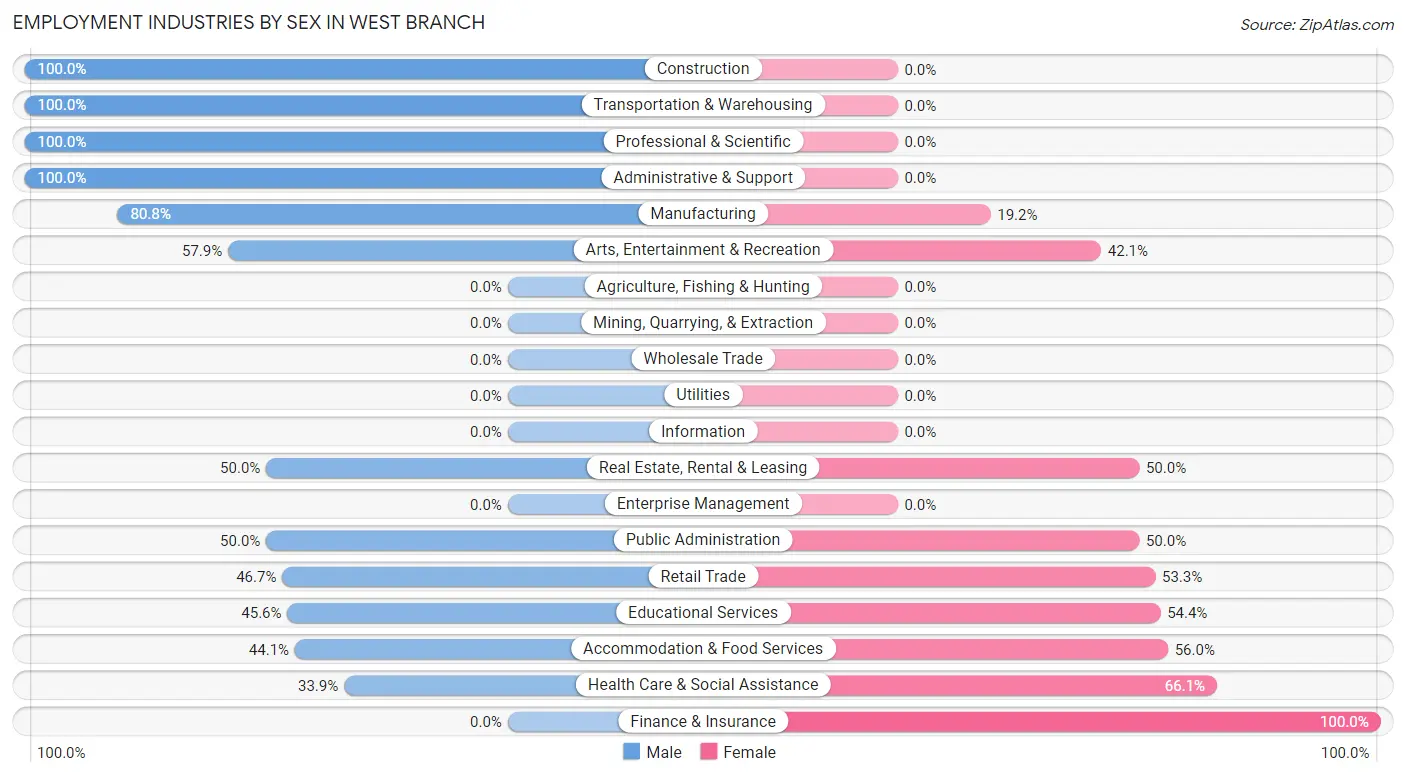
| Industry | Male | Female |
| Agriculture, Fishing & Hunting | 0 (0.0%) | 0 (0.0%) |
| Mining, Quarrying, & Extraction | 0 (0.0%) | 0 (0.0%) |
| Construction | 44 (100.0%) | 0 (0.0%) |
| Manufacturing | 84 (80.8%) | 20 (19.2%) |
| Wholesale Trade | 0 (0.0%) | 0 (0.0%) |
| Retail Trade | 70 (46.7%) | 80 (53.3%) |
| Transportation & Warehousing | 12 (100.0%) | 0 (0.0%) |
| Utilities | 0 (0.0%) | 0 (0.0%) |
| Information | 0 (0.0%) | 0 (0.0%) |
| Finance & Insurance | 0 (0.0%) | 20 (100.0%) |
| Real Estate, Rental & Leasing | 7 (50.0%) | 7 (50.0%) |
| Professional & Scientific | 7 (100.0%) | 0 (0.0%) |
| Enterprise Management | 0 (0.0%) | 0 (0.0%) |
| Administrative & Support | 6 (100.0%) | 0 (0.0%) |
| Educational Services | 26 (45.6%) | 31 (54.4%) |
| Health Care & Social Assistance | 62 (33.9%) | 121 (66.1%) |
| Arts, Entertainment & Recreation | 22 (57.9%) | 16 (42.1%) |
| Accommodation & Food Services | 37 (44.1%) | 47 (55.9%) |
| Public Administration | 12 (50.0%) | 12 (50.0%) |
| Total | 389 (51.9%) | 361 (48.1%) |
Education in West Branch
School Enrollment in West Branch
The most common levels of schooling among the 437 students in West Branch are middle school (117 | 26.8%), high school (90 | 20.6%), and elementary school (81 | 18.5%).
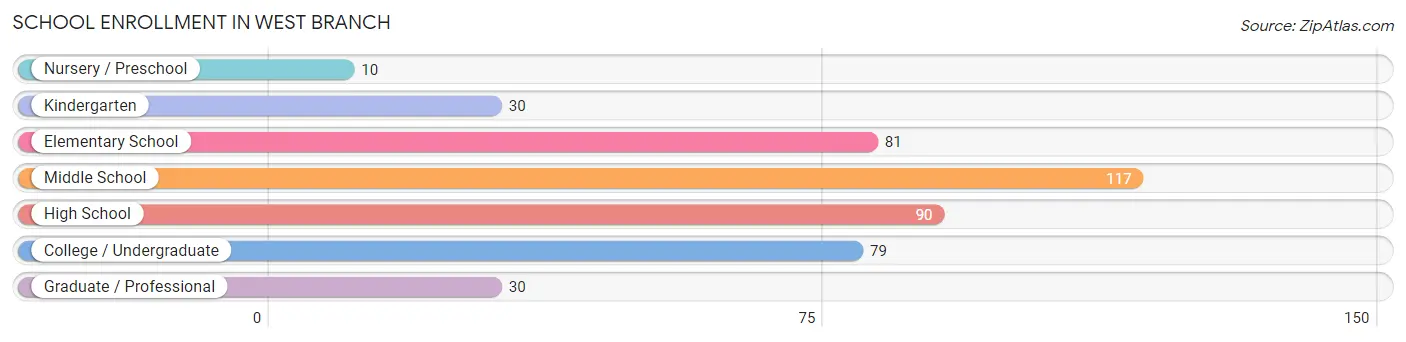
| School Level | # Students | % Students |
| Nursery / Preschool | 10 | 2.3% |
| Kindergarten | 30 | 6.9% |
| Elementary School | 81 | 18.5% |
| Middle School | 117 | 26.8% |
| High School | 90 | 20.6% |
| College / Undergraduate | 79 | 18.1% |
| Graduate / Professional | 30 | 6.9% |
| Total | 437 | 100.0% |
School Enrollment by Age by Funding Source in West Branch
Out of a total of 437 students who are enrolled in schools in West Branch, 16 (3.7%) attend a private institution, while the remaining 421 (96.3%) are enrolled in public schools. The age group of 3 to 4 year olds has the highest likelihood of being enrolled in private schools, with 5 (50.0% in the age bracket) enrolled. Conversely, the age group of 15 to 17 year olds has the lowest likelihood of being enrolled in a private school, with 71 (100.0% in the age bracket) attending a public institution.
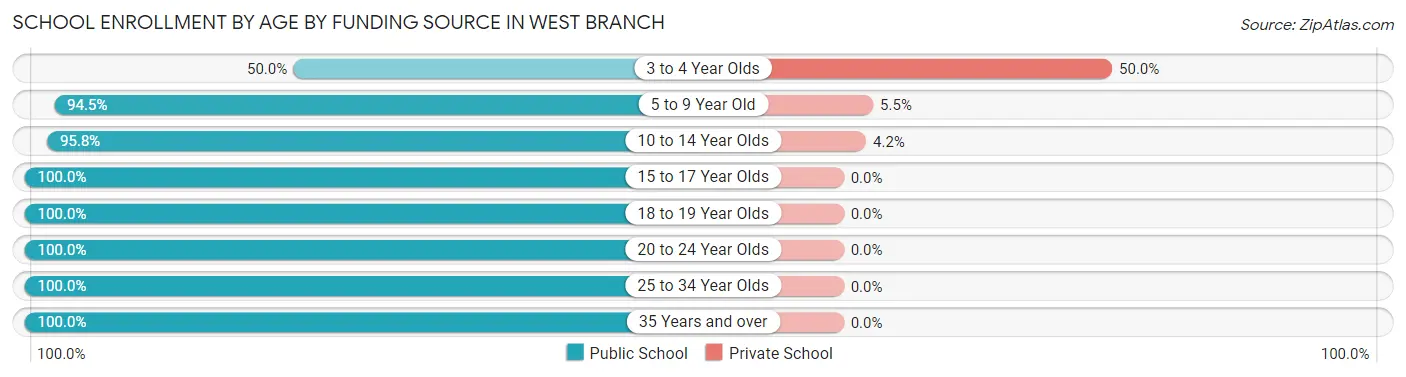
| Age Bracket | Public School | Private School |
| 3 to 4 Year Olds | 5 (50.0%) | 5 (50.0%) |
| 5 to 9 Year Old | 86 (94.5%) | 5 (5.5%) |
| 10 to 14 Year Olds | 138 (95.8%) | 6 (4.2%) |
| 15 to 17 Year Olds | 71 (100.0%) | 0 (0.0%) |
| 18 to 19 Year Olds | 31 (100.0%) | 0 (0.0%) |
| 20 to 24 Year Olds | 60 (100.0%) | 0 (0.0%) |
| 25 to 34 Year Olds | 6 (100.0%) | 0 (0.0%) |
| 35 Years and over | 24 (100.0%) | 0 (0.0%) |
| Total | 421 (96.3%) | 16 (3.7%) |
Educational Attainment by Field of Study in West Branch
Education (102 | 31.0%), literature & languages (47 | 14.3%), arts & humanities (38 | 11.6%), computers & mathematics (31 | 9.4%), and business (29 | 8.8%) are the most common fields of study among 329 individuals in West Branch who have obtained a bachelor's degree or higher.
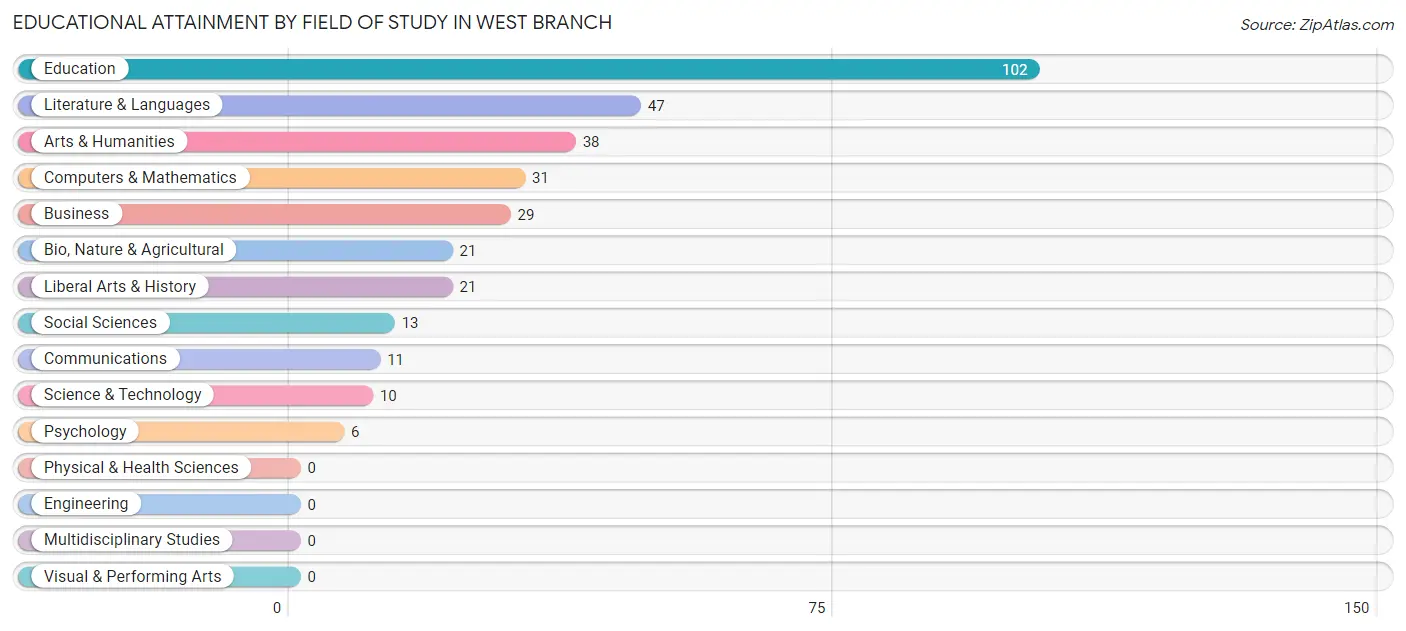
| Field of Study | # Graduates | % Graduates |
| Computers & Mathematics | 31 | 9.4% |
| Bio, Nature & Agricultural | 21 | 6.4% |
| Physical & Health Sciences | 0 | 0.0% |
| Psychology | 6 | 1.8% |
| Social Sciences | 13 | 4.0% |
| Engineering | 0 | 0.0% |
| Multidisciplinary Studies | 0 | 0.0% |
| Science & Technology | 10 | 3.0% |
| Business | 29 | 8.8% |
| Education | 102 | 31.0% |
| Literature & Languages | 47 | 14.3% |
| Liberal Arts & History | 21 | 6.4% |
| Visual & Performing Arts | 0 | 0.0% |
| Communications | 11 | 3.3% |
| Arts & Humanities | 38 | 11.6% |
| Total | 329 | 100.0% |
Transportation & Commute in West Branch
Vehicle Availability by Sex in West Branch
The most prevalent vehicle ownership categories in West Branch are males with 2 vehicles (146, accounting for 39.5%) and females with 2 vehicles (138, making up 41.6%).
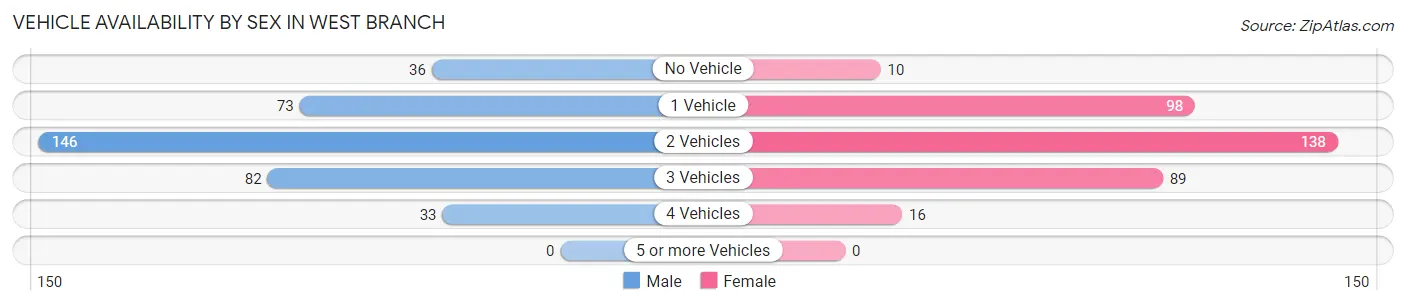
| Vehicles Available | Male | Female |
| No Vehicle | 36 (9.7%) | 10 (2.9%) |
| 1 Vehicle | 73 (19.7%) | 98 (27.9%) |
| 2 Vehicles | 146 (39.5%) | 138 (39.3%) |
| 3 Vehicles | 82 (22.2%) | 89 (25.4%) |
| 4 Vehicles | 33 (8.9%) | 16 (4.6%) |
| 5 or more Vehicles | 0 (0.0%) | 0 (0.0%) |
| Total | 370 (100.0%) | 351 (100.0%) |
Commute Time in West Branch
The most frequently occuring commute durations in West Branch are 5 to 9 minutes (207 commuters, 29.2%), 10 to 14 minutes (121 commuters, 17.1%), and less than 5 minutes (116 commuters, 16.4%).
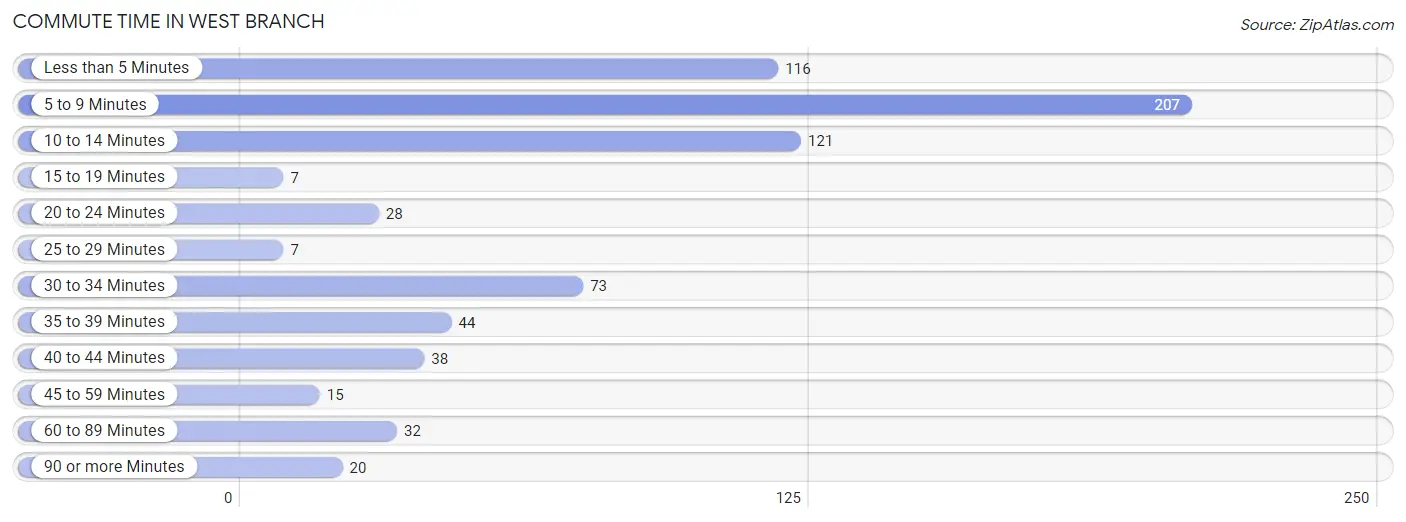
| Commute Time | # Commuters | % Commuters |
| Less than 5 Minutes | 116 | 16.4% |
| 5 to 9 Minutes | 207 | 29.2% |
| 10 to 14 Minutes | 121 | 17.1% |
| 15 to 19 Minutes | 7 | 1.0% |
| 20 to 24 Minutes | 28 | 4.0% |
| 25 to 29 Minutes | 7 | 1.0% |
| 30 to 34 Minutes | 73 | 10.3% |
| 35 to 39 Minutes | 44 | 6.2% |
| 40 to 44 Minutes | 38 | 5.4% |
| 45 to 59 Minutes | 15 | 2.1% |
| 60 to 89 Minutes | 32 | 4.5% |
| 90 or more Minutes | 20 | 2.8% |
Commute Time by Sex in West Branch
The most common commute times in West Branch are 5 to 9 minutes (130 commuters, 35.9%) for males and 5 to 9 minutes (77 commuters, 22.3%) for females.
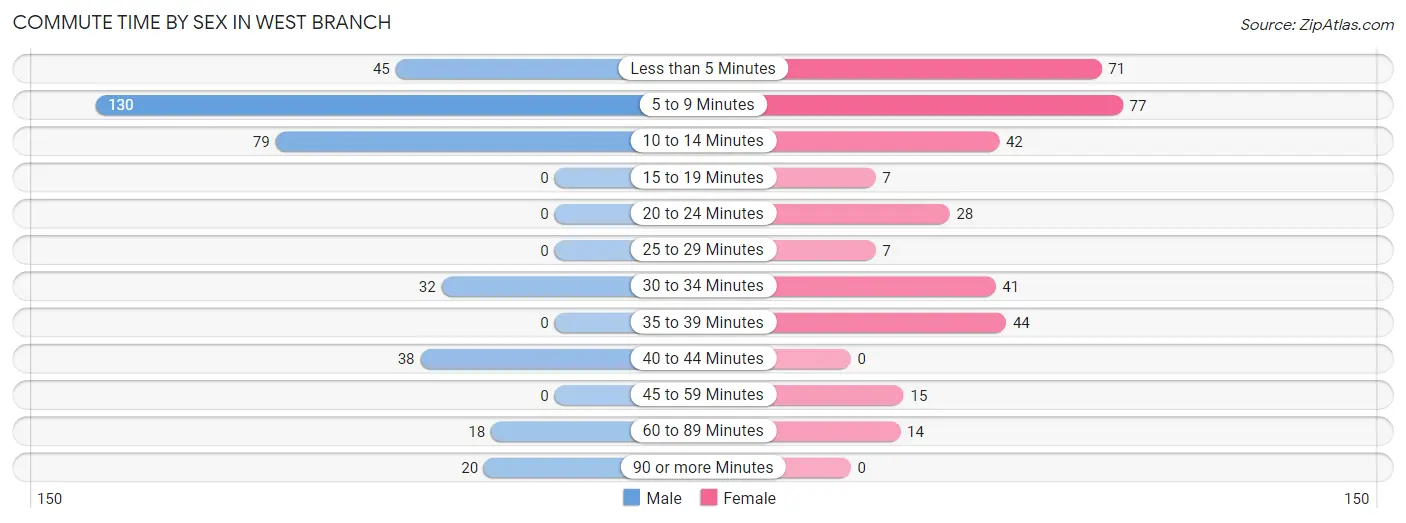
| Commute Time | Male | Female |
| Less than 5 Minutes | 45 (12.4%) | 71 (20.5%) |
| 5 to 9 Minutes | 130 (35.9%) | 77 (22.3%) |
| 10 to 14 Minutes | 79 (21.8%) | 42 (12.1%) |
| 15 to 19 Minutes | 0 (0.0%) | 7 (2.0%) |
| 20 to 24 Minutes | 0 (0.0%) | 28 (8.1%) |
| 25 to 29 Minutes | 0 (0.0%) | 7 (2.0%) |
| 30 to 34 Minutes | 32 (8.8%) | 41 (11.8%) |
| 35 to 39 Minutes | 0 (0.0%) | 44 (12.7%) |
| 40 to 44 Minutes | 38 (10.5%) | 0 (0.0%) |
| 45 to 59 Minutes | 0 (0.0%) | 15 (4.3%) |
| 60 to 89 Minutes | 18 (5.0%) | 14 (4.1%) |
| 90 or more Minutes | 20 (5.5%) | 0 (0.0%) |
Time of Departure to Work by Sex in West Branch
The most frequent times of departure to work in West Branch are 12:00 PM to 3:59 PM (55, 15.2%) for males and 7:30 AM to 7:59 AM (48, 13.9%) for females.
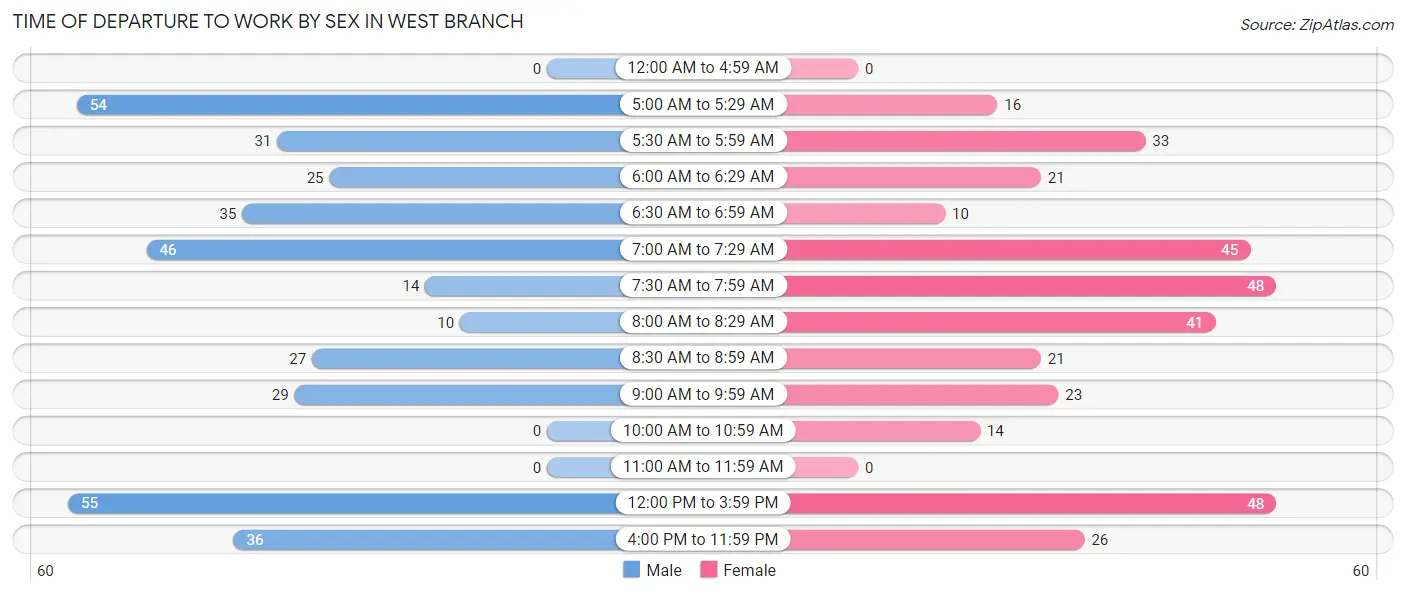
| Time of Departure | Male | Female |
| 12:00 AM to 4:59 AM | 0 (0.0%) | 0 (0.0%) |
| 5:00 AM to 5:29 AM | 54 (14.9%) | 16 (4.6%) |
| 5:30 AM to 5:59 AM | 31 (8.6%) | 33 (9.5%) |
| 6:00 AM to 6:29 AM | 25 (6.9%) | 21 (6.1%) |
| 6:30 AM to 6:59 AM | 35 (9.7%) | 10 (2.9%) |
| 7:00 AM to 7:29 AM | 46 (12.7%) | 45 (13.0%) |
| 7:30 AM to 7:59 AM | 14 (3.9%) | 48 (13.9%) |
| 8:00 AM to 8:29 AM | 10 (2.8%) | 41 (11.8%) |
| 8:30 AM to 8:59 AM | 27 (7.5%) | 21 (6.1%) |
| 9:00 AM to 9:59 AM | 29 (8.0%) | 23 (6.7%) |
| 10:00 AM to 10:59 AM | 0 (0.0%) | 14 (4.1%) |
| 11:00 AM to 11:59 AM | 0 (0.0%) | 0 (0.0%) |
| 12:00 PM to 3:59 PM | 55 (15.2%) | 48 (13.9%) |
| 4:00 PM to 11:59 PM | 36 (9.9%) | 26 (7.5%) |
| Total | 362 (100.0%) | 346 (100.0%) |
Housing Occupancy in West Branch
Occupancy by Ownership in West Branch
Of the total 978 dwellings in West Branch, owner-occupied units account for 392 (40.1%), while renter-occupied units make up 586 (59.9%).
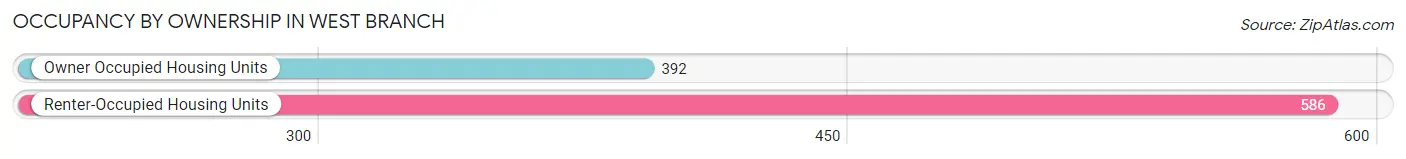
| Occupancy | # Housing Units | % Housing Units |
| Owner Occupied Housing Units | 392 | 40.1% |
| Renter-Occupied Housing Units | 586 | 59.9% |
| Total Occupied Housing Units | 978 | 100.0% |
Occupancy by Household Size in West Branch
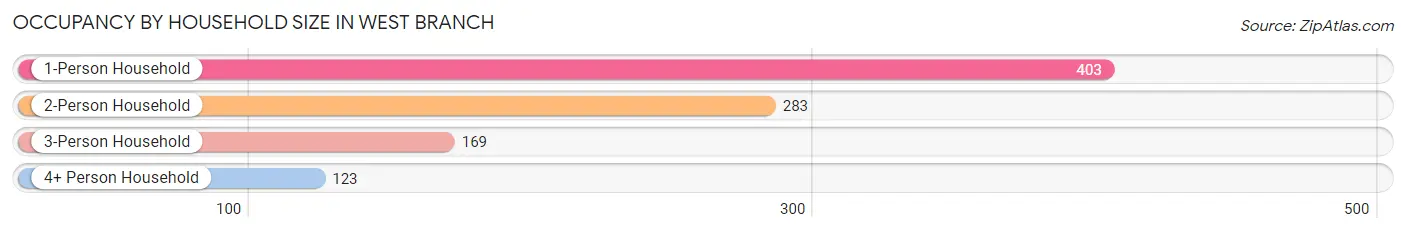
| Household Size | # Housing Units | % Housing Units |
| 1-Person Household | 403 | 41.2% |
| 2-Person Household | 283 | 28.9% |
| 3-Person Household | 169 | 17.3% |
| 4+ Person Household | 123 | 12.6% |
| Total Housing Units | 978 | 100.0% |
Occupancy by Ownership by Household Size in West Branch
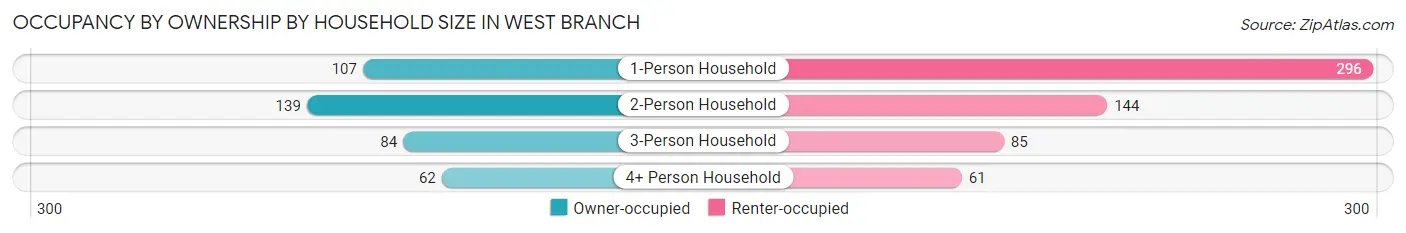
| Household Size | Owner-occupied | Renter-occupied |
| 1-Person Household | 107 (26.6%) | 296 (73.5%) |
| 2-Person Household | 139 (49.1%) | 144 (50.9%) |
| 3-Person Household | 84 (49.7%) | 85 (50.3%) |
| 4+ Person Household | 62 (50.4%) | 61 (49.6%) |
| Total Housing Units | 392 (40.1%) | 586 (59.9%) |
Occupancy by Educational Attainment in West Branch
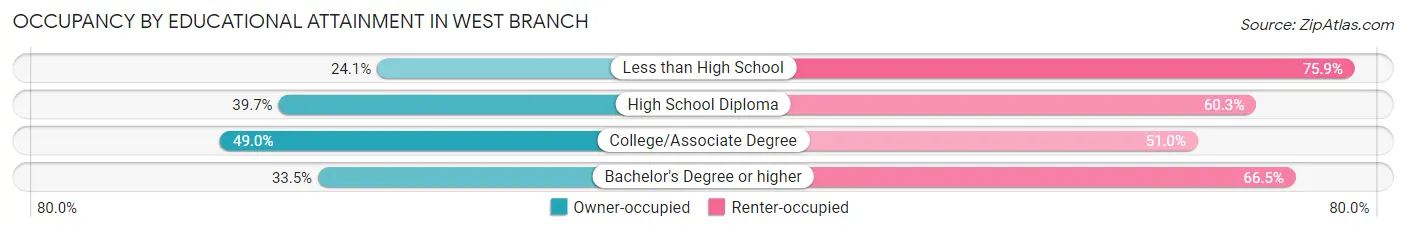
| Household Size | Owner-occupied | Renter-occupied |
| Less than High School | 20 (24.1%) | 63 (75.9%) |
| High School Diploma | 120 (39.7%) | 182 (60.3%) |
| College/Associate Degree | 169 (49.0%) | 176 (51.0%) |
| Bachelor's Degree or higher | 83 (33.5%) | 165 (66.5%) |
Occupancy by Age of Householder in West Branch
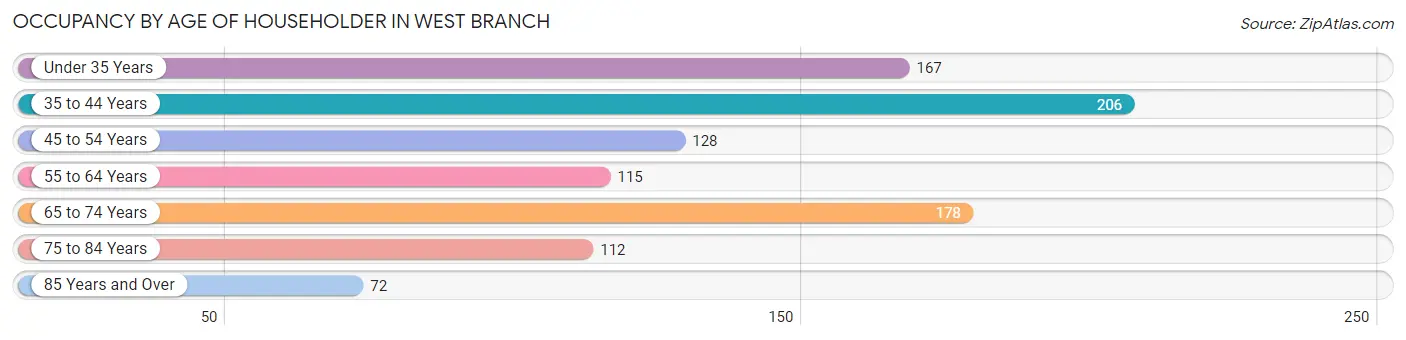
| Age Bracket | # Households | % Households |
| Under 35 Years | 167 | 17.1% |
| 35 to 44 Years | 206 | 21.1% |
| 45 to 54 Years | 128 | 13.1% |
| 55 to 64 Years | 115 | 11.8% |
| 65 to 74 Years | 178 | 18.2% |
| 75 to 84 Years | 112 | 11.5% |
| 85 Years and Over | 72 | 7.4% |
| Total | 978 | 100.0% |
Housing Finances in West Branch
Median Income by Occupancy in West Branch
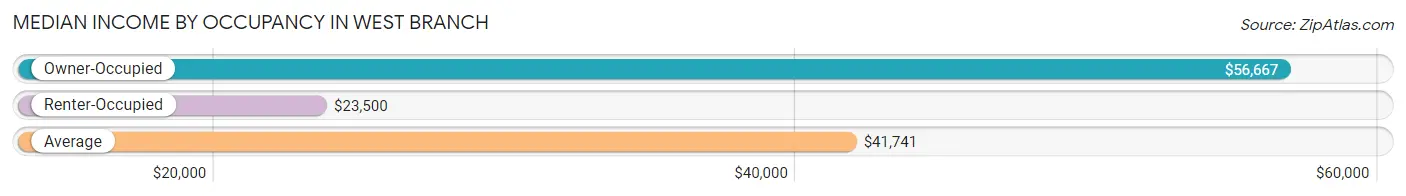
| Occupancy Type | # Households | Median Income |
| Owner-Occupied | 392 (40.1%) | $56,667 |
| Renter-Occupied | 586 (59.9%) | $23,500 |
| Average | 978 (100.0%) | $41,741 |
Occupancy by Householder Income Bracket in West Branch
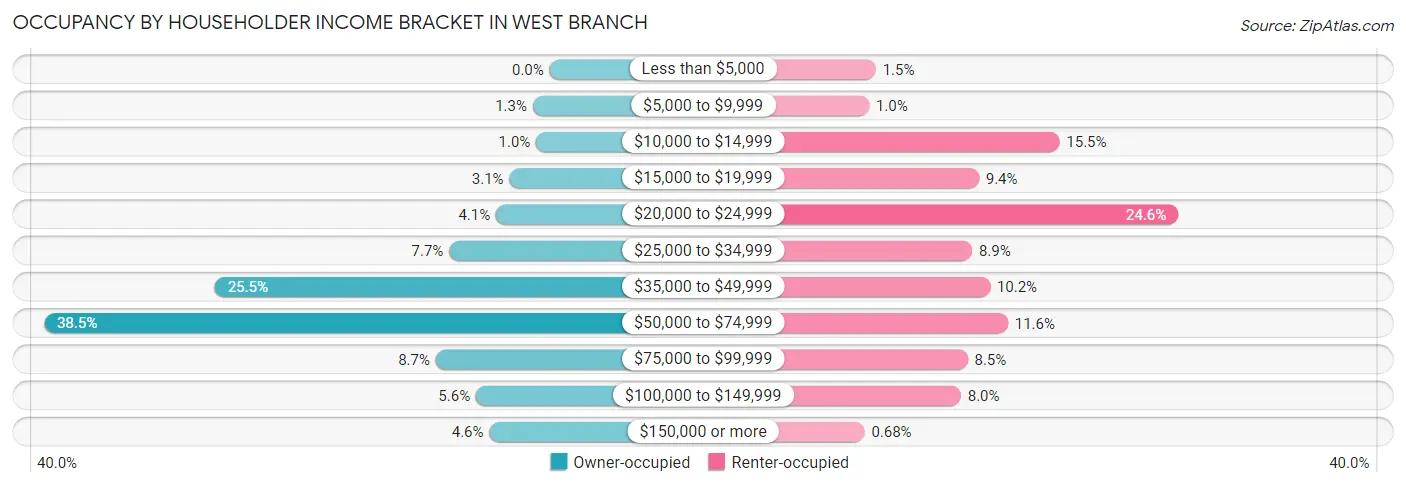
| Income Bracket | Owner-occupied | Renter-occupied |
| Less than $5,000 | 0 (0.0%) | 9 (1.5%) |
| $5,000 to $9,999 | 5 (1.3%) | 6 (1.0%) |
| $10,000 to $14,999 | 4 (1.0%) | 91 (15.5%) |
| $15,000 to $19,999 | 12 (3.1%) | 55 (9.4%) |
| $20,000 to $24,999 | 16 (4.1%) | 144 (24.6%) |
| $25,000 to $34,999 | 30 (7.6%) | 52 (8.9%) |
| $35,000 to $49,999 | 100 (25.5%) | 60 (10.2%) |
| $50,000 to $74,999 | 151 (38.5%) | 68 (11.6%) |
| $75,000 to $99,999 | 34 (8.7%) | 50 (8.5%) |
| $100,000 to $149,999 | 22 (5.6%) | 47 (8.0%) |
| $150,000 or more | 18 (4.6%) | 4 (0.7%) |
| Total | 392 (100.0%) | 586 (100.0%) |
Monthly Housing Cost Tiers in West Branch
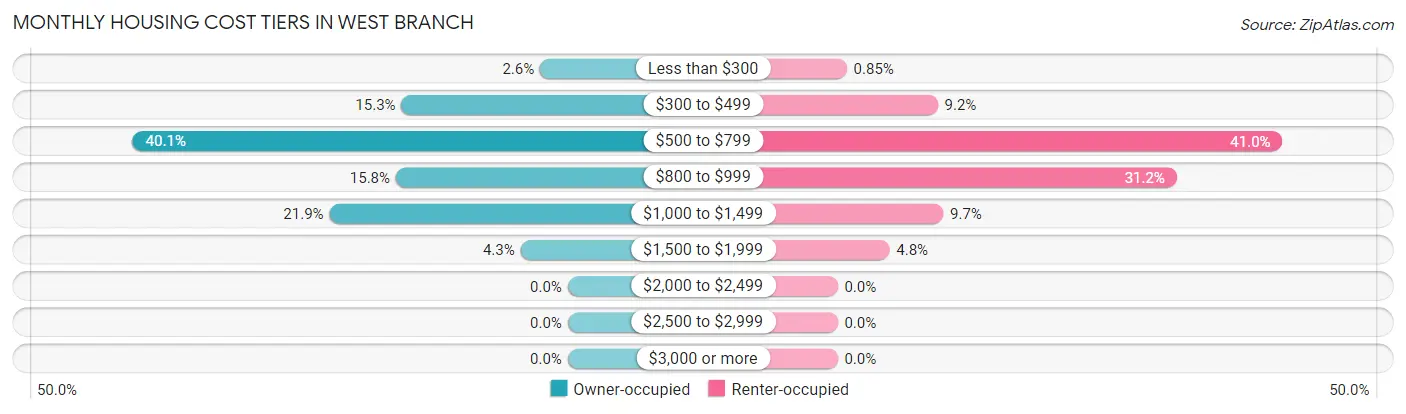
| Monthly Cost | Owner-occupied | Renter-occupied |
| Less than $300 | 10 (2.5%) | 5 (0.9%) |
| $300 to $499 | 60 (15.3%) | 54 (9.2%) |
| $500 to $799 | 157 (40.1%) | 240 (41.0%) |
| $800 to $999 | 62 (15.8%) | 183 (31.2%) |
| $1,000 to $1,499 | 86 (21.9%) | 57 (9.7%) |
| $1,500 to $1,999 | 17 (4.3%) | 28 (4.8%) |
| $2,000 to $2,499 | 0 (0.0%) | 0 (0.0%) |
| $2,500 to $2,999 | 0 (0.0%) | 0 (0.0%) |
| $3,000 or more | 0 (0.0%) | 0 (0.0%) |
| Total | 392 (100.0%) | 586 (100.0%) |
Physical Housing Characteristics in West Branch
Housing Structures in West Branch
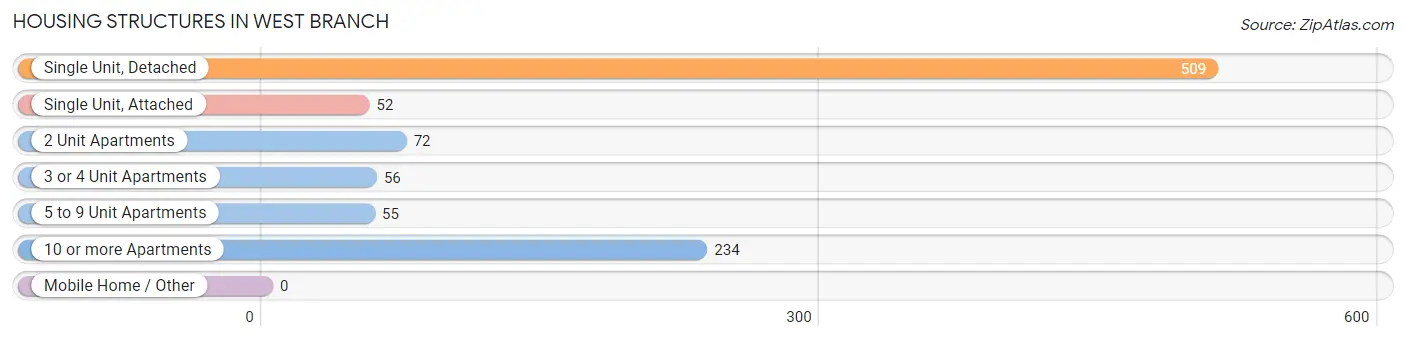
| Structure Type | # Housing Units | % Housing Units |
| Single Unit, Detached | 509 | 52.0% |
| Single Unit, Attached | 52 | 5.3% |
| 2 Unit Apartments | 72 | 7.4% |
| 3 or 4 Unit Apartments | 56 | 5.7% |
| 5 to 9 Unit Apartments | 55 | 5.6% |
| 10 or more Apartments | 234 | 23.9% |
| Mobile Home / Other | 0 | 0.0% |
| Total | 978 | 100.0% |
Housing Structures by Occupancy in West Branch
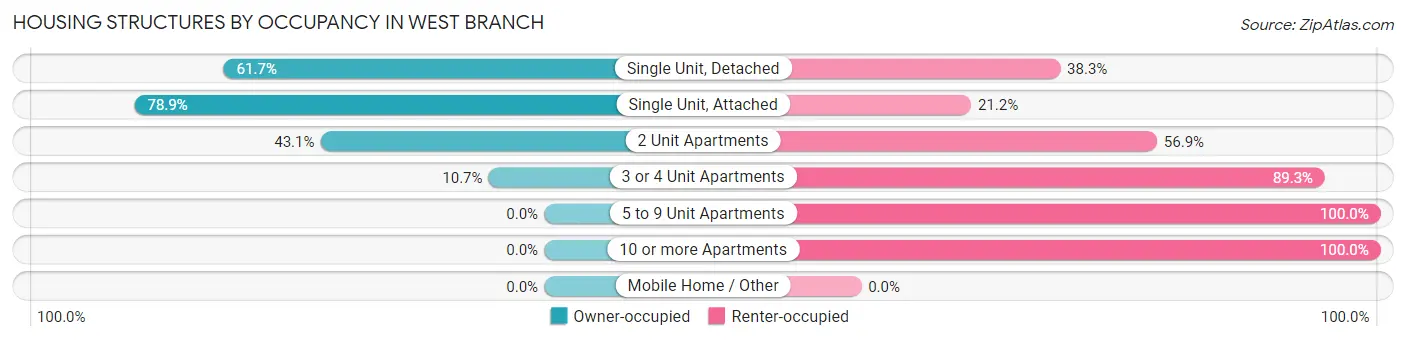
| Structure Type | Owner-occupied | Renter-occupied |
| Single Unit, Detached | 314 (61.7%) | 195 (38.3%) |
| Single Unit, Attached | 41 (78.8%) | 11 (21.1%) |
| 2 Unit Apartments | 31 (43.1%) | 41 (56.9%) |
| 3 or 4 Unit Apartments | 6 (10.7%) | 50 (89.3%) |
| 5 to 9 Unit Apartments | 0 (0.0%) | 55 (100.0%) |
| 10 or more Apartments | 0 (0.0%) | 234 (100.0%) |
| Mobile Home / Other | 0 (0.0%) | 0 (0.0%) |
| Total | 392 (40.1%) | 586 (59.9%) |
Housing Structures by Number of Rooms in West Branch
| Number of Rooms | Owner-occupied | Renter-occupied |
| 1 Room | 0 (0.0%) | 8 (1.4%) |
| 2 or 3 Rooms | 14 (3.6%) | 91 (15.5%) |
| 4 or 5 Rooms | 89 (22.7%) | 347 (59.2%) |
| 6 or 7 Rooms | 221 (56.4%) | 120 (20.5%) |
| 8 or more Rooms | 68 (17.3%) | 20 (3.4%) |
| Total | 392 (100.0%) | 586 (100.0%) |
Housing Structure by Heating Type in West Branch
| Heating Type | Owner-occupied | Renter-occupied |
| Utility Gas | 355 (90.6%) | 411 (70.1%) |
| Bottled, Tank, or LP Gas | 6 (1.5%) | 26 (4.4%) |
| Electricity | 24 (6.1%) | 132 (22.5%) |
| Fuel Oil or Kerosene | 0 (0.0%) | 0 (0.0%) |
| Coal or Coke | 0 (0.0%) | 0 (0.0%) |
| All other Fuels | 7 (1.8%) | 0 (0.0%) |
| No Fuel Used | 0 (0.0%) | 17 (2.9%) |
| Total | 392 (100.0%) | 586 (100.0%) |
Household Vehicle Usage in West Branch
| Vehicles per Household | Owner-occupied | Renter-occupied |
| No Vehicle | 12 (3.1%) | 145 (24.7%) |
| 1 Vehicle | 145 (37.0%) | 300 (51.2%) |
| 2 Vehicles | 157 (40.1%) | 101 (17.2%) |
| 3 or more Vehicles | 78 (19.9%) | 40 (6.8%) |
| Total | 392 (100.0%) | 586 (100.0%) |
Real Estate & Mortgages in West Branch
Real Estate and Mortgage Overview in West Branch
| Characteristic | Without Mortgage | With Mortgage |
| Housing Units | 186 | 206 |
| Median Property Value | $120,500 | $100,000 |
| Median Household Income | $56,250 | $6 |
| Monthly Housing Costs | $563 | $0 |
| Real Estate Taxes | $1,864 | $0 |
Property Value by Mortgage Status in West Branch
| Property Value | Without Mortgage | With Mortgage |
| Less than $50,000 | 12 (6.5%) | 4 (1.9%) |
| $50,000 to $99,999 | 58 (31.2%) | 99 (48.1%) |
| $100,000 to $299,999 | 105 (56.5%) | 96 (46.6%) |
| $300,000 to $499,999 | 0 (0.0%) | 7 (3.4%) |
| $500,000 to $749,999 | 11 (5.9%) | 0 (0.0%) |
| $750,000 to $999,999 | 0 (0.0%) | 0 (0.0%) |
| $1,000,000 or more | 0 (0.0%) | 0 (0.0%) |
| Total | 186 (100.0%) | 206 (100.0%) |
Household Income by Mortgage Status in West Branch
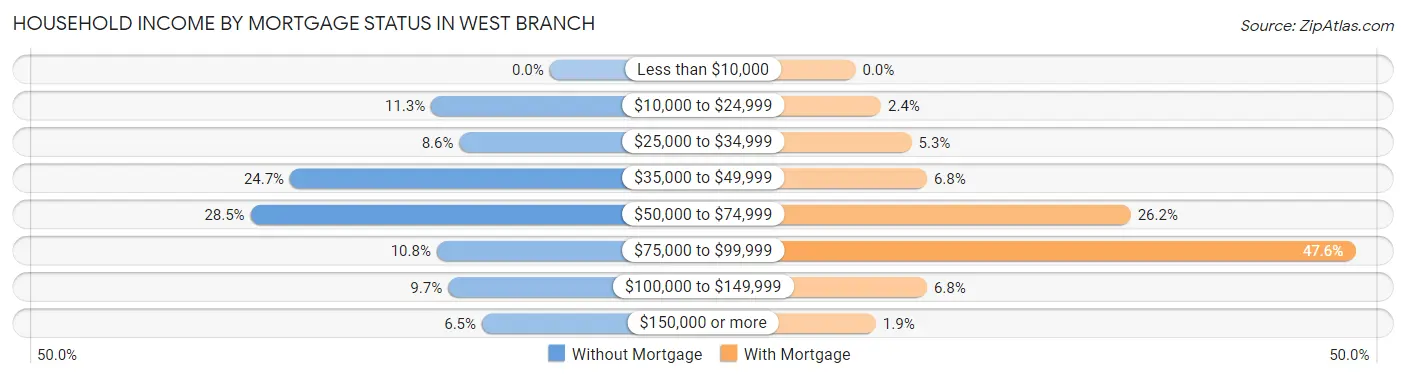
| Household Income | Without Mortgage | With Mortgage |
| Less than $10,000 | 0 (0.0%) | 0 (0.0%) |
| $10,000 to $24,999 | 21 (11.3%) | 5 (2.4%) |
| $25,000 to $34,999 | 16 (8.6%) | 11 (5.3%) |
| $35,000 to $49,999 | 46 (24.7%) | 14 (6.8%) |
| $50,000 to $74,999 | 53 (28.5%) | 54 (26.2%) |
| $75,000 to $99,999 | 20 (10.7%) | 98 (47.6%) |
| $100,000 to $149,999 | 18 (9.7%) | 14 (6.8%) |
| $150,000 or more | 12 (6.5%) | 4 (1.9%) |
| Total | 186 (100.0%) | 206 (100.0%) |
Property Value to Household Income Ratio in West Branch
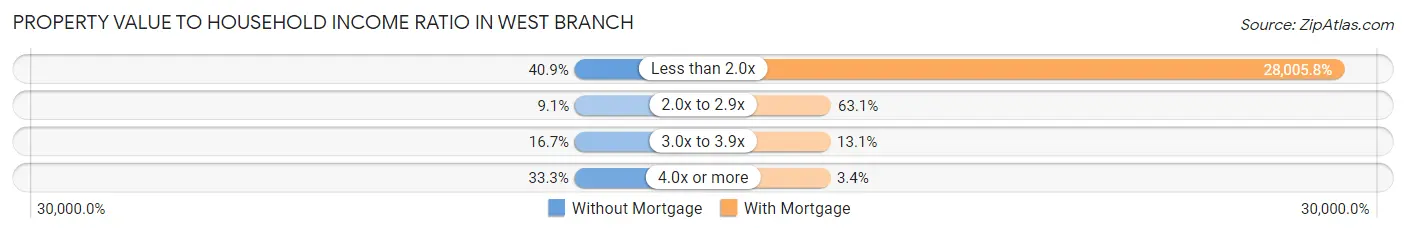
| Value-to-Income Ratio | Without Mortgage | With Mortgage |
| Less than 2.0x | 76 (40.9%) | 57,692 (28,005.8%) |
| 2.0x to 2.9x | 17 (9.1%) | 130 (63.1%) |
| 3.0x to 3.9x | 31 (16.7%) | 27 (13.1%) |
| 4.0x or more | 62 (33.3%) | 7 (3.4%) |
| Total | 186 (100.0%) | 206 (100.0%) |
Real Estate Taxes by Mortgage Status in West Branch
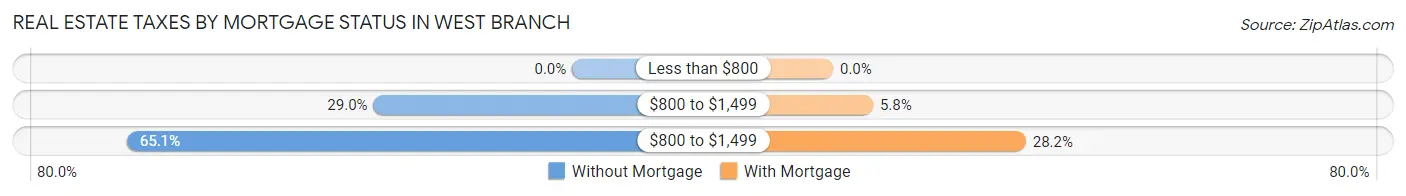
| Property Taxes | Without Mortgage | With Mortgage |
| Less than $800 | 0 (0.0%) | 0 (0.0%) |
| $800 to $1,499 | 54 (29.0%) | 12 (5.8%) |
| $800 to $1,499 | 121 (65.0%) | 58 (28.2%) |
| Total | 186 (100.0%) | 206 (100.0%) |
Health & Disability in West Branch
Health Insurance Coverage by Age in West Branch
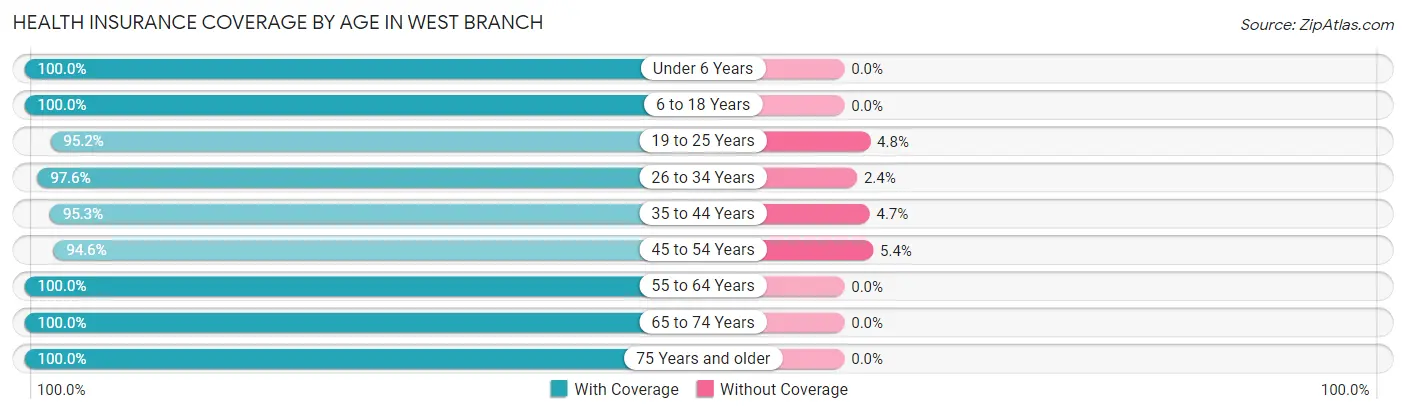
| Age Bracket | With Coverage | Without Coverage |
| Under 6 Years | 95 (100.0%) | 0 (0.0%) |
| 6 to 18 Years | 344 (100.0%) | 0 (0.0%) |
| 19 to 25 Years | 217 (95.2%) | 11 (4.8%) |
| 26 to 34 Years | 165 (97.6%) | 4 (2.4%) |
| 35 to 44 Years | 283 (95.3%) | 14 (4.7%) |
| 45 to 54 Years | 194 (94.6%) | 11 (5.4%) |
| 55 to 64 Years | 175 (100.0%) | 0 (0.0%) |
| 65 to 74 Years | 256 (100.0%) | 0 (0.0%) |
| 75 Years and older | 245 (100.0%) | 0 (0.0%) |
| Total | 1,974 (98.0%) | 40 (2.0%) |
Health Insurance Coverage by Citizenship Status in West Branch
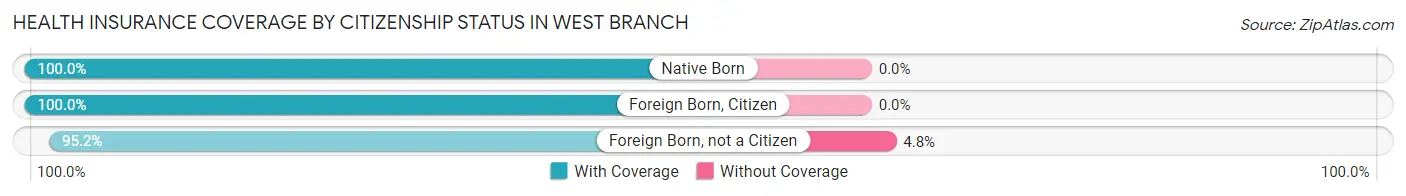
| Citizenship Status | With Coverage | Without Coverage |
| Native Born | 95 (100.0%) | 0 (0.0%) |
| Foreign Born, Citizen | 344 (100.0%) | 0 (0.0%) |
| Foreign Born, not a Citizen | 217 (95.2%) | 11 (4.8%) |
Health Insurance Coverage by Household Income in West Branch
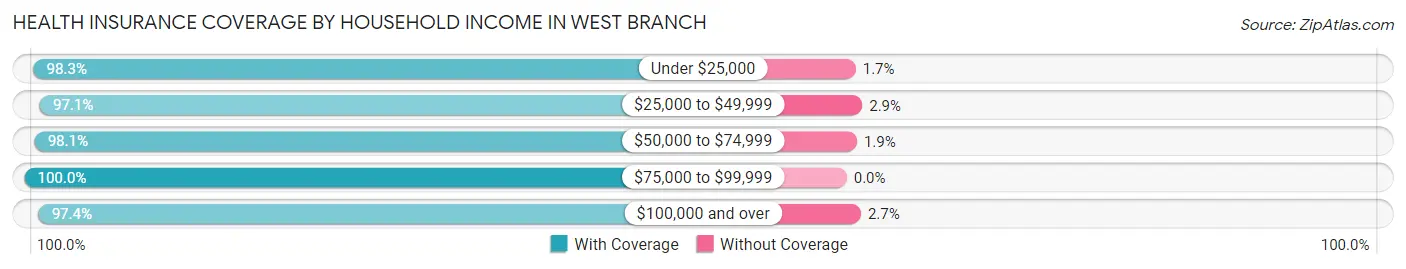
| Household Income | With Coverage | Without Coverage |
| Under $25,000 | 466 (98.3%) | 8 (1.7%) |
| $25,000 to $49,999 | 503 (97.1%) | 15 (2.9%) |
| $50,000 to $74,999 | 566 (98.1%) | 11 (1.9%) |
| $75,000 to $99,999 | 219 (100.0%) | 0 (0.0%) |
| $100,000 and over | 220 (97.4%) | 6 (2.6%) |
Public vs Private Health Insurance Coverage by Age in West Branch
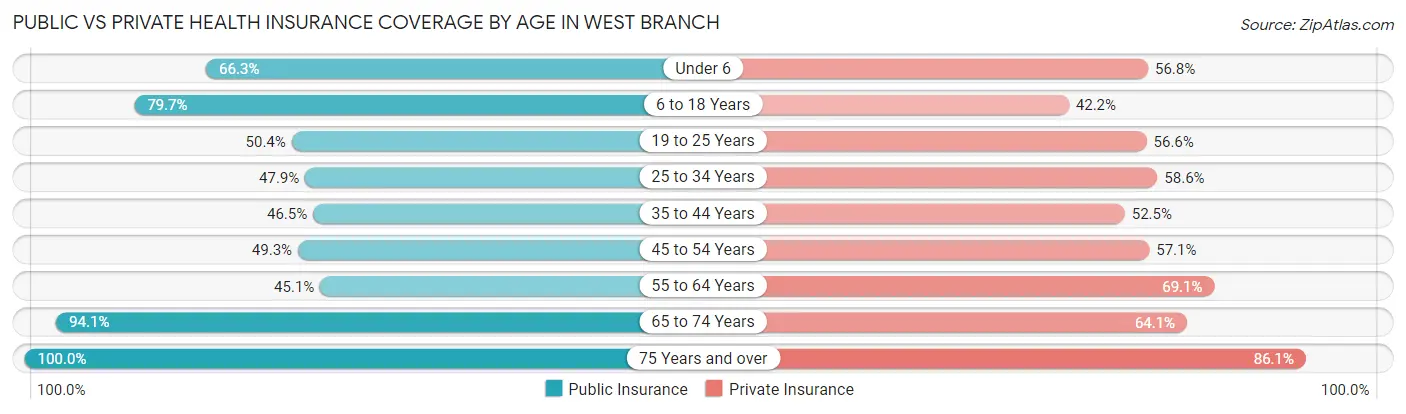
| Age Bracket | Public Insurance | Private Insurance |
| Under 6 | 63 (66.3%) | 54 (56.8%) |
| 6 to 18 Years | 274 (79.6%) | 145 (42.1%) |
| 19 to 25 Years | 115 (50.4%) | 129 (56.6%) |
| 25 to 34 Years | 81 (47.9%) | 99 (58.6%) |
| 35 to 44 Years | 138 (46.5%) | 156 (52.5%) |
| 45 to 54 Years | 101 (49.3%) | 117 (57.1%) |
| 55 to 64 Years | 79 (45.1%) | 121 (69.1%) |
| 65 to 74 Years | 241 (94.1%) | 164 (64.1%) |
| 75 Years and over | 245 (100.0%) | 211 (86.1%) |
| Total | 1,337 (66.4%) | 1,196 (59.4%) |
Disability Status by Sex by Age in West Branch
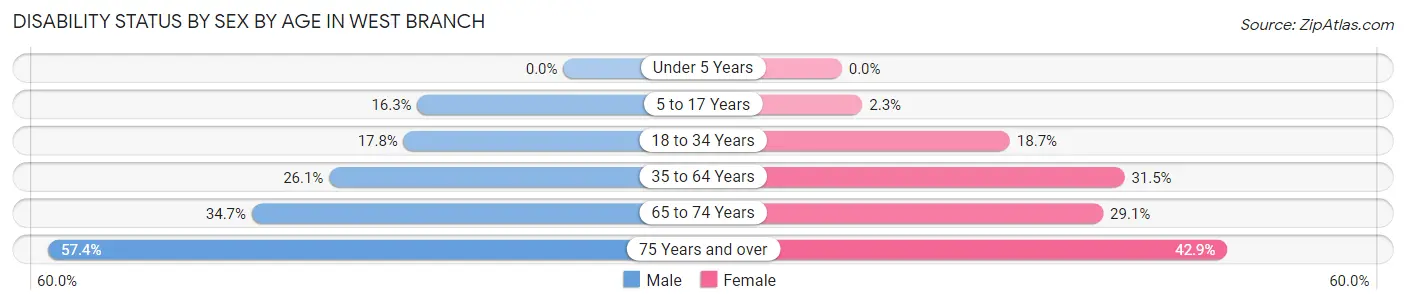
| Age Bracket | Male | Female |
| Under 5 Years | 0 (0.0%) | 0 (0.0%) |
| 5 to 17 Years | 26 (16.3%) | 4 (2.3%) |
| 18 to 34 Years | 32 (17.8%) | 44 (18.7%) |
| 35 to 64 Years | 97 (26.1%) | 96 (31.5%) |
| 65 to 74 Years | 34 (34.7%) | 46 (29.1%) |
| 75 Years and over | 35 (57.4%) | 79 (42.9%) |
Disability Class by Sex by Age in West Branch
Disability Class: Hearing Difficulty
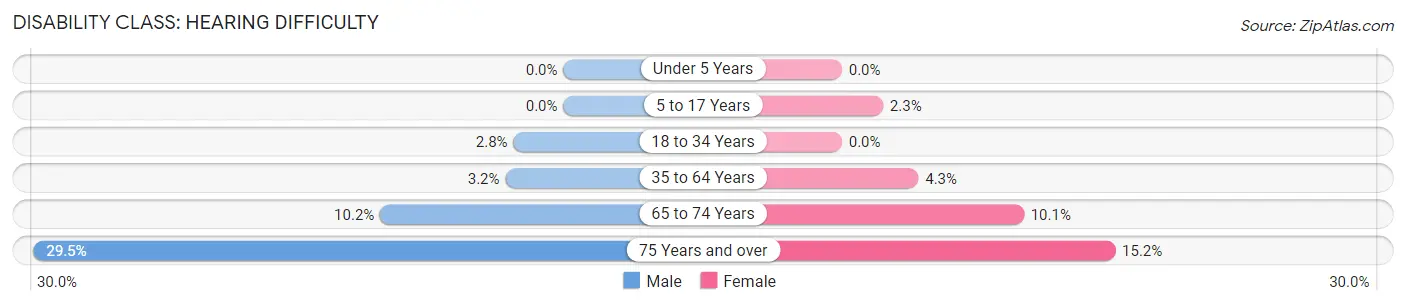
| Age Bracket | Male | Female |
| Under 5 Years | 0 (0.0%) | 0 (0.0%) |
| 5 to 17 Years | 0 (0.0%) | 4 (2.3%) |
| 18 to 34 Years | 5 (2.8%) | 0 (0.0%) |
| 35 to 64 Years | 12 (3.2%) | 13 (4.3%) |
| 65 to 74 Years | 10 (10.2%) | 16 (10.1%) |
| 75 Years and over | 18 (29.5%) | 28 (15.2%) |
Disability Class: Vision Difficulty
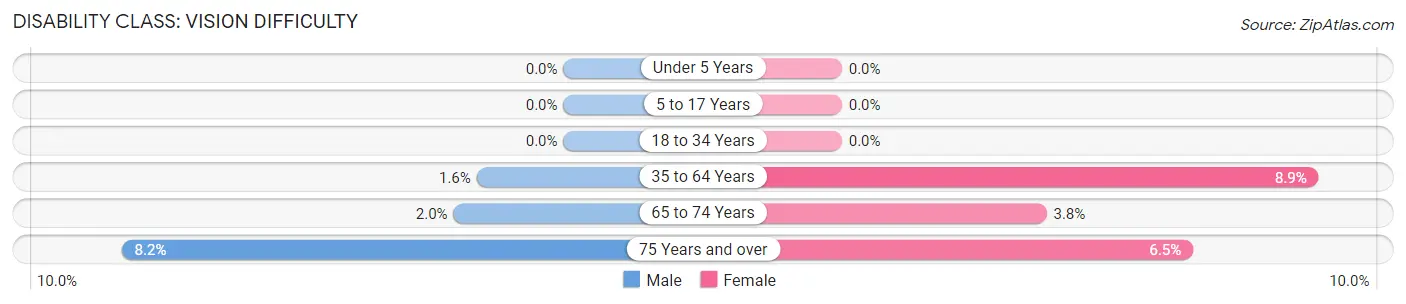
| Age Bracket | Male | Female |
| Under 5 Years | 0 (0.0%) | 0 (0.0%) |
| 5 to 17 Years | 0 (0.0%) | 0 (0.0%) |
| 18 to 34 Years | 0 (0.0%) | 0 (0.0%) |
| 35 to 64 Years | 6 (1.6%) | 27 (8.8%) |
| 65 to 74 Years | 2 (2.0%) | 6 (3.8%) |
| 75 Years and over | 5 (8.2%) | 12 (6.5%) |
Disability Class: Cognitive Difficulty
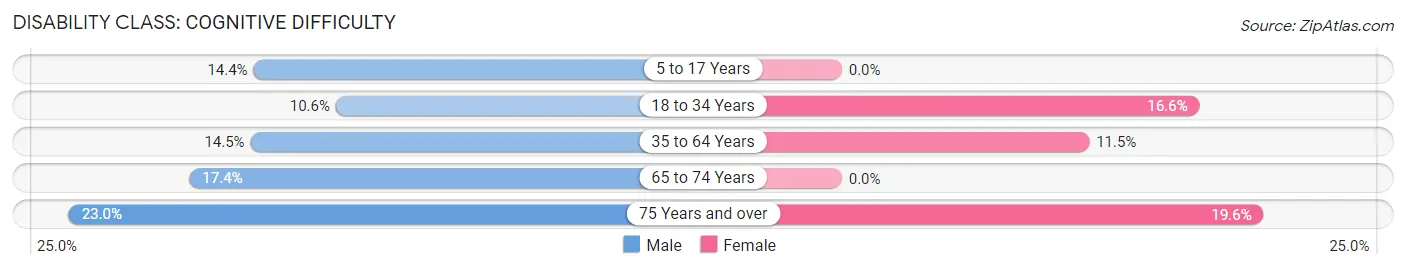
| Age Bracket | Male | Female |
| 5 to 17 Years | 23 (14.4%) | 0 (0.0%) |
| 18 to 34 Years | 19 (10.6%) | 39 (16.6%) |
| 35 to 64 Years | 54 (14.5%) | 35 (11.5%) |
| 65 to 74 Years | 17 (17.3%) | 0 (0.0%) |
| 75 Years and over | 14 (23.0%) | 36 (19.6%) |
Disability Class: Ambulatory Difficulty
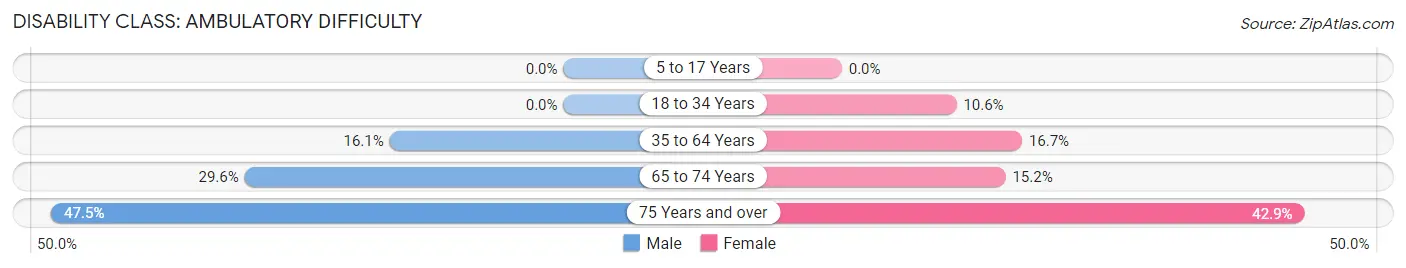
| Age Bracket | Male | Female |
| 5 to 17 Years | 0 (0.0%) | 0 (0.0%) |
| 18 to 34 Years | 0 (0.0%) | 25 (10.6%) |
| 35 to 64 Years | 60 (16.1%) | 51 (16.7%) |
| 65 to 74 Years | 29 (29.6%) | 24 (15.2%) |
| 75 Years and over | 29 (47.5%) | 79 (42.9%) |
Disability Class: Self-Care Difficulty
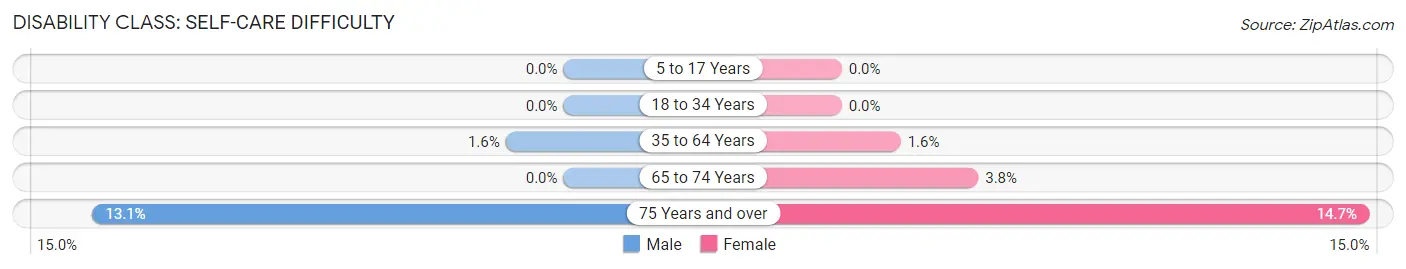
| Age Bracket | Male | Female |
| 5 to 17 Years | 0 (0.0%) | 0 (0.0%) |
| 18 to 34 Years | 0 (0.0%) | 0 (0.0%) |
| 35 to 64 Years | 6 (1.6%) | 5 (1.6%) |
| 65 to 74 Years | 0 (0.0%) | 6 (3.8%) |
| 75 Years and over | 8 (13.1%) | 27 (14.7%) |
Technology Access in West Branch
Computing Device Access in West Branch
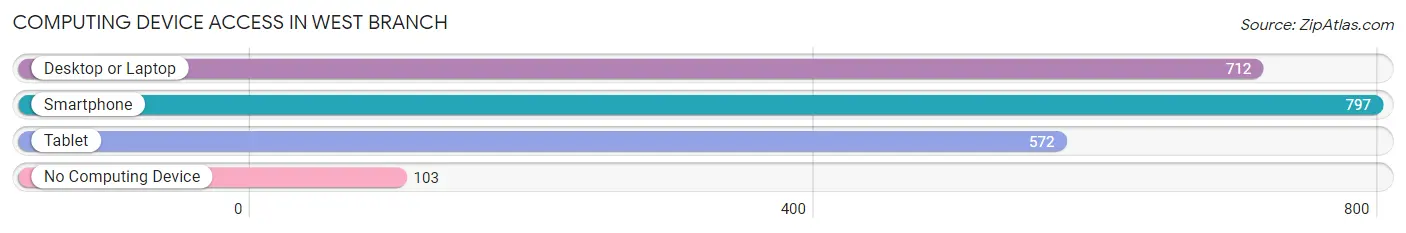
| Device Type | # Households | % Households |
| Desktop or Laptop | 712 | 72.8% |
| Smartphone | 797 | 81.5% |
| Tablet | 572 | 58.5% |
| No Computing Device | 103 | 10.5% |
| Total | 978 | 100.0% |
Internet Access in West Branch

| Internet Type | # Households | % Households |
| Dial-Up Internet | 0 | 0.0% |
| Broadband Home | 735 | 75.1% |
| Cellular Data Only | 66 | 6.8% |
| Satellite Internet | 42 | 4.3% |
| No Internet | 160 | 16.4% |
| Total | 978 | 100.0% |
West Branch Summary
West Branch, Michigan is a small city located in Ogemaw County in the northern part of the Lower Peninsula of Michigan. The city is situated on the banks of the Rifle River and is surrounded by rolling hills and forests. The city has a population of approximately 3,000 people and is the county seat of Ogemaw County.
History
West Branch was first settled in 1871 by a group of lumberjacks from Wisconsin. The city was named after the nearby West Branch of the Rifle River. The city was incorporated in 1887 and quickly became a hub for the lumber industry. The city was also home to a number of sawmills and other businesses related to the lumber industry.
In the early 1900s, West Branch began to diversify its economy and become a center for manufacturing. The city was home to a number of factories, including a paper mill, a furniture factory, and a canning factory. The city also became a center for the automotive industry, with a number of auto parts suppliers and manufacturers setting up shop in the city.
Geography
West Branch is located in the northern part of the Lower Peninsula of Michigan. The city is situated on the banks of the Rifle River and is surrounded by rolling hills and forests. The city has a total area of 4.2 square miles, all of which is land. The city has a humid continental climate, with cold winters and warm summers.
Economy
West Branch’s economy is largely based on manufacturing and tourism. The city is home to a number of factories, including a paper mill, a furniture factory, and a canning factory. The city is also home to a number of auto parts suppliers and manufacturers.
Tourism is also an important part of the city’s economy. The city is home to a number of attractions, including the West Branch State Park, the Ogemaw County Historical Museum, and the West Branch Historical Society. The city also hosts a number of festivals and events throughout the year, including the West Branch Summer Festival and the West Branch Fall Festival.
Demographics
As of the 2010 census, West Branch had a population of 3,039 people. The racial makeup of the city was 95.2% White, 0.7% African American, 0.4% Native American, 0.7% Asian, 0.1% Pacific Islander, 0.9% from other races, and 1.9% from two or more races. Hispanic or Latino of any race were 2.3% of the population.
The median household income in West Branch was $37,917, and the median family income was $45,938. The per capita income for the city was $19,945. About 11.2% of families and 14.2% of the population were below the poverty line, including 19.2% of those under age 18 and 8.2% of those age 65 or over.
Common Questions
What is Per Capita Income in West Branch?
Per Capita income in West Branch is $22,702.
What is the Median Family Income in West Branch?
Median Family Income in West Branch is $51,786.
What is the Median Household income in West Branch?
Median Household Income in West Branch is $41,741.
What is Income or Wage Gap in West Branch?
Income or Wage Gap in West Branch is 23.7%.
Women in West Branch earn 76.3 cents for every dollar earned by a man.
What is Family Income Deficit in West Branch?
Family Income Deficit in West Branch is $10,227.
Families that are below poverty line in West Branch earn $10,227 less on average than the poverty threshold level.
What is Inequality or Gini Index in West Branch?
Inequality or Gini Index in West Branch is 0.38.
What is the Total Population of West Branch?
Total Population of West Branch is 2,198.
What is the Total Male Population of West Branch?
Total Male Population of West Branch is 1,028.
What is the Total Female Population of West Branch?
Total Female Population of West Branch is 1,170.
What is the Ratio of Males per 100 Females in West Branch?
There are 87.86 Males per 100 Females in West Branch.
What is the Ratio of Females per 100 Males in West Branch?
There are 113.81 Females per 100 Males in West Branch.
What is the Median Population Age in West Branch?
Median Population Age in West Branch is 39.8 Years.
What is the Average Family Size in West Branch
Average Family Size in West Branch is 2.8 People.
What is the Average Household Size in West Branch
Average Household Size in West Branch is 2.1 People.
How Large is the Labor Force in West Branch?
There are 804 People in the Labor Forcein in West Branch.
What is the Percentage of People in the Labor Force in West Branch?
43.3% of People are in the Labor Force in West Branch.
What is the Unemployment Rate in West Branch?
Unemployment Rate in West Branch is 6.7%.