Barton Hills, MI Map & Demographics
Barton Hills Map
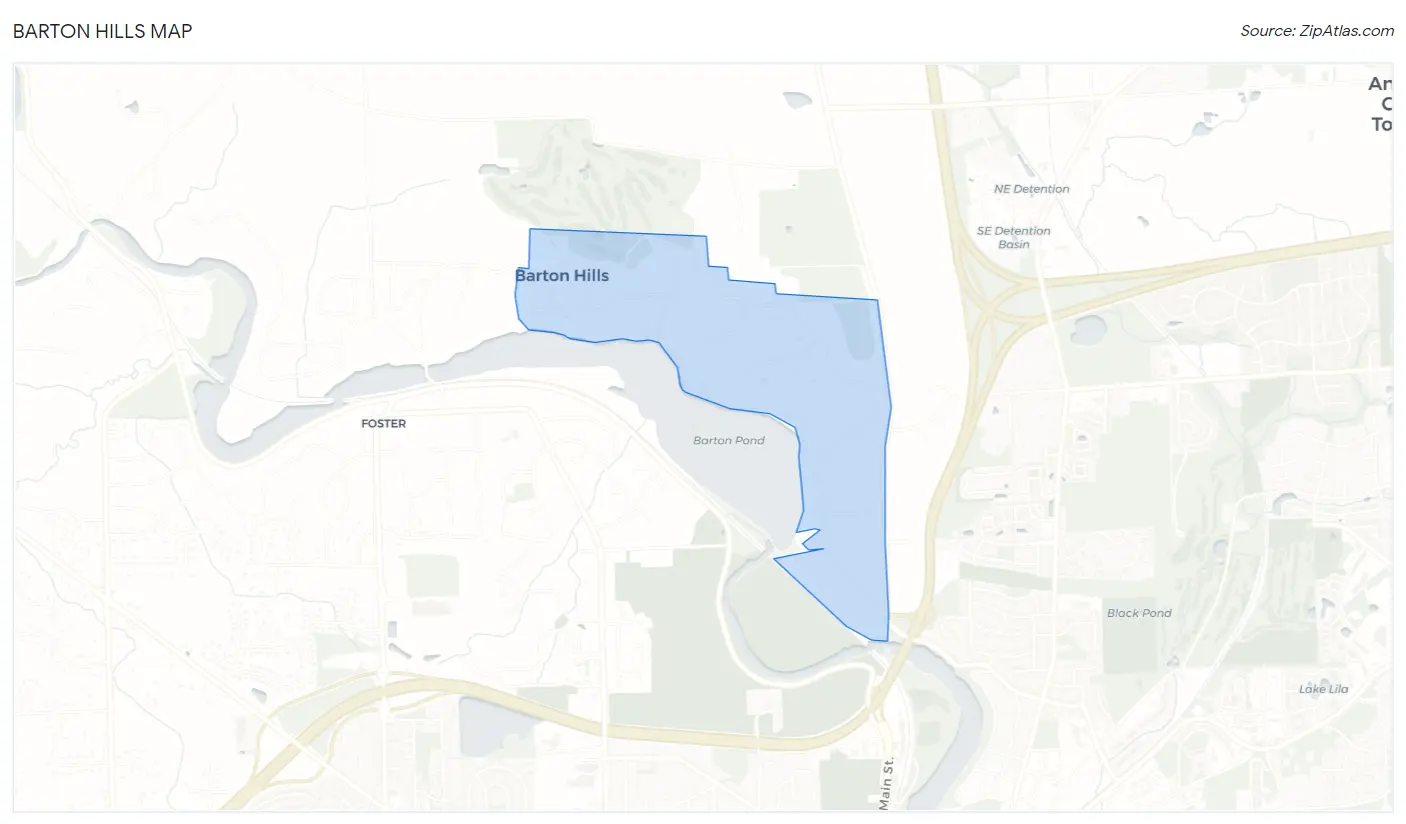
Barton Hills Overview
$194,386
PER CAPITA INCOME
$250,001
AVG FAMILY INCOME
$250,001
AVG HOUSEHOLD INCOME
43.2%
WAGE / INCOME GAP [ % ]
56.8¢/ $1
WAGE / INCOME GAP [ $ ]
0.42
INEQUALITY / GINI INDEX
444
TOTAL POPULATION
165
MALE POPULATION
279
FEMALE POPULATION
59.14
MALES / 100 FEMALES
169.09
FEMALES / 100 MALES
50.8
MEDIAN AGE
3.3
AVG FAMILY SIZE
2.5
AVG HOUSEHOLD SIZE
169
LABOR FORCE [ PEOPLE ]
50.8%
PERCENT IN LABOR FORCE
1.8%
UNEMPLOYMENT RATE
Income in Barton Hills
Income Overview in Barton Hills
Per Capita Income in Barton Hills is $194,386, while median incomes of families and households are $250,001 and $250,001 respectively.
| Characteristic | Number | Measure |
| Per Capita Income | 444 | $194,386 |
| Median Family Income | 116 | $250,001 |
| Mean Family Income | 116 | $499,801 |
| Median Household Income | 174 | $250,001 |
| Mean Household Income | 174 | $458,944 |
| Income Deficit | 116 | $0 |
| Wage / Income Gap (%) | 444 | 43.24% |
| Wage / Income Gap ($) | 444 | 56.76¢ per $1 |
| Gini / Inequality Index | 444 | 0.42 |
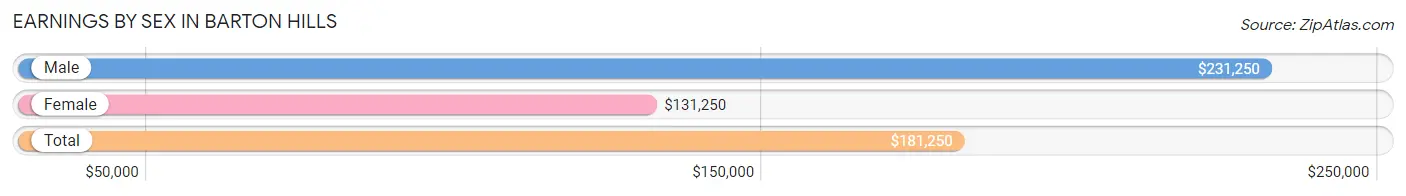
Earnings by Sex in Barton Hills
Average Earnings in Barton Hills are $181,250, $231,250 for men and $131,250 for women, a difference of 43.2%.
| Sex | Number | Average Earnings |
| Male | 101 (54.0%) | $231,250 |
| Female | 86 (46.0%) | $131,250 |
| Total | 187 (100.0%) | $181,250 |
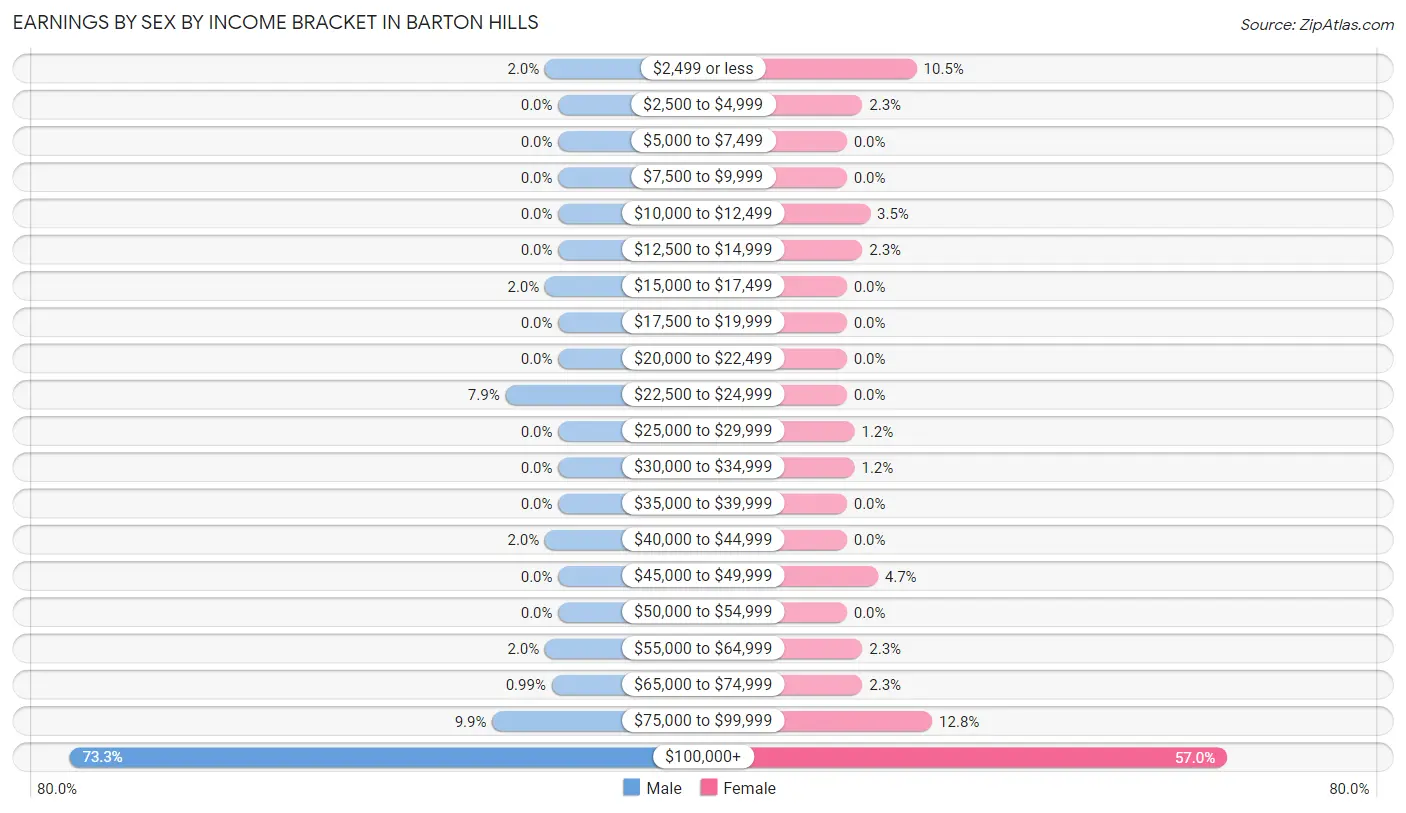
Earnings by Sex by Income Bracket in Barton Hills
The most common earnings brackets in Barton Hills are $100,000+ for men (74 | 73.3%) and $100,000+ for women (49 | 57.0%).
| Income | Male | Female |
| $2,499 or less | 2 (2.0%) | 9 (10.5%) |
| $2,500 to $4,999 | 0 (0.0%) | 2 (2.3%) |
| $5,000 to $7,499 | 0 (0.0%) | 0 (0.0%) |
| $7,500 to $9,999 | 0 (0.0%) | 0 (0.0%) |
| $10,000 to $12,499 | 0 (0.0%) | 3 (3.5%) |
| $12,500 to $14,999 | 0 (0.0%) | 2 (2.3%) |
| $15,000 to $17,499 | 2 (2.0%) | 0 (0.0%) |
| $17,500 to $19,999 | 0 (0.0%) | 0 (0.0%) |
| $20,000 to $22,499 | 0 (0.0%) | 0 (0.0%) |
| $22,500 to $24,999 | 8 (7.9%) | 0 (0.0%) |
| $25,000 to $29,999 | 0 (0.0%) | 1 (1.2%) |
| $30,000 to $34,999 | 0 (0.0%) | 1 (1.2%) |
| $35,000 to $39,999 | 0 (0.0%) | 0 (0.0%) |
| $40,000 to $44,999 | 2 (2.0%) | 0 (0.0%) |
| $45,000 to $49,999 | 0 (0.0%) | 4 (4.6%) |
| $50,000 to $54,999 | 0 (0.0%) | 0 (0.0%) |
| $55,000 to $64,999 | 2 (2.0%) | 2 (2.3%) |
| $65,000 to $74,999 | 1 (1.0%) | 2 (2.3%) |
| $75,000 to $99,999 | 10 (9.9%) | 11 (12.8%) |
| $100,000+ | 74 (73.3%) | 49 (57.0%) |
| Total | 101 (100.0%) | 86 (100.0%) |
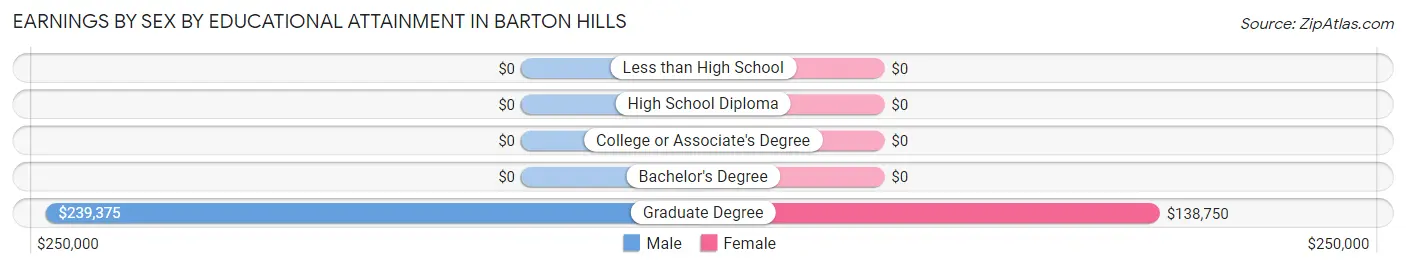
Earnings by Sex by Educational Attainment in Barton Hills
Average earnings in Barton Hills are $233,125 for men and $132,500 for women, a difference of 43.2%. Men with an educational attainment of graduate degree enjoy the highest average annual earnings of $239,375, while those with graduate degree education earn the least with $239,375. Women with an educational attainment of graduate degree earn the most with the average annual earnings of $138,750, while those with graduate degree education have the smallest earnings of $138,750.
| Educational Attainment | Male Income | Female Income |
| Less than High School | - | - |
| High School Diploma | - | - |
| College or Associate's Degree | - | - |
| Bachelor's Degree | - | - |
| Graduate Degree | $239,375 | $138,750 |
| Total | $233,125 | $132,500 |
Family Income in Barton Hills
Family Income Brackets in Barton Hills
According to the Barton Hills family income data, there are 84 families falling into the $200,000+ income range, which is the most common income bracket and makes up 72.4% of all families.
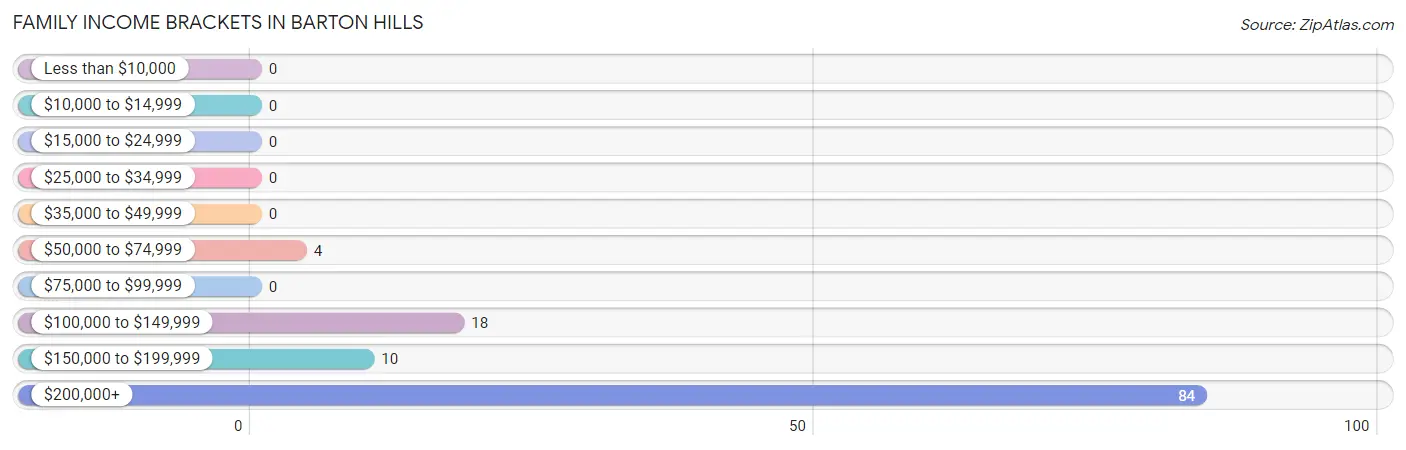
| Income Bracket | # Families | % Families |
| Less than $10,000 | 0 | 0.0% |
| $10,000 to $14,999 | 0 | 0.0% |
| $15,000 to $24,999 | 0 | 0.0% |
| $25,000 to $34,999 | 0 | 0.0% |
| $35,000 to $49,999 | 0 | 0.0% |
| $50,000 to $74,999 | 4 | 3.4% |
| $75,000 to $99,999 | 0 | 0.0% |
| $100,000 to $149,999 | 18 | 15.5% |
| $150,000 to $199,999 | 10 | 8.6% |
| $200,000+ | 84 | 72.4% |
Family Income by Famaliy Size in Barton Hills
2-person families (68 | 58.6%) account for the highest median family income in Barton Hills with $250,001 per family, while 2-person families (68 | 58.6%) have the highest median income of $125,000 per family member.
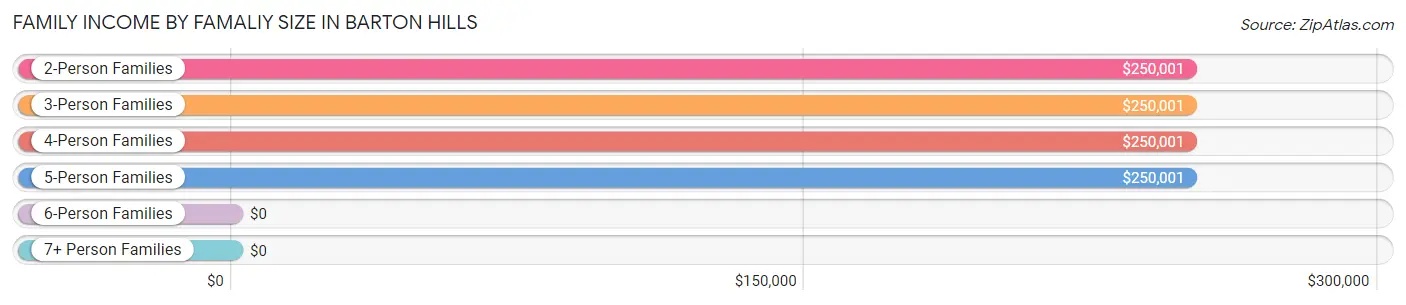
| Income Bracket | # Families | Median Income |
| 2-Person Families | 68 (58.6%) | $250,001 |
| 3-Person Families | 10 (8.6%) | $250,001 |
| 4-Person Families | 22 (19.0%) | $250,001 |
| 5-Person Families | 8 (6.9%) | $250,001 |
| 6-Person Families | 8 (6.9%) | $0 |
| 7+ Person Families | 0 (0.0%) | $0 |
| Total | 116 (100.0%) | $250,001 |
Family Income by Number of Earners in Barton Hills
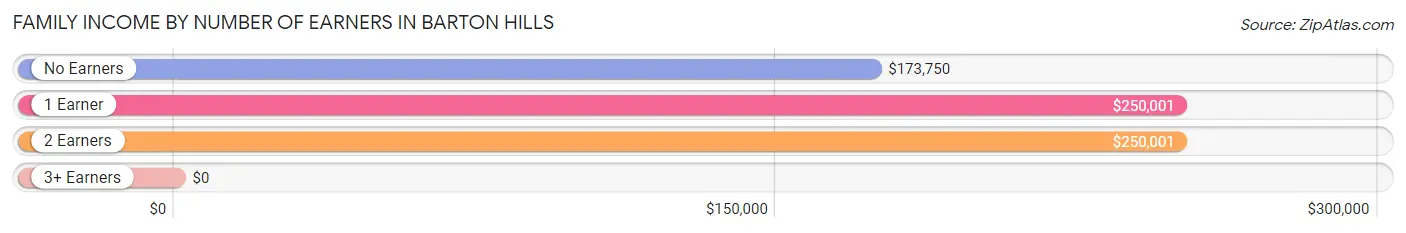
| Number of Earners | # Families | Median Income |
| No Earners | 15 (12.9%) | $173,750 |
| 1 Earner | 44 (37.9%) | $250,001 |
| 2 Earners | 54 (46.6%) | $250,001 |
| 3+ Earners | 3 (2.6%) | $0 |
| Total | 116 (100.0%) | $250,001 |
Household Income in Barton Hills
Household Income Brackets in Barton Hills
With 119 households falling in the category, the $200,000+ income range is the most frequent in Barton Hills, accounting for 68.4% of all households.
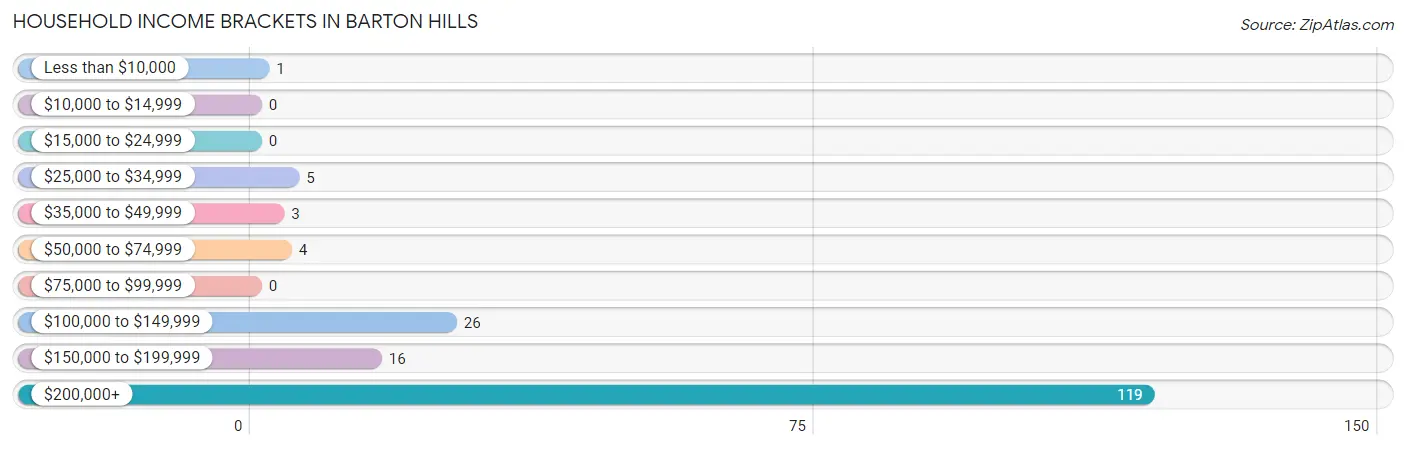
| Income Bracket | # Households | % Households |
| Less than $10,000 | 1 | 0.6% |
| $10,000 to $14,999 | 0 | 0.0% |
| $15,000 to $24,999 | 0 | 0.0% |
| $25,000 to $34,999 | 5 | 2.9% |
| $35,000 to $49,999 | 3 | 1.7% |
| $50,000 to $74,999 | 4 | 2.3% |
| $75,000 to $99,999 | 0 | 0.0% |
| $100,000 to $149,999 | 26 | 14.9% |
| $150,000 to $199,999 | 16 | 9.2% |
| $200,000+ | 119 | 68.4% |
Household Income by Householder Age in Barton Hills
The median household income in Barton Hills is $250,001, with the highest median household income of $250,001 found in the 25 to 44 years age bracket for the primary householder. A total of 17 households (9.8%) fall into this category.
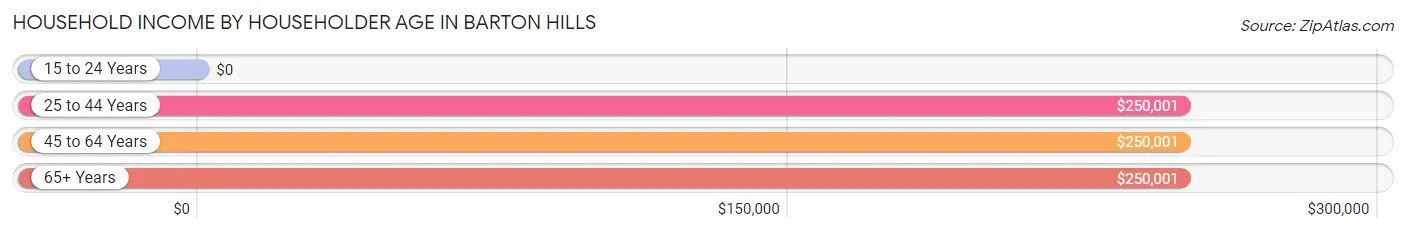
| Income Bracket | # Households | Median Income |
| 15 to 24 Years | 0 (0.0%) | $0 |
| 25 to 44 Years | 17 (9.8%) | $250,001 |
| 45 to 64 Years | 58 (33.3%) | $250,001 |
| 65+ Years | 99 (56.9%) | $250,001 |
| Total | 174 (100.0%) | $250,001 |
Poverty in Barton Hills
Income Below Poverty by Sex and Age in Barton Hills
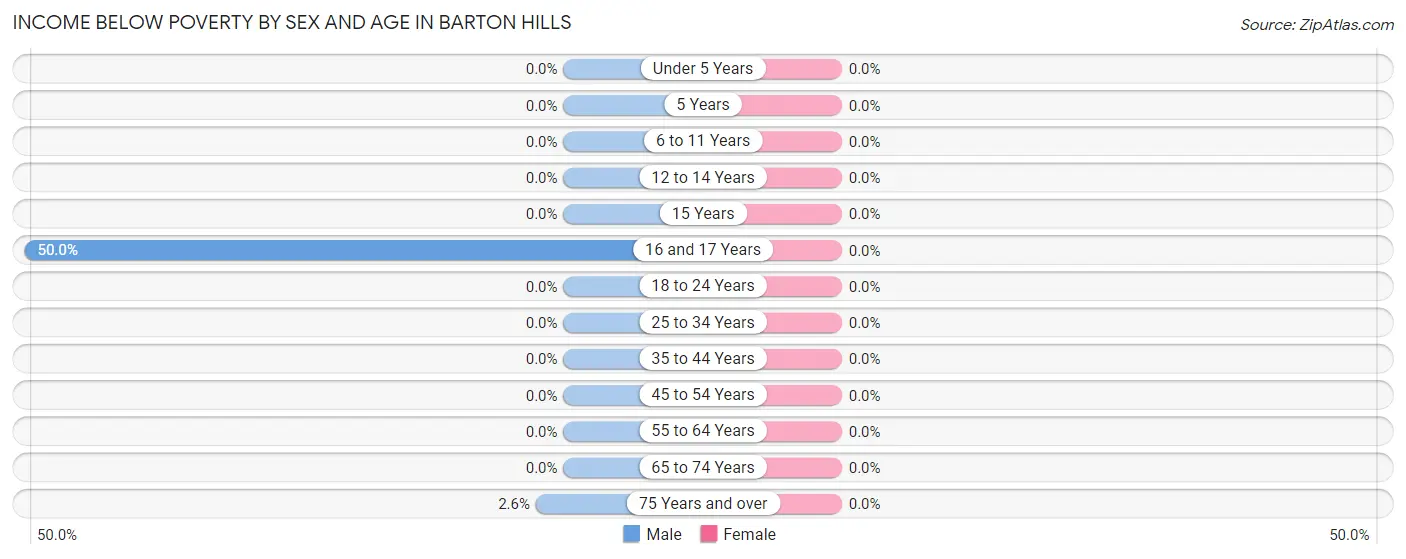
| Age Bracket | Male | Female |
| Under 5 Years | 0 (0.0%) | 0 (0.0%) |
| 5 Years | 0 (0.0%) | 0 (0.0%) |
| 6 to 11 Years | 0 (0.0%) | 0 (0.0%) |
| 12 to 14 Years | 0 (0.0%) | 0 (0.0%) |
| 15 Years | 0 (0.0%) | 0 (0.0%) |
| 16 and 17 Years | 2 (50.0%) | 0 (0.0%) |
| 18 to 24 Years | 0 (0.0%) | 0 (0.0%) |
| 25 to 34 Years | 0 (0.0%) | 0 (0.0%) |
| 35 to 44 Years | 0 (0.0%) | 0 (0.0%) |
| 45 to 54 Years | 0 (0.0%) | 0 (0.0%) |
| 55 to 64 Years | 0 (0.0%) | 0 (0.0%) |
| 65 to 74 Years | 0 (0.0%) | 0 (0.0%) |
| 75 Years and over | 1 (2.6%) | 0 (0.0%) |
| Total | 3 (1.8%) | 0 (0.0%) |
Income Above Poverty by Sex and Age in Barton Hills
According to the poverty statistics in Barton Hills, males aged under 5 years and females aged under 5 years are the age groups that are most secure financially, with 100.0% of males and 100.0% of females in these age groups living above the poverty line.
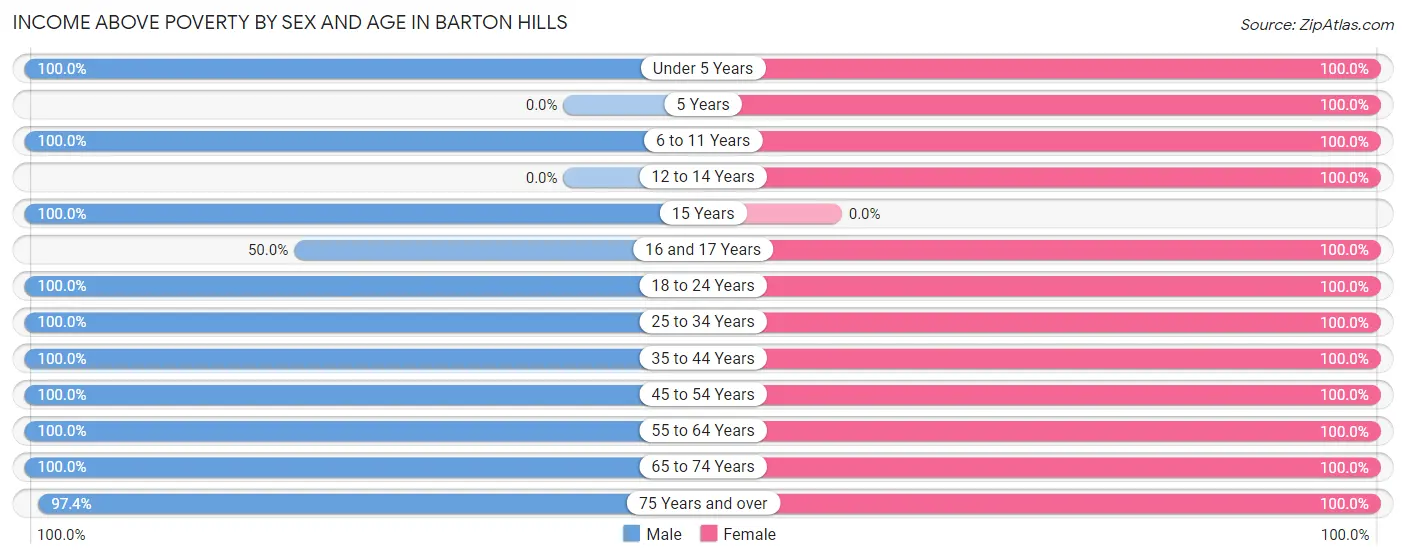
| Age Bracket | Male | Female |
| Under 5 Years | 4 (100.0%) | 15 (100.0%) |
| 5 Years | 0 (0.0%) | 1 (100.0%) |
| 6 to 11 Years | 19 (100.0%) | 62 (100.0%) |
| 12 to 14 Years | 0 (0.0%) | 8 (100.0%) |
| 15 Years | 2 (100.0%) | 0 (0.0%) |
| 16 and 17 Years | 2 (50.0%) | 6 (100.0%) |
| 18 to 24 Years | 5 (100.0%) | 7 (100.0%) |
| 25 to 34 Years | 5 (100.0%) | 8 (100.0%) |
| 35 to 44 Years | 10 (100.0%) | 14 (100.0%) |
| 45 to 54 Years | 45 (100.0%) | 49 (100.0%) |
| 55 to 64 Years | 15 (100.0%) | 23 (100.0%) |
| 65 to 74 Years | 17 (100.0%) | 24 (100.0%) |
| 75 Years and over | 38 (97.4%) | 62 (100.0%) |
| Total | 162 (98.2%) | 279 (100.0%) |
Income Below Poverty Among Married-Couple Families in Barton Hills
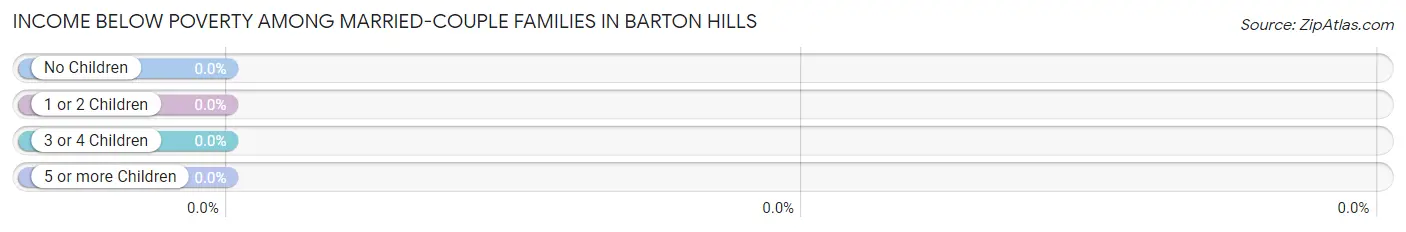
| Children | Above Poverty | Below Poverty |
| No Children | 73 (100.0%) | 0 (0.0%) |
| 1 or 2 Children | 27 (100.0%) | 0 (0.0%) |
| 3 or 4 Children | 12 (100.0%) | 0 (0.0%) |
| 5 or more Children | 0 (0.0%) | 0 (0.0%) |
| Total | 112 (100.0%) | 0 (0.0%) |
Income Below Poverty Among Single-Parent Households in Barton Hills
| Children | Single Father | Single Mother |
| No Children | 0 (0.0%) | 0 (0.0%) |
| 1 or 2 Children | 0 (0.0%) | 0 (0.0%) |
| 3 or 4 Children | 0 (0.0%) | 0 (0.0%) |
| 5 or more Children | 0 (0.0%) | 0 (0.0%) |
| Total | 0 (0.0%) | 0 (0.0%) |
Income Below Poverty Among Married-Couple vs Single-Parent Households in Barton Hills
| Children | Married-Couple Families | Single-Parent Households |
| No Children | 0 (0.0%) | 0 (0.0%) |
| 1 or 2 Children | 0 (0.0%) | 0 (0.0%) |
| 3 or 4 Children | 0 (0.0%) | 0 (0.0%) |
| 5 or more Children | 0 (0.0%) | 0 (0.0%) |
| Total | 0 (0.0%) | 0 (0.0%) |
Race in Barton Hills
The most populous races in Barton Hills are White / Caucasian (351 | 79.0%), Two or more Races (62 | 14.0%), and Asian (27 | 6.1%).
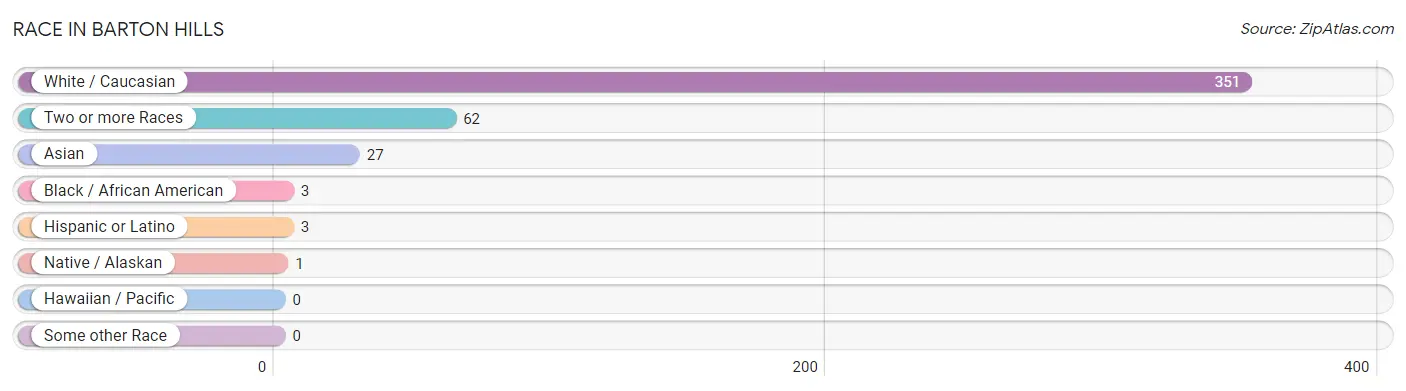
| Race | # Population | % Population |
| Asian | 27 | 6.1% |
| Black / African American | 3 | 0.7% |
| Hawaiian / Pacific | 0 | 0.0% |
| Hispanic or Latino | 3 | 0.7% |
| Native / Alaskan | 1 | 0.2% |
| White / Caucasian | 351 | 79.0% |
| Two or more Races | 62 | 14.0% |
| Some other Race | 0 | 0.0% |
| Total | 444 | 100.0% |
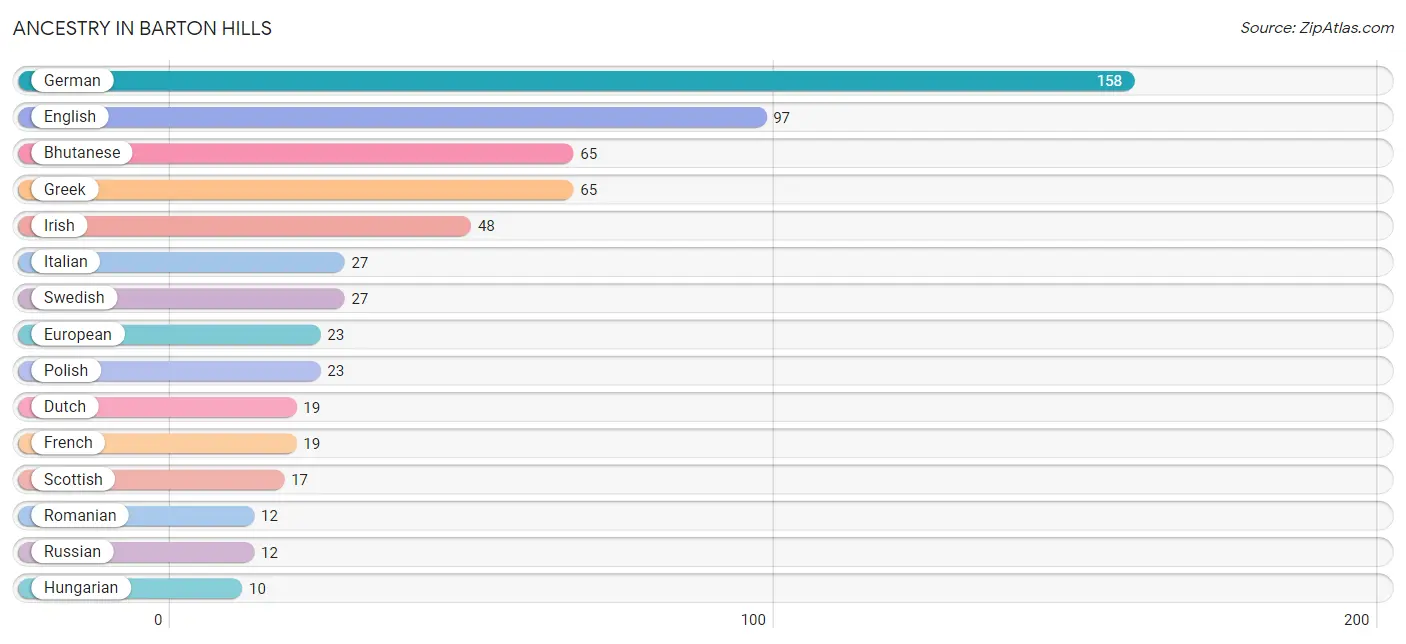
Ancestry in Barton Hills
The most populous ancestries reported in Barton Hills are German (158 | 35.6%), English (97 | 21.8%), Bhutanese (65 | 14.6%), Greek (65 | 14.6%), and Irish (48 | 10.8%), together accounting for 97.5% of all Barton Hills residents.
| Ancestry | # Population | % Population |
| American | 6 | 1.3% |
| Arab | 8 | 1.8% |
| Argentinean | 1 | 0.2% |
| Austrian | 1 | 0.2% |
| Bhutanese | 65 | 14.6% |
| Blackfeet | 1 | 0.2% |
| British | 3 | 0.7% |
| Burmese | 4 | 0.9% |
| Canadian | 1 | 0.2% |
| Czech | 9 | 2.0% |
| Dutch | 19 | 4.3% |
| English | 97 | 21.8% |
| European | 23 | 5.2% |
| French | 19 | 4.3% |
| German | 158 | 35.6% |
| Greek | 65 | 14.6% |
| Hungarian | 10 | 2.2% |
| Icelander | 2 | 0.4% |
| Indian (Asian) | 7 | 1.6% |
| Irish | 48 | 10.8% |
| Italian | 27 | 6.1% |
| Lebanese | 2 | 0.4% |
| Lithuanian | 2 | 0.4% |
| Mexican | 2 | 0.4% |
| Moroccan | 5 | 1.1% |
| Norwegian | 2 | 0.4% |
| Polish | 23 | 5.2% |
| Romanian | 12 | 2.7% |
| Russian | 12 | 2.7% |
| Scotch-Irish | 6 | 1.3% |
| Scottish | 17 | 3.8% |
| Serbian | 1 | 0.2% |
| South American | 1 | 0.2% |
| Sri Lankan | 2 | 0.4% |
| Swedish | 27 | 6.1% |
| Swiss | 3 | 0.7% |
| Syrian | 1 | 0.2% |
| Thai | 9 | 2.0% |
| Ukrainian | 10 | 2.2% |
| Welsh | 3 | 0.7% | View All 40 Rows |
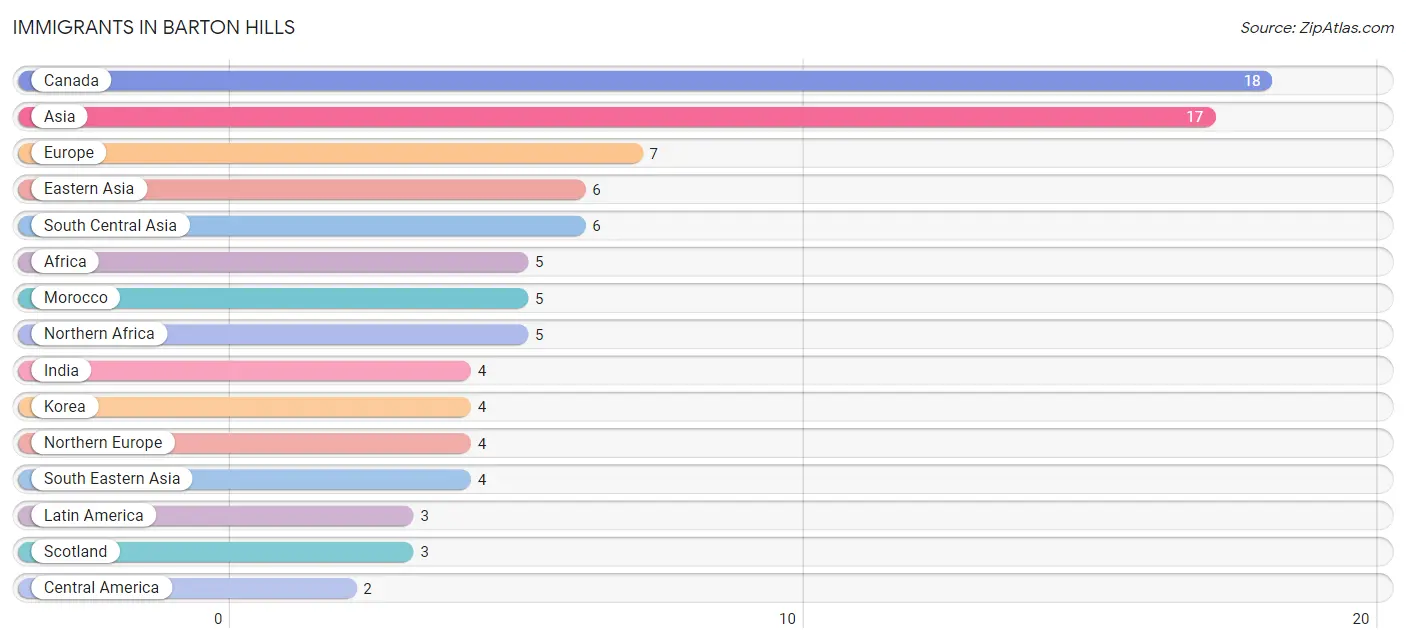
Immigrants in Barton Hills
The most numerous immigrant groups reported in Barton Hills came from Canada (18 | 4.1%), Asia (17 | 3.8%), Europe (7 | 1.6%), Eastern Asia (6 | 1.3%), and South Central Asia (6 | 1.3%), together accounting for 12.2% of all Barton Hills residents.
| Immigration Origin | # Population | % Population |
| Africa | 5 | 1.1% |
| Argentina | 1 | 0.2% |
| Asia | 17 | 3.8% |
| Canada | 18 | 4.1% |
| Central America | 2 | 0.4% |
| China | 2 | 0.4% |
| Eastern Asia | 6 | 1.3% |
| Eastern Europe | 2 | 0.4% |
| Europe | 7 | 1.6% |
| Germany | 1 | 0.2% |
| Hungary | 2 | 0.4% |
| India | 4 | 0.9% |
| Korea | 4 | 0.9% |
| Latin America | 3 | 0.7% |
| Lebanon | 1 | 0.2% |
| Mexico | 2 | 0.4% |
| Morocco | 5 | 1.1% |
| Northern Africa | 5 | 1.1% |
| Northern Europe | 4 | 0.9% |
| Norway | 1 | 0.2% |
| Pakistan | 2 | 0.4% |
| Scotland | 3 | 0.7% |
| Singapore | 2 | 0.4% |
| South America | 1 | 0.2% |
| South Central Asia | 6 | 1.3% |
| South Eastern Asia | 4 | 0.9% |
| Vietnam | 2 | 0.4% |
| Western Asia | 1 | 0.2% |
| Western Europe | 1 | 0.2% | View All 29 Rows |
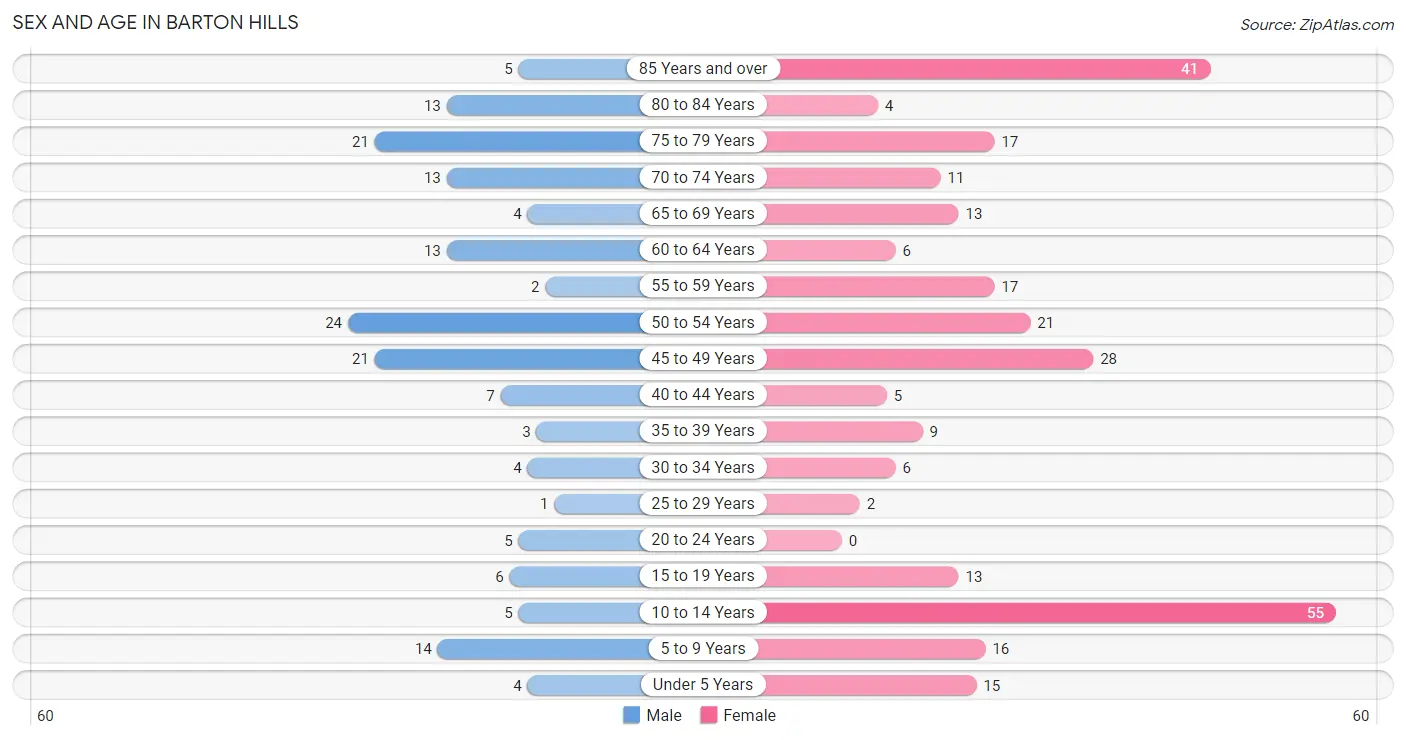
Sex and Age in Barton Hills
Sex and Age in Barton Hills
The most populous age groups in Barton Hills are 50 to 54 Years (24 | 14.5%) for men and 10 to 14 Years (55 | 19.7%) for women.
| Age Bracket | Male | Female |
| Under 5 Years | 4 (2.4%) | 15 (5.4%) |
| 5 to 9 Years | 14 (8.5%) | 16 (5.7%) |
| 10 to 14 Years | 5 (3.0%) | 55 (19.7%) |
| 15 to 19 Years | 6 (3.6%) | 13 (4.7%) |
| 20 to 24 Years | 5 (3.0%) | 0 (0.0%) |
| 25 to 29 Years | 1 (0.6%) | 2 (0.7%) |
| 30 to 34 Years | 4 (2.4%) | 6 (2.1%) |
| 35 to 39 Years | 3 (1.8%) | 9 (3.2%) |
| 40 to 44 Years | 7 (4.2%) | 5 (1.8%) |
| 45 to 49 Years | 21 (12.7%) | 28 (10.0%) |
| 50 to 54 Years | 24 (14.5%) | 21 (7.5%) |
| 55 to 59 Years | 2 (1.2%) | 17 (6.1%) |
| 60 to 64 Years | 13 (7.9%) | 6 (2.1%) |
| 65 to 69 Years | 4 (2.4%) | 13 (4.7%) |
| 70 to 74 Years | 13 (7.9%) | 11 (3.9%) |
| 75 to 79 Years | 21 (12.7%) | 17 (6.1%) |
| 80 to 84 Years | 13 (7.9%) | 4 (1.4%) |
| 85 Years and over | 5 (3.0%) | 41 (14.7%) |
| Total | 165 (100.0%) | 279 (100.0%) |
Families and Households in Barton Hills
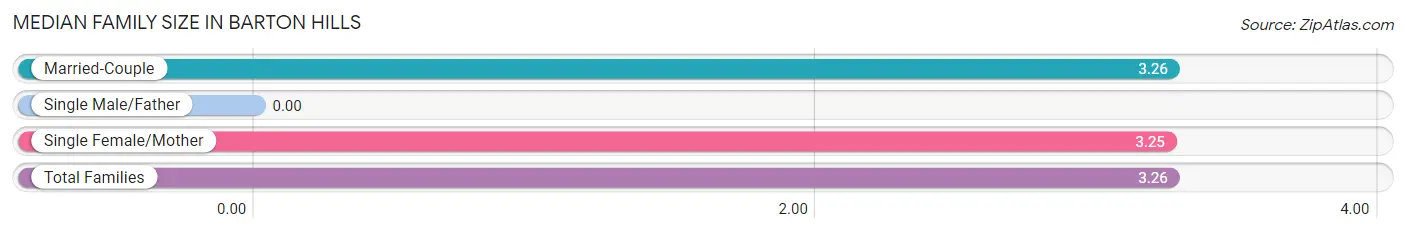
Median Family Size in Barton Hills
| Family Type | # Families | Family Size |
| Married-Couple | 112 (96.6%) | 3.26 |
| Single Male/Father | 0 (0.0%) | - |
| Single Female/Mother | 4 (3.5%) | 3.25 |
| Total Families | 116 (100.0%) | 3.26 |
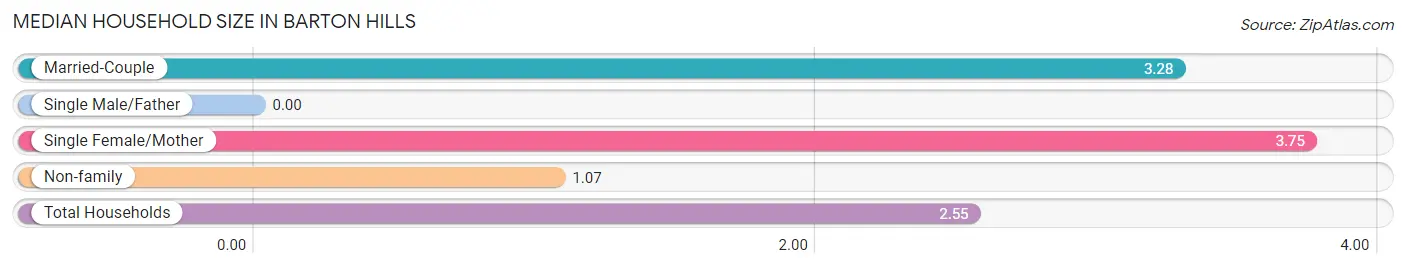
Median Household Size in Barton Hills
| Household Type | # Households | Household Size |
| Married-Couple | 112 (64.4%) | 3.28 |
| Single Male/Father | 0 (0.0%) | - |
| Single Female/Mother | 4 (2.3%) | 3.75 |
| Non-family | 58 (33.3%) | 1.07 |
| Total Households | 174 (100.0%) | 2.55 |
Household Size by Marriage Status in Barton Hills
Out of a total of 174 households in Barton Hills, 116 (66.7%) are family households, while 58 (33.3%) are nonfamily households. The most numerous type of family households are 2-person households, comprising 66, and the most common type of nonfamily households are 1-person households, comprising 55.
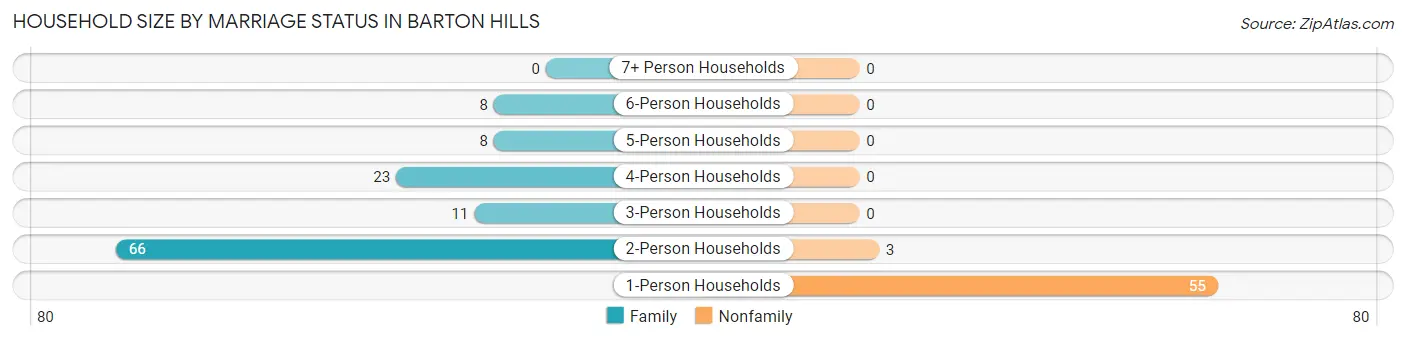
| Household Size | Family Households | Nonfamily Households |
| 1-Person Households | - | 55 (31.6%) |
| 2-Person Households | 66 (37.9%) | 3 (1.7%) |
| 3-Person Households | 11 (6.3%) | 0 (0.0%) |
| 4-Person Households | 23 (13.2%) | 0 (0.0%) |
| 5-Person Households | 8 (4.6%) | 0 (0.0%) |
| 6-Person Households | 8 (4.6%) | 0 (0.0%) |
| 7+ Person Households | 0 (0.0%) | 0 (0.0%) |
| Total | 116 (66.7%) | 58 (33.3%) |
Female Fertility in Barton Hills
Fertility by Age in Barton Hills
Average fertility rate in Barton Hills is 63.0 births per 1,000 women. Women in the age bracket of 20 to 34 years have the highest fertility rate with 125.0 births per 1,000 women. Women in the age bracket of 35 to 50 years acount for 75.0% of all women with births.
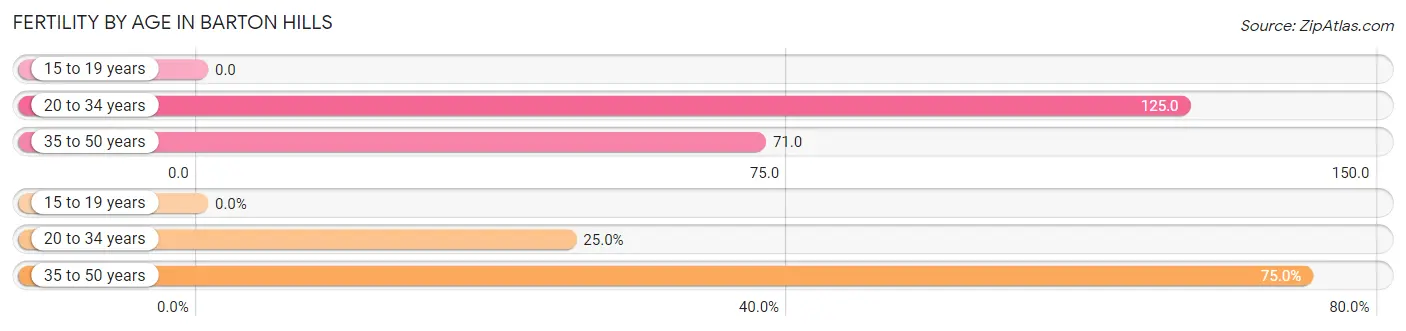
| Age Bracket | Women with Births | Births / 1,000 Women |
| 15 to 19 years | 0 (0.0%) | 0.0 |
| 20 to 34 years | 1 (25.0%) | 125.0 |
| 35 to 50 years | 3 (75.0%) | 71.0 |
| Total | 4 (100.0%) | 63.0 |
Fertility by Age by Marriage Status in Barton Hills
75.0% of women with births (4) in Barton Hills are married. The highest percentage of unmarried women with births falls into 35 to 50 years age bracket with 33.3% of them unmarried at the time of birth, while the lowest percentage of unmarried women with births belong to 20 to 34 years age bracket with 0.0% of them unmarried.
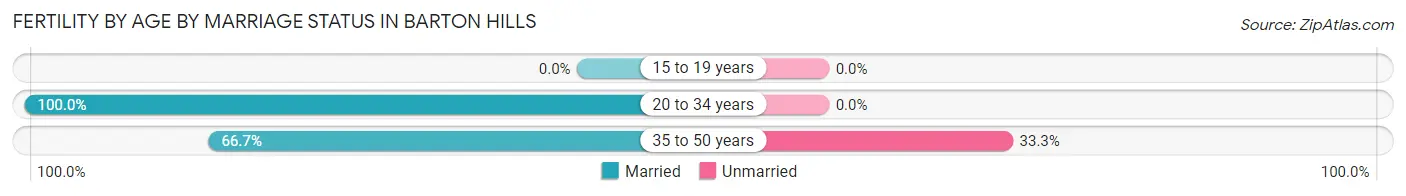
| Age Bracket | Married | Unmarried |
| 15 to 19 years | 0 (0.0%) | 0 (0.0%) |
| 20 to 34 years | 1 (100.0%) | 0 (0.0%) |
| 35 to 50 years | 2 (66.7%) | 1 (33.3%) |
| Total | 3 (75.0%) | 1 (25.0%) |
Fertility by Education in Barton Hills
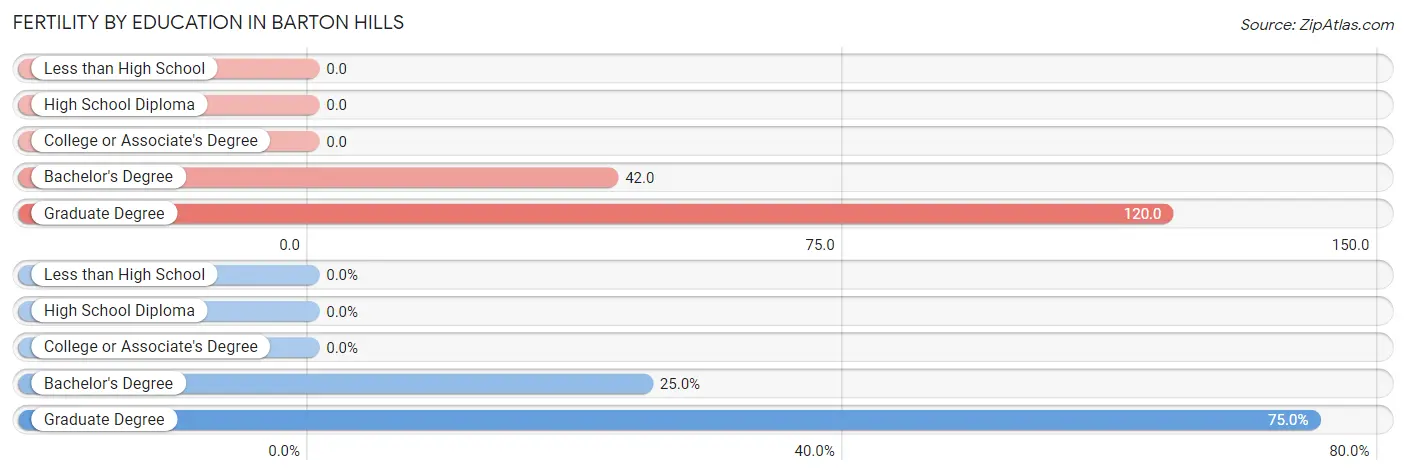
| Educational Attainment | Women with Births | Births / 1,000 Women |
| Less than High School | 0 (0.0%) | 0.0 |
| High School Diploma | 0 (0.0%) | 0.0 |
| College or Associate's Degree | 0 (0.0%) | 0.0 |
| Bachelor's Degree | 1 (25.0%) | 42.0 |
| Graduate Degree | 3 (75.0%) | 120.0 |
| Total | 4 (100.0%) | 63.0 |
Fertility by Education by Marriage Status in Barton Hills
25.0% of women with births in Barton Hills are unmarried. Women with the educational attainment of bachelor's degree are most likely to be married with 100.0% of them married at childbirth, while women with the educational attainment of graduate degree are least likely to be married with 33.3% of them unmarried at childbirth.
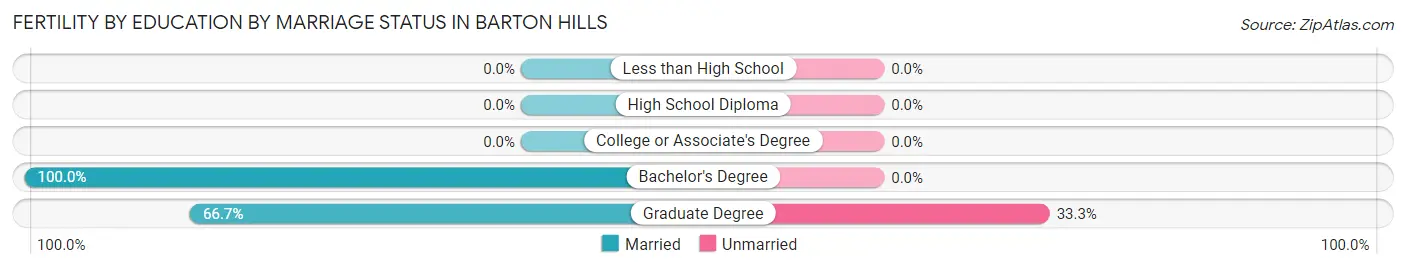
| Educational Attainment | Married | Unmarried |
| Less than High School | 0 (0.0%) | 0 (0.0%) |
| High School Diploma | 0 (0.0%) | 0 (0.0%) |
| College or Associate's Degree | 0 (0.0%) | 0 (0.0%) |
| Bachelor's Degree | 1 (100.0%) | 0 (0.0%) |
| Graduate Degree | 2 (66.7%) | 1 (33.3%) |
| Total | 3 (75.0%) | 1 (25.0%) |
Employment Characteristics in Barton Hills
Employment by Class of Employer in Barton Hills
Among the 166 employed individuals in Barton Hills, private company employees (69 | 41.6%), not-for-profit organizations (27 | 16.3%), and self-employed (incorporated) (23 | 13.9%) make up the most common classes of employment.
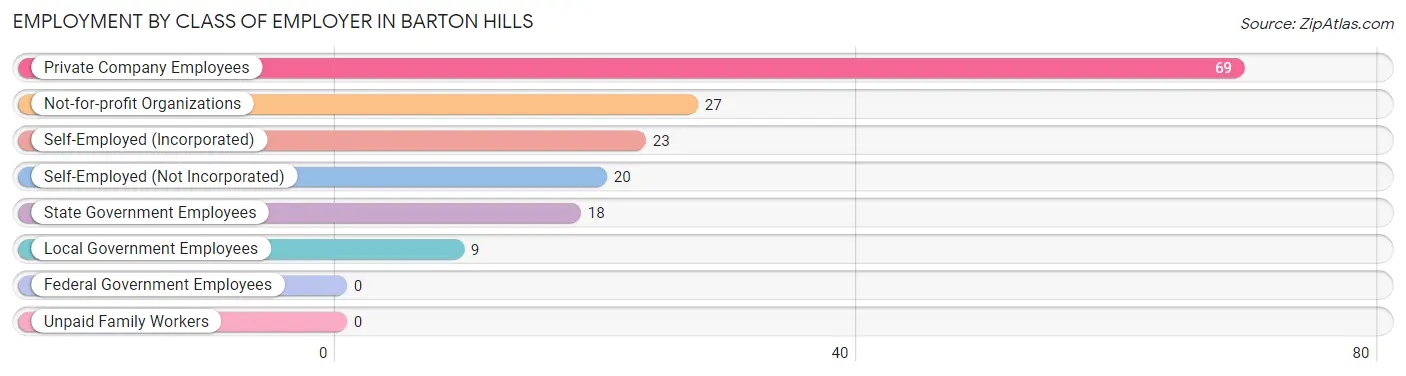
| Employer Class | # Employees | % Employees |
| Private Company Employees | 69 | 41.6% |
| Self-Employed (Incorporated) | 23 | 13.9% |
| Self-Employed (Not Incorporated) | 20 | 12.0% |
| Not-for-profit Organizations | 27 | 16.3% |
| Local Government Employees | 9 | 5.4% |
| State Government Employees | 18 | 10.8% |
| Federal Government Employees | 0 | 0.0% |
| Unpaid Family Workers | 0 | 0.0% |
| Total | 166 | 100.0% |
Employment Status by Age in Barton Hills
According to the labor force statistics for Barton Hills, out of the total population over 16 years of age (333), 50.8% or 169 individuals are in the labor force, with 1.8% or 3 of them unemployed. The age group with the highest labor force participation rate is 35 to 44 years, with 100.0% or 24 individuals in the labor force. Within the labor force, the 60 to 64 years age range has the highest percentage of unemployed individuals, with 5.9% or 1 of them being unemployed.
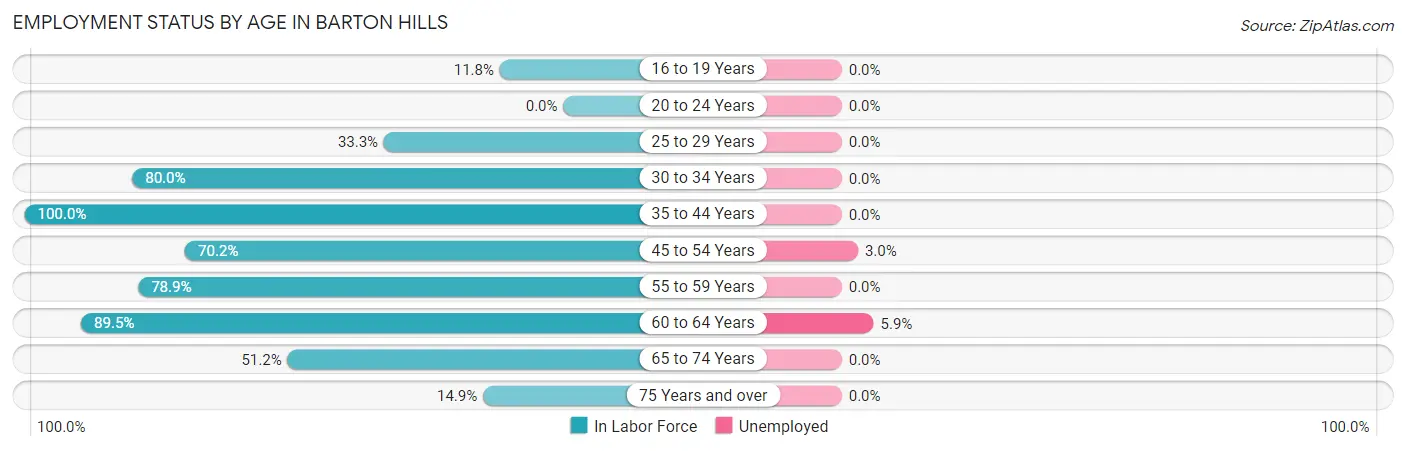
| Age Bracket | In Labor Force | Unemployed |
| 16 to 19 Years | 2 (11.8%) | 0 (0.0%) |
| 20 to 24 Years | 0 (0.0%) | 0 (0.0%) |
| 25 to 29 Years | 1 (33.3%) | 0 (0.0%) |
| 30 to 34 Years | 8 (80.0%) | 0 (0.0%) |
| 35 to 44 Years | 24 (100.0%) | 0 (0.0%) |
| 45 to 54 Years | 66 (70.2%) | 2 (3.0%) |
| 55 to 59 Years | 15 (78.9%) | 0 (0.0%) |
| 60 to 64 Years | 17 (89.5%) | 1 (5.9%) |
| 65 to 74 Years | 21 (51.2%) | 0 (0.0%) |
| 75 Years and over | 15 (14.9%) | 0 (0.0%) |
| Total | 169 (50.8%) | 3 (1.8%) |
Employment Status by Educational Attainment in Barton Hills
According to labor force statistics for Barton Hills, 77.5% of individuals (131) out of the total population between 25 and 64 years of age (169) are in the labor force, with 2.3% or 3 of them being unemployed. The group with the highest labor force participation rate are those with the educational attainment of bachelor's degree or higher, with 78.7% or 129 individuals in the labor force. Within the labor force, individuals with bachelor's degree or higher education have the highest percentage of unemployment, with 2.3% or 3 of them being unemployed.
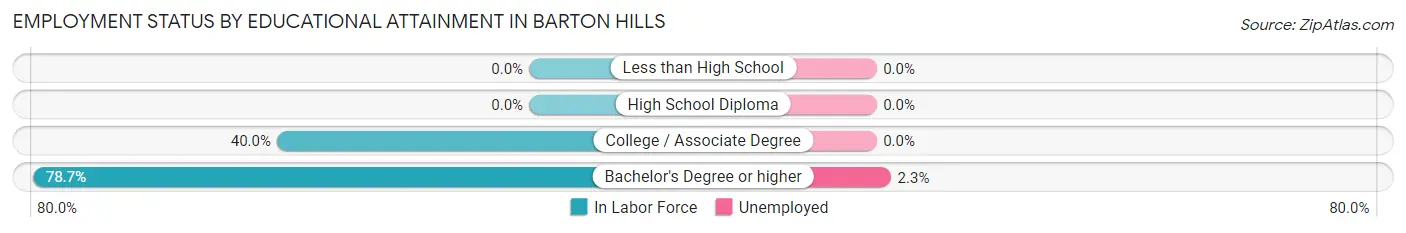
| Educational Attainment | In Labor Force | Unemployed |
| Less than High School | 0 (0.0%) | 0 (0.0%) |
| High School Diploma | 0 (0.0%) | 0 (0.0%) |
| College / Associate Degree | 2 (40.0%) | 0 (0.0%) |
| Bachelor's Degree or higher | 129 (78.7%) | 4 (2.3%) |
| Total | 131 (77.5%) | 4 (2.3%) |
Employment Occupations by Sex in Barton Hills
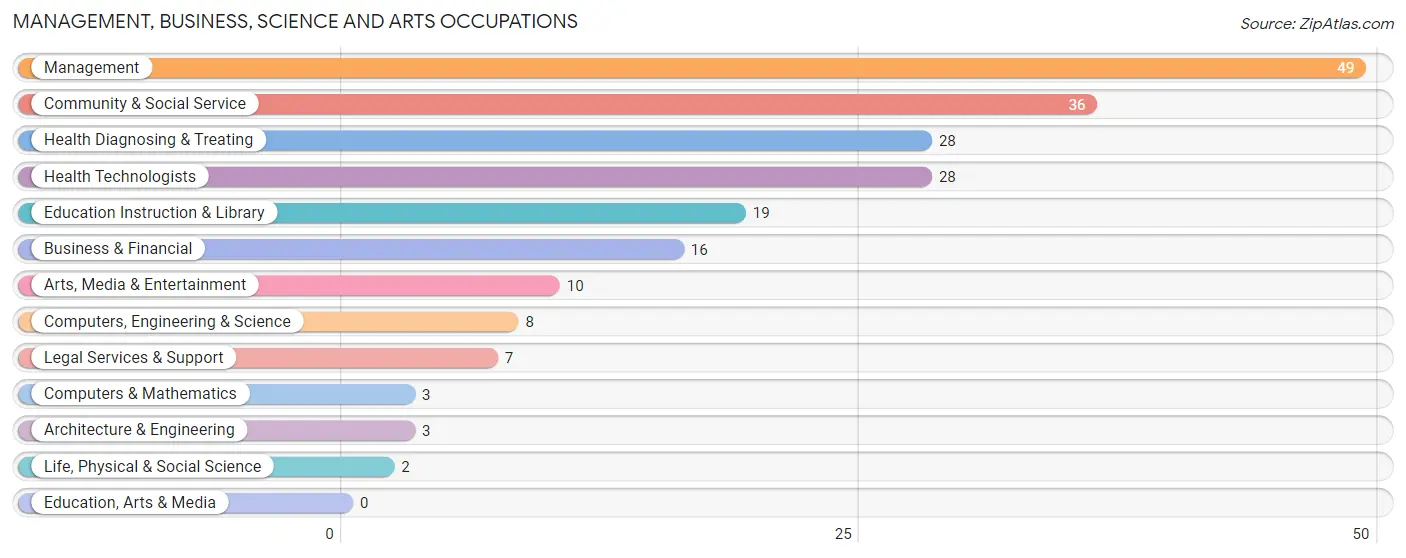
Management, Business, Science and Arts Occupations
The most common Management, Business, Science and Arts occupations in Barton Hills are Management (49 | 29.5%), Community & Social Service (36 | 21.7%), Health Diagnosing & Treating (28 | 16.9%), Health Technologists (28 | 16.9%), and Education Instruction & Library (19 | 11.5%).
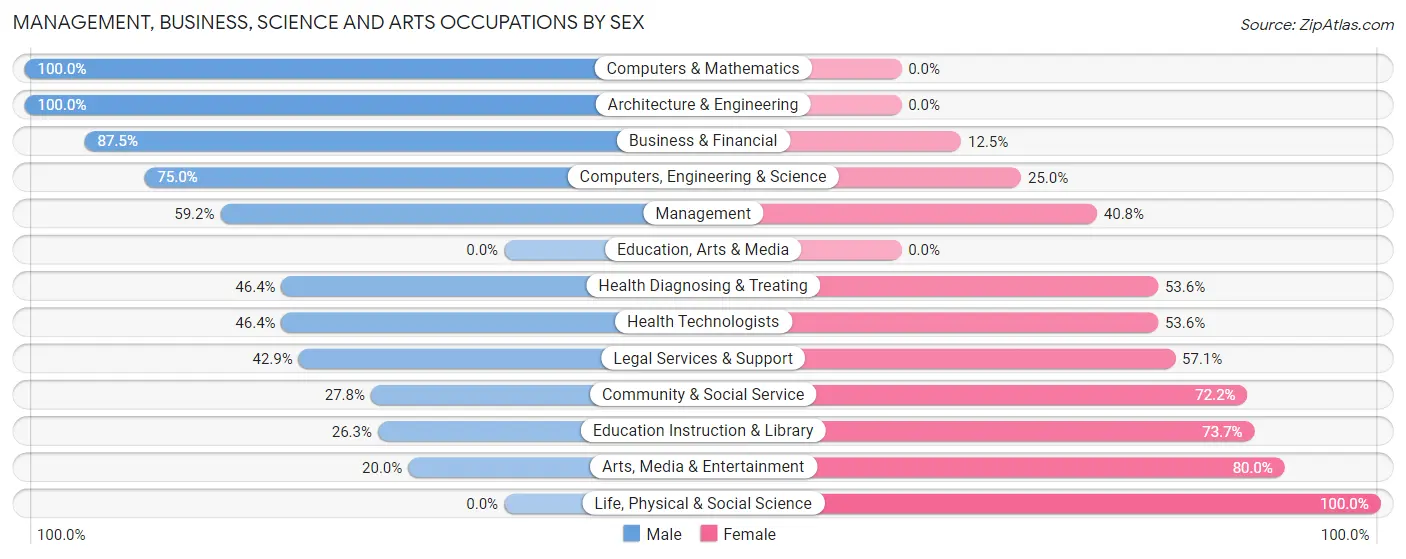
Management, Business, Science and Arts Occupations by Sex
Within the Management, Business, Science and Arts occupations in Barton Hills, the most male-oriented occupations are Computers & Mathematics (100.0%), Architecture & Engineering (100.0%), and Business & Financial (87.5%), while the most female-oriented occupations are Life, Physical & Social Science (100.0%), Arts, Media & Entertainment (80.0%), and Education Instruction & Library (73.7%).
| Occupation | Male | Female |
| Management | 29 (59.2%) | 20 (40.8%) |
| Business & Financial | 14 (87.5%) | 2 (12.5%) |
| Computers, Engineering & Science | 6 (75.0%) | 2 (25.0%) |
| Computers & Mathematics | 3 (100.0%) | 0 (0.0%) |
| Architecture & Engineering | 3 (100.0%) | 0 (0.0%) |
| Life, Physical & Social Science | 0 (0.0%) | 2 (100.0%) |
| Community & Social Service | 10 (27.8%) | 26 (72.2%) |
| Education, Arts & Media | 0 (0.0%) | 0 (0.0%) |
| Legal Services & Support | 3 (42.9%) | 4 (57.1%) |
| Education Instruction & Library | 5 (26.3%) | 14 (73.7%) |
| Arts, Media & Entertainment | 2 (20.0%) | 8 (80.0%) |
| Health Diagnosing & Treating | 13 (46.4%) | 15 (53.6%) |
| Health Technologists | 13 (46.4%) | 15 (53.6%) |
| Total (Category) | 72 (52.5%) | 65 (47.4%) |
| Total (Overall) | 85 (51.2%) | 81 (48.8%) |
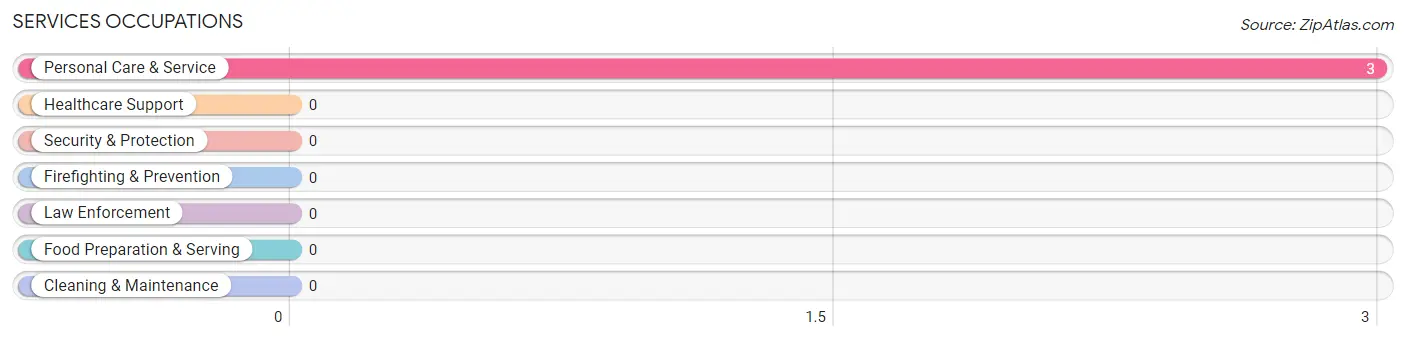
Services Occupations
The most common Services occupations in Barton Hills are , and Personal Care & Service (3 | 1.8%).
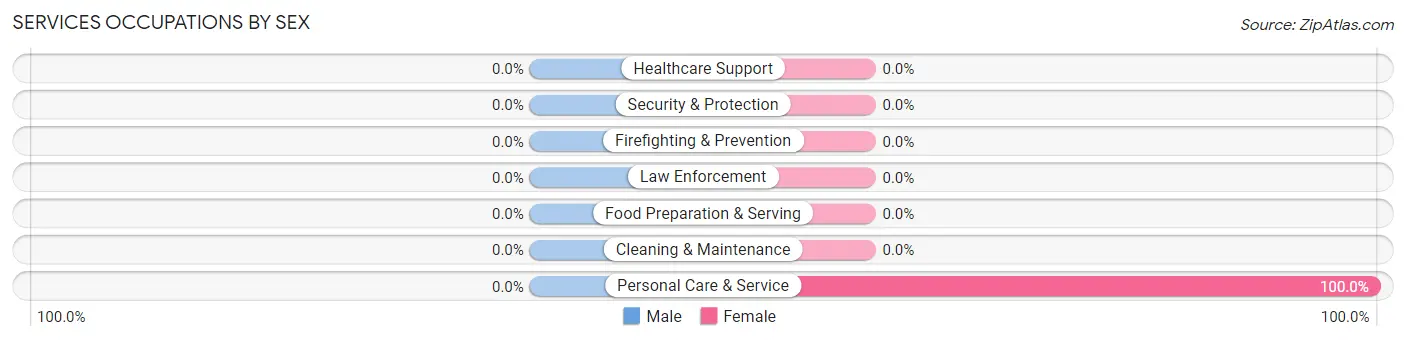
Services Occupations by Sex
| Occupation | Male | Female |
| Healthcare Support | 0 (0.0%) | 0 (0.0%) |
| Security & Protection | 0 (0.0%) | 0 (0.0%) |
| Firefighting & Prevention | 0 (0.0%) | 0 (0.0%) |
| Law Enforcement | 0 (0.0%) | 0 (0.0%) |
| Food Preparation & Serving | 0 (0.0%) | 0 (0.0%) |
| Cleaning & Maintenance | 0 (0.0%) | 0 (0.0%) |
| Personal Care & Service | 0 (0.0%) | 3 (100.0%) |
| Total (Category) | 0 (0.0%) | 3 (100.0%) |
| Total (Overall) | 85 (51.2%) | 81 (48.8%) |
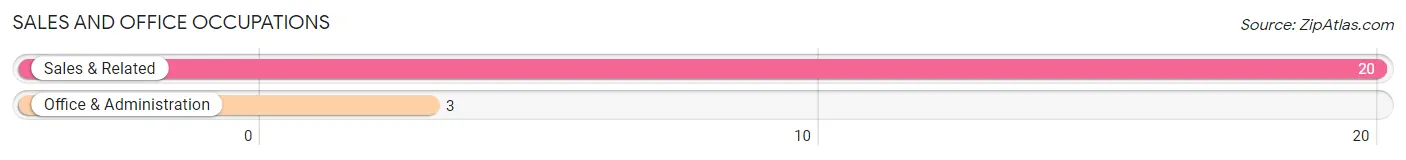
Sales and Office Occupations
The most common Sales and Office occupations in Barton Hills are Sales & Related (20 | 12.0%), and Office & Administration (3 | 1.8%).
Sales and Office Occupations by Sex
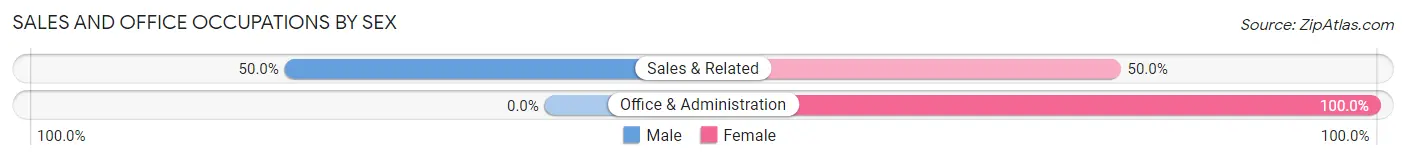
| Occupation | Male | Female |
| Sales & Related | 10 (50.0%) | 10 (50.0%) |
| Office & Administration | 0 (0.0%) | 3 (100.0%) |
| Total (Category) | 10 (43.5%) | 13 (56.5%) |
| Total (Overall) | 85 (51.2%) | 81 (48.8%) |
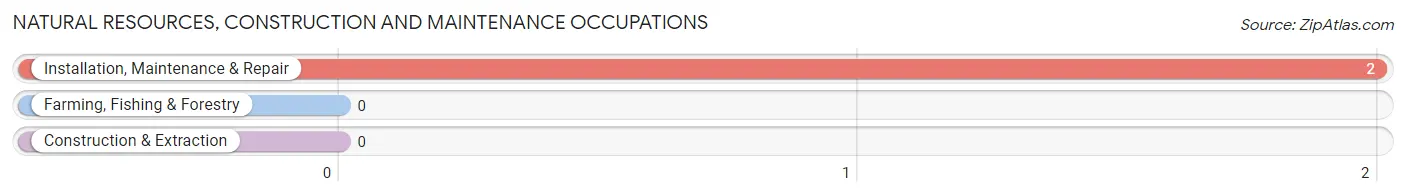
Natural Resources, Construction and Maintenance Occupations
The most common Natural Resources, Construction and Maintenance occupations in Barton Hills are , and Installation, Maintenance & Repair (2 | 1.2%).
Natural Resources, Construction and Maintenance Occupations by Sex
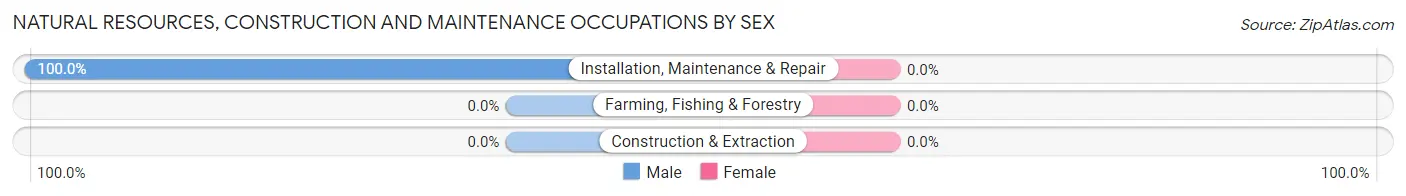
| Occupation | Male | Female |
| Farming, Fishing & Forestry | 0 (0.0%) | 0 (0.0%) |
| Construction & Extraction | 0 (0.0%) | 0 (0.0%) |
| Installation, Maintenance & Repair | 2 (100.0%) | 0 (0.0%) |
| Total (Category) | 2 (100.0%) | 0 (0.0%) |
| Total (Overall) | 85 (51.2%) | 81 (48.8%) |
Production, Transportation and Moving Occupations
The most common Production, Transportation and Moving occupations in Barton Hills are , and Production (1 | 0.6%).
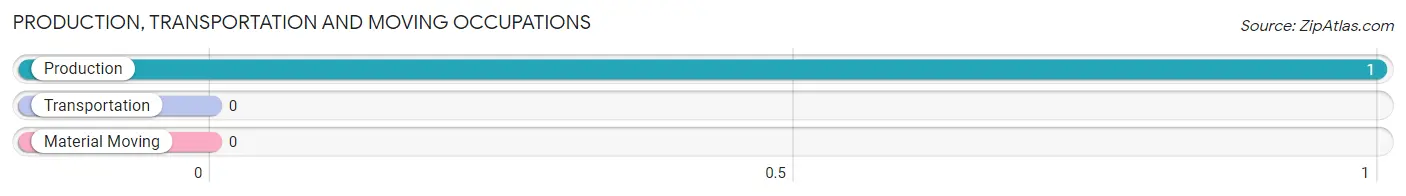
Production, Transportation and Moving Occupations by Sex
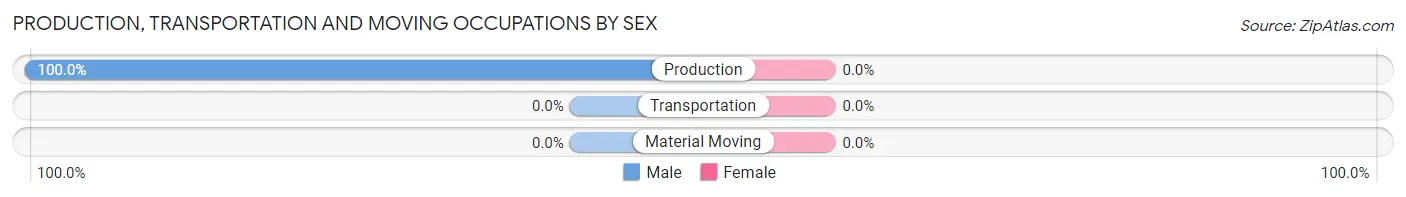
| Occupation | Male | Female |
| Production | 1 (100.0%) | 0 (0.0%) |
| Transportation | 0 (0.0%) | 0 (0.0%) |
| Material Moving | 0 (0.0%) | 0 (0.0%) |
| Total (Category) | 1 (100.0%) | 0 (0.0%) |
| Total (Overall) | 85 (51.2%) | 81 (48.8%) |
Employment Industries by Sex in Barton Hills
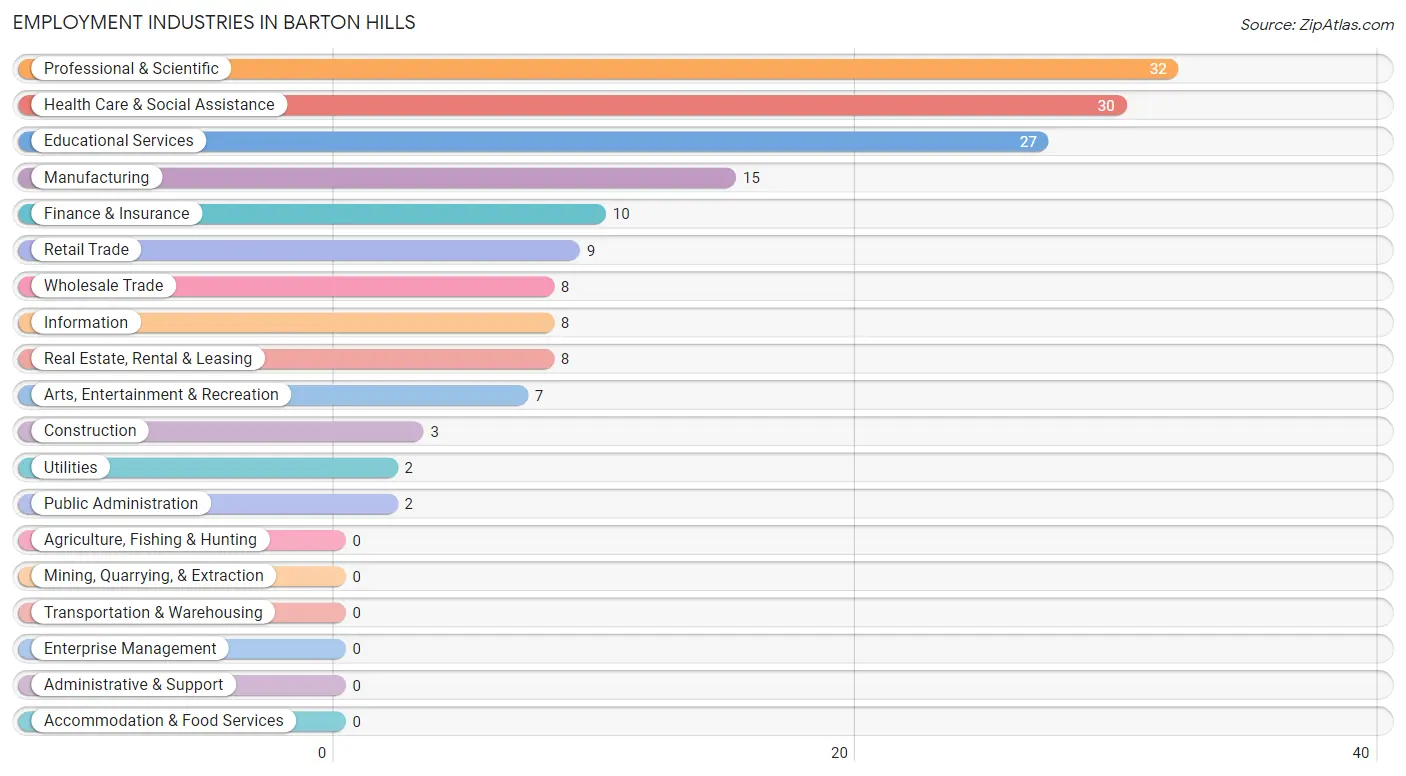
Employment Industries in Barton Hills
The major employment industries in Barton Hills include Professional & Scientific (32 | 19.3%), Health Care & Social Assistance (30 | 18.1%), Educational Services (27 | 16.3%), Manufacturing (15 | 9.0%), and Finance & Insurance (10 | 6.0%).
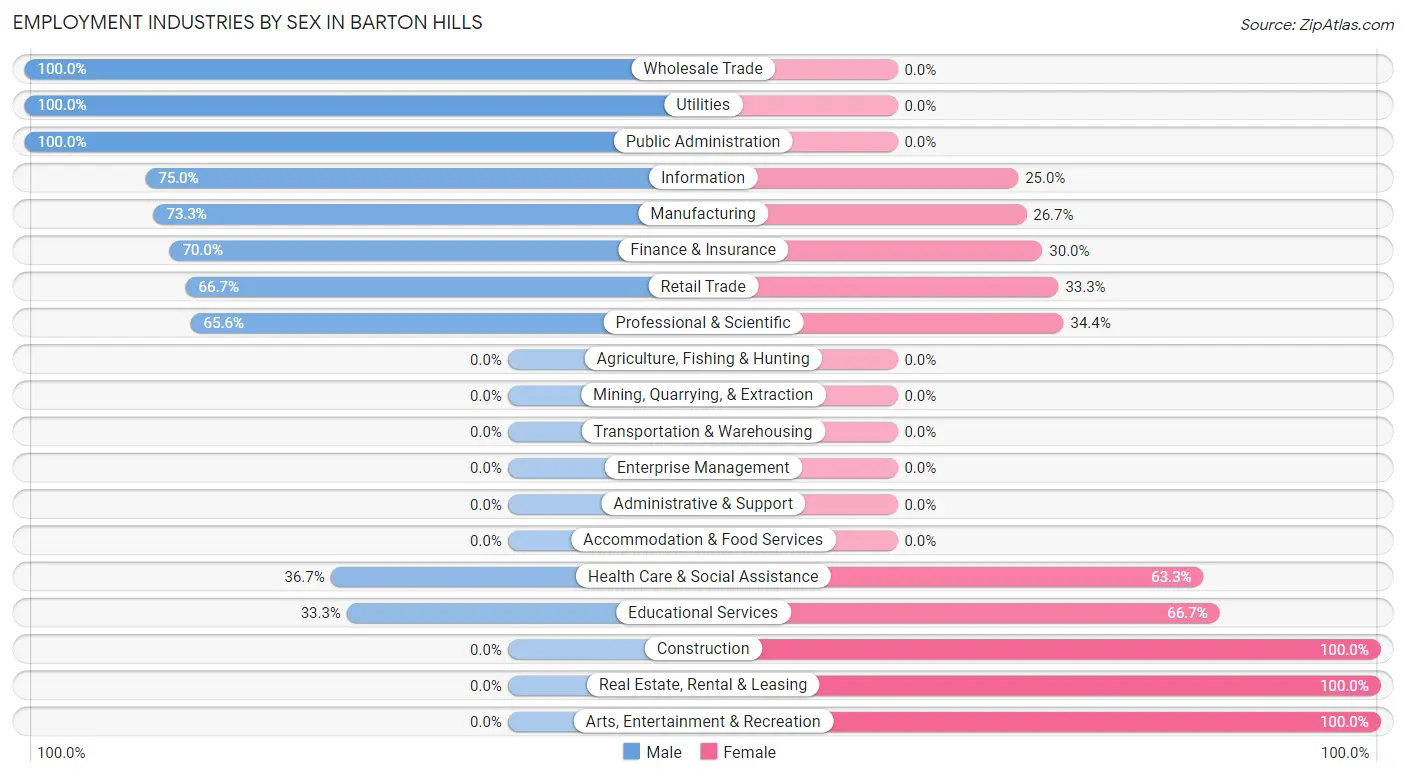
Employment Industries by Sex in Barton Hills
The Barton Hills industries that see more men than women are Wholesale Trade (100.0%), Utilities (100.0%), and Public Administration (100.0%), whereas the industries that tend to have a higher number of women are Construction (100.0%), Real Estate, Rental & Leasing (100.0%), and Arts, Entertainment & Recreation (100.0%).
| Industry | Male | Female |
| Agriculture, Fishing & Hunting | 0 (0.0%) | 0 (0.0%) |
| Mining, Quarrying, & Extraction | 0 (0.0%) | 0 (0.0%) |
| Construction | 0 (0.0%) | 3 (100.0%) |
| Manufacturing | 11 (73.3%) | 4 (26.7%) |
| Wholesale Trade | 8 (100.0%) | 0 (0.0%) |
| Retail Trade | 6 (66.7%) | 3 (33.3%) |
| Transportation & Warehousing | 0 (0.0%) | 0 (0.0%) |
| Utilities | 2 (100.0%) | 0 (0.0%) |
| Information | 6 (75.0%) | 2 (25.0%) |
| Finance & Insurance | 7 (70.0%) | 3 (30.0%) |
| Real Estate, Rental & Leasing | 0 (0.0%) | 8 (100.0%) |
| Professional & Scientific | 21 (65.6%) | 11 (34.4%) |
| Enterprise Management | 0 (0.0%) | 0 (0.0%) |
| Administrative & Support | 0 (0.0%) | 0 (0.0%) |
| Educational Services | 9 (33.3%) | 18 (66.7%) |
| Health Care & Social Assistance | 11 (36.7%) | 19 (63.3%) |
| Arts, Entertainment & Recreation | 0 (0.0%) | 7 (100.0%) |
| Accommodation & Food Services | 0 (0.0%) | 0 (0.0%) |
| Public Administration | 2 (100.0%) | 0 (0.0%) |
| Total | 85 (51.2%) | 81 (48.8%) |
Education in Barton Hills
School Enrollment in Barton Hills
The most common levels of schooling among the 133 students in Barton Hills are elementary school (71 | 53.4%), high school (17 | 12.8%), and middle school (13 | 9.8%).
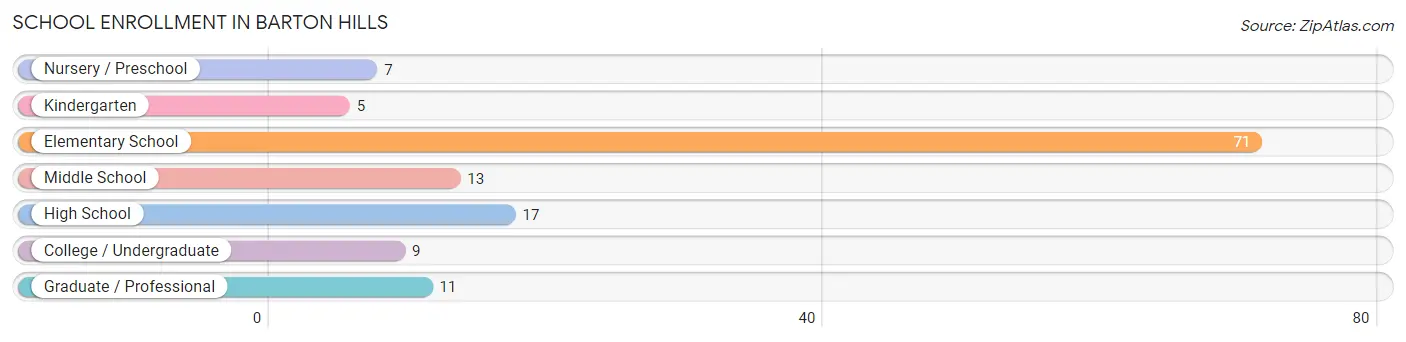
| School Level | # Students | % Students |
| Nursery / Preschool | 7 | 5.3% |
| Kindergarten | 5 | 3.8% |
| Elementary School | 71 | 53.4% |
| Middle School | 13 | 9.8% |
| High School | 17 | 12.8% |
| College / Undergraduate | 9 | 6.8% |
| Graduate / Professional | 11 | 8.3% |
| Total | 133 | 100.0% |
School Enrollment by Age by Funding Source in Barton Hills
Out of a total of 133 students who are enrolled in schools in Barton Hills, 21 (15.8%) attend a private institution, while the remaining 112 (84.2%) are enrolled in public schools. The age group of 3 to 4 year olds has the highest likelihood of being enrolled in private schools, with 7 (100.0% in the age bracket) enrolled. Conversely, the age group of 18 to 19 year olds has the lowest likelihood of being enrolled in a private school, with 7 (100.0% in the age bracket) attending a public institution.
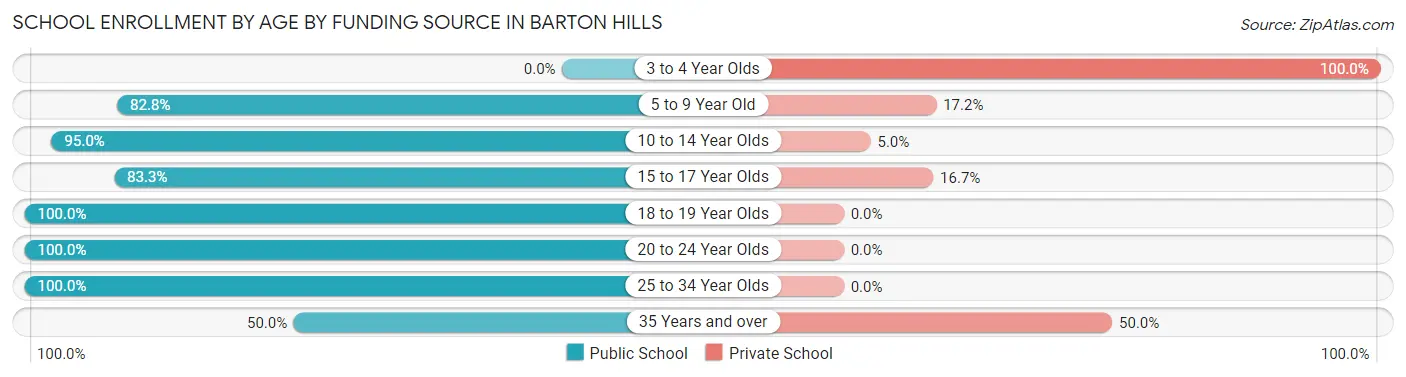
| Age Bracket | Public School | Private School |
| 3 to 4 Year Olds | 0 (0.0%) | 7 (100.0%) |
| 5 to 9 Year Old | 24 (82.8%) | 5 (17.2%) |
| 10 to 14 Year Olds | 57 (95.0%) | 3 (5.0%) |
| 15 to 17 Year Olds | 10 (83.3%) | 2 (16.7%) |
| 18 to 19 Year Olds | 7 (100.0%) | 0 (0.0%) |
| 20 to 24 Year Olds | 5 (100.0%) | 0 (0.0%) |
| 25 to 34 Year Olds | 5 (100.0%) | 0 (0.0%) |
| 35 Years and over | 4 (50.0%) | 4 (50.0%) |
| Total | 112 (84.2%) | 21 (15.8%) |
Educational Attainment by Field of Study in Barton Hills
Social sciences (60 | 18.2%), literature & languages (56 | 17.0%), science & technology (34 | 10.3%), engineering (28 | 8.5%), and education (26 | 7.9%) are the most common fields of study among 329 individuals in Barton Hills who have obtained a bachelor's degree or higher.
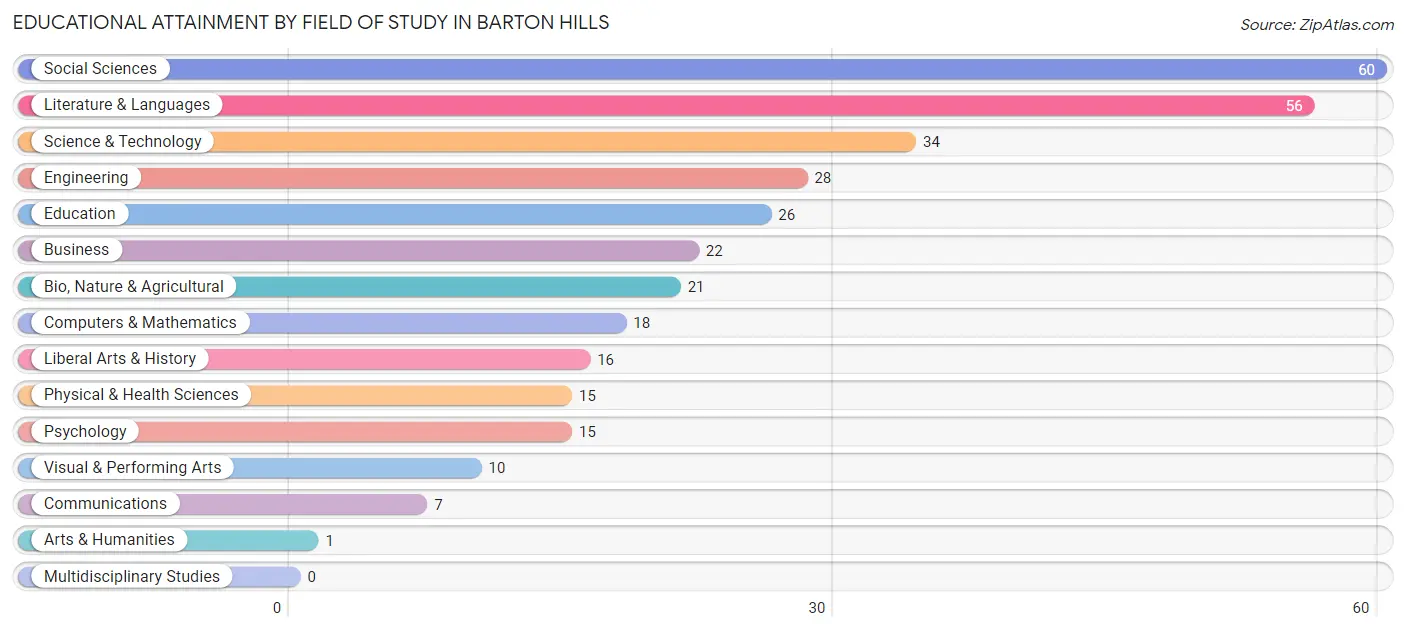
| Field of Study | # Graduates | % Graduates |
| Computers & Mathematics | 18 | 5.5% |
| Bio, Nature & Agricultural | 21 | 6.4% |
| Physical & Health Sciences | 15 | 4.6% |
| Psychology | 15 | 4.6% |
| Social Sciences | 60 | 18.2% |
| Engineering | 28 | 8.5% |
| Multidisciplinary Studies | 0 | 0.0% |
| Science & Technology | 34 | 10.3% |
| Business | 22 | 6.7% |
| Education | 26 | 7.9% |
| Literature & Languages | 56 | 17.0% |
| Liberal Arts & History | 16 | 4.9% |
| Visual & Performing Arts | 10 | 3.0% |
| Communications | 7 | 2.1% |
| Arts & Humanities | 1 | 0.3% |
| Total | 329 | 100.0% |
Transportation & Commute in Barton Hills
Vehicle Availability by Sex in Barton Hills
The most prevalent vehicle ownership categories in Barton Hills are males with 2 vehicles (37, accounting for 43.5%) and females with 2 vehicles (41, making up 45.7%).
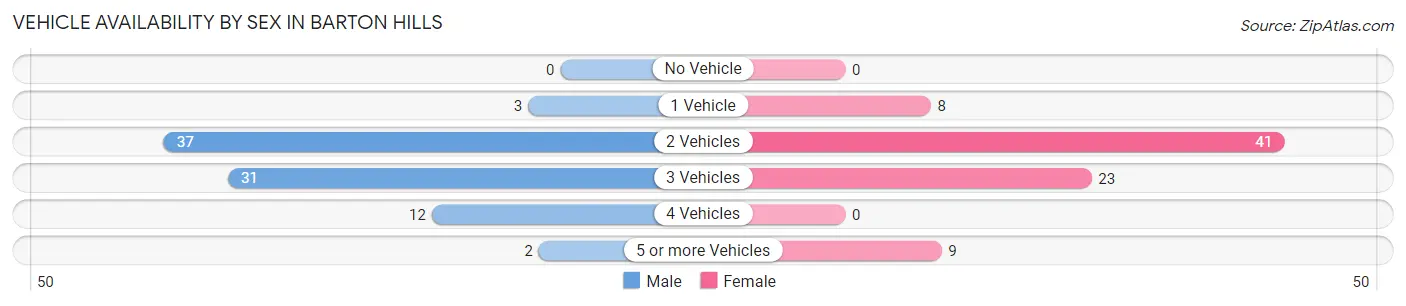
| Vehicles Available | Male | Female |
| No Vehicle | 0 (0.0%) | 0 (0.0%) |
| 1 Vehicle | 3 (3.5%) | 8 (9.9%) |
| 2 Vehicles | 37 (43.5%) | 41 (50.6%) |
| 3 Vehicles | 31 (36.5%) | 23 (28.4%) |
| 4 Vehicles | 12 (14.1%) | 0 (0.0%) |
| 5 or more Vehicles | 2 (2.4%) | 9 (11.1%) |
| Total | 85 (100.0%) | 81 (100.0%) |
Commute Time in Barton Hills
The most frequently occuring commute durations in Barton Hills are 10 to 14 minutes (32 commuters, 25.6%), 15 to 19 minutes (24 commuters, 19.2%), and 20 to 24 minutes (22 commuters, 17.6%).
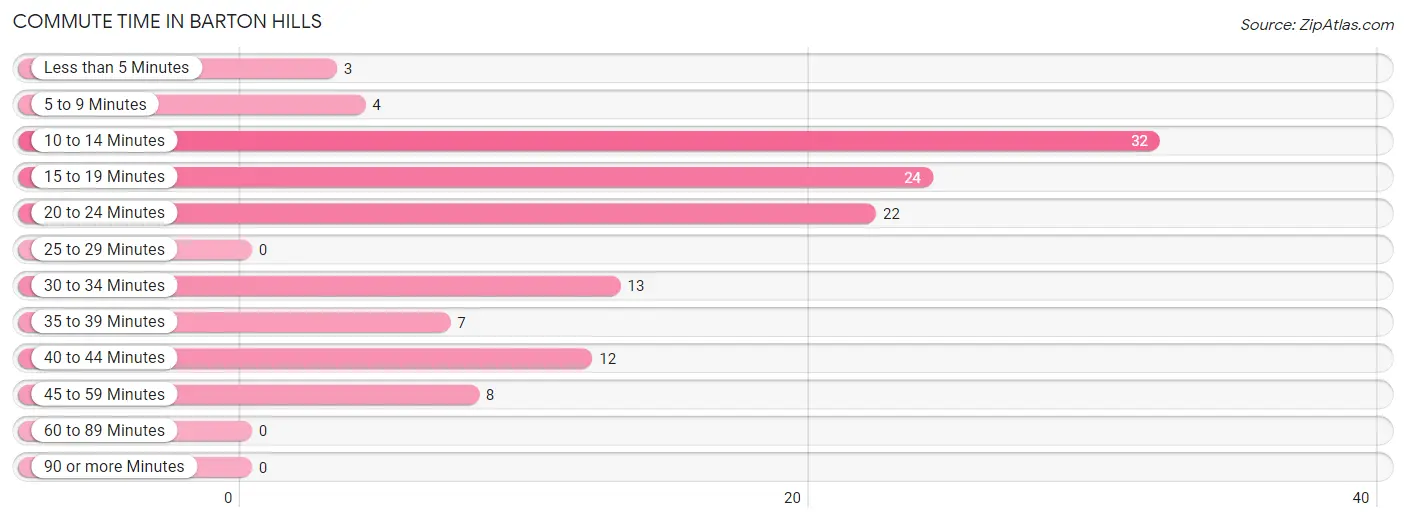
| Commute Time | # Commuters | % Commuters |
| Less than 5 Minutes | 3 | 2.4% |
| 5 to 9 Minutes | 4 | 3.2% |
| 10 to 14 Minutes | 32 | 25.6% |
| 15 to 19 Minutes | 24 | 19.2% |
| 20 to 24 Minutes | 22 | 17.6% |
| 25 to 29 Minutes | 0 | 0.0% |
| 30 to 34 Minutes | 13 | 10.4% |
| 35 to 39 Minutes | 7 | 5.6% |
| 40 to 44 Minutes | 12 | 9.6% |
| 45 to 59 Minutes | 8 | 6.4% |
| 60 to 89 Minutes | 0 | 0.0% |
| 90 or more Minutes | 0 | 0.0% |
Commute Time by Sex in Barton Hills
The most common commute times in Barton Hills are 10 to 14 minutes (22 commuters, 34.9%) for males and 20 to 24 minutes (15 commuters, 24.2%) for females.
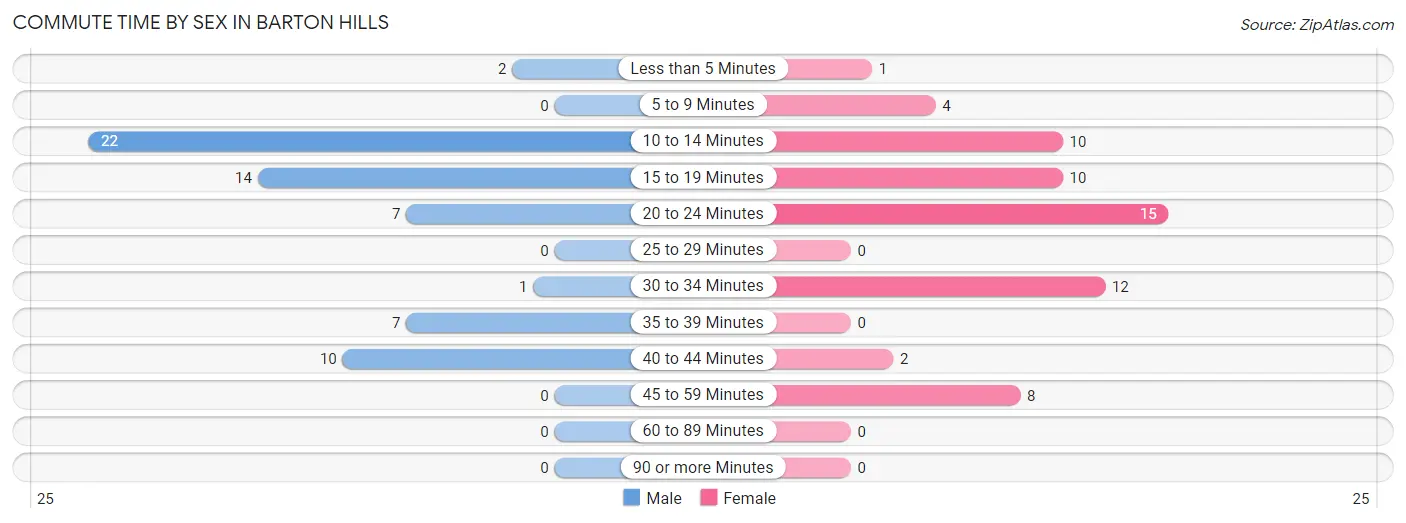
| Commute Time | Male | Female |
| Less than 5 Minutes | 2 (3.2%) | 1 (1.6%) |
| 5 to 9 Minutes | 0 (0.0%) | 4 (6.5%) |
| 10 to 14 Minutes | 22 (34.9%) | 10 (16.1%) |
| 15 to 19 Minutes | 14 (22.2%) | 10 (16.1%) |
| 20 to 24 Minutes | 7 (11.1%) | 15 (24.2%) |
| 25 to 29 Minutes | 0 (0.0%) | 0 (0.0%) |
| 30 to 34 Minutes | 1 (1.6%) | 12 (19.4%) |
| 35 to 39 Minutes | 7 (11.1%) | 0 (0.0%) |
| 40 to 44 Minutes | 10 (15.9%) | 2 (3.2%) |
| 45 to 59 Minutes | 0 (0.0%) | 8 (12.9%) |
| 60 to 89 Minutes | 0 (0.0%) | 0 (0.0%) |
| 90 or more Minutes | 0 (0.0%) | 0 (0.0%) |
Time of Departure to Work by Sex in Barton Hills
The most frequent times of departure to work in Barton Hills are 8:30 AM to 8:59 AM (20, 31.8%) for males and 8:00 AM to 8:29 AM (15, 24.2%) for females.
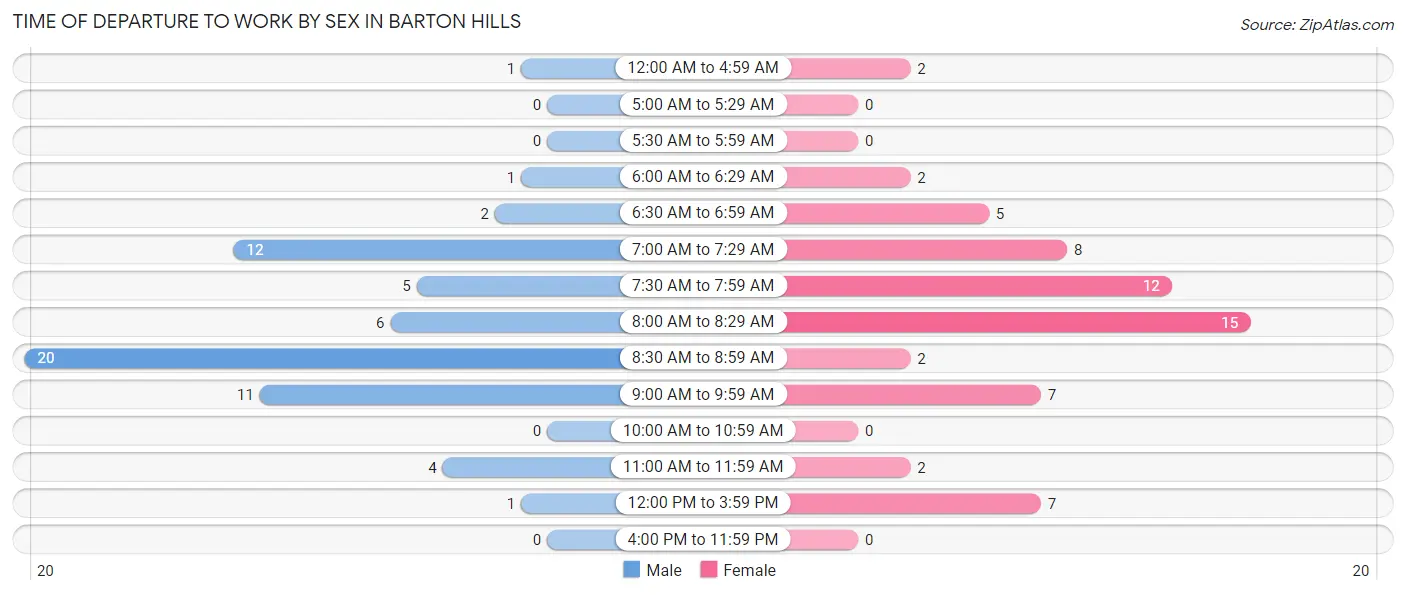
| Time of Departure | Male | Female |
| 12:00 AM to 4:59 AM | 1 (1.6%) | 2 (3.2%) |
| 5:00 AM to 5:29 AM | 0 (0.0%) | 0 (0.0%) |
| 5:30 AM to 5:59 AM | 0 (0.0%) | 0 (0.0%) |
| 6:00 AM to 6:29 AM | 1 (1.6%) | 2 (3.2%) |
| 6:30 AM to 6:59 AM | 2 (3.2%) | 5 (8.1%) |
| 7:00 AM to 7:29 AM | 12 (19.1%) | 8 (12.9%) |
| 7:30 AM to 7:59 AM | 5 (7.9%) | 12 (19.4%) |
| 8:00 AM to 8:29 AM | 6 (9.5%) | 15 (24.2%) |
| 8:30 AM to 8:59 AM | 20 (31.8%) | 2 (3.2%) |
| 9:00 AM to 9:59 AM | 11 (17.5%) | 7 (11.3%) |
| 10:00 AM to 10:59 AM | 0 (0.0%) | 0 (0.0%) |
| 11:00 AM to 11:59 AM | 4 (6.4%) | 2 (3.2%) |
| 12:00 PM to 3:59 PM | 1 (1.6%) | 7 (11.3%) |
| 4:00 PM to 11:59 PM | 0 (0.0%) | 0 (0.0%) |
| Total | 63 (100.0%) | 62 (100.0%) |
Housing Occupancy in Barton Hills
Occupancy by Ownership in Barton Hills
Of the total 174 dwellings in Barton Hills, owner-occupied units account for 171 (98.3%), while renter-occupied units make up 3 (1.7%).
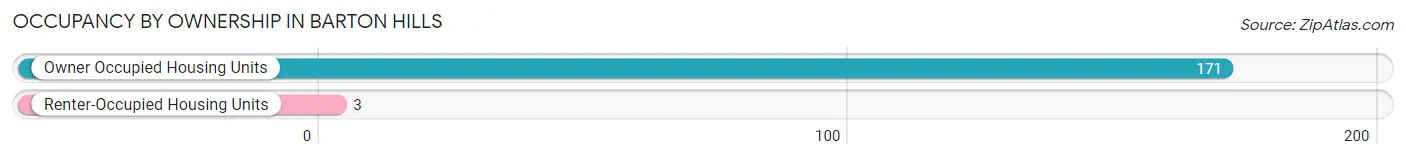
| Occupancy | # Housing Units | % Housing Units |
| Owner Occupied Housing Units | 171 | 98.3% |
| Renter-Occupied Housing Units | 3 | 1.7% |
| Total Occupied Housing Units | 174 | 100.0% |
Occupancy by Household Size in Barton Hills
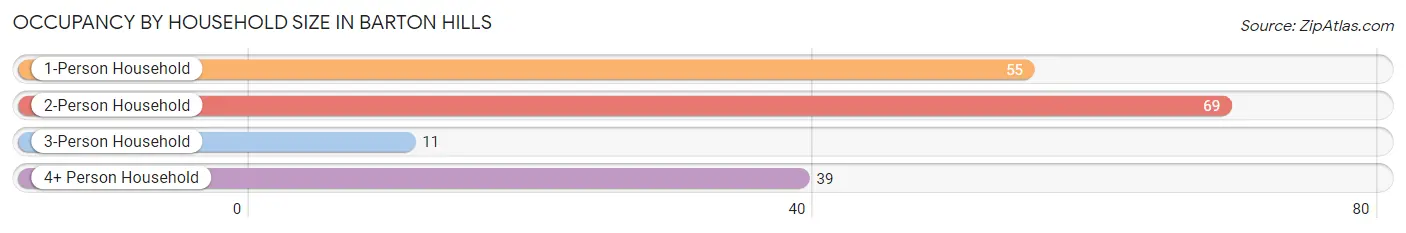
| Household Size | # Housing Units | % Housing Units |
| 1-Person Household | 55 | 31.6% |
| 2-Person Household | 69 | 39.7% |
| 3-Person Household | 11 | 6.3% |
| 4+ Person Household | 39 | 22.4% |
| Total Housing Units | 174 | 100.0% |
Occupancy by Ownership by Household Size in Barton Hills
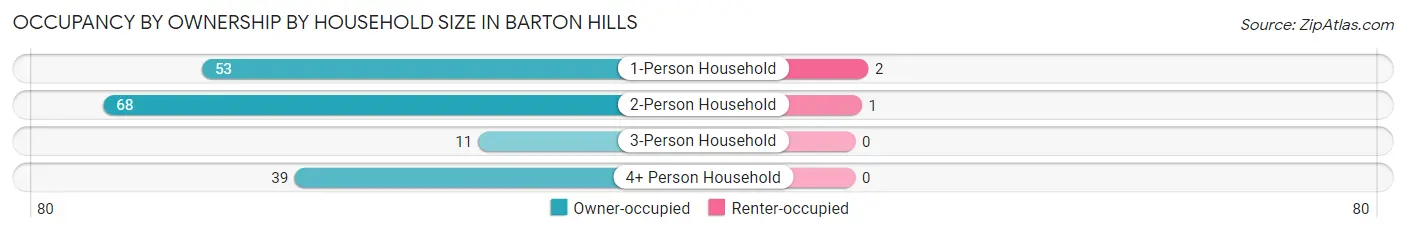
| Household Size | Owner-occupied | Renter-occupied |
| 1-Person Household | 53 (96.4%) | 2 (3.6%) |
| 2-Person Household | 68 (98.6%) | 1 (1.5%) |
| 3-Person Household | 11 (100.0%) | 0 (0.0%) |
| 4+ Person Household | 39 (100.0%) | 0 (0.0%) |
| Total Housing Units | 171 (98.3%) | 3 (1.7%) |
Occupancy by Educational Attainment in Barton Hills
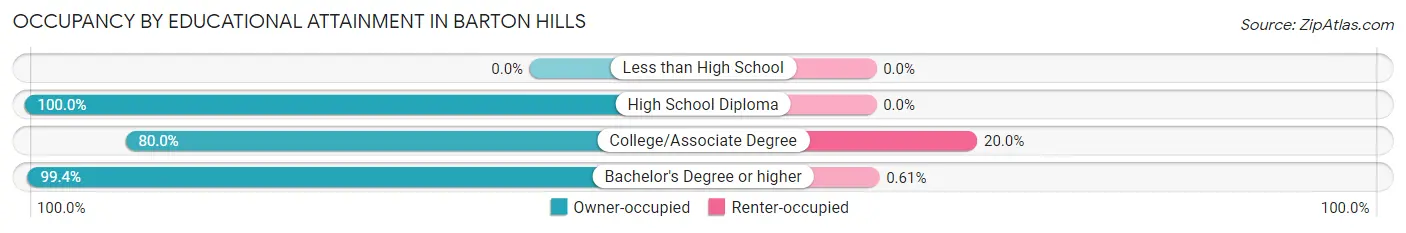
| Household Size | Owner-occupied | Renter-occupied |
| Less than High School | 0 (0.0%) | 0 (0.0%) |
| High School Diploma | 1 (100.0%) | 0 (0.0%) |
| College/Associate Degree | 8 (80.0%) | 2 (20.0%) |
| Bachelor's Degree or higher | 162 (99.4%) | 1 (0.6%) |
Occupancy by Age of Householder in Barton Hills
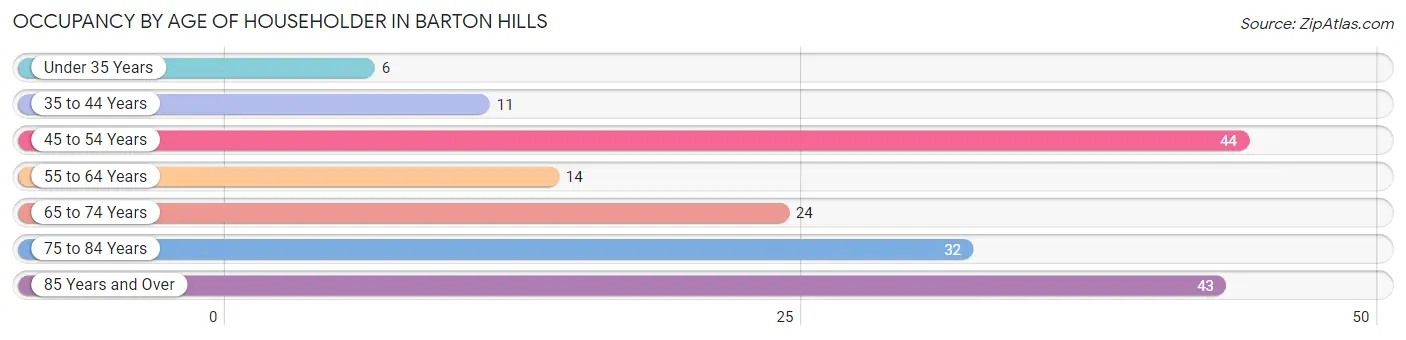
| Age Bracket | # Households | % Households |
| Under 35 Years | 6 | 3.5% |
| 35 to 44 Years | 11 | 6.3% |
| 45 to 54 Years | 44 | 25.3% |
| 55 to 64 Years | 14 | 8.1% |
| 65 to 74 Years | 24 | 13.8% |
| 75 to 84 Years | 32 | 18.4% |
| 85 Years and Over | 43 | 24.7% |
| Total | 174 | 100.0% |
Housing Finances in Barton Hills
Median Income by Occupancy in Barton Hills
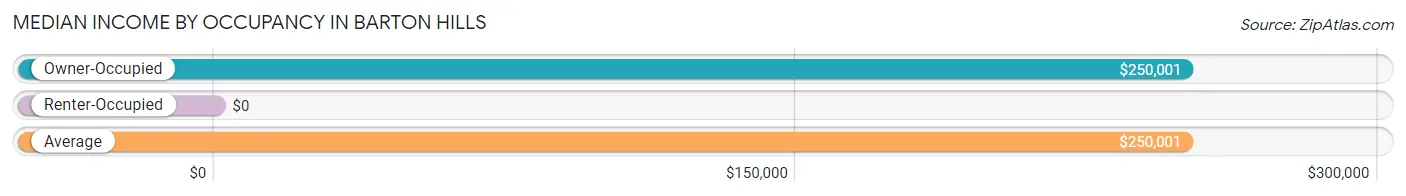
| Occupancy Type | # Households | Median Income |
| Owner-Occupied | 171 (98.3%) | $250,001 |
| Renter-Occupied | 3 (1.7%) | $0 |
| Average | 174 (100.0%) | $250,001 |
Occupancy by Householder Income Bracket in Barton Hills
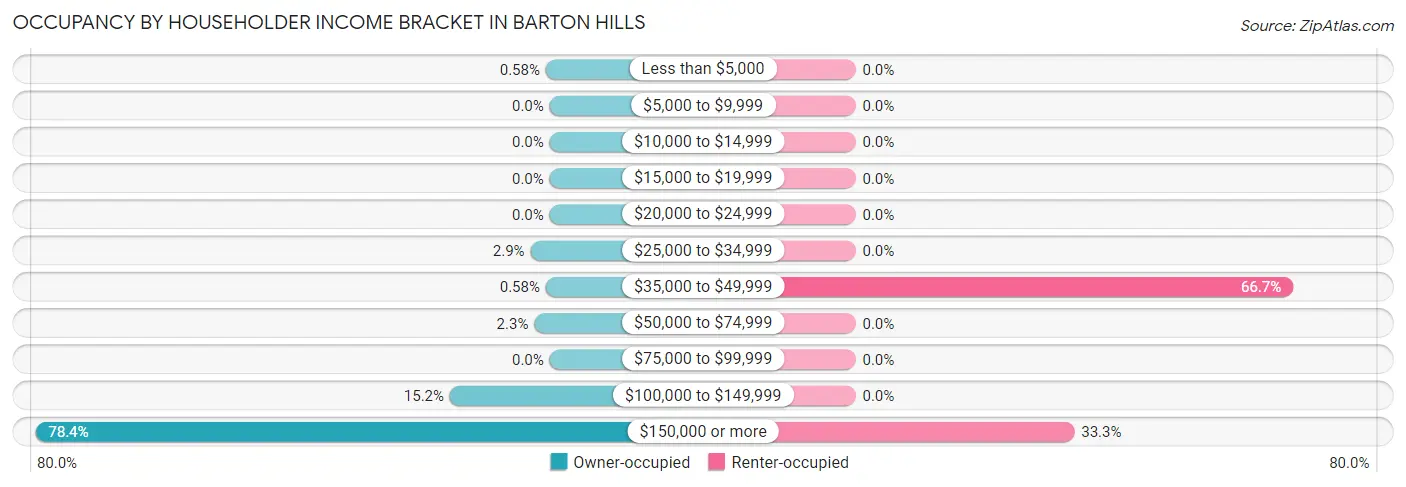
| Income Bracket | Owner-occupied | Renter-occupied |
| Less than $5,000 | 1 (0.6%) | 0 (0.0%) |
| $5,000 to $9,999 | 0 (0.0%) | 0 (0.0%) |
| $10,000 to $14,999 | 0 (0.0%) | 0 (0.0%) |
| $15,000 to $19,999 | 0 (0.0%) | 0 (0.0%) |
| $20,000 to $24,999 | 0 (0.0%) | 0 (0.0%) |
| $25,000 to $34,999 | 5 (2.9%) | 0 (0.0%) |
| $35,000 to $49,999 | 1 (0.6%) | 2 (66.7%) |
| $50,000 to $74,999 | 4 (2.3%) | 0 (0.0%) |
| $75,000 to $99,999 | 0 (0.0%) | 0 (0.0%) |
| $100,000 to $149,999 | 26 (15.2%) | 0 (0.0%) |
| $150,000 or more | 134 (78.4%) | 1 (33.3%) |
| Total | 171 (100.0%) | 3 (100.0%) |
Monthly Housing Cost Tiers in Barton Hills
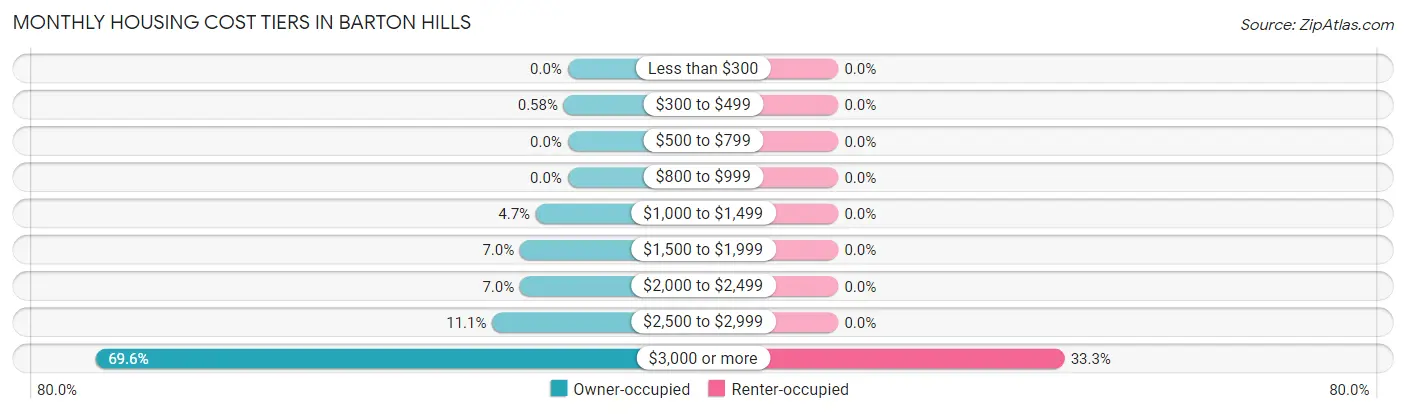
| Monthly Cost | Owner-occupied | Renter-occupied |
| Less than $300 | 0 (0.0%) | 0 (0.0%) |
| $300 to $499 | 1 (0.6%) | 0 (0.0%) |
| $500 to $799 | 0 (0.0%) | 0 (0.0%) |
| $800 to $999 | 0 (0.0%) | 0 (0.0%) |
| $1,000 to $1,499 | 8 (4.7%) | 0 (0.0%) |
| $1,500 to $1,999 | 12 (7.0%) | 0 (0.0%) |
| $2,000 to $2,499 | 12 (7.0%) | 0 (0.0%) |
| $2,500 to $2,999 | 19 (11.1%) | 0 (0.0%) |
| $3,000 or more | 119 (69.6%) | 1 (33.3%) |
| Total | 171 (100.0%) | 3 (100.0%) |
Physical Housing Characteristics in Barton Hills
Housing Structures in Barton Hills
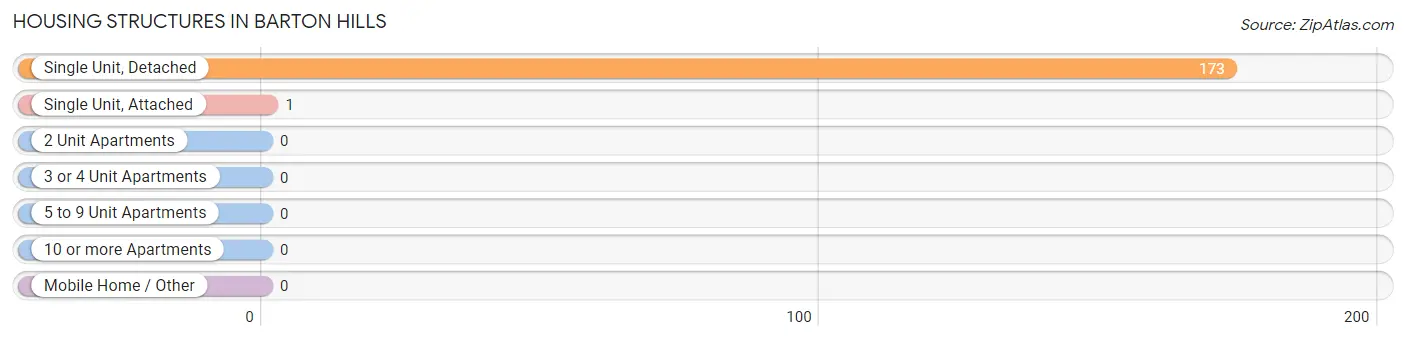
| Structure Type | # Housing Units | % Housing Units |
| Single Unit, Detached | 173 | 99.4% |
| Single Unit, Attached | 1 | 0.6% |
| 2 Unit Apartments | 0 | 0.0% |
| 3 or 4 Unit Apartments | 0 | 0.0% |
| 5 to 9 Unit Apartments | 0 | 0.0% |
| 10 or more Apartments | 0 | 0.0% |
| Mobile Home / Other | 0 | 0.0% |
| Total | 174 | 100.0% |
Housing Structures by Occupancy in Barton Hills
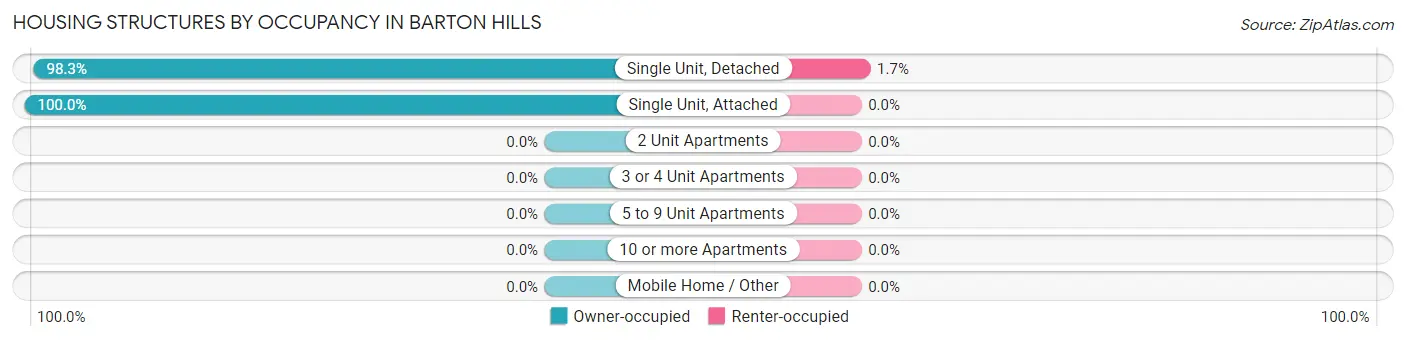
| Structure Type | Owner-occupied | Renter-occupied |
| Single Unit, Detached | 170 (98.3%) | 3 (1.7%) |
| Single Unit, Attached | 1 (100.0%) | 0 (0.0%) |
| 2 Unit Apartments | 0 (0.0%) | 0 (0.0%) |
| 3 or 4 Unit Apartments | 0 (0.0%) | 0 (0.0%) |
| 5 to 9 Unit Apartments | 0 (0.0%) | 0 (0.0%) |
| 10 or more Apartments | 0 (0.0%) | 0 (0.0%) |
| Mobile Home / Other | 0 (0.0%) | 0 (0.0%) |
| Total | 171 (98.3%) | 3 (1.7%) |
Housing Structures by Number of Rooms in Barton Hills
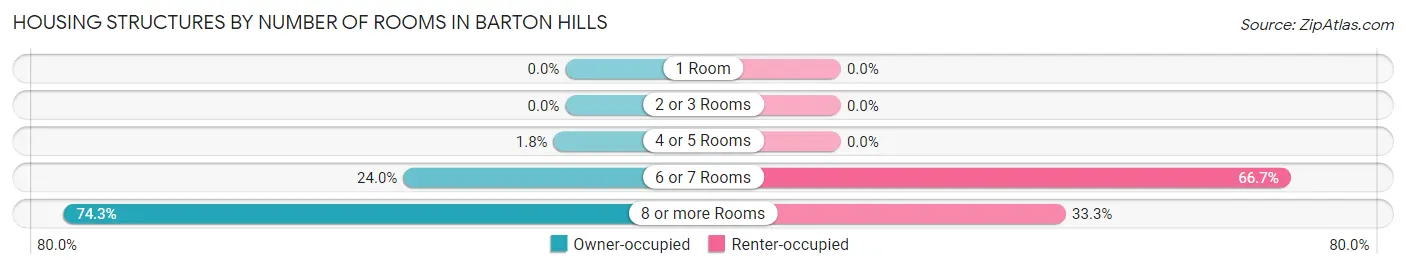
| Number of Rooms | Owner-occupied | Renter-occupied |
| 1 Room | 0 (0.0%) | 0 (0.0%) |
| 2 or 3 Rooms | 0 (0.0%) | 0 (0.0%) |
| 4 or 5 Rooms | 3 (1.8%) | 0 (0.0%) |
| 6 or 7 Rooms | 41 (24.0%) | 2 (66.7%) |
| 8 or more Rooms | 127 (74.3%) | 1 (33.3%) |
| Total | 171 (100.0%) | 3 (100.0%) |
Housing Structure by Heating Type in Barton Hills
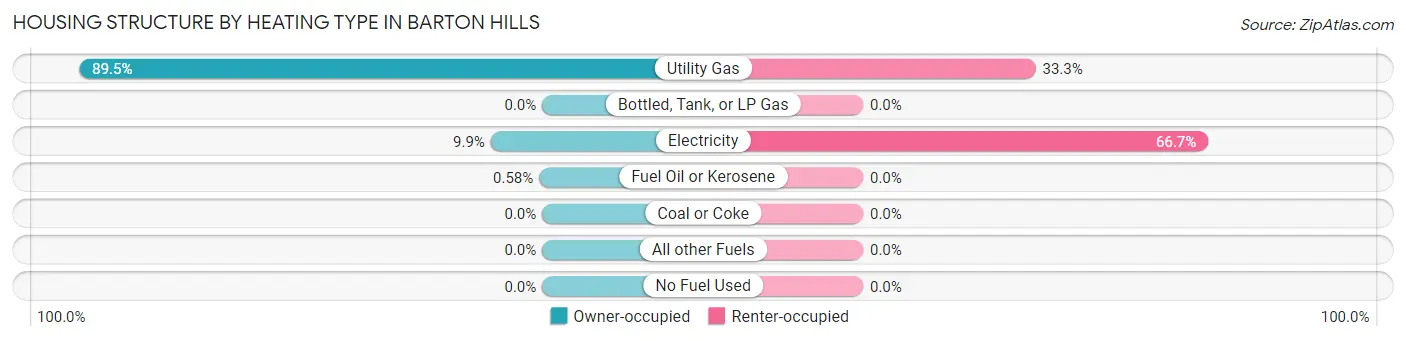
| Heating Type | Owner-occupied | Renter-occupied |
| Utility Gas | 153 (89.5%) | 1 (33.3%) |
| Bottled, Tank, or LP Gas | 0 (0.0%) | 0 (0.0%) |
| Electricity | 17 (9.9%) | 2 (66.7%) |
| Fuel Oil or Kerosene | 1 (0.6%) | 0 (0.0%) |
| Coal or Coke | 0 (0.0%) | 0 (0.0%) |
| All other Fuels | 0 (0.0%) | 0 (0.0%) |
| No Fuel Used | 0 (0.0%) | 0 (0.0%) |
| Total | 171 (100.0%) | 3 (100.0%) |
Household Vehicle Usage in Barton Hills
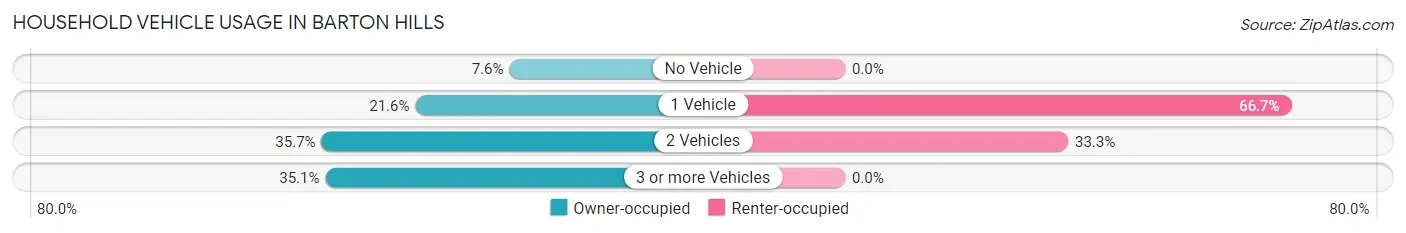
| Vehicles per Household | Owner-occupied | Renter-occupied |
| No Vehicle | 13 (7.6%) | 0 (0.0%) |
| 1 Vehicle | 37 (21.6%) | 2 (66.7%) |
| 2 Vehicles | 61 (35.7%) | 1 (33.3%) |
| 3 or more Vehicles | 60 (35.1%) | 0 (0.0%) |
| Total | 171 (100.0%) | 3 (100.0%) |
Real Estate & Mortgages in Barton Hills
Real Estate and Mortgage Overview in Barton Hills
| Characteristic | Without Mortgage | With Mortgage |
| Housing Units | 87 | 84 |
| Median Property Value | $1,479,200 | $1,131,000 |
| Median Household Income | $250,001 | $72 |
| Monthly Housing Costs | $1,501 | $75 |
| Real Estate Taxes | $10,001 | $0 |
Property Value by Mortgage Status in Barton Hills
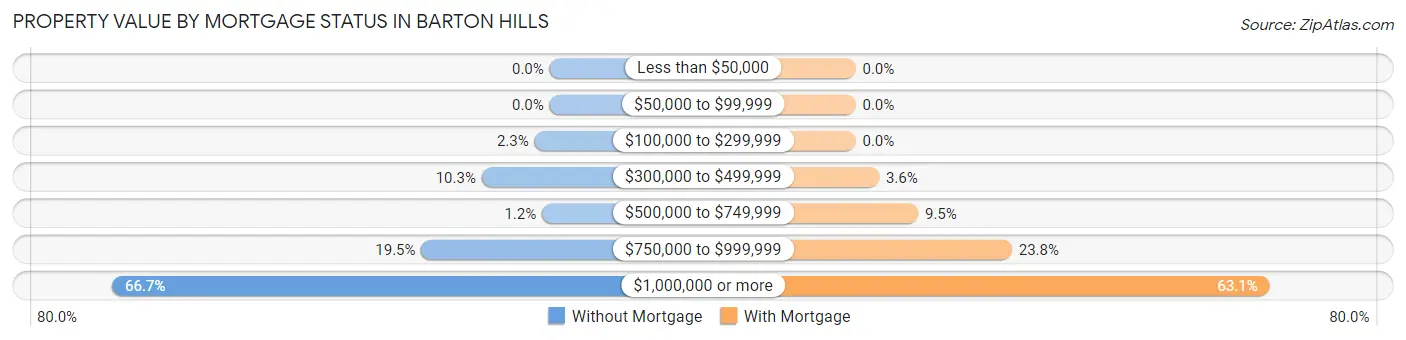
| Property Value | Without Mortgage | With Mortgage |
| Less than $50,000 | 0 (0.0%) | 0 (0.0%) |
| $50,000 to $99,999 | 0 (0.0%) | 0 (0.0%) |
| $100,000 to $299,999 | 2 (2.3%) | 0 (0.0%) |
| $300,000 to $499,999 | 9 (10.3%) | 3 (3.6%) |
| $500,000 to $749,999 | 1 (1.1%) | 8 (9.5%) |
| $750,000 to $999,999 | 17 (19.5%) | 20 (23.8%) |
| $1,000,000 or more | 58 (66.7%) | 53 (63.1%) |
| Total | 87 (100.0%) | 84 (100.0%) |
Household Income by Mortgage Status in Barton Hills
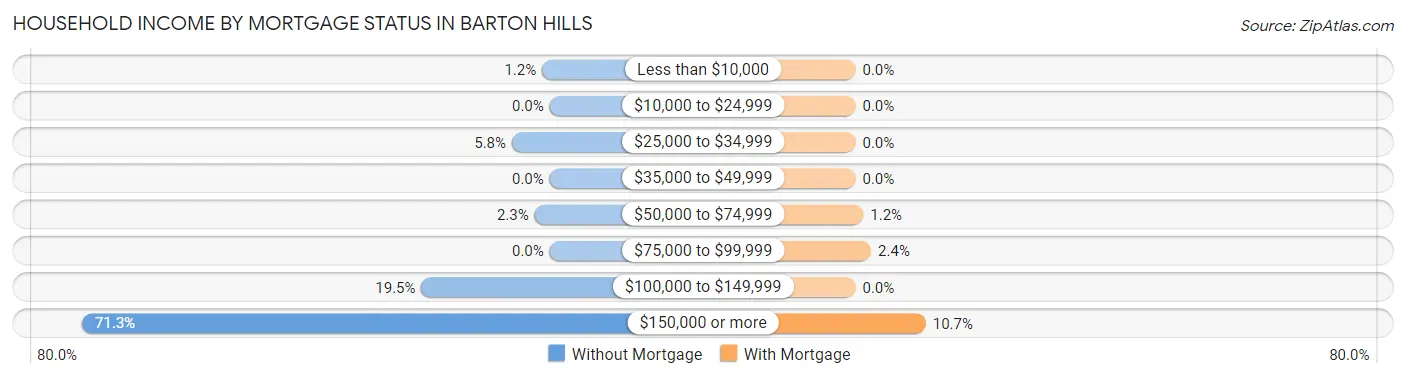
| Household Income | Without Mortgage | With Mortgage |
| Less than $10,000 | 1 (1.1%) | 0 (0.0%) |
| $10,000 to $24,999 | 0 (0.0%) | 0 (0.0%) |
| $25,000 to $34,999 | 5 (5.8%) | 0 (0.0%) |
| $35,000 to $49,999 | 0 (0.0%) | 0 (0.0%) |
| $50,000 to $74,999 | 2 (2.3%) | 1 (1.2%) |
| $75,000 to $99,999 | 0 (0.0%) | 2 (2.4%) |
| $100,000 to $149,999 | 17 (19.5%) | 0 (0.0%) |
| $150,000 or more | 62 (71.3%) | 9 (10.7%) |
| Total | 87 (100.0%) | 84 (100.0%) |
Property Value to Household Income Ratio in Barton Hills
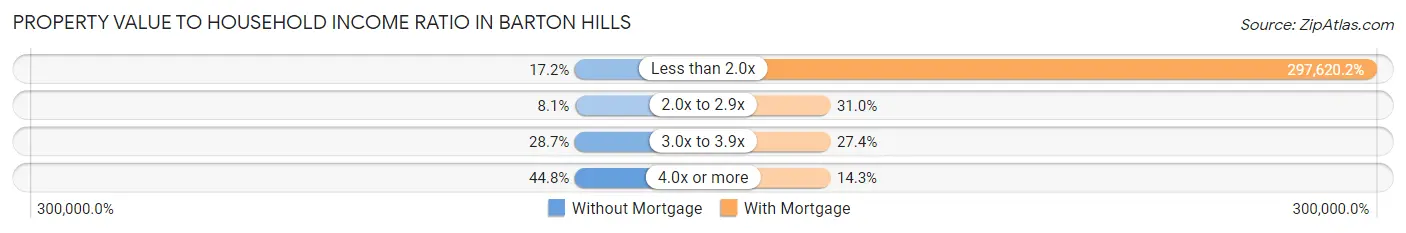
| Value-to-Income Ratio | Without Mortgage | With Mortgage |
| Less than 2.0x | 15 (17.2%) | 250,001 (297,620.2%) |
| 2.0x to 2.9x | 7 (8.1%) | 26 (30.9%) |
| 3.0x to 3.9x | 25 (28.7%) | 23 (27.4%) |
| 4.0x or more | 39 (44.8%) | 12 (14.3%) |
| Total | 87 (100.0%) | 84 (100.0%) |
Real Estate Taxes by Mortgage Status in Barton Hills
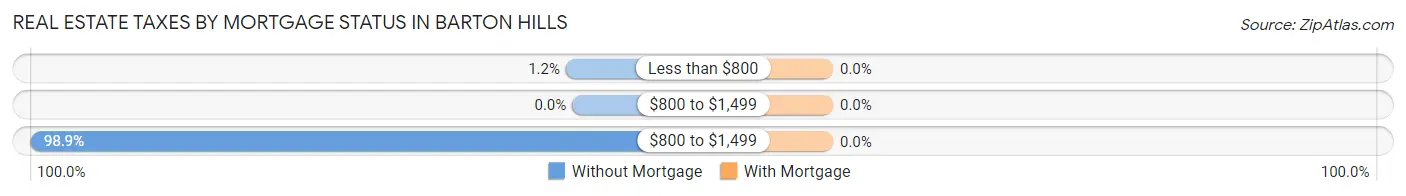
| Property Taxes | Without Mortgage | With Mortgage |
| Less than $800 | 1 (1.1%) | 0 (0.0%) |
| $800 to $1,499 | 0 (0.0%) | 0 (0.0%) |
| $800 to $1,499 | 86 (98.9%) | 0 (0.0%) |
| Total | 87 (100.0%) | 84 (100.0%) |
Health & Disability in Barton Hills
Health Insurance Coverage by Age in Barton Hills
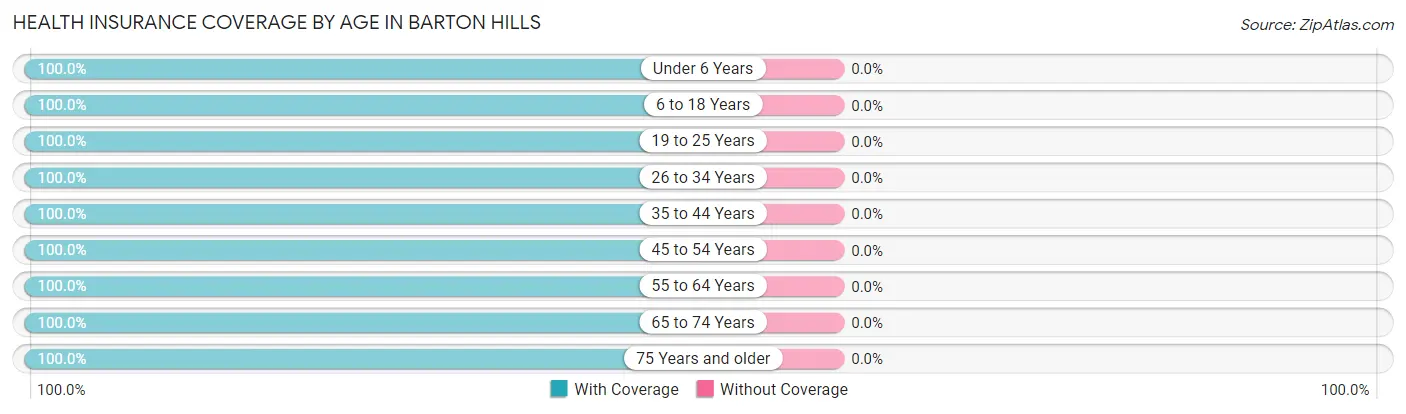
| Age Bracket | With Coverage | Without Coverage |
| Under 6 Years | 20 (100.0%) | 0 (0.0%) |
| 6 to 18 Years | 106 (100.0%) | 0 (0.0%) |
| 19 to 25 Years | 7 (100.0%) | 0 (0.0%) |
| 26 to 34 Years | 13 (100.0%) | 0 (0.0%) |
| 35 to 44 Years | 24 (100.0%) | 0 (0.0%) |
| 45 to 54 Years | 94 (100.0%) | 0 (0.0%) |
| 55 to 64 Years | 38 (100.0%) | 0 (0.0%) |
| 65 to 74 Years | 41 (100.0%) | 0 (0.0%) |
| 75 Years and older | 101 (100.0%) | 0 (0.0%) |
| Total | 444 (100.0%) | 0 (0.0%) |
Health Insurance Coverage by Citizenship Status in Barton Hills
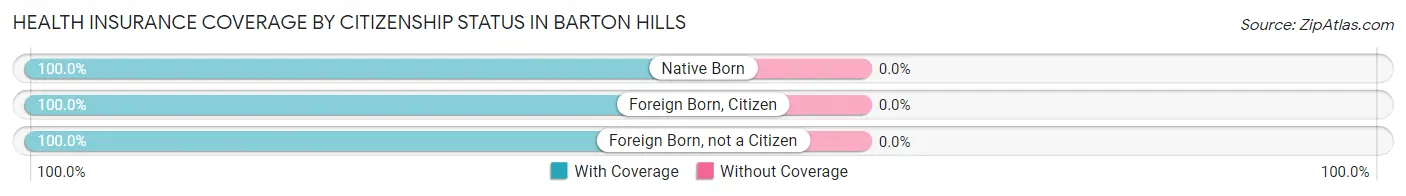
| Citizenship Status | With Coverage | Without Coverage |
| Native Born | 20 (100.0%) | 0 (0.0%) |
| Foreign Born, Citizen | 106 (100.0%) | 0 (0.0%) |
| Foreign Born, not a Citizen | 7 (100.0%) | 0 (0.0%) |
Health Insurance Coverage by Household Income in Barton Hills
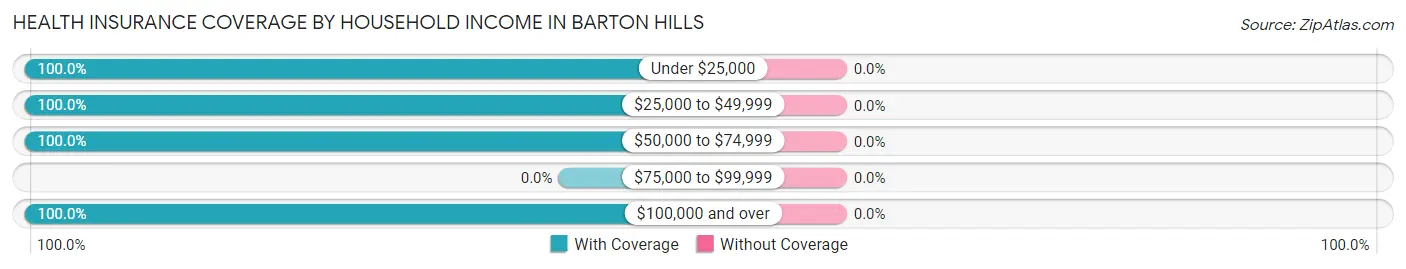
| Household Income | With Coverage | Without Coverage |
| Under $25,000 | 1 (100.0%) | 0 (0.0%) |
| $25,000 to $49,999 | 8 (100.0%) | 0 (0.0%) |
| $50,000 to $74,999 | 7 (100.0%) | 0 (0.0%) |
| $75,000 to $99,999 | 0 (0.0%) | 0 (0.0%) |
| $100,000 and over | 428 (100.0%) | 0 (0.0%) |
Public vs Private Health Insurance Coverage by Age in Barton Hills
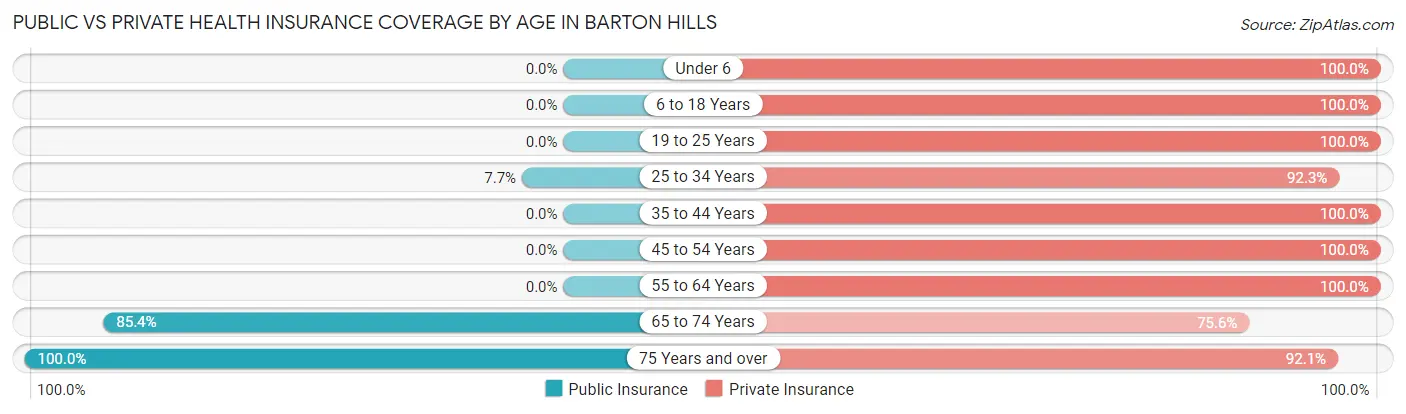
| Age Bracket | Public Insurance | Private Insurance |
| Under 6 | 0 (0.0%) | 20 (100.0%) |
| 6 to 18 Years | 0 (0.0%) | 106 (100.0%) |
| 19 to 25 Years | 0 (0.0%) | 7 (100.0%) |
| 25 to 34 Years | 1 (7.7%) | 12 (92.3%) |
| 35 to 44 Years | 0 (0.0%) | 24 (100.0%) |
| 45 to 54 Years | 0 (0.0%) | 94 (100.0%) |
| 55 to 64 Years | 0 (0.0%) | 38 (100.0%) |
| 65 to 74 Years | 35 (85.4%) | 31 (75.6%) |
| 75 Years and over | 101 (100.0%) | 93 (92.1%) |
| Total | 137 (30.9%) | 425 (95.7%) |
Disability Status by Sex by Age in Barton Hills
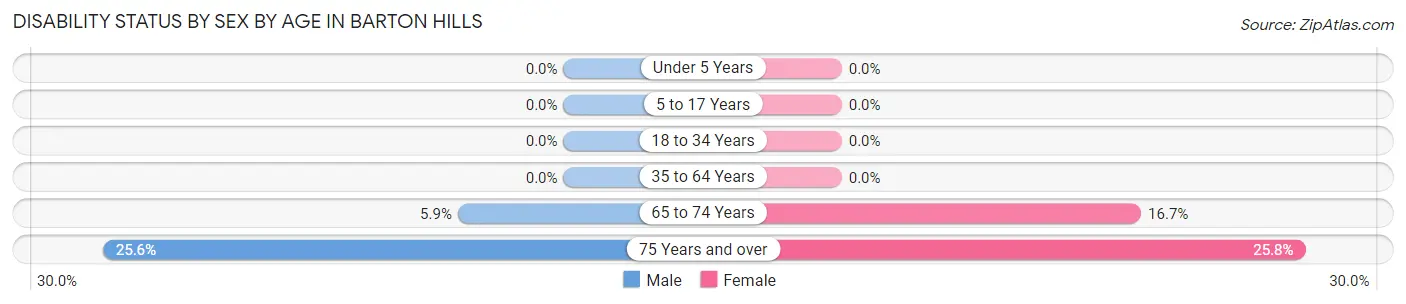
| Age Bracket | Male | Female |
| Under 5 Years | 0 (0.0%) | 0 (0.0%) |
| 5 to 17 Years | 0 (0.0%) | 0 (0.0%) |
| 18 to 34 Years | 0 (0.0%) | 0 (0.0%) |
| 35 to 64 Years | 0 (0.0%) | 0 (0.0%) |
| 65 to 74 Years | 1 (5.9%) | 4 (16.7%) |
| 75 Years and over | 10 (25.6%) | 16 (25.8%) |
Disability Class by Sex by Age in Barton Hills
Disability Class: Hearing Difficulty
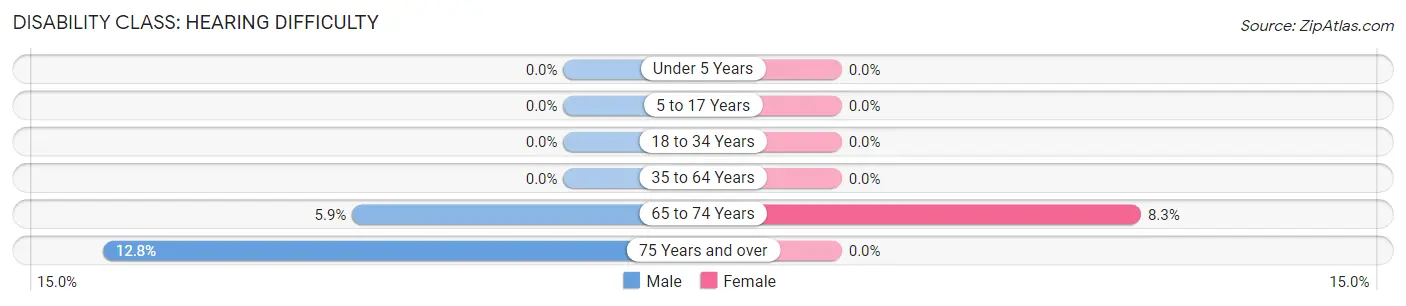
| Age Bracket | Male | Female |
| Under 5 Years | 0 (0.0%) | 0 (0.0%) |
| 5 to 17 Years | 0 (0.0%) | 0 (0.0%) |
| 18 to 34 Years | 0 (0.0%) | 0 (0.0%) |
| 35 to 64 Years | 0 (0.0%) | 0 (0.0%) |
| 65 to 74 Years | 1 (5.9%) | 2 (8.3%) |
| 75 Years and over | 5 (12.8%) | 0 (0.0%) |
Disability Class: Vision Difficulty
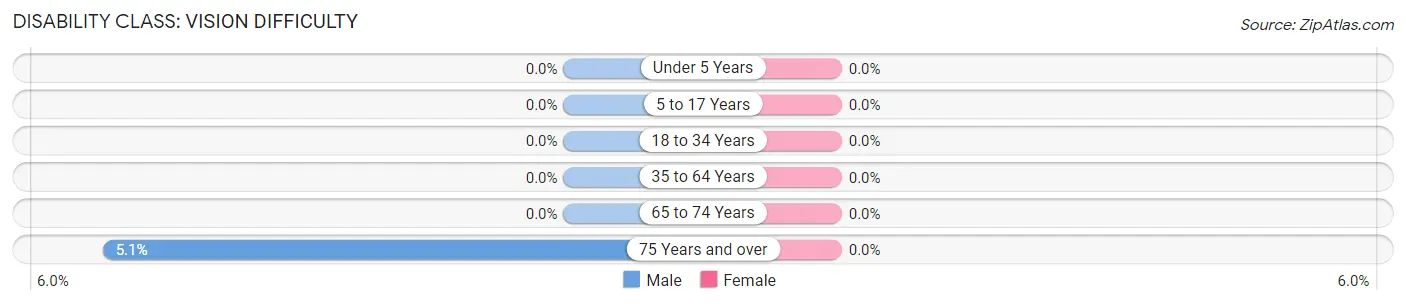
| Age Bracket | Male | Female |
| Under 5 Years | 0 (0.0%) | 0 (0.0%) |
| 5 to 17 Years | 0 (0.0%) | 0 (0.0%) |
| 18 to 34 Years | 0 (0.0%) | 0 (0.0%) |
| 35 to 64 Years | 0 (0.0%) | 0 (0.0%) |
| 65 to 74 Years | 0 (0.0%) | 0 (0.0%) |
| 75 Years and over | 2 (5.1%) | 0 (0.0%) |
Disability Class: Cognitive Difficulty
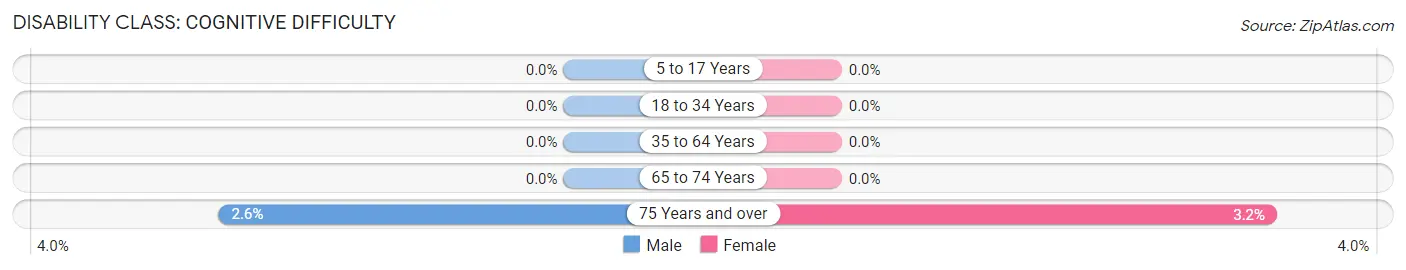
| Age Bracket | Male | Female |
| 5 to 17 Years | 0 (0.0%) | 0 (0.0%) |
| 18 to 34 Years | 0 (0.0%) | 0 (0.0%) |
| 35 to 64 Years | 0 (0.0%) | 0 (0.0%) |
| 65 to 74 Years | 0 (0.0%) | 0 (0.0%) |
| 75 Years and over | 1 (2.6%) | 2 (3.2%) |
Disability Class: Ambulatory Difficulty
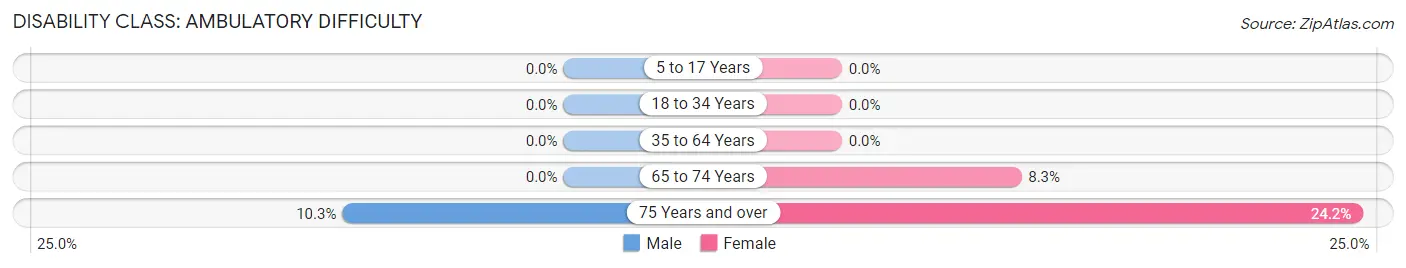
| Age Bracket | Male | Female |
| 5 to 17 Years | 0 (0.0%) | 0 (0.0%) |
| 18 to 34 Years | 0 (0.0%) | 0 (0.0%) |
| 35 to 64 Years | 0 (0.0%) | 0 (0.0%) |
| 65 to 74 Years | 0 (0.0%) | 2 (8.3%) |
| 75 Years and over | 4 (10.3%) | 15 (24.2%) |
Disability Class: Self-Care Difficulty
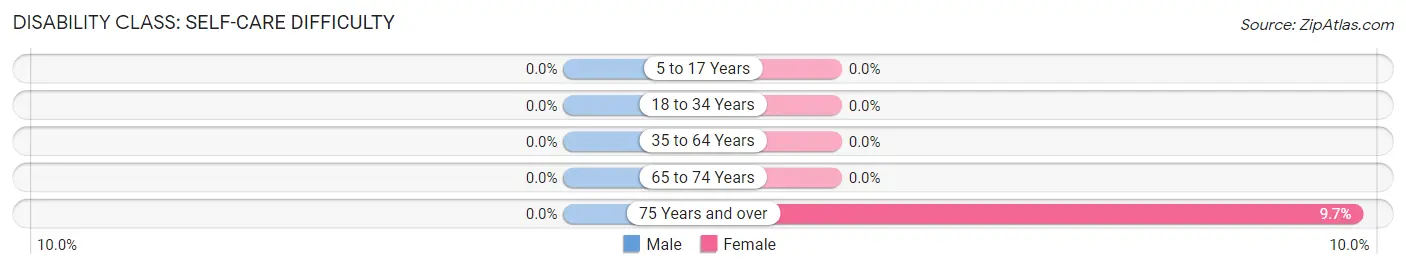
| Age Bracket | Male | Female |
| 5 to 17 Years | 0 (0.0%) | 0 (0.0%) |
| 18 to 34 Years | 0 (0.0%) | 0 (0.0%) |
| 35 to 64 Years | 0 (0.0%) | 0 (0.0%) |
| 65 to 74 Years | 0 (0.0%) | 0 (0.0%) |
| 75 Years and over | 0 (0.0%) | 6 (9.7%) |
Technology Access in Barton Hills
Computing Device Access in Barton Hills
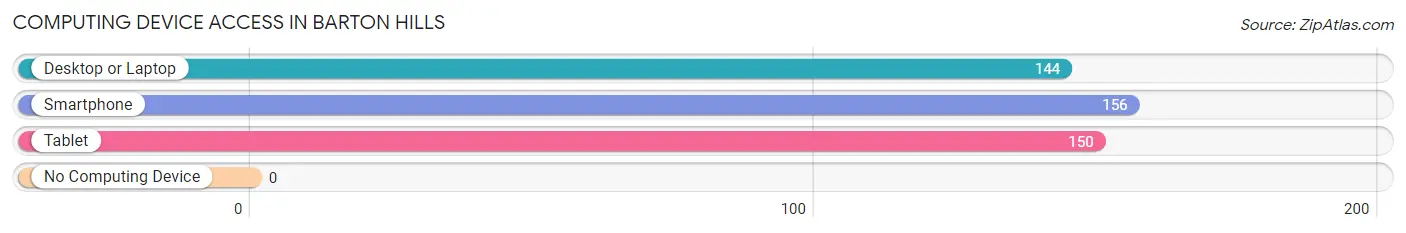
| Device Type | # Households | % Households |
| Desktop or Laptop | 144 | 82.8% |
| Smartphone | 156 | 89.7% |
| Tablet | 150 | 86.2% |
| No Computing Device | 0 | 0.0% |
| Total | 174 | 100.0% |
Internet Access in Barton Hills
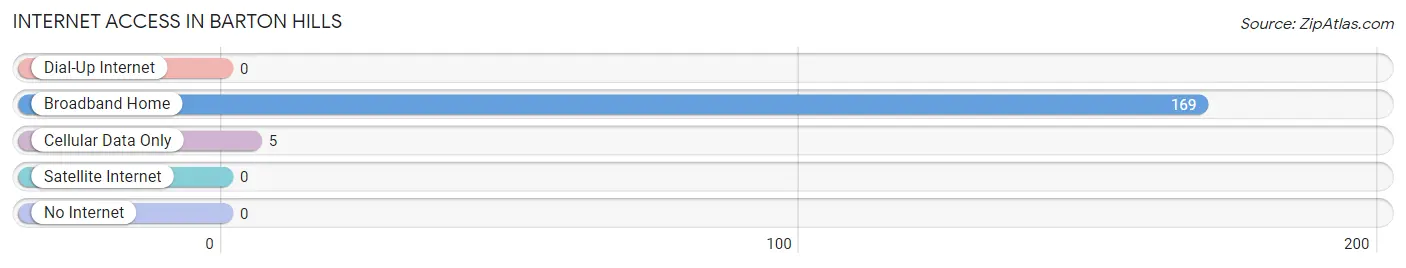
| Internet Type | # Households | % Households |
| Dial-Up Internet | 0 | 0.0% |
| Broadband Home | 169 | 97.1% |
| Cellular Data Only | 5 | 2.9% |
| Satellite Internet | 0 | 0.0% |
| No Internet | 0 | 0.0% |
| Total | 174 | 100.0% |
Barton Hills Summary
Barton Hills is a small village located in Washtenaw County, Michigan. It is situated on the Huron River, just south of Ann Arbor. The village was founded in 1835 and is home to approximately 1,000 people.
History
Barton Hills was founded in 1835 by William Barton, a settler from New York. He purchased the land from the federal government and named it after himself. The village was originally a farming community, but it soon became a popular summer resort destination. In the late 19th century, wealthy families from Detroit and Chicago began to build large summer homes in the area.
The village was incorporated in 1927 and has remained relatively unchanged since then. The village has a small-town feel and is known for its picturesque views of the Huron River.
Geography
Barton Hills is located in Washtenaw County, Michigan. It is situated on the Huron River, just south of Ann Arbor. The village is surrounded by rolling hills and is home to several parks and nature preserves. The village is also home to Barton Hills Country Club, a private golf course.
The climate in Barton Hills is typical of the Midwest. Summers are warm and humid, while winters are cold and snowy. The average temperature in the summer is around 75 degrees Fahrenheit, while the average temperature in the winter is around 25 degrees Fahrenheit.
Economy
The economy of Barton Hills is largely based on tourism. The village is home to several resorts and hotels, as well as a number of restaurants and shops. The village is also home to Barton Hills Country Club, a private golf course.
The village is also home to several small businesses, including a local newspaper, a hardware store, and a grocery store. The village is also home to several professional services, such as lawyers and accountants.
Demographics
As of the 2010 census, the population of Barton Hills was 1,000. The racial makeup of the village was 94.2% White, 1.2% African American, 0.2% Native American, 0.8% Asian, and 3.6% from other races. The median household income was $76,250, and the median family income was $90,000.
The village is home to a variety of religious denominations, including Catholic, Protestant, and Jewish. The village is also home to a variety of cultural organizations, including the Barton Hills Cultural Center and the Barton Hills Historical Society.
Conclusion
Barton Hills is a small village located in Washtenaw County, Michigan. It was founded in 1835 and is home to approximately 1,000 people. The village is known for its picturesque views of the Huron River and its small-town feel. The economy of Barton Hills is largely based on tourism, and the village is home to several resorts and hotels, as well as a number of restaurants and shops. The village is also home to a variety of religious denominations and cultural organizations.
Common Questions
What is Per Capita Income in Barton Hills?
Per Capita income in Barton Hills is $194,386.
What is the Median Family Income in Barton Hills?
Median Family Income in Barton Hills is $250,001.
What is the Median Household income in Barton Hills?
Median Household Income in Barton Hills is $250,001.
What is Income or Wage Gap in Barton Hills?
Income or Wage Gap in Barton Hills is 43.2%.
Women in Barton Hills earn 56.8 cents for every dollar earned by a man.
What is Inequality or Gini Index in Barton Hills?
Inequality or Gini Index in Barton Hills is 0.42.
What is the Total Population of Barton Hills?
Total Population of Barton Hills is 444.
What is the Total Male Population of Barton Hills?
Total Male Population of Barton Hills is 165.
What is the Total Female Population of Barton Hills?
Total Female Population of Barton Hills is 279.
What is the Ratio of Males per 100 Females in Barton Hills?
There are 59.14 Males per 100 Females in Barton Hills.
What is the Ratio of Females per 100 Males in Barton Hills?
There are 169.09 Females per 100 Males in Barton Hills.
What is the Median Population Age in Barton Hills?
Median Population Age in Barton Hills is 50.8 Years.
What is the Average Family Size in Barton Hills
Average Family Size in Barton Hills is 3.3 People.
What is the Average Household Size in Barton Hills
Average Household Size in Barton Hills is 2.5 People.
How Large is the Labor Force in Barton Hills?
There are 169 People in the Labor Forcein in Barton Hills.
What is the Percentage of People in the Labor Force in Barton Hills?
50.8% of People are in the Labor Force in Barton Hills.
What is the Unemployment Rate in Barton Hills?
Unemployment Rate in Barton Hills is 1.8%.