Ahmeek, MI Map & Demographics
Ahmeek Map
Ahmeek Overview
$25,486
PER CAPITA INCOME
$57,344
AVG FAMILY INCOME
$55,156
AVG HOUSEHOLD INCOME
0.36
INEQUALITY / GINI INDEX
87
TOTAL POPULATION
43
MALE POPULATION
44
FEMALE POPULATION
97.73
MALES / 100 FEMALES
102.33
FEMALES / 100 MALES
45.9
MEDIAN AGE
2.4
AVG FAMILY SIZE
2.0
AVG HOUSEHOLD SIZE
46
LABOR FORCE [ PEOPLE ]
60.5%
PERCENT IN LABOR FORCE
4.3%
UNEMPLOYMENT RATE
Ahmeek Zip Codes
Ahmeek Area Codes
Income in Ahmeek
Income Overview in Ahmeek
Per Capita Income in Ahmeek is $25,486, while median incomes of families and households are $57,344 and $55,156 respectively.
| Characteristic | Number | Measure |
| Per Capita Income | 87 | $25,486 |
| Median Family Income | 29 | $57,344 |
| Mean Family Income | 29 | $68,200 |
| Median Household Income | 43 | $55,156 |
| Mean Household Income | 43 | $53,902 |
| Income Deficit | 29 | $0 |
| Wage / Income Gap (%) | 87 | 0.00% |
| Wage / Income Gap ($) | 87 | 100.00¢ per $1 |
| Gini / Inequality Index | 87 | 0.36 |
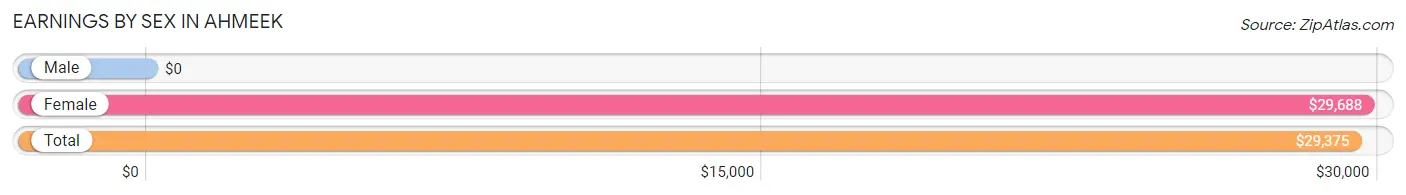
Earnings by Sex in Ahmeek
| Sex | Number | Average Earnings |
| Male | 27 (56.2%) | $0 |
| Female | 21 (43.8%) | $29,688 |
| Total | 48 (100.0%) | $29,375 |
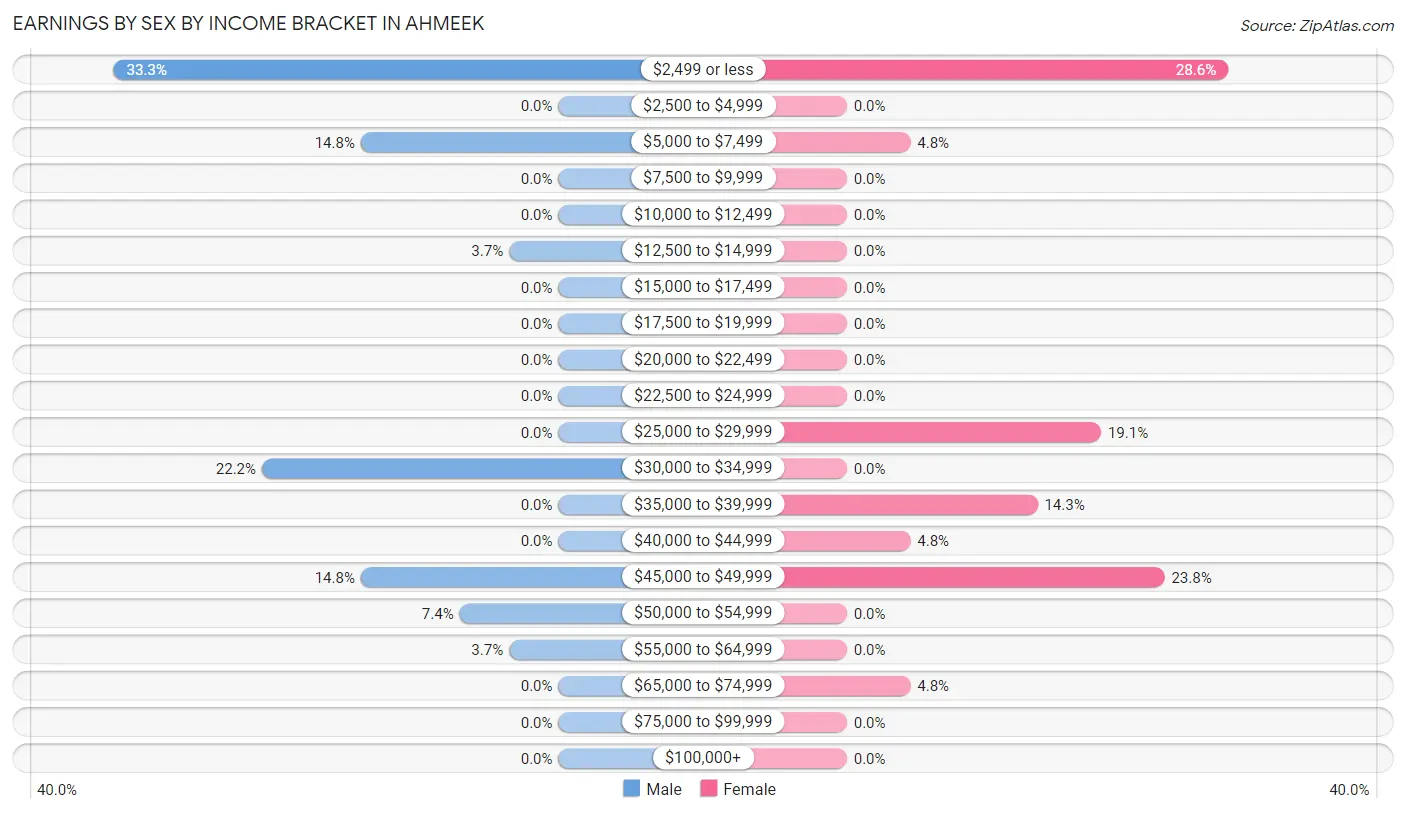
Earnings by Sex by Income Bracket in Ahmeek
The most common earnings brackets in Ahmeek are $2,499 or less for men (9 | 33.3%) and $2,499 or less for women (6 | 28.6%).
| Income | Male | Female |
| $2,499 or less | 9 (33.3%) | 6 (28.6%) |
| $2,500 to $4,999 | 0 (0.0%) | 0 (0.0%) |
| $5,000 to $7,499 | 4 (14.8%) | 1 (4.8%) |
| $7,500 to $9,999 | 0 (0.0%) | 0 (0.0%) |
| $10,000 to $12,499 | 0 (0.0%) | 0 (0.0%) |
| $12,500 to $14,999 | 1 (3.7%) | 0 (0.0%) |
| $15,000 to $17,499 | 0 (0.0%) | 0 (0.0%) |
| $17,500 to $19,999 | 0 (0.0%) | 0 (0.0%) |
| $20,000 to $22,499 | 0 (0.0%) | 0 (0.0%) |
| $22,500 to $24,999 | 0 (0.0%) | 0 (0.0%) |
| $25,000 to $29,999 | 0 (0.0%) | 4 (19.1%) |
| $30,000 to $34,999 | 6 (22.2%) | 0 (0.0%) |
| $35,000 to $39,999 | 0 (0.0%) | 3 (14.3%) |
| $40,000 to $44,999 | 0 (0.0%) | 1 (4.8%) |
| $45,000 to $49,999 | 4 (14.8%) | 5 (23.8%) |
| $50,000 to $54,999 | 2 (7.4%) | 0 (0.0%) |
| $55,000 to $64,999 | 1 (3.7%) | 0 (0.0%) |
| $65,000 to $74,999 | 0 (0.0%) | 1 (4.8%) |
| $75,000 to $99,999 | 0 (0.0%) | 0 (0.0%) |
| $100,000+ | 0 (0.0%) | 0 (0.0%) |
| Total | 27 (100.0%) | 21 (100.0%) |
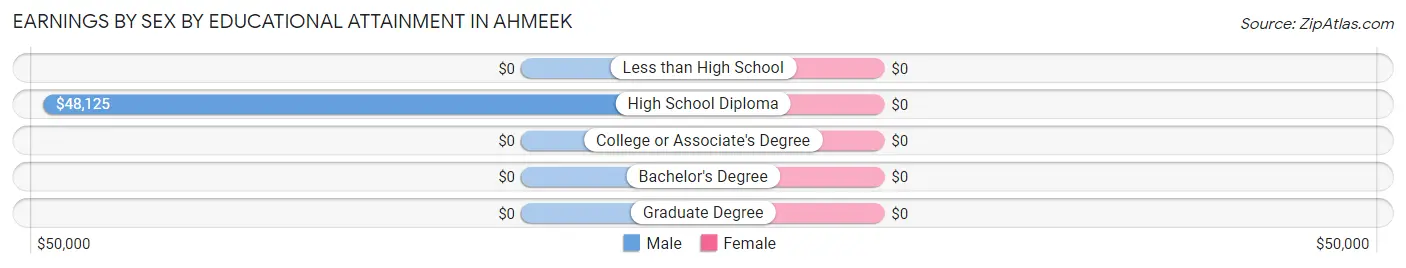
Earnings by Sex by Educational Attainment in Ahmeek
| Educational Attainment | Male Income | Female Income |
| Less than High School | - | - |
| High School Diploma | $48,125 | $0 |
| College or Associate's Degree | - | - |
| Bachelor's Degree | - | - |
| Graduate Degree | - | - |
| Total | - | - |
Family Income in Ahmeek
Family Income Brackets in Ahmeek
According to the Ahmeek family income data, there are 10 families falling into the $50,000 to $74,999 income range, which is the most common income bracket and makes up 34.5% of all families.
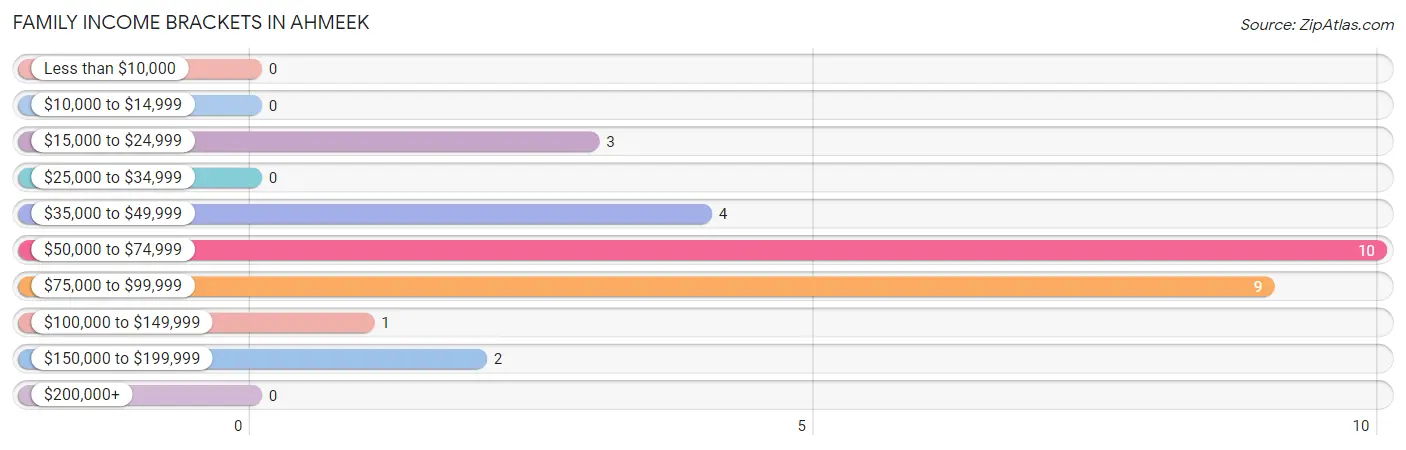
| Income Bracket | # Families | % Families |
| Less than $10,000 | 0 | 0.0% |
| $10,000 to $14,999 | 0 | 0.0% |
| $15,000 to $24,999 | 3 | 10.3% |
| $25,000 to $34,999 | 0 | 0.0% |
| $35,000 to $49,999 | 4 | 13.8% |
| $50,000 to $74,999 | 10 | 34.5% |
| $75,000 to $99,999 | 9 | 31.0% |
| $100,000 to $149,999 | 1 | 3.4% |
| $150,000 to $199,999 | 2 | 6.9% |
| $200,000+ | 0 | 0.0% |
Family Income by Famaliy Size in Ahmeek
2-person families (24 | 82.8%) account for the highest median family income in Ahmeek with $56,563 per family, while 2-person families (24 | 82.8%) have the highest median income of $28,282 per family member.
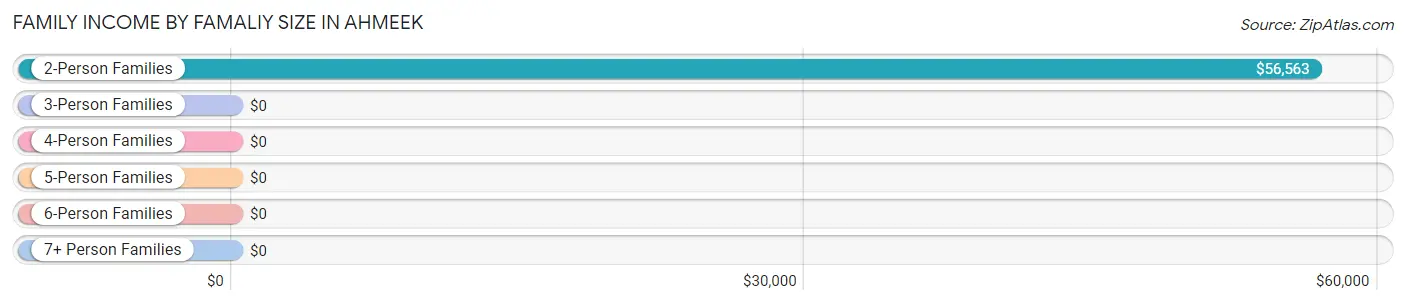
| Income Bracket | # Families | Median Income |
| 2-Person Families | 24 (82.8%) | $56,563 |
| 3-Person Families | 0 (0.0%) | $0 |
| 4-Person Families | 1 (3.5%) | $0 |
| 5-Person Families | 0 (0.0%) | $0 |
| 6-Person Families | 0 (0.0%) | $0 |
| 7+ Person Families | 4 (13.8%) | $0 |
| Total | 29 (100.0%) | $57,344 |
Family Income by Number of Earners in Ahmeek
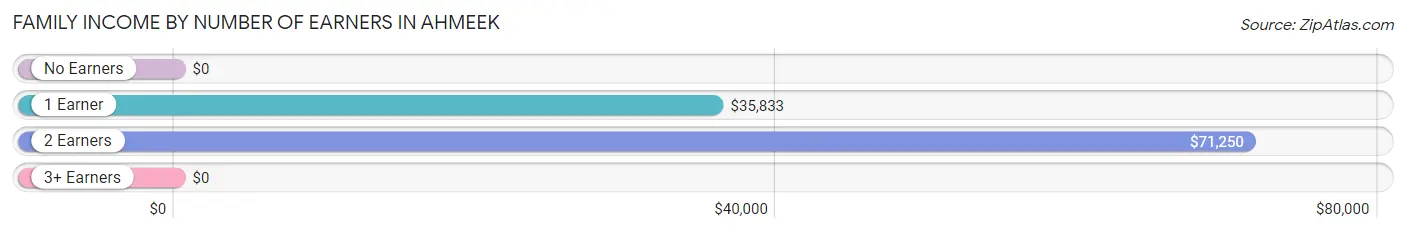
| Number of Earners | # Families | Median Income |
| No Earners | 4 (13.8%) | $0 |
| 1 Earner | 8 (27.6%) | $35,833 |
| 2 Earners | 17 (58.6%) | $71,250 |
| 3+ Earners | 0 (0.0%) | $0 |
| Total | 29 (100.0%) | $57,344 |
Household Income in Ahmeek
Household Income Brackets in Ahmeek
With 13 households falling in the category, the $50,000 to $74,999 income range is the most frequent in Ahmeek, accounting for 30.2% of all households.
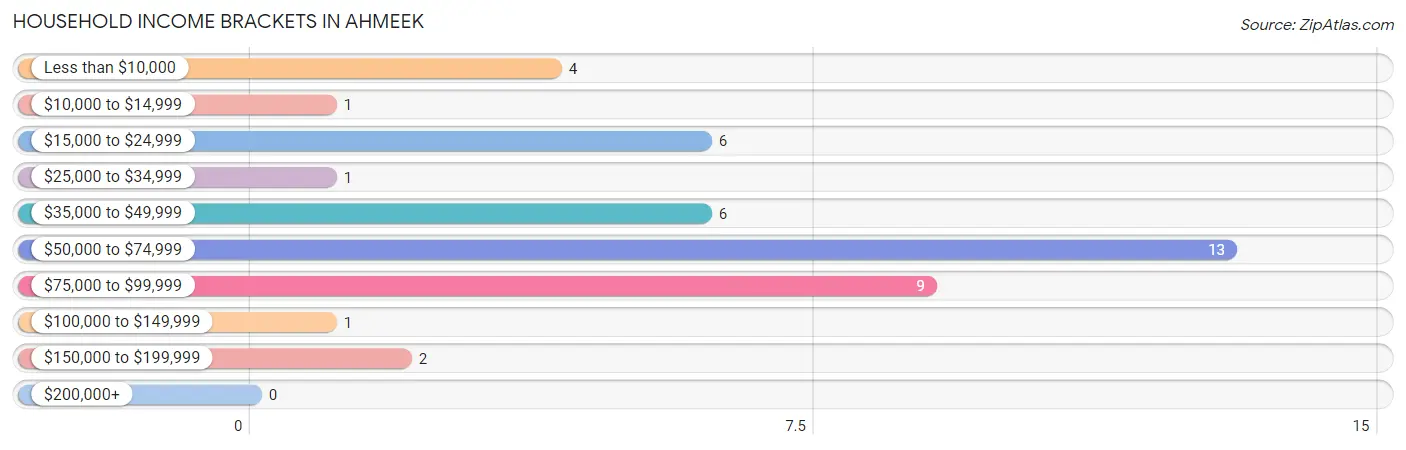
| Income Bracket | # Households | % Households |
| Less than $10,000 | 4 | 9.3% |
| $10,000 to $14,999 | 1 | 2.3% |
| $15,000 to $24,999 | 6 | 14.0% |
| $25,000 to $34,999 | 1 | 2.3% |
| $35,000 to $49,999 | 6 | 14.0% |
| $50,000 to $74,999 | 13 | 30.2% |
| $75,000 to $99,999 | 9 | 20.9% |
| $100,000 to $149,999 | 1 | 2.3% |
| $150,000 to $199,999 | 2 | 4.7% |
| $200,000+ | 0 | 0.0% |
Household Income by Householder Age in Ahmeek
The median household income in Ahmeek is $55,156, with the highest median household income of $56,094 found in the 45 to 64 years age bracket for the primary householder. A total of 19 households (44.2%) fall into this category.
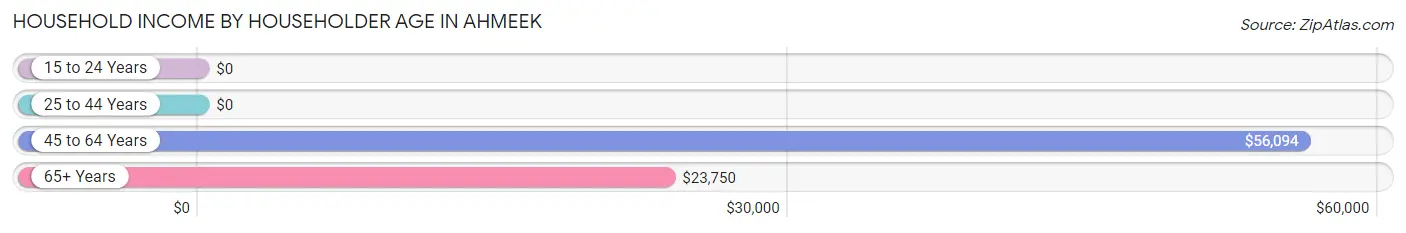
| Income Bracket | # Households | Median Income |
| 15 to 24 Years | 0 (0.0%) | $0 |
| 25 to 44 Years | 11 (25.6%) | $0 |
| 45 to 64 Years | 19 (44.2%) | $56,094 |
| 65+ Years | 13 (30.2%) | $23,750 |
| Total | 43 (100.0%) | $55,156 |
Poverty in Ahmeek
Income Below Poverty by Sex and Age in Ahmeek
With 4.6% poverty level for males and 6.8% for females among the residents of Ahmeek, 45 to 54 year old males and 35 to 44 year old females are the most vulnerable to poverty, with 2 males (25.0%) and 2 females (33.3%) in their respective age groups living below the poverty level.
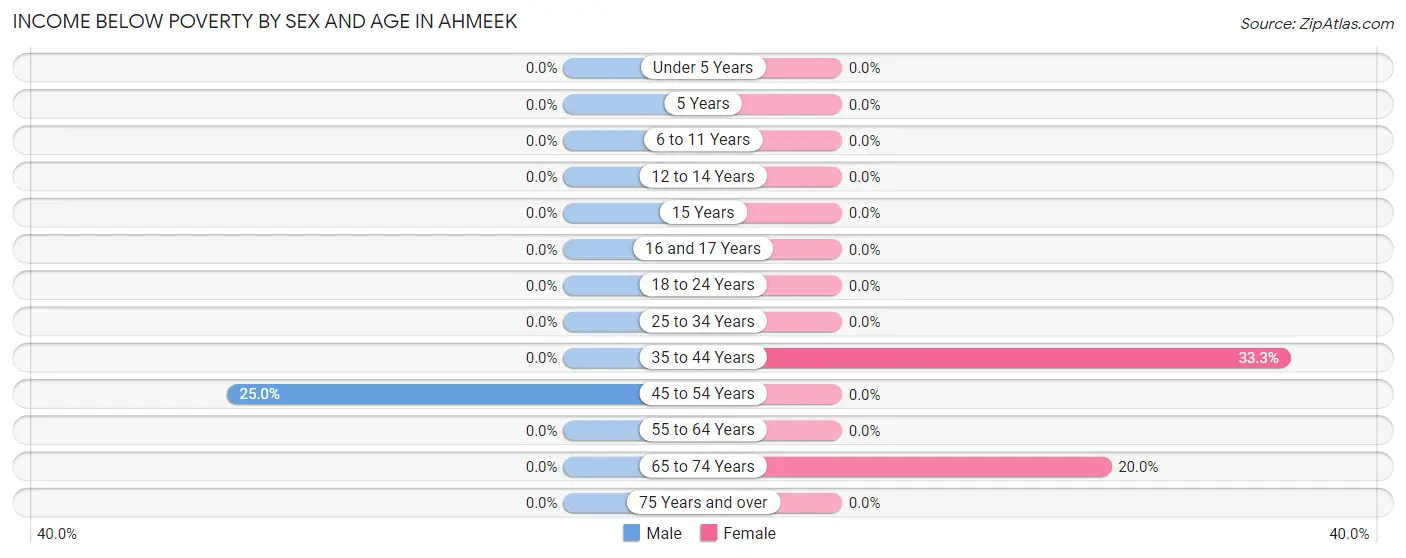
| Age Bracket | Male | Female |
| Under 5 Years | 0 (0.0%) | 0 (0.0%) |
| 5 Years | 0 (0.0%) | 0 (0.0%) |
| 6 to 11 Years | 0 (0.0%) | 0 (0.0%) |
| 12 to 14 Years | 0 (0.0%) | 0 (0.0%) |
| 15 Years | 0 (0.0%) | 0 (0.0%) |
| 16 and 17 Years | 0 (0.0%) | 0 (0.0%) |
| 18 to 24 Years | 0 (0.0%) | 0 (0.0%) |
| 25 to 34 Years | 0 (0.0%) | 0 (0.0%) |
| 35 to 44 Years | 0 (0.0%) | 2 (33.3%) |
| 45 to 54 Years | 2 (25.0%) | 0 (0.0%) |
| 55 to 64 Years | 0 (0.0%) | 0 (0.0%) |
| 65 to 74 Years | 0 (0.0%) | 1 (20.0%) |
| 75 Years and over | 0 (0.0%) | 0 (0.0%) |
| Total | 2 (4.6%) | 3 (6.8%) |
Income Above Poverty by Sex and Age in Ahmeek
According to the poverty statistics in Ahmeek, males aged 12 to 14 years and females aged 5 years are the age groups that are most secure financially, with 100.0% of males and 100.0% of females in these age groups living above the poverty line.
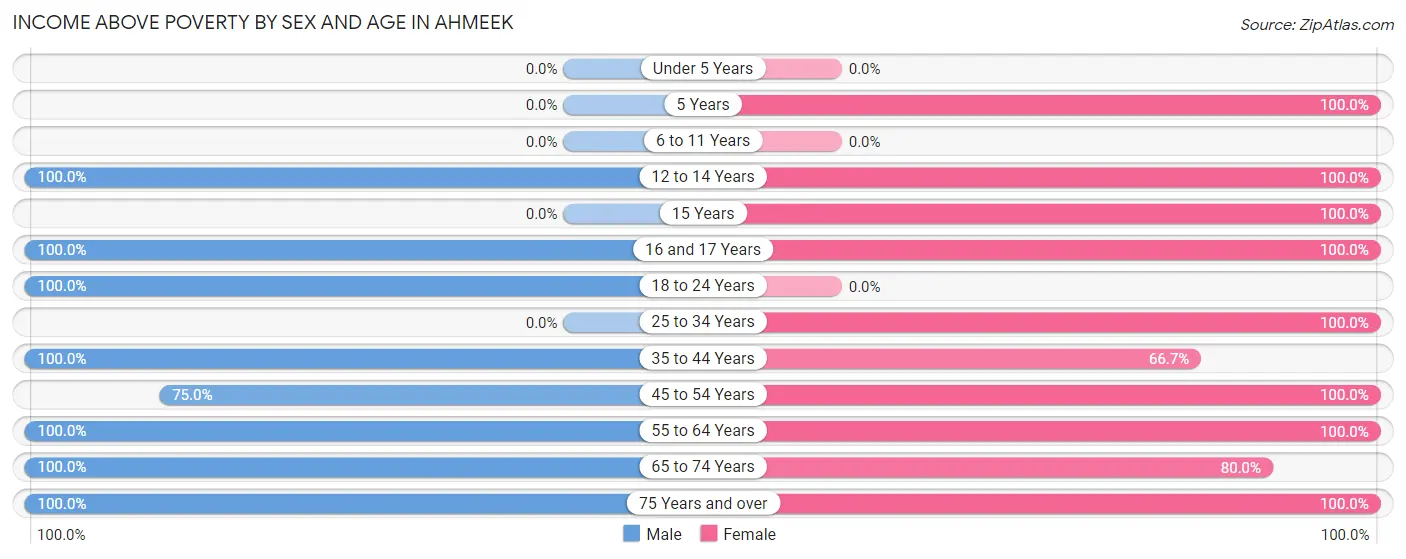
| Age Bracket | Male | Female |
| Under 5 Years | 0 (0.0%) | 0 (0.0%) |
| 5 Years | 0 (0.0%) | 1 (100.0%) |
| 6 to 11 Years | 0 (0.0%) | 0 (0.0%) |
| 12 to 14 Years | 2 (100.0%) | 4 (100.0%) |
| 15 Years | 0 (0.0%) | 4 (100.0%) |
| 16 and 17 Years | 4 (100.0%) | 3 (100.0%) |
| 18 to 24 Years | 3 (100.0%) | 0 (0.0%) |
| 25 to 34 Years | 0 (0.0%) | 6 (100.0%) |
| 35 to 44 Years | 7 (100.0%) | 4 (66.7%) |
| 45 to 54 Years | 6 (75.0%) | 8 (100.0%) |
| 55 to 64 Years | 11 (100.0%) | 4 (100.0%) |
| 65 to 74 Years | 6 (100.0%) | 4 (80.0%) |
| 75 Years and over | 2 (100.0%) | 3 (100.0%) |
| Total | 41 (95.4%) | 41 (93.2%) |
Income Below Poverty Among Married-Couple Families in Ahmeek
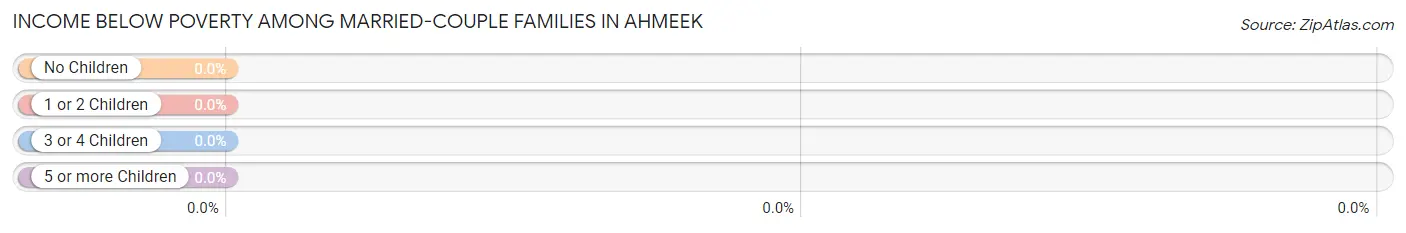
| Children | Above Poverty | Below Poverty |
| No Children | 20 (100.0%) | 0 (0.0%) |
| 1 or 2 Children | 1 (100.0%) | 0 (0.0%) |
| 3 or 4 Children | 4 (100.0%) | 0 (0.0%) |
| 5 or more Children | 0 (0.0%) | 0 (0.0%) |
| Total | 25 (100.0%) | 0 (0.0%) |
Income Below Poverty Among Single-Parent Households in Ahmeek
| Children | Single Father | Single Mother |
| No Children | 0 (0.0%) | 0 (0.0%) |
| 1 or 2 Children | 0 (0.0%) | 0 (0.0%) |
| 3 or 4 Children | 0 (0.0%) | 0 (0.0%) |
| 5 or more Children | 0 (0.0%) | 0 (0.0%) |
| Total | 0 (0.0%) | 0 (0.0%) |
Income Below Poverty Among Married-Couple vs Single-Parent Households in Ahmeek
| Children | Married-Couple Families | Single-Parent Households |
| No Children | 0 (0.0%) | 0 (0.0%) |
| 1 or 2 Children | 0 (0.0%) | 0 (0.0%) |
| 3 or 4 Children | 0 (0.0%) | 0 (0.0%) |
| 5 or more Children | 0 (0.0%) | 0 (0.0%) |
| Total | 0 (0.0%) | 0 (0.0%) |
Race in Ahmeek
The most populous races in Ahmeek are White / Caucasian (87 | 100.0%), and Hispanic or Latino (8 | 9.2%).
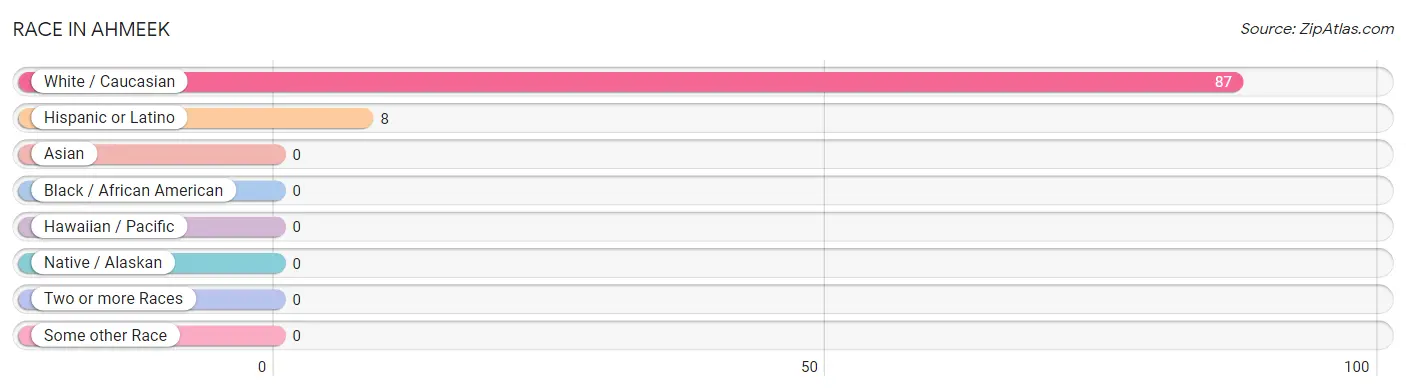
| Race | # Population | % Population |
| Asian | 0 | 0.0% |
| Black / African American | 0 | 0.0% |
| Hawaiian / Pacific | 0 | 0.0% |
| Hispanic or Latino | 8 | 9.2% |
| Native / Alaskan | 0 | 0.0% |
| White / Caucasian | 87 | 100.0% |
| Two or more Races | 0 | 0.0% |
| Some other Race | 0 | 0.0% |
| Total | 87 | 100.0% |
Ancestry in Ahmeek
The most populous ancestries reported in Ahmeek are Finnish (25 | 28.7%), Italian (22 | 25.3%), French (21 | 24.1%), British (13 | 14.9%), and English (10 | 11.5%), together accounting for 104.6% of all Ahmeek residents.
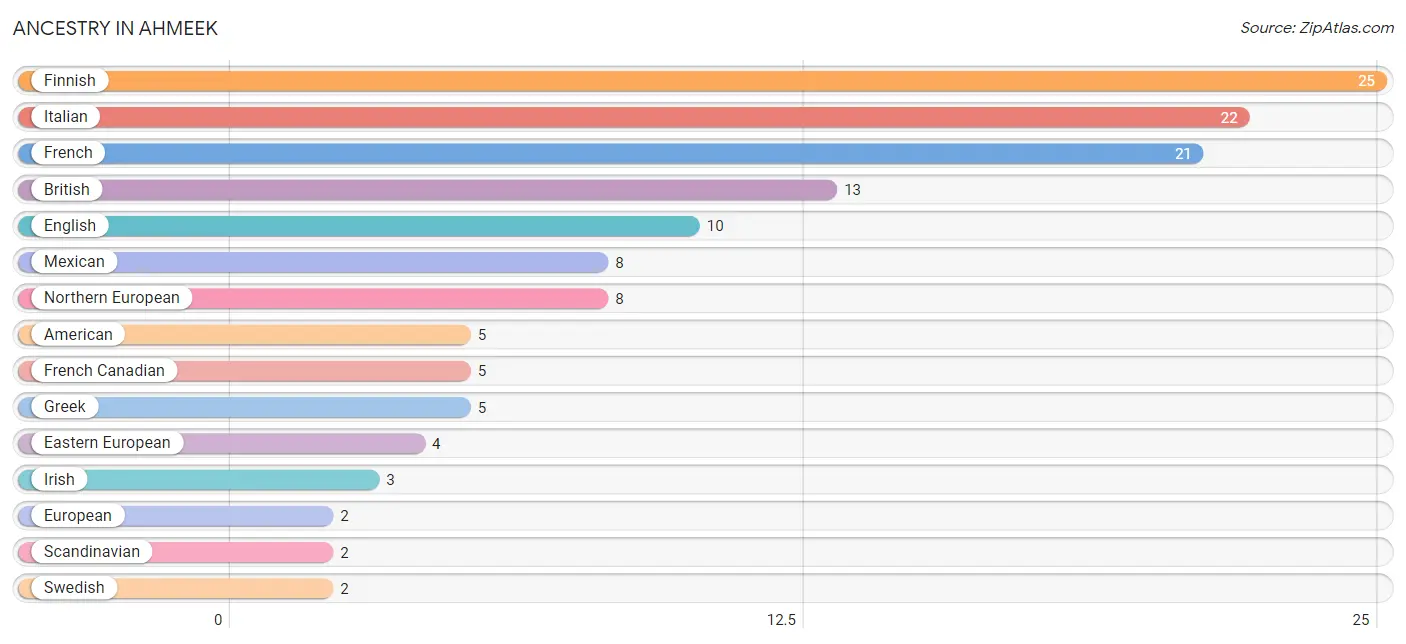
| Ancestry | # Population | % Population |
| American | 5 | 5.8% |
| British | 13 | 14.9% |
| Croatian | 1 | 1.1% |
| Eastern European | 4 | 4.6% |
| English | 10 | 11.5% |
| European | 2 | 2.3% |
| Finnish | 25 | 28.7% |
| French | 21 | 24.1% |
| French Canadian | 5 | 5.8% |
| German | 1 | 1.1% |
| Greek | 5 | 5.8% |
| Irish | 3 | 3.5% |
| Italian | 22 | 25.3% |
| Mexican | 8 | 9.2% |
| Northern European | 8 | 9.2% |
| Polish | 1 | 1.1% |
| Scandinavian | 2 | 2.3% |
| Swedish | 2 | 2.3% | View All 18 Rows |
Immigrants in Ahmeek
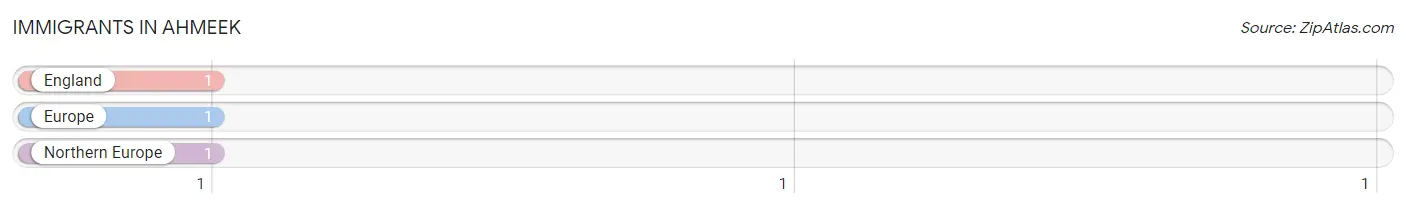
The most numerous immigrant groups reported in Ahmeek came from England (1 | 1.1%), Europe (1 | 1.1%), and Northern Europe (1 | 1.1%), together accounting for 3.5% of all Ahmeek residents.
| Immigration Origin | # Population | % Population |
| England | 1 | 1.1% |
| Europe | 1 | 1.1% |
| Northern Europe | 1 | 1.1% | View All 3 Rows |
Sex and Age in Ahmeek
Sex and Age in Ahmeek
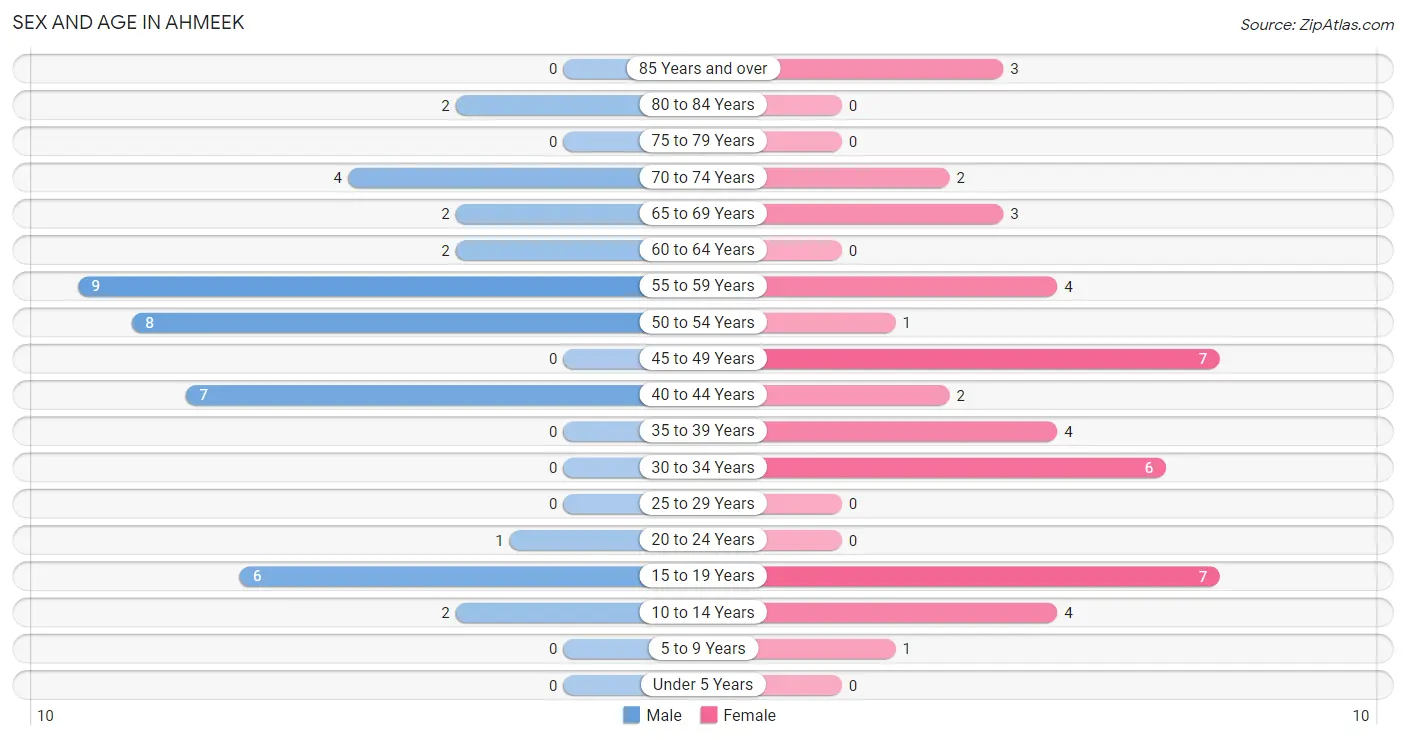
The most populous age groups in Ahmeek are 55 to 59 Years (9 | 20.9%) for men and 15 to 19 Years (7 | 15.9%) for women.
| Age Bracket | Male | Female |
| Under 5 Years | 0 (0.0%) | 0 (0.0%) |
| 5 to 9 Years | 0 (0.0%) | 1 (2.3%) |
| 10 to 14 Years | 2 (4.6%) | 4 (9.1%) |
| 15 to 19 Years | 6 (14.0%) | 7 (15.9%) |
| 20 to 24 Years | 1 (2.3%) | 0 (0.0%) |
| 25 to 29 Years | 0 (0.0%) | 0 (0.0%) |
| 30 to 34 Years | 0 (0.0%) | 6 (13.6%) |
| 35 to 39 Years | 0 (0.0%) | 4 (9.1%) |
| 40 to 44 Years | 7 (16.3%) | 2 (4.5%) |
| 45 to 49 Years | 0 (0.0%) | 7 (15.9%) |
| 50 to 54 Years | 8 (18.6%) | 1 (2.3%) |
| 55 to 59 Years | 9 (20.9%) | 4 (9.1%) |
| 60 to 64 Years | 2 (4.6%) | 0 (0.0%) |
| 65 to 69 Years | 2 (4.6%) | 3 (6.8%) |
| 70 to 74 Years | 4 (9.3%) | 2 (4.5%) |
| 75 to 79 Years | 0 (0.0%) | 0 (0.0%) |
| 80 to 84 Years | 2 (4.6%) | 0 (0.0%) |
| 85 Years and over | 0 (0.0%) | 3 (6.8%) |
| Total | 43 (100.0%) | 44 (100.0%) |
Families and Households in Ahmeek
Median Family Size in Ahmeek
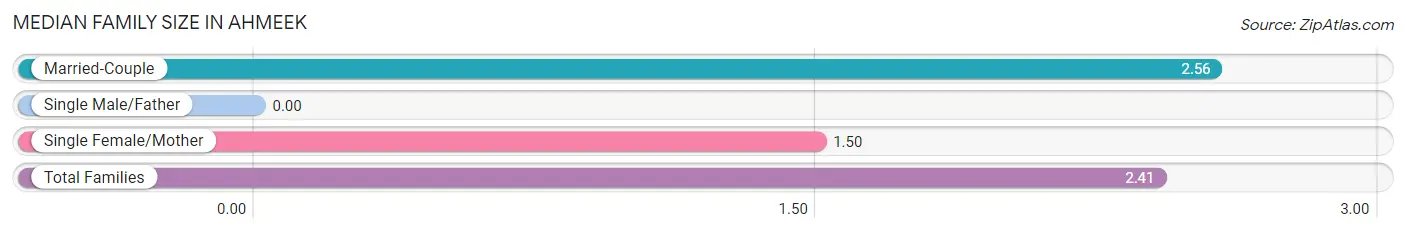
| Family Type | # Families | Family Size |
| Married-Couple | 25 (86.2%) | 2.56 |
| Single Male/Father | 0 (0.0%) | - |
| Single Female/Mother | 4 (13.8%) | 1.50 |
| Total Families | 29 (100.0%) | 2.41 |
Median Household Size in Ahmeek
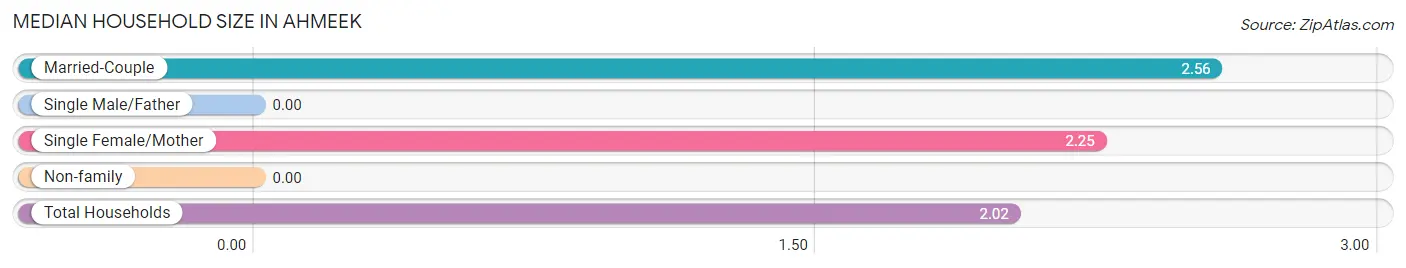
| Household Type | # Households | Household Size |
| Married-Couple | 25 (58.1%) | 2.56 |
| Single Male/Father | 0 (0.0%) | - |
| Single Female/Mother | 4 (9.3%) | 2.25 |
| Non-family | 14 (32.6%) | - |
| Total Households | 43 (100.0%) | 2.02 |
Household Size by Marriage Status in Ahmeek
Out of a total of 43 households in Ahmeek, 29 (67.4%) are family households, while 14 (32.6%) are nonfamily households. The most numerous type of family households are 2-person households, comprising 21, and the most common type of nonfamily households are 1-person households, comprising 14.
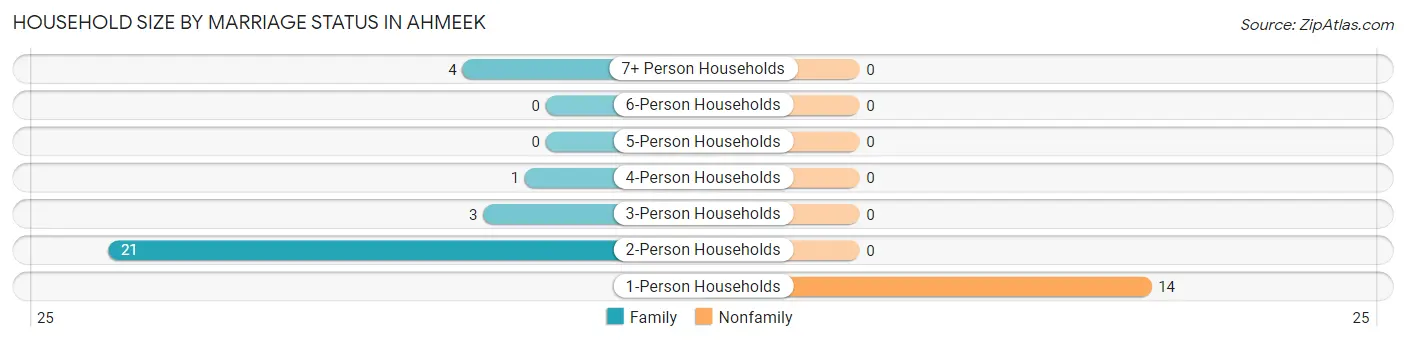
| Household Size | Family Households | Nonfamily Households |
| 1-Person Households | - | 14 (32.6%) |
| 2-Person Households | 21 (48.8%) | 0 (0.0%) |
| 3-Person Households | 3 (7.0%) | 0 (0.0%) |
| 4-Person Households | 1 (2.3%) | 0 (0.0%) |
| 5-Person Households | 0 (0.0%) | 0 (0.0%) |
| 6-Person Households | 0 (0.0%) | 0 (0.0%) |
| 7+ Person Households | 4 (9.3%) | 0 (0.0%) |
| Total | 29 (67.4%) | 14 (32.6%) |
Female Fertility in Ahmeek
Fertility by Age in Ahmeek
| Age Bracket | Women with Births | Births / 1,000 Women |
| 15 to 19 years | 0 (0.0%) | 0.0 |
| 20 to 34 years | 0 (0.0%) | 0.0 |
| 35 to 50 years | 0 (0.0%) | 0.0 |
| Total | 0 (0.0%) | 0.0 |
Fertility by Age by Marriage Status in Ahmeek
| Age Bracket | Married | Unmarried |
| 15 to 19 years | 0 (0.0%) | 0 (0.0%) |
| 20 to 34 years | 0 (0.0%) | 0 (0.0%) |
| 35 to 50 years | 0 (0.0%) | 0 (0.0%) |
| Total | 0 (0.0%) | 0 (0.0%) |
Fertility by Education in Ahmeek
| Educational Attainment | Women with Births | Births / 1,000 Women |
| Less than High School | 0 (0.0%) | 0.0 |
| High School Diploma | 0 (0.0%) | 0.0 |
| College or Associate's Degree | 0 (0.0%) | 0.0 |
| Bachelor's Degree | 0 (0.0%) | 0.0 |
| Graduate Degree | 0 (0.0%) | 0.0 |
| Total | 0 (0.0%) | 0.0 |
Fertility by Education by Marriage Status in Ahmeek
| Educational Attainment | Married | Unmarried |
| Less than High School | 0 (0.0%) | 0 (0.0%) |
| High School Diploma | 0 (0.0%) | 0 (0.0%) |
| College or Associate's Degree | 0 (0.0%) | 0 (0.0%) |
| Bachelor's Degree | 0 (0.0%) | 0 (0.0%) |
| Graduate Degree | 0 (0.0%) | 0 (0.0%) |
| Total | 0 (0.0%) | 0 (0.0%) |
Employment Characteristics in Ahmeek
Employment by Class of Employer in Ahmeek
Among the 44 employed individuals in Ahmeek, private company employees (26 | 59.1%), local government employees (16 | 36.4%), and not-for-profit organizations (2 | 4.5%) make up the most common classes of employment.
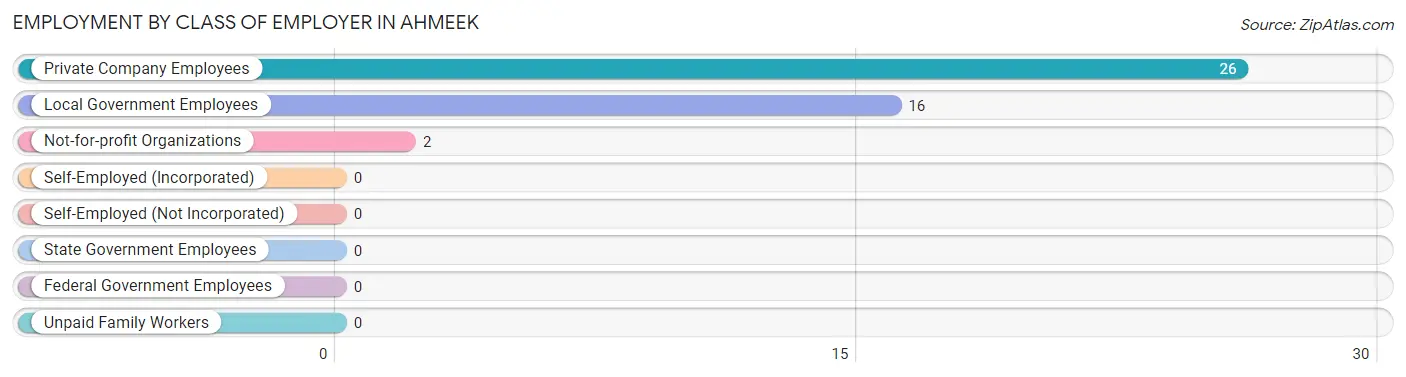
| Employer Class | # Employees | % Employees |
| Private Company Employees | 26 | 59.1% |
| Self-Employed (Incorporated) | 0 | 0.0% |
| Self-Employed (Not Incorporated) | 0 | 0.0% |
| Not-for-profit Organizations | 2 | 4.5% |
| Local Government Employees | 16 | 36.4% |
| State Government Employees | 0 | 0.0% |
| Federal Government Employees | 0 | 0.0% |
| Unpaid Family Workers | 0 | 0.0% |
| Total | 44 | 100.0% |
Employment Status by Age in Ahmeek
According to the labor force statistics for Ahmeek, out of the total population over 16 years of age (76), 60.5% or 46 individuals are in the labor force, with 4.3% or 2 of them unemployed. The age group with the highest labor force participation rate is 20 to 24 years, with 100.0% or 1 individuals in the labor force. Within the labor force, the 35 to 44 years age range has the highest percentage of unemployed individuals, with 15.4% or 2 of them being unemployed.
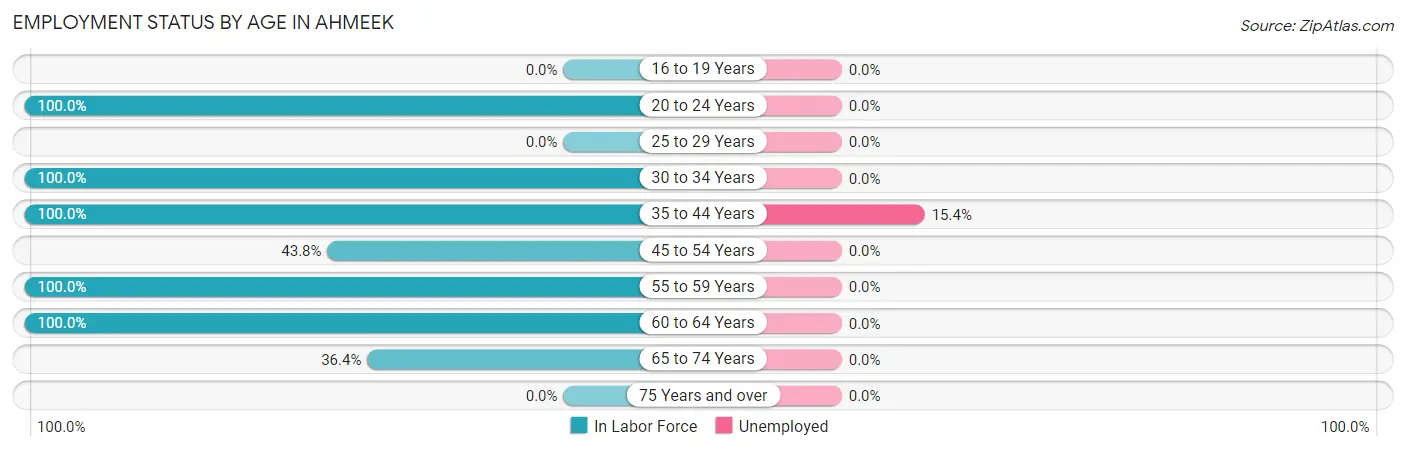
| Age Bracket | In Labor Force | Unemployed |
| 16 to 19 Years | 0 (0.0%) | 0 (0.0%) |
| 20 to 24 Years | 1 (100.0%) | 0 (0.0%) |
| 25 to 29 Years | 0 (0.0%) | 0 (0.0%) |
| 30 to 34 Years | 6 (100.0%) | 0 (0.0%) |
| 35 to 44 Years | 13 (100.0%) | 2 (15.4%) |
| 45 to 54 Years | 7 (43.8%) | 0 (0.0%) |
| 55 to 59 Years | 13 (100.0%) | 0 (0.0%) |
| 60 to 64 Years | 2 (100.0%) | 0 (0.0%) |
| 65 to 74 Years | 4 (36.4%) | 0 (0.0%) |
| 75 Years and over | 0 (0.0%) | 0 (0.0%) |
| Total | 46 (60.5%) | 2 (4.3%) |
Employment Status by Educational Attainment in Ahmeek
According to labor force statistics for Ahmeek, 82.0% of individuals (41) out of the total population between 25 and 64 years of age (50) are in the labor force, with 4.9% or 2 of them being unemployed. The group with the highest labor force participation rate are those with the educational attainment of less than high school, with 100.0% or 3 individuals in the labor force. Within the labor force, individuals with high school diploma education have the highest percentage of unemployment, with 9.5% or 2 of them being unemployed.
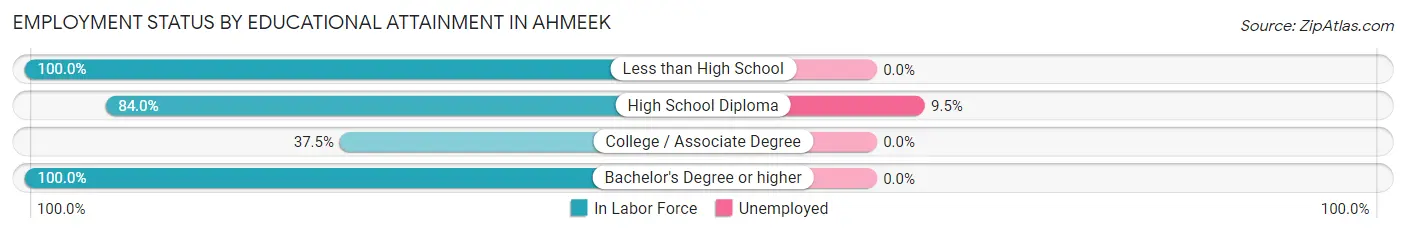
| Educational Attainment | In Labor Force | Unemployed |
| Less than High School | 3 (100.0%) | 0 (0.0%) |
| High School Diploma | 21 (84.0%) | 2 (9.5%) |
| College / Associate Degree | 3 (37.5%) | 0 (0.0%) |
| Bachelor's Degree or higher | 14 (100.0%) | 0 (0.0%) |
| Total | 41 (82.0%) | 2 (4.9%) |
Employment Occupations by Sex in Ahmeek
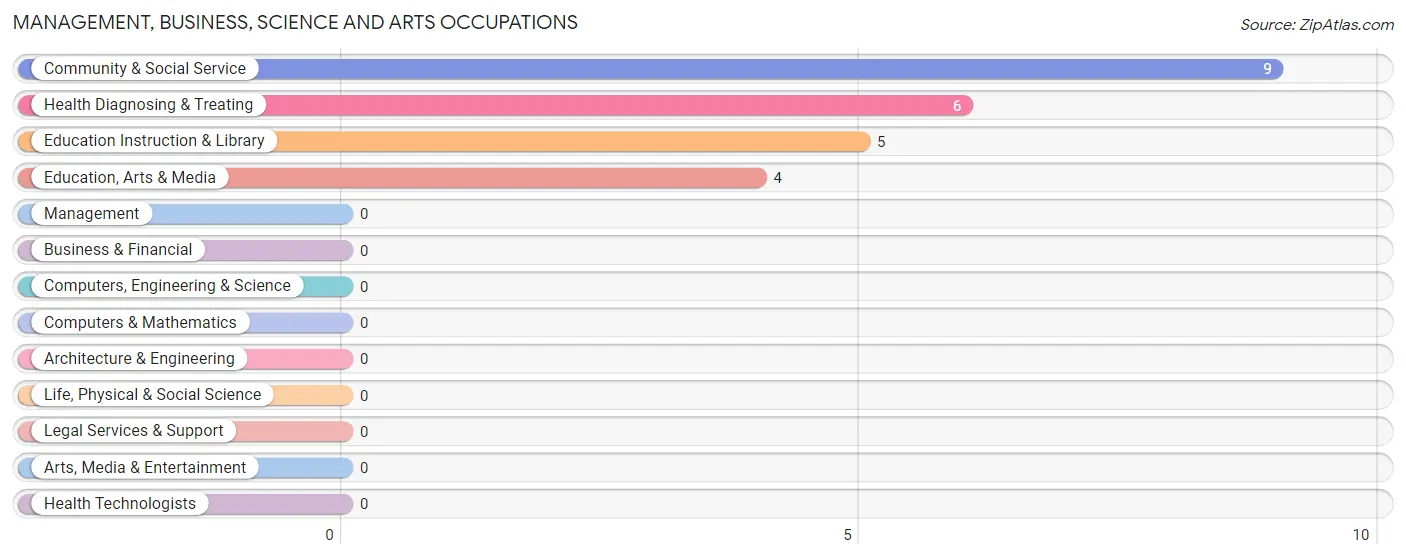
Management, Business, Science and Arts Occupations
The most common Management, Business, Science and Arts occupations in Ahmeek are Community & Social Service (9 | 20.4%), Health Diagnosing & Treating (6 | 13.6%), Education Instruction & Library (5 | 11.4%), and Education, Arts & Media (4 | 9.1%).
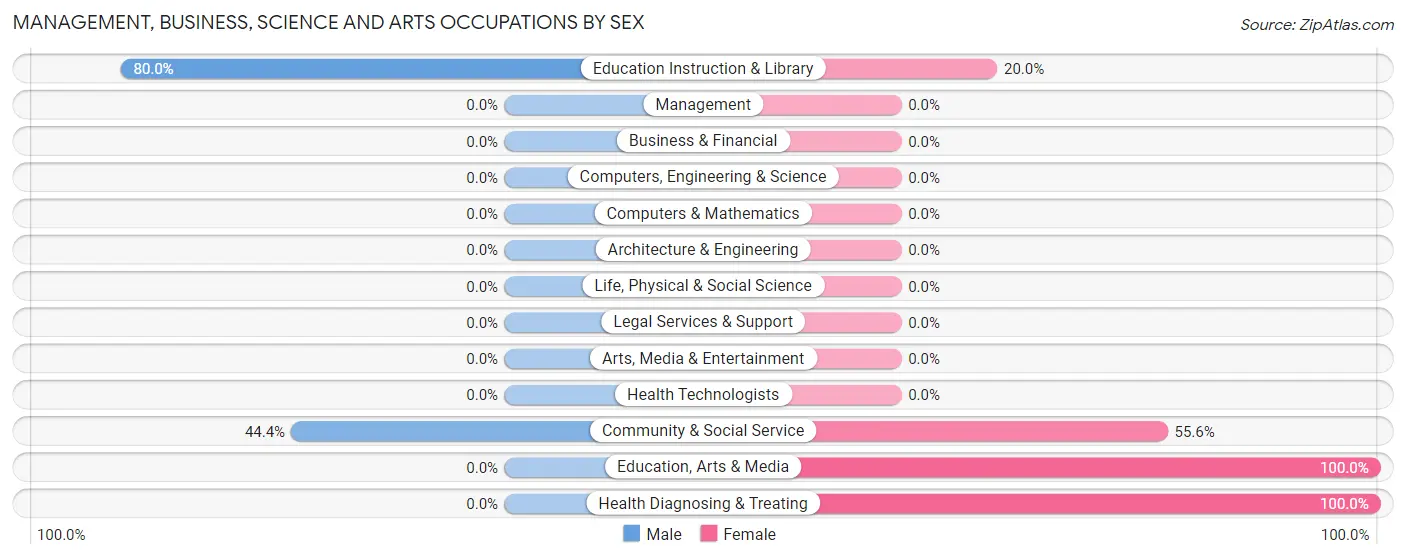
Management, Business, Science and Arts Occupations by Sex
Within the Management, Business, Science and Arts occupations in Ahmeek, the most male-oriented occupations are Education Instruction & Library (80.0%), and Community & Social Service (44.4%), while the most female-oriented occupations are Education, Arts & Media (100.0%), Health Diagnosing & Treating (100.0%), and Community & Social Service (55.6%).
| Occupation | Male | Female |
| Management | 0 (0.0%) | 0 (0.0%) |
| Business & Financial | 0 (0.0%) | 0 (0.0%) |
| Computers, Engineering & Science | 0 (0.0%) | 0 (0.0%) |
| Computers & Mathematics | 0 (0.0%) | 0 (0.0%) |
| Architecture & Engineering | 0 (0.0%) | 0 (0.0%) |
| Life, Physical & Social Science | 0 (0.0%) | 0 (0.0%) |
| Community & Social Service | 4 (44.4%) | 5 (55.6%) |
| Education, Arts & Media | 0 (0.0%) | 4 (100.0%) |
| Legal Services & Support | 0 (0.0%) | 0 (0.0%) |
| Education Instruction & Library | 4 (80.0%) | 1 (20.0%) |
| Arts, Media & Entertainment | 0 (0.0%) | 0 (0.0%) |
| Health Diagnosing & Treating | 0 (0.0%) | 6 (100.0%) |
| Health Technologists | 0 (0.0%) | 0 (0.0%) |
| Total (Category) | 4 (26.7%) | 11 (73.3%) |
| Total (Overall) | 27 (61.4%) | 17 (38.6%) |
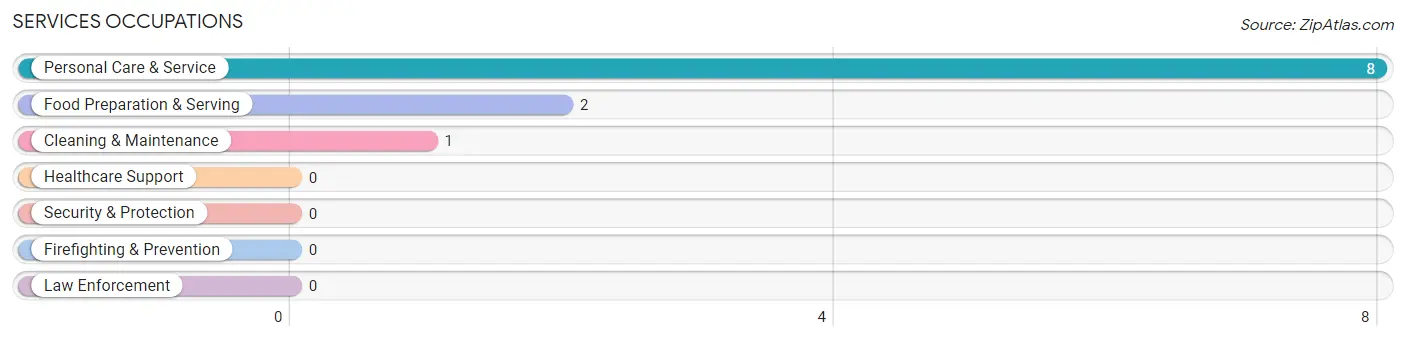
Services Occupations
The most common Services occupations in Ahmeek are Personal Care & Service (8 | 18.2%), Food Preparation & Serving (2 | 4.5%), and Cleaning & Maintenance (1 | 2.3%).
Services Occupations by Sex
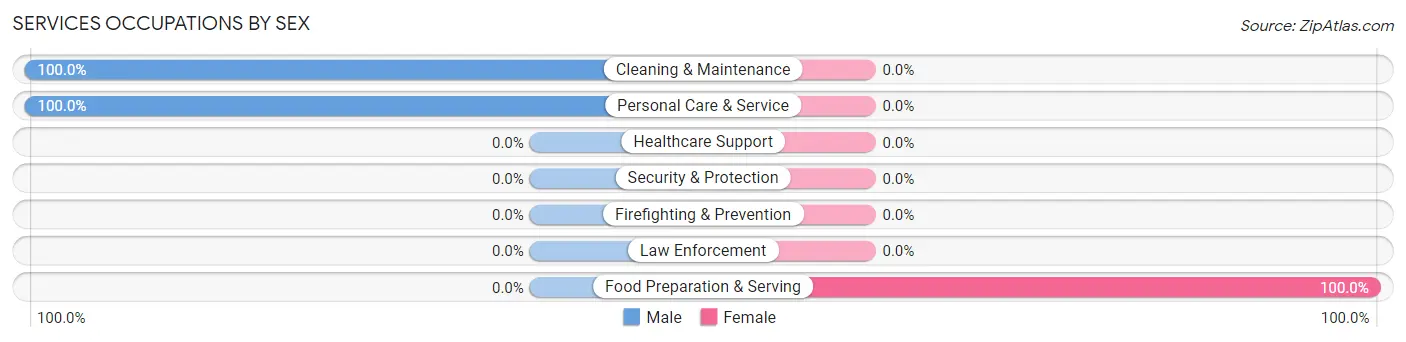
| Occupation | Male | Female |
| Healthcare Support | 0 (0.0%) | 0 (0.0%) |
| Security & Protection | 0 (0.0%) | 0 (0.0%) |
| Firefighting & Prevention | 0 (0.0%) | 0 (0.0%) |
| Law Enforcement | 0 (0.0%) | 0 (0.0%) |
| Food Preparation & Serving | 0 (0.0%) | 2 (100.0%) |
| Cleaning & Maintenance | 1 (100.0%) | 0 (0.0%) |
| Personal Care & Service | 8 (100.0%) | 0 (0.0%) |
| Total (Category) | 9 (81.8%) | 2 (18.2%) |
| Total (Overall) | 27 (61.4%) | 17 (38.6%) |
Sales and Office Occupations
The most common Sales and Office occupations in Ahmeek are Office & Administration (3 | 6.8%), and Sales & Related (1 | 2.3%).
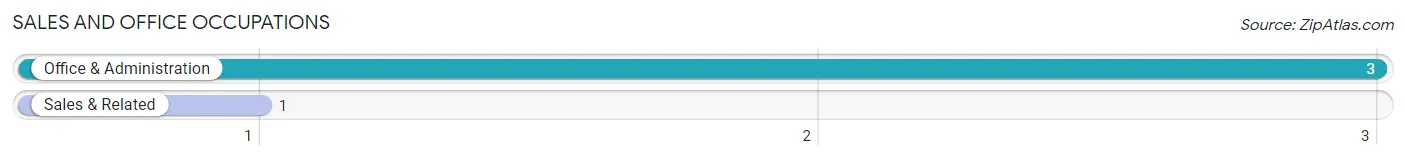
Sales and Office Occupations by Sex
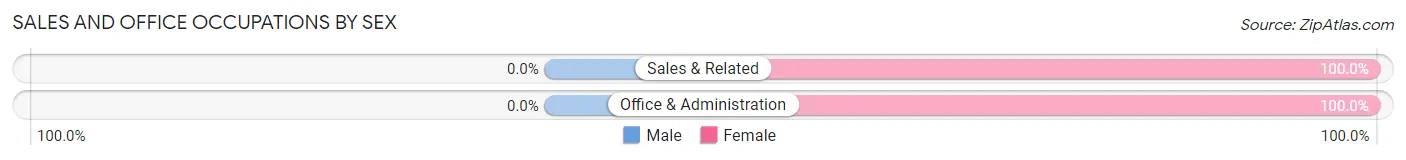
| Occupation | Male | Female |
| Sales & Related | 0 (0.0%) | 1 (100.0%) |
| Office & Administration | 0 (0.0%) | 3 (100.0%) |
| Total (Category) | 0 (0.0%) | 4 (100.0%) |
| Total (Overall) | 27 (61.4%) | 17 (38.6%) |
Natural Resources, Construction and Maintenance Occupations
The most common Natural Resources, Construction and Maintenance occupations in Ahmeek are , and Construction & Extraction (9 | 20.4%).
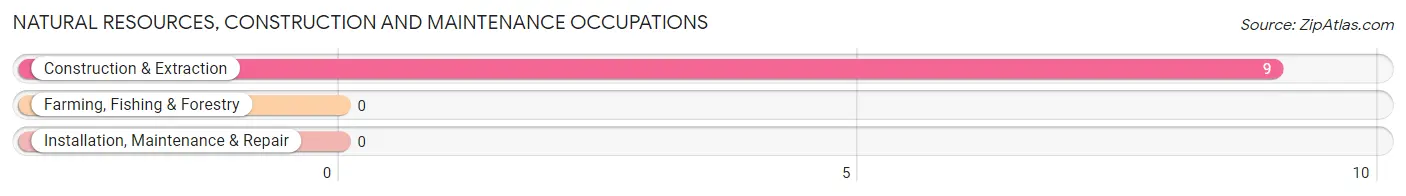
Natural Resources, Construction and Maintenance Occupations by Sex
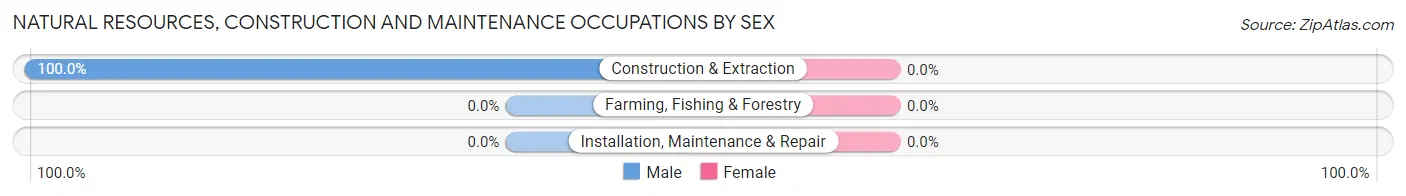
| Occupation | Male | Female |
| Farming, Fishing & Forestry | 0 (0.0%) | 0 (0.0%) |
| Construction & Extraction | 9 (100.0%) | 0 (0.0%) |
| Installation, Maintenance & Repair | 0 (0.0%) | 0 (0.0%) |
| Total (Category) | 9 (100.0%) | 0 (0.0%) |
| Total (Overall) | 27 (61.4%) | 17 (38.6%) |
Production, Transportation and Moving Occupations
The most common Production, Transportation and Moving occupations in Ahmeek are , and Production (5 | 11.4%).
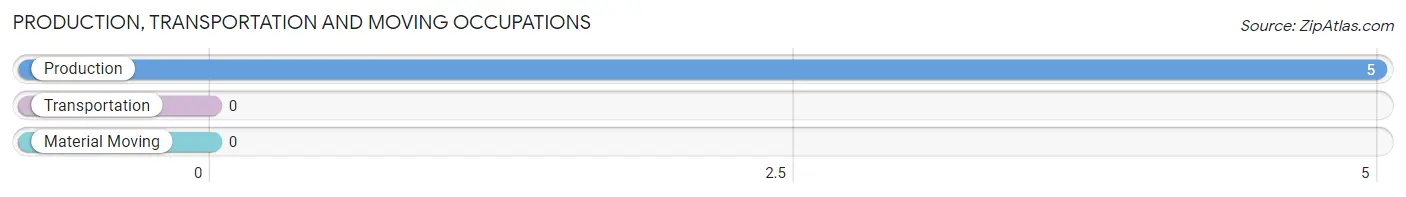
Production, Transportation and Moving Occupations by Sex
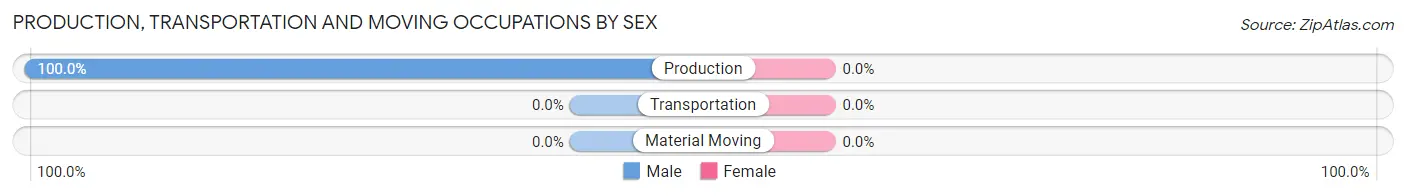
| Occupation | Male | Female |
| Production | 5 (100.0%) | 0 (0.0%) |
| Transportation | 0 (0.0%) | 0 (0.0%) |
| Material Moving | 0 (0.0%) | 0 (0.0%) |
| Total (Category) | 5 (100.0%) | 0 (0.0%) |
| Total (Overall) | 27 (61.4%) | 17 (38.6%) |
Employment Industries by Sex in Ahmeek
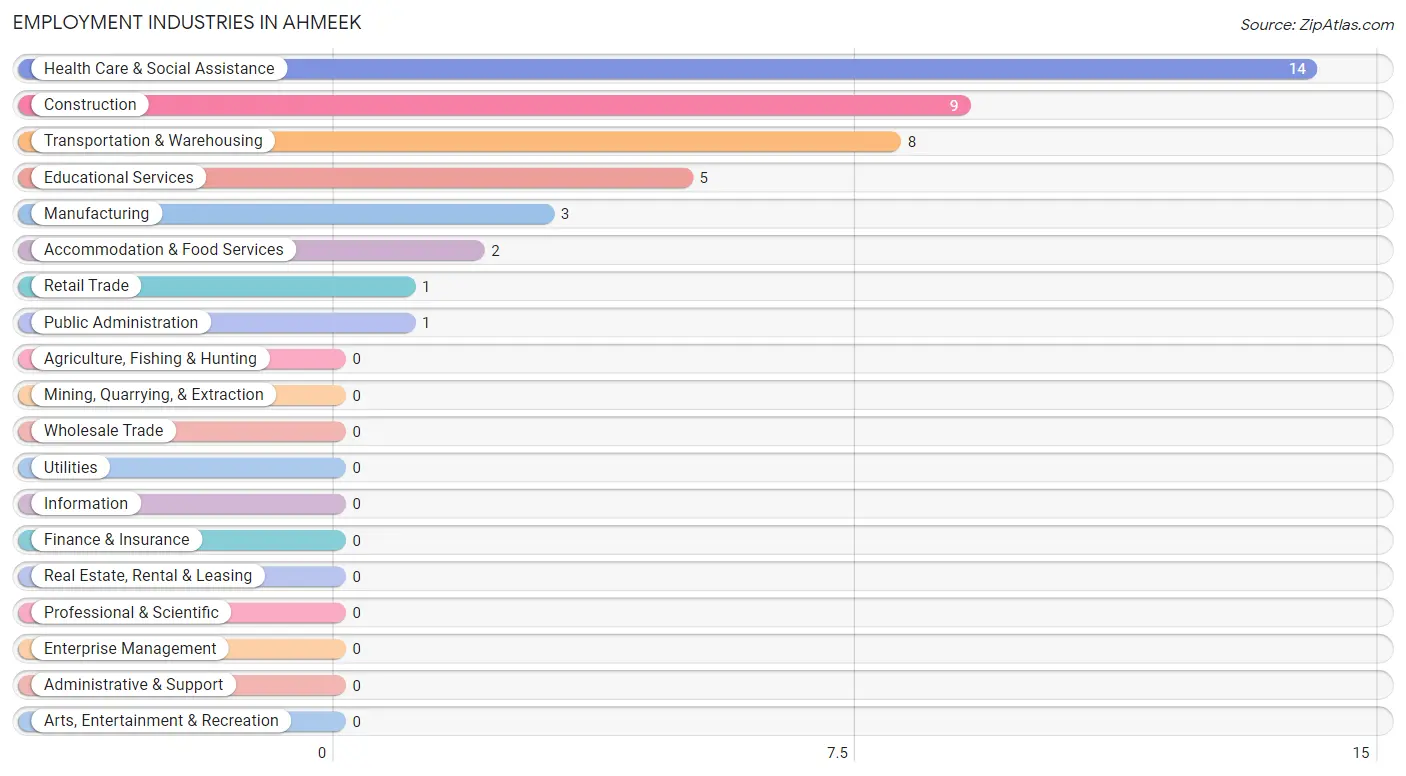
Employment Industries in Ahmeek
The major employment industries in Ahmeek include Health Care & Social Assistance (14 | 31.8%), Construction (9 | 20.4%), Transportation & Warehousing (8 | 18.2%), Educational Services (5 | 11.4%), and Manufacturing (3 | 6.8%).
Employment Industries by Sex in Ahmeek
The Ahmeek industries that see more men than women are Construction (100.0%), Manufacturing (100.0%), and Transportation & Warehousing (100.0%), whereas the industries that tend to have a higher number of women are Retail Trade (100.0%), Accommodation & Food Services (100.0%), and Health Care & Social Assistance (92.9%).
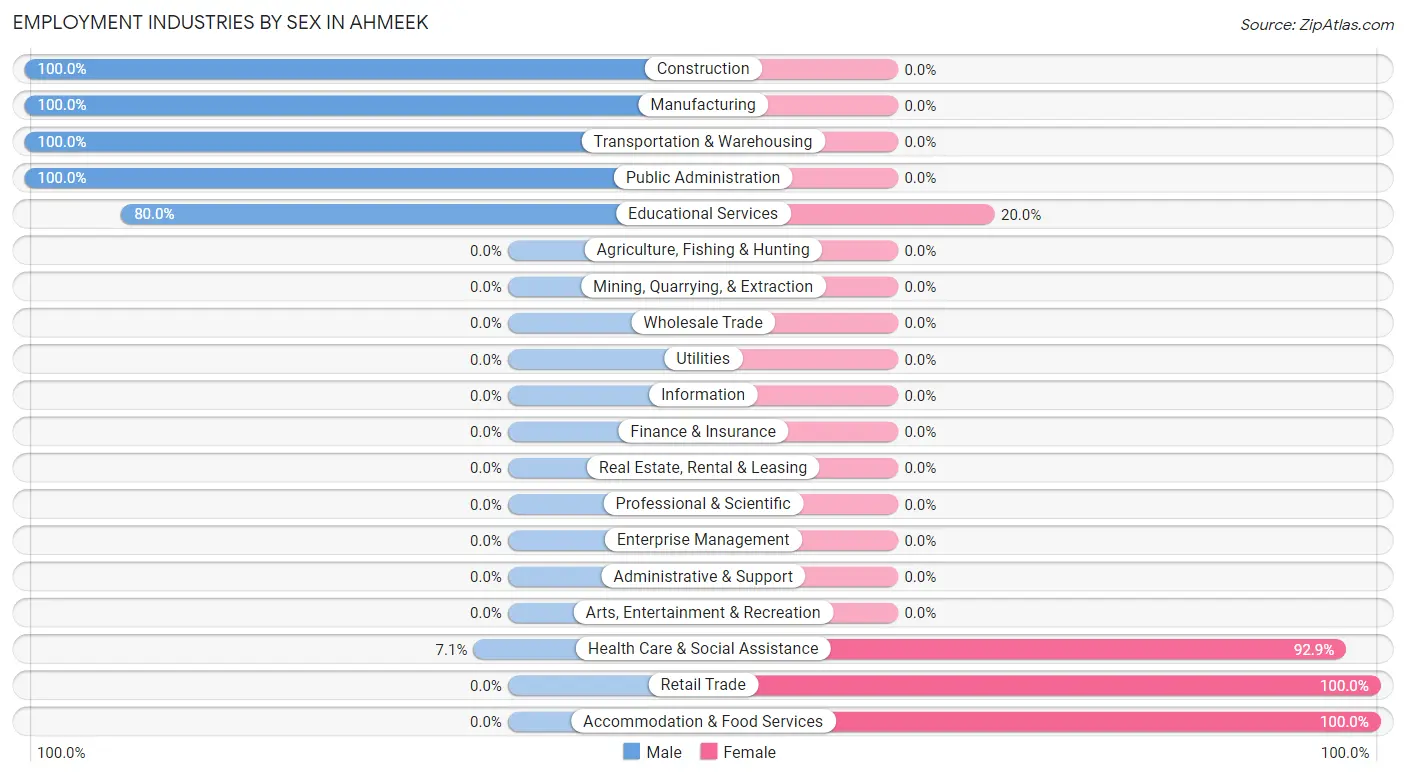
| Industry | Male | Female |
| Agriculture, Fishing & Hunting | 0 (0.0%) | 0 (0.0%) |
| Mining, Quarrying, & Extraction | 0 (0.0%) | 0 (0.0%) |
| Construction | 9 (100.0%) | 0 (0.0%) |
| Manufacturing | 3 (100.0%) | 0 (0.0%) |
| Wholesale Trade | 0 (0.0%) | 0 (0.0%) |
| Retail Trade | 0 (0.0%) | 1 (100.0%) |
| Transportation & Warehousing | 8 (100.0%) | 0 (0.0%) |
| Utilities | 0 (0.0%) | 0 (0.0%) |
| Information | 0 (0.0%) | 0 (0.0%) |
| Finance & Insurance | 0 (0.0%) | 0 (0.0%) |
| Real Estate, Rental & Leasing | 0 (0.0%) | 0 (0.0%) |
| Professional & Scientific | 0 (0.0%) | 0 (0.0%) |
| Enterprise Management | 0 (0.0%) | 0 (0.0%) |
| Administrative & Support | 0 (0.0%) | 0 (0.0%) |
| Educational Services | 4 (80.0%) | 1 (20.0%) |
| Health Care & Social Assistance | 1 (7.1%) | 13 (92.9%) |
| Arts, Entertainment & Recreation | 0 (0.0%) | 0 (0.0%) |
| Accommodation & Food Services | 0 (0.0%) | 2 (100.0%) |
| Public Administration | 1 (100.0%) | 0 (0.0%) |
| Total | 27 (61.4%) | 17 (38.6%) |
Education in Ahmeek
School Enrollment in Ahmeek
The most common levels of schooling among the 18 students in Ahmeek are high school (12 | 66.7%), middle school (5 | 27.8%), and kindergarten (1 | 5.6%).
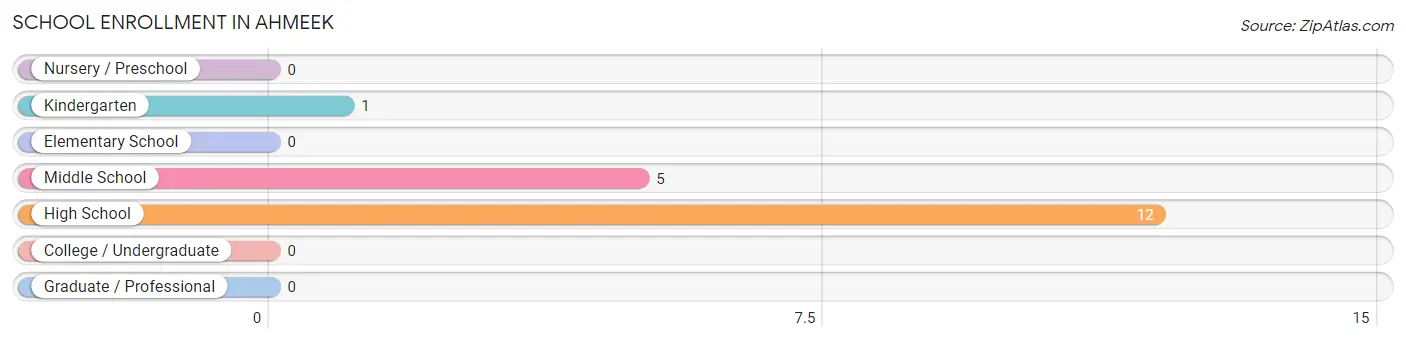
| School Level | # Students | % Students |
| Nursery / Preschool | 0 | 0.0% |
| Kindergarten | 1 | 5.6% |
| Elementary School | 0 | 0.0% |
| Middle School | 5 | 27.8% |
| High School | 12 | 66.7% |
| College / Undergraduate | 0 | 0.0% |
| Graduate / Professional | 0 | 0.0% |
| Total | 18 | 100.0% |
School Enrollment by Age by Funding Source in Ahmeek
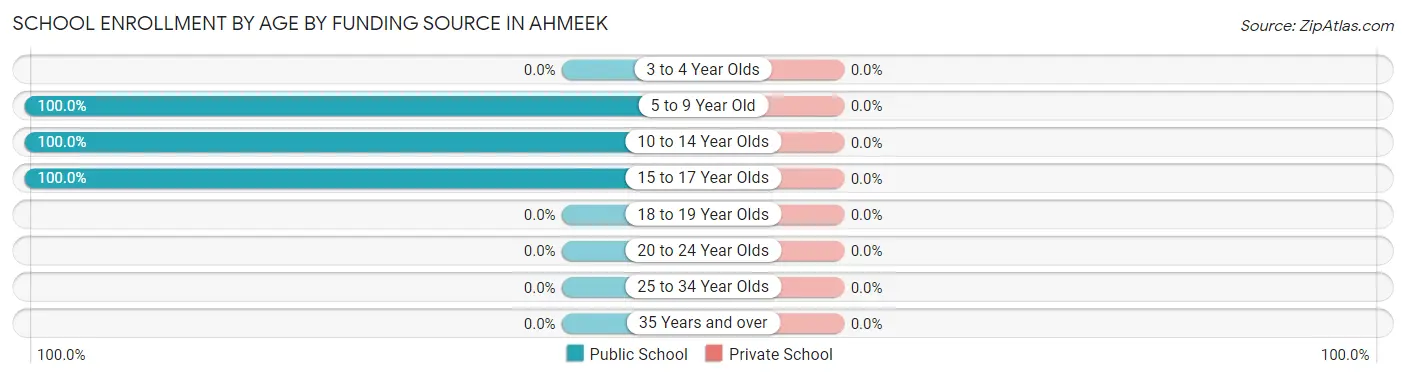
| Age Bracket | Public School | Private School |
| 3 to 4 Year Olds | 0 (0.0%) | 0 (0.0%) |
| 5 to 9 Year Old | 1 (100.0%) | 0 (0.0%) |
| 10 to 14 Year Olds | 6 (100.0%) | 0 (0.0%) |
| 15 to 17 Year Olds | 11 (100.0%) | 0 (0.0%) |
| 18 to 19 Year Olds | 0 (0.0%) | 0 (0.0%) |
| 20 to 24 Year Olds | 0 (0.0%) | 0 (0.0%) |
| 25 to 34 Year Olds | 0 (0.0%) | 0 (0.0%) |
| 35 Years and over | 0 (0.0%) | 0 (0.0%) |
| Total | 18 (100.0%) | 0 (0.0%) |
Educational Attainment by Field of Study in Ahmeek
Liberal arts & history (12 | 32.4%), communications (12 | 32.4%), literature & languages (8 | 21.6%), science & technology (2 | 5.4%), and bio, nature & agricultural (1 | 2.7%) are the most common fields of study among 37 individuals in Ahmeek who have obtained a bachelor's degree or higher.
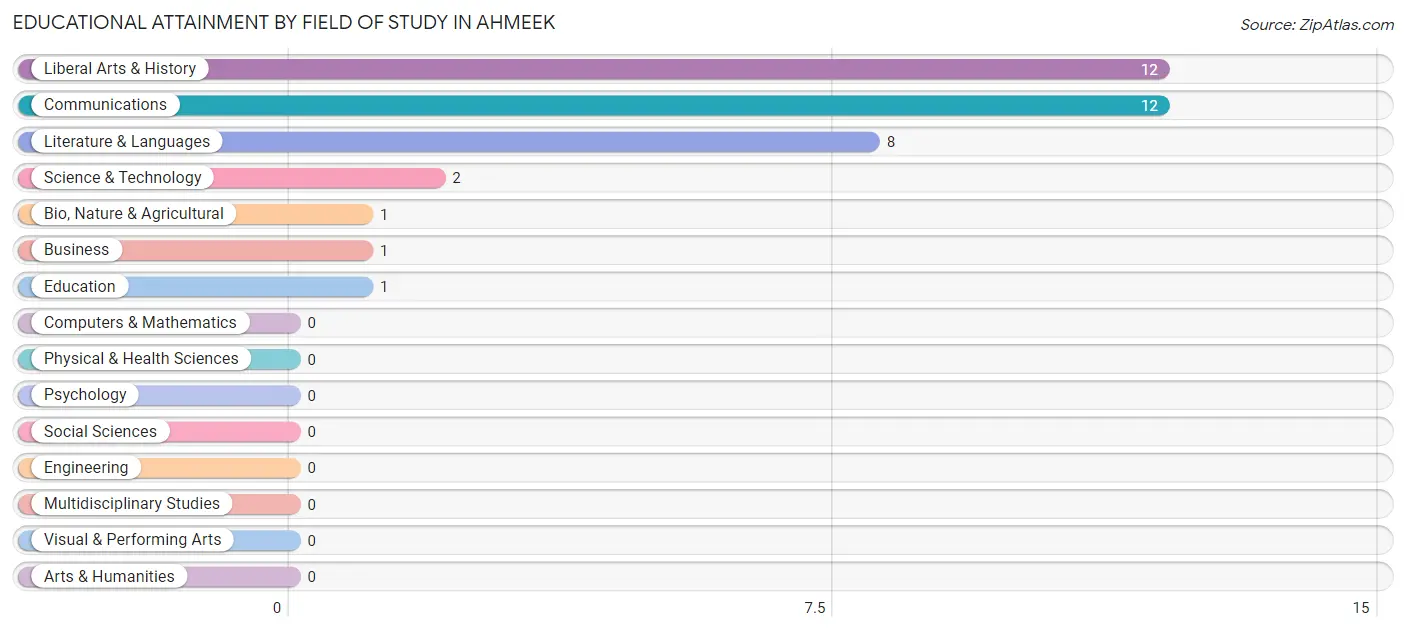
| Field of Study | # Graduates | % Graduates |
| Computers & Mathematics | 0 | 0.0% |
| Bio, Nature & Agricultural | 1 | 2.7% |
| Physical & Health Sciences | 0 | 0.0% |
| Psychology | 0 | 0.0% |
| Social Sciences | 0 | 0.0% |
| Engineering | 0 | 0.0% |
| Multidisciplinary Studies | 0 | 0.0% |
| Science & Technology | 2 | 5.4% |
| Business | 1 | 2.7% |
| Education | 1 | 2.7% |
| Literature & Languages | 8 | 21.6% |
| Liberal Arts & History | 12 | 32.4% |
| Visual & Performing Arts | 0 | 0.0% |
| Communications | 12 | 32.4% |
| Arts & Humanities | 0 | 0.0% |
| Total | 37 | 100.0% |
Transportation & Commute in Ahmeek
Vehicle Availability by Sex in Ahmeek
The most prevalent vehicle ownership categories in Ahmeek are males with 2 vehicles (22, accounting for 81.5%) and females with 2 vehicles (11, making up 129.4%).
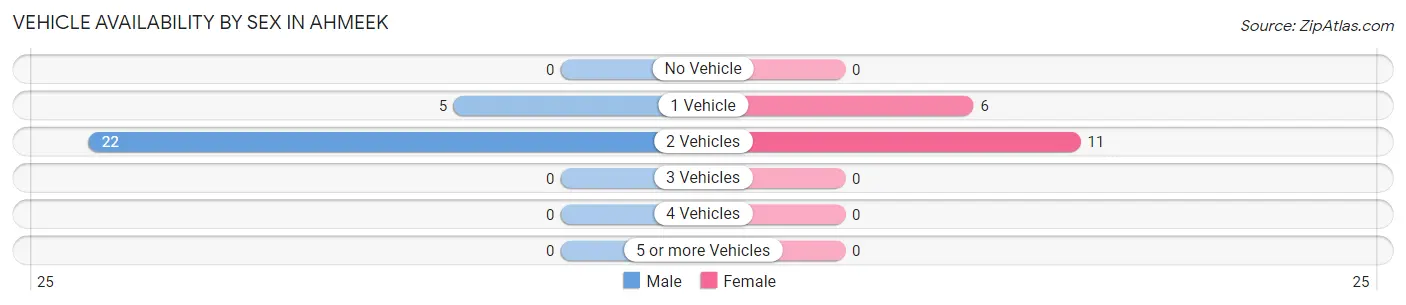
| Vehicles Available | Male | Female |
| No Vehicle | 0 (0.0%) | 0 (0.0%) |
| 1 Vehicle | 5 (18.5%) | 6 (35.3%) |
| 2 Vehicles | 22 (81.5%) | 11 (64.7%) |
| 3 Vehicles | 0 (0.0%) | 0 (0.0%) |
| 4 Vehicles | 0 (0.0%) | 0 (0.0%) |
| 5 or more Vehicles | 0 (0.0%) | 0 (0.0%) |
| Total | 27 (100.0%) | 17 (100.0%) |
Commute Time in Ahmeek
The most frequently occuring commute durations in Ahmeek are 5 to 9 minutes (12 commuters, 27.3%), 60 to 89 minutes (8 commuters, 18.2%), and 10 to 14 minutes (6 commuters, 13.6%).
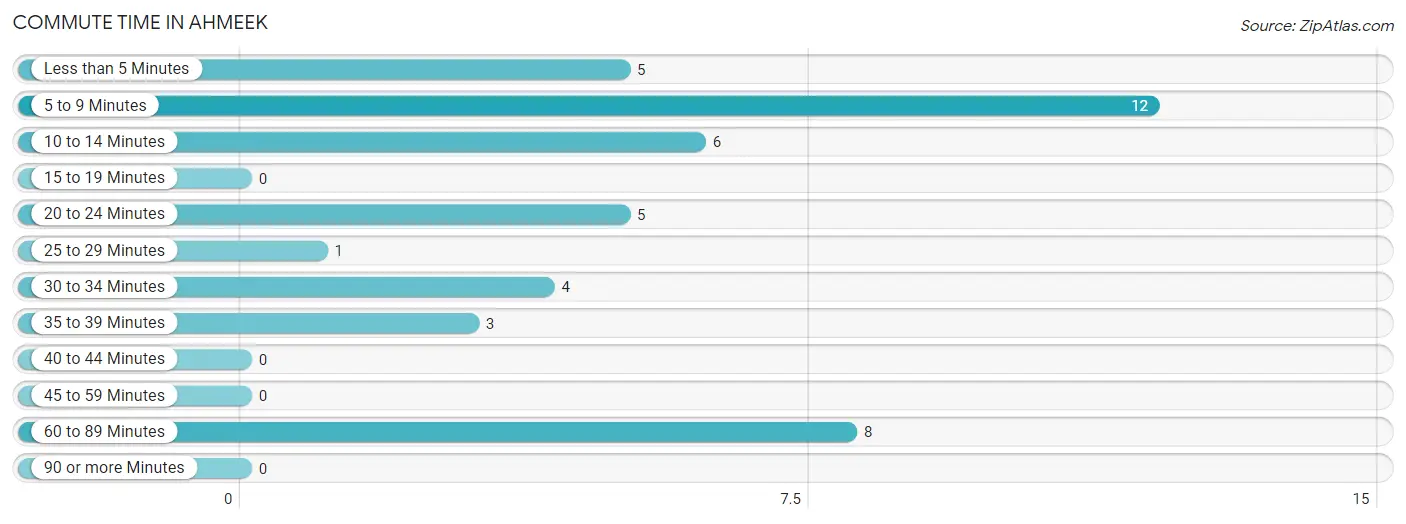
| Commute Time | # Commuters | % Commuters |
| Less than 5 Minutes | 5 | 11.4% |
| 5 to 9 Minutes | 12 | 27.3% |
| 10 to 14 Minutes | 6 | 13.6% |
| 15 to 19 Minutes | 0 | 0.0% |
| 20 to 24 Minutes | 5 | 11.4% |
| 25 to 29 Minutes | 1 | 2.3% |
| 30 to 34 Minutes | 4 | 9.1% |
| 35 to 39 Minutes | 3 | 6.8% |
| 40 to 44 Minutes | 0 | 0.0% |
| 45 to 59 Minutes | 0 | 0.0% |
| 60 to 89 Minutes | 8 | 18.2% |
| 90 or more Minutes | 0 | 0.0% |
Commute Time by Sex in Ahmeek
The most common commute times in Ahmeek are 60 to 89 minutes (8 commuters, 29.6%) for males and 5 to 9 minutes (6 commuters, 35.3%) for females.
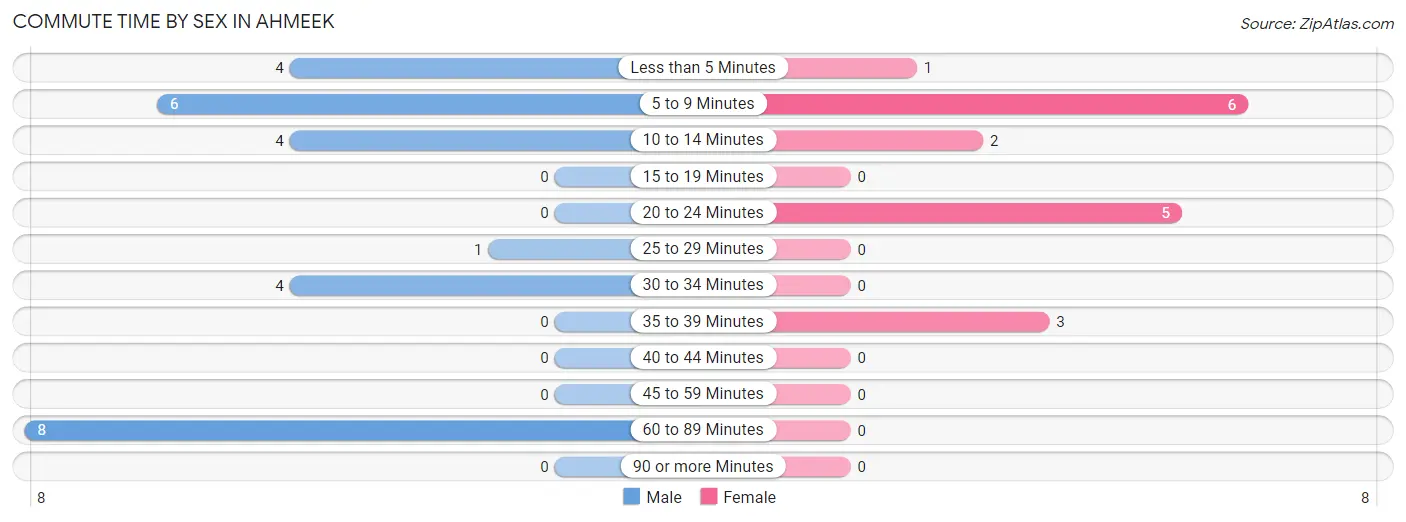
| Commute Time | Male | Female |
| Less than 5 Minutes | 4 (14.8%) | 1 (5.9%) |
| 5 to 9 Minutes | 6 (22.2%) | 6 (35.3%) |
| 10 to 14 Minutes | 4 (14.8%) | 2 (11.8%) |
| 15 to 19 Minutes | 0 (0.0%) | 0 (0.0%) |
| 20 to 24 Minutes | 0 (0.0%) | 5 (29.4%) |
| 25 to 29 Minutes | 1 (3.7%) | 0 (0.0%) |
| 30 to 34 Minutes | 4 (14.8%) | 0 (0.0%) |
| 35 to 39 Minutes | 0 (0.0%) | 3 (17.6%) |
| 40 to 44 Minutes | 0 (0.0%) | 0 (0.0%) |
| 45 to 59 Minutes | 0 (0.0%) | 0 (0.0%) |
| 60 to 89 Minutes | 8 (29.6%) | 0 (0.0%) |
| 90 or more Minutes | 0 (0.0%) | 0 (0.0%) |
Time of Departure to Work by Sex in Ahmeek
The most frequent times of departure to work in Ahmeek are 12:00 AM to 4:59 AM (12, 44.4%) for males and 5:30 AM to 5:59 AM (5, 29.4%) for females.
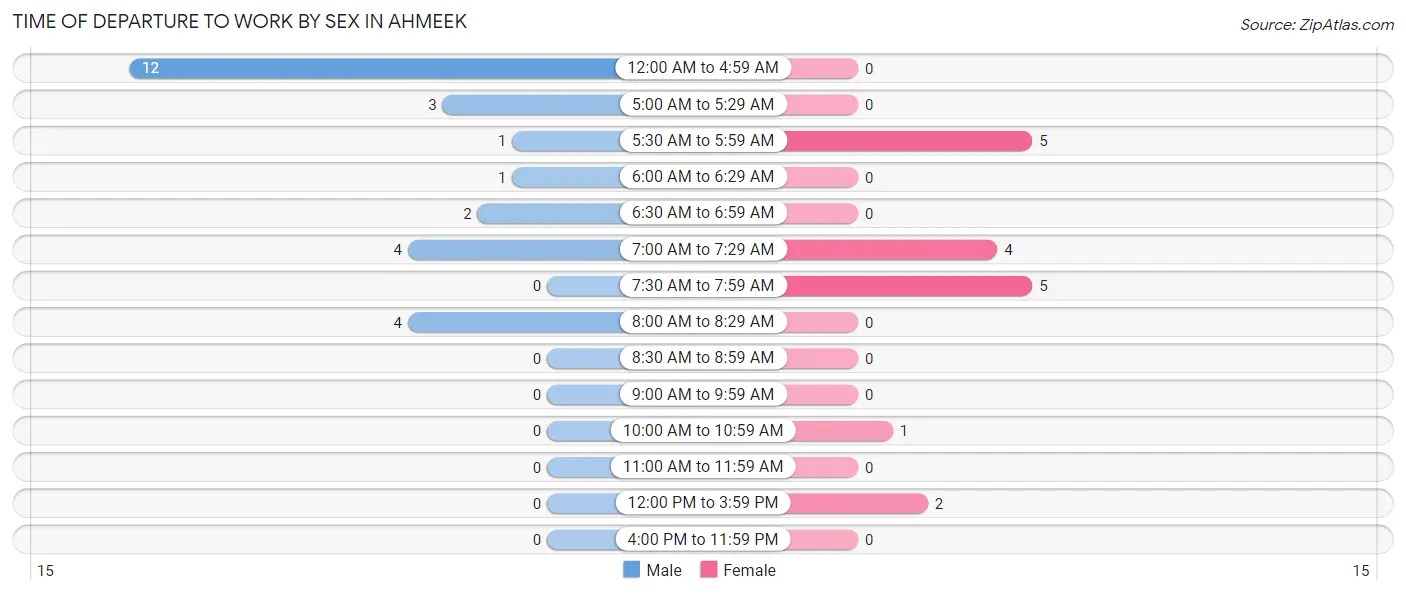
| Time of Departure | Male | Female |
| 12:00 AM to 4:59 AM | 12 (44.4%) | 0 (0.0%) |
| 5:00 AM to 5:29 AM | 3 (11.1%) | 0 (0.0%) |
| 5:30 AM to 5:59 AM | 1 (3.7%) | 5 (29.4%) |
| 6:00 AM to 6:29 AM | 1 (3.7%) | 0 (0.0%) |
| 6:30 AM to 6:59 AM | 2 (7.4%) | 0 (0.0%) |
| 7:00 AM to 7:29 AM | 4 (14.8%) | 4 (23.5%) |
| 7:30 AM to 7:59 AM | 0 (0.0%) | 5 (29.4%) |
| 8:00 AM to 8:29 AM | 4 (14.8%) | 0 (0.0%) |
| 8:30 AM to 8:59 AM | 0 (0.0%) | 0 (0.0%) |
| 9:00 AM to 9:59 AM | 0 (0.0%) | 0 (0.0%) |
| 10:00 AM to 10:59 AM | 0 (0.0%) | 1 (5.9%) |
| 11:00 AM to 11:59 AM | 0 (0.0%) | 0 (0.0%) |
| 12:00 PM to 3:59 PM | 0 (0.0%) | 2 (11.8%) |
| 4:00 PM to 11:59 PM | 0 (0.0%) | 0 (0.0%) |
| Total | 27 (100.0%) | 17 (100.0%) |
Housing Occupancy in Ahmeek
Occupancy by Ownership in Ahmeek
Of the total 43 dwellings in Ahmeek, owner-occupied units account for 41 (95.4%), while renter-occupied units make up 2 (4.6%).
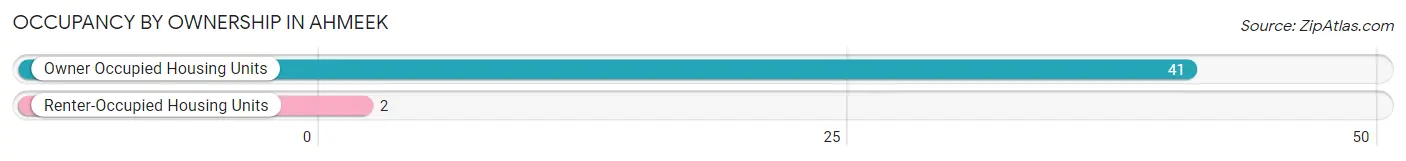
| Occupancy | # Housing Units | % Housing Units |
| Owner Occupied Housing Units | 41 | 95.4% |
| Renter-Occupied Housing Units | 2 | 4.6% |
| Total Occupied Housing Units | 43 | 100.0% |
Occupancy by Household Size in Ahmeek
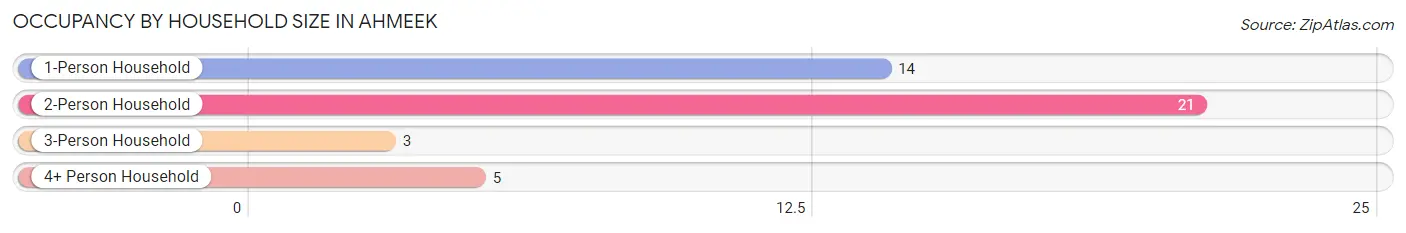
| Household Size | # Housing Units | % Housing Units |
| 1-Person Household | 14 | 32.6% |
| 2-Person Household | 21 | 48.8% |
| 3-Person Household | 3 | 7.0% |
| 4+ Person Household | 5 | 11.6% |
| Total Housing Units | 43 | 100.0% |
Occupancy by Ownership by Household Size in Ahmeek
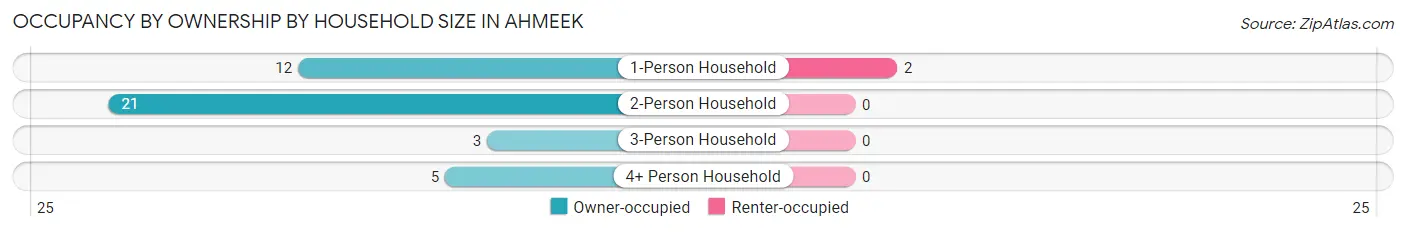
| Household Size | Owner-occupied | Renter-occupied |
| 1-Person Household | 12 (85.7%) | 2 (14.3%) |
| 2-Person Household | 21 (100.0%) | 0 (0.0%) |
| 3-Person Household | 3 (100.0%) | 0 (0.0%) |
| 4+ Person Household | 5 (100.0%) | 0 (0.0%) |
| Total Housing Units | 41 (95.4%) | 2 (4.6%) |
Occupancy by Educational Attainment in Ahmeek
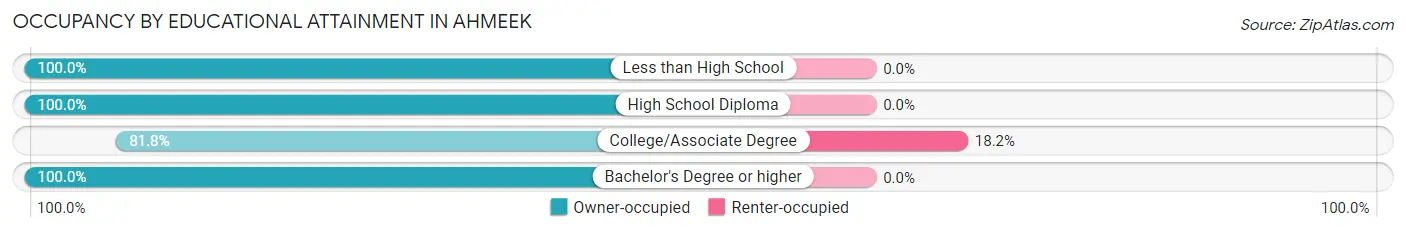
| Household Size | Owner-occupied | Renter-occupied |
| Less than High School | 3 (100.0%) | 0 (0.0%) |
| High School Diploma | 12 (100.0%) | 0 (0.0%) |
| College/Associate Degree | 9 (81.8%) | 2 (18.2%) |
| Bachelor's Degree or higher | 17 (100.0%) | 0 (0.0%) |
Occupancy by Age of Householder in Ahmeek
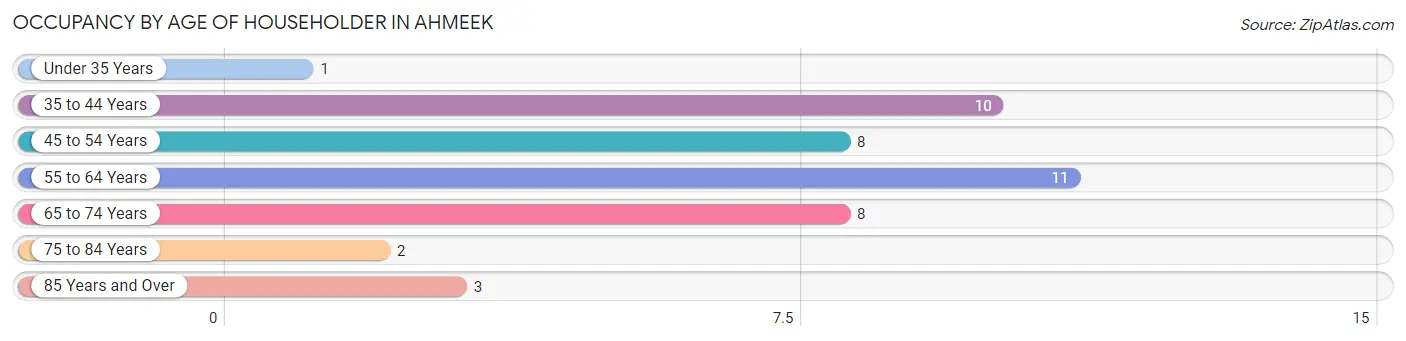
| Age Bracket | # Households | % Households |
| Under 35 Years | 1 | 2.3% |
| 35 to 44 Years | 10 | 23.3% |
| 45 to 54 Years | 8 | 18.6% |
| 55 to 64 Years | 11 | 25.6% |
| 65 to 74 Years | 8 | 18.6% |
| 75 to 84 Years | 2 | 4.6% |
| 85 Years and Over | 3 | 7.0% |
| Total | 43 | 100.0% |
Housing Finances in Ahmeek
Median Income by Occupancy in Ahmeek
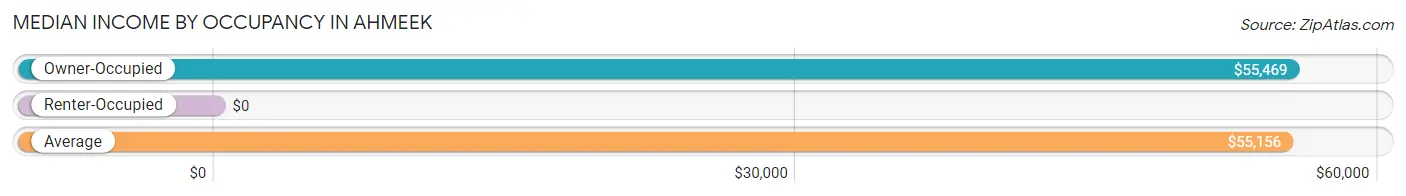
| Occupancy Type | # Households | Median Income |
| Owner-Occupied | 41 (95.4%) | $55,469 |
| Renter-Occupied | 2 (4.6%) | $0 |
| Average | 43 (100.0%) | $55,156 |
Occupancy by Householder Income Bracket in Ahmeek
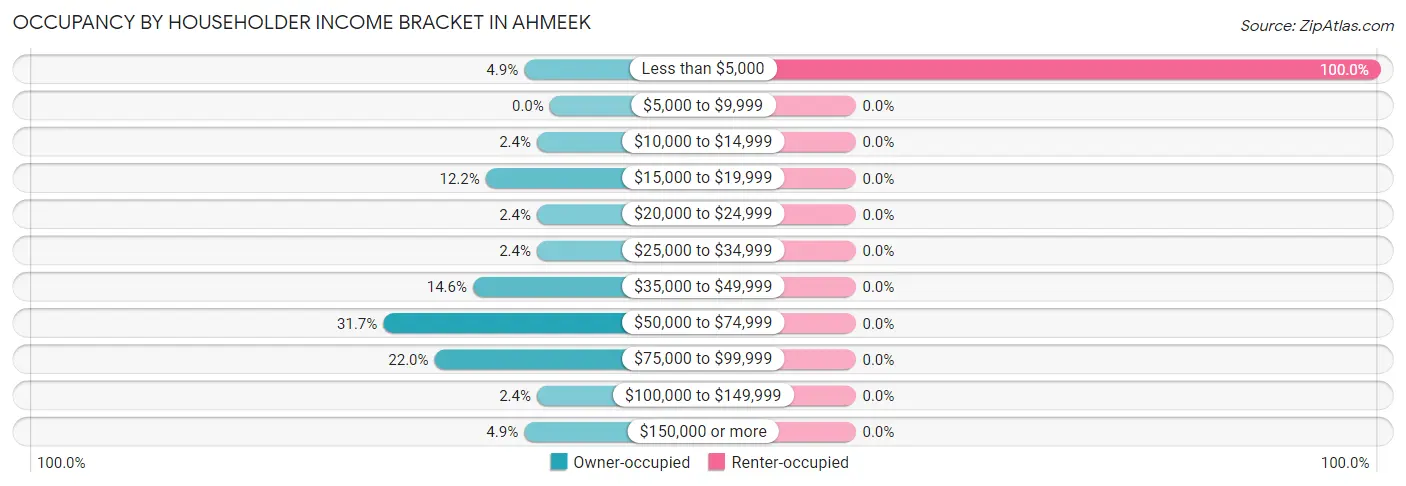
| Income Bracket | Owner-occupied | Renter-occupied |
| Less than $5,000 | 2 (4.9%) | 2 (100.0%) |
| $5,000 to $9,999 | 0 (0.0%) | 0 (0.0%) |
| $10,000 to $14,999 | 1 (2.4%) | 0 (0.0%) |
| $15,000 to $19,999 | 5 (12.2%) | 0 (0.0%) |
| $20,000 to $24,999 | 1 (2.4%) | 0 (0.0%) |
| $25,000 to $34,999 | 1 (2.4%) | 0 (0.0%) |
| $35,000 to $49,999 | 6 (14.6%) | 0 (0.0%) |
| $50,000 to $74,999 | 13 (31.7%) | 0 (0.0%) |
| $75,000 to $99,999 | 9 (22.0%) | 0 (0.0%) |
| $100,000 to $149,999 | 1 (2.4%) | 0 (0.0%) |
| $150,000 or more | 2 (4.9%) | 0 (0.0%) |
| Total | 41 (100.0%) | 2 (100.0%) |
Monthly Housing Cost Tiers in Ahmeek
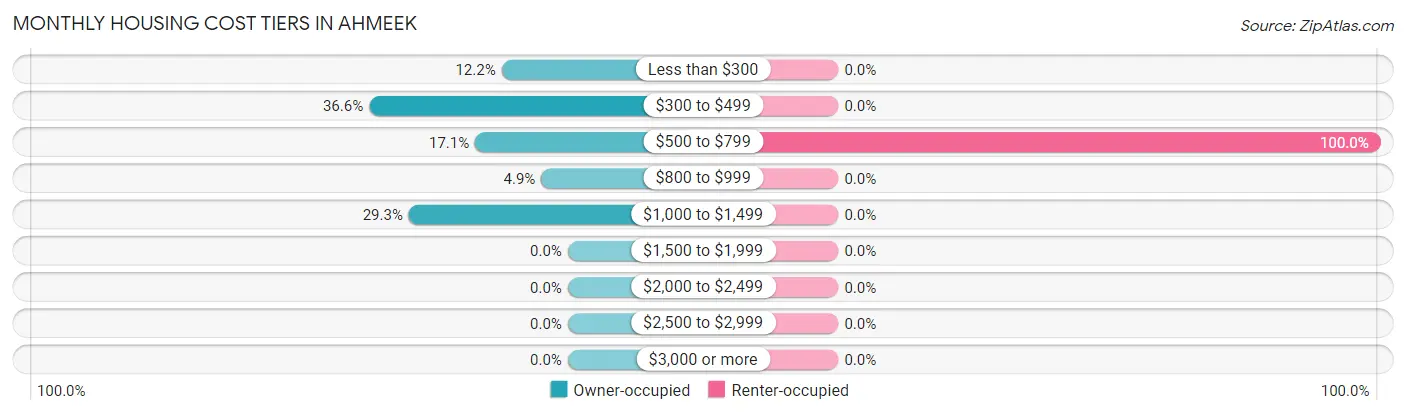
| Monthly Cost | Owner-occupied | Renter-occupied |
| Less than $300 | 5 (12.2%) | 0 (0.0%) |
| $300 to $499 | 15 (36.6%) | 0 (0.0%) |
| $500 to $799 | 7 (17.1%) | 2 (100.0%) |
| $800 to $999 | 2 (4.9%) | 0 (0.0%) |
| $1,000 to $1,499 | 12 (29.3%) | 0 (0.0%) |
| $1,500 to $1,999 | 0 (0.0%) | 0 (0.0%) |
| $2,000 to $2,499 | 0 (0.0%) | 0 (0.0%) |
| $2,500 to $2,999 | 0 (0.0%) | 0 (0.0%) |
| $3,000 or more | 0 (0.0%) | 0 (0.0%) |
| Total | 41 (100.0%) | 2 (100.0%) |
Physical Housing Characteristics in Ahmeek
Housing Structures in Ahmeek
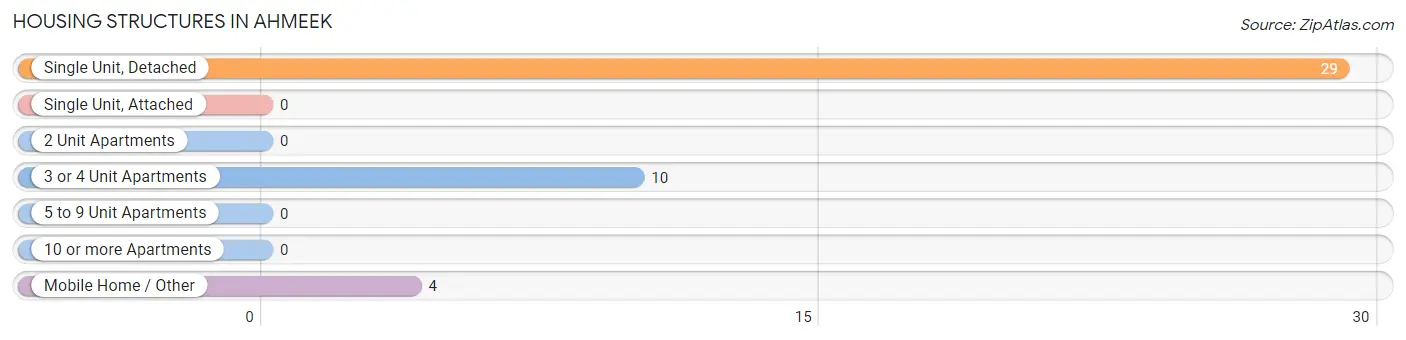
| Structure Type | # Housing Units | % Housing Units |
| Single Unit, Detached | 29 | 67.4% |
| Single Unit, Attached | 0 | 0.0% |
| 2 Unit Apartments | 0 | 0.0% |
| 3 or 4 Unit Apartments | 10 | 23.3% |
| 5 to 9 Unit Apartments | 0 | 0.0% |
| 10 or more Apartments | 0 | 0.0% |
| Mobile Home / Other | 4 | 9.3% |
| Total | 43 | 100.0% |
Housing Structures by Occupancy in Ahmeek
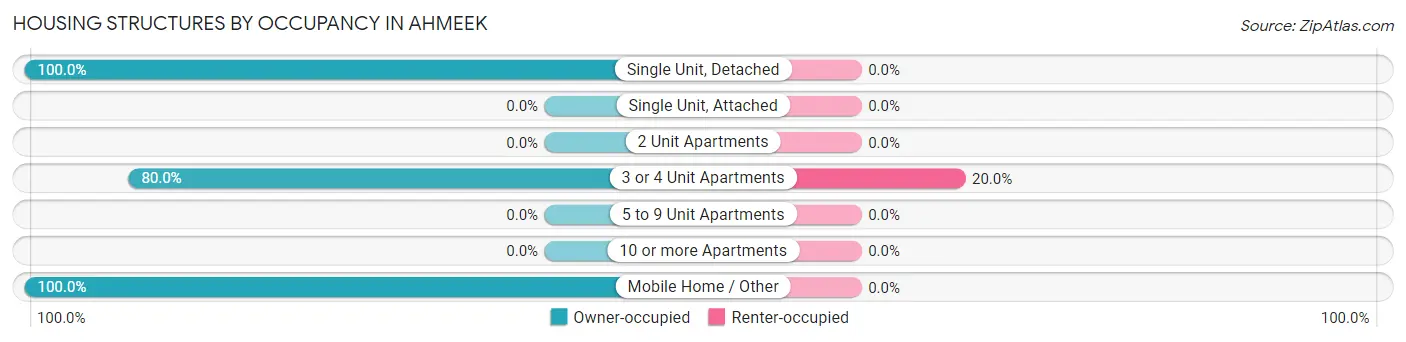
| Structure Type | Owner-occupied | Renter-occupied |
| Single Unit, Detached | 29 (100.0%) | 0 (0.0%) |
| Single Unit, Attached | 0 (0.0%) | 0 (0.0%) |
| 2 Unit Apartments | 0 (0.0%) | 0 (0.0%) |
| 3 or 4 Unit Apartments | 8 (80.0%) | 2 (20.0%) |
| 5 to 9 Unit Apartments | 0 (0.0%) | 0 (0.0%) |
| 10 or more Apartments | 0 (0.0%) | 0 (0.0%) |
| Mobile Home / Other | 4 (100.0%) | 0 (0.0%) |
| Total | 41 (95.4%) | 2 (4.6%) |
Housing Structures by Number of Rooms in Ahmeek
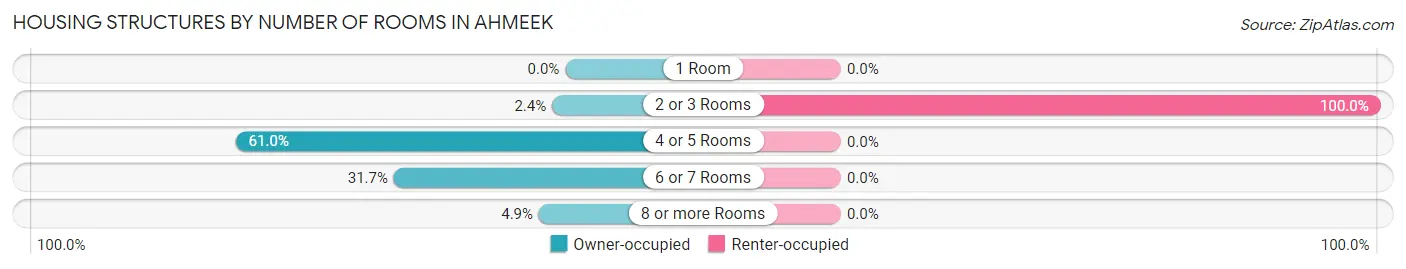
| Number of Rooms | Owner-occupied | Renter-occupied |
| 1 Room | 0 (0.0%) | 0 (0.0%) |
| 2 or 3 Rooms | 1 (2.4%) | 2 (100.0%) |
| 4 or 5 Rooms | 25 (61.0%) | 0 (0.0%) |
| 6 or 7 Rooms | 13 (31.7%) | 0 (0.0%) |
| 8 or more Rooms | 2 (4.9%) | 0 (0.0%) |
| Total | 41 (100.0%) | 2 (100.0%) |
Housing Structure by Heating Type in Ahmeek
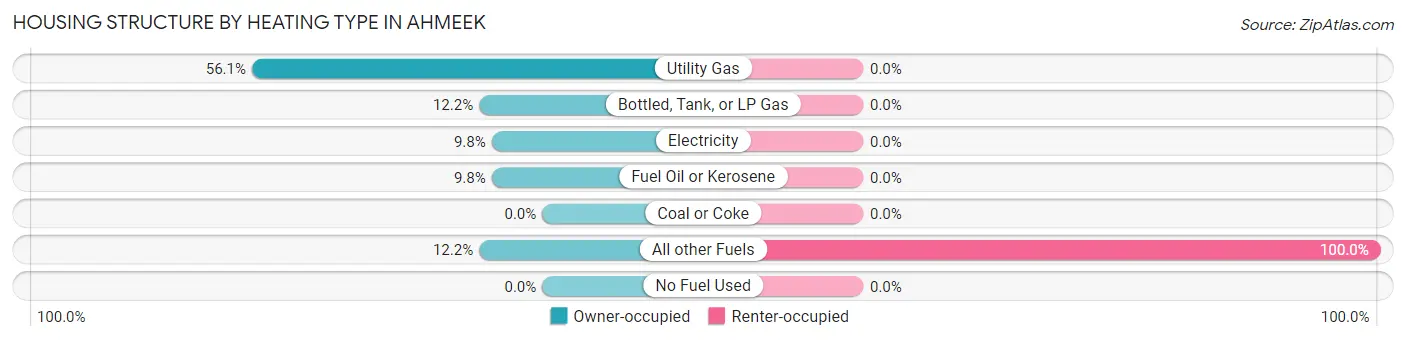
| Heating Type | Owner-occupied | Renter-occupied |
| Utility Gas | 23 (56.1%) | 0 (0.0%) |
| Bottled, Tank, or LP Gas | 5 (12.2%) | 0 (0.0%) |
| Electricity | 4 (9.8%) | 0 (0.0%) |
| Fuel Oil or Kerosene | 4 (9.8%) | 0 (0.0%) |
| Coal or Coke | 0 (0.0%) | 0 (0.0%) |
| All other Fuels | 5 (12.2%) | 2 (100.0%) |
| No Fuel Used | 0 (0.0%) | 0 (0.0%) |
| Total | 41 (100.0%) | 2 (100.0%) |
Household Vehicle Usage in Ahmeek
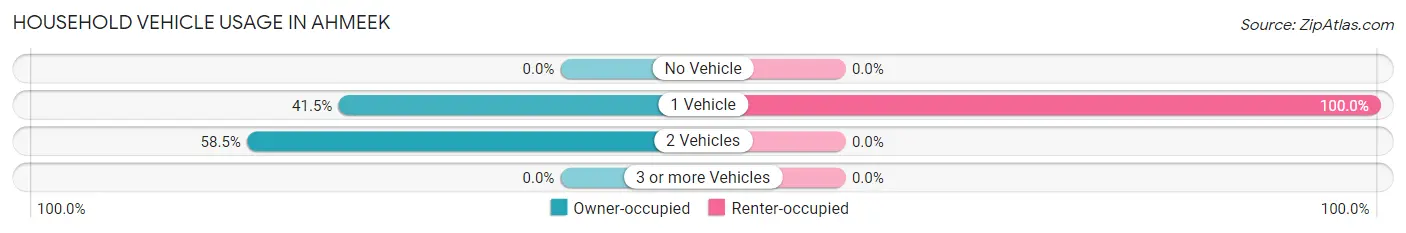
| Vehicles per Household | Owner-occupied | Renter-occupied |
| No Vehicle | 0 (0.0%) | 0 (0.0%) |
| 1 Vehicle | 17 (41.5%) | 2 (100.0%) |
| 2 Vehicles | 24 (58.5%) | 0 (0.0%) |
| 3 or more Vehicles | 0 (0.0%) | 0 (0.0%) |
| Total | 41 (100.0%) | 2 (100.0%) |
Real Estate & Mortgages in Ahmeek
Real Estate and Mortgage Overview in Ahmeek
| Characteristic | Without Mortgage | With Mortgage |
| Housing Units | 21 | 20 |
| Median Property Value | $55,000 | $0 |
| Median Household Income | - | - |
| Monthly Housing Costs | $408 | $0 |
| Real Estate Taxes | $625 | $0 |
Property Value by Mortgage Status in Ahmeek
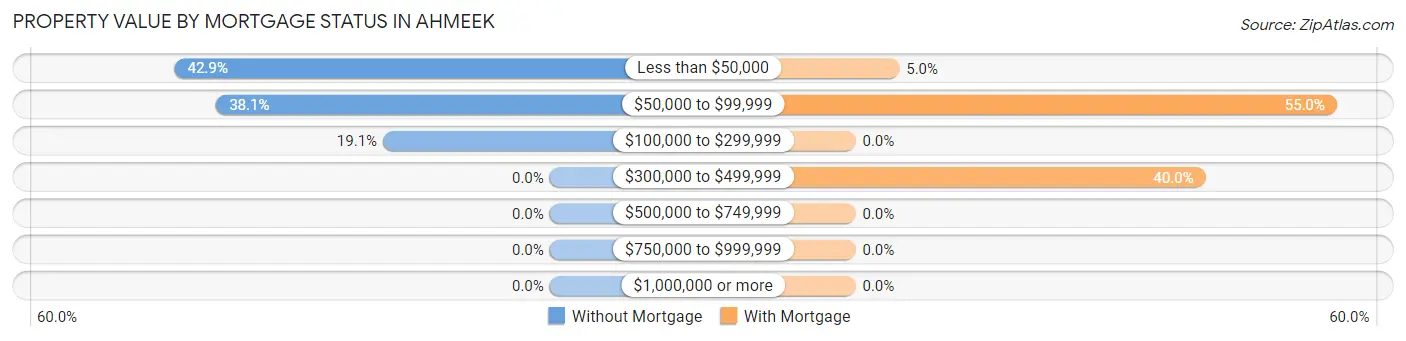
| Property Value | Without Mortgage | With Mortgage |
| Less than $50,000 | 9 (42.9%) | 1 (5.0%) |
| $50,000 to $99,999 | 8 (38.1%) | 11 (55.0%) |
| $100,000 to $299,999 | 4 (19.1%) | 0 (0.0%) |
| $300,000 to $499,999 | 0 (0.0%) | 8 (40.0%) |
| $500,000 to $749,999 | 0 (0.0%) | 0 (0.0%) |
| $750,000 to $999,999 | 0 (0.0%) | 0 (0.0%) |
| $1,000,000 or more | 0 (0.0%) | 0 (0.0%) |
| Total | 21 (100.0%) | 20 (100.0%) |
Household Income by Mortgage Status in Ahmeek
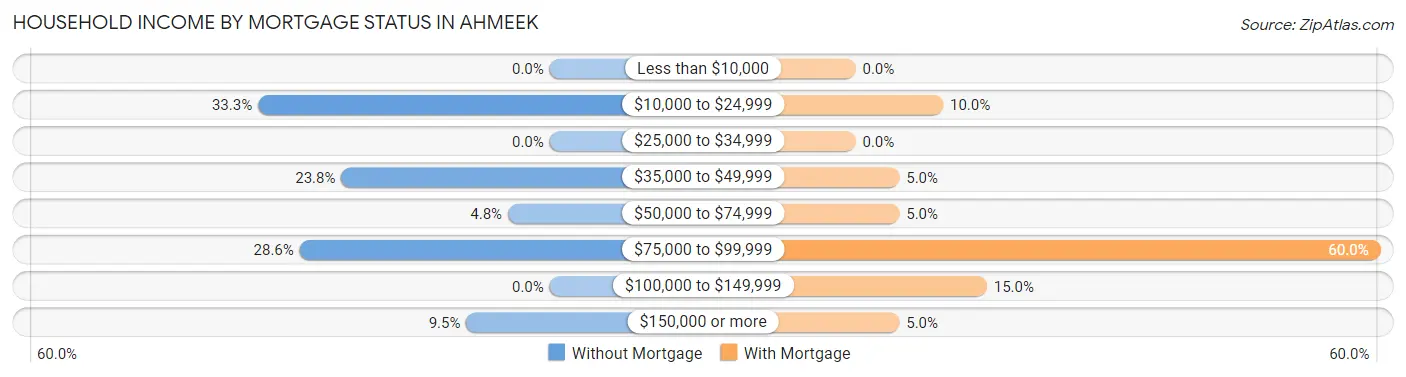
| Household Income | Without Mortgage | With Mortgage |
| Less than $10,000 | 0 (0.0%) | 0 (0.0%) |
| $10,000 to $24,999 | 7 (33.3%) | 2 (10.0%) |
| $25,000 to $34,999 | 0 (0.0%) | 0 (0.0%) |
| $35,000 to $49,999 | 5 (23.8%) | 1 (5.0%) |
| $50,000 to $74,999 | 1 (4.8%) | 1 (5.0%) |
| $75,000 to $99,999 | 6 (28.6%) | 12 (60.0%) |
| $100,000 to $149,999 | 0 (0.0%) | 3 (15.0%) |
| $150,000 or more | 2 (9.5%) | 1 (5.0%) |
| Total | 21 (100.0%) | 20 (100.0%) |
Property Value to Household Income Ratio in Ahmeek
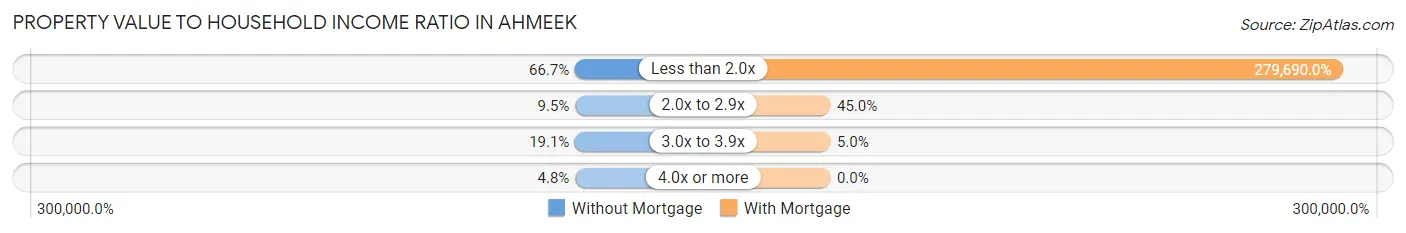
| Value-to-Income Ratio | Without Mortgage | With Mortgage |
| Less than 2.0x | 14 (66.7%) | 55,938 (279,690.0%) |
| 2.0x to 2.9x | 2 (9.5%) | 9 (45.0%) |
| 3.0x to 3.9x | 4 (19.1%) | 1 (5.0%) |
| 4.0x or more | 1 (4.8%) | 0 (0.0%) |
| Total | 21 (100.0%) | 20 (100.0%) |
Real Estate Taxes by Mortgage Status in Ahmeek
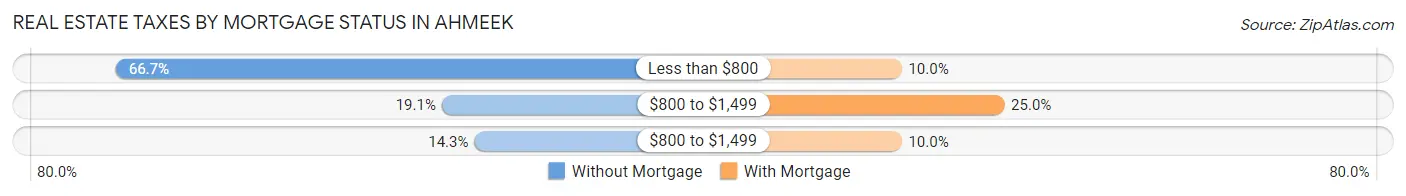
| Property Taxes | Without Mortgage | With Mortgage |
| Less than $800 | 14 (66.7%) | 2 (10.0%) |
| $800 to $1,499 | 4 (19.1%) | 5 (25.0%) |
| $800 to $1,499 | 3 (14.3%) | 2 (10.0%) |
| Total | 21 (100.0%) | 20 (100.0%) |
Health & Disability in Ahmeek
Health Insurance Coverage by Age in Ahmeek
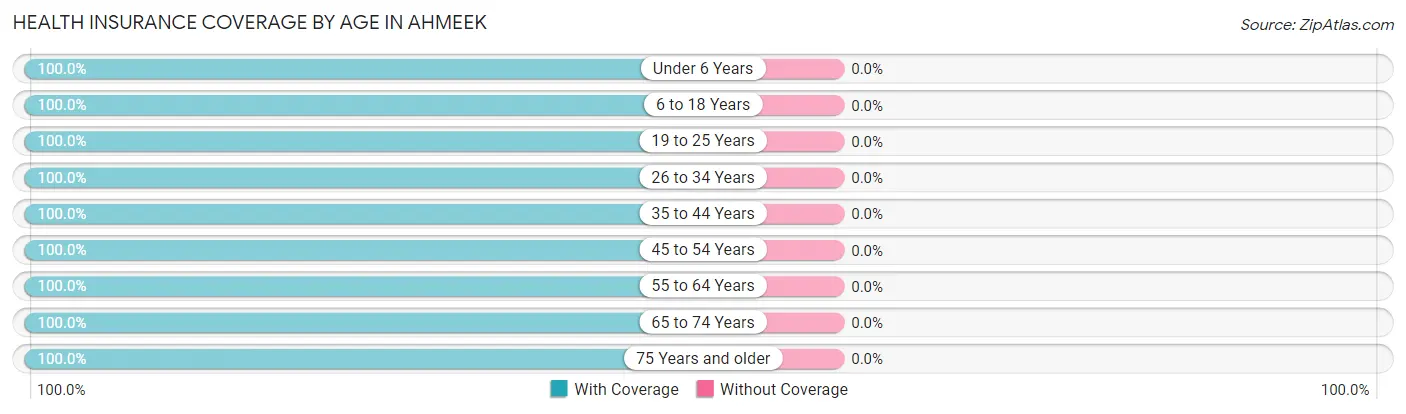
| Age Bracket | With Coverage | Without Coverage |
| Under 6 Years | 1 (100.0%) | 0 (0.0%) |
| 6 to 18 Years | 17 (100.0%) | 0 (0.0%) |
| 19 to 25 Years | 3 (100.0%) | 0 (0.0%) |
| 26 to 34 Years | 6 (100.0%) | 0 (0.0%) |
| 35 to 44 Years | 13 (100.0%) | 0 (0.0%) |
| 45 to 54 Years | 16 (100.0%) | 0 (0.0%) |
| 55 to 64 Years | 15 (100.0%) | 0 (0.0%) |
| 65 to 74 Years | 11 (100.0%) | 0 (0.0%) |
| 75 Years and older | 5 (100.0%) | 0 (0.0%) |
| Total | 87 (100.0%) | 0 (0.0%) |
Health Insurance Coverage by Citizenship Status in Ahmeek
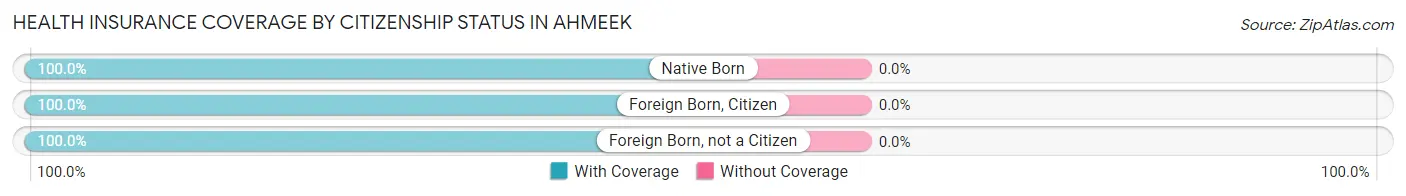
| Citizenship Status | With Coverage | Without Coverage |
| Native Born | 1 (100.0%) | 0 (0.0%) |
| Foreign Born, Citizen | 17 (100.0%) | 0 (0.0%) |
| Foreign Born, not a Citizen | 3 (100.0%) | 0 (0.0%) |
Health Insurance Coverage by Household Income in Ahmeek
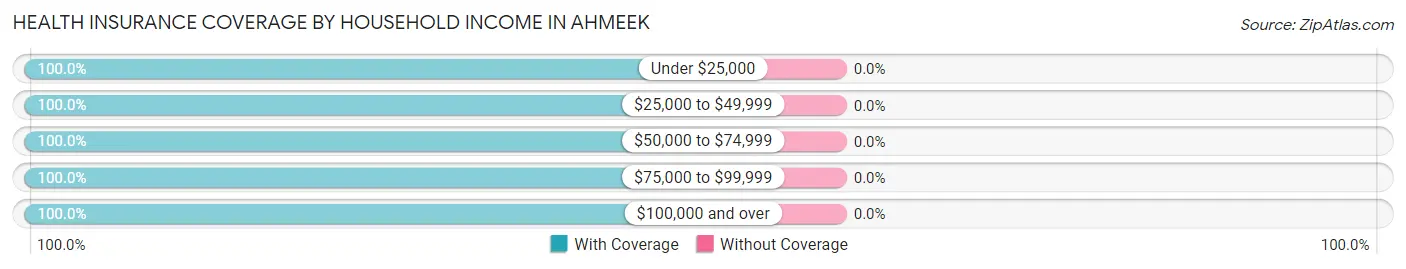
| Household Income | With Coverage | Without Coverage |
| Under $25,000 | 11 (100.0%) | 0 (0.0%) |
| $25,000 to $49,999 | 10 (100.0%) | 0 (0.0%) |
| $50,000 to $74,999 | 23 (100.0%) | 0 (0.0%) |
| $75,000 to $99,999 | 36 (100.0%) | 0 (0.0%) |
| $100,000 and over | 7 (100.0%) | 0 (0.0%) |
Public vs Private Health Insurance Coverage by Age in Ahmeek
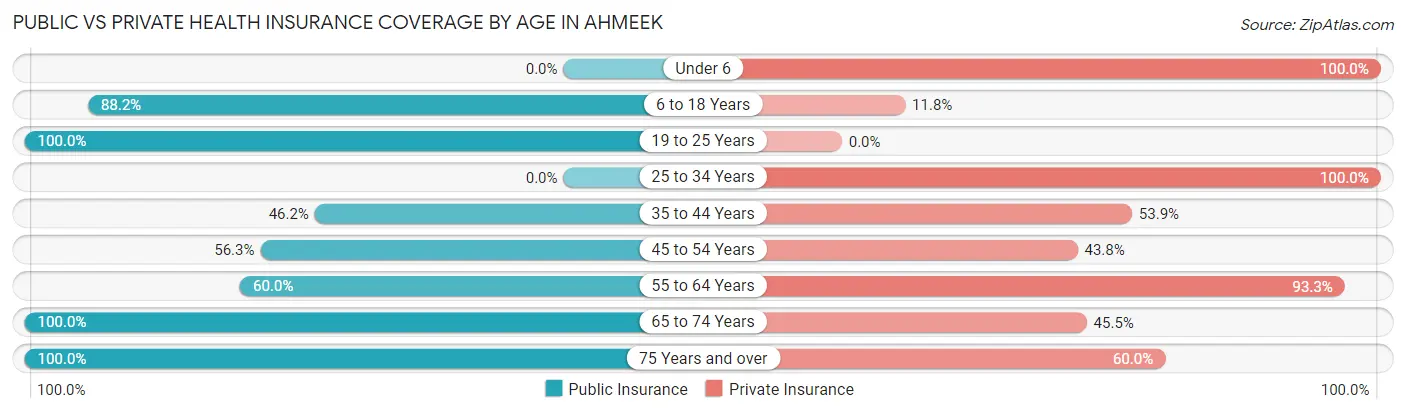
| Age Bracket | Public Insurance | Private Insurance |
| Under 6 | 0 (0.0%) | 1 (100.0%) |
| 6 to 18 Years | 15 (88.2%) | 2 (11.8%) |
| 19 to 25 Years | 3 (100.0%) | 0 (0.0%) |
| 25 to 34 Years | 0 (0.0%) | 6 (100.0%) |
| 35 to 44 Years | 6 (46.2%) | 7 (53.8%) |
| 45 to 54 Years | 9 (56.2%) | 7 (43.8%) |
| 55 to 64 Years | 9 (60.0%) | 14 (93.3%) |
| 65 to 74 Years | 11 (100.0%) | 5 (45.5%) |
| 75 Years and over | 5 (100.0%) | 3 (60.0%) |
| Total | 58 (66.7%) | 45 (51.7%) |
Disability Status by Sex by Age in Ahmeek
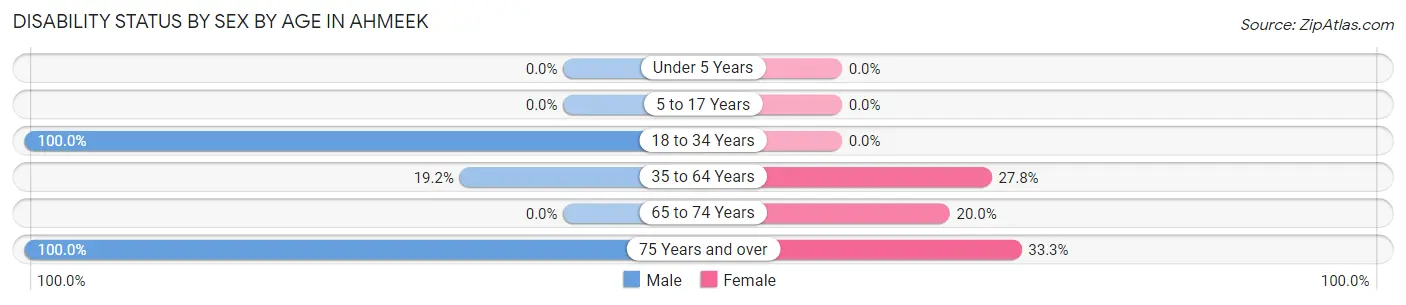
| Age Bracket | Male | Female |
| Under 5 Years | 0 (0.0%) | 0 (0.0%) |
| 5 to 17 Years | 0 (0.0%) | 0 (0.0%) |
| 18 to 34 Years | 3 (100.0%) | 0 (0.0%) |
| 35 to 64 Years | 5 (19.2%) | 5 (27.8%) |
| 65 to 74 Years | 0 (0.0%) | 1 (20.0%) |
| 75 Years and over | 2 (100.0%) | 1 (33.3%) |
Disability Class by Sex by Age in Ahmeek
Disability Class: Hearing Difficulty
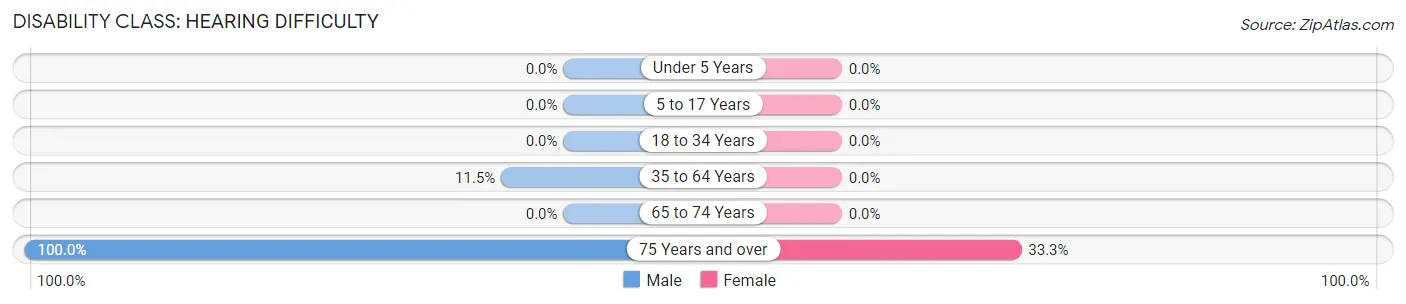
| Age Bracket | Male | Female |
| Under 5 Years | 0 (0.0%) | 0 (0.0%) |
| 5 to 17 Years | 0 (0.0%) | 0 (0.0%) |
| 18 to 34 Years | 0 (0.0%) | 0 (0.0%) |
| 35 to 64 Years | 3 (11.5%) | 0 (0.0%) |
| 65 to 74 Years | 0 (0.0%) | 0 (0.0%) |
| 75 Years and over | 2 (100.0%) | 1 (33.3%) |
Disability Class: Vision Difficulty
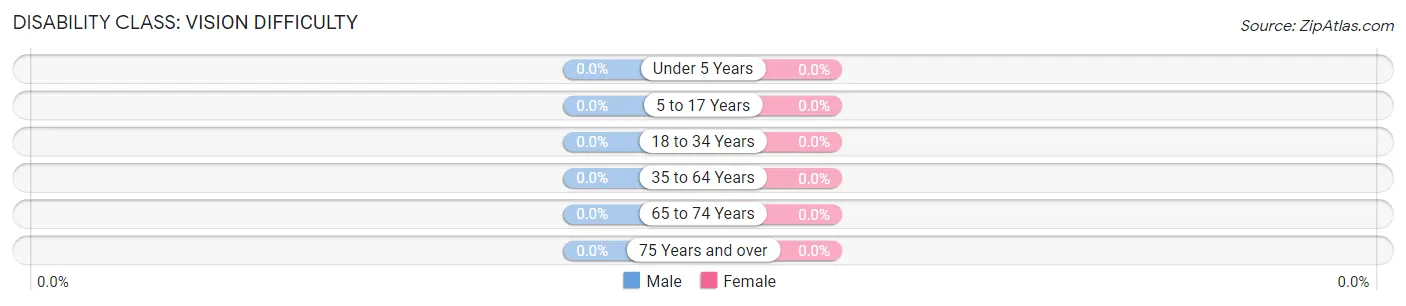
| Age Bracket | Male | Female |
| Under 5 Years | 0 (0.0%) | 0 (0.0%) |
| 5 to 17 Years | 0 (0.0%) | 0 (0.0%) |
| 18 to 34 Years | 0 (0.0%) | 0 (0.0%) |
| 35 to 64 Years | 0 (0.0%) | 0 (0.0%) |
| 65 to 74 Years | 0 (0.0%) | 0 (0.0%) |
| 75 Years and over | 0 (0.0%) | 0 (0.0%) |
Disability Class: Cognitive Difficulty
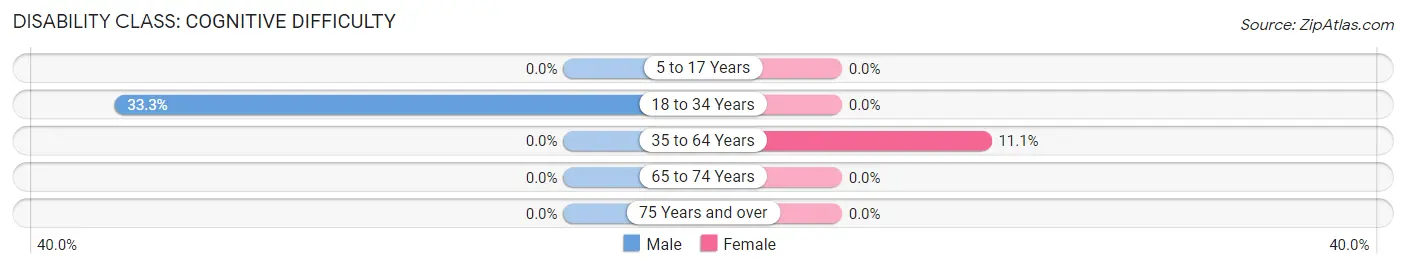
| Age Bracket | Male | Female |
| 5 to 17 Years | 0 (0.0%) | 0 (0.0%) |
| 18 to 34 Years | 1 (33.3%) | 0 (0.0%) |
| 35 to 64 Years | 0 (0.0%) | 2 (11.1%) |
| 65 to 74 Years | 0 (0.0%) | 0 (0.0%) |
| 75 Years and over | 0 (0.0%) | 0 (0.0%) |
Disability Class: Ambulatory Difficulty
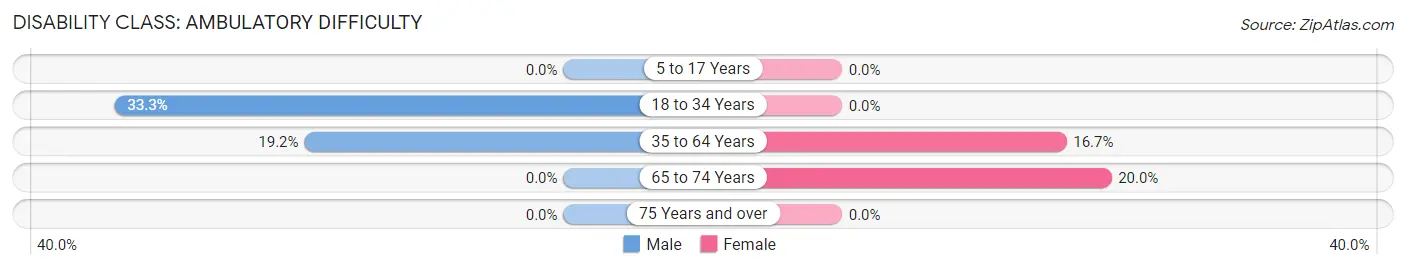
| Age Bracket | Male | Female |
| 5 to 17 Years | 0 (0.0%) | 0 (0.0%) |
| 18 to 34 Years | 1 (33.3%) | 0 (0.0%) |
| 35 to 64 Years | 5 (19.2%) | 3 (16.7%) |
| 65 to 74 Years | 0 (0.0%) | 1 (20.0%) |
| 75 Years and over | 0 (0.0%) | 0 (0.0%) |
Disability Class: Self-Care Difficulty
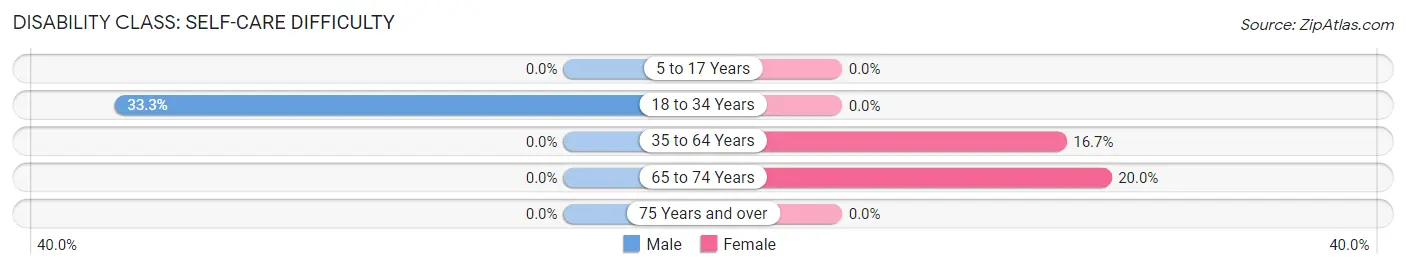
| Age Bracket | Male | Female |
| 5 to 17 Years | 0 (0.0%) | 0 (0.0%) |
| 18 to 34 Years | 1 (33.3%) | 0 (0.0%) |
| 35 to 64 Years | 0 (0.0%) | 3 (16.7%) |
| 65 to 74 Years | 0 (0.0%) | 1 (20.0%) |
| 75 Years and over | 0 (0.0%) | 0 (0.0%) |
Technology Access in Ahmeek
Computing Device Access in Ahmeek
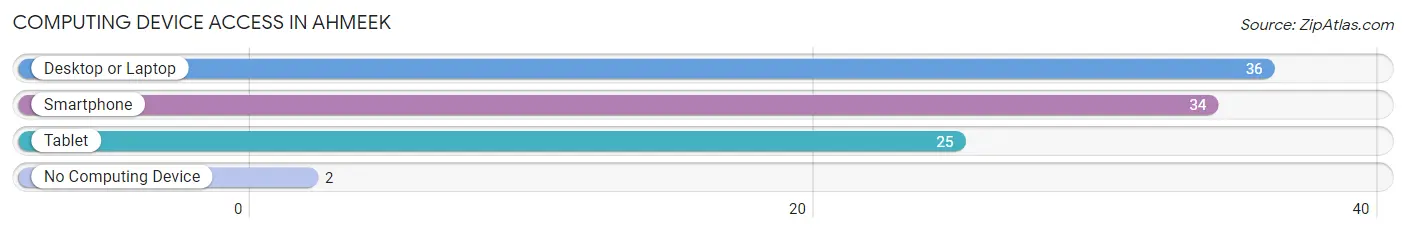
| Device Type | # Households | % Households |
| Desktop or Laptop | 36 | 83.7% |
| Smartphone | 34 | 79.1% |
| Tablet | 25 | 58.1% |
| No Computing Device | 2 | 4.6% |
| Total | 43 | 100.0% |
Internet Access in Ahmeek
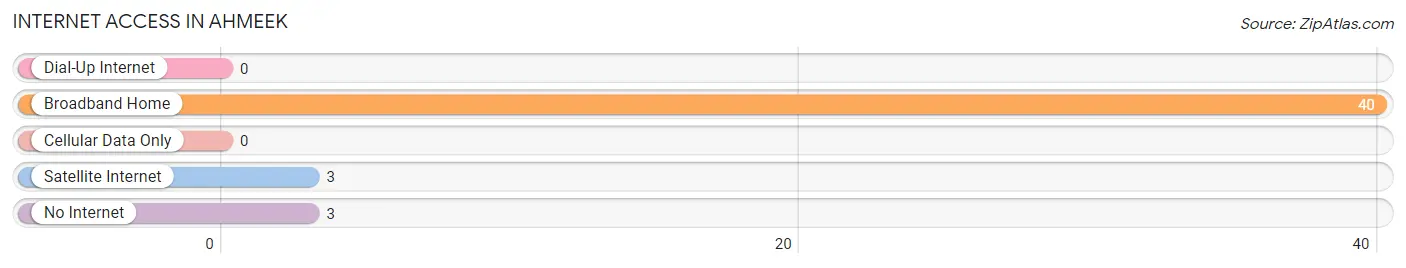
| Internet Type | # Households | % Households |
| Dial-Up Internet | 0 | 0.0% |
| Broadband Home | 40 | 93.0% |
| Cellular Data Only | 0 | 0.0% |
| Satellite Internet | 3 | 7.0% |
| No Internet | 3 | 7.0% |
| Total | 43 | 100.0% |
Ahmeek Summary
Ahmeek is a small unincorporated community located in Keweenaw County, Michigan. It is situated on the south shore of Lake Superior, about 10 miles east of the city of Houghton. The population of Ahmeek was estimated to be around 200 people in 2000.
History
Ahmeek was founded in 1871 by a group of Finnish immigrants who had come to the area to work in the copper mines. The town was originally called Ahmeekin, which means “little river” in Finnish. The name was later shortened to Ahmeek.
The town grew rapidly in the late 19th century, as the copper mines in the area were booming. By the early 20th century, Ahmeek had become a bustling community with a variety of businesses, including a hotel, a general store, a post office, a blacksmith shop, and a sawmill.
In the 1920s, the copper mines began to decline and many of the town’s residents moved away. By the 1950s, the population had dwindled to just a few dozen people.
Geography
Ahmeek is located in the Upper Peninsula of Michigan, on the south shore of Lake Superior. The town is situated in a rural area, surrounded by forests and lakes. The nearest major city is Houghton, which is about 10 miles to the west.
The climate in Ahmeek is typical of the Upper Peninsula, with cold winters and warm summers. The average annual temperature is around 40 degrees Fahrenheit.
Economy
Ahmeek’s economy is largely based on tourism. The town is a popular destination for outdoor activities such as fishing, hunting, and camping. There are also several small businesses in the area, including a general store, a post office, and a few restaurants.
Demographics
As of the 2000 census, the population of Ahmeek was estimated to be around 200 people. The racial makeup of the town was 97.5% White, 0.5% Native American, and 2.0% from other races. The median household income was $25,000.
Conclusion
Ahmeek is a small unincorporated community located in Keweenaw County, Michigan. It was founded in 1871 by a group of Finnish immigrants and grew rapidly in the late 19th century due to the copper mining industry. By the 1950s, the population had dwindled to just a few dozen people. Today, Ahmeek’s economy is largely based on tourism and the town is a popular destination for outdoor activities. The population of Ahmeek was estimated to be around 200 people in 2000, with a median household income of $25,000.
Common Questions
What is Per Capita Income in Ahmeek?
Per Capita income in Ahmeek is $25,486.
What is the Median Family Income in Ahmeek?
Median Family Income in Ahmeek is $57,344.
What is the Median Household income in Ahmeek?
Median Household Income in Ahmeek is $55,156.
What is Inequality or Gini Index in Ahmeek?
Inequality or Gini Index in Ahmeek is 0.36.
What is the Total Population of Ahmeek?
Total Population of Ahmeek is 87.
What is the Total Male Population of Ahmeek?
Total Male Population of Ahmeek is 43.
What is the Total Female Population of Ahmeek?
Total Female Population of Ahmeek is 44.
What is the Ratio of Males per 100 Females in Ahmeek?
There are 97.73 Males per 100 Females in Ahmeek.
What is the Ratio of Females per 100 Males in Ahmeek?
There are 102.33 Females per 100 Males in Ahmeek.
What is the Median Population Age in Ahmeek?
Median Population Age in Ahmeek is 45.9 Years.
What is the Average Family Size in Ahmeek
Average Family Size in Ahmeek is 2.4 People.
What is the Average Household Size in Ahmeek
Average Household Size in Ahmeek is 2.0 People.
How Large is the Labor Force in Ahmeek?
There are 46 People in the Labor Forcein in Ahmeek.
What is the Percentage of People in the Labor Force in Ahmeek?
60.5% of People are in the Labor Force in Ahmeek.
What is the Unemployment Rate in Ahmeek?
Unemployment Rate in Ahmeek is 4.3%.