Berrien Springs, MI Map & Demographics
Berrien Springs Map
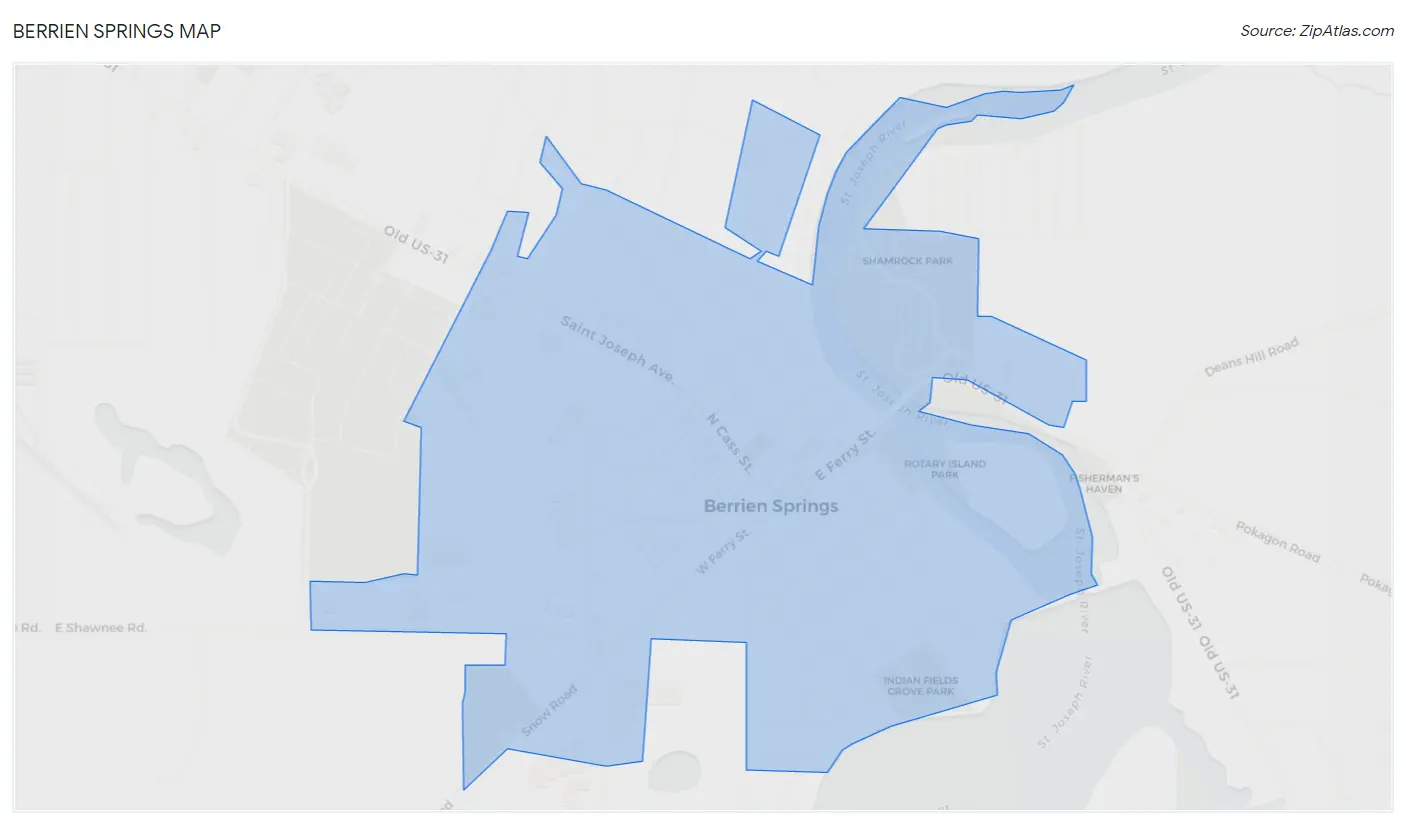
Berrien Springs Overview
$35,941
PER CAPITA INCOME
$82,165
AVG FAMILY INCOME
$61,328
AVG HOUSEHOLD INCOME
35.7%
WAGE / INCOME GAP [ % ]
64.3¢/ $1
WAGE / INCOME GAP [ $ ]
0.51
INEQUALITY / GINI INDEX
2,022
TOTAL POPULATION
1,003
MALE POPULATION
1,019
FEMALE POPULATION
98.43
MALES / 100 FEMALES
101.60
FEMALES / 100 MALES
35.0
MEDIAN AGE
3.1
AVG FAMILY SIZE
2.6
AVG HOUSEHOLD SIZE
1,057
LABOR FORCE [ PEOPLE ]
63.0%
PERCENT IN LABOR FORCE
9.6%
UNEMPLOYMENT RATE
Berrien Springs Area Codes
Income in Berrien Springs
Income Overview in Berrien Springs
Per Capita Income in Berrien Springs is $35,941, while median incomes of families and households are $82,165 and $61,328 respectively.
| Characteristic | Number | Measure |
| Per Capita Income | 2,022 | $35,941 |
| Median Family Income | 475 | $82,165 |
| Mean Family Income | 475 | $115,077 |
| Median Household Income | 771 | $61,328 |
| Mean Household Income | 771 | $91,726 |
| Income Deficit | 475 | $0 |
| Wage / Income Gap (%) | 2,022 | 35.67% |
| Wage / Income Gap ($) | 2,022 | 64.33¢ per $1 |
| Gini / Inequality Index | 2,022 | 0.51 |
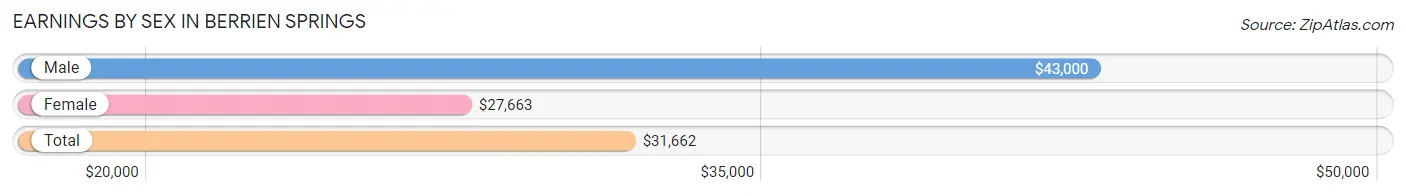
Earnings by Sex in Berrien Springs
Average Earnings in Berrien Springs are $31,662, $43,000 for men and $27,663 for women, a difference of 35.7%.
| Sex | Number | Average Earnings |
| Male | 562 (49.3%) | $43,000 |
| Female | 577 (50.7%) | $27,663 |
| Total | 1,139 (100.0%) | $31,662 |
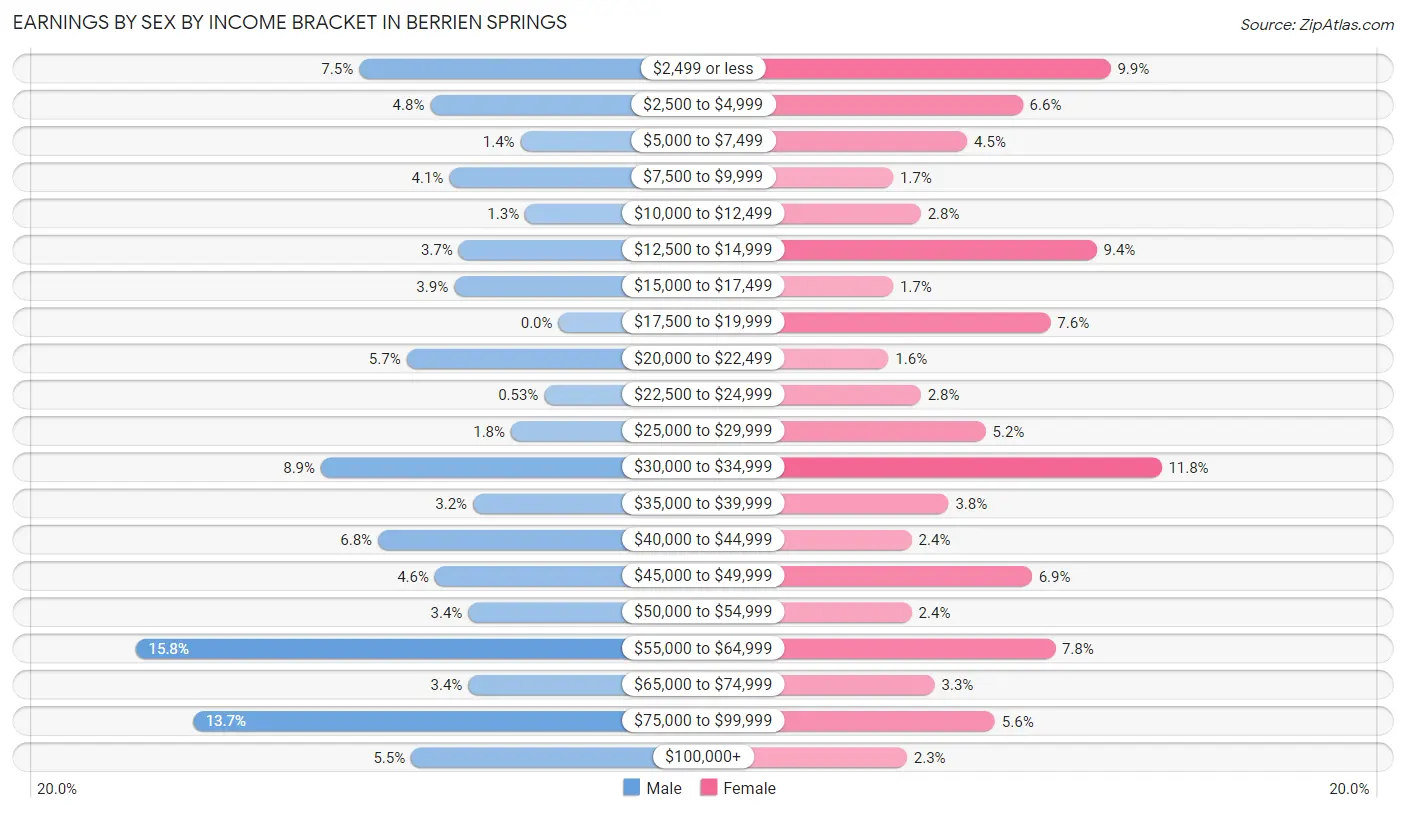
Earnings by Sex by Income Bracket in Berrien Springs
The most common earnings brackets in Berrien Springs are $55,000 to $64,999 for men (89 | 15.8%) and $30,000 to $34,999 for women (68 | 11.8%).
| Income | Male | Female |
| $2,499 or less | 42 (7.5%) | 57 (9.9%) |
| $2,500 to $4,999 | 27 (4.8%) | 38 (6.6%) |
| $5,000 to $7,499 | 8 (1.4%) | 26 (4.5%) |
| $7,500 to $9,999 | 23 (4.1%) | 10 (1.7%) |
| $10,000 to $12,499 | 7 (1.3%) | 16 (2.8%) |
| $12,500 to $14,999 | 21 (3.7%) | 54 (9.4%) |
| $15,000 to $17,499 | 22 (3.9%) | 10 (1.7%) |
| $17,500 to $19,999 | 0 (0.0%) | 44 (7.6%) |
| $20,000 to $22,499 | 32 (5.7%) | 9 (1.6%) |
| $22,500 to $24,999 | 3 (0.5%) | 16 (2.8%) |
| $25,000 to $29,999 | 10 (1.8%) | 30 (5.2%) |
| $30,000 to $34,999 | 50 (8.9%) | 68 (11.8%) |
| $35,000 to $39,999 | 18 (3.2%) | 22 (3.8%) |
| $40,000 to $44,999 | 38 (6.8%) | 14 (2.4%) |
| $45,000 to $49,999 | 26 (4.6%) | 40 (6.9%) |
| $50,000 to $54,999 | 19 (3.4%) | 14 (2.4%) |
| $55,000 to $64,999 | 89 (15.8%) | 45 (7.8%) |
| $65,000 to $74,999 | 19 (3.4%) | 19 (3.3%) |
| $75,000 to $99,999 | 77 (13.7%) | 32 (5.6%) |
| $100,000+ | 31 (5.5%) | 13 (2.2%) |
| Total | 562 (100.0%) | 577 (100.0%) |
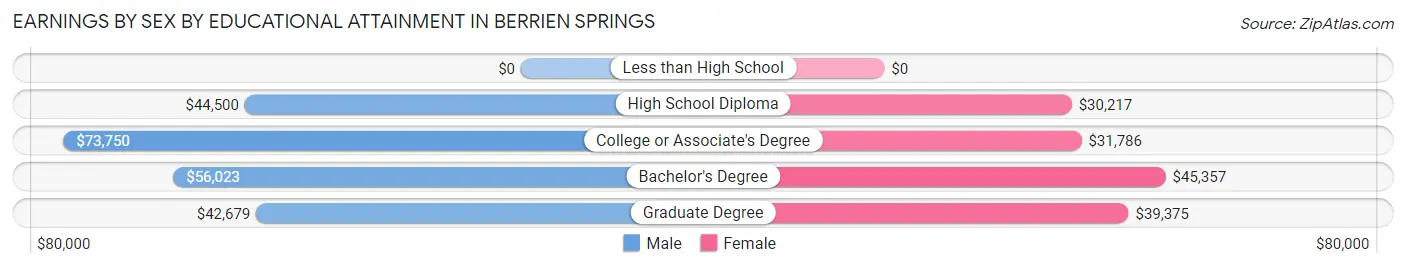
Earnings by Sex by Educational Attainment in Berrien Springs
Average earnings in Berrien Springs are $50,000 for men and $31,816 for women, a difference of 36.4%. Men with an educational attainment of college or associate's degree enjoy the highest average annual earnings of $73,750, while those with graduate degree education earn the least with $42,679. Women with an educational attainment of bachelor's degree earn the most with the average annual earnings of $45,357, while those with high school diploma education have the smallest earnings of $30,217.
| Educational Attainment | Male Income | Female Income |
| Less than High School | - | - |
| High School Diploma | $44,500 | $30,217 |
| College or Associate's Degree | $73,750 | $31,786 |
| Bachelor's Degree | $56,023 | $45,357 |
| Graduate Degree | $42,679 | $39,375 |
| Total | $50,000 | $31,816 |
Family Income in Berrien Springs
Family Income Brackets in Berrien Springs
According to the Berrien Springs family income data, there are 136 families falling into the $75,000 to $99,999 income range, which is the most common income bracket and makes up 28.6% of all families.
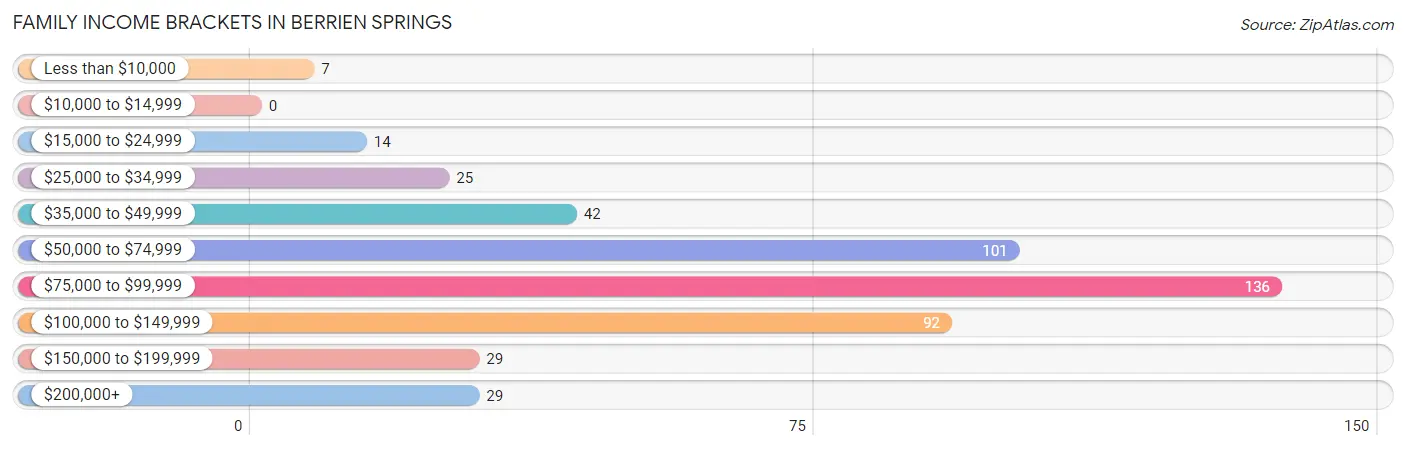
| Income Bracket | # Families | % Families |
| Less than $10,000 | 7 | 1.5% |
| $10,000 to $14,999 | 0 | 0.0% |
| $15,000 to $24,999 | 14 | 2.9% |
| $25,000 to $34,999 | 25 | 5.3% |
| $35,000 to $49,999 | 42 | 8.8% |
| $50,000 to $74,999 | 101 | 21.3% |
| $75,000 to $99,999 | 136 | 28.6% |
| $100,000 to $149,999 | 92 | 19.4% |
| $150,000 to $199,999 | 29 | 6.1% |
| $200,000+ | 29 | 6.1% |
Family Income by Famaliy Size in Berrien Springs
5-person families (57 | 12.0%) account for the highest median family income in Berrien Springs with $100,417 per family, while 2-person families (217 | 45.7%) have the highest median income of $37,375 per family member.
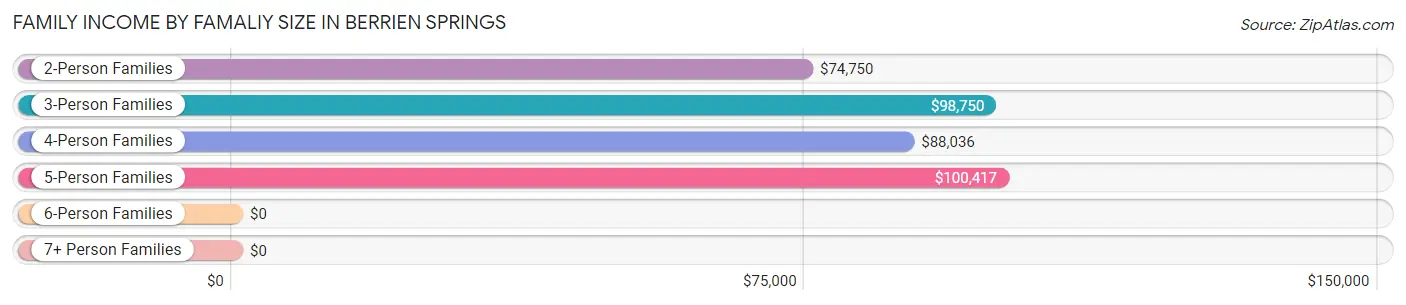
| Income Bracket | # Families | Median Income |
| 2-Person Families | 217 (45.7%) | $74,750 |
| 3-Person Families | 116 (24.4%) | $98,750 |
| 4-Person Families | 73 (15.4%) | $88,036 |
| 5-Person Families | 57 (12.0%) | $100,417 |
| 6-Person Families | 6 (1.3%) | $0 |
| 7+ Person Families | 6 (1.3%) | $0 |
| Total | 475 (100.0%) | $82,165 |
Family Income by Number of Earners in Berrien Springs
The median family income in Berrien Springs is $82,165, with families comprising 3+ earners (59) having the highest median family income of $126,964, while families with no earners (53) have the lowest median family income of $37,212, accounting for 12.4% and 11.2% of families, respectively.
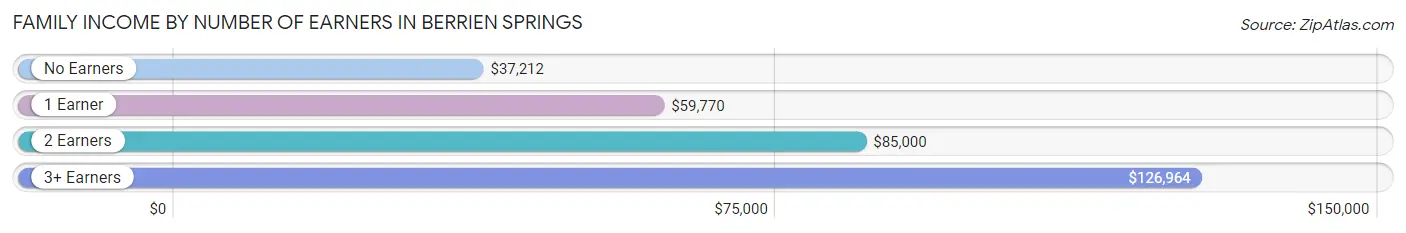
| Number of Earners | # Families | Median Income |
| No Earners | 53 (11.2%) | $37,212 |
| 1 Earner | 163 (34.3%) | $59,770 |
| 2 Earners | 200 (42.1%) | $85,000 |
| 3+ Earners | 59 (12.4%) | $126,964 |
| Total | 475 (100.0%) | $82,165 |
Household Income in Berrien Springs
Household Income Brackets in Berrien Springs
With 159 households falling in the category, the $75,000 to $99,999 income range is the most frequent in Berrien Springs, accounting for 20.6% of all households. In contrast, only 29 households (3.8%) fall into the $150,000 to $199,999 income bracket, making it the least populous group.
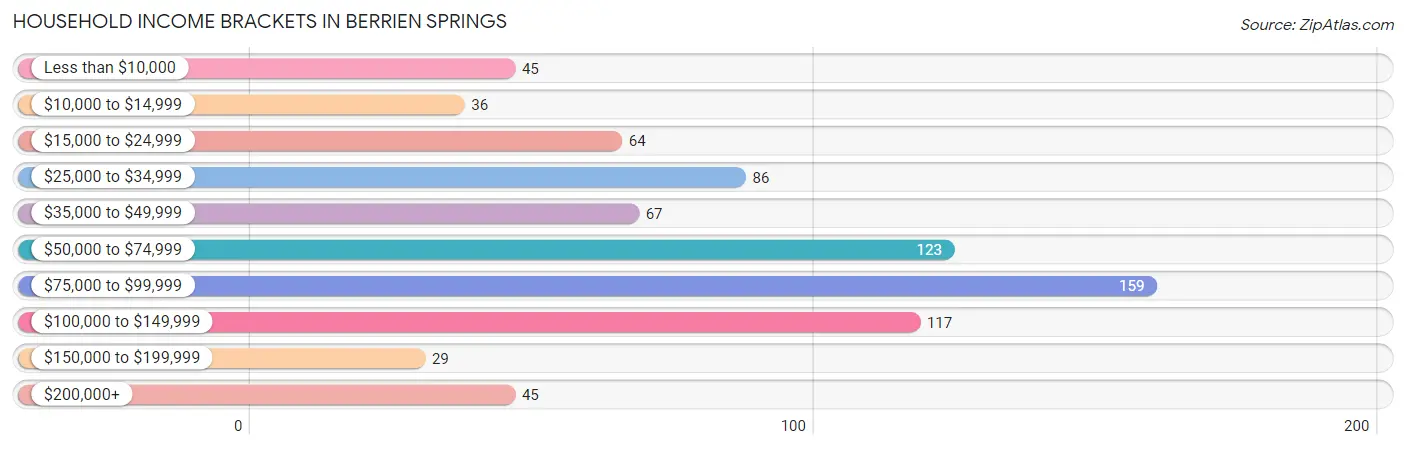
| Income Bracket | # Households | % Households |
| Less than $10,000 | 45 | 5.8% |
| $10,000 to $14,999 | 36 | 4.7% |
| $15,000 to $24,999 | 64 | 8.3% |
| $25,000 to $34,999 | 86 | 11.2% |
| $35,000 to $49,999 | 67 | 8.7% |
| $50,000 to $74,999 | 123 | 16.0% |
| $75,000 to $99,999 | 159 | 20.6% |
| $100,000 to $149,999 | 117 | 15.2% |
| $150,000 to $199,999 | 29 | 3.8% |
| $200,000+ | 45 | 5.8% |
Household Income by Householder Age in Berrien Springs
The median household income in Berrien Springs is $61,328, with the highest median household income of $80,481 found in the 25 to 44 years age bracket for the primary householder. A total of 253 households (32.8%) fall into this category. Meanwhile, the 15 to 24 years age bracket for the primary householder has the lowest median household income of $30,324, with 97 households (12.6%) in this group.
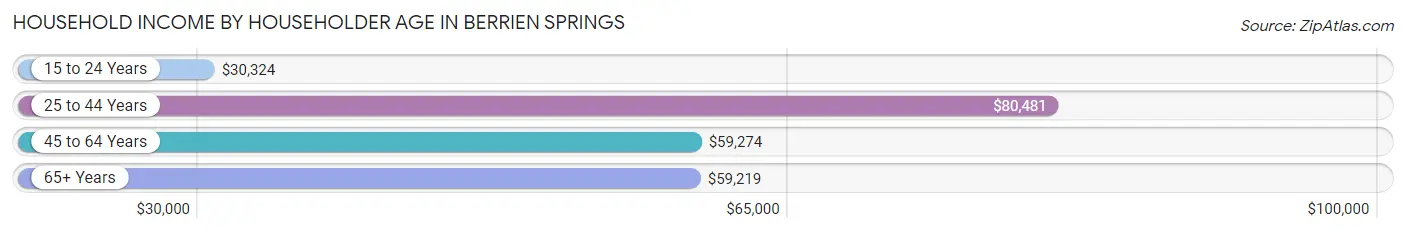
| Income Bracket | # Households | Median Income |
| 15 to 24 Years | 97 (12.6%) | $30,324 |
| 25 to 44 Years | 253 (32.8%) | $80,481 |
| 45 to 64 Years | 278 (36.1%) | $59,274 |
| 65+ Years | 143 (18.5%) | $59,219 |
| Total | 771 (100.0%) | $61,328 |
Poverty in Berrien Springs
Income Below Poverty by Sex and Age in Berrien Springs
With 12.9% poverty level for males and 16.6% for females among the residents of Berrien Springs, 18 to 24 year old males and 15 year old females are the most vulnerable to poverty, with 62 males (36.3%) and 7 females (35.0%) in their respective age groups living below the poverty level.
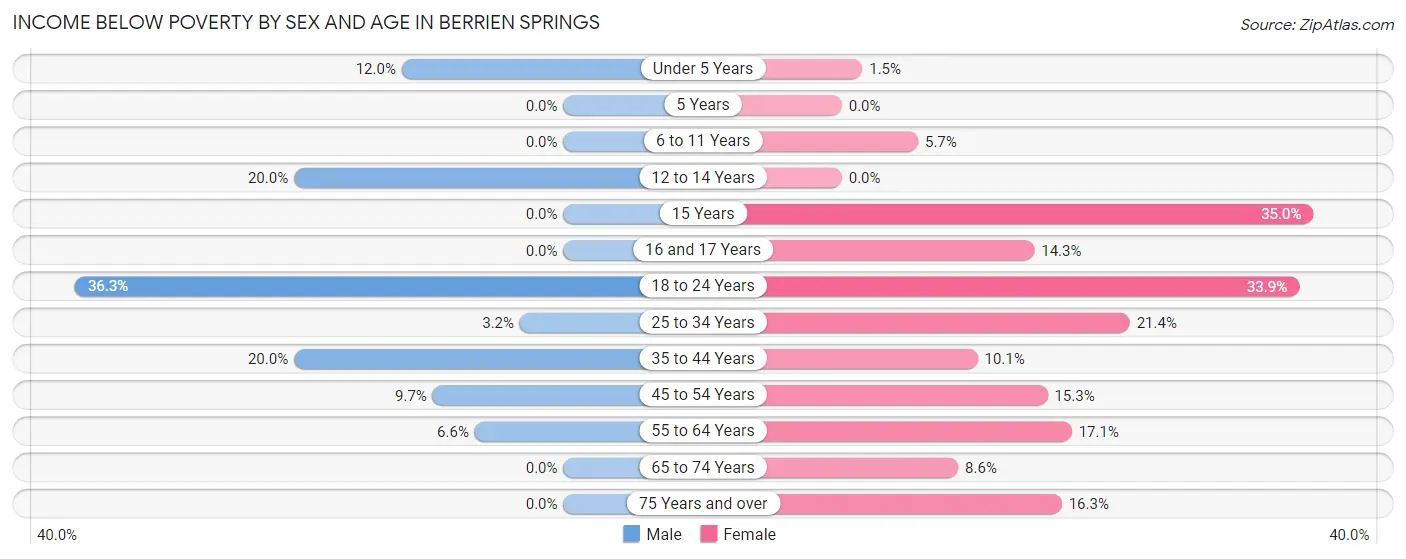
| Age Bracket | Male | Female |
| Under 5 Years | 3 (12.0%) | 1 (1.5%) |
| 5 Years | 0 (0.0%) | 0 (0.0%) |
| 6 to 11 Years | 0 (0.0%) | 3 (5.7%) |
| 12 to 14 Years | 10 (20.0%) | 0 (0.0%) |
| 15 Years | 0 (0.0%) | 7 (35.0%) |
| 16 and 17 Years | 0 (0.0%) | 6 (14.3%) |
| 18 to 24 Years | 62 (36.3%) | 56 (33.9%) |
| 25 to 34 Years | 3 (3.2%) | 34 (21.4%) |
| 35 to 44 Years | 28 (20.0%) | 13 (10.1%) |
| 45 to 54 Years | 13 (9.7%) | 20 (15.3%) |
| 55 to 64 Years | 10 (6.6%) | 14 (17.1%) |
| 65 to 74 Years | 0 (0.0%) | 7 (8.6%) |
| 75 Years and over | 0 (0.0%) | 8 (16.3%) |
| Total | 129 (12.9%) | 169 (16.6%) |
Income Above Poverty by Sex and Age in Berrien Springs
According to the poverty statistics in Berrien Springs, males aged 5 years and females aged 5 years are the age groups that are most secure financially, with 100.0% of males and 100.0% of females in these age groups living above the poverty line.
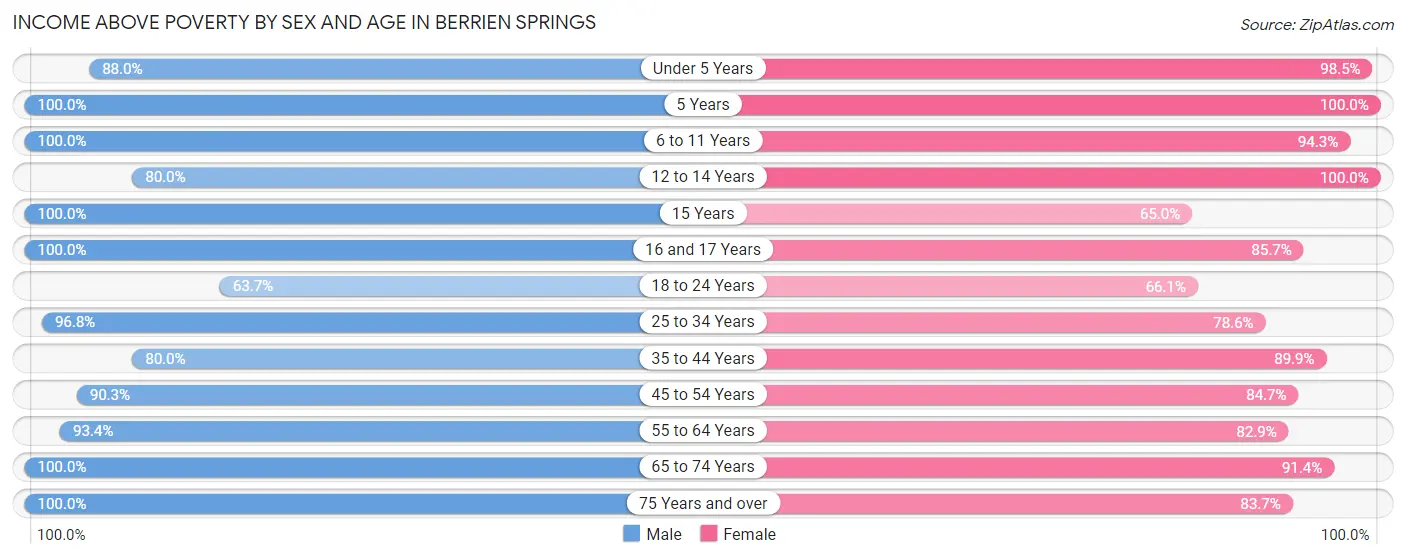
| Age Bracket | Male | Female |
| Under 5 Years | 22 (88.0%) | 65 (98.5%) |
| 5 Years | 12 (100.0%) | 9 (100.0%) |
| 6 to 11 Years | 69 (100.0%) | 50 (94.3%) |
| 12 to 14 Years | 40 (80.0%) | 31 (100.0%) |
| 15 Years | 4 (100.0%) | 13 (65.0%) |
| 16 and 17 Years | 37 (100.0%) | 36 (85.7%) |
| 18 to 24 Years | 109 (63.7%) | 109 (66.1%) |
| 25 to 34 Years | 90 (96.8%) | 125 (78.6%) |
| 35 to 44 Years | 112 (80.0%) | 116 (89.9%) |
| 45 to 54 Years | 121 (90.3%) | 111 (84.7%) |
| 55 to 64 Years | 142 (93.4%) | 68 (82.9%) |
| 65 to 74 Years | 69 (100.0%) | 74 (91.4%) |
| 75 Years and over | 44 (100.0%) | 41 (83.7%) |
| Total | 871 (87.1%) | 848 (83.4%) |
Income Below Poverty Among Married-Couple Families in Berrien Springs
The poverty statistics for married-couple families in Berrien Springs show that 3.1% or 11 of the total 356 families live below the poverty line. Families with 1 or 2 children have the highest poverty rate of 8.5%, comprising of 11 families. On the other hand, families with no children have the lowest poverty rate of 0.0%, which includes 0 families.
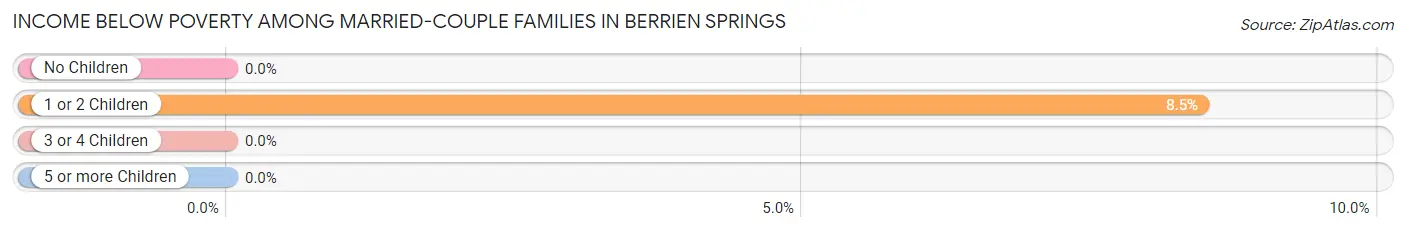
| Children | Above Poverty | Below Poverty |
| No Children | 191 (100.0%) | 0 (0.0%) |
| 1 or 2 Children | 119 (91.5%) | 11 (8.5%) |
| 3 or 4 Children | 32 (100.0%) | 0 (0.0%) |
| 5 or more Children | 3 (100.0%) | 0 (0.0%) |
| Total | 345 (96.9%) | 11 (3.1%) |
Income Below Poverty Among Single-Parent Households in Berrien Springs
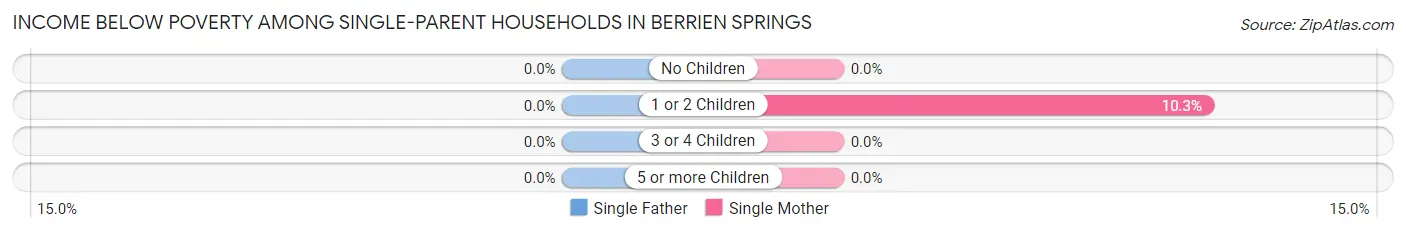
| Children | Single Father | Single Mother |
| No Children | 0 (0.0%) | 0 (0.0%) |
| 1 or 2 Children | 0 (0.0%) | 6 (10.3%) |
| 3 or 4 Children | 0 (0.0%) | 0 (0.0%) |
| 5 or more Children | 0 (0.0%) | 0 (0.0%) |
| Total | 0 (0.0%) | 6 (7.7%) |
Income Below Poverty Among Married-Couple vs Single-Parent Households in Berrien Springs
The poverty data for Berrien Springs shows that 11 of the married-couple family households (3.1%) and 6 of the single-parent households (5.0%) are living below the poverty level. Within the married-couple family households, those with 1 or 2 children have the highest poverty rate, with 11 households (8.5%) falling below the poverty line. Among the single-parent households, those with 1 or 2 children have the highest poverty rate, with 6 household (9.0%) living below poverty.
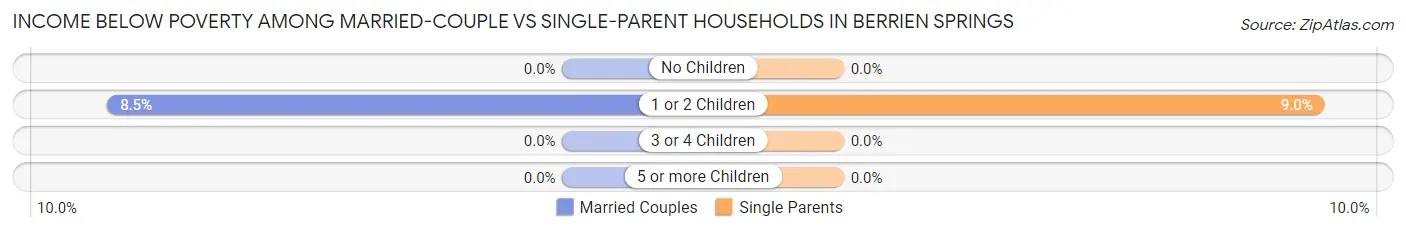
| Children | Married-Couple Families | Single-Parent Households |
| No Children | 0 (0.0%) | 0 (0.0%) |
| 1 or 2 Children | 11 (8.5%) | 6 (9.0%) |
| 3 or 4 Children | 0 (0.0%) | 0 (0.0%) |
| 5 or more Children | 0 (0.0%) | 0 (0.0%) |
| Total | 11 (3.1%) | 6 (5.0%) |
Race in Berrien Springs
The most populous races in Berrien Springs are White / Caucasian (1,180 | 58.4%), Black / African American (389 | 19.2%), and Hispanic or Latino (234 | 11.6%).
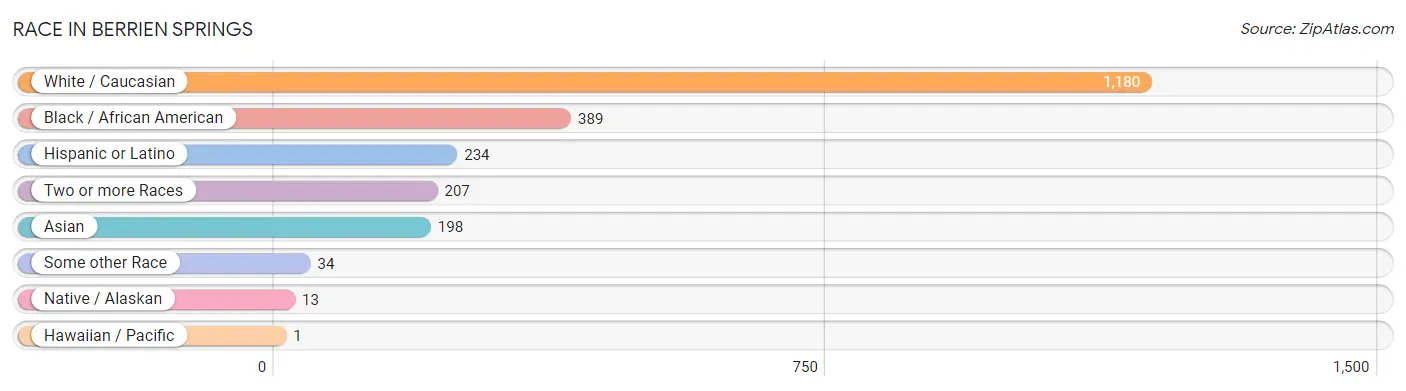
| Race | # Population | % Population |
| Asian | 198 | 9.8% |
| Black / African American | 389 | 19.2% |
| Hawaiian / Pacific | 1 | 0.1% |
| Hispanic or Latino | 234 | 11.6% |
| Native / Alaskan | 13 | 0.6% |
| White / Caucasian | 1,180 | 58.4% |
| Two or more Races | 207 | 10.2% |
| Some other Race | 34 | 1.7% |
| Total | 2,022 | 100.0% |
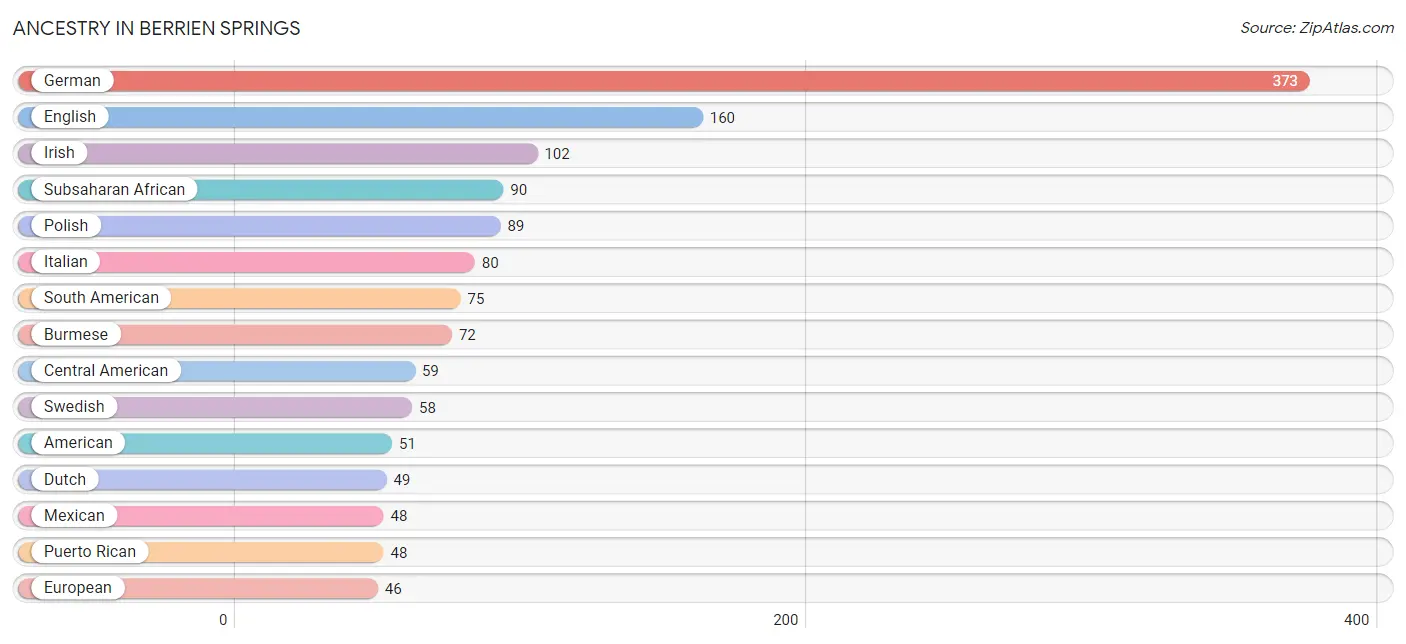
Ancestry in Berrien Springs
The most populous ancestries reported in Berrien Springs are German (373 | 18.4%), English (160 | 7.9%), Irish (102 | 5.0%), Subsaharan African (90 | 4.4%), and Polish (89 | 4.4%), together accounting for 40.2% of all Berrien Springs residents.
| Ancestry | # Population | % Population |
| African | 29 | 1.4% |
| American | 51 | 2.5% |
| Arab | 14 | 0.7% |
| Argentinean | 18 | 0.9% |
| Barbadian | 4 | 0.2% |
| Bhutanese | 30 | 1.5% |
| Brazilian | 3 | 0.2% |
| British | 9 | 0.4% |
| British West Indian | 24 | 1.2% |
| Burmese | 72 | 3.6% |
| Canadian | 5 | 0.3% |
| Central American | 59 | 2.9% |
| Central American Indian | 10 | 0.5% |
| Cherokee | 19 | 0.9% |
| Colombian | 30 | 1.5% |
| Costa Rican | 10 | 0.5% |
| Cuban | 2 | 0.1% |
| Czech | 2 | 0.1% |
| Danish | 13 | 0.6% |
| Dominican | 2 | 0.1% |
| Dutch | 49 | 2.4% |
| English | 160 | 7.9% |
| European | 46 | 2.3% |
| French | 30 | 1.5% |
| French Canadian | 4 | 0.2% |
| German | 373 | 18.4% |
| Guatemalan | 15 | 0.7% |
| Haitian | 33 | 1.6% |
| Honduran | 17 | 0.8% |
| Hungarian | 7 | 0.4% |
| Indian (Asian) | 10 | 0.5% |
| Iranian | 2 | 0.1% |
| Irish | 102 | 5.0% |
| Iroquois | 2 | 0.1% |
| Italian | 80 | 4.0% |
| Jamaican | 40 | 2.0% |
| Korean | 32 | 1.6% |
| Laotian | 40 | 2.0% |
| Lebanese | 14 | 0.7% |
| Mexican | 48 | 2.4% |
| Mongolian | 8 | 0.4% |
| Nicaraguan | 6 | 0.3% |
| Norwegian | 20 | 1.0% |
| Okinawan | 15 | 0.7% |
| Panamanian | 11 | 0.5% |
| Peruvian | 22 | 1.1% |
| Polish | 89 | 4.4% |
| Portuguese | 28 | 1.4% |
| Potawatomi | 16 | 0.8% |
| Puerto Rican | 48 | 2.4% |
| Russian | 15 | 0.7% |
| Scandinavian | 7 | 0.4% |
| Scotch-Irish | 10 | 0.5% |
| Scottish | 21 | 1.0% |
| Serbian | 11 | 0.5% |
| Sioux | 4 | 0.2% |
| South American | 75 | 3.7% |
| Subsaharan African | 90 | 4.4% |
| Swedish | 58 | 2.9% |
| Thai | 32 | 1.6% |
| Trinidadian and Tobagonian | 10 | 0.5% |
| Ukrainian | 4 | 0.2% |
| Venezuelan | 5 | 0.3% |
| Welsh | 12 | 0.6% |
| West Indian | 4 | 0.2% | View All 65 Rows |
Immigrants in Berrien Springs
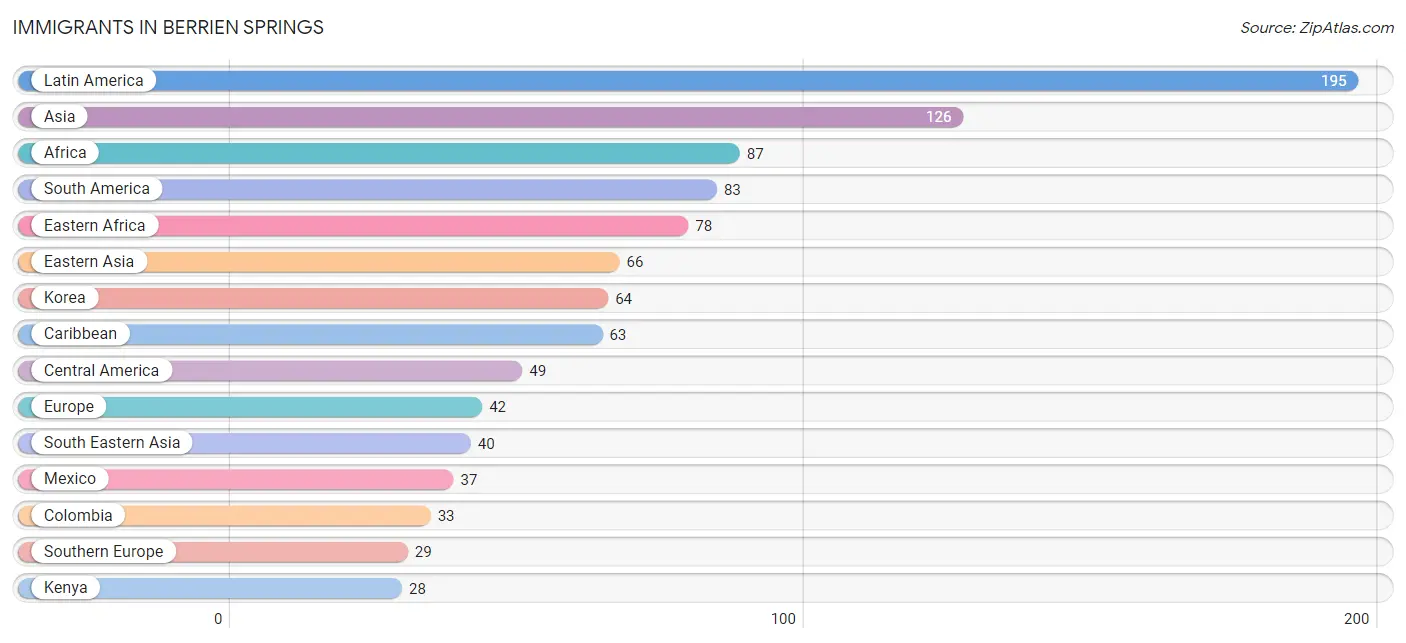
The most numerous immigrant groups reported in Berrien Springs came from Latin America (195 | 9.6%), Asia (126 | 6.2%), Africa (87 | 4.3%), South America (83 | 4.1%), and Eastern Africa (78 | 3.9%), together accounting for 28.1% of all Berrien Springs residents.
| Immigration Origin | # Population | % Population |
| Africa | 87 | 4.3% |
| Argentina | 15 | 0.7% |
| Asia | 126 | 6.2% |
| Bangladesh | 10 | 0.5% |
| Barbados | 4 | 0.2% |
| Brazil | 15 | 0.7% |
| Caribbean | 63 | 3.1% |
| Central America | 49 | 2.4% |
| China | 2 | 0.1% |
| Colombia | 33 | 1.6% |
| Costa Rica | 4 | 0.2% |
| Cuba | 2 | 0.1% |
| Eastern Africa | 78 | 3.9% |
| Eastern Asia | 66 | 3.3% |
| Europe | 42 | 2.1% |
| Germany | 9 | 0.4% |
| Guatemala | 4 | 0.2% |
| Haiti | 23 | 1.1% |
| Honduras | 3 | 0.2% |
| India | 10 | 0.5% |
| Italy | 17 | 0.8% |
| Kenya | 28 | 1.4% |
| Korea | 64 | 3.2% |
| Latin America | 195 | 9.6% |
| Malaysia | 11 | 0.5% |
| Mexico | 37 | 1.8% |
| Nicaragua | 1 | 0.1% |
| Nigeria | 7 | 0.4% |
| Northern Europe | 4 | 0.2% |
| Peru | 15 | 0.7% |
| Philippines | 6 | 0.3% |
| Portugal | 12 | 0.6% |
| Singapore | 12 | 0.6% |
| South America | 83 | 4.1% |
| South Central Asia | 20 | 1.0% |
| South Eastern Asia | 40 | 2.0% |
| Southern Europe | 29 | 1.4% |
| Thailand | 11 | 0.5% |
| Trinidad and Tobago | 10 | 0.5% |
| Venezuela | 5 | 0.3% |
| Western Africa | 7 | 0.4% |
| Western Europe | 9 | 0.4% | View All 42 Rows |
Sex and Age in Berrien Springs
Sex and Age in Berrien Springs
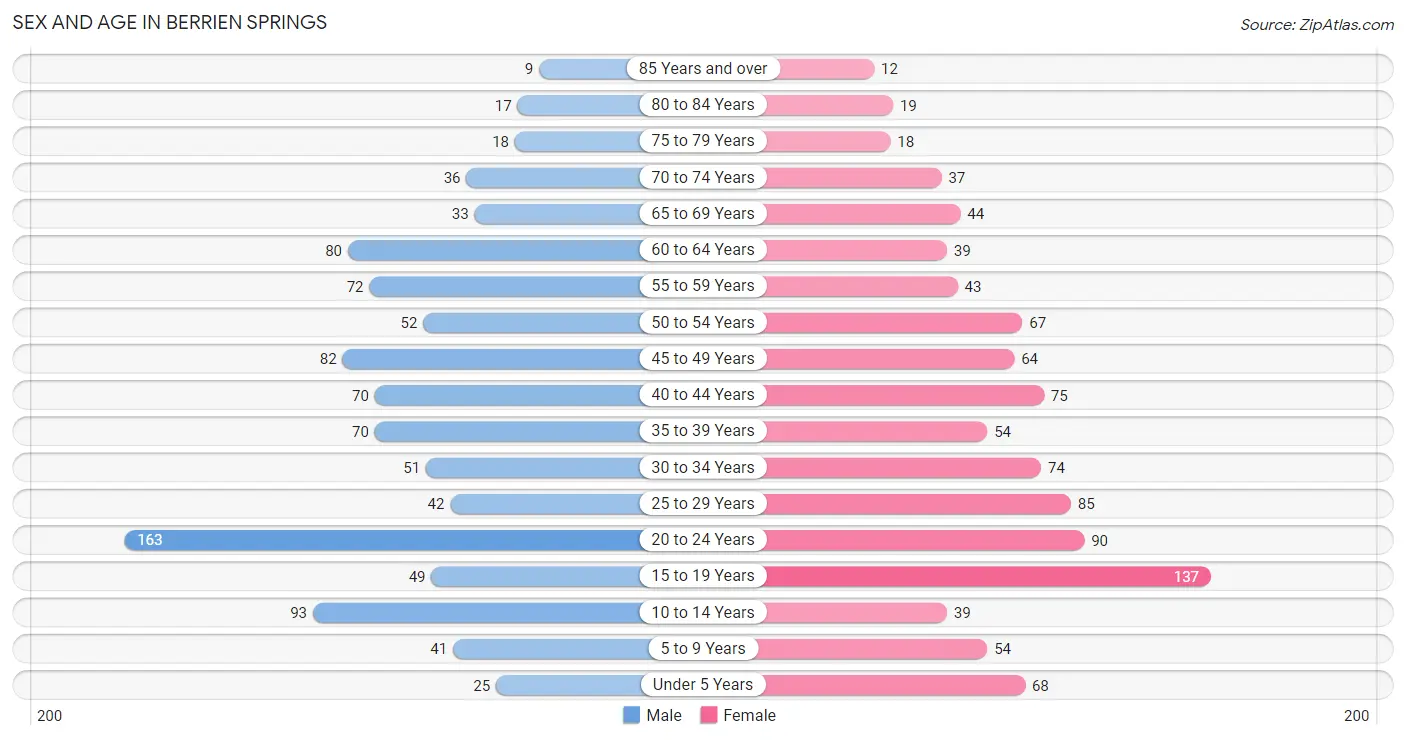
The most populous age groups in Berrien Springs are 20 to 24 Years (163 | 16.3%) for men and 15 to 19 Years (137 | 13.4%) for women.
| Age Bracket | Male | Female |
| Under 5 Years | 25 (2.5%) | 68 (6.7%) |
| 5 to 9 Years | 41 (4.1%) | 54 (5.3%) |
| 10 to 14 Years | 93 (9.3%) | 39 (3.8%) |
| 15 to 19 Years | 49 (4.9%) | 137 (13.4%) |
| 20 to 24 Years | 163 (16.3%) | 90 (8.8%) |
| 25 to 29 Years | 42 (4.2%) | 85 (8.3%) |
| 30 to 34 Years | 51 (5.1%) | 74 (7.3%) |
| 35 to 39 Years | 70 (7.0%) | 54 (5.3%) |
| 40 to 44 Years | 70 (7.0%) | 75 (7.4%) |
| 45 to 49 Years | 82 (8.2%) | 64 (6.3%) |
| 50 to 54 Years | 52 (5.2%) | 67 (6.6%) |
| 55 to 59 Years | 72 (7.2%) | 43 (4.2%) |
| 60 to 64 Years | 80 (8.0%) | 39 (3.8%) |
| 65 to 69 Years | 33 (3.3%) | 44 (4.3%) |
| 70 to 74 Years | 36 (3.6%) | 37 (3.6%) |
| 75 to 79 Years | 18 (1.8%) | 18 (1.8%) |
| 80 to 84 Years | 17 (1.7%) | 19 (1.9%) |
| 85 Years and over | 9 (0.9%) | 12 (1.2%) |
| Total | 1,003 (100.0%) | 1,019 (100.0%) |
Families and Households in Berrien Springs
Median Family Size in Berrien Springs
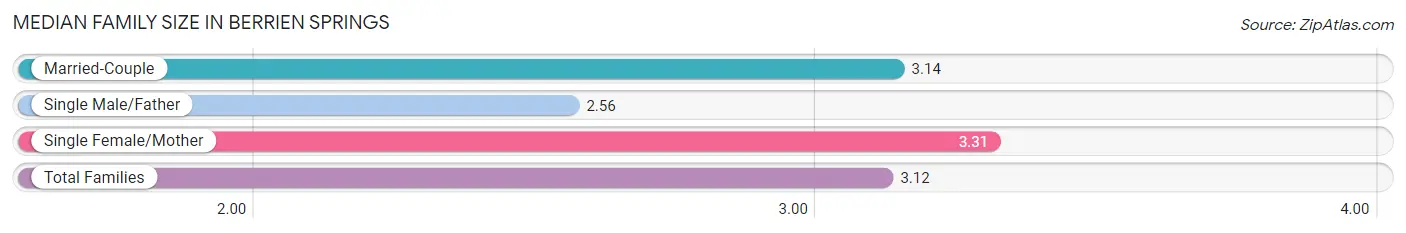
The median family size in Berrien Springs is 3.12 persons per family, with single female/mother families (78 | 16.4%) accounting for the largest median family size of 3.31 persons per family. On the other hand, single male/father families (41 | 8.6%) represent the smallest median family size with 2.56 persons per family.
| Family Type | # Families | Family Size |
| Married-Couple | 356 (75.0%) | 3.14 |
| Single Male/Father | 41 (8.6%) | 2.56 |
| Single Female/Mother | 78 (16.4%) | 3.31 |
| Total Families | 475 (100.0%) | 3.12 |
Median Household Size in Berrien Springs
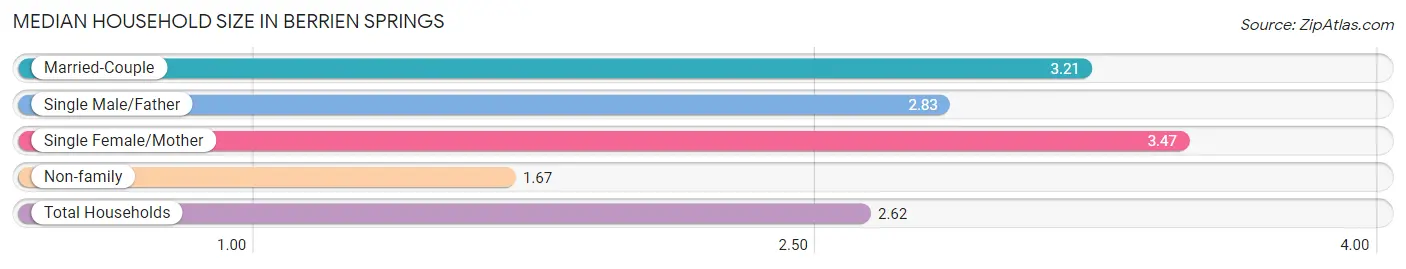
The median household size in Berrien Springs is 2.62 persons per household, with single female/mother households (78 | 10.1%) accounting for the largest median household size of 3.47 persons per household. non-family households (296 | 38.4%) represent the smallest median household size with 1.67 persons per household.
| Household Type | # Households | Household Size |
| Married-Couple | 356 (46.2%) | 3.21 |
| Single Male/Father | 41 (5.3%) | 2.83 |
| Single Female/Mother | 78 (10.1%) | 3.47 |
| Non-family | 296 (38.4%) | 1.67 |
| Total Households | 771 (100.0%) | 2.62 |
Household Size by Marriage Status in Berrien Springs
Out of a total of 771 households in Berrien Springs, 475 (61.6%) are family households, while 296 (38.4%) are nonfamily households. The most numerous type of family households are 2-person households, comprising 207, and the most common type of nonfamily households are 1-person households, comprising 193.
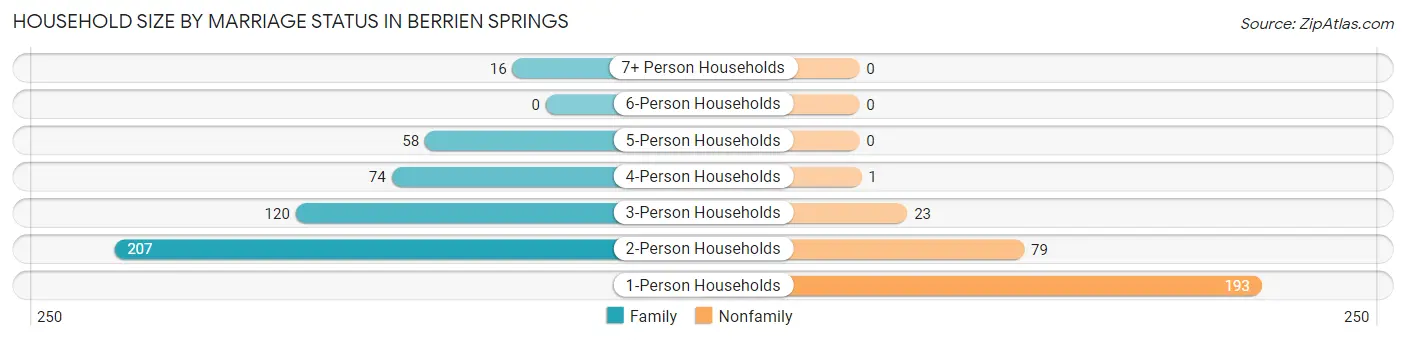
| Household Size | Family Households | Nonfamily Households |
| 1-Person Households | - | 193 (25.0%) |
| 2-Person Households | 207 (26.9%) | 79 (10.2%) |
| 3-Person Households | 120 (15.6%) | 23 (3.0%) |
| 4-Person Households | 74 (9.6%) | 1 (0.1%) |
| 5-Person Households | 58 (7.5%) | 0 (0.0%) |
| 6-Person Households | 0 (0.0%) | 0 (0.0%) |
| 7+ Person Households | 16 (2.1%) | 0 (0.0%) |
| Total | 475 (61.6%) | 296 (38.4%) |
Female Fertility in Berrien Springs
Fertility by Age in Berrien Springs
Average fertility rate in Berrien Springs is 48.0 births per 1,000 women. Women in the age bracket of 20 to 34 years have the highest fertility rate with 88.0 births per 1,000 women. Women in the age bracket of 20 to 34 years acount for 78.6% of all women with births.
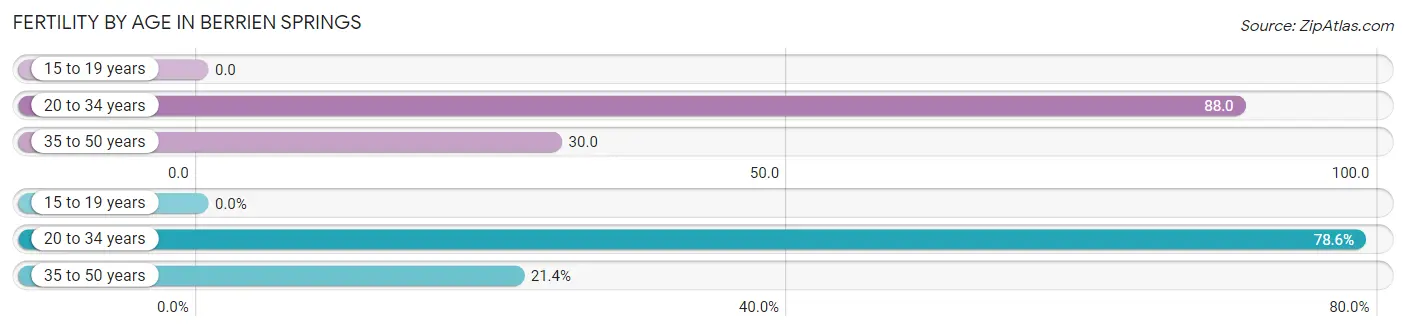
| Age Bracket | Women with Births | Births / 1,000 Women |
| 15 to 19 years | 0 (0.0%) | 0.0 |
| 20 to 34 years | 22 (78.6%) | 88.0 |
| 35 to 50 years | 6 (21.4%) | 30.0 |
| Total | 28 (100.0%) | 48.0 |
Fertility by Age by Marriage Status in Berrien Springs
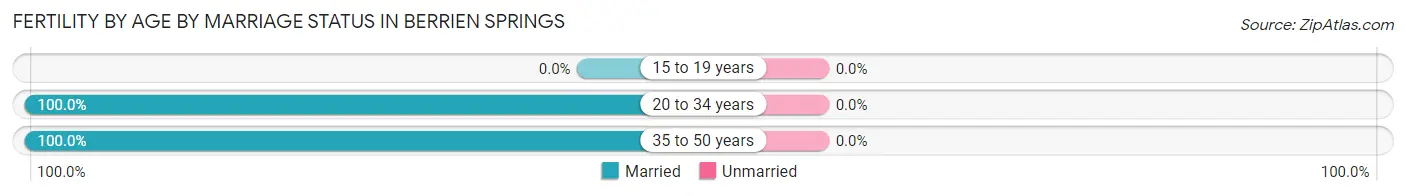
| Age Bracket | Married | Unmarried |
| 15 to 19 years | 0 (0.0%) | 0 (0.0%) |
| 20 to 34 years | 22 (100.0%) | 0 (0.0%) |
| 35 to 50 years | 6 (100.0%) | 0 (0.0%) |
| Total | 28 (100.0%) | 0 (0.0%) |
Fertility by Education in Berrien Springs
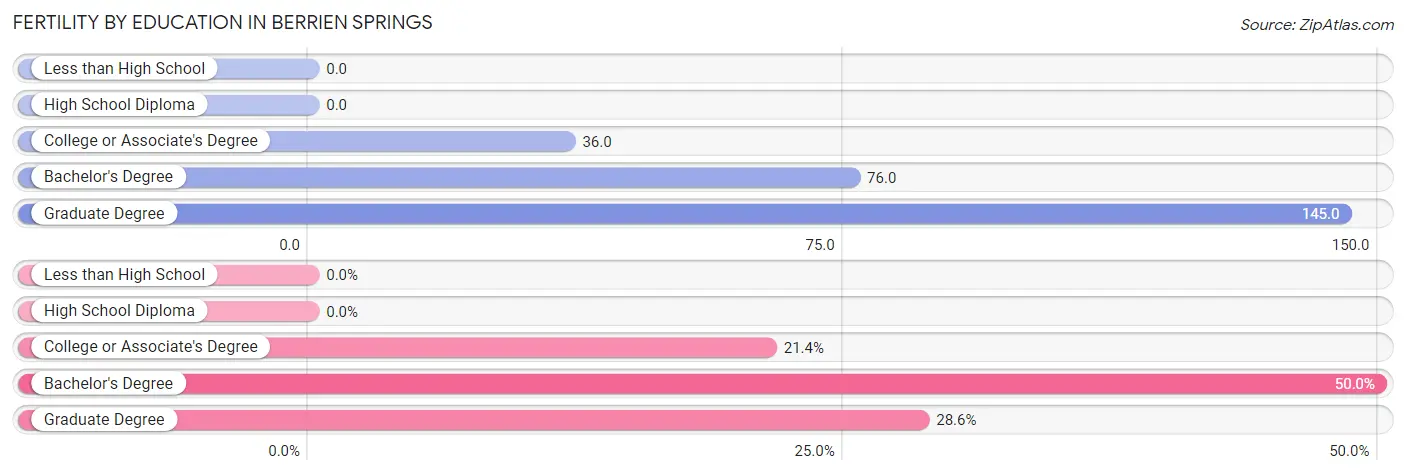
| Educational Attainment | Women with Births | Births / 1,000 Women |
| Less than High School | 0 (0.0%) | 0.0 |
| High School Diploma | 0 (0.0%) | 0.0 |
| College or Associate's Degree | 6 (21.4%) | 36.0 |
| Bachelor's Degree | 14 (50.0%) | 76.0 |
| Graduate Degree | 8 (28.6%) | 145.0 |
| Total | 28 (100.0%) | 48.0 |
Fertility by Education by Marriage Status in Berrien Springs
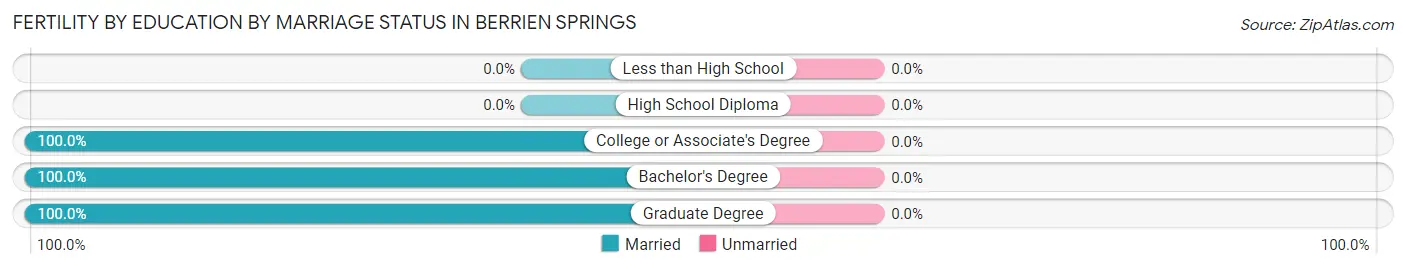
| Educational Attainment | Married | Unmarried |
| Less than High School | 0 (0.0%) | 0 (0.0%) |
| High School Diploma | 0 (0.0%) | 0 (0.0%) |
| College or Associate's Degree | 6 (100.0%) | 0 (0.0%) |
| Bachelor's Degree | 14 (100.0%) | 0 (0.0%) |
| Graduate Degree | 8 (100.0%) | 0 (0.0%) |
| Total | 28 (100.0%) | 0 (0.0%) |
Employment Characteristics in Berrien Springs
Employment by Class of Employer in Berrien Springs
Among the 938 employed individuals in Berrien Springs, private company employees (523 | 55.8%), not-for-profit organizations (214 | 22.8%), and local government employees (86 | 9.2%) make up the most common classes of employment.
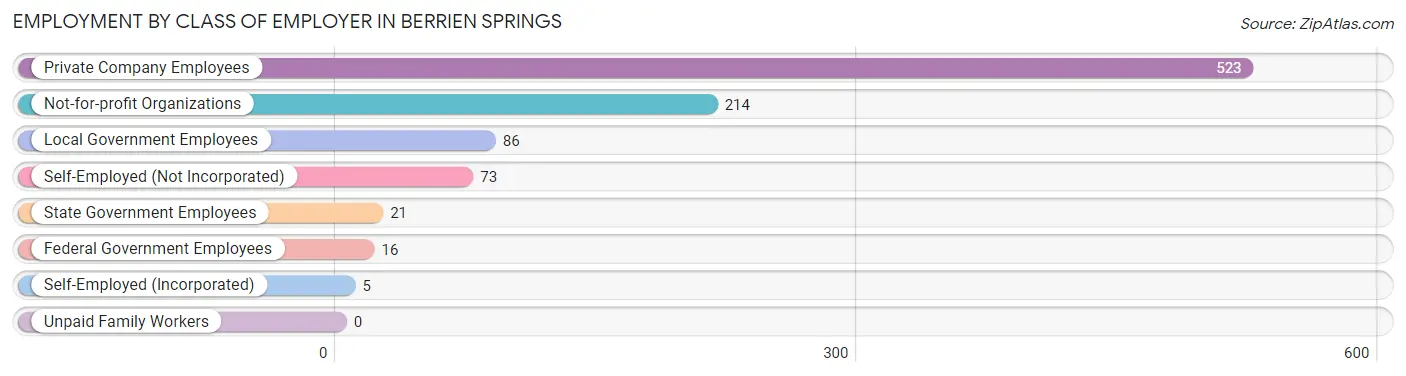
| Employer Class | # Employees | % Employees |
| Private Company Employees | 523 | 55.8% |
| Self-Employed (Incorporated) | 5 | 0.5% |
| Self-Employed (Not Incorporated) | 73 | 7.8% |
| Not-for-profit Organizations | 214 | 22.8% |
| Local Government Employees | 86 | 9.2% |
| State Government Employees | 21 | 2.2% |
| Federal Government Employees | 16 | 1.7% |
| Unpaid Family Workers | 0 | 0.0% |
| Total | 938 | 100.0% |
Employment Status by Age in Berrien Springs
According to the labor force statistics for Berrien Springs, out of the total population over 16 years of age (1,678), 63.0% or 1,057 individuals are in the labor force, with 9.6% or 101 of them unemployed. The age group with the highest labor force participation rate is 30 to 34 years, with 80.8% or 101 individuals in the labor force. Within the labor force, the 16 to 19 years age range has the highest percentage of unemployed individuals, with 47.4% or 37 of them being unemployed.
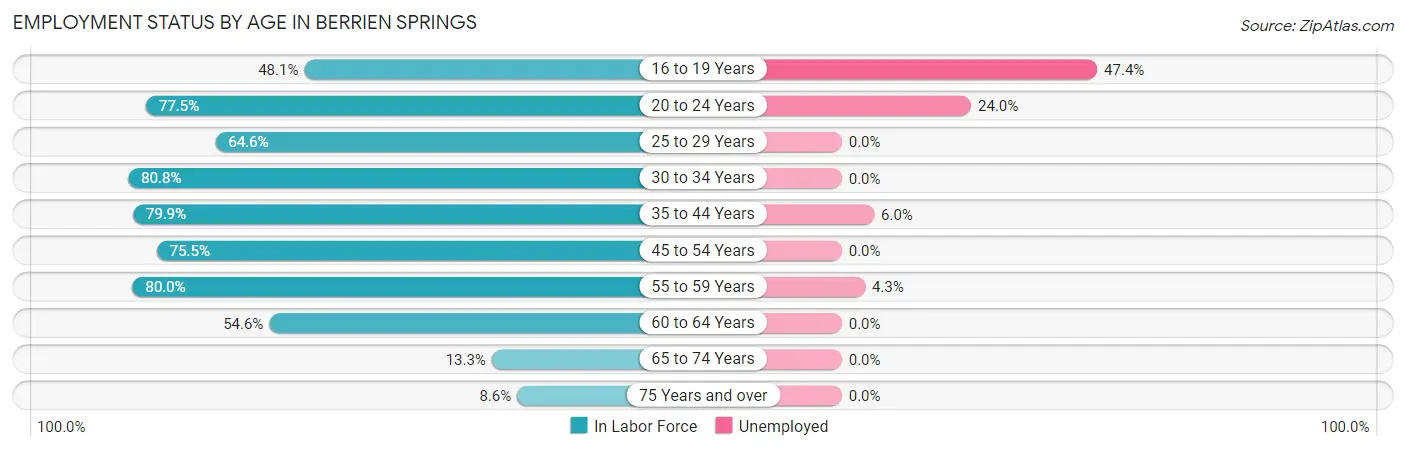
| Age Bracket | In Labor Force | Unemployed |
| 16 to 19 Years | 78 (48.1%) | 37 (47.4%) |
| 20 to 24 Years | 196 (77.5%) | 47 (24.0%) |
| 25 to 29 Years | 82 (64.6%) | 0 (0.0%) |
| 30 to 34 Years | 101 (80.8%) | 0 (0.0%) |
| 35 to 44 Years | 215 (79.9%) | 13 (6.0%) |
| 45 to 54 Years | 200 (75.5%) | 0 (0.0%) |
| 55 to 59 Years | 92 (80.0%) | 4 (4.3%) |
| 60 to 64 Years | 65 (54.6%) | 0 (0.0%) |
| 65 to 74 Years | 20 (13.3%) | 0 (0.0%) |
| 75 Years and over | 8 (8.6%) | 0 (0.0%) |
| Total | 1,057 (63.0%) | 101 (9.6%) |
Employment Status by Educational Attainment in Berrien Springs
According to labor force statistics for Berrien Springs, 74.0% of individuals (755) out of the total population between 25 and 64 years of age (1,020) are in the labor force, with 2.3% or 17 of them being unemployed. The group with the highest labor force participation rate are those with the educational attainment of bachelor's degree or higher, with 77.4% or 380 individuals in the labor force. Within the labor force, individuals with high school diploma education have the highest percentage of unemployment, with 4.5% or 6 of them being unemployed.
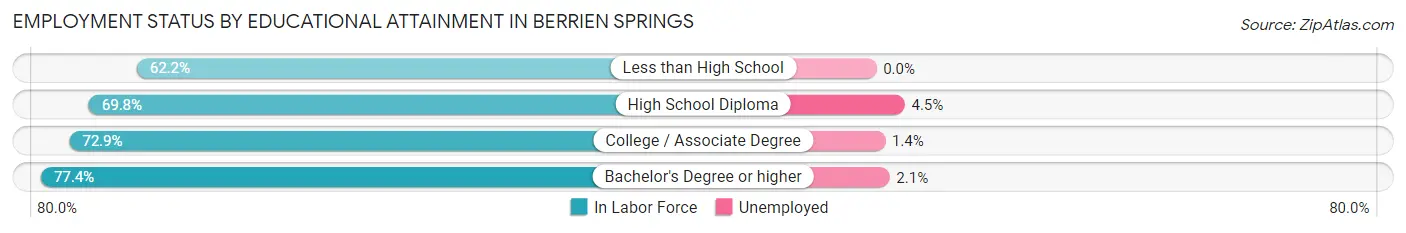
| Educational Attainment | In Labor Force | Unemployed |
| Less than High School | 28 (62.2%) | 0 (0.0%) |
| High School Diploma | 134 (69.8%) | 9 (4.5%) |
| College / Associate Degree | 213 (72.9%) | 4 (1.4%) |
| Bachelor's Degree or higher | 380 (77.4%) | 10 (2.1%) |
| Total | 755 (74.0%) | 23 (2.3%) |
Employment Occupations by Sex in Berrien Springs
Management, Business, Science and Arts Occupations
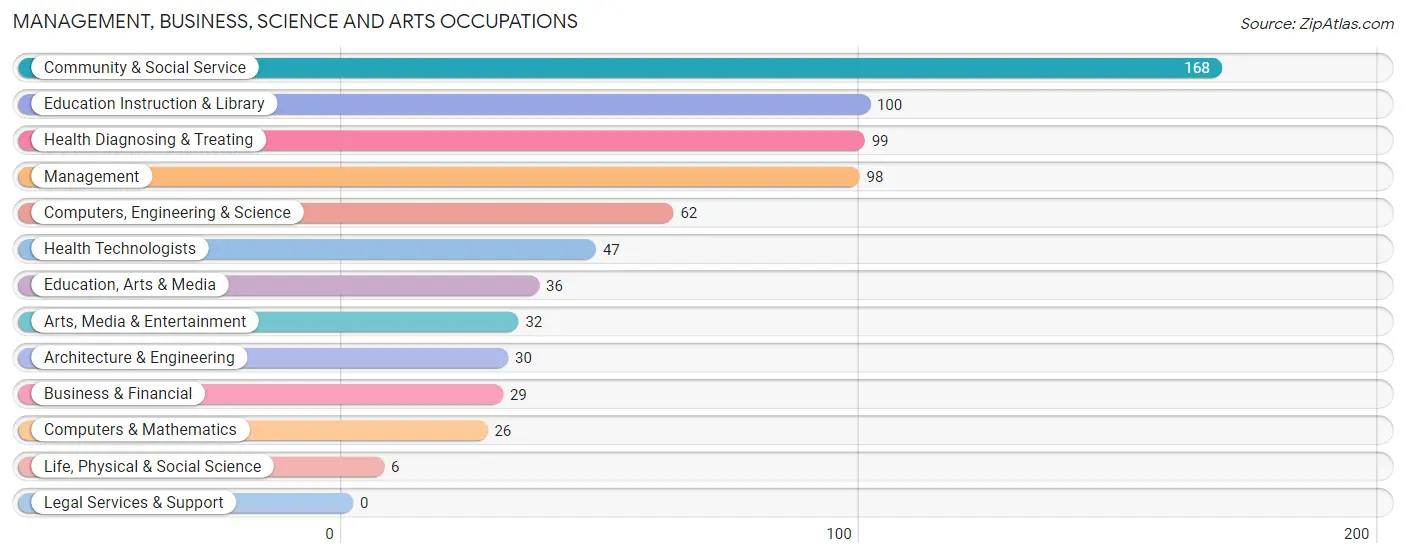
The most common Management, Business, Science and Arts occupations in Berrien Springs are Community & Social Service (168 | 17.6%), Education Instruction & Library (100 | 10.5%), Health Diagnosing & Treating (99 | 10.4%), Management (98 | 10.2%), and Computers, Engineering & Science (62 | 6.5%).
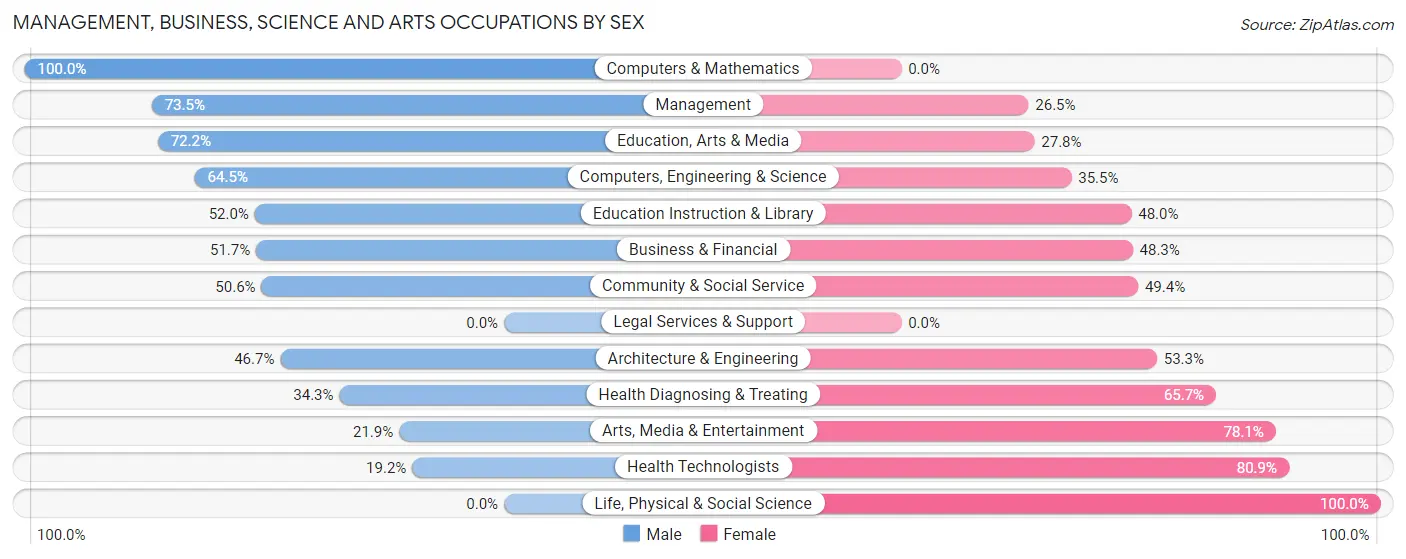
Management, Business, Science and Arts Occupations by Sex
Within the Management, Business, Science and Arts occupations in Berrien Springs, the most male-oriented occupations are Computers & Mathematics (100.0%), Management (73.5%), and Education, Arts & Media (72.2%), while the most female-oriented occupations are Life, Physical & Social Science (100.0%), Health Technologists (80.8%), and Arts, Media & Entertainment (78.1%).
| Occupation | Male | Female |
| Management | 72 (73.5%) | 26 (26.5%) |
| Business & Financial | 15 (51.7%) | 14 (48.3%) |
| Computers, Engineering & Science | 40 (64.5%) | 22 (35.5%) |
| Computers & Mathematics | 26 (100.0%) | 0 (0.0%) |
| Architecture & Engineering | 14 (46.7%) | 16 (53.3%) |
| Life, Physical & Social Science | 0 (0.0%) | 6 (100.0%) |
| Community & Social Service | 85 (50.6%) | 83 (49.4%) |
| Education, Arts & Media | 26 (72.2%) | 10 (27.8%) |
| Legal Services & Support | 0 (0.0%) | 0 (0.0%) |
| Education Instruction & Library | 52 (52.0%) | 48 (48.0%) |
| Arts, Media & Entertainment | 7 (21.9%) | 25 (78.1%) |
| Health Diagnosing & Treating | 34 (34.3%) | 65 (65.7%) |
| Health Technologists | 9 (19.2%) | 38 (80.8%) |
| Total (Category) | 246 (53.9%) | 210 (46.1%) |
| Total (Overall) | 514 (53.8%) | 442 (46.2%) |
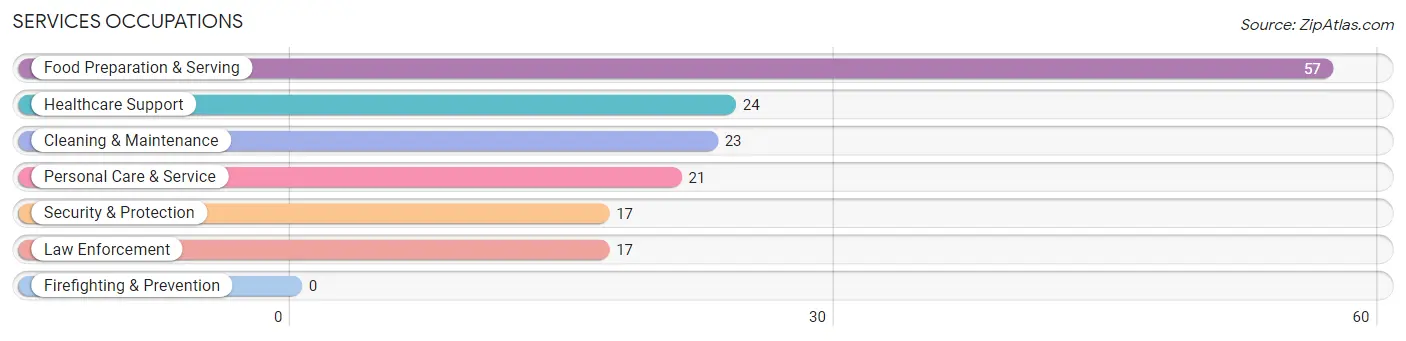
Services Occupations
The most common Services occupations in Berrien Springs are Food Preparation & Serving (57 | 6.0%), Healthcare Support (24 | 2.5%), Cleaning & Maintenance (23 | 2.4%), Personal Care & Service (21 | 2.2%), and Security & Protection (17 | 1.8%).
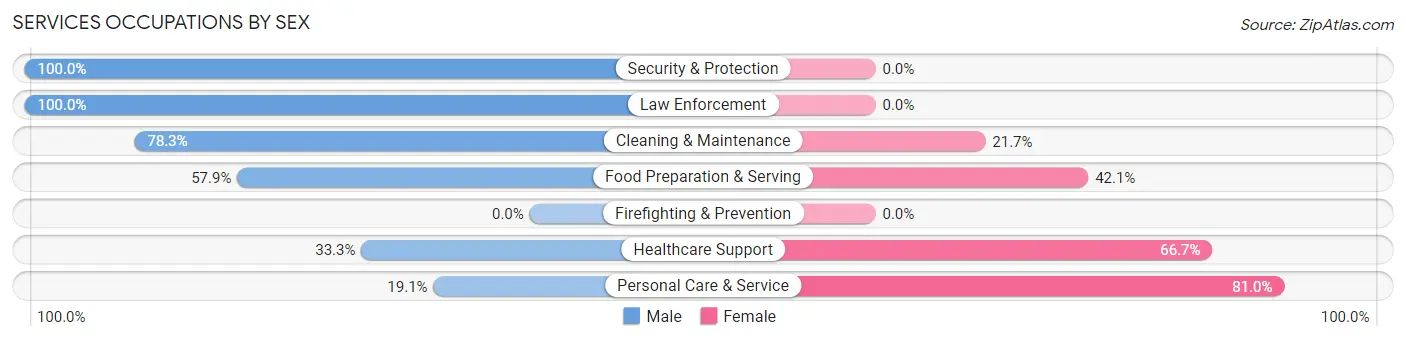
Services Occupations by Sex
Within the Services occupations in Berrien Springs, the most male-oriented occupations are Security & Protection (100.0%), Law Enforcement (100.0%), and Cleaning & Maintenance (78.3%), while the most female-oriented occupations are Personal Care & Service (80.9%), Healthcare Support (66.7%), and Food Preparation & Serving (42.1%).
| Occupation | Male | Female |
| Healthcare Support | 8 (33.3%) | 16 (66.7%) |
| Security & Protection | 17 (100.0%) | 0 (0.0%) |
| Firefighting & Prevention | 0 (0.0%) | 0 (0.0%) |
| Law Enforcement | 17 (100.0%) | 0 (0.0%) |
| Food Preparation & Serving | 33 (57.9%) | 24 (42.1%) |
| Cleaning & Maintenance | 18 (78.3%) | 5 (21.7%) |
| Personal Care & Service | 4 (19.1%) | 17 (80.9%) |
| Total (Category) | 80 (56.3%) | 62 (43.7%) |
| Total (Overall) | 514 (53.8%) | 442 (46.2%) |
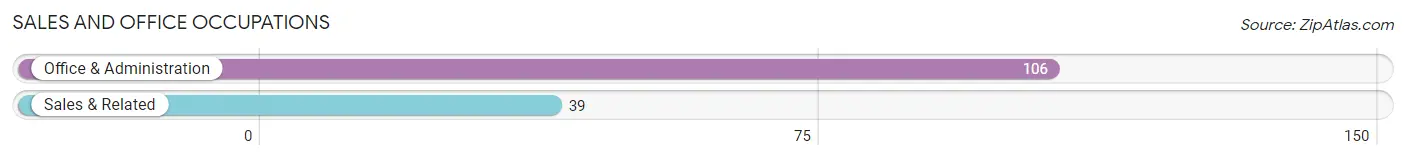
Sales and Office Occupations
The most common Sales and Office occupations in Berrien Springs are Office & Administration (106 | 11.1%), and Sales & Related (39 | 4.1%).
Sales and Office Occupations by Sex
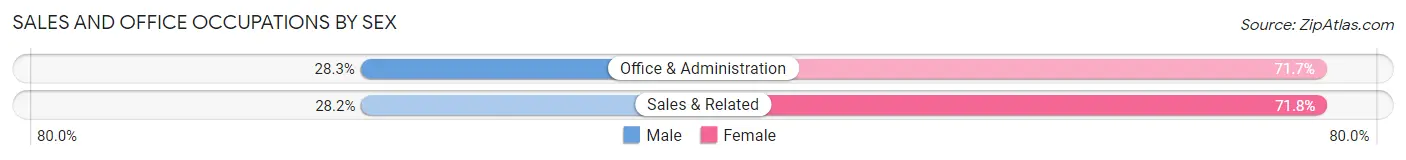
| Occupation | Male | Female |
| Sales & Related | 11 (28.2%) | 28 (71.8%) |
| Office & Administration | 30 (28.3%) | 76 (71.7%) |
| Total (Category) | 41 (28.3%) | 104 (71.7%) |
| Total (Overall) | 514 (53.8%) | 442 (46.2%) |
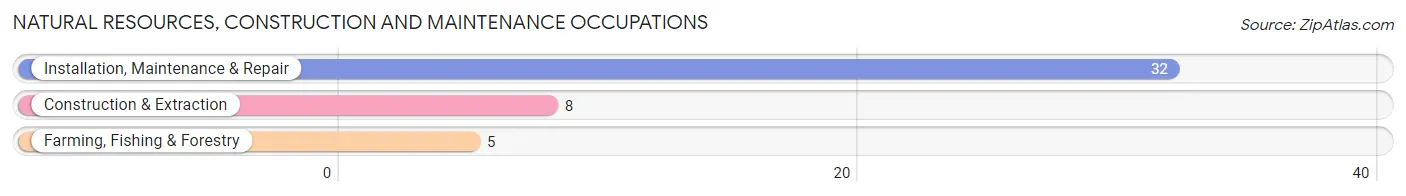
Natural Resources, Construction and Maintenance Occupations
The most common Natural Resources, Construction and Maintenance occupations in Berrien Springs are Installation, Maintenance & Repair (32 | 3.4%), Construction & Extraction (8 | 0.8%), and Farming, Fishing & Forestry (5 | 0.5%).
Natural Resources, Construction and Maintenance Occupations by Sex
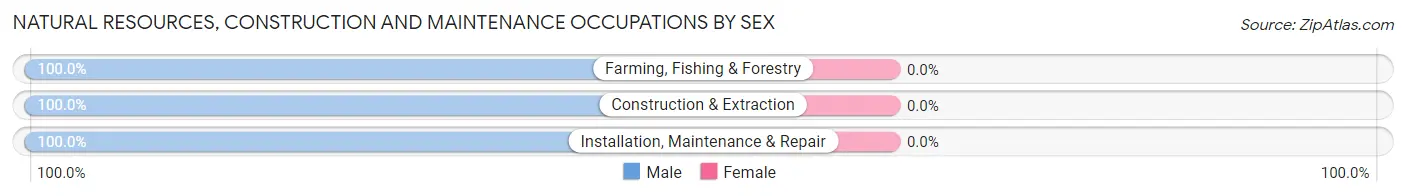
| Occupation | Male | Female |
| Farming, Fishing & Forestry | 5 (100.0%) | 0 (0.0%) |
| Construction & Extraction | 8 (100.0%) | 0 (0.0%) |
| Installation, Maintenance & Repair | 32 (100.0%) | 0 (0.0%) |
| Total (Category) | 45 (100.0%) | 0 (0.0%) |
| Total (Overall) | 514 (53.8%) | 442 (46.2%) |
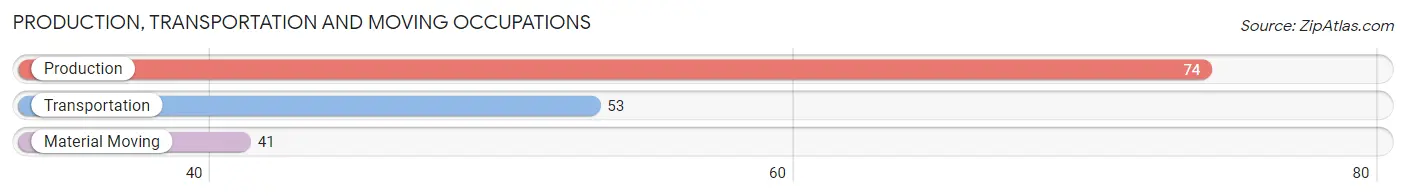
Production, Transportation and Moving Occupations
The most common Production, Transportation and Moving occupations in Berrien Springs are Production (74 | 7.7%), Transportation (53 | 5.5%), and Material Moving (41 | 4.3%).
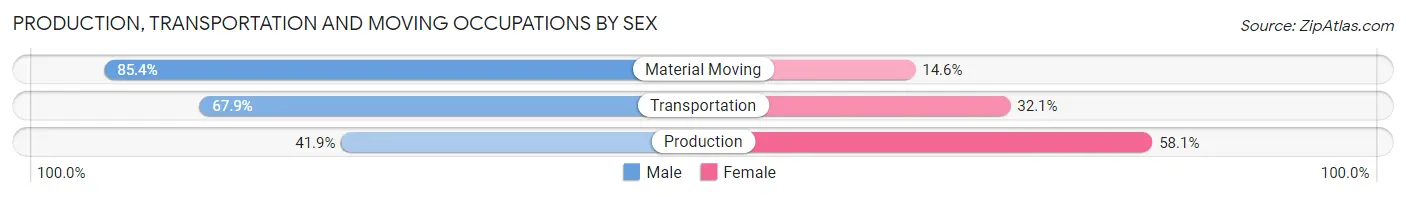
Production, Transportation and Moving Occupations by Sex
| Occupation | Male | Female |
| Production | 31 (41.9%) | 43 (58.1%) |
| Transportation | 36 (67.9%) | 17 (32.1%) |
| Material Moving | 35 (85.4%) | 6 (14.6%) |
| Total (Category) | 102 (60.7%) | 66 (39.3%) |
| Total (Overall) | 514 (53.8%) | 442 (46.2%) |
Employment Industries by Sex in Berrien Springs
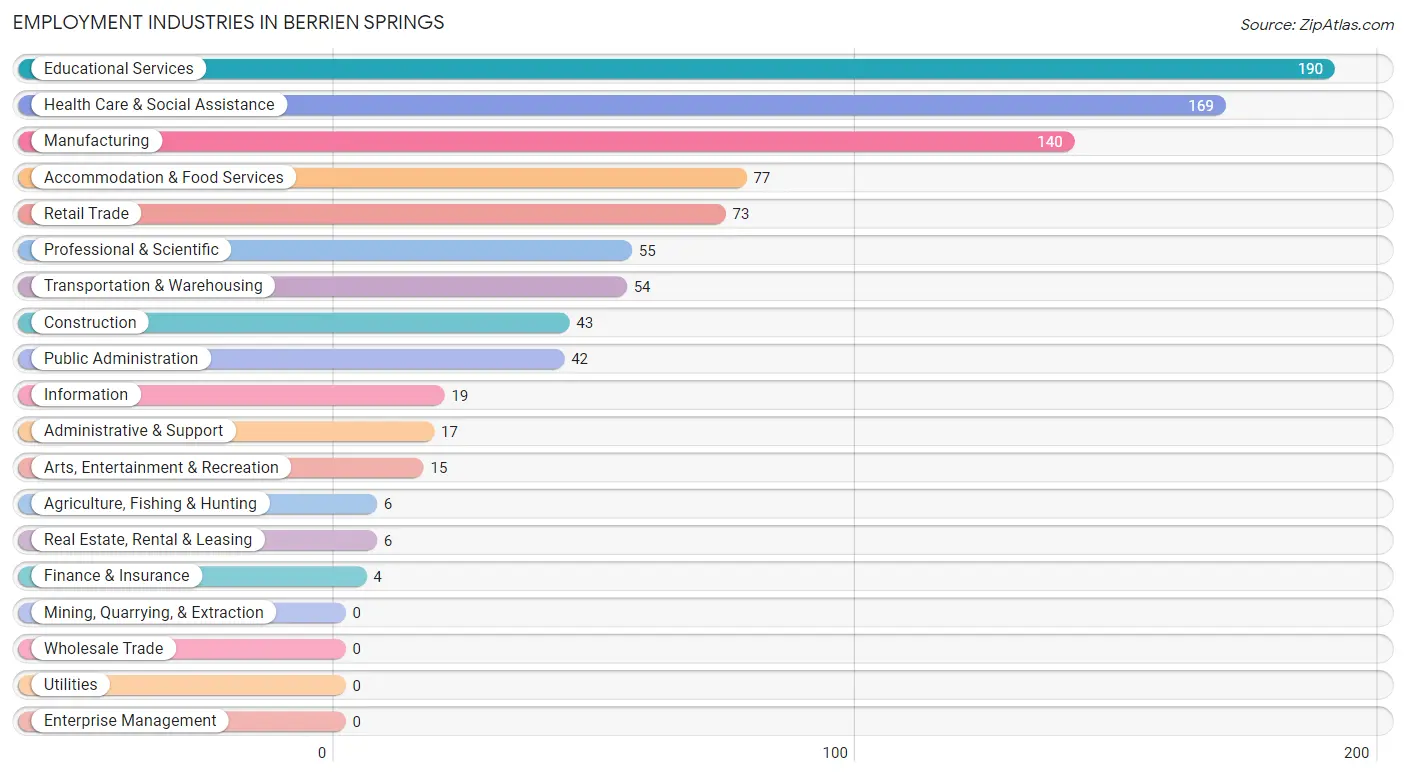
Employment Industries in Berrien Springs
The major employment industries in Berrien Springs include Educational Services (190 | 19.9%), Health Care & Social Assistance (169 | 17.7%), Manufacturing (140 | 14.6%), Accommodation & Food Services (77 | 8.1%), and Retail Trade (73 | 7.6%).
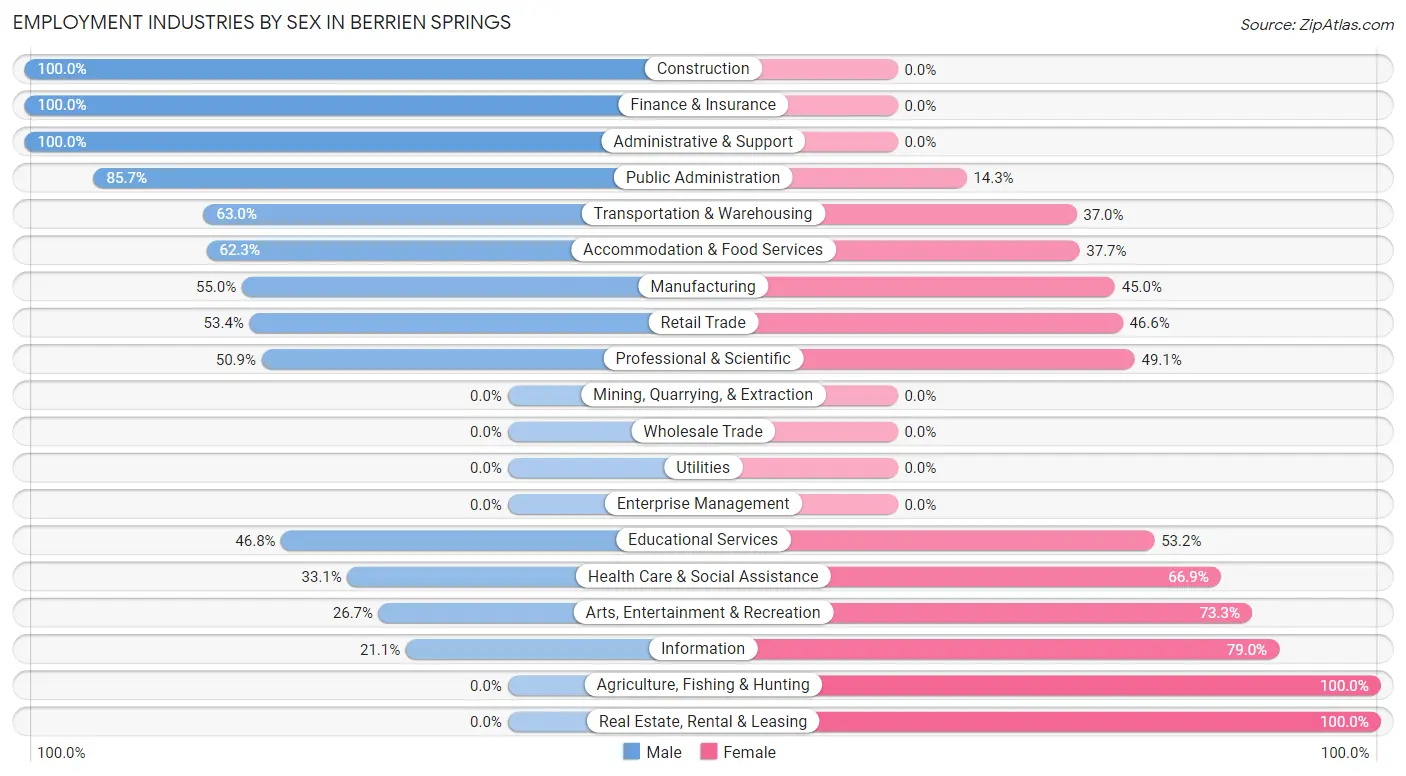
Employment Industries by Sex in Berrien Springs
The Berrien Springs industries that see more men than women are Construction (100.0%), Finance & Insurance (100.0%), and Administrative & Support (100.0%), whereas the industries that tend to have a higher number of women are Agriculture, Fishing & Hunting (100.0%), Real Estate, Rental & Leasing (100.0%), and Information (78.9%).
| Industry | Male | Female |
| Agriculture, Fishing & Hunting | 0 (0.0%) | 6 (100.0%) |
| Mining, Quarrying, & Extraction | 0 (0.0%) | 0 (0.0%) |
| Construction | 43 (100.0%) | 0 (0.0%) |
| Manufacturing | 77 (55.0%) | 63 (45.0%) |
| Wholesale Trade | 0 (0.0%) | 0 (0.0%) |
| Retail Trade | 39 (53.4%) | 34 (46.6%) |
| Transportation & Warehousing | 34 (63.0%) | 20 (37.0%) |
| Utilities | 0 (0.0%) | 0 (0.0%) |
| Information | 4 (21.0%) | 15 (78.9%) |
| Finance & Insurance | 4 (100.0%) | 0 (0.0%) |
| Real Estate, Rental & Leasing | 0 (0.0%) | 6 (100.0%) |
| Professional & Scientific | 28 (50.9%) | 27 (49.1%) |
| Enterprise Management | 0 (0.0%) | 0 (0.0%) |
| Administrative & Support | 17 (100.0%) | 0 (0.0%) |
| Educational Services | 89 (46.8%) | 101 (53.2%) |
| Health Care & Social Assistance | 56 (33.1%) | 113 (66.9%) |
| Arts, Entertainment & Recreation | 4 (26.7%) | 11 (73.3%) |
| Accommodation & Food Services | 48 (62.3%) | 29 (37.7%) |
| Public Administration | 36 (85.7%) | 6 (14.3%) |
| Total | 514 (53.8%) | 442 (46.2%) |
Education in Berrien Springs
School Enrollment in Berrien Springs
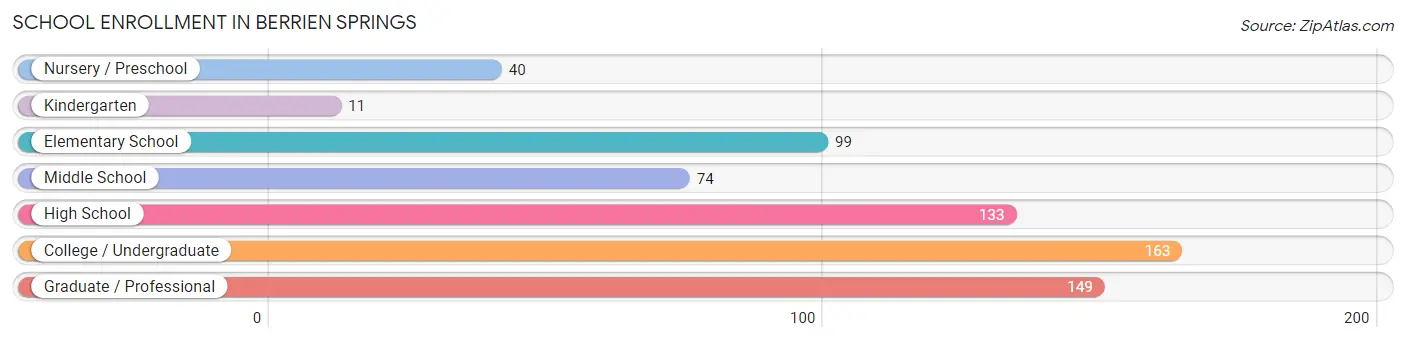
The most common levels of schooling among the 669 students in Berrien Springs are college / undergraduate (163 | 24.4%), graduate / professional (149 | 22.3%), and high school (133 | 19.9%).
| School Level | # Students | % Students |
| Nursery / Preschool | 40 | 6.0% |
| Kindergarten | 11 | 1.6% |
| Elementary School | 99 | 14.8% |
| Middle School | 74 | 11.1% |
| High School | 133 | 19.9% |
| College / Undergraduate | 163 | 24.4% |
| Graduate / Professional | 149 | 22.3% |
| Total | 669 | 100.0% |
School Enrollment by Age by Funding Source in Berrien Springs
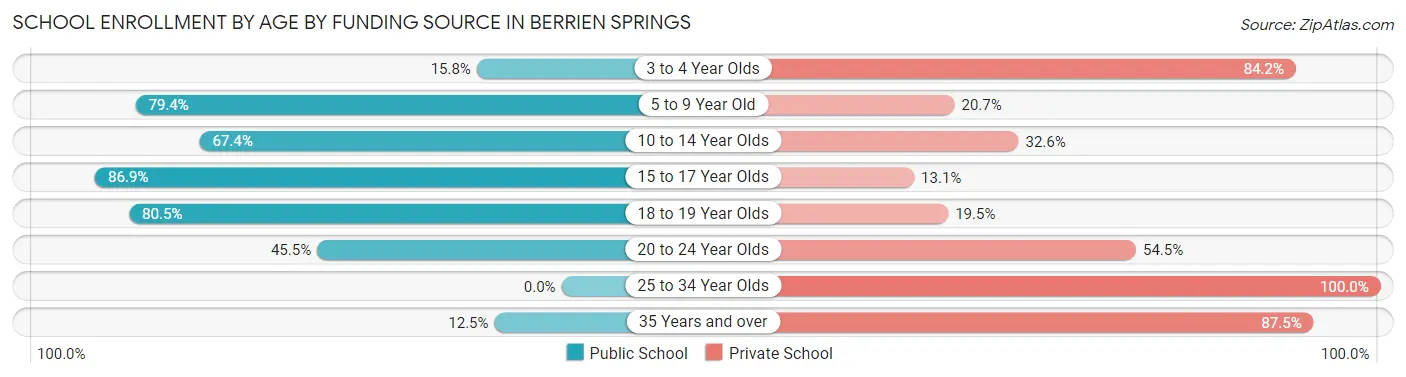
Out of a total of 669 students who are enrolled in schools in Berrien Springs, 299 (44.7%) attend a private institution, while the remaining 370 (55.3%) are enrolled in public schools. The age group of 25 to 34 year olds has the highest likelihood of being enrolled in private schools, with 61 (100.0% in the age bracket) enrolled. Conversely, the age group of 15 to 17 year olds has the lowest likelihood of being enrolled in a private school, with 86 (86.9% in the age bracket) attending a public institution.
| Age Bracket | Public School | Private School |
| 3 to 4 Year Olds | 3 (15.8%) | 16 (84.2%) |
| 5 to 9 Year Old | 73 (79.3%) | 19 (20.6%) |
| 10 to 14 Year Olds | 89 (67.4%) | 43 (32.6%) |
| 15 to 17 Year Olds | 86 (86.9%) | 13 (13.1%) |
| 18 to 19 Year Olds | 62 (80.5%) | 15 (19.5%) |
| 20 to 24 Year Olds | 46 (45.5%) | 55 (54.5%) |
| 25 to 34 Year Olds | 0 (0.0%) | 61 (100.0%) |
| 35 Years and over | 11 (12.5%) | 77 (87.5%) |
| Total | 370 (55.3%) | 299 (44.7%) |
Educational Attainment by Field of Study in Berrien Springs
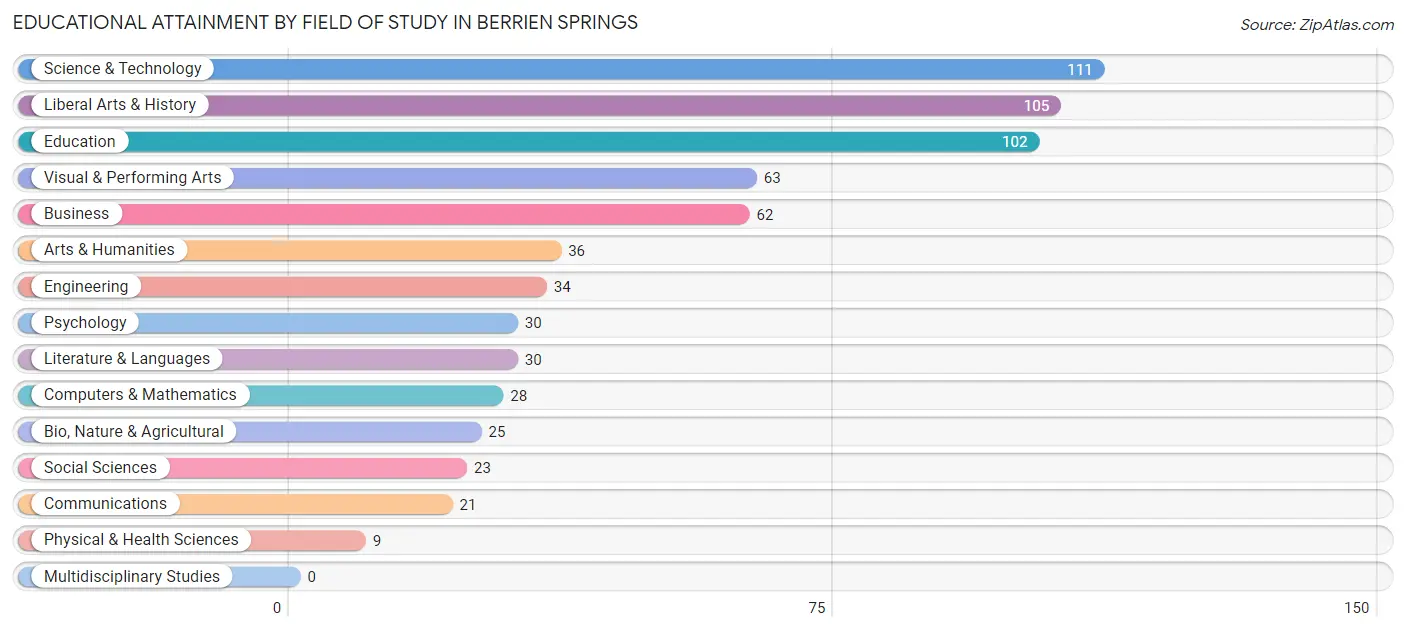
Science & technology (111 | 16.4%), liberal arts & history (105 | 15.5%), education (102 | 15.0%), visual & performing arts (63 | 9.3%), and business (62 | 9.1%) are the most common fields of study among 679 individuals in Berrien Springs who have obtained a bachelor's degree or higher.
| Field of Study | # Graduates | % Graduates |
| Computers & Mathematics | 28 | 4.1% |
| Bio, Nature & Agricultural | 25 | 3.7% |
| Physical & Health Sciences | 9 | 1.3% |
| Psychology | 30 | 4.4% |
| Social Sciences | 23 | 3.4% |
| Engineering | 34 | 5.0% |
| Multidisciplinary Studies | 0 | 0.0% |
| Science & Technology | 111 | 16.4% |
| Business | 62 | 9.1% |
| Education | 102 | 15.0% |
| Literature & Languages | 30 | 4.4% |
| Liberal Arts & History | 105 | 15.5% |
| Visual & Performing Arts | 63 | 9.3% |
| Communications | 21 | 3.1% |
| Arts & Humanities | 36 | 5.3% |
| Total | 679 | 100.0% |
Transportation & Commute in Berrien Springs
Vehicle Availability by Sex in Berrien Springs
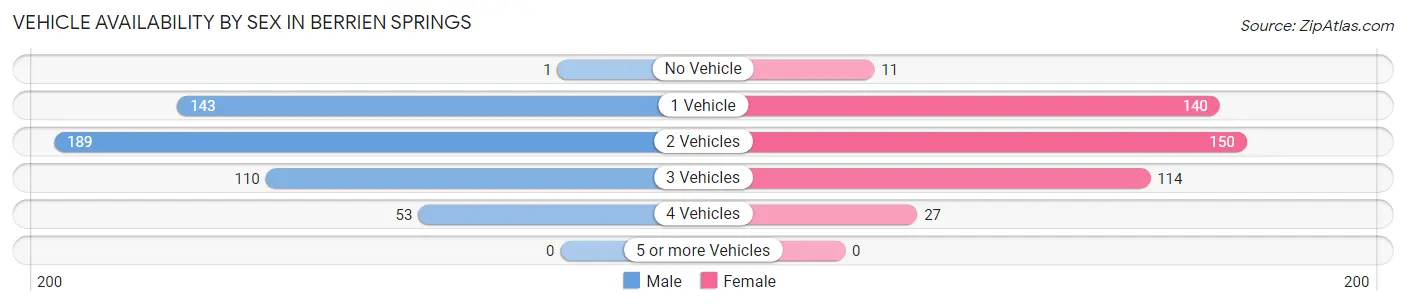
The most prevalent vehicle ownership categories in Berrien Springs are males with 2 vehicles (189, accounting for 38.1%) and females with 2 vehicles (150, making up 42.8%).
| Vehicles Available | Male | Female |
| No Vehicle | 1 (0.2%) | 11 (2.5%) |
| 1 Vehicle | 143 (28.8%) | 140 (31.7%) |
| 2 Vehicles | 189 (38.1%) | 150 (33.9%) |
| 3 Vehicles | 110 (22.2%) | 114 (25.8%) |
| 4 Vehicles | 53 (10.7%) | 27 (6.1%) |
| 5 or more Vehicles | 0 (0.0%) | 0 (0.0%) |
| Total | 496 (100.0%) | 442 (100.0%) |
Commute Time in Berrien Springs
The most frequently occuring commute durations in Berrien Springs are 5 to 9 minutes (224 commuters, 26.5%), 20 to 24 minutes (159 commuters, 18.8%), and 10 to 14 minutes (110 commuters, 13.0%).
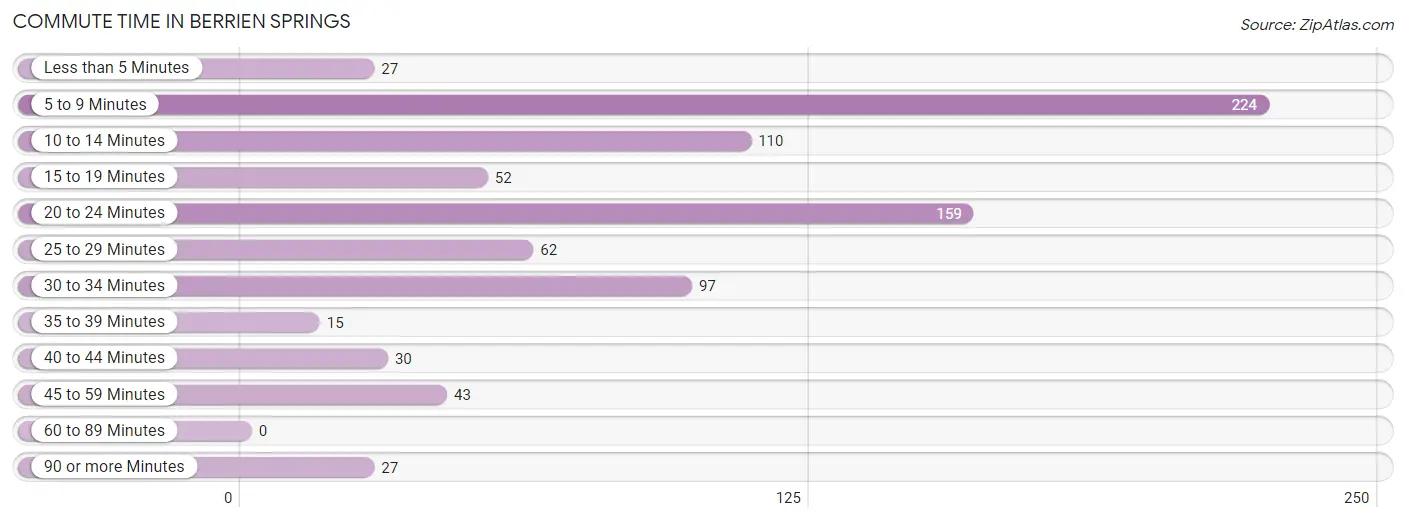
| Commute Time | # Commuters | % Commuters |
| Less than 5 Minutes | 27 | 3.2% |
| 5 to 9 Minutes | 224 | 26.5% |
| 10 to 14 Minutes | 110 | 13.0% |
| 15 to 19 Minutes | 52 | 6.1% |
| 20 to 24 Minutes | 159 | 18.8% |
| 25 to 29 Minutes | 62 | 7.3% |
| 30 to 34 Minutes | 97 | 11.5% |
| 35 to 39 Minutes | 15 | 1.8% |
| 40 to 44 Minutes | 30 | 3.5% |
| 45 to 59 Minutes | 43 | 5.1% |
| 60 to 89 Minutes | 0 | 0.0% |
| 90 or more Minutes | 27 | 3.2% |
Commute Time by Sex in Berrien Springs
The most common commute times in Berrien Springs are 5 to 9 minutes (112 commuters, 24.9%) for males and 5 to 9 minutes (112 commuters, 28.2%) for females.
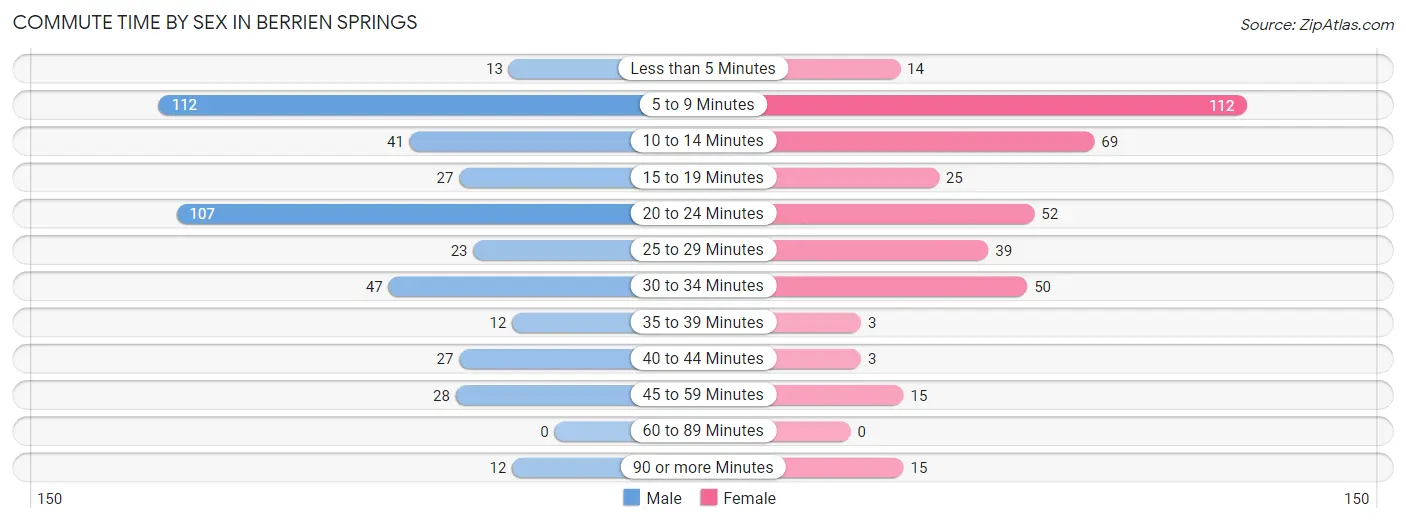
| Commute Time | Male | Female |
| Less than 5 Minutes | 13 (2.9%) | 14 (3.5%) |
| 5 to 9 Minutes | 112 (24.9%) | 112 (28.2%) |
| 10 to 14 Minutes | 41 (9.1%) | 69 (17.4%) |
| 15 to 19 Minutes | 27 (6.0%) | 25 (6.3%) |
| 20 to 24 Minutes | 107 (23.8%) | 52 (13.1%) |
| 25 to 29 Minutes | 23 (5.1%) | 39 (9.8%) |
| 30 to 34 Minutes | 47 (10.5%) | 50 (12.6%) |
| 35 to 39 Minutes | 12 (2.7%) | 3 (0.8%) |
| 40 to 44 Minutes | 27 (6.0%) | 3 (0.8%) |
| 45 to 59 Minutes | 28 (6.2%) | 15 (3.8%) |
| 60 to 89 Minutes | 0 (0.0%) | 0 (0.0%) |
| 90 or more Minutes | 12 (2.7%) | 15 (3.8%) |
Time of Departure to Work by Sex in Berrien Springs
The most frequent times of departure to work in Berrien Springs are 9:00 AM to 9:59 AM (82, 18.3%) for males and 7:30 AM to 7:59 AM (75, 18.9%) for females.
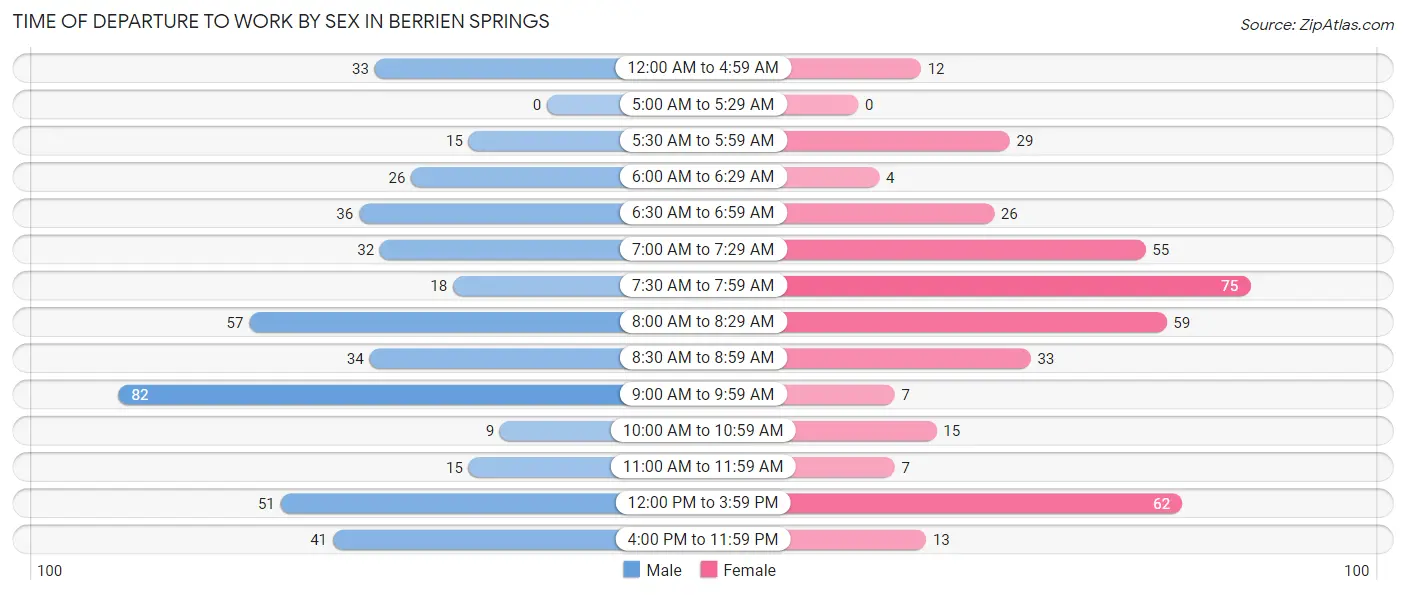
| Time of Departure | Male | Female |
| 12:00 AM to 4:59 AM | 33 (7.3%) | 12 (3.0%) |
| 5:00 AM to 5:29 AM | 0 (0.0%) | 0 (0.0%) |
| 5:30 AM to 5:59 AM | 15 (3.3%) | 29 (7.3%) |
| 6:00 AM to 6:29 AM | 26 (5.8%) | 4 (1.0%) |
| 6:30 AM to 6:59 AM | 36 (8.0%) | 26 (6.6%) |
| 7:00 AM to 7:29 AM | 32 (7.1%) | 55 (13.9%) |
| 7:30 AM to 7:59 AM | 18 (4.0%) | 75 (18.9%) |
| 8:00 AM to 8:29 AM | 57 (12.7%) | 59 (14.9%) |
| 8:30 AM to 8:59 AM | 34 (7.6%) | 33 (8.3%) |
| 9:00 AM to 9:59 AM | 82 (18.3%) | 7 (1.8%) |
| 10:00 AM to 10:59 AM | 9 (2.0%) | 15 (3.8%) |
| 11:00 AM to 11:59 AM | 15 (3.3%) | 7 (1.8%) |
| 12:00 PM to 3:59 PM | 51 (11.4%) | 62 (15.6%) |
| 4:00 PM to 11:59 PM | 41 (9.1%) | 13 (3.3%) |
| Total | 449 (100.0%) | 397 (100.0%) |
Housing Occupancy in Berrien Springs
Occupancy by Ownership in Berrien Springs
Of the total 771 dwellings in Berrien Springs, owner-occupied units account for 450 (58.4%), while renter-occupied units make up 321 (41.6%).
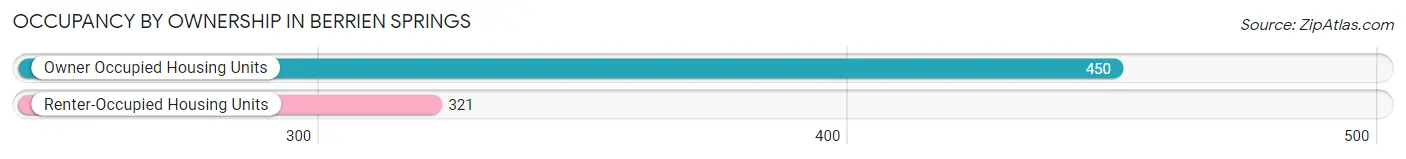
| Occupancy | # Housing Units | % Housing Units |
| Owner Occupied Housing Units | 450 | 58.4% |
| Renter-Occupied Housing Units | 321 | 41.6% |
| Total Occupied Housing Units | 771 | 100.0% |
Occupancy by Household Size in Berrien Springs
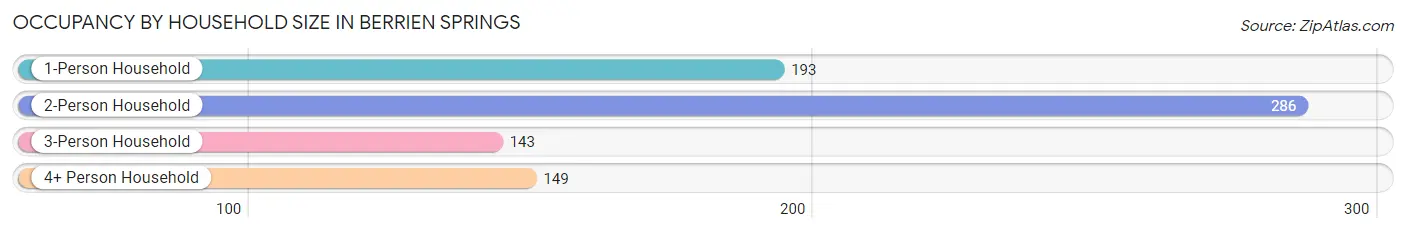
| Household Size | # Housing Units | % Housing Units |
| 1-Person Household | 193 | 25.0% |
| 2-Person Household | 286 | 37.1% |
| 3-Person Household | 143 | 18.5% |
| 4+ Person Household | 149 | 19.3% |
| Total Housing Units | 771 | 100.0% |
Occupancy by Ownership by Household Size in Berrien Springs
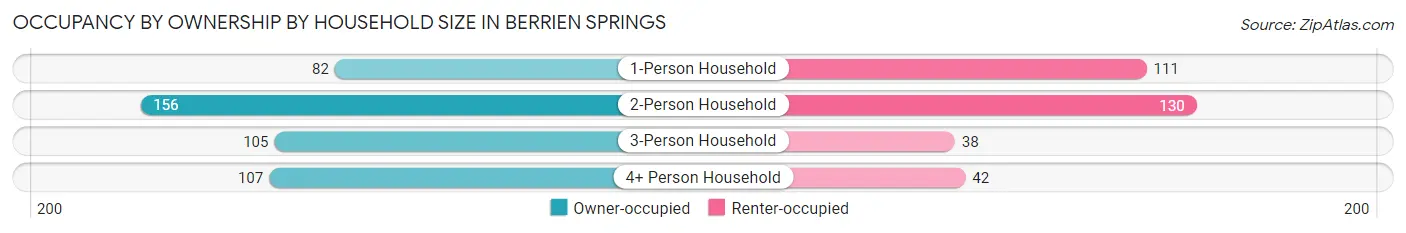
| Household Size | Owner-occupied | Renter-occupied |
| 1-Person Household | 82 (42.5%) | 111 (57.5%) |
| 2-Person Household | 156 (54.5%) | 130 (45.5%) |
| 3-Person Household | 105 (73.4%) | 38 (26.6%) |
| 4+ Person Household | 107 (71.8%) | 42 (28.2%) |
| Total Housing Units | 450 (58.4%) | 321 (41.6%) |
Occupancy by Educational Attainment in Berrien Springs
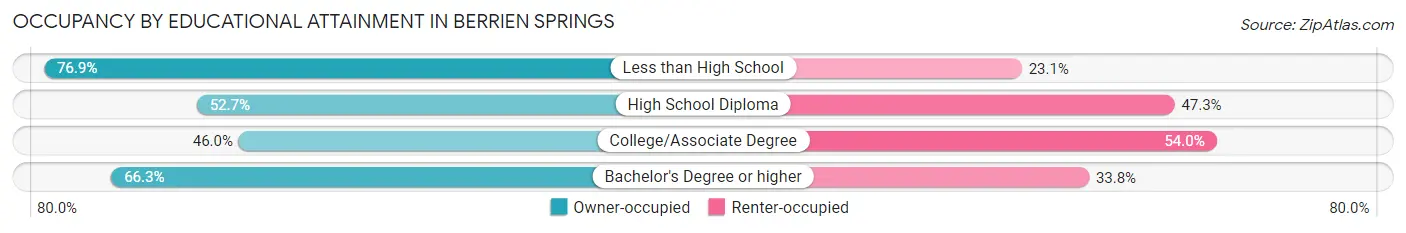
| Household Size | Owner-occupied | Renter-occupied |
| Less than High School | 20 (76.9%) | 6 (23.1%) |
| High School Diploma | 49 (52.7%) | 44 (47.3%) |
| College/Associate Degree | 116 (46.0%) | 136 (54.0%) |
| Bachelor's Degree or higher | 265 (66.2%) | 135 (33.8%) |
Occupancy by Age of Householder in Berrien Springs
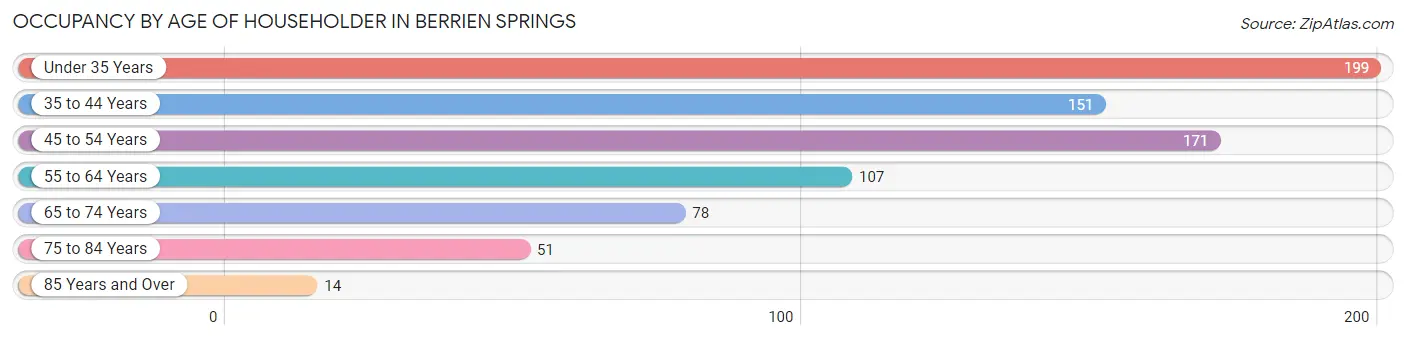
| Age Bracket | # Households | % Households |
| Under 35 Years | 199 | 25.8% |
| 35 to 44 Years | 151 | 19.6% |
| 45 to 54 Years | 171 | 22.2% |
| 55 to 64 Years | 107 | 13.9% |
| 65 to 74 Years | 78 | 10.1% |
| 75 to 84 Years | 51 | 6.6% |
| 85 Years and Over | 14 | 1.8% |
| Total | 771 | 100.0% |
Housing Finances in Berrien Springs
Median Income by Occupancy in Berrien Springs
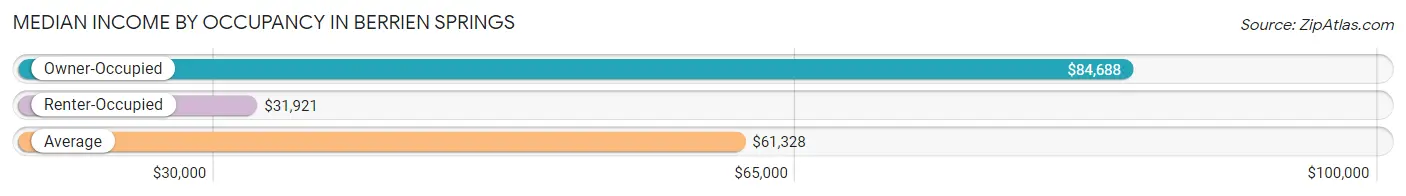
| Occupancy Type | # Households | Median Income |
| Owner-Occupied | 450 (58.4%) | $84,688 |
| Renter-Occupied | 321 (41.6%) | $31,921 |
| Average | 771 (100.0%) | $61,328 |
Occupancy by Householder Income Bracket in Berrien Springs
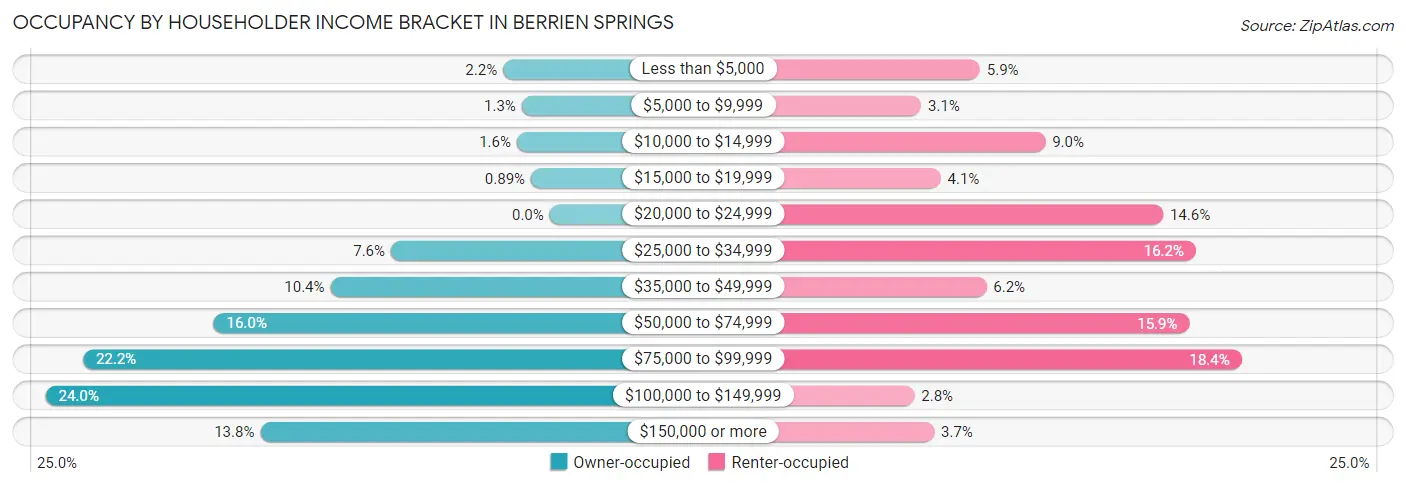
| Income Bracket | Owner-occupied | Renter-occupied |
| Less than $5,000 | 10 (2.2%) | 19 (5.9%) |
| $5,000 to $9,999 | 6 (1.3%) | 10 (3.1%) |
| $10,000 to $14,999 | 7 (1.6%) | 29 (9.0%) |
| $15,000 to $19,999 | 4 (0.9%) | 13 (4.1%) |
| $20,000 to $24,999 | 0 (0.0%) | 47 (14.6%) |
| $25,000 to $34,999 | 34 (7.6%) | 52 (16.2%) |
| $35,000 to $49,999 | 47 (10.4%) | 20 (6.2%) |
| $50,000 to $74,999 | 72 (16.0%) | 51 (15.9%) |
| $75,000 to $99,999 | 100 (22.2%) | 59 (18.4%) |
| $100,000 to $149,999 | 108 (24.0%) | 9 (2.8%) |
| $150,000 or more | 62 (13.8%) | 12 (3.7%) |
| Total | 450 (100.0%) | 321 (100.0%) |
Monthly Housing Cost Tiers in Berrien Springs
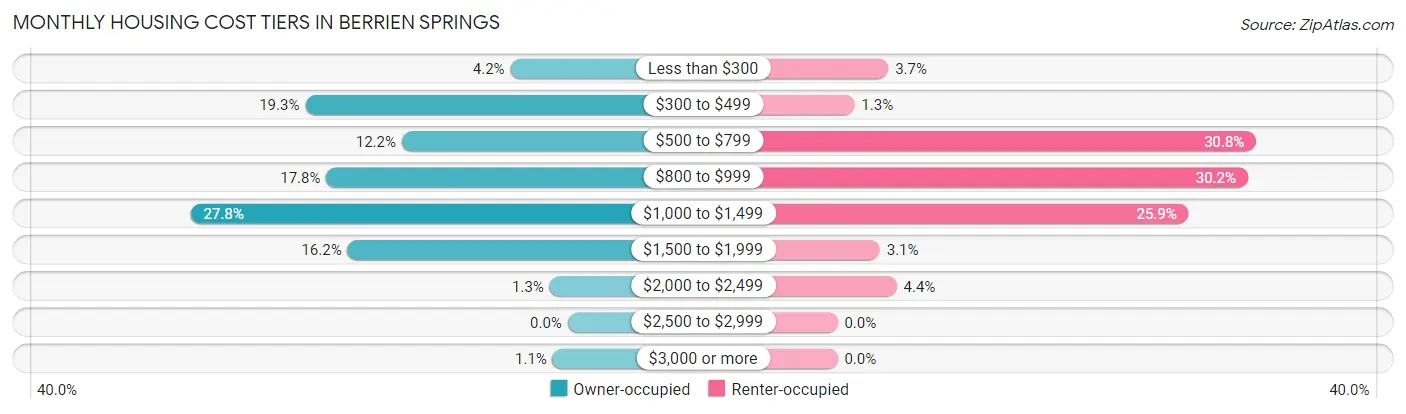
| Monthly Cost | Owner-occupied | Renter-occupied |
| Less than $300 | 19 (4.2%) | 12 (3.7%) |
| $300 to $499 | 87 (19.3%) | 4 (1.3%) |
| $500 to $799 | 55 (12.2%) | 99 (30.8%) |
| $800 to $999 | 80 (17.8%) | 97 (30.2%) |
| $1,000 to $1,499 | 125 (27.8%) | 83 (25.9%) |
| $1,500 to $1,999 | 73 (16.2%) | 10 (3.1%) |
| $2,000 to $2,499 | 6 (1.3%) | 14 (4.4%) |
| $2,500 to $2,999 | 0 (0.0%) | 0 (0.0%) |
| $3,000 or more | 5 (1.1%) | 0 (0.0%) |
| Total | 450 (100.0%) | 321 (100.0%) |
Physical Housing Characteristics in Berrien Springs
Housing Structures in Berrien Springs
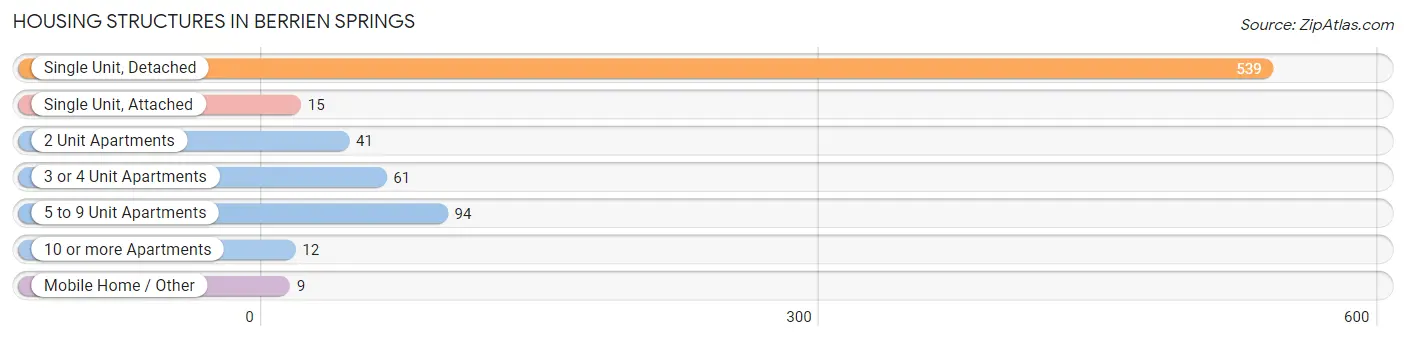
| Structure Type | # Housing Units | % Housing Units |
| Single Unit, Detached | 539 | 69.9% |
| Single Unit, Attached | 15 | 1.9% |
| 2 Unit Apartments | 41 | 5.3% |
| 3 or 4 Unit Apartments | 61 | 7.9% |
| 5 to 9 Unit Apartments | 94 | 12.2% |
| 10 or more Apartments | 12 | 1.6% |
| Mobile Home / Other | 9 | 1.2% |
| Total | 771 | 100.0% |
Housing Structures by Occupancy in Berrien Springs
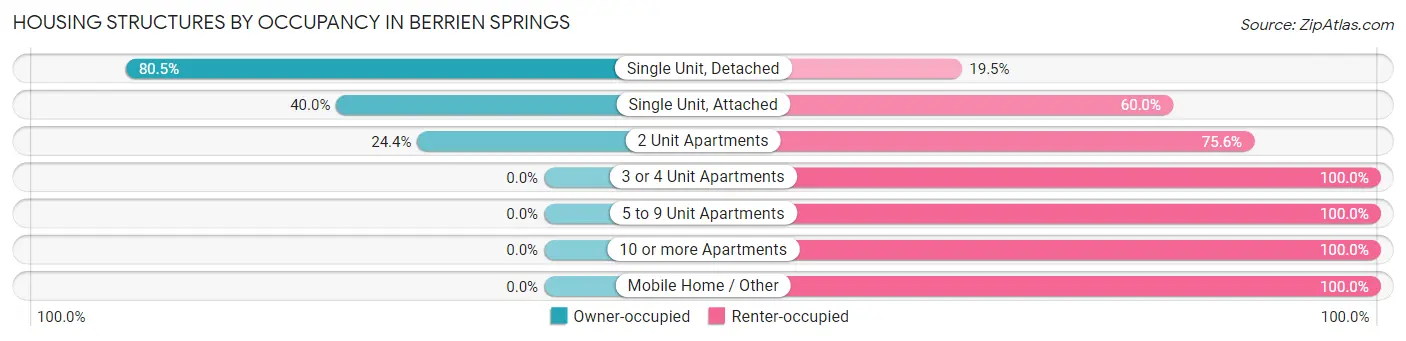
| Structure Type | Owner-occupied | Renter-occupied |
| Single Unit, Detached | 434 (80.5%) | 105 (19.5%) |
| Single Unit, Attached | 6 (40.0%) | 9 (60.0%) |
| 2 Unit Apartments | 10 (24.4%) | 31 (75.6%) |
| 3 or 4 Unit Apartments | 0 (0.0%) | 61 (100.0%) |
| 5 to 9 Unit Apartments | 0 (0.0%) | 94 (100.0%) |
| 10 or more Apartments | 0 (0.0%) | 12 (100.0%) |
| Mobile Home / Other | 0 (0.0%) | 9 (100.0%) |
| Total | 450 (58.4%) | 321 (41.6%) |
Housing Structures by Number of Rooms in Berrien Springs
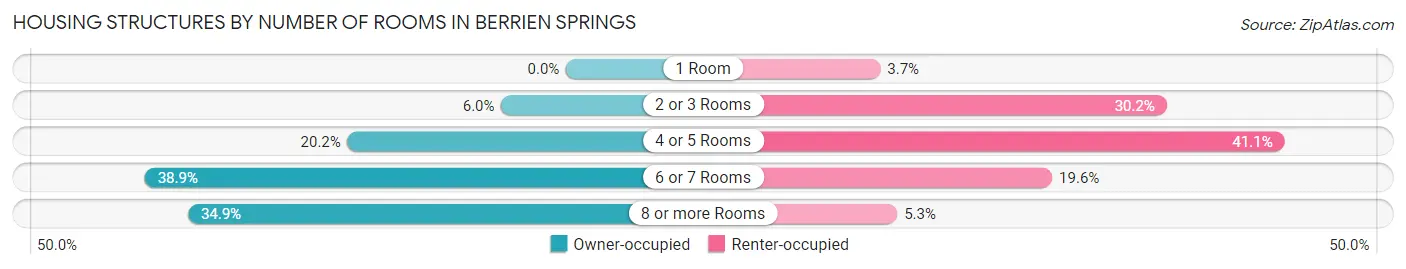
| Number of Rooms | Owner-occupied | Renter-occupied |
| 1 Room | 0 (0.0%) | 12 (3.7%) |
| 2 or 3 Rooms | 27 (6.0%) | 97 (30.2%) |
| 4 or 5 Rooms | 91 (20.2%) | 132 (41.1%) |
| 6 or 7 Rooms | 175 (38.9%) | 63 (19.6%) |
| 8 or more Rooms | 157 (34.9%) | 17 (5.3%) |
| Total | 450 (100.0%) | 321 (100.0%) |
Housing Structure by Heating Type in Berrien Springs
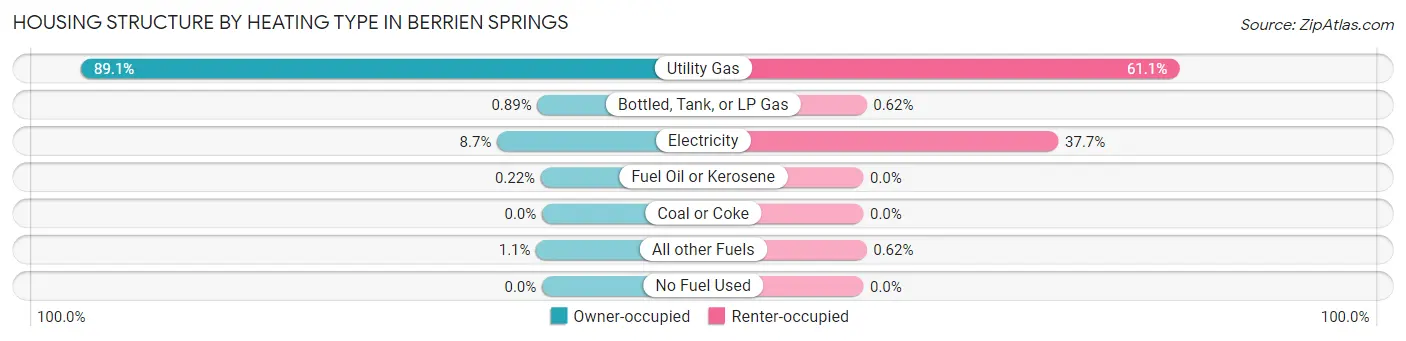
| Heating Type | Owner-occupied | Renter-occupied |
| Utility Gas | 401 (89.1%) | 196 (61.1%) |
| Bottled, Tank, or LP Gas | 4 (0.9%) | 2 (0.6%) |
| Electricity | 39 (8.7%) | 121 (37.7%) |
| Fuel Oil or Kerosene | 1 (0.2%) | 0 (0.0%) |
| Coal or Coke | 0 (0.0%) | 0 (0.0%) |
| All other Fuels | 5 (1.1%) | 2 (0.6%) |
| No Fuel Used | 0 (0.0%) | 0 (0.0%) |
| Total | 450 (100.0%) | 321 (100.0%) |
Household Vehicle Usage in Berrien Springs
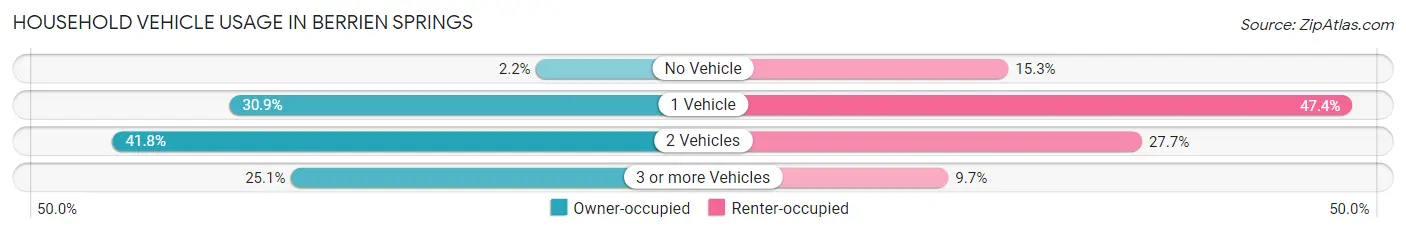
| Vehicles per Household | Owner-occupied | Renter-occupied |
| No Vehicle | 10 (2.2%) | 49 (15.3%) |
| 1 Vehicle | 139 (30.9%) | 152 (47.3%) |
| 2 Vehicles | 188 (41.8%) | 89 (27.7%) |
| 3 or more Vehicles | 113 (25.1%) | 31 (9.7%) |
| Total | 450 (100.0%) | 321 (100.0%) |
Real Estate & Mortgages in Berrien Springs
Real Estate and Mortgage Overview in Berrien Springs
| Characteristic | Without Mortgage | With Mortgage |
| Housing Units | 167 | 283 |
| Median Property Value | $145,000 | $149,400 |
| Median Household Income | $75,938 | $33 |
| Monthly Housing Costs | $403 | $0 |
| Real Estate Taxes | $2,127 | $0 |
Property Value by Mortgage Status in Berrien Springs
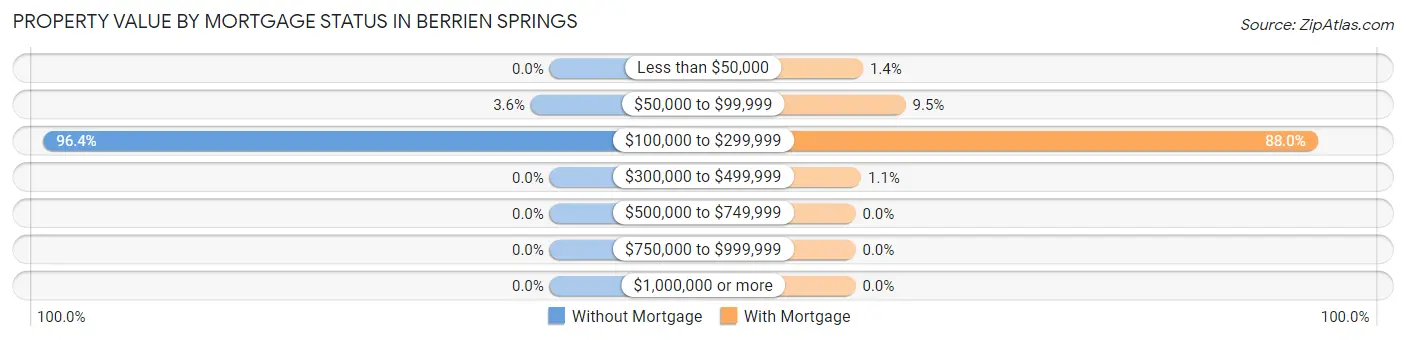
| Property Value | Without Mortgage | With Mortgage |
| Less than $50,000 | 0 (0.0%) | 4 (1.4%) |
| $50,000 to $99,999 | 6 (3.6%) | 27 (9.5%) |
| $100,000 to $299,999 | 161 (96.4%) | 249 (88.0%) |
| $300,000 to $499,999 | 0 (0.0%) | 3 (1.1%) |
| $500,000 to $749,999 | 0 (0.0%) | 0 (0.0%) |
| $750,000 to $999,999 | 0 (0.0%) | 0 (0.0%) |
| $1,000,000 or more | 0 (0.0%) | 0 (0.0%) |
| Total | 167 (100.0%) | 283 (100.0%) |
Household Income by Mortgage Status in Berrien Springs
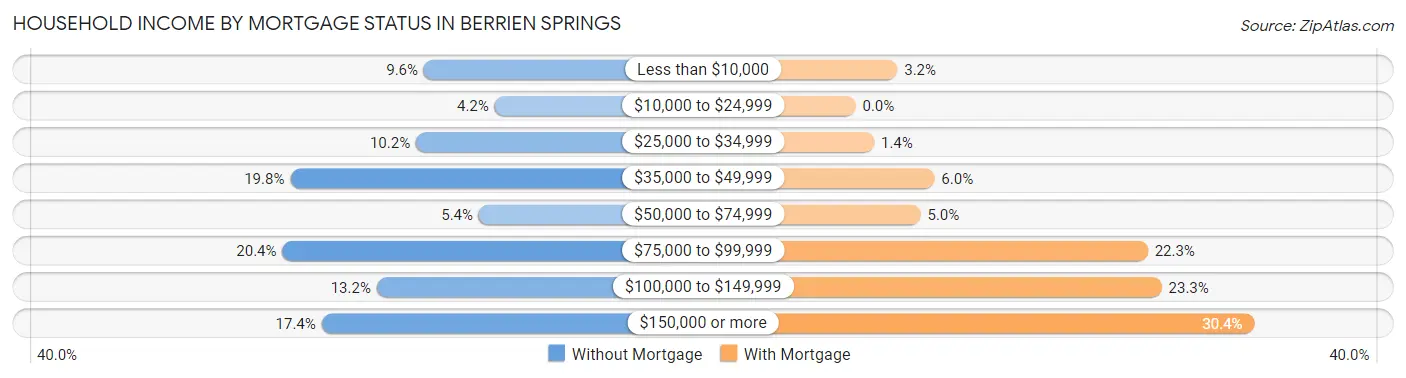
| Household Income | Without Mortgage | With Mortgage |
| Less than $10,000 | 16 (9.6%) | 9 (3.2%) |
| $10,000 to $24,999 | 7 (4.2%) | 0 (0.0%) |
| $25,000 to $34,999 | 17 (10.2%) | 4 (1.4%) |
| $35,000 to $49,999 | 33 (19.8%) | 17 (6.0%) |
| $50,000 to $74,999 | 9 (5.4%) | 14 (5.0%) |
| $75,000 to $99,999 | 34 (20.4%) | 63 (22.3%) |
| $100,000 to $149,999 | 22 (13.2%) | 66 (23.3%) |
| $150,000 or more | 29 (17.4%) | 86 (30.4%) |
| Total | 167 (100.0%) | 283 (100.0%) |
Property Value to Household Income Ratio in Berrien Springs
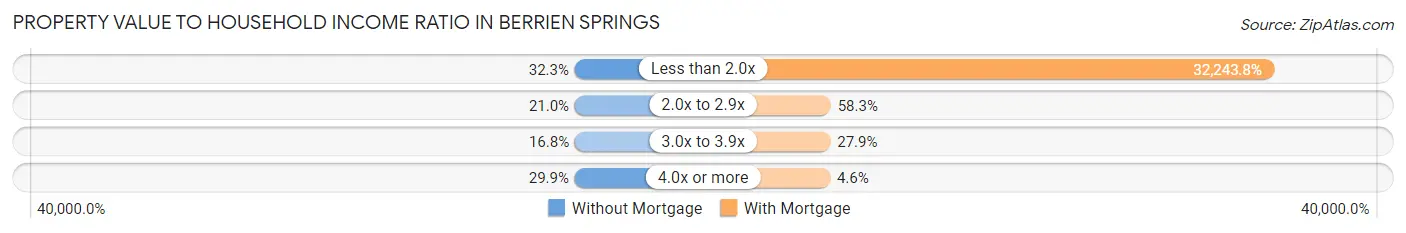
| Value-to-Income Ratio | Without Mortgage | With Mortgage |
| Less than 2.0x | 54 (32.3%) | 91,250 (32,243.8%) |
| 2.0x to 2.9x | 35 (21.0%) | 165 (58.3%) |
| 3.0x to 3.9x | 28 (16.8%) | 79 (27.9%) |
| 4.0x or more | 50 (29.9%) | 13 (4.6%) |
| Total | 167 (100.0%) | 283 (100.0%) |
Real Estate Taxes by Mortgage Status in Berrien Springs
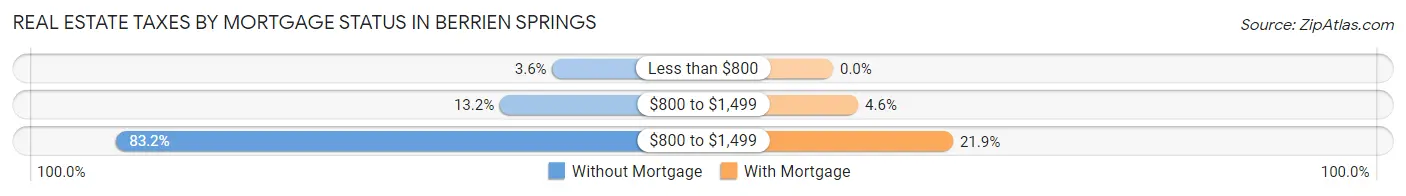
| Property Taxes | Without Mortgage | With Mortgage |
| Less than $800 | 6 (3.6%) | 0 (0.0%) |
| $800 to $1,499 | 22 (13.2%) | 13 (4.6%) |
| $800 to $1,499 | 139 (83.2%) | 62 (21.9%) |
| Total | 167 (100.0%) | 283 (100.0%) |
Health & Disability in Berrien Springs
Health Insurance Coverage by Age in Berrien Springs
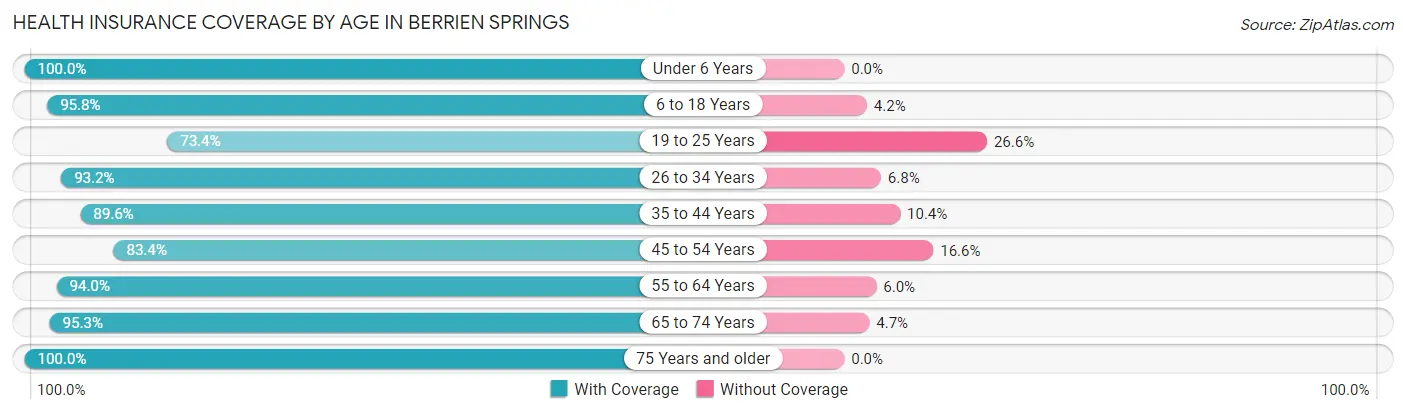
| Age Bracket | With Coverage | Without Coverage |
| Under 6 Years | 117 (100.0%) | 0 (0.0%) |
| 6 to 18 Years | 318 (95.8%) | 14 (4.2%) |
| 19 to 25 Years | 262 (73.4%) | 95 (26.6%) |
| 26 to 34 Years | 191 (93.2%) | 14 (6.8%) |
| 35 to 44 Years | 241 (89.6%) | 28 (10.4%) |
| 45 to 54 Years | 221 (83.4%) | 44 (16.6%) |
| 55 to 64 Years | 220 (94.0%) | 14 (6.0%) |
| 65 to 74 Years | 143 (95.3%) | 7 (4.7%) |
| 75 Years and older | 93 (100.0%) | 0 (0.0%) |
| Total | 1,806 (89.3%) | 216 (10.7%) |
Health Insurance Coverage by Citizenship Status in Berrien Springs
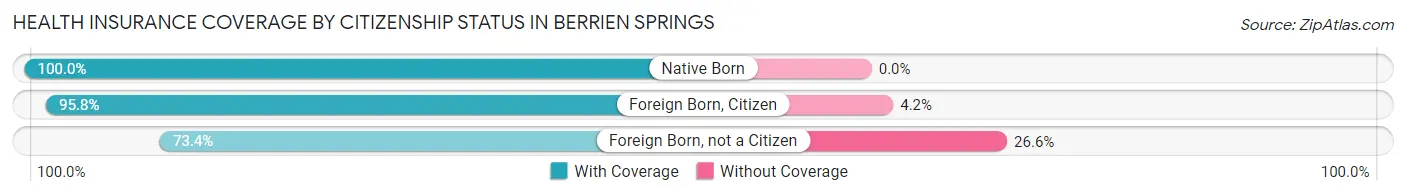
| Citizenship Status | With Coverage | Without Coverage |
| Native Born | 117 (100.0%) | 0 (0.0%) |
| Foreign Born, Citizen | 318 (95.8%) | 14 (4.2%) |
| Foreign Born, not a Citizen | 262 (73.4%) | 95 (26.6%) |
Health Insurance Coverage by Household Income in Berrien Springs
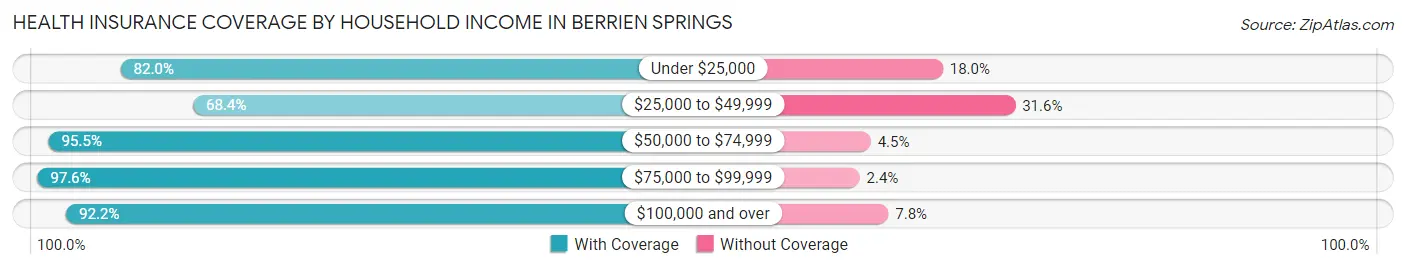
| Household Income | With Coverage | Without Coverage |
| Under $25,000 | 237 (82.0%) | 52 (18.0%) |
| $25,000 to $49,999 | 193 (68.4%) | 89 (31.6%) |
| $50,000 to $74,999 | 320 (95.5%) | 15 (4.5%) |
| $75,000 to $99,999 | 487 (97.6%) | 12 (2.4%) |
| $100,000 and over | 569 (92.2%) | 48 (7.8%) |
Public vs Private Health Insurance Coverage by Age in Berrien Springs
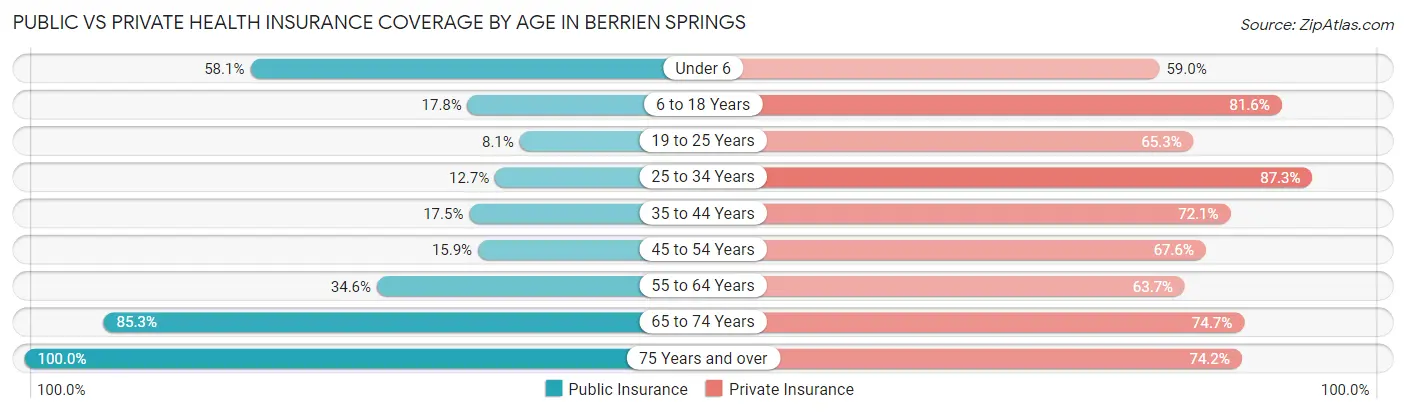
| Age Bracket | Public Insurance | Private Insurance |
| Under 6 | 68 (58.1%) | 69 (59.0%) |
| 6 to 18 Years | 59 (17.8%) | 271 (81.6%) |
| 19 to 25 Years | 29 (8.1%) | 233 (65.3%) |
| 25 to 34 Years | 26 (12.7%) | 179 (87.3%) |
| 35 to 44 Years | 47 (17.5%) | 194 (72.1%) |
| 45 to 54 Years | 42 (15.9%) | 179 (67.5%) |
| 55 to 64 Years | 81 (34.6%) | 149 (63.7%) |
| 65 to 74 Years | 128 (85.3%) | 112 (74.7%) |
| 75 Years and over | 93 (100.0%) | 69 (74.2%) |
| Total | 573 (28.3%) | 1,455 (72.0%) |
Disability Status by Sex by Age in Berrien Springs
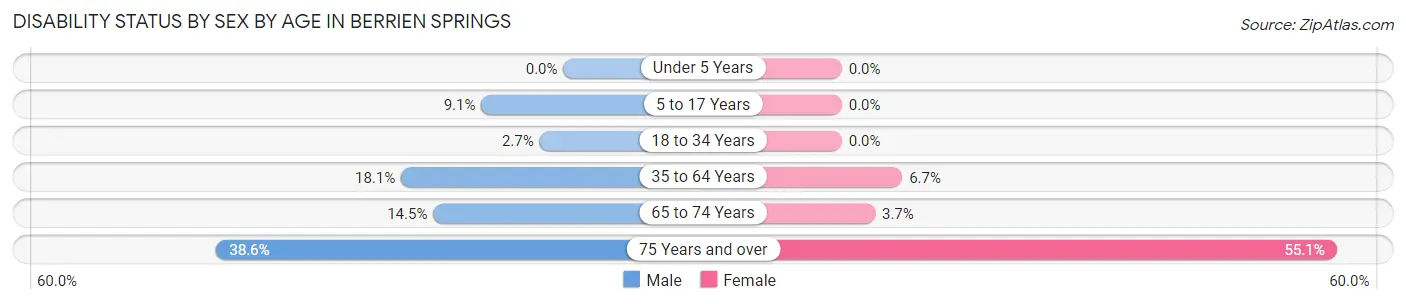
| Age Bracket | Male | Female |
| Under 5 Years | 0 (0.0%) | 0 (0.0%) |
| 5 to 17 Years | 16 (9.1%) | 0 (0.0%) |
| 18 to 34 Years | 7 (2.6%) | 0 (0.0%) |
| 35 to 64 Years | 77 (18.1%) | 23 (6.7%) |
| 65 to 74 Years | 10 (14.5%) | 3 (3.7%) |
| 75 Years and over | 17 (38.6%) | 27 (55.1%) |
Disability Class by Sex by Age in Berrien Springs
Disability Class: Hearing Difficulty
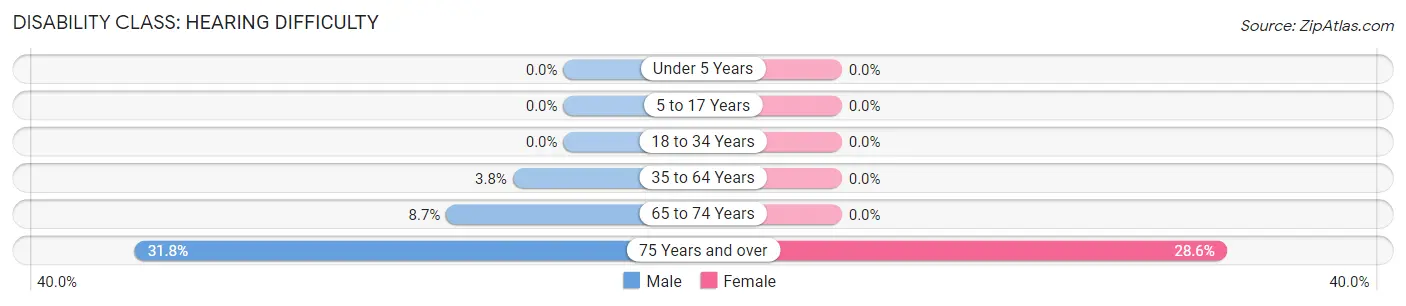
| Age Bracket | Male | Female |
| Under 5 Years | 0 (0.0%) | 0 (0.0%) |
| 5 to 17 Years | 0 (0.0%) | 0 (0.0%) |
| 18 to 34 Years | 0 (0.0%) | 0 (0.0%) |
| 35 to 64 Years | 16 (3.8%) | 0 (0.0%) |
| 65 to 74 Years | 6 (8.7%) | 0 (0.0%) |
| 75 Years and over | 14 (31.8%) | 14 (28.6%) |
Disability Class: Vision Difficulty
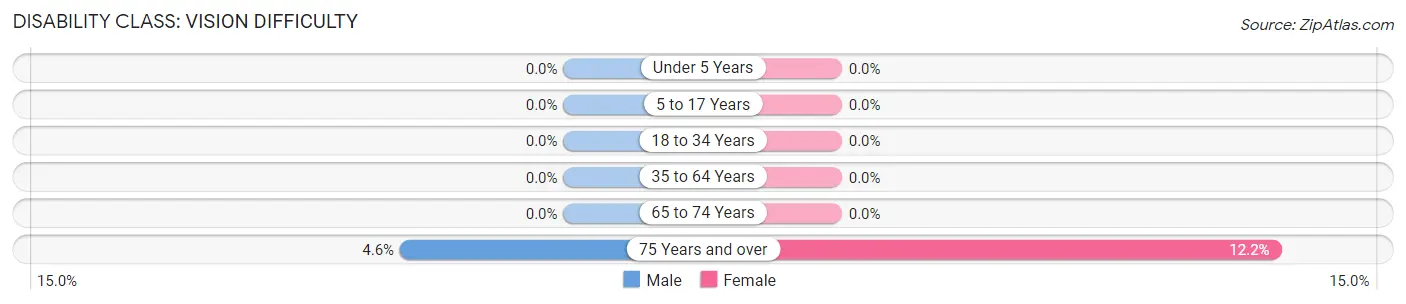
| Age Bracket | Male | Female |
| Under 5 Years | 0 (0.0%) | 0 (0.0%) |
| 5 to 17 Years | 0 (0.0%) | 0 (0.0%) |
| 18 to 34 Years | 0 (0.0%) | 0 (0.0%) |
| 35 to 64 Years | 0 (0.0%) | 0 (0.0%) |
| 65 to 74 Years | 0 (0.0%) | 0 (0.0%) |
| 75 Years and over | 2 (4.5%) | 6 (12.2%) |
Disability Class: Cognitive Difficulty
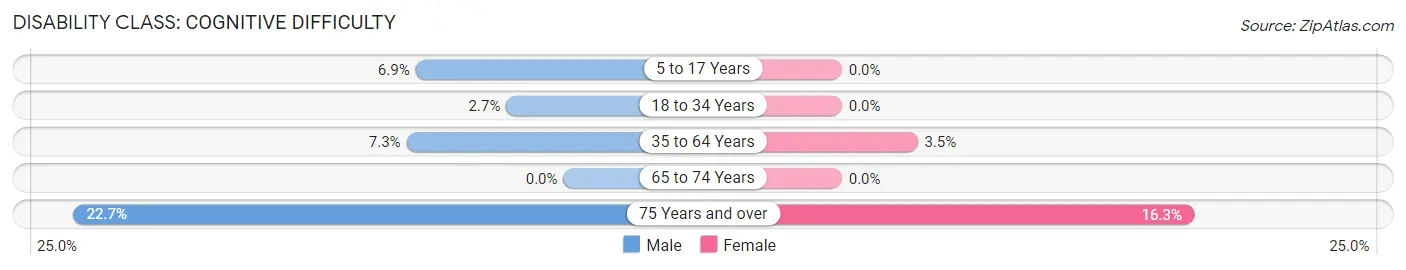
| Age Bracket | Male | Female |
| 5 to 17 Years | 12 (6.9%) | 0 (0.0%) |
| 18 to 34 Years | 7 (2.6%) | 0 (0.0%) |
| 35 to 64 Years | 31 (7.3%) | 12 (3.5%) |
| 65 to 74 Years | 0 (0.0%) | 0 (0.0%) |
| 75 Years and over | 10 (22.7%) | 8 (16.3%) |
Disability Class: Ambulatory Difficulty
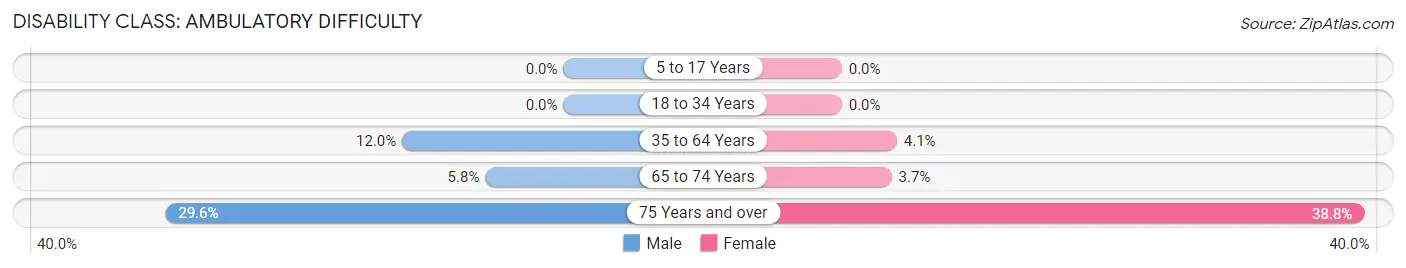
| Age Bracket | Male | Female |
| 5 to 17 Years | 0 (0.0%) | 0 (0.0%) |
| 18 to 34 Years | 0 (0.0%) | 0 (0.0%) |
| 35 to 64 Years | 51 (12.0%) | 14 (4.1%) |
| 65 to 74 Years | 4 (5.8%) | 3 (3.7%) |
| 75 Years and over | 13 (29.5%) | 19 (38.8%) |
Disability Class: Self-Care Difficulty
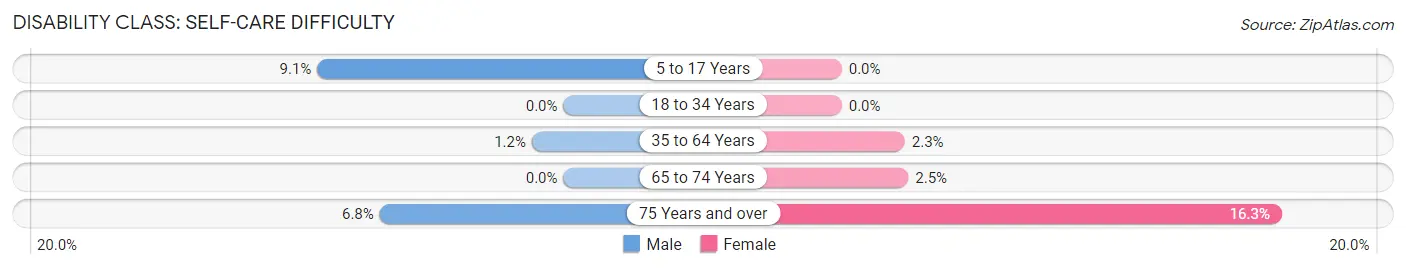
| Age Bracket | Male | Female |
| 5 to 17 Years | 16 (9.1%) | 0 (0.0%) |
| 18 to 34 Years | 0 (0.0%) | 0 (0.0%) |
| 35 to 64 Years | 5 (1.2%) | 8 (2.3%) |
| 65 to 74 Years | 0 (0.0%) | 2 (2.5%) |
| 75 Years and over | 3 (6.8%) | 8 (16.3%) |
Technology Access in Berrien Springs
Computing Device Access in Berrien Springs
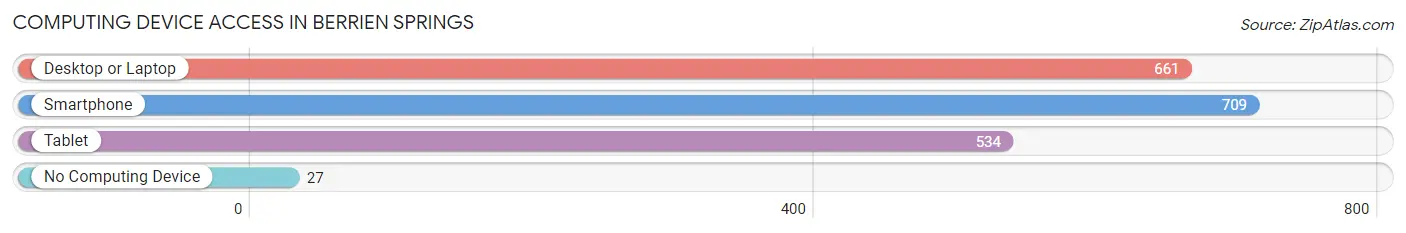
| Device Type | # Households | % Households |
| Desktop or Laptop | 661 | 85.7% |
| Smartphone | 709 | 92.0% |
| Tablet | 534 | 69.3% |
| No Computing Device | 27 | 3.5% |
| Total | 771 | 100.0% |
Internet Access in Berrien Springs
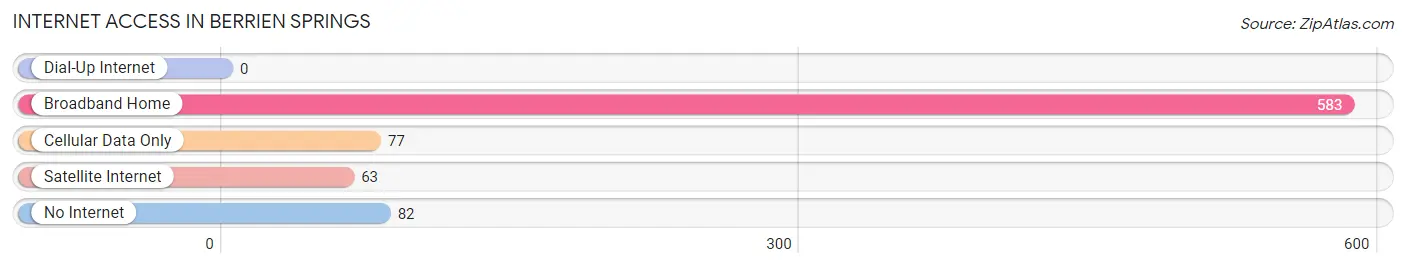
| Internet Type | # Households | % Households |
| Dial-Up Internet | 0 | 0.0% |
| Broadband Home | 583 | 75.6% |
| Cellular Data Only | 77 | 10.0% |
| Satellite Internet | 63 | 8.2% |
| No Internet | 82 | 10.6% |
| Total | 771 | 100.0% |
Berrien Springs Summary
Berrien Springs, Michigan is a small village located in Berrien County, Michigan. It is situated on the banks of the St. Joseph River, approximately 10 miles east of the city of Benton Harbor. The village has a population of 1,845 people, according to the 2010 census.
History
Berrien Springs was first settled in 1829 by a group of settlers from New York. The village was originally known as "Springsville" due to the numerous springs in the area. In 1831, the village was renamed Berrien Springs after John M. Berrien, a prominent lawyer and politician from Georgia.
The village was incorporated in 1837 and quickly became a popular destination for tourists due to its natural beauty and abundance of springs. In the late 19th century, the village was home to several resorts, including the Berrien Springs Hotel, which was built in 1876.
Geography
Berrien Springs is located in southwestern Michigan, approximately 10 miles east of Benton Harbor. The village is situated on the banks of the St. Joseph River, which flows through the village and provides a scenic backdrop. The village is surrounded by rolling hills and farmland, and is located in the heart of the St. Joseph Valley.
The village has a total area of 1.2 square miles, all of which is land. The village is located in the Central Time Zone and observes Daylight Saving Time.
Economy
The economy of Berrien Springs is largely based on agriculture and tourism. The village is home to several farms, which produce a variety of crops, including corn, soybeans, and wheat. The village is also home to several wineries, which produce a variety of wines.
The village is also home to several small businesses, including restaurants, shops, and galleries. The village is also home to Andrews University, which is a private university affiliated with the Seventh-day Adventist Church.
Demographics
According to the 2010 census, the population of Berrien Springs was 1,845 people. The racial makeup of the village was 94.3% White, 1.2% African American, 0.7% Native American, 0.7% Asian, 0.1% Pacific Islander, 1.2% from other races, and 1.9% from two or more races. Hispanic or Latino of any race were 3.2% of the population.
The median income for a household in the village was $37,917, and the median income for a family was $45,000. The per capita income for the village was $17,845. About 8.3% of families and 11.2% of the population were below the poverty line, including 15.2% of those under age 18 and 5.2% of those age 65 or over.
Common Questions
What is Per Capita Income in Berrien Springs?
Per Capita income in Berrien Springs is $35,941.
What is the Median Family Income in Berrien Springs?
Median Family Income in Berrien Springs is $82,165.
What is the Median Household income in Berrien Springs?
Median Household Income in Berrien Springs is $61,328.
What is Income or Wage Gap in Berrien Springs?
Income or Wage Gap in Berrien Springs is 35.7%.
Women in Berrien Springs earn 64.3 cents for every dollar earned by a man.
What is Inequality or Gini Index in Berrien Springs?
Inequality or Gini Index in Berrien Springs is 0.51.
What is the Total Population of Berrien Springs?
Total Population of Berrien Springs is 2,022.
What is the Total Male Population of Berrien Springs?
Total Male Population of Berrien Springs is 1,003.
What is the Total Female Population of Berrien Springs?
Total Female Population of Berrien Springs is 1,019.
What is the Ratio of Males per 100 Females in Berrien Springs?
There are 98.43 Males per 100 Females in Berrien Springs.
What is the Ratio of Females per 100 Males in Berrien Springs?
There are 101.60 Females per 100 Males in Berrien Springs.
What is the Median Population Age in Berrien Springs?
Median Population Age in Berrien Springs is 35.0 Years.
What is the Average Family Size in Berrien Springs
Average Family Size in Berrien Springs is 3.1 People.
What is the Average Household Size in Berrien Springs
Average Household Size in Berrien Springs is 2.6 People.
How Large is the Labor Force in Berrien Springs?
There are 1,057 People in the Labor Forcein in Berrien Springs.
What is the Percentage of People in the Labor Force in Berrien Springs?
63.0% of People are in the Labor Force in Berrien Springs.
What is the Unemployment Rate in Berrien Springs?
Unemployment Rate in Berrien Springs is 9.6%.