Greilickville, MI Map & Demographics
Greilickville Map
Greilickville Overview
$47,834
PER CAPITA INCOME
$90,543
AVG FAMILY INCOME
$73,553
AVG HOUSEHOLD INCOME
63.7%
WAGE / INCOME GAP [ % ]
36.3¢/ $1
WAGE / INCOME GAP [ $ ]
0.44
INEQUALITY / GINI INDEX
1,467
TOTAL POPULATION
706
MALE POPULATION
761
FEMALE POPULATION
92.77
MALES / 100 FEMALES
107.79
FEMALES / 100 MALES
59.5
MEDIAN AGE
2.7
AVG FAMILY SIZE
2.3
AVG HOUSEHOLD SIZE
503
LABOR FORCE [ PEOPLE ]
40.9%
PERCENT IN LABOR FORCE
2.0%
UNEMPLOYMENT RATE
Income in Greilickville
Income Overview in Greilickville
Per Capita Income in Greilickville is $47,834, while median incomes of families and households are $90,543 and $73,553 respectively.
| Characteristic | Number | Measure |
| Per Capita Income | 1,467 | $47,834 |
| Median Family Income | 366 | $90,543 |
| Mean Family Income | 366 | $120,066 |
| Median Household Income | 622 | $73,553 |
| Mean Household Income | 622 | $101,787 |
| Income Deficit | 366 | $0 |
| Wage / Income Gap (%) | 1,467 | 63.74% |
| Wage / Income Gap ($) | 1,467 | 36.26¢ per $1 |
| Gini / Inequality Index | 1,467 | 0.44 |
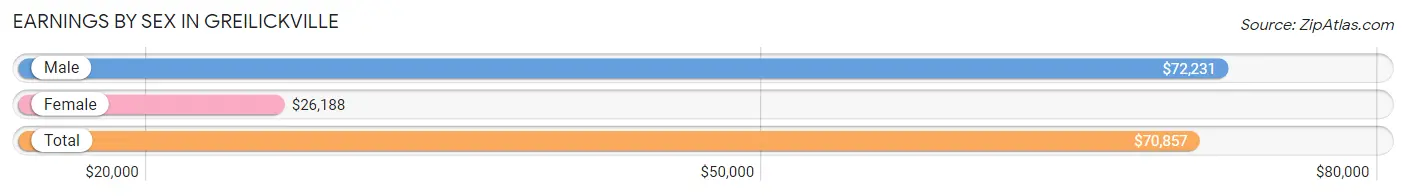
Earnings by Sex in Greilickville
Average Earnings in Greilickville are $70,857, $72,231 for men and $26,188 for women, a difference of 63.7%.
| Sex | Number | Average Earnings |
| Male | 318 (63.2%) | $72,231 |
| Female | 185 (36.8%) | $26,188 |
| Total | 503 (100.0%) | $70,857 |
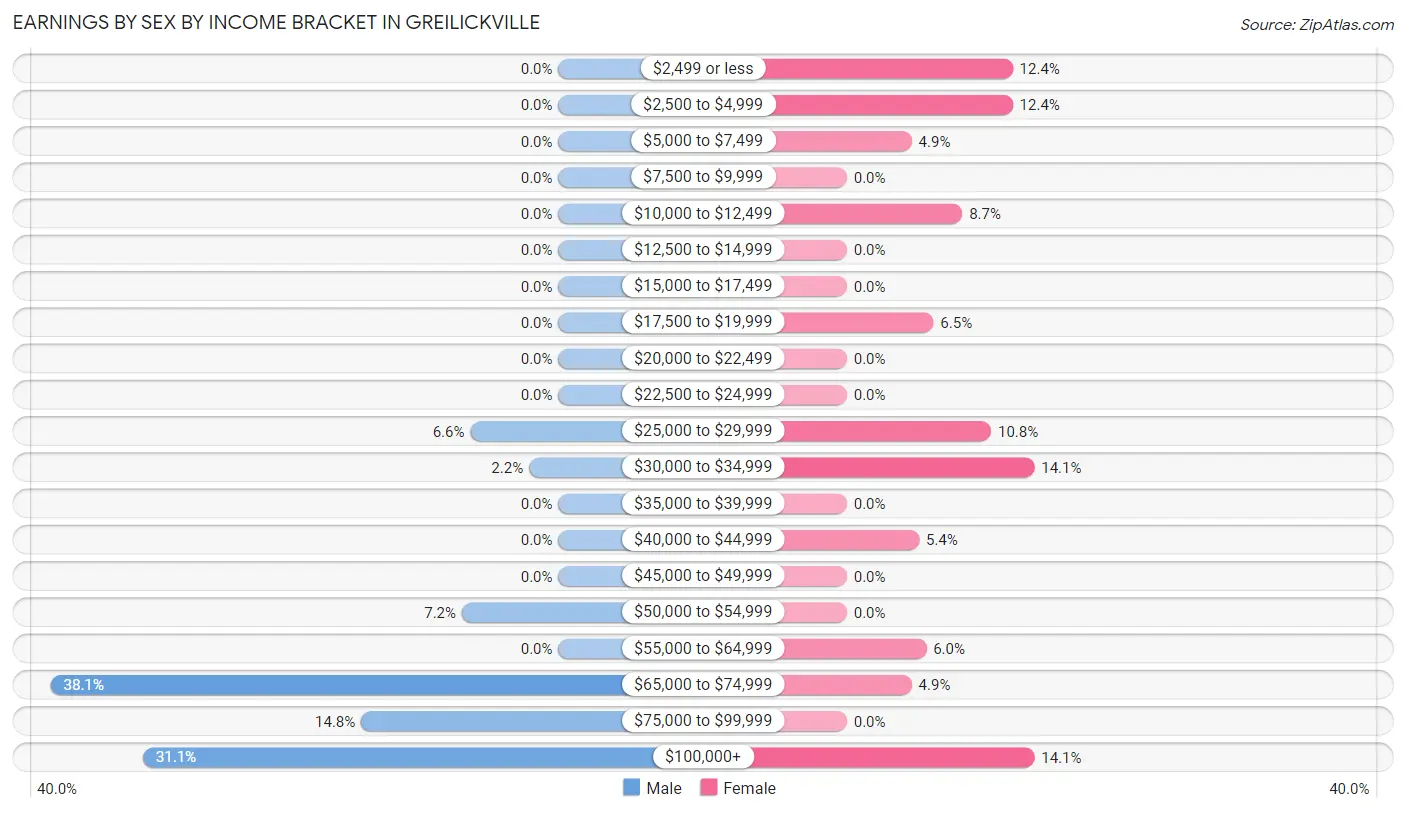
Earnings by Sex by Income Bracket in Greilickville
The most common earnings brackets in Greilickville are $65,000 to $74,999 for men (121 | 38.1%) and $30,000 to $34,999 for women (26 | 14.1%).
| Income | Male | Female |
| $2,499 or less | 0 (0.0%) | 23 (12.4%) |
| $2,500 to $4,999 | 0 (0.0%) | 23 (12.4%) |
| $5,000 to $7,499 | 0 (0.0%) | 9 (4.9%) |
| $7,500 to $9,999 | 0 (0.0%) | 0 (0.0%) |
| $10,000 to $12,499 | 0 (0.0%) | 16 (8.6%) |
| $12,500 to $14,999 | 0 (0.0%) | 0 (0.0%) |
| $15,000 to $17,499 | 0 (0.0%) | 0 (0.0%) |
| $17,500 to $19,999 | 0 (0.0%) | 12 (6.5%) |
| $20,000 to $22,499 | 0 (0.0%) | 0 (0.0%) |
| $22,500 to $24,999 | 0 (0.0%) | 0 (0.0%) |
| $25,000 to $29,999 | 21 (6.6%) | 20 (10.8%) |
| $30,000 to $34,999 | 7 (2.2%) | 26 (14.1%) |
| $35,000 to $39,999 | 0 (0.0%) | 0 (0.0%) |
| $40,000 to $44,999 | 0 (0.0%) | 10 (5.4%) |
| $45,000 to $49,999 | 0 (0.0%) | 0 (0.0%) |
| $50,000 to $54,999 | 23 (7.2%) | 0 (0.0%) |
| $55,000 to $64,999 | 0 (0.0%) | 11 (5.9%) |
| $65,000 to $74,999 | 121 (38.1%) | 9 (4.9%) |
| $75,000 to $99,999 | 47 (14.8%) | 0 (0.0%) |
| $100,000+ | 99 (31.1%) | 26 (14.1%) |
| Total | 318 (100.0%) | 185 (100.0%) |
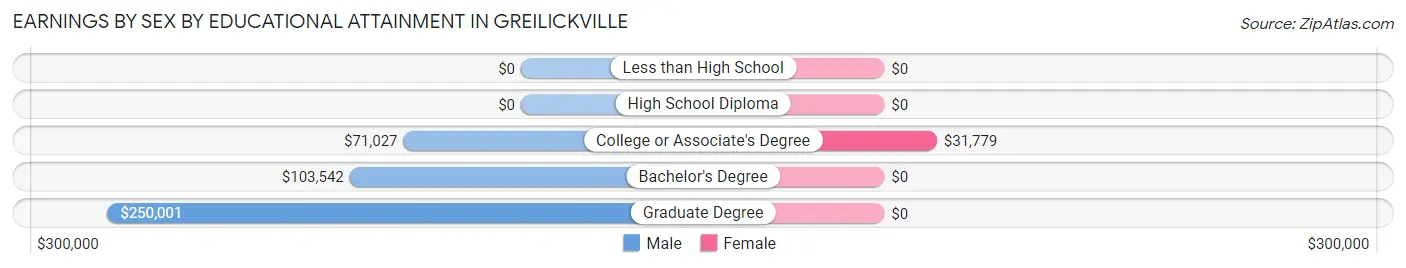
Earnings by Sex by Educational Attainment in Greilickville
Average earnings in Greilickville are $72,231 for men and $26,938 for women, a difference of 62.7%. Men with an educational attainment of graduate degree enjoy the highest average annual earnings of $250,001, while those with college or associate's degree education earn the least with $71,027. Women with an educational attainment of college or associate's degree earn the most with the average annual earnings of $31,779, while those with college or associate's degree education have the smallest earnings of $31,779.
| Educational Attainment | Male Income | Female Income |
| Less than High School | - | - |
| High School Diploma | - | - |
| College or Associate's Degree | $71,027 | $31,779 |
| Bachelor's Degree | $103,542 | $0 |
| Graduate Degree | $250,001 | $0 |
| Total | $72,231 | $26,938 |
Family Income in Greilickville
Family Income Brackets in Greilickville
According to the Greilickville family income data, there are 70 families falling into the $100,000 to $149,999 income range, which is the most common income bracket and makes up 19.1% of all families.
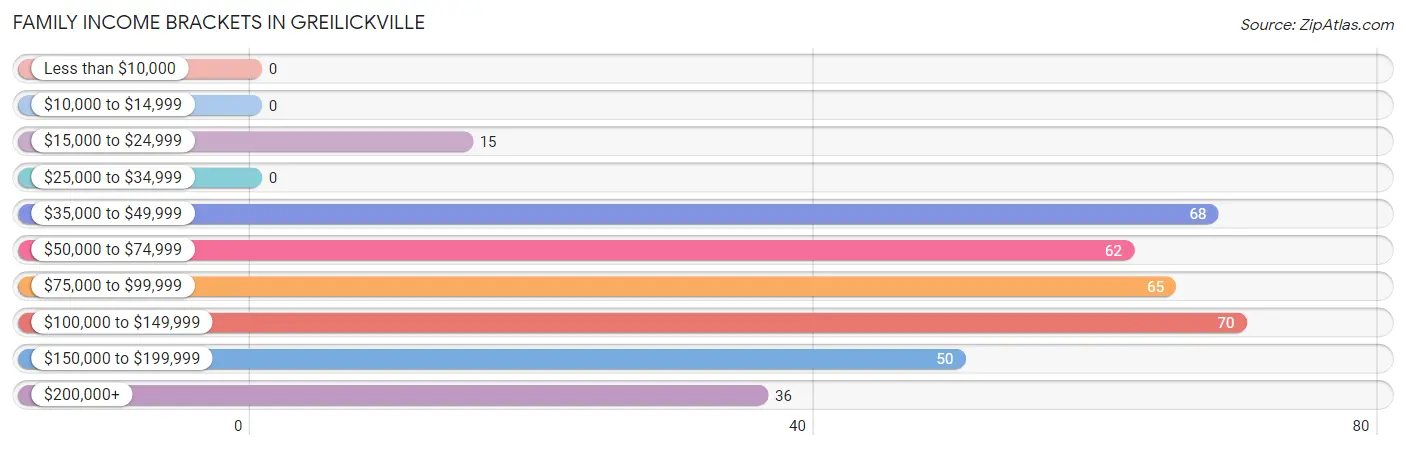
| Income Bracket | # Families | % Families |
| Less than $10,000 | 0 | 0.0% |
| $10,000 to $14,999 | 0 | 0.0% |
| $15,000 to $24,999 | 15 | 4.1% |
| $25,000 to $34,999 | 0 | 0.0% |
| $35,000 to $49,999 | 68 | 18.6% |
| $50,000 to $74,999 | 62 | 16.9% |
| $75,000 to $99,999 | 65 | 17.8% |
| $100,000 to $149,999 | 70 | 19.1% |
| $150,000 to $199,999 | 50 | 13.7% |
| $200,000+ | 36 | 9.8% |
Family Income by Famaliy Size in Greilickville
3-person families (30 | 8.2%) account for the highest median family income in Greilickville with $180,417 per family, while 3-person families (30 | 8.2%) have the highest median income of $60,139 per family member.
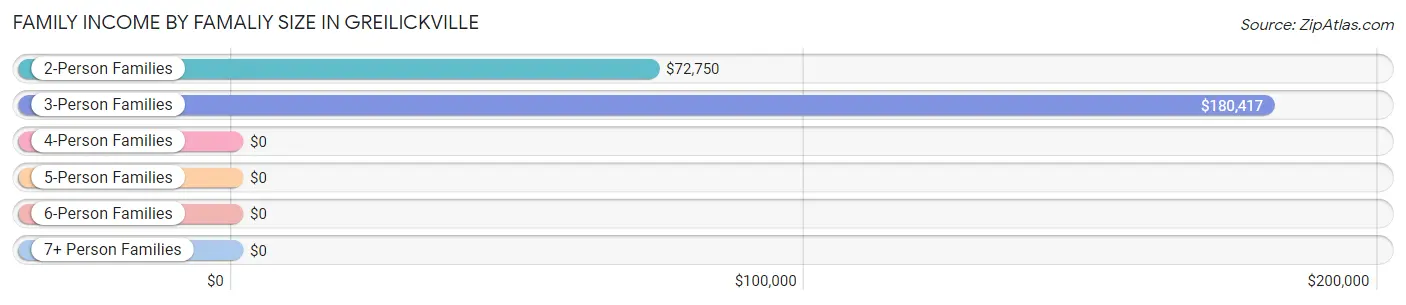
| Income Bracket | # Families | Median Income |
| 2-Person Families | 272 (74.3%) | $72,750 |
| 3-Person Families | 30 (8.2%) | $180,417 |
| 4-Person Families | 0 (0.0%) | $0 |
| 5-Person Families | 50 (13.7%) | $0 |
| 6-Person Families | 14 (3.8%) | $0 |
| 7+ Person Families | 0 (0.0%) | $0 |
| Total | 366 (100.0%) | $90,543 |
Family Income by Number of Earners in Greilickville
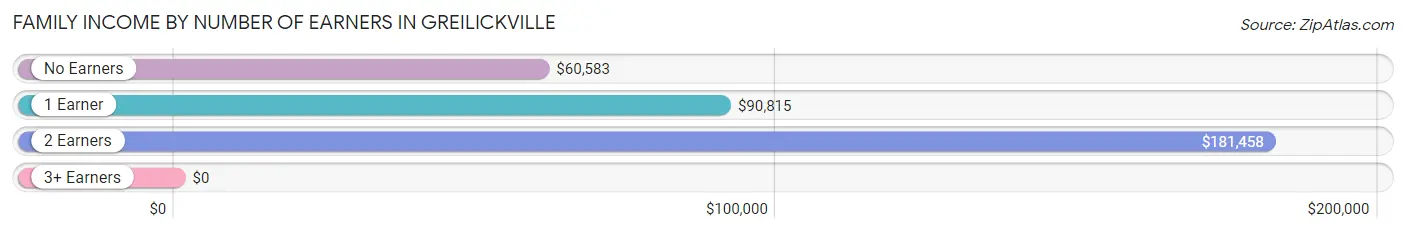
| Number of Earners | # Families | Median Income |
| No Earners | 225 (61.5%) | $60,583 |
| 1 Earner | 53 (14.5%) | $90,815 |
| 2 Earners | 79 (21.6%) | $181,458 |
| 3+ Earners | 9 (2.5%) | $0 |
| Total | 366 (100.0%) | $90,543 |
Household Income in Greilickville
Household Income Brackets in Greilickville
With 137 households falling in the category, the $50,000 to $74,999 income range is the most frequent in Greilickville, accounting for 22.0% of all households.
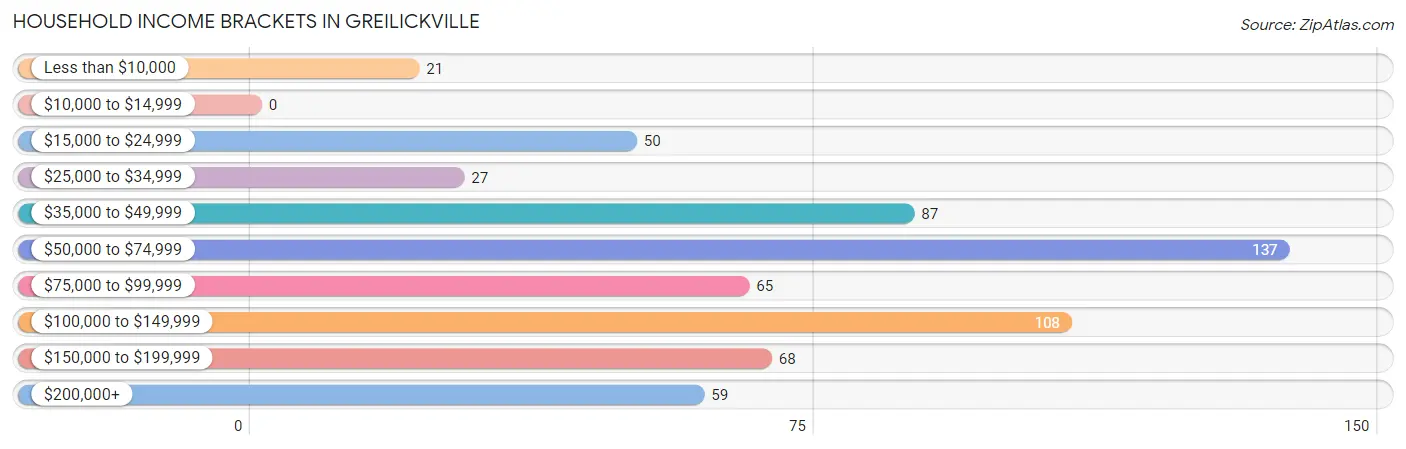
| Income Bracket | # Households | % Households |
| Less than $10,000 | 21 | 3.4% |
| $10,000 to $14,999 | 0 | 0.0% |
| $15,000 to $24,999 | 50 | 8.0% |
| $25,000 to $34,999 | 27 | 4.3% |
| $35,000 to $49,999 | 87 | 14.0% |
| $50,000 to $74,999 | 137 | 22.0% |
| $75,000 to $99,999 | 65 | 10.5% |
| $100,000 to $149,999 | 108 | 17.4% |
| $150,000 to $199,999 | 68 | 10.9% |
| $200,000+ | 59 | 9.5% |
Household Income by Householder Age in Greilickville
The median household income in Greilickville is $73,553, with the highest median household income of $94,722 found in the 45 to 64 years age bracket for the primary householder. A total of 170 households (27.3%) fall into this category.
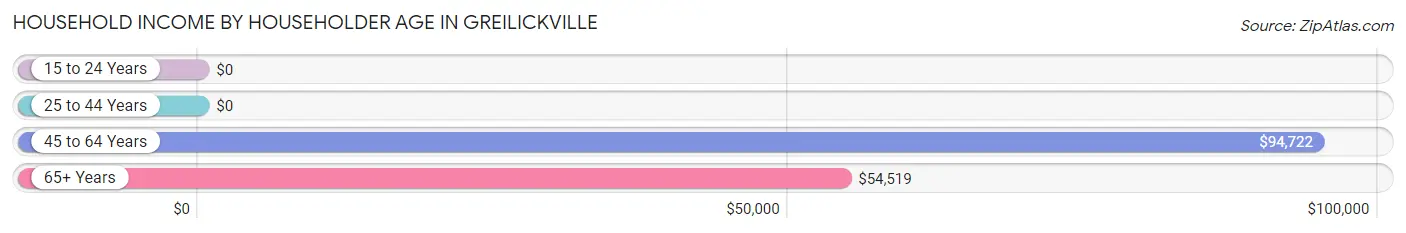
| Income Bracket | # Households | Median Income |
| 15 to 24 Years | 0 (0.0%) | $0 |
| 25 to 44 Years | 80 (12.9%) | $0 |
| 45 to 64 Years | 170 (27.3%) | $94,722 |
| 65+ Years | 372 (59.8%) | $54,519 |
| Total | 622 (100.0%) | $73,553 |
Poverty in Greilickville
Income Below Poverty by Sex and Age in Greilickville
With 6.4% poverty level for males and 3.4% for females among the residents of Greilickville, 75 year old and over males and 15 year old females are the most vulnerable to poverty, with 21 males (17.4%) and 6 females (10.0%) in their respective age groups living below the poverty level.
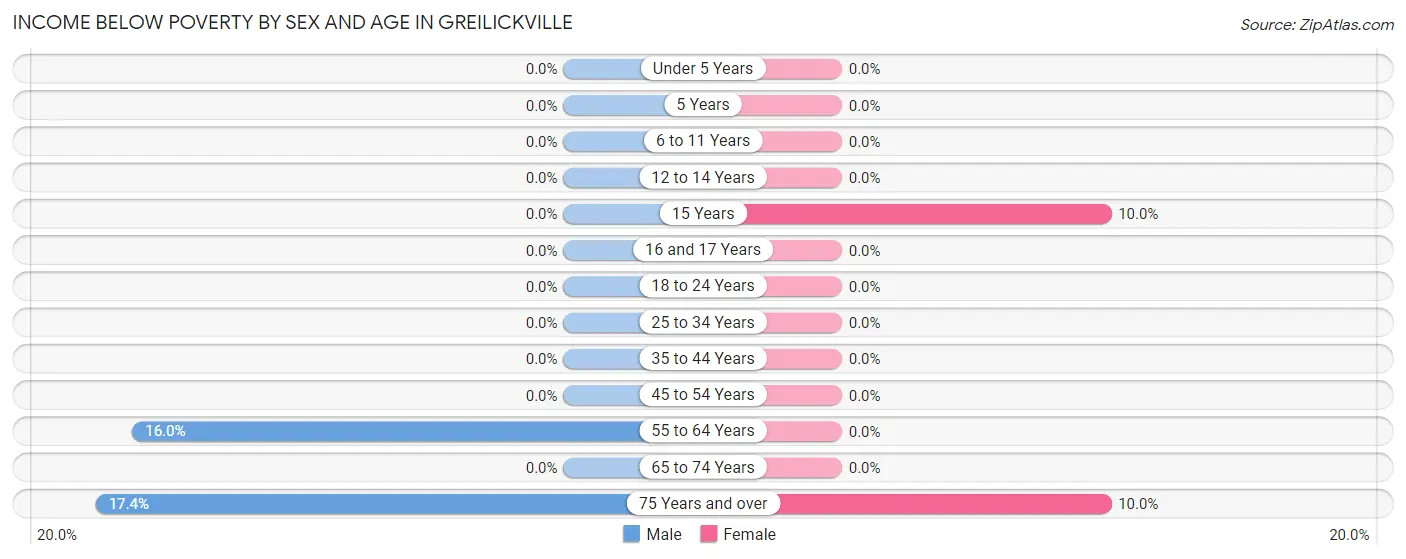
| Age Bracket | Male | Female |
| Under 5 Years | 0 (0.0%) | 0 (0.0%) |
| 5 Years | 0 (0.0%) | 0 (0.0%) |
| 6 to 11 Years | 0 (0.0%) | 0 (0.0%) |
| 12 to 14 Years | 0 (0.0%) | 0 (0.0%) |
| 15 Years | 0 (0.0%) | 6 (10.0%) |
| 16 and 17 Years | 0 (0.0%) | 0 (0.0%) |
| 18 to 24 Years | 0 (0.0%) | 0 (0.0%) |
| 25 to 34 Years | 0 (0.0%) | 0 (0.0%) |
| 35 to 44 Years | 0 (0.0%) | 0 (0.0%) |
| 45 to 54 Years | 0 (0.0%) | 0 (0.0%) |
| 55 to 64 Years | 24 (16.0%) | 0 (0.0%) |
| 65 to 74 Years | 0 (0.0%) | 0 (0.0%) |
| 75 Years and over | 21 (17.4%) | 19 (10.0%) |
| Total | 45 (6.4%) | 25 (3.4%) |
Income Above Poverty by Sex and Age in Greilickville
According to the poverty statistics in Greilickville, males aged under 5 years and females aged under 5 years are the age groups that are most secure financially, with 100.0% of males and 100.0% of females in these age groups living above the poverty line.
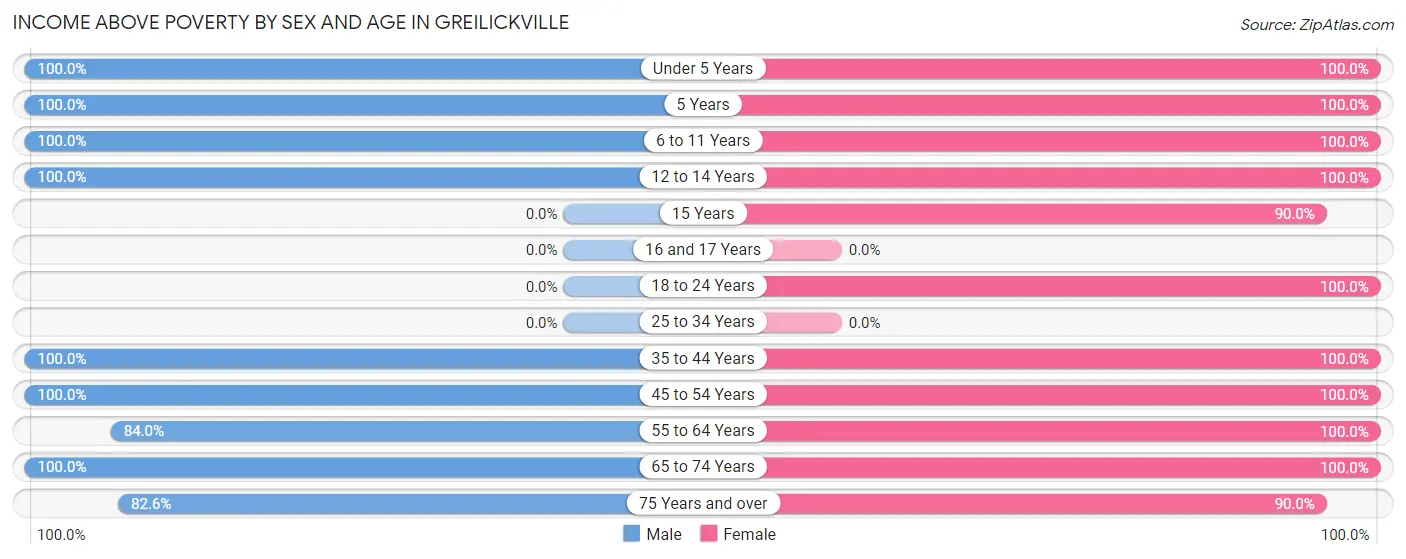
| Age Bracket | Male | Female |
| Under 5 Years | 12 (100.0%) | 34 (100.0%) |
| 5 Years | 24 (100.0%) | 12 (100.0%) |
| 6 to 11 Years | 44 (100.0%) | 17 (100.0%) |
| 12 to 14 Years | 24 (100.0%) | 11 (100.0%) |
| 15 Years | 0 (0.0%) | 54 (90.0%) |
| 16 and 17 Years | 0 (0.0%) | 0 (0.0%) |
| 18 to 24 Years | 0 (0.0%) | 12 (100.0%) |
| 25 to 34 Years | 0 (0.0%) | 0 (0.0%) |
| 35 to 44 Years | 57 (100.0%) | 114 (100.0%) |
| 45 to 54 Years | 145 (100.0%) | 75 (100.0%) |
| 55 to 64 Years | 126 (84.0%) | 104 (100.0%) |
| 65 to 74 Years | 129 (100.0%) | 112 (100.0%) |
| 75 Years and over | 100 (82.6%) | 171 (90.0%) |
| Total | 661 (93.6%) | 716 (96.6%) |
Income Below Poverty Among Married-Couple Families in Greilickville
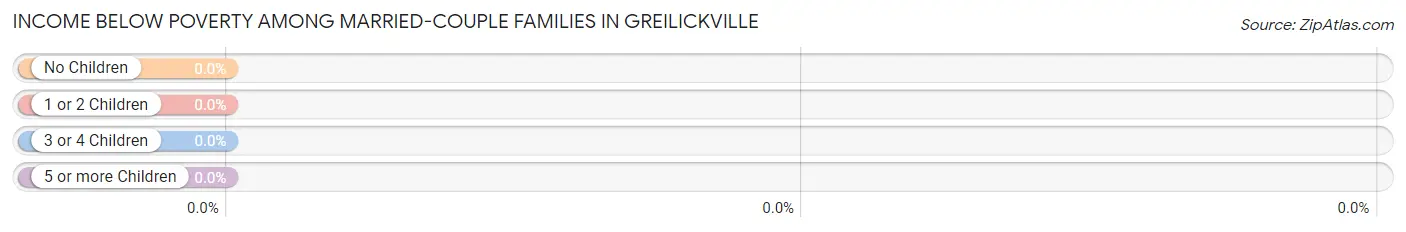
| Children | Above Poverty | Below Poverty |
| No Children | 229 (100.0%) | 0 (0.0%) |
| 1 or 2 Children | 45 (100.0%) | 0 (0.0%) |
| 3 or 4 Children | 37 (100.0%) | 0 (0.0%) |
| 5 or more Children | 0 (0.0%) | 0 (0.0%) |
| Total | 311 (100.0%) | 0 (0.0%) |
Income Below Poverty Among Single-Parent Households in Greilickville
| Children | Single Father | Single Mother |
| No Children | 0 (0.0%) | 0 (0.0%) |
| 1 or 2 Children | 0 (0.0%) | 0 (0.0%) |
| 3 or 4 Children | 0 (0.0%) | 0 (0.0%) |
| 5 or more Children | 0 (0.0%) | 0 (0.0%) |
| Total | 0 (0.0%) | 0 (0.0%) |
Income Below Poverty Among Married-Couple vs Single-Parent Households in Greilickville
| Children | Married-Couple Families | Single-Parent Households |
| No Children | 0 (0.0%) | 0 (0.0%) |
| 1 or 2 Children | 0 (0.0%) | 0 (0.0%) |
| 3 or 4 Children | 0 (0.0%) | 0 (0.0%) |
| 5 or more Children | 0 (0.0%) | 0 (0.0%) |
| Total | 0 (0.0%) | 0 (0.0%) |
Race in Greilickville
The most populous races in Greilickville are White / Caucasian (1,319 | 89.9%), Two or more Races (83 | 5.7%), and Asian (40 | 2.7%).
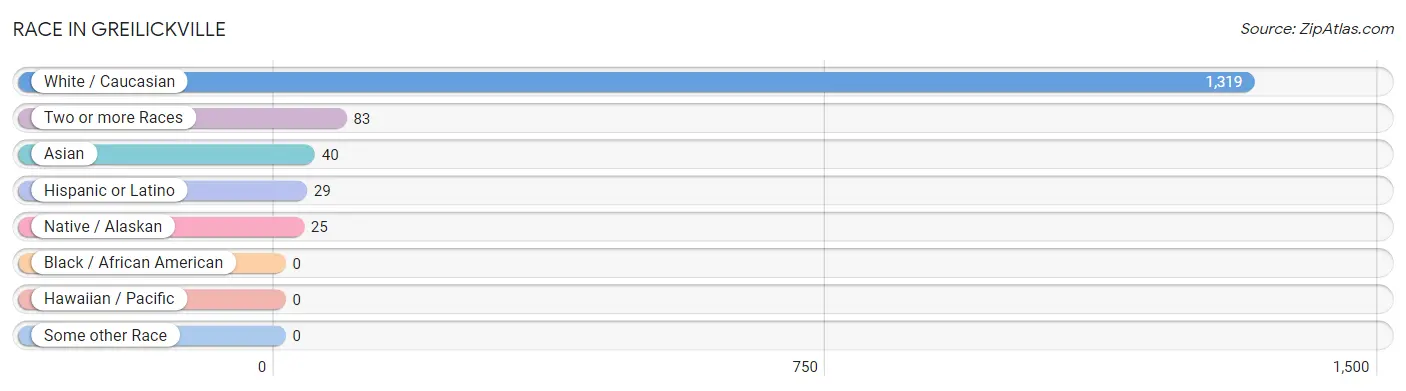
| Race | # Population | % Population |
| Asian | 40 | 2.7% |
| Black / African American | 0 | 0.0% |
| Hawaiian / Pacific | 0 | 0.0% |
| Hispanic or Latino | 29 | 2.0% |
| Native / Alaskan | 25 | 1.7% |
| White / Caucasian | 1,319 | 89.9% |
| Two or more Races | 83 | 5.7% |
| Some other Race | 0 | 0.0% |
| Total | 1,467 | 100.0% |
Ancestry in Greilickville
The most populous ancestries reported in Greilickville are German (542 | 36.9%), English (255 | 17.4%), American (123 | 8.4%), Irish (97 | 6.6%), and Scottish (87 | 5.9%), together accounting for 75.3% of all Greilickville residents.
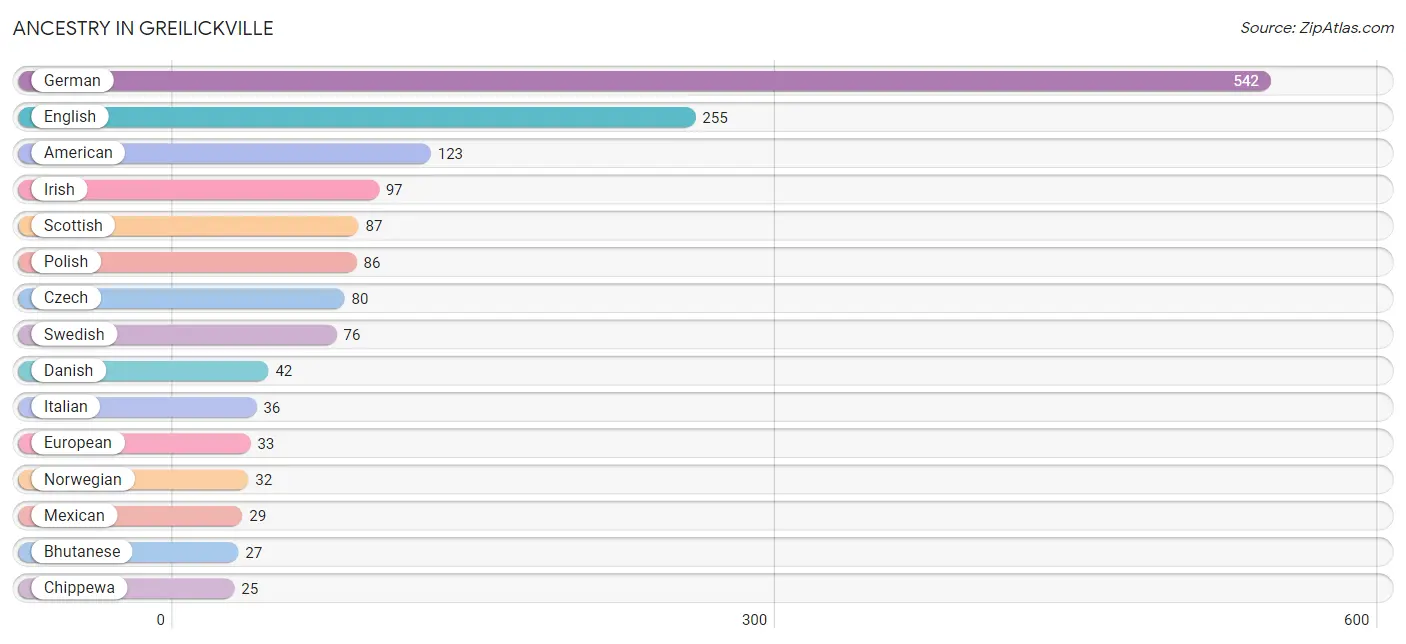
| Ancestry | # Population | % Population |
| American | 123 | 8.4% |
| Belgian | 18 | 1.2% |
| Bhutanese | 27 | 1.8% |
| Chippewa | 25 | 1.7% |
| Czech | 80 | 5.4% |
| Danish | 42 | 2.9% |
| Dutch | 23 | 1.6% |
| English | 255 | 17.4% |
| European | 33 | 2.2% |
| Filipino | 12 | 0.8% |
| German | 542 | 36.9% |
| Indian (Asian) | 21 | 1.4% |
| Irish | 97 | 6.6% |
| Italian | 36 | 2.5% |
| Korean | 11 | 0.7% |
| Lithuanian | 15 | 1.0% |
| Mexican | 29 | 2.0% |
| Norwegian | 32 | 2.2% |
| Polish | 86 | 5.9% |
| Scandinavian | 14 | 0.9% |
| Scottish | 87 | 5.9% |
| Sri Lankan | 4 | 0.3% |
| Swedish | 76 | 5.2% |
| Swiss | 9 | 0.6% | View All 24 Rows |
Immigrants in Greilickville
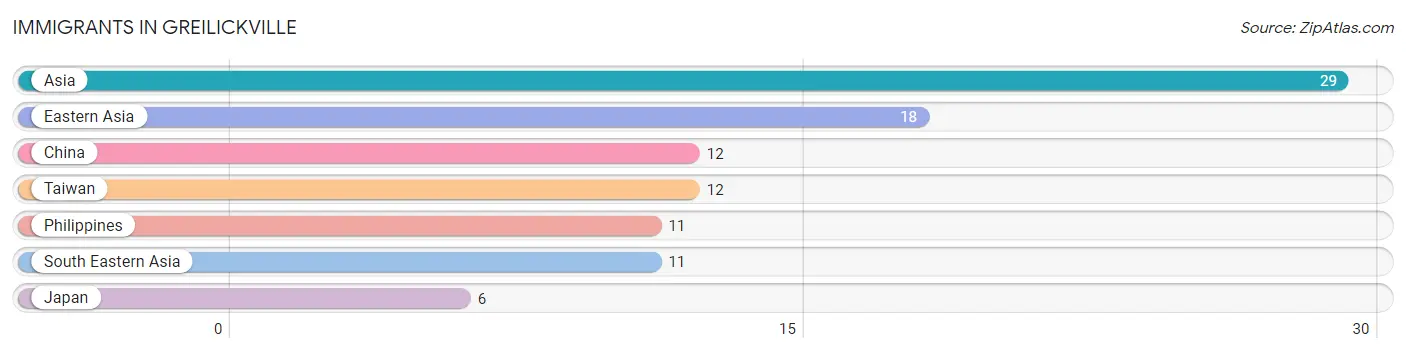
The most numerous immigrant groups reported in Greilickville came from Asia (29 | 2.0%), Eastern Asia (18 | 1.2%), China (12 | 0.8%), Taiwan (12 | 0.8%), and Philippines (11 | 0.7%), together accounting for 5.6% of all Greilickville residents.
| Immigration Origin | # Population | % Population |
| Asia | 29 | 2.0% |
| China | 12 | 0.8% |
| Eastern Asia | 18 | 1.2% |
| Japan | 6 | 0.4% |
| Philippines | 11 | 0.7% |
| South Eastern Asia | 11 | 0.7% |
| Taiwan | 12 | 0.8% | View All 7 Rows |
Sex and Age in Greilickville
Sex and Age in Greilickville
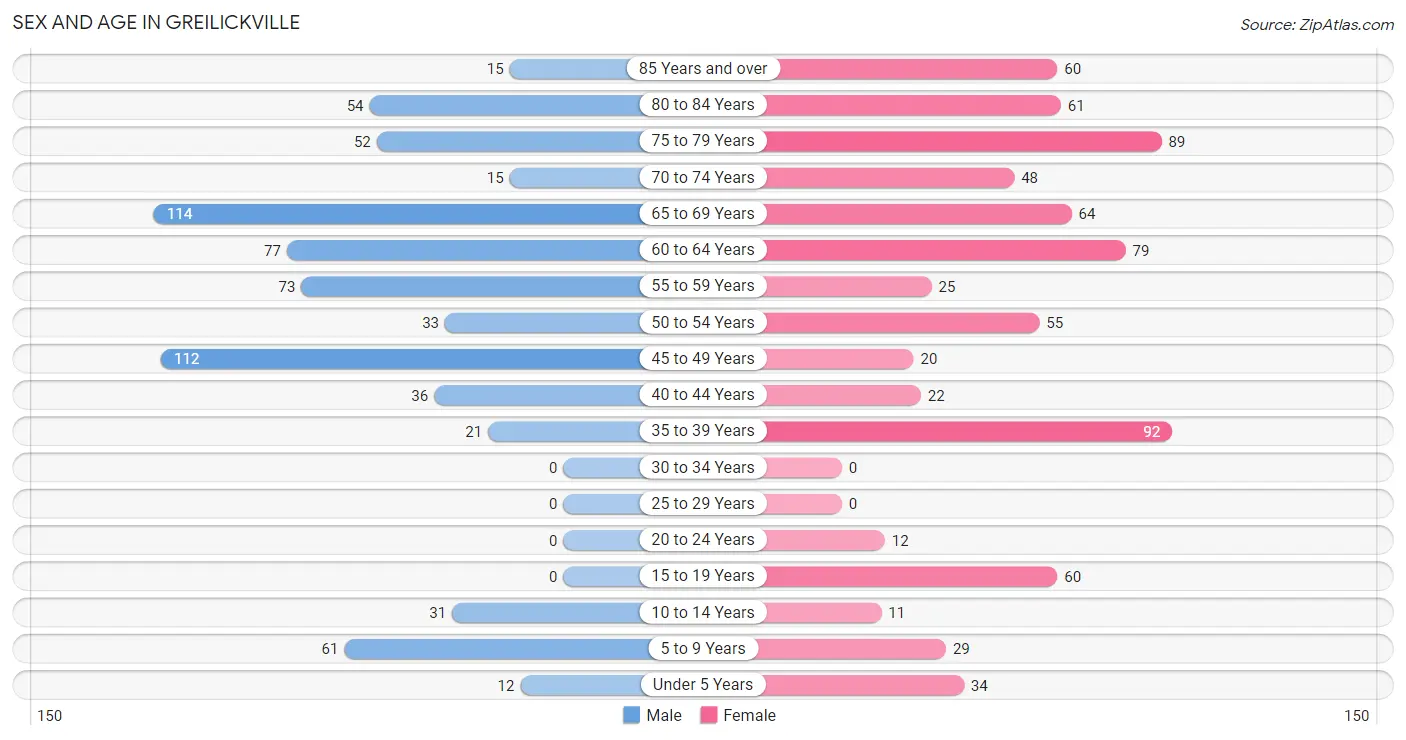
The most populous age groups in Greilickville are 65 to 69 Years (114 | 16.2%) for men and 35 to 39 Years (92 | 12.1%) for women.
| Age Bracket | Male | Female |
| Under 5 Years | 12 (1.7%) | 34 (4.5%) |
| 5 to 9 Years | 61 (8.6%) | 29 (3.8%) |
| 10 to 14 Years | 31 (4.4%) | 11 (1.5%) |
| 15 to 19 Years | 0 (0.0%) | 60 (7.9%) |
| 20 to 24 Years | 0 (0.0%) | 12 (1.6%) |
| 25 to 29 Years | 0 (0.0%) | 0 (0.0%) |
| 30 to 34 Years | 0 (0.0%) | 0 (0.0%) |
| 35 to 39 Years | 21 (3.0%) | 92 (12.1%) |
| 40 to 44 Years | 36 (5.1%) | 22 (2.9%) |
| 45 to 49 Years | 112 (15.9%) | 20 (2.6%) |
| 50 to 54 Years | 33 (4.7%) | 55 (7.2%) |
| 55 to 59 Years | 73 (10.3%) | 25 (3.3%) |
| 60 to 64 Years | 77 (10.9%) | 79 (10.4%) |
| 65 to 69 Years | 114 (16.2%) | 64 (8.4%) |
| 70 to 74 Years | 15 (2.1%) | 48 (6.3%) |
| 75 to 79 Years | 52 (7.4%) | 89 (11.7%) |
| 80 to 84 Years | 54 (7.6%) | 61 (8.0%) |
| 85 Years and over | 15 (2.1%) | 60 (7.9%) |
| Total | 706 (100.0%) | 761 (100.0%) |
Families and Households in Greilickville
Median Family Size in Greilickville
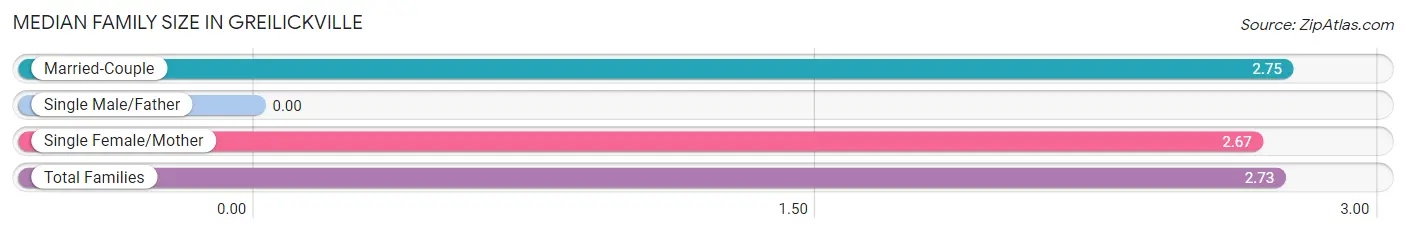
| Family Type | # Families | Family Size |
| Married-Couple | 311 (85.0%) | 2.75 |
| Single Male/Father | 0 (0.0%) | - |
| Single Female/Mother | 55 (15.0%) | 2.67 |
| Total Families | 366 (100.0%) | 2.73 |
Median Household Size in Greilickville
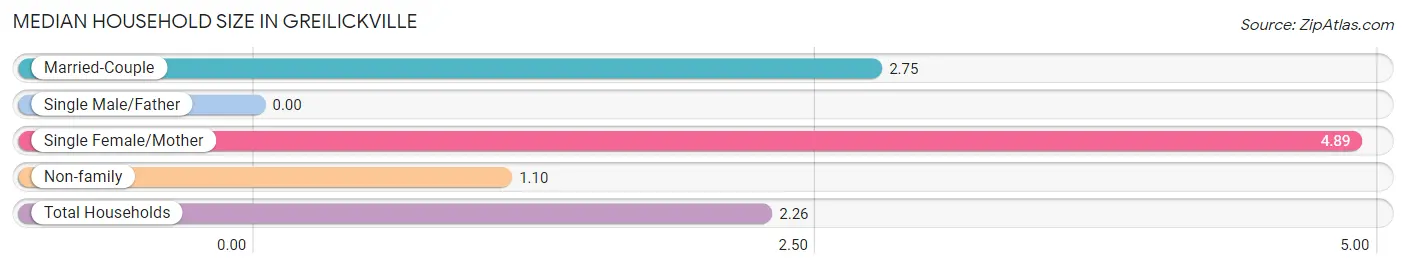
| Household Type | # Households | Household Size |
| Married-Couple | 311 (50.0%) | 2.75 |
| Single Male/Father | 0 (0.0%) | - |
| Single Female/Mother | 55 (8.8%) | 4.89 |
| Non-family | 256 (41.2%) | 1.10 |
| Total Households | 622 (100.0%) | 2.26 |
Household Size by Marriage Status in Greilickville
Out of a total of 622 households in Greilickville, 366 (58.8%) are family households, while 256 (41.2%) are nonfamily households. The most numerous type of family households are 2-person households, comprising 245, and the most common type of nonfamily households are 1-person households, comprising 233.
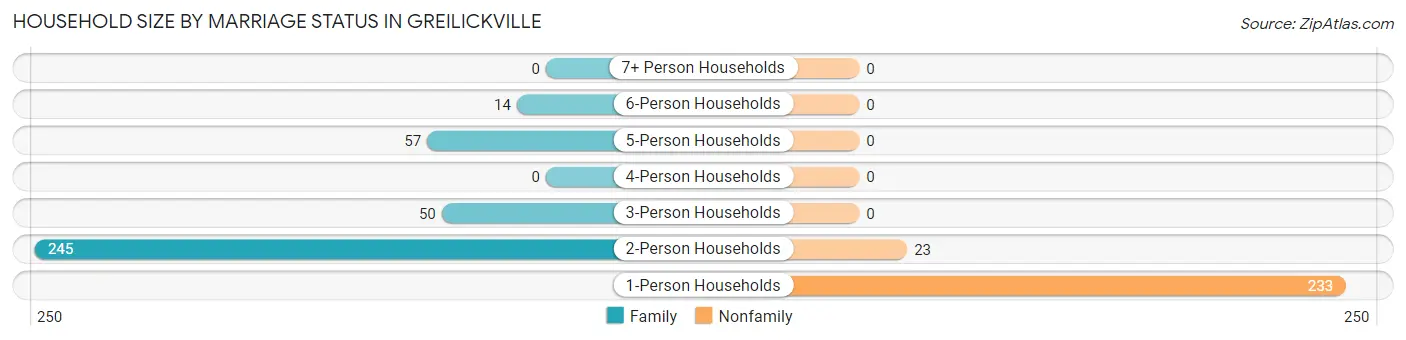
| Household Size | Family Households | Nonfamily Households |
| 1-Person Households | - | 233 (37.5%) |
| 2-Person Households | 245 (39.4%) | 23 (3.7%) |
| 3-Person Households | 50 (8.0%) | 0 (0.0%) |
| 4-Person Households | 0 (0.0%) | 0 (0.0%) |
| 5-Person Households | 57 (9.2%) | 0 (0.0%) |
| 6-Person Households | 14 (2.2%) | 0 (0.0%) |
| 7+ Person Households | 0 (0.0%) | 0 (0.0%) |
| Total | 366 (58.8%) | 256 (41.2%) |
Female Fertility in Greilickville
Fertility by Age in Greilickville
| Age Bracket | Women with Births | Births / 1,000 Women |
| 15 to 19 years | 0 (0.0%) | 0.0 |
| 20 to 34 years | 0 (0.0%) | 0.0 |
| 35 to 50 years | 0 (0.0%) | 0.0 |
| Total | 0 (0.0%) | 0.0 |
Fertility by Age by Marriage Status in Greilickville
| Age Bracket | Married | Unmarried |
| 15 to 19 years | 0 (0.0%) | 0 (0.0%) |
| 20 to 34 years | 0 (0.0%) | 0 (0.0%) |
| 35 to 50 years | 0 (0.0%) | 0 (0.0%) |
| Total | 0 (0.0%) | 0 (0.0%) |
Fertility by Education in Greilickville
| Educational Attainment | Women with Births | Births / 1,000 Women |
| Less than High School | 0 (0.0%) | 0.0 |
| High School Diploma | 0 (0.0%) | 0.0 |
| College or Associate's Degree | 0 (0.0%) | 0.0 |
| Bachelor's Degree | 0 (0.0%) | 0.0 |
| Graduate Degree | 0 (0.0%) | 0.0 |
| Total | 0 (0.0%) | 0.0 |
Fertility by Education by Marriage Status in Greilickville
| Educational Attainment | Married | Unmarried |
| Less than High School | 0 (0.0%) | 0 (0.0%) |
| High School Diploma | 0 (0.0%) | 0 (0.0%) |
| College or Associate's Degree | 0 (0.0%) | 0 (0.0%) |
| Bachelor's Degree | 0 (0.0%) | 0 (0.0%) |
| Graduate Degree | 0 (0.0%) | 0 (0.0%) |
| Total | 0 (0.0%) | 0 (0.0%) |
Employment Characteristics in Greilickville
Employment by Class of Employer in Greilickville
Among the 472 employed individuals in Greilickville, private company employees (164 | 34.7%), local government employees (154 | 32.6%), and not-for-profit organizations (66 | 14.0%) make up the most common classes of employment.
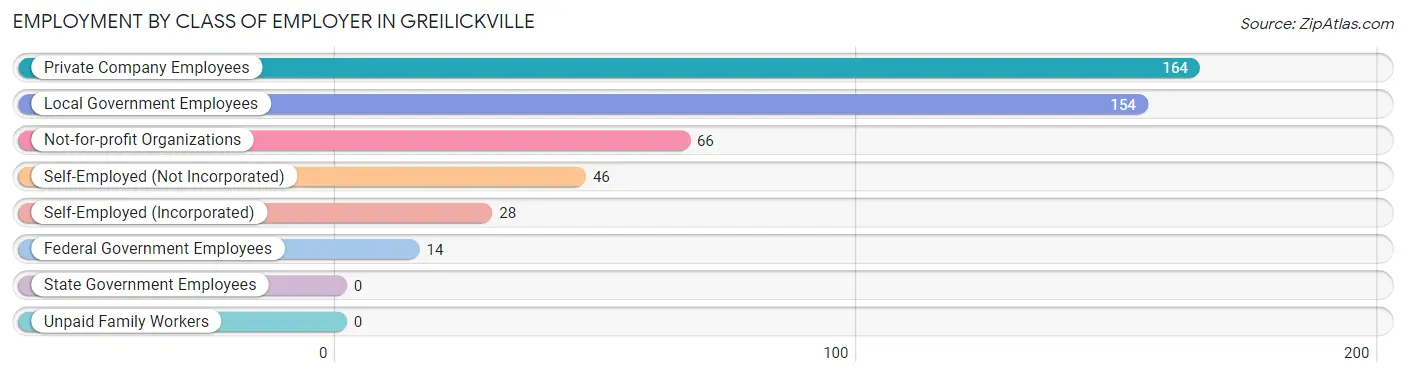
| Employer Class | # Employees | % Employees |
| Private Company Employees | 164 | 34.7% |
| Self-Employed (Incorporated) | 28 | 5.9% |
| Self-Employed (Not Incorporated) | 46 | 9.8% |
| Not-for-profit Organizations | 66 | 14.0% |
| Local Government Employees | 154 | 32.6% |
| State Government Employees | 0 | 0.0% |
| Federal Government Employees | 14 | 3.0% |
| Unpaid Family Workers | 0 | 0.0% |
| Total | 472 | 100.0% |
Employment Status by Age in Greilickville
According to the labor force statistics for Greilickville, out of the total population over 16 years of age (1,229), 40.9% or 503 individuals are in the labor force, with 2.0% or 10 of them unemployed. The age group with the highest labor force participation rate is 20 to 24 years, with 100.0% or 12 individuals in the labor force. Within the labor force, the 55 to 59 years age range has the highest percentage of unemployed individuals, with 22.2% or 10 of them being unemployed.
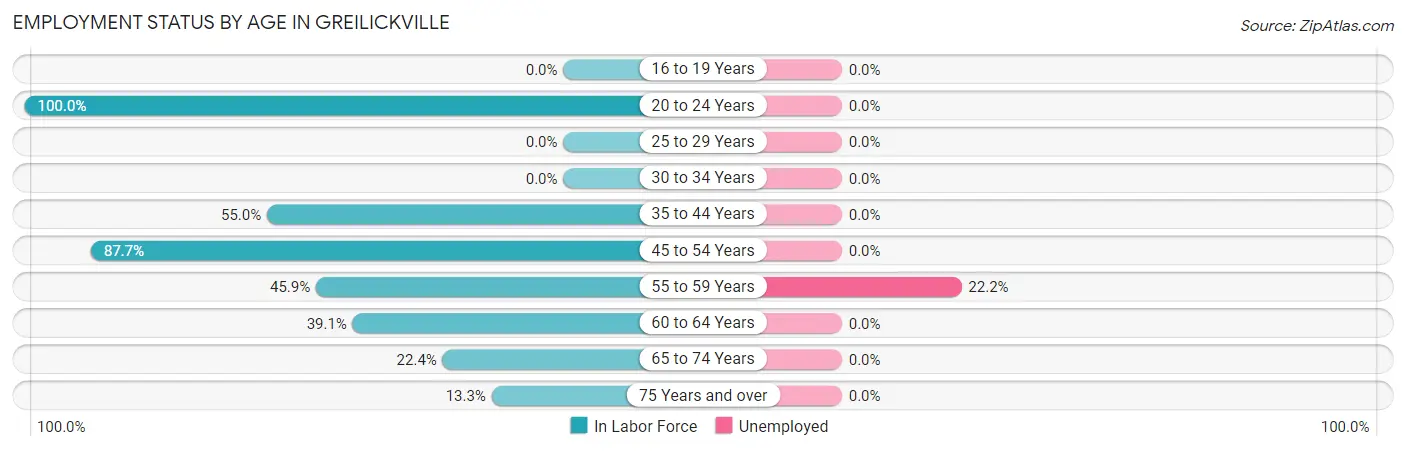
| Age Bracket | In Labor Force | Unemployed |
| 16 to 19 Years | 0 (0.0%) | 0 (0.0%) |
| 20 to 24 Years | 12 (100.0%) | 0 (0.0%) |
| 25 to 29 Years | 0 (0.0%) | 0 (0.0%) |
| 30 to 34 Years | 0 (0.0%) | 0 (0.0%) |
| 35 to 44 Years | 94 (55.0%) | 0 (0.0%) |
| 45 to 54 Years | 193 (87.7%) | 0 (0.0%) |
| 55 to 59 Years | 45 (45.9%) | 10 (22.2%) |
| 60 to 64 Years | 61 (39.1%) | 0 (0.0%) |
| 65 to 74 Years | 54 (22.4%) | 0 (0.0%) |
| 75 Years and over | 44 (13.3%) | 0 (0.0%) |
| Total | 503 (40.9%) | 10 (2.0%) |
Employment Status by Educational Attainment in Greilickville
According to labor force statistics for Greilickville, 60.9% of individuals (393) out of the total population between 25 and 64 years of age (645) are in the labor force, with 2.5% or 10 of them being unemployed. The group with the highest labor force participation rate are those with the educational attainment of bachelor's degree or higher, with 84.1% or 190 individuals in the labor force. Within the labor force, individuals with high school diploma education have the highest percentage of unemployment, with 35.7% or 10 of them being unemployed.
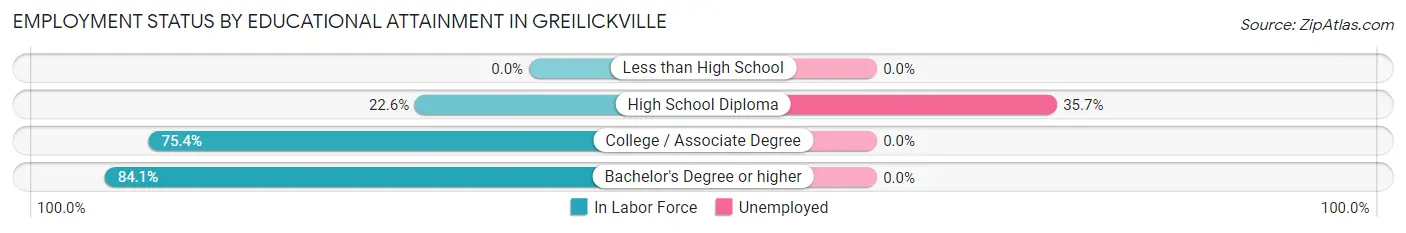
| Educational Attainment | In Labor Force | Unemployed |
| Less than High School | 0 (0.0%) | 0 (0.0%) |
| High School Diploma | 28 (22.6%) | 44 (35.7%) |
| College / Associate Degree | 175 (75.4%) | 0 (0.0%) |
| Bachelor's Degree or higher | 190 (84.1%) | 0 (0.0%) |
| Total | 393 (60.9%) | 16 (2.5%) |
Employment Occupations by Sex in Greilickville
Management, Business, Science and Arts Occupations
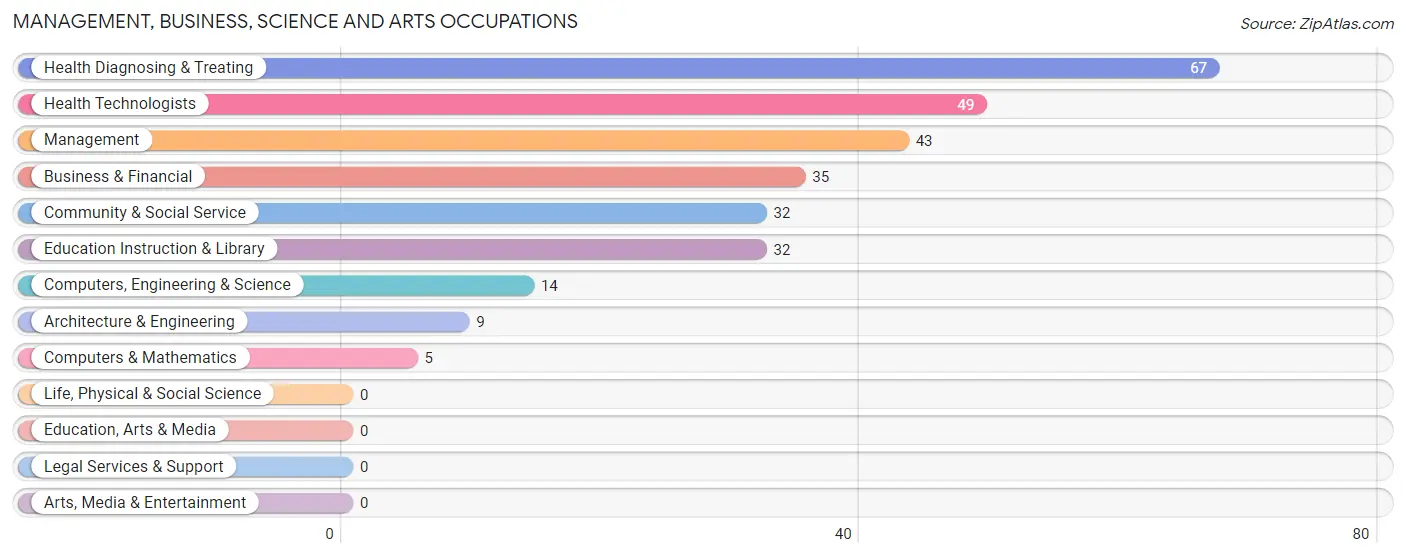
The most common Management, Business, Science and Arts occupations in Greilickville are Health Diagnosing & Treating (67 | 13.6%), Health Technologists (49 | 9.9%), Management (43 | 8.7%), Business & Financial (35 | 7.1%), and Community & Social Service (32 | 6.5%).
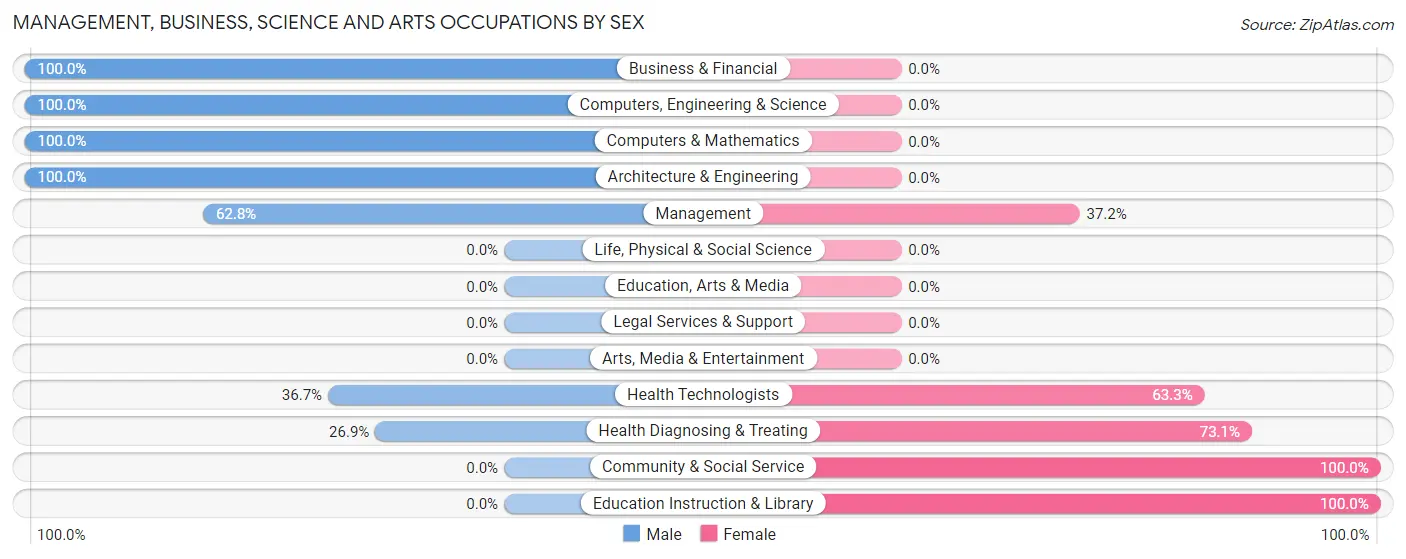
Management, Business, Science and Arts Occupations by Sex
Within the Management, Business, Science and Arts occupations in Greilickville, the most male-oriented occupations are Business & Financial (100.0%), Computers, Engineering & Science (100.0%), and Computers & Mathematics (100.0%), while the most female-oriented occupations are Community & Social Service (100.0%), Education Instruction & Library (100.0%), and Health Diagnosing & Treating (73.1%).
| Occupation | Male | Female |
| Management | 27 (62.8%) | 16 (37.2%) |
| Business & Financial | 35 (100.0%) | 0 (0.0%) |
| Computers, Engineering & Science | 14 (100.0%) | 0 (0.0%) |
| Computers & Mathematics | 5 (100.0%) | 0 (0.0%) |
| Architecture & Engineering | 9 (100.0%) | 0 (0.0%) |
| Life, Physical & Social Science | 0 (0.0%) | 0 (0.0%) |
| Community & Social Service | 0 (0.0%) | 32 (100.0%) |
| Education, Arts & Media | 0 (0.0%) | 0 (0.0%) |
| Legal Services & Support | 0 (0.0%) | 0 (0.0%) |
| Education Instruction & Library | 0 (0.0%) | 32 (100.0%) |
| Arts, Media & Entertainment | 0 (0.0%) | 0 (0.0%) |
| Health Diagnosing & Treating | 18 (26.9%) | 49 (73.1%) |
| Health Technologists | 18 (36.7%) | 31 (63.3%) |
| Total (Category) | 94 (49.2%) | 97 (50.8%) |
| Total (Overall) | 318 (64.5%) | 175 (35.5%) |
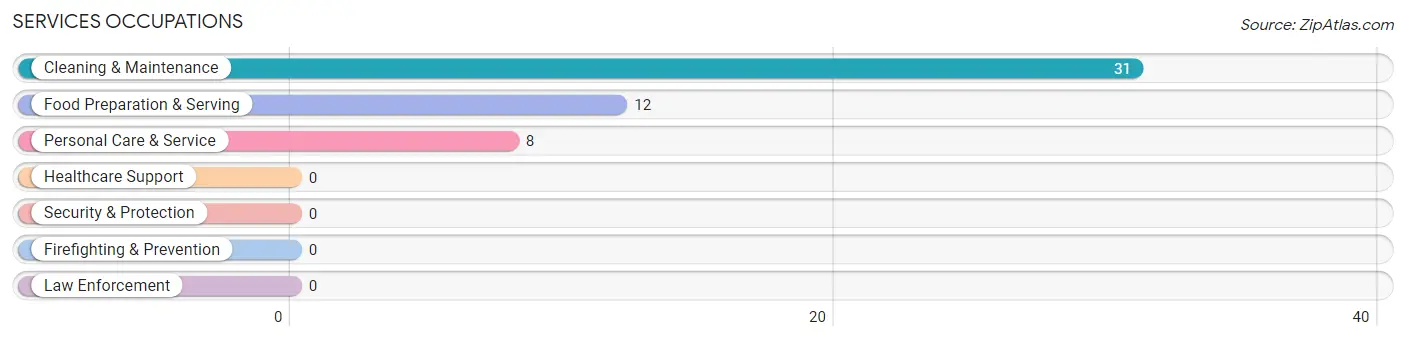
Services Occupations
The most common Services occupations in Greilickville are Cleaning & Maintenance (31 | 6.3%), Food Preparation & Serving (12 | 2.4%), and Personal Care & Service (8 | 1.6%).
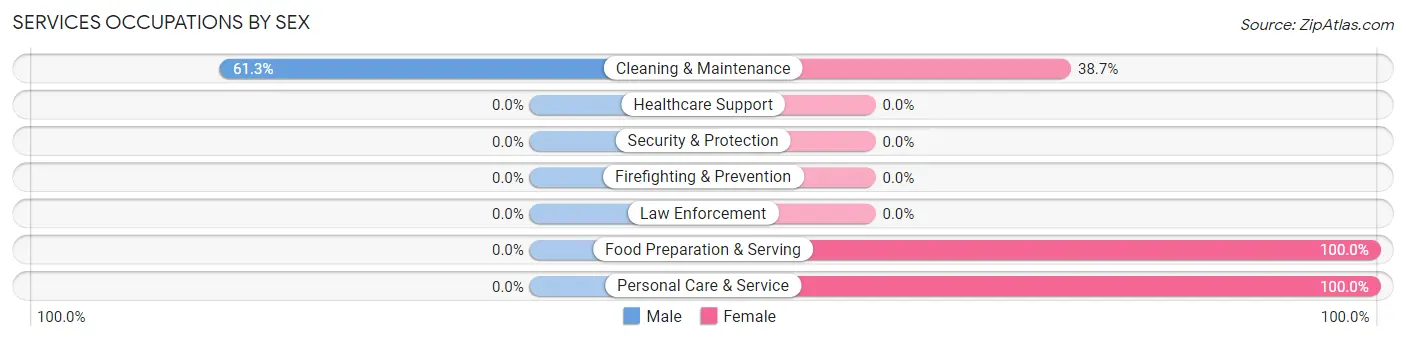
Services Occupations by Sex
| Occupation | Male | Female |
| Healthcare Support | 0 (0.0%) | 0 (0.0%) |
| Security & Protection | 0 (0.0%) | 0 (0.0%) |
| Firefighting & Prevention | 0 (0.0%) | 0 (0.0%) |
| Law Enforcement | 0 (0.0%) | 0 (0.0%) |
| Food Preparation & Serving | 0 (0.0%) | 12 (100.0%) |
| Cleaning & Maintenance | 19 (61.3%) | 12 (38.7%) |
| Personal Care & Service | 0 (0.0%) | 8 (100.0%) |
| Total (Category) | 19 (37.2%) | 32 (62.7%) |
| Total (Overall) | 318 (64.5%) | 175 (35.5%) |
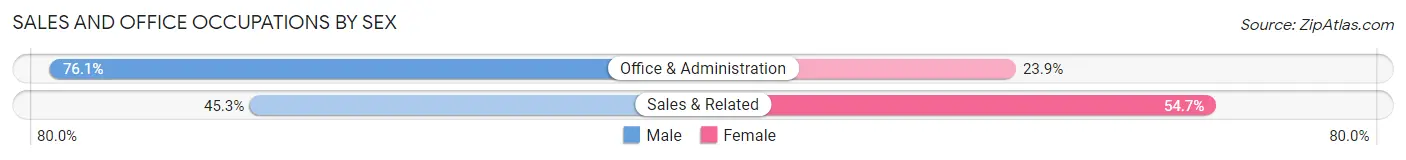
Sales and Office Occupations
The most common Sales and Office occupations in Greilickville are Sales & Related (64 | 13.0%), and Office & Administration (46 | 9.3%).
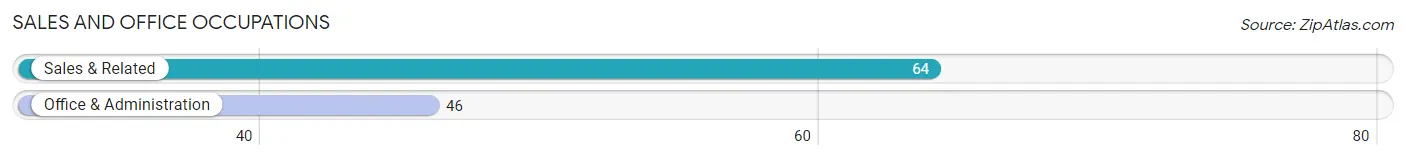
Sales and Office Occupations by Sex
| Occupation | Male | Female |
| Sales & Related | 29 (45.3%) | 35 (54.7%) |
| Office & Administration | 35 (76.1%) | 11 (23.9%) |
| Total (Category) | 64 (58.2%) | 46 (41.8%) |
| Total (Overall) | 318 (64.5%) | 175 (35.5%) |
Natural Resources, Construction and Maintenance Occupations
The most common Natural Resources, Construction and Maintenance occupations in Greilickville are Installation, Maintenance & Repair (112 | 22.7%), and Construction & Extraction (3 | 0.6%).
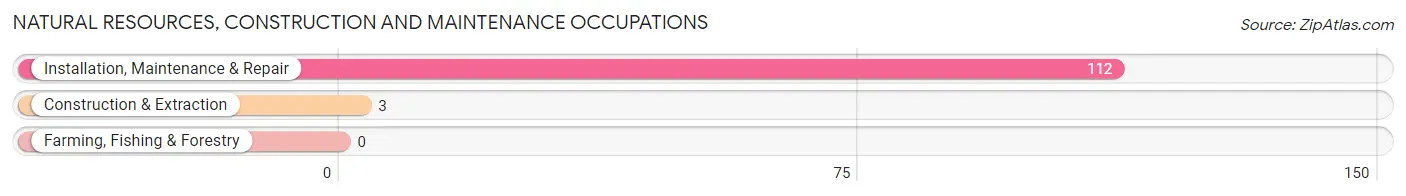
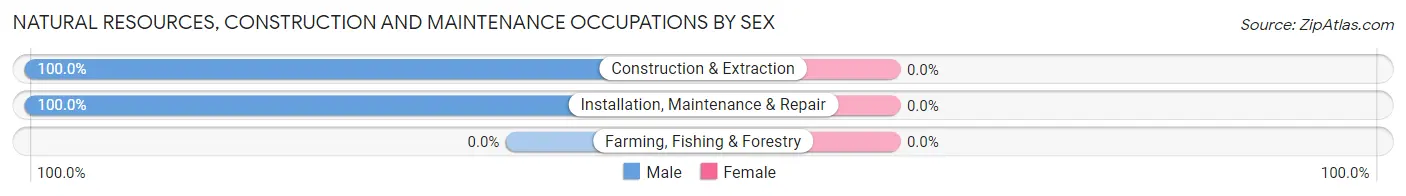
Natural Resources, Construction and Maintenance Occupations by Sex
| Occupation | Male | Female |
| Farming, Fishing & Forestry | 0 (0.0%) | 0 (0.0%) |
| Construction & Extraction | 3 (100.0%) | 0 (0.0%) |
| Installation, Maintenance & Repair | 112 (100.0%) | 0 (0.0%) |
| Total (Category) | 115 (100.0%) | 0 (0.0%) |
| Total (Overall) | 318 (64.5%) | 175 (35.5%) |
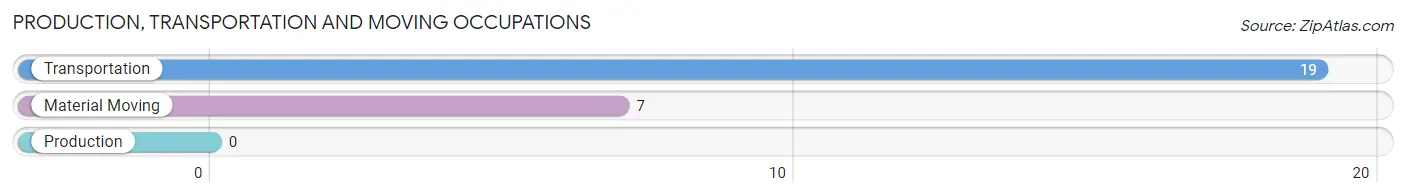
Production, Transportation and Moving Occupations
The most common Production, Transportation and Moving occupations in Greilickville are Transportation (19 | 3.8%), and Material Moving (7 | 1.4%).
Production, Transportation and Moving Occupations by Sex
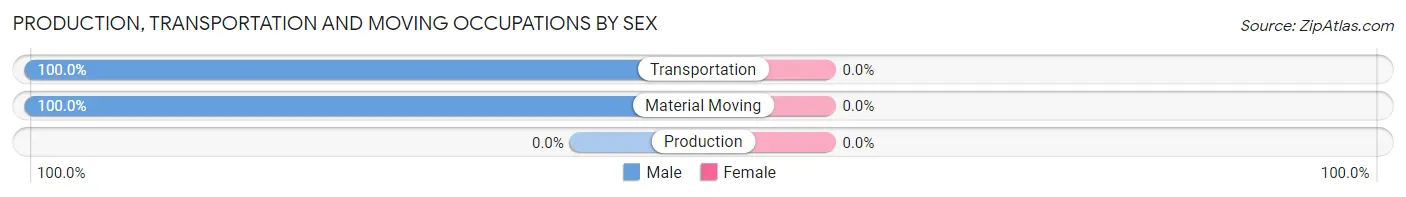
| Occupation | Male | Female |
| Production | 0 (0.0%) | 0 (0.0%) |
| Transportation | 19 (100.0%) | 0 (0.0%) |
| Material Moving | 7 (100.0%) | 0 (0.0%) |
| Total (Category) | 26 (100.0%) | 0 (0.0%) |
| Total (Overall) | 318 (64.5%) | 175 (35.5%) |
Employment Industries by Sex in Greilickville
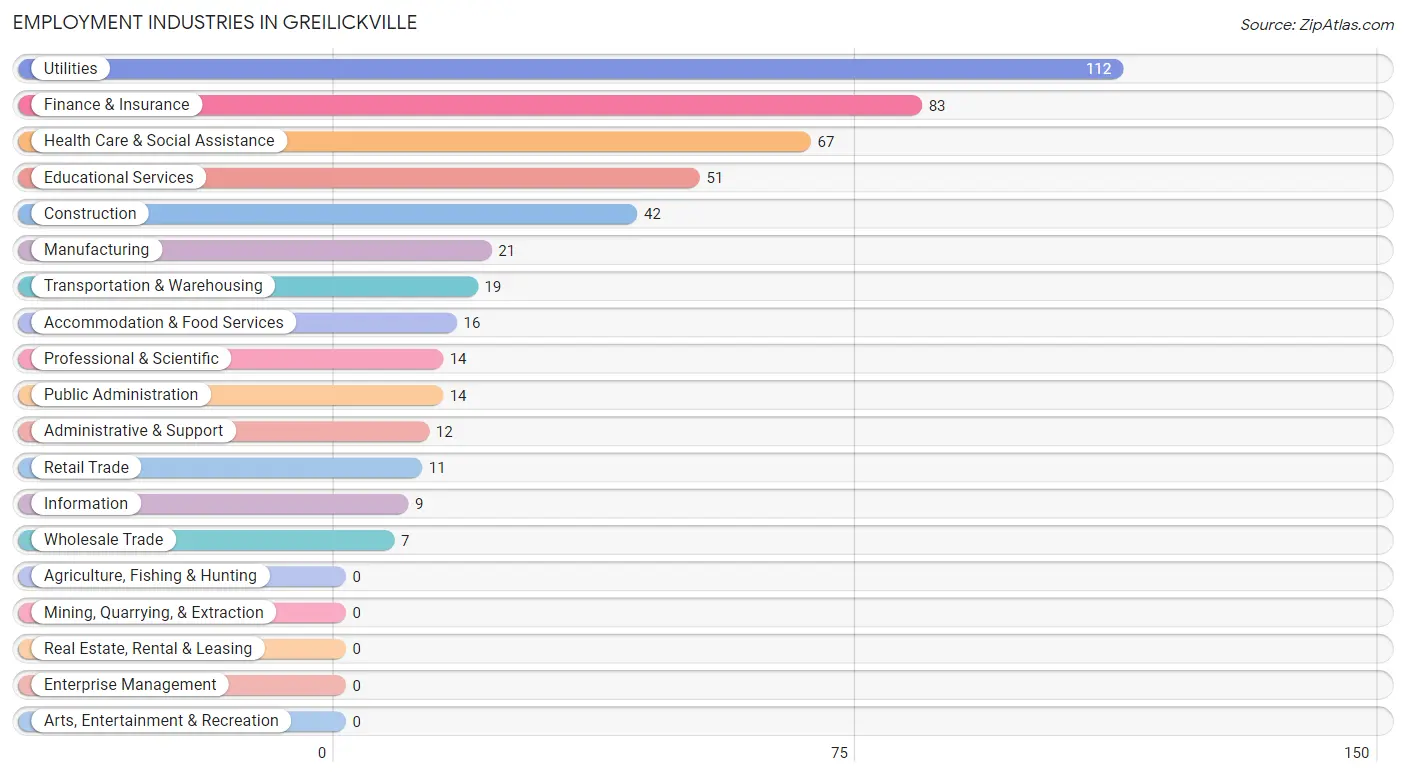
Employment Industries in Greilickville
The major employment industries in Greilickville include Utilities (112 | 22.7%), Finance & Insurance (83 | 16.8%), Health Care & Social Assistance (67 | 13.6%), Educational Services (51 | 10.3%), and Construction (42 | 8.5%).
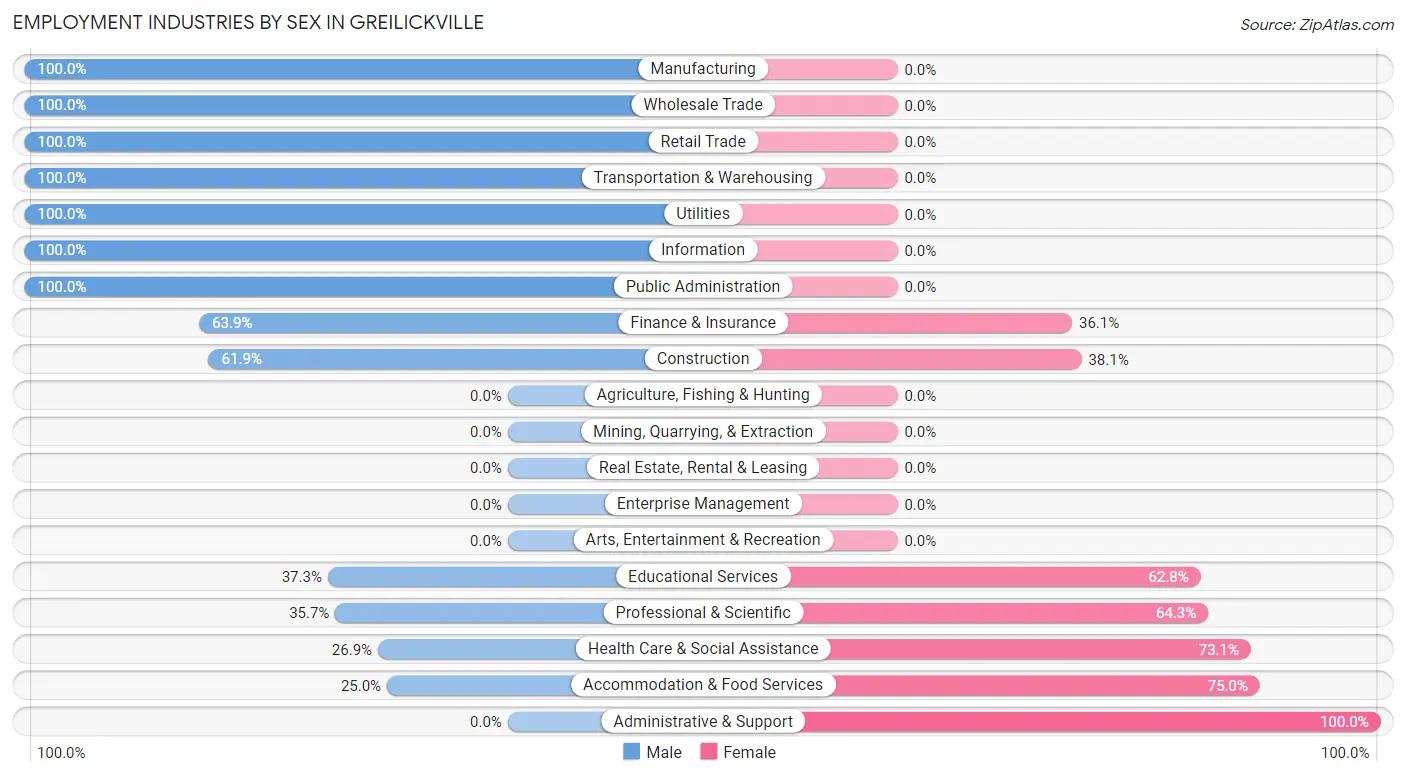
Employment Industries by Sex in Greilickville
The Greilickville industries that see more men than women are Manufacturing (100.0%), Wholesale Trade (100.0%), and Retail Trade (100.0%), whereas the industries that tend to have a higher number of women are Administrative & Support (100.0%), Accommodation & Food Services (75.0%), and Health Care & Social Assistance (73.1%).
| Industry | Male | Female |
| Agriculture, Fishing & Hunting | 0 (0.0%) | 0 (0.0%) |
| Mining, Quarrying, & Extraction | 0 (0.0%) | 0 (0.0%) |
| Construction | 26 (61.9%) | 16 (38.1%) |
| Manufacturing | 21 (100.0%) | 0 (0.0%) |
| Wholesale Trade | 7 (100.0%) | 0 (0.0%) |
| Retail Trade | 11 (100.0%) | 0 (0.0%) |
| Transportation & Warehousing | 19 (100.0%) | 0 (0.0%) |
| Utilities | 112 (100.0%) | 0 (0.0%) |
| Information | 9 (100.0%) | 0 (0.0%) |
| Finance & Insurance | 53 (63.9%) | 30 (36.1%) |
| Real Estate, Rental & Leasing | 0 (0.0%) | 0 (0.0%) |
| Professional & Scientific | 5 (35.7%) | 9 (64.3%) |
| Enterprise Management | 0 (0.0%) | 0 (0.0%) |
| Administrative & Support | 0 (0.0%) | 12 (100.0%) |
| Educational Services | 19 (37.2%) | 32 (62.7%) |
| Health Care & Social Assistance | 18 (26.9%) | 49 (73.1%) |
| Arts, Entertainment & Recreation | 0 (0.0%) | 0 (0.0%) |
| Accommodation & Food Services | 4 (25.0%) | 12 (75.0%) |
| Public Administration | 14 (100.0%) | 0 (0.0%) |
| Total | 318 (64.5%) | 175 (35.5%) |
Education in Greilickville
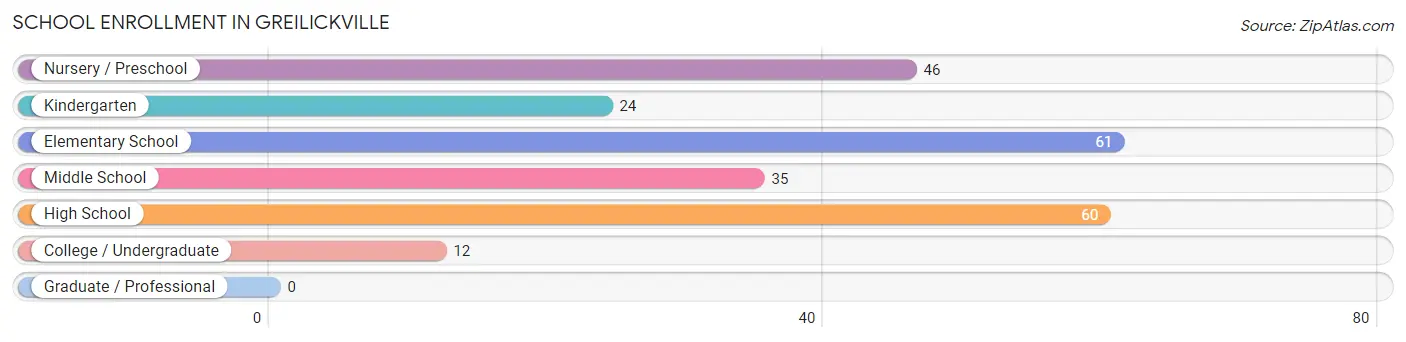
School Enrollment in Greilickville
The most common levels of schooling among the 238 students in Greilickville are elementary school (61 | 25.6%), high school (60 | 25.2%), and nursery / preschool (46 | 19.3%).
| School Level | # Students | % Students |
| Nursery / Preschool | 46 | 19.3% |
| Kindergarten | 24 | 10.1% |
| Elementary School | 61 | 25.6% |
| Middle School | 35 | 14.7% |
| High School | 60 | 25.2% |
| College / Undergraduate | 12 | 5.0% |
| Graduate / Professional | 0 | 0.0% |
| Total | 238 | 100.0% |
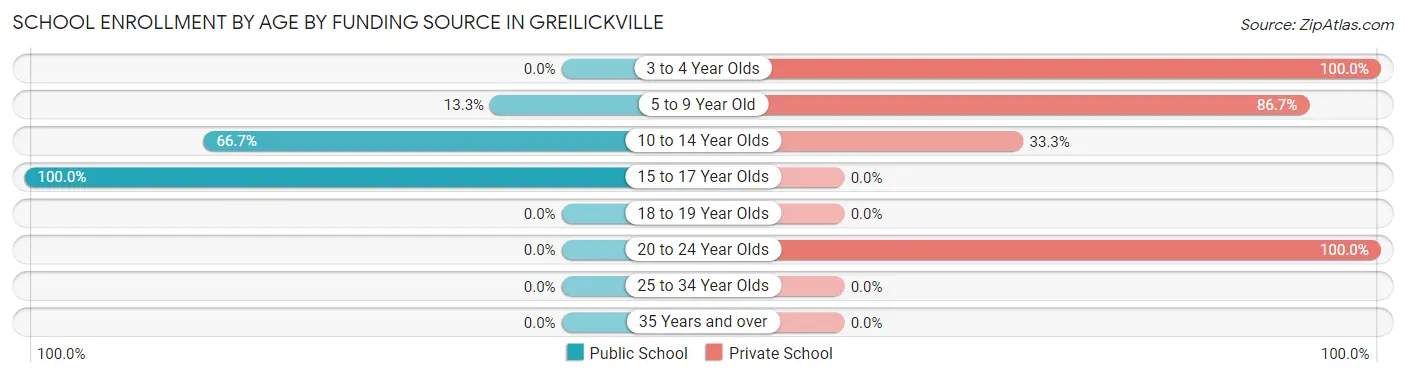
School Enrollment by Age by Funding Source in Greilickville
Out of a total of 238 students who are enrolled in schools in Greilickville, 138 (58.0%) attend a private institution, while the remaining 100 (42.0%) are enrolled in public schools. The age group of 3 to 4 year olds has the highest likelihood of being enrolled in private schools, with 34 (100.0% in the age bracket) enrolled. Conversely, the age group of 15 to 17 year olds has the lowest likelihood of being enrolled in a private school, with 60 (100.0% in the age bracket) attending a public institution.
| Age Bracket | Public School | Private School |
| 3 to 4 Year Olds | 0 (0.0%) | 34 (100.0%) |
| 5 to 9 Year Old | 12 (13.3%) | 78 (86.7%) |
| 10 to 14 Year Olds | 28 (66.7%) | 14 (33.3%) |
| 15 to 17 Year Olds | 60 (100.0%) | 0 (0.0%) |
| 18 to 19 Year Olds | 0 (0.0%) | 0 (0.0%) |
| 20 to 24 Year Olds | 0 (0.0%) | 12 (100.0%) |
| 25 to 34 Year Olds | 0 (0.0%) | 0 (0.0%) |
| 35 Years and over | 0 (0.0%) | 0 (0.0%) |
| Total | 100 (42.0%) | 138 (58.0%) |
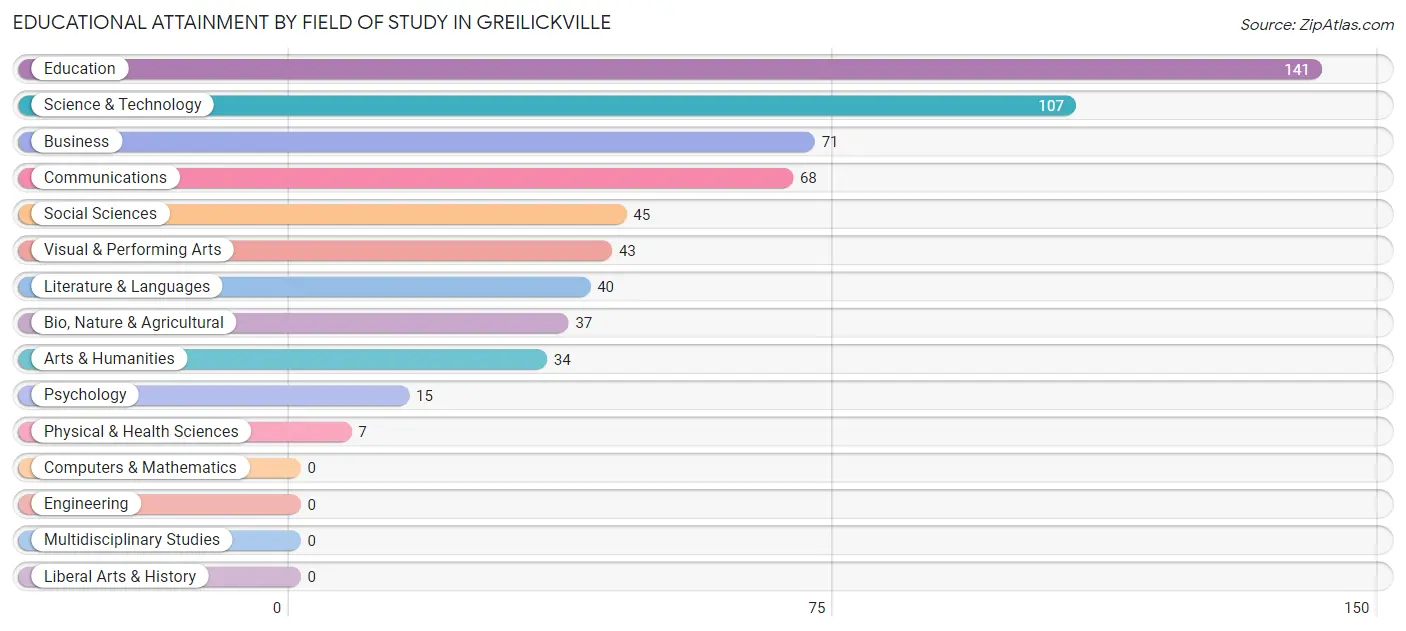
Educational Attainment by Field of Study in Greilickville
Education (141 | 23.2%), science & technology (107 | 17.6%), business (71 | 11.7%), communications (68 | 11.2%), and social sciences (45 | 7.4%) are the most common fields of study among 608 individuals in Greilickville who have obtained a bachelor's degree or higher.
| Field of Study | # Graduates | % Graduates |
| Computers & Mathematics | 0 | 0.0% |
| Bio, Nature & Agricultural | 37 | 6.1% |
| Physical & Health Sciences | 7 | 1.1% |
| Psychology | 15 | 2.5% |
| Social Sciences | 45 | 7.4% |
| Engineering | 0 | 0.0% |
| Multidisciplinary Studies | 0 | 0.0% |
| Science & Technology | 107 | 17.6% |
| Business | 71 | 11.7% |
| Education | 141 | 23.2% |
| Literature & Languages | 40 | 6.6% |
| Liberal Arts & History | 0 | 0.0% |
| Visual & Performing Arts | 43 | 7.1% |
| Communications | 68 | 11.2% |
| Arts & Humanities | 34 | 5.6% |
| Total | 608 | 100.0% |
Transportation & Commute in Greilickville
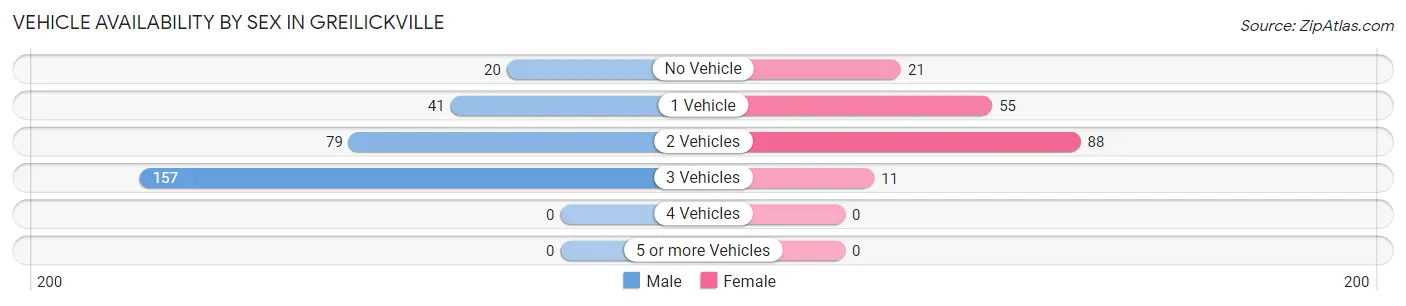
Vehicle Availability by Sex in Greilickville
The most prevalent vehicle ownership categories in Greilickville are males with 3 vehicles (157, accounting for 52.9%) and females with 3 vehicles (11, making up 89.7%).
| Vehicles Available | Male | Female |
| No Vehicle | 20 (6.7%) | 21 (12.0%) |
| 1 Vehicle | 41 (13.8%) | 55 (31.4%) |
| 2 Vehicles | 79 (26.6%) | 88 (50.3%) |
| 3 Vehicles | 157 (52.9%) | 11 (6.3%) |
| 4 Vehicles | 0 (0.0%) | 0 (0.0%) |
| 5 or more Vehicles | 0 (0.0%) | 0 (0.0%) |
| Total | 297 (100.0%) | 175 (100.0%) |
Commute Time in Greilickville
The most frequently occuring commute durations in Greilickville are 20 to 24 minutes (151 commuters, 35.6%), 15 to 19 minutes (74 commuters, 17.4%), and 30 to 34 minutes (62 commuters, 14.6%).
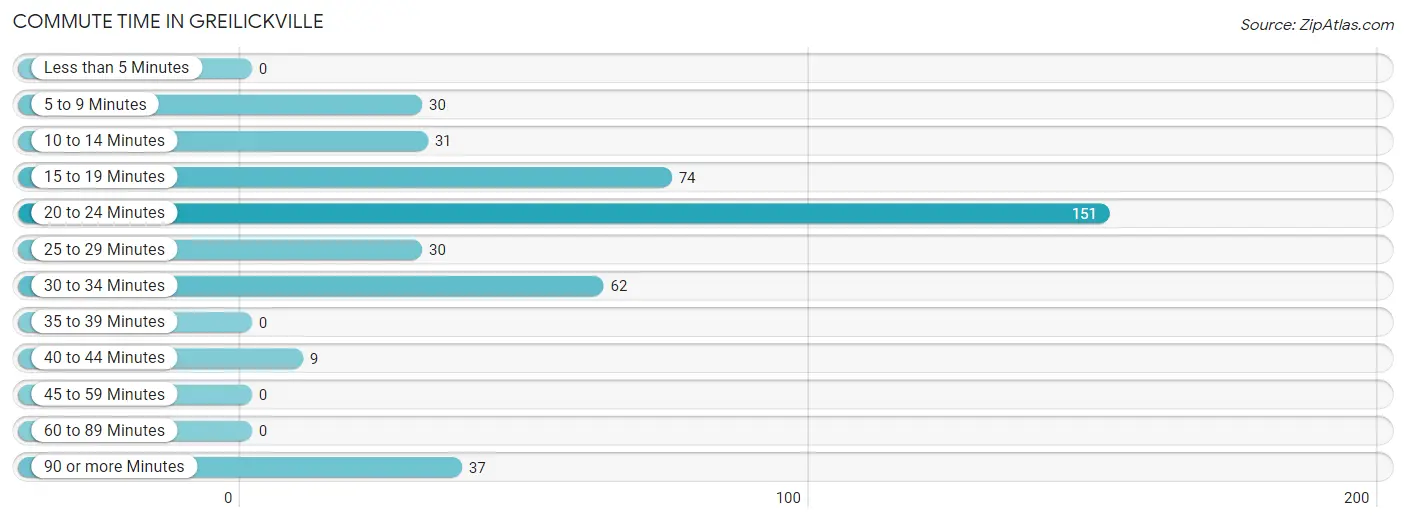
| Commute Time | # Commuters | % Commuters |
| Less than 5 Minutes | 0 | 0.0% |
| 5 to 9 Minutes | 30 | 7.1% |
| 10 to 14 Minutes | 31 | 7.3% |
| 15 to 19 Minutes | 74 | 17.4% |
| 20 to 24 Minutes | 151 | 35.6% |
| 25 to 29 Minutes | 30 | 7.1% |
| 30 to 34 Minutes | 62 | 14.6% |
| 35 to 39 Minutes | 0 | 0.0% |
| 40 to 44 Minutes | 9 | 2.1% |
| 45 to 59 Minutes | 0 | 0.0% |
| 60 to 89 Minutes | 0 | 0.0% |
| 90 or more Minutes | 37 | 8.7% |
Commute Time by Sex in Greilickville
The most common commute times in Greilickville are 20 to 24 minutes (121 commuters, 40.7%) for males and 5 to 9 minutes (30 commuters, 23.6%) for females.
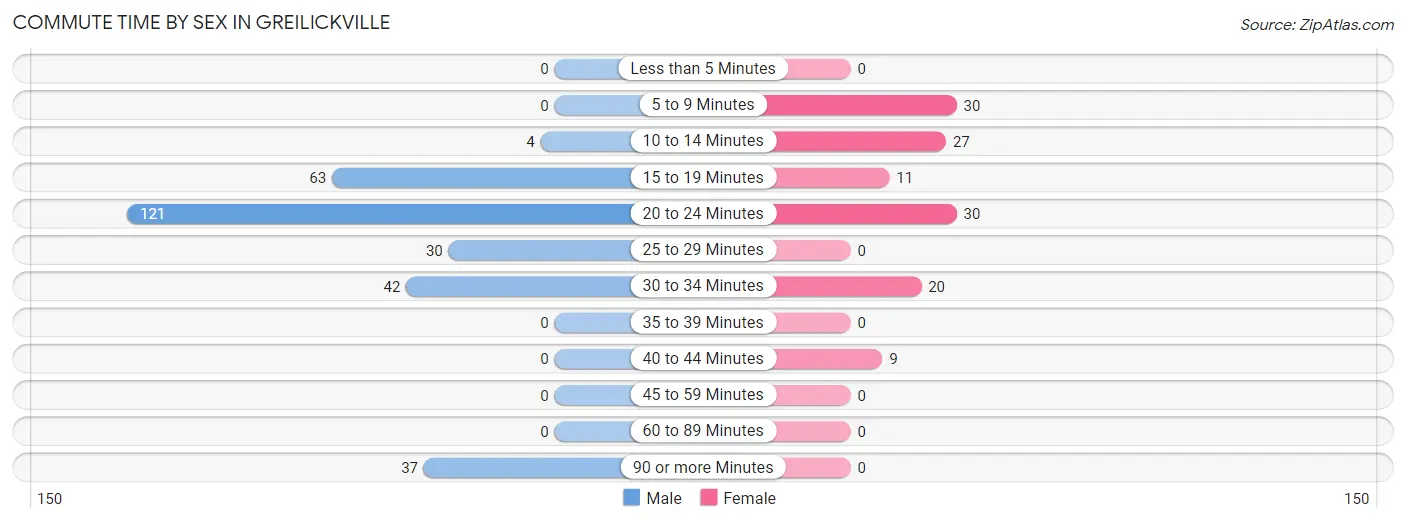
| Commute Time | Male | Female |
| Less than 5 Minutes | 0 (0.0%) | 0 (0.0%) |
| 5 to 9 Minutes | 0 (0.0%) | 30 (23.6%) |
| 10 to 14 Minutes | 4 (1.3%) | 27 (21.3%) |
| 15 to 19 Minutes | 63 (21.2%) | 11 (8.7%) |
| 20 to 24 Minutes | 121 (40.7%) | 30 (23.6%) |
| 25 to 29 Minutes | 30 (10.1%) | 0 (0.0%) |
| 30 to 34 Minutes | 42 (14.1%) | 20 (15.8%) |
| 35 to 39 Minutes | 0 (0.0%) | 0 (0.0%) |
| 40 to 44 Minutes | 0 (0.0%) | 9 (7.1%) |
| 45 to 59 Minutes | 0 (0.0%) | 0 (0.0%) |
| 60 to 89 Minutes | 0 (0.0%) | 0 (0.0%) |
| 90 or more Minutes | 37 (12.5%) | 0 (0.0%) |
Time of Departure to Work by Sex in Greilickville
The most frequent times of departure to work in Greilickville are 5:00 AM to 5:29 AM (115, 38.7%) for males and 8:00 AM to 8:29 AM (39, 30.7%) for females.
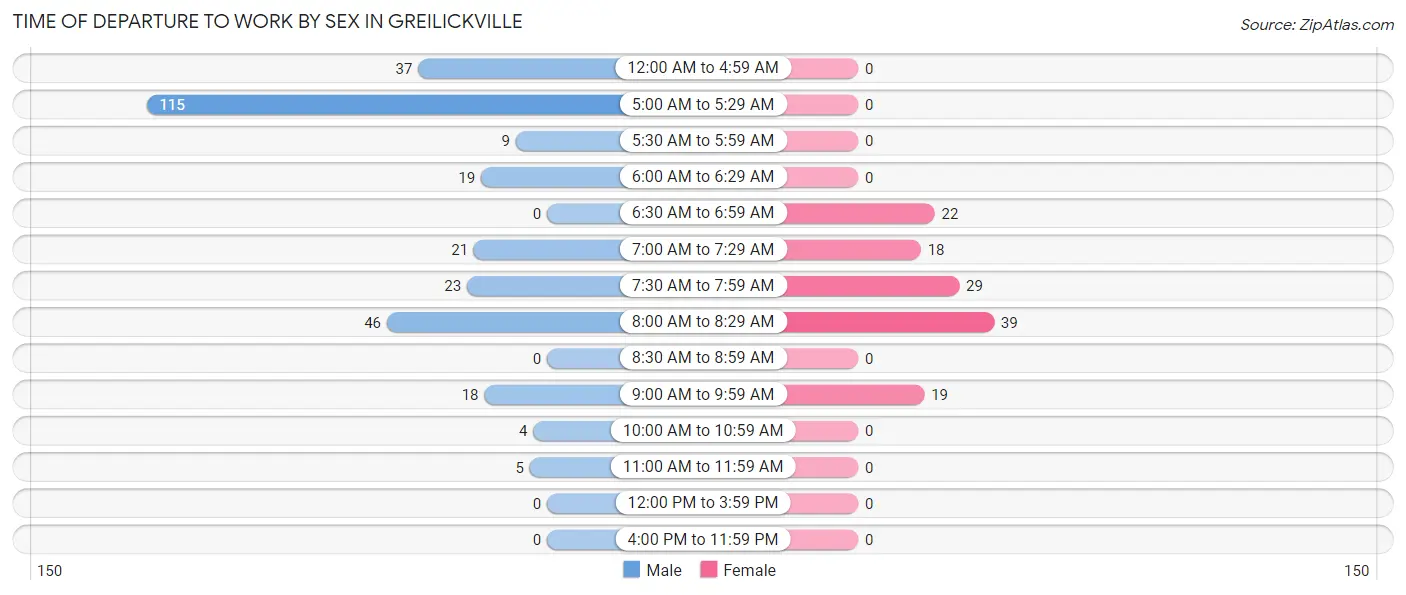
| Time of Departure | Male | Female |
| 12:00 AM to 4:59 AM | 37 (12.5%) | 0 (0.0%) |
| 5:00 AM to 5:29 AM | 115 (38.7%) | 0 (0.0%) |
| 5:30 AM to 5:59 AM | 9 (3.0%) | 0 (0.0%) |
| 6:00 AM to 6:29 AM | 19 (6.4%) | 0 (0.0%) |
| 6:30 AM to 6:59 AM | 0 (0.0%) | 22 (17.3%) |
| 7:00 AM to 7:29 AM | 21 (7.1%) | 18 (14.2%) |
| 7:30 AM to 7:59 AM | 23 (7.7%) | 29 (22.8%) |
| 8:00 AM to 8:29 AM | 46 (15.5%) | 39 (30.7%) |
| 8:30 AM to 8:59 AM | 0 (0.0%) | 0 (0.0%) |
| 9:00 AM to 9:59 AM | 18 (6.1%) | 19 (15.0%) |
| 10:00 AM to 10:59 AM | 4 (1.3%) | 0 (0.0%) |
| 11:00 AM to 11:59 AM | 5 (1.7%) | 0 (0.0%) |
| 12:00 PM to 3:59 PM | 0 (0.0%) | 0 (0.0%) |
| 4:00 PM to 11:59 PM | 0 (0.0%) | 0 (0.0%) |
| Total | 297 (100.0%) | 127 (100.0%) |
Housing Occupancy in Greilickville
Occupancy by Ownership in Greilickville
Of the total 622 dwellings in Greilickville, owner-occupied units account for 510 (82.0%), while renter-occupied units make up 112 (18.0%).
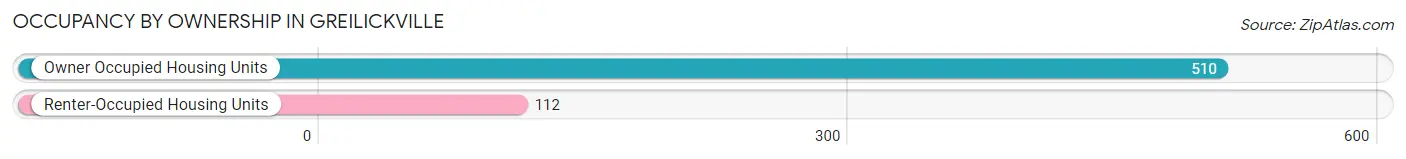
| Occupancy | # Housing Units | % Housing Units |
| Owner Occupied Housing Units | 510 | 82.0% |
| Renter-Occupied Housing Units | 112 | 18.0% |
| Total Occupied Housing Units | 622 | 100.0% |
Occupancy by Household Size in Greilickville
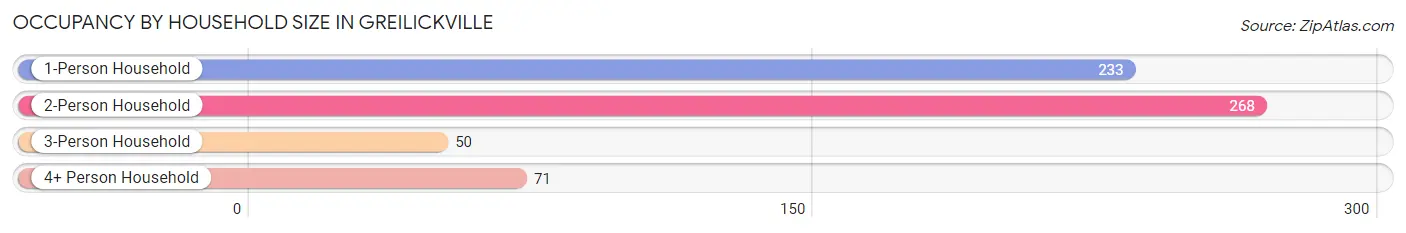
| Household Size | # Housing Units | % Housing Units |
| 1-Person Household | 233 | 37.5% |
| 2-Person Household | 268 | 43.1% |
| 3-Person Household | 50 | 8.0% |
| 4+ Person Household | 71 | 11.4% |
| Total Housing Units | 622 | 100.0% |
Occupancy by Ownership by Household Size in Greilickville
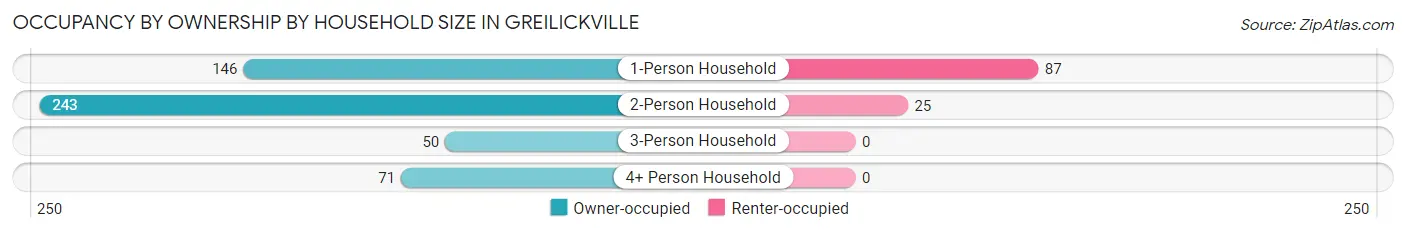
| Household Size | Owner-occupied | Renter-occupied |
| 1-Person Household | 146 (62.7%) | 87 (37.3%) |
| 2-Person Household | 243 (90.7%) | 25 (9.3%) |
| 3-Person Household | 50 (100.0%) | 0 (0.0%) |
| 4+ Person Household | 71 (100.0%) | 0 (0.0%) |
| Total Housing Units | 510 (82.0%) | 112 (18.0%) |
Occupancy by Educational Attainment in Greilickville
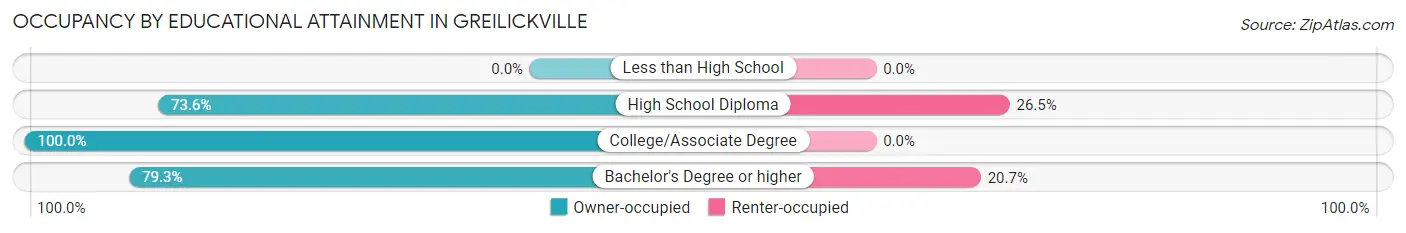
| Household Size | Owner-occupied | Renter-occupied |
| Less than High School | 0 (0.0%) | 0 (0.0%) |
| High School Diploma | 89 (73.6%) | 32 (26.5%) |
| College/Associate Degree | 115 (100.0%) | 0 (0.0%) |
| Bachelor's Degree or higher | 306 (79.3%) | 80 (20.7%) |
Occupancy by Age of Householder in Greilickville
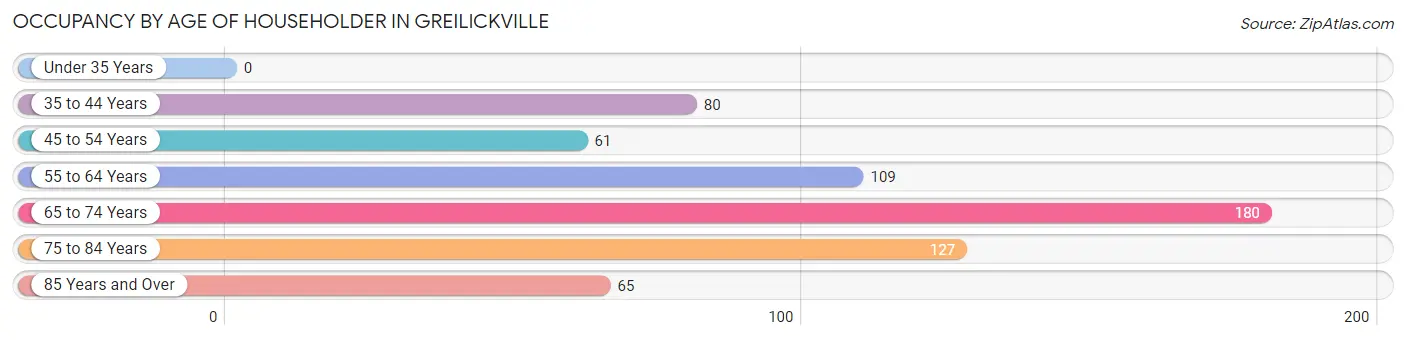
| Age Bracket | # Households | % Households |
| Under 35 Years | 0 | 0.0% |
| 35 to 44 Years | 80 | 12.9% |
| 45 to 54 Years | 61 | 9.8% |
| 55 to 64 Years | 109 | 17.5% |
| 65 to 74 Years | 180 | 28.9% |
| 75 to 84 Years | 127 | 20.4% |
| 85 Years and Over | 65 | 10.4% |
| Total | 622 | 100.0% |
Housing Finances in Greilickville
Median Income by Occupancy in Greilickville
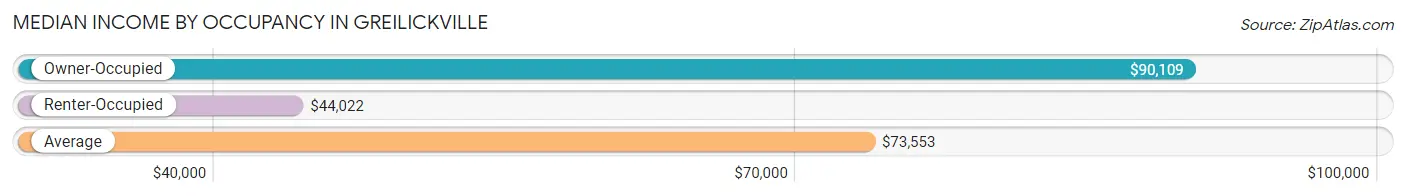
| Occupancy Type | # Households | Median Income |
| Owner-Occupied | 510 (82.0%) | $90,109 |
| Renter-Occupied | 112 (18.0%) | $44,022 |
| Average | 622 (100.0%) | $73,553 |
Occupancy by Householder Income Bracket in Greilickville
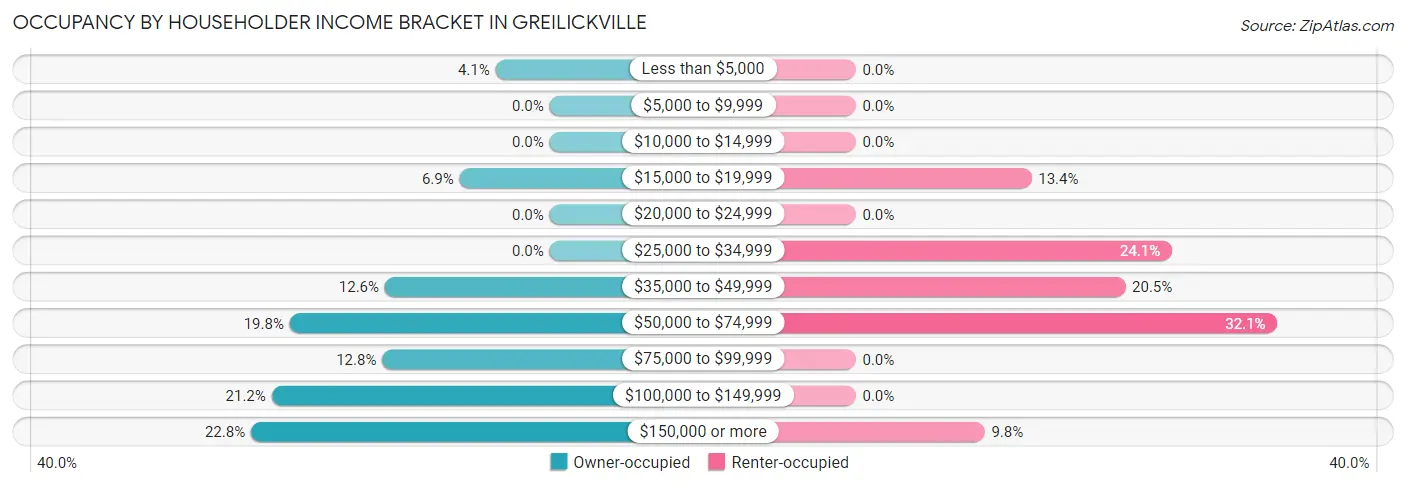
| Income Bracket | Owner-occupied | Renter-occupied |
| Less than $5,000 | 21 (4.1%) | 0 (0.0%) |
| $5,000 to $9,999 | 0 (0.0%) | 0 (0.0%) |
| $10,000 to $14,999 | 0 (0.0%) | 0 (0.0%) |
| $15,000 to $19,999 | 35 (6.9%) | 15 (13.4%) |
| $20,000 to $24,999 | 0 (0.0%) | 0 (0.0%) |
| $25,000 to $34,999 | 0 (0.0%) | 27 (24.1%) |
| $35,000 to $49,999 | 64 (12.6%) | 23 (20.5%) |
| $50,000 to $74,999 | 101 (19.8%) | 36 (32.1%) |
| $75,000 to $99,999 | 65 (12.8%) | 0 (0.0%) |
| $100,000 to $149,999 | 108 (21.2%) | 0 (0.0%) |
| $150,000 or more | 116 (22.8%) | 11 (9.8%) |
| Total | 510 (100.0%) | 112 (100.0%) |
Monthly Housing Cost Tiers in Greilickville
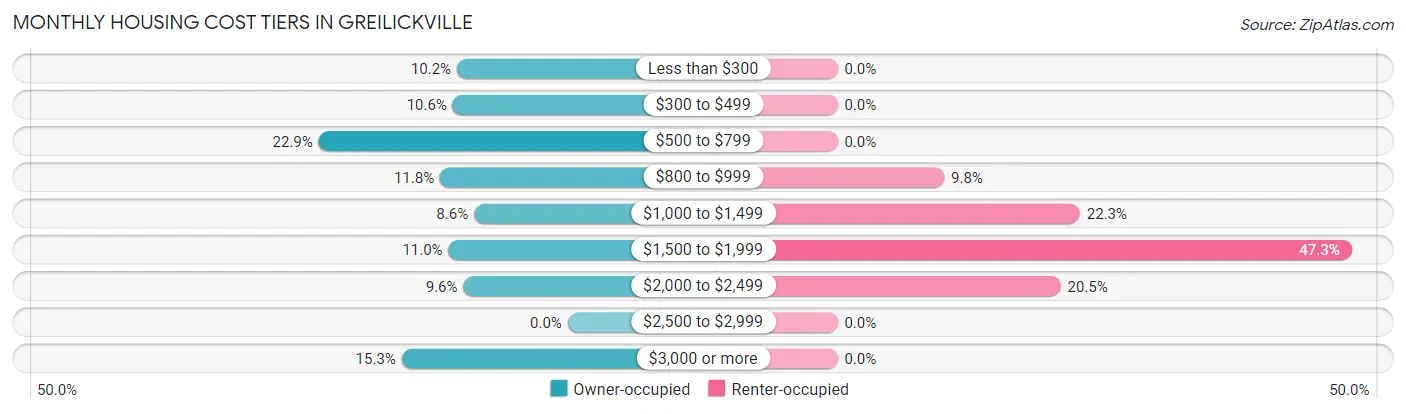
| Monthly Cost | Owner-occupied | Renter-occupied |
| Less than $300 | 52 (10.2%) | 0 (0.0%) |
| $300 to $499 | 54 (10.6%) | 0 (0.0%) |
| $500 to $799 | 117 (22.9%) | 0 (0.0%) |
| $800 to $999 | 60 (11.8%) | 11 (9.8%) |
| $1,000 to $1,499 | 44 (8.6%) | 25 (22.3%) |
| $1,500 to $1,999 | 56 (11.0%) | 53 (47.3%) |
| $2,000 to $2,499 | 49 (9.6%) | 23 (20.5%) |
| $2,500 to $2,999 | 0 (0.0%) | 0 (0.0%) |
| $3,000 or more | 78 (15.3%) | 0 (0.0%) |
| Total | 510 (100.0%) | 112 (100.0%) |
Physical Housing Characteristics in Greilickville
Housing Structures in Greilickville
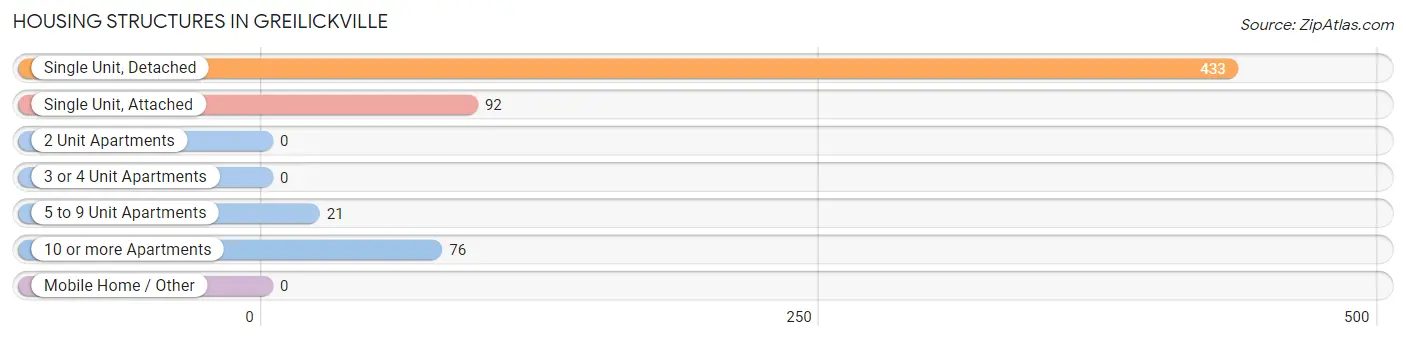
| Structure Type | # Housing Units | % Housing Units |
| Single Unit, Detached | 433 | 69.6% |
| Single Unit, Attached | 92 | 14.8% |
| 2 Unit Apartments | 0 | 0.0% |
| 3 or 4 Unit Apartments | 0 | 0.0% |
| 5 to 9 Unit Apartments | 21 | 3.4% |
| 10 or more Apartments | 76 | 12.2% |
| Mobile Home / Other | 0 | 0.0% |
| Total | 622 | 100.0% |
Housing Structures by Occupancy in Greilickville
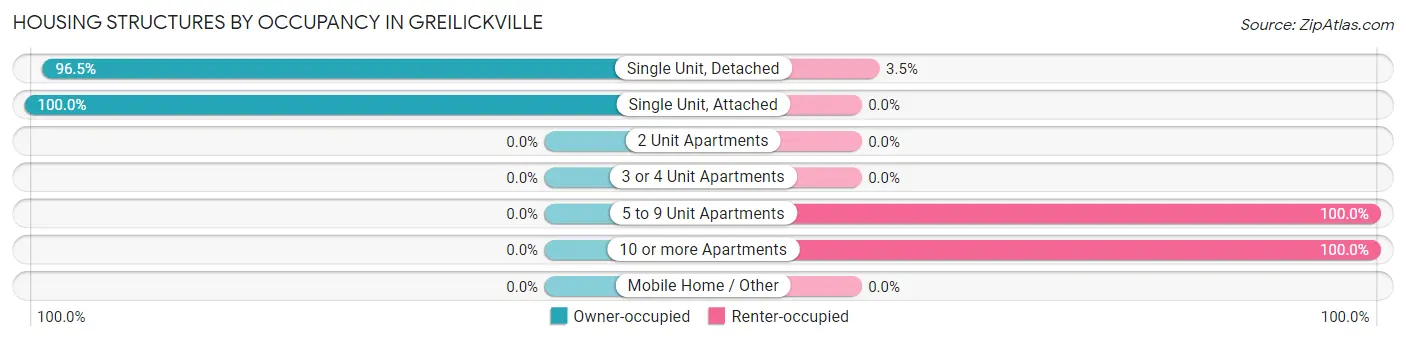
| Structure Type | Owner-occupied | Renter-occupied |
| Single Unit, Detached | 418 (96.5%) | 15 (3.5%) |
| Single Unit, Attached | 92 (100.0%) | 0 (0.0%) |
| 2 Unit Apartments | 0 (0.0%) | 0 (0.0%) |
| 3 or 4 Unit Apartments | 0 (0.0%) | 0 (0.0%) |
| 5 to 9 Unit Apartments | 0 (0.0%) | 21 (100.0%) |
| 10 or more Apartments | 0 (0.0%) | 76 (100.0%) |
| Mobile Home / Other | 0 (0.0%) | 0 (0.0%) |
| Total | 510 (82.0%) | 112 (18.0%) |
Housing Structures by Number of Rooms in Greilickville
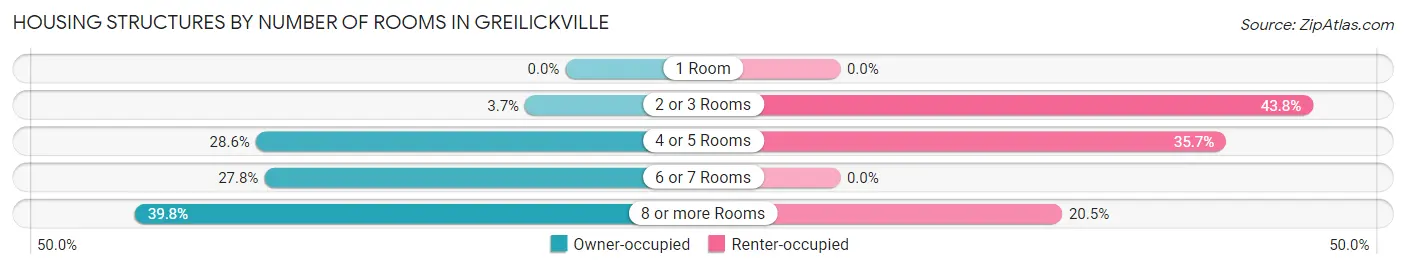
| Number of Rooms | Owner-occupied | Renter-occupied |
| 1 Room | 0 (0.0%) | 0 (0.0%) |
| 2 or 3 Rooms | 19 (3.7%) | 49 (43.8%) |
| 4 or 5 Rooms | 146 (28.6%) | 40 (35.7%) |
| 6 or 7 Rooms | 142 (27.8%) | 0 (0.0%) |
| 8 or more Rooms | 203 (39.8%) | 23 (20.5%) |
| Total | 510 (100.0%) | 112 (100.0%) |
Housing Structure by Heating Type in Greilickville
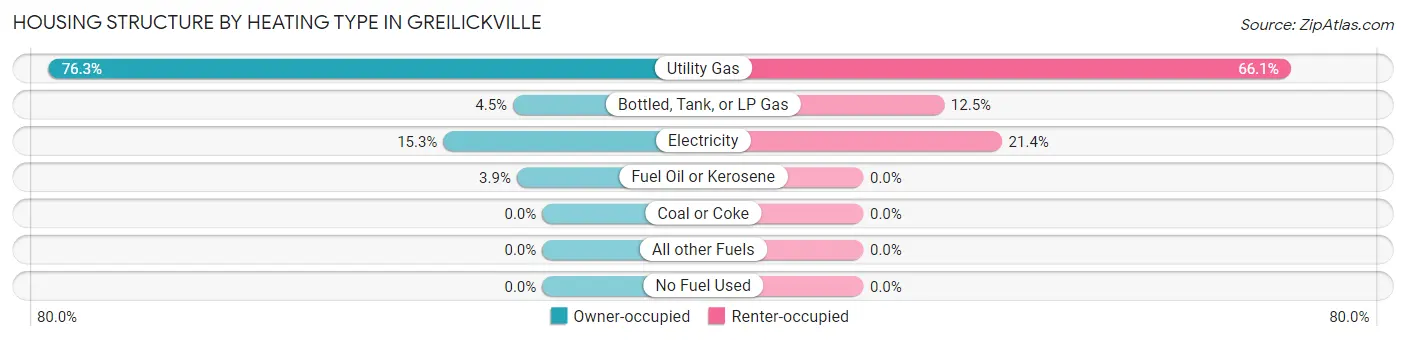
| Heating Type | Owner-occupied | Renter-occupied |
| Utility Gas | 389 (76.3%) | 74 (66.1%) |
| Bottled, Tank, or LP Gas | 23 (4.5%) | 14 (12.5%) |
| Electricity | 78 (15.3%) | 24 (21.4%) |
| Fuel Oil or Kerosene | 20 (3.9%) | 0 (0.0%) |
| Coal or Coke | 0 (0.0%) | 0 (0.0%) |
| All other Fuels | 0 (0.0%) | 0 (0.0%) |
| No Fuel Used | 0 (0.0%) | 0 (0.0%) |
| Total | 510 (100.0%) | 112 (100.0%) |
Household Vehicle Usage in Greilickville
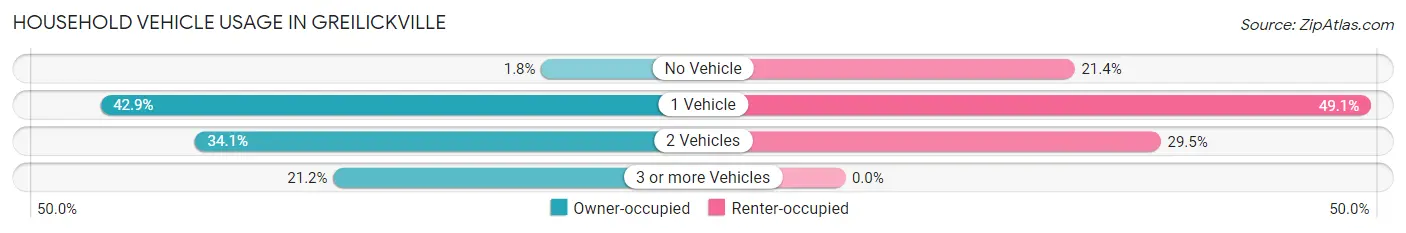
| Vehicles per Household | Owner-occupied | Renter-occupied |
| No Vehicle | 9 (1.8%) | 24 (21.4%) |
| 1 Vehicle | 219 (42.9%) | 55 (49.1%) |
| 2 Vehicles | 174 (34.1%) | 33 (29.5%) |
| 3 or more Vehicles | 108 (21.2%) | 0 (0.0%) |
| Total | 510 (100.0%) | 112 (100.0%) |
Real Estate & Mortgages in Greilickville
Real Estate and Mortgage Overview in Greilickville
| Characteristic | Without Mortgage | With Mortgage |
| Housing Units | 235 | 275 |
| Median Property Value | $279,700 | $501,500 |
| Median Household Income | $59,844 | $86 |
| Monthly Housing Costs | $543 | $78 |
| Real Estate Taxes | $2,208 | $15 |
Property Value by Mortgage Status in Greilickville
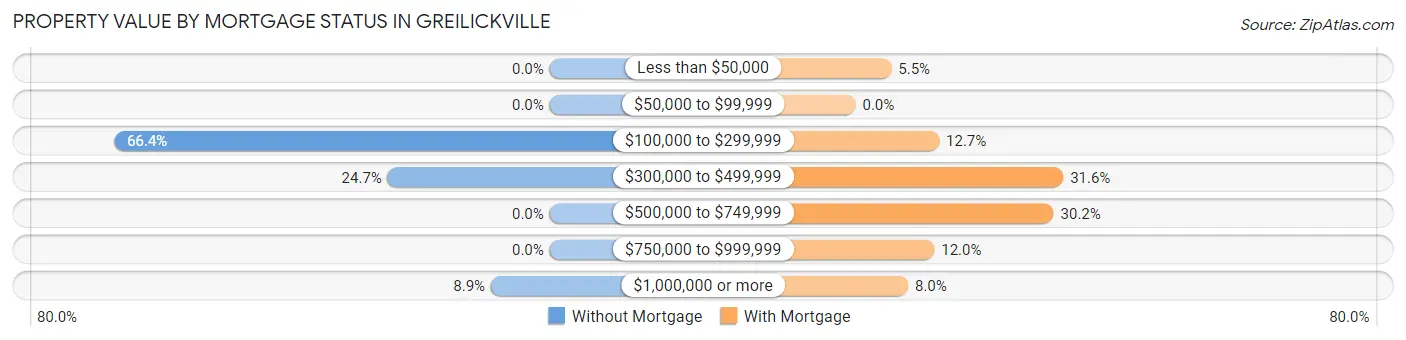
| Property Value | Without Mortgage | With Mortgage |
| Less than $50,000 | 0 (0.0%) | 15 (5.4%) |
| $50,000 to $99,999 | 0 (0.0%) | 0 (0.0%) |
| $100,000 to $299,999 | 156 (66.4%) | 35 (12.7%) |
| $300,000 to $499,999 | 58 (24.7%) | 87 (31.6%) |
| $500,000 to $749,999 | 0 (0.0%) | 83 (30.2%) |
| $750,000 to $999,999 | 0 (0.0%) | 33 (12.0%) |
| $1,000,000 or more | 21 (8.9%) | 22 (8.0%) |
| Total | 235 (100.0%) | 275 (100.0%) |
Household Income by Mortgage Status in Greilickville
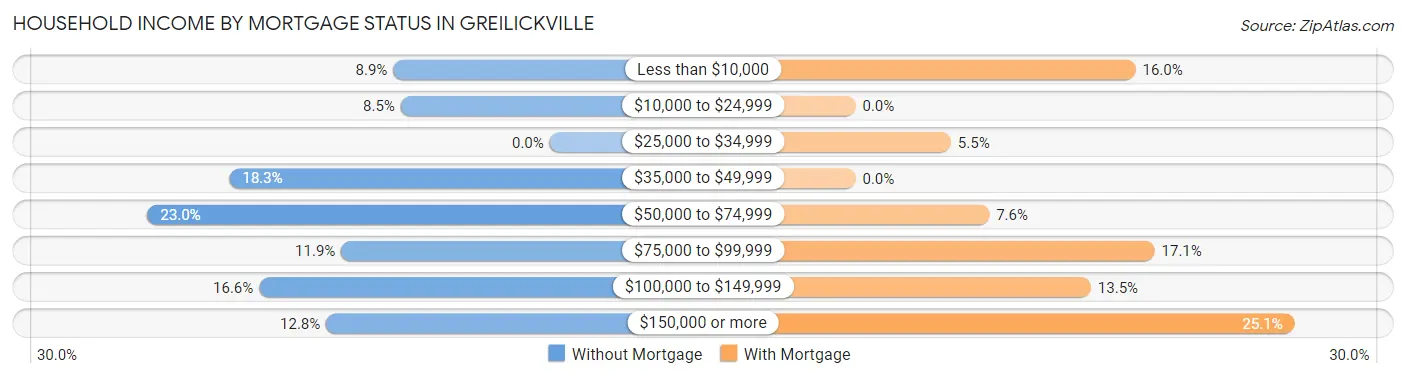
| Household Income | Without Mortgage | With Mortgage |
| Less than $10,000 | 21 (8.9%) | 44 (16.0%) |
| $10,000 to $24,999 | 20 (8.5%) | 0 (0.0%) |
| $25,000 to $34,999 | 0 (0.0%) | 15 (5.4%) |
| $35,000 to $49,999 | 43 (18.3%) | 0 (0.0%) |
| $50,000 to $74,999 | 54 (23.0%) | 21 (7.6%) |
| $75,000 to $99,999 | 28 (11.9%) | 47 (17.1%) |
| $100,000 to $149,999 | 39 (16.6%) | 37 (13.5%) |
| $150,000 or more | 30 (12.8%) | 69 (25.1%) |
| Total | 235 (100.0%) | 275 (100.0%) |
Property Value to Household Income Ratio in Greilickville
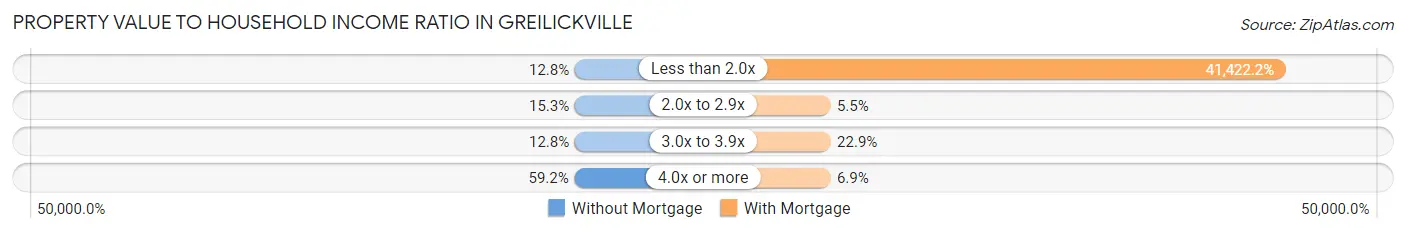
| Value-to-Income Ratio | Without Mortgage | With Mortgage |
| Less than 2.0x | 30 (12.8%) | 113,911 (41,422.2%) |
| 2.0x to 2.9x | 36 (15.3%) | 15 (5.4%) |
| 3.0x to 3.9x | 30 (12.8%) | 63 (22.9%) |
| 4.0x or more | 139 (59.2%) | 19 (6.9%) |
| Total | 235 (100.0%) | 275 (100.0%) |
Real Estate Taxes by Mortgage Status in Greilickville
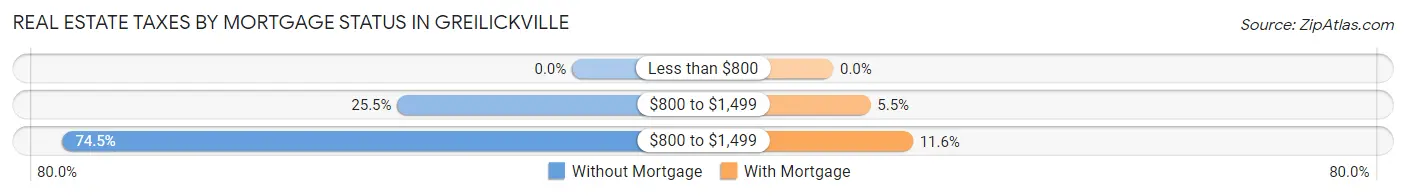
| Property Taxes | Without Mortgage | With Mortgage |
| Less than $800 | 0 (0.0%) | 0 (0.0%) |
| $800 to $1,499 | 60 (25.5%) | 15 (5.4%) |
| $800 to $1,499 | 175 (74.5%) | 32 (11.6%) |
| Total | 235 (100.0%) | 275 (100.0%) |
Health & Disability in Greilickville
Health Insurance Coverage by Age in Greilickville
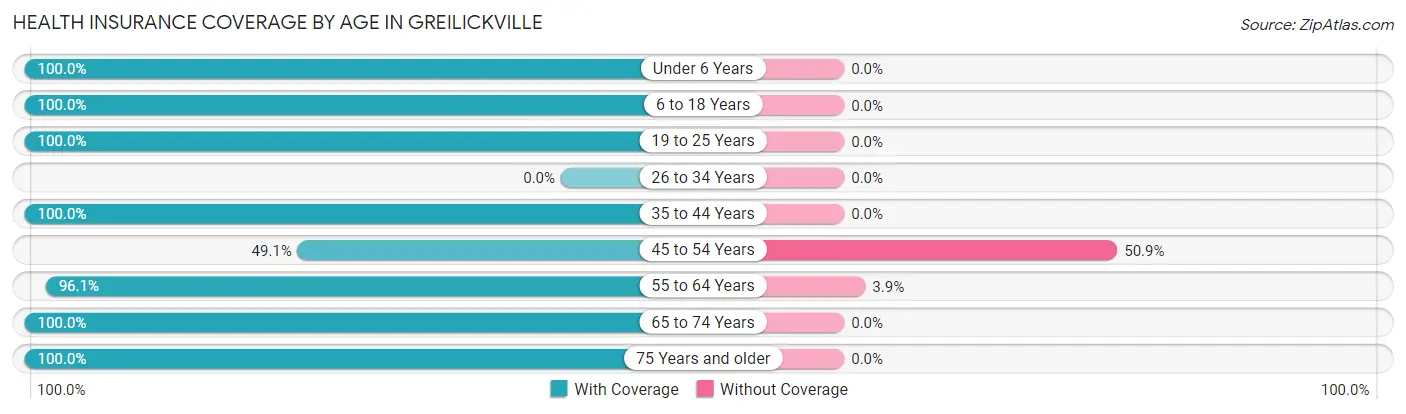
| Age Bracket | With Coverage | Without Coverage |
| Under 6 Years | 82 (100.0%) | 0 (0.0%) |
| 6 to 18 Years | 156 (100.0%) | 0 (0.0%) |
| 19 to 25 Years | 12 (100.0%) | 0 (0.0%) |
| 26 to 34 Years | 0 (0.0%) | 0 (0.0%) |
| 35 to 44 Years | 171 (100.0%) | 0 (0.0%) |
| 45 to 54 Years | 108 (49.1%) | 112 (50.9%) |
| 55 to 64 Years | 244 (96.1%) | 10 (3.9%) |
| 65 to 74 Years | 241 (100.0%) | 0 (0.0%) |
| 75 Years and older | 311 (100.0%) | 0 (0.0%) |
| Total | 1,325 (91.6%) | 122 (8.4%) |
Health Insurance Coverage by Citizenship Status in Greilickville
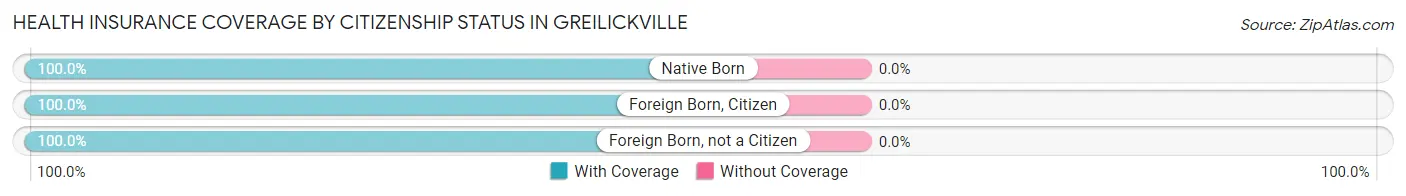
| Citizenship Status | With Coverage | Without Coverage |
| Native Born | 82 (100.0%) | 0 (0.0%) |
| Foreign Born, Citizen | 156 (100.0%) | 0 (0.0%) |
| Foreign Born, not a Citizen | 12 (100.0%) | 0 (0.0%) |
Health Insurance Coverage by Household Income in Greilickville
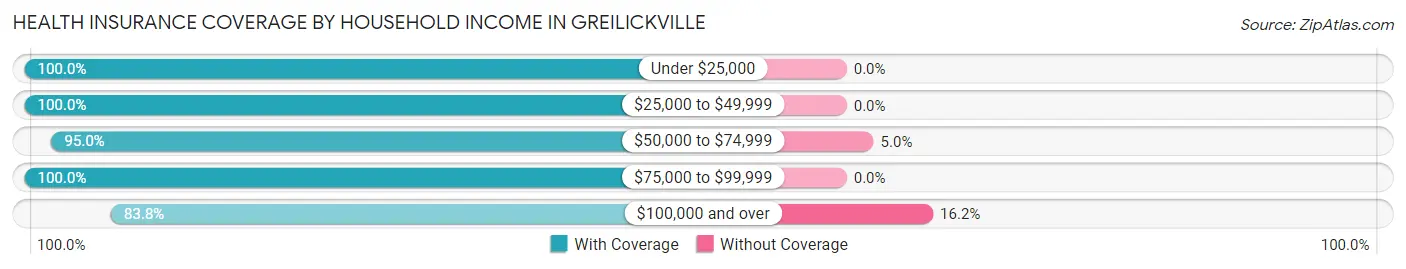
| Household Income | With Coverage | Without Coverage |
| Under $25,000 | 88 (100.0%) | 0 (0.0%) |
| $25,000 to $49,999 | 156 (100.0%) | 0 (0.0%) |
| $50,000 to $74,999 | 189 (95.0%) | 10 (5.0%) |
| $75,000 to $99,999 | 269 (100.0%) | 0 (0.0%) |
| $100,000 and over | 580 (83.8%) | 112 (16.2%) |
Public vs Private Health Insurance Coverage by Age in Greilickville
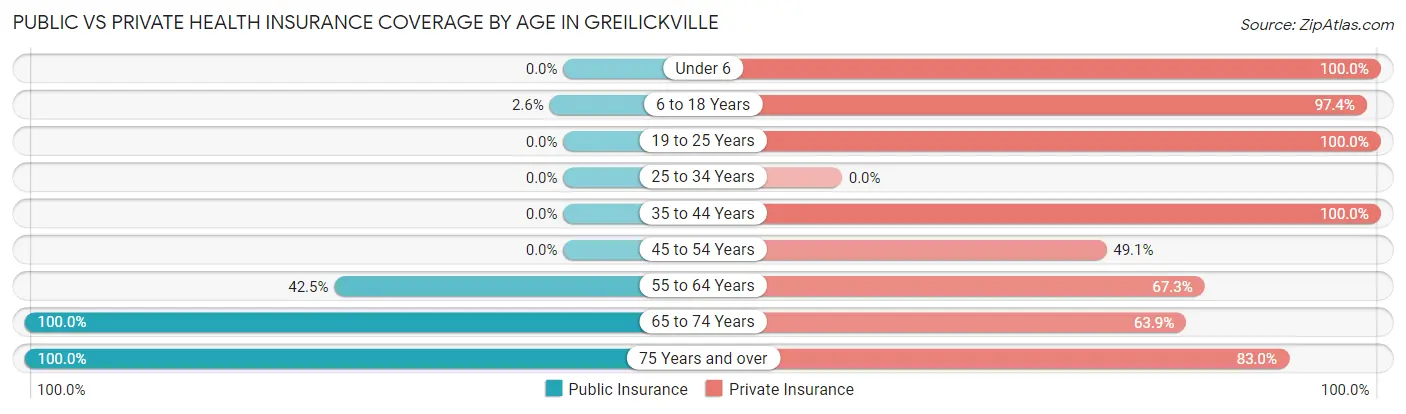
| Age Bracket | Public Insurance | Private Insurance |
| Under 6 | 0 (0.0%) | 82 (100.0%) |
| 6 to 18 Years | 4 (2.6%) | 152 (97.4%) |
| 19 to 25 Years | 0 (0.0%) | 12 (100.0%) |
| 25 to 34 Years | 0 (0.0%) | 0 (0.0%) |
| 35 to 44 Years | 0 (0.0%) | 171 (100.0%) |
| 45 to 54 Years | 0 (0.0%) | 108 (49.1%) |
| 55 to 64 Years | 108 (42.5%) | 171 (67.3%) |
| 65 to 74 Years | 241 (100.0%) | 154 (63.9%) |
| 75 Years and over | 311 (100.0%) | 258 (83.0%) |
| Total | 664 (45.9%) | 1,108 (76.6%) |
Disability Status by Sex by Age in Greilickville
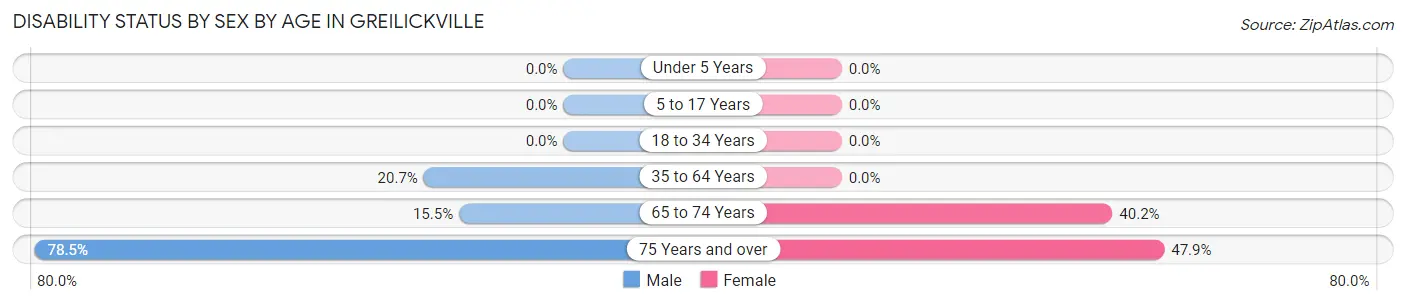
| Age Bracket | Male | Female |
| Under 5 Years | 0 (0.0%) | 0 (0.0%) |
| 5 to 17 Years | 0 (0.0%) | 0 (0.0%) |
| 18 to 34 Years | 0 (0.0%) | 0 (0.0%) |
| 35 to 64 Years | 73 (20.7%) | 0 (0.0%) |
| 65 to 74 Years | 20 (15.5%) | 45 (40.2%) |
| 75 Years and over | 95 (78.5%) | 91 (47.9%) |
Disability Class by Sex by Age in Greilickville
Disability Class: Hearing Difficulty
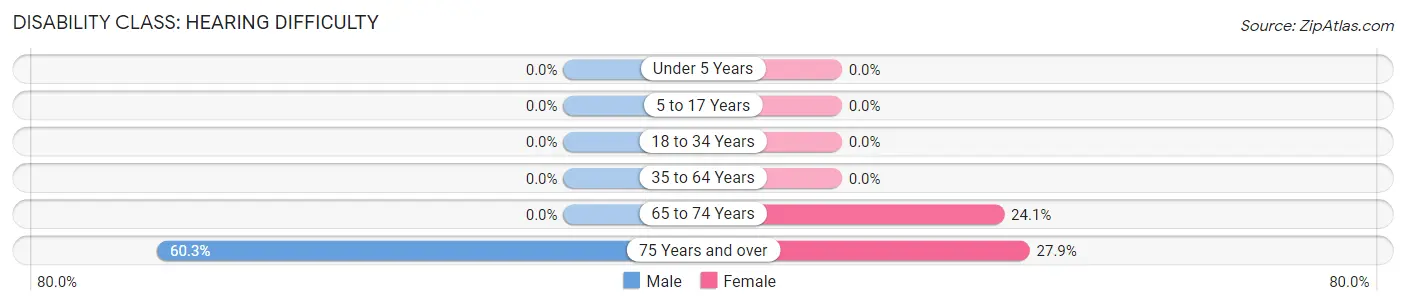
| Age Bracket | Male | Female |
| Under 5 Years | 0 (0.0%) | 0 (0.0%) |
| 5 to 17 Years | 0 (0.0%) | 0 (0.0%) |
| 18 to 34 Years | 0 (0.0%) | 0 (0.0%) |
| 35 to 64 Years | 0 (0.0%) | 0 (0.0%) |
| 65 to 74 Years | 0 (0.0%) | 27 (24.1%) |
| 75 Years and over | 73 (60.3%) | 53 (27.9%) |
Disability Class: Vision Difficulty
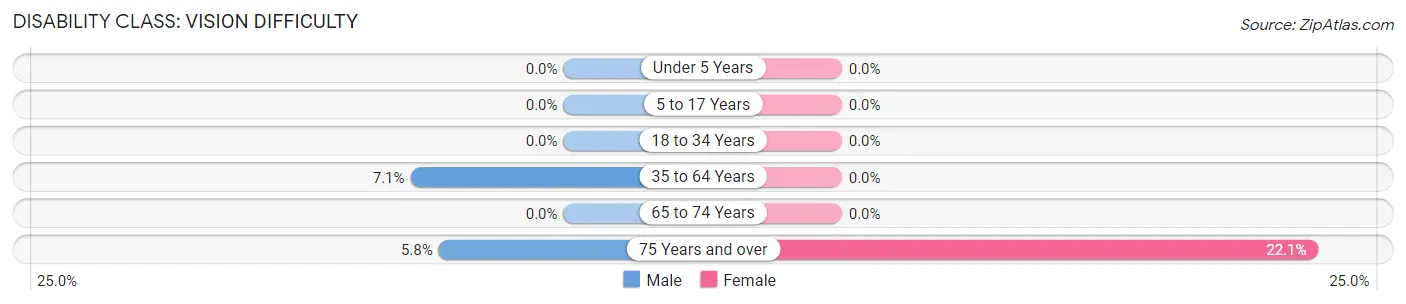
| Age Bracket | Male | Female |
| Under 5 Years | 0 (0.0%) | 0 (0.0%) |
| 5 to 17 Years | 0 (0.0%) | 0 (0.0%) |
| 18 to 34 Years | 0 (0.0%) | 0 (0.0%) |
| 35 to 64 Years | 25 (7.1%) | 0 (0.0%) |
| 65 to 74 Years | 0 (0.0%) | 0 (0.0%) |
| 75 Years and over | 7 (5.8%) | 42 (22.1%) |
Disability Class: Cognitive Difficulty
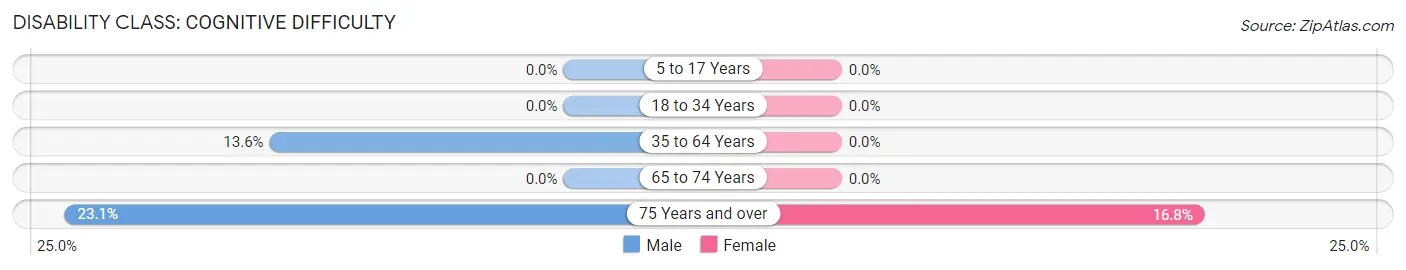
| Age Bracket | Male | Female |
| 5 to 17 Years | 0 (0.0%) | 0 (0.0%) |
| 18 to 34 Years | 0 (0.0%) | 0 (0.0%) |
| 35 to 64 Years | 48 (13.6%) | 0 (0.0%) |
| 65 to 74 Years | 0 (0.0%) | 0 (0.0%) |
| 75 Years and over | 28 (23.1%) | 32 (16.8%) |
Disability Class: Ambulatory Difficulty
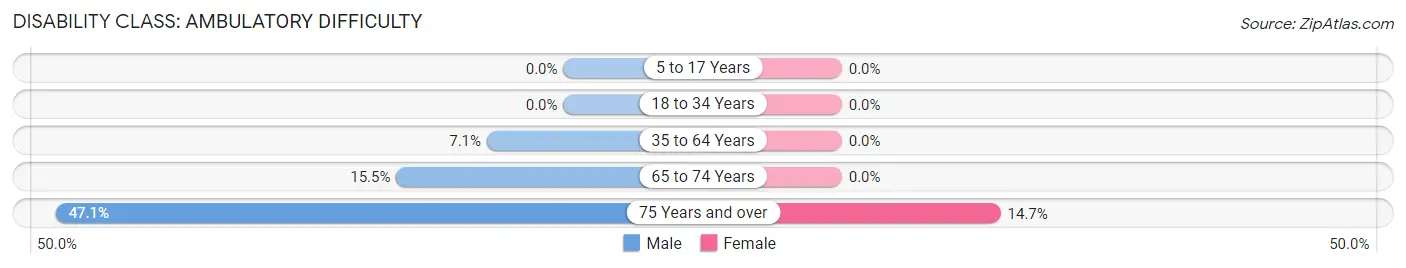
| Age Bracket | Male | Female |
| 5 to 17 Years | 0 (0.0%) | 0 (0.0%) |
| 18 to 34 Years | 0 (0.0%) | 0 (0.0%) |
| 35 to 64 Years | 25 (7.1%) | 0 (0.0%) |
| 65 to 74 Years | 20 (15.5%) | 0 (0.0%) |
| 75 Years and over | 57 (47.1%) | 28 (14.7%) |
Disability Class: Self-Care Difficulty
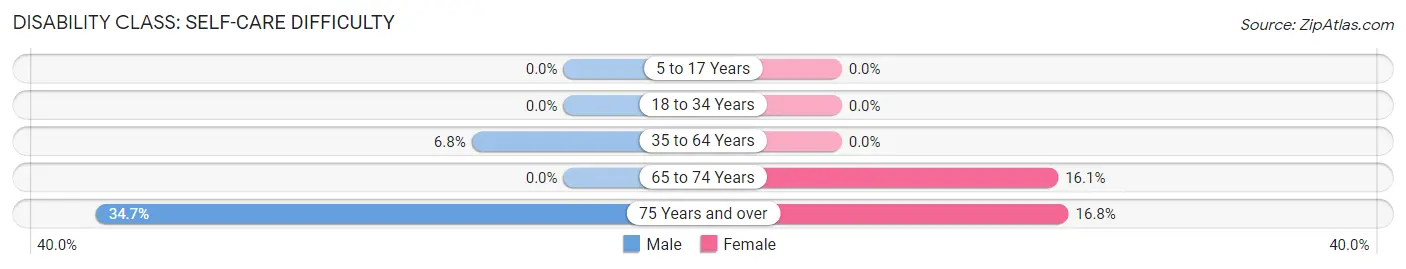
| Age Bracket | Male | Female |
| 5 to 17 Years | 0 (0.0%) | 0 (0.0%) |
| 18 to 34 Years | 0 (0.0%) | 0 (0.0%) |
| 35 to 64 Years | 24 (6.8%) | 0 (0.0%) |
| 65 to 74 Years | 0 (0.0%) | 18 (16.1%) |
| 75 Years and over | 42 (34.7%) | 32 (16.8%) |
Technology Access in Greilickville
Computing Device Access in Greilickville
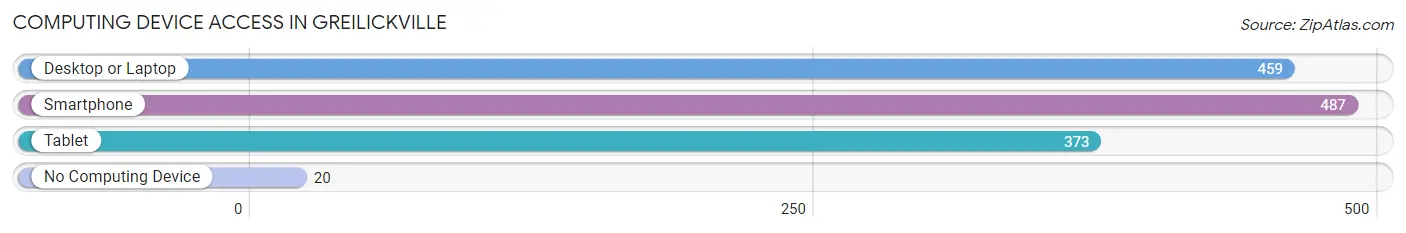
| Device Type | # Households | % Households |
| Desktop or Laptop | 459 | 73.8% |
| Smartphone | 487 | 78.3% |
| Tablet | 373 | 60.0% |
| No Computing Device | 20 | 3.2% |
| Total | 622 | 100.0% |
Internet Access in Greilickville
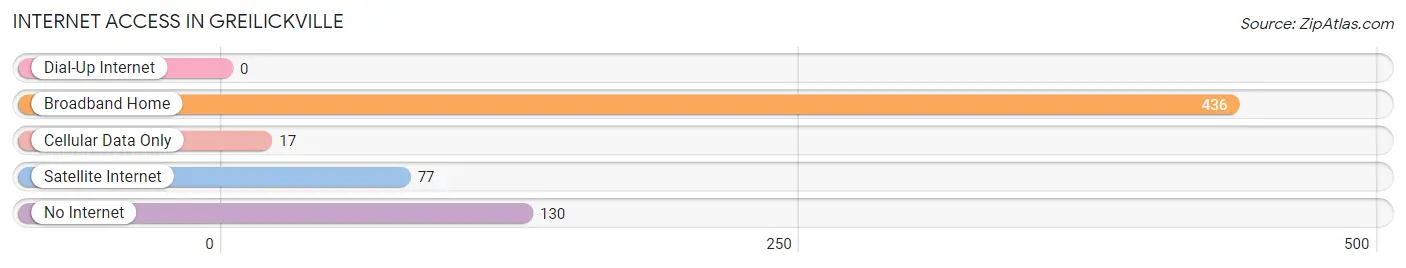
| Internet Type | # Households | % Households |
| Dial-Up Internet | 0 | 0.0% |
| Broadband Home | 436 | 70.1% |
| Cellular Data Only | 17 | 2.7% |
| Satellite Internet | 77 | 12.4% |
| No Internet | 130 | 20.9% |
| Total | 622 | 100.0% |
Greilickville Summary
Greilickville is a small unincorporated community located in Grand Traverse County, Michigan. It is situated on the east side of Grand Traverse Bay, just south of Traverse City. The community is named after the Greilick family, who were among the first settlers in the area.
History
The Greilick family first settled in the area in the late 1800s. The family was originally from Germany and had immigrated to the United States in the mid-1800s. They settled in the area that is now Greilickville and began farming the land. The family also built a sawmill and a gristmill, which were important to the local economy.
The community was officially established in 1891 when the post office was opened. The post office was named after the Greilick family, and the community was soon known as Greilickville.
In the early 1900s, the community began to grow and develop. A school was built in 1910, and a general store was opened in 1912. The store was owned and operated by the Greilick family, and it served as the center of the community.
The community continued to grow and develop throughout the 20th century. In the 1950s, a new school was built, and a new post office was opened in the 1960s. The community also had a fire station, a library, and a community center.
Geography
Greilickville is located in Grand Traverse County, Michigan. It is situated on the east side of Grand Traverse Bay, just south of Traverse City. The community is located in a rural area, and it is surrounded by farmland and forests.
The climate in Greilickville is typical of the Great Lakes region. Summers are warm and humid, and winters are cold and snowy. The average annual temperature is around 45 degrees Fahrenheit.
Economy
The economy of Greilickville is largely based on agriculture and tourism. The area is known for its apple orchards, and many of the local farms produce apples, cherries, and other fruits and vegetables. The area is also popular with tourists, and there are several wineries and breweries in the area.
The community also has several small businesses, including a general store, a hardware store, and a restaurant. There is also a post office in the community.
Demographics
As of the 2010 census, the population of Greilickville was 1,093. The population is mostly white (97.3%), with a small percentage of African Americans (1.2%) and Native Americans (0.7%). The median household income is $45,000, and the median age is 44.
Conclusion
Greilickville is a small unincorporated community located in Grand Traverse County, Michigan. It is situated on the east side of Grand Traverse Bay, just south of Traverse City. The community was established in 1891 and is named after the Greilick family, who were among the first settlers in the area. The economy of Greilickville is largely based on agriculture and tourism, and the population is mostly white.
Common Questions
What is Per Capita Income in Greilickville?
Per Capita income in Greilickville is $47,834.
What is the Median Family Income in Greilickville?
Median Family Income in Greilickville is $90,543.
What is the Median Household income in Greilickville?
Median Household Income in Greilickville is $73,553.
What is Income or Wage Gap in Greilickville?
Income or Wage Gap in Greilickville is 63.7%.
Women in Greilickville earn 36.3 cents for every dollar earned by a man.
What is Inequality or Gini Index in Greilickville?
Inequality or Gini Index in Greilickville is 0.44.
What is the Total Population of Greilickville?
Total Population of Greilickville is 1,467.
What is the Total Male Population of Greilickville?
Total Male Population of Greilickville is 706.
What is the Total Female Population of Greilickville?
Total Female Population of Greilickville is 761.
What is the Ratio of Males per 100 Females in Greilickville?
There are 92.77 Males per 100 Females in Greilickville.
What is the Ratio of Females per 100 Males in Greilickville?
There are 107.79 Females per 100 Males in Greilickville.
What is the Median Population Age in Greilickville?
Median Population Age in Greilickville is 59.5 Years.
What is the Average Family Size in Greilickville
Average Family Size in Greilickville is 2.7 People.
What is the Average Household Size in Greilickville
Average Household Size in Greilickville is 2.3 People.
How Large is the Labor Force in Greilickville?
There are 503 People in the Labor Forcein in Greilickville.
What is the Percentage of People in the Labor Force in Greilickville?
40.9% of People are in the Labor Force in Greilickville.
What is the Unemployment Rate in Greilickville?
Unemployment Rate in Greilickville is 2.0%.