Kingsford, MI Map & Demographics
Kingsford Map
Kingsford Overview
$31,160
PER CAPITA INCOME
$63,000
AVG FAMILY INCOME
$59,106
AVG HOUSEHOLD INCOME
16.8%
WAGE / INCOME GAP [ % ]
83.2¢/ $1
WAGE / INCOME GAP [ $ ]
0.40
INEQUALITY / GINI INDEX
5,127
TOTAL POPULATION
2,452
MALE POPULATION
2,675
FEMALE POPULATION
91.66
MALES / 100 FEMALES
109.09
FEMALES / 100 MALES
40.6
MEDIAN AGE
2.7
AVG FAMILY SIZE
2.2
AVG HOUSEHOLD SIZE
2,558
LABOR FORCE [ PEOPLE ]
61.1%
PERCENT IN LABOR FORCE
3.6%
UNEMPLOYMENT RATE
Kingsford Zip Codes
Kingsford Area Codes
Income in Kingsford
Income Overview in Kingsford
Per Capita Income in Kingsford is $31,160, while median incomes of families and households are $63,000 and $59,106 respectively.
| Characteristic | Number | Measure |
| Per Capita Income | 5,127 | $31,160 |
| Median Family Income | 1,390 | $63,000 |
| Mean Family Income | 1,390 | $83,786 |
| Median Household Income | 2,219 | $59,106 |
| Mean Household Income | 2,219 | $71,250 |
| Income Deficit | 1,390 | $0 |
| Wage / Income Gap (%) | 5,127 | 16.83% |
| Wage / Income Gap ($) | 5,127 | 83.17¢ per $1 |
| Gini / Inequality Index | 5,127 | 0.40 |
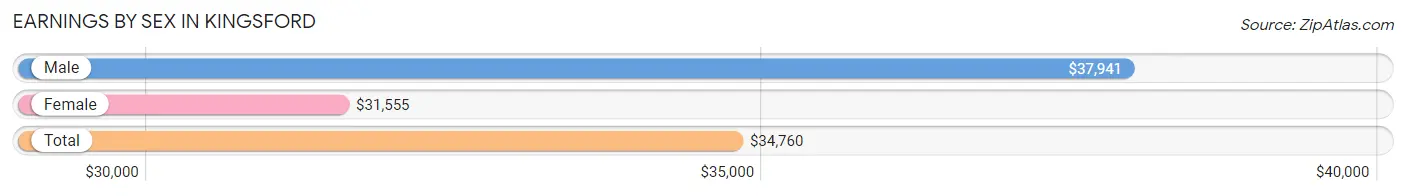
Earnings by Sex in Kingsford
Average Earnings in Kingsford are $34,760, $37,941 for men and $31,555 for women, a difference of 16.8%.
| Sex | Number | Average Earnings |
| Male | 1,392 (51.8%) | $37,941 |
| Female | 1,293 (48.2%) | $31,555 |
| Total | 2,685 (100.0%) | $34,760 |
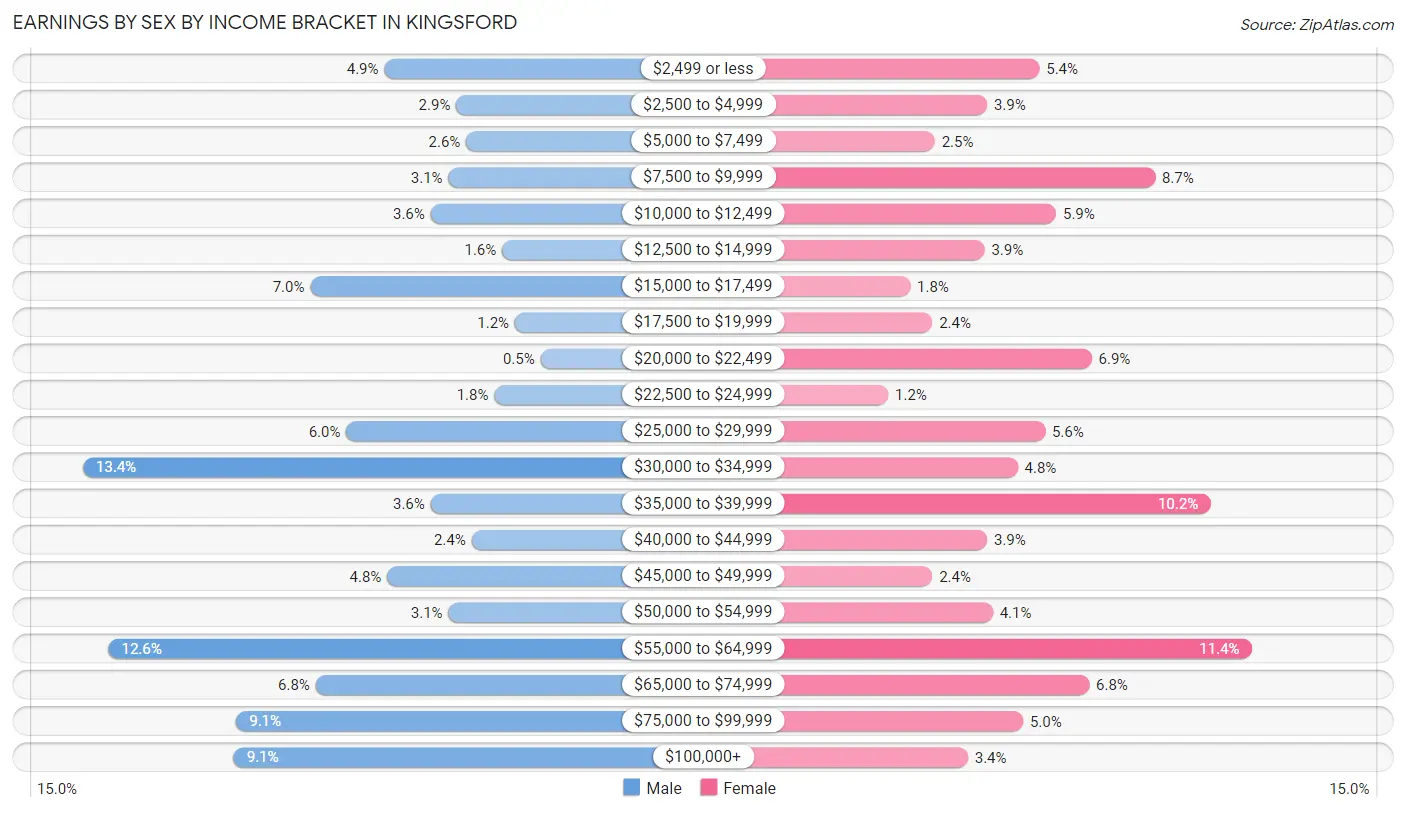
Earnings by Sex by Income Bracket in Kingsford
The most common earnings brackets in Kingsford are $30,000 to $34,999 for men (186 | 13.4%) and $55,000 to $64,999 for women (147 | 11.4%).
| Income | Male | Female |
| $2,499 or less | 68 (4.9%) | 70 (5.4%) |
| $2,500 to $4,999 | 40 (2.9%) | 51 (3.9%) |
| $5,000 to $7,499 | 36 (2.6%) | 32 (2.5%) |
| $7,500 to $9,999 | 43 (3.1%) | 112 (8.7%) |
| $10,000 to $12,499 | 50 (3.6%) | 76 (5.9%) |
| $12,500 to $14,999 | 22 (1.6%) | 50 (3.9%) |
| $15,000 to $17,499 | 97 (7.0%) | 23 (1.8%) |
| $17,500 to $19,999 | 17 (1.2%) | 31 (2.4%) |
| $20,000 to $22,499 | 7 (0.5%) | 89 (6.9%) |
| $22,500 to $24,999 | 25 (1.8%) | 15 (1.2%) |
| $25,000 to $29,999 | 83 (6.0%) | 72 (5.6%) |
| $30,000 to $34,999 | 186 (13.4%) | 62 (4.8%) |
| $35,000 to $39,999 | 50 (3.6%) | 132 (10.2%) |
| $40,000 to $44,999 | 34 (2.4%) | 51 (3.9%) |
| $45,000 to $49,999 | 67 (4.8%) | 31 (2.4%) |
| $50,000 to $54,999 | 43 (3.1%) | 53 (4.1%) |
| $55,000 to $64,999 | 176 (12.6%) | 147 (11.4%) |
| $65,000 to $74,999 | 95 (6.8%) | 88 (6.8%) |
| $75,000 to $99,999 | 126 (9.0%) | 64 (5.0%) |
| $100,000+ | 127 (9.1%) | 44 (3.4%) |
| Total | 1,392 (100.0%) | 1,293 (100.0%) |
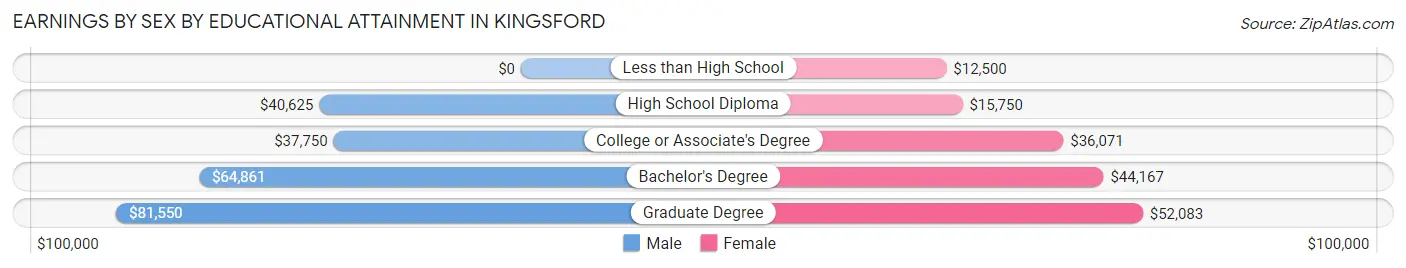
Earnings by Sex by Educational Attainment in Kingsford
Average earnings in Kingsford are $55,024 for men and $37,962 for women, a difference of 31.0%. Men with an educational attainment of graduate degree enjoy the highest average annual earnings of $81,550, while those with college or associate's degree education earn the least with $37,750. Women with an educational attainment of graduate degree earn the most with the average annual earnings of $52,083, while those with less than high school education have the smallest earnings of $12,500.
| Educational Attainment | Male Income | Female Income |
| Less than High School | - | - |
| High School Diploma | $40,625 | $15,750 |
| College or Associate's Degree | $37,750 | $36,071 |
| Bachelor's Degree | $64,861 | $44,167 |
| Graduate Degree | $81,550 | $52,083 |
| Total | $55,024 | $37,962 |
Family Income in Kingsford
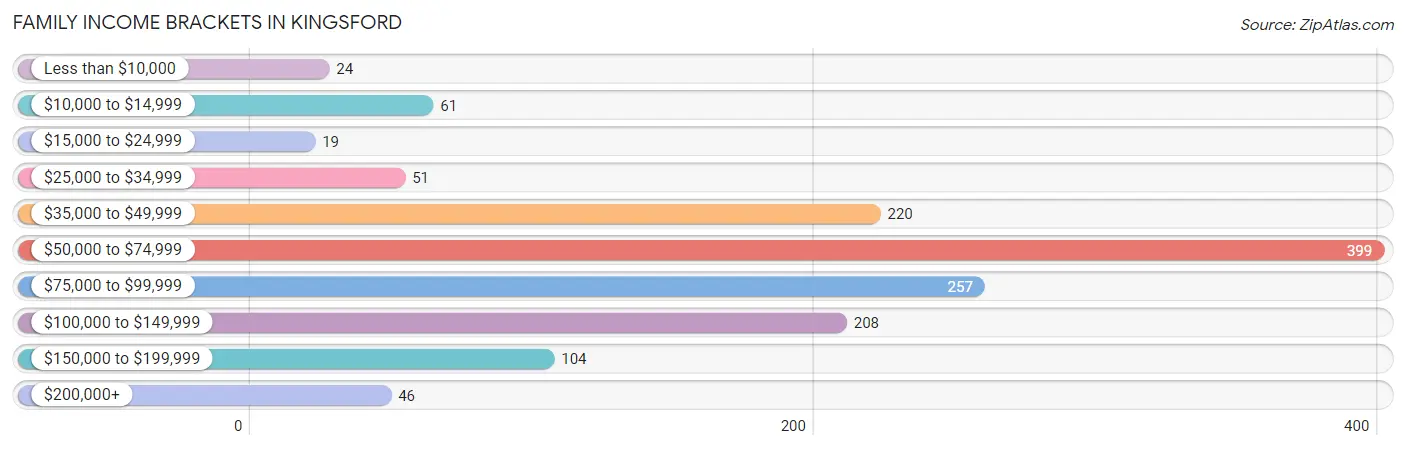
Family Income Brackets in Kingsford
According to the Kingsford family income data, there are 399 families falling into the $50,000 to $74,999 income range, which is the most common income bracket and makes up 28.7% of all families. Conversely, the $15,000 to $24,999 income bracket is the least frequent group with only 19 families (1.4%) belonging to this category.
| Income Bracket | # Families | % Families |
| Less than $10,000 | 24 | 1.7% |
| $10,000 to $14,999 | 61 | 4.4% |
| $15,000 to $24,999 | 19 | 1.4% |
| $25,000 to $34,999 | 51 | 3.7% |
| $35,000 to $49,999 | 220 | 15.8% |
| $50,000 to $74,999 | 399 | 28.7% |
| $75,000 to $99,999 | 257 | 18.5% |
| $100,000 to $149,999 | 208 | 15.0% |
| $150,000 to $199,999 | 104 | 7.5% |
| $200,000+ | 46 | 3.3% |
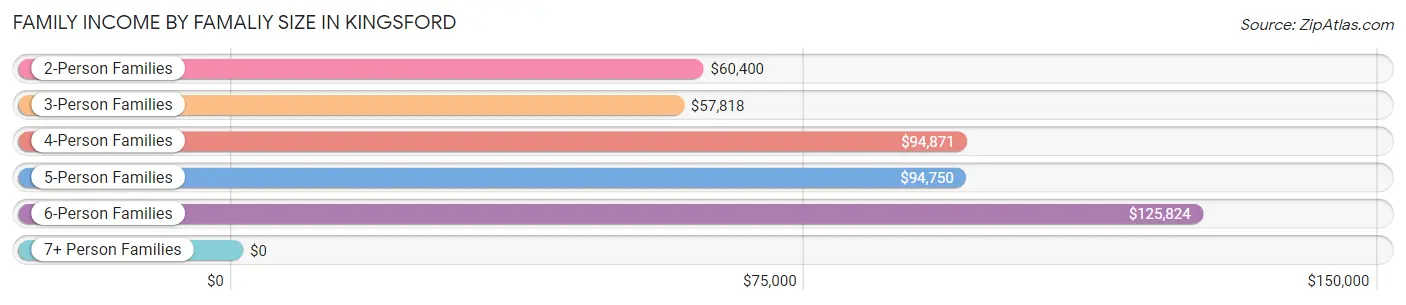
Family Income by Famaliy Size in Kingsford
6-person families (63 | 4.5%) account for the highest median family income in Kingsford with $125,824 per family, while 2-person families (832 | 59.9%) have the highest median income of $30,200 per family member.
| Income Bracket | # Families | Median Income |
| 2-Person Families | 832 (59.9%) | $60,400 |
| 3-Person Families | 245 (17.6%) | $57,818 |
| 4-Person Families | 201 (14.5%) | $94,871 |
| 5-Person Families | 49 (3.5%) | $94,750 |
| 6-Person Families | 63 (4.5%) | $125,824 |
| 7+ Person Families | 0 (0.0%) | $0 |
| Total | 1,390 (100.0%) | $63,000 |
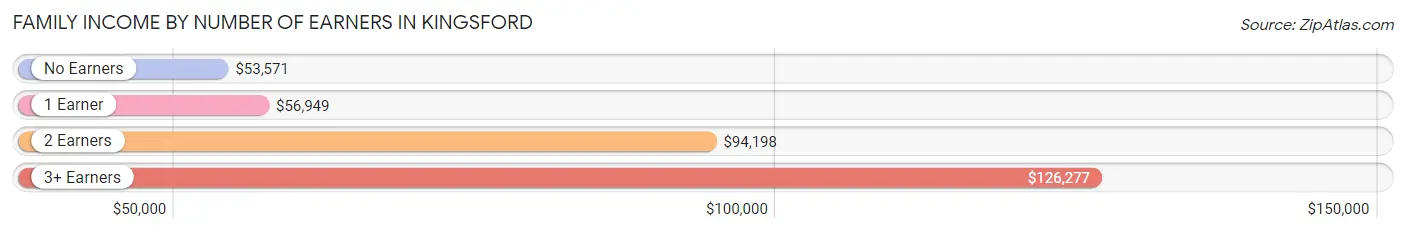
Family Income by Number of Earners in Kingsford
The median family income in Kingsford is $63,000, with families comprising 3+ earners (108) having the highest median family income of $126,277, while families with no earners (226) have the lowest median family income of $53,571, accounting for 7.8% and 16.3% of families, respectively.
| Number of Earners | # Families | Median Income |
| No Earners | 226 (16.3%) | $53,571 |
| 1 Earner | 497 (35.8%) | $56,949 |
| 2 Earners | 559 (40.2%) | $94,198 |
| 3+ Earners | 108 (7.8%) | $126,277 |
| Total | 1,390 (100.0%) | $63,000 |
Household Income in Kingsford
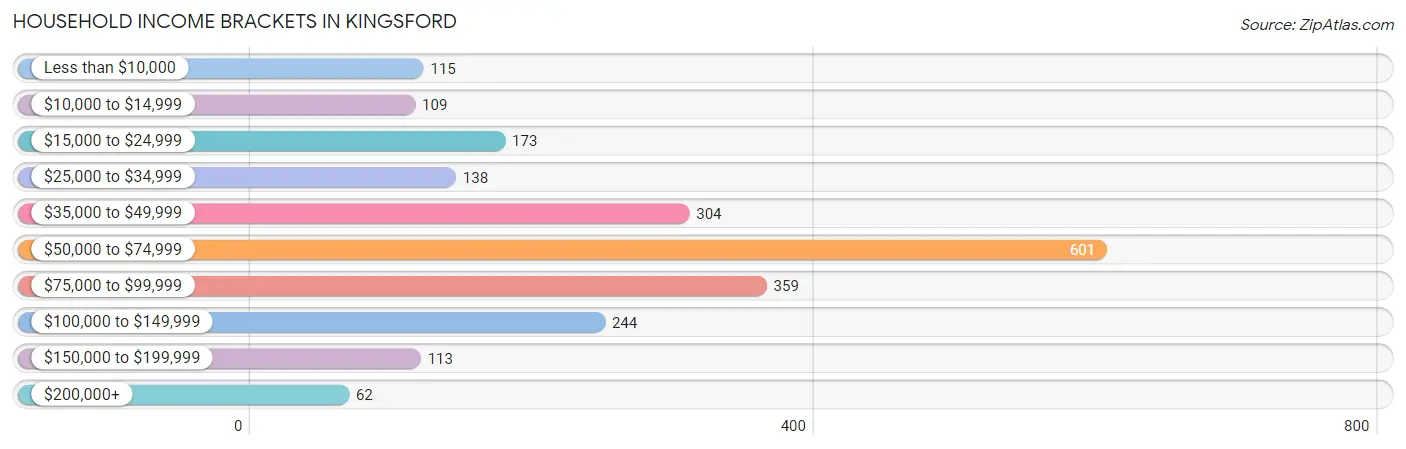
Household Income Brackets in Kingsford
With 601 households falling in the category, the $50,000 to $74,999 income range is the most frequent in Kingsford, accounting for 27.1% of all households. In contrast, only 62 households (2.8%) fall into the $200,000+ income bracket, making it the least populous group.
| Income Bracket | # Households | % Households |
| Less than $10,000 | 115 | 5.2% |
| $10,000 to $14,999 | 109 | 4.9% |
| $15,000 to $24,999 | 173 | 7.8% |
| $25,000 to $34,999 | 138 | 6.2% |
| $35,000 to $49,999 | 304 | 13.7% |
| $50,000 to $74,999 | 601 | 27.1% |
| $75,000 to $99,999 | 359 | 16.2% |
| $100,000 to $149,999 | 244 | 11.0% |
| $150,000 to $199,999 | 113 | 5.1% |
| $200,000+ | 62 | 2.8% |
Household Income by Householder Age in Kingsford
The median household income in Kingsford is $59,106, with the highest median household income of $93,098 found in the 25 to 44 years age bracket for the primary householder. A total of 634 households (28.6%) fall into this category. Meanwhile, the 15 to 24 years age bracket for the primary householder has the lowest median household income of $0, with 158 households (7.1%) in this group.
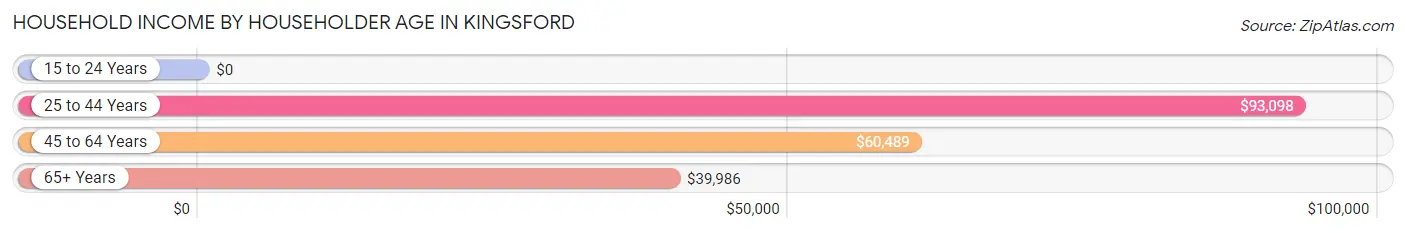
| Income Bracket | # Households | Median Income |
| 15 to 24 Years | 158 (7.1%) | $0 |
| 25 to 44 Years | 634 (28.6%) | $93,098 |
| 45 to 64 Years | 694 (31.3%) | $60,489 |
| 65+ Years | 733 (33.0%) | $39,986 |
| Total | 2,219 (100.0%) | $59,106 |
Poverty in Kingsford
Income Below Poverty by Sex and Age in Kingsford
With 8.1% poverty level for males and 12.1% for females among the residents of Kingsford, 16 and 17 year old males and 25 to 34 year old females are the most vulnerable to poverty, with 35 males (49.3%) and 72 females (27.7%) in their respective age groups living below the poverty level.
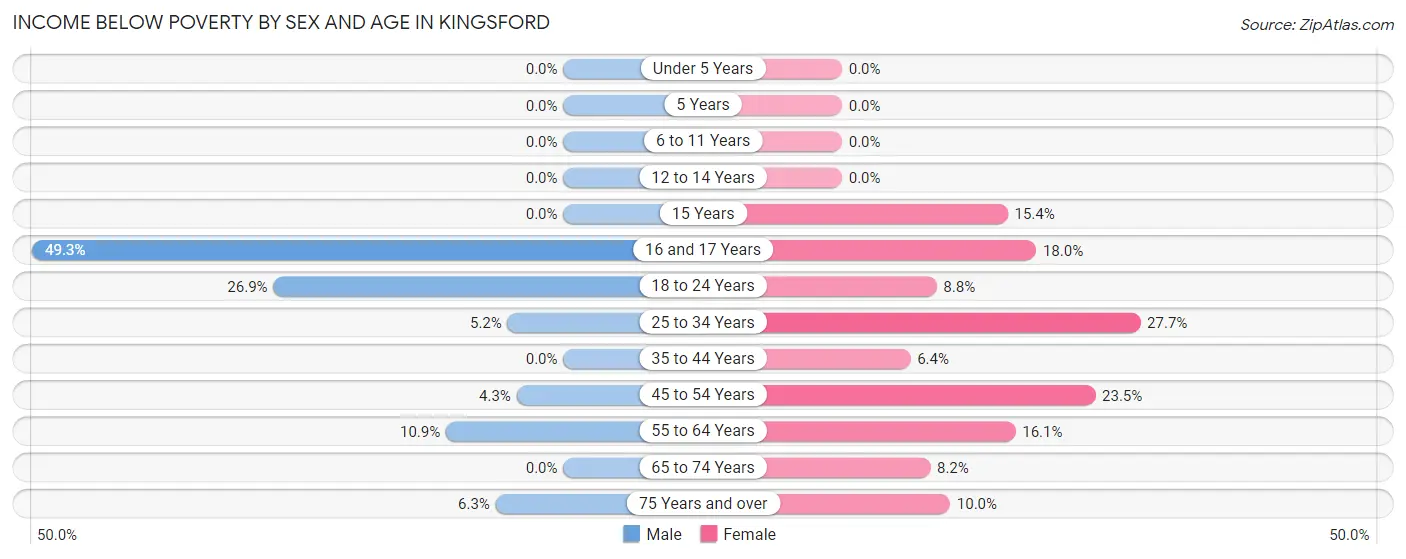
| Age Bracket | Male | Female |
| Under 5 Years | 0 (0.0%) | 0 (0.0%) |
| 5 Years | 0 (0.0%) | 0 (0.0%) |
| 6 to 11 Years | 0 (0.0%) | 0 (0.0%) |
| 12 to 14 Years | 0 (0.0%) | 0 (0.0%) |
| 15 Years | 0 (0.0%) | 6 (15.4%) |
| 16 and 17 Years | 35 (49.3%) | 20 (18.0%) |
| 18 to 24 Years | 95 (26.9%) | 13 (8.8%) |
| 25 to 34 Years | 12 (5.2%) | 72 (27.7%) |
| 35 to 44 Years | 0 (0.0%) | 24 (6.4%) |
| 45 to 54 Years | 11 (4.3%) | 75 (23.5%) |
| 55 to 64 Years | 22 (10.9%) | 47 (16.1%) |
| 65 to 74 Years | 0 (0.0%) | 23 (8.2%) |
| 75 Years and over | 13 (6.3%) | 32 (10.0%) |
| Total | 188 (8.1%) | 312 (12.1%) |
Income Above Poverty by Sex and Age in Kingsford
According to the poverty statistics in Kingsford, males aged under 5 years and females aged under 5 years are the age groups that are most secure financially, with 100.0% of males and 100.0% of females in these age groups living above the poverty line.
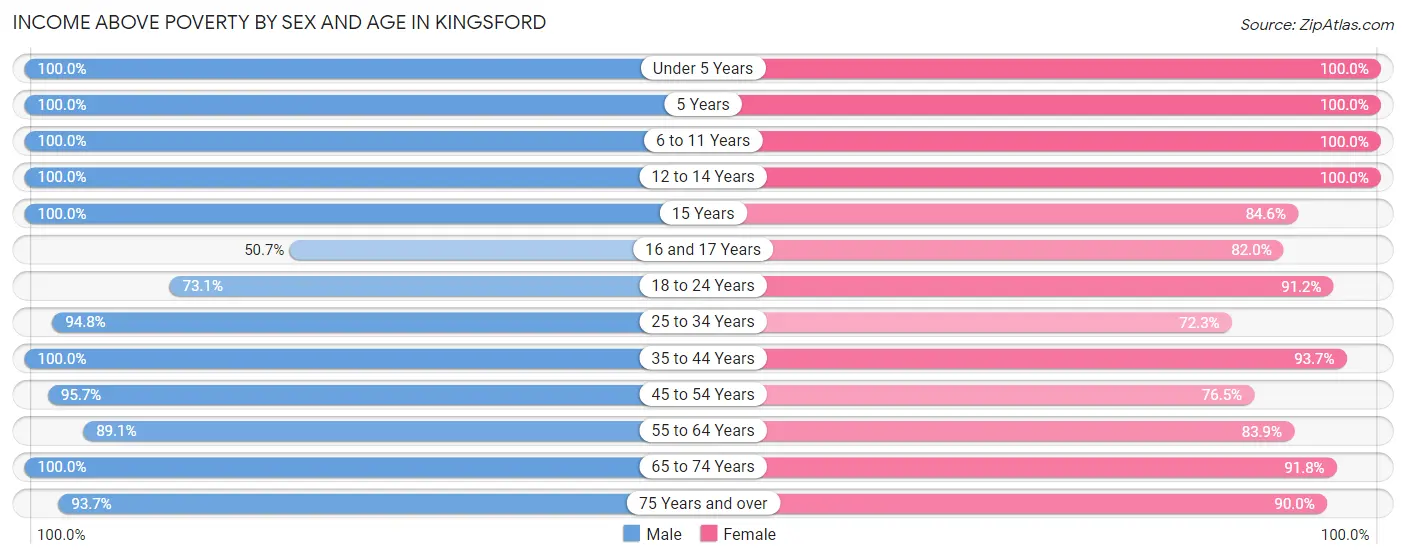
| Age Bracket | Male | Female |
| Under 5 Years | 144 (100.0%) | 171 (100.0%) |
| 5 Years | 39 (100.0%) | 8 (100.0%) |
| 6 to 11 Years | 95 (100.0%) | 78 (100.0%) |
| 12 to 14 Years | 103 (100.0%) | 172 (100.0%) |
| 15 Years | 17 (100.0%) | 33 (84.6%) |
| 16 and 17 Years | 36 (50.7%) | 91 (82.0%) |
| 18 to 24 Years | 258 (73.1%) | 135 (91.2%) |
| 25 to 34 Years | 220 (94.8%) | 188 (72.3%) |
| 35 to 44 Years | 395 (100.0%) | 354 (93.6%) |
| 45 to 54 Years | 243 (95.7%) | 244 (76.5%) |
| 55 to 64 Years | 180 (89.1%) | 245 (83.9%) |
| 65 to 74 Years | 223 (100.0%) | 258 (91.8%) |
| 75 Years and over | 194 (93.7%) | 287 (90.0%) |
| Total | 2,147 (91.9%) | 2,264 (87.9%) |
Income Below Poverty Among Married-Couple Families in Kingsford
The poverty statistics for married-couple families in Kingsford show that 0.8% or 8 of the total 999 families live below the poverty line. Families with no children have the highest poverty rate of 1.3%, comprising of 8 families. On the other hand, families with 1 or 2 children have the lowest poverty rate of 0.0%, which includes 0 families.

| Children | Above Poverty | Below Poverty |
| No Children | 589 (98.7%) | 8 (1.3%) |
| 1 or 2 Children | 356 (100.0%) | 0 (0.0%) |
| 3 or 4 Children | 46 (100.0%) | 0 (0.0%) |
| 5 or more Children | 0 (0.0%) | 0 (0.0%) |
| Total | 991 (99.2%) | 8 (0.8%) |
Income Below Poverty Among Single-Parent Households in Kingsford
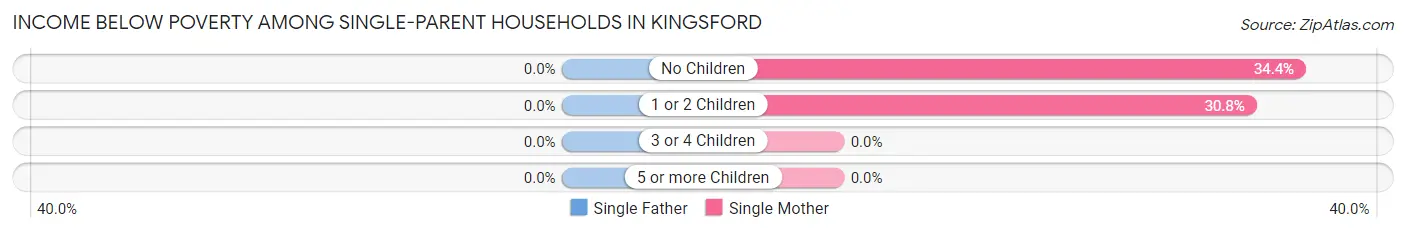
| Children | Single Father | Single Mother |
| No Children | 0 (0.0%) | 52 (34.4%) |
| 1 or 2 Children | 0 (0.0%) | 40 (30.8%) |
| 3 or 4 Children | 0 (0.0%) | 0 (0.0%) |
| 5 or more Children | 0 (0.0%) | 0 (0.0%) |
| Total | 0 (0.0%) | 92 (32.7%) |
Income Below Poverty Among Married-Couple vs Single-Parent Households in Kingsford
The poverty data for Kingsford shows that 8 of the married-couple family households (0.8%) and 92 of the single-parent households (23.5%) are living below the poverty level. Within the married-couple family households, those with no children have the highest poverty rate, with 8 households (1.3%) falling below the poverty line. Among the single-parent households, those with 1 or 2 children have the highest poverty rate, with 40 household (26.1%) living below poverty.
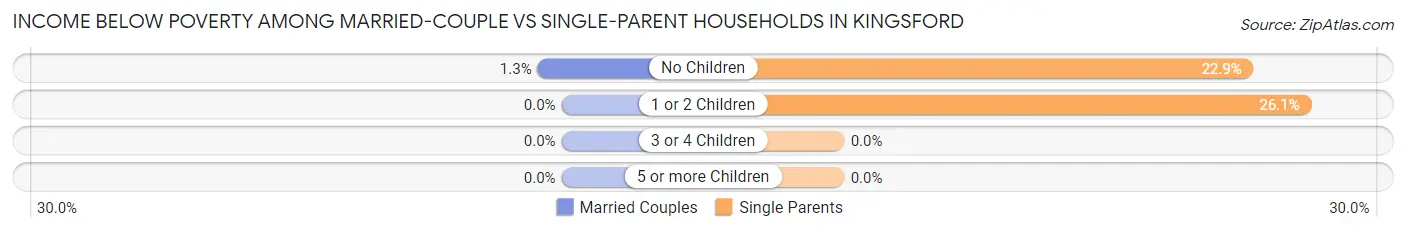
| Children | Married-Couple Families | Single-Parent Households |
| No Children | 8 (1.3%) | 52 (22.9%) |
| 1 or 2 Children | 0 (0.0%) | 40 (26.1%) |
| 3 or 4 Children | 0 (0.0%) | 0 (0.0%) |
| 5 or more Children | 0 (0.0%) | 0 (0.0%) |
| Total | 8 (0.8%) | 92 (23.5%) |
Race in Kingsford
The most populous races in Kingsford are White / Caucasian (4,549 | 88.7%), Two or more Races (322 | 6.3%), and Hispanic or Latino (95 | 1.8%).
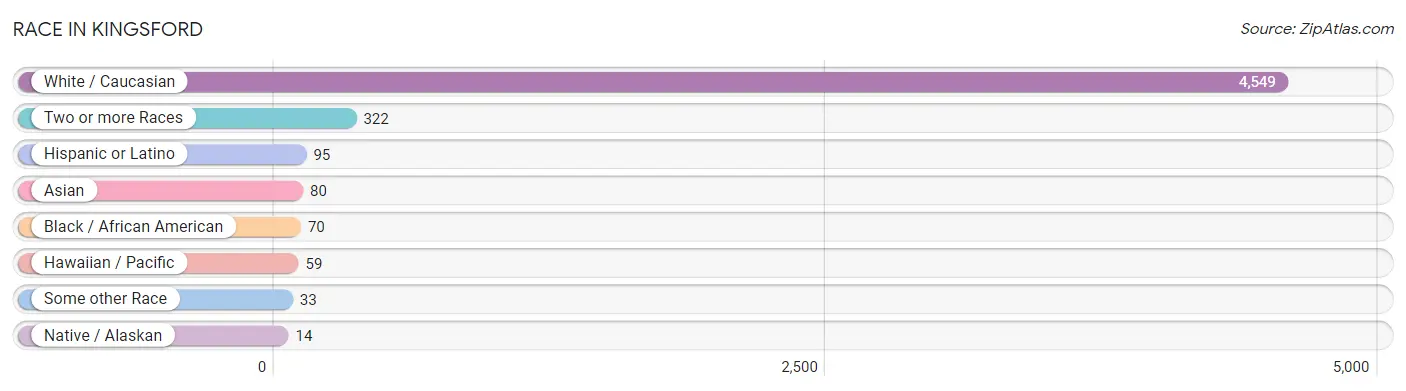
| Race | # Population | % Population |
| Asian | 80 | 1.6% |
| Black / African American | 70 | 1.4% |
| Hawaiian / Pacific | 59 | 1.1% |
| Hispanic or Latino | 95 | 1.8% |
| Native / Alaskan | 14 | 0.3% |
| White / Caucasian | 4,549 | 88.7% |
| Two or more Races | 322 | 6.3% |
| Some other Race | 33 | 0.6% |
| Total | 5,127 | 100.0% |
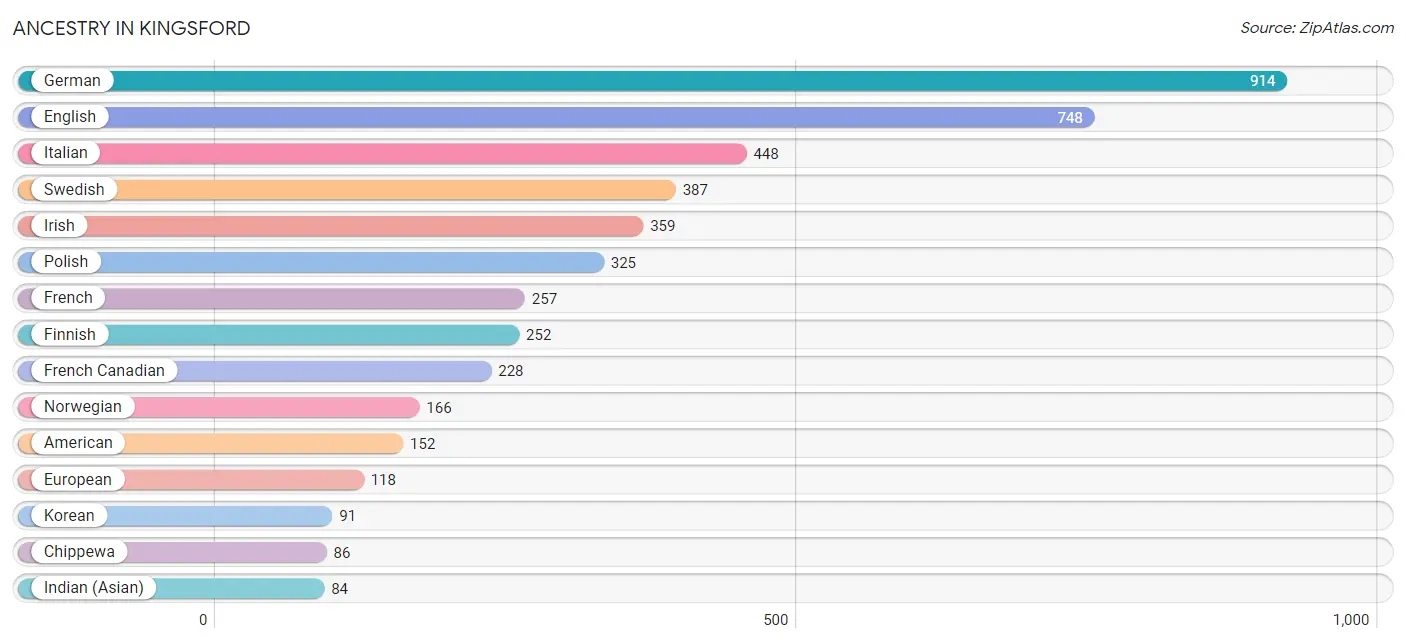
Ancestry in Kingsford
The most populous ancestries reported in Kingsford are German (914 | 17.8%), English (748 | 14.6%), Italian (448 | 8.7%), Swedish (387 | 7.5%), and Irish (359 | 7.0%), together accounting for 55.7% of all Kingsford residents.
| Ancestry | # Population | % Population |
| African | 10 | 0.2% |
| American | 152 | 3.0% |
| Austrian | 43 | 0.8% |
| Bangladeshi | 20 | 0.4% |
| Belgian | 68 | 1.3% |
| Bhutanese | 14 | 0.3% |
| British | 10 | 0.2% |
| Canadian | 9 | 0.2% |
| Central American | 9 | 0.2% |
| Chilean | 11 | 0.2% |
| Chippewa | 86 | 1.7% |
| Croatian | 40 | 0.8% |
| Czech | 15 | 0.3% |
| Czechoslovakian | 17 | 0.3% |
| Danish | 19 | 0.4% |
| Dutch | 34 | 0.7% |
| English | 748 | 14.6% |
| European | 118 | 2.3% |
| Finnish | 252 | 4.9% |
| French | 257 | 5.0% |
| French Canadian | 228 | 4.4% |
| German | 914 | 17.8% |
| Honduran | 9 | 0.2% |
| Hungarian | 10 | 0.2% |
| Indian (Asian) | 84 | 1.6% |
| Irish | 359 | 7.0% |
| Italian | 448 | 8.7% |
| Jamaican | 36 | 0.7% |
| Korean | 91 | 1.8% |
| Mexican | 54 | 1.1% |
| Native Hawaiian | 59 | 1.1% |
| Northern European | 9 | 0.2% |
| Norwegian | 166 | 3.2% |
| Polish | 325 | 6.3% |
| Russian | 1 | 0.0% |
| Scandinavian | 8 | 0.2% |
| Scotch-Irish | 37 | 0.7% |
| Scottish | 73 | 1.4% |
| Slavic | 67 | 1.3% |
| South American | 11 | 0.2% |
| Spaniard | 21 | 0.4% |
| Subsaharan African | 10 | 0.2% |
| Swedish | 387 | 7.5% |
| Swiss | 39 | 0.8% |
| Welsh | 48 | 0.9% | View All 45 Rows |
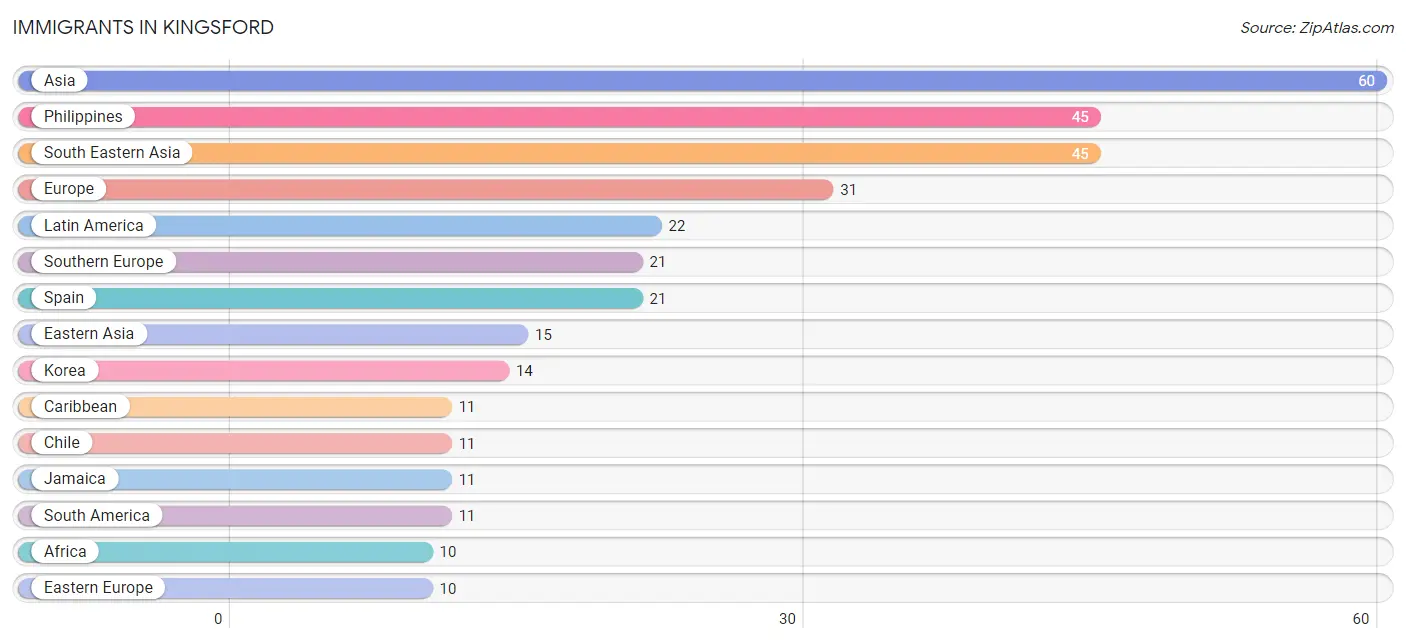
Immigrants in Kingsford
The most numerous immigrant groups reported in Kingsford came from Asia (60 | 1.2%), Philippines (45 | 0.9%), South Eastern Asia (45 | 0.9%), Europe (31 | 0.6%), and Latin America (22 | 0.4%), together accounting for 4.0% of all Kingsford residents.
| Immigration Origin | # Population | % Population |
| Africa | 10 | 0.2% |
| Asia | 60 | 1.2% |
| Caribbean | 11 | 0.2% |
| Chile | 11 | 0.2% |
| China | 1 | 0.0% |
| Eastern Asia | 15 | 0.3% |
| Eastern Europe | 10 | 0.2% |
| Europe | 31 | 0.6% |
| Hungary | 10 | 0.2% |
| Jamaica | 11 | 0.2% |
| Korea | 14 | 0.3% |
| Latin America | 22 | 0.4% |
| Philippines | 45 | 0.9% |
| South America | 11 | 0.2% |
| South Eastern Asia | 45 | 0.9% |
| Southern Europe | 21 | 0.4% |
| Spain | 21 | 0.4% | View All 17 Rows |
Sex and Age in Kingsford
Sex and Age in Kingsford
The most populous age groups in Kingsford are 20 to 24 Years (316 | 12.9%) for men and 10 to 14 Years (226 | 8.5%) for women.
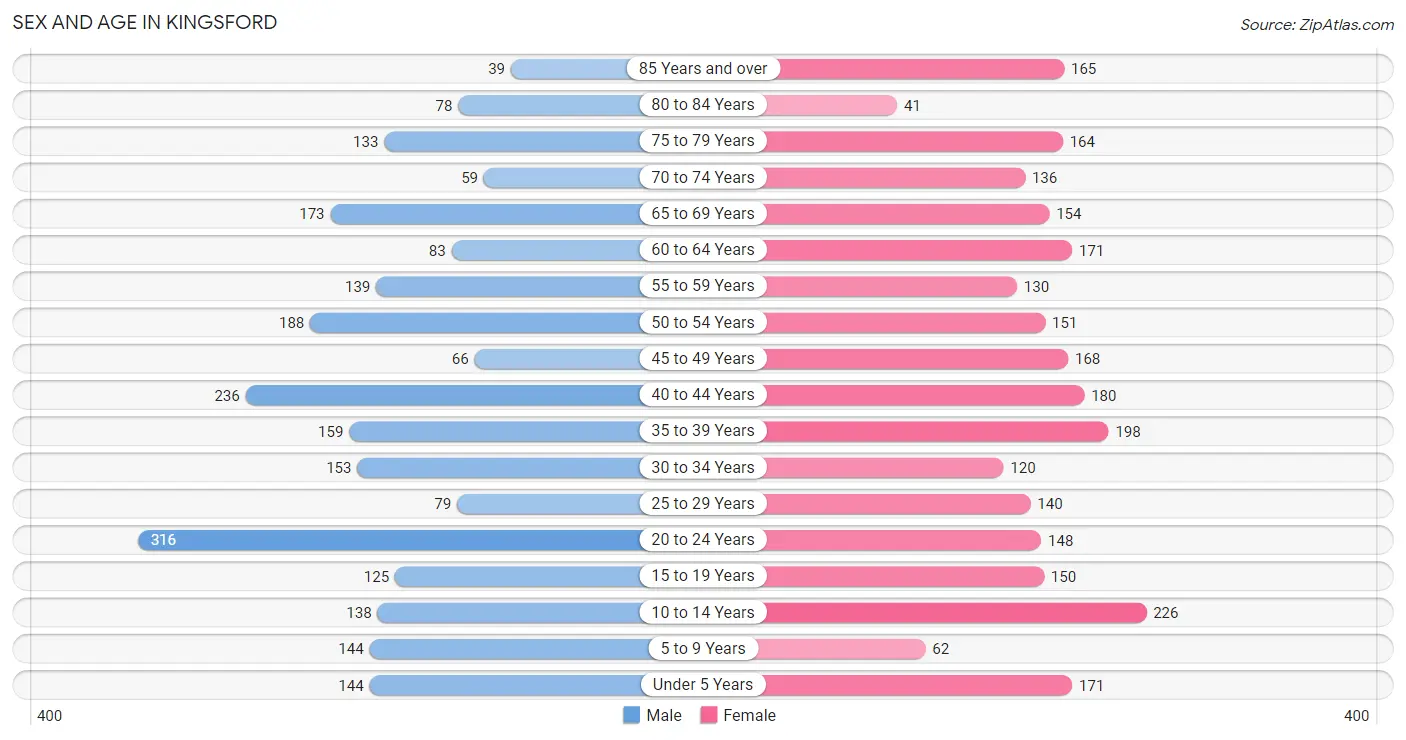
| Age Bracket | Male | Female |
| Under 5 Years | 144 (5.9%) | 171 (6.4%) |
| 5 to 9 Years | 144 (5.9%) | 62 (2.3%) |
| 10 to 14 Years | 138 (5.6%) | 226 (8.5%) |
| 15 to 19 Years | 125 (5.1%) | 150 (5.6%) |
| 20 to 24 Years | 316 (12.9%) | 148 (5.5%) |
| 25 to 29 Years | 79 (3.2%) | 140 (5.2%) |
| 30 to 34 Years | 153 (6.2%) | 120 (4.5%) |
| 35 to 39 Years | 159 (6.5%) | 198 (7.4%) |
| 40 to 44 Years | 236 (9.6%) | 180 (6.7%) |
| 45 to 49 Years | 66 (2.7%) | 168 (6.3%) |
| 50 to 54 Years | 188 (7.7%) | 151 (5.6%) |
| 55 to 59 Years | 139 (5.7%) | 130 (4.9%) |
| 60 to 64 Years | 83 (3.4%) | 171 (6.4%) |
| 65 to 69 Years | 173 (7.1%) | 154 (5.8%) |
| 70 to 74 Years | 59 (2.4%) | 136 (5.1%) |
| 75 to 79 Years | 133 (5.4%) | 164 (6.1%) |
| 80 to 84 Years | 78 (3.2%) | 41 (1.5%) |
| 85 Years and over | 39 (1.6%) | 165 (6.2%) |
| Total | 2,452 (100.0%) | 2,675 (100.0%) |
Families and Households in Kingsford
Median Family Size in Kingsford
The median family size in Kingsford is 2.74 persons per family, with married-couple families (999 | 71.9%) accounting for the largest median family size of 2.98 persons per family. On the other hand, single male/father families (110 | 7.9%) represent the smallest median family size with 1.99 persons per family.
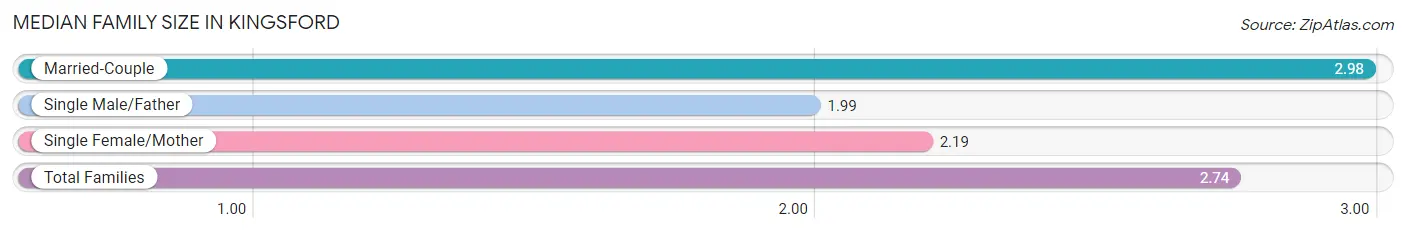
| Family Type | # Families | Family Size |
| Married-Couple | 999 (71.9%) | 2.98 |
| Single Male/Father | 110 (7.9%) | 1.99 |
| Single Female/Mother | 281 (20.2%) | 2.19 |
| Total Families | 1,390 (100.0%) | 2.74 |
Median Household Size in Kingsford
The median household size in Kingsford is 2.24 persons per household, with married-couple households (999 | 45.0%) accounting for the largest median household size of 2.98 persons per household. non-family households (829 | 37.4%) represent the smallest median household size with 1.19 persons per household.
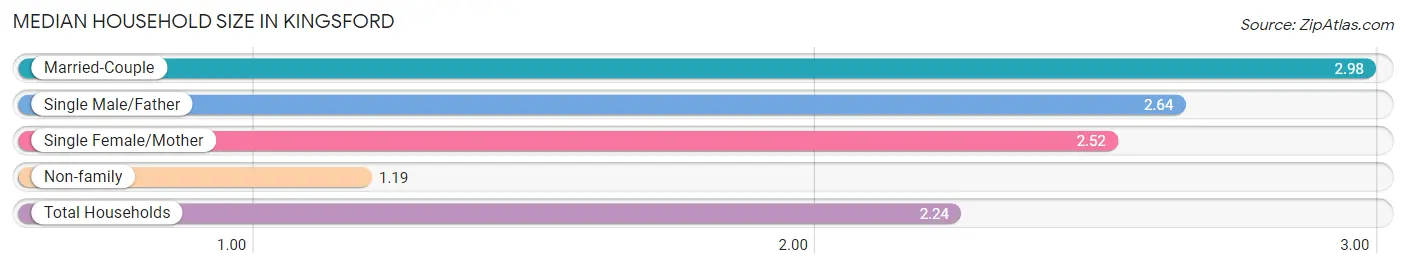
| Household Type | # Households | Household Size |
| Married-Couple | 999 (45.0%) | 2.98 |
| Single Male/Father | 110 (5.0%) | 2.64 |
| Single Female/Mother | 281 (12.7%) | 2.52 |
| Non-family | 829 (37.4%) | 1.19 |
| Total Households | 2,219 (100.0%) | 2.24 |
Household Size by Marriage Status in Kingsford
Out of a total of 2,219 households in Kingsford, 1,390 (62.6%) are family households, while 829 (37.4%) are nonfamily households. The most numerous type of family households are 2-person households, comprising 761, and the most common type of nonfamily households are 1-person households, comprising 699.
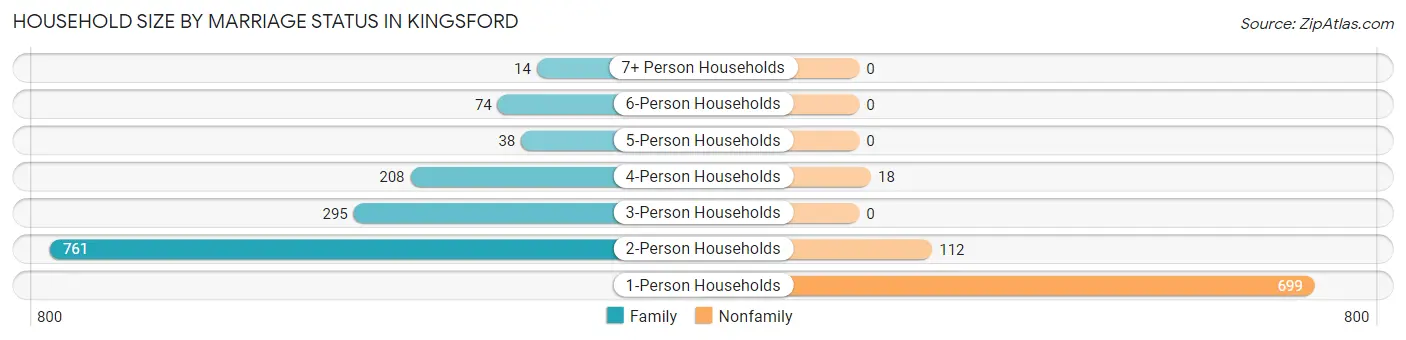
| Household Size | Family Households | Nonfamily Households |
| 1-Person Households | - | 699 (31.5%) |
| 2-Person Households | 761 (34.3%) | 112 (5.1%) |
| 3-Person Households | 295 (13.3%) | 0 (0.0%) |
| 4-Person Households | 208 (9.4%) | 18 (0.8%) |
| 5-Person Households | 38 (1.7%) | 0 (0.0%) |
| 6-Person Households | 74 (3.3%) | 0 (0.0%) |
| 7+ Person Households | 14 (0.6%) | 0 (0.0%) |
| Total | 1,390 (62.6%) | 829 (37.4%) |
Female Fertility in Kingsford
Fertility by Age in Kingsford
Average fertility rate in Kingsford is 15.0 births per 1,000 women. Women in the age bracket of 20 to 34 years have the highest fertility rate with 32.0 births per 1,000 women. Women in the age bracket of 20 to 34 years acount for 72.2% of all women with births.
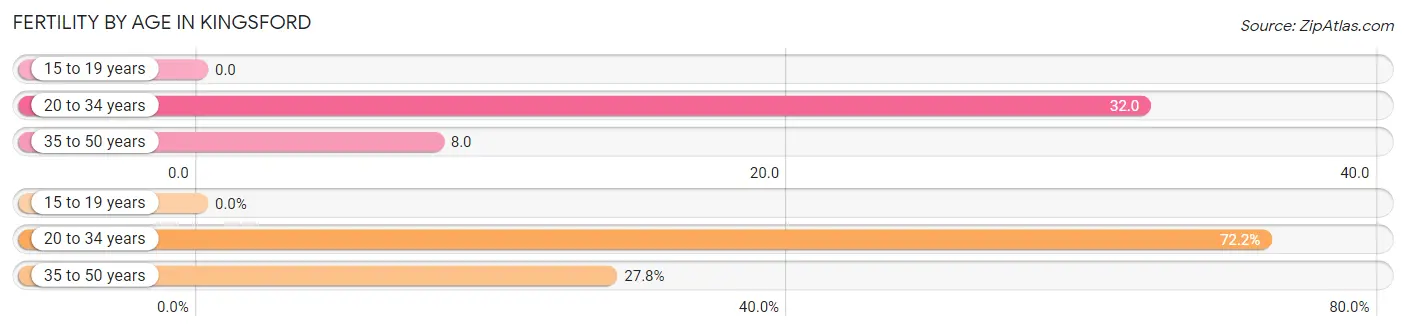
| Age Bracket | Women with Births | Births / 1,000 Women |
| 15 to 19 years | 0 (0.0%) | 0.0 |
| 20 to 34 years | 13 (72.2%) | 32.0 |
| 35 to 50 years | 5 (27.8%) | 8.0 |
| Total | 18 (100.0%) | 15.0 |
Fertility by Age by Marriage Status in Kingsford
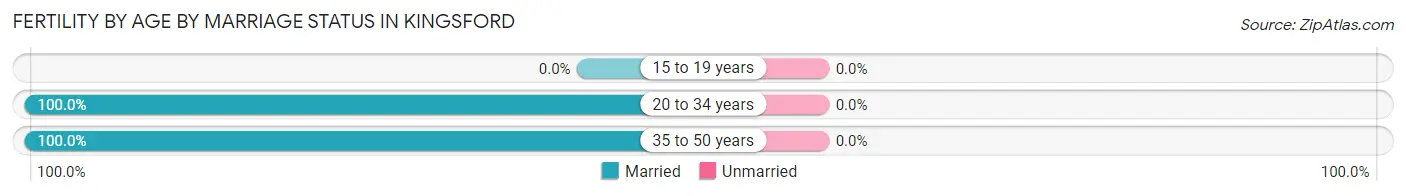
| Age Bracket | Married | Unmarried |
| 15 to 19 years | 0 (0.0%) | 0 (0.0%) |
| 20 to 34 years | 13 (100.0%) | 0 (0.0%) |
| 35 to 50 years | 5 (100.0%) | 0 (0.0%) |
| Total | 18 (100.0%) | 0 (0.0%) |
Fertility by Education in Kingsford
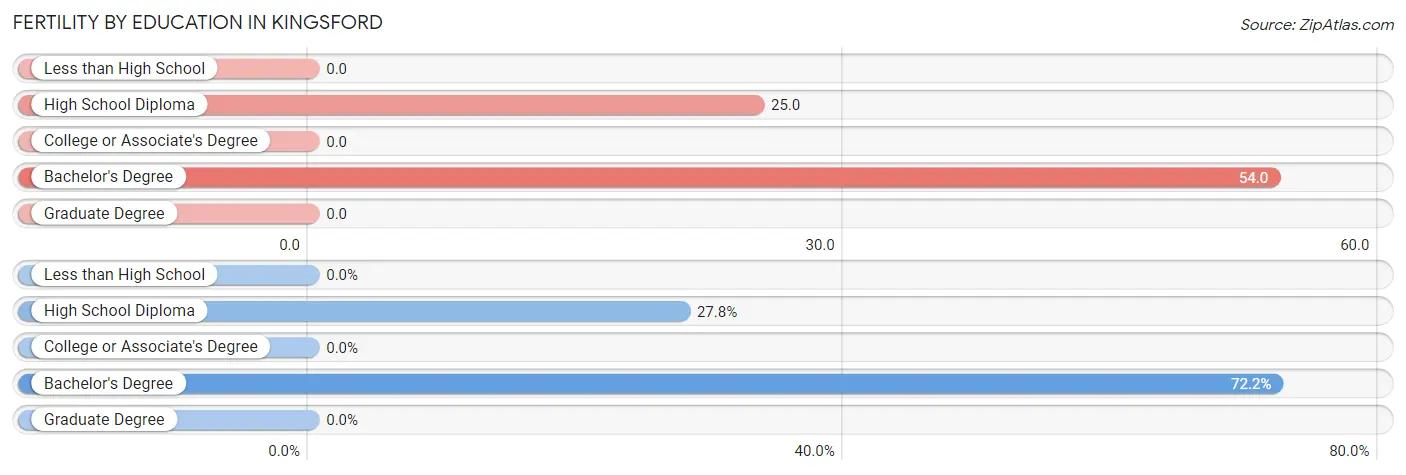
| Educational Attainment | Women with Births | Births / 1,000 Women |
| Less than High School | 0 (0.0%) | 0.0 |
| High School Diploma | 5 (27.8%) | 25.0 |
| College or Associate's Degree | 0 (0.0%) | 0.0 |
| Bachelor's Degree | 13 (72.2%) | 54.0 |
| Graduate Degree | 0 (0.0%) | 0.0 |
| Total | 18 (100.0%) | 15.0 |
Fertility by Education by Marriage Status in Kingsford
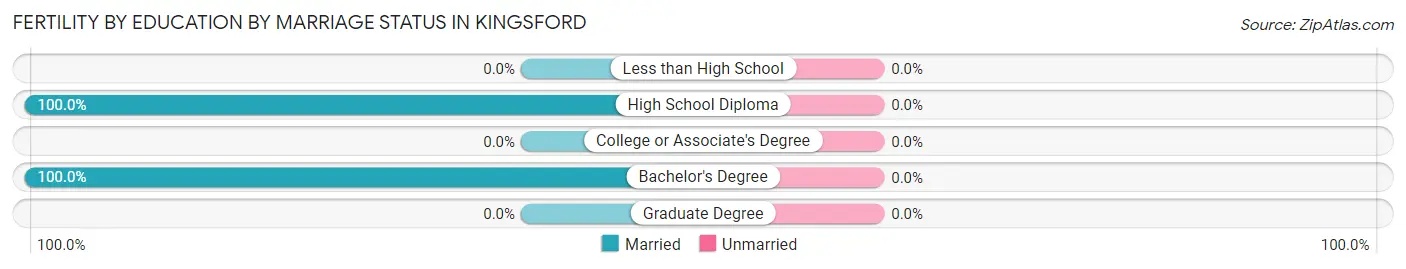
| Educational Attainment | Married | Unmarried |
| Less than High School | 0 (0.0%) | 0 (0.0%) |
| High School Diploma | 5 (100.0%) | 0 (0.0%) |
| College or Associate's Degree | 0 (0.0%) | 0 (0.0%) |
| Bachelor's Degree | 13 (100.0%) | 0 (0.0%) |
| Graduate Degree | 0 (0.0%) | 0 (0.0%) |
| Total | 18 (100.0%) | 0 (0.0%) |
Employment Characteristics in Kingsford
Employment by Class of Employer in Kingsford
Among the 2,426 employed individuals in Kingsford, private company employees (1,697 | 70.0%), not-for-profit organizations (276 | 11.4%), and local government employees (185 | 7.6%) make up the most common classes of employment.
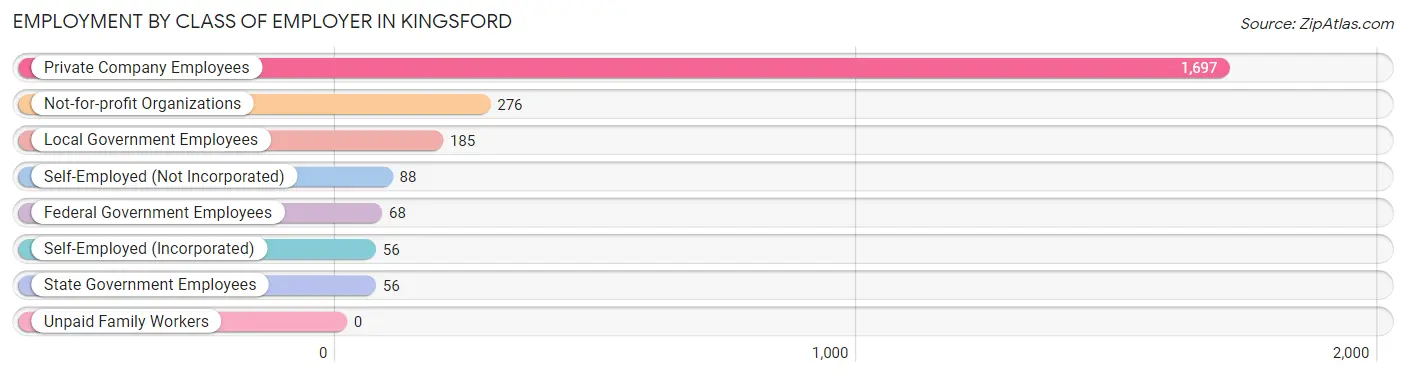
| Employer Class | # Employees | % Employees |
| Private Company Employees | 1,697 | 70.0% |
| Self-Employed (Incorporated) | 56 | 2.3% |
| Self-Employed (Not Incorporated) | 88 | 3.6% |
| Not-for-profit Organizations | 276 | 11.4% |
| Local Government Employees | 185 | 7.6% |
| State Government Employees | 56 | 2.3% |
| Federal Government Employees | 68 | 2.8% |
| Unpaid Family Workers | 0 | 0.0% |
| Total | 2,426 | 100.0% |
Employment Status by Age in Kingsford
According to the labor force statistics for Kingsford, out of the total population over 16 years of age (4,186), 61.1% or 2,558 individuals are in the labor force, with 3.6% or 92 of them unemployed. The age group with the highest labor force participation rate is 35 to 44 years, with 92.5% or 715 individuals in the labor force. Within the labor force, the 65 to 74 years age range has the highest percentage of unemployed individuals, with 40.6% or 28 of them being unemployed.
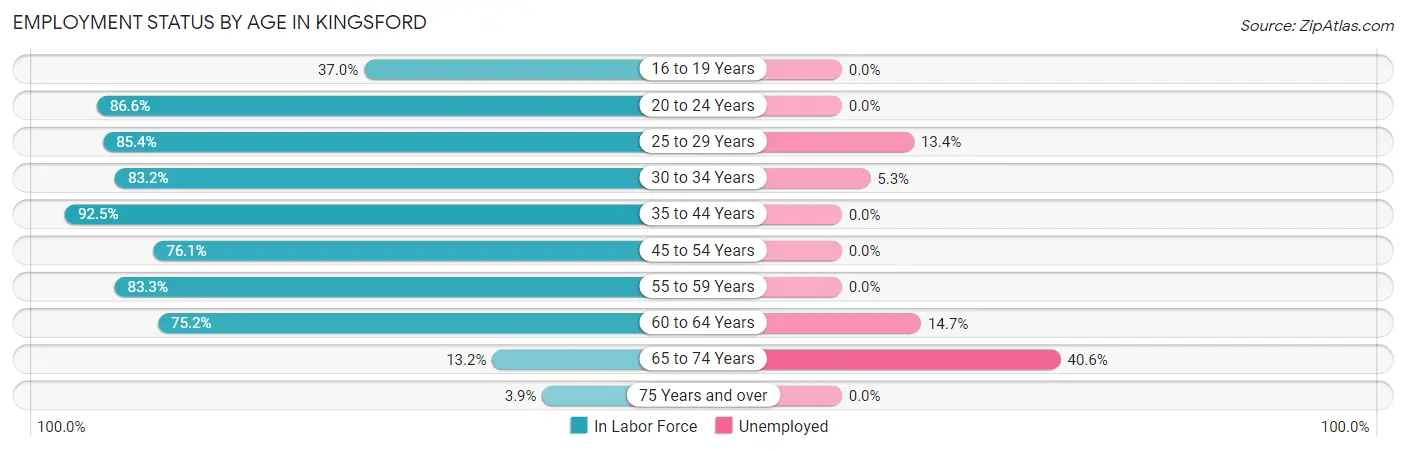
| Age Bracket | In Labor Force | Unemployed |
| 16 to 19 Years | 81 (37.0%) | 0 (0.0%) |
| 20 to 24 Years | 402 (86.6%) | 0 (0.0%) |
| 25 to 29 Years | 187 (85.4%) | 25 (13.4%) |
| 30 to 34 Years | 227 (83.2%) | 12 (5.3%) |
| 35 to 44 Years | 715 (92.5%) | 0 (0.0%) |
| 45 to 54 Years | 436 (76.1%) | 0 (0.0%) |
| 55 to 59 Years | 224 (83.3%) | 0 (0.0%) |
| 60 to 64 Years | 191 (75.2%) | 28 (14.7%) |
| 65 to 74 Years | 69 (13.2%) | 28 (40.6%) |
| 75 Years and over | 24 (3.9%) | 0 (0.0%) |
| Total | 2,558 (61.1%) | 92 (3.6%) |
Employment Status by Educational Attainment in Kingsford
According to labor force statistics for Kingsford, 83.9% of individuals (1,981) out of the total population between 25 and 64 years of age (2,361) are in the labor force, with 3.3% or 65 of them being unemployed. The group with the highest labor force participation rate are those with the educational attainment of bachelor's degree or higher, with 98.9% or 632 individuals in the labor force. Within the labor force, individuals with high school diploma education have the highest percentage of unemployment, with 4.9% or 28 of them being unemployed.
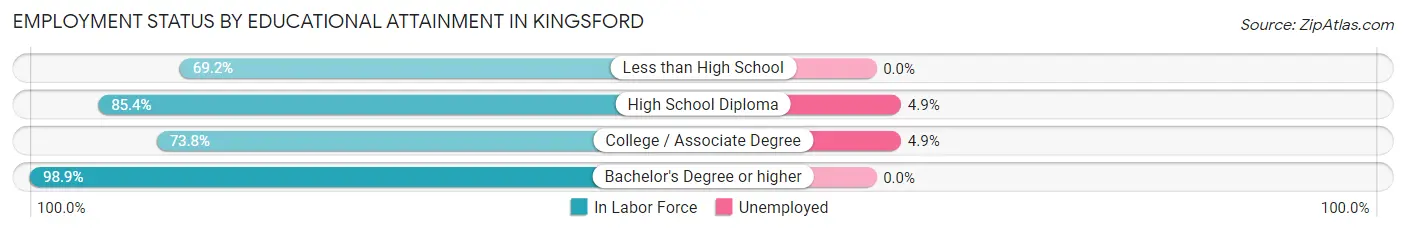
| Educational Attainment | In Labor Force | Unemployed |
| Less than High School | 18 (69.2%) | 0 (0.0%) |
| High School Diploma | 574 (85.4%) | 33 (4.9%) |
| College / Associate Degree | 756 (73.8%) | 50 (4.9%) |
| Bachelor's Degree or higher | 632 (98.9%) | 0 (0.0%) |
| Total | 1,981 (83.9%) | 78 (3.3%) |
Employment Occupations by Sex in Kingsford
Management, Business, Science and Arts Occupations
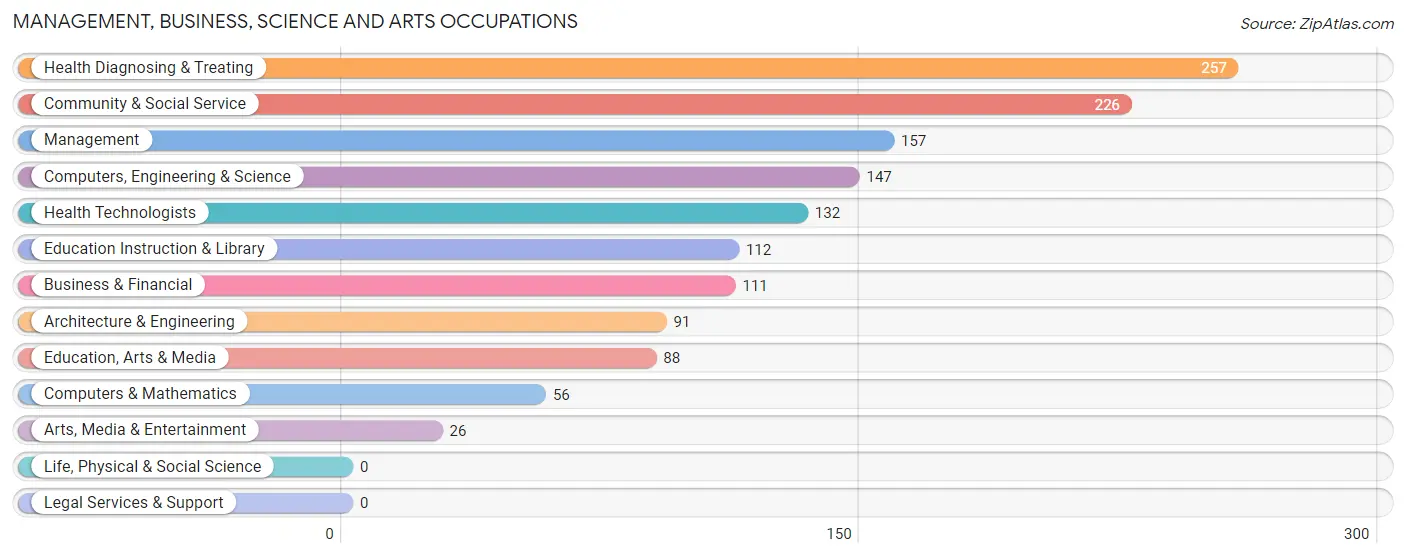
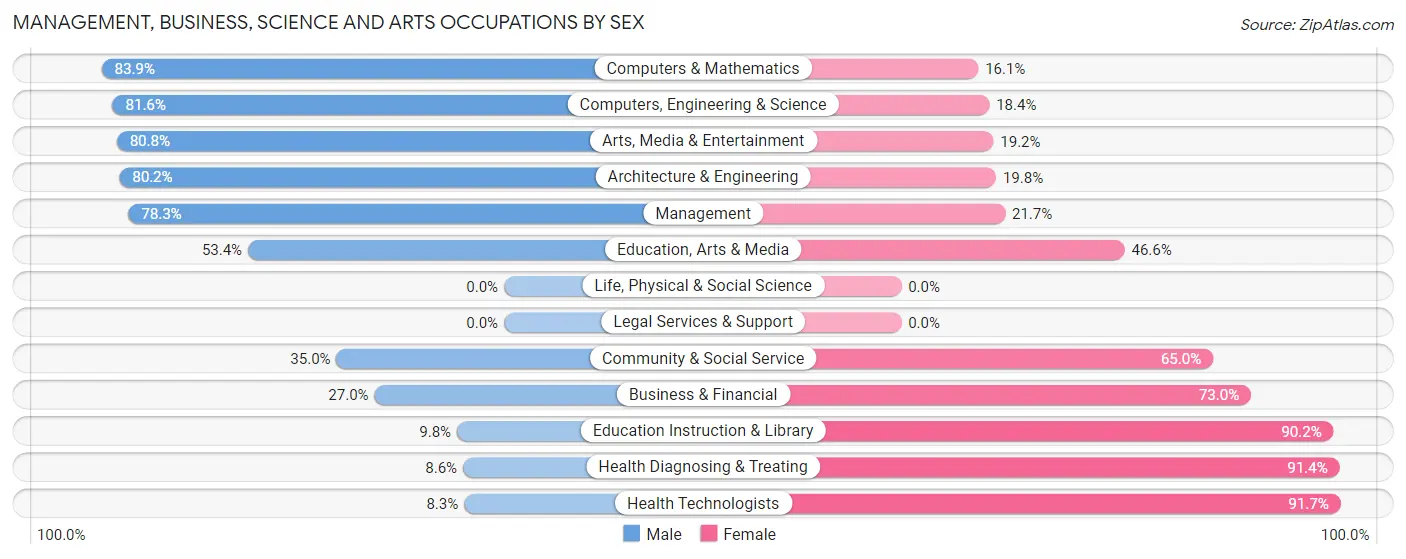
The most common Management, Business, Science and Arts occupations in Kingsford are Health Diagnosing & Treating (257 | 10.4%), Community & Social Service (226 | 9.2%), Management (157 | 6.4%), Computers, Engineering & Science (147 | 6.0%), and Health Technologists (132 | 5.4%).
Management, Business, Science and Arts Occupations by Sex
Within the Management, Business, Science and Arts occupations in Kingsford, the most male-oriented occupations are Computers & Mathematics (83.9%), Computers, Engineering & Science (81.6%), and Arts, Media & Entertainment (80.8%), while the most female-oriented occupations are Health Technologists (91.7%), Health Diagnosing & Treating (91.4%), and Education Instruction & Library (90.2%).
| Occupation | Male | Female |
| Management | 123 (78.3%) | 34 (21.7%) |
| Business & Financial | 30 (27.0%) | 81 (73.0%) |
| Computers, Engineering & Science | 120 (81.6%) | 27 (18.4%) |
| Computers & Mathematics | 47 (83.9%) | 9 (16.1%) |
| Architecture & Engineering | 73 (80.2%) | 18 (19.8%) |
| Life, Physical & Social Science | 0 (0.0%) | 0 (0.0%) |
| Community & Social Service | 79 (35.0%) | 147 (65.0%) |
| Education, Arts & Media | 47 (53.4%) | 41 (46.6%) |
| Legal Services & Support | 0 (0.0%) | 0 (0.0%) |
| Education Instruction & Library | 11 (9.8%) | 101 (90.2%) |
| Arts, Media & Entertainment | 21 (80.8%) | 5 (19.2%) |
| Health Diagnosing & Treating | 22 (8.6%) | 235 (91.4%) |
| Health Technologists | 11 (8.3%) | 121 (91.7%) |
| Total (Category) | 374 (41.6%) | 524 (58.4%) |
| Total (Overall) | 1,361 (55.3%) | 1,102 (44.7%) |
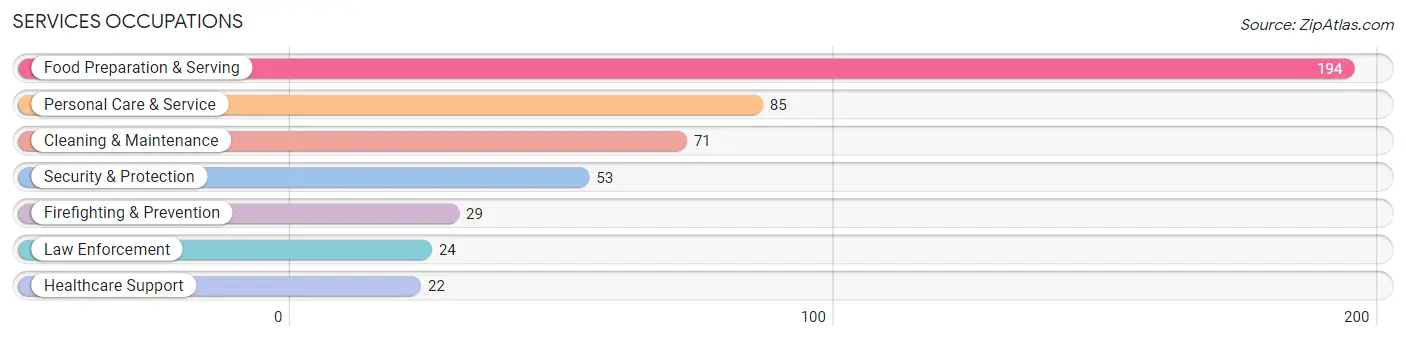
Services Occupations
The most common Services occupations in Kingsford are Food Preparation & Serving (194 | 7.9%), Personal Care & Service (85 | 3.5%), Cleaning & Maintenance (71 | 2.9%), Security & Protection (53 | 2.1%), and Firefighting & Prevention (29 | 1.2%).
Services Occupations by Sex
Within the Services occupations in Kingsford, the most male-oriented occupations are Law Enforcement (100.0%), Personal Care & Service (97.7%), and Security & Protection (83.0%), while the most female-oriented occupations are Healthcare Support (100.0%), Food Preparation & Serving (63.4%), and Cleaning & Maintenance (35.2%).
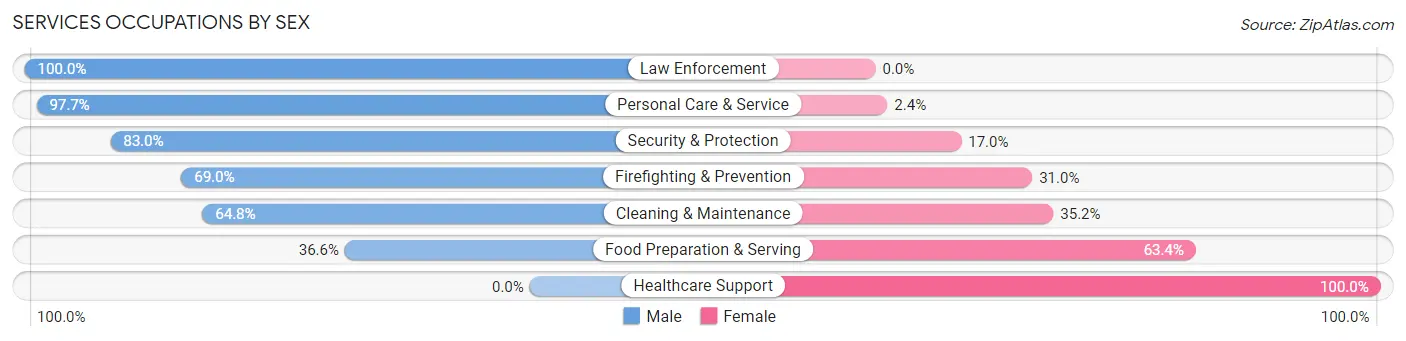
| Occupation | Male | Female |
| Healthcare Support | 0 (0.0%) | 22 (100.0%) |
| Security & Protection | 44 (83.0%) | 9 (17.0%) |
| Firefighting & Prevention | 20 (69.0%) | 9 (31.0%) |
| Law Enforcement | 24 (100.0%) | 0 (0.0%) |
| Food Preparation & Serving | 71 (36.6%) | 123 (63.4%) |
| Cleaning & Maintenance | 46 (64.8%) | 25 (35.2%) |
| Personal Care & Service | 83 (97.7%) | 2 (2.4%) |
| Total (Category) | 244 (57.4%) | 181 (42.6%) |
| Total (Overall) | 1,361 (55.3%) | 1,102 (44.7%) |
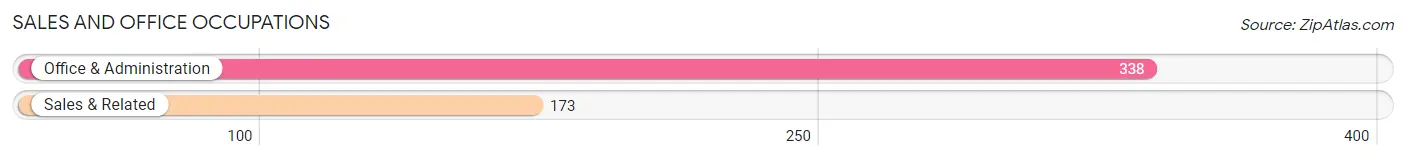
Sales and Office Occupations
The most common Sales and Office occupations in Kingsford are Office & Administration (338 | 13.7%), and Sales & Related (173 | 7.0%).
Sales and Office Occupations by Sex
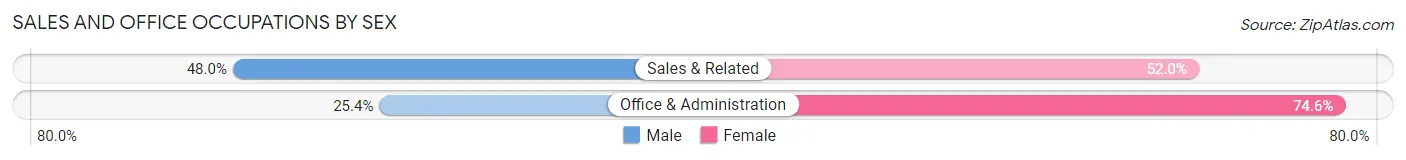
| Occupation | Male | Female |
| Sales & Related | 83 (48.0%) | 90 (52.0%) |
| Office & Administration | 86 (25.4%) | 252 (74.6%) |
| Total (Category) | 169 (33.1%) | 342 (66.9%) |
| Total (Overall) | 1,361 (55.3%) | 1,102 (44.7%) |
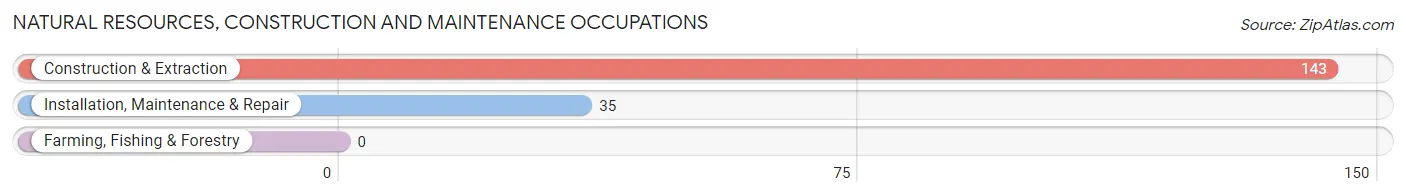
Natural Resources, Construction and Maintenance Occupations
The most common Natural Resources, Construction and Maintenance occupations in Kingsford are Construction & Extraction (143 | 5.8%), and Installation, Maintenance & Repair (35 | 1.4%).
Natural Resources, Construction and Maintenance Occupations by Sex
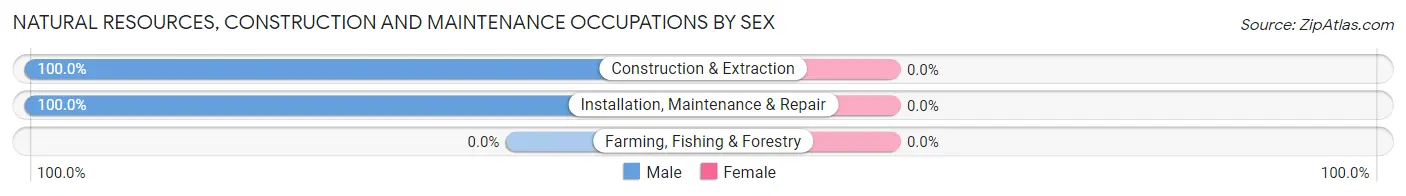
| Occupation | Male | Female |
| Farming, Fishing & Forestry | 0 (0.0%) | 0 (0.0%) |
| Construction & Extraction | 143 (100.0%) | 0 (0.0%) |
| Installation, Maintenance & Repair | 35 (100.0%) | 0 (0.0%) |
| Total (Category) | 178 (100.0%) | 0 (0.0%) |
| Total (Overall) | 1,361 (55.3%) | 1,102 (44.7%) |
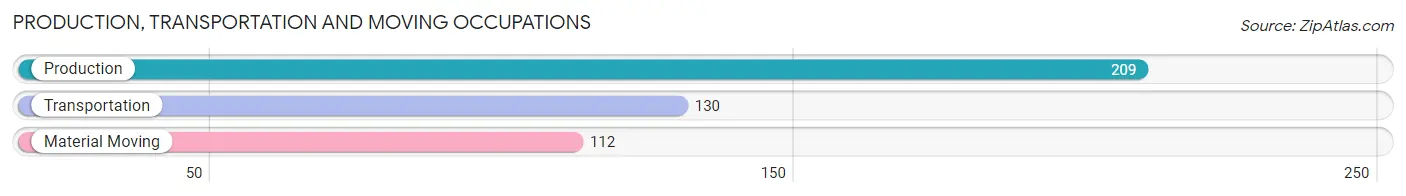
Production, Transportation and Moving Occupations
The most common Production, Transportation and Moving occupations in Kingsford are Production (209 | 8.5%), Transportation (130 | 5.3%), and Material Moving (112 | 4.5%).
Production, Transportation and Moving Occupations by Sex
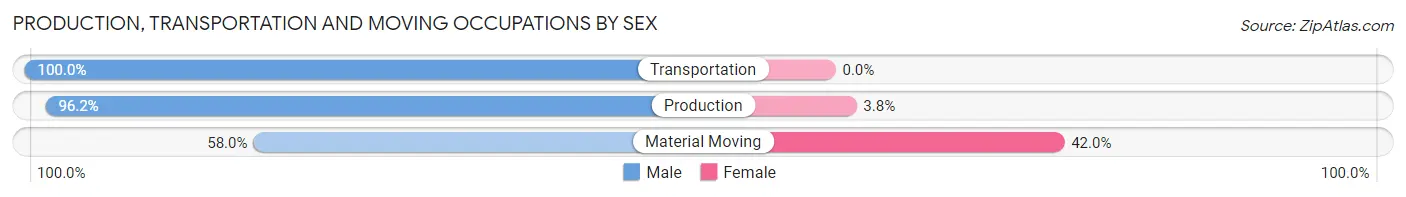
| Occupation | Male | Female |
| Production | 201 (96.2%) | 8 (3.8%) |
| Transportation | 130 (100.0%) | 0 (0.0%) |
| Material Moving | 65 (58.0%) | 47 (42.0%) |
| Total (Category) | 396 (87.8%) | 55 (12.2%) |
| Total (Overall) | 1,361 (55.3%) | 1,102 (44.7%) |
Employment Industries by Sex in Kingsford
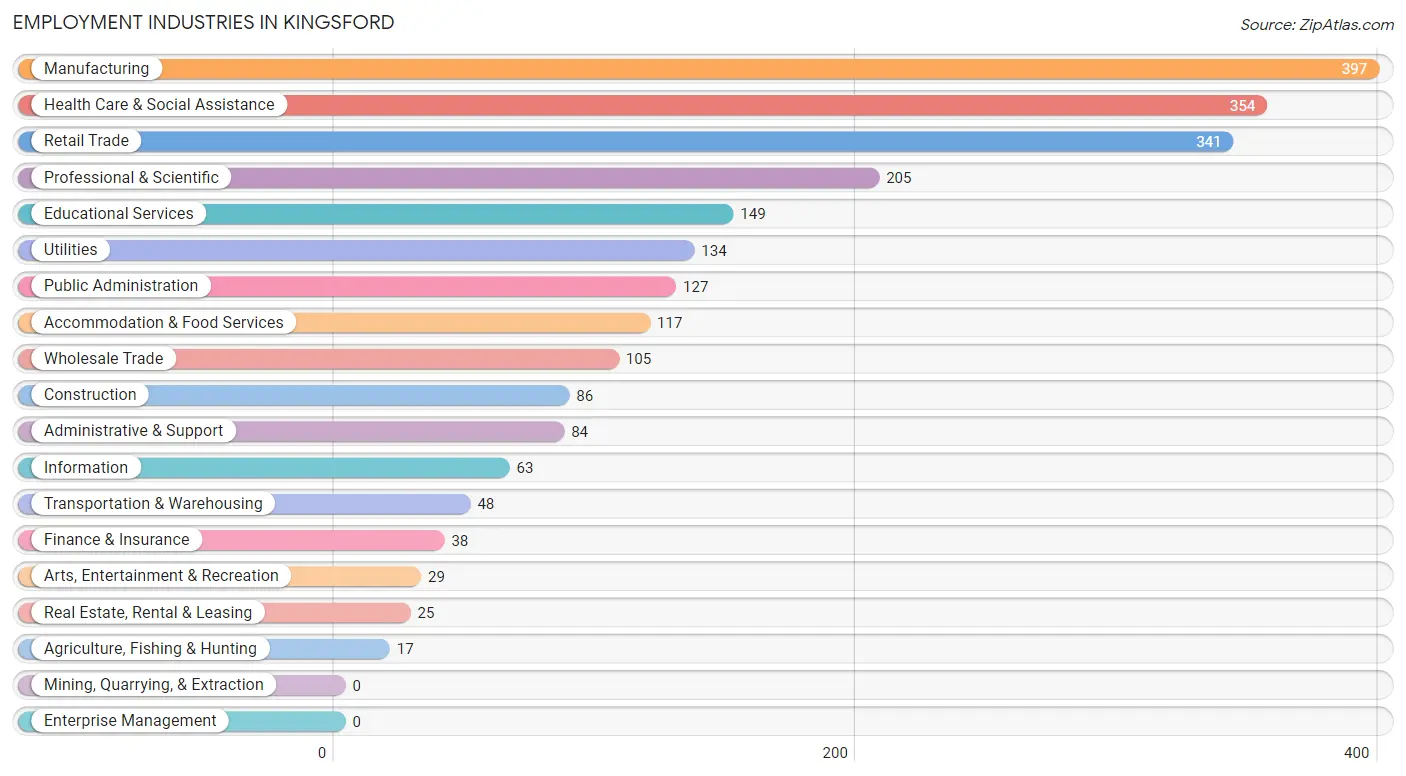
Employment Industries in Kingsford
The major employment industries in Kingsford include Manufacturing (397 | 16.1%), Health Care & Social Assistance (354 | 14.4%), Retail Trade (341 | 13.8%), Professional & Scientific (205 | 8.3%), and Educational Services (149 | 6.0%).
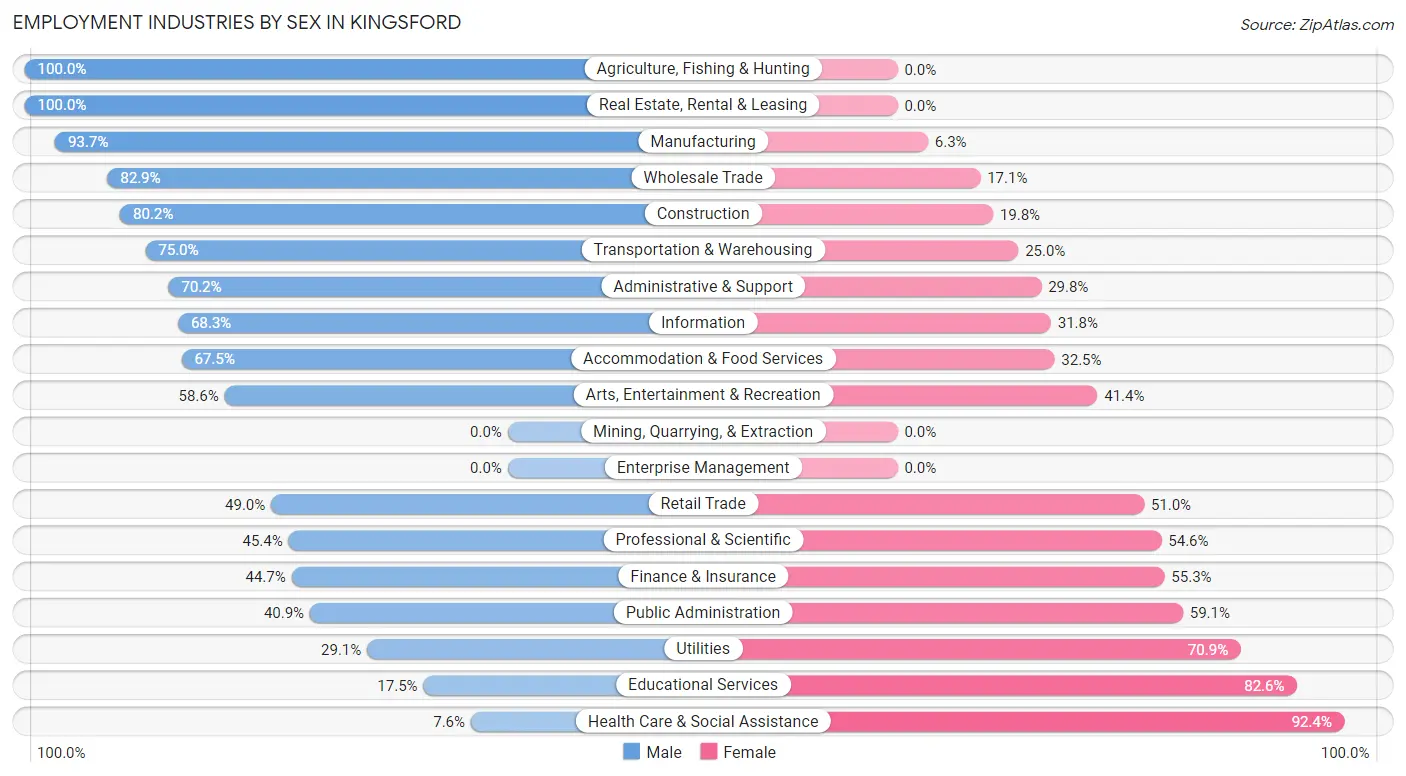
Employment Industries by Sex in Kingsford
The Kingsford industries that see more men than women are Agriculture, Fishing & Hunting (100.0%), Real Estate, Rental & Leasing (100.0%), and Manufacturing (93.7%), whereas the industries that tend to have a higher number of women are Health Care & Social Assistance (92.4%), Educational Services (82.6%), and Utilities (70.9%).
| Industry | Male | Female |
| Agriculture, Fishing & Hunting | 17 (100.0%) | 0 (0.0%) |
| Mining, Quarrying, & Extraction | 0 (0.0%) | 0 (0.0%) |
| Construction | 69 (80.2%) | 17 (19.8%) |
| Manufacturing | 372 (93.7%) | 25 (6.3%) |
| Wholesale Trade | 87 (82.9%) | 18 (17.1%) |
| Retail Trade | 167 (49.0%) | 174 (51.0%) |
| Transportation & Warehousing | 36 (75.0%) | 12 (25.0%) |
| Utilities | 39 (29.1%) | 95 (70.9%) |
| Information | 43 (68.2%) | 20 (31.8%) |
| Finance & Insurance | 17 (44.7%) | 21 (55.3%) |
| Real Estate, Rental & Leasing | 25 (100.0%) | 0 (0.0%) |
| Professional & Scientific | 93 (45.4%) | 112 (54.6%) |
| Enterprise Management | 0 (0.0%) | 0 (0.0%) |
| Administrative & Support | 59 (70.2%) | 25 (29.8%) |
| Educational Services | 26 (17.4%) | 123 (82.6%) |
| Health Care & Social Assistance | 27 (7.6%) | 327 (92.4%) |
| Arts, Entertainment & Recreation | 17 (58.6%) | 12 (41.4%) |
| Accommodation & Food Services | 79 (67.5%) | 38 (32.5%) |
| Public Administration | 52 (40.9%) | 75 (59.1%) |
| Total | 1,361 (55.3%) | 1,102 (44.7%) |
Education in Kingsford
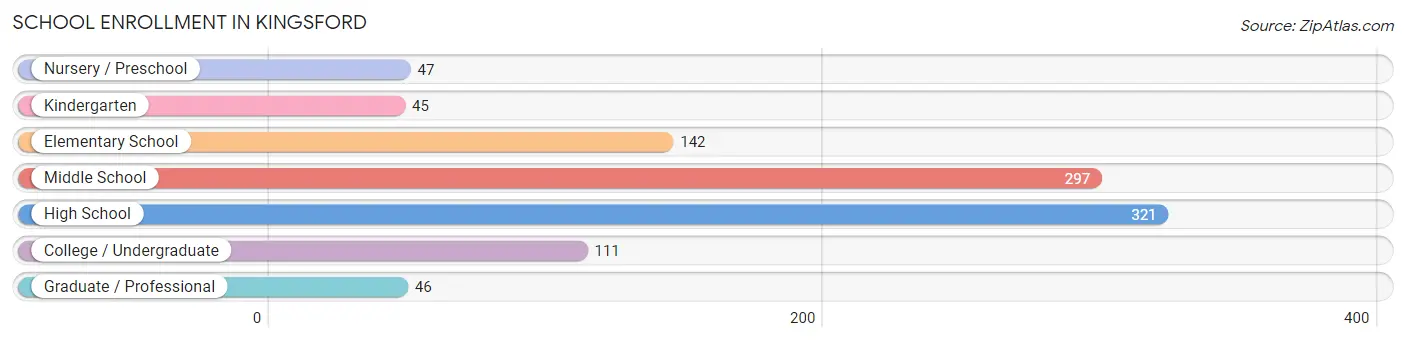
School Enrollment in Kingsford
The most common levels of schooling among the 1,009 students in Kingsford are high school (321 | 31.8%), middle school (297 | 29.4%), and elementary school (142 | 14.1%).
| School Level | # Students | % Students |
| Nursery / Preschool | 47 | 4.7% |
| Kindergarten | 45 | 4.5% |
| Elementary School | 142 | 14.1% |
| Middle School | 297 | 29.4% |
| High School | 321 | 31.8% |
| College / Undergraduate | 111 | 11.0% |
| Graduate / Professional | 46 | 4.6% |
| Total | 1,009 | 100.0% |
School Enrollment by Age by Funding Source in Kingsford
Out of a total of 1,009 students who are enrolled in schools in Kingsford, 80 (7.9%) attend a private institution, while the remaining 929 (92.1%) are enrolled in public schools. The age group of 25 to 34 year olds has the highest likelihood of being enrolled in private schools, with 13 (40.6% in the age bracket) enrolled. Conversely, the age group of 3 to 4 year olds has the lowest likelihood of being enrolled in a private school, with 35 (100.0% in the age bracket) attending a public institution.
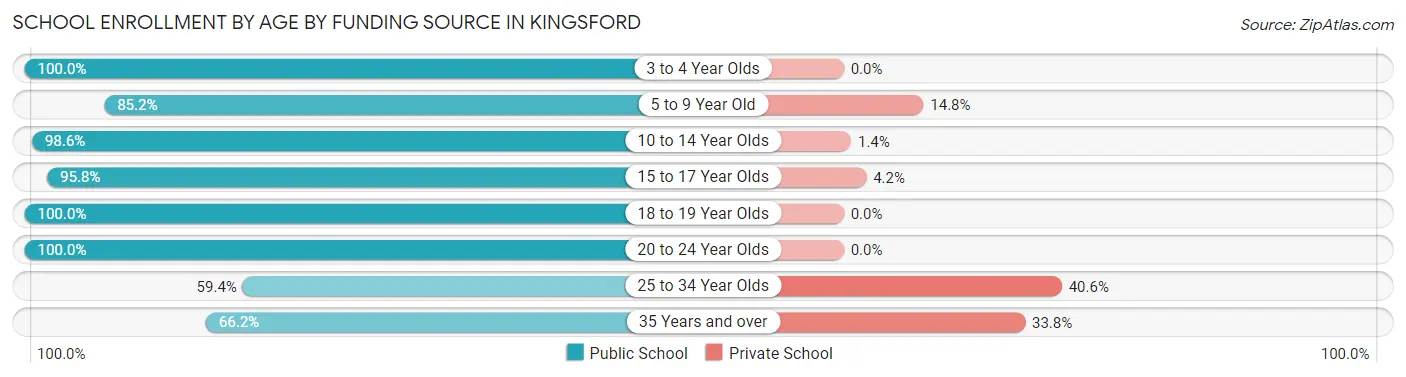
| Age Bracket | Public School | Private School |
| 3 to 4 Year Olds | 35 (100.0%) | 0 (0.0%) |
| 5 to 9 Year Old | 155 (85.2%) | 27 (14.8%) |
| 10 to 14 Year Olds | 359 (98.6%) | 5 (1.4%) |
| 15 to 17 Year Olds | 228 (95.8%) | 10 (4.2%) |
| 18 to 19 Year Olds | 37 (100.0%) | 0 (0.0%) |
| 20 to 24 Year Olds | 47 (100.0%) | 0 (0.0%) |
| 25 to 34 Year Olds | 19 (59.4%) | 13 (40.6%) |
| 35 Years and over | 49 (66.2%) | 25 (33.8%) |
| Total | 929 (92.1%) | 80 (7.9%) |
Educational Attainment by Field of Study in Kingsford
Science & technology (161 | 17.2%), education (156 | 16.6%), business (149 | 15.9%), social sciences (85 | 9.1%), and arts & humanities (81 | 8.6%) are the most common fields of study among 938 individuals in Kingsford who have obtained a bachelor's degree or higher.
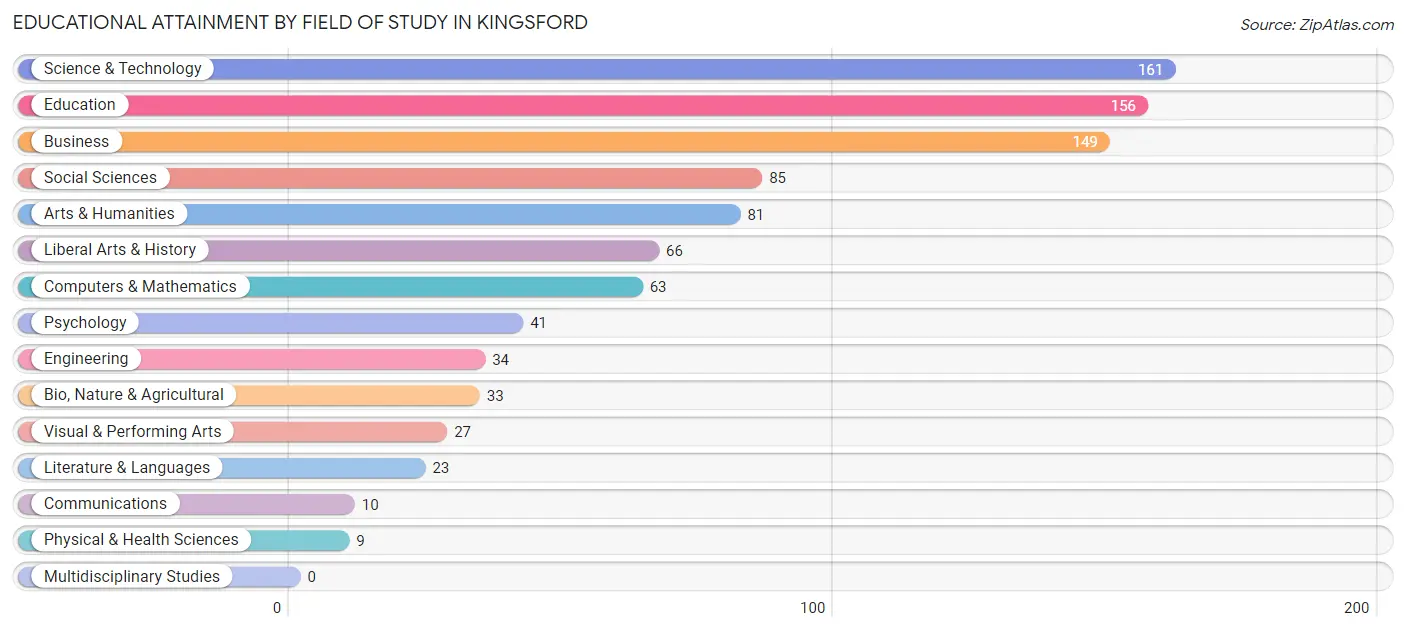
| Field of Study | # Graduates | % Graduates |
| Computers & Mathematics | 63 | 6.7% |
| Bio, Nature & Agricultural | 33 | 3.5% |
| Physical & Health Sciences | 9 | 1.0% |
| Psychology | 41 | 4.4% |
| Social Sciences | 85 | 9.1% |
| Engineering | 34 | 3.6% |
| Multidisciplinary Studies | 0 | 0.0% |
| Science & Technology | 161 | 17.2% |
| Business | 149 | 15.9% |
| Education | 156 | 16.6% |
| Literature & Languages | 23 | 2.5% |
| Liberal Arts & History | 66 | 7.0% |
| Visual & Performing Arts | 27 | 2.9% |
| Communications | 10 | 1.1% |
| Arts & Humanities | 81 | 8.6% |
| Total | 938 | 100.0% |
Transportation & Commute in Kingsford
Vehicle Availability by Sex in Kingsford
The most prevalent vehicle ownership categories in Kingsford are males with 2 vehicles (675, accounting for 51.0%) and females with 2 vehicles (509, making up 62.3%).
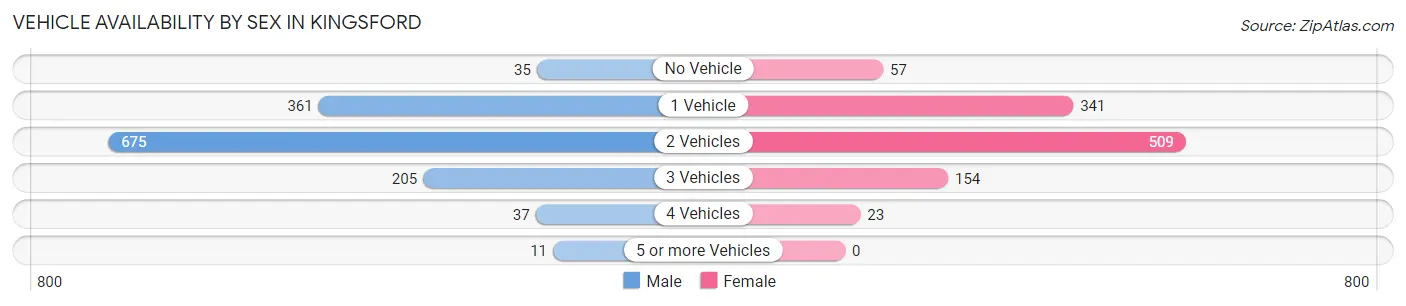
| Vehicles Available | Male | Female |
| No Vehicle | 35 (2.6%) | 57 (5.3%) |
| 1 Vehicle | 361 (27.3%) | 341 (31.5%) |
| 2 Vehicles | 675 (51.0%) | 509 (47.0%) |
| 3 Vehicles | 205 (15.5%) | 154 (14.2%) |
| 4 Vehicles | 37 (2.8%) | 23 (2.1%) |
| 5 or more Vehicles | 11 (0.8%) | 0 (0.0%) |
| Total | 1,324 (100.0%) | 1,084 (100.0%) |
Commute Time in Kingsford
The most frequently occuring commute durations in Kingsford are 5 to 9 minutes (732 commuters, 32.8%), 10 to 14 minutes (670 commuters, 30.0%), and 15 to 19 minutes (323 commuters, 14.5%).
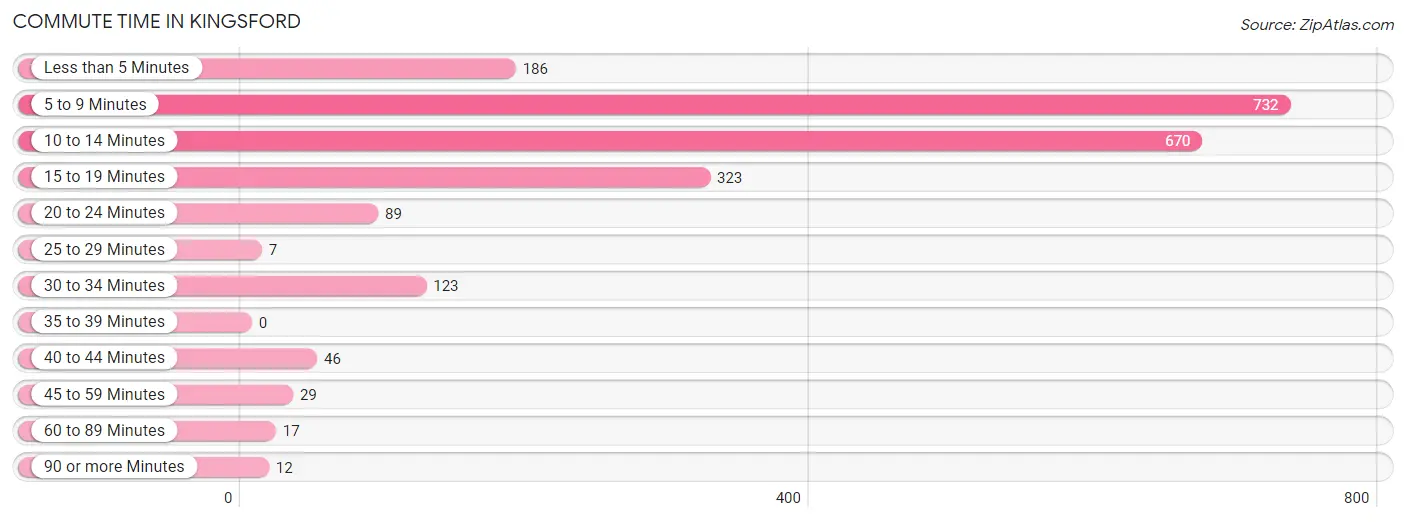
| Commute Time | # Commuters | % Commuters |
| Less than 5 Minutes | 186 | 8.3% |
| 5 to 9 Minutes | 732 | 32.8% |
| 10 to 14 Minutes | 670 | 30.0% |
| 15 to 19 Minutes | 323 | 14.5% |
| 20 to 24 Minutes | 89 | 4.0% |
| 25 to 29 Minutes | 7 | 0.3% |
| 30 to 34 Minutes | 123 | 5.5% |
| 35 to 39 Minutes | 0 | 0.0% |
| 40 to 44 Minutes | 46 | 2.1% |
| 45 to 59 Minutes | 29 | 1.3% |
| 60 to 89 Minutes | 17 | 0.8% |
| 90 or more Minutes | 12 | 0.5% |
Commute Time by Sex in Kingsford
The most common commute times in Kingsford are 5 to 9 minutes (458 commuters, 36.9%) for males and 10 to 14 minutes (297 commuters, 29.9%) for females.
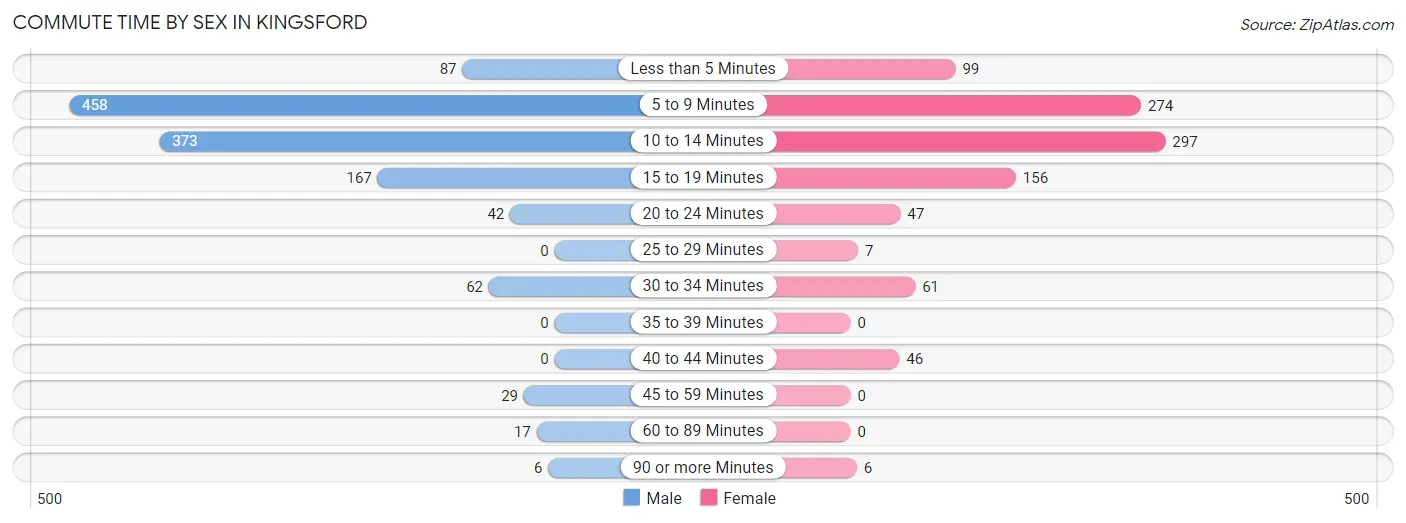
| Commute Time | Male | Female |
| Less than 5 Minutes | 87 (7.0%) | 99 (10.0%) |
| 5 to 9 Minutes | 458 (36.9%) | 274 (27.6%) |
| 10 to 14 Minutes | 373 (30.1%) | 297 (29.9%) |
| 15 to 19 Minutes | 167 (13.5%) | 156 (15.7%) |
| 20 to 24 Minutes | 42 (3.4%) | 47 (4.7%) |
| 25 to 29 Minutes | 0 (0.0%) | 7 (0.7%) |
| 30 to 34 Minutes | 62 (5.0%) | 61 (6.1%) |
| 35 to 39 Minutes | 0 (0.0%) | 0 (0.0%) |
| 40 to 44 Minutes | 0 (0.0%) | 46 (4.6%) |
| 45 to 59 Minutes | 29 (2.3%) | 0 (0.0%) |
| 60 to 89 Minutes | 17 (1.4%) | 0 (0.0%) |
| 90 or more Minutes | 6 (0.5%) | 6 (0.6%) |
Time of Departure to Work by Sex in Kingsford
The most frequent times of departure to work in Kingsford are 7:30 AM to 7:59 AM (251, 20.2%) for males and 7:30 AM to 7:59 AM (287, 28.9%) for females.
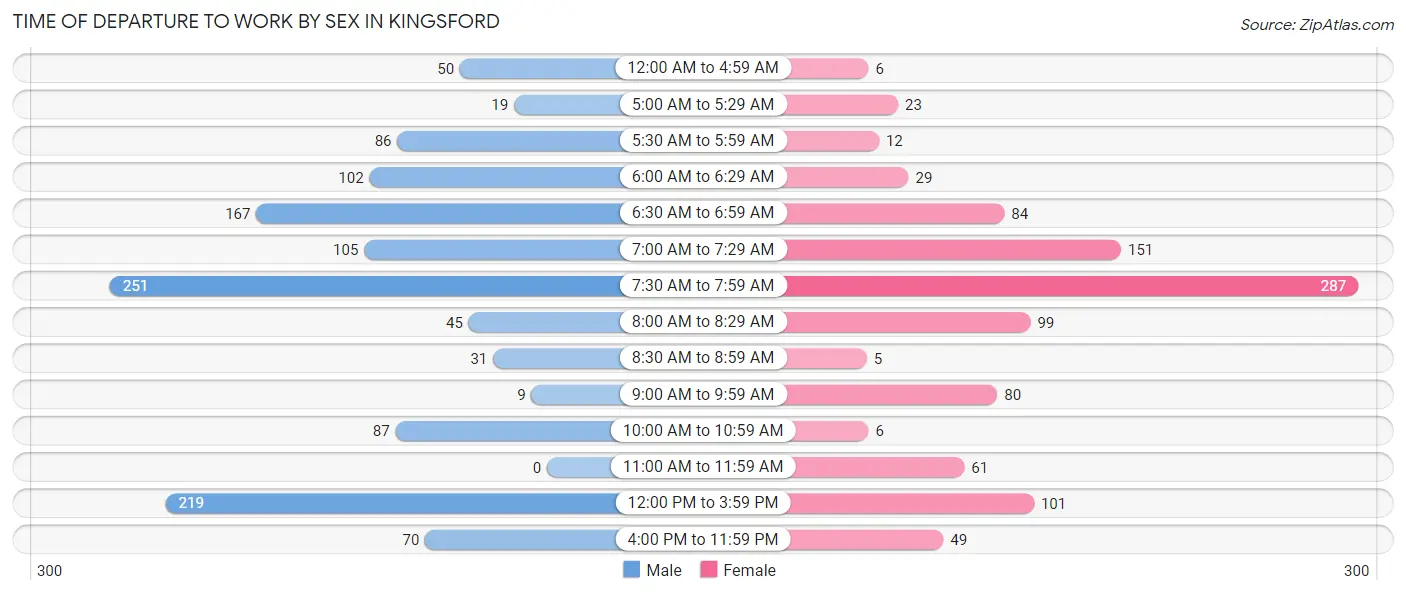
| Time of Departure | Male | Female |
| 12:00 AM to 4:59 AM | 50 (4.0%) | 6 (0.6%) |
| 5:00 AM to 5:29 AM | 19 (1.5%) | 23 (2.3%) |
| 5:30 AM to 5:59 AM | 86 (6.9%) | 12 (1.2%) |
| 6:00 AM to 6:29 AM | 102 (8.2%) | 29 (2.9%) |
| 6:30 AM to 6:59 AM | 167 (13.5%) | 84 (8.5%) |
| 7:00 AM to 7:29 AM | 105 (8.5%) | 151 (15.2%) |
| 7:30 AM to 7:59 AM | 251 (20.2%) | 287 (28.9%) |
| 8:00 AM to 8:29 AM | 45 (3.6%) | 99 (10.0%) |
| 8:30 AM to 8:59 AM | 31 (2.5%) | 5 (0.5%) |
| 9:00 AM to 9:59 AM | 9 (0.7%) | 80 (8.1%) |
| 10:00 AM to 10:59 AM | 87 (7.0%) | 6 (0.6%) |
| 11:00 AM to 11:59 AM | 0 (0.0%) | 61 (6.1%) |
| 12:00 PM to 3:59 PM | 219 (17.6%) | 101 (10.2%) |
| 4:00 PM to 11:59 PM | 70 (5.6%) | 49 (4.9%) |
| Total | 1,241 (100.0%) | 993 (100.0%) |
Housing Occupancy in Kingsford
Occupancy by Ownership in Kingsford
Of the total 2,219 dwellings in Kingsford, owner-occupied units account for 1,622 (73.1%), while renter-occupied units make up 597 (26.9%).
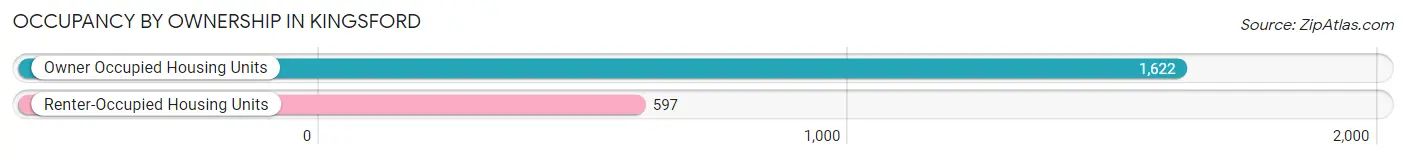
| Occupancy | # Housing Units | % Housing Units |
| Owner Occupied Housing Units | 1,622 | 73.1% |
| Renter-Occupied Housing Units | 597 | 26.9% |
| Total Occupied Housing Units | 2,219 | 100.0% |
Occupancy by Household Size in Kingsford
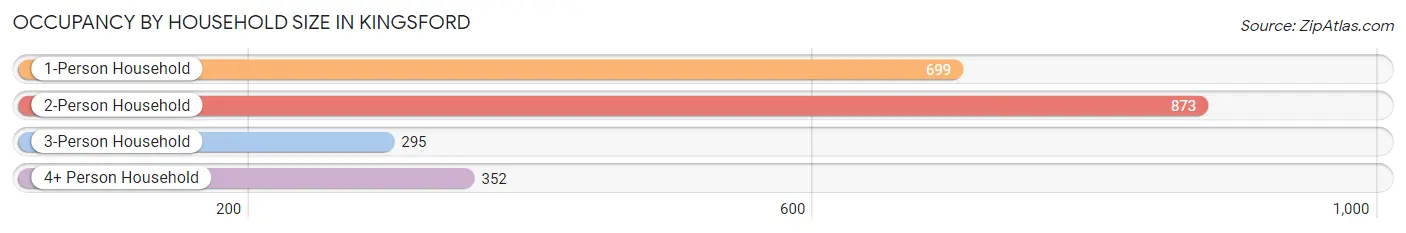
| Household Size | # Housing Units | % Housing Units |
| 1-Person Household | 699 | 31.5% |
| 2-Person Household | 873 | 39.3% |
| 3-Person Household | 295 | 13.3% |
| 4+ Person Household | 352 | 15.9% |
| Total Housing Units | 2,219 | 100.0% |
Occupancy by Ownership by Household Size in Kingsford
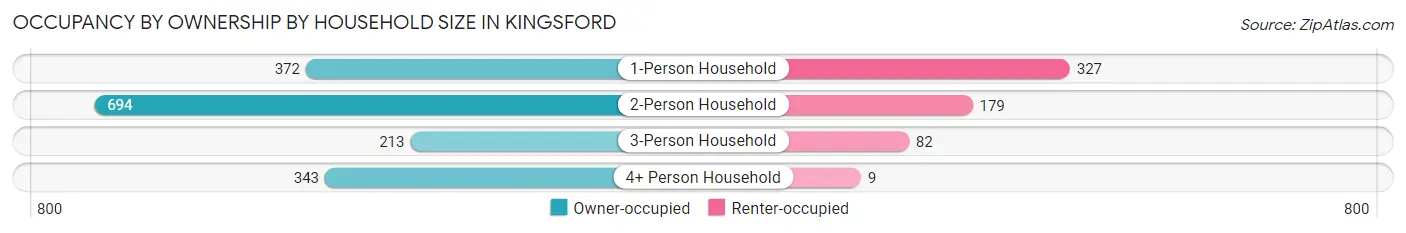
| Household Size | Owner-occupied | Renter-occupied |
| 1-Person Household | 372 (53.2%) | 327 (46.8%) |
| 2-Person Household | 694 (79.5%) | 179 (20.5%) |
| 3-Person Household | 213 (72.2%) | 82 (27.8%) |
| 4+ Person Household | 343 (97.4%) | 9 (2.6%) |
| Total Housing Units | 1,622 (73.1%) | 597 (26.9%) |
Occupancy by Educational Attainment in Kingsford
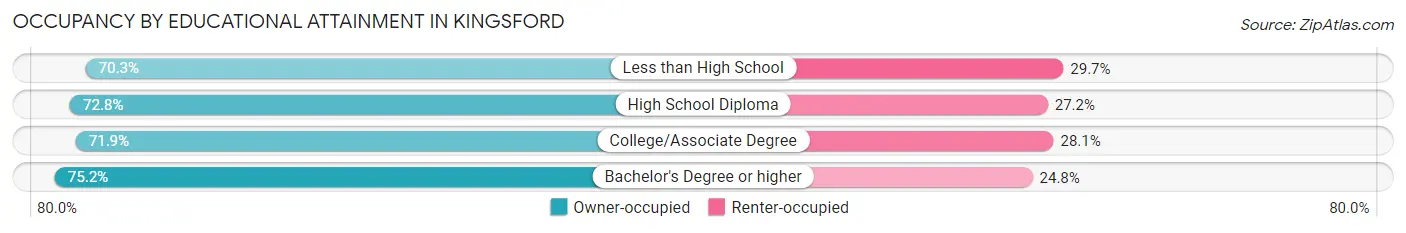
| Household Size | Owner-occupied | Renter-occupied |
| Less than High School | 45 (70.3%) | 19 (29.7%) |
| High School Diploma | 548 (72.8%) | 205 (27.2%) |
| College/Associate Degree | 544 (71.9%) | 213 (28.1%) |
| Bachelor's Degree or higher | 485 (75.2%) | 160 (24.8%) |
Occupancy by Age of Householder in Kingsford
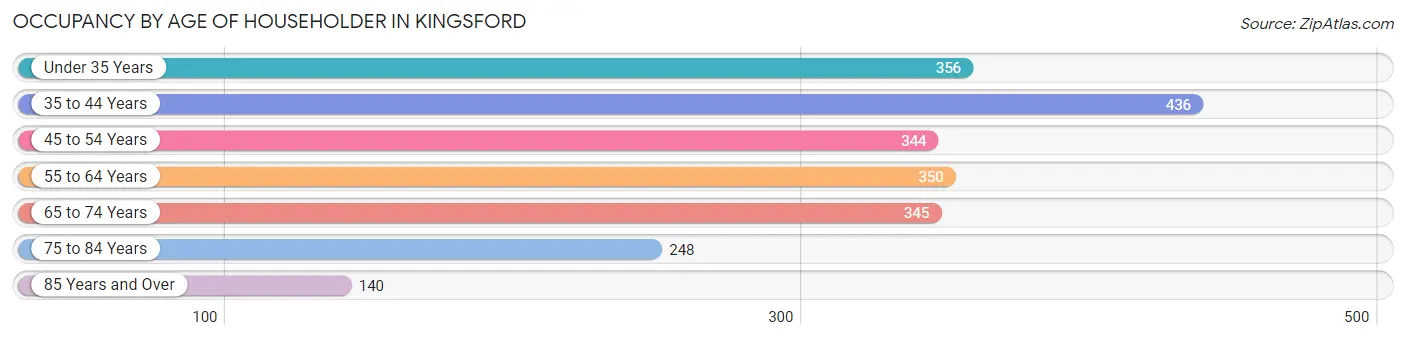
| Age Bracket | # Households | % Households |
| Under 35 Years | 356 | 16.0% |
| 35 to 44 Years | 436 | 19.7% |
| 45 to 54 Years | 344 | 15.5% |
| 55 to 64 Years | 350 | 15.8% |
| 65 to 74 Years | 345 | 15.5% |
| 75 to 84 Years | 248 | 11.2% |
| 85 Years and Over | 140 | 6.3% |
| Total | 2,219 | 100.0% |
Housing Finances in Kingsford
Median Income by Occupancy in Kingsford
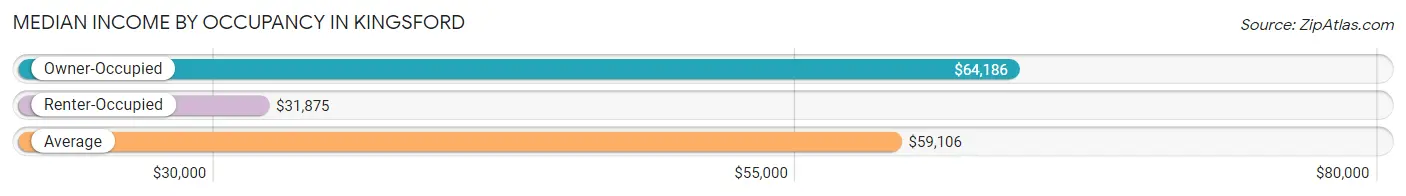
| Occupancy Type | # Households | Median Income |
| Owner-Occupied | 1,622 (73.1%) | $64,186 |
| Renter-Occupied | 597 (26.9%) | $31,875 |
| Average | 2,219 (100.0%) | $59,106 |
Occupancy by Householder Income Bracket in Kingsford
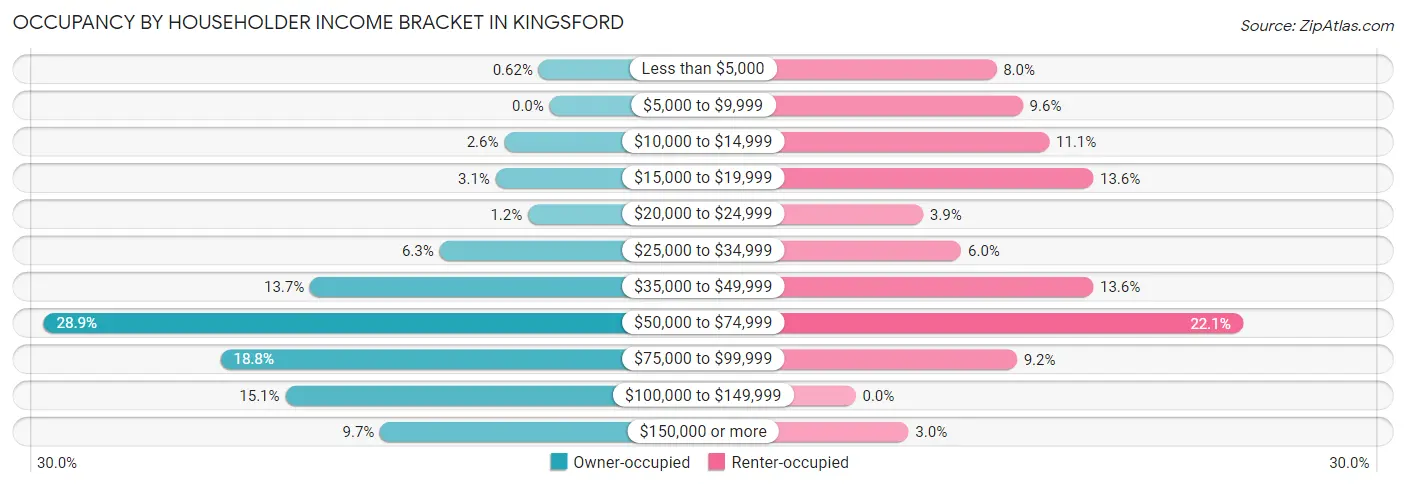
| Income Bracket | Owner-occupied | Renter-occupied |
| Less than $5,000 | 10 (0.6%) | 48 (8.0%) |
| $5,000 to $9,999 | 0 (0.0%) | 57 (9.6%) |
| $10,000 to $14,999 | 42 (2.6%) | 66 (11.1%) |
| $15,000 to $19,999 | 50 (3.1%) | 81 (13.6%) |
| $20,000 to $24,999 | 20 (1.2%) | 23 (3.8%) |
| $25,000 to $34,999 | 102 (6.3%) | 36 (6.0%) |
| $35,000 to $49,999 | 222 (13.7%) | 81 (13.6%) |
| $50,000 to $74,999 | 469 (28.9%) | 132 (22.1%) |
| $75,000 to $99,999 | 305 (18.8%) | 55 (9.2%) |
| $100,000 to $149,999 | 245 (15.1%) | 0 (0.0%) |
| $150,000 or more | 157 (9.7%) | 18 (3.0%) |
| Total | 1,622 (100.0%) | 597 (100.0%) |
Monthly Housing Cost Tiers in Kingsford
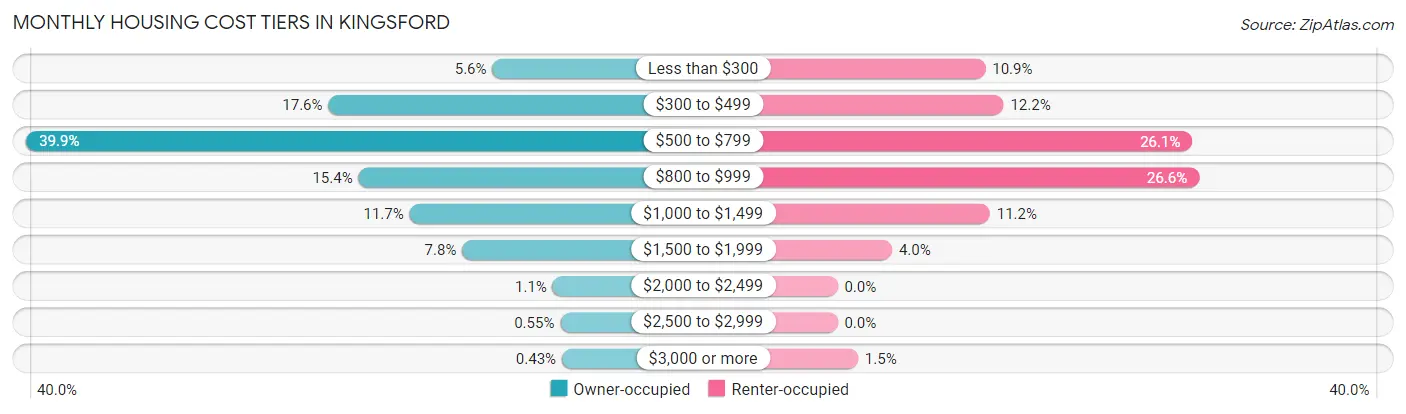
| Monthly Cost | Owner-occupied | Renter-occupied |
| Less than $300 | 90 (5.6%) | 65 (10.9%) |
| $300 to $499 | 286 (17.6%) | 73 (12.2%) |
| $500 to $799 | 647 (39.9%) | 156 (26.1%) |
| $800 to $999 | 250 (15.4%) | 159 (26.6%) |
| $1,000 to $1,499 | 189 (11.7%) | 67 (11.2%) |
| $1,500 to $1,999 | 126 (7.8%) | 24 (4.0%) |
| $2,000 to $2,499 | 18 (1.1%) | 0 (0.0%) |
| $2,500 to $2,999 | 9 (0.5%) | 0 (0.0%) |
| $3,000 or more | 7 (0.4%) | 9 (1.5%) |
| Total | 1,622 (100.0%) | 597 (100.0%) |
Physical Housing Characteristics in Kingsford
Housing Structures in Kingsford
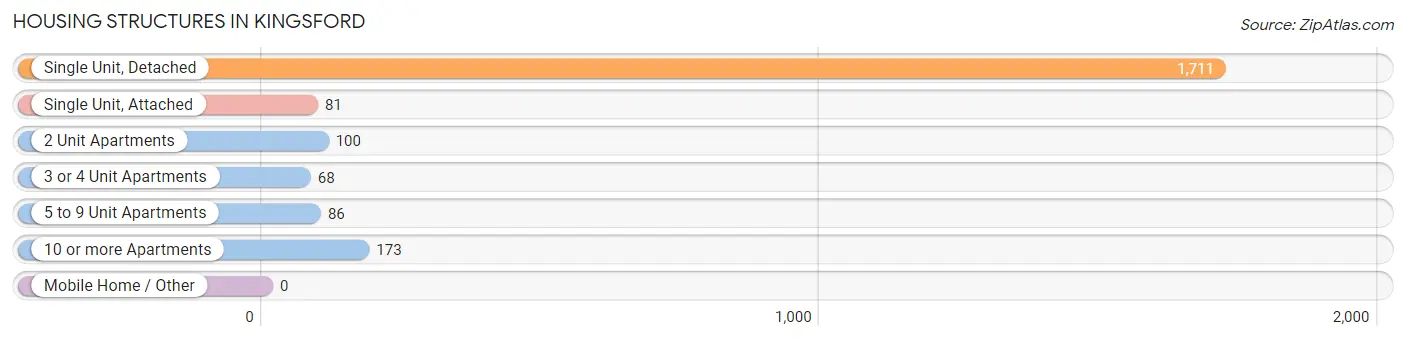
| Structure Type | # Housing Units | % Housing Units |
| Single Unit, Detached | 1,711 | 77.1% |
| Single Unit, Attached | 81 | 3.6% |
| 2 Unit Apartments | 100 | 4.5% |
| 3 or 4 Unit Apartments | 68 | 3.1% |
| 5 to 9 Unit Apartments | 86 | 3.9% |
| 10 or more Apartments | 173 | 7.8% |
| Mobile Home / Other | 0 | 0.0% |
| Total | 2,219 | 100.0% |
Housing Structures by Occupancy in Kingsford
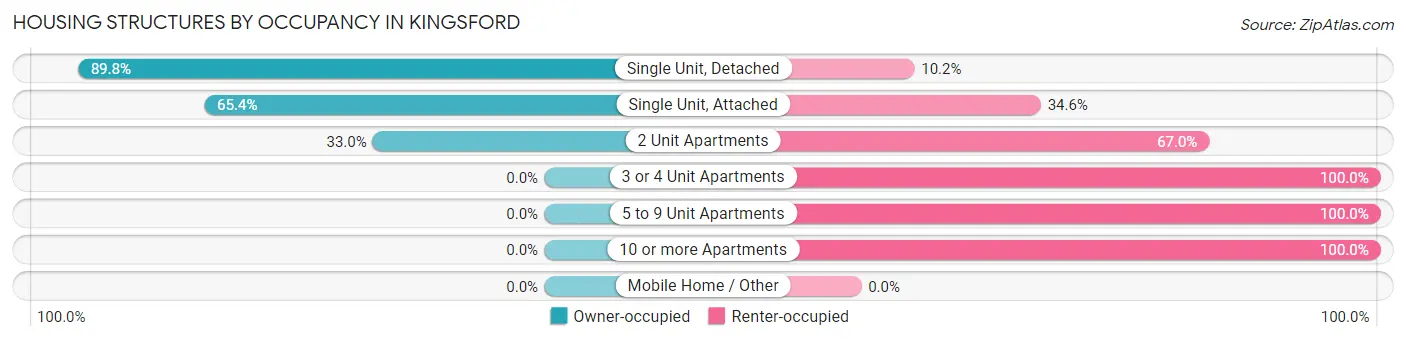
| Structure Type | Owner-occupied | Renter-occupied |
| Single Unit, Detached | 1,536 (89.8%) | 175 (10.2%) |
| Single Unit, Attached | 53 (65.4%) | 28 (34.6%) |
| 2 Unit Apartments | 33 (33.0%) | 67 (67.0%) |
| 3 or 4 Unit Apartments | 0 (0.0%) | 68 (100.0%) |
| 5 to 9 Unit Apartments | 0 (0.0%) | 86 (100.0%) |
| 10 or more Apartments | 0 (0.0%) | 173 (100.0%) |
| Mobile Home / Other | 0 (0.0%) | 0 (0.0%) |
| Total | 1,622 (73.1%) | 597 (26.9%) |
Housing Structures by Number of Rooms in Kingsford
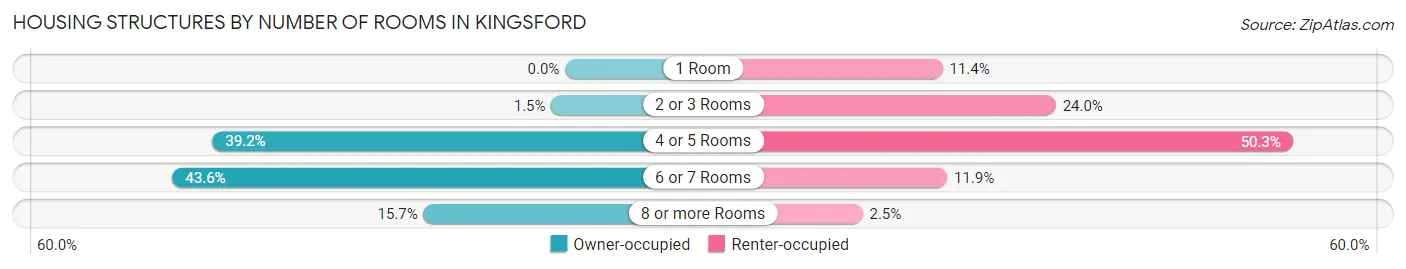
| Number of Rooms | Owner-occupied | Renter-occupied |
| 1 Room | 0 (0.0%) | 68 (11.4%) |
| 2 or 3 Rooms | 25 (1.5%) | 143 (23.9%) |
| 4 or 5 Rooms | 635 (39.2%) | 300 (50.2%) |
| 6 or 7 Rooms | 707 (43.6%) | 71 (11.9%) |
| 8 or more Rooms | 255 (15.7%) | 15 (2.5%) |
| Total | 1,622 (100.0%) | 597 (100.0%) |
Housing Structure by Heating Type in Kingsford
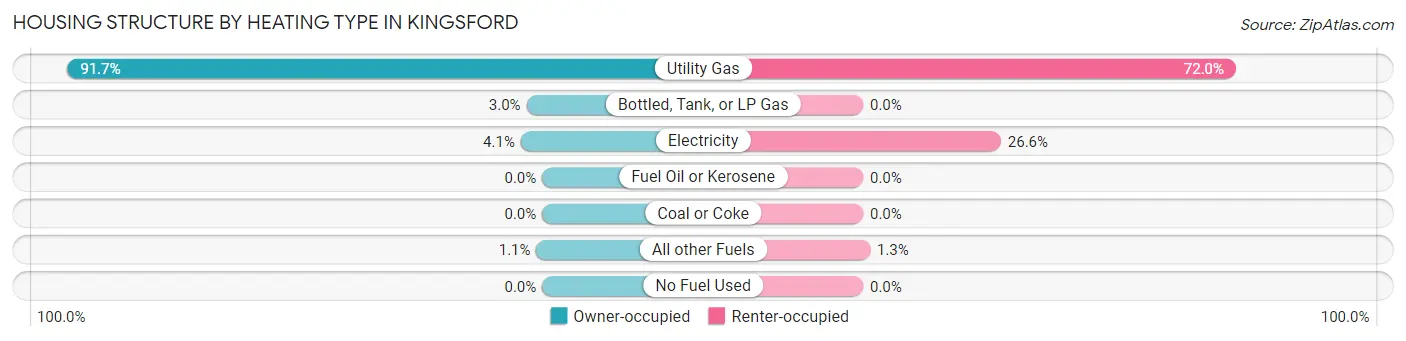
| Heating Type | Owner-occupied | Renter-occupied |
| Utility Gas | 1,488 (91.7%) | 430 (72.0%) |
| Bottled, Tank, or LP Gas | 49 (3.0%) | 0 (0.0%) |
| Electricity | 67 (4.1%) | 159 (26.6%) |
| Fuel Oil or Kerosene | 0 (0.0%) | 0 (0.0%) |
| Coal or Coke | 0 (0.0%) | 0 (0.0%) |
| All other Fuels | 18 (1.1%) | 8 (1.3%) |
| No Fuel Used | 0 (0.0%) | 0 (0.0%) |
| Total | 1,622 (100.0%) | 597 (100.0%) |
Household Vehicle Usage in Kingsford
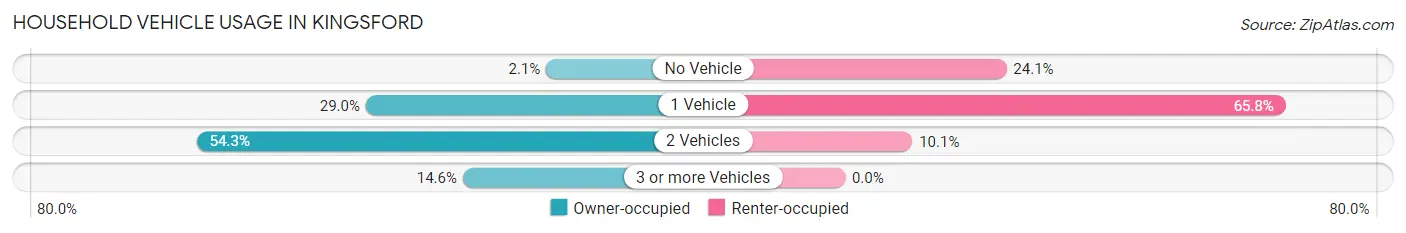
| Vehicles per Household | Owner-occupied | Renter-occupied |
| No Vehicle | 34 (2.1%) | 144 (24.1%) |
| 1 Vehicle | 471 (29.0%) | 393 (65.8%) |
| 2 Vehicles | 881 (54.3%) | 60 (10.1%) |
| 3 or more Vehicles | 236 (14.5%) | 0 (0.0%) |
| Total | 1,622 (100.0%) | 597 (100.0%) |
Real Estate & Mortgages in Kingsford
Real Estate and Mortgage Overview in Kingsford
| Characteristic | Without Mortgage | With Mortgage |
| Housing Units | 644 | 978 |
| Median Property Value | $97,100 | $109,300 |
| Median Household Income | $58,203 | $87 |
| Monthly Housing Costs | $460 | $7 |
| Real Estate Taxes | $1,845 | $15 |
Property Value by Mortgage Status in Kingsford
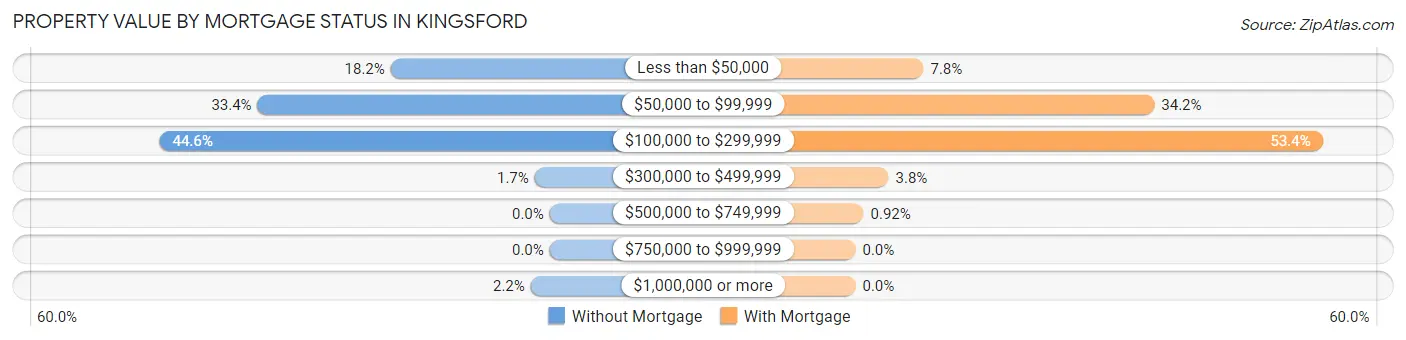
| Property Value | Without Mortgage | With Mortgage |
| Less than $50,000 | 117 (18.2%) | 76 (7.8%) |
| $50,000 to $99,999 | 215 (33.4%) | 334 (34.2%) |
| $100,000 to $299,999 | 287 (44.6%) | 522 (53.4%) |
| $300,000 to $499,999 | 11 (1.7%) | 37 (3.8%) |
| $500,000 to $749,999 | 0 (0.0%) | 9 (0.9%) |
| $750,000 to $999,999 | 0 (0.0%) | 0 (0.0%) |
| $1,000,000 or more | 14 (2.2%) | 0 (0.0%) |
| Total | 644 (100.0%) | 978 (100.0%) |
Household Income by Mortgage Status in Kingsford
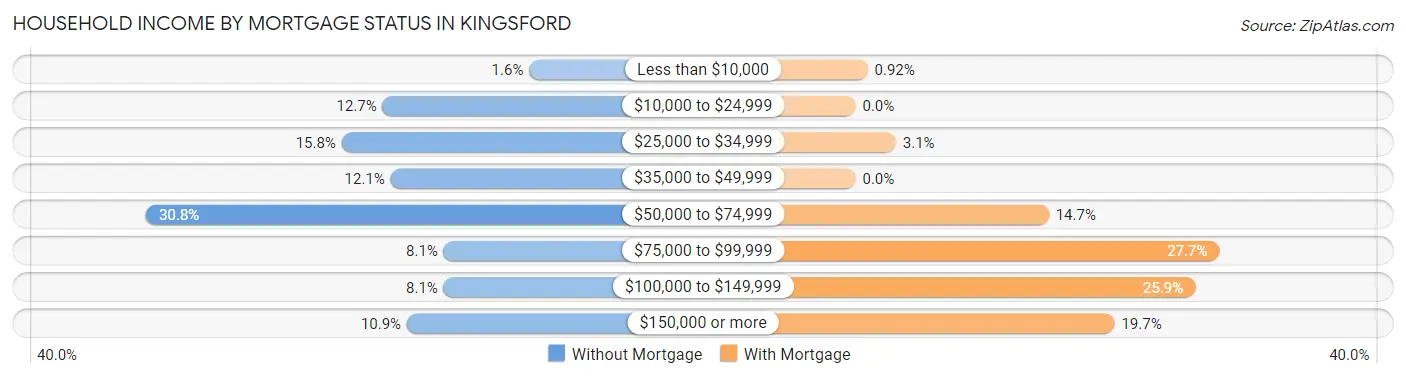
| Household Income | Without Mortgage | With Mortgage |
| Less than $10,000 | 10 (1.5%) | 9 (0.9%) |
| $10,000 to $24,999 | 82 (12.7%) | 0 (0.0%) |
| $25,000 to $34,999 | 102 (15.8%) | 30 (3.1%) |
| $35,000 to $49,999 | 78 (12.1%) | 0 (0.0%) |
| $50,000 to $74,999 | 198 (30.7%) | 144 (14.7%) |
| $75,000 to $99,999 | 52 (8.1%) | 271 (27.7%) |
| $100,000 to $149,999 | 52 (8.1%) | 253 (25.9%) |
| $150,000 or more | 70 (10.9%) | 193 (19.7%) |
| Total | 644 (100.0%) | 978 (100.0%) |
Property Value to Household Income Ratio in Kingsford
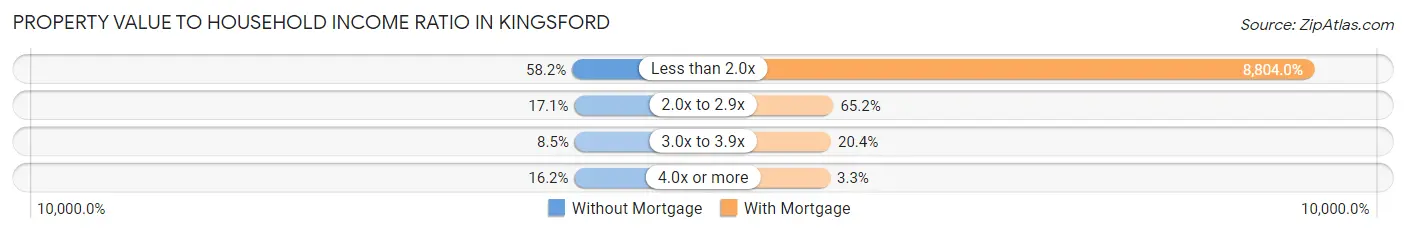
| Value-to-Income Ratio | Without Mortgage | With Mortgage |
| Less than 2.0x | 375 (58.2%) | 86,103 (8,804.0%) |
| 2.0x to 2.9x | 110 (17.1%) | 638 (65.2%) |
| 3.0x to 3.9x | 55 (8.5%) | 199 (20.3%) |
| 4.0x or more | 104 (16.2%) | 32 (3.3%) |
| Total | 644 (100.0%) | 978 (100.0%) |
Real Estate Taxes by Mortgage Status in Kingsford
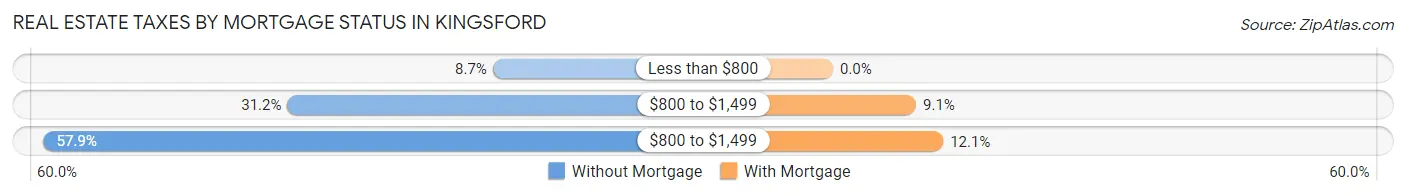
| Property Taxes | Without Mortgage | With Mortgage |
| Less than $800 | 56 (8.7%) | 0 (0.0%) |
| $800 to $1,499 | 201 (31.2%) | 89 (9.1%) |
| $800 to $1,499 | 373 (57.9%) | 118 (12.1%) |
| Total | 644 (100.0%) | 978 (100.0%) |
Health & Disability in Kingsford
Health Insurance Coverage by Age in Kingsford
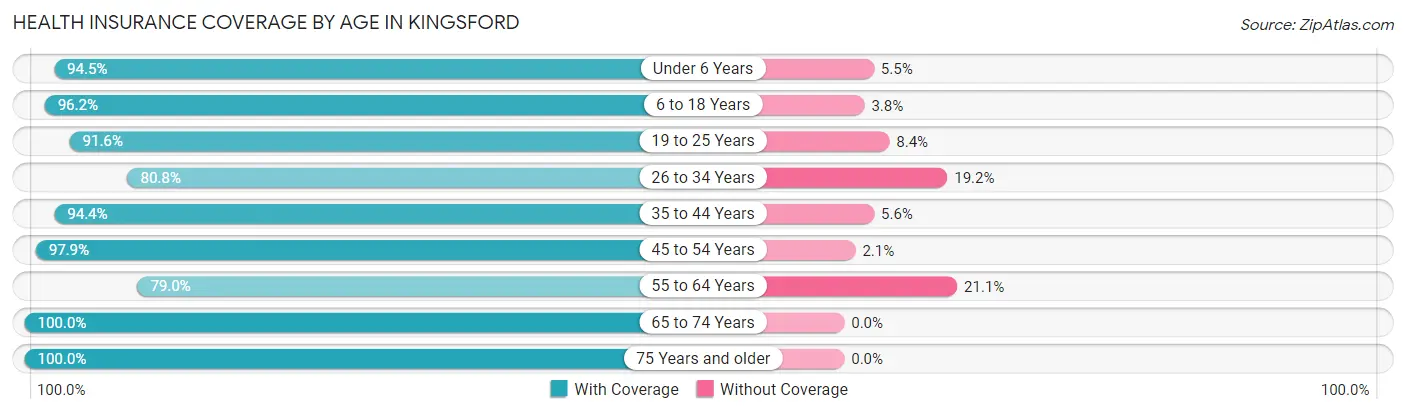
| Age Bracket | With Coverage | Without Coverage |
| Under 6 Years | 342 (94.5%) | 20 (5.5%) |
| 6 to 18 Years | 768 (96.2%) | 30 (3.8%) |
| 19 to 25 Years | 480 (91.6%) | 44 (8.4%) |
| 26 to 34 Years | 349 (80.8%) | 83 (19.2%) |
| 35 to 44 Years | 730 (94.4%) | 43 (5.6%) |
| 45 to 54 Years | 561 (97.9%) | 12 (2.1%) |
| 55 to 64 Years | 390 (78.9%) | 104 (21.0%) |
| 65 to 74 Years | 504 (100.0%) | 0 (0.0%) |
| 75 Years and older | 526 (100.0%) | 0 (0.0%) |
| Total | 4,650 (93.3%) | 336 (6.7%) |
Health Insurance Coverage by Citizenship Status in Kingsford
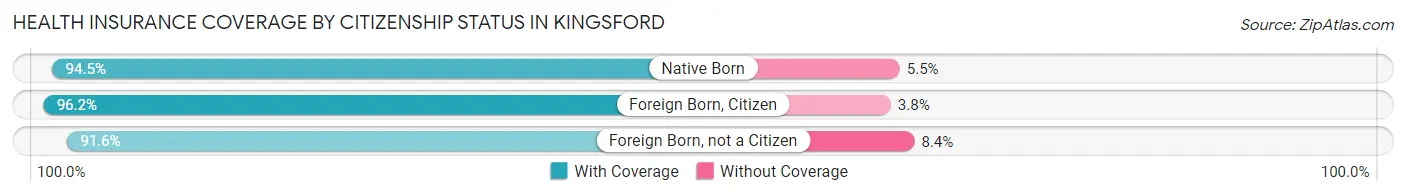
| Citizenship Status | With Coverage | Without Coverage |
| Native Born | 342 (94.5%) | 20 (5.5%) |
| Foreign Born, Citizen | 768 (96.2%) | 30 (3.8%) |
| Foreign Born, not a Citizen | 480 (91.6%) | 44 (8.4%) |
Health Insurance Coverage by Household Income in Kingsford
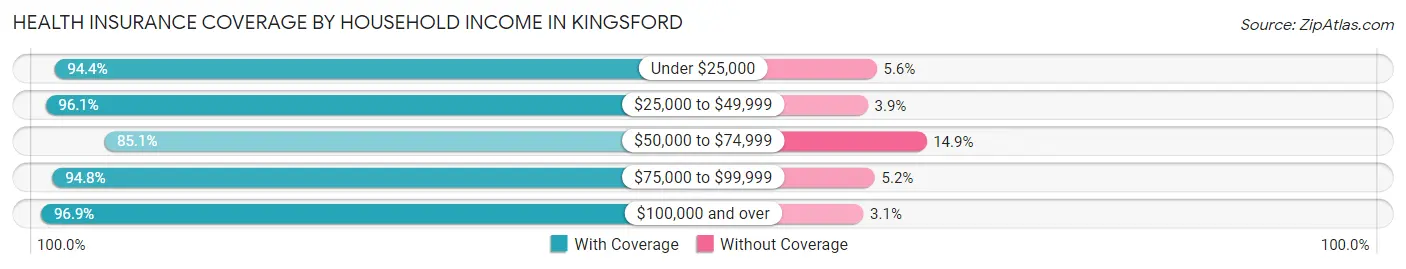
| Household Income | With Coverage | Without Coverage |
| Under $25,000 | 475 (94.4%) | 28 (5.6%) |
| $25,000 to $49,999 | 764 (96.1%) | 31 (3.9%) |
| $50,000 to $74,999 | 1,024 (85.1%) | 179 (14.9%) |
| $75,000 to $99,999 | 982 (94.8%) | 54 (5.2%) |
| $100,000 and over | 1,387 (96.9%) | 44 (3.1%) |
Public vs Private Health Insurance Coverage by Age in Kingsford
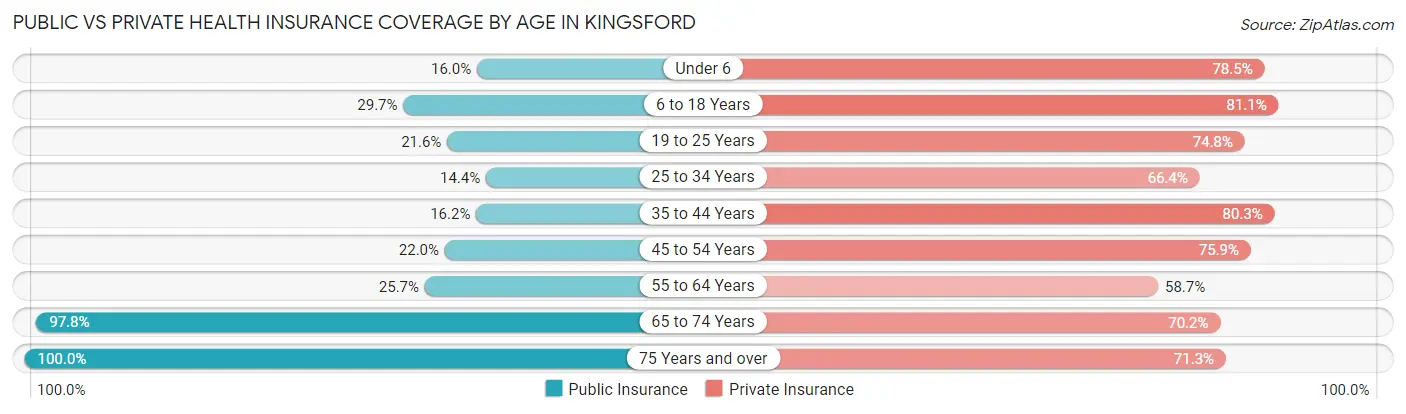
| Age Bracket | Public Insurance | Private Insurance |
| Under 6 | 58 (16.0%) | 284 (78.4%) |
| 6 to 18 Years | 237 (29.7%) | 647 (81.1%) |
| 19 to 25 Years | 113 (21.6%) | 392 (74.8%) |
| 25 to 34 Years | 62 (14.3%) | 287 (66.4%) |
| 35 to 44 Years | 125 (16.2%) | 621 (80.3%) |
| 45 to 54 Years | 126 (22.0%) | 435 (75.9%) |
| 55 to 64 Years | 127 (25.7%) | 290 (58.7%) |
| 65 to 74 Years | 493 (97.8%) | 354 (70.2%) |
| 75 Years and over | 526 (100.0%) | 375 (71.3%) |
| Total | 1,867 (37.4%) | 3,685 (73.9%) |
Disability Status by Sex by Age in Kingsford
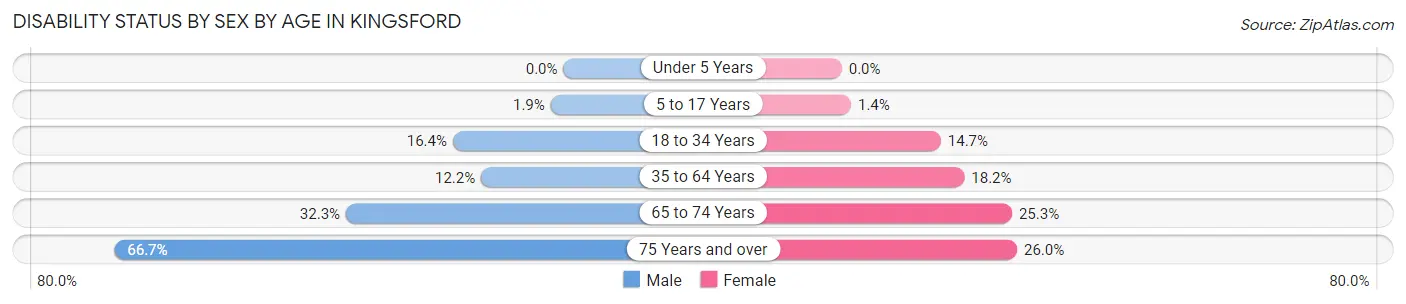
| Age Bracket | Male | Female |
| Under 5 Years | 0 (0.0%) | 0 (0.0%) |
| 5 to 17 Years | 7 (1.9%) | 6 (1.4%) |
| 18 to 34 Years | 96 (16.4%) | 60 (14.7%) |
| 35 to 64 Years | 104 (12.2%) | 180 (18.2%) |
| 65 to 74 Years | 72 (32.3%) | 71 (25.3%) |
| 75 Years and over | 138 (66.7%) | 83 (26.0%) |
Disability Class by Sex by Age in Kingsford
Disability Class: Hearing Difficulty
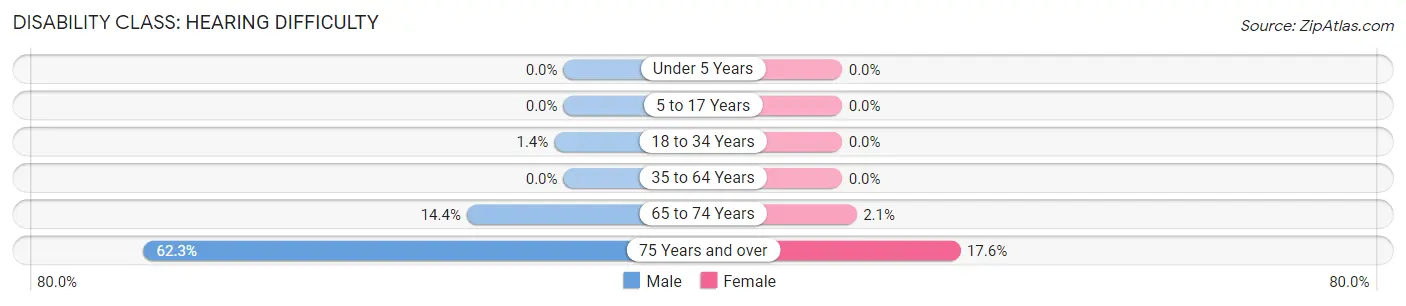
| Age Bracket | Male | Female |
| Under 5 Years | 0 (0.0%) | 0 (0.0%) |
| 5 to 17 Years | 0 (0.0%) | 0 (0.0%) |
| 18 to 34 Years | 8 (1.4%) | 0 (0.0%) |
| 35 to 64 Years | 0 (0.0%) | 0 (0.0%) |
| 65 to 74 Years | 32 (14.3%) | 6 (2.1%) |
| 75 Years and over | 129 (62.3%) | 56 (17.5%) |
Disability Class: Vision Difficulty
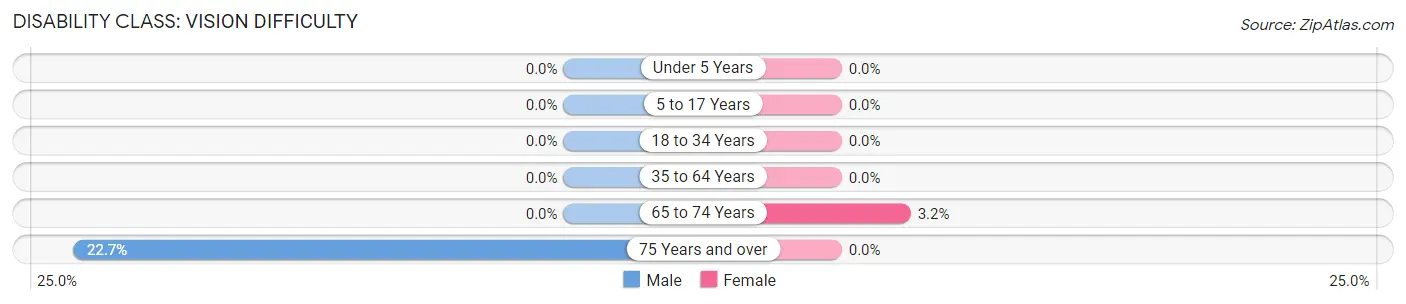
| Age Bracket | Male | Female |
| Under 5 Years | 0 (0.0%) | 0 (0.0%) |
| 5 to 17 Years | 0 (0.0%) | 0 (0.0%) |
| 18 to 34 Years | 0 (0.0%) | 0 (0.0%) |
| 35 to 64 Years | 0 (0.0%) | 0 (0.0%) |
| 65 to 74 Years | 0 (0.0%) | 9 (3.2%) |
| 75 Years and over | 47 (22.7%) | 0 (0.0%) |
Disability Class: Cognitive Difficulty
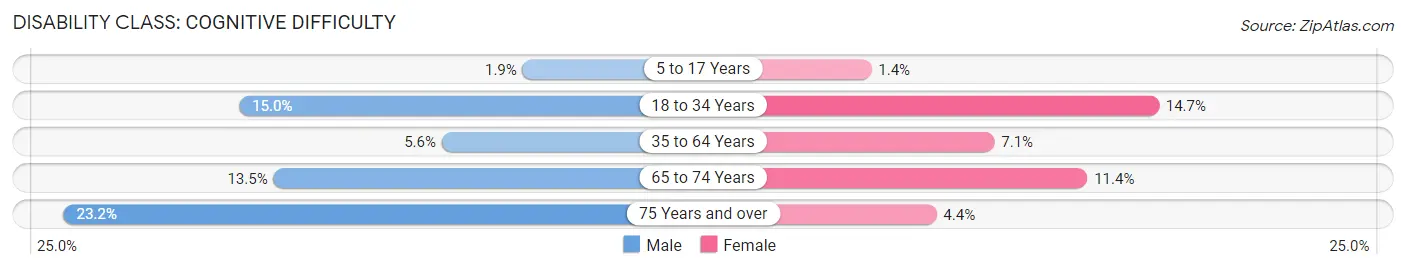
| Age Bracket | Male | Female |
| 5 to 17 Years | 7 (1.9%) | 6 (1.4%) |
| 18 to 34 Years | 88 (15.0%) | 60 (14.7%) |
| 35 to 64 Years | 48 (5.6%) | 70 (7.1%) |
| 65 to 74 Years | 30 (13.5%) | 32 (11.4%) |
| 75 Years and over | 48 (23.2%) | 14 (4.4%) |
Disability Class: Ambulatory Difficulty
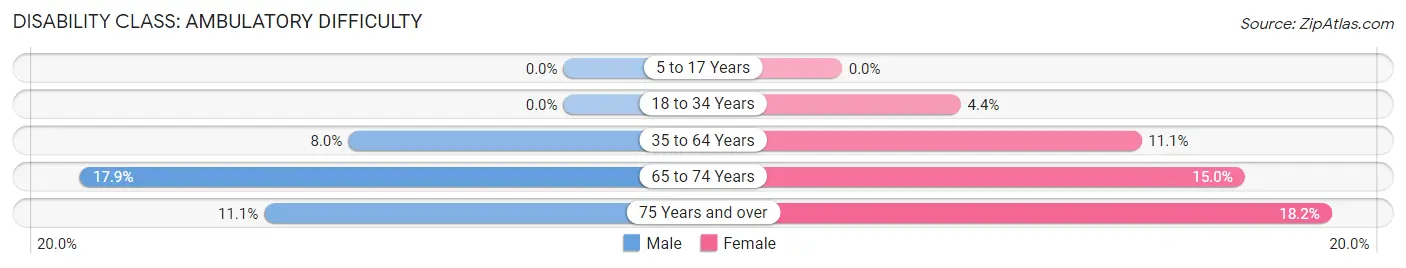
| Age Bracket | Male | Female |
| 5 to 17 Years | 0 (0.0%) | 0 (0.0%) |
| 18 to 34 Years | 0 (0.0%) | 18 (4.4%) |
| 35 to 64 Years | 68 (8.0%) | 110 (11.1%) |
| 65 to 74 Years | 40 (17.9%) | 42 (14.9%) |
| 75 Years and over | 23 (11.1%) | 58 (18.2%) |
Disability Class: Self-Care Difficulty
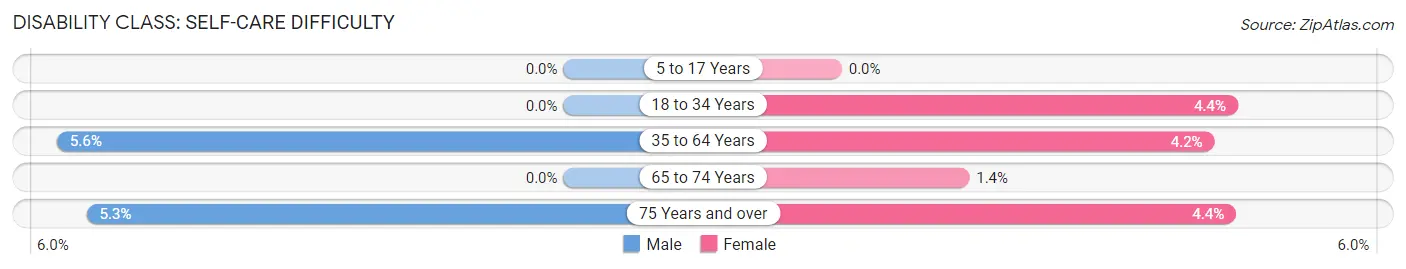
| Age Bracket | Male | Female |
| 5 to 17 Years | 0 (0.0%) | 0 (0.0%) |
| 18 to 34 Years | 0 (0.0%) | 18 (4.4%) |
| 35 to 64 Years | 48 (5.6%) | 41 (4.2%) |
| 65 to 74 Years | 0 (0.0%) | 4 (1.4%) |
| 75 Years and over | 11 (5.3%) | 14 (4.4%) |
Technology Access in Kingsford
Computing Device Access in Kingsford
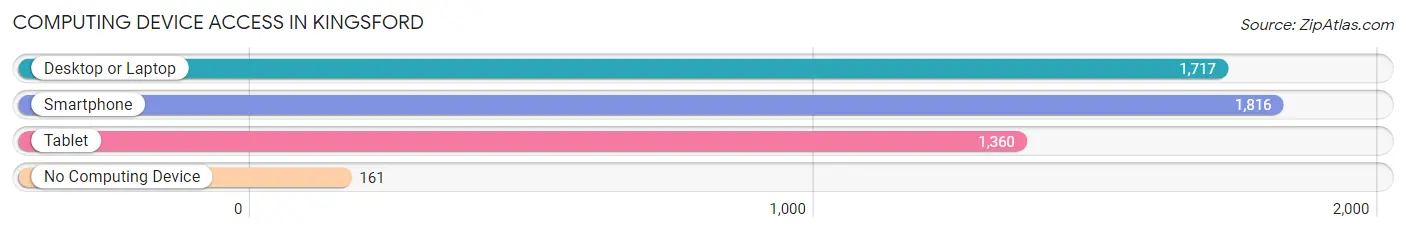
| Device Type | # Households | % Households |
| Desktop or Laptop | 1,717 | 77.4% |
| Smartphone | 1,816 | 81.8% |
| Tablet | 1,360 | 61.3% |
| No Computing Device | 161 | 7.3% |
| Total | 2,219 | 100.0% |
Internet Access in Kingsford
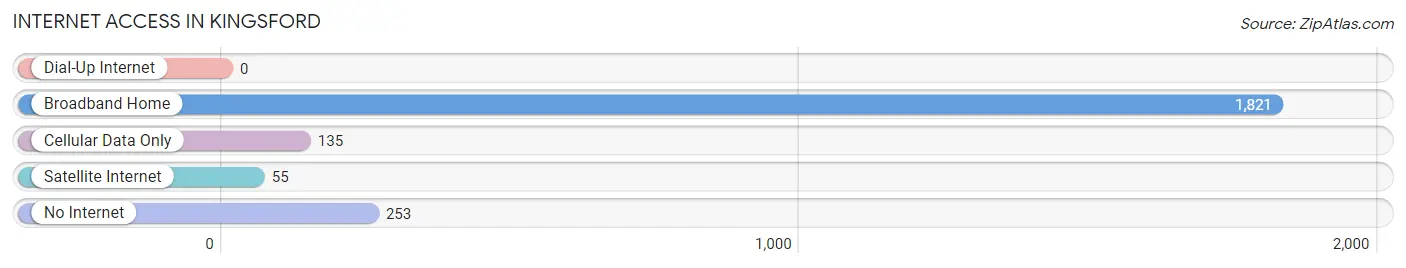
| Internet Type | # Households | % Households |
| Dial-Up Internet | 0 | 0.0% |
| Broadband Home | 1,821 | 82.1% |
| Cellular Data Only | 135 | 6.1% |
| Satellite Internet | 55 | 2.5% |
| No Internet | 253 | 11.4% |
| Total | 2,219 | 100.0% |
Kingsford Summary
History
The city of Kingsford, Michigan is located in the Upper Peninsula of Michigan, and is part of Dickinson County. The city was founded in 1887 by the Kingsford brothers, who were looking to capitalize on the area’s rich iron ore deposits. The city was named after the brothers, and the first post office was established in 1888.
The city quickly grew, and by the early 1900s, it was home to several large iron ore mines, as well as a number of other businesses. The city was also home to a large number of immigrants, mostly from Finland, who had come to work in the mines. The city’s population peaked in the 1920s, when it had over 5,000 residents.
The city’s economy was heavily dependent on the iron ore industry, and when the industry began to decline in the 1950s, the city’s population began to decline as well. By the 1970s, the city’s population had dropped to just over 2,000.
In the 1980s, the city began to experience a resurgence, as new businesses moved into the area and the city began to attract new residents. The city’s population has been steadily increasing since then, and as of the 2010 census, the city had a population of 3,976.
Geography
Kingsford is located in the Upper Peninsula of Michigan, in Dickinson County. The city is situated on the Menominee River, which flows into Lake Michigan. The city is surrounded by forests and lakes, and is located near the Porcupine Mountains State Park.
The city has a total area of 4.2 square miles, of which 4.1 square miles is land and 0.1 square miles is water. The city has a humid continental climate, with cold winters and warm summers.
Economy
The economy of Kingsford is largely based on the manufacturing industry. The city is home to several large manufacturing companies, including the Kingsford Manufacturing Company, which produces charcoal briquettes. The city is also home to several other manufacturing companies, including a paper mill, a steel mill, and a wood products plant.
The city is also home to several retail stores, restaurants, and other businesses. The city is served by the Dickinson County Airport, which provides air service to the area.
Demographics
As of the 2010 census, the city of Kingsford had a population of 3,976. The population was spread out, with 48.3% male and 51.7% female. The median age was 43.7 years.
The racial makeup of the city was 97.2% White, 0.3% African American, 0.3% Native American, 0.3% Asian, 0.2% from other races, and 1.7% from two or more races. Hispanic or Latino of any race were 1.2% of the population.
The median income for a household in the city was $37,917, and the median income for a family was $45,938. The per capita income for the city was $20,845. About 11.2% of families and 14.2% of the population were below the poverty line, including 19.2% of those under age 18 and 8.2% of those age 65 or over.
Common Questions
What is Per Capita Income in Kingsford?
Per Capita income in Kingsford is $31,160.
What is the Median Family Income in Kingsford?
Median Family Income in Kingsford is $63,000.
What is the Median Household income in Kingsford?
Median Household Income in Kingsford is $59,106.
What is Income or Wage Gap in Kingsford?
Income or Wage Gap in Kingsford is 16.8%.
Women in Kingsford earn 83.2 cents for every dollar earned by a man.
What is Inequality or Gini Index in Kingsford?
Inequality or Gini Index in Kingsford is 0.40.
What is the Total Population of Kingsford?
Total Population of Kingsford is 5,127.
What is the Total Male Population of Kingsford?
Total Male Population of Kingsford is 2,452.
What is the Total Female Population of Kingsford?
Total Female Population of Kingsford is 2,675.
What is the Ratio of Males per 100 Females in Kingsford?
There are 91.66 Males per 100 Females in Kingsford.
What is the Ratio of Females per 100 Males in Kingsford?
There are 109.09 Females per 100 Males in Kingsford.
What is the Median Population Age in Kingsford?
Median Population Age in Kingsford is 40.6 Years.
What is the Average Family Size in Kingsford
Average Family Size in Kingsford is 2.7 People.
What is the Average Household Size in Kingsford
Average Household Size in Kingsford is 2.2 People.
How Large is the Labor Force in Kingsford?
There are 2,558 People in the Labor Forcein in Kingsford.
What is the Percentage of People in the Labor Force in Kingsford?
61.1% of People are in the Labor Force in Kingsford.
What is the Unemployment Rate in Kingsford?
Unemployment Rate in Kingsford is 3.6%.