East Grand Rapids, MI Map & Demographics
East Grand Rapids Map
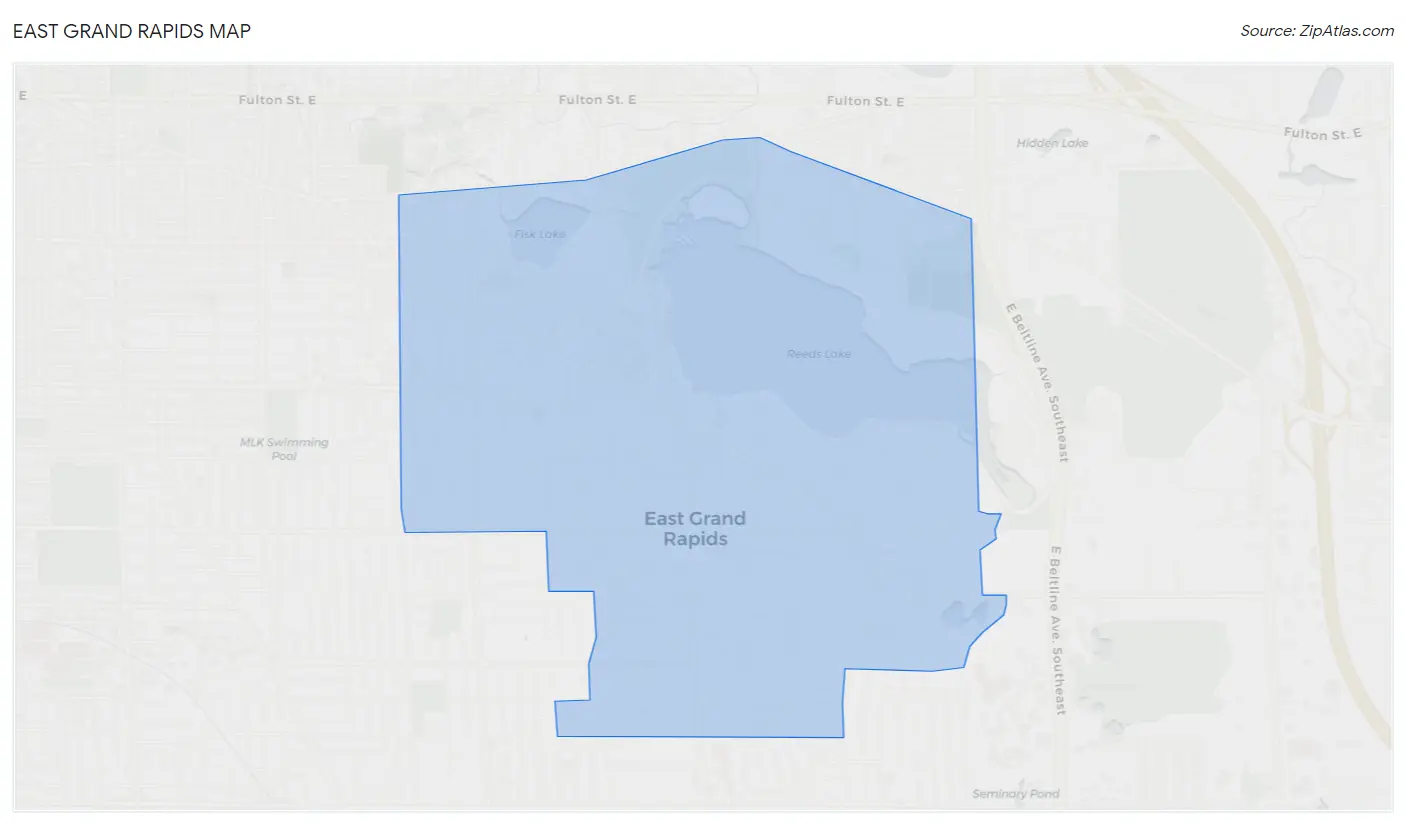
East Grand Rapids Overview
$76,034
PER CAPITA INCOME
$173,529
AVG FAMILY INCOME
$160,417
AVG HOUSEHOLD INCOME
46.7%
WAGE / INCOME GAP [ % ]
53.3¢/ $1
WAGE / INCOME GAP [ $ ]
0.45
INEQUALITY / GINI INDEX
11,385
TOTAL POPULATION
5,705
MALE POPULATION
5,680
FEMALE POPULATION
100.44
MALES / 100 FEMALES
99.56
FEMALES / 100 MALES
37.5
MEDIAN AGE
3.3
AVG FAMILY SIZE
3.0
AVG HOUSEHOLD SIZE
5,771
LABOR FORCE [ PEOPLE ]
71.9%
PERCENT IN LABOR FORCE
1.9%
UNEMPLOYMENT RATE
East Grand Rapids Area Codes
Income in East Grand Rapids
Income Overview in East Grand Rapids
Per Capita Income in East Grand Rapids is $76,034, while median incomes of families and households are $173,529 and $160,417 respectively.
| Characteristic | Number | Measure |
| Per Capita Income | 11,385 | $76,034 |
| Median Family Income | 3,232 | $173,529 |
| Mean Family Income | 3,232 | $244,584 |
| Median Household Income | 3,850 | $160,417 |
| Mean Household Income | 3,850 | $225,057 |
| Income Deficit | 3,232 | $0 |
| Wage / Income Gap (%) | 11,385 | 46.74% |
| Wage / Income Gap ($) | 11,385 | 53.26¢ per $1 |
| Gini / Inequality Index | 11,385 | 0.45 |
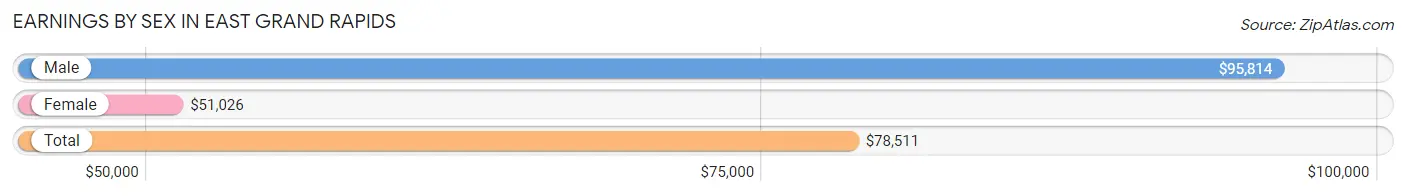
Earnings by Sex in East Grand Rapids
Average Earnings in East Grand Rapids are $78,511, $95,814 for men and $51,026 for women, a difference of 46.7%.
| Sex | Number | Average Earnings |
| Male | 3,381 (55.4%) | $95,814 |
| Female | 2,719 (44.6%) | $51,026 |
| Total | 6,100 (100.0%) | $78,511 |
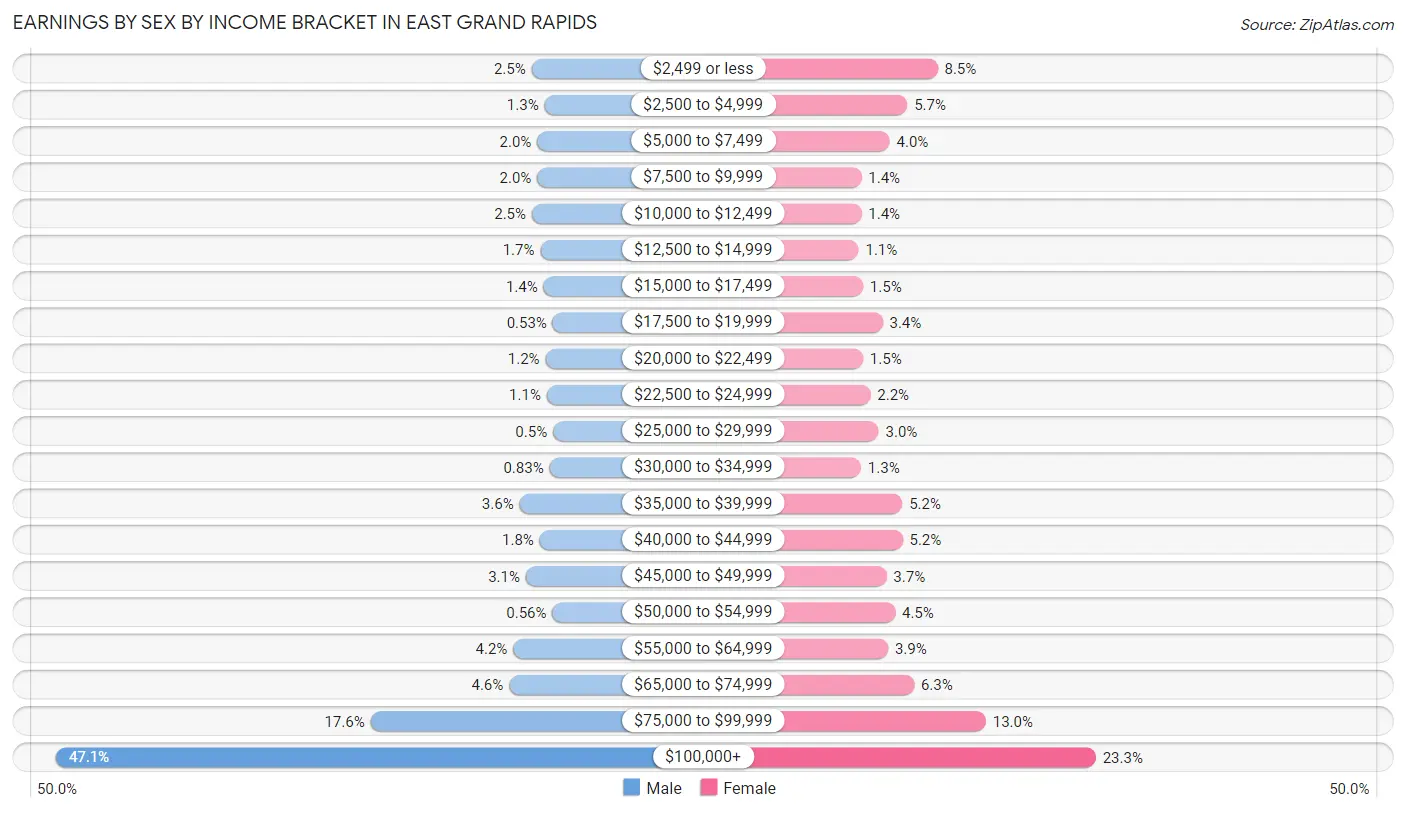
Earnings by Sex by Income Bracket in East Grand Rapids
The most common earnings brackets in East Grand Rapids are $100,000+ for men (1,591 | 47.1%) and $100,000+ for women (634 | 23.3%).
| Income | Male | Female |
| $2,499 or less | 85 (2.5%) | 231 (8.5%) |
| $2,500 to $4,999 | 44 (1.3%) | 154 (5.7%) |
| $5,000 to $7,499 | 67 (2.0%) | 109 (4.0%) |
| $7,500 to $9,999 | 67 (2.0%) | 37 (1.4%) |
| $10,000 to $12,499 | 84 (2.5%) | 37 (1.4%) |
| $12,500 to $14,999 | 57 (1.7%) | 30 (1.1%) |
| $15,000 to $17,499 | 47 (1.4%) | 41 (1.5%) |
| $17,500 to $19,999 | 18 (0.5%) | 91 (3.4%) |
| $20,000 to $22,499 | 41 (1.2%) | 41 (1.5%) |
| $22,500 to $24,999 | 37 (1.1%) | 60 (2.2%) |
| $25,000 to $29,999 | 17 (0.5%) | 81 (3.0%) |
| $30,000 to $34,999 | 28 (0.8%) | 36 (1.3%) |
| $35,000 to $39,999 | 123 (3.6%) | 141 (5.2%) |
| $40,000 to $44,999 | 59 (1.8%) | 142 (5.2%) |
| $45,000 to $49,999 | 103 (3.0%) | 101 (3.7%) |
| $50,000 to $54,999 | 19 (0.6%) | 123 (4.5%) |
| $55,000 to $64,999 | 143 (4.2%) | 105 (3.9%) |
| $65,000 to $74,999 | 156 (4.6%) | 171 (6.3%) |
| $75,000 to $99,999 | 595 (17.6%) | 354 (13.0%) |
| $100,000+ | 1,591 (47.1%) | 634 (23.3%) |
| Total | 3,381 (100.0%) | 2,719 (100.0%) |
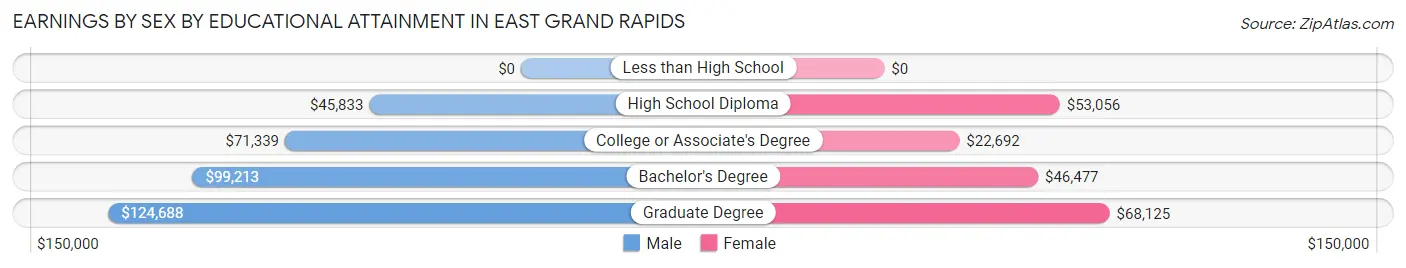
Earnings by Sex by Educational Attainment in East Grand Rapids
Average earnings in East Grand Rapids are $103,354 for men and $54,509 for women, a difference of 47.3%. Men with an educational attainment of graduate degree enjoy the highest average annual earnings of $124,688, while those with high school diploma education earn the least with $45,833. Women with an educational attainment of graduate degree earn the most with the average annual earnings of $68,125, while those with college or associate's degree education have the smallest earnings of $22,692.
| Educational Attainment | Male Income | Female Income |
| Less than High School | - | - |
| High School Diploma | $45,833 | $53,056 |
| College or Associate's Degree | $71,339 | $22,692 |
| Bachelor's Degree | $99,213 | $46,477 |
| Graduate Degree | $124,688 | $68,125 |
| Total | $103,354 | $54,509 |
Family Income in East Grand Rapids
Family Income Brackets in East Grand Rapids
According to the East Grand Rapids family income data, there are 1,325 families falling into the $200,000+ income range, which is the most common income bracket and makes up 41.0% of all families.
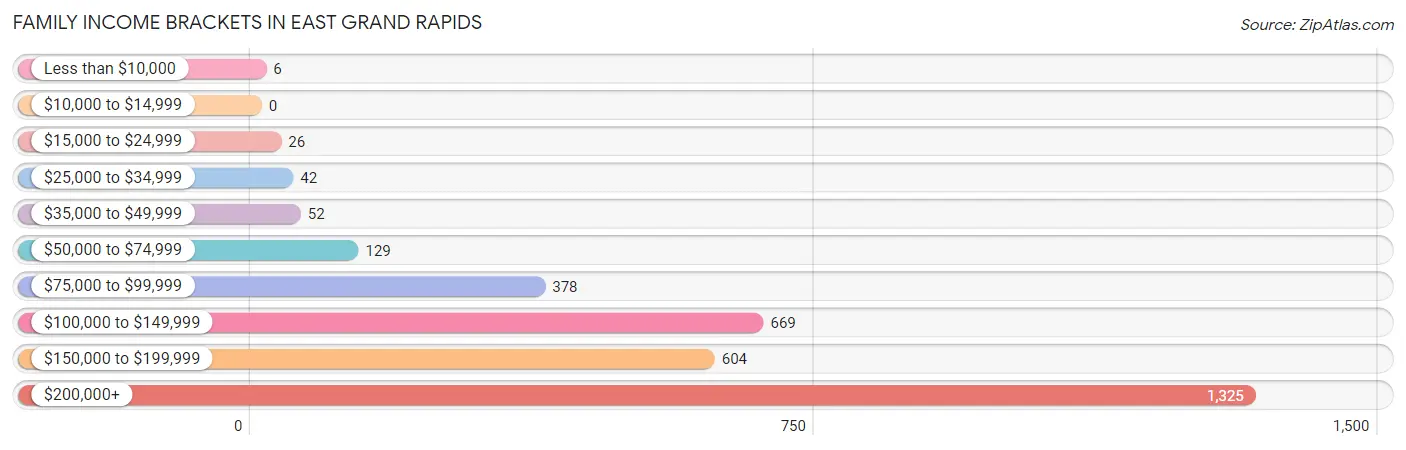
| Income Bracket | # Families | % Families |
| Less than $10,000 | 6 | 0.2% |
| $10,000 to $14,999 | 0 | 0.0% |
| $15,000 to $24,999 | 26 | 0.8% |
| $25,000 to $34,999 | 42 | 1.3% |
| $35,000 to $49,999 | 52 | 1.6% |
| $50,000 to $74,999 | 129 | 4.0% |
| $75,000 to $99,999 | 378 | 11.7% |
| $100,000 to $149,999 | 669 | 20.7% |
| $150,000 to $199,999 | 604 | 18.7% |
| $200,000+ | 1,325 | 41.0% |
Family Income by Famaliy Size in East Grand Rapids
5-person families (319 | 9.9%) account for the highest median family income in East Grand Rapids with $249,651 per family, while 2-person families (1,160 | 35.9%) have the highest median income of $72,945 per family member.
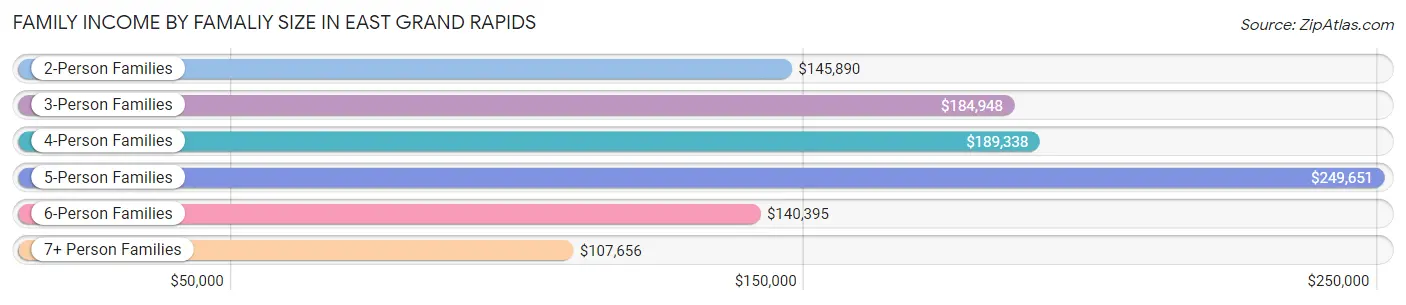
| Income Bracket | # Families | Median Income |
| 2-Person Families | 1,160 (35.9%) | $145,890 |
| 3-Person Families | 679 (21.0%) | $184,948 |
| 4-Person Families | 868 (26.9%) | $189,338 |
| 5-Person Families | 319 (9.9%) | $249,651 |
| 6-Person Families | 152 (4.7%) | $140,395 |
| 7+ Person Families | 54 (1.7%) | $107,656 |
| Total | 3,232 (100.0%) | $173,529 |
Family Income by Number of Earners in East Grand Rapids
The median family income in East Grand Rapids is $173,529, with families comprising 3+ earners (348) having the highest median family income of $250,001, while families with no earners (237) have the lowest median family income of $114,531, accounting for 10.8% and 7.3% of families, respectively.
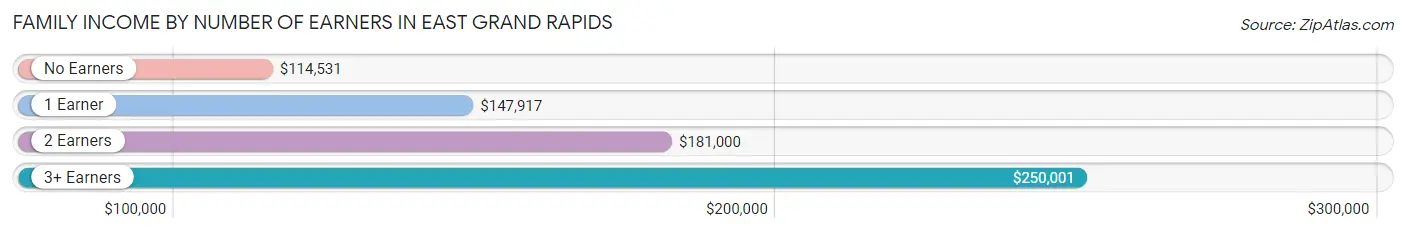
| Number of Earners | # Families | Median Income |
| No Earners | 237 (7.3%) | $114,531 |
| 1 Earner | 817 (25.3%) | $147,917 |
| 2 Earners | 1,830 (56.6%) | $181,000 |
| 3+ Earners | 348 (10.8%) | $250,001 |
| Total | 3,232 (100.0%) | $173,529 |
Household Income in East Grand Rapids
Household Income Brackets in East Grand Rapids
With 1,409 households falling in the category, the $200,000+ income range is the most frequent in East Grand Rapids, accounting for 36.6% of all households. In contrast, only 23 households (0.6%) fall into the less than $10,000 income bracket, making it the least populous group.
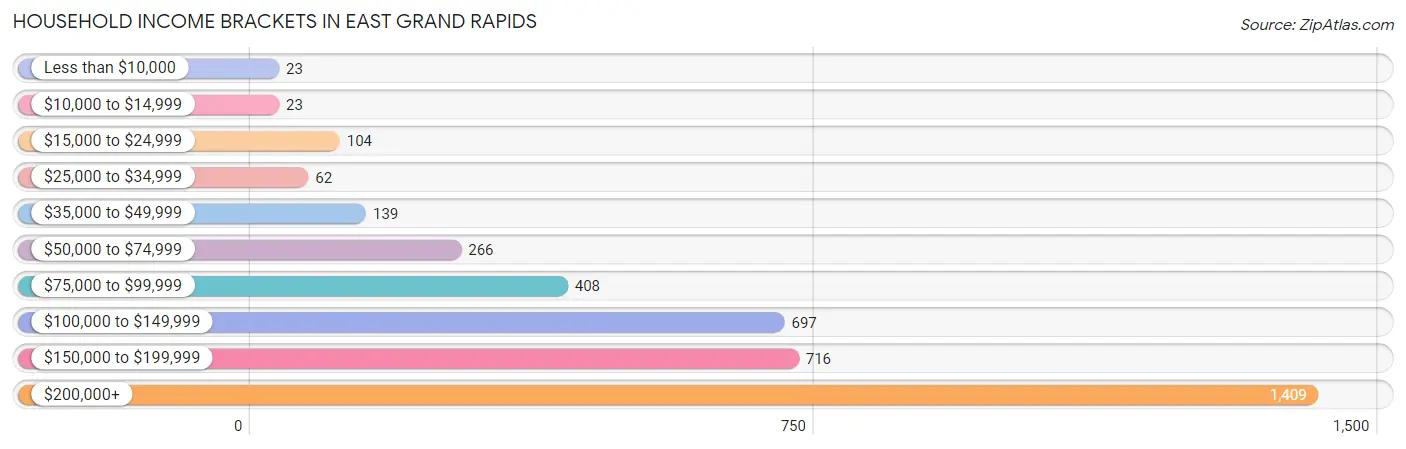
| Income Bracket | # Households | % Households |
| Less than $10,000 | 23 | 0.6% |
| $10,000 to $14,999 | 23 | 0.6% |
| $15,000 to $24,999 | 104 | 2.7% |
| $25,000 to $34,999 | 62 | 1.6% |
| $35,000 to $49,999 | 139 | 3.6% |
| $50,000 to $74,999 | 266 | 6.9% |
| $75,000 to $99,999 | 408 | 10.6% |
| $100,000 to $149,999 | 697 | 18.1% |
| $150,000 to $199,999 | 716 | 18.6% |
| $200,000+ | 1,409 | 36.6% |
Household Income by Householder Age in East Grand Rapids
The median household income in East Grand Rapids is $160,417, with the highest median household income of $180,250 found in the 45 to 64 years age bracket for the primary householder. A total of 1,656 households (43.0%) fall into this category. Meanwhile, the 15 to 24 years age bracket for the primary householder has the lowest median household income of $0, with 9 households (0.2%) in this group.
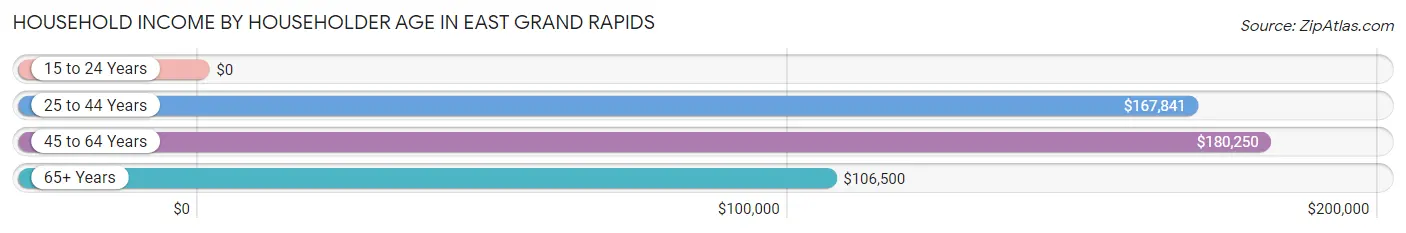
| Income Bracket | # Households | Median Income |
| 15 to 24 Years | 9 (0.2%) | $0 |
| 25 to 44 Years | 1,455 (37.8%) | $167,841 |
| 45 to 64 Years | 1,656 (43.0%) | $180,250 |
| 65+ Years | 730 (19.0%) | $106,500 |
| Total | 3,850 (100.0%) | $160,417 |
Poverty in East Grand Rapids
Income Below Poverty by Sex and Age in East Grand Rapids
With 1.3% poverty level for males and 2.1% for females among the residents of East Grand Rapids, 15 year old males and 5 year old females are the most vulnerable to poverty, with 7 males (9.3%) and 7 females (5.9%) in their respective age groups living below the poverty level.
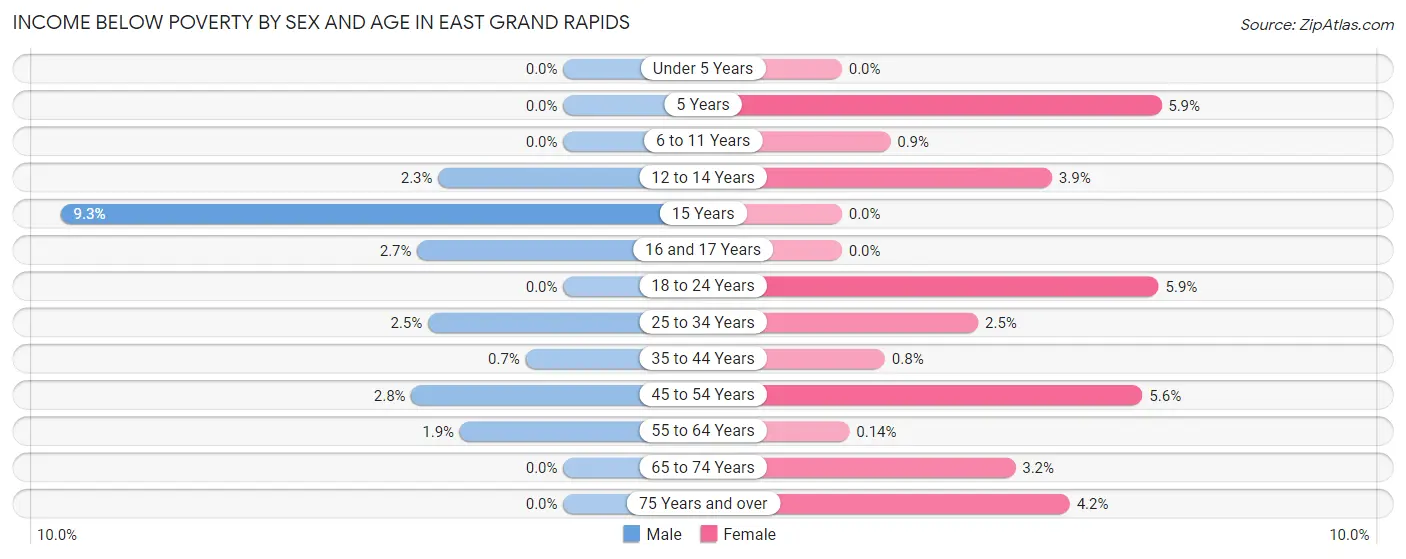
| Age Bracket | Male | Female |
| Under 5 Years | 0 (0.0%) | 0 (0.0%) |
| 5 Years | 0 (0.0%) | 7 (5.9%) |
| 6 to 11 Years | 0 (0.0%) | 7 (0.9%) |
| 12 to 14 Years | 8 (2.3%) | 8 (3.9%) |
| 15 Years | 7 (9.3%) | 0 (0.0%) |
| 16 and 17 Years | 6 (2.7%) | 0 (0.0%) |
| 18 to 24 Years | 0 (0.0%) | 6 (5.9%) |
| 25 to 34 Years | 11 (2.5%) | 14 (2.5%) |
| 35 to 44 Years | 7 (0.7%) | 8 (0.8%) |
| 45 to 54 Years | 20 (2.8%) | 47 (5.6%) |
| 55 to 64 Years | 14 (1.9%) | 1 (0.1%) |
| 65 to 74 Years | 0 (0.0%) | 14 (3.2%) |
| 75 Years and over | 0 (0.0%) | 9 (4.2%) |
| Total | 73 (1.3%) | 121 (2.1%) |
Income Above Poverty by Sex and Age in East Grand Rapids
According to the poverty statistics in East Grand Rapids, males aged under 5 years and females aged under 5 years are the age groups that are most secure financially, with 100.0% of males and 100.0% of females in these age groups living above the poverty line.
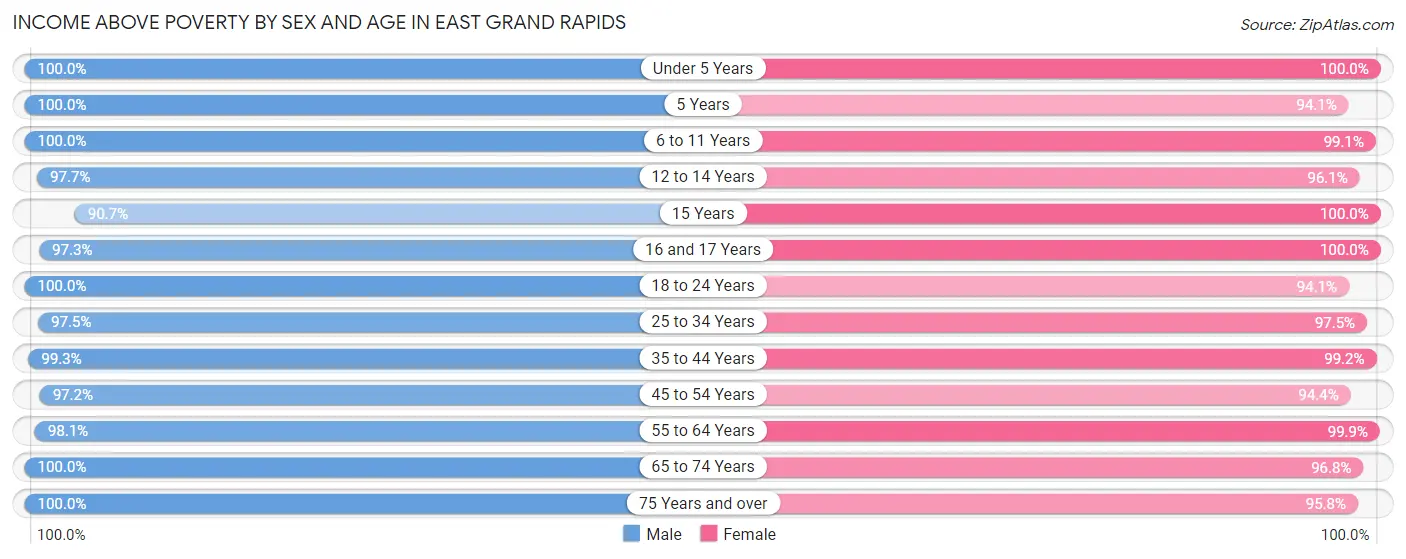
| Age Bracket | Male | Female |
| Under 5 Years | 596 (100.0%) | 400 (100.0%) |
| 5 Years | 87 (100.0%) | 111 (94.1%) |
| 6 to 11 Years | 644 (100.0%) | 773 (99.1%) |
| 12 to 14 Years | 337 (97.7%) | 197 (96.1%) |
| 15 Years | 68 (90.7%) | 108 (100.0%) |
| 16 and 17 Years | 215 (97.3%) | 208 (100.0%) |
| 18 to 24 Years | 259 (100.0%) | 96 (94.1%) |
| 25 to 34 Years | 428 (97.5%) | 540 (97.5%) |
| 35 to 44 Years | 995 (99.3%) | 994 (99.2%) |
| 45 to 54 Years | 688 (97.2%) | 796 (94.4%) |
| 55 to 64 Years | 715 (98.1%) | 711 (99.9%) |
| 65 to 74 Years | 447 (100.0%) | 421 (96.8%) |
| 75 Years and over | 153 (100.0%) | 204 (95.8%) |
| Total | 5,632 (98.7%) | 5,559 (97.9%) |
Income Below Poverty Among Married-Couple Families in East Grand Rapids
The poverty statistics for married-couple families in East Grand Rapids show that 0.5% or 15 of the total 2,917 families live below the poverty line. Families with 1 or 2 children have the highest poverty rate of 1.2%, comprising of 15 families. On the other hand, families with no children have the lowest poverty rate of 0.0%, which includes 0 families.
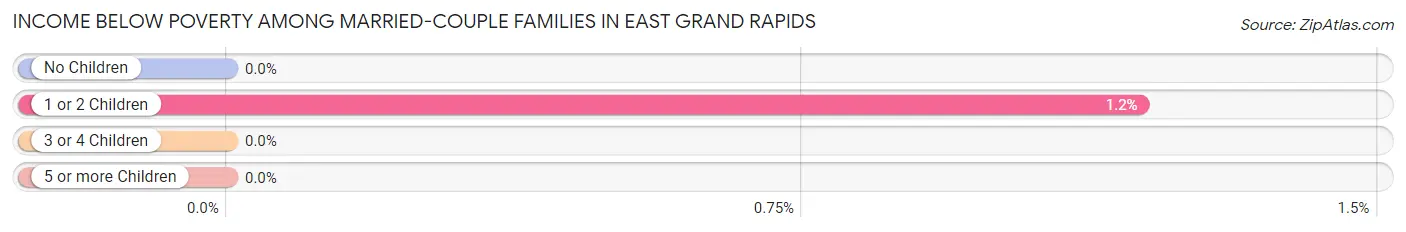
| Children | Above Poverty | Below Poverty |
| No Children | 1,184 (100.0%) | 0 (0.0%) |
| 1 or 2 Children | 1,243 (98.8%) | 15 (1.2%) |
| 3 or 4 Children | 421 (100.0%) | 0 (0.0%) |
| 5 or more Children | 54 (100.0%) | 0 (0.0%) |
| Total | 2,902 (99.5%) | 15 (0.5%) |
Income Below Poverty Among Single-Parent Households in East Grand Rapids
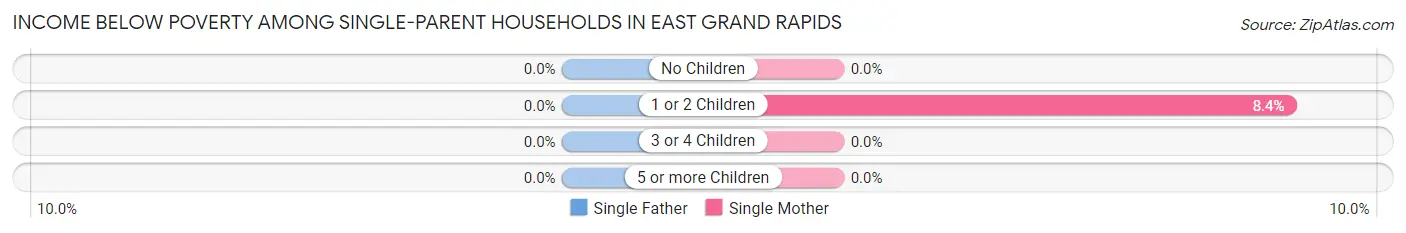
| Children | Single Father | Single Mother |
| No Children | 0 (0.0%) | 0 (0.0%) |
| 1 or 2 Children | 0 (0.0%) | 15 (8.4%) |
| 3 or 4 Children | 0 (0.0%) | 0 (0.0%) |
| 5 or more Children | 0 (0.0%) | 0 (0.0%) |
| Total | 0 (0.0%) | 15 (5.9%) |
Income Below Poverty Among Married-Couple vs Single-Parent Households in East Grand Rapids
The poverty data for East Grand Rapids shows that 15 of the married-couple family households (0.5%) and 15 of the single-parent households (4.8%) are living below the poverty level. Within the married-couple family households, those with 1 or 2 children have the highest poverty rate, with 15 households (1.2%) falling below the poverty line. Among the single-parent households, those with 1 or 2 children have the highest poverty rate, with 15 household (7.3%) living below poverty.
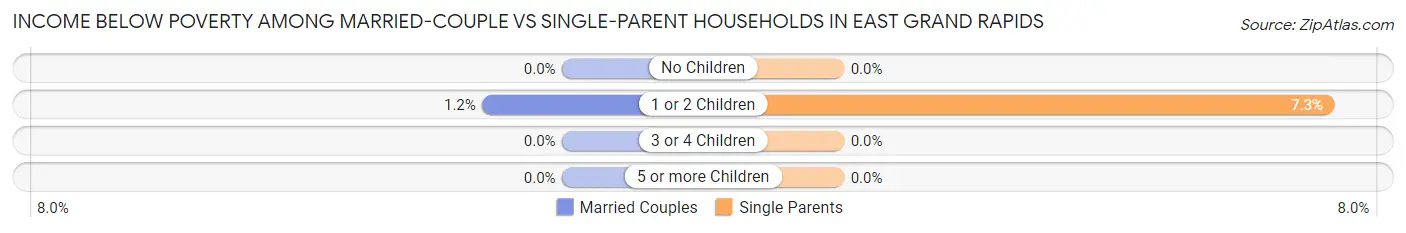
| Children | Married-Couple Families | Single-Parent Households |
| No Children | 0 (0.0%) | 0 (0.0%) |
| 1 or 2 Children | 15 (1.2%) | 15 (7.3%) |
| 3 or 4 Children | 0 (0.0%) | 0 (0.0%) |
| 5 or more Children | 0 (0.0%) | 0 (0.0%) |
| Total | 15 (0.5%) | 15 (4.8%) |
Race in East Grand Rapids
The most populous races in East Grand Rapids are White / Caucasian (10,631 | 93.4%), Two or more Races (376 | 3.3%), and Hispanic or Latino (192 | 1.7%).
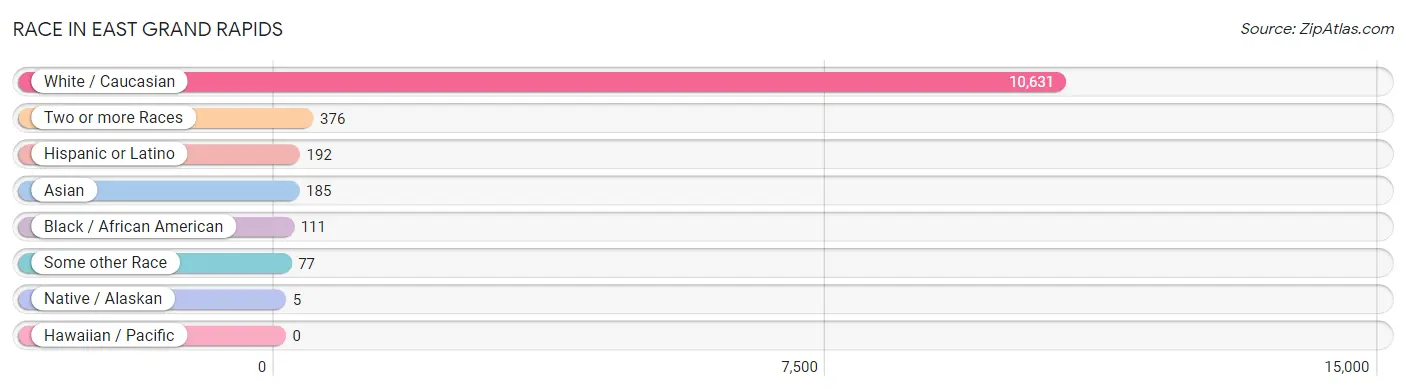
| Race | # Population | % Population |
| Asian | 185 | 1.6% |
| Black / African American | 111 | 1.0% |
| Hawaiian / Pacific | 0 | 0.0% |
| Hispanic or Latino | 192 | 1.7% |
| Native / Alaskan | 5 | 0.0% |
| White / Caucasian | 10,631 | 93.4% |
| Two or more Races | 376 | 3.3% |
| Some other Race | 77 | 0.7% |
| Total | 11,385 | 100.0% |
Ancestry in East Grand Rapids
The most populous ancestries reported in East Grand Rapids are German (2,551 | 22.4%), Irish (1,864 | 16.4%), English (1,676 | 14.7%), Dutch (1,606 | 14.1%), and Polish (950 | 8.3%), together accounting for 76.0% of all East Grand Rapids residents.
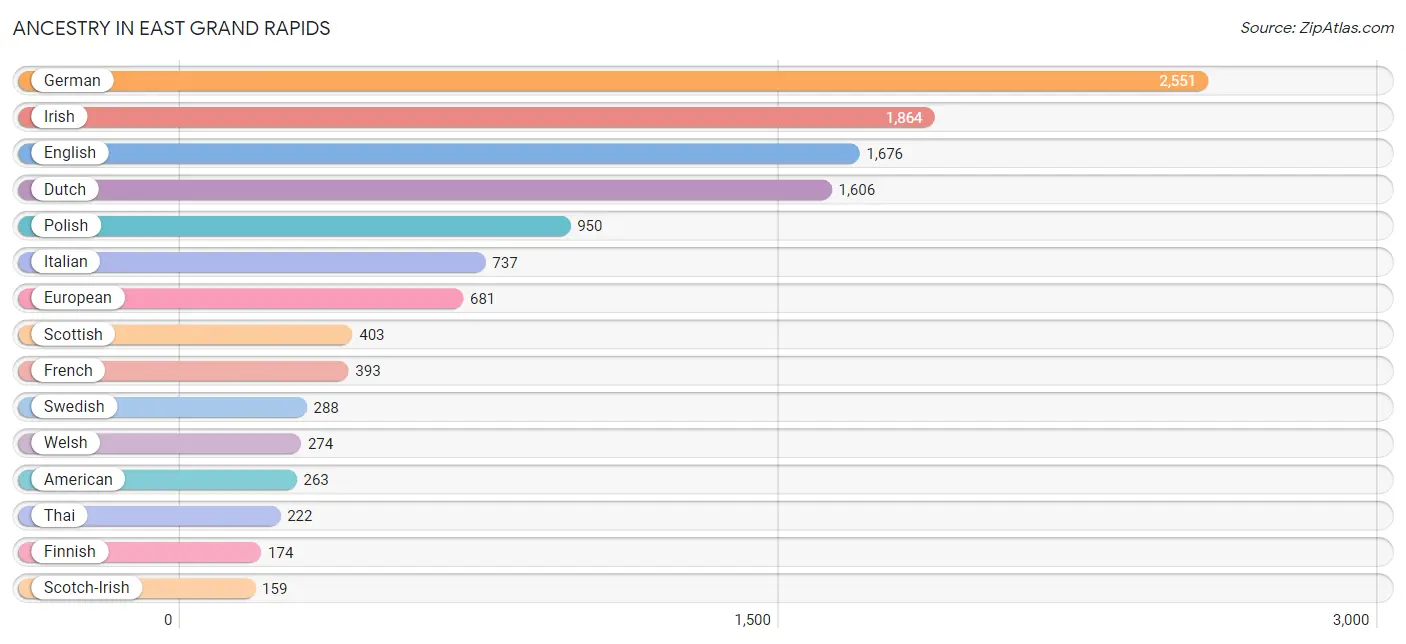
| Ancestry | # Population | % Population |
| African | 8 | 0.1% |
| American | 263 | 2.3% |
| Arab | 144 | 1.3% |
| Argentinean | 23 | 0.2% |
| Armenian | 8 | 0.1% |
| Austrian | 22 | 0.2% |
| Belgian | 43 | 0.4% |
| Bhutanese | 46 | 0.4% |
| Brazilian | 4 | 0.0% |
| British | 74 | 0.6% |
| Burmese | 29 | 0.3% |
| Canadian | 59 | 0.5% |
| Central American | 30 | 0.3% |
| Colombian | 50 | 0.4% |
| Cuban | 12 | 0.1% |
| Czech | 65 | 0.6% |
| Czechoslovakian | 9 | 0.1% |
| Danish | 45 | 0.4% |
| Dutch | 1,606 | 14.1% |
| Eastern European | 62 | 0.5% |
| Egyptian | 14 | 0.1% |
| English | 1,676 | 14.7% |
| Ethiopian | 42 | 0.4% |
| European | 681 | 6.0% |
| Finnish | 174 | 1.5% |
| French | 393 | 3.5% |
| French Canadian | 68 | 0.6% |
| German | 2,551 | 22.4% |
| Greek | 93 | 0.8% |
| Guatemalan | 30 | 0.3% |
| Hungarian | 53 | 0.5% |
| Indian (Asian) | 16 | 0.1% |
| Irish | 1,864 | 16.4% |
| Italian | 737 | 6.5% |
| Korean | 61 | 0.5% |
| Laotian | 9 | 0.1% |
| Lebanese | 123 | 1.1% |
| Lithuanian | 49 | 0.4% |
| Mexican | 40 | 0.4% |
| Northern European | 27 | 0.2% |
| Norwegian | 85 | 0.7% |
| Ottawa | 5 | 0.0% |
| Pakistani | 20 | 0.2% |
| Polish | 950 | 8.3% |
| Portuguese | 21 | 0.2% |
| Romanian | 12 | 0.1% |
| Russian | 62 | 0.5% |
| Scandinavian | 8 | 0.1% |
| Scotch-Irish | 159 | 1.4% |
| Scottish | 403 | 3.5% |
| Serbian | 9 | 0.1% |
| Slovak | 20 | 0.2% |
| South American | 73 | 0.6% |
| Spaniard | 25 | 0.2% |
| Spanish | 12 | 0.1% |
| Sri Lankan | 7 | 0.1% |
| Subsaharan African | 50 | 0.4% |
| Swedish | 288 | 2.5% |
| Swiss | 63 | 0.5% |
| Thai | 222 | 1.9% |
| Ukrainian | 42 | 0.4% |
| Welsh | 274 | 2.4% |
| Yugoslavian | 36 | 0.3% | View All 63 Rows |
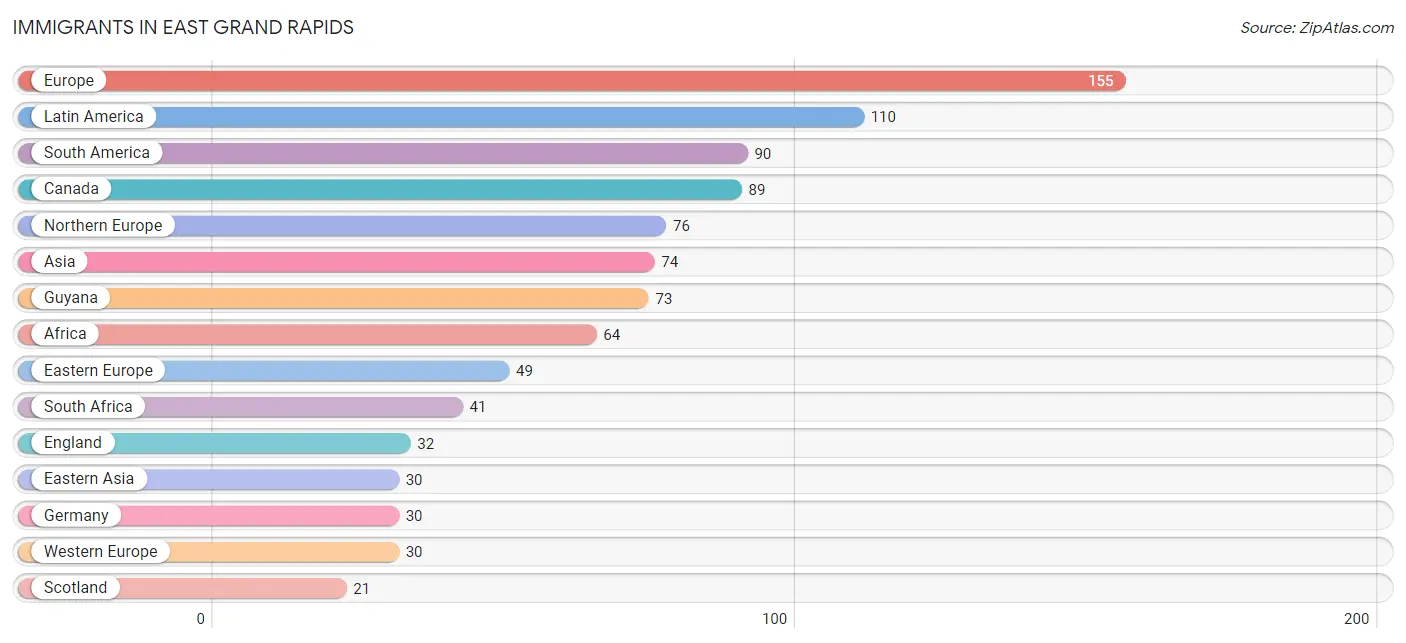
Immigrants in East Grand Rapids
The most numerous immigrant groups reported in East Grand Rapids came from Europe (155 | 1.4%), Latin America (110 | 1.0%), South America (90 | 0.8%), Canada (89 | 0.8%), and Northern Europe (76 | 0.7%), together accounting for 4.6% of all East Grand Rapids residents.
| Immigration Origin | # Population | % Population |
| Africa | 64 | 0.6% |
| Asia | 74 | 0.6% |
| Bosnia and Herzegovina | 18 | 0.2% |
| Bulgaria | 12 | 0.1% |
| Canada | 89 | 0.8% |
| Central America | 20 | 0.2% |
| China | 16 | 0.1% |
| Colombia | 9 | 0.1% |
| Eastern Africa | 9 | 0.1% |
| Eastern Asia | 30 | 0.3% |
| Eastern Europe | 49 | 0.4% |
| England | 32 | 0.3% |
| Eritrea | 9 | 0.1% |
| Europe | 155 | 1.4% |
| Germany | 30 | 0.3% |
| Guatemala | 13 | 0.1% |
| Guyana | 73 | 0.6% |
| Hungary | 7 | 0.1% |
| India | 12 | 0.1% |
| Korea | 14 | 0.1% |
| Latin America | 110 | 1.0% |
| Lebanon | 8 | 0.1% |
| Mexico | 7 | 0.1% |
| Nepal | 6 | 0.1% |
| Northern Africa | 14 | 0.1% |
| Northern Europe | 76 | 0.7% |
| Philippines | 8 | 0.1% |
| Scotland | 21 | 0.2% |
| South Africa | 41 | 0.4% |
| South America | 90 | 0.8% |
| South Central Asia | 18 | 0.2% |
| South Eastern Asia | 18 | 0.2% |
| Thailand | 10 | 0.1% |
| Ukraine | 12 | 0.1% |
| Uruguay | 8 | 0.1% |
| Western Asia | 8 | 0.1% |
| Western Europe | 30 | 0.3% | View All 37 Rows |
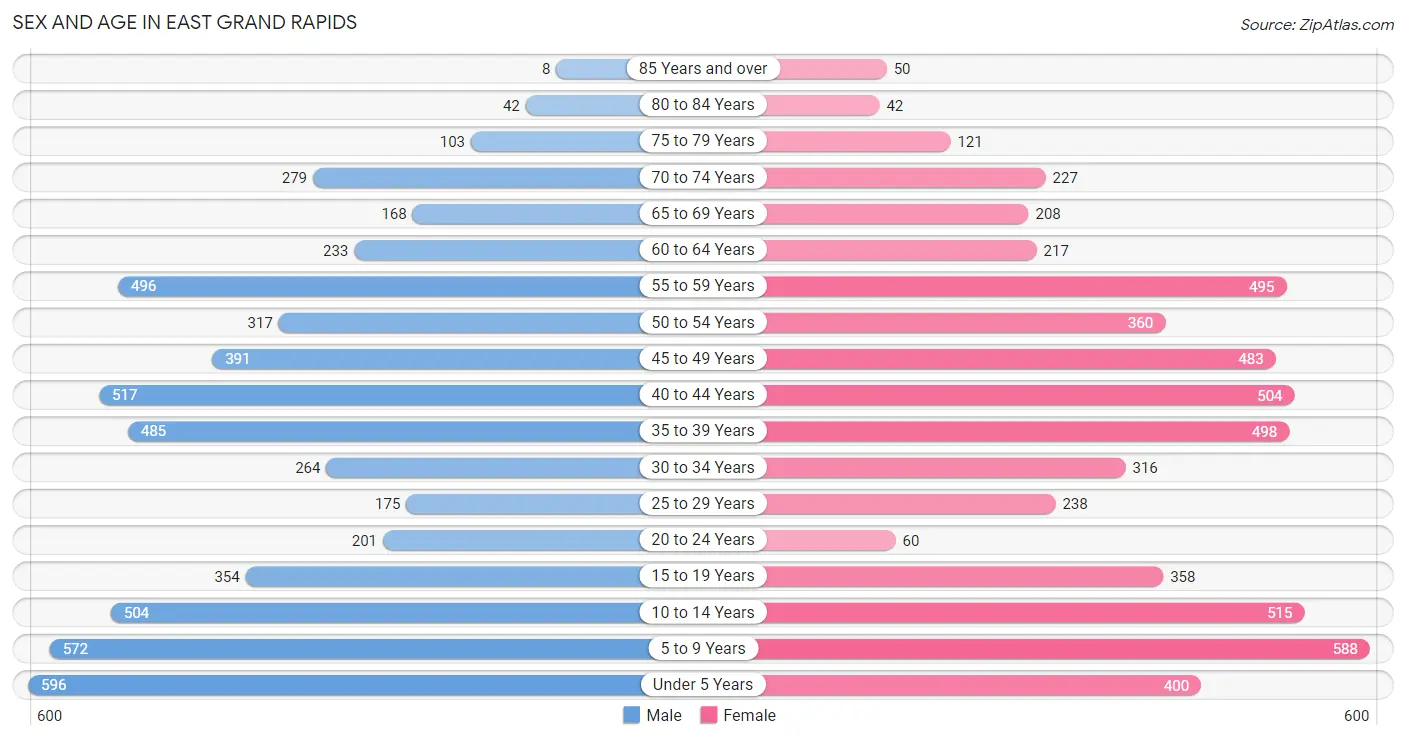
Sex and Age in East Grand Rapids
Sex and Age in East Grand Rapids
The most populous age groups in East Grand Rapids are Under 5 Years (596 | 10.4%) for men and 5 to 9 Years (588 | 10.3%) for women.
| Age Bracket | Male | Female |
| Under 5 Years | 596 (10.4%) | 400 (7.0%) |
| 5 to 9 Years | 572 (10.0%) | 588 (10.3%) |
| 10 to 14 Years | 504 (8.8%) | 515 (9.1%) |
| 15 to 19 Years | 354 (6.2%) | 358 (6.3%) |
| 20 to 24 Years | 201 (3.5%) | 60 (1.1%) |
| 25 to 29 Years | 175 (3.1%) | 238 (4.2%) |
| 30 to 34 Years | 264 (4.6%) | 316 (5.6%) |
| 35 to 39 Years | 485 (8.5%) | 498 (8.8%) |
| 40 to 44 Years | 517 (9.1%) | 504 (8.9%) |
| 45 to 49 Years | 391 (6.9%) | 483 (8.5%) |
| 50 to 54 Years | 317 (5.6%) | 360 (6.3%) |
| 55 to 59 Years | 496 (8.7%) | 495 (8.7%) |
| 60 to 64 Years | 233 (4.1%) | 217 (3.8%) |
| 65 to 69 Years | 168 (2.9%) | 208 (3.7%) |
| 70 to 74 Years | 279 (4.9%) | 227 (4.0%) |
| 75 to 79 Years | 103 (1.8%) | 121 (2.1%) |
| 80 to 84 Years | 42 (0.7%) | 42 (0.7%) |
| 85 Years and over | 8 (0.1%) | 50 (0.9%) |
| Total | 5,705 (100.0%) | 5,680 (100.0%) |
Families and Households in East Grand Rapids
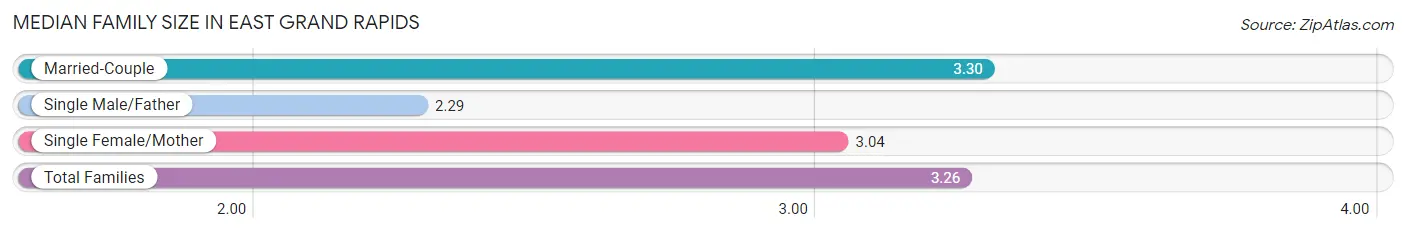
Median Family Size in East Grand Rapids
The median family size in East Grand Rapids is 3.26 persons per family, with married-couple families (2,917 | 90.2%) accounting for the largest median family size of 3.3 persons per family. On the other hand, single male/father families (62 | 1.9%) represent the smallest median family size with 2.29 persons per family.
| Family Type | # Families | Family Size |
| Married-Couple | 2,917 (90.2%) | 3.30 |
| Single Male/Father | 62 (1.9%) | 2.29 |
| Single Female/Mother | 253 (7.8%) | 3.04 |
| Total Families | 3,232 (100.0%) | 3.26 |
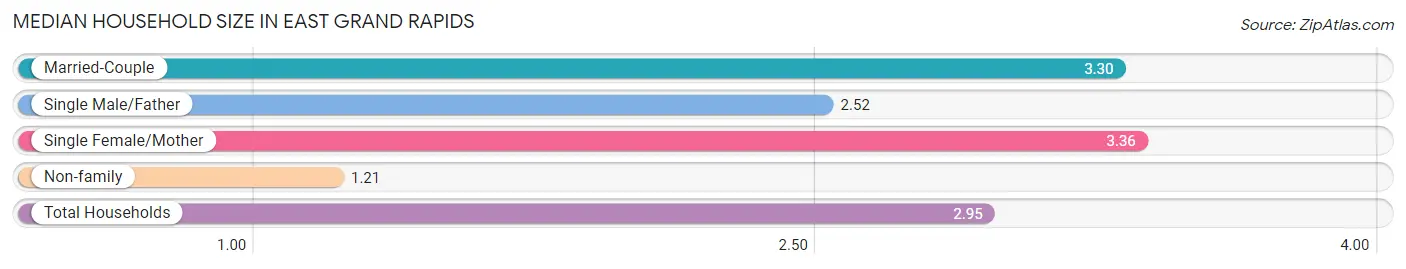
Median Household Size in East Grand Rapids
The median household size in East Grand Rapids is 2.95 persons per household, with single female/mother households (253 | 6.6%) accounting for the largest median household size of 3.36 persons per household. non-family households (618 | 16.1%) represent the smallest median household size with 1.21 persons per household.
| Household Type | # Households | Household Size |
| Married-Couple | 2,917 (75.8%) | 3.30 |
| Single Male/Father | 62 (1.6%) | 2.52 |
| Single Female/Mother | 253 (6.6%) | 3.36 |
| Non-family | 618 (16.1%) | 1.21 |
| Total Households | 3,850 (100.0%) | 2.95 |
Household Size by Marriage Status in East Grand Rapids
Out of a total of 3,850 households in East Grand Rapids, 3,232 (84.0%) are family households, while 618 (16.1%) are nonfamily households. The most numerous type of family households are 2-person households, comprising 1,129, and the most common type of nonfamily households are 1-person households, comprising 497.
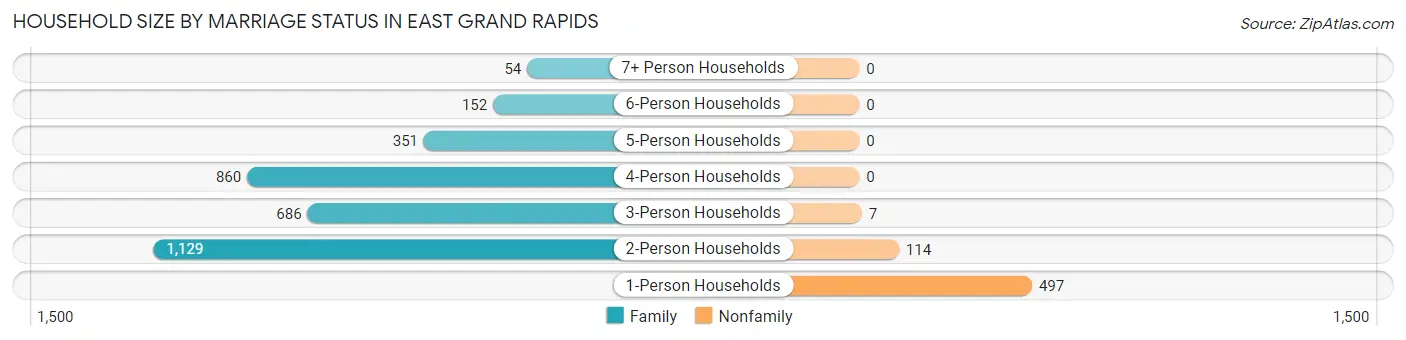
| Household Size | Family Households | Nonfamily Households |
| 1-Person Households | - | 497 (12.9%) |
| 2-Person Households | 1,129 (29.3%) | 114 (3.0%) |
| 3-Person Households | 686 (17.8%) | 7 (0.2%) |
| 4-Person Households | 860 (22.3%) | 0 (0.0%) |
| 5-Person Households | 351 (9.1%) | 0 (0.0%) |
| 6-Person Households | 152 (4.0%) | 0 (0.0%) |
| 7+ Person Households | 54 (1.4%) | 0 (0.0%) |
| Total | 3,232 (84.0%) | 618 (16.1%) |
Female Fertility in East Grand Rapids
Fertility by Age in East Grand Rapids
Average fertility rate in East Grand Rapids is 83.0 births per 1,000 women. Women in the age bracket of 20 to 34 years have the highest fertility rate with 225.0 births per 1,000 women. Women in the age bracket of 20 to 34 years acount for 66.3% of all women with births.
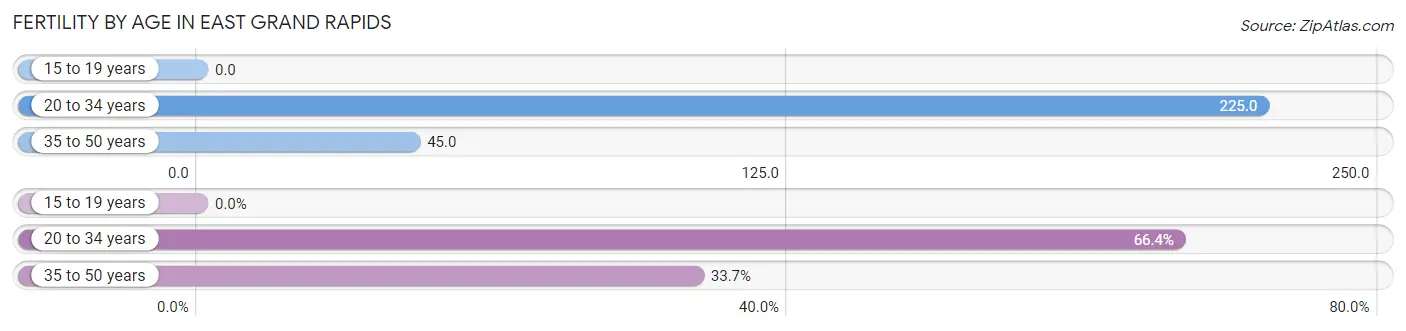
| Age Bracket | Women with Births | Births / 1,000 Women |
| 15 to 19 years | 0 (0.0%) | 0.0 |
| 20 to 34 years | 138 (66.3%) | 225.0 |
| 35 to 50 years | 70 (33.7%) | 45.0 |
| Total | 208 (100.0%) | 83.0 |
Fertility by Age by Marriage Status in East Grand Rapids
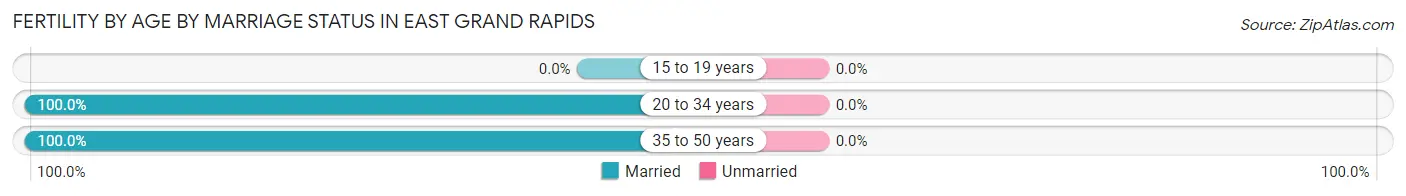
| Age Bracket | Married | Unmarried |
| 15 to 19 years | 0 (0.0%) | 0 (0.0%) |
| 20 to 34 years | 138 (100.0%) | 0 (0.0%) |
| 35 to 50 years | 70 (100.0%) | 0 (0.0%) |
| Total | 208 (100.0%) | 0 (0.0%) |
Fertility by Education in East Grand Rapids
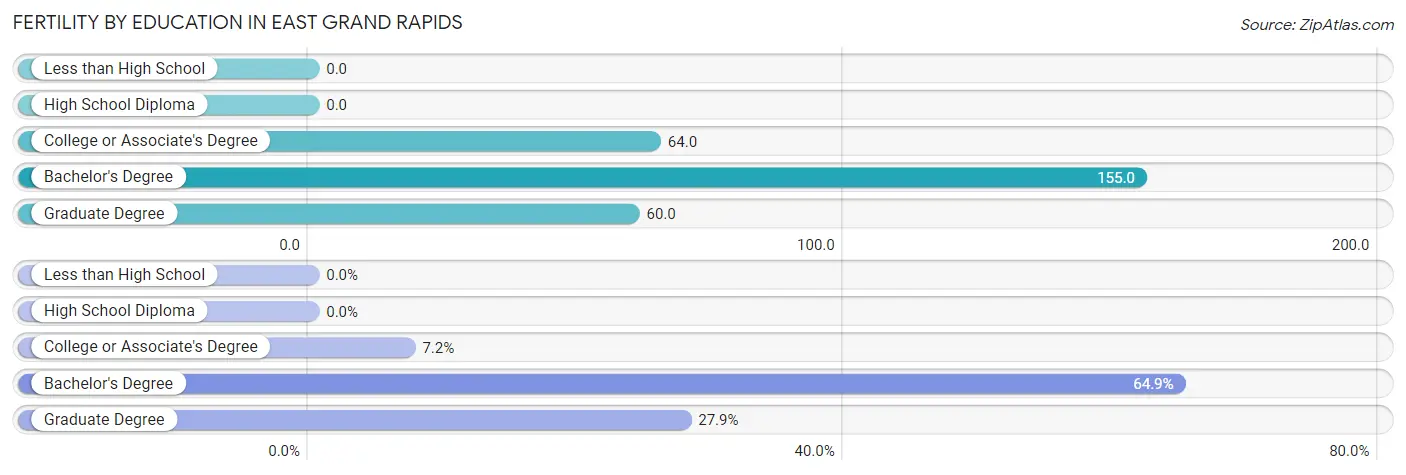
| Educational Attainment | Women with Births | Births / 1,000 Women |
| Less than High School | 0 (0.0%) | 0.0 |
| High School Diploma | 0 (0.0%) | 0.0 |
| College or Associate's Degree | 15 (7.2%) | 64.0 |
| Bachelor's Degree | 135 (64.9%) | 155.0 |
| Graduate Degree | 58 (27.9%) | 60.0 |
| Total | 208 (100.0%) | 83.0 |
Fertility by Education by Marriage Status in East Grand Rapids
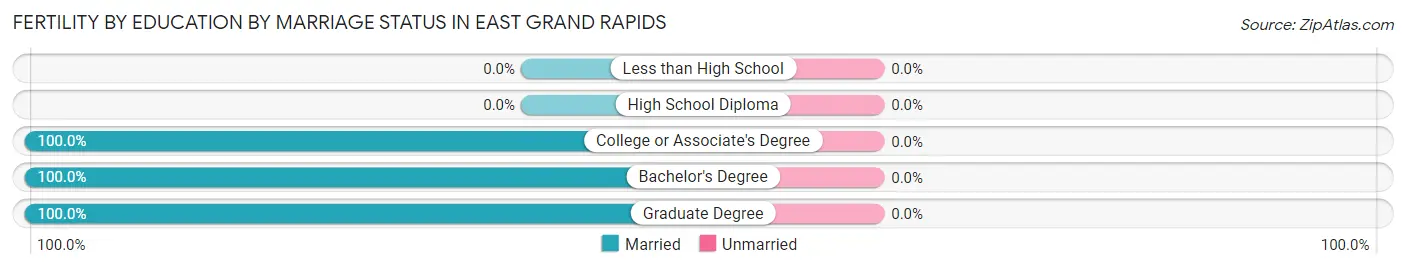
| Educational Attainment | Married | Unmarried |
| Less than High School | 0 (0.0%) | 0 (0.0%) |
| High School Diploma | 0 (0.0%) | 0 (0.0%) |
| College or Associate's Degree | 15 (100.0%) | 0 (0.0%) |
| Bachelor's Degree | 135 (100.0%) | 0 (0.0%) |
| Graduate Degree | 58 (100.0%) | 0 (0.0%) |
| Total | 208 (100.0%) | 0 (0.0%) |
Employment Characteristics in East Grand Rapids
Employment by Class of Employer in East Grand Rapids
Among the 5,595 employed individuals in East Grand Rapids, private company employees (3,418 | 61.1%), not-for-profit organizations (904 | 16.2%), and self-employed (not incorporated) (476 | 8.5%) make up the most common classes of employment.
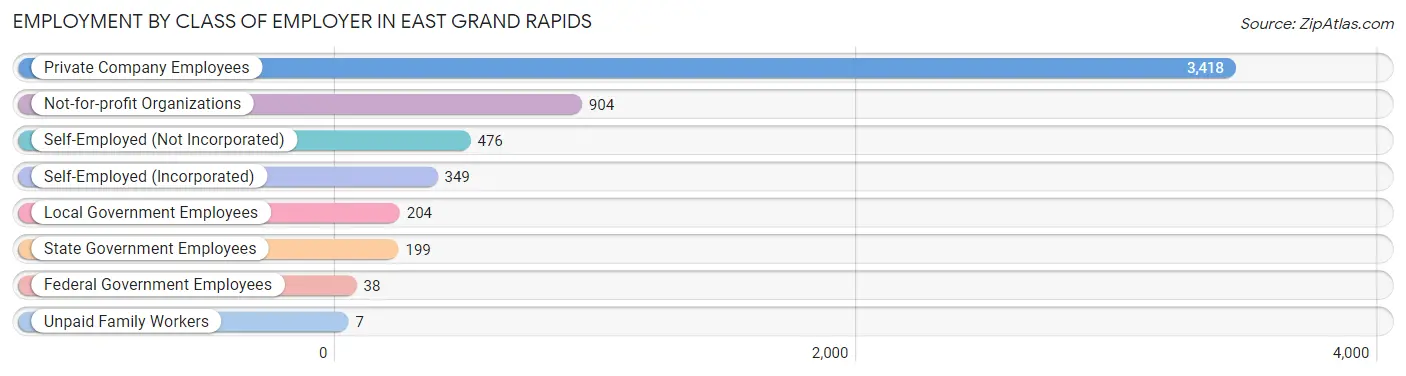
| Employer Class | # Employees | % Employees |
| Private Company Employees | 3,418 | 61.1% |
| Self-Employed (Incorporated) | 349 | 6.2% |
| Self-Employed (Not Incorporated) | 476 | 8.5% |
| Not-for-profit Organizations | 904 | 16.2% |
| Local Government Employees | 204 | 3.6% |
| State Government Employees | 199 | 3.6% |
| Federal Government Employees | 38 | 0.7% |
| Unpaid Family Workers | 7 | 0.1% |
| Total | 5,595 | 100.0% |
Employment Status by Age in East Grand Rapids
According to the labor force statistics for East Grand Rapids, out of the total population over 16 years of age (8,027), 71.9% or 5,771 individuals are in the labor force, with 1.9% or 110 of them unemployed. The age group with the highest labor force participation rate is 35 to 44 years, with 89.6% or 1,796 individuals in the labor force. Within the labor force, the 20 to 24 years age range has the highest percentage of unemployed individuals, with 17.9% or 38 of them being unemployed.
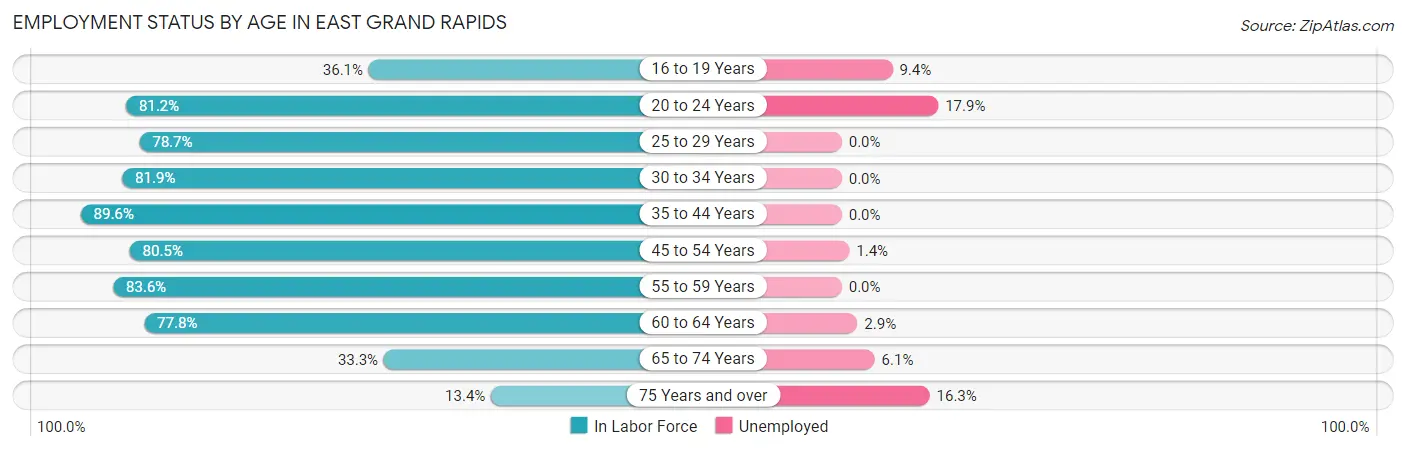
| Age Bracket | In Labor Force | Unemployed |
| 16 to 19 Years | 191 (36.1%) | 18 (9.4%) |
| 20 to 24 Years | 212 (81.2%) | 38 (17.9%) |
| 25 to 29 Years | 325 (78.7%) | 0 (0.0%) |
| 30 to 34 Years | 475 (81.9%) | 0 (0.0%) |
| 35 to 44 Years | 1,796 (89.6%) | 0 (0.0%) |
| 45 to 54 Years | 1,249 (80.5%) | 17 (1.4%) |
| 55 to 59 Years | 828 (83.6%) | 0 (0.0%) |
| 60 to 64 Years | 350 (77.8%) | 10 (2.9%) |
| 65 to 74 Years | 294 (33.3%) | 18 (6.1%) |
| 75 Years and over | 49 (13.4%) | 8 (16.3%) |
| Total | 5,771 (71.9%) | 110 (1.9%) |
Employment Status by Educational Attainment in East Grand Rapids
According to labor force statistics for East Grand Rapids, 83.9% of individuals (5,025) out of the total population between 25 and 64 years of age (5,989) are in the labor force, with 0.6% or 30 of them being unemployed. The group with the highest labor force participation rate are those with the educational attainment of bachelor's degree or higher, with 85.7% or 4,304 individuals in the labor force. Within the labor force, individuals with bachelor's degree or higher education have the highest percentage of unemployment, with 0.7% or 30 of them being unemployed.
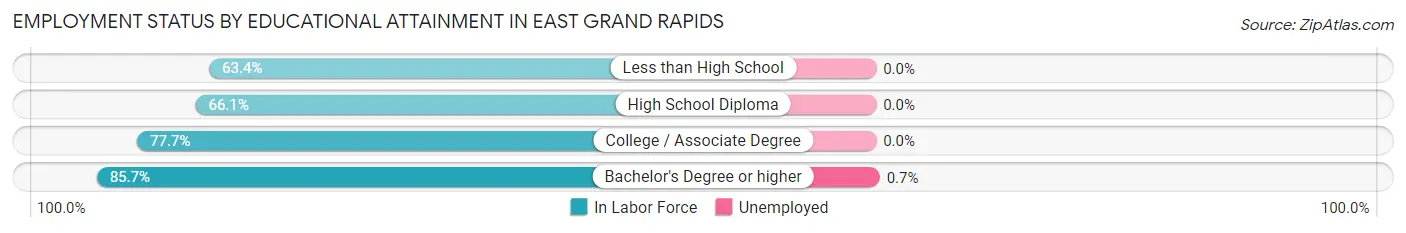
| Educational Attainment | In Labor Force | Unemployed |
| Less than High School | 26 (63.4%) | 0 (0.0%) |
| High School Diploma | 152 (66.1%) | 0 (0.0%) |
| College / Associate Degree | 541 (77.7%) | 0 (0.0%) |
| Bachelor's Degree or higher | 4,304 (85.7%) | 35 (0.7%) |
| Total | 5,025 (83.9%) | 36 (0.6%) |
Employment Occupations by Sex in East Grand Rapids
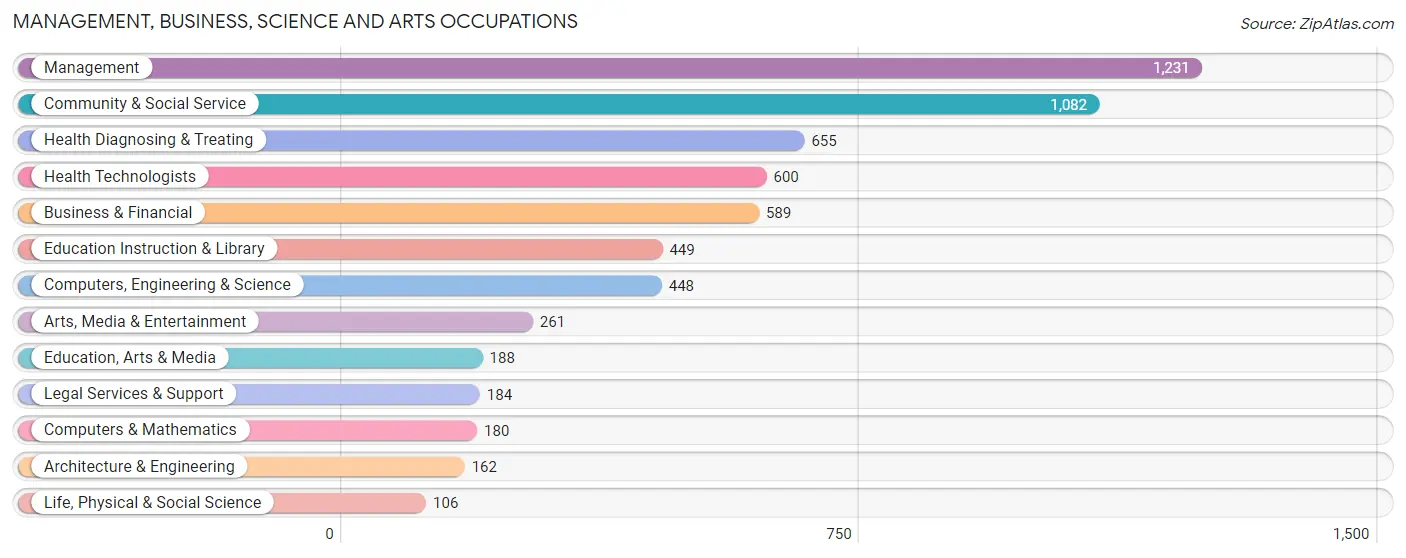
Management, Business, Science and Arts Occupations
The most common Management, Business, Science and Arts occupations in East Grand Rapids are Management (1,231 | 21.8%), Community & Social Service (1,082 | 19.1%), Health Diagnosing & Treating (655 | 11.6%), Health Technologists (600 | 10.6%), and Business & Financial (589 | 10.4%).
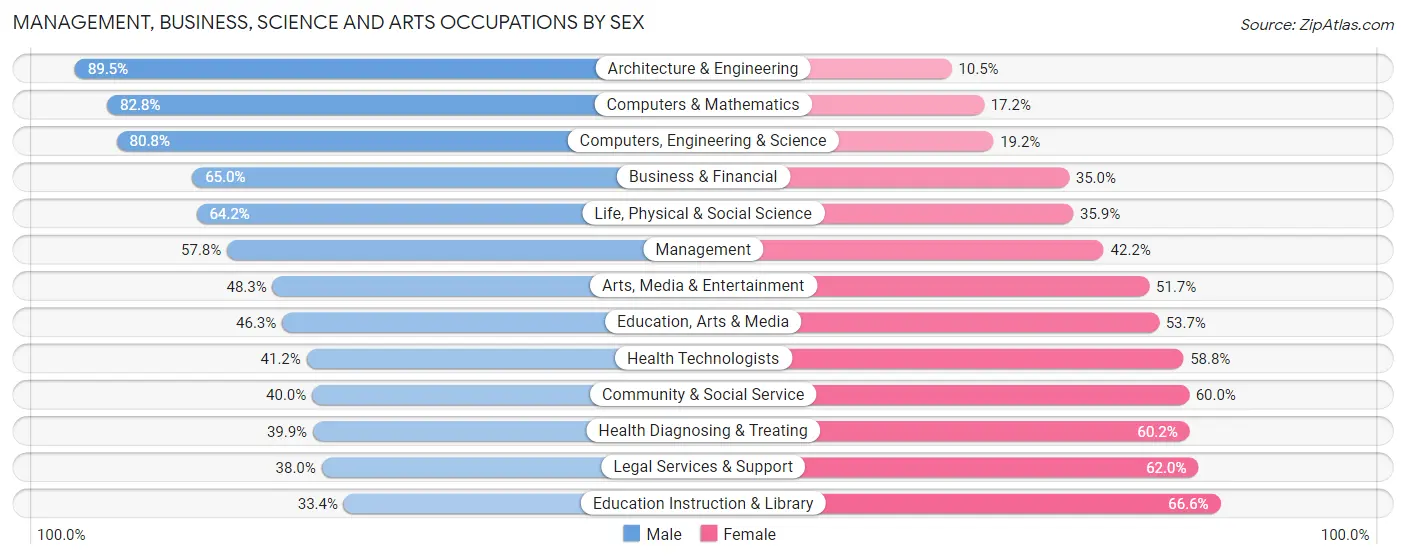
Management, Business, Science and Arts Occupations by Sex
Within the Management, Business, Science and Arts occupations in East Grand Rapids, the most male-oriented occupations are Architecture & Engineering (89.5%), Computers & Mathematics (82.8%), and Computers, Engineering & Science (80.8%), while the most female-oriented occupations are Education Instruction & Library (66.6%), Legal Services & Support (62.0%), and Health Diagnosing & Treating (60.2%).
| Occupation | Male | Female |
| Management | 711 (57.8%) | 520 (42.2%) |
| Business & Financial | 383 (65.0%) | 206 (35.0%) |
| Computers, Engineering & Science | 362 (80.8%) | 86 (19.2%) |
| Computers & Mathematics | 149 (82.8%) | 31 (17.2%) |
| Architecture & Engineering | 145 (89.5%) | 17 (10.5%) |
| Life, Physical & Social Science | 68 (64.1%) | 38 (35.8%) |
| Community & Social Service | 433 (40.0%) | 649 (60.0%) |
| Education, Arts & Media | 87 (46.3%) | 101 (53.7%) |
| Legal Services & Support | 70 (38.0%) | 114 (62.0%) |
| Education Instruction & Library | 150 (33.4%) | 299 (66.6%) |
| Arts, Media & Entertainment | 126 (48.3%) | 135 (51.7%) |
| Health Diagnosing & Treating | 261 (39.9%) | 394 (60.2%) |
| Health Technologists | 247 (41.2%) | 353 (58.8%) |
| Total (Category) | 2,150 (53.7%) | 1,855 (46.3%) |
| Total (Overall) | 3,187 (56.3%) | 2,471 (43.7%) |
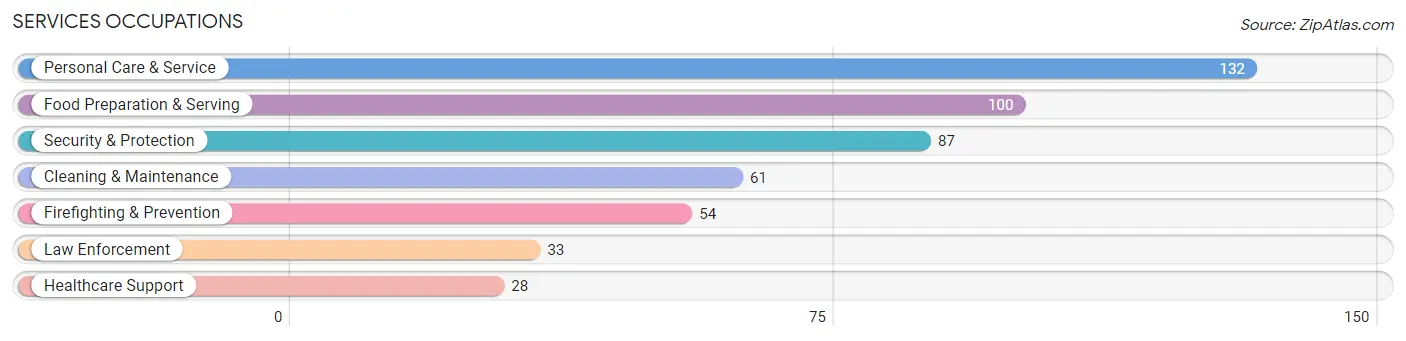
Services Occupations
The most common Services occupations in East Grand Rapids are Personal Care & Service (132 | 2.3%), Food Preparation & Serving (100 | 1.8%), Security & Protection (87 | 1.5%), Cleaning & Maintenance (61 | 1.1%), and Firefighting & Prevention (54 | 0.9%).
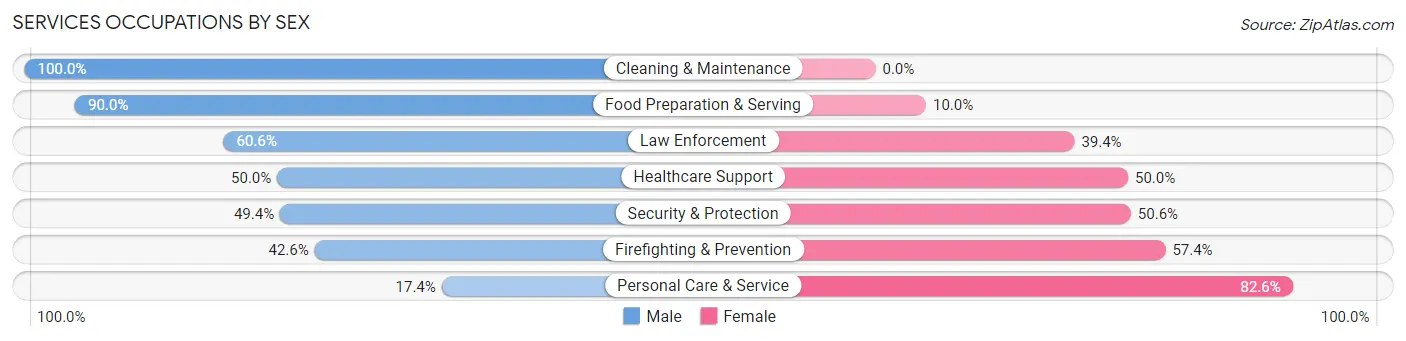
Services Occupations by Sex
Within the Services occupations in East Grand Rapids, the most male-oriented occupations are Cleaning & Maintenance (100.0%), Food Preparation & Serving (90.0%), and Law Enforcement (60.6%), while the most female-oriented occupations are Personal Care & Service (82.6%), Firefighting & Prevention (57.4%), and Security & Protection (50.6%).
| Occupation | Male | Female |
| Healthcare Support | 14 (50.0%) | 14 (50.0%) |
| Security & Protection | 43 (49.4%) | 44 (50.6%) |
| Firefighting & Prevention | 23 (42.6%) | 31 (57.4%) |
| Law Enforcement | 20 (60.6%) | 13 (39.4%) |
| Food Preparation & Serving | 90 (90.0%) | 10 (10.0%) |
| Cleaning & Maintenance | 61 (100.0%) | 0 (0.0%) |
| Personal Care & Service | 23 (17.4%) | 109 (82.6%) |
| Total (Category) | 231 (56.6%) | 177 (43.4%) |
| Total (Overall) | 3,187 (56.3%) | 2,471 (43.7%) |
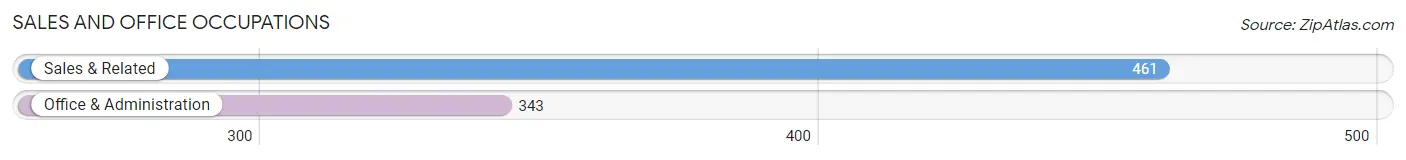
Sales and Office Occupations
The most common Sales and Office occupations in East Grand Rapids are Sales & Related (461 | 8.2%), and Office & Administration (343 | 6.1%).
Sales and Office Occupations by Sex
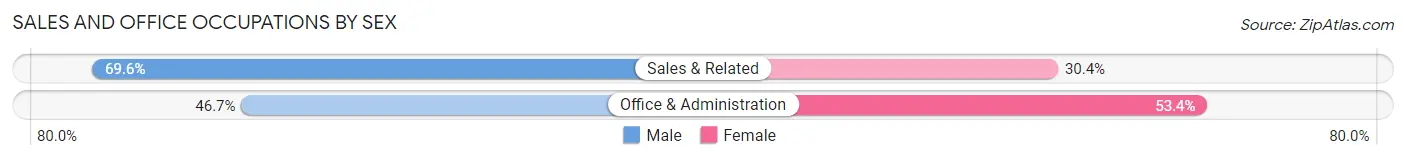
| Occupation | Male | Female |
| Sales & Related | 321 (69.6%) | 140 (30.4%) |
| Office & Administration | 160 (46.7%) | 183 (53.3%) |
| Total (Category) | 481 (59.8%) | 323 (40.2%) |
| Total (Overall) | 3,187 (56.3%) | 2,471 (43.7%) |
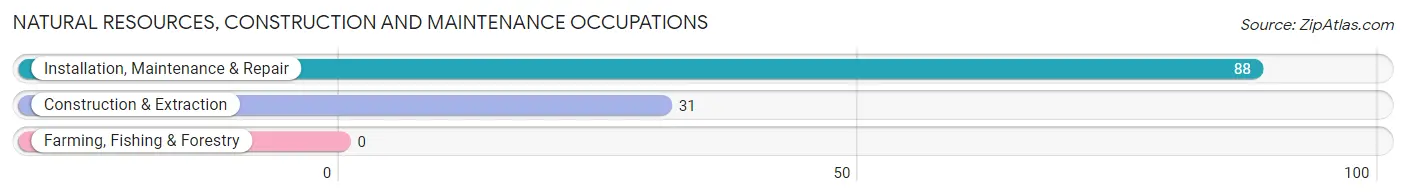
Natural Resources, Construction and Maintenance Occupations
The most common Natural Resources, Construction and Maintenance occupations in East Grand Rapids are Installation, Maintenance & Repair (88 | 1.6%), and Construction & Extraction (31 | 0.5%).
Natural Resources, Construction and Maintenance Occupations by Sex
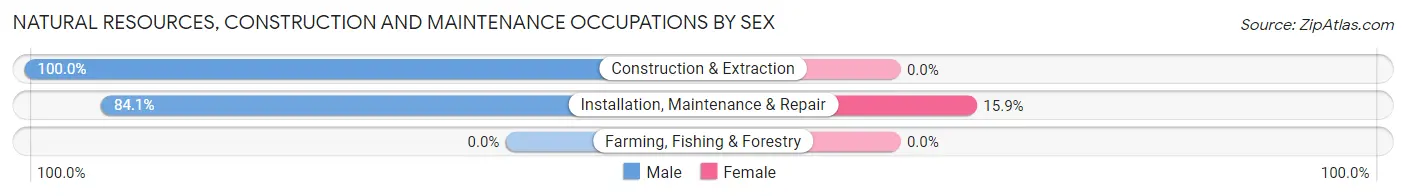
| Occupation | Male | Female |
| Farming, Fishing & Forestry | 0 (0.0%) | 0 (0.0%) |
| Construction & Extraction | 31 (100.0%) | 0 (0.0%) |
| Installation, Maintenance & Repair | 74 (84.1%) | 14 (15.9%) |
| Total (Category) | 105 (88.2%) | 14 (11.8%) |
| Total (Overall) | 3,187 (56.3%) | 2,471 (43.7%) |
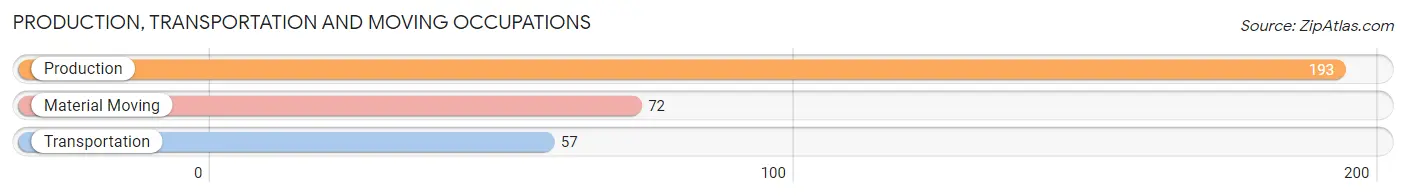
Production, Transportation and Moving Occupations
The most common Production, Transportation and Moving occupations in East Grand Rapids are Production (193 | 3.4%), Material Moving (72 | 1.3%), and Transportation (57 | 1.0%).
Production, Transportation and Moving Occupations by Sex
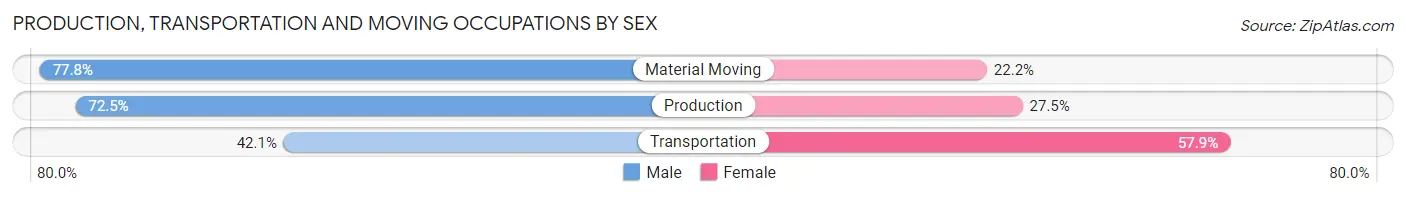
| Occupation | Male | Female |
| Production | 140 (72.5%) | 53 (27.5%) |
| Transportation | 24 (42.1%) | 33 (57.9%) |
| Material Moving | 56 (77.8%) | 16 (22.2%) |
| Total (Category) | 220 (68.3%) | 102 (31.7%) |
| Total (Overall) | 3,187 (56.3%) | 2,471 (43.7%) |
Employment Industries by Sex in East Grand Rapids
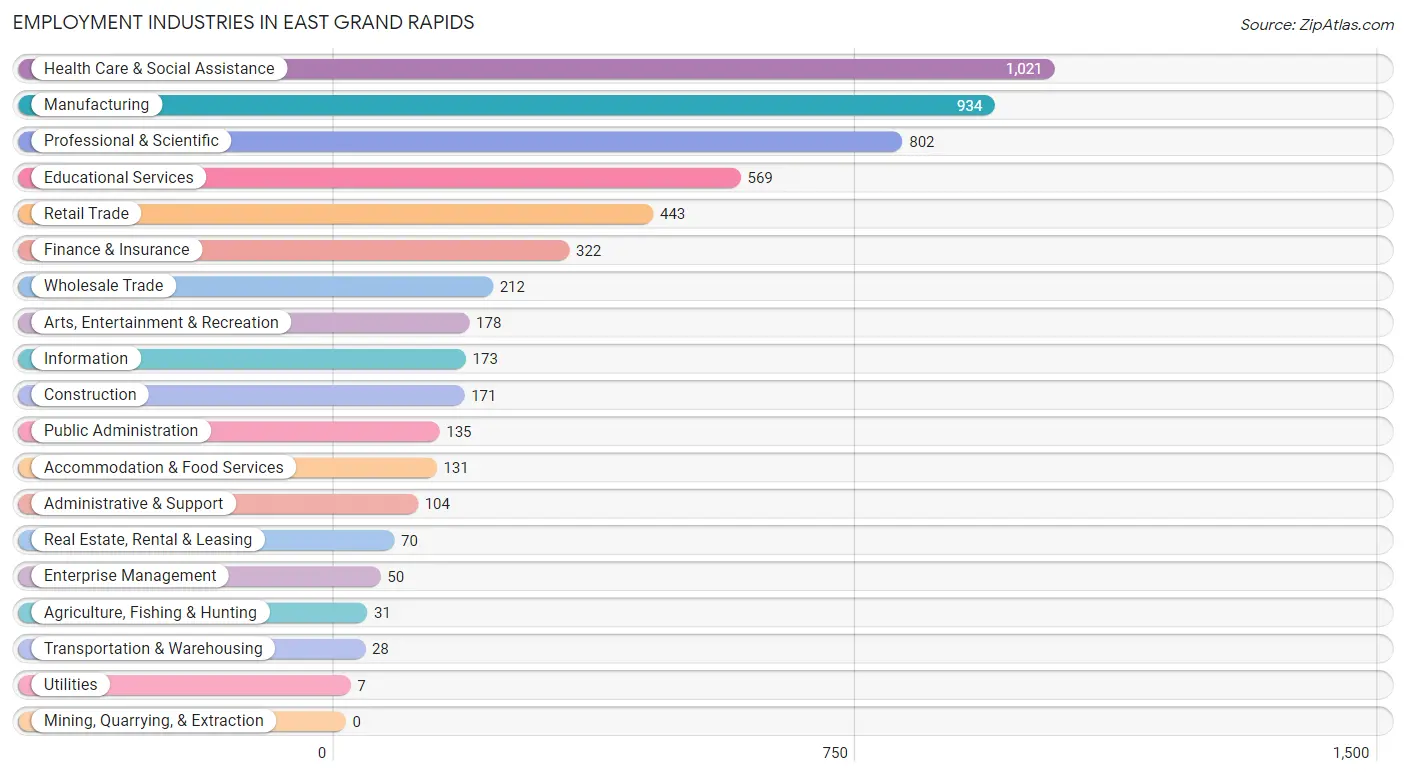
Employment Industries in East Grand Rapids
The major employment industries in East Grand Rapids include Health Care & Social Assistance (1,021 | 18.0%), Manufacturing (934 | 16.5%), Professional & Scientific (802 | 14.2%), Educational Services (569 | 10.1%), and Retail Trade (443 | 7.8%).
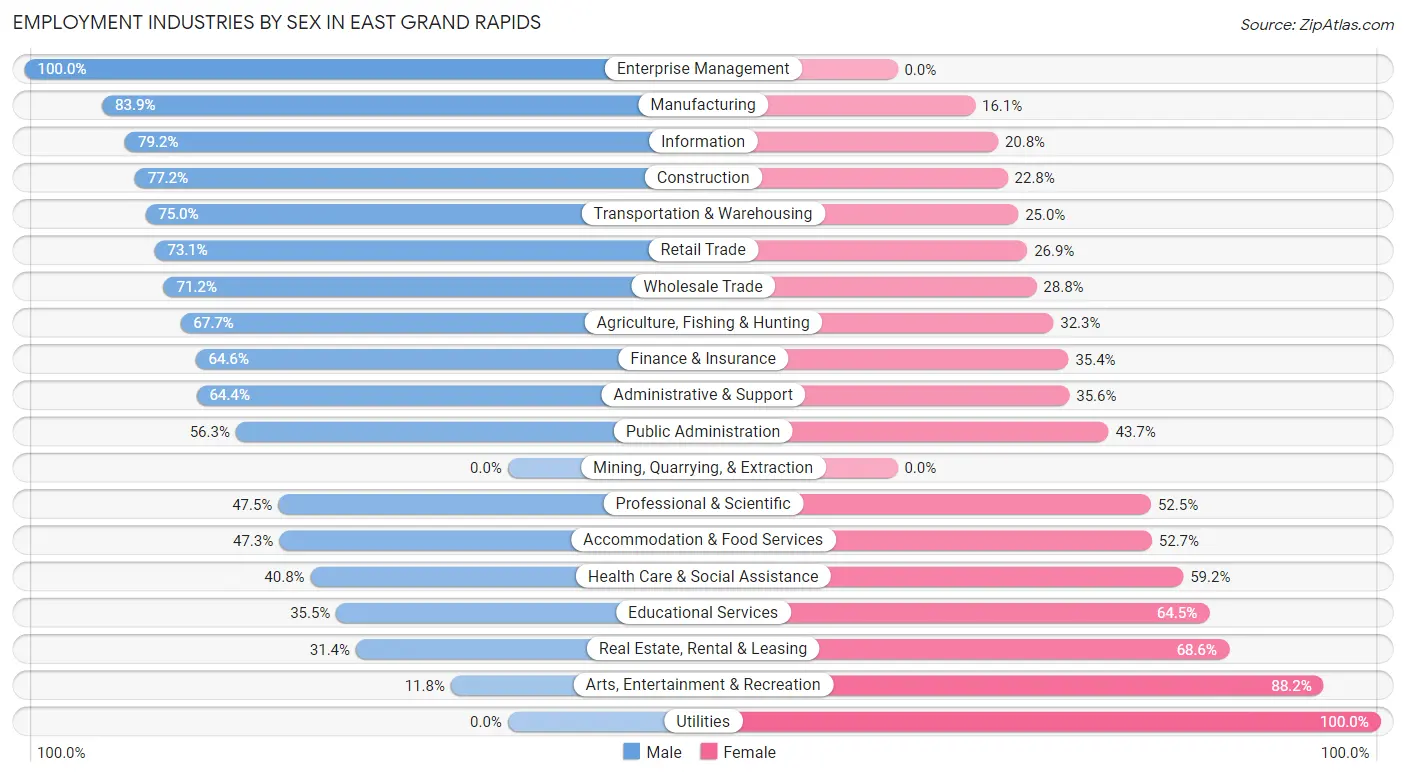
Employment Industries by Sex in East Grand Rapids
The East Grand Rapids industries that see more men than women are Enterprise Management (100.0%), Manufacturing (83.9%), and Information (79.2%), whereas the industries that tend to have a higher number of women are Utilities (100.0%), Arts, Entertainment & Recreation (88.2%), and Real Estate, Rental & Leasing (68.6%).
| Industry | Male | Female |
| Agriculture, Fishing & Hunting | 21 (67.7%) | 10 (32.3%) |
| Mining, Quarrying, & Extraction | 0 (0.0%) | 0 (0.0%) |
| Construction | 132 (77.2%) | 39 (22.8%) |
| Manufacturing | 784 (83.9%) | 150 (16.1%) |
| Wholesale Trade | 151 (71.2%) | 61 (28.8%) |
| Retail Trade | 324 (73.1%) | 119 (26.9%) |
| Transportation & Warehousing | 21 (75.0%) | 7 (25.0%) |
| Utilities | 0 (0.0%) | 7 (100.0%) |
| Information | 137 (79.2%) | 36 (20.8%) |
| Finance & Insurance | 208 (64.6%) | 114 (35.4%) |
| Real Estate, Rental & Leasing | 22 (31.4%) | 48 (68.6%) |
| Professional & Scientific | 381 (47.5%) | 421 (52.5%) |
| Enterprise Management | 50 (100.0%) | 0 (0.0%) |
| Administrative & Support | 67 (64.4%) | 37 (35.6%) |
| Educational Services | 202 (35.5%) | 367 (64.5%) |
| Health Care & Social Assistance | 417 (40.8%) | 604 (59.2%) |
| Arts, Entertainment & Recreation | 21 (11.8%) | 157 (88.2%) |
| Accommodation & Food Services | 62 (47.3%) | 69 (52.7%) |
| Public Administration | 76 (56.3%) | 59 (43.7%) |
| Total | 3,187 (56.3%) | 2,471 (43.7%) |
Education in East Grand Rapids
School Enrollment in East Grand Rapids
The most common levels of schooling among the 3,483 students in East Grand Rapids are elementary school (862 | 24.7%), middle school (821 | 23.6%), and high school (732 | 21.0%).
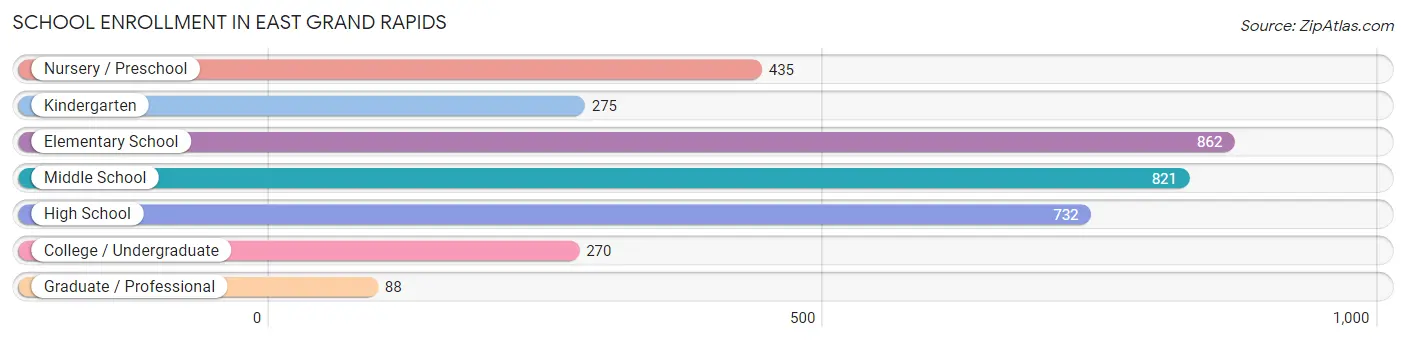
| School Level | # Students | % Students |
| Nursery / Preschool | 435 | 12.5% |
| Kindergarten | 275 | 7.9% |
| Elementary School | 862 | 24.7% |
| Middle School | 821 | 23.6% |
| High School | 732 | 21.0% |
| College / Undergraduate | 270 | 7.7% |
| Graduate / Professional | 88 | 2.5% |
| Total | 3,483 | 100.0% |
School Enrollment by Age by Funding Source in East Grand Rapids
Out of a total of 3,483 students who are enrolled in schools in East Grand Rapids, 630 (18.1%) attend a private institution, while the remaining 2,853 (81.9%) are enrolled in public schools. The age group of 3 to 4 year olds has the highest likelihood of being enrolled in private schools, with 197 (58.3% in the age bracket) enrolled. Conversely, the age group of 10 to 14 year olds has the lowest likelihood of being enrolled in a private school, with 952 (94.1% in the age bracket) attending a public institution.
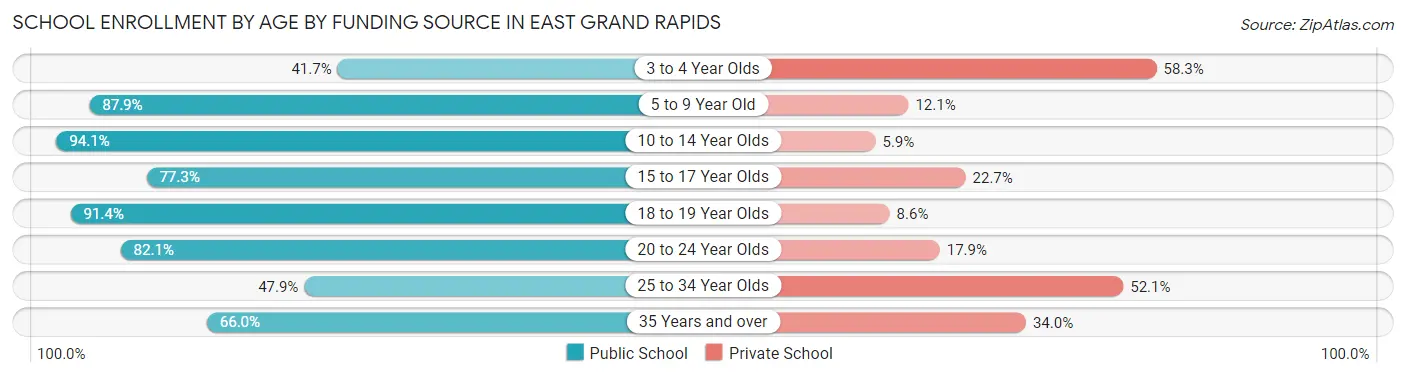
| Age Bracket | Public School | Private School |
| 3 to 4 Year Olds | 141 (41.7%) | 197 (58.3%) |
| 5 to 9 Year Old | 998 (87.9%) | 137 (12.1%) |
| 10 to 14 Year Olds | 952 (94.1%) | 60 (5.9%) |
| 15 to 17 Year Olds | 473 (77.3%) | 139 (22.7%) |
| 18 to 19 Year Olds | 64 (91.4%) | 6 (8.6%) |
| 20 to 24 Year Olds | 133 (82.1%) | 29 (17.9%) |
| 25 to 34 Year Olds | 23 (47.9%) | 25 (52.1%) |
| 35 Years and over | 70 (66.0%) | 36 (34.0%) |
| Total | 2,853 (81.9%) | 630 (18.1%) |
Educational Attainment by Field of Study in East Grand Rapids
Business (1,278 | 19.9%), liberal arts & history (573 | 8.9%), education (565 | 8.8%), science & technology (488 | 7.6%), and bio, nature & agricultural (473 | 7.4%) are the most common fields of study among 6,419 individuals in East Grand Rapids who have obtained a bachelor's degree or higher.
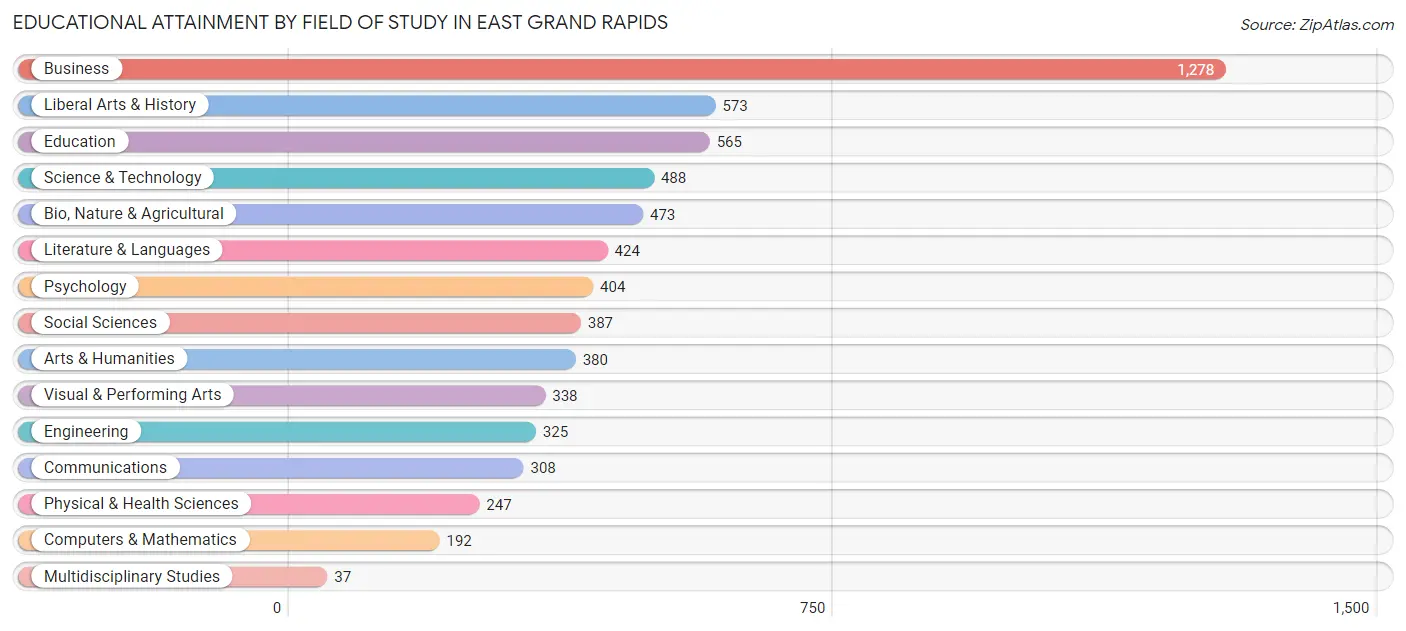
| Field of Study | # Graduates | % Graduates |
| Computers & Mathematics | 192 | 3.0% |
| Bio, Nature & Agricultural | 473 | 7.4% |
| Physical & Health Sciences | 247 | 3.8% |
| Psychology | 404 | 6.3% |
| Social Sciences | 387 | 6.0% |
| Engineering | 325 | 5.1% |
| Multidisciplinary Studies | 37 | 0.6% |
| Science & Technology | 488 | 7.6% |
| Business | 1,278 | 19.9% |
| Education | 565 | 8.8% |
| Literature & Languages | 424 | 6.6% |
| Liberal Arts & History | 573 | 8.9% |
| Visual & Performing Arts | 338 | 5.3% |
| Communications | 308 | 4.8% |
| Arts & Humanities | 380 | 5.9% |
| Total | 6,419 | 100.0% |
Transportation & Commute in East Grand Rapids
Vehicle Availability by Sex in East Grand Rapids
The most prevalent vehicle ownership categories in East Grand Rapids are males with 2 vehicles (2,036, accounting for 64.8%) and females with 2 vehicles (1,509, making up 83.0%).
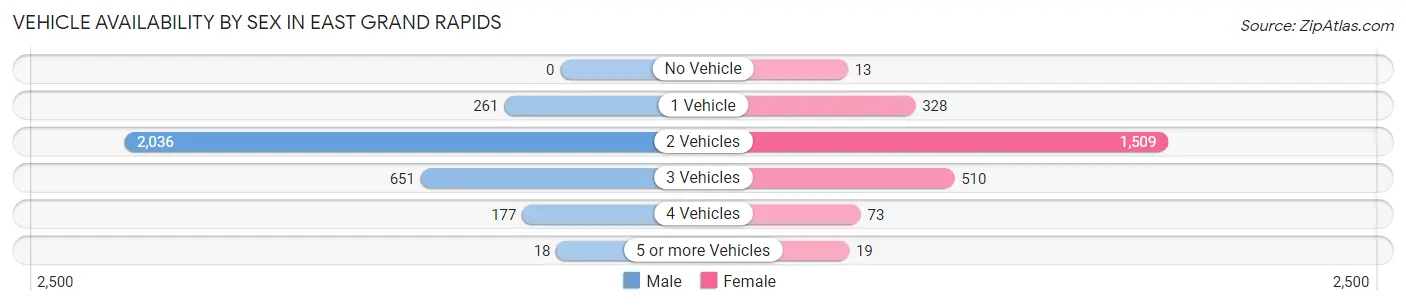
| Vehicles Available | Male | Female |
| No Vehicle | 0 (0.0%) | 13 (0.5%) |
| 1 Vehicle | 261 (8.3%) | 328 (13.4%) |
| 2 Vehicles | 2,036 (64.8%) | 1,509 (61.5%) |
| 3 Vehicles | 651 (20.7%) | 510 (20.8%) |
| 4 Vehicles | 177 (5.6%) | 73 (3.0%) |
| 5 or more Vehicles | 18 (0.6%) | 19 (0.8%) |
| Total | 3,143 (100.0%) | 2,452 (100.0%) |
Commute Time in East Grand Rapids
The most frequently occuring commute durations in East Grand Rapids are 15 to 19 minutes (1,189 commuters, 26.3%), 10 to 14 minutes (934 commuters, 20.7%), and 5 to 9 minutes (619 commuters, 13.7%).
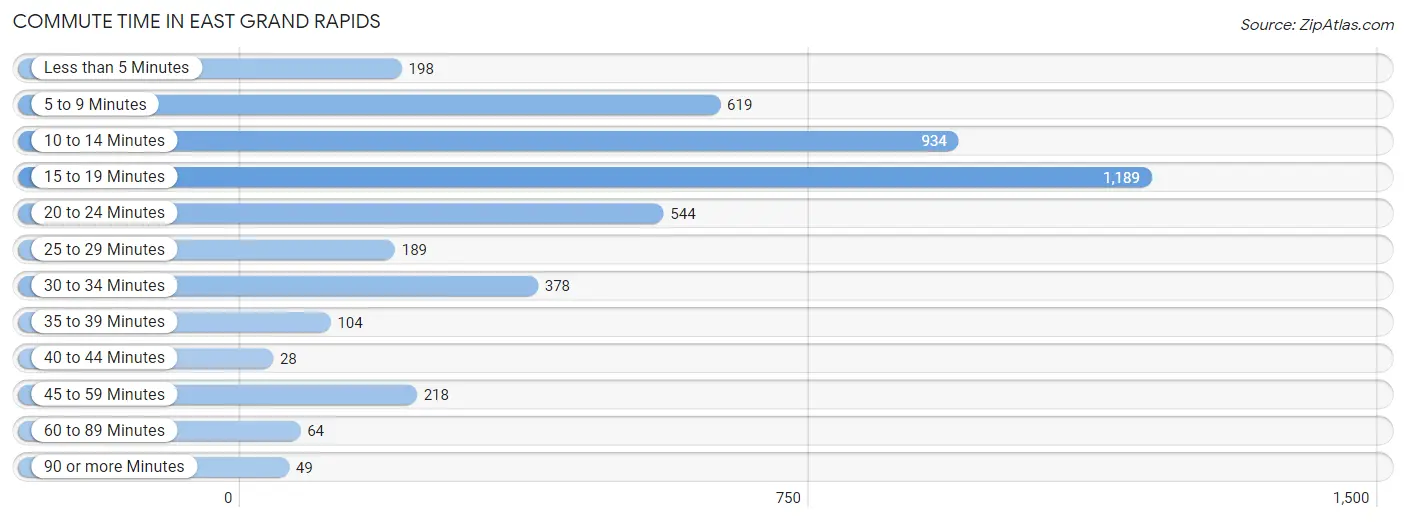
| Commute Time | # Commuters | % Commuters |
| Less than 5 Minutes | 198 | 4.4% |
| 5 to 9 Minutes | 619 | 13.7% |
| 10 to 14 Minutes | 934 | 20.7% |
| 15 to 19 Minutes | 1,189 | 26.3% |
| 20 to 24 Minutes | 544 | 12.0% |
| 25 to 29 Minutes | 189 | 4.2% |
| 30 to 34 Minutes | 378 | 8.4% |
| 35 to 39 Minutes | 104 | 2.3% |
| 40 to 44 Minutes | 28 | 0.6% |
| 45 to 59 Minutes | 218 | 4.8% |
| 60 to 89 Minutes | 64 | 1.4% |
| 90 or more Minutes | 49 | 1.1% |
Commute Time by Sex in East Grand Rapids
The most common commute times in East Grand Rapids are 15 to 19 minutes (704 commuters, 27.0%) for males and 15 to 19 minutes (485 commuters, 25.4%) for females.
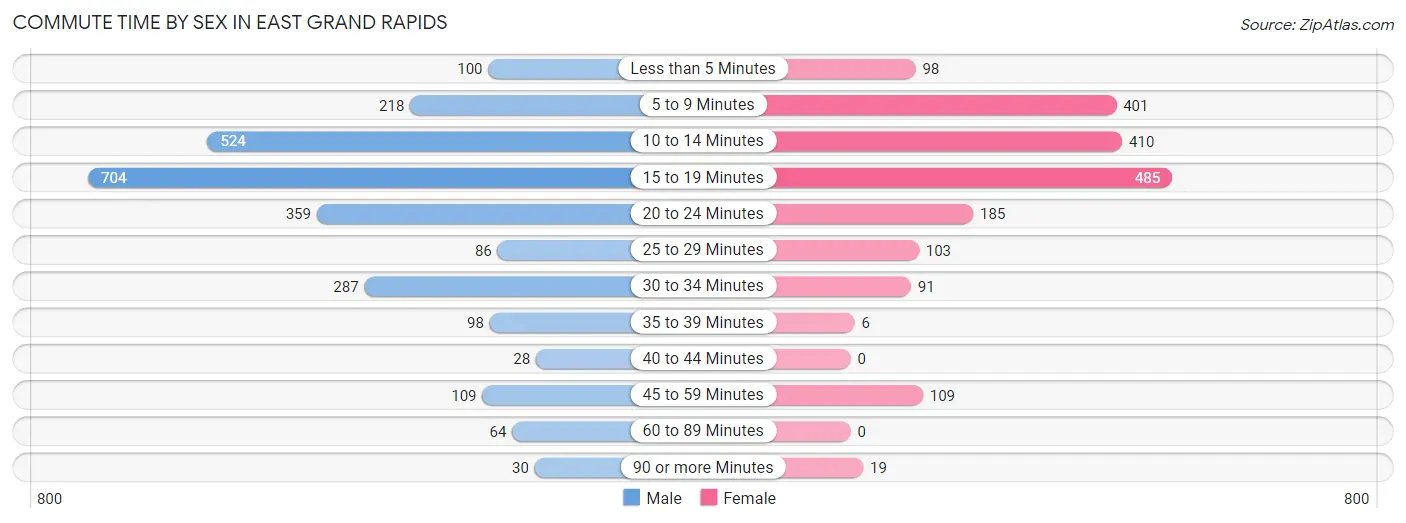
| Commute Time | Male | Female |
| Less than 5 Minutes | 100 (3.8%) | 98 (5.1%) |
| 5 to 9 Minutes | 218 (8.4%) | 401 (21.0%) |
| 10 to 14 Minutes | 524 (20.1%) | 410 (21.5%) |
| 15 to 19 Minutes | 704 (27.0%) | 485 (25.4%) |
| 20 to 24 Minutes | 359 (13.8%) | 185 (9.7%) |
| 25 to 29 Minutes | 86 (3.3%) | 103 (5.4%) |
| 30 to 34 Minutes | 287 (11.0%) | 91 (4.8%) |
| 35 to 39 Minutes | 98 (3.8%) | 6 (0.3%) |
| 40 to 44 Minutes | 28 (1.1%) | 0 (0.0%) |
| 45 to 59 Minutes | 109 (4.2%) | 109 (5.7%) |
| 60 to 89 Minutes | 64 (2.5%) | 0 (0.0%) |
| 90 or more Minutes | 30 (1.1%) | 19 (1.0%) |
Time of Departure to Work by Sex in East Grand Rapids
The most frequent times of departure to work in East Grand Rapids are 8:00 AM to 8:29 AM (591, 22.7%) for males and 8:00 AM to 8:29 AM (489, 25.6%) for females.
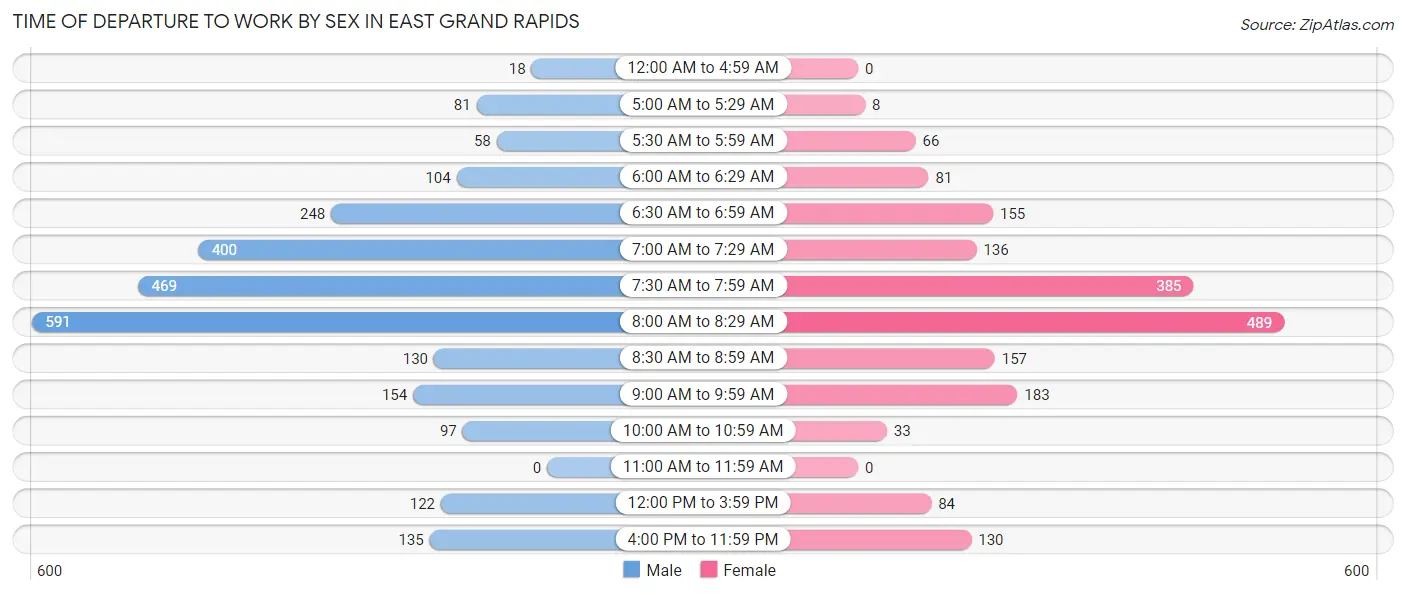
| Time of Departure | Male | Female |
| 12:00 AM to 4:59 AM | 18 (0.7%) | 0 (0.0%) |
| 5:00 AM to 5:29 AM | 81 (3.1%) | 8 (0.4%) |
| 5:30 AM to 5:59 AM | 58 (2.2%) | 66 (3.5%) |
| 6:00 AM to 6:29 AM | 104 (4.0%) | 81 (4.3%) |
| 6:30 AM to 6:59 AM | 248 (9.5%) | 155 (8.1%) |
| 7:00 AM to 7:29 AM | 400 (15.3%) | 136 (7.1%) |
| 7:30 AM to 7:59 AM | 469 (18.0%) | 385 (20.2%) |
| 8:00 AM to 8:29 AM | 591 (22.7%) | 489 (25.6%) |
| 8:30 AM to 8:59 AM | 130 (5.0%) | 157 (8.2%) |
| 9:00 AM to 9:59 AM | 154 (5.9%) | 183 (9.6%) |
| 10:00 AM to 10:59 AM | 97 (3.7%) | 33 (1.7%) |
| 11:00 AM to 11:59 AM | 0 (0.0%) | 0 (0.0%) |
| 12:00 PM to 3:59 PM | 122 (4.7%) | 84 (4.4%) |
| 4:00 PM to 11:59 PM | 135 (5.2%) | 130 (6.8%) |
| Total | 2,607 (100.0%) | 1,907 (100.0%) |
Housing Occupancy in East Grand Rapids
Occupancy by Ownership in East Grand Rapids
Of the total 3,850 dwellings in East Grand Rapids, owner-occupied units account for 3,656 (95.0%), while renter-occupied units make up 194 (5.0%).
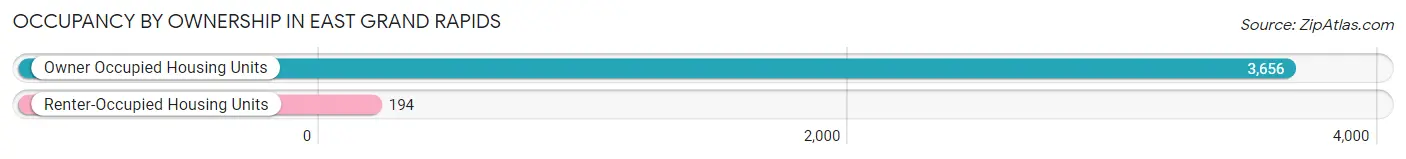
| Occupancy | # Housing Units | % Housing Units |
| Owner Occupied Housing Units | 3,656 | 95.0% |
| Renter-Occupied Housing Units | 194 | 5.0% |
| Total Occupied Housing Units | 3,850 | 100.0% |
Occupancy by Household Size in East Grand Rapids
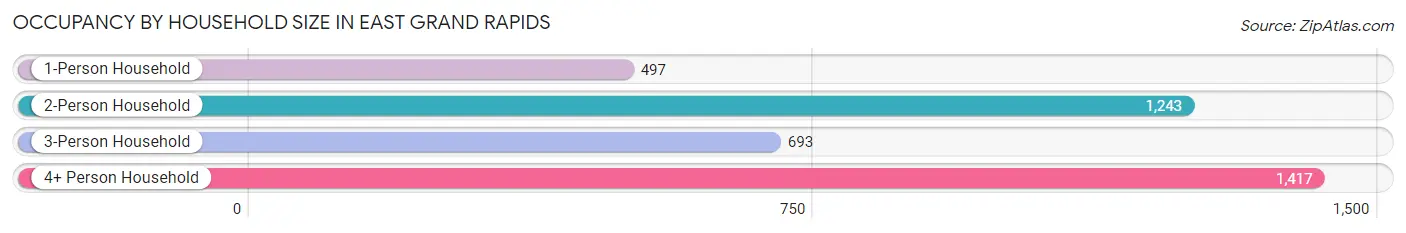
| Household Size | # Housing Units | % Housing Units |
| 1-Person Household | 497 | 12.9% |
| 2-Person Household | 1,243 | 32.3% |
| 3-Person Household | 693 | 18.0% |
| 4+ Person Household | 1,417 | 36.8% |
| Total Housing Units | 3,850 | 100.0% |
Occupancy by Ownership by Household Size in East Grand Rapids
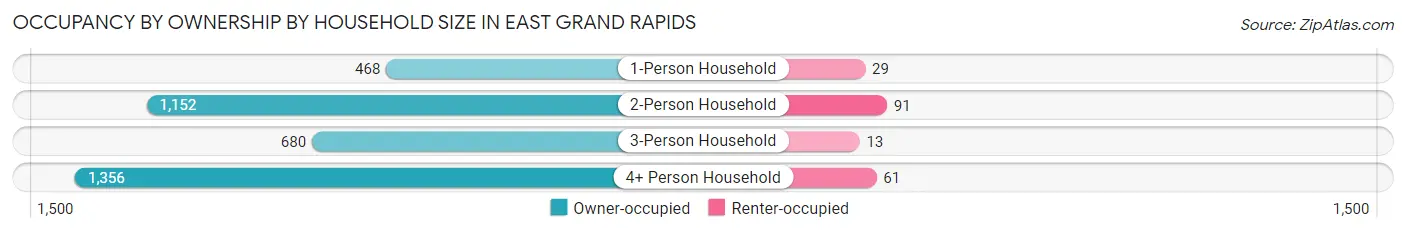
| Household Size | Owner-occupied | Renter-occupied |
| 1-Person Household | 468 (94.2%) | 29 (5.8%) |
| 2-Person Household | 1,152 (92.7%) | 91 (7.3%) |
| 3-Person Household | 680 (98.1%) | 13 (1.9%) |
| 4+ Person Household | 1,356 (95.7%) | 61 (4.3%) |
| Total Housing Units | 3,656 (95.0%) | 194 (5.0%) |
Occupancy by Educational Attainment in East Grand Rapids
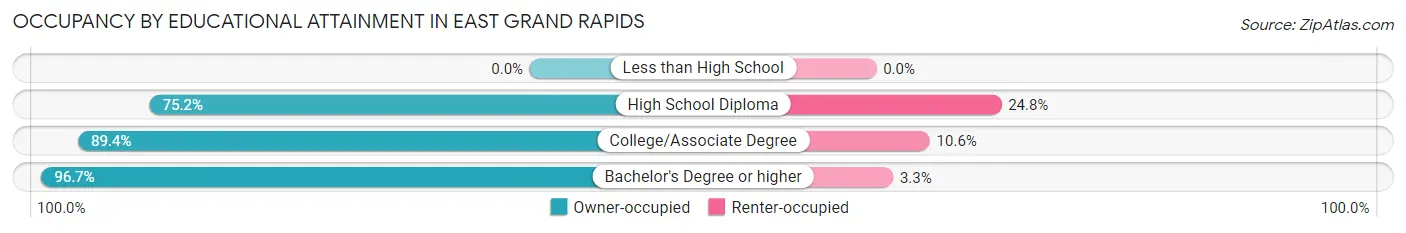
| Household Size | Owner-occupied | Renter-occupied |
| Less than High School | 0 (0.0%) | 0 (0.0%) |
| High School Diploma | 91 (75.2%) | 30 (24.8%) |
| College/Associate Degree | 489 (89.4%) | 58 (10.6%) |
| Bachelor's Degree or higher | 3,076 (96.7%) | 106 (3.3%) |
Occupancy by Age of Householder in East Grand Rapids
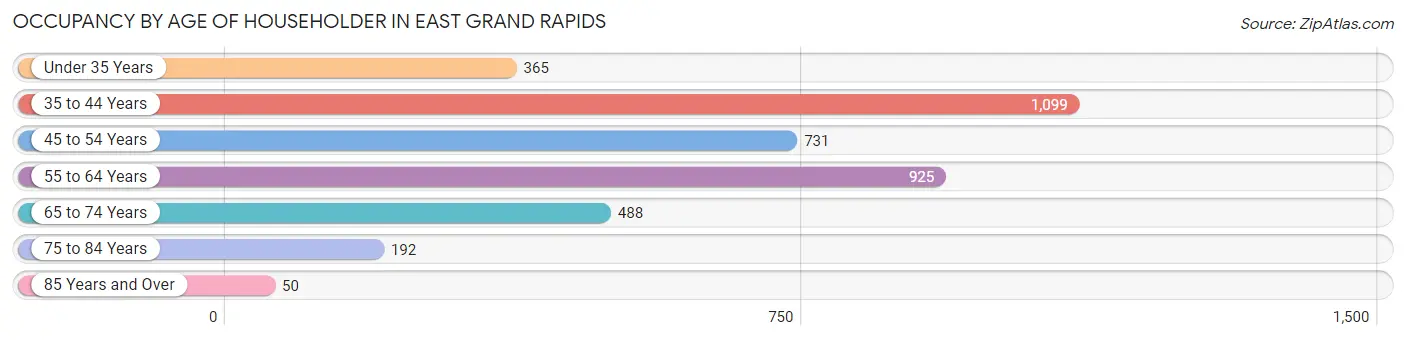
| Age Bracket | # Households | % Households |
| Under 35 Years | 365 | 9.5% |
| 35 to 44 Years | 1,099 | 28.5% |
| 45 to 54 Years | 731 | 19.0% |
| 55 to 64 Years | 925 | 24.0% |
| 65 to 74 Years | 488 | 12.7% |
| 75 to 84 Years | 192 | 5.0% |
| 85 Years and Over | 50 | 1.3% |
| Total | 3,850 | 100.0% |
Housing Finances in East Grand Rapids
Median Income by Occupancy in East Grand Rapids
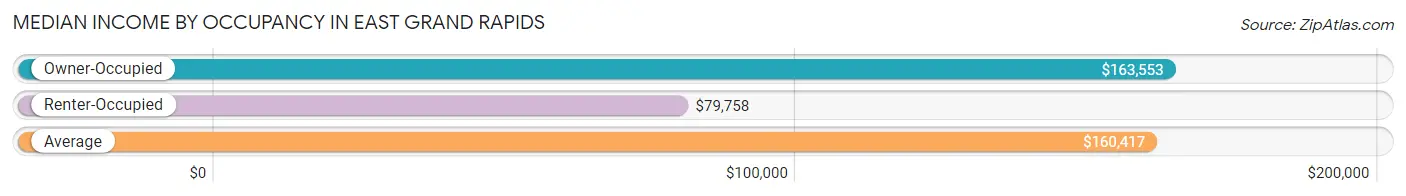
| Occupancy Type | # Households | Median Income |
| Owner-Occupied | 3,656 (95.0%) | $163,553 |
| Renter-Occupied | 194 (5.0%) | $79,758 |
| Average | 3,850 (100.0%) | $160,417 |
Occupancy by Householder Income Bracket in East Grand Rapids
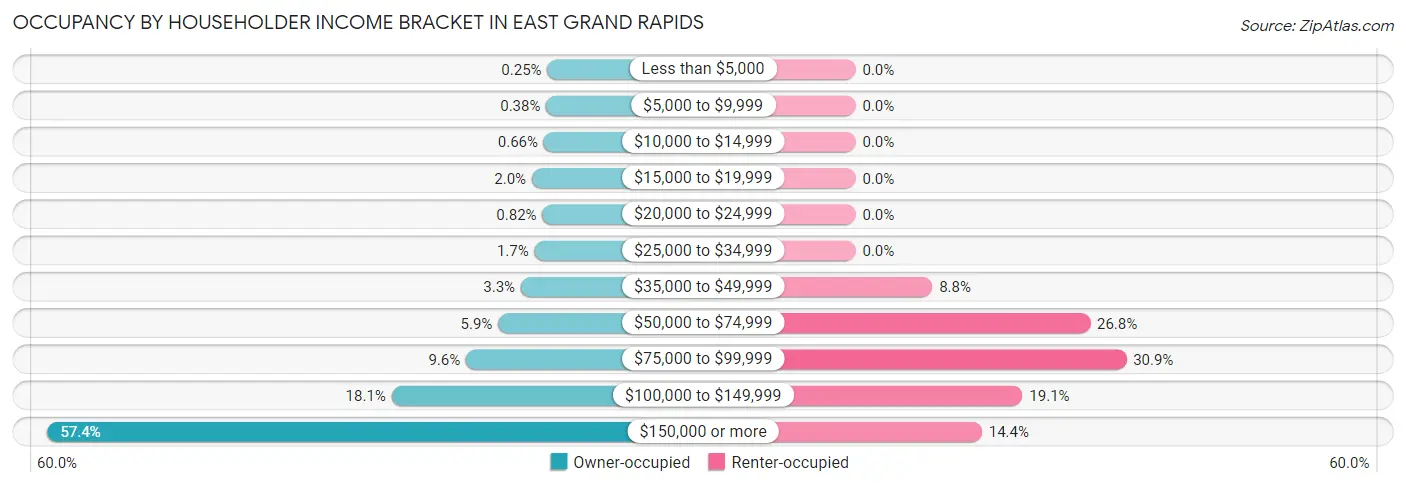
| Income Bracket | Owner-occupied | Renter-occupied |
| Less than $5,000 | 9 (0.3%) | 0 (0.0%) |
| $5,000 to $9,999 | 14 (0.4%) | 0 (0.0%) |
| $10,000 to $14,999 | 24 (0.7%) | 0 (0.0%) |
| $15,000 to $19,999 | 74 (2.0%) | 0 (0.0%) |
| $20,000 to $24,999 | 30 (0.8%) | 0 (0.0%) |
| $25,000 to $34,999 | 63 (1.7%) | 0 (0.0%) |
| $35,000 to $49,999 | 120 (3.3%) | 17 (8.8%) |
| $50,000 to $74,999 | 215 (5.9%) | 52 (26.8%) |
| $75,000 to $99,999 | 349 (9.6%) | 60 (30.9%) |
| $100,000 to $149,999 | 660 (18.0%) | 37 (19.1%) |
| $150,000 or more | 2,098 (57.4%) | 28 (14.4%) |
| Total | 3,656 (100.0%) | 194 (100.0%) |
Monthly Housing Cost Tiers in East Grand Rapids
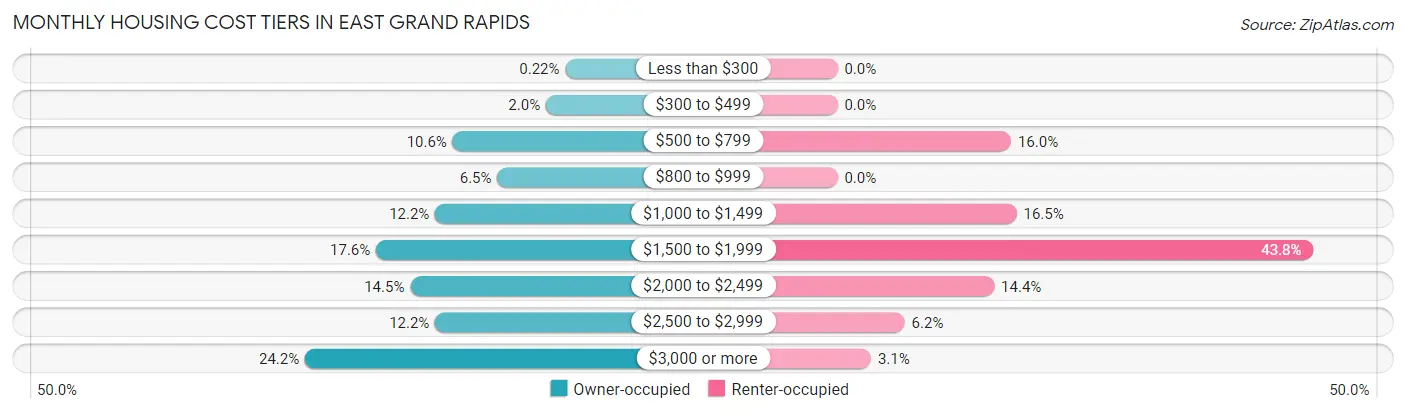
| Monthly Cost | Owner-occupied | Renter-occupied |
| Less than $300 | 8 (0.2%) | 0 (0.0%) |
| $300 to $499 | 73 (2.0%) | 0 (0.0%) |
| $500 to $799 | 387 (10.6%) | 31 (16.0%) |
| $800 to $999 | 237 (6.5%) | 0 (0.0%) |
| $1,000 to $1,499 | 446 (12.2%) | 32 (16.5%) |
| $1,500 to $1,999 | 645 (17.6%) | 85 (43.8%) |
| $2,000 to $2,499 | 530 (14.5%) | 28 (14.4%) |
| $2,500 to $2,999 | 446 (12.2%) | 12 (6.2%) |
| $3,000 or more | 884 (24.2%) | 6 (3.1%) |
| Total | 3,656 (100.0%) | 194 (100.0%) |
Physical Housing Characteristics in East Grand Rapids
Housing Structures in East Grand Rapids
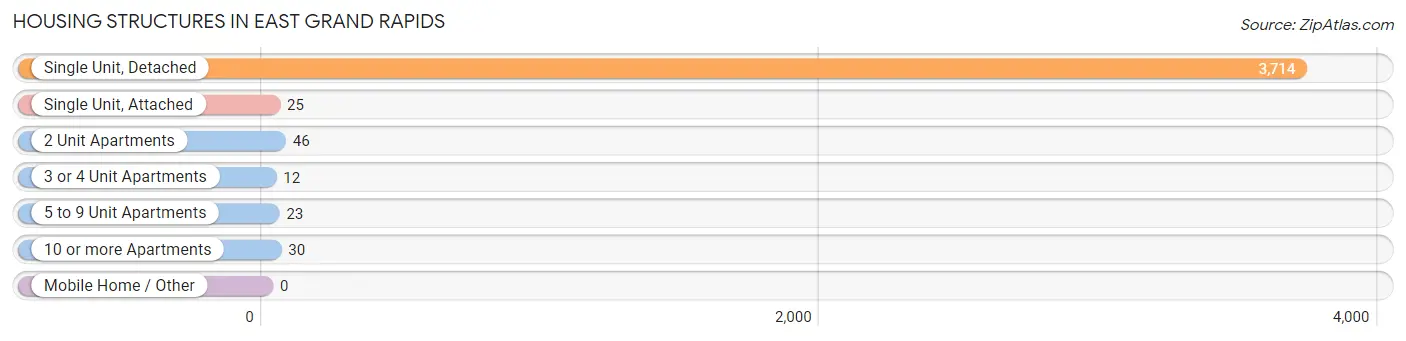
| Structure Type | # Housing Units | % Housing Units |
| Single Unit, Detached | 3,714 | 96.5% |
| Single Unit, Attached | 25 | 0.6% |
| 2 Unit Apartments | 46 | 1.2% |
| 3 or 4 Unit Apartments | 12 | 0.3% |
| 5 to 9 Unit Apartments | 23 | 0.6% |
| 10 or more Apartments | 30 | 0.8% |
| Mobile Home / Other | 0 | 0.0% |
| Total | 3,850 | 100.0% |
Housing Structures by Occupancy in East Grand Rapids
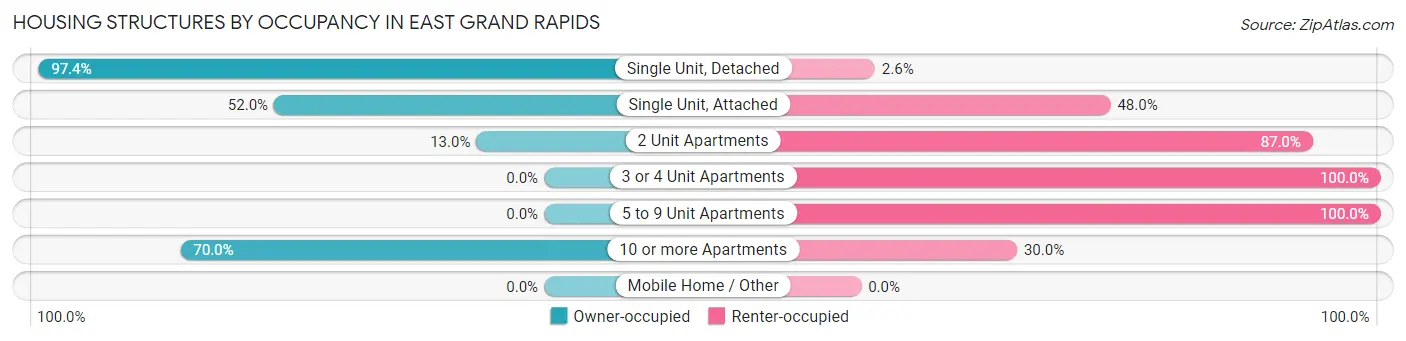
| Structure Type | Owner-occupied | Renter-occupied |
| Single Unit, Detached | 3,616 (97.4%) | 98 (2.6%) |
| Single Unit, Attached | 13 (52.0%) | 12 (48.0%) |
| 2 Unit Apartments | 6 (13.0%) | 40 (87.0%) |
| 3 or 4 Unit Apartments | 0 (0.0%) | 12 (100.0%) |
| 5 to 9 Unit Apartments | 0 (0.0%) | 23 (100.0%) |
| 10 or more Apartments | 21 (70.0%) | 9 (30.0%) |
| Mobile Home / Other | 0 (0.0%) | 0 (0.0%) |
| Total | 3,656 (95.0%) | 194 (5.0%) |
Housing Structures by Number of Rooms in East Grand Rapids
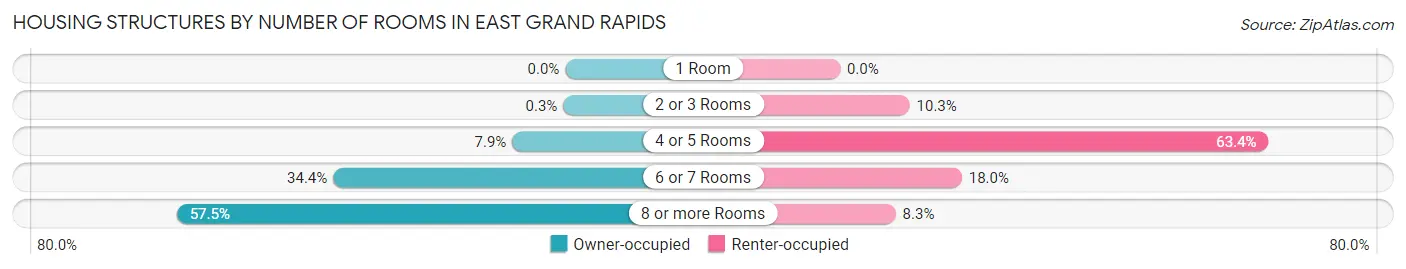
| Number of Rooms | Owner-occupied | Renter-occupied |
| 1 Room | 0 (0.0%) | 0 (0.0%) |
| 2 or 3 Rooms | 11 (0.3%) | 20 (10.3%) |
| 4 or 5 Rooms | 287 (7.9%) | 123 (63.4%) |
| 6 or 7 Rooms | 1,256 (34.4%) | 35 (18.0%) |
| 8 or more Rooms | 2,102 (57.5%) | 16 (8.3%) |
| Total | 3,656 (100.0%) | 194 (100.0%) |
Housing Structure by Heating Type in East Grand Rapids
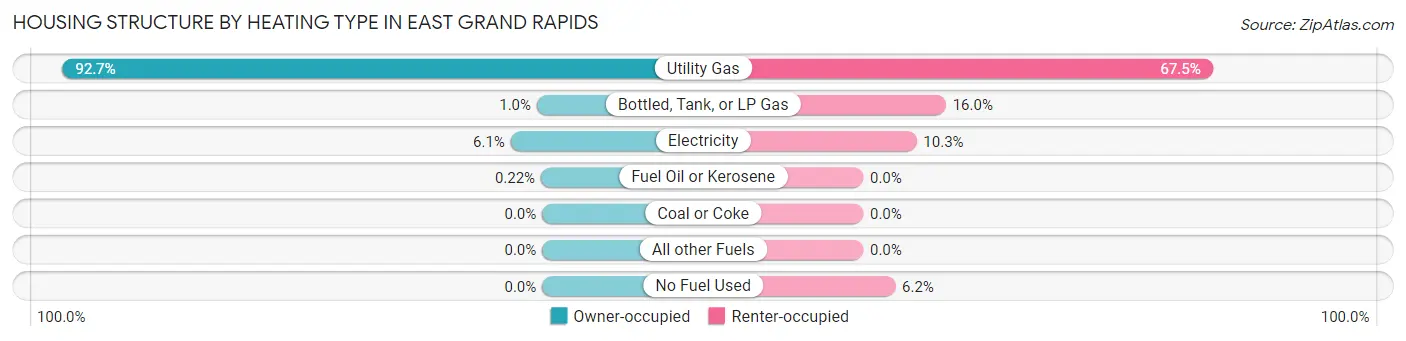
| Heating Type | Owner-occupied | Renter-occupied |
| Utility Gas | 3,389 (92.7%) | 131 (67.5%) |
| Bottled, Tank, or LP Gas | 37 (1.0%) | 31 (16.0%) |
| Electricity | 222 (6.1%) | 20 (10.3%) |
| Fuel Oil or Kerosene | 8 (0.2%) | 0 (0.0%) |
| Coal or Coke | 0 (0.0%) | 0 (0.0%) |
| All other Fuels | 0 (0.0%) | 0 (0.0%) |
| No Fuel Used | 0 (0.0%) | 12 (6.2%) |
| Total | 3,656 (100.0%) | 194 (100.0%) |
Household Vehicle Usage in East Grand Rapids
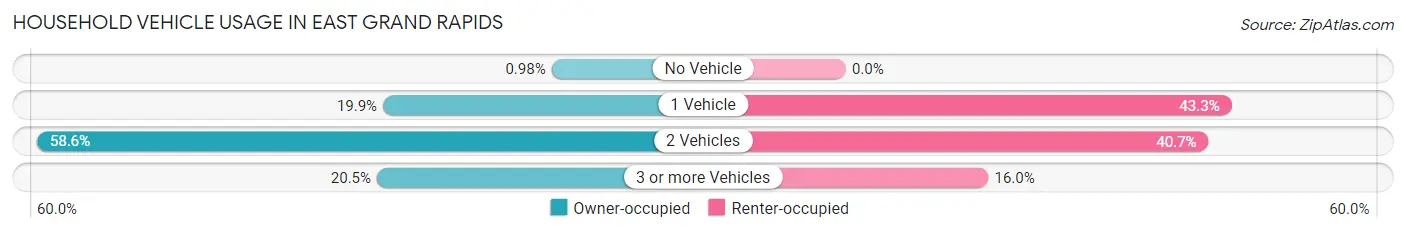
| Vehicles per Household | Owner-occupied | Renter-occupied |
| No Vehicle | 36 (1.0%) | 0 (0.0%) |
| 1 Vehicle | 726 (19.9%) | 84 (43.3%) |
| 2 Vehicles | 2,143 (58.6%) | 79 (40.7%) |
| 3 or more Vehicles | 751 (20.5%) | 31 (16.0%) |
| Total | 3,656 (100.0%) | 194 (100.0%) |
Real Estate & Mortgages in East Grand Rapids
Real Estate and Mortgage Overview in East Grand Rapids
| Characteristic | Without Mortgage | With Mortgage |
| Housing Units | 1,151 | 2,505 |
| Median Property Value | $445,600 | $454,200 |
| Median Household Income | $147,708 | $1,539 |
| Monthly Housing Costs | $972 | $818 |
| Real Estate Taxes | $7,188 | $15 |
Property Value by Mortgage Status in East Grand Rapids
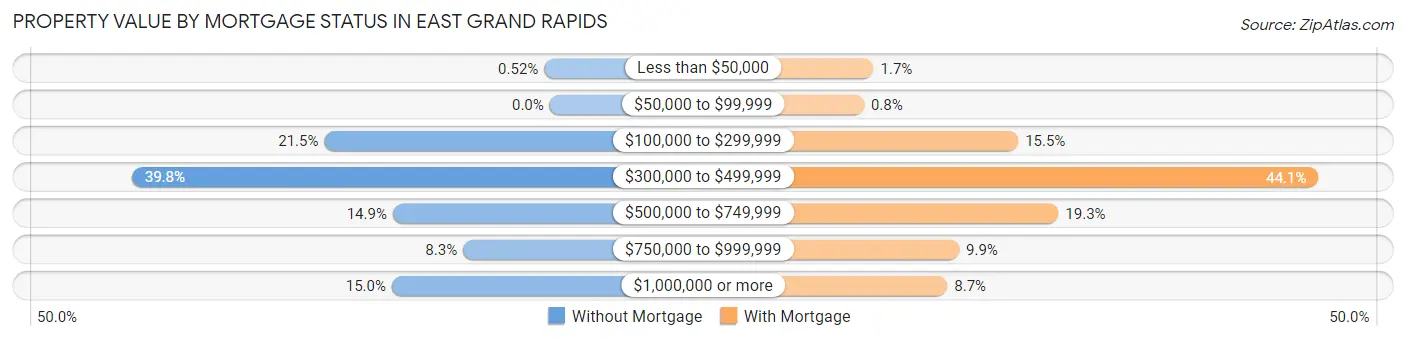
| Property Value | Without Mortgage | With Mortgage |
| Less than $50,000 | 6 (0.5%) | 43 (1.7%) |
| $50,000 to $99,999 | 0 (0.0%) | 20 (0.8%) |
| $100,000 to $299,999 | 247 (21.5%) | 388 (15.5%) |
| $300,000 to $499,999 | 458 (39.8%) | 1,104 (44.1%) |
| $500,000 to $749,999 | 172 (14.9%) | 484 (19.3%) |
| $750,000 to $999,999 | 95 (8.3%) | 247 (9.9%) |
| $1,000,000 or more | 173 (15.0%) | 219 (8.7%) |
| Total | 1,151 (100.0%) | 2,505 (100.0%) |
Household Income by Mortgage Status in East Grand Rapids
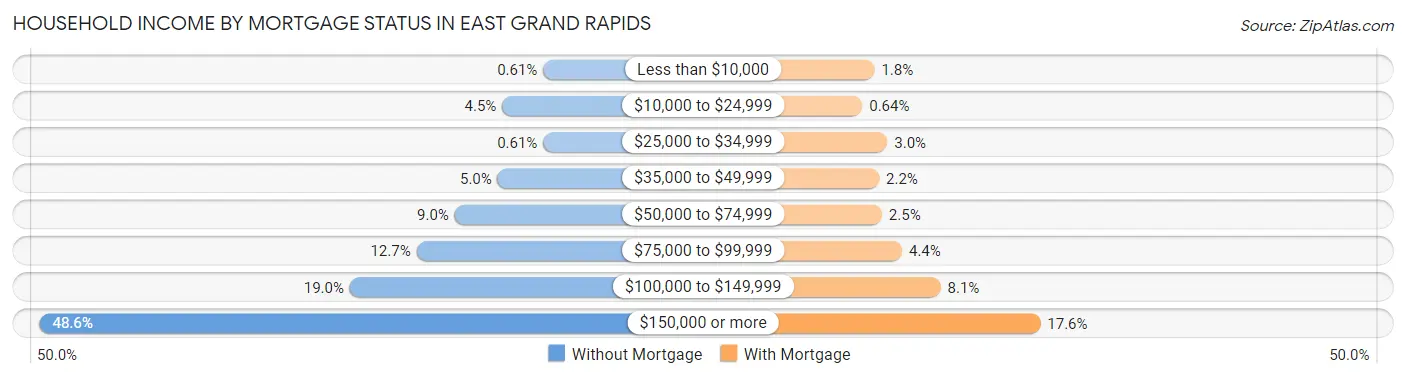
| Household Income | Without Mortgage | With Mortgage |
| Less than $10,000 | 7 (0.6%) | 45 (1.8%) |
| $10,000 to $24,999 | 52 (4.5%) | 16 (0.6%) |
| $25,000 to $34,999 | 7 (0.6%) | 76 (3.0%) |
| $35,000 to $49,999 | 57 (5.0%) | 56 (2.2%) |
| $50,000 to $74,999 | 104 (9.0%) | 63 (2.5%) |
| $75,000 to $99,999 | 146 (12.7%) | 111 (4.4%) |
| $100,000 to $149,999 | 219 (19.0%) | 203 (8.1%) |
| $150,000 or more | 559 (48.6%) | 441 (17.6%) |
| Total | 1,151 (100.0%) | 2,505 (100.0%) |
Property Value to Household Income Ratio in East Grand Rapids
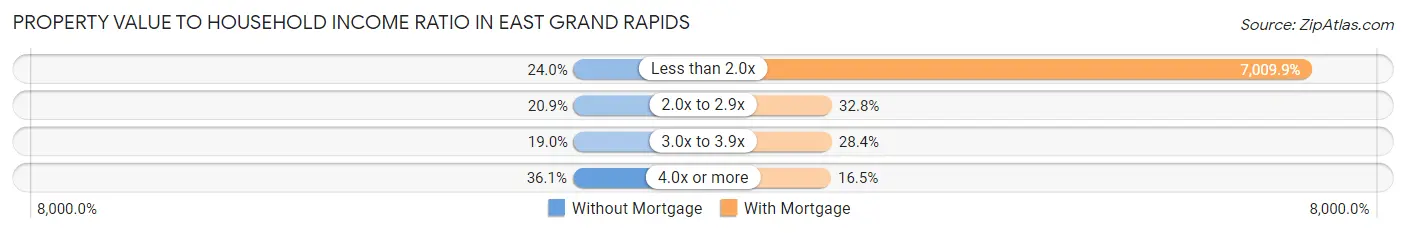
| Value-to-Income Ratio | Without Mortgage | With Mortgage |
| Less than 2.0x | 276 (24.0%) | 175,598 (7,009.9%) |
| 2.0x to 2.9x | 241 (20.9%) | 822 (32.8%) |
| 3.0x to 3.9x | 219 (19.0%) | 711 (28.4%) |
| 4.0x or more | 415 (36.1%) | 414 (16.5%) |
| Total | 1,151 (100.0%) | 2,505 (100.0%) |
Real Estate Taxes by Mortgage Status in East Grand Rapids
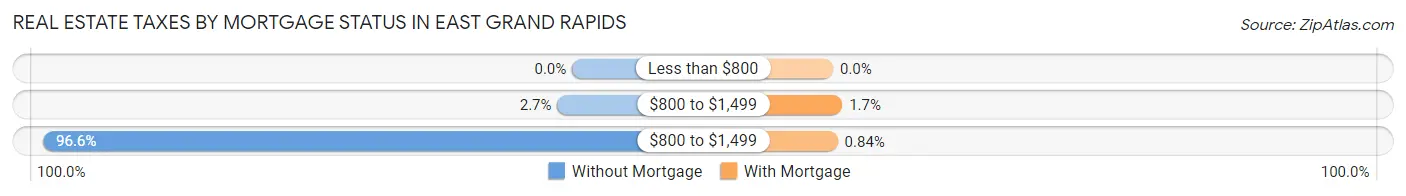
| Property Taxes | Without Mortgage | With Mortgage |
| Less than $800 | 0 (0.0%) | 0 (0.0%) |
| $800 to $1,499 | 31 (2.7%) | 42 (1.7%) |
| $800 to $1,499 | 1,112 (96.6%) | 21 (0.8%) |
| Total | 1,151 (100.0%) | 2,505 (100.0%) |
Health & Disability in East Grand Rapids
Health Insurance Coverage by Age in East Grand Rapids
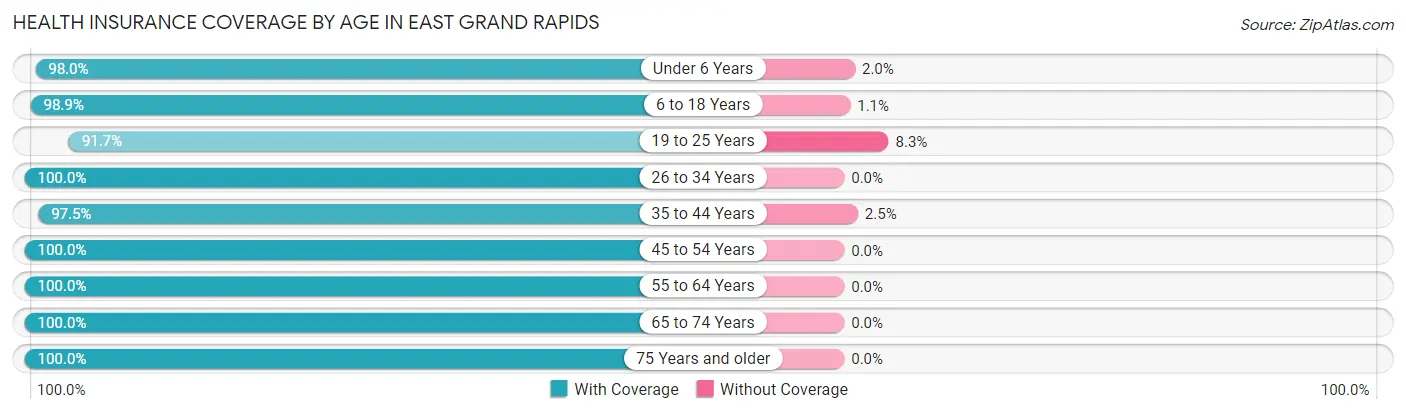
| Age Bracket | With Coverage | Without Coverage |
| Under 6 Years | 1,177 (98.0%) | 24 (2.0%) |
| 6 to 18 Years | 2,637 (98.9%) | 30 (1.1%) |
| 19 to 25 Years | 300 (91.7%) | 27 (8.3%) |
| 26 to 34 Years | 946 (100.0%) | 0 (0.0%) |
| 35 to 44 Years | 1,953 (97.5%) | 51 (2.5%) |
| 45 to 54 Years | 1,551 (100.0%) | 0 (0.0%) |
| 55 to 64 Years | 1,441 (100.0%) | 0 (0.0%) |
| 65 to 74 Years | 882 (100.0%) | 0 (0.0%) |
| 75 Years and older | 366 (100.0%) | 0 (0.0%) |
| Total | 11,253 (98.8%) | 132 (1.2%) |
Health Insurance Coverage by Citizenship Status in East Grand Rapids
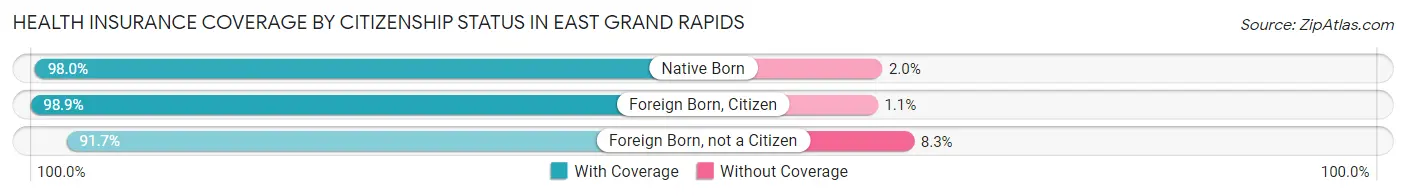
| Citizenship Status | With Coverage | Without Coverage |
| Native Born | 1,177 (98.0%) | 24 (2.0%) |
| Foreign Born, Citizen | 2,637 (98.9%) | 30 (1.1%) |
| Foreign Born, not a Citizen | 300 (91.7%) | 27 (8.3%) |
Health Insurance Coverage by Household Income in East Grand Rapids
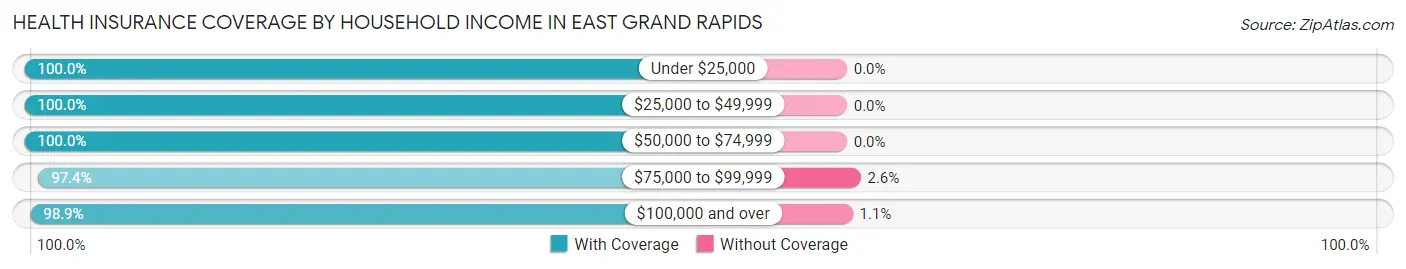
| Household Income | With Coverage | Without Coverage |
| Under $25,000 | 207 (100.0%) | 0 (0.0%) |
| $25,000 to $49,999 | 360 (100.0%) | 0 (0.0%) |
| $50,000 to $74,999 | 410 (100.0%) | 0 (0.0%) |
| $75,000 to $99,999 | 1,288 (97.4%) | 34 (2.6%) |
| $100,000 and over | 8,970 (98.9%) | 98 (1.1%) |
Public vs Private Health Insurance Coverage by Age in East Grand Rapids
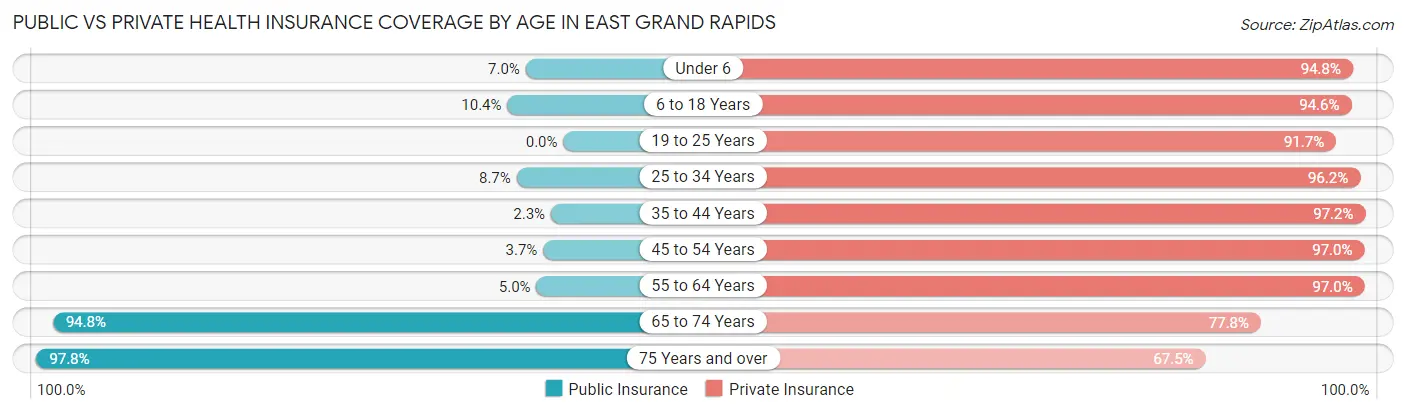
| Age Bracket | Public Insurance | Private Insurance |
| Under 6 | 84 (7.0%) | 1,139 (94.8%) |
| 6 to 18 Years | 277 (10.4%) | 2,522 (94.6%) |
| 19 to 25 Years | 0 (0.0%) | 300 (91.7%) |
| 25 to 34 Years | 82 (8.7%) | 910 (96.2%) |
| 35 to 44 Years | 46 (2.3%) | 1,947 (97.2%) |
| 45 to 54 Years | 58 (3.7%) | 1,504 (97.0%) |
| 55 to 64 Years | 72 (5.0%) | 1,398 (97.0%) |
| 65 to 74 Years | 836 (94.8%) | 686 (77.8%) |
| 75 Years and over | 358 (97.8%) | 247 (67.5%) |
| Total | 1,813 (15.9%) | 10,653 (93.6%) |
Disability Status by Sex by Age in East Grand Rapids
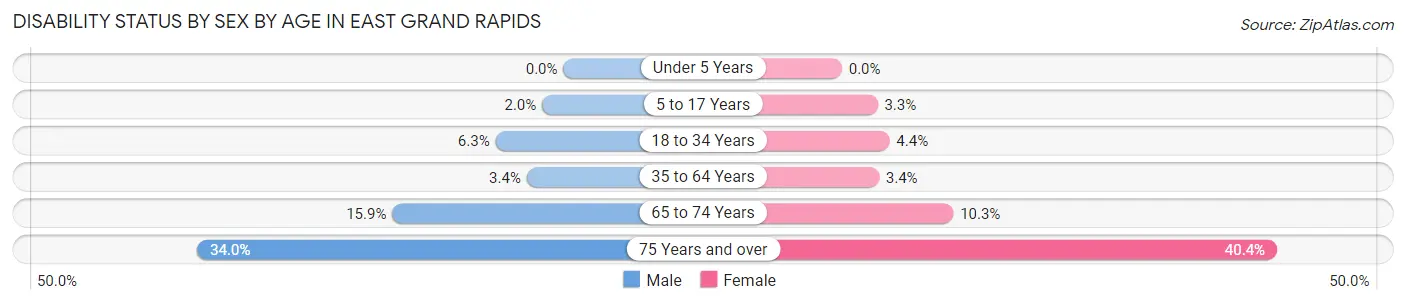
| Age Bracket | Male | Female |
| Under 5 Years | 0 (0.0%) | 0 (0.0%) |
| 5 to 17 Years | 27 (2.0%) | 47 (3.3%) |
| 18 to 34 Years | 44 (6.3%) | 29 (4.4%) |
| 35 to 64 Years | 83 (3.4%) | 88 (3.4%) |
| 65 to 74 Years | 71 (15.9%) | 45 (10.3%) |
| 75 Years and over | 52 (34.0%) | 86 (40.4%) |
Disability Class by Sex by Age in East Grand Rapids
Disability Class: Hearing Difficulty
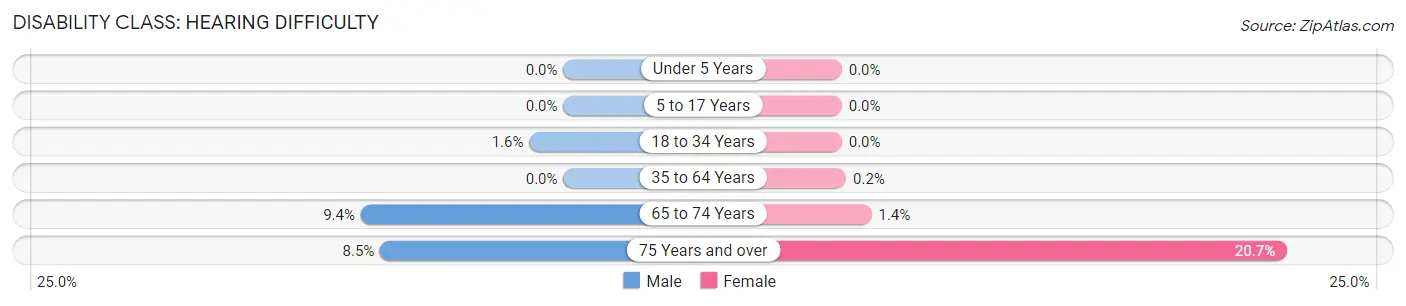
| Age Bracket | Male | Female |
| Under 5 Years | 0 (0.0%) | 0 (0.0%) |
| 5 to 17 Years | 0 (0.0%) | 0 (0.0%) |
| 18 to 34 Years | 11 (1.6%) | 0 (0.0%) |
| 35 to 64 Years | 0 (0.0%) | 5 (0.2%) |
| 65 to 74 Years | 42 (9.4%) | 6 (1.4%) |
| 75 Years and over | 13 (8.5%) | 44 (20.7%) |
Disability Class: Vision Difficulty
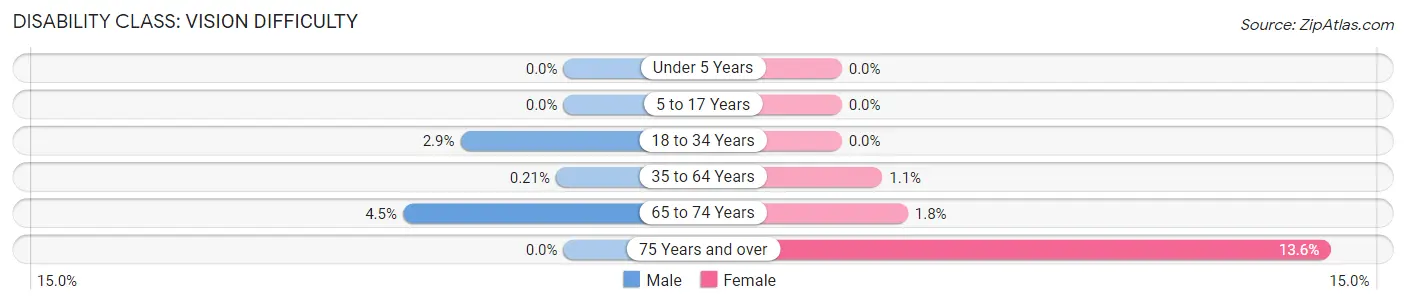
| Age Bracket | Male | Female |
| Under 5 Years | 0 (0.0%) | 0 (0.0%) |
| 5 to 17 Years | 0 (0.0%) | 0 (0.0%) |
| 18 to 34 Years | 20 (2.9%) | 0 (0.0%) |
| 35 to 64 Years | 5 (0.2%) | 29 (1.1%) |
| 65 to 74 Years | 20 (4.5%) | 8 (1.8%) |
| 75 Years and over | 0 (0.0%) | 29 (13.6%) |
Disability Class: Cognitive Difficulty
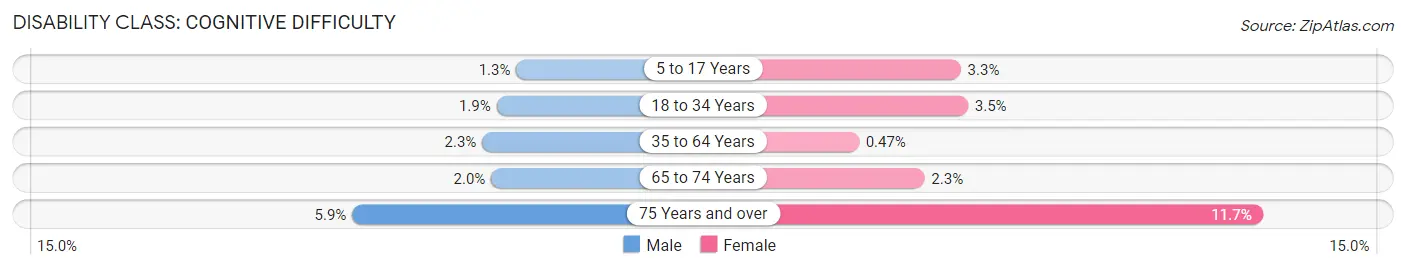
| Age Bracket | Male | Female |
| 5 to 17 Years | 18 (1.3%) | 47 (3.3%) |
| 18 to 34 Years | 13 (1.9%) | 23 (3.5%) |
| 35 to 64 Years | 55 (2.3%) | 12 (0.5%) |
| 65 to 74 Years | 9 (2.0%) | 10 (2.3%) |
| 75 Years and over | 9 (5.9%) | 25 (11.7%) |
Disability Class: Ambulatory Difficulty
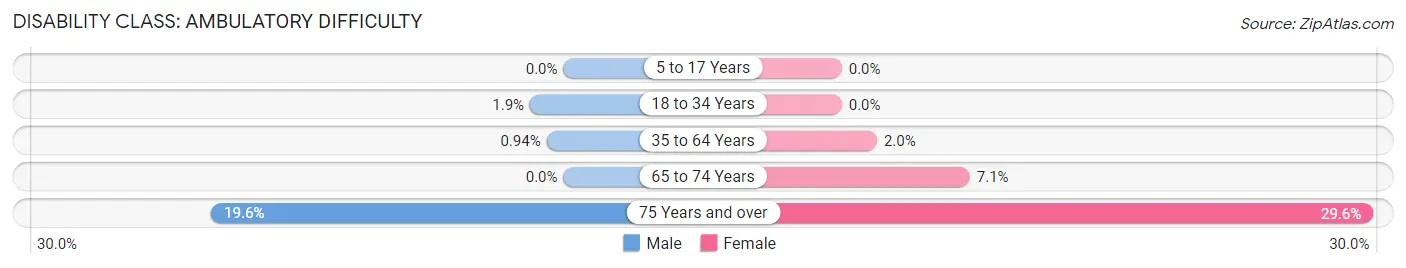
| Age Bracket | Male | Female |
| 5 to 17 Years | 0 (0.0%) | 0 (0.0%) |
| 18 to 34 Years | 13 (1.9%) | 0 (0.0%) |
| 35 to 64 Years | 23 (0.9%) | 50 (2.0%) |
| 65 to 74 Years | 0 (0.0%) | 31 (7.1%) |
| 75 Years and over | 30 (19.6%) | 63 (29.6%) |
Disability Class: Self-Care Difficulty
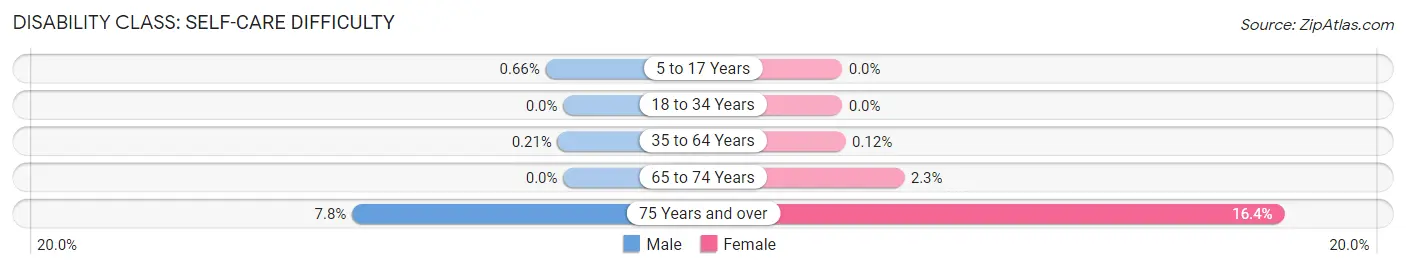
| Age Bracket | Male | Female |
| 5 to 17 Years | 9 (0.7%) | 0 (0.0%) |
| 18 to 34 Years | 0 (0.0%) | 0 (0.0%) |
| 35 to 64 Years | 5 (0.2%) | 3 (0.1%) |
| 65 to 74 Years | 0 (0.0%) | 10 (2.3%) |
| 75 Years and over | 12 (7.8%) | 35 (16.4%) |
Technology Access in East Grand Rapids
Computing Device Access in East Grand Rapids
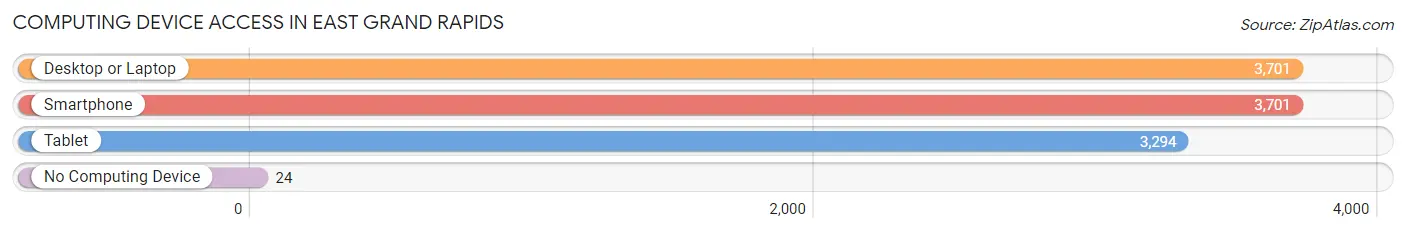
| Device Type | # Households | % Households |
| Desktop or Laptop | 3,701 | 96.1% |
| Smartphone | 3,701 | 96.1% |
| Tablet | 3,294 | 85.6% |
| No Computing Device | 24 | 0.6% |
| Total | 3,850 | 100.0% |
Internet Access in East Grand Rapids
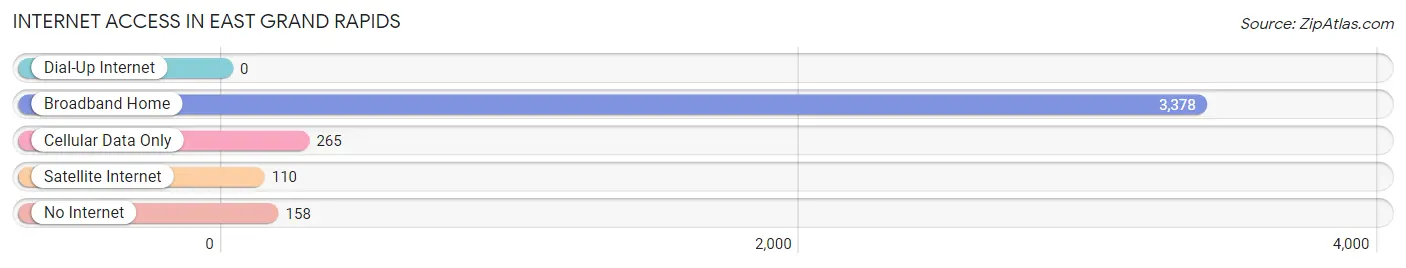
| Internet Type | # Households | % Households |
| Dial-Up Internet | 0 | 0.0% |
| Broadband Home | 3,378 | 87.7% |
| Cellular Data Only | 265 | 6.9% |
| Satellite Internet | 110 | 2.9% |
| No Internet | 158 | 4.1% |
| Total | 3,850 | 100.0% |
East Grand Rapids Summary
Grand Rapids, Michigan is a city located in Kent County, Michigan. It is the second largest city in the state and the county seat of Kent County. Grand Rapids is located on the Grand River, approximately 30 miles east of Lake Michigan. The city is home to a population of approximately 197,800 people, making it the second largest city in Michigan.
History
Grand Rapids was founded in 1826 by Louis Campau, a French-Canadian fur trader. The city was named after the Grand River, which runs through the city. The city was incorporated in 1850 and quickly became a major lumbering center. By the late 19th century, Grand Rapids had become a major furniture manufacturing center, earning it the nickname “Furniture City.”
In the early 20th century, Grand Rapids was a major center for the automotive industry. The city was home to several major auto manufacturers, including Oldsmobile, Packard, and Cadillac. The city also became a major center for the aviation industry, with the Grand Rapids Airport being established in the 1920s.
Geography
Grand Rapids is located in the western part of Michigan, approximately 30 miles east of Lake Michigan. The city is situated on the Grand River, which runs through the city. The city is surrounded by several smaller towns and villages, including East Grand Rapids, Walker, Wyoming, and Kentwood.
The city has a total area of approximately 45.3 square miles, of which 44.7 square miles is land and 0.6 square miles is water. The city has a humid continental climate, with cold winters and hot, humid summers.
Economy
Grand Rapids is a major economic center in Michigan. The city is home to several major corporations, including Amway, Steelcase, and Meijer. The city is also home to several major health care providers, including Spectrum Health, Mercy Health, and Metro Health.
The city is also home to several major educational institutions, including Grand Valley State University, Calvin College, and Davenport University. The city is also home to several major cultural institutions, including the Grand Rapids Art Museum, the Grand Rapids Symphony, and the Grand Rapids Ballet.
Demographics
As of the 2010 census, Grand Rapids had a population of 197,800 people. The racial makeup of the city was 73.2% White, 17.2% African American, 0.7% Native American, 2.7% Asian, 0.1% Pacific Islander, 3.2% from other races, and 2.9% from two or more races. Hispanic or Latino of any race were 8.2% of the population.
The median income for a household in the city was $41,939, and the median income for a family was $51,914. The per capita income for the city was $23,945. About 17.2% of families and 21.7% of the population were below the poverty line, including 33.2% of those under age 18 and 10.2% of those age 65 or over.
Common Questions
What is Per Capita Income in East Grand Rapids?
Per Capita income in East Grand Rapids is $76,034.
What is the Median Family Income in East Grand Rapids?
Median Family Income in East Grand Rapids is $173,529.
What is the Median Household income in East Grand Rapids?
Median Household Income in East Grand Rapids is $160,417.
What is Income or Wage Gap in East Grand Rapids?
Income or Wage Gap in East Grand Rapids is 46.7%.
Women in East Grand Rapids earn 53.3 cents for every dollar earned by a man.
What is Inequality or Gini Index in East Grand Rapids?
Inequality or Gini Index in East Grand Rapids is 0.45.
What is the Total Population of East Grand Rapids?
Total Population of East Grand Rapids is 11,385.
What is the Total Male Population of East Grand Rapids?
Total Male Population of East Grand Rapids is 5,705.
What is the Total Female Population of East Grand Rapids?
Total Female Population of East Grand Rapids is 5,680.
What is the Ratio of Males per 100 Females in East Grand Rapids?
There are 100.44 Males per 100 Females in East Grand Rapids.
What is the Ratio of Females per 100 Males in East Grand Rapids?
There are 99.56 Females per 100 Males in East Grand Rapids.
What is the Median Population Age in East Grand Rapids?
Median Population Age in East Grand Rapids is 37.5 Years.
What is the Average Family Size in East Grand Rapids
Average Family Size in East Grand Rapids is 3.3 People.
What is the Average Household Size in East Grand Rapids
Average Household Size in East Grand Rapids is 3.0 People.
How Large is the Labor Force in East Grand Rapids?
There are 5,771 People in the Labor Forcein in East Grand Rapids.
What is the Percentage of People in the Labor Force in East Grand Rapids?
71.9% of People are in the Labor Force in East Grand Rapids.
What is the Unemployment Rate in East Grand Rapids?
Unemployment Rate in East Grand Rapids is 1.9%.