Zip Codes with the Highest Percentage of Population Employed in Health Care & Social Assistance in Acton, MA
RELATED REPORTS & OPTIONS
Health Care & Social Assistance
Acton
Compare Zip Codes
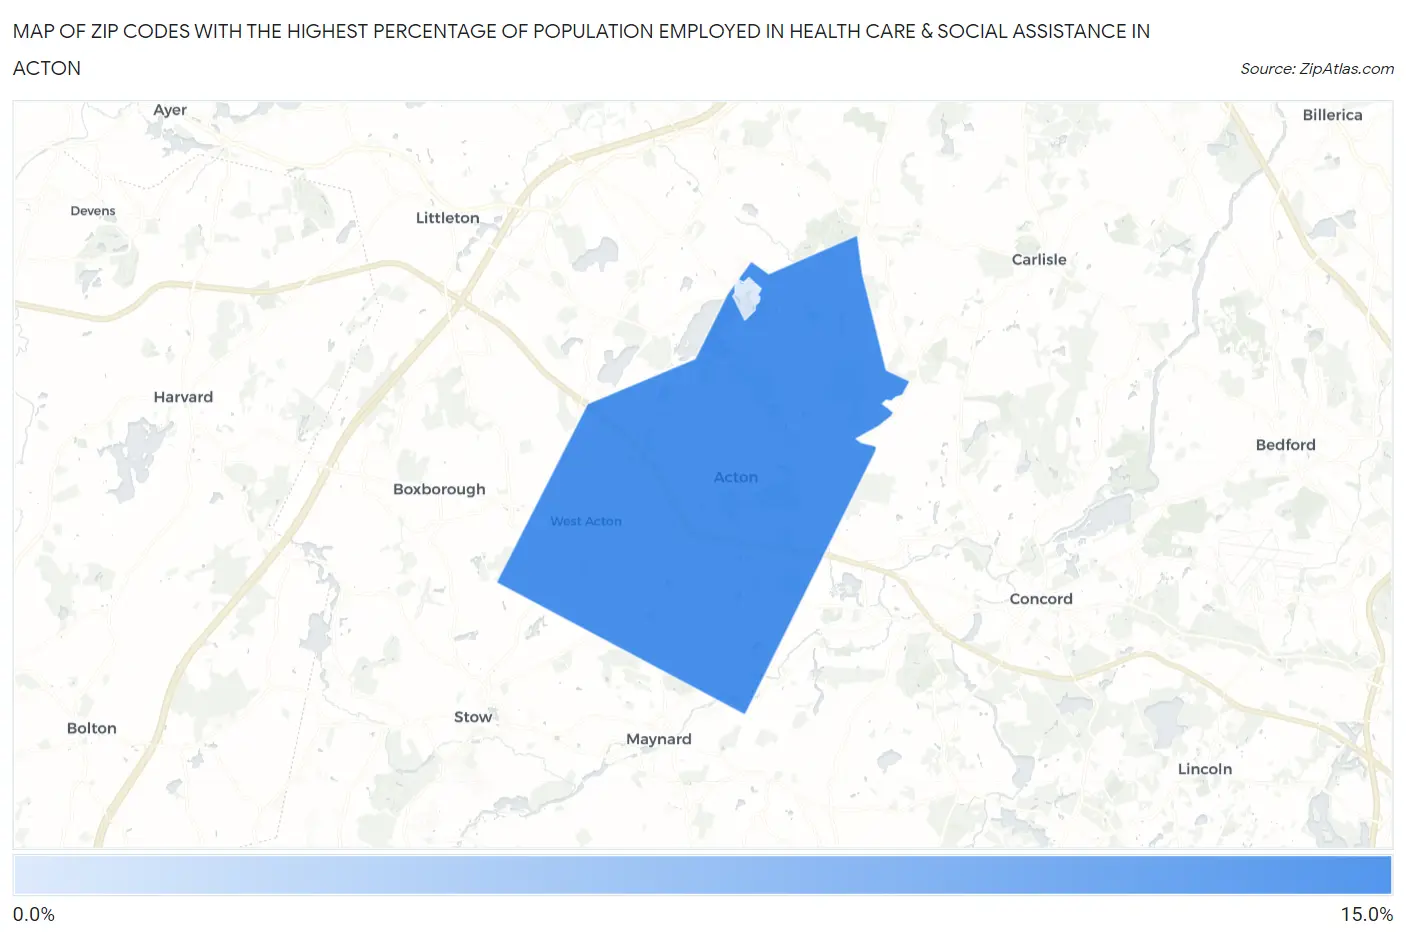
Map of Zip Codes with the Highest Percentage of Population Employed in Health Care & Social Assistance in Acton
4.1%
12.3%
Zip Codes with the Highest Percentage of Population Employed in Health Care & Social Assistance in Acton, MA
| Zip Code | % Employed | vs State | vs National | |
| 1. | 01720 | 12.3% | 16.1%(-3.85)#392 | 13.9%(-1.65)#18,381 |
| 2. | 01718 | 4.1% | 16.1%(-12.0)#508 | 13.9%(-9.80)#29,529 |
1
Common Questions
What are the Top Zip Codes with the Highest Percentage of Population Employed in Health Care & Social Assistance in Acton, MA?
Top Zip Codes with the Highest Percentage of Population Employed in Health Care & Social Assistance in Acton, MA are:
What zip code has the Highest Percentage of Population Employed in Health Care & Social Assistance in Acton, MA?
01720 has the Highest Percentage of Population Employed in Health Care & Social Assistance in Acton, MA with 12.3%.
What is the Percentage of Population Employed in Health Care & Social Assistance in Massachusetts?
Percentage of Population Employed in Health Care & Social Assistance in Massachusetts is 16.1%.
What is the Percentage of Population Employed in Health Care & Social Assistance in the United States?
Percentage of Population Employed in Health Care & Social Assistance in the United States is 13.9%.