Cities with the Most Births per 1,000 Women Receiving Public Assitance in Utah
RELATED REPORTS & OPTIONS
Highest Birth Rate | Public Income
Utah
Compare Cities
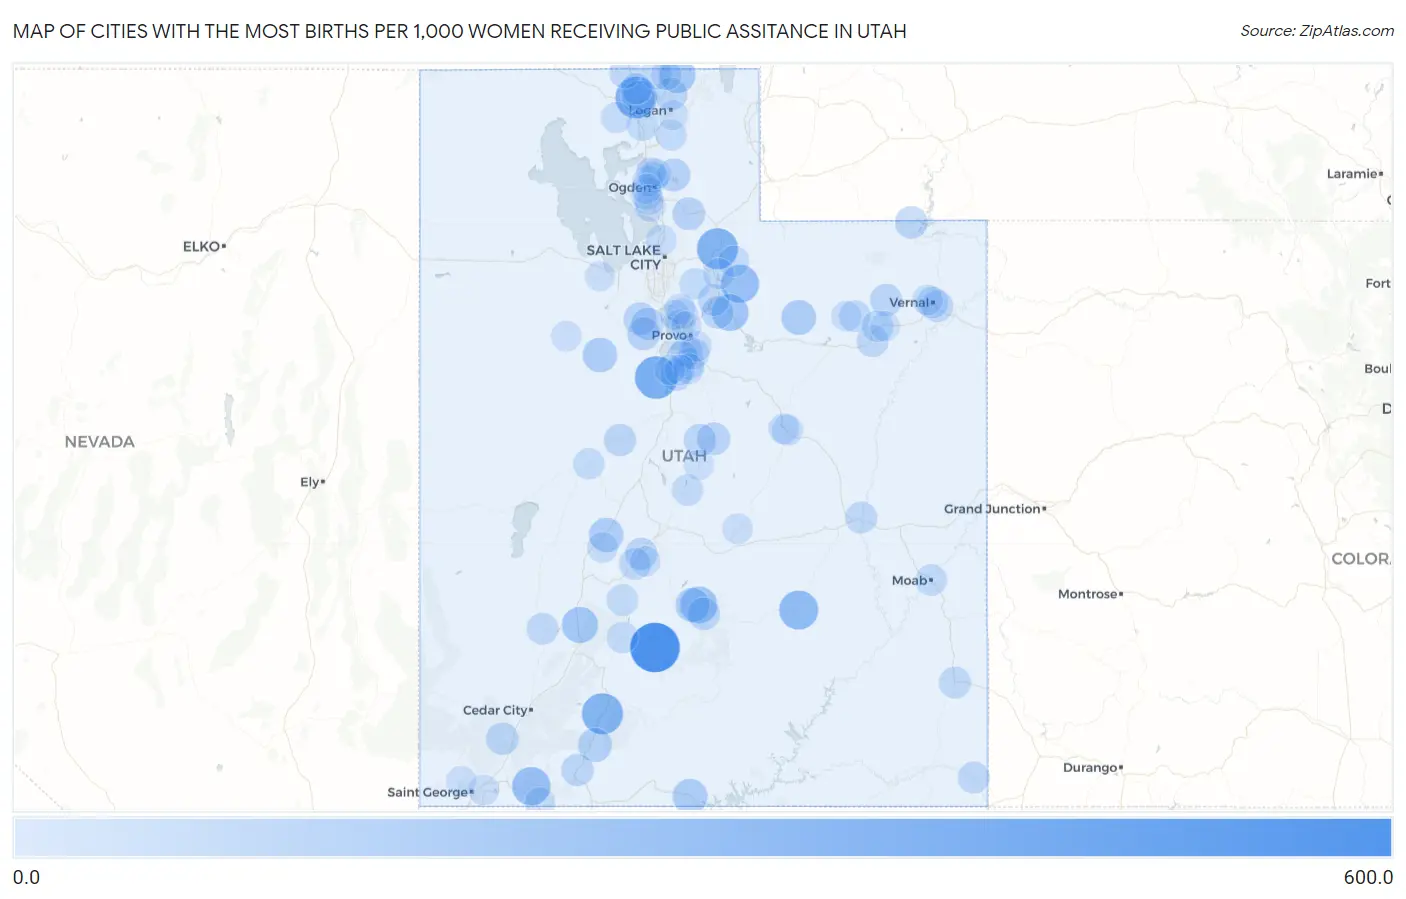
Map of Cities with the Most Births per 1,000 Women Receiving Public Assitance in Utah
0.0
600.0
Cities with the Most Births per 1,000 Women Receiving Public Assitance in Utah
| City | Births / 1,000 Women | vs State | vs National | |
| 1. | Antimony | 600.0 | 59.0(+541)#1 | 52.0(+548)#175 |
| 2. | Elberta | 407.0 | 59.0(+348)#2 | 52.0(+355)#335 |
| 3. | Riverside | 380.0 | 59.0(+321)#3 | 52.0(+328)#375 |
| 4. | Hatch | 364.0 | 59.0(+305)#4 | 52.0(+312)#409 |
| 5. | Wanship | 362.0 | 59.0(+303)#5 | 52.0(+310)#413 |
| 6. | Hanksville | 308.0 | 59.0(+249)#6 | 52.0(+256)#593 |
| 7. | Rockville | 286.0 | 59.0(+227)#7 | 52.0(+234)#684 |
| 8. | Woodland | 281.0 | 59.0(+222)#8 | 52.0(+229)#708 |
| 9. | Lyman | 250.0 | 59.0(+191)#9 | 52.0(+198)#873 |
| 10. | Independence | 250.0 | 59.0(+191)#10 | 52.0(+198)#883 |
| 11. | Beaver | 227.0 | 59.0(+168)#11 | 52.0(+175)#1,053 |
| 12. | Cove | 221.0 | 59.0(+162)#12 | 52.0(+169)#1,126 |
| 13. | Big Water | 195.0 | 59.0(+136)#13 | 52.0(+143)#1,386 |
| 14. | Tabiona | 194.0 | 59.0(+135)#14 | 52.0(+142)#1,405 |
| 15. | Vernon | 186.0 | 59.0(+127)#15 | 52.0(+134)#1,521 |
| 16. | Meadow | 184.0 | 59.0(+125)#16 | 52.0(+132)#1,548 |
| 17. | Loa | 175.0 | 59.0(+116)#17 | 52.0(+123)#1,678 |
| 18. | Alton | 170.0 | 59.0(+111)#18 | 52.0(+118)#1,775 |
| 19. | Fielding | 160.0 | 59.0(+101)#19 | 52.0(+108)#1,980 |
| 20. | Eden | 146.0 | 59.0(+87.0)#20 | 52.0(+94.0)#2,369 |
| 21. | Cedar Fort | 143.0 | 59.0(+84.0)#21 | 52.0(+91.0)#2,507 |
| 22. | Fairfield | 143.0 | 59.0(+84.0)#22 | 52.0(+91.0)#2,519 |
| 23. | Morgan | 140.0 | 59.0(+81.0)#23 | 52.0(+88.0)#2,576 |
| 24. | Mount Pleasant | 138.0 | 59.0(+79.0)#24 | 52.0(+86.0)#2,642 |
| 25. | Bicknell | 136.0 | 59.0(+77.0)#25 | 52.0(+84.0)#2,730 |
| 26. | Manila | 134.0 | 59.0(+75.0)#26 | 52.0(+82.0)#2,806 |
| 27. | Eagle Mountain | 133.0 | 59.0(+74.0)#27 | 52.0(+81.0)#2,807 |
| 28. | Moroni | 133.0 | 59.0(+74.0)#28 | 52.0(+81.0)#2,830 |
| 29. | New Harmony | 132.0 | 59.0(+73.0)#29 | 52.0(+80.0)#2,895 |
| 30. | Leamington | 128.0 | 59.0(+69.0)#30 | 52.0(+76.0)#3,073 |
| 31. | Orderville | 127.0 | 59.0(+68.0)#31 | 52.0(+75.0)#3,108 |
| 32. | Whiterocks | 127.0 | 59.0(+68.0)#32 | 52.0(+75.0)#3,118 |
| 33. | Smithfield | 125.0 | 59.0(+66.0)#33 | 52.0(+73.0)#3,157 |
| 34. | Richfield | 125.0 | 59.0(+66.0)#34 | 52.0(+73.0)#3,161 |
| 35. | Wallsburg | 125.0 | 59.0(+66.0)#35 | 52.0(+73.0)#3,191 |
| 36. | Monticello | 119.0 | 59.0(+60.0)#36 | 52.0(+67.0)#3,474 |
| 37. | Elsinore | 118.0 | 59.0(+59.0)#37 | 52.0(+66.0)#3,549 |
| 38. | Charleston | 118.0 | 59.0(+59.0)#38 | 52.0(+66.0)#3,564 |
| 39. | Green River | 117.0 | 59.0(+58.0)#39 | 52.0(+65.0)#3,609 |
| 40. | Naples | 116.0 | 59.0(+57.0)#40 | 52.0(+64.0)#3,634 |
| 41. | Myton | 116.0 | 59.0(+57.0)#41 | 52.0(+64.0)#3,661 |
| 42. | Aneth | 115.0 | 59.0(+56.0)#42 | 52.0(+63.0)#3,722 |
| 43. | Bluebell | 115.0 | 59.0(+56.0)#43 | 52.0(+63.0)#3,728 |
| 44. | Minersville | 114.0 | 59.0(+55.0)#44 | 52.0(+62.0)#3,770 |
| 45. | Santaquin | 113.0 | 59.0(+54.0)#45 | 52.0(+61.0)#3,795 |
| 46. | Vernal | 111.0 | 59.0(+52.0)#46 | 52.0(+59.0)#3,906 |
| 47. | Portage | 111.0 | 59.0(+52.0)#47 | 52.0(+59.0)#3,975 |
| 48. | Marysvale | 110.0 | 59.0(+51.0)#48 | 52.0(+58.0)#4,041 |
| 49. | Roy | 108.0 | 59.0(+49.0)#49 | 52.0(+56.0)#4,110 |
| 50. | Hobble Creek | 108.0 | 59.0(+49.0)#50 | 52.0(+56.0)#4,163 |
| 51. | Honeyville | 107.0 | 59.0(+48.0)#51 | 52.0(+55.0)#4,196 |
| 52. | Cornish | 107.0 | 59.0(+48.0)#52 | 52.0(+55.0)#4,231 |
| 53. | Roosevelt | 106.0 | 59.0(+47.0)#53 | 52.0(+54.0)#4,247 |
| 54. | Moab | 105.0 | 59.0(+46.0)#54 | 52.0(+53.0)#4,308 |
| 55. | Palmyra | 105.0 | 59.0(+46.0)#55 | 52.0(+53.0)#4,350 |
| 56. | Circleville | 105.0 | 59.0(+46.0)#56 | 52.0(+53.0)#4,354 |
| 57. | Plymouth | 102.0 | 59.0(+43.0)#57 | 52.0(+50.0)#4,578 |
| 58. | Sterling | 102.0 | 59.0(+43.0)#58 | 52.0(+50.0)#4,579 |
| 59. | Salem | 100.0 | 59.0(+41.0)#59 | 52.0(+48.0)#4,668 |
| 60. | Alta | 100.0 | 59.0(+41.0)#60 | 52.0(+48.0)#4,720 |
| 61. | Delta | 98.0 | 59.0(+39.0)#61 | 52.0(+46.0)#4,853 |
| 62. | Spanish Fork | 97.0 | 59.0(+38.0)#62 | 52.0(+45.0)#4,914 |
| 63. | Oakley | 95.0 | 59.0(+36.0)#63 | 52.0(+43.0)#5,146 |
| 64. | Hideout | 95.0 | 59.0(+36.0)#64 | 52.0(+43.0)#5,159 |
| 65. | Paradise | 94.0 | 59.0(+35.0)#65 | 52.0(+42.0)#5,257 |
| 66. | Thatcher | 93.0 | 59.0(+34.0)#66 | 52.0(+41.0)#5,340 |
| 67. | Pleasant Grove | 92.0 | 59.0(+33.0)#67 | 52.0(+40.0)#5,376 |
| 68. | Springville | 92.0 | 59.0(+33.0)#68 | 52.0(+40.0)#5,377 |
| 69. | Clearfield | 92.0 | 59.0(+33.0)#69 | 52.0(+40.0)#5,378 |
| 70. | Price | 91.0 | 59.0(+32.0)#70 | 52.0(+39.0)#5,473 |
| 71. | West Wood | 89.0 | 59.0(+30.0)#71 | 52.0(+37.0)#5,699 |
| 72. | Kanosh | 89.0 | 59.0(+30.0)#72 | 52.0(+37.0)#5,713 |
| 73. | Benjamin | 88.0 | 59.0(+29.0)#73 | 52.0(+36.0)#5,803 |
| 74. | Woods Cross | 87.0 | 59.0(+28.0)#74 | 52.0(+35.0)#5,851 |
| 75. | Vineyard | 83.0 | 59.0(+24.0)#75 | 52.0(+31.0)#6,256 |
| 76. | Elk Ridge | 82.0 | 59.0(+23.0)#76 | 52.0(+30.0)#6,420 |
| 77. | Maeser | 82.0 | 59.0(+23.0)#77 | 52.0(+30.0)#6,424 |
| 78. | Marriott Slaterville | 82.0 | 59.0(+23.0)#78 | 52.0(+30.0)#6,441 |
| 79. | Emery | 82.0 | 59.0(+23.0)#79 | 52.0(+30.0)#6,493 |
| 80. | Harrisville | 81.0 | 59.0(+22.0)#80 | 52.0(+29.0)#6,535 |
| 81. | Annabella | 81.0 | 59.0(+22.0)#81 | 52.0(+29.0)#6,601 |
| 82. | Dugway | 81.0 | 59.0(+22.0)#82 | 52.0(+29.0)#6,619 |
| 83. | Washington | 79.0 | 59.0(+20.0)#83 | 52.0(+27.0)#6,769 |
| 84. | Ivins | 79.0 | 59.0(+20.0)#84 | 52.0(+27.0)#6,788 |
| 85. | Hildale | 79.0 | 59.0(+20.0)#85 | 52.0(+27.0)#6,845 |
| 86. | Altamont | 79.0 | 59.0(+20.0)#86 | 52.0(+27.0)#6,862 |
| 87. | Cedar Hills | 78.0 | 59.0(+19.0)#87 | 52.0(+26.0)#6,896 |
| 88. | Spring Lake | 78.0 | 59.0(+19.0)#88 | 52.0(+26.0)#6,972 |
| 89. | North Ogden | 77.0 | 59.0(+18.0)#89 | 52.0(+25.0)#6,996 |
| 90. | Lewiston | 77.0 | 59.0(+18.0)#90 | 52.0(+25.0)#7,057 |
| 91. | Pleasant View | 76.0 | 59.0(+17.0)#91 | 52.0(+24.0)#7,167 |
| 92. | American Fork | 75.0 | 59.0(+16.0)#92 | 52.0(+23.0)#7,257 |
| 93. | Genola | 75.0 | 59.0(+16.0)#93 | 52.0(+23.0)#7,335 |
| 94. | West Haven | 74.0 | 59.0(+15.0)#94 | 52.0(+22.0)#7,412 |
| 95. | Grantsville | 74.0 | 59.0(+15.0)#95 | 52.0(+22.0)#7,424 |
| 96. | Providence | 73.0 | 59.0(+14.0)#96 | 52.0(+21.0)#7,597 |
| 97. | Ephraim | 73.0 | 59.0(+14.0)#97 | 52.0(+21.0)#7,614 |
| 98. | Sunset | 72.0 | 59.0(+13.0)#98 | 52.0(+20.0)#7,748 |
| 99. | Ballard | 72.0 | 59.0(+13.0)#99 | 52.0(+20.0)#7,783 |
| 100. | Orem | 71.0 | 59.0(+12.0)#100 | 52.0(+19.0)#7,821 |
Common Questions
What are the Top 10 Cities with the Most Births per 1,000 Women Receiving Public Assitance in Utah?
Top 10 Cities with the Most Births per 1,000 Women Receiving Public Assitance in Utah are:
#1
600.0
#2
407.0
#3
380.0
#4
364.0
#5
362.0
#6
308.0
#7
286.0
#8
281.0
#9
250.0
#10
250.0
What city has the Most Births per 1,000 Women Receiving Public Assitance in Utah?
Antimony has the Most Births per 1,000 Women Receiving Public Assitance in Utah with 600.0.
What is the Number of Births per 1,000 Women Receiving Public Assitance in the State of Utah?
Number of Births per 1,000 Women Receiving Public Assitance in Utah is 59.0.
What is the Number of Births per 1,000 Women Receiving Public Assitance in the United States?
Number of Births per 1,000 Women Receiving Public Assitance in the United States is 52.0.