Cities with the Most Births per 1,000 Women Receiving Public Assitance in Oregon
RELATED REPORTS & OPTIONS
Highest Birth Rate | Public Income
Oregon
Compare Cities
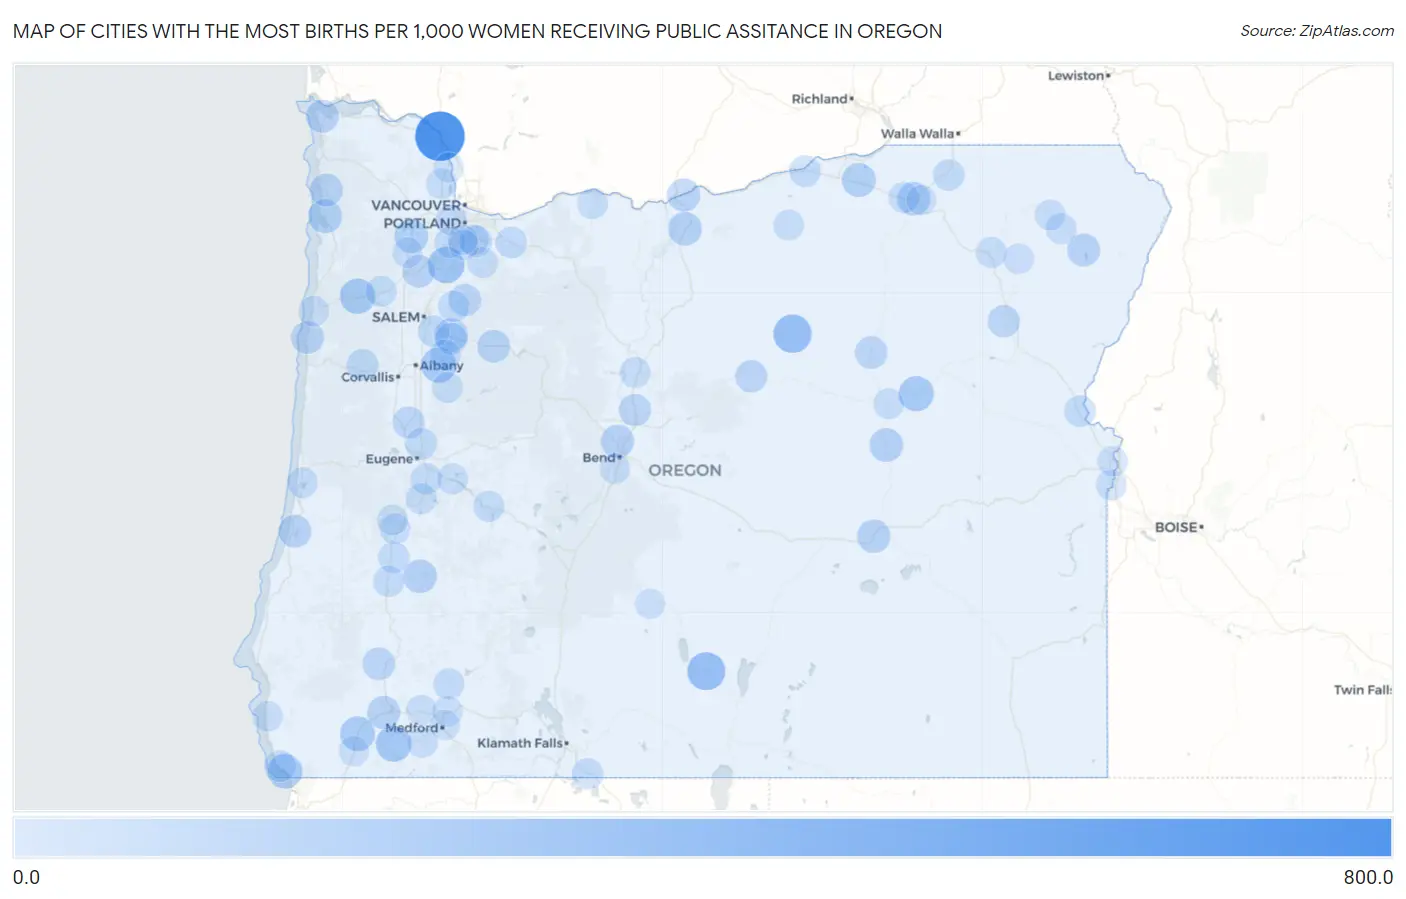
Map of Cities with the Most Births per 1,000 Women Receiving Public Assitance in Oregon
0.0
800.0
Cities with the Most Births per 1,000 Women Receiving Public Assitance in Oregon
| City | Births / 1,000 Women | vs State | vs National | |
| 1. | Prescott | 750.0 | 46.0(+704)#1 | 52.0(+698)#111 |
| 2. | Rocky Point | 692.0 | 46.0(+646)#2 | 52.0(+640)#133 |
| 3. | Knappa | 580.0 | 46.0(+534)#3 | 52.0(+528)#182 |
| 4. | Mapleton | 475.0 | 46.0(+429)#4 | 52.0(+423)#255 |
| 5. | Neotsu | 415.0 | 46.0(+369)#5 | 52.0(+363)#325 |
| 6. | Spray | 346.0 | 46.0(+300)#6 | 52.0(+294)#448 |
| 7. | Paisley | 340.0 | 46.0(+294)#7 | 52.0(+288)#465 |
| 8. | Ochoco West | 325.0 | 46.0(+279)#8 | 52.0(+273)#521 |
| 9. | Cheshire | 308.0 | 46.0(+262)#9 | 52.0(+256)#592 |
| 10. | Butteville | 282.0 | 46.0(+236)#10 | 52.0(+230)#704 |
| 11. | Williams | 264.0 | 46.0(+218)#11 | 52.0(+212)#793 |
| 12. | Grand Ronde | 247.0 | 46.0(+201)#12 | 52.0(+195)#905 |
| 13. | Crabtree | 246.0 | 46.0(+200)#13 | 52.0(+194)#912 |
| 14. | Prairie City | 238.0 | 46.0(+192)#14 | 52.0(+186)#960 |
| 15. | Selma | 229.0 | 46.0(+183)#15 | 52.0(+177)#1,033 |
| 16. | Harbor | 226.0 | 46.0(+180)#16 | 52.0(+174)#1,071 |
| 17. | Stanfield | 199.0 | 46.0(+153)#17 | 52.0(+147)#1,353 |
| 18. | Garibaldi | 195.0 | 46.0(+149)#18 | 52.0(+143)#1,383 |
| 19. | Gaston | 194.0 | 46.0(+148)#19 | 52.0(+142)#1,395 |
| 20. | Moro | 190.0 | 46.0(+144)#20 | 52.0(+138)#1,455 |
| 21. | Glide | 189.0 | 46.0(+143)#21 | 52.0(+137)#1,464 |
| 22. | Seneca | 188.0 | 46.0(+142)#22 | 52.0(+136)#1,486 |
| 23. | Barnesdale | 186.0 | 46.0(+140)#23 | 52.0(+134)#1,522 |
| 24. | Gopher Flats | 182.0 | 46.0(+136)#24 | 52.0(+130)#1,572 |
| 25. | Sublimity | 180.0 | 46.0(+134)#25 | 52.0(+128)#1,597 |
| 26. | Hines | 180.0 | 46.0(+134)#26 | 52.0(+128)#1,600 |
| 27. | Tumalo | 174.0 | 46.0(+128)#27 | 52.0(+122)#1,694 |
| 28. | Redwood | 169.0 | 46.0(+123)#28 | 52.0(+117)#1,779 |
| 29. | Rufus | 167.0 | 46.0(+121)#29 | 52.0(+115)#1,838 |
| 30. | Joseph | 164.0 | 46.0(+118)#30 | 52.0(+112)#1,895 |
| 31. | Warrenton | 163.0 | 46.0(+117)#31 | 52.0(+111)#1,907 |
| 32. | Lakeside | 163.0 | 46.0(+117)#32 | 52.0(+111)#1,912 |
| 33. | Nehalem | 163.0 | 46.0(+117)#33 | 52.0(+111)#1,926 |
| 34. | Dayton | 159.0 | 46.0(+113)#34 | 52.0(+107)#1,999 |
| 35. | Depoe Bay | 159.0 | 46.0(+113)#35 | 52.0(+107)#2,001 |
| 36. | Gates | 158.0 | 46.0(+112)#36 | 52.0(+106)#2,035 |
| 37. | Glendale | 154.0 | 46.0(+108)#37 | 52.0(+102)#2,126 |
| 38. | Long Creek | 154.0 | 46.0(+108)#38 | 52.0(+102)#2,140 |
| 39. | Saunders Lake | 152.0 | 46.0(+106)#39 | 52.0(+100.0)#2,188 |
| 40. | Scotts Mills | 148.0 | 46.0(+102)#40 | 52.0(+96.0)#2,324 |
| 41. | Haines | 143.0 | 46.0(+97.0)#41 | 52.0(+91.0)#2,503 |
| 42. | Terrebonne | 142.0 | 46.0(+96.0)#42 | 52.0(+90.0)#2,546 |
| 43. | Mitchell | 139.0 | 46.0(+93.0)#43 | 52.0(+87.0)#2,638 |
| 44. | Harrisburg | 137.0 | 46.0(+91.0)#44 | 52.0(+85.0)#2,681 |
| 45. | Juniper Canyon | 134.0 | 46.0(+88.0)#45 | 52.0(+82.0)#2,784 |
| 46. | Summit | 127.0 | 46.0(+81.0)#46 | 52.0(+75.0)#3,119 |
| 47. | Stayton | 124.0 | 46.0(+78.0)#47 | 52.0(+72.0)#3,217 |
| 48. | Brookings | 123.0 | 46.0(+77.0)#48 | 52.0(+71.0)#3,255 |
| 49. | Turner | 123.0 | 46.0(+77.0)#49 | 52.0(+71.0)#3,264 |
| 50. | Weston | 123.0 | 46.0(+77.0)#50 | 52.0(+71.0)#3,287 |
| 51. | Coburg | 121.0 | 46.0(+75.0)#51 | 52.0(+69.0)#3,367 |
| 52. | Sandy | 118.0 | 46.0(+72.0)#52 | 52.0(+66.0)#3,508 |
| 53. | Boardman | 116.0 | 46.0(+70.0)#53 | 52.0(+64.0)#3,629 |
| 54. | Johnson City | 115.0 | 46.0(+69.0)#54 | 52.0(+63.0)#3,721 |
| 55. | Huntington | 114.0 | 46.0(+68.0)#55 | 52.0(+62.0)#3,778 |
| 56. | Silverton | 110.0 | 46.0(+64.0)#56 | 52.0(+58.0)#3,998 |
| 57. | Creswell | 110.0 | 46.0(+64.0)#57 | 52.0(+58.0)#4,003 |
| 58. | Merrill | 110.0 | 46.0(+64.0)#58 | 52.0(+58.0)#4,035 |
| 59. | Sheridan | 109.0 | 46.0(+63.0)#59 | 52.0(+57.0)#4,061 |
| 60. | Oakland | 107.0 | 46.0(+61.0)#60 | 52.0(+55.0)#4,205 |
| 61. | Roseburg North | 106.0 | 46.0(+60.0)#61 | 52.0(+54.0)#4,253 |
| 62. | Oakridge | 105.0 | 46.0(+59.0)#62 | 52.0(+53.0)#4,317 |
| 63. | King City | 102.0 | 46.0(+56.0)#63 | 52.0(+50.0)#4,524 |
| 64. | Shady Cove | 102.0 | 46.0(+56.0)#64 | 52.0(+50.0)#4,530 |
| 65. | Cottage Grove | 101.0 | 46.0(+55.0)#65 | 52.0(+49.0)#4,592 |
| 66. | Lowell | 101.0 | 46.0(+55.0)#66 | 52.0(+49.0)#4,635 |
| 67. | Metolius | 101.0 | 46.0(+55.0)#67 | 52.0(+49.0)#4,639 |
| 68. | Lostine | 101.0 | 46.0(+55.0)#68 | 52.0(+49.0)#4,657 |
| 69. | Island City | 100.0 | 46.0(+54.0)#69 | 52.0(+48.0)#4,703 |
| 70. | Scio | 99.0 | 46.0(+53.0)#70 | 52.0(+47.0)#4,817 |
| 71. | Yoncalla | 98.0 | 46.0(+52.0)#71 | 52.0(+46.0)#4,872 |
| 72. | Pendleton | 96.0 | 46.0(+50.0)#72 | 52.0(+44.0)#5,003 |
| 73. | Cedar Mill | 95.0 | 46.0(+49.0)#73 | 52.0(+43.0)#5,104 |
| 74. | Drain | 95.0 | 46.0(+49.0)#74 | 52.0(+43.0)#5,161 |
| 75. | Waterloo | 95.0 | 46.0(+49.0)#75 | 52.0(+43.0)#5,190 |
| 76. | Scappoose | 92.0 | 46.0(+46.0)#76 | 52.0(+40.0)#5,393 |
| 77. | Beavercreek | 91.0 | 46.0(+45.0)#77 | 52.0(+39.0)#5,482 |
| 78. | Nyssa | 90.0 | 46.0(+44.0)#78 | 52.0(+38.0)#5,591 |
| 79. | Odell | 90.0 | 46.0(+44.0)#79 | 52.0(+38.0)#5,592 |
| 80. | Dunes City | 90.0 | 46.0(+44.0)#80 | 52.0(+38.0)#5,610 |
| 81. | Canyon City | 90.0 | 46.0(+44.0)#81 | 52.0(+38.0)#5,617 |
| 82. | Wallowa | 90.0 | 46.0(+44.0)#82 | 52.0(+38.0)#5,622 |
| 83. | Ione | 90.0 | 46.0(+44.0)#83 | 52.0(+38.0)#5,636 |
| 84. | Lincoln City | 88.0 | 46.0(+42.0)#84 | 52.0(+36.0)#5,742 |
| 85. | Gold Beach | 88.0 | 46.0(+42.0)#85 | 52.0(+36.0)#5,781 |
| 86. | Ruch | 88.0 | 46.0(+42.0)#86 | 52.0(+36.0)#5,788 |
| 87. | Cove | 86.0 | 46.0(+40.0)#87 | 52.0(+34.0)#6,017 |
| 88. | Yamhill | 83.0 | 46.0(+37.0)#88 | 52.0(+31.0)#6,304 |
| 89. | Ontario | 82.0 | 46.0(+36.0)#89 | 52.0(+30.0)#6,394 |
| 90. | Deschutes River Woods | 82.0 | 46.0(+36.0)#90 | 52.0(+30.0)#6,414 |
| 91. | Oatfield | 81.0 | 46.0(+35.0)#91 | 52.0(+29.0)#6,526 |
| 92. | Gold Hill | 80.0 | 46.0(+34.0)#92 | 52.0(+28.0)#6,714 |
| 93. | White City | 78.0 | 46.0(+32.0)#93 | 52.0(+26.0)#6,891 |
| 94. | Stafford | 77.0 | 46.0(+31.0)#94 | 52.0(+25.0)#7,072 |
| 95. | St Helens | 76.0 | 46.0(+30.0)#95 | 52.0(+24.0)#7,162 |
| 96. | Cave Junction | 76.0 | 46.0(+30.0)#96 | 52.0(+24.0)#7,222 |
| 97. | Mission | 74.0 | 46.0(+28.0)#97 | 52.0(+22.0)#7,516 |
| 98. | Silver Lake | 74.0 | 46.0(+28.0)#98 | 52.0(+22.0)#7,549 |
| 99. | Medford | 73.0 | 46.0(+27.0)#99 | 52.0(+21.0)#7,562 |
| 100. | Lake Oswego | 73.0 | 46.0(+27.0)#100 | 52.0(+21.0)#7,566 |
Common Questions
What are the Top 10 Cities with the Most Births per 1,000 Women Receiving Public Assitance in Oregon?
Top 10 Cities with the Most Births per 1,000 Women Receiving Public Assitance in Oregon are:
#1
750.0
#2
346.0
#3
340.0
#4
282.0
#5
264.0
#6
247.0
#7
246.0
#8
238.0
#9
229.0
#10
226.0
What city has the Most Births per 1,000 Women Receiving Public Assitance in Oregon?
Prescott has the Most Births per 1,000 Women Receiving Public Assitance in Oregon with 750.0.
What is the Number of Births per 1,000 Women Receiving Public Assitance in the State of Oregon?
Number of Births per 1,000 Women Receiving Public Assitance in Oregon is 46.0.
What is the Number of Births per 1,000 Women Receiving Public Assitance in the United States?
Number of Births per 1,000 Women Receiving Public Assitance in the United States is 52.0.