Cities with the Most Births per 1,000 Women Receiving Public Assitance in New Hampshire
RELATED REPORTS & OPTIONS
Highest Birth Rate | Public Income
New Hampshire
Compare Cities
Map of Cities with the Most Births per 1,000 Women Receiving Public Assitance in New Hampshire
0.0
400.0
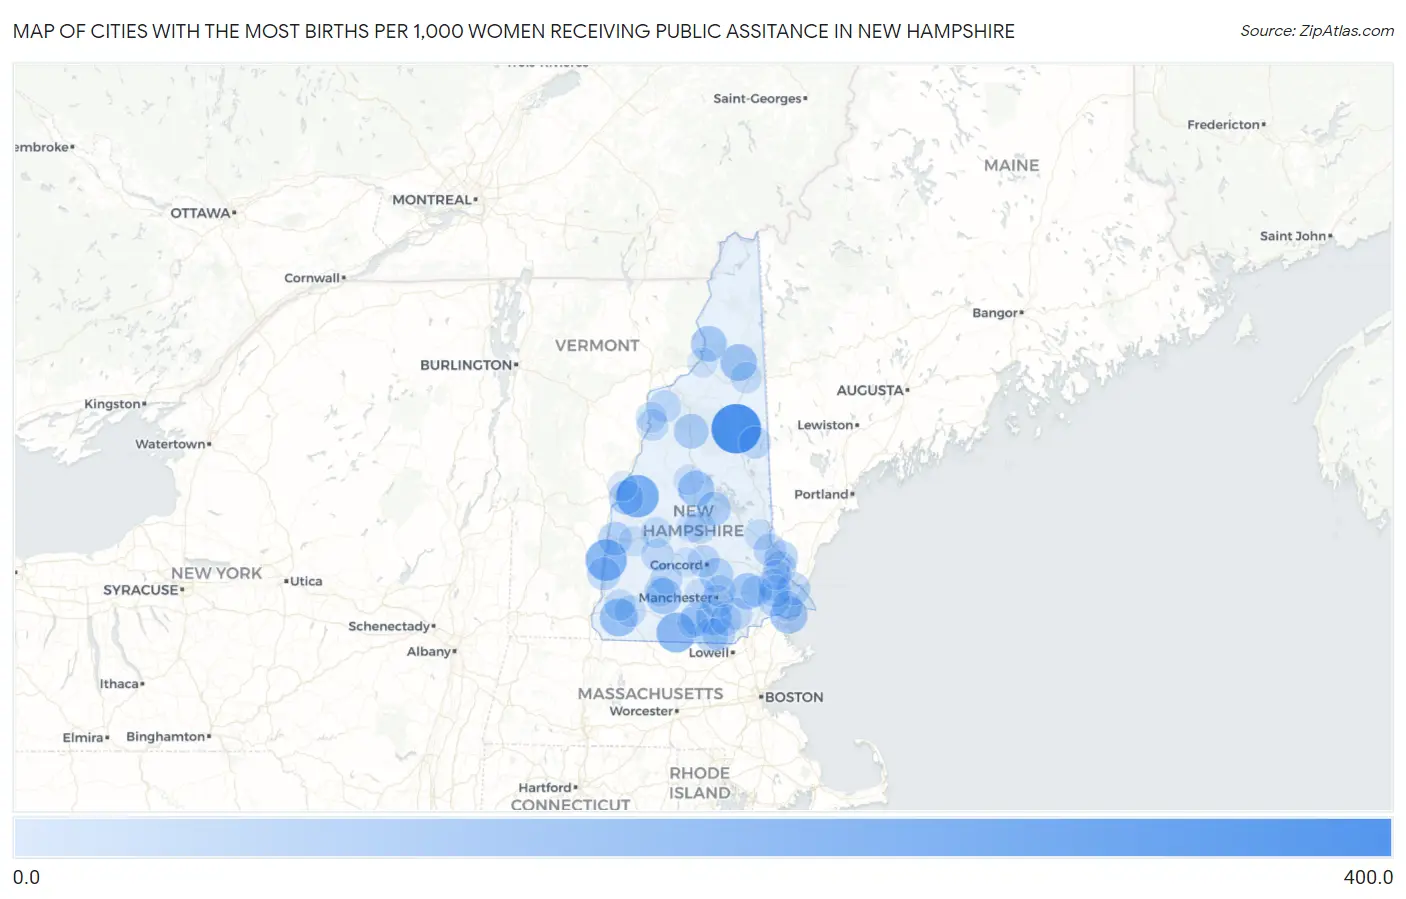
Cities with the Most Births per 1,000 Women Receiving Public Assitance in New Hampshire
| City | Births / 1,000 Women | vs State | vs National | |
| 1. | Bartlett | 364.0 | 46.0(+318)#1 | 52.0(+312)#407 |
| 2. | Enfield | 229.0 | 46.0(+183)#2 | 52.0(+177)#1,031 |
| 3. | Charlestown | 209.0 | 46.0(+163)#3 | 52.0(+157)#1,232 |
| 4. | Greenville | 178.0 | 46.0(+132)#4 | 52.0(+126)#1,637 |
| 5. | West Swanzey | 144.0 | 46.0(+98.0)#5 | 52.0(+92.0)#2,440 |
| 6. | Seabrook Beach | 132.0 | 46.0(+86.0)#6 | 52.0(+80.0)#2,882 |
| 7. | Berlin | 121.0 | 46.0(+75.0)#7 | 52.0(+69.0)#3,350 |
| 8. | Raymond | 113.0 | 46.0(+67.0)#8 | 52.0(+61.0)#3,804 |
| 9. | Bennington | 111.0 | 46.0(+65.0)#9 | 52.0(+59.0)#3,969 |
| 10. | Ashland | 110.0 | 46.0(+64.0)#10 | 52.0(+58.0)#4,024 |
| 11. | Groveton | 104.0 | 46.0(+58.0)#11 | 52.0(+52.0)#4,414 |
| 12. | East Merrimack | 95.0 | 46.0(+49.0)#12 | 52.0(+43.0)#5,122 |
| 13. | Lincoln | 86.0 | 46.0(+40.0)#13 | 52.0(+34.0)#6,006 |
| 14. | Lebanon | 79.0 | 46.0(+33.0)#14 | 52.0(+27.0)#6,781 |
| 15. | Klondike Corner | 79.0 | 46.0(+33.0)#15 | 52.0(+27.0)#6,848 |
| 16. | Laconia | 76.0 | 46.0(+30.0)#16 | 52.0(+24.0)#7,158 |
| 17. | Claremont | 71.0 | 46.0(+25.0)#17 | 52.0(+19.0)#7,851 |
| 18. | Suncook | 71.0 | 46.0(+25.0)#18 | 52.0(+19.0)#7,882 |
| 19. | Amherst | 71.0 | 46.0(+25.0)#19 | 52.0(+19.0)#7,959 |
| 20. | Nashua | 70.0 | 46.0(+24.0)#20 | 52.0(+18.0)#8,000 |
| 21. | Somersworth | 64.0 | 46.0(+18.0)#21 | 52.0(+12.0)#9,044 |
| 22. | Hudson | 60.0 | 46.0(+14.0)#22 | 52.0(+8.00)#9,853 |
| 23. | North Walpole | 57.0 | 46.0(+11.0)#23 | 52.0(+5.00)#10,560 |
| 24. | Portsmouth | 55.0 | 46.0(+9.00)#24 | 52.0(+3.00)#10,868 |
| 25. | Dover | 50.0 | 46.0(+4.00)#25 | 52.0(-2.00)#12,016 |
| 26. | Rochester | 49.0 | 46.0(+3.00)#26 | 52.0(-3.00)#12,274 |
| 27. | Manchester | 47.0 | 46.0(+1.000)#27 | 52.0(-5.00)#12,747 |
| 28. | Exeter | 47.0 | 46.0(+1.000)#28 | 52.0(-5.00)#12,827 |
| 29. | Concord | 44.0 | 46.0(-2.00)#29 | 52.0(-8.00)#13,475 |
| 30. | Newmarket | 43.0 | 46.0(-3.00)#30 | 52.0(-9.00)#13,788 |
| 31. | Bradford | 43.0 | 46.0(-3.00)#31 | 52.0(-9.00)#13,910 |
| 32. | Newfields | 43.0 | 46.0(-3.00)#32 | 52.0(-9.00)#13,925 |
| 33. | Derry | 41.0 | 46.0(-5.00)#33 | 52.0(-11.0)#14,243 |
| 34. | Conway | 41.0 | 46.0(-5.00)#34 | 52.0(-11.0)#14,344 |
| 35. | Tilton Northfield | 39.0 | 46.0(-7.00)#35 | 52.0(-13.0)#14,819 |
| 36. | Lisbon | 37.0 | 46.0(-9.00)#36 | 52.0(-15.0)#15,399 |
| 37. | South Hooksett | 36.0 | 46.0(-10.00)#37 | 52.0(-16.0)#15,539 |
| 38. | North Haverhill | 34.0 | 46.0(-12.0)#38 | 52.0(-18.0)#16,117 |
| 39. | Hillsborough | 33.0 | 46.0(-13.0)#39 | 52.0(-19.0)#16,315 |
| 40. | Londonderry | 30.0 | 46.0(-16.0)#40 | 52.0(-22.0)#16,885 |
| 41. | Epping | 29.0 | 46.0(-17.0)#41 | 52.0(-23.0)#17,198 |
| 42. | Marlborough | 29.0 | 46.0(-17.0)#42 | 52.0(-23.0)#17,244 |
| 43. | Gorham | 26.0 | 46.0(-20.0)#43 | 52.0(-26.0)#17,829 |
| 44. | Keene | 25.0 | 46.0(-21.0)#44 | 52.0(-27.0)#17,940 |
| 45. | New London | 23.0 | 46.0(-23.0)#45 | 52.0(-29.0)#18,461 |
| 46. | Antrim | 23.0 | 46.0(-23.0)#46 | 52.0(-29.0)#18,463 |
| 47. | Woodsville | 21.0 | 46.0(-25.0)#47 | 52.0(-31.0)#18,825 |
| 48. | Farmington | 20.0 | 46.0(-26.0)#48 | 52.0(-32.0)#18,962 |
| 49. | Milford | 17.0 | 46.0(-29.0)#49 | 52.0(-35.0)#19,449 |
| 50. | Hampton | 15.0 | 46.0(-31.0)#50 | 52.0(-37.0)#19,800 |
| 51. | Plymouth | 12.0 | 46.0(-34.0)#51 | 52.0(-40.0)#20,261 |
| 52. | Goffstown | 12.0 | 46.0(-34.0)#52 | 52.0(-40.0)#20,275 |
| 53. | Franklin | 11.0 | 46.0(-35.0)#53 | 52.0(-41.0)#20,375 |
| 54. | Newport | 7.0 | 46.0(-39.0)#54 | 52.0(-45.0)#20,806 |
| 55. | Hanover | 6.0 | 46.0(-40.0)#55 | 52.0(-46.0)#20,895 |
| 56. | Lancaster | 6.0 | 46.0(-40.0)#56 | 52.0(-46.0)#20,914 |
| 57. | Contoocook | 4.0 | 46.0(-42.0)#57 | 52.0(-48.0)#21,023 |
| 58. | Durham | 3.0 | 46.0(-43.0)#58 | 52.0(-49.0)#21,030 |
1
Common Questions
What are the Top 10 Cities with the Most Births per 1,000 Women Receiving Public Assitance in New Hampshire?
Top 10 Cities with the Most Births per 1,000 Women Receiving Public Assitance in New Hampshire are:
#1
364.0
#2
229.0
#3
209.0
#4
178.0
#5
144.0
#6
132.0
#7
121.0
#8
113.0
#9
111.0
#10
110.0
What city has the Most Births per 1,000 Women Receiving Public Assitance in New Hampshire?
Bartlett has the Most Births per 1,000 Women Receiving Public Assitance in New Hampshire with 364.0.
What is the Number of Births per 1,000 Women Receiving Public Assitance in the State of New Hampshire?
Number of Births per 1,000 Women Receiving Public Assitance in New Hampshire is 46.0.
What is the Number of Births per 1,000 Women Receiving Public Assitance in the United States?
Number of Births per 1,000 Women Receiving Public Assitance in the United States is 52.0.