Plano, TX Map & Demographics
Plano Map
Plano Overview
$55,938
PER CAPITA INCOME
$126,993
AVG FAMILY INCOME
$105,679
AVG HOUSEHOLD INCOME
32.9%
WAGE / INCOME GAP [ % ]
67.1¢/ $1
WAGE / INCOME GAP [ $ ]
$12,656
FAMILY INCOME DEFICIT
0.45
INEQUALITY / GINI INDEX
284,948
TOTAL POPULATION
141,374
MALE POPULATION
143,574
FEMALE POPULATION
98.47
MALES / 100 FEMALES
101.56
FEMALES / 100 MALES
38.9
MEDIAN AGE
3.1
AVG FAMILY SIZE
2.6
AVG HOUSEHOLD SIZE
159,574
LABOR FORCE [ PEOPLE ]
69.3%
PERCENT IN LABOR FORCE
4.4%
UNEMPLOYMENT RATE
Income in Plano
Income Overview in Plano
Per Capita Income in Plano is $55,938, while median incomes of families and households are $126,993 and $105,679 respectively.
| Characteristic | Number | Measure |
| Per Capita Income | 284,948 | $55,938 |
| Median Family Income | 75,566 | $126,993 |
| Mean Family Income | 75,566 | $168,133 |
| Median Household Income | 107,448 | $105,679 |
| Mean Household Income | 107,448 | $145,448 |
| Income Deficit | 75,566 | $12,656 |
| Wage / Income Gap (%) | 284,948 | 32.92% |
| Wage / Income Gap ($) | 284,948 | 67.08¢ per $1 |
| Gini / Inequality Index | 284,948 | 0.45 |
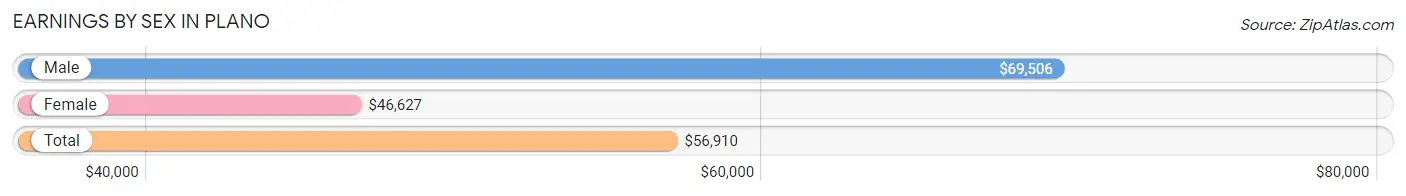
Earnings by Sex in Plano
Average Earnings in Plano are $56,910, $69,506 for men and $46,627 for women, a difference of 32.9%.
| Sex | Number | Average Earnings |
| Male | 90,129 (54.7%) | $69,506 |
| Female | 74,758 (45.3%) | $46,627 |
| Total | 164,887 (100.0%) | $56,910 |
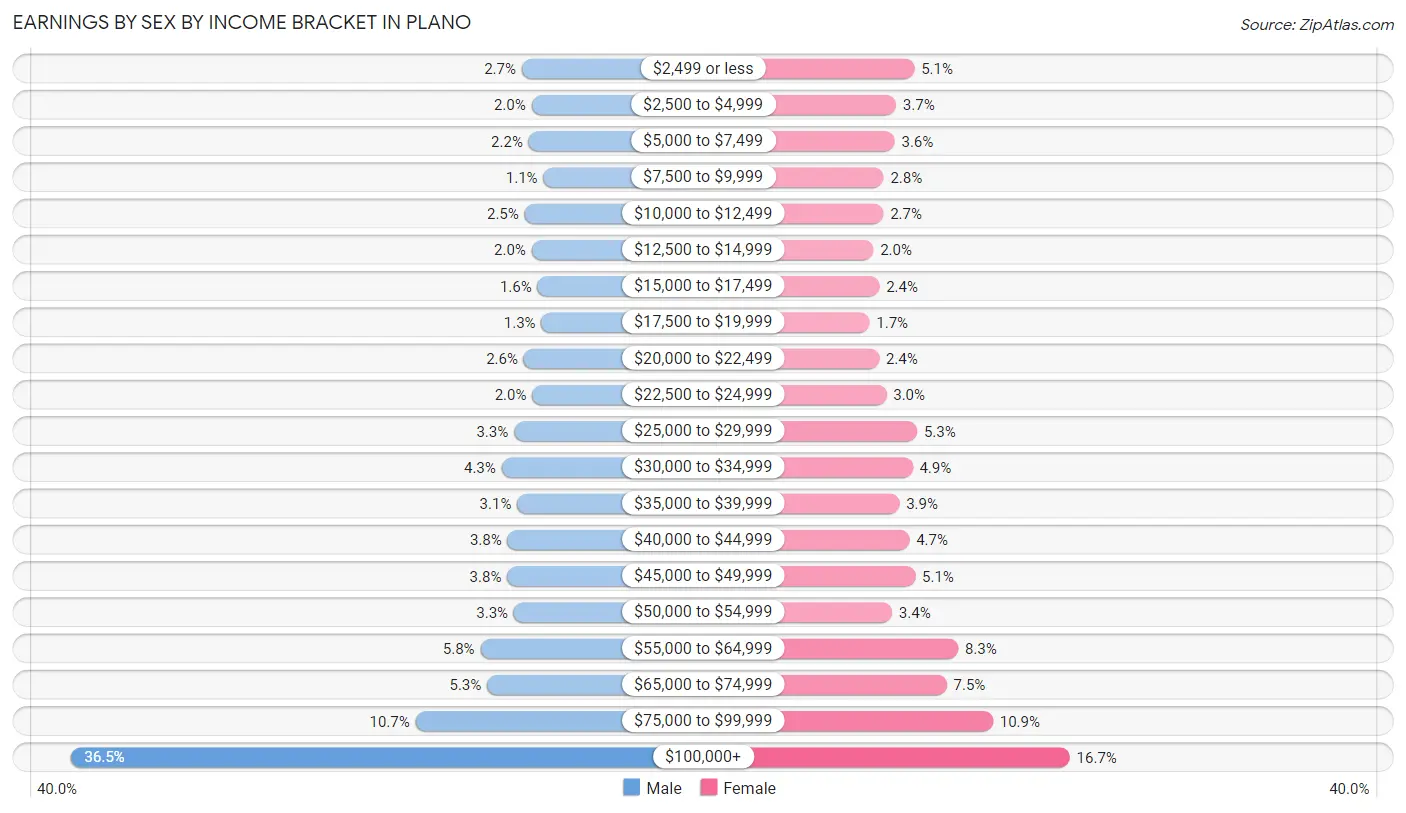
Earnings by Sex by Income Bracket in Plano
The most common earnings brackets in Plano are $100,000+ for men (32,889 | 36.5%) and $100,000+ for women (12,484 | 16.7%).
| Income | Male | Female |
| $2,499 or less | 2,470 (2.7%) | 3,776 (5.1%) |
| $2,500 to $4,999 | 1,808 (2.0%) | 2,751 (3.7%) |
| $5,000 to $7,499 | 2,000 (2.2%) | 2,674 (3.6%) |
| $7,500 to $9,999 | 1,009 (1.1%) | 2,058 (2.8%) |
| $10,000 to $12,499 | 2,282 (2.5%) | 2,043 (2.7%) |
| $12,500 to $14,999 | 1,799 (2.0%) | 1,480 (2.0%) |
| $15,000 to $17,499 | 1,407 (1.6%) | 1,814 (2.4%) |
| $17,500 to $19,999 | 1,145 (1.3%) | 1,260 (1.7%) |
| $20,000 to $22,499 | 2,334 (2.6%) | 1,802 (2.4%) |
| $22,500 to $24,999 | 1,759 (1.9%) | 2,213 (3.0%) |
| $25,000 to $29,999 | 2,996 (3.3%) | 3,929 (5.3%) |
| $30,000 to $34,999 | 3,832 (4.3%) | 3,681 (4.9%) |
| $35,000 to $39,999 | 2,777 (3.1%) | 2,941 (3.9%) |
| $40,000 to $44,999 | 3,438 (3.8%) | 3,495 (4.7%) |
| $45,000 to $49,999 | 3,456 (3.8%) | 3,831 (5.1%) |
| $50,000 to $54,999 | 3,002 (3.3%) | 2,524 (3.4%) |
| $55,000 to $64,999 | 5,268 (5.8%) | 6,228 (8.3%) |
| $65,000 to $74,999 | 4,817 (5.3%) | 5,595 (7.5%) |
| $75,000 to $99,999 | 9,641 (10.7%) | 8,179 (10.9%) |
| $100,000+ | 32,889 (36.5%) | 12,484 (16.7%) |
| Total | 90,129 (100.0%) | 74,758 (100.0%) |
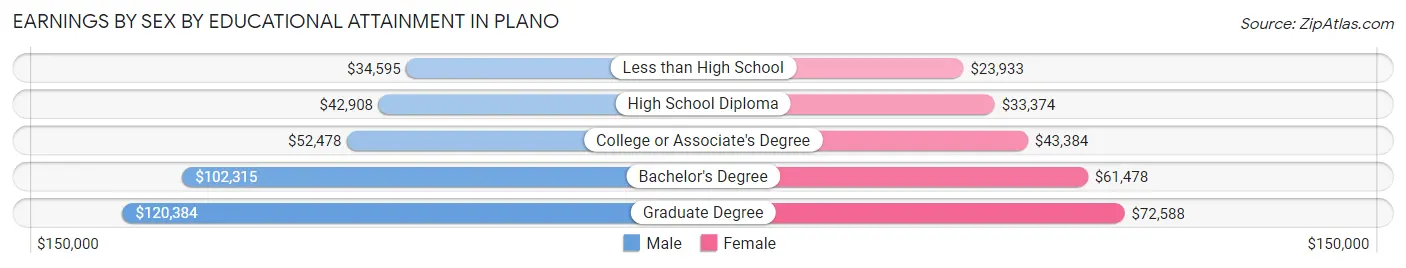
Earnings by Sex by Educational Attainment in Plano
Average earnings in Plano are $81,350 for men and $54,048 for women, a difference of 33.6%. Men with an educational attainment of graduate degree enjoy the highest average annual earnings of $120,384, while those with less than high school education earn the least with $34,595. Women with an educational attainment of graduate degree earn the most with the average annual earnings of $72,588, while those with less than high school education have the smallest earnings of $23,933.
| Educational Attainment | Male Income | Female Income |
| Less than High School | $34,595 | $23,933 |
| High School Diploma | $42,908 | $33,374 |
| College or Associate's Degree | $52,478 | $43,384 |
| Bachelor's Degree | $102,315 | $61,478 |
| Graduate Degree | $120,384 | $72,588 |
| Total | $81,350 | $54,048 |
Family Income in Plano
Family Income Brackets in Plano
According to the Plano family income data, there are 19,798 families falling into the $200,000+ income range, which is the most common income bracket and makes up 26.2% of all families. Conversely, the $10,000 to $14,999 income bracket is the least frequent group with only 529 families (0.7%) belonging to this category.
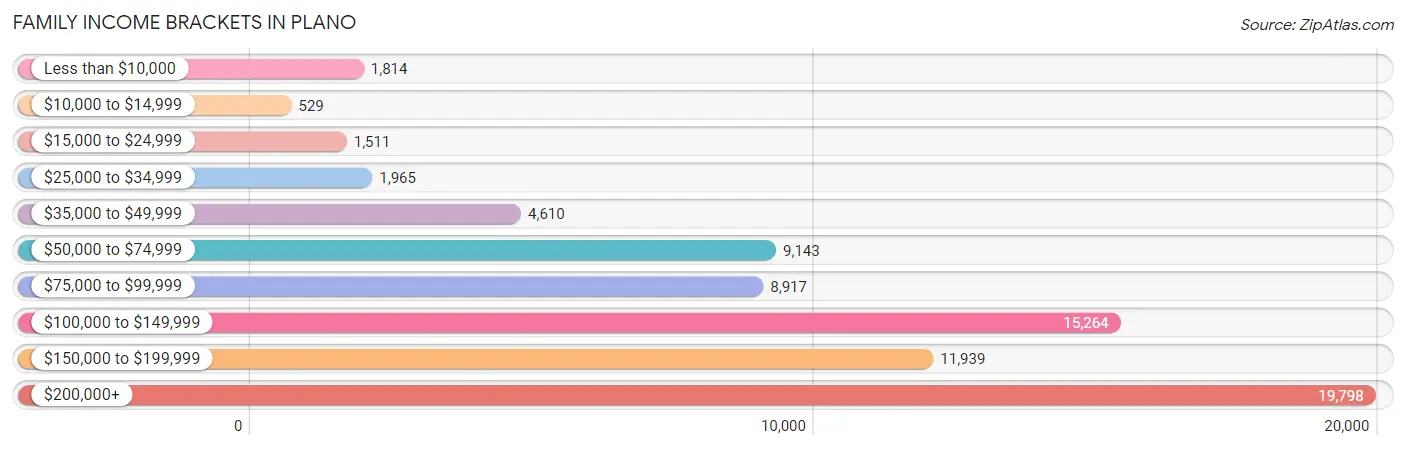
| Income Bracket | # Families | % Families |
| Less than $10,000 | 1,814 | 2.4% |
| $10,000 to $14,999 | 529 | 0.7% |
| $15,000 to $24,999 | 1,511 | 2.0% |
| $25,000 to $34,999 | 1,965 | 2.6% |
| $35,000 to $49,999 | 4,610 | 6.1% |
| $50,000 to $74,999 | 9,143 | 12.1% |
| $75,000 to $99,999 | 8,917 | 11.8% |
| $100,000 to $149,999 | 15,264 | 20.2% |
| $150,000 to $199,999 | 11,939 | 15.8% |
| $200,000+ | 19,798 | 26.2% |
Family Income by Famaliy Size in Plano
5-person families (6,420 | 8.5%) account for the highest median family income in Plano with $154,036 per family, while 2-person families (32,490 | 43.0%) have the highest median income of $55,986 per family member.
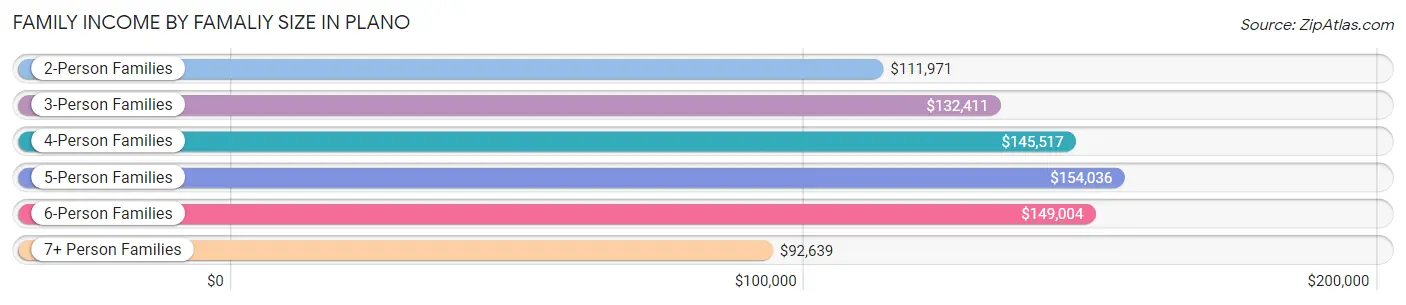
| Income Bracket | # Families | Median Income |
| 2-Person Families | 32,490 (43.0%) | $111,971 |
| 3-Person Families | 18,689 (24.7%) | $132,411 |
| 4-Person Families | 15,618 (20.7%) | $145,517 |
| 5-Person Families | 6,420 (8.5%) | $154,036 |
| 6-Person Families | 1,577 (2.1%) | $149,004 |
| 7+ Person Families | 772 (1.0%) | $92,639 |
| Total | 75,566 (100.0%) | $126,993 |
Family Income by Number of Earners in Plano
The median family income in Plano is $126,993, with families comprising 3+ earners (8,365) having the highest median family income of $172,931, while families with no earners (7,191) have the lowest median family income of $65,394, accounting for 11.1% and 9.5% of families, respectively.
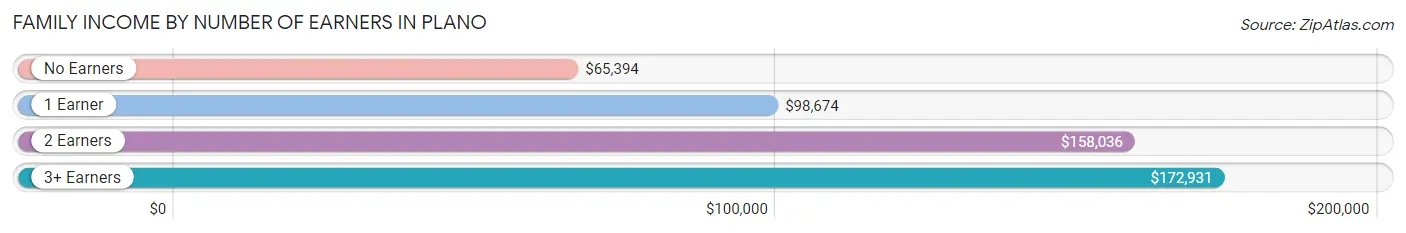
| Number of Earners | # Families | Median Income |
| No Earners | 7,191 (9.5%) | $65,394 |
| 1 Earner | 25,255 (33.4%) | $98,674 |
| 2 Earners | 34,755 (46.0%) | $158,036 |
| 3+ Earners | 8,365 (11.1%) | $172,931 |
| Total | 75,566 (100.0%) | $126,993 |
Household Income in Plano
Household Income Brackets in Plano
With 22,349 households falling in the category, the $200,000+ income range is the most frequent in Plano, accounting for 20.8% of all households. In contrast, only 1,397 households (1.3%) fall into the $10,000 to $14,999 income bracket, making it the least populous group.
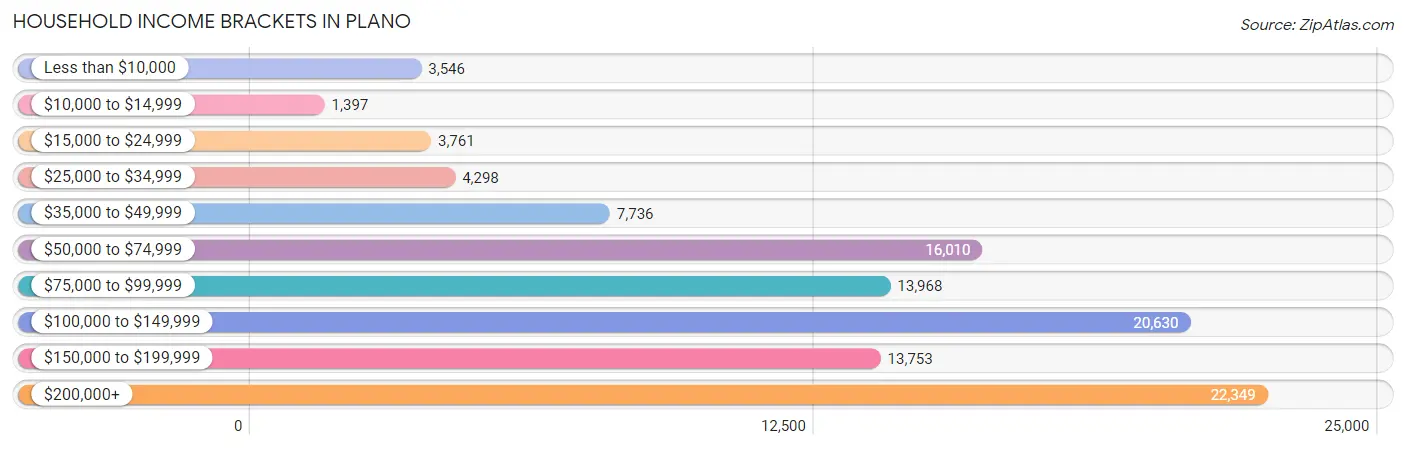
| Income Bracket | # Households | % Households |
| Less than $10,000 | 3,546 | 3.3% |
| $10,000 to $14,999 | 1,397 | 1.3% |
| $15,000 to $24,999 | 3,761 | 3.5% |
| $25,000 to $34,999 | 4,298 | 4.0% |
| $35,000 to $49,999 | 7,736 | 7.2% |
| $50,000 to $74,999 | 16,010 | 14.9% |
| $75,000 to $99,999 | 13,968 | 13.0% |
| $100,000 to $149,999 | 20,630 | 19.2% |
| $150,000 to $199,999 | 13,753 | 12.8% |
| $200,000+ | 22,349 | 20.8% |
Household Income by Householder Age in Plano
The median household income in Plano is $105,679, with the highest median household income of $135,912 found in the 45 to 64 years age bracket for the primary householder. A total of 42,558 households (39.6%) fall into this category. Meanwhile, the 15 to 24 years age bracket for the primary householder has the lowest median household income of $48,130, with 3,679 households (3.4%) in this group.
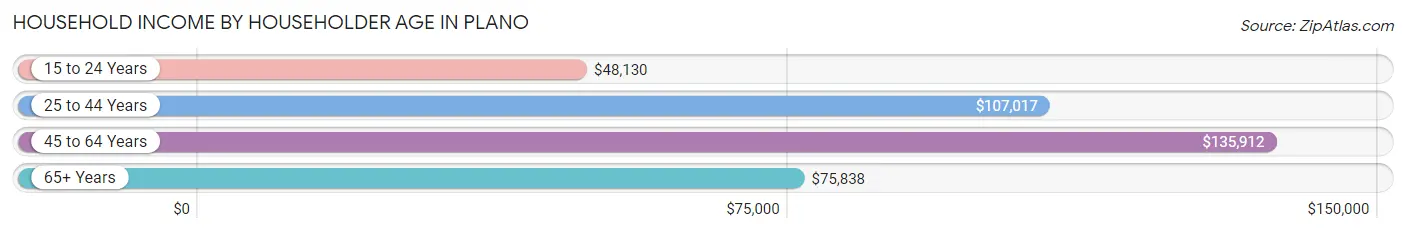
| Income Bracket | # Households | Median Income |
| 15 to 24 Years | 3,679 (3.4%) | $48,130 |
| 25 to 44 Years | 39,475 (36.7%) | $107,017 |
| 45 to 64 Years | 42,558 (39.6%) | $135,912 |
| 65+ Years | 21,736 (20.2%) | $75,838 |
| Total | 107,448 (100.0%) | $105,679 |
Poverty in Plano
Income Below Poverty by Sex and Age in Plano
With 6.2% poverty level for males and 7.6% for females among the residents of Plano, under 5 year old males and 18 to 24 year old females are the most vulnerable to poverty, with 1,165 males (14.6%) and 1,852 females (14.8%) in their respective age groups living below the poverty level.
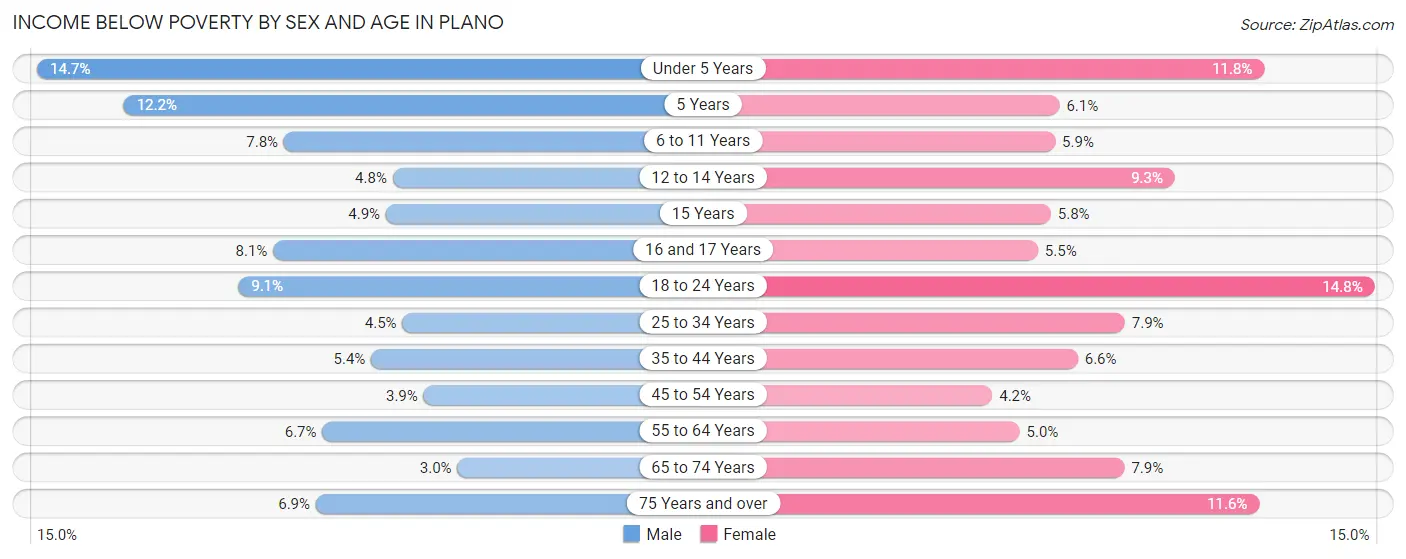
| Age Bracket | Male | Female |
| Under 5 Years | 1,165 (14.6%) | 908 (11.8%) |
| 5 Years | 172 (12.2%) | 103 (6.1%) |
| 6 to 11 Years | 894 (7.8%) | 550 (5.9%) |
| 12 to 14 Years | 243 (4.8%) | 524 (9.3%) |
| 15 Years | 102 (4.9%) | 117 (5.8%) |
| 16 and 17 Years | 293 (8.1%) | 193 (5.5%) |
| 18 to 24 Years | 1,152 (9.0%) | 1,852 (14.8%) |
| 25 to 34 Years | 878 (4.5%) | 1,523 (7.9%) |
| 35 to 44 Years | 1,188 (5.3%) | 1,363 (6.6%) |
| 45 to 54 Years | 751 (3.9%) | 844 (4.2%) |
| 55 to 64 Years | 1,236 (6.7%) | 940 (5.0%) |
| 65 to 74 Years | 332 (2.9%) | 1,026 (7.9%) |
| 75 Years and over | 400 (6.9%) | 965 (11.6%) |
| Total | 8,806 (6.2%) | 10,908 (7.6%) |
Income Above Poverty by Sex and Age in Plano
According to the poverty statistics in Plano, males aged 65 to 74 years and females aged 45 to 54 years are the age groups that are most secure financially, with 97.1% of males and 95.8% of females in these age groups living above the poverty line.
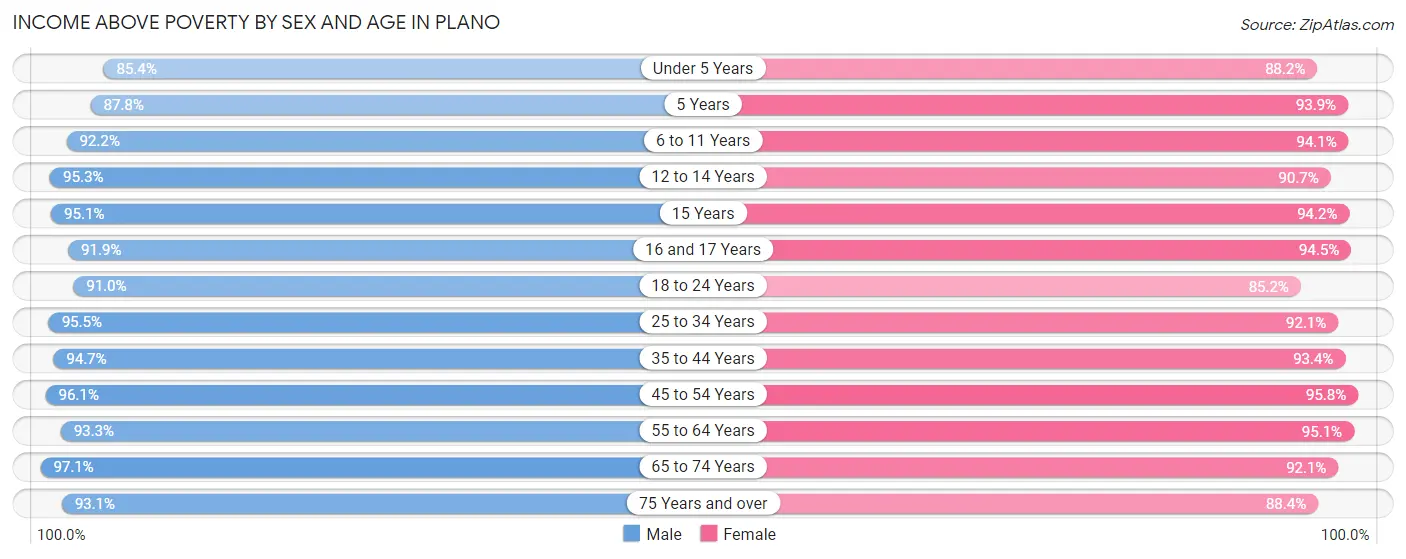
| Age Bracket | Male | Female |
| Under 5 Years | 6,789 (85.4%) | 6,811 (88.2%) |
| 5 Years | 1,233 (87.8%) | 1,598 (93.9%) |
| 6 to 11 Years | 10,590 (92.2%) | 8,711 (94.1%) |
| 12 to 14 Years | 4,871 (95.3%) | 5,129 (90.7%) |
| 15 Years | 1,963 (95.1%) | 1,894 (94.2%) |
| 16 and 17 Years | 3,333 (91.9%) | 3,343 (94.5%) |
| 18 to 24 Years | 11,576 (90.9%) | 10,636 (85.2%) |
| 25 to 34 Years | 18,737 (95.5%) | 17,795 (92.1%) |
| 35 to 44 Years | 21,007 (94.7%) | 19,369 (93.4%) |
| 45 to 54 Years | 18,548 (96.1%) | 19,294 (95.8%) |
| 55 to 64 Years | 17,198 (93.3%) | 18,062 (95.1%) |
| 65 to 74 Years | 10,919 (97.1%) | 12,013 (92.1%) |
| 75 Years and over | 5,404 (93.1%) | 7,340 (88.4%) |
| Total | 132,168 (93.8%) | 131,995 (92.4%) |
Income Below Poverty Among Married-Couple Families in Plano
The poverty statistics for married-couple families in Plano show that 3.2% or 1,914 of the total 60,712 families live below the poverty line. Families with 3 or 4 children have the highest poverty rate of 6.2%, comprising of 281 families. On the other hand, families with 5 or more children have the lowest poverty rate of 0.0%, which includes 0 families.
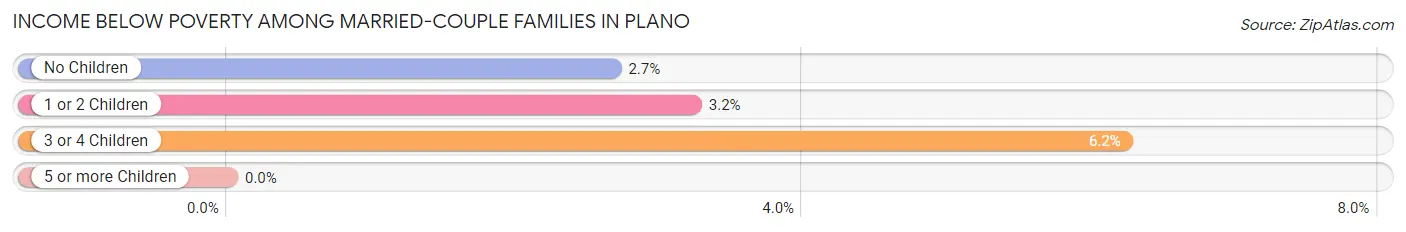
| Children | Above Poverty | Below Poverty |
| No Children | 31,375 (97.3%) | 862 (2.7%) |
| 1 or 2 Children | 23,110 (96.8%) | 771 (3.2%) |
| 3 or 4 Children | 4,233 (93.8%) | 281 (6.2%) |
| 5 or more Children | 80 (100.0%) | 0 (0.0%) |
| Total | 58,798 (96.9%) | 1,914 (3.2%) |
Income Below Poverty Among Single-Parent Households in Plano
According to the poverty data in Plano, 3.8% or 159 single-father households and 16.0% or 1,698 single-mother households are living below the poverty line. Among single-father households, those with 1 or 2 children have the highest poverty rate, with 123 households (7.0%) experiencing poverty. Likewise, among single-mother households, those with 3 or 4 children have the highest poverty rate, with 501 households (51.5%) falling below the poverty line.
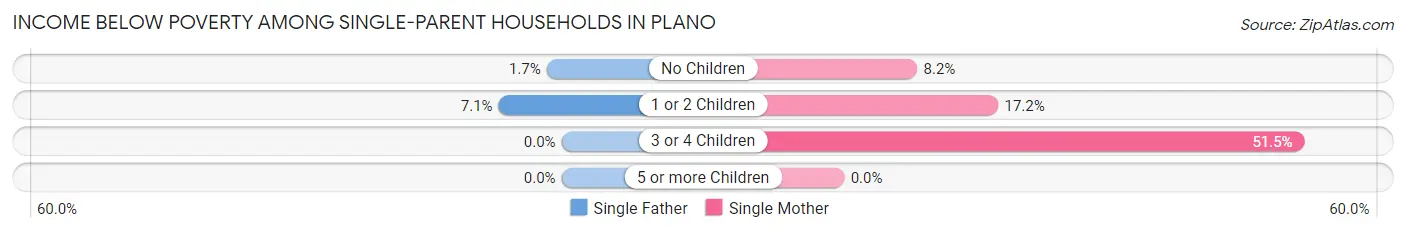
| Children | Single Father | Single Mother |
| No Children | 36 (1.7%) | 414 (8.2%) |
| 1 or 2 Children | 123 (7.0%) | 783 (17.2%) |
| 3 or 4 Children | 0 (0.0%) | 501 (51.5%) |
| 5 or more Children | 0 (0.0%) | 0 (0.0%) |
| Total | 159 (3.8%) | 1,698 (16.0%) |
Income Below Poverty Among Married-Couple vs Single-Parent Households in Plano
The poverty data for Plano shows that 1,914 of the married-couple family households (3.2%) and 1,857 of the single-parent households (12.5%) are living below the poverty level. Within the married-couple family households, those with 3 or 4 children have the highest poverty rate, with 281 households (6.2%) falling below the poverty line. Among the single-parent households, those with 3 or 4 children have the highest poverty rate, with 501 household (43.5%) living below poverty.
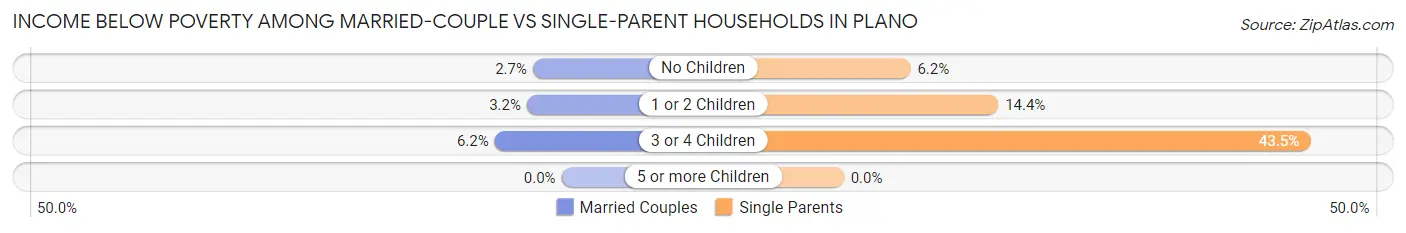
| Children | Married-Couple Families | Single-Parent Households |
| No Children | 862 (2.7%) | 450 (6.2%) |
| 1 or 2 Children | 771 (3.2%) | 906 (14.4%) |
| 3 or 4 Children | 281 (6.2%) | 501 (43.5%) |
| 5 or more Children | 0 (0.0%) | 0 (0.0%) |
| Total | 1,914 (3.2%) | 1,857 (12.5%) |
Race in Plano
The most populous races in Plano are White / Caucasian (158,292 | 55.5%), Asian (64,625 | 22.7%), and Hispanic or Latino (44,397 | 15.6%).
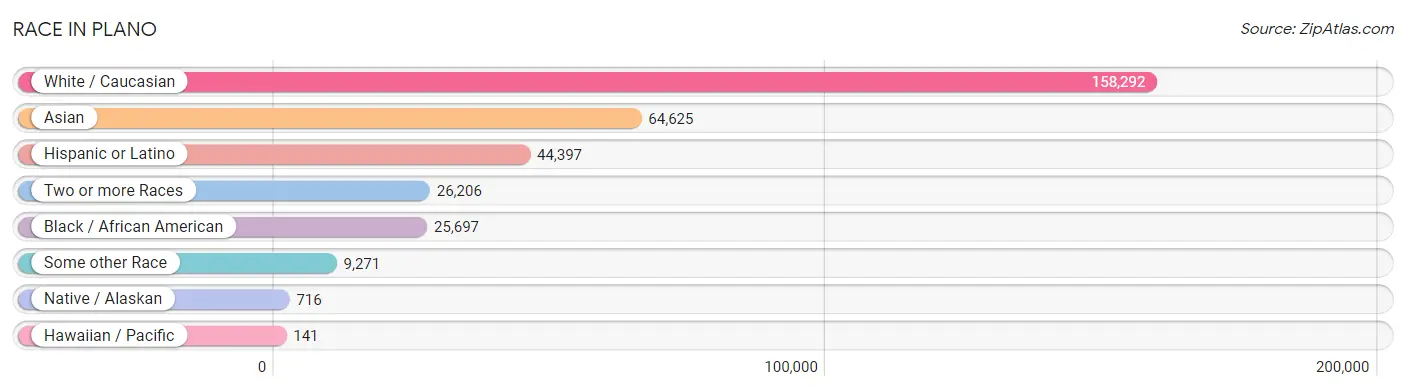
| Race | # Population | % Population |
| Asian | 64,625 | 22.7% |
| Black / African American | 25,697 | 9.0% |
| Hawaiian / Pacific | 141 | 0.1% |
| Hispanic or Latino | 44,397 | 15.6% |
| Native / Alaskan | 716 | 0.3% |
| White / Caucasian | 158,292 | 55.5% |
| Two or more Races | 26,206 | 9.2% |
| Some other Race | 9,271 | 3.3% |
| Total | 284,948 | 100.0% |
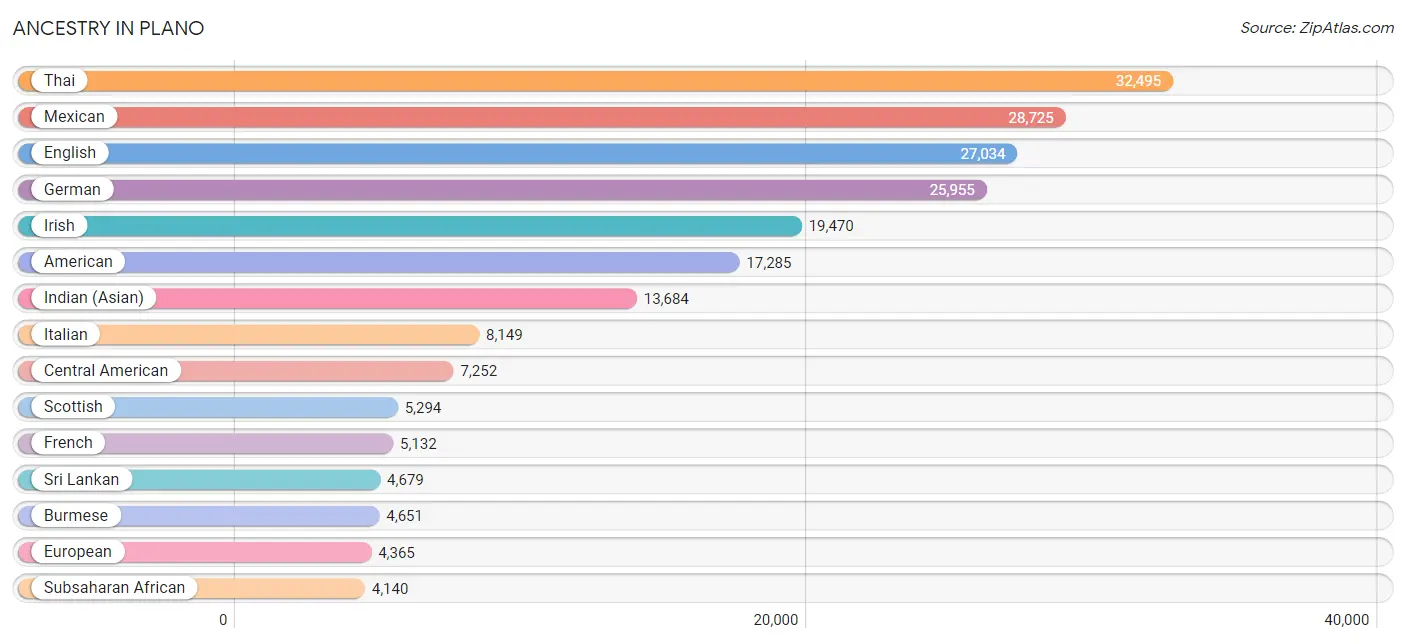
Ancestry in Plano
The most populous ancestries reported in Plano are Thai (32,495 | 11.4%), Mexican (28,725 | 10.1%), English (27,034 | 9.5%), German (25,955 | 9.1%), and Irish (19,470 | 6.8%), together accounting for 46.9% of all Plano residents.
| Ancestry | # Population | % Population |
| Afghan | 134 | 0.1% |
| African | 1,133 | 0.4% |
| Albanian | 680 | 0.2% |
| Aleut | 26 | 0.0% |
| Alsatian | 12 | 0.0% |
| American | 17,285 | 6.1% |
| Apache | 50 | 0.0% |
| Arab | 3,293 | 1.2% |
| Argentinean | 362 | 0.1% |
| Armenian | 194 | 0.1% |
| Assyrian / Chaldean / Syriac | 44 | 0.0% |
| Australian | 45 | 0.0% |
| Austrian | 435 | 0.2% |
| Bahamian | 29 | 0.0% |
| Basque | 66 | 0.0% |
| Belgian | 160 | 0.1% |
| Belizean | 20 | 0.0% |
| Bermudan | 21 | 0.0% |
| Bhutanese | 1,617 | 0.6% |
| Blackfeet | 14 | 0.0% |
| Bolivian | 130 | 0.1% |
| Brazilian | 668 | 0.2% |
| British | 1,794 | 0.6% |
| British West Indian | 70 | 0.0% |
| Bulgarian | 116 | 0.0% |
| Burmese | 4,651 | 1.6% |
| Cajun | 91 | 0.0% |
| Cambodian | 6 | 0.0% |
| Canadian | 601 | 0.2% |
| Carpatho Rusyn | 11 | 0.0% |
| Celtic | 5 | 0.0% |
| Central American | 7,252 | 2.5% |
| Central American Indian | 141 | 0.1% |
| Cherokee | 815 | 0.3% |
| Cheyenne | 3 | 0.0% |
| Chickasaw | 158 | 0.1% |
| Chilean | 236 | 0.1% |
| Chippewa | 19 | 0.0% |
| Choctaw | 239 | 0.1% |
| Colombian | 1,084 | 0.4% |
| Colville | 60 | 0.0% |
| Comanche | 36 | 0.0% |
| Costa Rican | 118 | 0.0% |
| Cree | 32 | 0.0% |
| Creek | 52 | 0.0% |
| Croatian | 190 | 0.1% |
| Cuban | 328 | 0.1% |
| Czech | 988 | 0.4% |
| Czechoslovakian | 158 | 0.1% |
| Danish | 869 | 0.3% |
| Delaware | 4 | 0.0% |
| Dominican | 236 | 0.1% |
| Dutch | 1,652 | 0.6% |
| Dutch West Indian | 16 | 0.0% |
| Eastern European | 1,035 | 0.4% |
| Ecuadorian | 190 | 0.1% |
| Egyptian | 398 | 0.1% |
| English | 27,034 | 9.5% |
| Estonian | 71 | 0.0% |
| Ethiopian | 1,000 | 0.4% |
| European | 4,365 | 1.5% |
| Filipino | 1,350 | 0.5% |
| Finnish | 176 | 0.1% |
| French | 5,132 | 1.8% |
| French American Indian | 8 | 0.0% |
| French Canadian | 742 | 0.3% |
| German | 25,955 | 9.1% |
| Ghanaian | 107 | 0.0% |
| Greek | 687 | 0.2% |
| Guamanian / Chamorro | 194 | 0.1% |
| Guatemalan | 3,712 | 1.3% |
| Guyanese | 61 | 0.0% |
| Haitian | 229 | 0.1% |
| Honduran | 747 | 0.3% |
| Hungarian | 690 | 0.2% |
| Icelander | 107 | 0.0% |
| Indian (Asian) | 13,684 | 4.8% |
| Indonesian | 319 | 0.1% |
| Iranian | 3,358 | 1.2% |
| Iraqi | 268 | 0.1% |
| Irish | 19,470 | 6.8% |
| Israeli | 294 | 0.1% |
| Italian | 8,149 | 2.9% |
| Jamaican | 290 | 0.1% |
| Japanese | 374 | 0.1% |
| Jordanian | 148 | 0.1% |
| Kenyan | 249 | 0.1% |
| Korean | 3,397 | 1.2% |
| Laotian | 253 | 0.1% |
| Latvian | 156 | 0.1% |
| Lebanese | 543 | 0.2% |
| Liberian | 56 | 0.0% |
| Lithuanian | 240 | 0.1% |
| Lumbee | 80 | 0.0% |
| Luxembourger | 18 | 0.0% |
| Malaysian | 572 | 0.2% |
| Maltese | 29 | 0.0% |
| Mexican | 28,725 | 10.1% |
| Mexican American Indian | 276 | 0.1% |
| Mongolian | 22 | 0.0% |
| Moroccan | 94 | 0.0% |
| Native Hawaiian | 182 | 0.1% |
| Navajo | 90 | 0.0% |
| Nicaraguan | 265 | 0.1% |
| Nigerian | 714 | 0.3% |
| Northern European | 622 | 0.2% |
| Norwegian | 2,047 | 0.7% |
| Pakistani | 363 | 0.1% |
| Palestinian | 203 | 0.1% |
| Panamanian | 96 | 0.0% |
| Paraguayan | 10 | 0.0% |
| Pennsylvania German | 59 | 0.0% |
| Peruvian | 334 | 0.1% |
| Polish | 4,120 | 1.5% |
| Portuguese | 506 | 0.2% |
| Potawatomi | 5 | 0.0% |
| Pueblo | 23 | 0.0% |
| Puerto Rican | 2,100 | 0.7% |
| Romanian | 339 | 0.1% |
| Russian | 2,080 | 0.7% |
| Salvadoran | 2,314 | 0.8% |
| Scandinavian | 452 | 0.2% |
| Scotch-Irish | 3,165 | 1.1% |
| Scottish | 5,294 | 1.9% |
| Seminole | 9 | 0.0% |
| Serbian | 190 | 0.1% |
| Sioux | 43 | 0.0% |
| Slavic | 167 | 0.1% |
| Slovak | 385 | 0.1% |
| Slovene | 62 | 0.0% |
| South African | 113 | 0.0% |
| South American | 3,324 | 1.2% |
| South American Indian | 37 | 0.0% |
| Spaniard | 718 | 0.3% |
| Spanish | 587 | 0.2% |
| Sri Lankan | 4,679 | 1.6% |
| Subsaharan African | 4,140 | 1.5% |
| Sudanese | 58 | 0.0% |
| Swedish | 2,395 | 0.8% |
| Swiss | 175 | 0.1% |
| Syrian | 170 | 0.1% |
| Thai | 32,495 | 11.4% |
| Tohono O'Odham | 8 | 0.0% |
| Trinidadian and Tobagonian | 121 | 0.0% |
| Turkish | 456 | 0.2% |
| Ugandan | 13 | 0.0% |
| Ukrainian | 783 | 0.3% |
| Venezuelan | 964 | 0.3% |
| Vietnamese | 853 | 0.3% |
| Welsh | 1,285 | 0.4% |
| West Indian | 143 | 0.1% |
| Yugoslavian | 441 | 0.2% |
| Zimbabwean | 14 | 0.0% | View All 153 Rows |
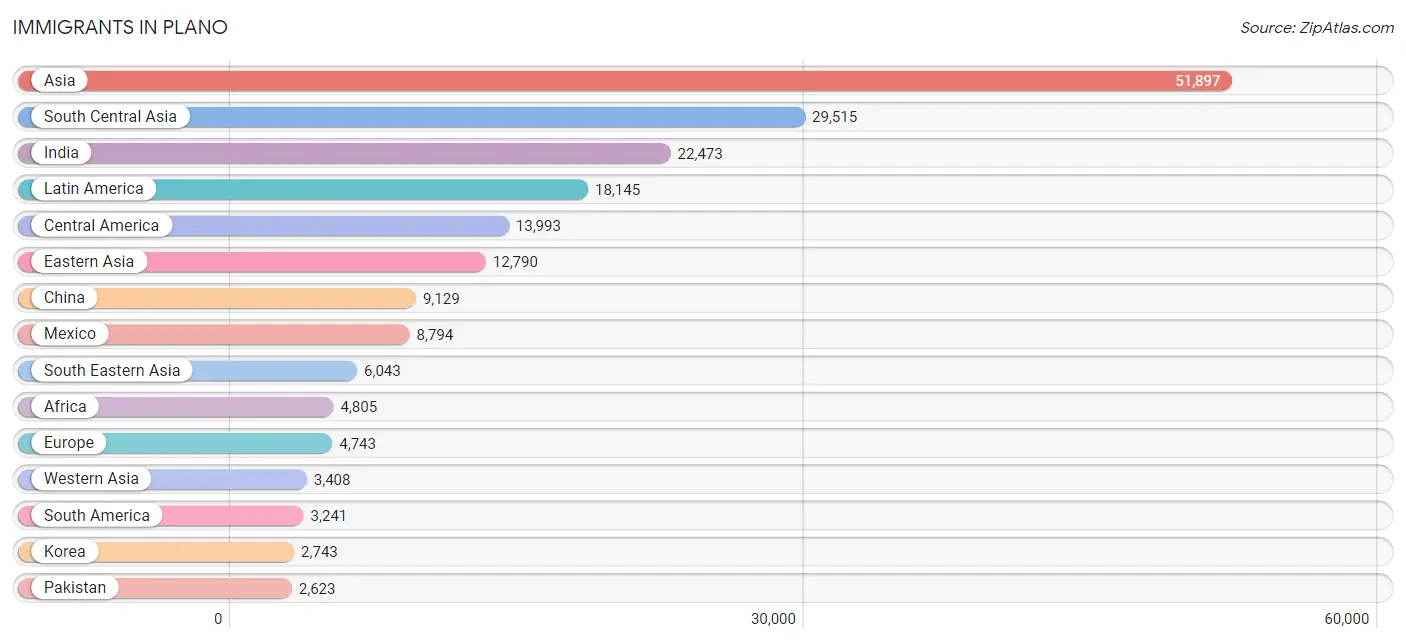
Immigrants in Plano
The most numerous immigrant groups reported in Plano came from Asia (51,897 | 18.2%), South Central Asia (29,515 | 10.4%), India (22,473 | 7.9%), Latin America (18,145 | 6.4%), and Central America (13,993 | 4.9%), together accounting for 47.7% of all Plano residents.
| Immigration Origin | # Population | % Population |
| Afghanistan | 110 | 0.0% |
| Africa | 4,805 | 1.7% |
| Albania | 190 | 0.1% |
| Argentina | 210 | 0.1% |
| Armenia | 50 | 0.0% |
| Asia | 51,897 | 18.2% |
| Australia | 40 | 0.0% |
| Austria | 25 | 0.0% |
| Bahamas | 29 | 0.0% |
| Bangladesh | 748 | 0.3% |
| Belarus | 96 | 0.0% |
| Belgium | 85 | 0.0% |
| Bolivia | 108 | 0.0% |
| Bosnia and Herzegovina | 72 | 0.0% |
| Brazil | 821 | 0.3% |
| Bulgaria | 69 | 0.0% |
| Cambodia | 114 | 0.0% |
| Cameroon | 300 | 0.1% |
| Canada | 1,446 | 0.5% |
| Caribbean | 911 | 0.3% |
| Central America | 13,993 | 4.9% |
| Chile | 29 | 0.0% |
| China | 9,129 | 3.2% |
| Colombia | 583 | 0.2% |
| Costa Rica | 53 | 0.0% |
| Croatia | 14 | 0.0% |
| Cuba | 185 | 0.1% |
| Czechoslovakia | 12 | 0.0% |
| Denmark | 42 | 0.0% |
| Dominican Republic | 14 | 0.0% |
| Eastern Africa | 2,073 | 0.7% |
| Eastern Asia | 12,790 | 4.5% |
| Eastern Europe | 2,028 | 0.7% |
| Ecuador | 133 | 0.1% |
| Egypt | 375 | 0.1% |
| El Salvador | 1,879 | 0.7% |
| England | 454 | 0.2% |
| Eritrea | 92 | 0.0% |
| Ethiopia | 702 | 0.3% |
| Europe | 4,743 | 1.7% |
| France | 320 | 0.1% |
| Germany | 691 | 0.2% |
| Ghana | 79 | 0.0% |
| Greece | 14 | 0.0% |
| Guatemala | 2,310 | 0.8% |
| Guyana | 146 | 0.1% |
| Haiti | 196 | 0.1% |
| Honduras | 698 | 0.2% |
| Hong Kong | 447 | 0.2% |
| Hungary | 84 | 0.0% |
| India | 22,473 | 7.9% |
| Indonesia | 246 | 0.1% |
| Iran | 2,596 | 0.9% |
| Iraq | 984 | 0.4% |
| Ireland | 60 | 0.0% |
| Israel | 524 | 0.2% |
| Italy | 132 | 0.1% |
| Jamaica | 114 | 0.0% |
| Japan | 918 | 0.3% |
| Jordan | 190 | 0.1% |
| Kazakhstan | 26 | 0.0% |
| Kenya | 432 | 0.2% |
| Korea | 2,743 | 1.0% |
| Kuwait | 179 | 0.1% |
| Laos | 396 | 0.1% |
| Latin America | 18,145 | 6.4% |
| Latvia | 54 | 0.0% |
| Lebanon | 211 | 0.1% |
| Liberia | 15 | 0.0% |
| Malaysia | 287 | 0.1% |
| Mexico | 8,794 | 3.1% |
| Micronesia | 8 | 0.0% |
| Middle Africa | 300 | 0.1% |
| Moldova | 22 | 0.0% |
| Morocco | 55 | 0.0% |
| Nepal | 375 | 0.1% |
| Netherlands | 68 | 0.0% |
| Nicaragua | 204 | 0.1% |
| Nigeria | 895 | 0.3% |
| North Macedonia | 38 | 0.0% |
| Northern Africa | 815 | 0.3% |
| Northern Europe | 1,255 | 0.4% |
| Oceania | 154 | 0.1% |
| Pakistan | 2,623 | 0.9% |
| Panama | 55 | 0.0% |
| Peru | 312 | 0.1% |
| Philippines | 1,877 | 0.7% |
| Poland | 102 | 0.0% |
| Portugal | 28 | 0.0% |
| Romania | 59 | 0.0% |
| Russia | 489 | 0.2% |
| Saudi Arabia | 127 | 0.0% |
| Scotland | 69 | 0.0% |
| Serbia | 39 | 0.0% |
| Sierra Leone | 22 | 0.0% |
| Singapore | 25 | 0.0% |
| South Africa | 279 | 0.1% |
| South America | 3,241 | 1.1% |
| South Central Asia | 29,515 | 10.4% |
| South Eastern Asia | 6,043 | 2.1% |
| Southern Europe | 233 | 0.1% |
| Spain | 59 | 0.0% |
| Sri Lanka | 187 | 0.1% |
| Sudan | 228 | 0.1% |
| Sweden | 164 | 0.1% |
| Switzerland | 38 | 0.0% |
| Syria | 159 | 0.1% |
| Taiwan | 2,050 | 0.7% |
| Thailand | 316 | 0.1% |
| Trinidad and Tobago | 282 | 0.1% |
| Turkey | 689 | 0.2% |
| Uganda | 181 | 0.1% |
| Ukraine | 449 | 0.2% |
| Uruguay | 10 | 0.0% |
| Uzbekistan | 347 | 0.1% |
| Venezuela | 879 | 0.3% |
| Vietnam | 2,333 | 0.8% |
| West Indies | 41 | 0.0% |
| Western Africa | 1,230 | 0.4% |
| Western Asia | 3,408 | 1.2% |
| Western Europe | 1,227 | 0.4% |
| Zimbabwe | 281 | 0.1% | View All 122 Rows |
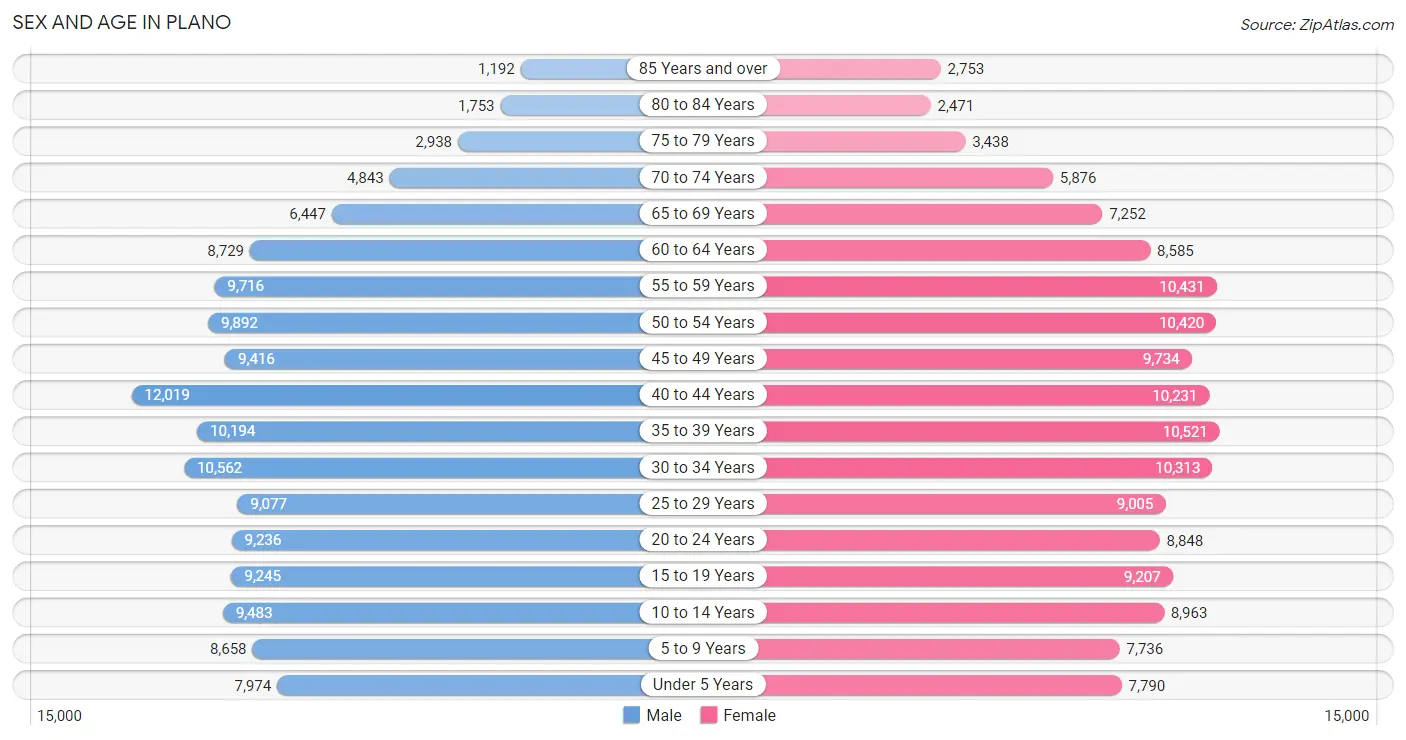
Sex and Age in Plano
Sex and Age in Plano
The most populous age groups in Plano are 40 to 44 Years (12,019 | 8.5%) for men and 35 to 39 Years (10,521 | 7.3%) for women.
| Age Bracket | Male | Female |
| Under 5 Years | 7,974 (5.6%) | 7,790 (5.4%) |
| 5 to 9 Years | 8,658 (6.1%) | 7,736 (5.4%) |
| 10 to 14 Years | 9,483 (6.7%) | 8,963 (6.2%) |
| 15 to 19 Years | 9,245 (6.5%) | 9,207 (6.4%) |
| 20 to 24 Years | 9,236 (6.5%) | 8,848 (6.2%) |
| 25 to 29 Years | 9,077 (6.4%) | 9,005 (6.3%) |
| 30 to 34 Years | 10,562 (7.5%) | 10,313 (7.2%) |
| 35 to 39 Years | 10,194 (7.2%) | 10,521 (7.3%) |
| 40 to 44 Years | 12,019 (8.5%) | 10,231 (7.1%) |
| 45 to 49 Years | 9,416 (6.7%) | 9,734 (6.8%) |
| 50 to 54 Years | 9,892 (7.0%) | 10,420 (7.3%) |
| 55 to 59 Years | 9,716 (6.9%) | 10,431 (7.3%) |
| 60 to 64 Years | 8,729 (6.2%) | 8,585 (6.0%) |
| 65 to 69 Years | 6,447 (4.6%) | 7,252 (5.1%) |
| 70 to 74 Years | 4,843 (3.4%) | 5,876 (4.1%) |
| 75 to 79 Years | 2,938 (2.1%) | 3,438 (2.4%) |
| 80 to 84 Years | 1,753 (1.2%) | 2,471 (1.7%) |
| 85 Years and over | 1,192 (0.8%) | 2,753 (1.9%) |
| Total | 141,374 (100.0%) | 143,574 (100.0%) |
Families and Households in Plano
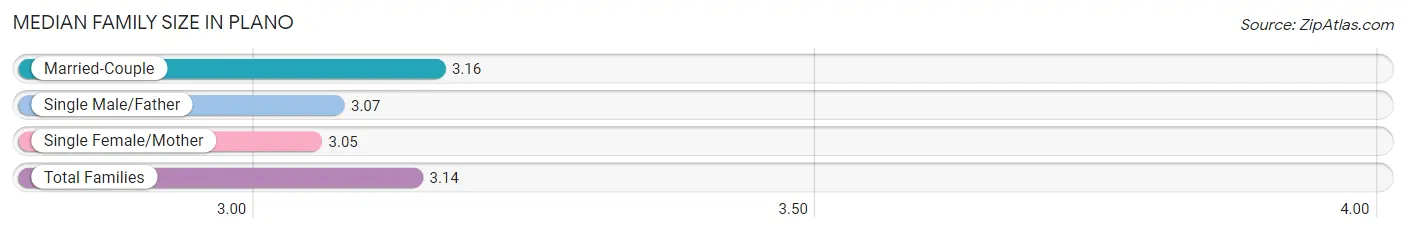
Median Family Size in Plano
The median family size in Plano is 3.14 persons per family, with married-couple families (60,712 | 80.3%) accounting for the largest median family size of 3.16 persons per family. On the other hand, single female/mother families (10,640 | 14.1%) represent the smallest median family size with 3.05 persons per family.
| Family Type | # Families | Family Size |
| Married-Couple | 60,712 (80.3%) | 3.16 |
| Single Male/Father | 4,214 (5.6%) | 3.07 |
| Single Female/Mother | 10,640 (14.1%) | 3.05 |
| Total Families | 75,566 (100.0%) | 3.14 |
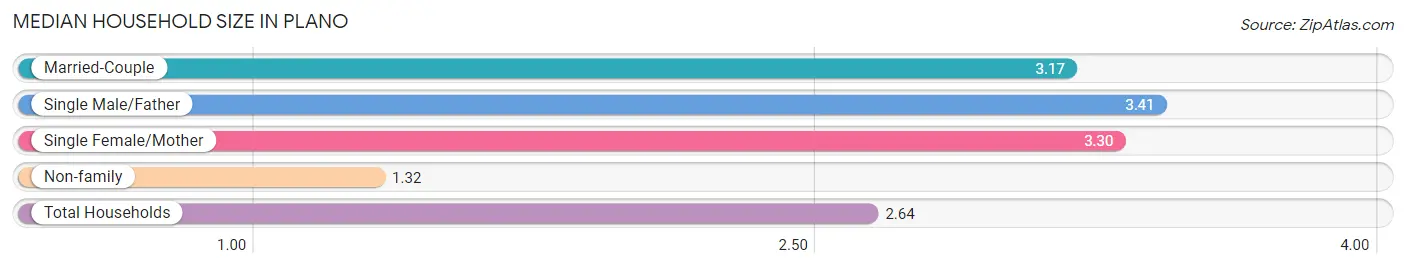
Median Household Size in Plano
The median household size in Plano is 2.64 persons per household, with single male/father households (4,214 | 3.9%) accounting for the largest median household size of 3.41 persons per household. non-family households (31,882 | 29.7%) represent the smallest median household size with 1.32 persons per household.
| Household Type | # Households | Household Size |
| Married-Couple | 60,712 (56.5%) | 3.17 |
| Single Male/Father | 4,214 (3.9%) | 3.41 |
| Single Female/Mother | 10,640 (9.9%) | 3.30 |
| Non-family | 31,882 (29.7%) | 1.32 |
| Total Households | 107,448 (100.0%) | 2.64 |
Household Size by Marriage Status in Plano
Out of a total of 107,448 households in Plano, 75,566 (70.3%) are family households, while 31,882 (29.7%) are nonfamily households. The most numerous type of family households are 2-person households, comprising 30,803, and the most common type of nonfamily households are 1-person households, comprising 25,170.
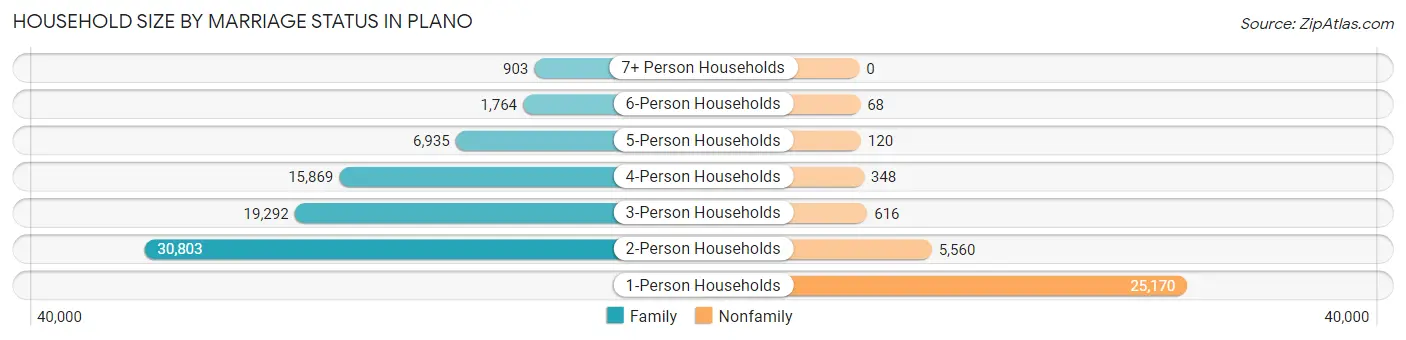
| Household Size | Family Households | Nonfamily Households |
| 1-Person Households | - | 25,170 (23.4%) |
| 2-Person Households | 30,803 (28.7%) | 5,560 (5.2%) |
| 3-Person Households | 19,292 (17.9%) | 616 (0.6%) |
| 4-Person Households | 15,869 (14.8%) | 348 (0.3%) |
| 5-Person Households | 6,935 (6.5%) | 120 (0.1%) |
| 6-Person Households | 1,764 (1.6%) | 68 (0.1%) |
| 7+ Person Households | 903 (0.8%) | 0 (0.0%) |
| Total | 75,566 (70.3%) | 31,882 (29.7%) |
Female Fertility in Plano
Fertility by Age in Plano
Average fertility rate in Plano is 46.0 births per 1,000 women. Women in the age bracket of 20 to 34 years have the highest fertility rate with 63.0 births per 1,000 women. Women in the age bracket of 20 to 34 years acount for 55.0% of all women with births.
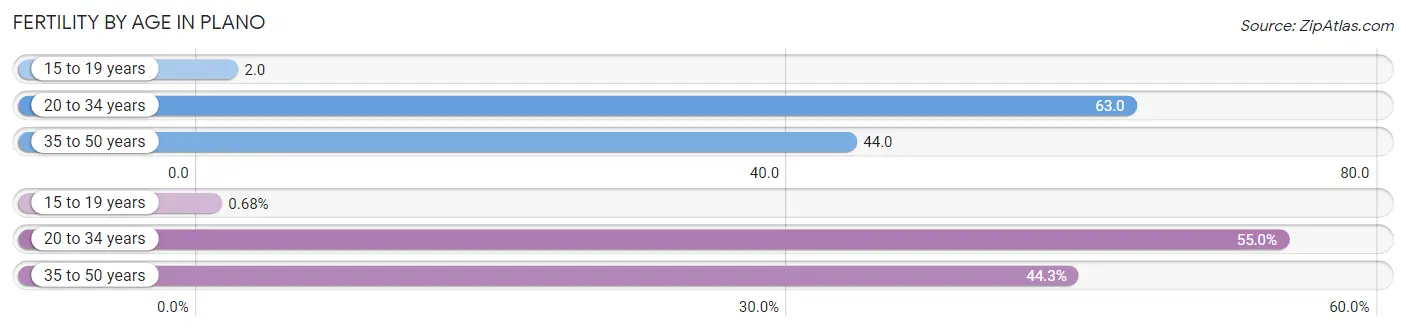
| Age Bracket | Women with Births | Births / 1,000 Women |
| 15 to 19 years | 22 (0.7%) | 2.0 |
| 20 to 34 years | 1,785 (55.0%) | 63.0 |
| 35 to 50 years | 1,438 (44.3%) | 44.0 |
| Total | 3,245 (100.0%) | 46.0 |
Fertility by Age by Marriage Status in Plano
76.9% of women with births (3,245) in Plano are married. The highest percentage of unmarried women with births falls into 15 to 19 years age bracket with 100.0% of them unmarried at the time of birth, while the lowest percentage of unmarried women with births belong to 20 to 34 years age bracket with 19.9% of them unmarried.
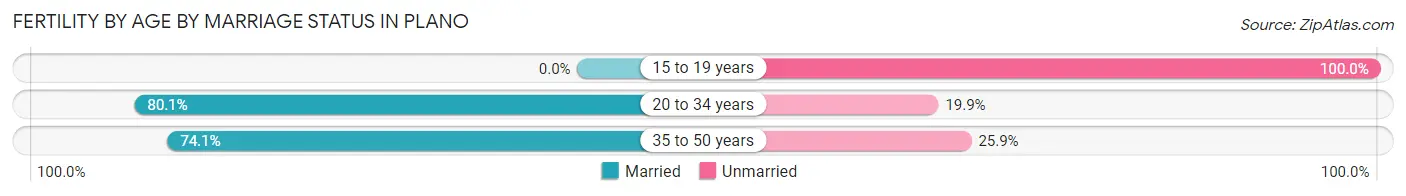
| Age Bracket | Married | Unmarried |
| 15 to 19 years | 0 (0.0%) | 22 (100.0%) |
| 20 to 34 years | 1,430 (80.1%) | 355 (19.9%) |
| 35 to 50 years | 1,066 (74.1%) | 372 (25.9%) |
| Total | 2,495 (76.9%) | 750 (23.1%) |
Fertility by Education in Plano
Average fertility rate in Plano is 46.0 births per 1,000 women. Women with the education attainment of bachelor's degree have the highest fertility rate of 56.0 births per 1,000 women, while women with the education attainment of less than high school have the lowest fertility at 30.0 births per 1,000 women. Women with the education attainment of bachelor's degree represent 38.4% of all women with births.
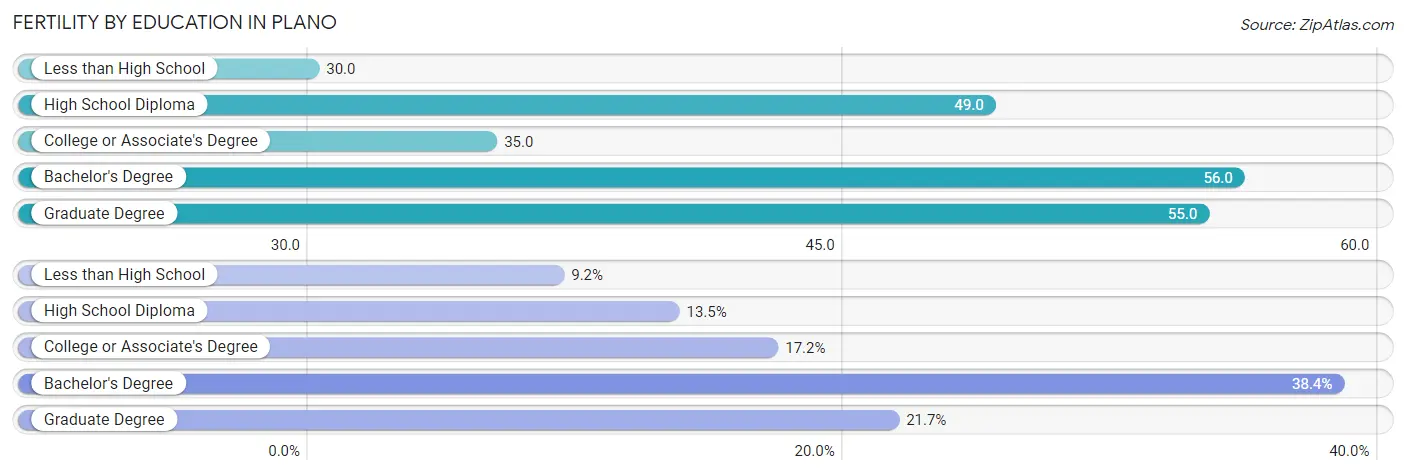
| Educational Attainment | Women with Births | Births / 1,000 Women |
| Less than High School | 298 (9.2%) | 30.0 |
| High School Diploma | 438 (13.5%) | 49.0 |
| College or Associate's Degree | 558 (17.2%) | 35.0 |
| Bachelor's Degree | 1,246 (38.4%) | 56.0 |
| Graduate Degree | 705 (21.7%) | 55.0 |
| Total | 3,245 (100.0%) | 46.0 |
Fertility by Education by Marriage Status in Plano
23.1% of women with births in Plano are unmarried. Women with the educational attainment of graduate degree are most likely to be married with 100.0% of them married at childbirth, while women with the educational attainment of high school diploma are least likely to be married with 44.1% of them unmarried at childbirth.
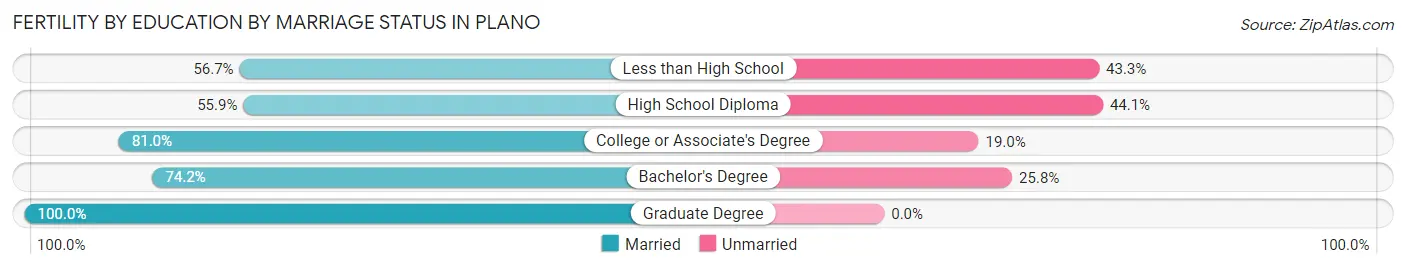
| Educational Attainment | Married | Unmarried |
| Less than High School | 169 (56.7%) | 129 (43.3%) |
| High School Diploma | 245 (55.9%) | 193 (44.1%) |
| College or Associate's Degree | 452 (81.0%) | 106 (19.0%) |
| Bachelor's Degree | 925 (74.2%) | 321 (25.8%) |
| Graduate Degree | 705 (100.0%) | 0 (0.0%) |
| Total | 2,495 (76.9%) | 750 (23.1%) |
Employment Characteristics in Plano
Employment by Class of Employer in Plano
Among the 150,810 employed individuals in Plano, private company employees (112,242 | 74.4%), self-employed (not incorporated) (9,152 | 6.1%), and not-for-profit organizations (8,239 | 5.5%) make up the most common classes of employment.
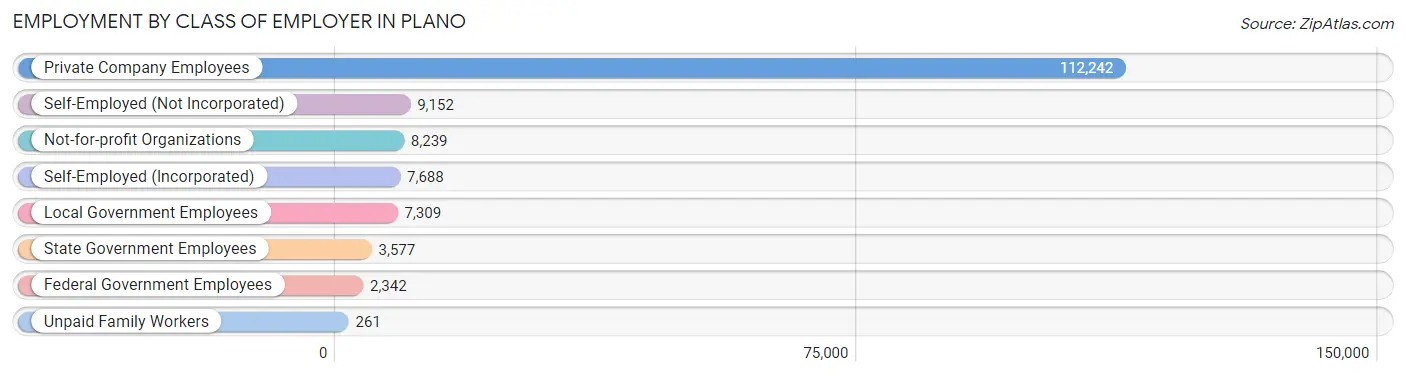
| Employer Class | # Employees | % Employees |
| Private Company Employees | 112,242 | 74.4% |
| Self-Employed (Incorporated) | 7,688 | 5.1% |
| Self-Employed (Not Incorporated) | 9,152 | 6.1% |
| Not-for-profit Organizations | 8,239 | 5.5% |
| Local Government Employees | 7,309 | 4.9% |
| State Government Employees | 3,577 | 2.4% |
| Federal Government Employees | 2,342 | 1.5% |
| Unpaid Family Workers | 261 | 0.2% |
| Total | 150,810 | 100.0% |
Employment Status by Age in Plano
According to the labor force statistics for Plano, out of the total population over 16 years of age (230,265), 69.3% or 159,574 individuals are in the labor force, with 4.4% or 7,021 of them unemployed. The age group with the highest labor force participation rate is 45 to 54 years, with 86.4% or 34,095 individuals in the labor force. Within the labor force, the 16 to 19 years age range has the highest percentage of unemployed individuals, with 9.5% or 440 of them being unemployed.
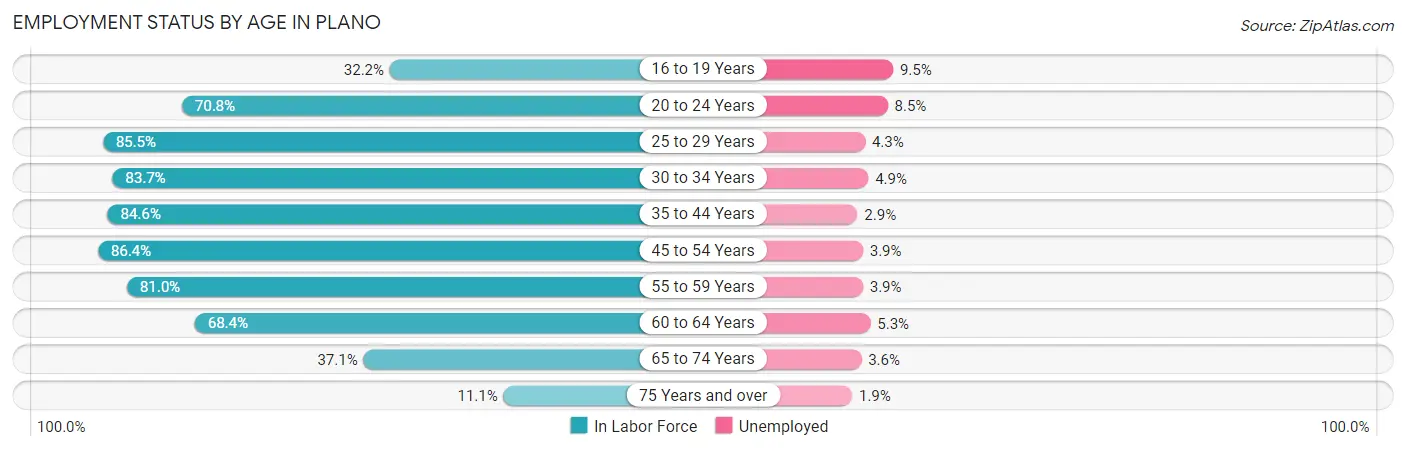
| Age Bracket | In Labor Force | Unemployed |
| 16 to 19 Years | 4,628 (32.2%) | 440 (9.5%) |
| 20 to 24 Years | 12,803 (70.8%) | 1,088 (8.5%) |
| 25 to 29 Years | 15,460 (85.5%) | 665 (4.3%) |
| 30 to 34 Years | 17,472 (83.7%) | 856 (4.9%) |
| 35 to 44 Years | 36,348 (84.6%) | 1,054 (2.9%) |
| 45 to 54 Years | 34,095 (86.4%) | 1,330 (3.9%) |
| 55 to 59 Years | 16,319 (81.0%) | 636 (3.9%) |
| 60 to 64 Years | 11,843 (68.4%) | 628 (5.3%) |
| 65 to 74 Years | 9,059 (37.1%) | 326 (3.6%) |
| 75 Years and over | 1,614 (11.1%) | 31 (1.9%) |
| Total | 159,574 (69.3%) | 7,021 (4.4%) |
Employment Status by Educational Attainment in Plano
According to labor force statistics for Plano, 82.8% of individuals (131,524) out of the total population between 25 and 64 years of age (158,845) are in the labor force, with 3.9% or 5,129 of them being unemployed. The group with the highest labor force participation rate are those with the educational attainment of bachelor's degree or higher, with 85.3% or 82,156 individuals in the labor force. Within the labor force, individuals with high school diploma education have the highest percentage of unemployment, with 5.5% or 769 of them being unemployed.
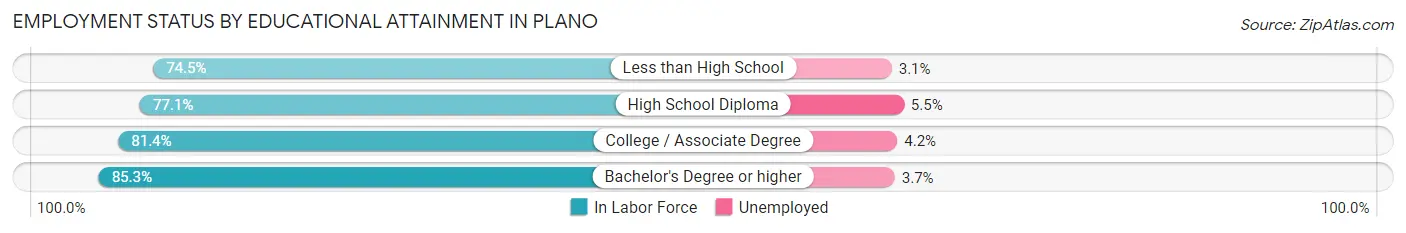
| Educational Attainment | In Labor Force | Unemployed |
| Less than High School | 7,632 (74.5%) | 318 (3.1%) |
| High School Diploma | 13,976 (77.1%) | 997 (5.5%) |
| College / Associate Degree | 27,806 (81.4%) | 1,435 (4.2%) |
| Bachelor's Degree or higher | 82,156 (85.3%) | 3,564 (3.7%) |
| Total | 131,524 (82.8%) | 6,195 (3.9%) |
Employment Occupations by Sex in Plano
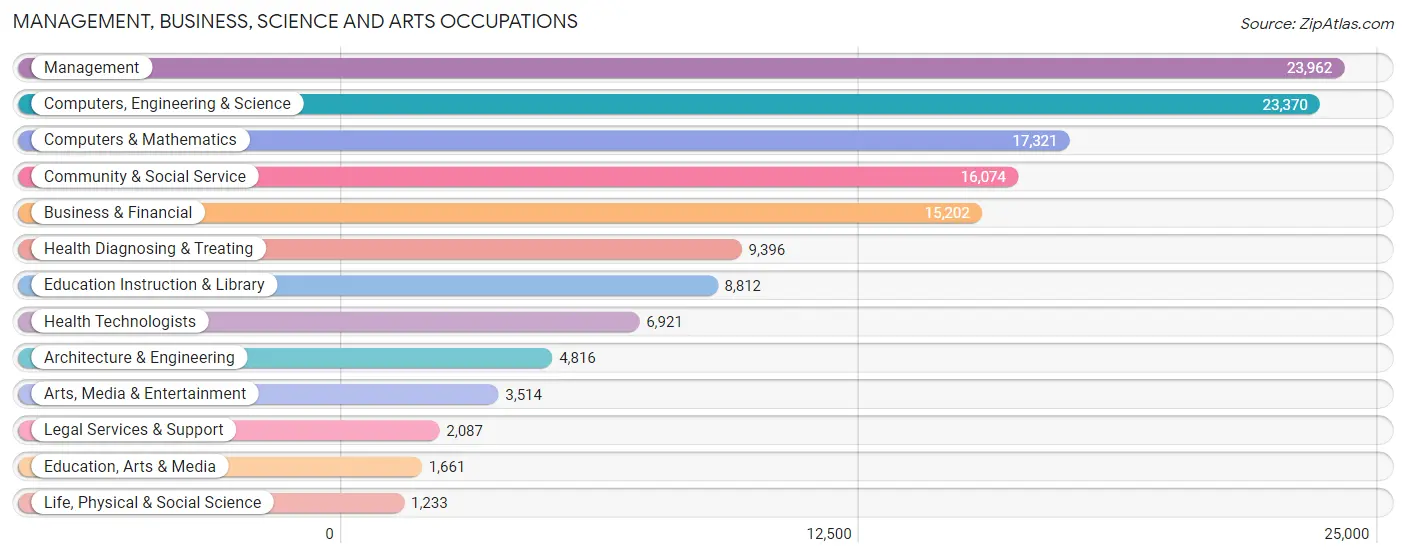
Management, Business, Science and Arts Occupations
The most common Management, Business, Science and Arts occupations in Plano are Management (23,962 | 15.7%), Computers, Engineering & Science (23,370 | 15.3%), Computers & Mathematics (17,321 | 11.4%), Community & Social Service (16,074 | 10.5%), and Business & Financial (15,202 | 10.0%).
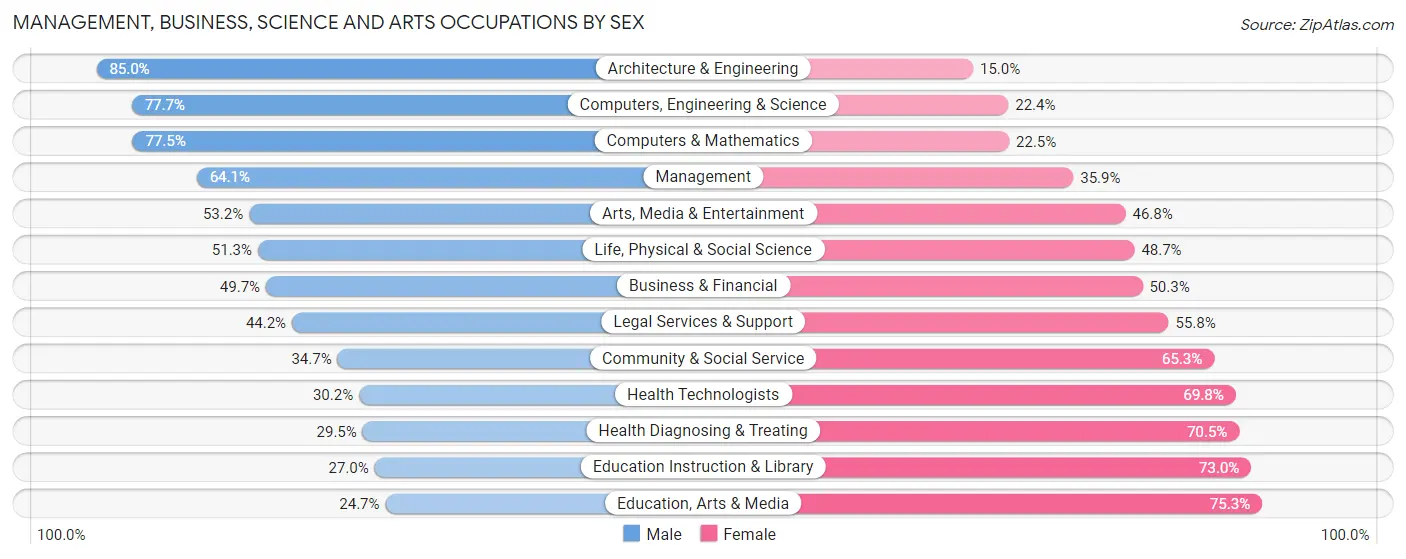
Management, Business, Science and Arts Occupations by Sex
Within the Management, Business, Science and Arts occupations in Plano, the most male-oriented occupations are Architecture & Engineering (85.0%), Computers, Engineering & Science (77.6%), and Computers & Mathematics (77.5%), while the most female-oriented occupations are Education, Arts & Media (75.3%), Education Instruction & Library (73.0%), and Health Diagnosing & Treating (70.5%).
| Occupation | Male | Female |
| Management | 15,358 (64.1%) | 8,604 (35.9%) |
| Business & Financial | 7,550 (49.7%) | 7,652 (50.3%) |
| Computers, Engineering & Science | 18,147 (77.6%) | 5,223 (22.4%) |
| Computers & Mathematics | 13,420 (77.5%) | 3,901 (22.5%) |
| Architecture & Engineering | 4,094 (85.0%) | 722 (15.0%) |
| Life, Physical & Social Science | 633 (51.3%) | 600 (48.7%) |
| Community & Social Service | 5,582 (34.7%) | 10,492 (65.3%) |
| Education, Arts & Media | 411 (24.7%) | 1,250 (75.3%) |
| Legal Services & Support | 923 (44.2%) | 1,164 (55.8%) |
| Education Instruction & Library | 2,379 (27.0%) | 6,433 (73.0%) |
| Arts, Media & Entertainment | 1,869 (53.2%) | 1,645 (46.8%) |
| Health Diagnosing & Treating | 2,771 (29.5%) | 6,625 (70.5%) |
| Health Technologists | 2,093 (30.2%) | 4,828 (69.8%) |
| Total (Category) | 49,408 (56.1%) | 38,596 (43.9%) |
| Total (Overall) | 84,399 (55.4%) | 68,035 (44.6%) |
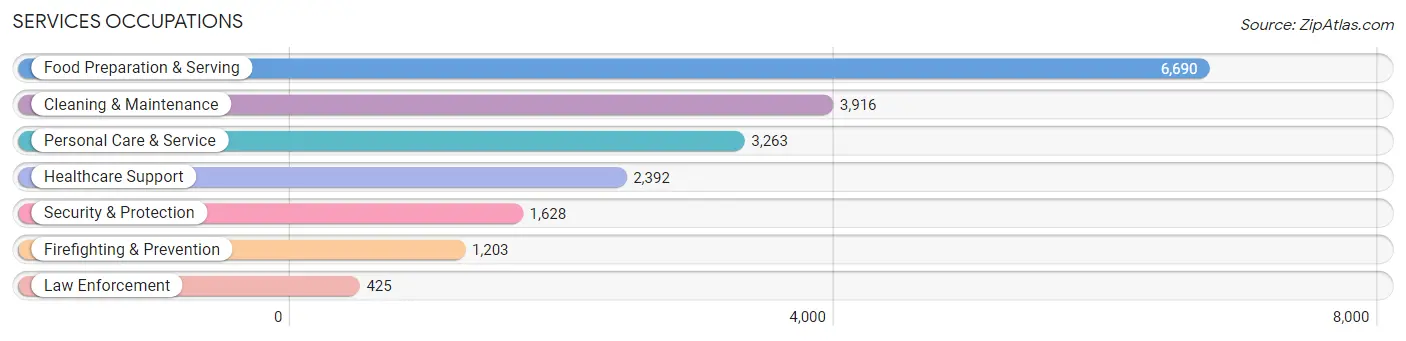
Services Occupations
The most common Services occupations in Plano are Food Preparation & Serving (6,690 | 4.4%), Cleaning & Maintenance (3,916 | 2.6%), Personal Care & Service (3,263 | 2.1%), Healthcare Support (2,392 | 1.6%), and Security & Protection (1,628 | 1.1%).
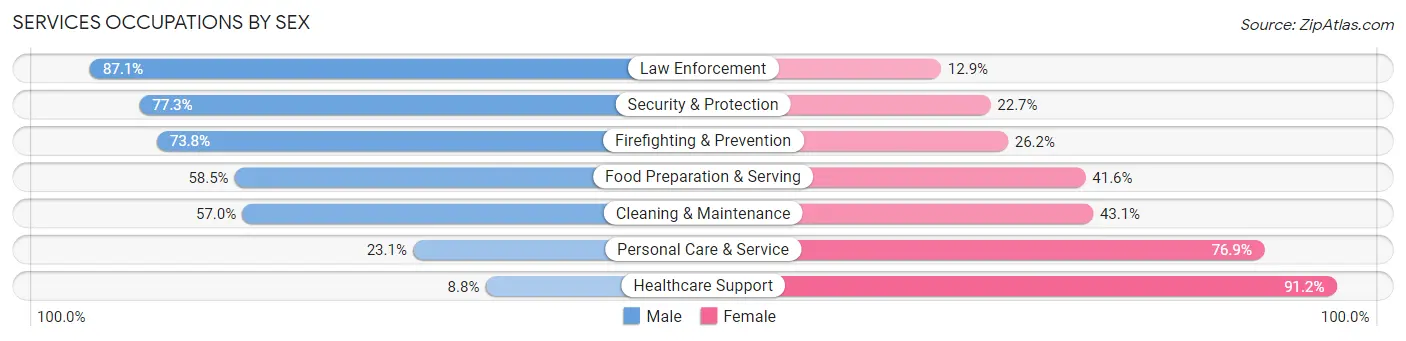
Services Occupations by Sex
Within the Services occupations in Plano, the most male-oriented occupations are Law Enforcement (87.1%), Security & Protection (77.3%), and Firefighting & Prevention (73.8%), while the most female-oriented occupations are Healthcare Support (91.2%), Personal Care & Service (76.9%), and Cleaning & Maintenance (43.0%).
| Occupation | Male | Female |
| Healthcare Support | 210 (8.8%) | 2,182 (91.2%) |
| Security & Protection | 1,258 (77.3%) | 370 (22.7%) |
| Firefighting & Prevention | 888 (73.8%) | 315 (26.2%) |
| Law Enforcement | 370 (87.1%) | 55 (12.9%) |
| Food Preparation & Serving | 3,910 (58.5%) | 2,780 (41.5%) |
| Cleaning & Maintenance | 2,230 (57.0%) | 1,686 (43.0%) |
| Personal Care & Service | 755 (23.1%) | 2,508 (76.9%) |
| Total (Category) | 8,363 (46.8%) | 9,526 (53.2%) |
| Total (Overall) | 84,399 (55.4%) | 68,035 (44.6%) |
Sales and Office Occupations
The most common Sales and Office occupations in Plano are Sales & Related (16,888 | 11.1%), and Office & Administration (14,942 | 9.8%).

Sales and Office Occupations by Sex

| Occupation | Male | Female |
| Sales & Related | 9,556 (56.6%) | 7,332 (43.4%) |
| Office & Administration | 4,775 (32.0%) | 10,167 (68.0%) |
| Total (Category) | 14,331 (45.0%) | 17,499 (55.0%) |
| Total (Overall) | 84,399 (55.4%) | 68,035 (44.6%) |
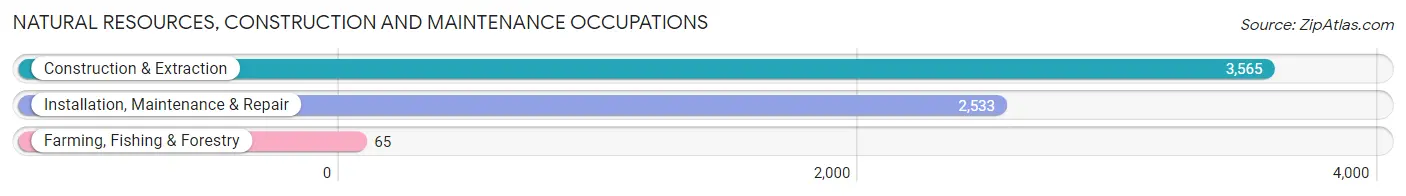
Natural Resources, Construction and Maintenance Occupations
The most common Natural Resources, Construction and Maintenance occupations in Plano are Construction & Extraction (3,565 | 2.3%), Installation, Maintenance & Repair (2,533 | 1.7%), and Farming, Fishing & Forestry (65 | 0.0%).
Natural Resources, Construction and Maintenance Occupations by Sex
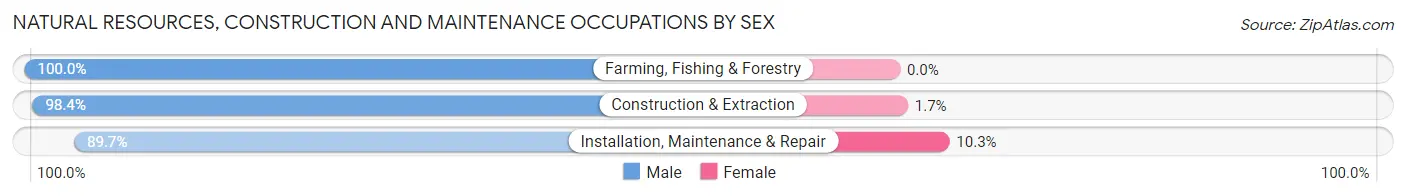
| Occupation | Male | Female |
| Farming, Fishing & Forestry | 65 (100.0%) | 0 (0.0%) |
| Construction & Extraction | 3,506 (98.4%) | 59 (1.7%) |
| Installation, Maintenance & Repair | 2,272 (89.7%) | 261 (10.3%) |
| Total (Category) | 5,843 (94.8%) | 320 (5.2%) |
| Total (Overall) | 84,399 (55.4%) | 68,035 (44.6%) |
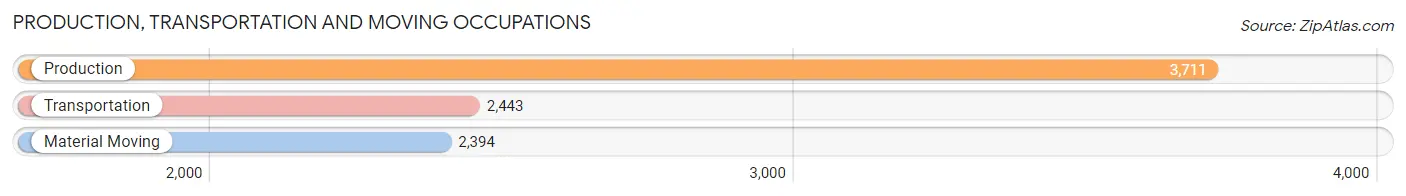
Production, Transportation and Moving Occupations
The most common Production, Transportation and Moving occupations in Plano are Production (3,711 | 2.4%), Transportation (2,443 | 1.6%), and Material Moving (2,394 | 1.6%).
Production, Transportation and Moving Occupations by Sex
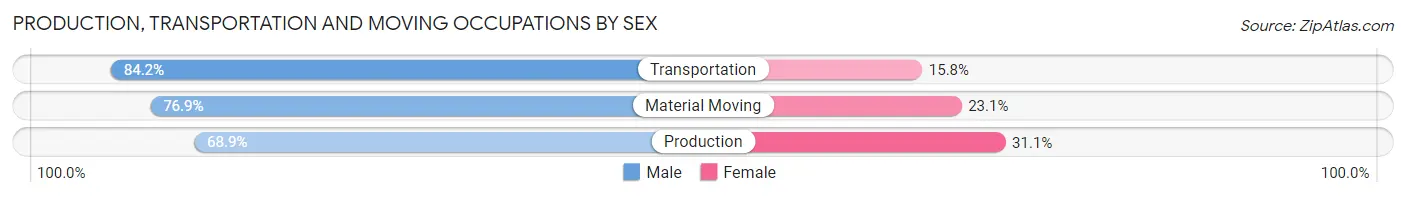
| Occupation | Male | Female |
| Production | 2,556 (68.9%) | 1,155 (31.1%) |
| Transportation | 2,056 (84.2%) | 387 (15.8%) |
| Material Moving | 1,842 (76.9%) | 552 (23.1%) |
| Total (Category) | 6,454 (75.5%) | 2,094 (24.5%) |
| Total (Overall) | 84,399 (55.4%) | 68,035 (44.6%) |
Employment Industries by Sex in Plano
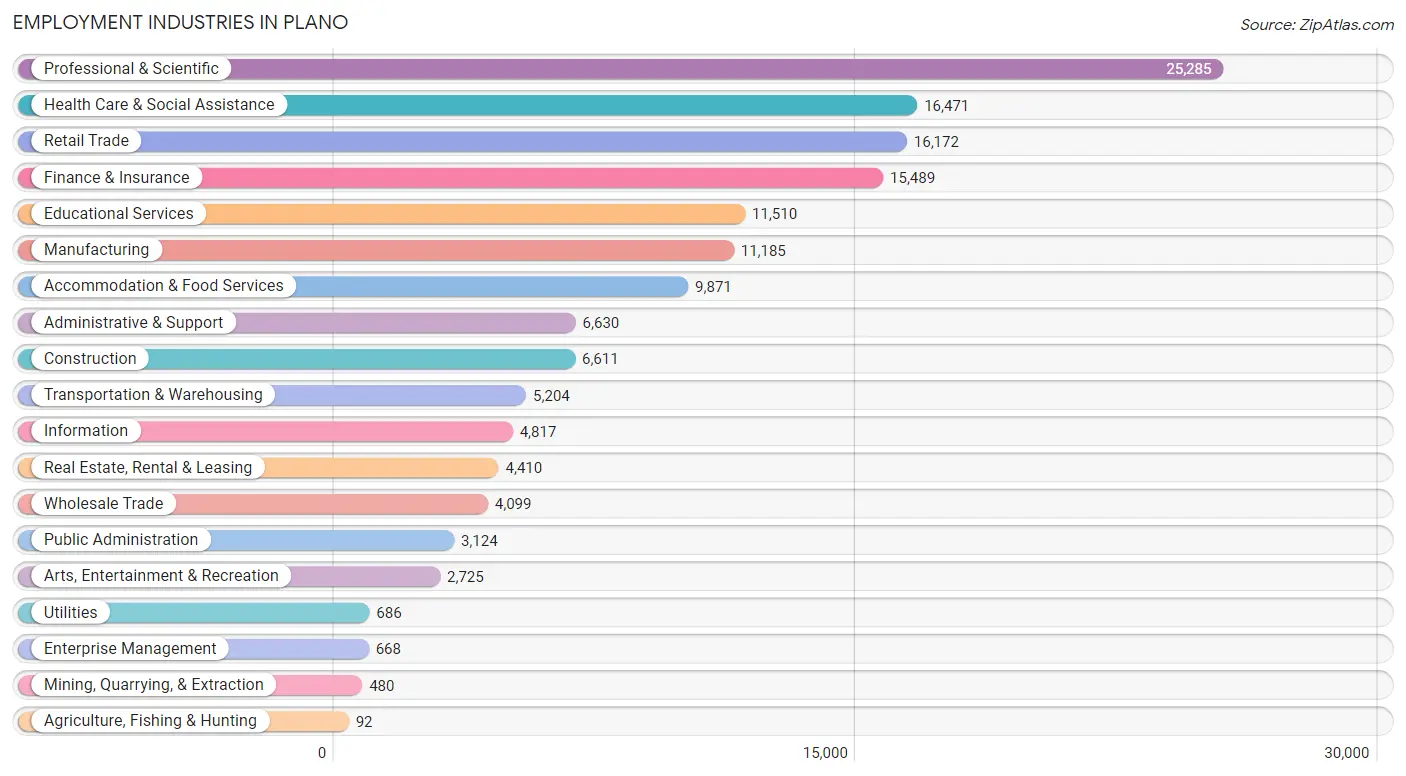
Employment Industries in Plano
The major employment industries in Plano include Professional & Scientific (25,285 | 16.6%), Health Care & Social Assistance (16,471 | 10.8%), Retail Trade (16,172 | 10.6%), Finance & Insurance (15,489 | 10.2%), and Educational Services (11,510 | 7.5%).
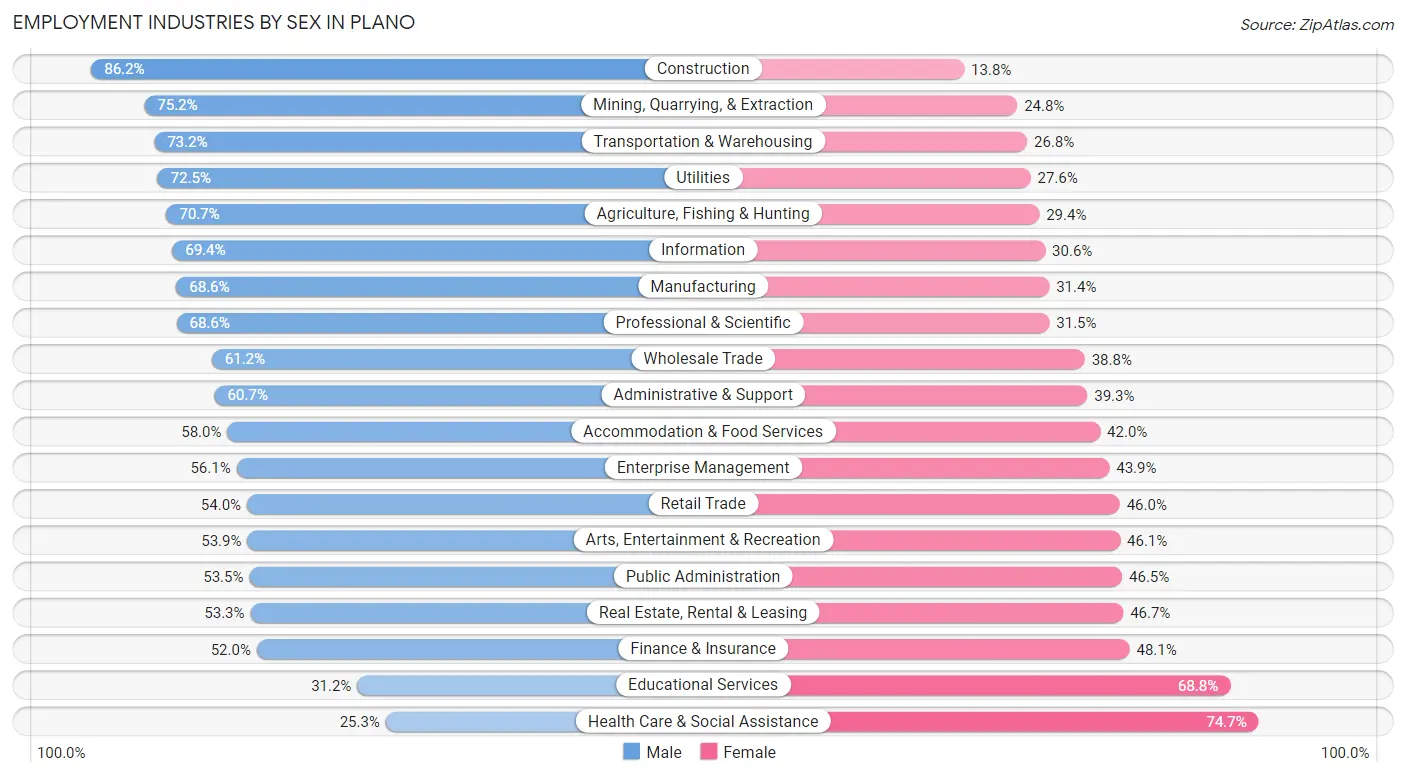
Employment Industries by Sex in Plano
The Plano industries that see more men than women are Construction (86.2%), Mining, Quarrying, & Extraction (75.2%), and Transportation & Warehousing (73.2%), whereas the industries that tend to have a higher number of women are Health Care & Social Assistance (74.7%), Educational Services (68.8%), and Finance & Insurance (48.0%).
| Industry | Male | Female |
| Agriculture, Fishing & Hunting | 65 (70.7%) | 27 (29.3%) |
| Mining, Quarrying, & Extraction | 361 (75.2%) | 119 (24.8%) |
| Construction | 5,698 (86.2%) | 913 (13.8%) |
| Manufacturing | 7,671 (68.6%) | 3,514 (31.4%) |
| Wholesale Trade | 2,510 (61.2%) | 1,589 (38.8%) |
| Retail Trade | 8,731 (54.0%) | 7,441 (46.0%) |
| Transportation & Warehousing | 3,807 (73.2%) | 1,397 (26.8%) |
| Utilities | 497 (72.5%) | 189 (27.6%) |
| Information | 3,344 (69.4%) | 1,473 (30.6%) |
| Finance & Insurance | 8,047 (51.9%) | 7,442 (48.0%) |
| Real Estate, Rental & Leasing | 2,349 (53.3%) | 2,061 (46.7%) |
| Professional & Scientific | 17,334 (68.5%) | 7,951 (31.5%) |
| Enterprise Management | 375 (56.1%) | 293 (43.9%) |
| Administrative & Support | 4,024 (60.7%) | 2,606 (39.3%) |
| Educational Services | 3,587 (31.2%) | 7,923 (68.8%) |
| Health Care & Social Assistance | 4,161 (25.3%) | 12,310 (74.7%) |
| Arts, Entertainment & Recreation | 1,469 (53.9%) | 1,256 (46.1%) |
| Accommodation & Food Services | 5,729 (58.0%) | 4,142 (42.0%) |
| Public Administration | 1,671 (53.5%) | 1,453 (46.5%) |
| Total | 84,399 (55.4%) | 68,035 (44.6%) |
Education in Plano
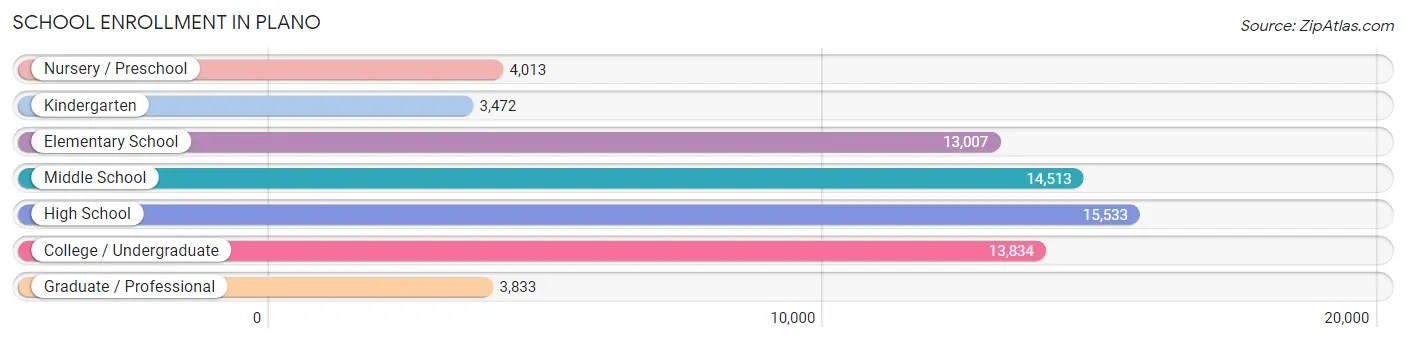
School Enrollment in Plano
The most common levels of schooling among the 68,205 students in Plano are high school (15,533 | 22.8%), middle school (14,513 | 21.3%), and college / undergraduate (13,834 | 20.3%).
| School Level | # Students | % Students |
| Nursery / Preschool | 4,013 | 5.9% |
| Kindergarten | 3,472 | 5.1% |
| Elementary School | 13,007 | 19.1% |
| Middle School | 14,513 | 21.3% |
| High School | 15,533 | 22.8% |
| College / Undergraduate | 13,834 | 20.3% |
| Graduate / Professional | 3,833 | 5.6% |
| Total | 68,205 | 100.0% |
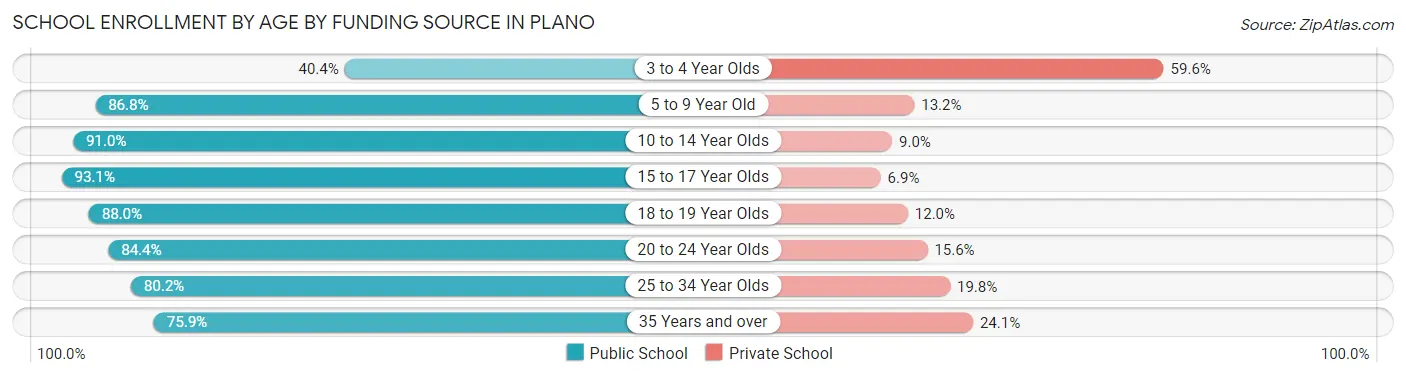
School Enrollment by Age by Funding Source in Plano
Out of a total of 68,205 students who are enrolled in schools in Plano, 9,753 (14.3%) attend a private institution, while the remaining 58,452 (85.7%) are enrolled in public schools. The age group of 3 to 4 year olds has the highest likelihood of being enrolled in private schools, with 1,931 (59.6% in the age bracket) enrolled. Conversely, the age group of 15 to 17 year olds has the lowest likelihood of being enrolled in a private school, with 10,258 (93.1% in the age bracket) attending a public institution.
| Age Bracket | Public School | Private School |
| 3 to 4 Year Olds | 1,309 (40.4%) | 1,931 (59.6%) |
| 5 to 9 Year Old | 13,553 (86.8%) | 2,053 (13.2%) |
| 10 to 14 Year Olds | 16,454 (91.0%) | 1,632 (9.0%) |
| 15 to 17 Year Olds | 10,258 (93.1%) | 759 (6.9%) |
| 18 to 19 Year Olds | 4,977 (88.0%) | 676 (12.0%) |
| 20 to 24 Year Olds | 6,471 (84.4%) | 1,196 (15.6%) |
| 25 to 34 Year Olds | 3,012 (80.2%) | 744 (19.8%) |
| 35 Years and over | 2,414 (75.9%) | 766 (24.1%) |
| Total | 58,452 (85.7%) | 9,753 (14.3%) |
Educational Attainment by Field of Study in Plano
Business (29,948 | 24.4%), engineering (19,609 | 16.0%), computers & mathematics (12,135 | 9.9%), science & technology (9,378 | 7.6%), and education (8,077 | 6.6%) are the most common fields of study among 122,700 individuals in Plano who have obtained a bachelor's degree or higher.
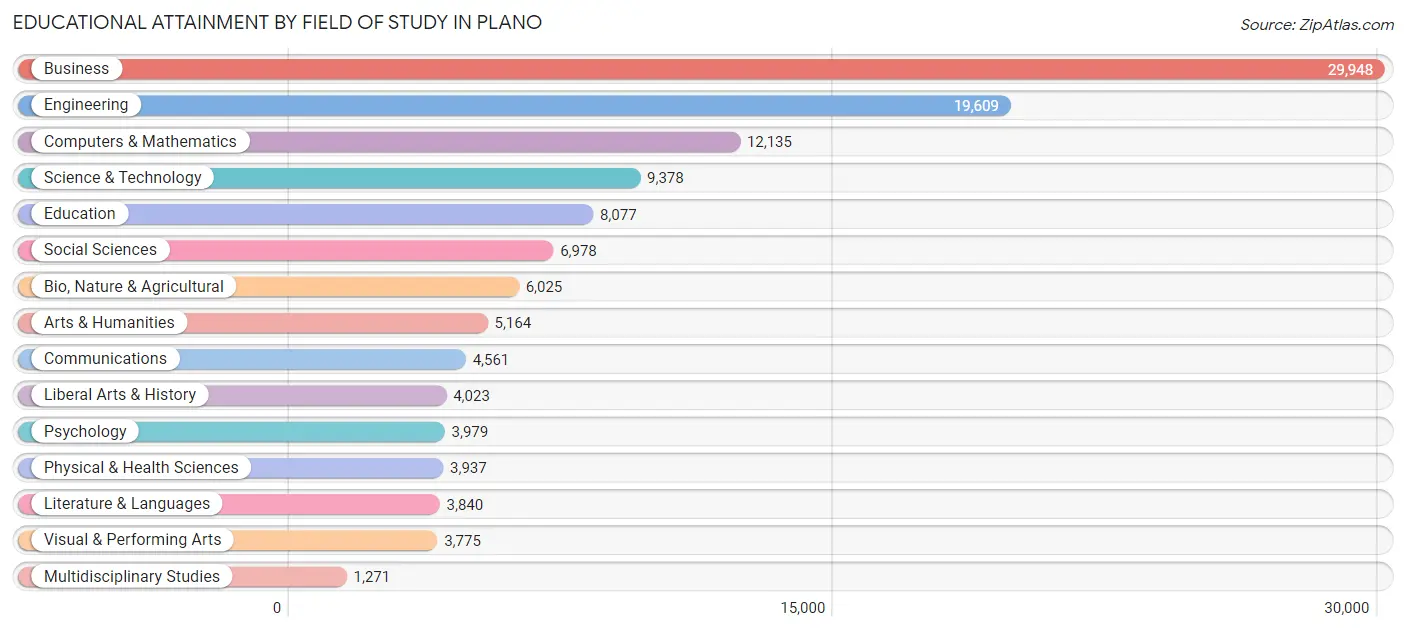
| Field of Study | # Graduates | % Graduates |
| Computers & Mathematics | 12,135 | 9.9% |
| Bio, Nature & Agricultural | 6,025 | 4.9% |
| Physical & Health Sciences | 3,937 | 3.2% |
| Psychology | 3,979 | 3.2% |
| Social Sciences | 6,978 | 5.7% |
| Engineering | 19,609 | 16.0% |
| Multidisciplinary Studies | 1,271 | 1.0% |
| Science & Technology | 9,378 | 7.6% |
| Business | 29,948 | 24.4% |
| Education | 8,077 | 6.6% |
| Literature & Languages | 3,840 | 3.1% |
| Liberal Arts & History | 4,023 | 3.3% |
| Visual & Performing Arts | 3,775 | 3.1% |
| Communications | 4,561 | 3.7% |
| Arts & Humanities | 5,164 | 4.2% |
| Total | 122,700 | 100.0% |
Transportation & Commute in Plano
Vehicle Availability by Sex in Plano
The most prevalent vehicle ownership categories in Plano are males with 2 vehicles (39,629, accounting for 47.3%) and females with 2 vehicles (31,779, making up 59.2%).
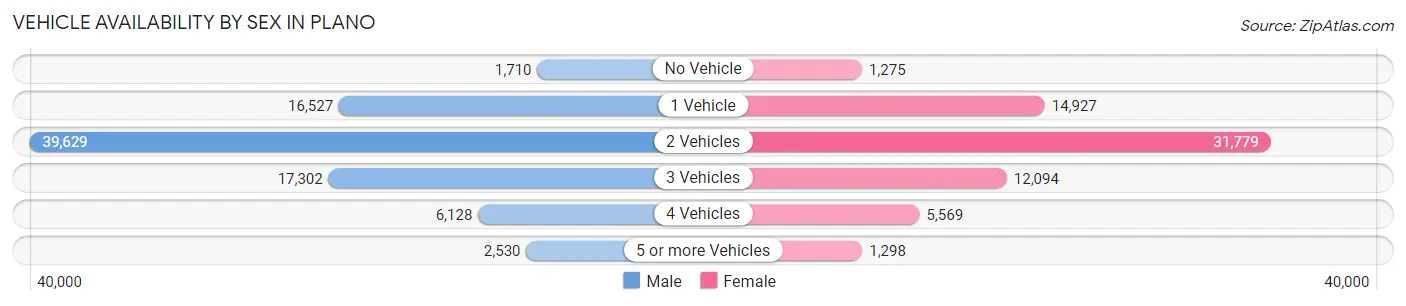
| Vehicles Available | Male | Female |
| No Vehicle | 1,710 (2.0%) | 1,275 (1.9%) |
| 1 Vehicle | 16,527 (19.7%) | 14,927 (22.3%) |
| 2 Vehicles | 39,629 (47.3%) | 31,779 (47.5%) |
| 3 Vehicles | 17,302 (20.6%) | 12,094 (18.1%) |
| 4 Vehicles | 6,128 (7.3%) | 5,569 (8.3%) |
| 5 or more Vehicles | 2,530 (3.0%) | 1,298 (1.9%) |
| Total | 83,826 (100.0%) | 66,942 (100.0%) |
Commute Time in Plano
The most frequently occuring commute durations in Plano are 30 to 34 minutes (19,653 commuters, 16.8%), 20 to 24 minutes (19,343 commuters, 16.5%), and 15 to 19 minutes (17,833 commuters, 15.2%).
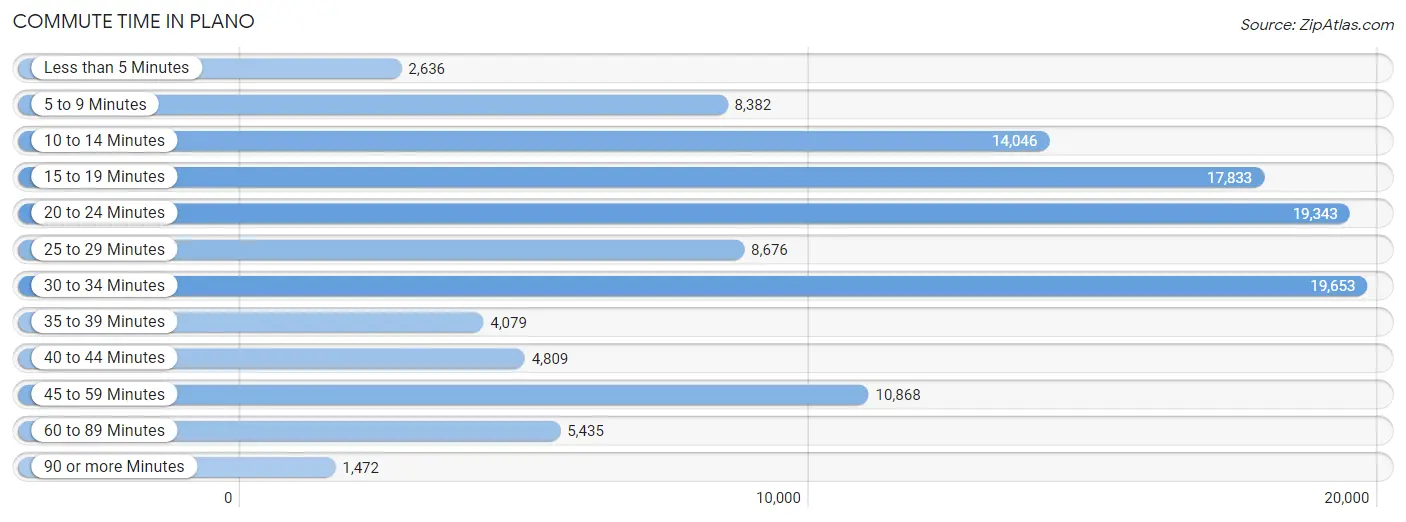
| Commute Time | # Commuters | % Commuters |
| Less than 5 Minutes | 2,636 | 2.2% |
| 5 to 9 Minutes | 8,382 | 7.1% |
| 10 to 14 Minutes | 14,046 | 12.0% |
| 15 to 19 Minutes | 17,833 | 15.2% |
| 20 to 24 Minutes | 19,343 | 16.5% |
| 25 to 29 Minutes | 8,676 | 7.4% |
| 30 to 34 Minutes | 19,653 | 16.8% |
| 35 to 39 Minutes | 4,079 | 3.5% |
| 40 to 44 Minutes | 4,809 | 4.1% |
| 45 to 59 Minutes | 10,868 | 9.3% |
| 60 to 89 Minutes | 5,435 | 4.6% |
| 90 or more Minutes | 1,472 | 1.3% |
Commute Time by Sex in Plano
The most common commute times in Plano are 20 to 24 minutes (10,833 commuters, 16.6%) for males and 30 to 34 minutes (8,823 commuters, 16.9%) for females.
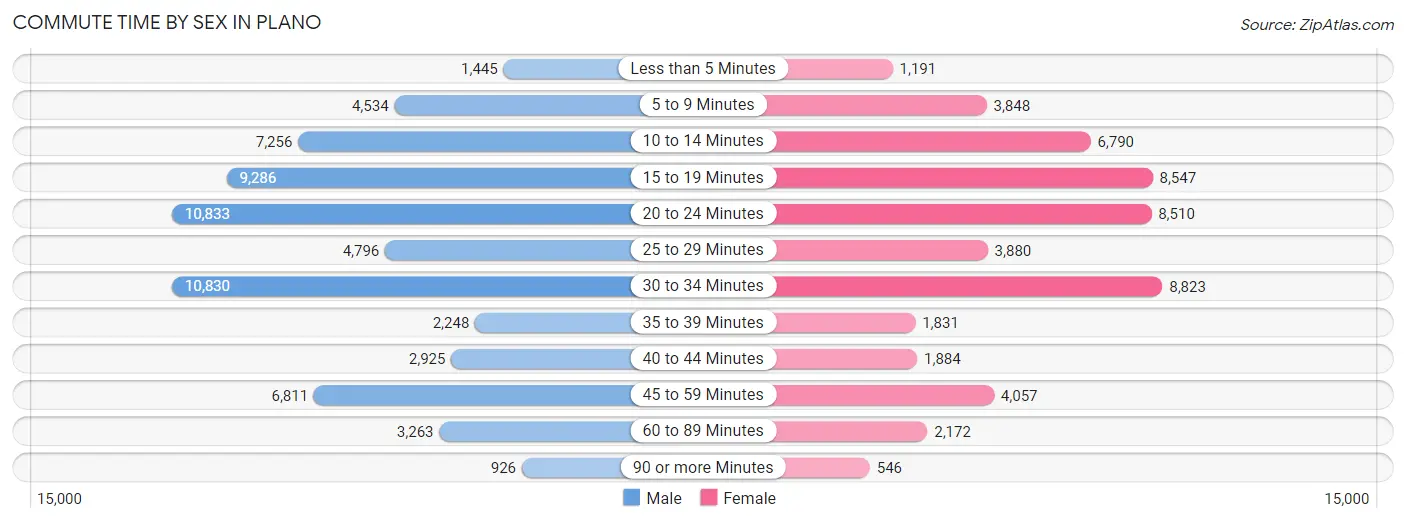
| Commute Time | Male | Female |
| Less than 5 Minutes | 1,445 (2.2%) | 1,191 (2.3%) |
| 5 to 9 Minutes | 4,534 (7.0%) | 3,848 (7.4%) |
| 10 to 14 Minutes | 7,256 (11.1%) | 6,790 (13.0%) |
| 15 to 19 Minutes | 9,286 (14.2%) | 8,547 (16.4%) |
| 20 to 24 Minutes | 10,833 (16.6%) | 8,510 (16.3%) |
| 25 to 29 Minutes | 4,796 (7.4%) | 3,880 (7.4%) |
| 30 to 34 Minutes | 10,830 (16.6%) | 8,823 (16.9%) |
| 35 to 39 Minutes | 2,248 (3.5%) | 1,831 (3.5%) |
| 40 to 44 Minutes | 2,925 (4.5%) | 1,884 (3.6%) |
| 45 to 59 Minutes | 6,811 (10.4%) | 4,057 (7.8%) |
| 60 to 89 Minutes | 3,263 (5.0%) | 2,172 (4.2%) |
| 90 or more Minutes | 926 (1.4%) | 546 (1.1%) |
Time of Departure to Work by Sex in Plano
The most frequent times of departure to work in Plano are 8:00 AM to 8:29 AM (10,880, 16.7%) for males and 7:30 AM to 7:59 AM (8,815, 16.9%) for females.
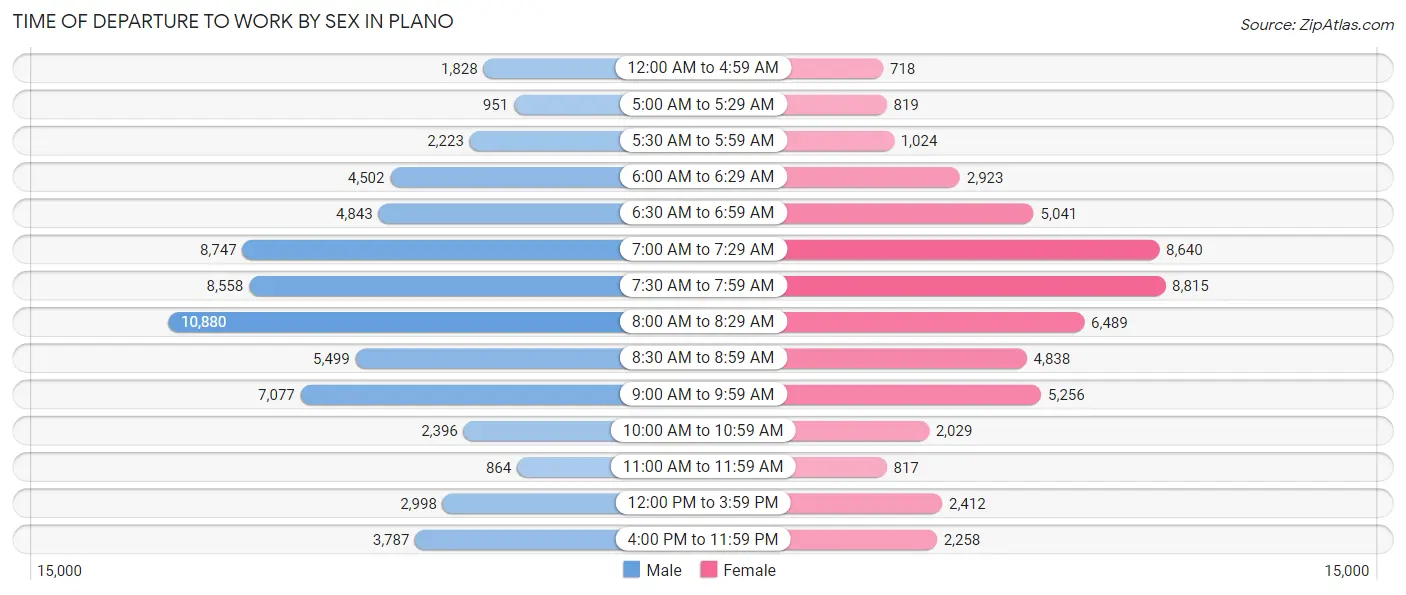
| Time of Departure | Male | Female |
| 12:00 AM to 4:59 AM | 1,828 (2.8%) | 718 (1.4%) |
| 5:00 AM to 5:29 AM | 951 (1.5%) | 819 (1.6%) |
| 5:30 AM to 5:59 AM | 2,223 (3.4%) | 1,024 (2.0%) |
| 6:00 AM to 6:29 AM | 4,502 (6.9%) | 2,923 (5.6%) |
| 6:30 AM to 6:59 AM | 4,843 (7.4%) | 5,041 (9.7%) |
| 7:00 AM to 7:29 AM | 8,747 (13.4%) | 8,640 (16.6%) |
| 7:30 AM to 7:59 AM | 8,558 (13.1%) | 8,815 (16.9%) |
| 8:00 AM to 8:29 AM | 10,880 (16.7%) | 6,489 (12.5%) |
| 8:30 AM to 8:59 AM | 5,499 (8.4%) | 4,838 (9.3%) |
| 9:00 AM to 9:59 AM | 7,077 (10.9%) | 5,256 (10.1%) |
| 10:00 AM to 10:59 AM | 2,396 (3.7%) | 2,029 (3.9%) |
| 11:00 AM to 11:59 AM | 864 (1.3%) | 817 (1.6%) |
| 12:00 PM to 3:59 PM | 2,998 (4.6%) | 2,412 (4.6%) |
| 4:00 PM to 11:59 PM | 3,787 (5.8%) | 2,258 (4.3%) |
| Total | 65,153 (100.0%) | 52,079 (100.0%) |
Housing Occupancy in Plano
Occupancy by Ownership in Plano
Of the total 107,448 dwellings in Plano, owner-occupied units account for 60,957 (56.7%), while renter-occupied units make up 46,491 (43.3%).
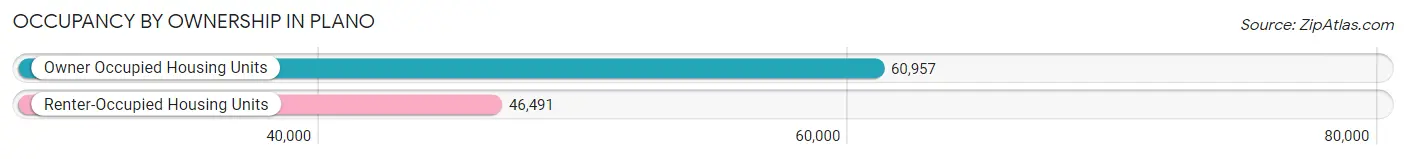
| Occupancy | # Housing Units | % Housing Units |
| Owner Occupied Housing Units | 60,957 | 56.7% |
| Renter-Occupied Housing Units | 46,491 | 43.3% |
| Total Occupied Housing Units | 107,448 | 100.0% |
Occupancy by Household Size in Plano
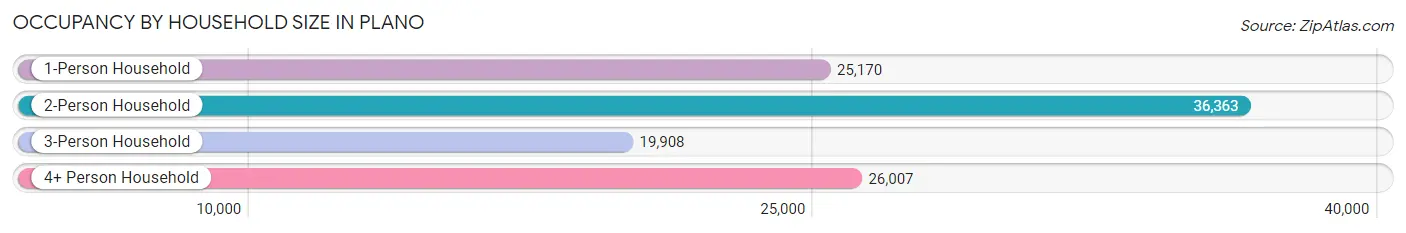
| Household Size | # Housing Units | % Housing Units |
| 1-Person Household | 25,170 | 23.4% |
| 2-Person Household | 36,363 | 33.8% |
| 3-Person Household | 19,908 | 18.5% |
| 4+ Person Household | 26,007 | 24.2% |
| Total Housing Units | 107,448 | 100.0% |
Occupancy by Ownership by Household Size in Plano
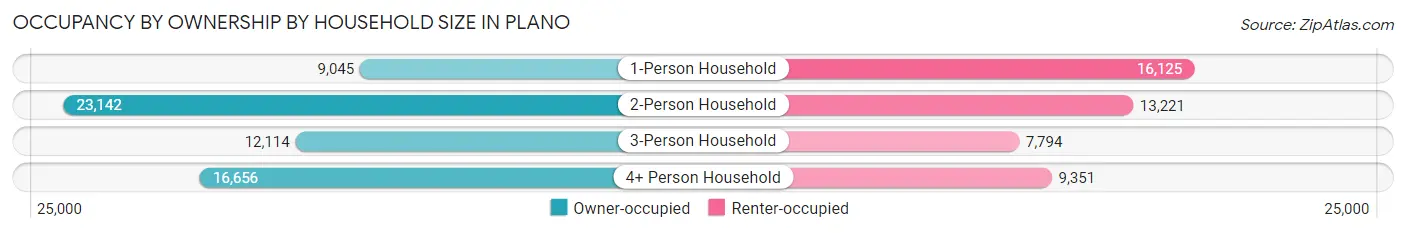
| Household Size | Owner-occupied | Renter-occupied |
| 1-Person Household | 9,045 (35.9%) | 16,125 (64.1%) |
| 2-Person Household | 23,142 (63.6%) | 13,221 (36.4%) |
| 3-Person Household | 12,114 (60.9%) | 7,794 (39.2%) |
| 4+ Person Household | 16,656 (64.0%) | 9,351 (36.0%) |
| Total Housing Units | 60,957 (56.7%) | 46,491 (43.3%) |
Occupancy by Educational Attainment in Plano
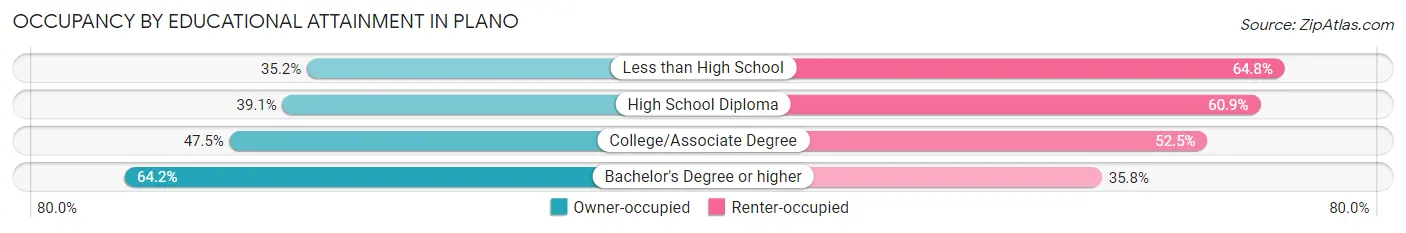
| Household Size | Owner-occupied | Renter-occupied |
| Less than High School | 1,658 (35.2%) | 3,053 (64.8%) |
| High School Diploma | 3,927 (39.1%) | 6,124 (60.9%) |
| College/Associate Degree | 11,743 (47.5%) | 12,996 (52.5%) |
| Bachelor's Degree or higher | 43,629 (64.2%) | 24,318 (35.8%) |
Occupancy by Age of Householder in Plano
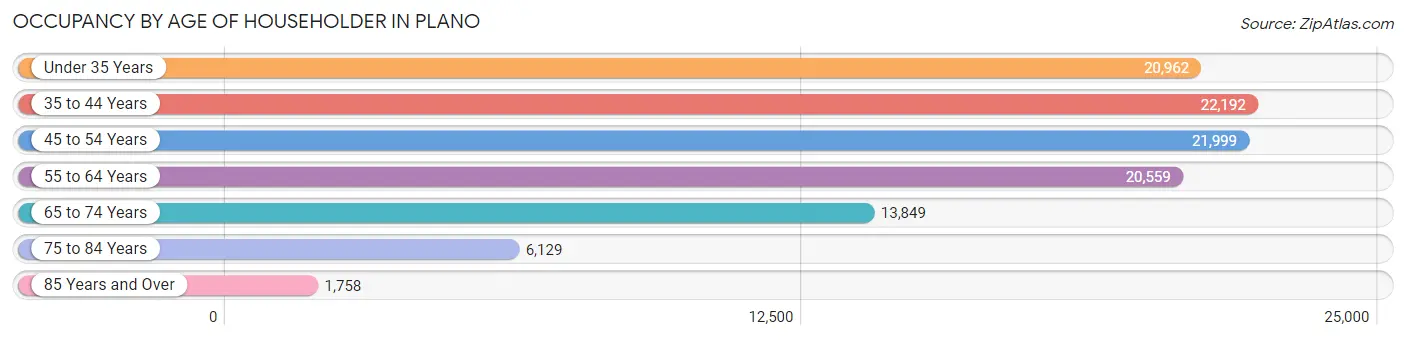
| Age Bracket | # Households | % Households |
| Under 35 Years | 20,962 | 19.5% |
| 35 to 44 Years | 22,192 | 20.6% |
| 45 to 54 Years | 21,999 | 20.5% |
| 55 to 64 Years | 20,559 | 19.1% |
| 65 to 74 Years | 13,849 | 12.9% |
| 75 to 84 Years | 6,129 | 5.7% |
| 85 Years and Over | 1,758 | 1.6% |
| Total | 107,448 | 100.0% |
Housing Finances in Plano
Median Income by Occupancy in Plano
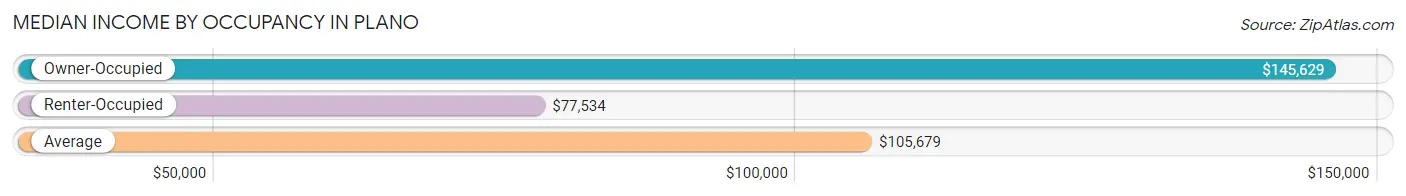
| Occupancy Type | # Households | Median Income |
| Owner-Occupied | 60,957 (56.7%) | $145,629 |
| Renter-Occupied | 46,491 (43.3%) | $77,534 |
| Average | 107,448 (100.0%) | $105,679 |
Occupancy by Householder Income Bracket in Plano
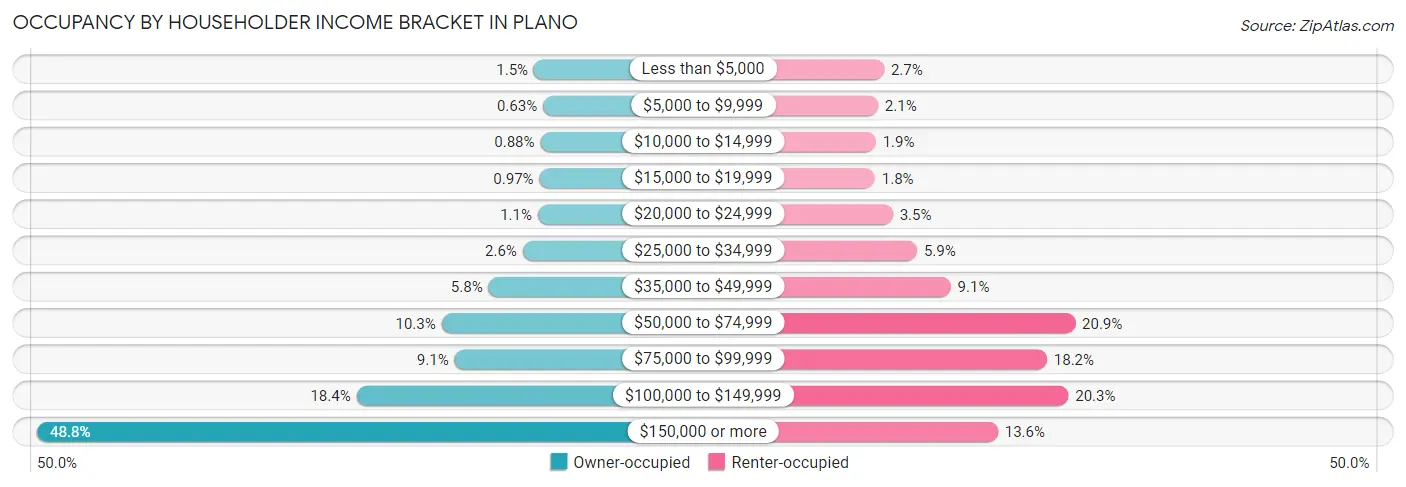
| Income Bracket | Owner-occupied | Renter-occupied |
| Less than $5,000 | 907 (1.5%) | 1,259 (2.7%) |
| $5,000 to $9,999 | 384 (0.6%) | 990 (2.1%) |
| $10,000 to $14,999 | 534 (0.9%) | 894 (1.9%) |
| $15,000 to $19,999 | 593 (1.0%) | 856 (1.8%) |
| $20,000 to $24,999 | 680 (1.1%) | 1,647 (3.5%) |
| $25,000 to $34,999 | 1,560 (2.6%) | 2,722 (5.9%) |
| $35,000 to $49,999 | 3,549 (5.8%) | 4,213 (9.1%) |
| $50,000 to $74,999 | 6,271 (10.3%) | 9,721 (20.9%) |
| $75,000 to $99,999 | 5,520 (9.1%) | 8,471 (18.2%) |
| $100,000 to $149,999 | 11,208 (18.4%) | 9,417 (20.3%) |
| $150,000 or more | 29,751 (48.8%) | 6,301 (13.6%) |
| Total | 60,957 (100.0%) | 46,491 (100.0%) |
Monthly Housing Cost Tiers in Plano
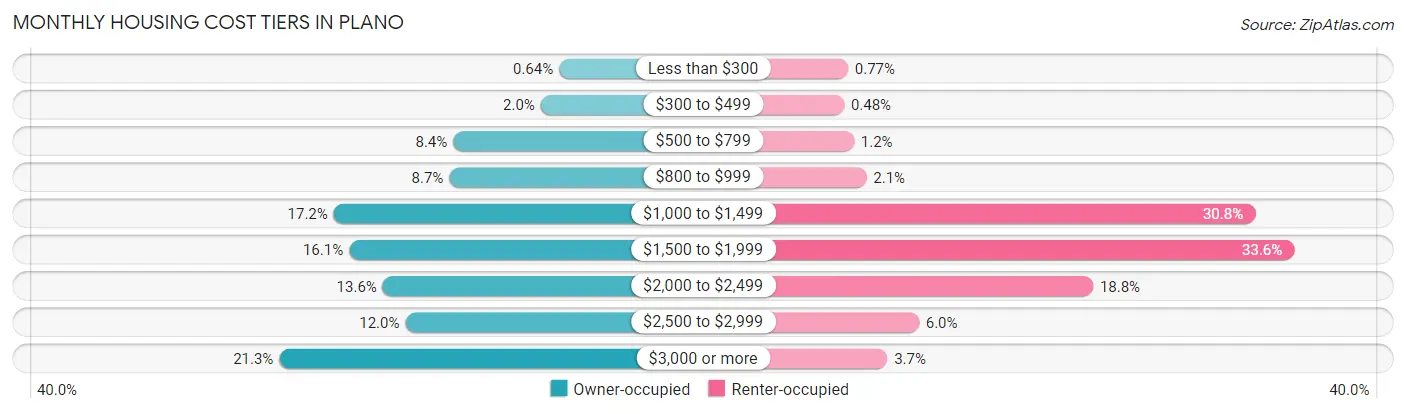
| Monthly Cost | Owner-occupied | Renter-occupied |
| Less than $300 | 390 (0.6%) | 357 (0.8%) |
| $300 to $499 | 1,216 (2.0%) | 222 (0.5%) |
| $500 to $799 | 5,146 (8.4%) | 564 (1.2%) |
| $800 to $999 | 5,323 (8.7%) | 989 (2.1%) |
| $1,000 to $1,499 | 10,507 (17.2%) | 14,294 (30.7%) |
| $1,500 to $1,999 | 9,823 (16.1%) | 15,634 (33.6%) |
| $2,000 to $2,499 | 8,308 (13.6%) | 8,749 (18.8%) |
| $2,500 to $2,999 | 7,291 (12.0%) | 2,786 (6.0%) |
| $3,000 or more | 12,953 (21.2%) | 1,705 (3.7%) |
| Total | 60,957 (100.0%) | 46,491 (100.0%) |
Physical Housing Characteristics in Plano
Housing Structures in Plano
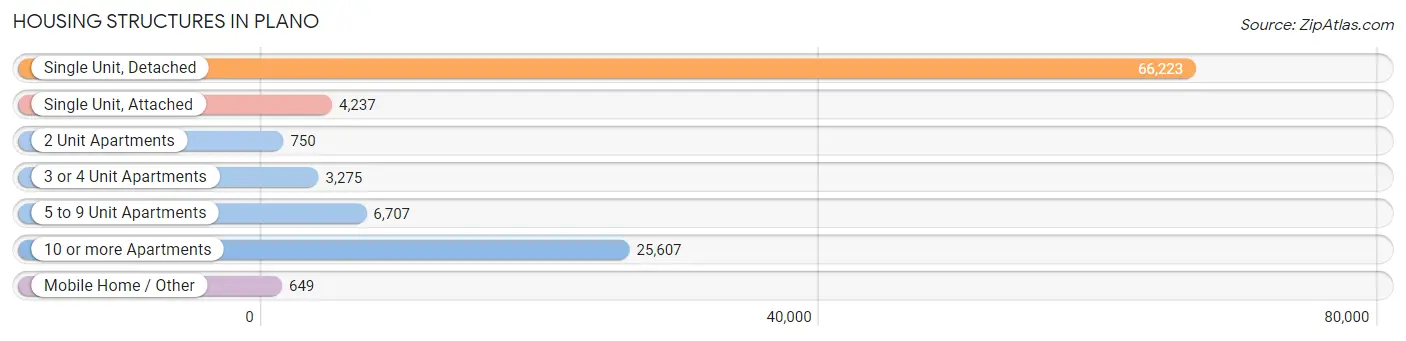
| Structure Type | # Housing Units | % Housing Units |
| Single Unit, Detached | 66,223 | 61.6% |
| Single Unit, Attached | 4,237 | 3.9% |
| 2 Unit Apartments | 750 | 0.7% |
| 3 or 4 Unit Apartments | 3,275 | 3.0% |
| 5 to 9 Unit Apartments | 6,707 | 6.2% |
| 10 or more Apartments | 25,607 | 23.8% |
| Mobile Home / Other | 649 | 0.6% |
| Total | 107,448 | 100.0% |
Housing Structures by Occupancy in Plano
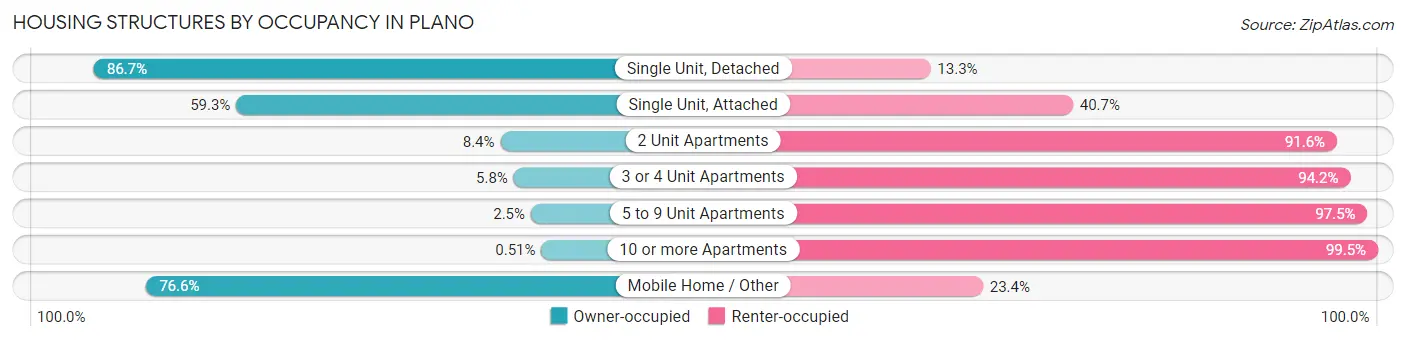
| Structure Type | Owner-occupied | Renter-occupied |
| Single Unit, Detached | 57,394 (86.7%) | 8,829 (13.3%) |
| Single Unit, Attached | 2,511 (59.3%) | 1,726 (40.7%) |
| 2 Unit Apartments | 63 (8.4%) | 687 (91.6%) |
| 3 or 4 Unit Apartments | 191 (5.8%) | 3,084 (94.2%) |
| 5 to 9 Unit Apartments | 170 (2.5%) | 6,537 (97.5%) |
| 10 or more Apartments | 131 (0.5%) | 25,476 (99.5%) |
| Mobile Home / Other | 497 (76.6%) | 152 (23.4%) |
| Total | 60,957 (56.7%) | 46,491 (43.3%) |
Housing Structures by Number of Rooms in Plano
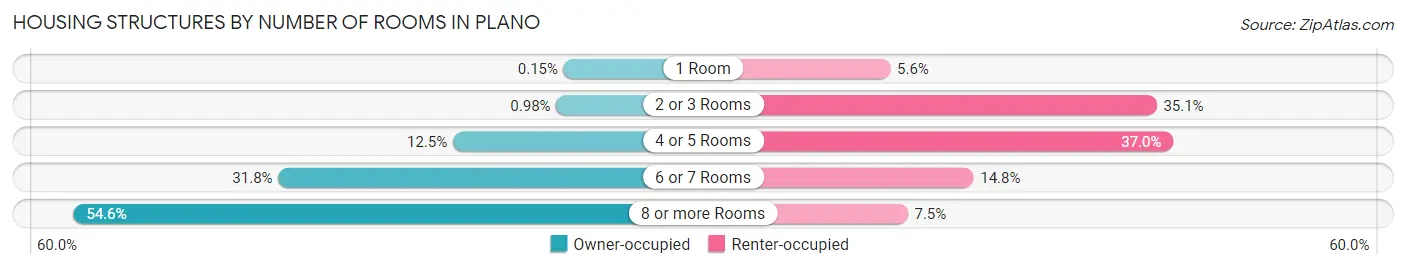
| Number of Rooms | Owner-occupied | Renter-occupied |
| 1 Room | 91 (0.2%) | 2,590 (5.6%) |
| 2 or 3 Rooms | 597 (1.0%) | 16,332 (35.1%) |
| 4 or 5 Rooms | 7,590 (12.4%) | 17,202 (37.0%) |
| 6 or 7 Rooms | 19,404 (31.8%) | 6,880 (14.8%) |
| 8 or more Rooms | 33,275 (54.6%) | 3,487 (7.5%) |
| Total | 60,957 (100.0%) | 46,491 (100.0%) |
Housing Structure by Heating Type in Plano
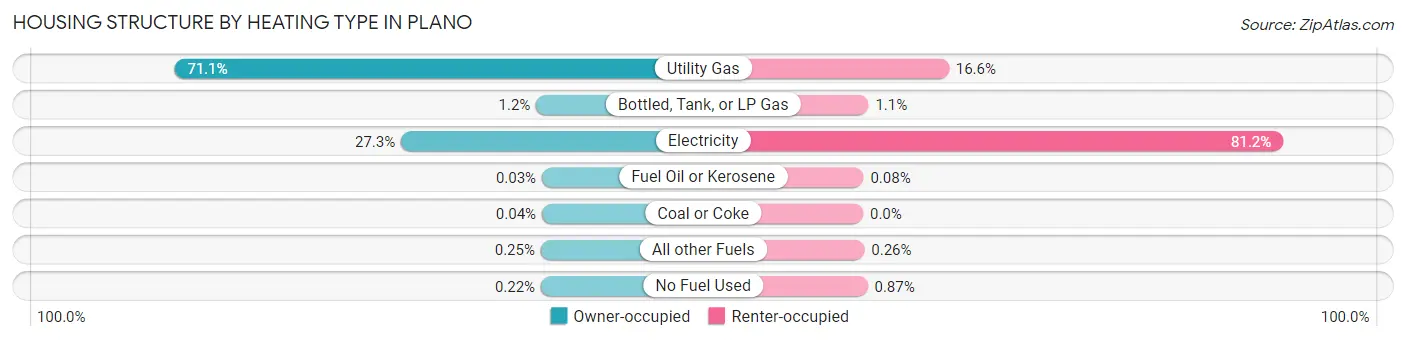
| Heating Type | Owner-occupied | Renter-occupied |
| Utility Gas | 43,316 (71.1%) | 7,704 (16.6%) |
| Bottled, Tank, or LP Gas | 704 (1.1%) | 488 (1.1%) |
| Electricity | 16,608 (27.3%) | 37,736 (81.2%) |
| Fuel Oil or Kerosene | 16 (0.0%) | 38 (0.1%) |
| Coal or Coke | 27 (0.0%) | 0 (0.0%) |
| All other Fuels | 150 (0.3%) | 120 (0.3%) |
| No Fuel Used | 136 (0.2%) | 405 (0.9%) |
| Total | 60,957 (100.0%) | 46,491 (100.0%) |
Household Vehicle Usage in Plano
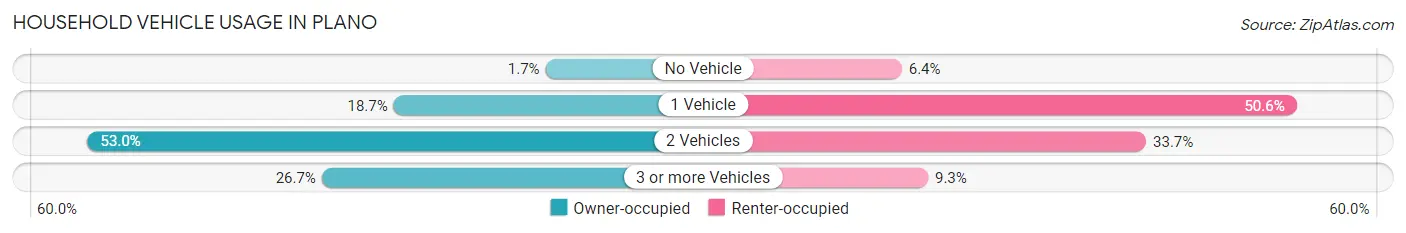
| Vehicles per Household | Owner-occupied | Renter-occupied |
| No Vehicle | 1,011 (1.7%) | 2,963 (6.4%) |
| 1 Vehicle | 11,379 (18.7%) | 23,514 (50.6%) |
| 2 Vehicles | 32,282 (53.0%) | 15,684 (33.7%) |
| 3 or more Vehicles | 16,285 (26.7%) | 4,330 (9.3%) |
| Total | 60,957 (100.0%) | 46,491 (100.0%) |
Real Estate & Mortgages in Plano
Real Estate and Mortgage Overview in Plano
| Characteristic | Without Mortgage | With Mortgage |
| Housing Units | 22,770 | 38,187 |
| Median Property Value | $397,100 | $421,000 |
| Median Household Income | $121,630 | $20,486 |
| Monthly Housing Costs | $1,008 | $12,571 |
| Real Estate Taxes | $6,217 | $437 |
Property Value by Mortgage Status in Plano
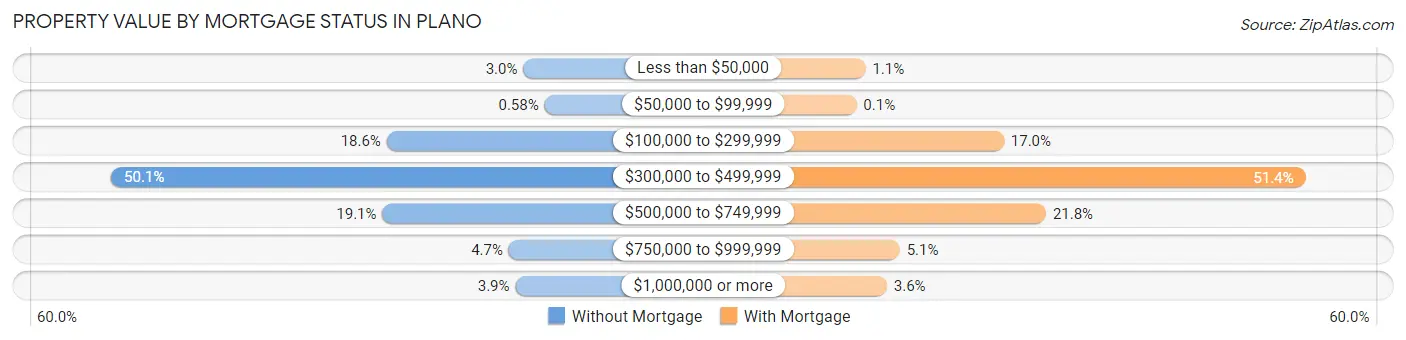
| Property Value | Without Mortgage | With Mortgage |
| Less than $50,000 | 685 (3.0%) | 430 (1.1%) |
| $50,000 to $99,999 | 133 (0.6%) | 37 (0.1%) |
| $100,000 to $299,999 | 4,239 (18.6%) | 6,473 (17.0%) |
| $300,000 to $499,999 | 11,411 (50.1%) | 19,639 (51.4%) |
| $500,000 to $749,999 | 4,352 (19.1%) | 8,311 (21.8%) |
| $750,000 to $999,999 | 1,060 (4.7%) | 1,929 (5.1%) |
| $1,000,000 or more | 890 (3.9%) | 1,368 (3.6%) |
| Total | 22,770 (100.0%) | 38,187 (100.0%) |
Household Income by Mortgage Status in Plano
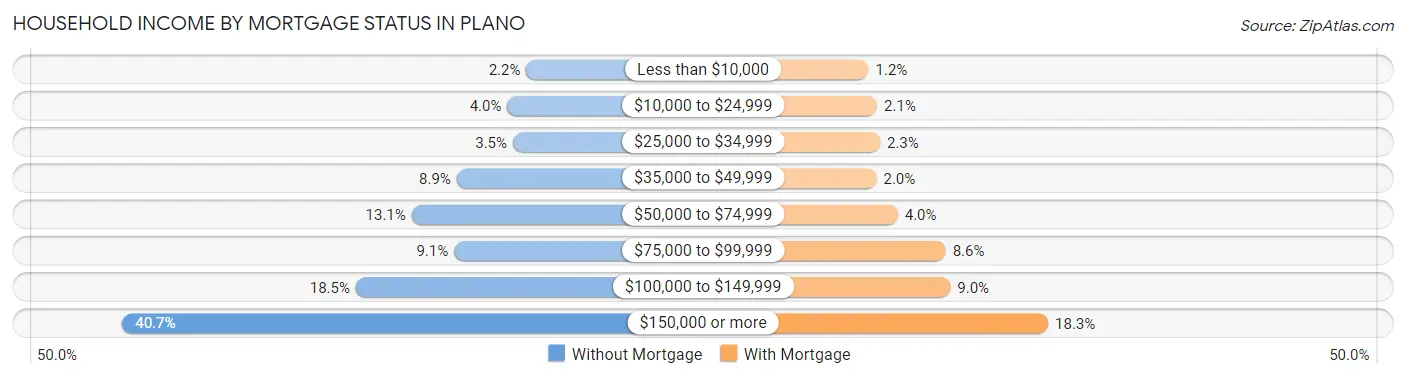
| Household Income | Without Mortgage | With Mortgage |
| Less than $10,000 | 505 (2.2%) | 473 (1.2%) |
| $10,000 to $24,999 | 918 (4.0%) | 786 (2.1%) |
| $25,000 to $34,999 | 798 (3.5%) | 889 (2.3%) |
| $35,000 to $49,999 | 2,015 (8.8%) | 762 (2.0%) |
| $50,000 to $74,999 | 2,992 (13.1%) | 1,534 (4.0%) |
| $75,000 to $99,999 | 2,073 (9.1%) | 3,279 (8.6%) |
| $100,000 to $149,999 | 4,204 (18.5%) | 3,447 (9.0%) |
| $150,000 or more | 9,265 (40.7%) | 7,004 (18.3%) |
| Total | 22,770 (100.0%) | 38,187 (100.0%) |
Property Value to Household Income Ratio in Plano
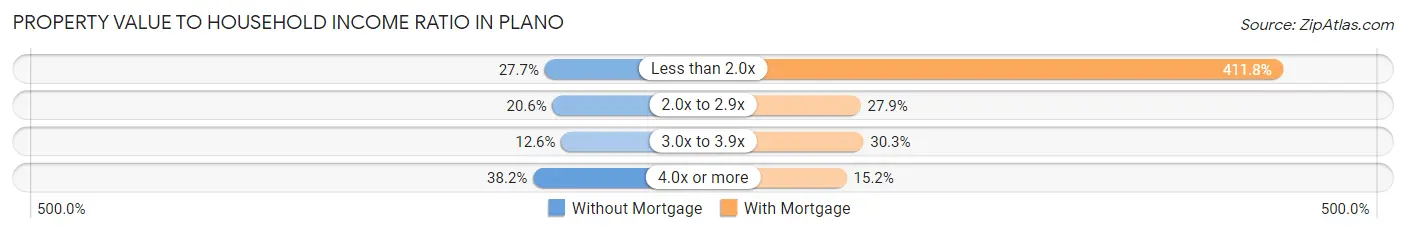
| Value-to-Income Ratio | Without Mortgage | With Mortgage |
| Less than 2.0x | 6,306 (27.7%) | 157,256 (411.8%) |
| 2.0x to 2.9x | 4,695 (20.6%) | 10,642 (27.9%) |
| 3.0x to 3.9x | 2,867 (12.6%) | 11,562 (30.3%) |
| 4.0x or more | 8,697 (38.2%) | 5,798 (15.2%) |
| Total | 22,770 (100.0%) | 38,187 (100.0%) |
Real Estate Taxes by Mortgage Status in Plano

| Property Taxes | Without Mortgage | With Mortgage |
| Less than $800 | 580 (2.5%) | 289 (0.8%) |
| $800 to $1,499 | 653 (2.9%) | 284 (0.7%) |
| $800 to $1,499 | 20,958 (92.0%) | 623 (1.6%) |
| Total | 22,770 (100.0%) | 38,187 (100.0%) |
Health & Disability in Plano
Health Insurance Coverage by Age in Plano
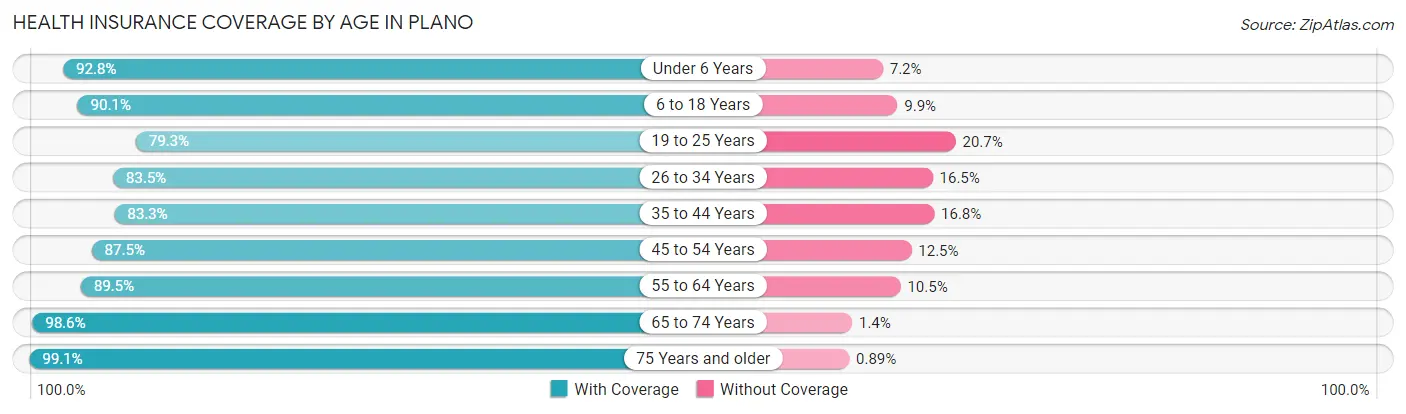
| Age Bracket | With Coverage | Without Coverage |
| Under 6 Years | 17,515 (92.8%) | 1,355 (7.2%) |
| 6 to 18 Years | 42,460 (90.1%) | 4,658 (9.9%) |
| 19 to 25 Years | 19,466 (79.3%) | 5,093 (20.7%) |
| 26 to 34 Years | 29,562 (83.5%) | 5,829 (16.5%) |
| 35 to 44 Years | 35,672 (83.3%) | 7,179 (16.8%) |
| 45 to 54 Years | 34,504 (87.5%) | 4,933 (12.5%) |
| 55 to 64 Years | 33,514 (89.5%) | 3,922 (10.5%) |
| 65 to 74 Years | 23,941 (98.6%) | 349 (1.4%) |
| 75 Years and older | 13,984 (99.1%) | 125 (0.9%) |
| Total | 250,618 (88.2%) | 33,443 (11.8%) |
Health Insurance Coverage by Citizenship Status in Plano

| Citizenship Status | With Coverage | Without Coverage |
| Native Born | 17,515 (92.8%) | 1,355 (7.2%) |
| Foreign Born, Citizen | 42,460 (90.1%) | 4,658 (9.9%) |
| Foreign Born, not a Citizen | 19,466 (79.3%) | 5,093 (20.7%) |
Health Insurance Coverage by Household Income in Plano
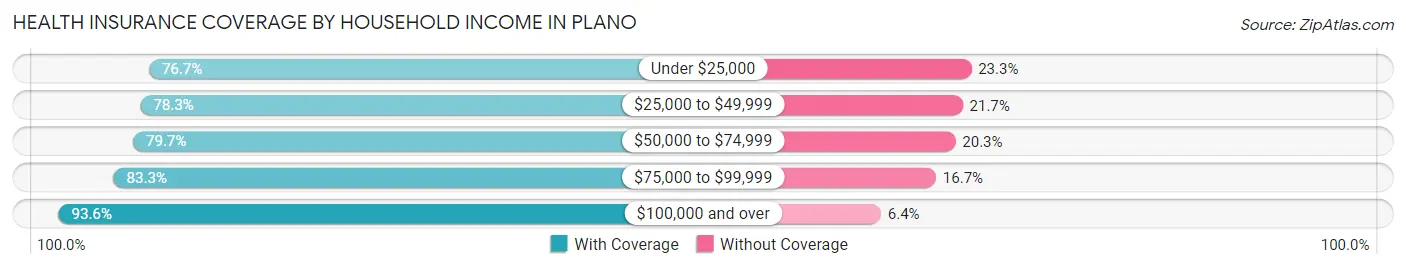
| Household Income | With Coverage | Without Coverage |
| Under $25,000 | 11,832 (76.7%) | 3,597 (23.3%) |
| $25,000 to $49,999 | 20,465 (78.3%) | 5,672 (21.7%) |
| $50,000 to $74,999 | 28,469 (79.7%) | 7,268 (20.3%) |
| $75,000 to $99,999 | 29,593 (83.3%) | 5,927 (16.7%) |
| $100,000 and over | 160,105 (93.6%) | 10,913 (6.4%) |
Public vs Private Health Insurance Coverage by Age in Plano
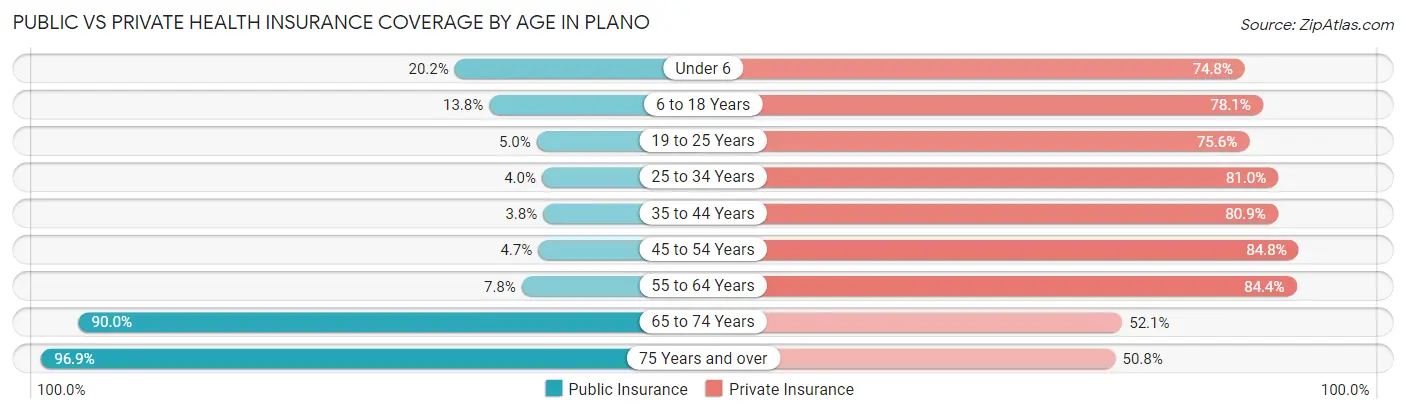
| Age Bracket | Public Insurance | Private Insurance |
| Under 6 | 3,812 (20.2%) | 14,113 (74.8%) |
| 6 to 18 Years | 6,496 (13.8%) | 36,800 (78.1%) |
| 19 to 25 Years | 1,219 (5.0%) | 18,559 (75.6%) |
| 25 to 34 Years | 1,415 (4.0%) | 28,654 (81.0%) |
| 35 to 44 Years | 1,613 (3.8%) | 34,649 (80.9%) |
| 45 to 54 Years | 1,855 (4.7%) | 33,436 (84.8%) |
| 55 to 64 Years | 2,901 (7.7%) | 31,577 (84.4%) |
| 65 to 74 Years | 21,852 (90.0%) | 12,646 (52.1%) |
| 75 Years and over | 13,672 (96.9%) | 7,169 (50.8%) |
| Total | 54,835 (19.3%) | 217,603 (76.6%) |
Disability Status by Sex by Age in Plano
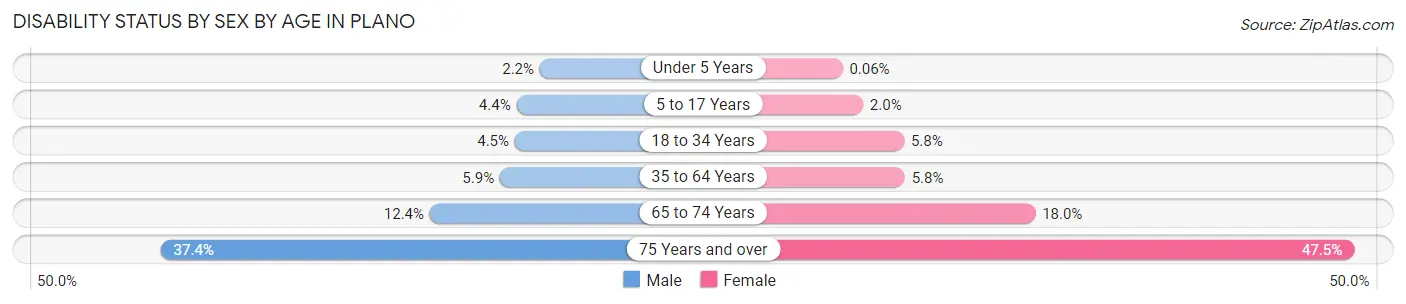
| Age Bracket | Male | Female |
| Under 5 Years | 174 (2.2%) | 5 (0.1%) |
| 5 to 17 Years | 1,036 (4.3%) | 436 (2.0%) |
| 18 to 34 Years | 1,453 (4.5%) | 1,835 (5.8%) |
| 35 to 64 Years | 3,522 (5.9%) | 3,495 (5.8%) |
| 65 to 74 Years | 1,394 (12.4%) | 2,341 (17.9%) |
| 75 Years and over | 2,169 (37.4%) | 3,948 (47.5%) |
Disability Class by Sex by Age in Plano
Disability Class: Hearing Difficulty
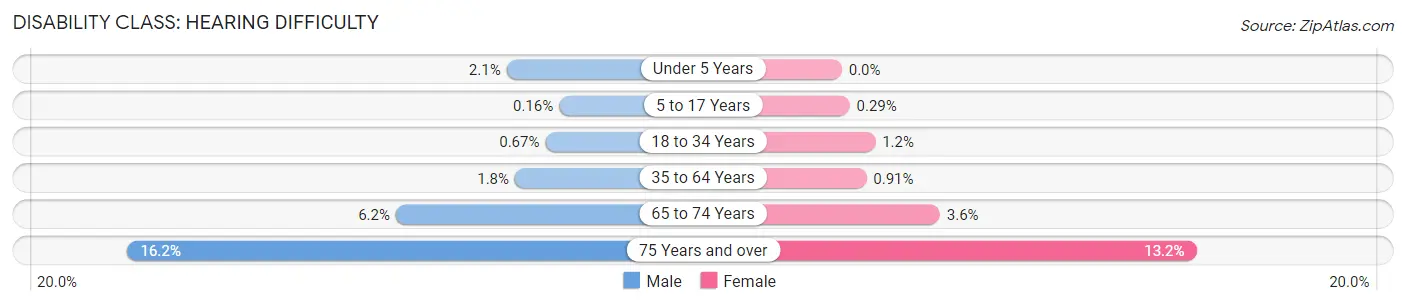
| Age Bracket | Male | Female |
| Under 5 Years | 168 (2.1%) | 0 (0.0%) |
| 5 to 17 Years | 39 (0.2%) | 65 (0.3%) |
| 18 to 34 Years | 216 (0.7%) | 393 (1.2%) |
| 35 to 64 Years | 1,075 (1.8%) | 546 (0.9%) |
| 65 to 74 Years | 700 (6.2%) | 474 (3.6%) |
| 75 Years and over | 939 (16.2%) | 1,093 (13.2%) |
Disability Class: Vision Difficulty
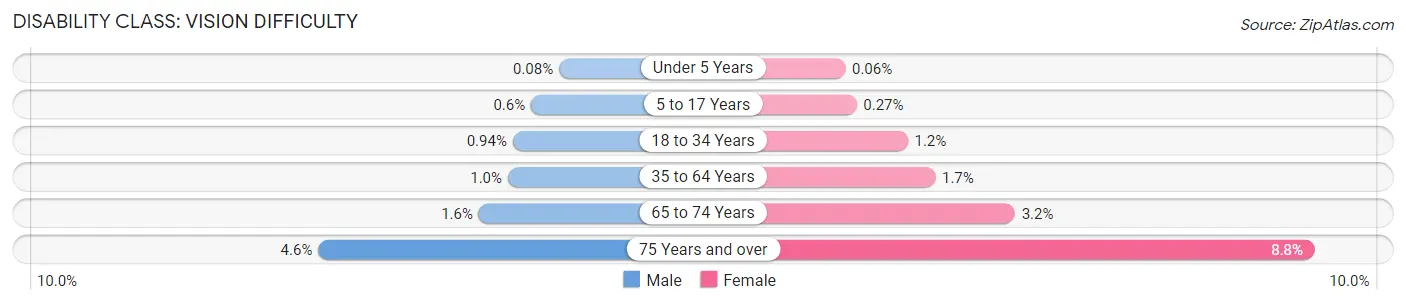
| Age Bracket | Male | Female |
| Under 5 Years | 6 (0.1%) | 5 (0.1%) |
| 5 to 17 Years | 142 (0.6%) | 59 (0.3%) |
| 18 to 34 Years | 303 (0.9%) | 387 (1.2%) |
| 35 to 64 Years | 617 (1.0%) | 1,038 (1.7%) |
| 65 to 74 Years | 177 (1.6%) | 419 (3.2%) |
| 75 Years and over | 264 (4.5%) | 729 (8.8%) |
Disability Class: Cognitive Difficulty
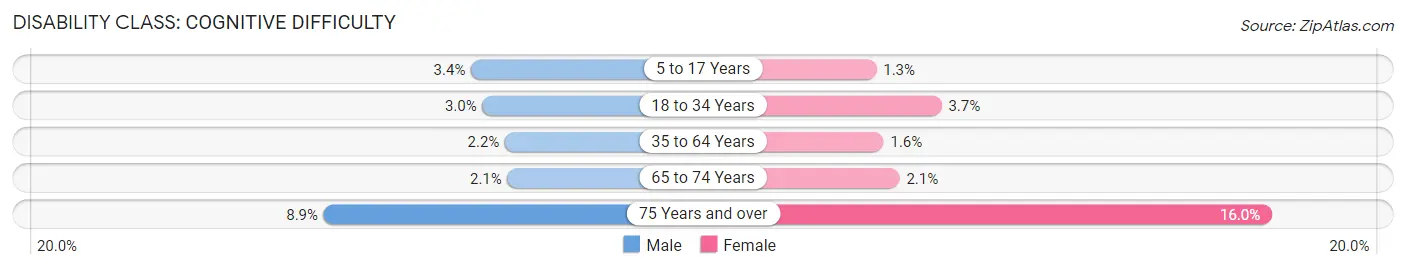
| Age Bracket | Male | Female |
| 5 to 17 Years | 815 (3.4%) | 284 (1.3%) |
| 18 to 34 Years | 969 (3.0%) | 1,175 (3.7%) |
| 35 to 64 Years | 1,293 (2.2%) | 929 (1.5%) |
| 65 to 74 Years | 233 (2.1%) | 279 (2.1%) |
| 75 Years and over | 516 (8.9%) | 1,326 (16.0%) |
Disability Class: Ambulatory Difficulty

| Age Bracket | Male | Female |
| 5 to 17 Years | 46 (0.2%) | 14 (0.1%) |
| 18 to 34 Years | 148 (0.5%) | 279 (0.9%) |
| 35 to 64 Years | 1,318 (2.2%) | 1,480 (2.5%) |
| 65 to 74 Years | 849 (7.5%) | 1,454 (11.2%) |
| 75 Years and over | 1,330 (22.9%) | 2,900 (34.9%) |
Disability Class: Self-Care Difficulty
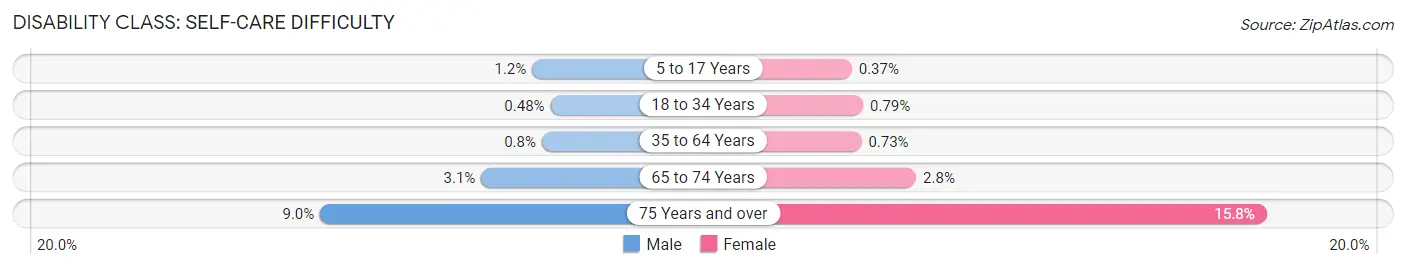
| Age Bracket | Male | Female |
| 5 to 17 Years | 277 (1.2%) | 82 (0.4%) |
| 18 to 34 Years | 154 (0.5%) | 252 (0.8%) |
| 35 to 64 Years | 478 (0.8%) | 436 (0.7%) |
| 65 to 74 Years | 343 (3.0%) | 360 (2.8%) |
| 75 Years and over | 524 (9.0%) | 1,310 (15.8%) |
Technology Access in Plano
Computing Device Access in Plano
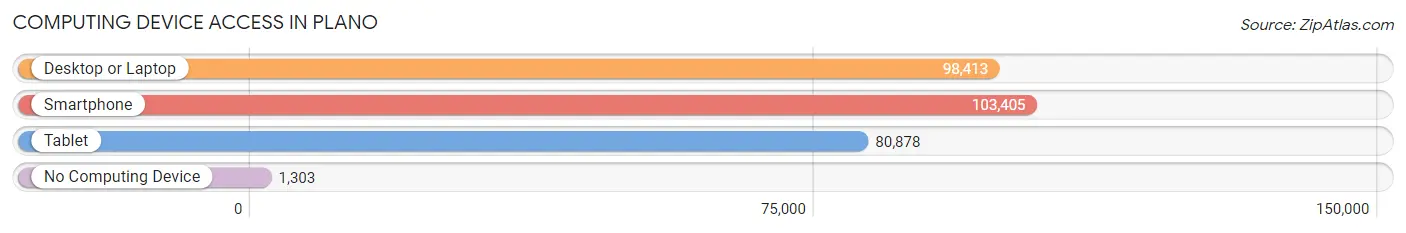
| Device Type | # Households | % Households |
| Desktop or Laptop | 98,413 | 91.6% |
| Smartphone | 103,405 | 96.2% |
| Tablet | 80,878 | 75.3% |
| No Computing Device | 1,303 | 1.2% |
| Total | 107,448 | 100.0% |
Internet Access in Plano
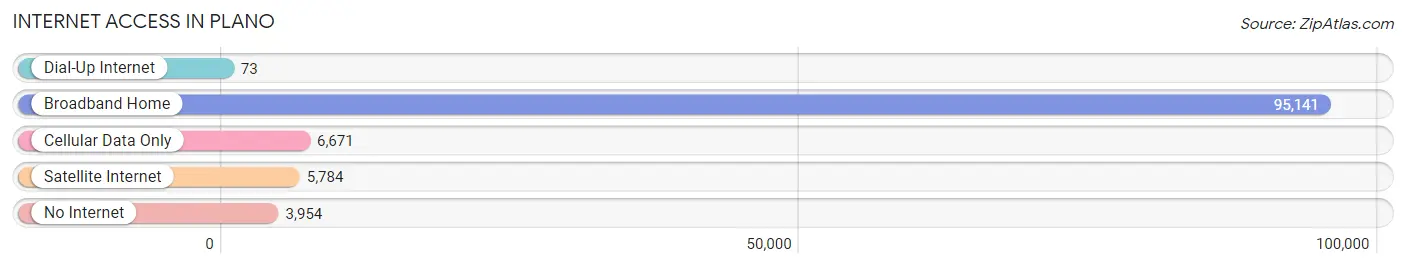
| Internet Type | # Households | % Households |
| Dial-Up Internet | 73 | 0.1% |
| Broadband Home | 95,141 | 88.5% |
| Cellular Data Only | 6,671 | 6.2% |
| Satellite Internet | 5,784 | 5.4% |
| No Internet | 3,954 | 3.7% |
| Total | 107,448 | 100.0% |
Plano Summary
Plano, Texas is a city located in Collin County, Texas, United States. It is a suburb of Dallas and is part of the Dallas-Fort Worth metropolitan area. The city had a population of 259,841 as of the 2010 census, making it the ninth-largest city in the state of Texas and the 70th most populous city in the United States.
History
Plano was first settled in the 1840s by settlers from Kentucky and Tennessee. The city was named after the Spanish word for “flat” due to the terrain of the area. The city was incorporated in 1873 and was officially recognized as a city in 1875.
In the late 19th century, Plano was a small farming community with a population of about 500. The city experienced rapid growth in the 1950s and 1960s due to the influx of people from the Dallas-Fort Worth area. By the 1970s, Plano had become a major suburb of Dallas and had a population of over 50,000.
Geography
Plano is located in Collin County, Texas, about 20 miles north of Dallas. The city covers an area of 71.6 square miles and has an elevation of 645 feet. The city is located in the Blackland Prairie region of Texas and is characterized by flat terrain and rolling hills. The city is bisected by the East Fork of the Trinity River.
Climate
Plano has a humid subtropical climate with hot summers and mild winters. The average annual temperature is 68°F and the average annual precipitation is 37.5 inches. The city experiences an average of 214 sunny days per year.
Economy
Plano is a major economic center in the Dallas-Fort Worth metropolitan area. The city is home to several major corporations, including Frito-Lay, JCPenney, Dr Pepper Snapple Group, and Pizza Hut. The city is also home to several major shopping centers, including The Shops at Willow Bend and The Shops at Legacy.
Demographics
As of the 2010 census, Plano had a population of 259,841. The racial makeup of the city was 68.9% White, 11.2% African American, 0.5% Native American, 11.9% Asian, and 6.5% from other races. The median household income was $81,856 and the median family income was $95,843.
Conclusion
Plano, Texas is a major city in the Dallas-Fort Worth metropolitan area. The city has a rich history and is home to several major corporations. The city has a humid subtropical climate and is characterized by flat terrain and rolling hills. The city has a population of 259,841 and a median household income of $81,856. Plano is a major economic center in the Dallas-Fort Worth area and is a great place to live and work.
Common Questions
What is Per Capita Income in Plano?
Per Capita income in Plano is $55,938.
What is the Median Family Income in Plano?
Median Family Income in Plano is $126,993.
What is the Median Household income in Plano?
Median Household Income in Plano is $105,679.
What is Income or Wage Gap in Plano?
Income or Wage Gap in Plano is 32.9%.
Women in Plano earn 67.1 cents for every dollar earned by a man.
What is Family Income Deficit in Plano?
Family Income Deficit in Plano is $12,656.
Families that are below poverty line in Plano earn $12,656 less on average than the poverty threshold level.
What is Inequality or Gini Index in Plano?
Inequality or Gini Index in Plano is 0.45.
What is the Total Population of Plano?
Total Population of Plano is 284,948.
What is the Total Male Population of Plano?
Total Male Population of Plano is 141,374.
What is the Total Female Population of Plano?
Total Female Population of Plano is 143,574.
What is the Ratio of Males per 100 Females in Plano?
There are 98.47 Males per 100 Females in Plano.
What is the Ratio of Females per 100 Males in Plano?
There are 101.56 Females per 100 Males in Plano.
What is the Median Population Age in Plano?
Median Population Age in Plano is 38.9 Years.
What is the Average Family Size in Plano
Average Family Size in Plano is 3.1 People.
What is the Average Household Size in Plano
Average Household Size in Plano is 2.6 People.
How Large is the Labor Force in Plano?
There are 159,574 People in the Labor Forcein in Plano.
What is the Percentage of People in the Labor Force in Plano?
69.3% of People are in the Labor Force in Plano.
What is the Unemployment Rate in Plano?
Unemployment Rate in Plano is 4.4%.