Houston, TX Map & Demographics
Houston Map
Houston Overview
$38,834
PER CAPITA INCOME
$68,832
AVG FAMILY INCOME
$60,440
AVG HOUSEHOLD INCOME
21.5%
WAGE / INCOME GAP [ % ]
78.5¢/ $1
WAGE / INCOME GAP [ $ ]
$11,809
FAMILY INCOME DEFICIT
0.53
INEQUALITY / GINI INDEX
2,296,253
TOTAL POPULATION
1,142,243
MALE POPULATION
1,154,010
FEMALE POPULATION
98.98
MALES / 100 FEMALES
101.03
FEMALES / 100 MALES
33.9
MEDIAN AGE
3.3
AVG FAMILY SIZE
2.5
AVG HOUSEHOLD SIZE
1,208,614
LABOR FORCE [ PEOPLE ]
66.9%
PERCENT IN LABOR FORCE
6.6%
UNEMPLOYMENT RATE
Houston Zip Codes
Income in Houston
Income Overview in Houston
Per Capita Income in Houston is $38,834, while median incomes of families and households are $68,832 and $60,440 respectively.
| Characteristic | Number | Measure |
| Per Capita Income | 2,296,253 | $38,834 |
| Median Family Income | 530,928 | $68,832 |
| Mean Family Income | 530,928 | $112,797 |
| Median Household Income | 897,510 | $60,440 |
| Mean Household Income | 897,510 | $97,458 |
| Income Deficit | 530,928 | $11,809 |
| Wage / Income Gap (%) | 2,296,253 | 21.49% |
| Wage / Income Gap ($) | 2,296,253 | 78.51¢ per $1 |
| Gini / Inequality Index | 2,296,253 | 0.53 |
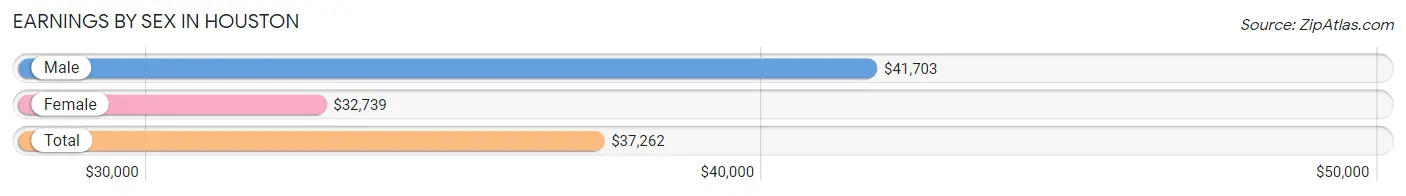
Earnings by Sex in Houston
Average Earnings in Houston are $37,262, $41,703 for men and $32,739 for women, a difference of 21.5%.
| Sex | Number | Average Earnings |
| Male | 679,216 (55.0%) | $41,703 |
| Female | 554,966 (45.0%) | $32,739 |
| Total | 1,234,182 (100.0%) | $37,262 |
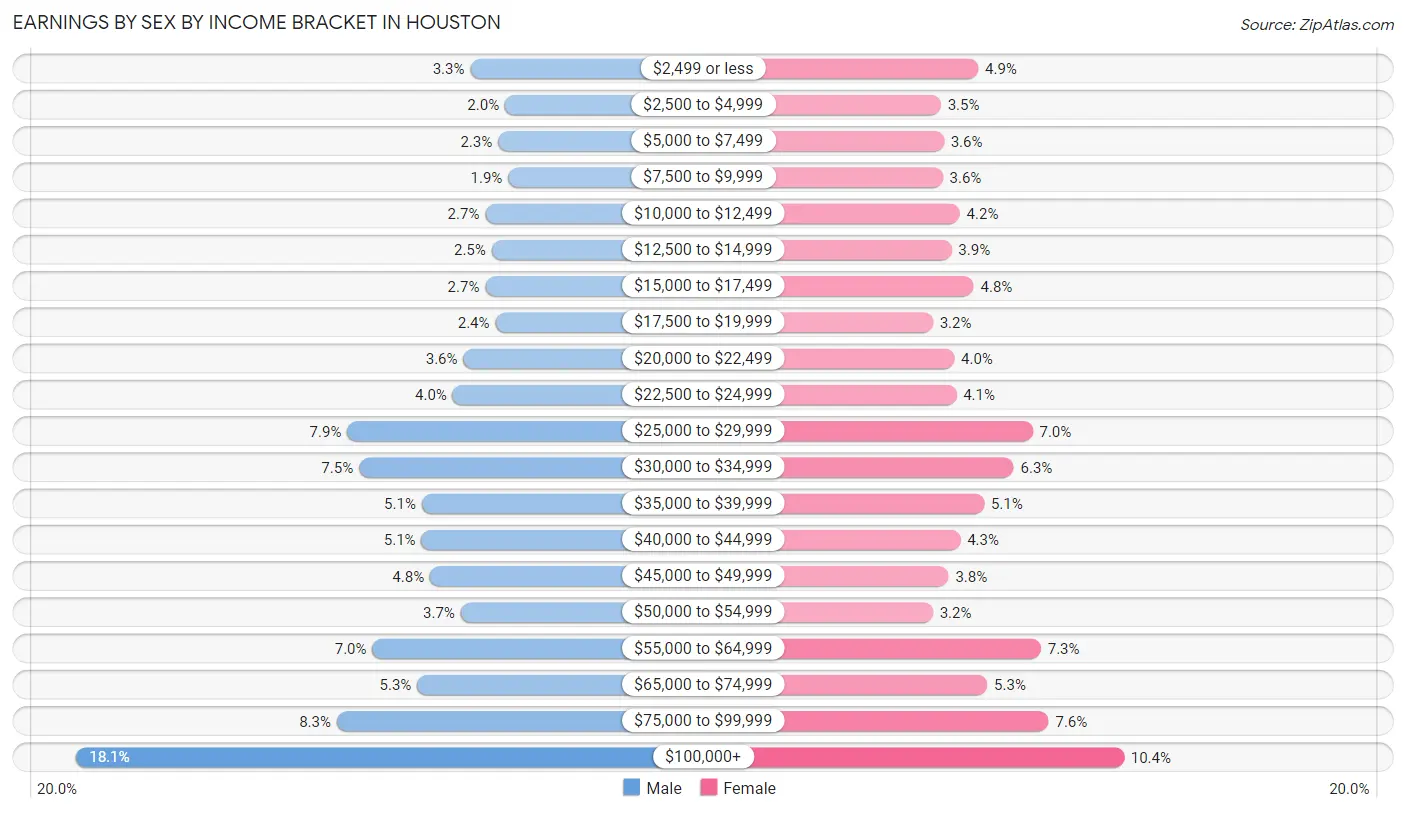
Earnings by Sex by Income Bracket in Houston
The most common earnings brackets in Houston are $100,000+ for men (122,659 | 18.1%) and $100,000+ for women (57,607 | 10.4%).
| Income | Male | Female |
| $2,499 or less | 22,416 (3.3%) | 27,296 (4.9%) |
| $2,500 to $4,999 | 13,551 (2.0%) | 19,550 (3.5%) |
| $5,000 to $7,499 | 15,373 (2.3%) | 20,140 (3.6%) |
| $7,500 to $9,999 | 12,757 (1.9%) | 19,911 (3.6%) |
| $10,000 to $12,499 | 18,604 (2.7%) | 23,480 (4.2%) |
| $12,500 to $14,999 | 16,960 (2.5%) | 21,728 (3.9%) |
| $15,000 to $17,499 | 18,578 (2.7%) | 26,365 (4.8%) |
| $17,500 to $19,999 | 16,013 (2.4%) | 17,875 (3.2%) |
| $20,000 to $22,499 | 24,175 (3.6%) | 22,294 (4.0%) |
| $22,500 to $24,999 | 26,919 (4.0%) | 22,735 (4.1%) |
| $25,000 to $29,999 | 53,733 (7.9%) | 38,646 (7.0%) |
| $30,000 to $34,999 | 50,739 (7.5%) | 34,706 (6.2%) |
| $35,000 to $39,999 | 34,790 (5.1%) | 28,538 (5.1%) |
| $40,000 to $44,999 | 34,847 (5.1%) | 23,560 (4.3%) |
| $45,000 to $49,999 | 32,669 (4.8%) | 21,162 (3.8%) |
| $50,000 to $54,999 | 24,865 (3.7%) | 17,848 (3.2%) |
| $55,000 to $64,999 | 47,318 (7.0%) | 40,336 (7.3%) |
| $65,000 to $74,999 | 35,899 (5.3%) | 29,214 (5.3%) |
| $75,000 to $99,999 | 56,351 (8.3%) | 41,975 (7.6%) |
| $100,000+ | 122,659 (18.1%) | 57,607 (10.4%) |
| Total | 679,216 (100.0%) | 554,966 (100.0%) |
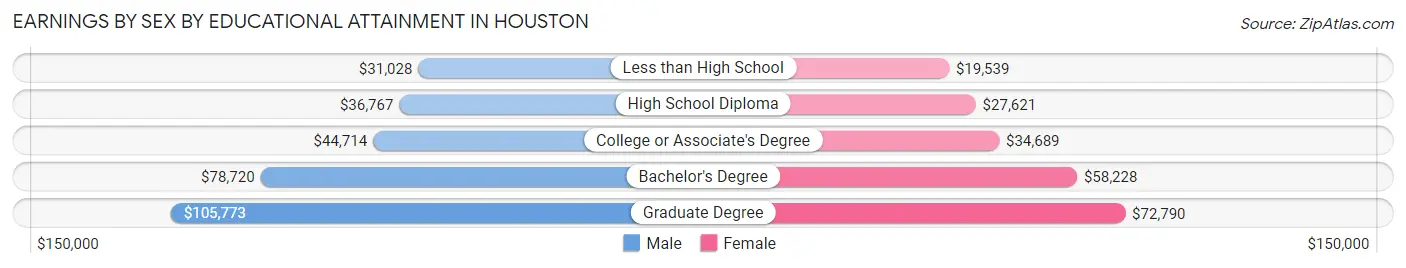
Earnings by Sex by Educational Attainment in Houston
Average earnings in Houston are $46,496 for men and $37,423 for women, a difference of 19.5%. Men with an educational attainment of graduate degree enjoy the highest average annual earnings of $105,773, while those with less than high school education earn the least with $31,028. Women with an educational attainment of graduate degree earn the most with the average annual earnings of $72,790, while those with less than high school education have the smallest earnings of $19,539.
| Educational Attainment | Male Income | Female Income |
| Less than High School | $31,028 | $19,539 |
| High School Diploma | $36,767 | $27,621 |
| College or Associate's Degree | $44,714 | $34,689 |
| Bachelor's Degree | $78,720 | $58,228 |
| Graduate Degree | $105,773 | $72,790 |
| Total | $46,496 | $37,423 |
Family Income in Houston
Family Income Brackets in Houston
According to the Houston family income data, there are 87,072 families falling into the $50,000 to $74,999 income range, which is the most common income bracket and makes up 16.4% of all families. Conversely, the $10,000 to $14,999 income bracket is the least frequent group with only 15,928 families (3.0%) belonging to this category.
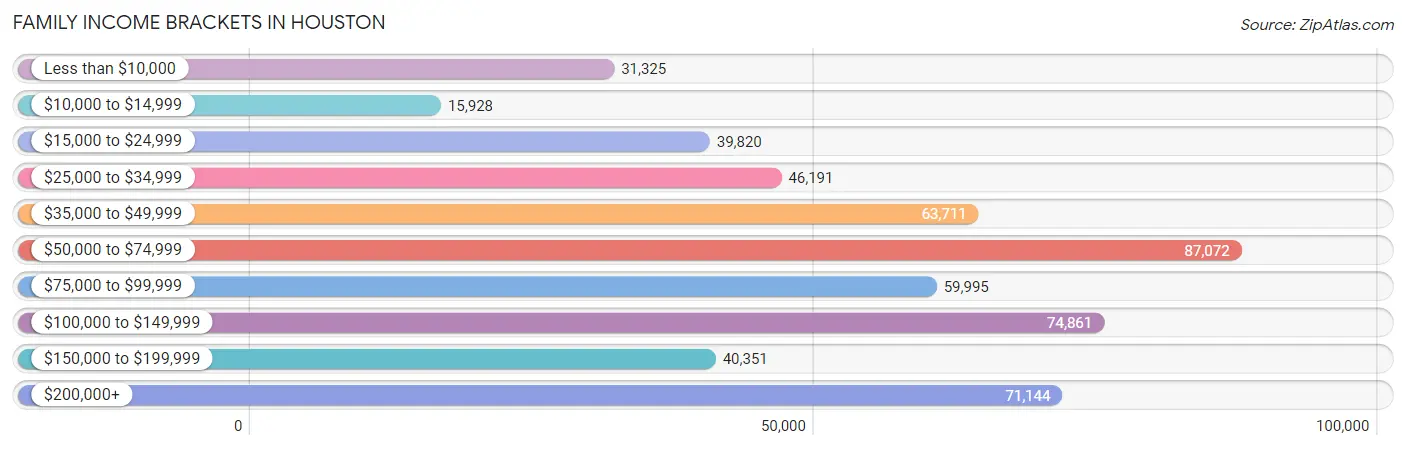
| Income Bracket | # Families | % Families |
| Less than $10,000 | 31,325 | 5.9% |
| $10,000 to $14,999 | 15,928 | 3.0% |
| $15,000 to $24,999 | 39,820 | 7.5% |
| $25,000 to $34,999 | 46,191 | 8.7% |
| $35,000 to $49,999 | 63,711 | 12.0% |
| $50,000 to $74,999 | 87,072 | 16.4% |
| $75,000 to $99,999 | 59,995 | 11.3% |
| $100,000 to $149,999 | 74,861 | 14.1% |
| $150,000 to $199,999 | 40,351 | 7.6% |
| $200,000+ | 71,144 | 13.4% |
Family Income by Famaliy Size in Houston
7+ person families (11,028 | 2.1%) account for the highest median family income in Houston with $77,882 per family, while 2-person families (224,621 | 42.3%) have the highest median income of $33,584 per family member.
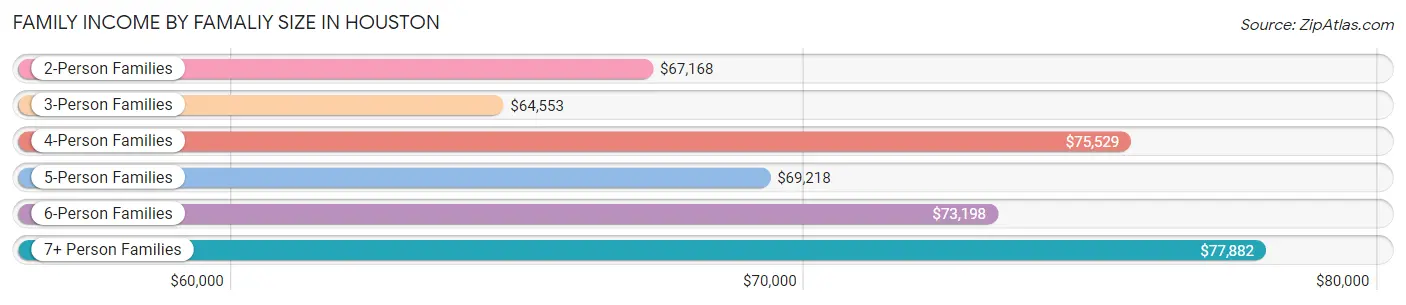
| Income Bracket | # Families | Median Income |
| 2-Person Families | 224,621 (42.3%) | $67,168 |
| 3-Person Families | 129,653 (24.4%) | $64,553 |
| 4-Person Families | 98,252 (18.5%) | $75,529 |
| 5-Person Families | 48,670 (9.2%) | $69,218 |
| 6-Person Families | 18,704 (3.5%) | $73,198 |
| 7+ Person Families | 11,028 (2.1%) | $77,882 |
| Total | 530,928 (100.0%) | $68,832 |
Family Income by Number of Earners in Houston
The median family income in Houston is $68,832, with families comprising 3+ earners (57,846) having the highest median family income of $109,755, while families with no earners (60,529) have the lowest median family income of $23,236, accounting for 10.9% and 11.4% of families, respectively.
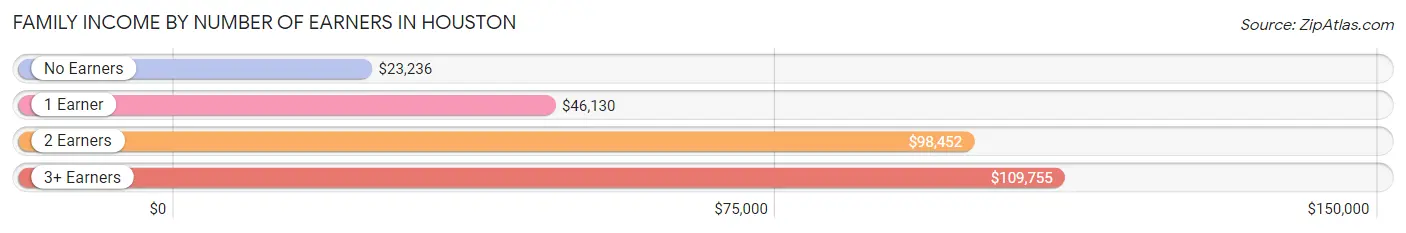
| Number of Earners | # Families | Median Income |
| No Earners | 60,529 (11.4%) | $23,236 |
| 1 Earner | 202,996 (38.2%) | $46,130 |
| 2 Earners | 209,557 (39.5%) | $98,452 |
| 3+ Earners | 57,846 (10.9%) | $109,755 |
| Total | 530,928 (100.0%) | $68,832 |
Household Income in Houston
Household Income Brackets in Houston
With 156,167 households falling in the category, the $50,000 to $74,999 income range is the most frequent in Houston, accounting for 17.4% of all households. In contrast, only 39,490 households (4.4%) fall into the $10,000 to $14,999 income bracket, making it the least populous group.
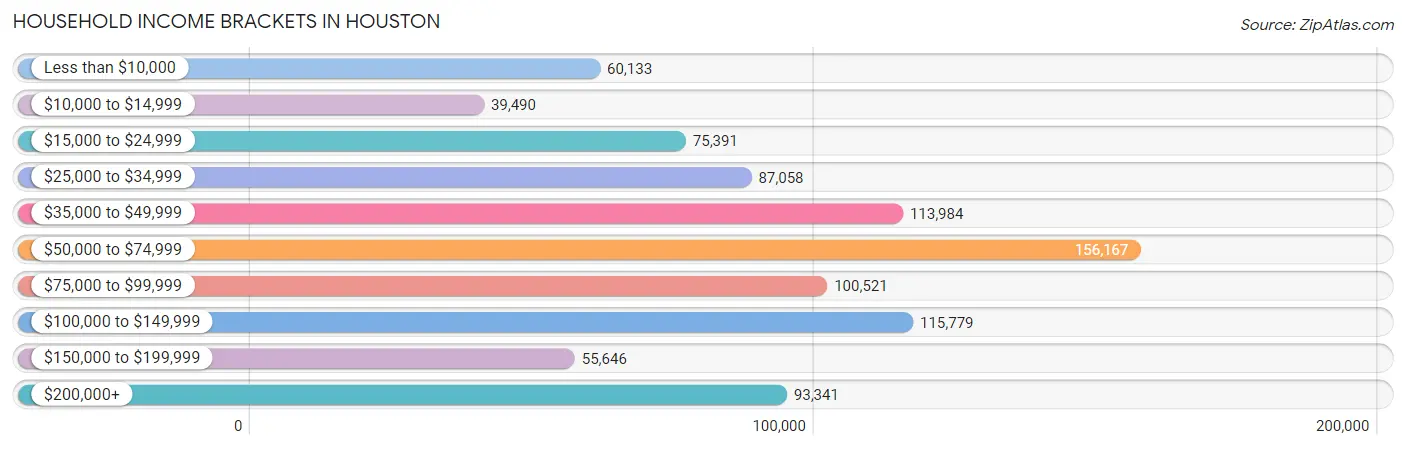
| Income Bracket | # Households | % Households |
| Less than $10,000 | 60,133 | 6.7% |
| $10,000 to $14,999 | 39,490 | 4.4% |
| $15,000 to $24,999 | 75,391 | 8.4% |
| $25,000 to $34,999 | 87,058 | 9.7% |
| $35,000 to $49,999 | 113,984 | 12.7% |
| $50,000 to $74,999 | 156,167 | 17.4% |
| $75,000 to $99,999 | 100,521 | 11.2% |
| $100,000 to $149,999 | 115,779 | 12.9% |
| $150,000 to $199,999 | 55,646 | 6.2% |
| $200,000+ | 93,341 | 10.4% |
Household Income by Householder Age in Houston
The median household income in Houston is $60,440, with the highest median household income of $68,709 found in the 45 to 64 years age bracket for the primary householder. A total of 295,098 households (32.9%) fall into this category. Meanwhile, the 15 to 24 years age bracket for the primary householder has the lowest median household income of $35,703, with 51,177 households (5.7%) in this group.
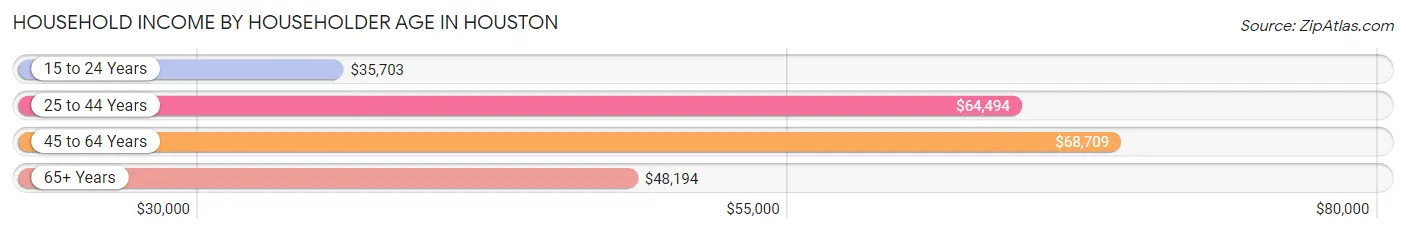
| Income Bracket | # Households | Median Income |
| 15 to 24 Years | 51,177 (5.7%) | $35,703 |
| 25 to 44 Years | 380,347 (42.4%) | $64,494 |
| 45 to 64 Years | 295,098 (32.9%) | $68,709 |
| 65+ Years | 170,888 (19.0%) | $48,194 |
| Total | 897,510 (100.0%) | $60,440 |
Poverty in Houston
Income Below Poverty by Sex and Age in Houston
With 17.5% poverty level for males and 21.6% for females among the residents of Houston, 5 year old males and 5 year old females are the most vulnerable to poverty, with 5,588 males (36.2%) and 5,222 females (32.7%) in their respective age groups living below the poverty level.
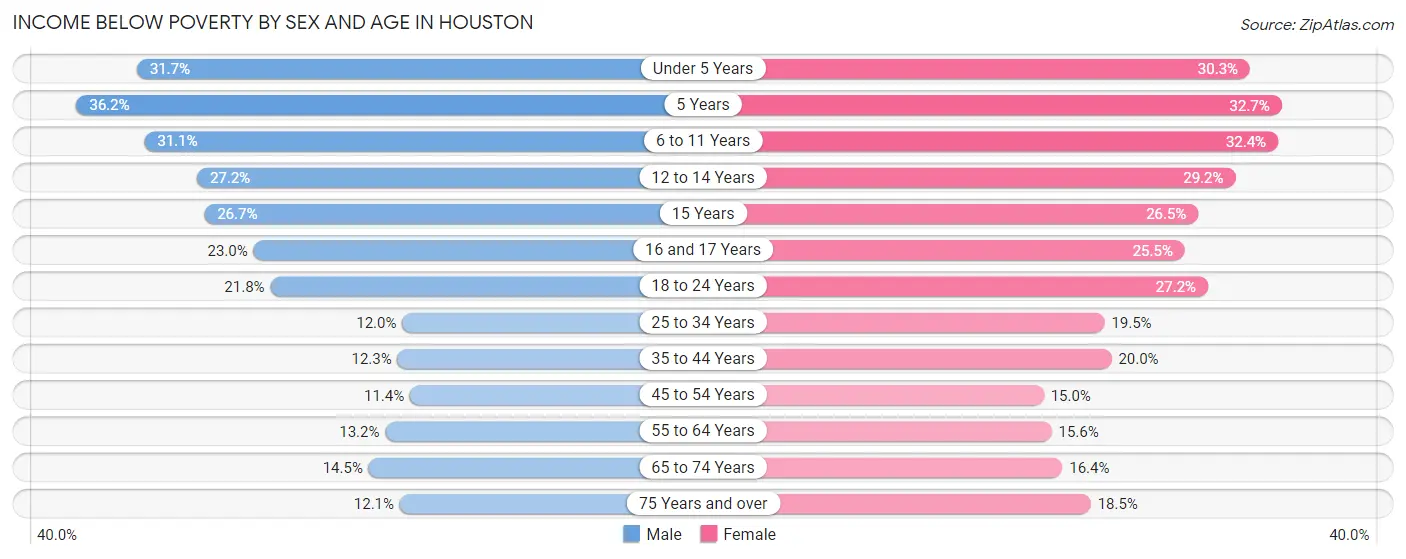
| Age Bracket | Male | Female |
| Under 5 Years | 24,703 (31.7%) | 23,553 (30.3%) |
| 5 Years | 5,588 (36.2%) | 5,222 (32.7%) |
| 6 to 11 Years | 28,150 (31.1%) | 28,701 (32.4%) |
| 12 to 14 Years | 11,605 (27.2%) | 13,089 (29.2%) |
| 15 Years | 4,038 (26.7%) | 3,921 (26.5%) |
| 16 and 17 Years | 6,879 (23.0%) | 7,549 (25.5%) |
| 18 to 24 Years | 23,568 (21.7%) | 30,314 (27.2%) |
| 25 to 34 Years | 24,536 (12.0%) | 38,872 (19.5%) |
| 35 to 44 Years | 20,884 (12.3%) | 31,494 (20.0%) |
| 45 to 54 Years | 15,420 (11.4%) | 19,673 (15.0%) |
| 55 to 64 Years | 15,477 (13.2%) | 18,827 (15.6%) |
| 65 to 74 Years | 10,543 (14.4%) | 13,873 (16.4%) |
| 75 Years and over | 5,058 (12.1%) | 11,464 (18.5%) |
| Total | 196,449 (17.5%) | 246,552 (21.6%) |
Income Above Poverty by Sex and Age in Houston
According to the poverty statistics in Houston, males aged 45 to 54 years and females aged 45 to 54 years are the age groups that are most secure financially, with 88.6% of males and 85.0% of females in these age groups living above the poverty line.
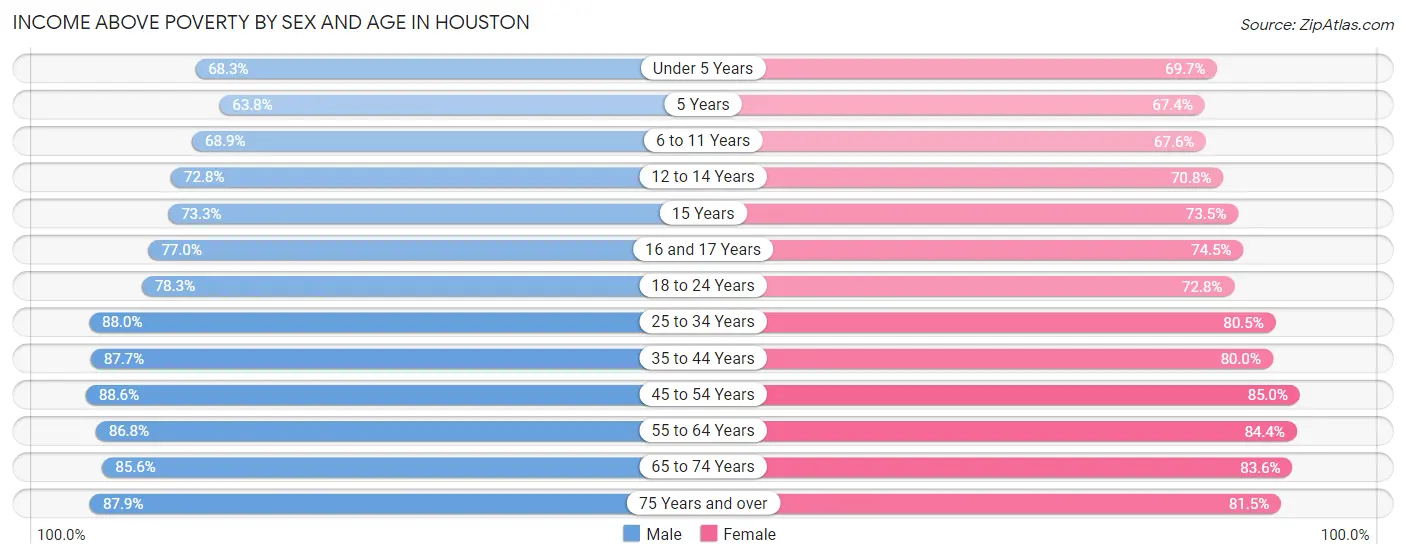
| Age Bracket | Male | Female |
| Under 5 Years | 53,286 (68.3%) | 54,171 (69.7%) |
| 5 Years | 9,866 (63.8%) | 10,771 (67.3%) |
| 6 to 11 Years | 62,339 (68.9%) | 59,936 (67.6%) |
| 12 to 14 Years | 31,060 (72.8%) | 31,724 (70.8%) |
| 15 Years | 11,107 (73.3%) | 10,900 (73.5%) |
| 16 and 17 Years | 23,029 (77.0%) | 22,101 (74.5%) |
| 18 to 24 Years | 84,815 (78.2%) | 81,225 (72.8%) |
| 25 to 34 Years | 180,563 (88.0%) | 160,505 (80.5%) |
| 35 to 44 Years | 148,759 (87.7%) | 125,827 (80.0%) |
| 45 to 54 Years | 120,028 (88.6%) | 111,601 (85.0%) |
| 55 to 64 Years | 101,556 (86.8%) | 102,130 (84.4%) |
| 65 to 74 Years | 62,425 (85.6%) | 70,852 (83.6%) |
| 75 Years and over | 36,593 (87.9%) | 50,586 (81.5%) |
| Total | 925,426 (82.5%) | 892,329 (78.3%) |
Income Below Poverty Among Married-Couple Families in Houston
The poverty statistics for married-couple families in Houston show that 9.3% or 30,599 of the total 328,732 families live below the poverty line. Families with 5 or more children have the highest poverty rate of 44.3%, comprising of 1,302 families. On the other hand, families with no children have the lowest poverty rate of 6.1%, which includes 10,700 families.
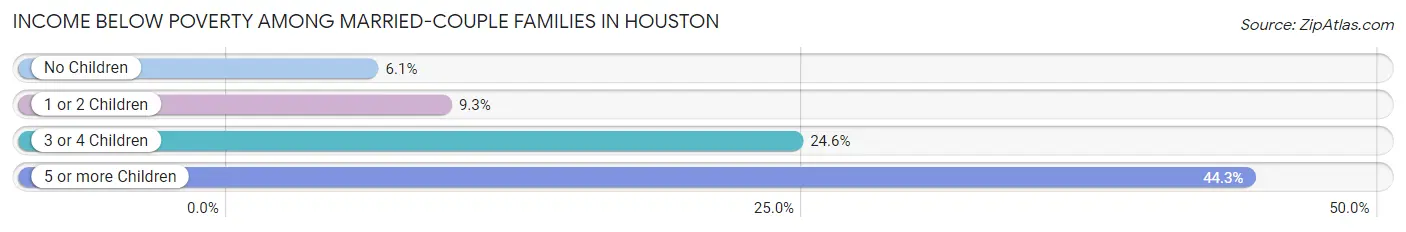
| Children | Above Poverty | Below Poverty |
| No Children | 164,249 (93.9%) | 10,700 (6.1%) |
| 1 or 2 Children | 109,765 (90.7%) | 11,264 (9.3%) |
| 3 or 4 Children | 22,480 (75.4%) | 7,333 (24.6%) |
| 5 or more Children | 1,639 (55.7%) | 1,302 (44.3%) |
| Total | 298,133 (90.7%) | 30,599 (9.3%) |
Income Below Poverty Among Single-Parent Households in Houston
According to the poverty data in Houston, 14.9% or 8,884 single-father households and 33.1% or 47,223 single-mother households are living below the poverty line. Among single-father households, those with 5 or more children have the highest poverty rate, with 267 households (82.9%) experiencing poverty. Likewise, among single-mother households, those with 5 or more children have the highest poverty rate, with 1,584 households (82.0%) falling below the poverty line.
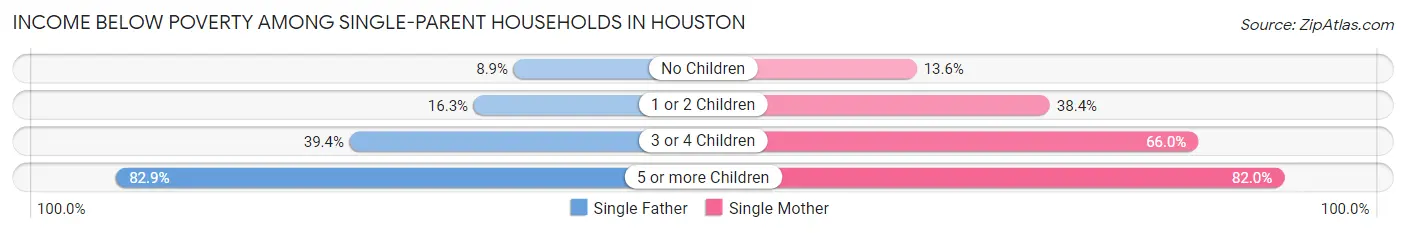
| Children | Single Father | Single Mother |
| No Children | 2,640 (8.9%) | 7,021 (13.6%) |
| 1 or 2 Children | 3,956 (16.3%) | 28,178 (38.4%) |
| 3 or 4 Children | 2,021 (39.4%) | 10,440 (66.0%) |
| 5 or more Children | 267 (82.9%) | 1,584 (82.0%) |
| Total | 8,884 (14.9%) | 47,223 (33.1%) |
Income Below Poverty Among Married-Couple vs Single-Parent Households in Houston
The poverty data for Houston shows that 30,599 of the married-couple family households (9.3%) and 56,107 of the single-parent households (27.8%) are living below the poverty level. Within the married-couple family households, those with 5 or more children have the highest poverty rate, with 1,302 households (44.3%) falling below the poverty line. Among the single-parent households, those with 5 or more children have the highest poverty rate, with 1,851 household (82.2%) living below poverty.
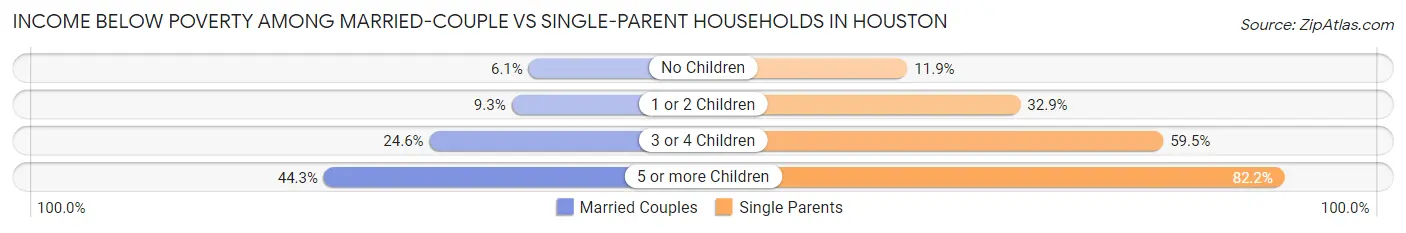
| Children | Married-Couple Families | Single-Parent Households |
| No Children | 10,700 (6.1%) | 9,661 (11.9%) |
| 1 or 2 Children | 11,264 (9.3%) | 32,134 (32.9%) |
| 3 or 4 Children | 7,333 (24.6%) | 12,461 (59.5%) |
| 5 or more Children | 1,302 (44.3%) | 1,851 (82.2%) |
| Total | 30,599 (9.3%) | 56,107 (27.8%) |
Race in Houston
The most populous races in Houston are Hispanic or Latino (1,029,429 | 44.8%), White / Caucasian (937,232 | 40.8%), and Black / African American (514,692 | 22.4%).
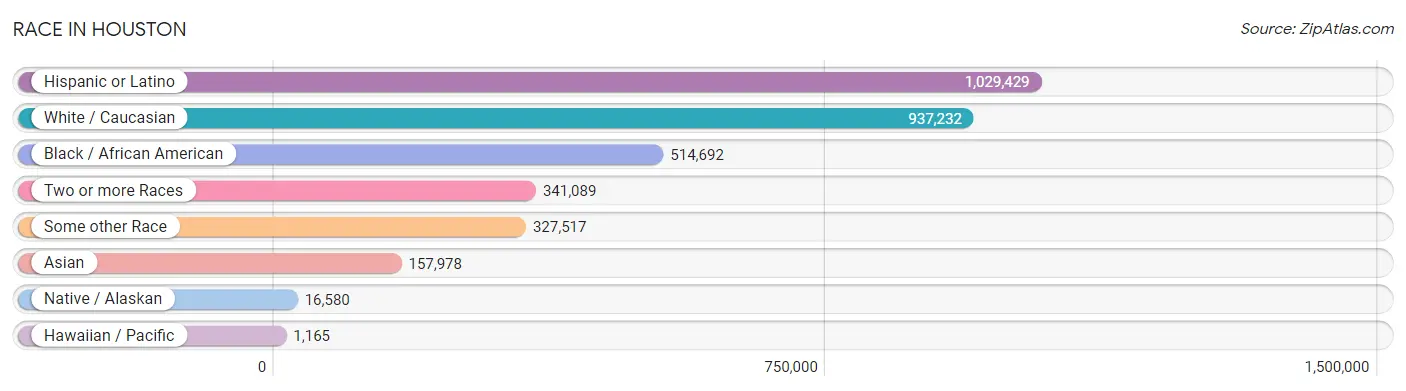
| Race | # Population | % Population |
| Asian | 157,978 | 6.9% |
| Black / African American | 514,692 | 22.4% |
| Hawaiian / Pacific | 1,165 | 0.1% |
| Hispanic or Latino | 1,029,429 | 44.8% |
| Native / Alaskan | 16,580 | 0.7% |
| White / Caucasian | 937,232 | 40.8% |
| Two or more Races | 341,089 | 14.8% |
| Some other Race | 327,517 | 14.3% |
| Total | 2,296,253 | 100.0% |
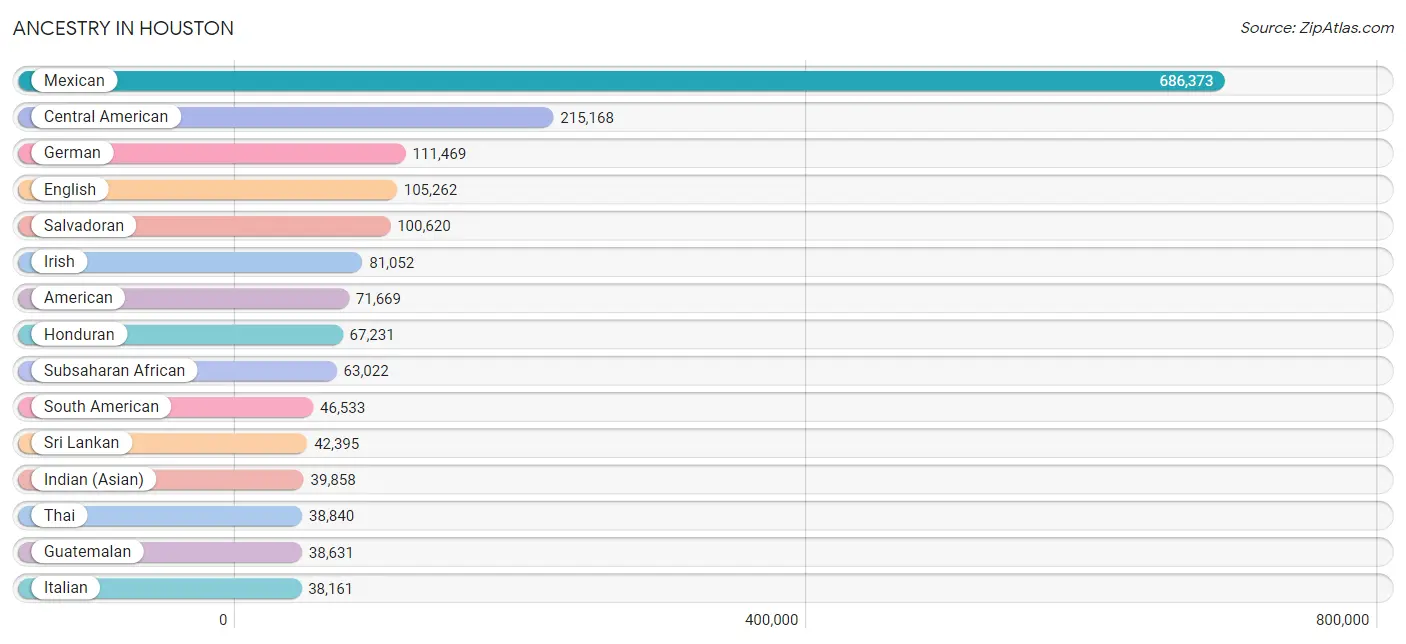
Ancestry in Houston
The most populous ancestries reported in Houston are Mexican (686,373 | 29.9%), Central American (215,168 | 9.4%), German (111,469 | 4.9%), English (105,262 | 4.6%), and Salvadoran (100,620 | 4.4%), together accounting for 53.1% of all Houston residents.
| Ancestry | # Population | % Population |
| Afghan | 2,534 | 0.1% |
| African | 26,807 | 1.2% |
| Alaska Native | 79 | 0.0% |
| Alaskan Athabascan | 63 | 0.0% |
| Albanian | 366 | 0.0% |
| Aleut | 32 | 0.0% |
| Alsatian | 48 | 0.0% |
| American | 71,669 | 3.1% |
| Apache | 898 | 0.0% |
| Arab | 23,194 | 1.0% |
| Arapaho | 7 | 0.0% |
| Argentinean | 3,017 | 0.1% |
| Armenian | 932 | 0.0% |
| Assyrian / Chaldean / Syriac | 20 | 0.0% |
| Australian | 895 | 0.0% |
| Austrian | 2,157 | 0.1% |
| Bahamian | 794 | 0.0% |
| Bangladeshi | 16 | 0.0% |
| Barbadian | 253 | 0.0% |
| Basque | 186 | 0.0% |
| Belgian | 1,039 | 0.1% |
| Belizean | 760 | 0.0% |
| Bermudan | 19 | 0.0% |
| Bhutanese | 6,096 | 0.3% |
| Blackfeet | 467 | 0.0% |
| Bolivian | 1,136 | 0.1% |
| Brazilian | 2,264 | 0.1% |
| British | 9,284 | 0.4% |
| British West Indian | 542 | 0.0% |
| Bulgarian | 273 | 0.0% |
| Burmese | 9,722 | 0.4% |
| Cajun | 720 | 0.0% |
| Cambodian | 26 | 0.0% |
| Canadian | 2,054 | 0.1% |
| Cape Verdean | 59 | 0.0% |
| Celtic | 219 | 0.0% |
| Central American | 215,168 | 9.4% |
| Central American Indian | 5,012 | 0.2% |
| Cherokee | 4,188 | 0.2% |
| Cheyenne | 15 | 0.0% |
| Chickasaw | 497 | 0.0% |
| Chilean | 1,086 | 0.1% |
| Chippewa | 286 | 0.0% |
| Choctaw | 1,853 | 0.1% |
| Colombian | 15,280 | 0.7% |
| Comanche | 220 | 0.0% |
| Costa Rican | 970 | 0.0% |
| Creek | 478 | 0.0% |
| Croatian | 1,185 | 0.1% |
| Cuban | 16,481 | 0.7% |
| Cypriot | 30 | 0.0% |
| Czech | 9,341 | 0.4% |
| Czechoslovakian | 956 | 0.0% |
| Danish | 3,203 | 0.1% |
| Delaware | 84 | 0.0% |
| Dominican | 3,566 | 0.2% |
| Dutch | 9,072 | 0.4% |
| Dutch West Indian | 179 | 0.0% |
| Eastern European | 2,506 | 0.1% |
| Ecuadorian | 3,931 | 0.2% |
| Egyptian | 3,405 | 0.2% |
| English | 105,262 | 4.6% |
| Estonian | 54 | 0.0% |
| Ethiopian | 4,161 | 0.2% |
| European | 24,286 | 1.1% |
| Filipino | 3,032 | 0.1% |
| Finnish | 1,054 | 0.1% |
| French | 32,725 | 1.4% |
| French American Indian | 27 | 0.0% |
| French Canadian | 4,557 | 0.2% |
| German | 111,469 | 4.9% |
| German Russian | 4 | 0.0% |
| Ghanaian | 1,727 | 0.1% |
| Greek | 3,772 | 0.2% |
| Guamanian / Chamorro | 886 | 0.0% |
| Guatemalan | 38,631 | 1.7% |
| Guyanese | 397 | 0.0% |
| Haitian | 1,747 | 0.1% |
| Honduran | 67,231 | 2.9% |
| Hopi | 17 | 0.0% |
| Houma | 49 | 0.0% |
| Hungarian | 2,159 | 0.1% |
| Icelander | 169 | 0.0% |
| Indian (Asian) | 39,858 | 1.7% |
| Indonesian | 1,344 | 0.1% |
| Inupiat | 97 | 0.0% |
| Iranian | 6,667 | 0.3% |
| Iraqi | 3,753 | 0.2% |
| Irish | 81,052 | 3.5% |
| Iroquois | 171 | 0.0% |
| Israeli | 902 | 0.0% |
| Italian | 38,161 | 1.7% |
| Jamaican | 4,872 | 0.2% |
| Japanese | 1,727 | 0.1% |
| Jordanian | 1,543 | 0.1% |
| Kenyan | 538 | 0.0% |
| Kiowa | 40 | 0.0% |
| Korean | 15,419 | 0.7% |
| Laotian | 1,070 | 0.1% |
| Latvian | 277 | 0.0% |
| Lebanese | 4,393 | 0.2% |
| Liberian | 307 | 0.0% |
| Lithuanian | 1,066 | 0.1% |
| Lumbee | 6 | 0.0% |
| Luxembourger | 35 | 0.0% |
| Macedonian | 743 | 0.0% |
| Malaysian | 634 | 0.0% |
| Maltese | 23 | 0.0% |
| Marshallese | 8 | 0.0% |
| Mexican | 686,373 | 29.9% |
| Mexican American Indian | 6,906 | 0.3% |
| Mongolian | 476 | 0.0% |
| Moroccan | 960 | 0.0% |
| Native Hawaiian | 1,275 | 0.1% |
| Navajo | 446 | 0.0% |
| New Zealander | 204 | 0.0% |
| Nicaraguan | 5,715 | 0.3% |
| Nigerian | 21,167 | 0.9% |
| Northern European | 1,510 | 0.1% |
| Norwegian | 6,658 | 0.3% |
| Okinawan | 141 | 0.0% |
| Osage | 230 | 0.0% |
| Pakistani | 1,771 | 0.1% |
| Palestinian | 2,134 | 0.1% |
| Panamanian | 1,621 | 0.1% |
| Paraguayan | 91 | 0.0% |
| Pennsylvania German | 146 | 0.0% |
| Peruvian | 3,571 | 0.2% |
| Pima | 6 | 0.0% |
| Polish | 21,289 | 0.9% |
| Portuguese | 2,840 | 0.1% |
| Potawatomi | 82 | 0.0% |
| Pueblo | 99 | 0.0% |
| Puerto Rican | 17,709 | 0.8% |
| Romanian | 1,378 | 0.1% |
| Russian | 7,719 | 0.3% |
| Salvadoran | 100,620 | 4.4% |
| Samoan | 364 | 0.0% |
| Scandinavian | 2,735 | 0.1% |
| Scotch-Irish | 12,557 | 0.5% |
| Scottish | 19,777 | 0.9% |
| Seminole | 56 | 0.0% |
| Senegalese | 177 | 0.0% |
| Serbian | 1,520 | 0.1% |
| Sierra Leonean | 580 | 0.0% |
| Sioux | 175 | 0.0% |
| Slavic | 482 | 0.0% |
| Slovak | 1,171 | 0.1% |
| Slovene | 358 | 0.0% |
| Somali | 129 | 0.0% |
| South African | 1,010 | 0.0% |
| South American | 46,533 | 2.0% |
| South American Indian | 464 | 0.0% |
| Soviet Union | 139 | 0.0% |
| Spaniard | 6,389 | 0.3% |
| Spanish | 4,257 | 0.2% |
| Spanish American | 520 | 0.0% |
| Spanish American Indian | 43 | 0.0% |
| Sri Lankan | 42,395 | 1.8% |
| Subsaharan African | 63,022 | 2.7% |
| Sudanese | 591 | 0.0% |
| Swedish | 7,427 | 0.3% |
| Swiss | 2,124 | 0.1% |
| Syrian | 2,135 | 0.1% |
| Thai | 38,840 | 1.7% |
| Tohono O'Odham | 108 | 0.0% |
| Tongan | 2 | 0.0% |
| Trinidadian and Tobagonian | 1,243 | 0.1% |
| Turkish | 2,254 | 0.1% |
| U.S. Virgin Islander | 259 | 0.0% |
| Ugandan | 148 | 0.0% |
| Ukrainian | 2,535 | 0.1% |
| Uruguayan | 555 | 0.0% |
| Ute | 10 | 0.0% |
| Venezuelan | 17,733 | 0.8% |
| Vietnamese | 1,412 | 0.1% |
| Welsh | 5,253 | 0.2% |
| West Indian | 1,612 | 0.1% |
| Yaqui | 78 | 0.0% |
| Yugoslavian | 781 | 0.0% |
| Yup'ik | 17 | 0.0% | View All 181 Rows |
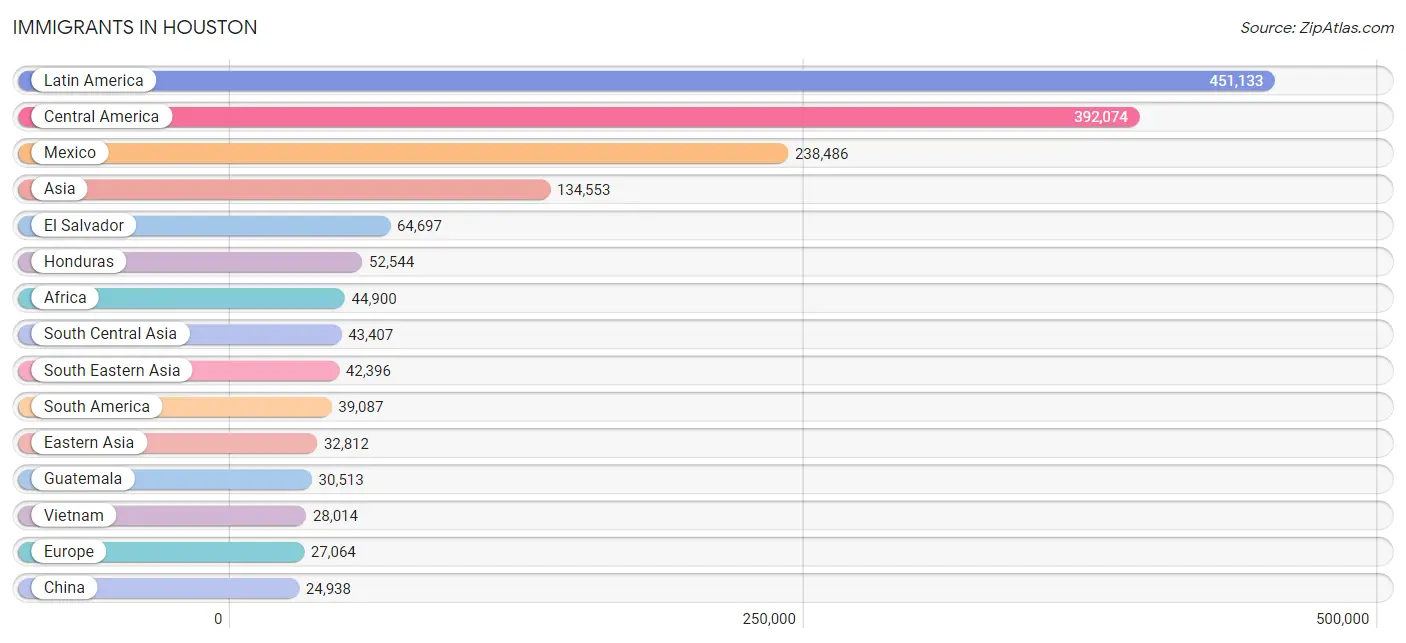
Immigrants in Houston
The most numerous immigrant groups reported in Houston came from Latin America (451,133 | 19.7%), Central America (392,074 | 17.1%), Mexico (238,486 | 10.4%), Asia (134,553 | 5.9%), and El Salvador (64,697 | 2.8%), together accounting for 55.8% of all Houston residents.
| Immigration Origin | # Population | % Population |
| Afghanistan | 2,277 | 0.1% |
| Africa | 44,900 | 2.0% |
| Albania | 157 | 0.0% |
| Argentina | 2,040 | 0.1% |
| Armenia | 160 | 0.0% |
| Asia | 134,553 | 5.9% |
| Australia | 1,392 | 0.1% |
| Austria | 209 | 0.0% |
| Bahamas | 446 | 0.0% |
| Bangladesh | 1,554 | 0.1% |
| Barbados | 67 | 0.0% |
| Belarus | 168 | 0.0% |
| Belgium | 165 | 0.0% |
| Belize | 608 | 0.0% |
| Bolivia | 889 | 0.0% |
| Bosnia and Herzegovina | 765 | 0.0% |
| Brazil | 2,970 | 0.1% |
| Bulgaria | 271 | 0.0% |
| Cabo Verde | 18 | 0.0% |
| Cambodia | 647 | 0.0% |
| Cameroon | 3,091 | 0.1% |
| Canada | 5,042 | 0.2% |
| Caribbean | 19,972 | 0.9% |
| Central America | 392,074 | 17.1% |
| Chile | 597 | 0.0% |
| China | 24,938 | 1.1% |
| Colombia | 10,912 | 0.5% |
| Congo | 471 | 0.0% |
| Costa Rica | 565 | 0.0% |
| Croatia | 217 | 0.0% |
| Cuba | 11,858 | 0.5% |
| Czechoslovakia | 266 | 0.0% |
| Denmark | 631 | 0.0% |
| Dominica | 236 | 0.0% |
| Dominican Republic | 2,090 | 0.1% |
| Eastern Africa | 9,011 | 0.4% |
| Eastern Asia | 32,812 | 1.4% |
| Eastern Europe | 8,601 | 0.4% |
| Ecuador | 2,644 | 0.1% |
| Egypt | 2,190 | 0.1% |
| El Salvador | 64,697 | 2.8% |
| England | 2,121 | 0.1% |
| Eritrea | 2,514 | 0.1% |
| Ethiopia | 2,964 | 0.1% |
| Europe | 27,064 | 1.2% |
| Fiji | 21 | 0.0% |
| France | 2,308 | 0.1% |
| Germany | 2,753 | 0.1% |
| Ghana | 1,802 | 0.1% |
| Greece | 786 | 0.0% |
| Grenada | 10 | 0.0% |
| Guatemala | 30,513 | 1.3% |
| Guyana | 352 | 0.0% |
| Haiti | 531 | 0.0% |
| Honduras | 52,544 | 2.3% |
| Hong Kong | 1,592 | 0.1% |
| Hungary | 469 | 0.0% |
| India | 23,959 | 1.0% |
| Indonesia | 1,119 | 0.1% |
| Iran | 5,634 | 0.3% |
| Iraq | 4,039 | 0.2% |
| Ireland | 453 | 0.0% |
| Israel | 966 | 0.0% |
| Italy | 1,555 | 0.1% |
| Jamaica | 2,504 | 0.1% |
| Japan | 2,819 | 0.1% |
| Jordan | 1,645 | 0.1% |
| Kazakhstan | 621 | 0.0% |
| Kenya | 1,195 | 0.1% |
| Korea | 5,055 | 0.2% |
| Kuwait | 989 | 0.0% |
| Laos | 296 | 0.0% |
| Latin America | 451,133 | 19.7% |
| Latvia | 99 | 0.0% |
| Lebanon | 1,821 | 0.1% |
| Liberia | 464 | 0.0% |
| Lithuania | 43 | 0.0% |
| Malaysia | 782 | 0.0% |
| Mexico | 238,486 | 10.4% |
| Micronesia | 52 | 0.0% |
| Middle Africa | 5,357 | 0.2% |
| Moldova | 11 | 0.0% |
| Morocco | 761 | 0.0% |
| Nepal | 1,334 | 0.1% |
| Netherlands | 961 | 0.0% |
| Nicaragua | 4,052 | 0.2% |
| Nigeria | 18,159 | 0.8% |
| North Macedonia | 356 | 0.0% |
| Northern Africa | 4,145 | 0.2% |
| Northern Europe | 8,059 | 0.4% |
| Norway | 448 | 0.0% |
| Oceania | 1,749 | 0.1% |
| Pakistan | 6,983 | 0.3% |
| Panama | 585 | 0.0% |
| Peru | 2,064 | 0.1% |
| Philippines | 8,616 | 0.4% |
| Poland | 1,129 | 0.1% |
| Portugal | 157 | 0.0% |
| Romania | 775 | 0.0% |
| Russia | 2,048 | 0.1% |
| Saudi Arabia | 1,250 | 0.1% |
| Scotland | 720 | 0.0% |
| Senegal | 160 | 0.0% |
| Serbia | 485 | 0.0% |
| Sierra Leone | 979 | 0.0% |
| Singapore | 397 | 0.0% |
| Somalia | 236 | 0.0% |
| South Africa | 1,578 | 0.1% |
| South America | 39,087 | 1.7% |
| South Central Asia | 43,407 | 1.9% |
| South Eastern Asia | 42,396 | 1.8% |
| Southern Europe | 3,744 | 0.2% |
| Spain | 1,246 | 0.1% |
| Sri Lanka | 727 | 0.0% |
| St. Vincent and the Grenadines | 10 | 0.0% |
| Sudan | 613 | 0.0% |
| Sweden | 279 | 0.0% |
| Switzerland | 216 | 0.0% |
| Syria | 1,373 | 0.1% |
| Taiwan | 4,210 | 0.2% |
| Thailand | 1,511 | 0.1% |
| Trinidad and Tobago | 1,438 | 0.1% |
| Turkey | 1,483 | 0.1% |
| Uganda | 325 | 0.0% |
| Ukraine | 802 | 0.0% |
| Uruguay | 465 | 0.0% |
| Uzbekistan | 69 | 0.0% |
| Venezuela | 16,008 | 0.7% |
| Vietnam | 28,014 | 1.2% |
| West Indies | 91 | 0.0% |
| Western Africa | 23,403 | 1.0% |
| Western Asia | 15,418 | 0.7% |
| Western Europe | 6,622 | 0.3% |
| Yemen | 62 | 0.0% |
| Zaire | 482 | 0.0% |
| Zimbabwe | 237 | 0.0% | View All 136 Rows |
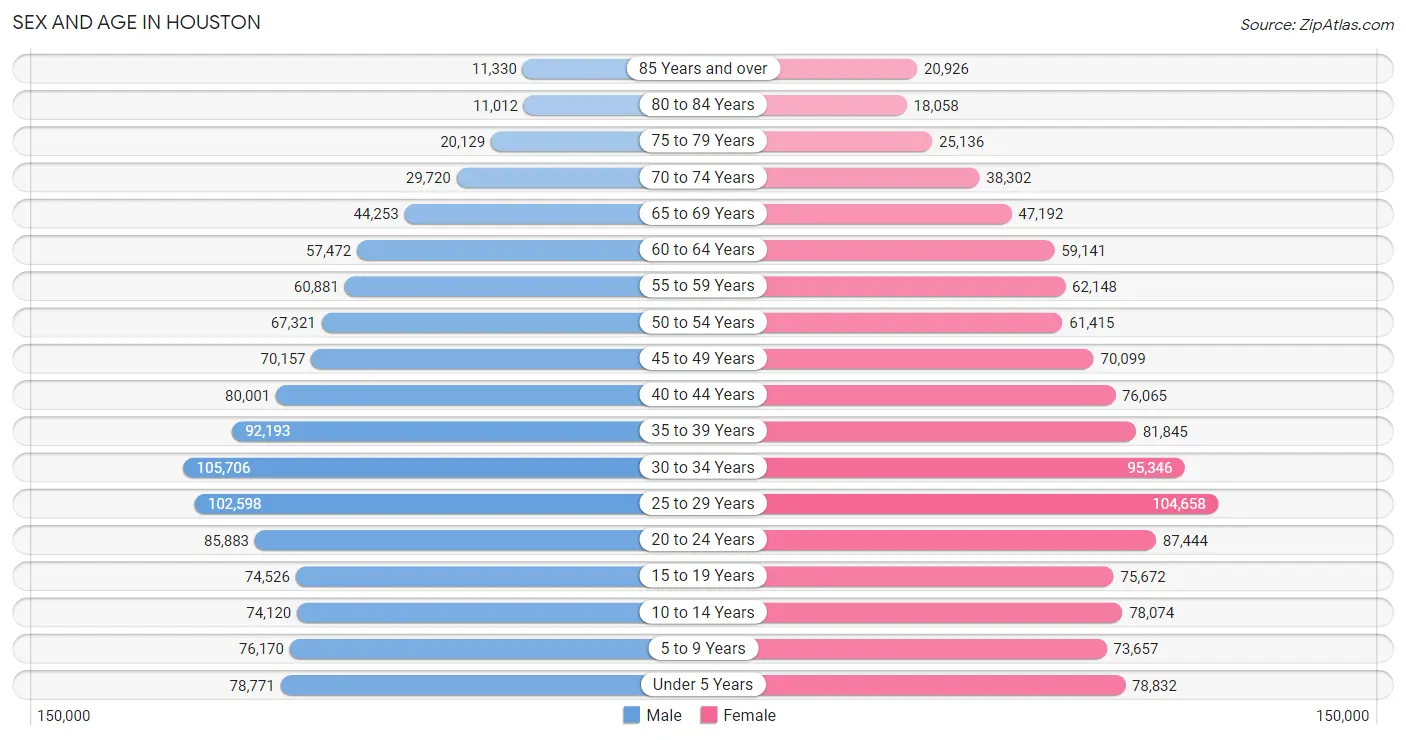
Sex and Age in Houston
Sex and Age in Houston
The most populous age groups in Houston are 30 to 34 Years (105,706 | 9.2%) for men and 25 to 29 Years (104,658 | 9.1%) for women.
| Age Bracket | Male | Female |
| Under 5 Years | 78,771 (6.9%) | 78,832 (6.8%) |
| 5 to 9 Years | 76,170 (6.7%) | 73,657 (6.4%) |
| 10 to 14 Years | 74,120 (6.5%) | 78,074 (6.8%) |
| 15 to 19 Years | 74,526 (6.5%) | 75,672 (6.6%) |
| 20 to 24 Years | 85,883 (7.5%) | 87,444 (7.6%) |
| 25 to 29 Years | 102,598 (9.0%) | 104,658 (9.1%) |
| 30 to 34 Years | 105,706 (9.2%) | 95,346 (8.3%) |
| 35 to 39 Years | 92,193 (8.1%) | 81,845 (7.1%) |
| 40 to 44 Years | 80,001 (7.0%) | 76,065 (6.6%) |
| 45 to 49 Years | 70,157 (6.1%) | 70,099 (6.1%) |
| 50 to 54 Years | 67,321 (5.9%) | 61,415 (5.3%) |
| 55 to 59 Years | 60,881 (5.3%) | 62,148 (5.4%) |
| 60 to 64 Years | 57,472 (5.0%) | 59,141 (5.1%) |
| 65 to 69 Years | 44,253 (3.9%) | 47,192 (4.1%) |
| 70 to 74 Years | 29,720 (2.6%) | 38,302 (3.3%) |
| 75 to 79 Years | 20,129 (1.8%) | 25,136 (2.2%) |
| 80 to 84 Years | 11,012 (1.0%) | 18,058 (1.6%) |
| 85 Years and over | 11,330 (1.0%) | 20,926 (1.8%) |
| Total | 1,142,243 (100.0%) | 1,154,010 (100.0%) |
Families and Households in Houston
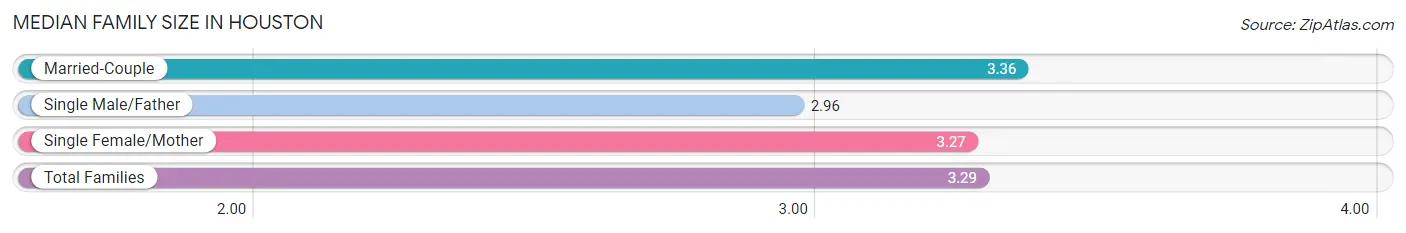
Median Family Size in Houston
The median family size in Houston is 3.29 persons per family, with married-couple families (328,732 | 61.9%) accounting for the largest median family size of 3.36 persons per family. On the other hand, single male/father families (59,472 | 11.2%) represent the smallest median family size with 2.96 persons per family.
| Family Type | # Families | Family Size |
| Married-Couple | 328,732 (61.9%) | 3.36 |
| Single Male/Father | 59,472 (11.2%) | 2.96 |
| Single Female/Mother | 142,724 (26.9%) | 3.27 |
| Total Families | 530,928 (100.0%) | 3.29 |
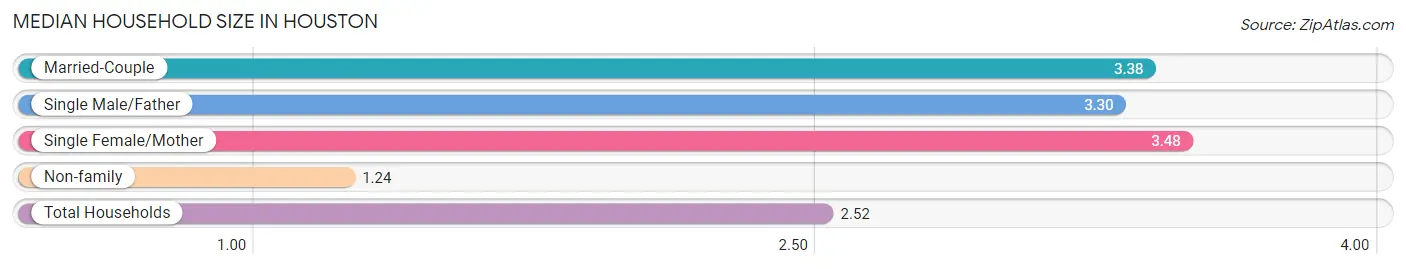
Median Household Size in Houston
The median household size in Houston is 2.52 persons per household, with single female/mother households (142,724 | 15.9%) accounting for the largest median household size of 3.48 persons per household. non-family households (366,582 | 40.8%) represent the smallest median household size with 1.24 persons per household.
| Household Type | # Households | Household Size |
| Married-Couple | 328,732 (36.6%) | 3.38 |
| Single Male/Father | 59,472 (6.6%) | 3.30 |
| Single Female/Mother | 142,724 (15.9%) | 3.48 |
| Non-family | 366,582 (40.8%) | 1.24 |
| Total Households | 897,510 (100.0%) | 2.52 |
Household Size by Marriage Status in Houston
Out of a total of 897,510 households in Houston, 530,928 (59.2%) are family households, while 366,582 (40.8%) are nonfamily households. The most numerous type of family households are 2-person households, comprising 204,893, and the most common type of nonfamily households are 1-person households, comprising 297,823.
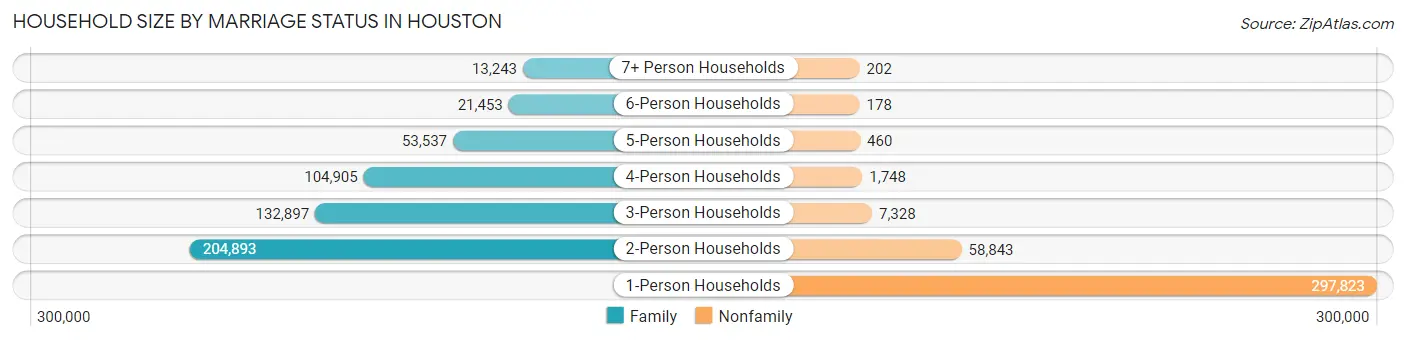
| Household Size | Family Households | Nonfamily Households |
| 1-Person Households | - | 297,823 (33.2%) |
| 2-Person Households | 204,893 (22.8%) | 58,843 (6.6%) |
| 3-Person Households | 132,897 (14.8%) | 7,328 (0.8%) |
| 4-Person Households | 104,905 (11.7%) | 1,748 (0.2%) |
| 5-Person Households | 53,537 (6.0%) | 460 (0.1%) |
| 6-Person Households | 21,453 (2.4%) | 178 (0.0%) |
| 7+ Person Households | 13,243 (1.5%) | 202 (0.0%) |
| Total | 530,928 (59.2%) | 366,582 (40.8%) |
Female Fertility in Houston
Fertility by Age in Houston
Average fertility rate in Houston is 56.0 births per 1,000 women. Women in the age bracket of 20 to 34 years have the highest fertility rate with 83.0 births per 1,000 women. Women in the age bracket of 20 to 34 years acount for 70.1% of all women with births.
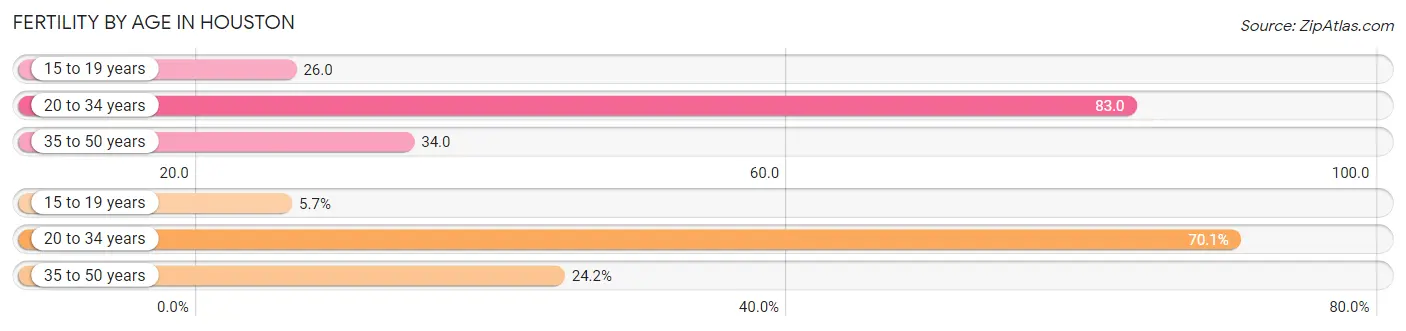
| Age Bracket | Women with Births | Births / 1,000 Women |
| 15 to 19 years | 1,955 (5.7%) | 26.0 |
| 20 to 34 years | 24,000 (70.1%) | 83.0 |
| 35 to 50 years | 8,293 (24.2%) | 34.0 |
| Total | 34,248 (100.0%) | 56.0 |
Fertility by Age by Marriage Status in Houston
61.2% of women with births (34,248) in Houston are married. The highest percentage of unmarried women with births falls into 15 to 19 years age bracket with 87.3% of them unmarried at the time of birth, while the lowest percentage of unmarried women with births belong to 35 to 50 years age bracket with 28.0% of them unmarried.
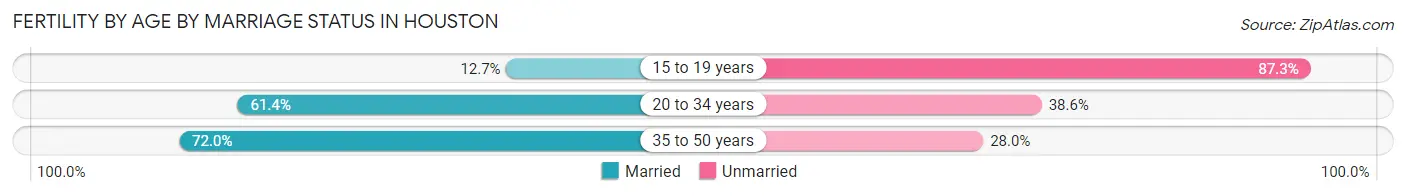
| Age Bracket | Married | Unmarried |
| 15 to 19 years | 248 (12.7%) | 1,707 (87.3%) |
| 20 to 34 years | 14,736 (61.4%) | 9,264 (38.6%) |
| 35 to 50 years | 5,971 (72.0%) | 2,322 (28.0%) |
| Total | 20,960 (61.2%) | 13,288 (38.8%) |
Fertility by Education in Houston
Average fertility rate in Houston is 56.0 births per 1,000 women. Women with the education attainment of high school diploma have the highest fertility rate of 64.0 births per 1,000 women, while women with the education attainment of less than high school have the lowest fertility at 50.0 births per 1,000 women. Women with the education attainment of college or associate's degree represent 24.4% of all women with births.
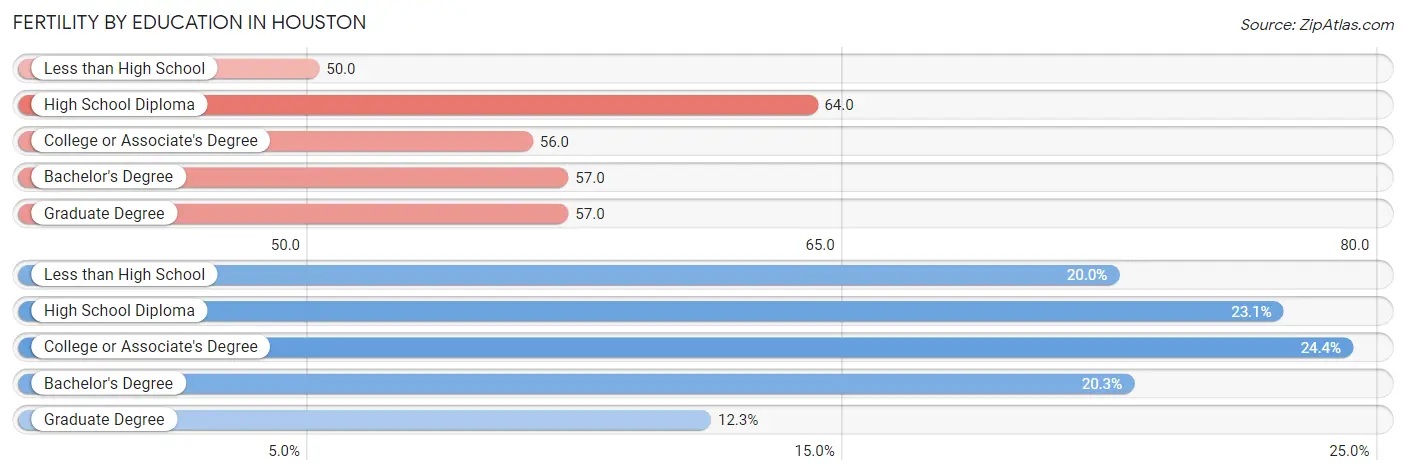
| Educational Attainment | Women with Births | Births / 1,000 Women |
| Less than High School | 6,844 (20.0%) | 50.0 |
| High School Diploma | 7,899 (23.1%) | 64.0 |
| College or Associate's Degree | 8,342 (24.4%) | 56.0 |
| Bachelor's Degree | 6,938 (20.3%) | 57.0 |
| Graduate Degree | 4,225 (12.3%) | 57.0 |
| Total | 34,248 (100.0%) | 56.0 |
Fertility by Education by Marriage Status in Houston
38.8% of women with births in Houston are unmarried. Women with the educational attainment of graduate degree are most likely to be married with 91.1% of them married at childbirth, while women with the educational attainment of college or associate's degree are least likely to be married with 52.8% of them unmarried at childbirth.
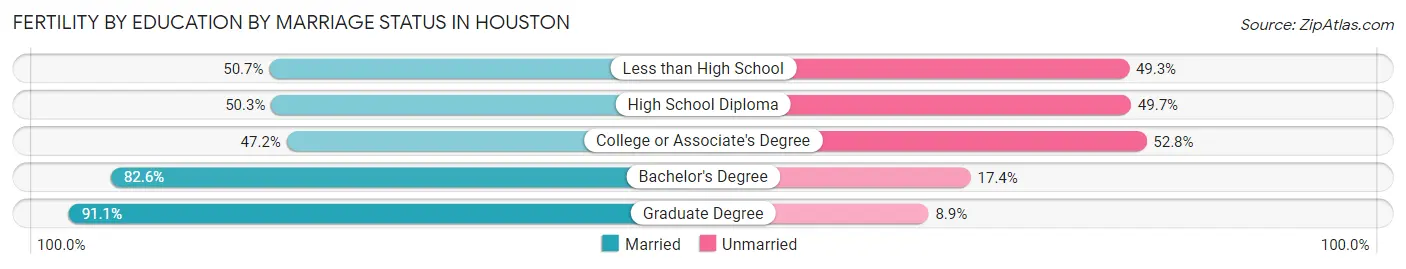
| Educational Attainment | Married | Unmarried |
| Less than High School | 3,470 (50.7%) | 3,374 (49.3%) |
| High School Diploma | 3,973 (50.3%) | 3,926 (49.7%) |
| College or Associate's Degree | 3,937 (47.2%) | 4,405 (52.8%) |
| Bachelor's Degree | 5,731 (82.6%) | 1,207 (17.4%) |
| Graduate Degree | 3,849 (91.1%) | 376 (8.9%) |
| Total | 20,960 (61.2%) | 13,288 (38.8%) |
Employment Characteristics in Houston
Employment by Class of Employer in Houston
Among the 1,105,088 employed individuals in Houston, private company employees (814,835 | 73.7%), self-employed (not incorporated) (71,956 | 6.5%), and not-for-profit organizations (70,313 | 6.4%) make up the most common classes of employment.
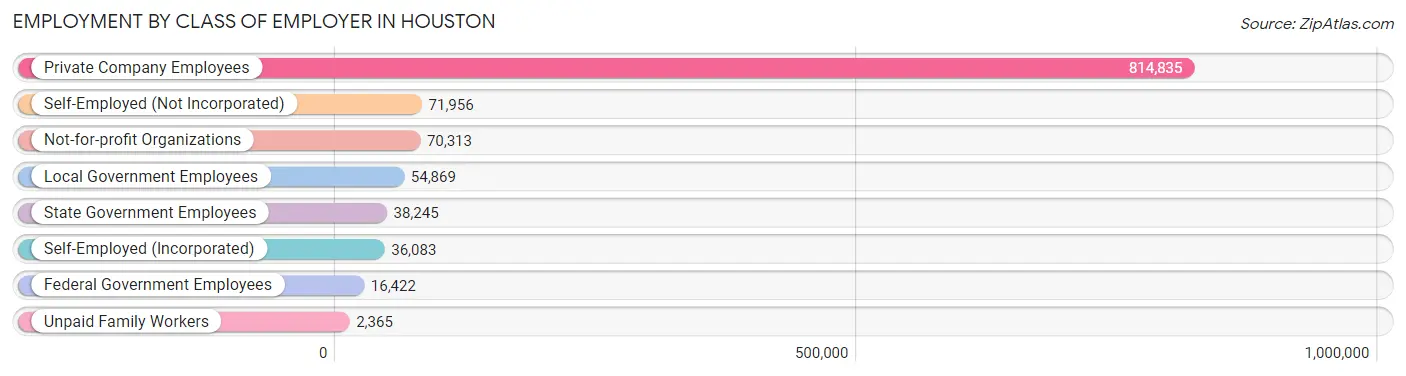
| Employer Class | # Employees | % Employees |
| Private Company Employees | 814,835 | 73.7% |
| Self-Employed (Incorporated) | 36,083 | 3.3% |
| Self-Employed (Not Incorporated) | 71,956 | 6.5% |
| Not-for-profit Organizations | 70,313 | 6.4% |
| Local Government Employees | 54,869 | 5.0% |
| State Government Employees | 38,245 | 3.5% |
| Federal Government Employees | 16,422 | 1.5% |
| Unpaid Family Workers | 2,365 | 0.2% |
| Total | 1,105,088 | 100.0% |
Employment Status by Age in Houston
According to the labor force statistics for Houston, out of the total population over 16 years of age (1,806,598), 66.9% or 1,208,614 individuals are in the labor force, with 6.6% or 79,769 of them unemployed. The age group with the highest labor force participation rate is 30 to 34 years, with 83.5% or 167,878 individuals in the labor force. Within the labor force, the 16 to 19 years age range has the highest percentage of unemployed individuals, with 22.8% or 8,493 of them being unemployed.
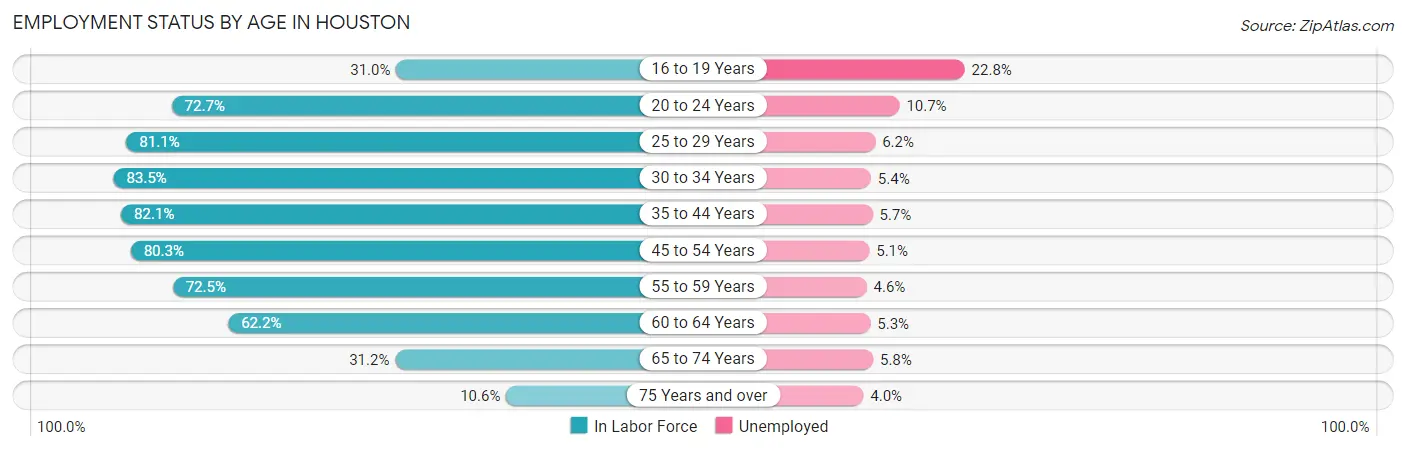
| Age Bracket | In Labor Force | Unemployed |
| 16 to 19 Years | 37,252 (31.0%) | 8,493 (22.8%) |
| 20 to 24 Years | 126,009 (72.7%) | 13,483 (10.7%) |
| 25 to 29 Years | 168,085 (81.1%) | 10,421 (6.2%) |
| 30 to 34 Years | 167,878 (83.5%) | 9,065 (5.4%) |
| 35 to 44 Years | 271,015 (82.1%) | 15,448 (5.7%) |
| 45 to 54 Years | 216,001 (80.3%) | 11,016 (5.1%) |
| 55 to 59 Years | 89,196 (72.5%) | 4,103 (4.6%) |
| 60 to 64 Years | 72,533 (62.2%) | 3,844 (5.3%) |
| 65 to 74 Years | 49,754 (31.2%) | 2,886 (5.8%) |
| 75 Years and over | 11,299 (10.6%) | 452 (4.0%) |
| Total | 1,208,614 (66.9%) | 79,769 (6.6%) |
Employment Status by Educational Attainment in Houston
According to labor force statistics for Houston, 79.0% of individuals (985,166) out of the total population between 25 and 64 years of age (1,247,046) are in the labor force, with 5.5% or 54,184 of them being unemployed. The group with the highest labor force participation rate are those with the educational attainment of bachelor's degree or higher, with 86.8% or 384,270 individuals in the labor force. Within the labor force, individuals with college / associate degree education have the highest percentage of unemployment, with 7.4% or 16,703 of them being unemployed.
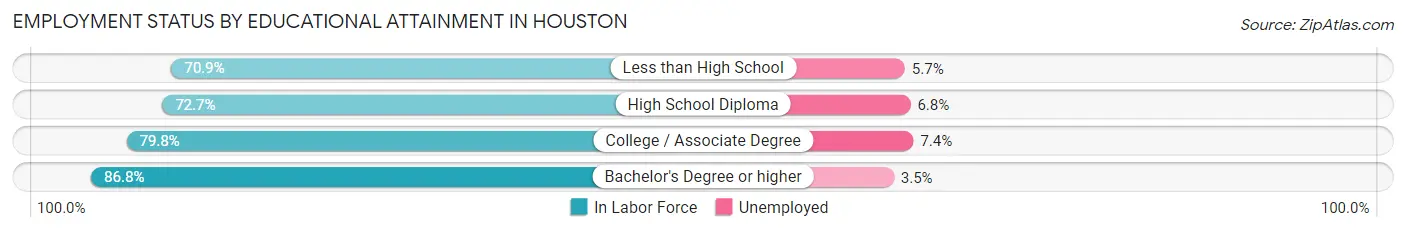
| Educational Attainment | In Labor Force | Unemployed |
| Less than High School | 176,954 (70.9%) | 14,226 (5.7%) |
| High School Diploma | 197,679 (72.7%) | 18,490 (6.8%) |
| College / Associate Degree | 225,710 (79.8%) | 20,931 (7.4%) |
| Bachelor's Degree or higher | 384,270 (86.8%) | 15,495 (3.5%) |
| Total | 985,166 (79.0%) | 68,588 (5.5%) |
Employment Occupations by Sex in Houston
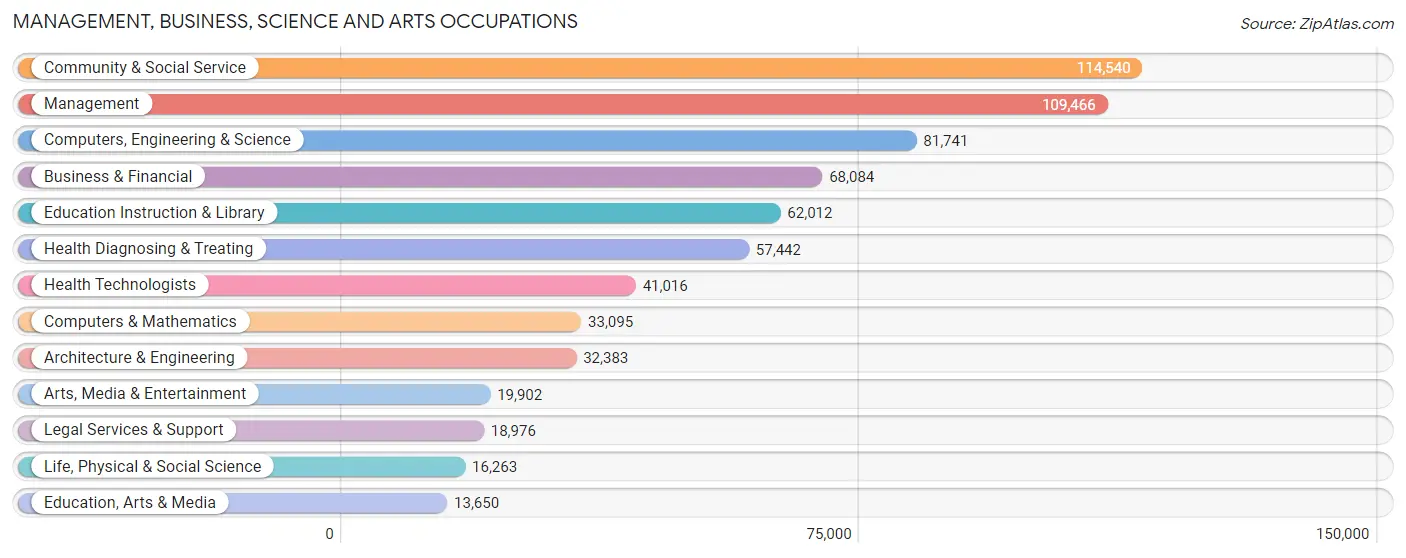
Management, Business, Science and Arts Occupations
The most common Management, Business, Science and Arts occupations in Houston are Community & Social Service (114,540 | 10.2%), Management (109,466 | 9.7%), Computers, Engineering & Science (81,741 | 7.2%), Business & Financial (68,084 | 6.0%), and Education Instruction & Library (62,012 | 5.5%).
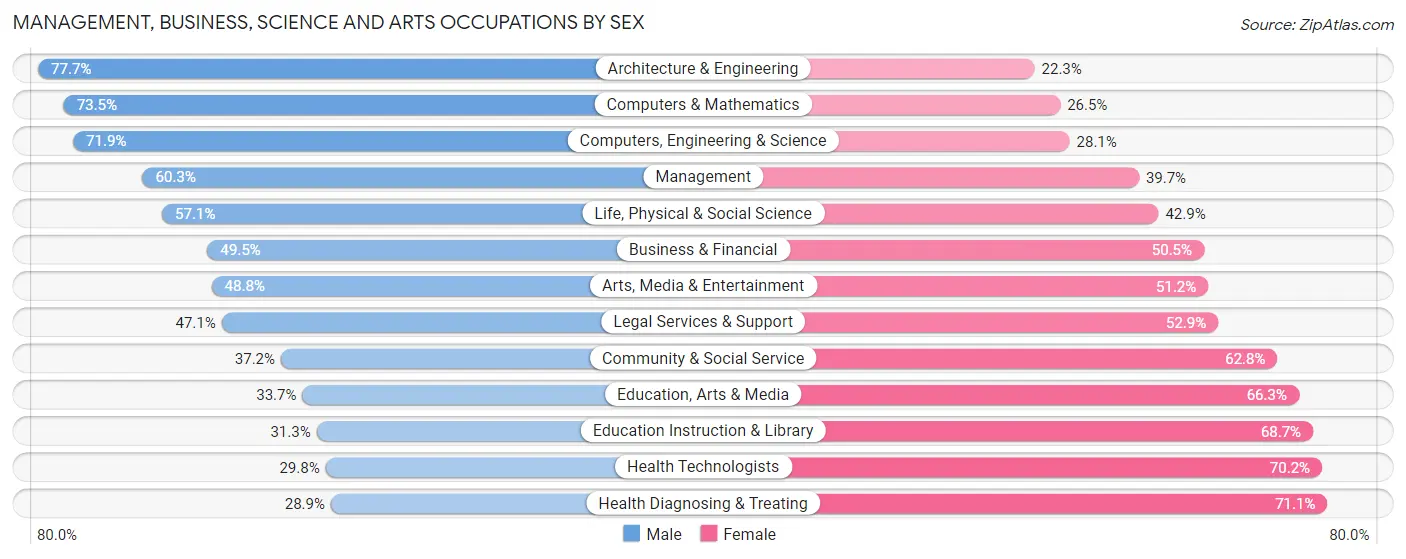
Management, Business, Science and Arts Occupations by Sex
Within the Management, Business, Science and Arts occupations in Houston, the most male-oriented occupations are Architecture & Engineering (77.7%), Computers & Mathematics (73.5%), and Computers, Engineering & Science (71.9%), while the most female-oriented occupations are Health Diagnosing & Treating (71.1%), Health Technologists (70.2%), and Education Instruction & Library (68.7%).
| Occupation | Male | Female |
| Management | 66,033 (60.3%) | 43,433 (39.7%) |
| Business & Financial | 33,697 (49.5%) | 34,387 (50.5%) |
| Computers, Engineering & Science | 58,763 (71.9%) | 22,978 (28.1%) |
| Computers & Mathematics | 24,311 (73.5%) | 8,784 (26.5%) |
| Architecture & Engineering | 25,172 (77.7%) | 7,211 (22.3%) |
| Life, Physical & Social Science | 9,280 (57.1%) | 6,983 (42.9%) |
| Community & Social Service | 42,647 (37.2%) | 71,893 (62.8%) |
| Education, Arts & Media | 4,594 (33.7%) | 9,056 (66.3%) |
| Legal Services & Support | 8,943 (47.1%) | 10,033 (52.9%) |
| Education Instruction & Library | 19,402 (31.3%) | 42,610 (68.7%) |
| Arts, Media & Entertainment | 9,708 (48.8%) | 10,194 (51.2%) |
| Health Diagnosing & Treating | 16,599 (28.9%) | 40,843 (71.1%) |
| Health Technologists | 12,218 (29.8%) | 28,798 (70.2%) |
| Total (Category) | 217,739 (50.5%) | 213,534 (49.5%) |
| Total (Overall) | 624,666 (55.3%) | 503,991 (44.7%) |
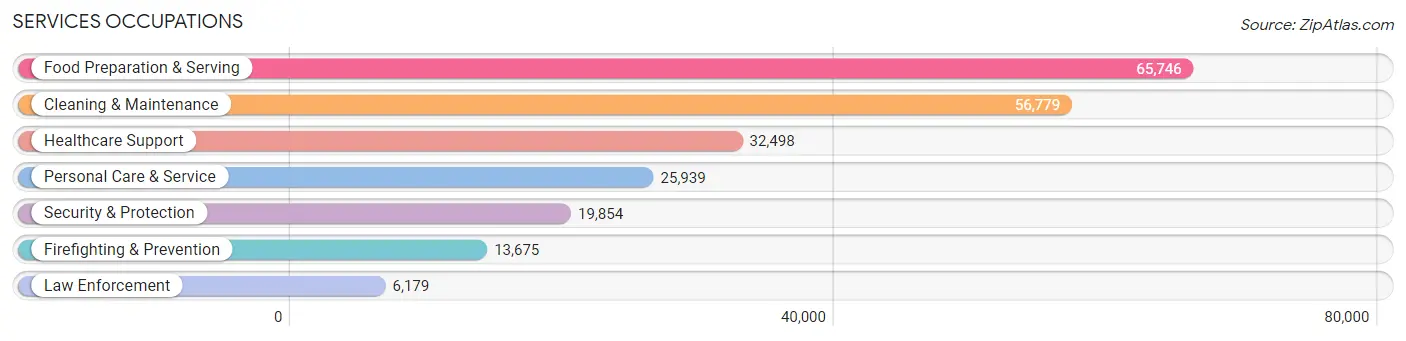
Services Occupations
The most common Services occupations in Houston are Food Preparation & Serving (65,746 | 5.8%), Cleaning & Maintenance (56,779 | 5.0%), Healthcare Support (32,498 | 2.9%), Personal Care & Service (25,939 | 2.3%), and Security & Protection (19,854 | 1.8%).
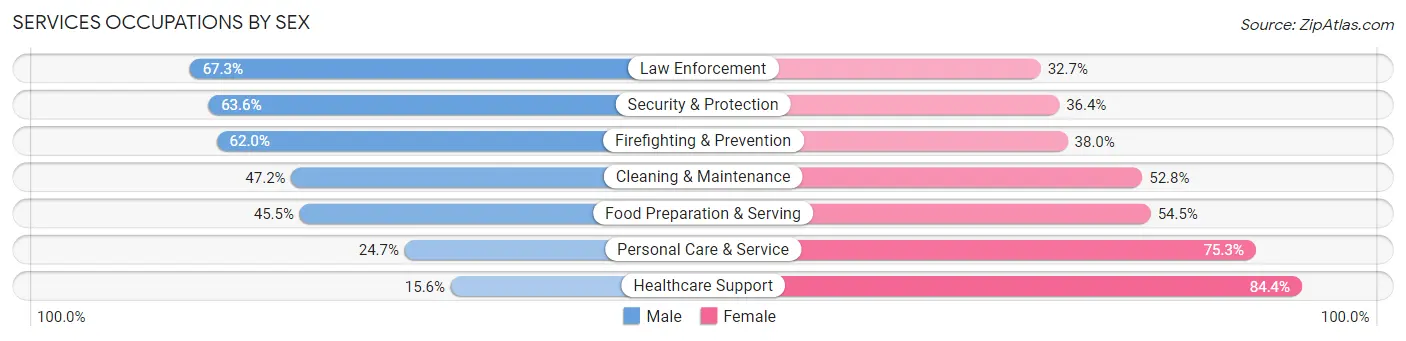
Services Occupations by Sex
Within the Services occupations in Houston, the most male-oriented occupations are Law Enforcement (67.3%), Security & Protection (63.6%), and Firefighting & Prevention (62.0%), while the most female-oriented occupations are Healthcare Support (84.4%), Personal Care & Service (75.3%), and Food Preparation & Serving (54.5%).
| Occupation | Male | Female |
| Healthcare Support | 5,068 (15.6%) | 27,430 (84.4%) |
| Security & Protection | 12,633 (63.6%) | 7,221 (36.4%) |
| Firefighting & Prevention | 8,475 (62.0%) | 5,200 (38.0%) |
| Law Enforcement | 4,158 (67.3%) | 2,021 (32.7%) |
| Food Preparation & Serving | 29,920 (45.5%) | 35,826 (54.5%) |
| Cleaning & Maintenance | 26,781 (47.2%) | 29,998 (52.8%) |
| Personal Care & Service | 6,412 (24.7%) | 19,527 (75.3%) |
| Total (Category) | 80,814 (40.2%) | 120,002 (59.8%) |
| Total (Overall) | 624,666 (55.3%) | 503,991 (44.7%) |
Sales and Office Occupations
The most common Sales and Office occupations in Houston are Sales & Related (110,598 | 9.8%), and Office & Administration (108,148 | 9.6%).

Sales and Office Occupations by Sex
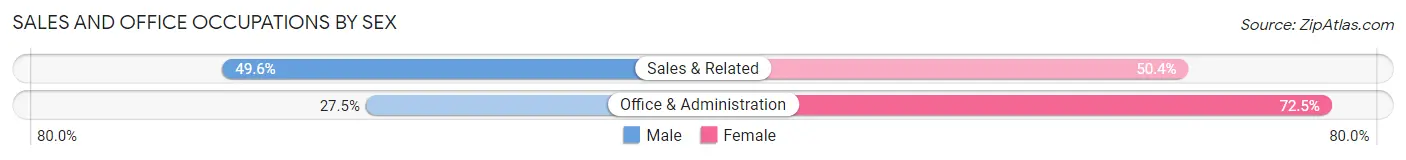
| Occupation | Male | Female |
| Sales & Related | 54,808 (49.6%) | 55,790 (50.4%) |
| Office & Administration | 29,763 (27.5%) | 78,385 (72.5%) |
| Total (Category) | 84,571 (38.7%) | 134,175 (61.3%) |
| Total (Overall) | 624,666 (55.3%) | 503,991 (44.7%) |
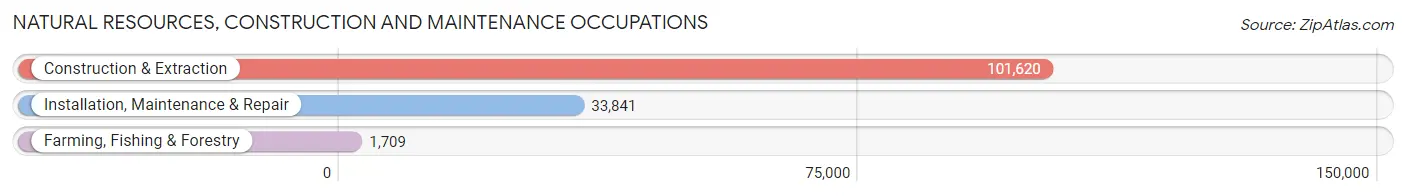
Natural Resources, Construction and Maintenance Occupations
The most common Natural Resources, Construction and Maintenance occupations in Houston are Construction & Extraction (101,620 | 9.0%), Installation, Maintenance & Repair (33,841 | 3.0%), and Farming, Fishing & Forestry (1,709 | 0.2%).
Natural Resources, Construction and Maintenance Occupations by Sex
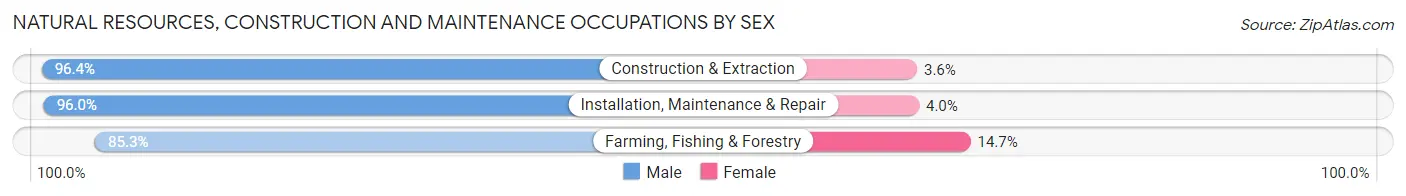
| Occupation | Male | Female |
| Farming, Fishing & Forestry | 1,458 (85.3%) | 251 (14.7%) |
| Construction & Extraction | 98,004 (96.4%) | 3,616 (3.6%) |
| Installation, Maintenance & Repair | 32,493 (96.0%) | 1,348 (4.0%) |
| Total (Category) | 131,955 (96.2%) | 5,215 (3.8%) |
| Total (Overall) | 624,666 (55.3%) | 503,991 (44.7%) |
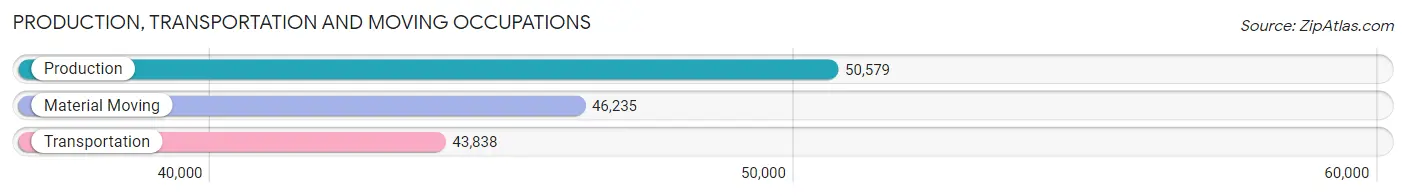
Production, Transportation and Moving Occupations
The most common Production, Transportation and Moving occupations in Houston are Production (50,579 | 4.5%), Material Moving (46,235 | 4.1%), and Transportation (43,838 | 3.9%).
Production, Transportation and Moving Occupations by Sex
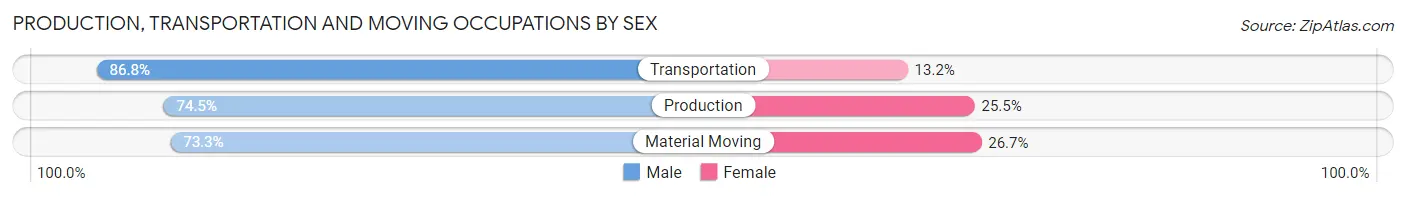
| Occupation | Male | Female |
| Production | 37,674 (74.5%) | 12,905 (25.5%) |
| Transportation | 38,040 (86.8%) | 5,798 (13.2%) |
| Material Moving | 33,873 (73.3%) | 12,362 (26.7%) |
| Total (Category) | 109,587 (77.9%) | 31,065 (22.1%) |
| Total (Overall) | 624,666 (55.3%) | 503,991 (44.7%) |
Employment Industries by Sex in Houston
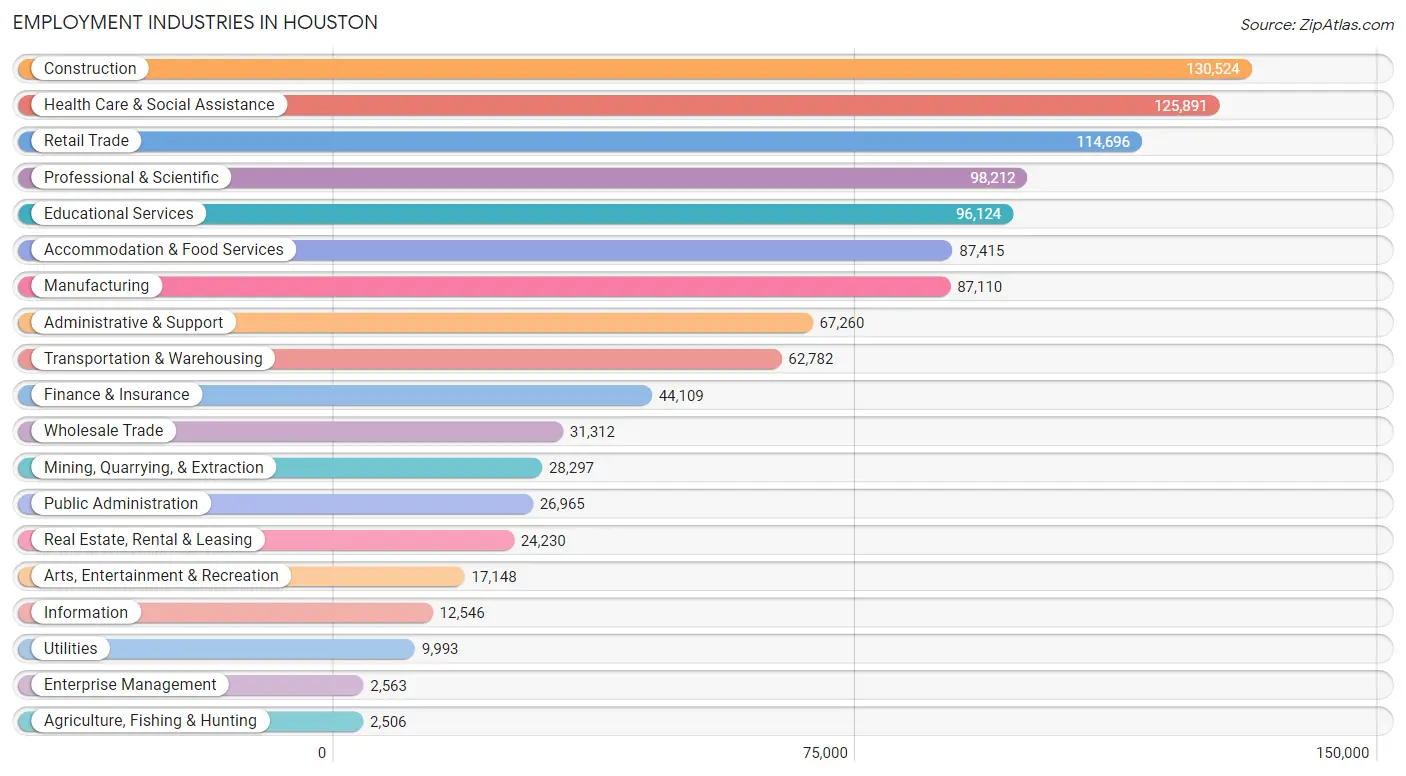
Employment Industries in Houston
The major employment industries in Houston include Construction (130,524 | 11.6%), Health Care & Social Assistance (125,891 | 11.2%), Retail Trade (114,696 | 10.2%), Professional & Scientific (98,212 | 8.7%), and Educational Services (96,124 | 8.5%).
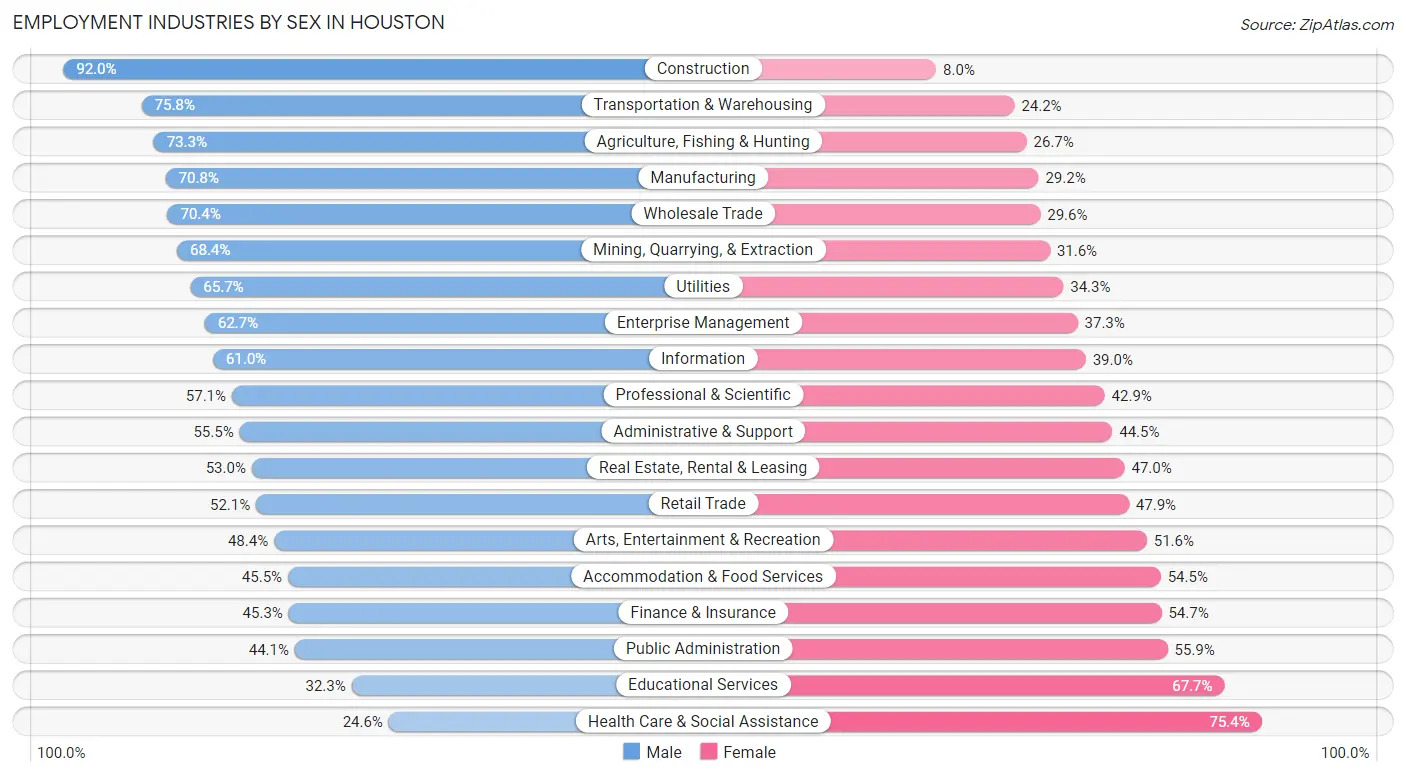
Employment Industries by Sex in Houston
The Houston industries that see more men than women are Construction (92.0%), Transportation & Warehousing (75.8%), and Agriculture, Fishing & Hunting (73.3%), whereas the industries that tend to have a higher number of women are Health Care & Social Assistance (75.4%), Educational Services (67.7%), and Public Administration (55.9%).
| Industry | Male | Female |
| Agriculture, Fishing & Hunting | 1,836 (73.3%) | 670 (26.7%) |
| Mining, Quarrying, & Extraction | 19,365 (68.4%) | 8,932 (31.6%) |
| Construction | 120,062 (92.0%) | 10,462 (8.0%) |
| Manufacturing | 61,675 (70.8%) | 25,435 (29.2%) |
| Wholesale Trade | 22,051 (70.4%) | 9,261 (29.6%) |
| Retail Trade | 59,741 (52.1%) | 54,955 (47.9%) |
| Transportation & Warehousing | 47,578 (75.8%) | 15,204 (24.2%) |
| Utilities | 6,562 (65.7%) | 3,431 (34.3%) |
| Information | 7,655 (61.0%) | 4,891 (39.0%) |
| Finance & Insurance | 20,000 (45.3%) | 24,109 (54.7%) |
| Real Estate, Rental & Leasing | 12,840 (53.0%) | 11,390 (47.0%) |
| Professional & Scientific | 56,077 (57.1%) | 42,135 (42.9%) |
| Enterprise Management | 1,607 (62.7%) | 956 (37.3%) |
| Administrative & Support | 37,342 (55.5%) | 29,918 (44.5%) |
| Educational Services | 31,074 (32.3%) | 65,050 (67.7%) |
| Health Care & Social Assistance | 31,021 (24.6%) | 94,870 (75.4%) |
| Arts, Entertainment & Recreation | 8,297 (48.4%) | 8,851 (51.6%) |
| Accommodation & Food Services | 39,776 (45.5%) | 47,639 (54.5%) |
| Public Administration | 11,883 (44.1%) | 15,082 (55.9%) |
| Total | 624,666 (55.3%) | 503,991 (44.7%) |
Education in Houston
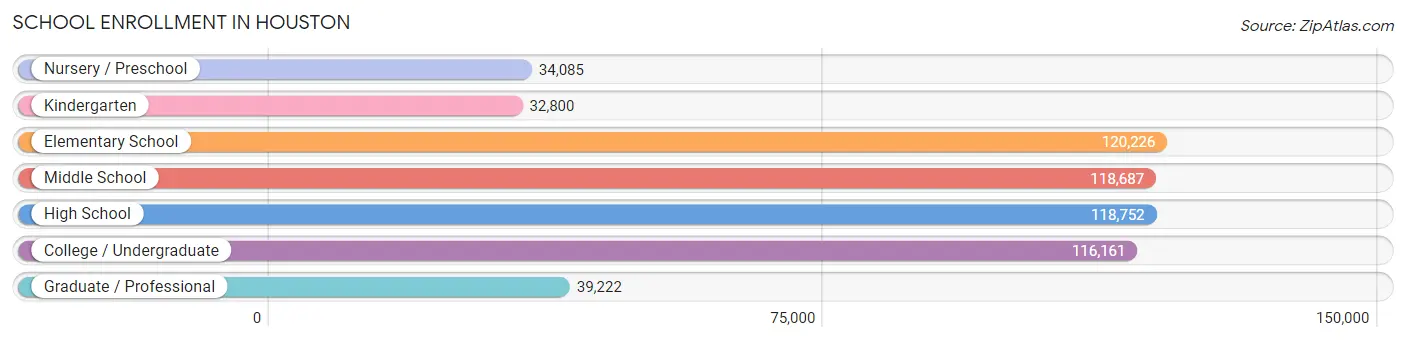
School Enrollment in Houston
The most common levels of schooling among the 579,933 students in Houston are elementary school (120,226 | 20.7%), high school (118,752 | 20.5%), and middle school (118,687 | 20.5%).
| School Level | # Students | % Students |
| Nursery / Preschool | 34,085 | 5.9% |
| Kindergarten | 32,800 | 5.7% |
| Elementary School | 120,226 | 20.7% |
| Middle School | 118,687 | 20.5% |
| High School | 118,752 | 20.5% |
| College / Undergraduate | 116,161 | 20.0% |
| Graduate / Professional | 39,222 | 6.8% |
| Total | 579,933 | 100.0% |
School Enrollment by Age by Funding Source in Houston
Out of a total of 579,933 students who are enrolled in schools in Houston, 77,711 (13.4%) attend a private institution, while the remaining 502,222 (86.6%) are enrolled in public schools. The age group of 3 to 4 year olds has the highest likelihood of being enrolled in private schools, with 9,509 (34.3% in the age bracket) enrolled. Conversely, the age group of 15 to 17 year olds has the lowest likelihood of being enrolled in a private school, with 79,203 (92.6% in the age bracket) attending a public institution.
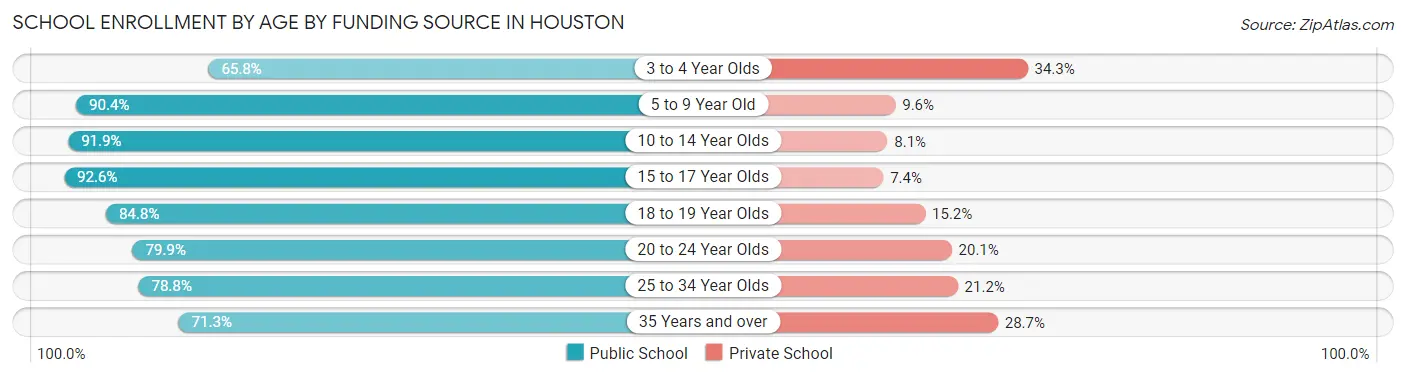
| Age Bracket | Public School | Private School |
| 3 to 4 Year Olds | 18,257 (65.7%) | 9,509 (34.3%) |
| 5 to 9 Year Old | 128,752 (90.4%) | 13,688 (9.6%) |
| 10 to 14 Year Olds | 135,070 (91.9%) | 11,960 (8.1%) |
| 15 to 17 Year Olds | 79,203 (92.6%) | 6,289 (7.4%) |
| 18 to 19 Year Olds | 35,580 (84.8%) | 6,362 (15.2%) |
| 20 to 24 Year Olds | 49,060 (79.9%) | 12,343 (20.1%) |
| 25 to 34 Year Olds | 36,427 (78.8%) | 9,820 (21.2%) |
| 35 Years and over | 19,688 (71.3%) | 7,925 (28.7%) |
| Total | 502,222 (86.6%) | 77,711 (13.4%) |
Educational Attainment by Field of Study in Houston
Business (129,571 | 22.7%), engineering (72,766 | 12.7%), science & technology (47,136 | 8.3%), social sciences (44,952 | 7.9%), and education (41,365 | 7.2%) are the most common fields of study among 571,562 individuals in Houston who have obtained a bachelor's degree or higher.
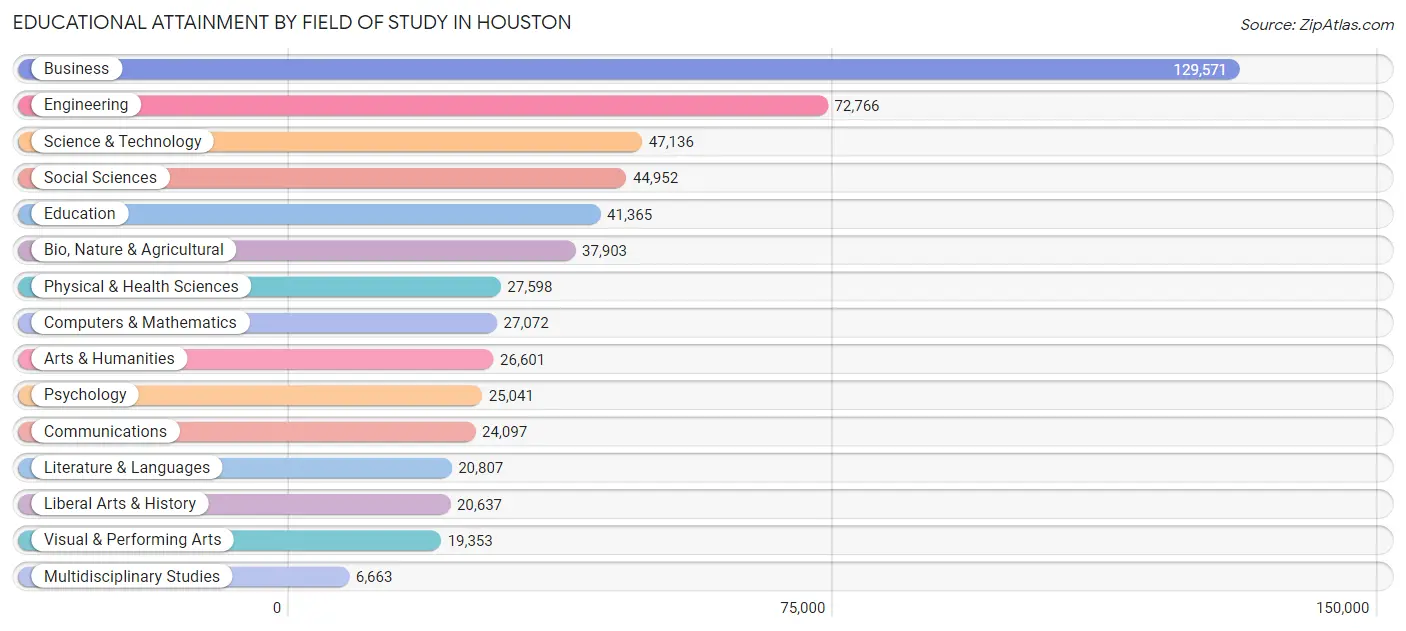
| Field of Study | # Graduates | % Graduates |
| Computers & Mathematics | 27,072 | 4.7% |
| Bio, Nature & Agricultural | 37,903 | 6.6% |
| Physical & Health Sciences | 27,598 | 4.8% |
| Psychology | 25,041 | 4.4% |
| Social Sciences | 44,952 | 7.9% |
| Engineering | 72,766 | 12.7% |
| Multidisciplinary Studies | 6,663 | 1.2% |
| Science & Technology | 47,136 | 8.3% |
| Business | 129,571 | 22.7% |
| Education | 41,365 | 7.2% |
| Literature & Languages | 20,807 | 3.6% |
| Liberal Arts & History | 20,637 | 3.6% |
| Visual & Performing Arts | 19,353 | 3.4% |
| Communications | 24,097 | 4.2% |
| Arts & Humanities | 26,601 | 4.6% |
| Total | 571,562 | 100.0% |
Transportation & Commute in Houston
Vehicle Availability by Sex in Houston
The most prevalent vehicle ownership categories in Houston are males with 2 vehicles (257,737, accounting for 42.1%) and females with 2 vehicles (193,651, making up 52.7%).
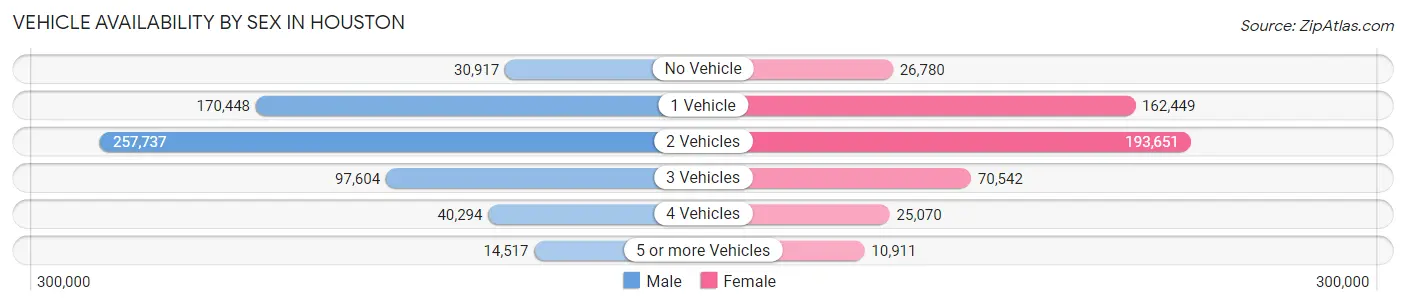
| Vehicles Available | Male | Female |
| No Vehicle | 30,917 (5.1%) | 26,780 (5.5%) |
| 1 Vehicle | 170,448 (27.9%) | 162,449 (33.2%) |
| 2 Vehicles | 257,737 (42.1%) | 193,651 (39.6%) |
| 3 Vehicles | 97,604 (16.0%) | 70,542 (14.4%) |
| 4 Vehicles | 40,294 (6.6%) | 25,070 (5.1%) |
| 5 or more Vehicles | 14,517 (2.4%) | 10,911 (2.2%) |
| Total | 611,517 (100.0%) | 489,403 (100.0%) |
Commute Time in Houston
The most frequently occuring commute durations in Houston are 30 to 34 minutes (199,731 commuters, 20.0%), 20 to 24 minutes (160,485 commuters, 16.1%), and 15 to 19 minutes (145,979 commuters, 14.6%).
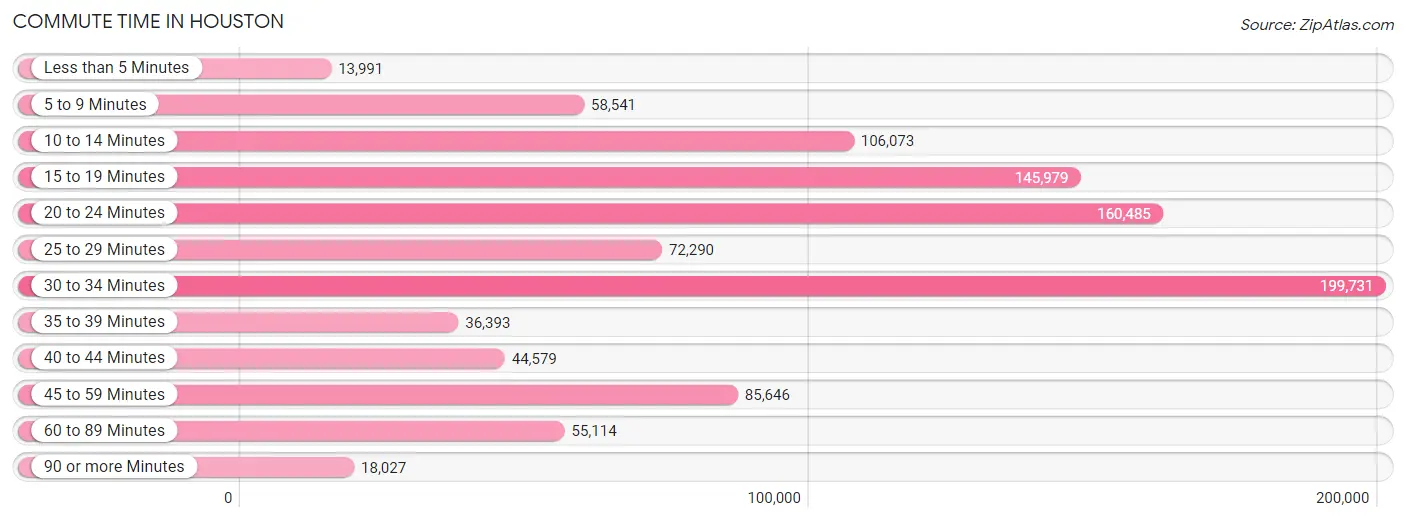
| Commute Time | # Commuters | % Commuters |
| Less than 5 Minutes | 13,991 | 1.4% |
| 5 to 9 Minutes | 58,541 | 5.9% |
| 10 to 14 Minutes | 106,073 | 10.6% |
| 15 to 19 Minutes | 145,979 | 14.6% |
| 20 to 24 Minutes | 160,485 | 16.1% |
| 25 to 29 Minutes | 72,290 | 7.2% |
| 30 to 34 Minutes | 199,731 | 20.0% |
| 35 to 39 Minutes | 36,393 | 3.6% |
| 40 to 44 Minutes | 44,579 | 4.5% |
| 45 to 59 Minutes | 85,646 | 8.6% |
| 60 to 89 Minutes | 55,114 | 5.5% |
| 90 or more Minutes | 18,027 | 1.8% |
Commute Time by Sex in Houston
The most common commute times in Houston are 30 to 34 minutes (118,871 commuters, 21.2%) for males and 30 to 34 minutes (80,860 commuters, 18.5%) for females.
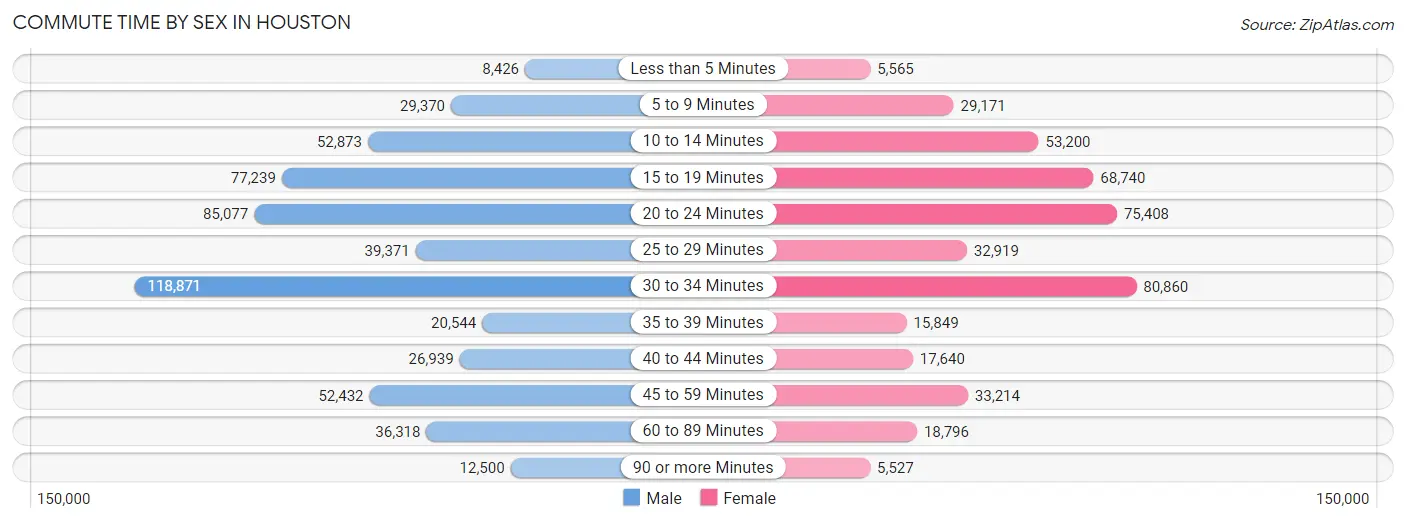
| Commute Time | Male | Female |
| Less than 5 Minutes | 8,426 (1.5%) | 5,565 (1.3%) |
| 5 to 9 Minutes | 29,370 (5.2%) | 29,171 (6.7%) |
| 10 to 14 Minutes | 52,873 (9.4%) | 53,200 (12.2%) |
| 15 to 19 Minutes | 77,239 (13.8%) | 68,740 (15.7%) |
| 20 to 24 Minutes | 85,077 (15.2%) | 75,408 (17.3%) |
| 25 to 29 Minutes | 39,371 (7.0%) | 32,919 (7.5%) |
| 30 to 34 Minutes | 118,871 (21.2%) | 80,860 (18.5%) |
| 35 to 39 Minutes | 20,544 (3.7%) | 15,849 (3.6%) |
| 40 to 44 Minutes | 26,939 (4.8%) | 17,640 (4.0%) |
| 45 to 59 Minutes | 52,432 (9.4%) | 33,214 (7.6%) |
| 60 to 89 Minutes | 36,318 (6.5%) | 18,796 (4.3%) |
| 90 or more Minutes | 12,500 (2.2%) | 5,527 (1.3%) |
Time of Departure to Work by Sex in Houston
The most frequent times of departure to work in Houston are 7:00 AM to 7:29 AM (90,040, 16.1%) for males and 7:00 AM to 7:29 AM (70,836, 16.2%) for females.
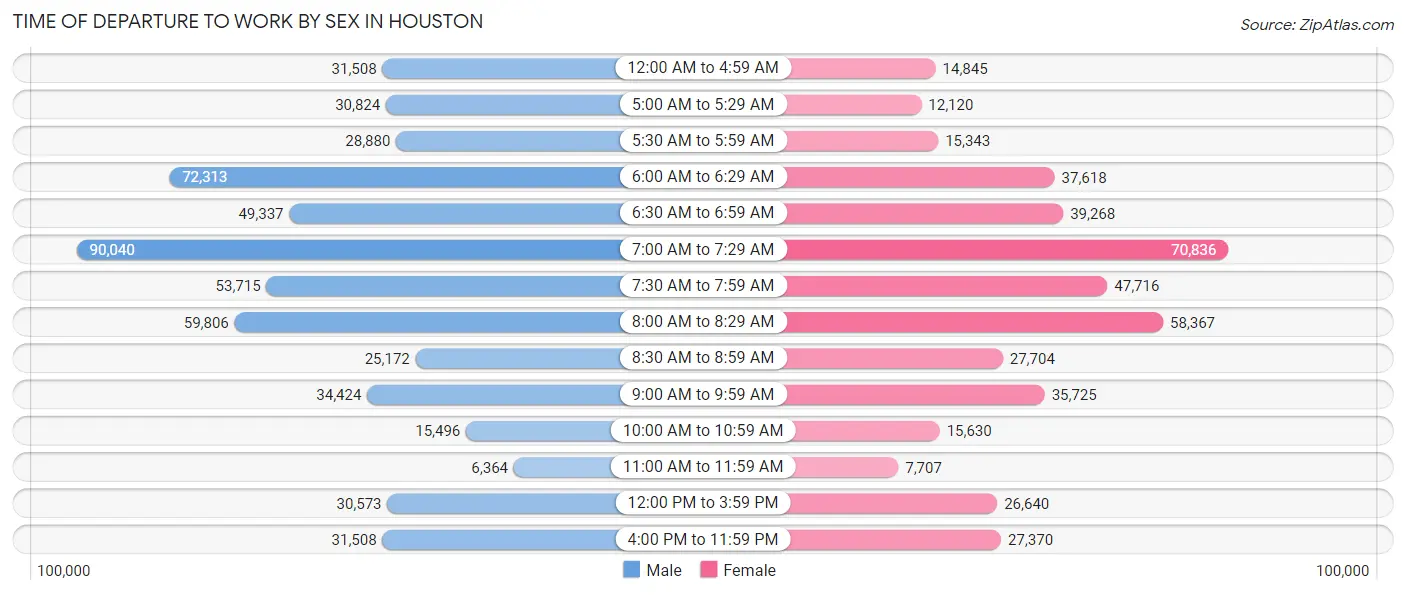
| Time of Departure | Male | Female |
| 12:00 AM to 4:59 AM | 31,508 (5.6%) | 14,845 (3.4%) |
| 5:00 AM to 5:29 AM | 30,824 (5.5%) | 12,120 (2.8%) |
| 5:30 AM to 5:59 AM | 28,880 (5.2%) | 15,343 (3.5%) |
| 6:00 AM to 6:29 AM | 72,313 (12.9%) | 37,618 (8.6%) |
| 6:30 AM to 6:59 AM | 49,337 (8.8%) | 39,268 (9.0%) |
| 7:00 AM to 7:29 AM | 90,040 (16.1%) | 70,836 (16.2%) |
| 7:30 AM to 7:59 AM | 53,715 (9.6%) | 47,716 (10.9%) |
| 8:00 AM to 8:29 AM | 59,806 (10.7%) | 58,367 (13.4%) |
| 8:30 AM to 8:59 AM | 25,172 (4.5%) | 27,704 (6.3%) |
| 9:00 AM to 9:59 AM | 34,424 (6.1%) | 35,725 (8.2%) |
| 10:00 AM to 10:59 AM | 15,496 (2.8%) | 15,630 (3.6%) |
| 11:00 AM to 11:59 AM | 6,364 (1.1%) | 7,707 (1.8%) |
| 12:00 PM to 3:59 PM | 30,573 (5.5%) | 26,640 (6.1%) |
| 4:00 PM to 11:59 PM | 31,508 (5.6%) | 27,370 (6.3%) |
| Total | 559,960 (100.0%) | 436,889 (100.0%) |
Housing Occupancy in Houston
Occupancy by Ownership in Houston
Of the total 897,510 dwellings in Houston, owner-occupied units account for 376,562 (42.0%), while renter-occupied units make up 520,948 (58.0%).
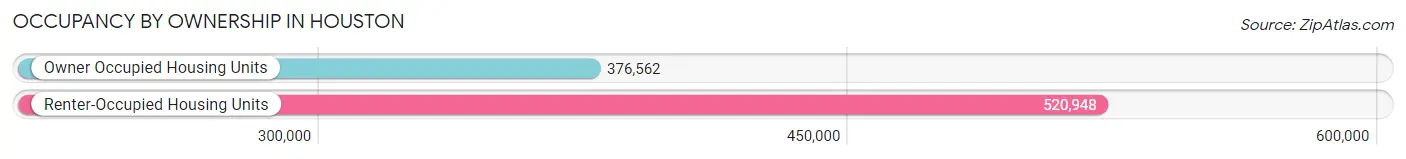
| Occupancy | # Housing Units | % Housing Units |
| Owner Occupied Housing Units | 376,562 | 42.0% |
| Renter-Occupied Housing Units | 520,948 | 58.0% |
| Total Occupied Housing Units | 897,510 | 100.0% |
Occupancy by Household Size in Houston
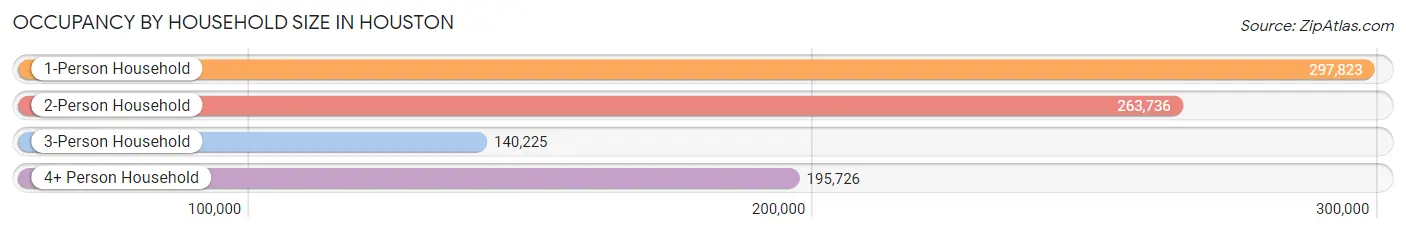
| Household Size | # Housing Units | % Housing Units |
| 1-Person Household | 297,823 | 33.2% |
| 2-Person Household | 263,736 | 29.4% |
| 3-Person Household | 140,225 | 15.6% |
| 4+ Person Household | 195,726 | 21.8% |
| Total Housing Units | 897,510 | 100.0% |
Occupancy by Ownership by Household Size in Houston
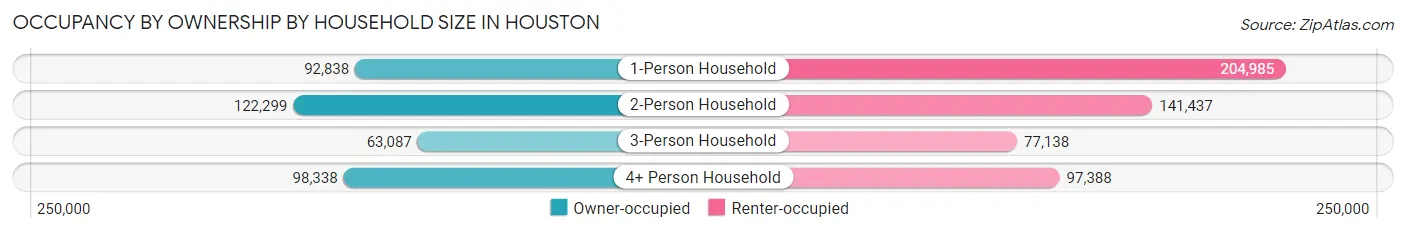
| Household Size | Owner-occupied | Renter-occupied |
| 1-Person Household | 92,838 (31.2%) | 204,985 (68.8%) |
| 2-Person Household | 122,299 (46.4%) | 141,437 (53.6%) |
| 3-Person Household | 63,087 (45.0%) | 77,138 (55.0%) |
| 4+ Person Household | 98,338 (50.2%) | 97,388 (49.8%) |
| Total Housing Units | 376,562 (42.0%) | 520,948 (58.0%) |
Occupancy by Educational Attainment in Houston
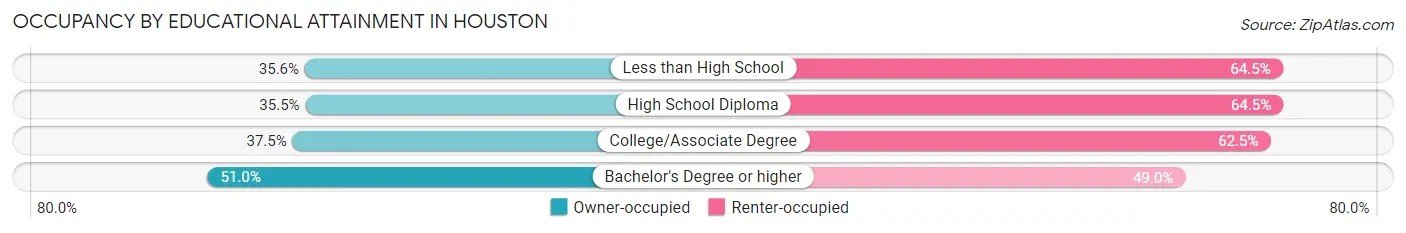
| Household Size | Owner-occupied | Renter-occupied |
| Less than High School | 55,839 (35.5%) | 101,237 (64.4%) |
| High School Diploma | 62,427 (35.5%) | 113,622 (64.5%) |
| College/Associate Degree | 81,977 (37.5%) | 136,618 (62.5%) |
| Bachelor's Degree or higher | 176,319 (51.0%) | 169,471 (49.0%) |
Occupancy by Age of Householder in Houston
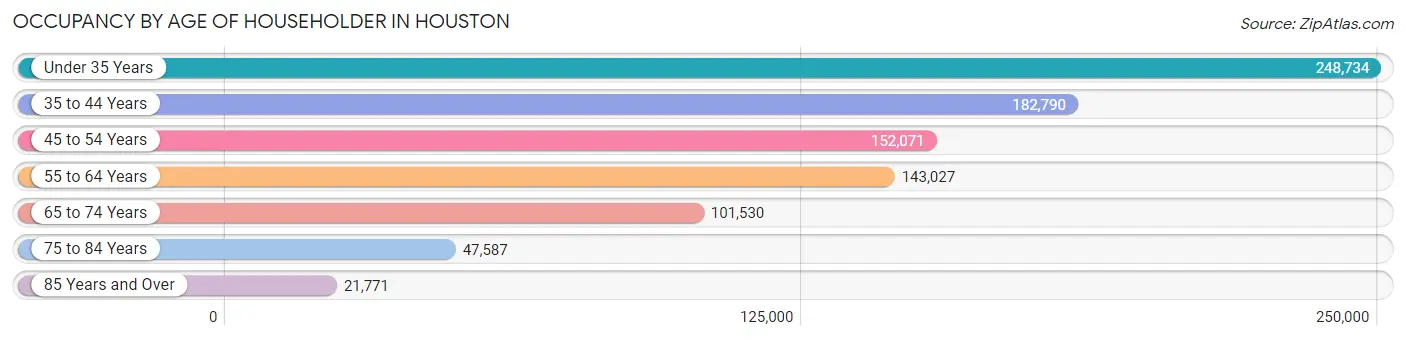
| Age Bracket | # Households | % Households |
| Under 35 Years | 248,734 | 27.7% |
| 35 to 44 Years | 182,790 | 20.4% |
| 45 to 54 Years | 152,071 | 16.9% |
| 55 to 64 Years | 143,027 | 15.9% |
| 65 to 74 Years | 101,530 | 11.3% |
| 75 to 84 Years | 47,587 | 5.3% |
| 85 Years and Over | 21,771 | 2.4% |
| Total | 897,510 | 100.0% |
Housing Finances in Houston
Median Income by Occupancy in Houston
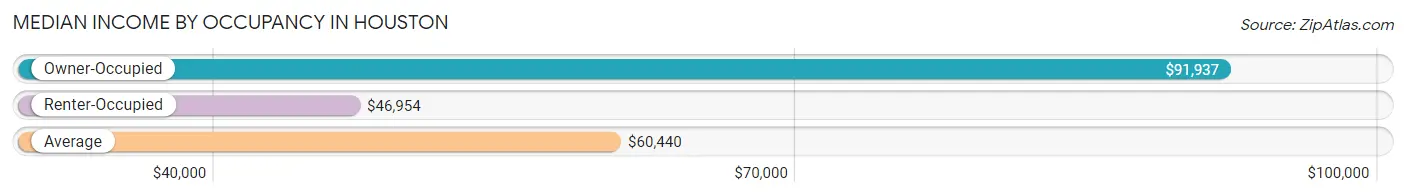
| Occupancy Type | # Households | Median Income |
| Owner-Occupied | 376,562 (42.0%) | $91,937 |
| Renter-Occupied | 520,948 (58.0%) | $46,954 |
| Average | 897,510 (100.0%) | $60,440 |
Occupancy by Householder Income Bracket in Houston
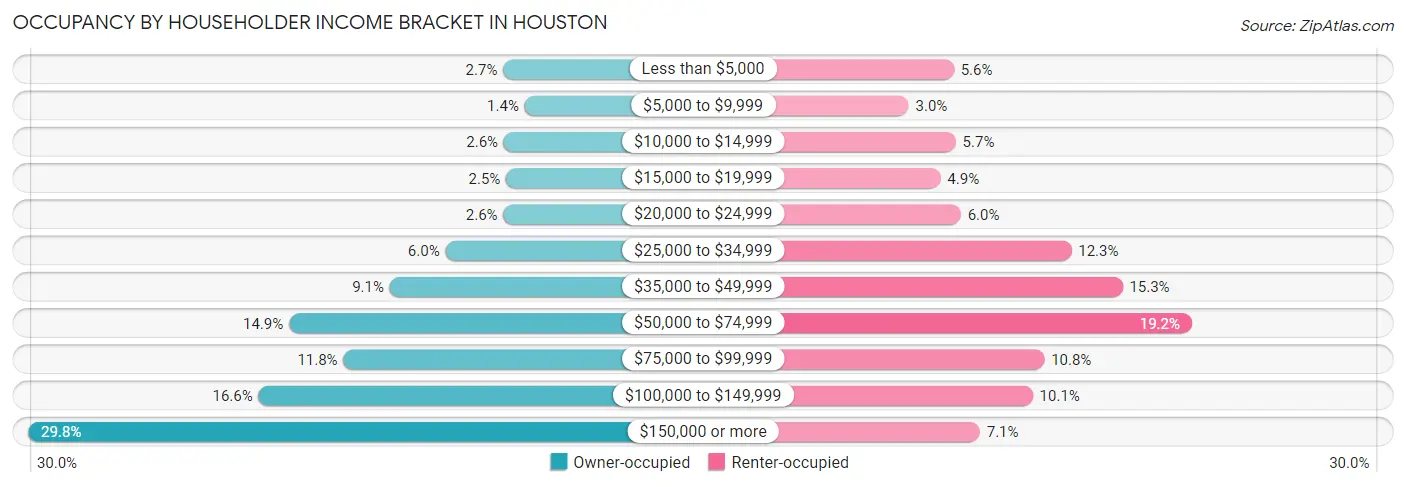
| Income Bracket | Owner-occupied | Renter-occupied |
| Less than $5,000 | 9,977 (2.6%) | 29,204 (5.6%) |
| $5,000 to $9,999 | 5,366 (1.4%) | 15,767 (3.0%) |
| $10,000 to $14,999 | 9,833 (2.6%) | 29,809 (5.7%) |
| $15,000 to $19,999 | 9,357 (2.5%) | 25,241 (4.9%) |
| $20,000 to $24,999 | 9,934 (2.6%) | 31,307 (6.0%) |
| $25,000 to $34,999 | 22,420 (5.9%) | 64,229 (12.3%) |
| $35,000 to $49,999 | 34,377 (9.1%) | 79,433 (15.2%) |
| $50,000 to $74,999 | 56,070 (14.9%) | 100,083 (19.2%) |
| $75,000 to $99,999 | 44,367 (11.8%) | 56,161 (10.8%) |
| $100,000 to $149,999 | 62,641 (16.6%) | 52,713 (10.1%) |
| $150,000 or more | 112,220 (29.8%) | 37,001 (7.1%) |
| Total | 376,562 (100.0%) | 520,948 (100.0%) |
Monthly Housing Cost Tiers in Houston
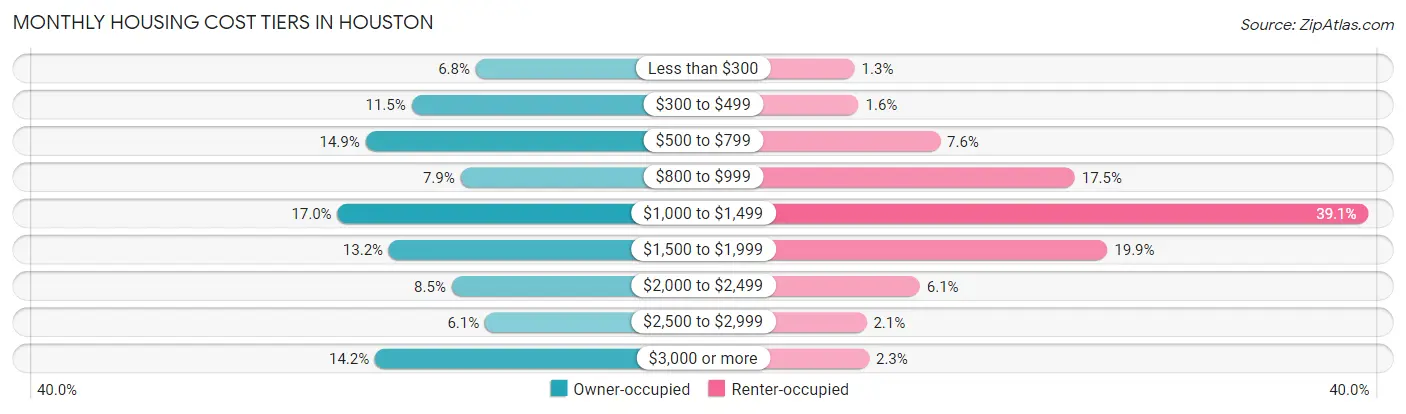
| Monthly Cost | Owner-occupied | Renter-occupied |
| Less than $300 | 25,476 (6.8%) | 6,605 (1.3%) |
| $300 to $499 | 43,296 (11.5%) | 8,118 (1.6%) |
| $500 to $799 | 56,072 (14.9%) | 39,365 (7.6%) |
| $800 to $999 | 29,711 (7.9%) | 91,039 (17.5%) |
| $1,000 to $1,499 | 63,877 (17.0%) | 203,715 (39.1%) |
| $1,500 to $1,999 | 49,605 (13.2%) | 103,558 (19.9%) |
| $2,000 to $2,499 | 32,152 (8.5%) | 31,596 (6.1%) |
| $2,500 to $2,999 | 22,939 (6.1%) | 11,168 (2.1%) |
| $3,000 or more | 53,434 (14.2%) | 12,136 (2.3%) |
| Total | 376,562 (100.0%) | 520,948 (100.0%) |
Physical Housing Characteristics in Houston
Housing Structures in Houston
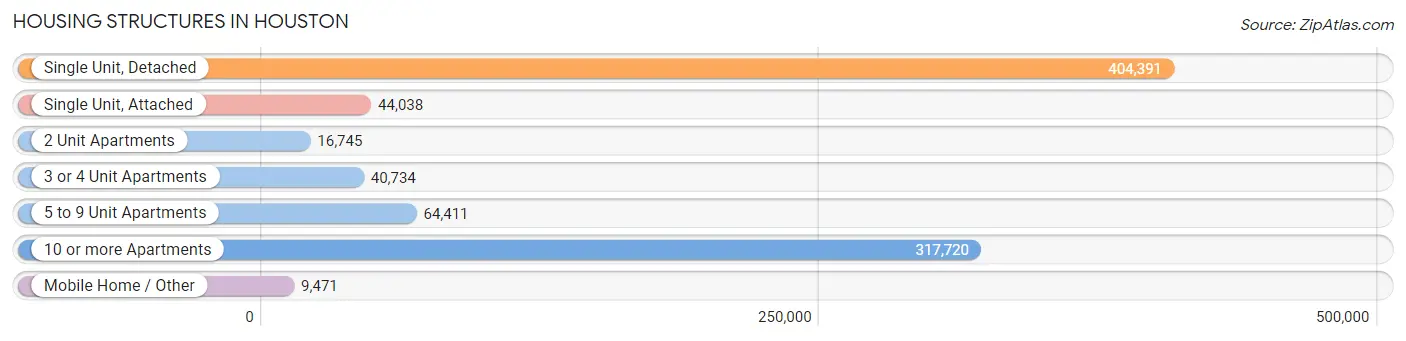
| Structure Type | # Housing Units | % Housing Units |
| Single Unit, Detached | 404,391 | 45.1% |
| Single Unit, Attached | 44,038 | 4.9% |
| 2 Unit Apartments | 16,745 | 1.9% |
| 3 or 4 Unit Apartments | 40,734 | 4.5% |
| 5 to 9 Unit Apartments | 64,411 | 7.2% |
| 10 or more Apartments | 317,720 | 35.4% |
| Mobile Home / Other | 9,471 | 1.1% |
| Total | 897,510 | 100.0% |
Housing Structures by Occupancy in Houston
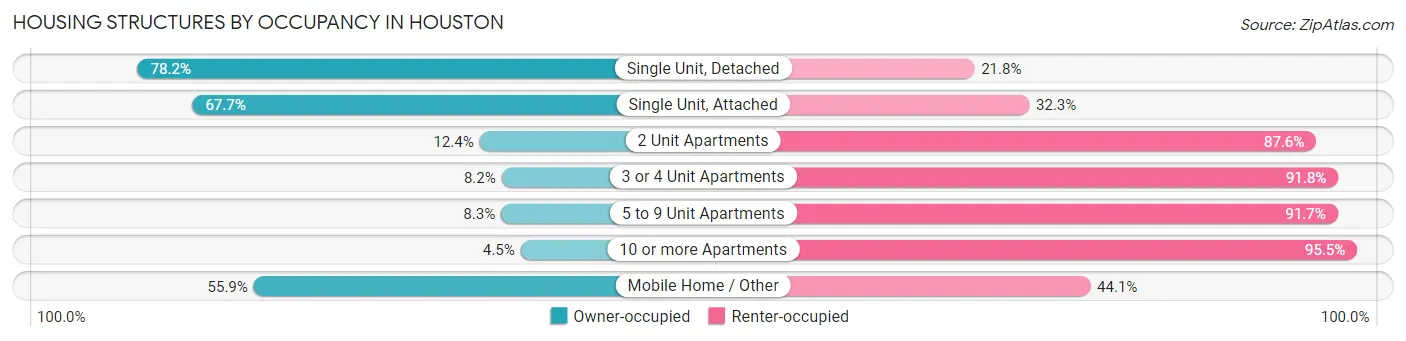
| Structure Type | Owner-occupied | Renter-occupied |
| Single Unit, Detached | 316,371 (78.2%) | 88,020 (21.8%) |
| Single Unit, Attached | 29,801 (67.7%) | 14,237 (32.3%) |
| 2 Unit Apartments | 2,079 (12.4%) | 14,666 (87.6%) |
| 3 or 4 Unit Apartments | 3,330 (8.2%) | 37,404 (91.8%) |
| 5 to 9 Unit Apartments | 5,336 (8.3%) | 59,075 (91.7%) |
| 10 or more Apartments | 14,350 (4.5%) | 303,370 (95.5%) |
| Mobile Home / Other | 5,295 (55.9%) | 4,176 (44.1%) |
| Total | 376,562 (42.0%) | 520,948 (58.0%) |
Housing Structures by Number of Rooms in Houston
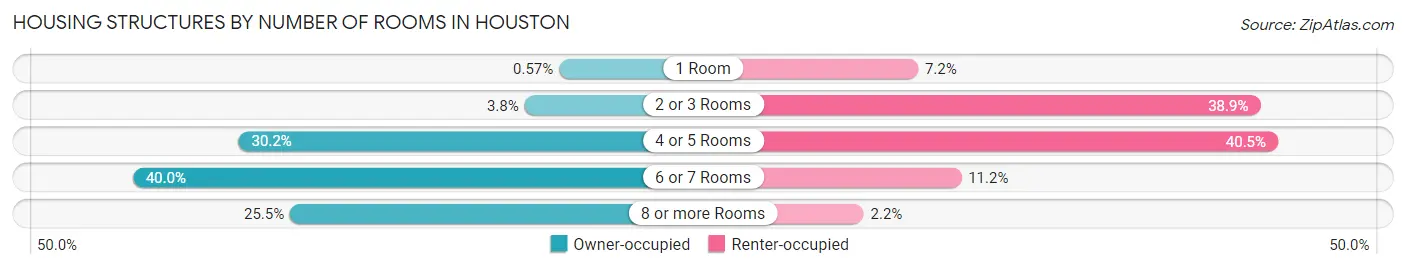
| Number of Rooms | Owner-occupied | Renter-occupied |
| 1 Room | 2,132 (0.6%) | 37,609 (7.2%) |
| 2 or 3 Rooms | 14,146 (3.8%) | 202,495 (38.9%) |
| 4 or 5 Rooms | 113,811 (30.2%) | 210,990 (40.5%) |
| 6 or 7 Rooms | 150,638 (40.0%) | 58,437 (11.2%) |
| 8 or more Rooms | 95,835 (25.5%) | 11,417 (2.2%) |
| Total | 376,562 (100.0%) | 520,948 (100.0%) |
Housing Structure by Heating Type in Houston
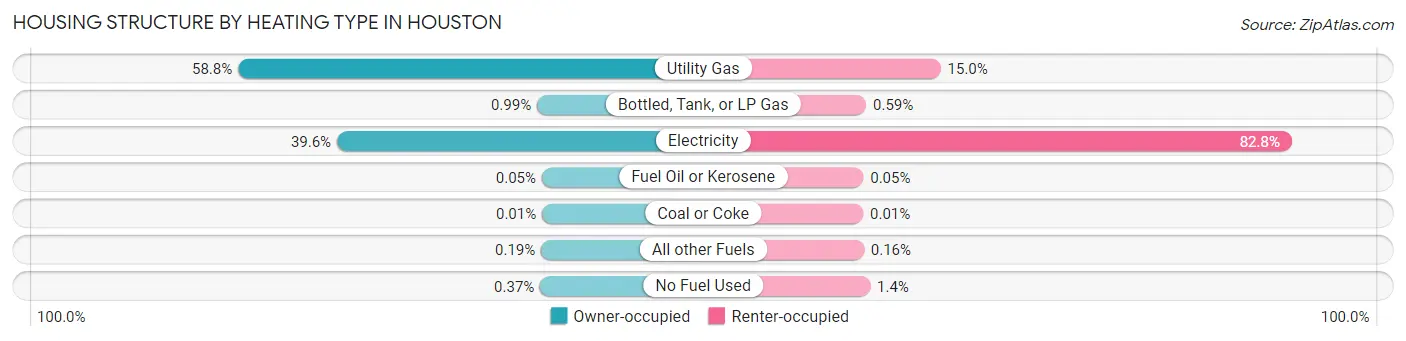
| Heating Type | Owner-occupied | Renter-occupied |
| Utility Gas | 221,234 (58.8%) | 78,113 (15.0%) |
| Bottled, Tank, or LP Gas | 3,727 (1.0%) | 3,061 (0.6%) |
| Electricity | 149,275 (39.6%) | 431,488 (82.8%) |
| Fuel Oil or Kerosene | 184 (0.1%) | 272 (0.1%) |
| Coal or Coke | 44 (0.0%) | 76 (0.0%) |
| All other Fuels | 722 (0.2%) | 812 (0.2%) |
| No Fuel Used | 1,376 (0.4%) | 7,126 (1.4%) |
| Total | 376,562 (100.0%) | 520,948 (100.0%) |
Household Vehicle Usage in Houston
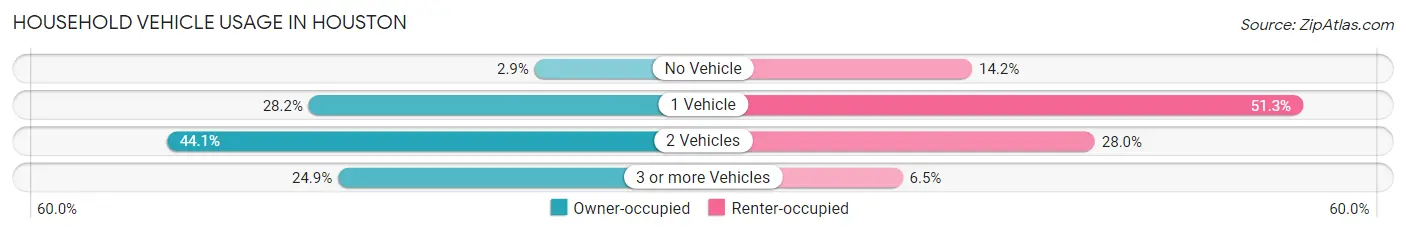
| Vehicles per Household | Owner-occupied | Renter-occupied |
| No Vehicle | 10,805 (2.9%) | 74,182 (14.2%) |
| 1 Vehicle | 106,060 (28.2%) | 267,247 (51.3%) |
| 2 Vehicles | 165,980 (44.1%) | 145,877 (28.0%) |
| 3 or more Vehicles | 93,717 (24.9%) | 33,642 (6.5%) |
| Total | 376,562 (100.0%) | 520,948 (100.0%) |
Real Estate & Mortgages in Houston
Real Estate and Mortgage Overview in Houston
| Characteristic | Without Mortgage | With Mortgage |
| Housing Units | 178,083 | 198,479 |
| Median Property Value | $191,600 | $281,100 |
| Median Household Income | $69,880 | $77,429 |
| Monthly Housing Costs | $605 | $48,653 |
| Real Estate Taxes | $2,639 | $8,893 |
Property Value by Mortgage Status in Houston
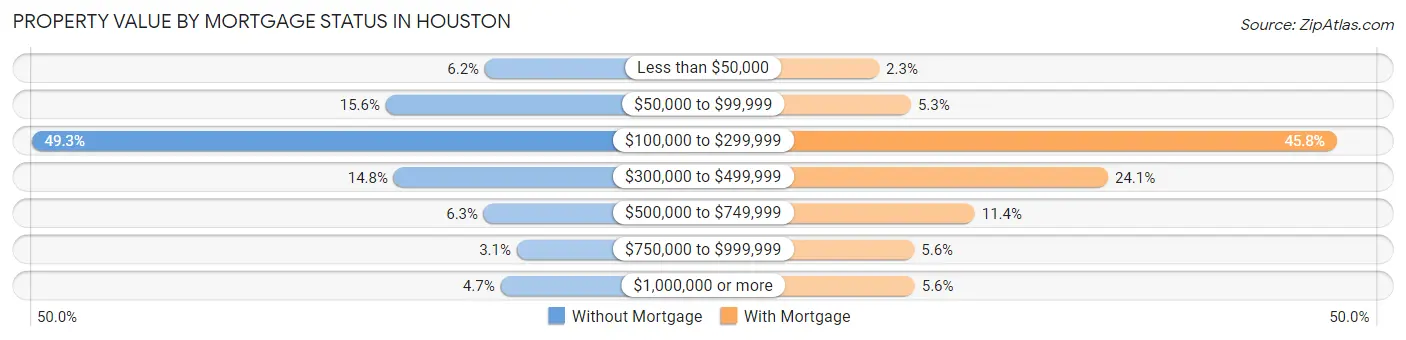
| Property Value | Without Mortgage | With Mortgage |
| Less than $50,000 | 10,973 (6.2%) | 4,460 (2.2%) |
| $50,000 to $99,999 | 27,781 (15.6%) | 10,476 (5.3%) |
| $100,000 to $299,999 | 87,845 (49.3%) | 90,947 (45.8%) |
| $300,000 to $499,999 | 26,431 (14.8%) | 47,729 (24.0%) |
| $500,000 to $749,999 | 11,154 (6.3%) | 22,548 (11.4%) |
| $750,000 to $999,999 | 5,565 (3.1%) | 11,118 (5.6%) |
| $1,000,000 or more | 8,334 (4.7%) | 11,201 (5.6%) |
| Total | 178,083 (100.0%) | 198,479 (100.0%) |
Household Income by Mortgage Status in Houston
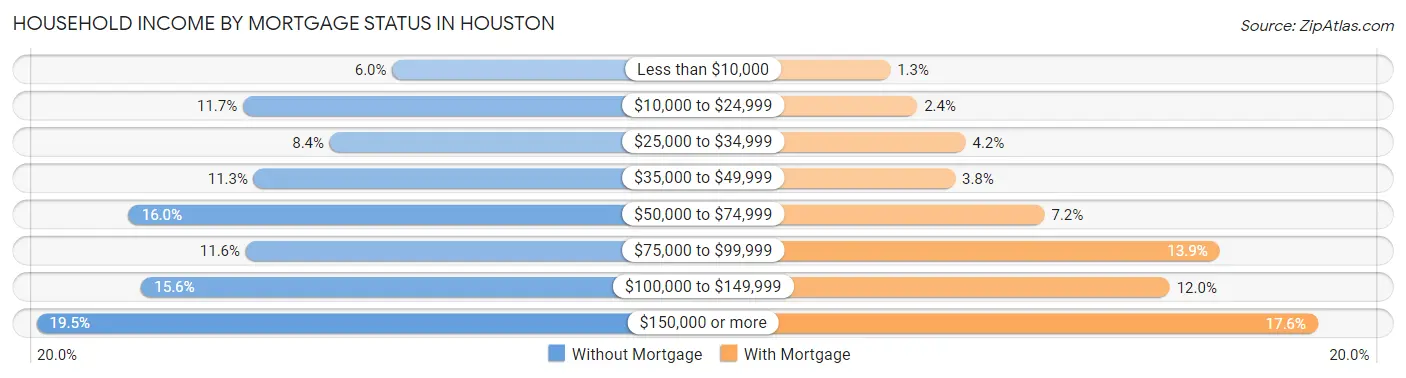
| Household Income | Without Mortgage | With Mortgage |
| Less than $10,000 | 10,673 (6.0%) | 2,613 (1.3%) |
| $10,000 to $24,999 | 20,807 (11.7%) | 4,670 (2.4%) |
| $25,000 to $34,999 | 14,898 (8.4%) | 8,317 (4.2%) |
| $35,000 to $49,999 | 20,077 (11.3%) | 7,522 (3.8%) |
| $50,000 to $74,999 | 28,541 (16.0%) | 14,300 (7.2%) |
| $75,000 to $99,999 | 20,610 (11.6%) | 27,529 (13.9%) |
| $100,000 to $149,999 | 27,686 (15.5%) | 23,757 (12.0%) |
| $150,000 or more | 34,791 (19.5%) | 34,955 (17.6%) |
| Total | 178,083 (100.0%) | 198,479 (100.0%) |
Property Value to Household Income Ratio in Houston
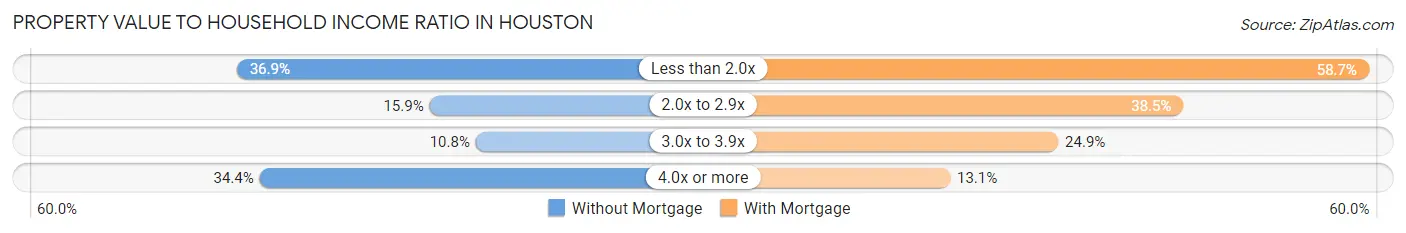
| Value-to-Income Ratio | Without Mortgage | With Mortgage |
| Less than 2.0x | 65,673 (36.9%) | 116,554 (58.7%) |
| 2.0x to 2.9x | 28,286 (15.9%) | 76,406 (38.5%) |
| 3.0x to 3.9x | 19,300 (10.8%) | 49,355 (24.9%) |
| 4.0x or more | 61,266 (34.4%) | 25,985 (13.1%) |
| Total | 178,083 (100.0%) | 198,479 (100.0%) |
Real Estate Taxes by Mortgage Status in Houston
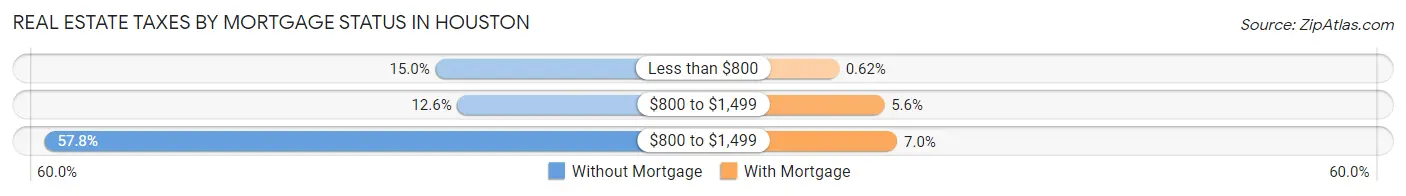
| Property Taxes | Without Mortgage | With Mortgage |
| Less than $800 | 26,659 (15.0%) | 1,231 (0.6%) |
| $800 to $1,499 | 22,376 (12.6%) | 11,126 (5.6%) |
| $800 to $1,499 | 102,929 (57.8%) | 13,941 (7.0%) |
| Total | 178,083 (100.0%) | 198,479 (100.0%) |
Health & Disability in Houston
Health Insurance Coverage by Age in Houston
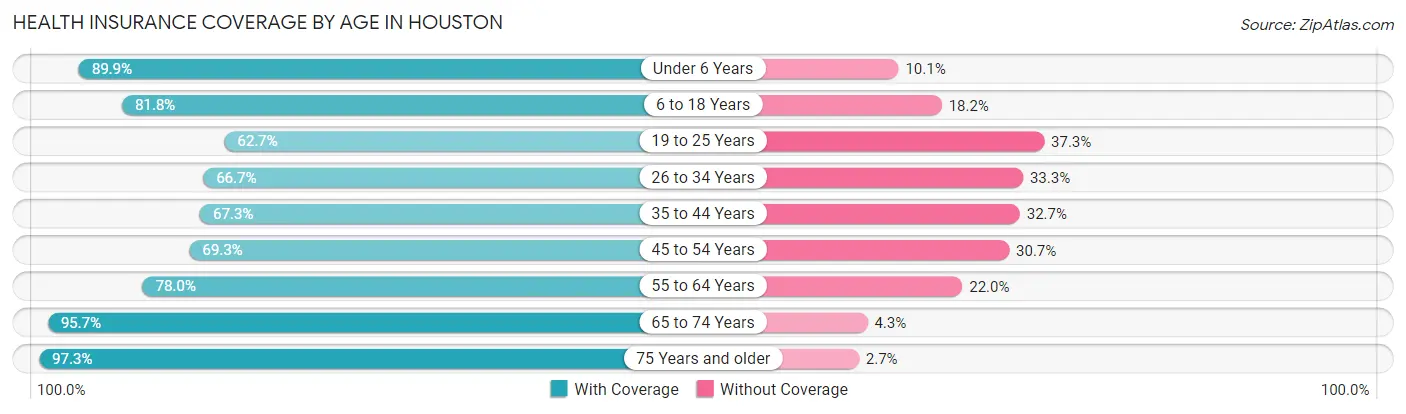
| Age Bracket | With Coverage | Without Coverage |
| Under 6 Years | 170,189 (89.9%) | 19,149 (10.1%) |
| 6 to 18 Years | 319,500 (81.8%) | 70,874 (18.2%) |
| 19 to 25 Years | 149,691 (62.7%) | 88,896 (37.3%) |
| 26 to 34 Years | 244,735 (66.7%) | 122,298 (33.3%) |
| 35 to 44 Years | 219,850 (67.3%) | 106,988 (32.7%) |
| 45 to 54 Years | 184,742 (69.3%) | 82,009 (30.7%) |
| 55 to 64 Years | 185,652 (78.0%) | 52,361 (22.0%) |
| 65 to 74 Years | 150,875 (95.7%) | 6,818 (4.3%) |
| 75 Years and older | 100,894 (97.3%) | 2,807 (2.7%) |
| Total | 1,726,128 (75.8%) | 552,200 (24.2%) |
Health Insurance Coverage by Citizenship Status in Houston
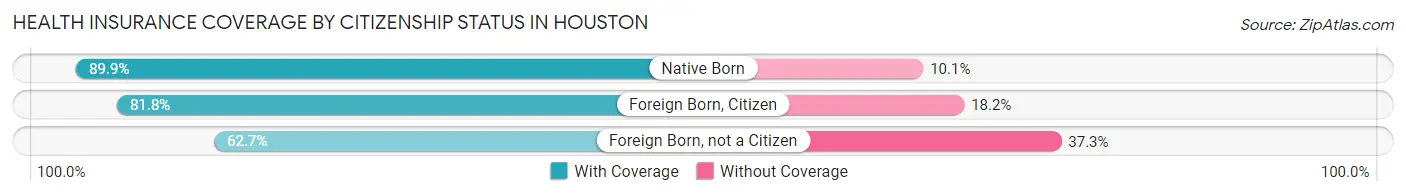
| Citizenship Status | With Coverage | Without Coverage |
| Native Born | 170,189 (89.9%) | 19,149 (10.1%) |
| Foreign Born, Citizen | 319,500 (81.8%) | 70,874 (18.2%) |
| Foreign Born, not a Citizen | 149,691 (62.7%) | 88,896 (37.3%) |
Health Insurance Coverage by Household Income in Houston
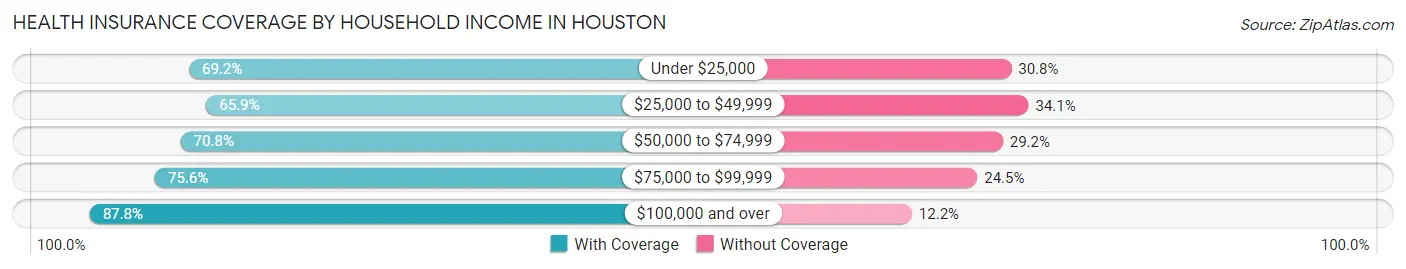
| Household Income | With Coverage | Without Coverage |
| Under $25,000 | 245,643 (69.2%) | 109,429 (30.8%) |
| $25,000 to $49,999 | 321,361 (65.9%) | 165,995 (34.1%) |
| $50,000 to $74,999 | 280,744 (70.8%) | 115,919 (29.2%) |
| $75,000 to $99,999 | 203,801 (75.5%) | 65,962 (24.4%) |
| $100,000 and over | 657,518 (87.8%) | 91,358 (12.2%) |
Public vs Private Health Insurance Coverage by Age in Houston
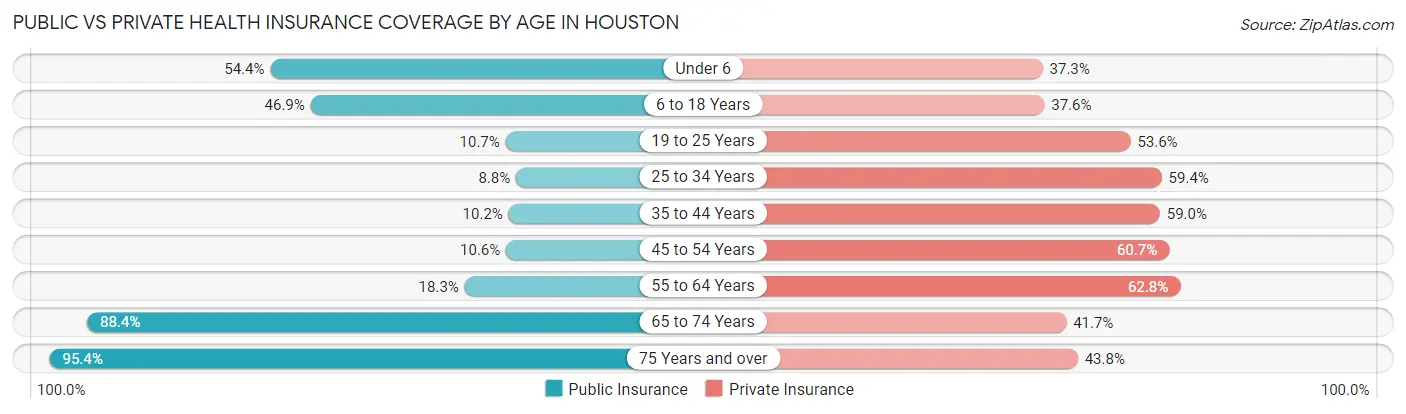
| Age Bracket | Public Insurance | Private Insurance |
| Under 6 | 102,974 (54.4%) | 70,575 (37.3%) |
| 6 to 18 Years | 183,111 (46.9%) | 146,691 (37.6%) |
| 19 to 25 Years | 25,565 (10.7%) | 127,846 (53.6%) |
| 25 to 34 Years | 32,239 (8.8%) | 217,920 (59.4%) |
| 35 to 44 Years | 33,182 (10.2%) | 192,895 (59.0%) |
| 45 to 54 Years | 28,323 (10.6%) | 162,012 (60.7%) |
| 55 to 64 Years | 43,615 (18.3%) | 149,457 (62.8%) |
| 65 to 74 Years | 139,407 (88.4%) | 65,681 (41.6%) |
| 75 Years and over | 98,902 (95.4%) | 45,407 (43.8%) |
| Total | 687,318 (30.2%) | 1,178,484 (51.7%) |
Disability Status by Sex by Age in Houston
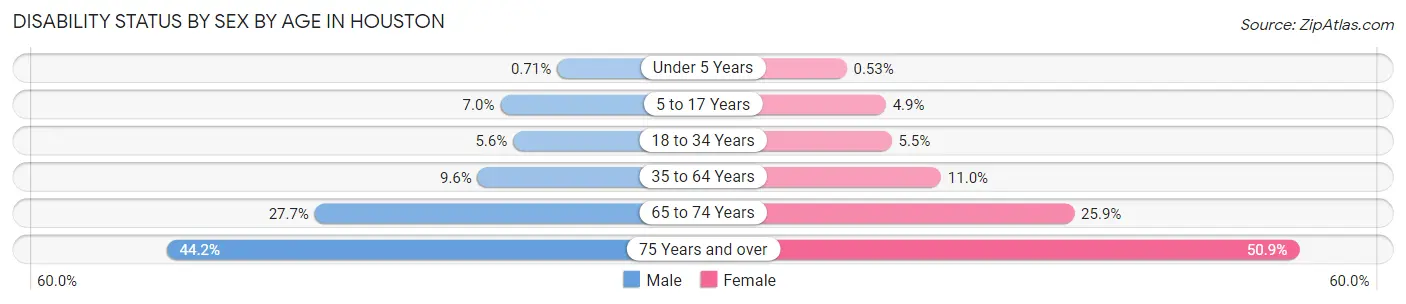
| Age Bracket | Male | Female |
| Under 5 Years | 563 (0.7%) | 419 (0.5%) |
| 5 to 17 Years | 13,739 (7.0%) | 9,595 (4.9%) |
| 18 to 34 Years | 17,839 (5.6%) | 17,592 (5.5%) |
| 35 to 64 Years | 40,321 (9.6%) | 45,200 (11.0%) |
| 65 to 74 Years | 20,202 (27.7%) | 21,927 (25.9%) |
| 75 Years and over | 18,400 (44.2%) | 31,587 (50.9%) |
Disability Class by Sex by Age in Houston
Disability Class: Hearing Difficulty
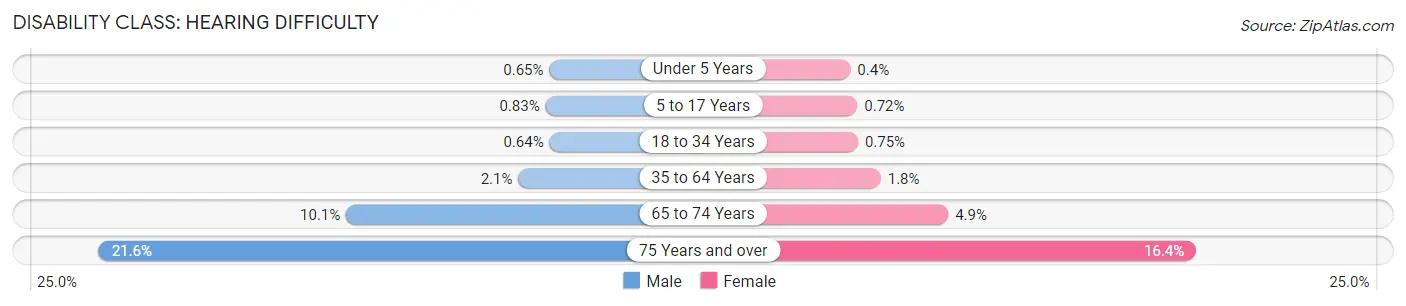
| Age Bracket | Male | Female |
| Under 5 Years | 515 (0.6%) | 316 (0.4%) |
| 5 to 17 Years | 1,623 (0.8%) | 1,413 (0.7%) |
| 18 to 34 Years | 2,049 (0.6%) | 2,382 (0.7%) |
| 35 to 64 Years | 8,802 (2.1%) | 7,397 (1.8%) |
| 65 to 74 Years | 7,352 (10.1%) | 4,188 (4.9%) |
| 75 Years and over | 8,978 (21.6%) | 10,202 (16.4%) |
Disability Class: Vision Difficulty
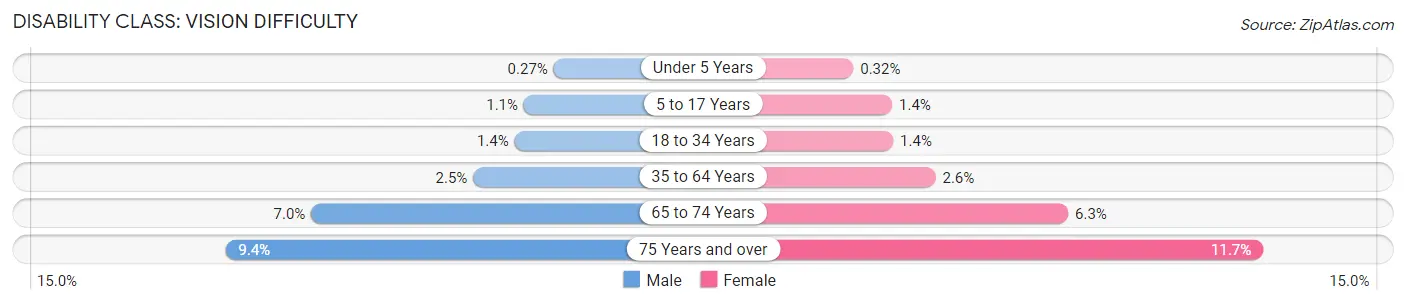
| Age Bracket | Male | Female |
| Under 5 Years | 216 (0.3%) | 250 (0.3%) |
| 5 to 17 Years | 2,147 (1.1%) | 2,743 (1.4%) |
| 18 to 34 Years | 4,337 (1.4%) | 4,529 (1.4%) |
| 35 to 64 Years | 10,600 (2.5%) | 10,680 (2.6%) |
| 65 to 74 Years | 5,120 (7.0%) | 5,336 (6.3%) |
| 75 Years and over | 3,921 (9.4%) | 7,278 (11.7%) |
Disability Class: Cognitive Difficulty
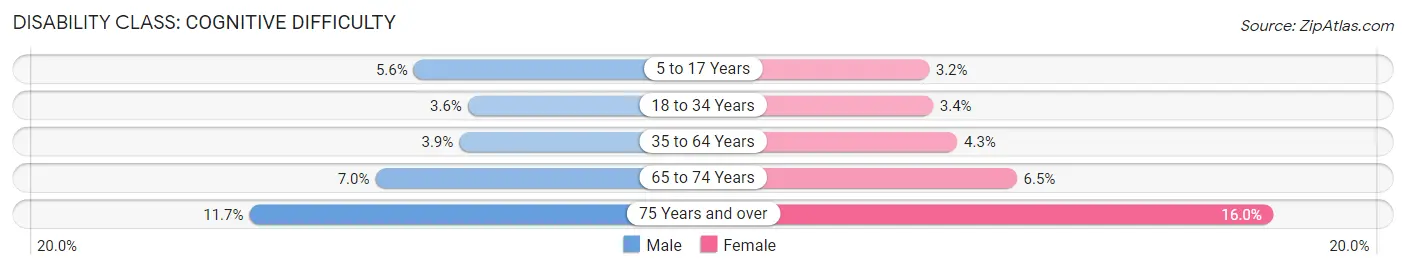
| Age Bracket | Male | Female |
| 5 to 17 Years | 10,872 (5.6%) | 6,341 (3.2%) |
| 18 to 34 Years | 11,297 (3.5%) | 10,730 (3.4%) |
| 35 to 64 Years | 16,328 (3.9%) | 17,527 (4.3%) |
| 65 to 74 Years | 5,090 (7.0%) | 5,500 (6.5%) |
| 75 Years and over | 4,856 (11.7%) | 9,945 (16.0%) |
Disability Class: Ambulatory Difficulty
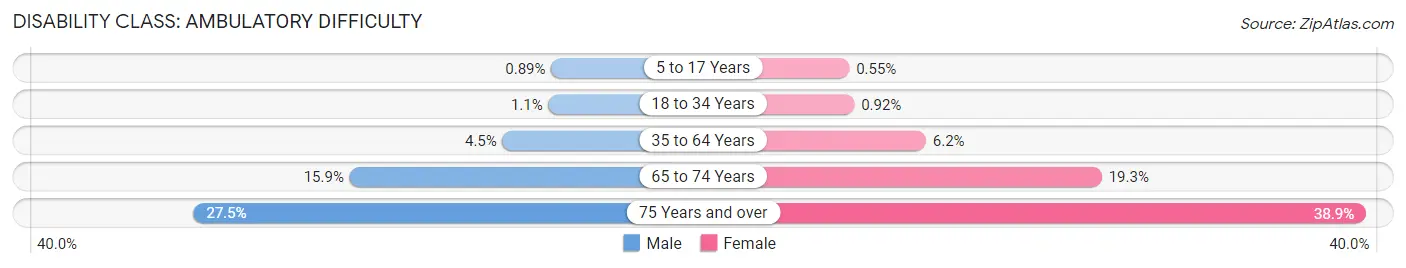
| Age Bracket | Male | Female |
| 5 to 17 Years | 1,739 (0.9%) | 1,084 (0.5%) |
| 18 to 34 Years | 3,514 (1.1%) | 2,932 (0.9%) |
| 35 to 64 Years | 19,035 (4.5%) | 25,576 (6.2%) |
| 65 to 74 Years | 11,576 (15.9%) | 16,349 (19.3%) |
| 75 Years and over | 11,441 (27.5%) | 24,151 (38.9%) |
Disability Class: Self-Care Difficulty
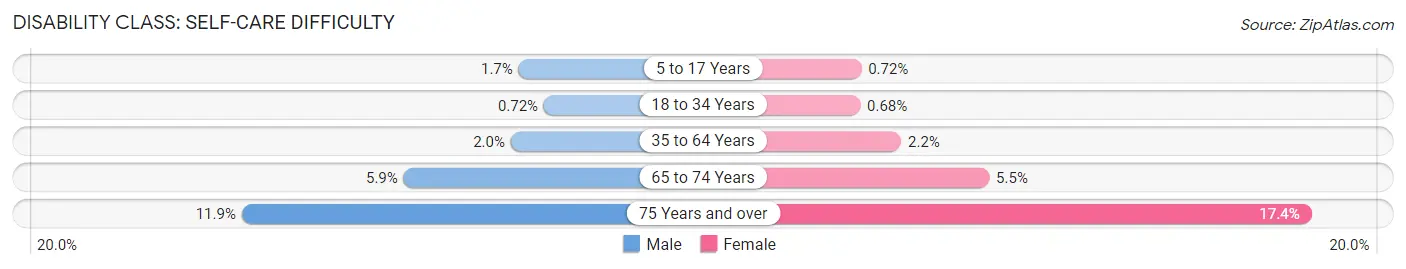
| Age Bracket | Male | Female |
| 5 to 17 Years | 3,250 (1.7%) | 1,423 (0.7%) |
| 18 to 34 Years | 2,277 (0.7%) | 2,172 (0.7%) |
| 35 to 64 Years | 8,250 (1.9%) | 8,998 (2.2%) |
| 65 to 74 Years | 4,330 (5.9%) | 4,631 (5.5%) |
| 75 Years and over | 4,973 (11.9%) | 10,824 (17.4%) |
Technology Access in Houston
Computing Device Access in Houston
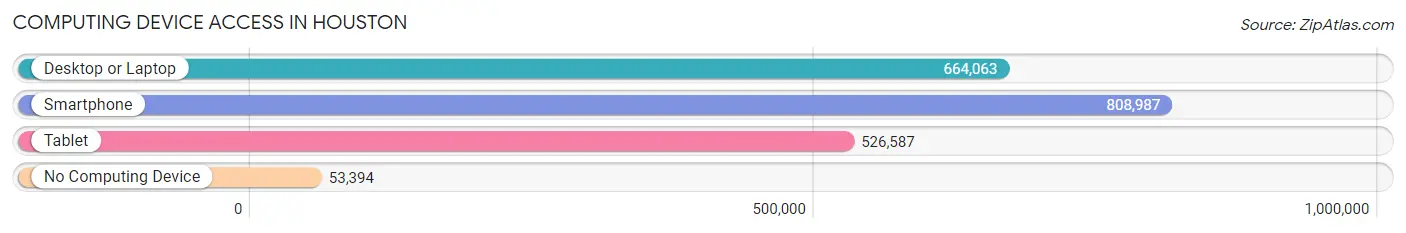
| Device Type | # Households | % Households |
| Desktop or Laptop | 664,063 | 74.0% |
| Smartphone | 808,987 | 90.1% |
| Tablet | 526,587 | 58.7% |
| No Computing Device | 53,394 | 5.9% |
| Total | 897,510 | 100.0% |
Internet Access in Houston
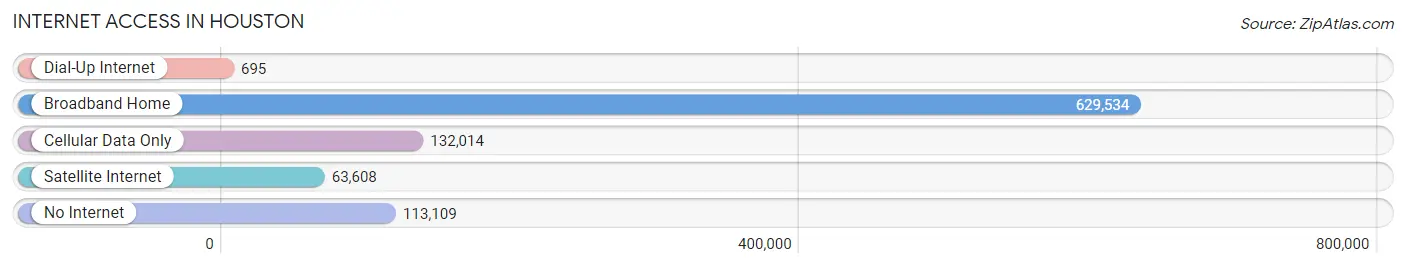
| Internet Type | # Households | % Households |
| Dial-Up Internet | 695 | 0.1% |
| Broadband Home | 629,534 | 70.1% |
| Cellular Data Only | 132,014 | 14.7% |
| Satellite Internet | 63,608 | 7.1% |
| No Internet | 113,109 | 12.6% |
| Total | 897,510 | 100.0% |
Houston Summary
Houston, Texas is the fourth largest city in the United States and the largest city in the state of Texas. It is located in the southeastern part of the state, along the Gulf Coast. Houston is the county seat of Harris County and is the economic and cultural center of the Houston–The Woodlands–Sugar Land metropolitan area, which is the fifth most populous metropolitan area in the United States.
Geography
Houston is located in the Gulf Coastal Plain region of Texas, about 50 miles (80 km) inland from the Gulf of Mexico. The city is located in the Houston–The Woodlands–Sugar Land metropolitan area, which is the fifth most populous metropolitan area in the United States. The city is situated in the southeast corner of the state, near the Gulf of Mexico. The city is bordered by the San Jacinto River to the east, the Trinity River to the north, and the Brazos River to the west. The city is also located near the Houston Ship Channel, which is a major shipping route for the region.
The city has a total area of 637.4 square miles (1,651.9 km2), of which 634.3 square miles (1,644.2 km2) is land and 3.1 square miles (7.7 km2) is water. The city is located in the humid subtropical climate zone, with hot, humid summers and mild winters. The average annual temperature is 68 °F (20 °C).
Economy
Houston is a major economic center for the state of Texas and the United States. The city is home to the headquarters of many major corporations, including ExxonMobil, ConocoPhillips, Sysco, and Halliburton. The city is also home to the Port of Houston, which is the largest port in the United States in terms of foreign tonnage. The city is also a major center for the oil and gas industry, with many major oil and gas companies having their headquarters in the city.
The city is also a major center for the aerospace industry, with NASA's Johnson Space Center located in the city. The city is also home to the Texas Medical Center, which is the largest medical center in the world.
Demographics
As of the 2010 census, the city had a population of 2,099,451, making it the fourth most populous city in the United States. The city is racially and ethnically diverse, with a population that is 44.8% White, 25.3% African American, 0.7% Native American, 5.8% Asian, 0.1% Pacific Islander, and 22.8% from other races. The city is also home to a large Hispanic population, with 37.6% of the population being of Hispanic or Latino origin.
The median household income in the city is $45,845, and the median family income is $53,811. The city has a poverty rate of 19.3%, which is higher than the national average.
Conclusion
Houston, Texas is the fourth largest city in the United States and the largest city in the state of Texas. It is located in the southeastern part of the state, along the Gulf Coast. Houston is the county seat of Harris County and is the economic and cultural center of the Houston–The Woodlands–Sugar Land metropolitan area, which is the fifth most populous metropolitan area in the United States. The city has a total area of 637.4 square miles (1,651.9 km2), of which 634.3 square miles (1,644.2 km2) is land and 3.1 square miles (7.7 km2) is water. The city is located in the humid subtropical climate zone, with hot, humid summers and mild winters. The average annual temperature is 68 °F (20 °C).
Houston is a major economic center for the state of Texas and the United States. The city is home to the headquarters of many major corporations, including ExxonMobil, ConocoPhillips, Sysco, and Halliburton. The city is also home to the Port of Houston, which is the largest port in the United States in terms of foreign tonnage. The city is also a major center for the oil and gas industry, with many major oil and gas companies having their headquarters in the city.
As of the 2010 census, the city had a population of 2,099,451, making it the fourth most populous city in the United States. The city is racially and ethnically diverse, with a population that is 44.8% White, 25.3% African American, 0.7% Native American, 5.8% Asian, 0.1% Pacific Islander, and 22.8% from other races. The city is also home to a large Hispanic population, with 37.6% of the population being of Hispanic or Latino origin. The median household income in the city is $45,845, and the median family income is $53,811. The city has a poverty rate of 19.3%, which is higher than the national average.
Common Questions
What is Per Capita Income in Houston?
Per Capita income in Houston is $38,834.
What is the Median Family Income in Houston?
Median Family Income in Houston is $68,832.
What is the Median Household income in Houston?
Median Household Income in Houston is $60,440.
What is Income or Wage Gap in Houston?
Income or Wage Gap in Houston is 21.5%.
Women in Houston earn 78.5 cents for every dollar earned by a man.
What is Family Income Deficit in Houston?
Family Income Deficit in Houston is $11,809.
Families that are below poverty line in Houston earn $11,809 less on average than the poverty threshold level.
What is Inequality or Gini Index in Houston?
Inequality or Gini Index in Houston is 0.53.
What is the Total Population of Houston?
Total Population of Houston is 2,296,253.
What is the Total Male Population of Houston?
Total Male Population of Houston is 1,142,243.
What is the Total Female Population of Houston?
Total Female Population of Houston is 1,154,010.
What is the Ratio of Males per 100 Females in Houston?
There are 98.98 Males per 100 Females in Houston.
What is the Ratio of Females per 100 Males in Houston?
There are 101.03 Females per 100 Males in Houston.
What is the Median Population Age in Houston?
Median Population Age in Houston is 33.9 Years.
What is the Average Family Size in Houston
Average Family Size in Houston is 3.3 People.
What is the Average Household Size in Houston
Average Household Size in Houston is 2.5 People.
How Large is the Labor Force in Houston?
There are 1,208,614 People in the Labor Forcein in Houston.
What is the Percentage of People in the Labor Force in Houston?
66.9% of People are in the Labor Force in Houston.
What is the Unemployment Rate in Houston?
Unemployment Rate in Houston is 6.6%.