Memphis, TN Map & Demographics
Memphis Map
Memphis Overview
$31,060
PER CAPITA INCOME
$60,089
AVG FAMILY INCOME
$48,090
AVG HOUSEHOLD INCOME
12.8%
WAGE / INCOME GAP [ % ]
87.2¢/ $1
WAGE / INCOME GAP [ $ ]
$12,298
FAMILY INCOME DEFICIT
0.52
INEQUALITY / GINI INDEX
630,027
TOTAL POPULATION
299,702
MALE POPULATION
330,325
FEMALE POPULATION
90.73
MALES / 100 FEMALES
110.22
FEMALES / 100 MALES
34.5
MEDIAN AGE
3.4
AVG FAMILY SIZE
2.5
AVG HOUSEHOLD SIZE
312,423
LABOR FORCE [ PEOPLE ]
63.6%
PERCENT IN LABOR FORCE
8.6%
UNEMPLOYMENT RATE
Memphis Zip Codes
Memphis Area Codes
Income in Memphis
Income Overview in Memphis
Per Capita Income in Memphis is $31,060, while median incomes of families and households are $60,089 and $48,090 respectively.
| Characteristic | Number | Measure |
| Per Capita Income | 630,027 | $31,060 |
| Median Family Income | 137,948 | $60,089 |
| Mean Family Income | 137,948 | $91,025 |
| Median Household Income | 251,586 | $48,090 |
| Mean Household Income | 251,586 | $74,176 |
| Income Deficit | 137,948 | $12,298 |
| Wage / Income Gap (%) | 630,027 | 12.76% |
| Wage / Income Gap ($) | 630,027 | 87.24¢ per $1 |
| Gini / Inequality Index | 630,027 | 0.52 |
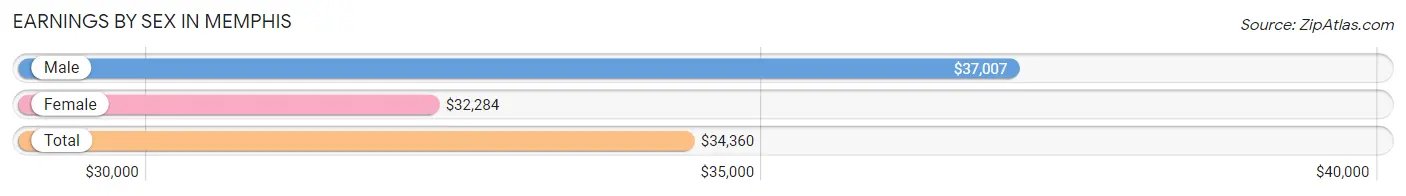
Earnings by Sex in Memphis
Average Earnings in Memphis are $34,360, $37,007 for men and $32,284 for women, a difference of 12.8%.
| Sex | Number | Average Earnings |
| Male | 154,425 (48.7%) | $37,007 |
| Female | 162,864 (51.3%) | $32,284 |
| Total | 317,289 (100.0%) | $34,360 |
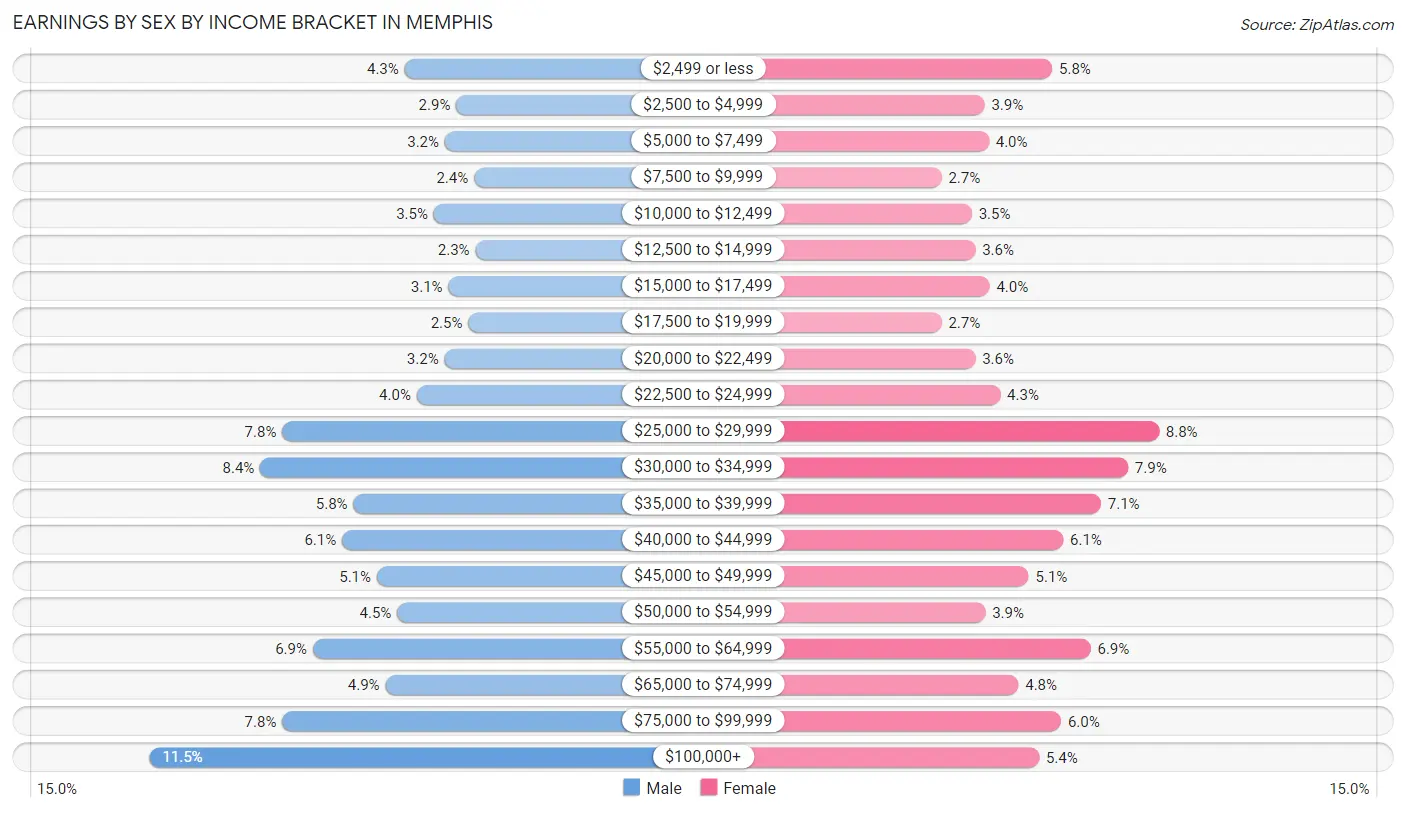
Earnings by Sex by Income Bracket in Memphis
The most common earnings brackets in Memphis are $100,000+ for men (17,740 | 11.5%) and $25,000 to $29,999 for women (14,289 | 8.8%).
| Income | Male | Female |
| $2,499 or less | 6,664 (4.3%) | 9,405 (5.8%) |
| $2,500 to $4,999 | 4,425 (2.9%) | 6,307 (3.9%) |
| $5,000 to $7,499 | 4,932 (3.2%) | 6,498 (4.0%) |
| $7,500 to $9,999 | 3,657 (2.4%) | 4,326 (2.7%) |
| $10,000 to $12,499 | 5,406 (3.5%) | 5,720 (3.5%) |
| $12,500 to $14,999 | 3,602 (2.3%) | 5,885 (3.6%) |
| $15,000 to $17,499 | 4,778 (3.1%) | 6,528 (4.0%) |
| $17,500 to $19,999 | 3,904 (2.5%) | 4,328 (2.7%) |
| $20,000 to $22,499 | 4,945 (3.2%) | 5,879 (3.6%) |
| $22,500 to $24,999 | 6,144 (4.0%) | 7,020 (4.3%) |
| $25,000 to $29,999 | 11,981 (7.8%) | 14,289 (8.8%) |
| $30,000 to $34,999 | 12,939 (8.4%) | 12,871 (7.9%) |
| $35,000 to $39,999 | 8,899 (5.8%) | 11,631 (7.1%) |
| $40,000 to $44,999 | 9,382 (6.1%) | 9,905 (6.1%) |
| $45,000 to $49,999 | 7,879 (5.1%) | 8,322 (5.1%) |
| $50,000 to $54,999 | 6,997 (4.5%) | 6,337 (3.9%) |
| $55,000 to $64,999 | 10,655 (6.9%) | 11,162 (6.9%) |
| $65,000 to $74,999 | 7,506 (4.9%) | 7,850 (4.8%) |
| $75,000 to $99,999 | 11,990 (7.8%) | 9,806 (6.0%) |
| $100,000+ | 17,740 (11.5%) | 8,795 (5.4%) |
| Total | 154,425 (100.0%) | 162,864 (100.0%) |
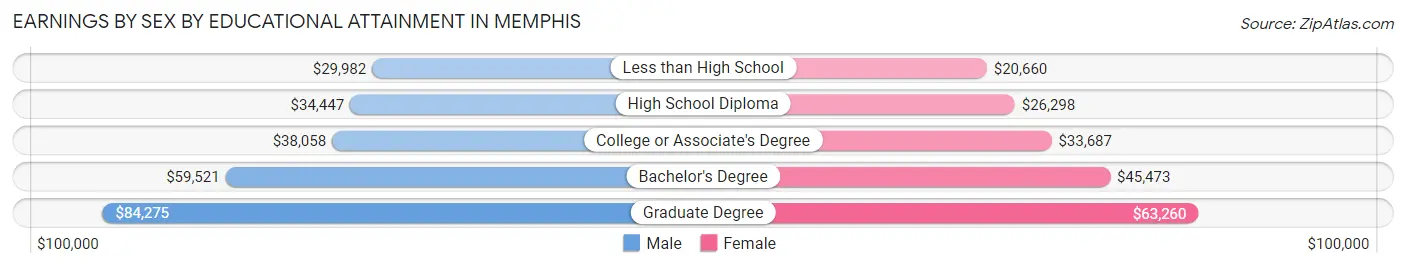
Earnings by Sex by Educational Attainment in Memphis
Average earnings in Memphis are $41,659 for men and $36,026 for women, a difference of 13.5%. Men with an educational attainment of graduate degree enjoy the highest average annual earnings of $84,275, while those with less than high school education earn the least with $29,982. Women with an educational attainment of graduate degree earn the most with the average annual earnings of $63,260, while those with less than high school education have the smallest earnings of $20,660.
| Educational Attainment | Male Income | Female Income |
| Less than High School | $29,982 | $20,660 |
| High School Diploma | $34,447 | $26,298 |
| College or Associate's Degree | $38,058 | $33,687 |
| Bachelor's Degree | $59,521 | $45,473 |
| Graduate Degree | $84,275 | $63,260 |
| Total | $41,659 | $36,026 |
Family Income in Memphis
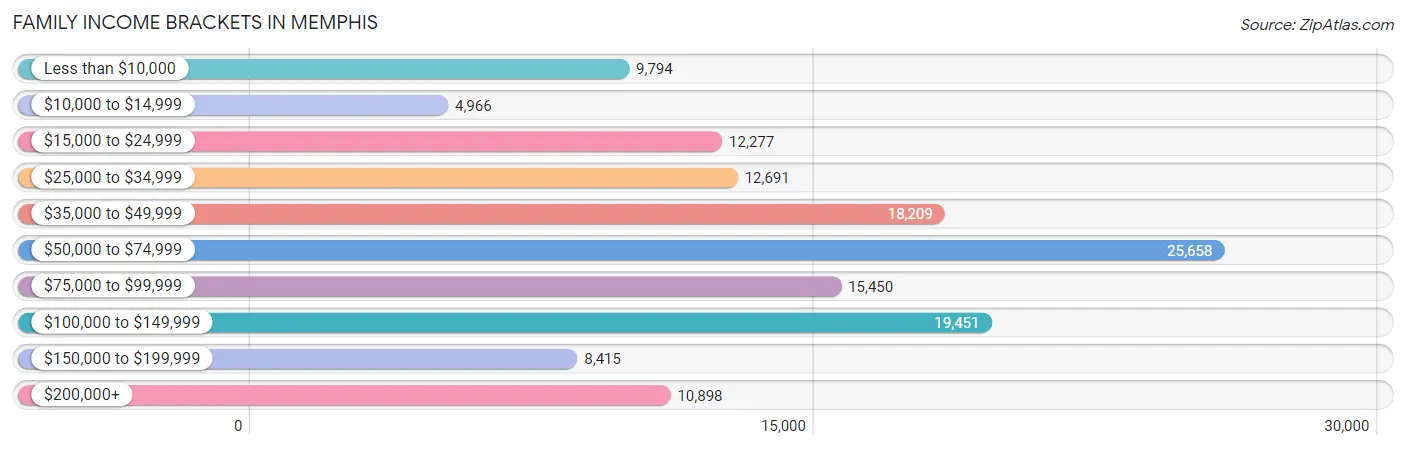
Family Income Brackets in Memphis
According to the Memphis family income data, there are 25,658 families falling into the $50,000 to $74,999 income range, which is the most common income bracket and makes up 18.6% of all families. Conversely, the $10,000 to $14,999 income bracket is the least frequent group with only 4,966 families (3.6%) belonging to this category.
| Income Bracket | # Families | % Families |
| Less than $10,000 | 9,794 | 7.1% |
| $10,000 to $14,999 | 4,966 | 3.6% |
| $15,000 to $24,999 | 12,277 | 8.9% |
| $25,000 to $34,999 | 12,691 | 9.2% |
| $35,000 to $49,999 | 18,209 | 13.2% |
| $50,000 to $74,999 | 25,658 | 18.6% |
| $75,000 to $99,999 | 15,450 | 11.2% |
| $100,000 to $149,999 | 19,451 | 14.1% |
| $150,000 to $199,999 | 8,415 | 6.1% |
| $200,000+ | 10,898 | 7.9% |
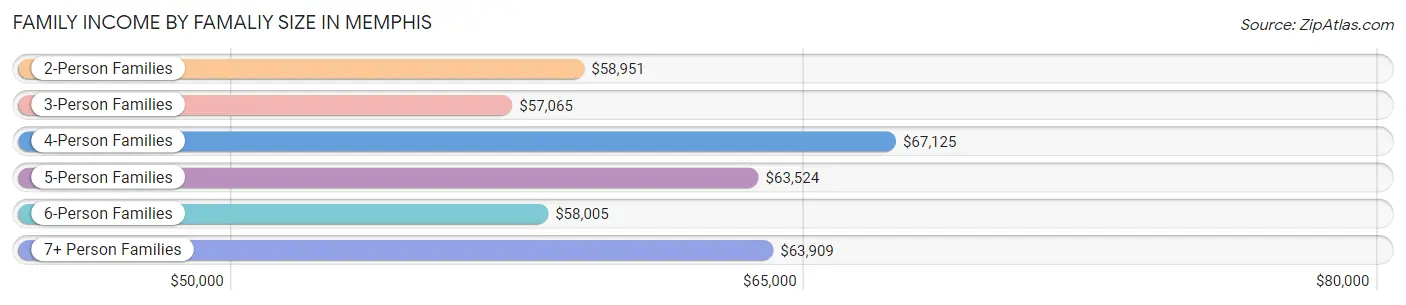
Family Income by Famaliy Size in Memphis
4-person families (22,079 | 16.0%) account for the highest median family income in Memphis with $67,125 per family, while 2-person families (66,805 | 48.4%) have the highest median income of $29,476 per family member.
| Income Bracket | # Families | Median Income |
| 2-Person Families | 66,805 (48.4%) | $58,951 |
| 3-Person Families | 32,666 (23.7%) | $57,065 |
| 4-Person Families | 22,079 (16.0%) | $67,125 |
| 5-Person Families | 8,971 (6.5%) | $63,524 |
| 6-Person Families | 4,666 (3.4%) | $58,005 |
| 7+ Person Families | 2,761 (2.0%) | $63,909 |
| Total | 137,948 (100.0%) | $60,089 |
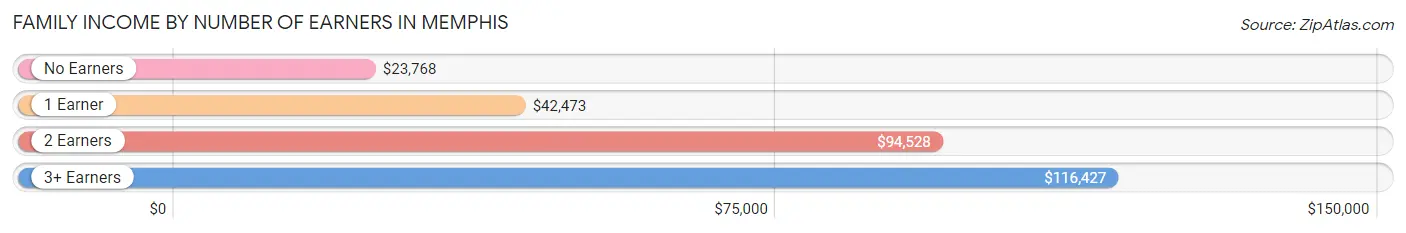
Family Income by Number of Earners in Memphis
The median family income in Memphis is $60,089, with families comprising 3+ earners (12,215) having the highest median family income of $116,427, while families with no earners (19,566) have the lowest median family income of $23,768, accounting for 8.8% and 14.2% of families, respectively.
| Number of Earners | # Families | Median Income |
| No Earners | 19,566 (14.2%) | $23,768 |
| 1 Earner | 57,765 (41.9%) | $42,473 |
| 2 Earners | 48,402 (35.1%) | $94,528 |
| 3+ Earners | 12,215 (8.8%) | $116,427 |
| Total | 137,948 (100.0%) | $60,089 |
Household Income in Memphis
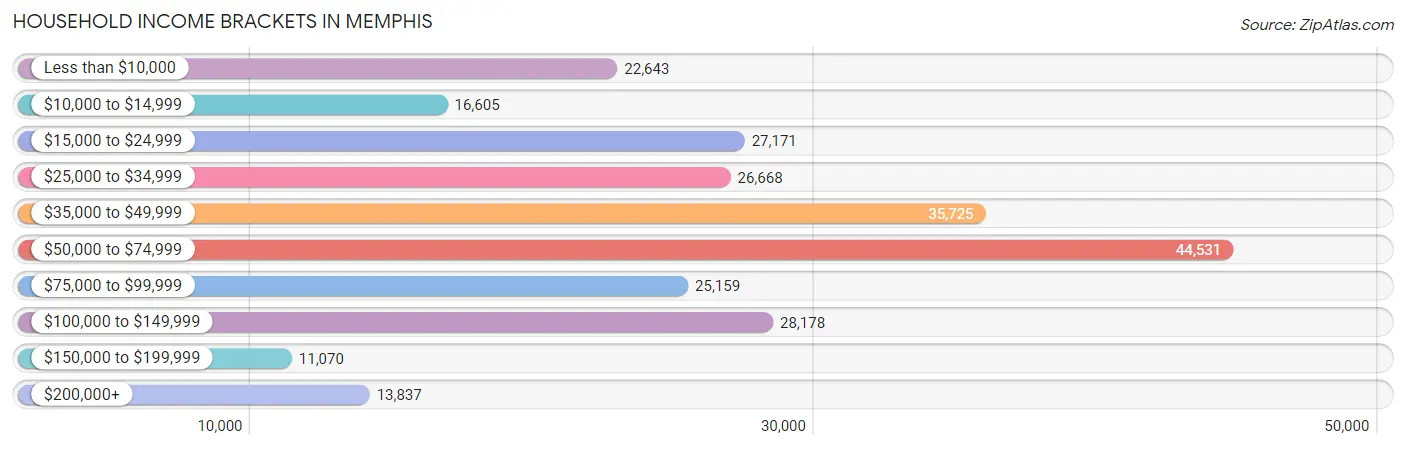
Household Income Brackets in Memphis
With 44,531 households falling in the category, the $50,000 to $74,999 income range is the most frequent in Memphis, accounting for 17.7% of all households. In contrast, only 11,070 households (4.4%) fall into the $150,000 to $199,999 income bracket, making it the least populous group.
| Income Bracket | # Households | % Households |
| Less than $10,000 | 22,643 | 9.0% |
| $10,000 to $14,999 | 16,605 | 6.6% |
| $15,000 to $24,999 | 27,171 | 10.8% |
| $25,000 to $34,999 | 26,668 | 10.6% |
| $35,000 to $49,999 | 35,725 | 14.2% |
| $50,000 to $74,999 | 44,531 | 17.7% |
| $75,000 to $99,999 | 25,159 | 10.0% |
| $100,000 to $149,999 | 28,178 | 11.2% |
| $150,000 to $199,999 | 11,070 | 4.4% |
| $200,000+ | 13,837 | 5.5% |
Household Income by Householder Age in Memphis
The median household income in Memphis is $48,090, with the highest median household income of $55,957 found in the 45 to 64 years age bracket for the primary householder. A total of 86,791 households (34.5%) fall into this category. Meanwhile, the 15 to 24 years age bracket for the primary householder has the lowest median household income of $31,017, with 12,566 households (5.0%) in this group.
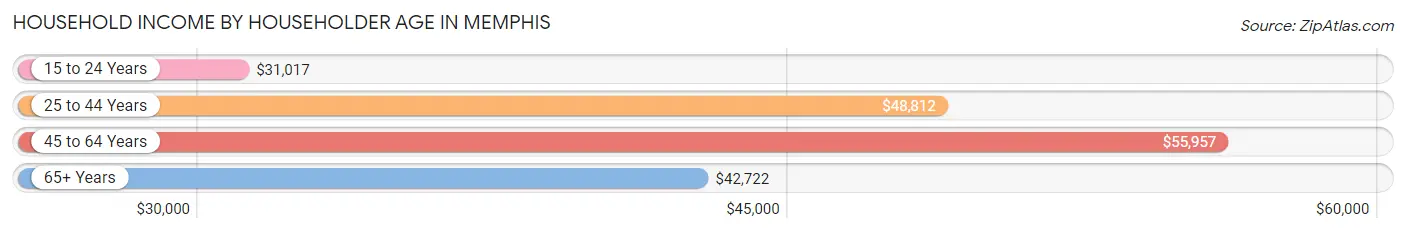
| Income Bracket | # Households | Median Income |
| 15 to 24 Years | 12,566 (5.0%) | $31,017 |
| 25 to 44 Years | 91,710 (36.4%) | $48,812 |
| 45 to 64 Years | 86,791 (34.5%) | $55,957 |
| 65+ Years | 60,519 (24.0%) | $42,722 |
| Total | 251,586 (100.0%) | $48,090 |
Poverty in Memphis
Income Below Poverty by Sex and Age in Memphis
With 21.6% poverty level for males and 25.4% for females among the residents of Memphis, 5 year old males and under 5 year old females are the most vulnerable to poverty, with 2,462 males (52.1%) and 9,024 females (42.4%) in their respective age groups living below the poverty level.
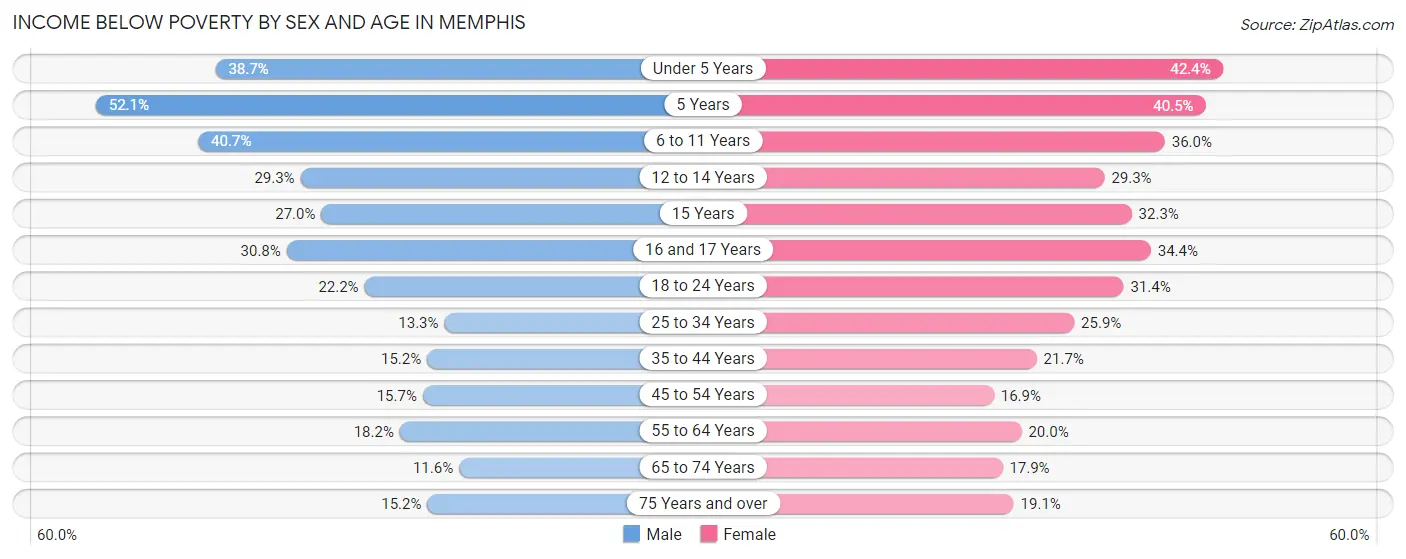
| Age Bracket | Male | Female |
| Under 5 Years | 8,729 (38.7%) | 9,024 (42.4%) |
| 5 Years | 2,462 (52.1%) | 1,958 (40.5%) |
| 6 to 11 Years | 10,641 (40.7%) | 8,725 (36.0%) |
| 12 to 14 Years | 3,715 (29.3%) | 3,559 (29.2%) |
| 15 Years | 1,120 (27.0%) | 1,063 (32.3%) |
| 16 and 17 Years | 2,442 (30.8%) | 2,770 (34.4%) |
| 18 to 24 Years | 6,291 (22.2%) | 9,343 (31.4%) |
| 25 to 34 Years | 6,344 (13.3%) | 13,556 (25.9%) |
| 35 to 44 Years | 5,337 (15.2%) | 8,633 (21.7%) |
| 45 to 54 Years | 5,117 (15.7%) | 6,270 (16.9%) |
| 55 to 64 Years | 6,205 (18.2%) | 7,998 (20.0%) |
| 65 to 74 Years | 2,684 (11.6%) | 5,532 (17.9%) |
| 75 Years and over | 1,711 (15.1%) | 3,962 (19.1%) |
| Total | 62,798 (21.6%) | 82,393 (25.4%) |
Income Above Poverty by Sex and Age in Memphis
According to the poverty statistics in Memphis, males aged 65 to 74 years and females aged 45 to 54 years are the age groups that are most secure financially, with 88.4% of males and 83.1% of females in these age groups living above the poverty line.
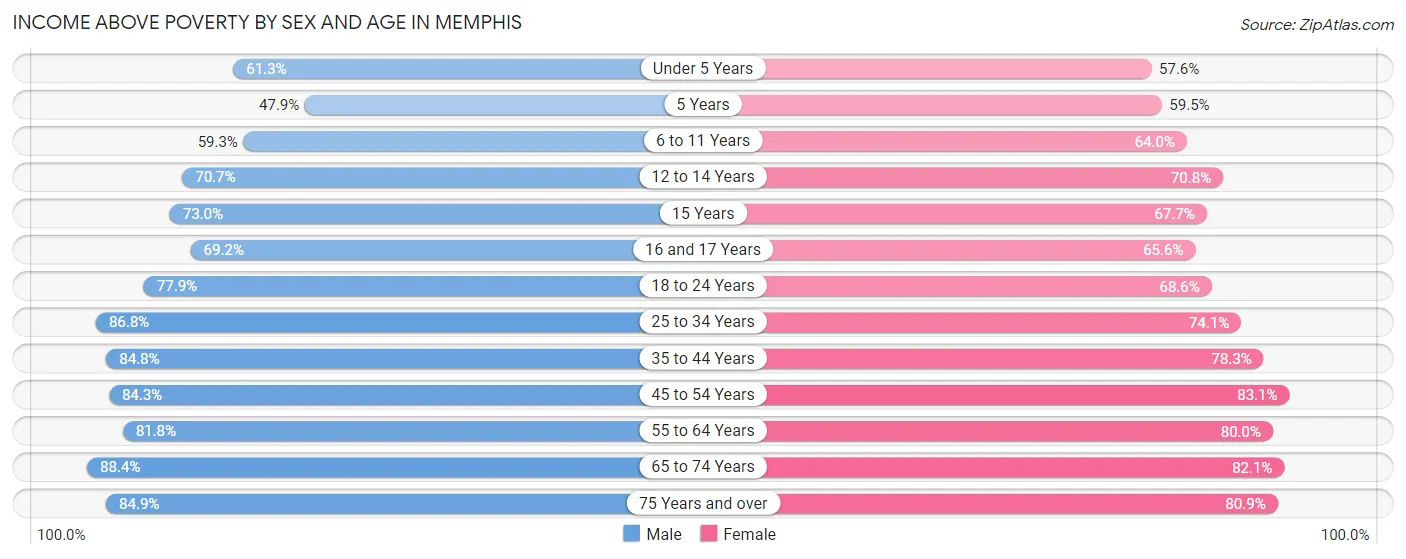
| Age Bracket | Male | Female |
| Under 5 Years | 13,802 (61.3%) | 12,259 (57.6%) |
| 5 Years | 2,266 (47.9%) | 2,878 (59.5%) |
| 6 to 11 Years | 15,523 (59.3%) | 15,533 (64.0%) |
| 12 to 14 Years | 8,972 (70.7%) | 8,607 (70.8%) |
| 15 Years | 3,034 (73.0%) | 2,230 (67.7%) |
| 16 and 17 Years | 5,481 (69.2%) | 5,279 (65.6%) |
| 18 to 24 Years | 22,107 (77.8%) | 20,430 (68.6%) |
| 25 to 34 Years | 41,537 (86.8%) | 38,830 (74.1%) |
| 35 to 44 Years | 29,832 (84.8%) | 31,155 (78.3%) |
| 45 to 54 Years | 27,557 (84.3%) | 30,754 (83.1%) |
| 55 to 64 Years | 27,851 (81.8%) | 31,963 (80.0%) |
| 65 to 74 Years | 20,421 (88.4%) | 25,394 (82.1%) |
| 75 Years and over | 9,584 (84.9%) | 16,739 (80.9%) |
| Total | 227,967 (78.4%) | 242,051 (74.6%) |
Income Below Poverty Among Married-Couple Families in Memphis
The poverty statistics for married-couple families in Memphis show that 6.7% or 4,614 of the total 68,970 families live below the poverty line. Families with 5 or more children have the highest poverty rate of 43.6%, comprising of 257 families. On the other hand, families with no children have the lowest poverty rate of 4.5%, which includes 1,963 families.
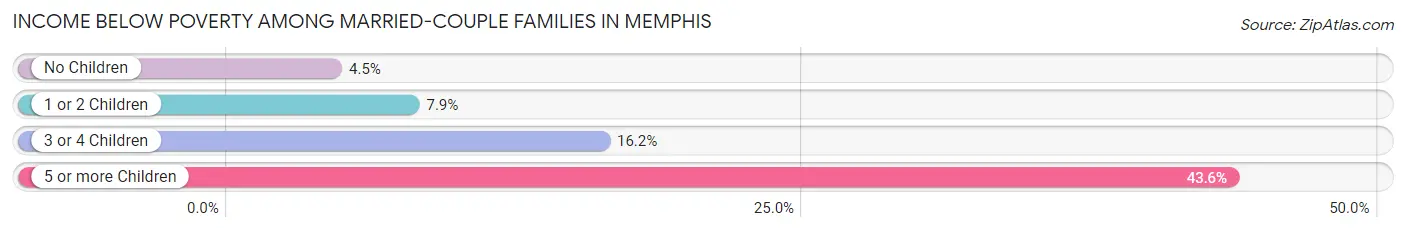
| Children | Above Poverty | Below Poverty |
| No Children | 41,406 (95.5%) | 1,963 (4.5%) |
| 1 or 2 Children | 18,394 (92.1%) | 1,578 (7.9%) |
| 3 or 4 Children | 4,223 (83.8%) | 816 (16.2%) |
| 5 or more Children | 333 (56.4%) | 257 (43.6%) |
| Total | 64,356 (93.3%) | 4,614 (6.7%) |
Income Below Poverty Among Single-Parent Households in Memphis
According to the poverty data in Memphis, 19.5% or 2,523 single-father households and 32.8% or 18,390 single-mother households are living below the poverty line. Among single-father households, those with 3 or 4 children have the highest poverty rate, with 506 households (44.2%) experiencing poverty. Likewise, among single-mother households, those with 5 or more children have the highest poverty rate, with 1,181 households (89.5%) falling below the poverty line.
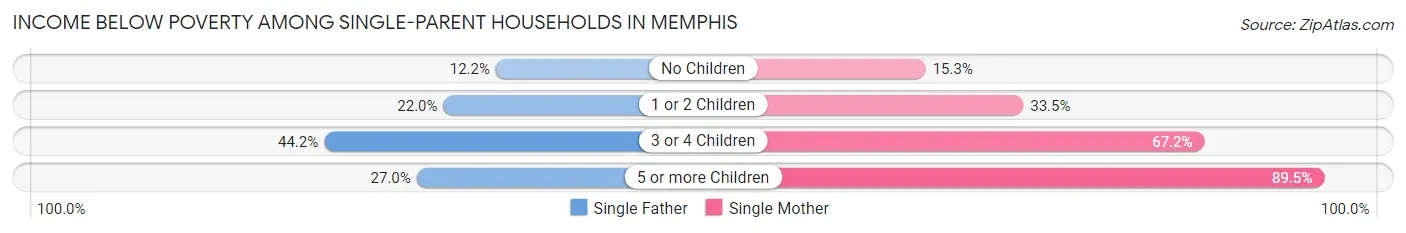
| Children | Single Father | Single Mother |
| No Children | 745 (12.2%) | 2,910 (15.3%) |
| 1 or 2 Children | 1,187 (22.0%) | 9,586 (33.5%) |
| 3 or 4 Children | 506 (44.2%) | 4,713 (67.2%) |
| 5 or more Children | 85 (27.0%) | 1,181 (89.5%) |
| Total | 2,523 (19.5%) | 18,390 (32.8%) |
Income Below Poverty Among Married-Couple vs Single-Parent Households in Memphis
The poverty data for Memphis shows that 4,614 of the married-couple family households (6.7%) and 20,913 of the single-parent households (30.3%) are living below the poverty level. Within the married-couple family households, those with 5 or more children have the highest poverty rate, with 257 households (43.6%) falling below the poverty line. Among the single-parent households, those with 5 or more children have the highest poverty rate, with 1,266 household (77.4%) living below poverty.
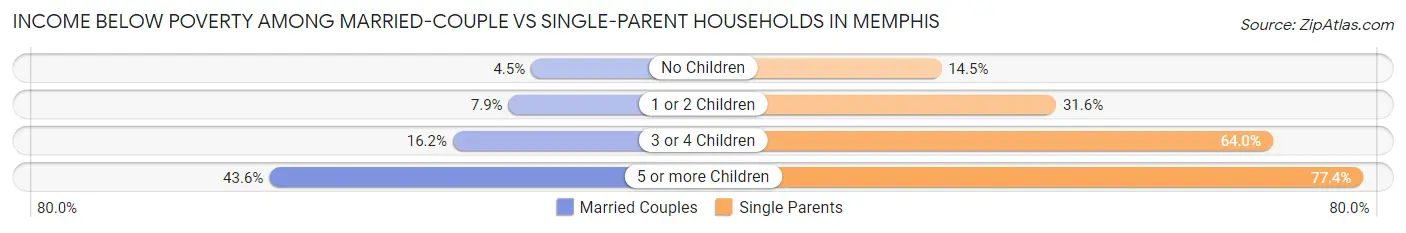
| Children | Married-Couple Families | Single-Parent Households |
| No Children | 1,963 (4.5%) | 3,655 (14.5%) |
| 1 or 2 Children | 1,578 (7.9%) | 10,773 (31.6%) |
| 3 or 4 Children | 816 (16.2%) | 5,219 (63.9%) |
| 5 or more Children | 257 (43.6%) | 1,266 (77.4%) |
| Total | 4,614 (6.7%) | 20,913 (30.3%) |
Race in Memphis
The most populous races in Memphis are Black / African American (405,463 | 64.4%), White / Caucasian (166,679 | 26.5%), and Hispanic or Latino (50,539 | 8.0%).
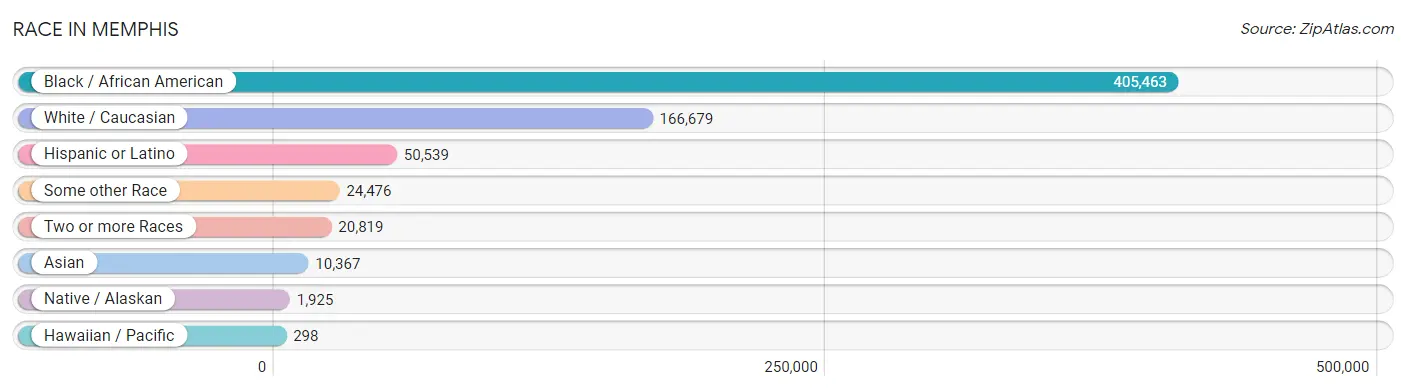
| Race | # Population | % Population |
| Asian | 10,367 | 1.7% |
| Black / African American | 405,463 | 64.4% |
| Hawaiian / Pacific | 298 | 0.1% |
| Hispanic or Latino | 50,539 | 8.0% |
| Native / Alaskan | 1,925 | 0.3% |
| White / Caucasian | 166,679 | 26.5% |
| Two or more Races | 20,819 | 3.3% |
| Some other Race | 24,476 | 3.9% |
| Total | 630,027 | 100.0% |
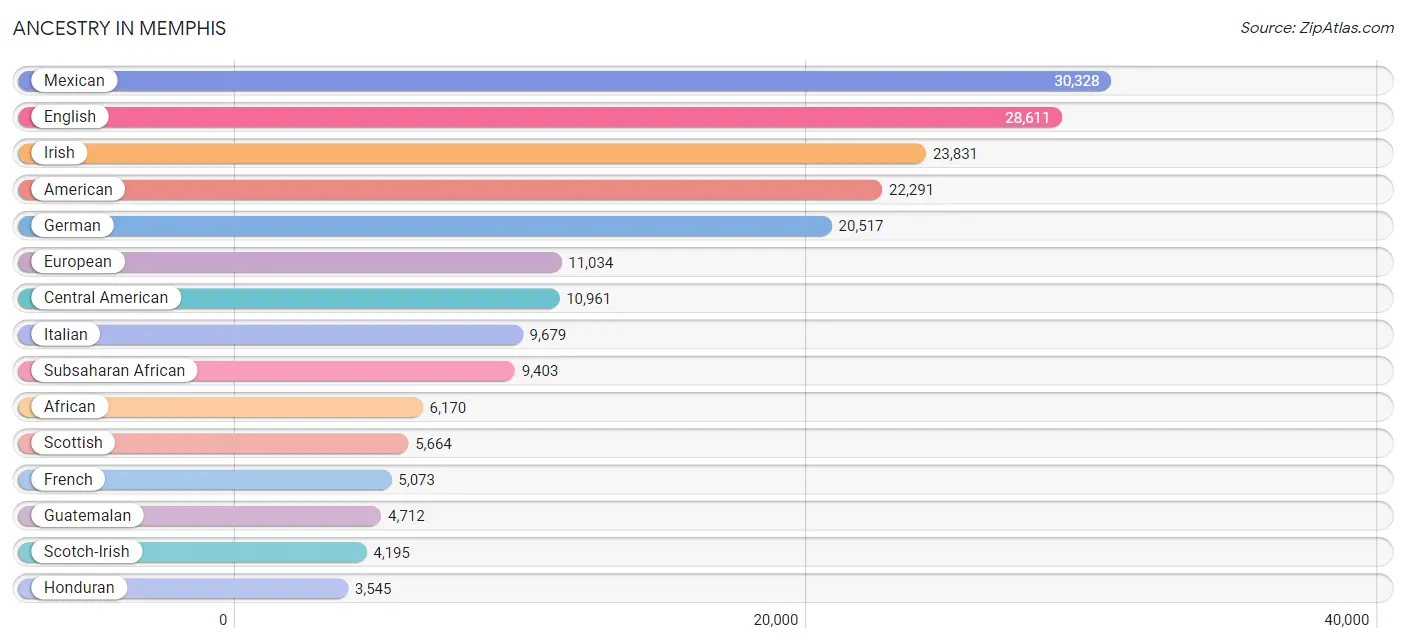
Ancestry in Memphis
The most populous ancestries reported in Memphis are Mexican (30,328 | 4.8%), English (28,611 | 4.5%), Irish (23,831 | 3.8%), American (22,291 | 3.5%), and German (20,517 | 3.3%), together accounting for 19.9% of all Memphis residents.
| Ancestry | # Population | % Population |
| African | 6,170 | 1.0% |
| Albanian | 25 | 0.0% |
| Alsatian | 7 | 0.0% |
| American | 22,291 | 3.5% |
| Apache | 146 | 0.0% |
| Arab | 2,271 | 0.4% |
| Argentinean | 135 | 0.0% |
| Armenian | 74 | 0.0% |
| Assyrian / Chaldean / Syriac | 8 | 0.0% |
| Australian | 23 | 0.0% |
| Austrian | 546 | 0.1% |
| Bahamian | 36 | 0.0% |
| Bangladeshi | 82 | 0.0% |
| Barbadian | 19 | 0.0% |
| Basque | 5 | 0.0% |
| Belgian | 100 | 0.0% |
| Belizean | 21 | 0.0% |
| Bermudan | 7 | 0.0% |
| Bhutanese | 421 | 0.1% |
| Blackfeet | 169 | 0.0% |
| Bolivian | 6 | 0.0% |
| Brazilian | 188 | 0.0% |
| British | 1,972 | 0.3% |
| British West Indian | 49 | 0.0% |
| Bulgarian | 34 | 0.0% |
| Burmese | 746 | 0.1% |
| Cajun | 61 | 0.0% |
| Cambodian | 166 | 0.0% |
| Canadian | 226 | 0.0% |
| Cape Verdean | 57 | 0.0% |
| Celtic | 31 | 0.0% |
| Central American | 10,961 | 1.7% |
| Central American Indian | 145 | 0.0% |
| Cherokee | 1,266 | 0.2% |
| Cheyenne | 16 | 0.0% |
| Chickasaw | 45 | 0.0% |
| Chilean | 22 | 0.0% |
| Chippewa | 8 | 0.0% |
| Choctaw | 64 | 0.0% |
| Colombian | 620 | 0.1% |
| Costa Rican | 32 | 0.0% |
| Creek | 29 | 0.0% |
| Croatian | 151 | 0.0% |
| Crow | 14 | 0.0% |
| Cuban | 1,151 | 0.2% |
| Czech | 668 | 0.1% |
| Czechoslovakian | 128 | 0.0% |
| Danish | 269 | 0.0% |
| Dominican | 434 | 0.1% |
| Dutch | 1,939 | 0.3% |
| Eastern European | 952 | 0.2% |
| Ecuadorian | 96 | 0.0% |
| Egyptian | 277 | 0.0% |
| English | 28,611 | 4.5% |
| Estonian | 9 | 0.0% |
| Ethiopian | 768 | 0.1% |
| European | 11,034 | 1.8% |
| Filipino | 162 | 0.0% |
| Finnish | 99 | 0.0% |
| French | 5,073 | 0.8% |
| French American Indian | 2 | 0.0% |
| French Canadian | 835 | 0.1% |
| German | 20,517 | 3.3% |
| Ghanaian | 175 | 0.0% |
| Greek | 931 | 0.2% |
| Guatemalan | 4,712 | 0.7% |
| Guyanese | 15 | 0.0% |
| Haitian | 68 | 0.0% |
| Honduran | 3,545 | 0.6% |
| Hungarian | 451 | 0.1% |
| Icelander | 10 | 0.0% |
| Indian (Asian) | 2,509 | 0.4% |
| Indonesian | 59 | 0.0% |
| Iranian | 222 | 0.0% |
| Iraqi | 22 | 0.0% |
| Irish | 23,831 | 3.8% |
| Iroquois | 2 | 0.0% |
| Israeli | 132 | 0.0% |
| Italian | 9,679 | 1.5% |
| Jamaican | 546 | 0.1% |
| Japanese | 367 | 0.1% |
| Jordanian | 9 | 0.0% |
| Kenyan | 43 | 0.0% |
| Kiowa | 11 | 0.0% |
| Korean | 1,399 | 0.2% |
| Laotian | 52 | 0.0% |
| Latvian | 10 | 0.0% |
| Lebanese | 442 | 0.1% |
| Liberian | 10 | 0.0% |
| Lithuanian | 412 | 0.1% |
| Lumbee | 5 | 0.0% |
| Malaysian | 321 | 0.1% |
| Mexican | 30,328 | 4.8% |
| Mexican American Indian | 629 | 0.1% |
| Mongolian | 12 | 0.0% |
| Moroccan | 15 | 0.0% |
| Native Hawaiian | 399 | 0.1% |
| Navajo | 64 | 0.0% |
| Nicaraguan | 297 | 0.1% |
| Nigerian | 1,071 | 0.2% |
| Northern European | 437 | 0.1% |
| Norwegian | 1,343 | 0.2% |
| Okinawan | 2 | 0.0% |
| Pakistani | 188 | 0.0% |
| Palestinian | 352 | 0.1% |
| Panamanian | 294 | 0.1% |
| Paraguayan | 6 | 0.0% |
| Pennsylvania German | 11 | 0.0% |
| Peruvian | 489 | 0.1% |
| Polish | 3,155 | 0.5% |
| Portuguese | 440 | 0.1% |
| Pueblo | 57 | 0.0% |
| Puerto Rican | 1,952 | 0.3% |
| Romanian | 185 | 0.0% |
| Russian | 1,134 | 0.2% |
| Salvadoran | 2,081 | 0.3% |
| Samoan | 41 | 0.0% |
| Scandinavian | 697 | 0.1% |
| Scotch-Irish | 4,195 | 0.7% |
| Scottish | 5,664 | 0.9% |
| Seminole | 13 | 0.0% |
| Senegalese | 60 | 0.0% |
| Serbian | 60 | 0.0% |
| Sierra Leonean | 16 | 0.0% |
| Sioux | 100 | 0.0% |
| Slavic | 91 | 0.0% |
| Slovak | 70 | 0.0% |
| Slovene | 10 | 0.0% |
| Somali | 77 | 0.0% |
| South African | 100 | 0.0% |
| South American | 2,838 | 0.4% |
| South American Indian | 6 | 0.0% |
| Spaniard | 488 | 0.1% |
| Spanish | 493 | 0.1% |
| Spanish American | 22 | 0.0% |
| Sri Lankan | 3,375 | 0.5% |
| Subsaharan African | 9,403 | 1.5% |
| Sudanese | 168 | 0.0% |
| Swedish | 1,376 | 0.2% |
| Swiss | 610 | 0.1% |
| Syrian | 111 | 0.0% |
| Thai | 2,284 | 0.4% |
| Trinidadian and Tobagonian | 369 | 0.1% |
| Turkish | 105 | 0.0% |
| U.S. Virgin Islander | 18 | 0.0% |
| Ugandan | 14 | 0.0% |
| Ukrainian | 244 | 0.0% |
| Uruguayan | 11 | 0.0% |
| Venezuelan | 1,274 | 0.2% |
| Vietnamese | 129 | 0.0% |
| Welsh | 1,549 | 0.3% |
| West Indian | 71 | 0.0% |
| Yugoslavian | 63 | 0.0% | View All 153 Rows |
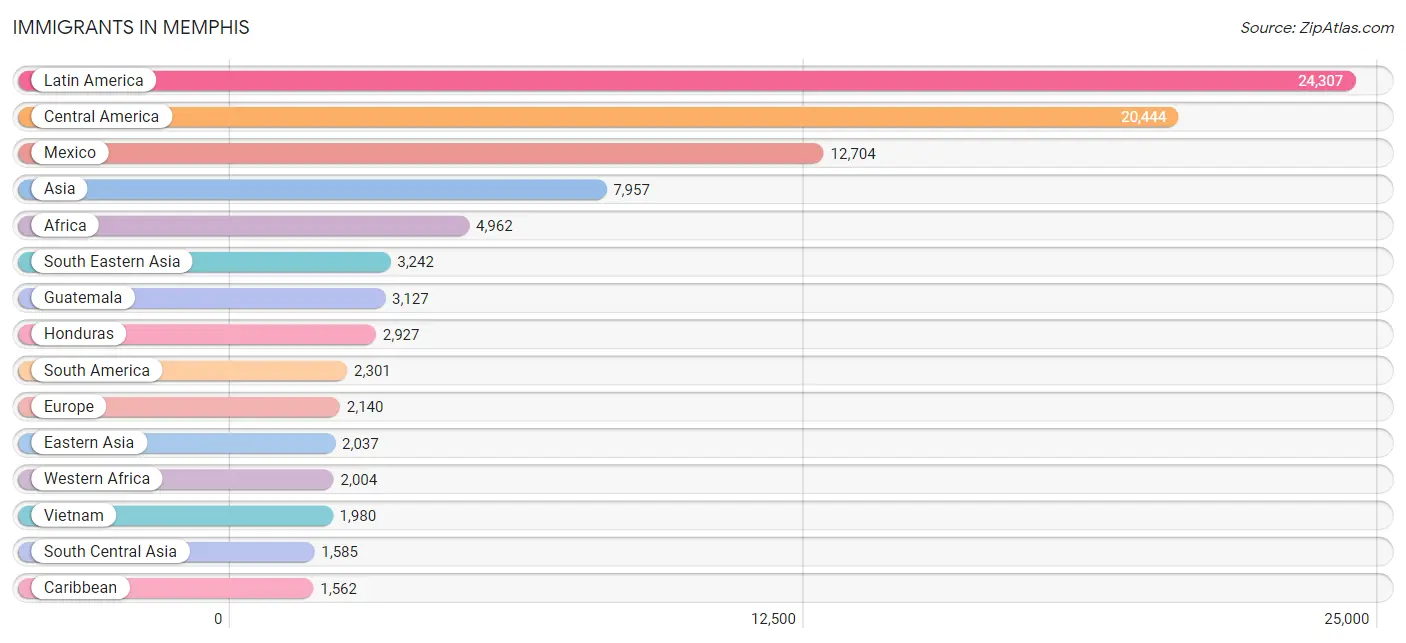
Immigrants in Memphis
The most numerous immigrant groups reported in Memphis came from Latin America (24,307 | 3.9%), Central America (20,444 | 3.2%), Mexico (12,704 | 2.0%), Asia (7,957 | 1.3%), and Africa (4,962 | 0.8%), together accounting for 11.2% of all Memphis residents.
| Immigration Origin | # Population | % Population |
| Africa | 4,962 | 0.8% |
| Argentina | 59 | 0.0% |
| Armenia | 10 | 0.0% |
| Asia | 7,957 | 1.3% |
| Australia | 68 | 0.0% |
| Bahamas | 43 | 0.0% |
| Bangladesh | 123 | 0.0% |
| Barbados | 6 | 0.0% |
| Belarus | 33 | 0.0% |
| Belgium | 15 | 0.0% |
| Belize | 138 | 0.0% |
| Bolivia | 6 | 0.0% |
| Bosnia and Herzegovina | 10 | 0.0% |
| Brazil | 241 | 0.0% |
| Bulgaria | 34 | 0.0% |
| Cambodia | 216 | 0.0% |
| Canada | 365 | 0.1% |
| Caribbean | 1,562 | 0.3% |
| Central America | 20,444 | 3.2% |
| Chile | 14 | 0.0% |
| China | 1,553 | 0.3% |
| Colombia | 324 | 0.1% |
| Congo | 315 | 0.1% |
| Costa Rica | 23 | 0.0% |
| Cuba | 506 | 0.1% |
| Czechoslovakia | 13 | 0.0% |
| Dominica | 15 | 0.0% |
| Dominican Republic | 244 | 0.0% |
| Eastern Africa | 1,233 | 0.2% |
| Eastern Asia | 2,037 | 0.3% |
| Eastern Europe | 620 | 0.1% |
| Ecuador | 37 | 0.0% |
| Egypt | 447 | 0.1% |
| El Salvador | 1,252 | 0.2% |
| England | 319 | 0.1% |
| Eritrea | 37 | 0.0% |
| Ethiopia | 929 | 0.2% |
| Europe | 2,140 | 0.3% |
| France | 41 | 0.0% |
| Germany | 434 | 0.1% |
| Ghana | 183 | 0.0% |
| Greece | 94 | 0.0% |
| Guatemala | 3,127 | 0.5% |
| Guyana | 158 | 0.0% |
| Haiti | 24 | 0.0% |
| Honduras | 2,927 | 0.5% |
| Hong Kong | 81 | 0.0% |
| India | 1,095 | 0.2% |
| Indonesia | 68 | 0.0% |
| Iran | 188 | 0.0% |
| Iraq | 78 | 0.0% |
| Ireland | 96 | 0.0% |
| Israel | 65 | 0.0% |
| Italy | 130 | 0.0% |
| Jamaica | 195 | 0.0% |
| Japan | 101 | 0.0% |
| Jordan | 104 | 0.0% |
| Kazakhstan | 25 | 0.0% |
| Kenya | 43 | 0.0% |
| Korea | 304 | 0.1% |
| Kuwait | 46 | 0.0% |
| Laos | 82 | 0.0% |
| Latin America | 24,307 | 3.9% |
| Lebanon | 105 | 0.0% |
| Liberia | 11 | 0.0% |
| Lithuania | 12 | 0.0% |
| Malaysia | 66 | 0.0% |
| Mexico | 12,704 | 2.0% |
| Middle Africa | 357 | 0.1% |
| Morocco | 1 | 0.0% |
| Nepal | 24 | 0.0% |
| Netherlands | 71 | 0.0% |
| Nicaragua | 96 | 0.0% |
| Nigeria | 739 | 0.1% |
| Northern Africa | 684 | 0.1% |
| Northern Europe | 609 | 0.1% |
| Oceania | 71 | 0.0% |
| Pakistan | 99 | 0.0% |
| Panama | 158 | 0.0% |
| Peru | 197 | 0.0% |
| Philippines | 675 | 0.1% |
| Poland | 182 | 0.0% |
| Portugal | 25 | 0.0% |
| Romania | 82 | 0.0% |
| Russia | 74 | 0.0% |
| Saudi Arabia | 135 | 0.0% |
| Scotland | 12 | 0.0% |
| Senegal | 325 | 0.1% |
| Singapore | 34 | 0.0% |
| Somalia | 23 | 0.0% |
| South Africa | 97 | 0.0% |
| South America | 2,301 | 0.4% |
| South Central Asia | 1,585 | 0.3% |
| South Eastern Asia | 3,242 | 0.5% |
| Southern Europe | 342 | 0.1% |
| Spain | 93 | 0.0% |
| Sudan | 233 | 0.0% |
| Sweden | 50 | 0.0% |
| Switzerland | 8 | 0.0% |
| Syria | 27 | 0.0% |
| Taiwan | 165 | 0.0% |
| Thailand | 93 | 0.0% |
| Trinidad and Tobago | 470 | 0.1% |
| Turkey | 100 | 0.0% |
| Uganda | 14 | 0.0% |
| Ukraine | 96 | 0.0% |
| Uruguay | 11 | 0.0% |
| Uzbekistan | 31 | 0.0% |
| Venezuela | 1,248 | 0.2% |
| Vietnam | 1,980 | 0.3% |
| West Indies | 34 | 0.0% |
| Western Africa | 2,004 | 0.3% |
| Western Asia | 994 | 0.2% |
| Western Europe | 569 | 0.1% |
| Yemen | 298 | 0.1% |
| Zaire | 42 | 0.0% | View All 116 Rows |
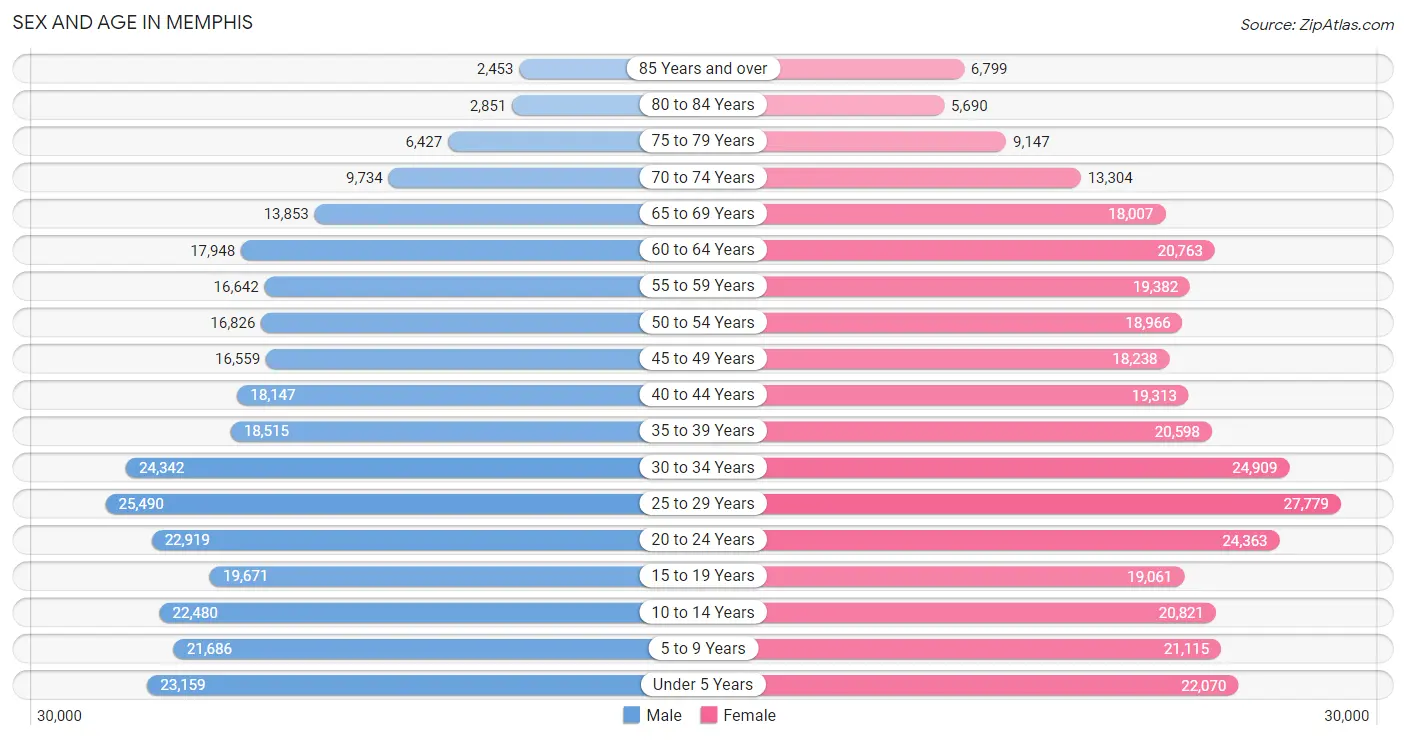
Sex and Age in Memphis
Sex and Age in Memphis
The most populous age groups in Memphis are 25 to 29 Years (25,490 | 8.5%) for men and 25 to 29 Years (27,779 | 8.4%) for women.
| Age Bracket | Male | Female |
| Under 5 Years | 23,159 (7.7%) | 22,070 (6.7%) |
| 5 to 9 Years | 21,686 (7.2%) | 21,115 (6.4%) |
| 10 to 14 Years | 22,480 (7.5%) | 20,821 (6.3%) |
| 15 to 19 Years | 19,671 (6.6%) | 19,061 (5.8%) |
| 20 to 24 Years | 22,919 (7.6%) | 24,363 (7.4%) |
| 25 to 29 Years | 25,490 (8.5%) | 27,779 (8.4%) |
| 30 to 34 Years | 24,342 (8.1%) | 24,909 (7.5%) |
| 35 to 39 Years | 18,515 (6.2%) | 20,598 (6.2%) |
| 40 to 44 Years | 18,147 (6.1%) | 19,313 (5.9%) |
| 45 to 49 Years | 16,559 (5.5%) | 18,238 (5.5%) |
| 50 to 54 Years | 16,826 (5.6%) | 18,966 (5.7%) |
| 55 to 59 Years | 16,642 (5.6%) | 19,382 (5.9%) |
| 60 to 64 Years | 17,948 (6.0%) | 20,763 (6.3%) |
| 65 to 69 Years | 13,853 (4.6%) | 18,007 (5.4%) |
| 70 to 74 Years | 9,734 (3.3%) | 13,304 (4.0%) |
| 75 to 79 Years | 6,427 (2.1%) | 9,147 (2.8%) |
| 80 to 84 Years | 2,851 (0.9%) | 5,690 (1.7%) |
| 85 Years and over | 2,453 (0.8%) | 6,799 (2.1%) |
| Total | 299,702 (100.0%) | 330,325 (100.0%) |
Families and Households in Memphis
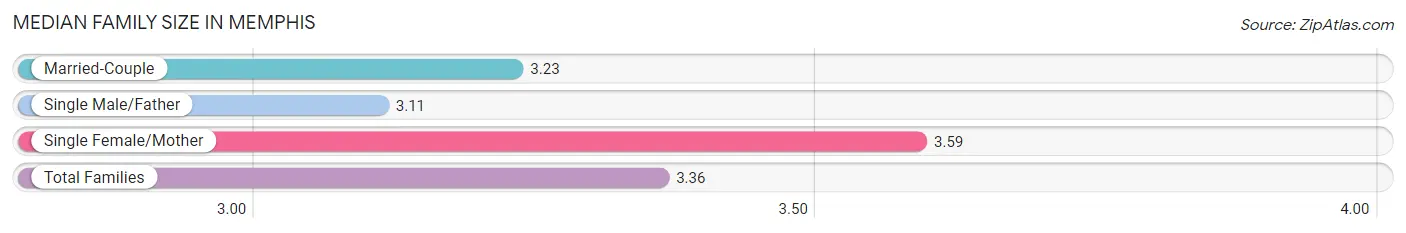
Median Family Size in Memphis
The median family size in Memphis is 3.36 persons per family, with single female/mother families (56,034 | 40.6%) accounting for the largest median family size of 3.59 persons per family. On the other hand, single male/father families (12,944 | 9.4%) represent the smallest median family size with 3.11 persons per family.
| Family Type | # Families | Family Size |
| Married-Couple | 68,970 (50.0%) | 3.23 |
| Single Male/Father | 12,944 (9.4%) | 3.11 |
| Single Female/Mother | 56,034 (40.6%) | 3.59 |
| Total Families | 137,948 (100.0%) | 3.36 |
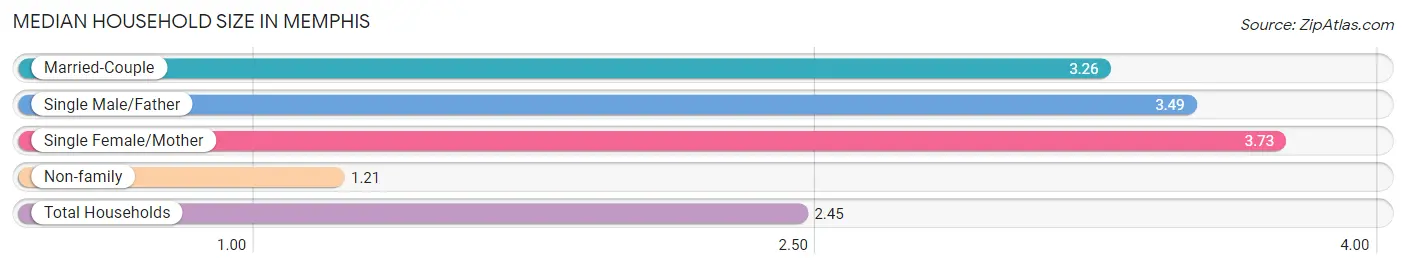
Median Household Size in Memphis
The median household size in Memphis is 2.45 persons per household, with single female/mother households (56,034 | 22.3%) accounting for the largest median household size of 3.73 persons per household. non-family households (113,638 | 45.2%) represent the smallest median household size with 1.21 persons per household.
| Household Type | # Households | Household Size |
| Married-Couple | 68,970 (27.4%) | 3.26 |
| Single Male/Father | 12,944 (5.1%) | 3.49 |
| Single Female/Mother | 56,034 (22.3%) | 3.73 |
| Non-family | 113,638 (45.2%) | 1.21 |
| Total Households | 251,586 (100.0%) | 2.45 |
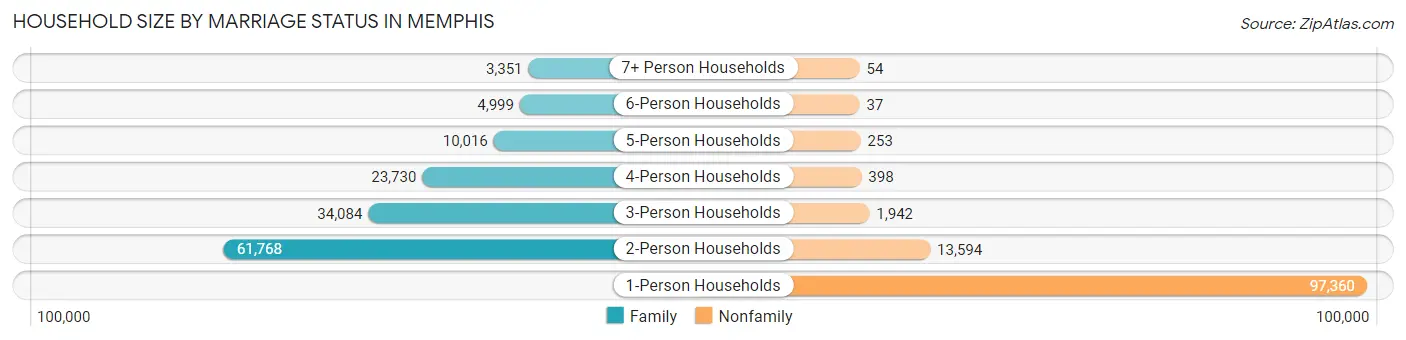
Household Size by Marriage Status in Memphis
Out of a total of 251,586 households in Memphis, 137,948 (54.8%) are family households, while 113,638 (45.2%) are nonfamily households. The most numerous type of family households are 2-person households, comprising 61,768, and the most common type of nonfamily households are 1-person households, comprising 97,360.
| Household Size | Family Households | Nonfamily Households |
| 1-Person Households | - | 97,360 (38.7%) |
| 2-Person Households | 61,768 (24.5%) | 13,594 (5.4%) |
| 3-Person Households | 34,084 (13.6%) | 1,942 (0.8%) |
| 4-Person Households | 23,730 (9.4%) | 398 (0.2%) |
| 5-Person Households | 10,016 (4.0%) | 253 (0.1%) |
| 6-Person Households | 4,999 (2.0%) | 37 (0.0%) |
| 7+ Person Households | 3,351 (1.3%) | 54 (0.0%) |
| Total | 137,948 (54.8%) | 113,638 (45.2%) |
Female Fertility in Memphis
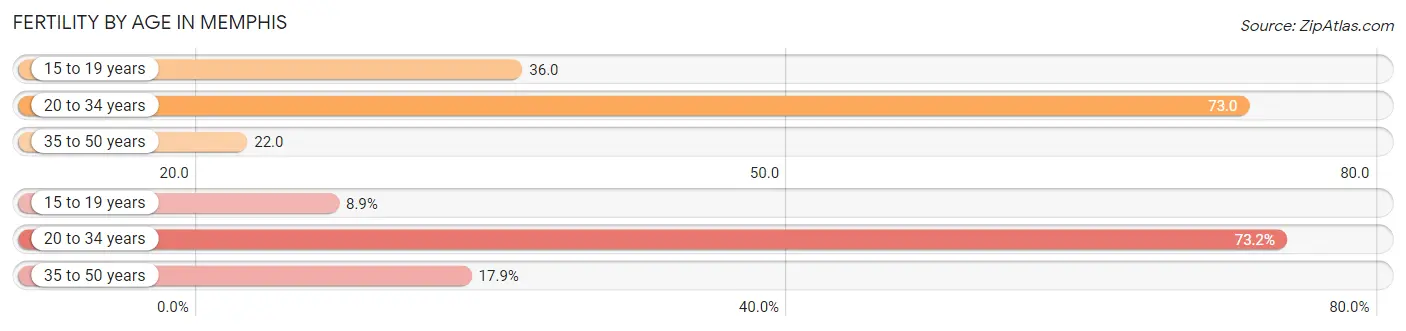
Fertility by Age in Memphis
Average fertility rate in Memphis is 49.0 births per 1,000 women. Women in the age bracket of 20 to 34 years have the highest fertility rate with 73.0 births per 1,000 women. Women in the age bracket of 20 to 34 years acount for 73.2% of all women with births.
| Age Bracket | Women with Births | Births / 1,000 Women |
| 15 to 19 years | 685 (8.9%) | 36.0 |
| 20 to 34 years | 5,639 (73.2%) | 73.0 |
| 35 to 50 years | 1,378 (17.9%) | 22.0 |
| Total | 7,702 (100.0%) | 49.0 |
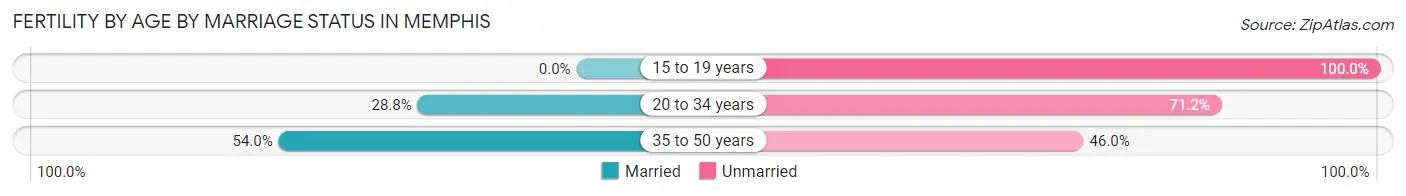
Fertility by Age by Marriage Status in Memphis
30.7% of women with births (7,702) in Memphis are married. The highest percentage of unmarried women with births falls into 15 to 19 years age bracket with 100.0% of them unmarried at the time of birth, while the lowest percentage of unmarried women with births belong to 35 to 50 years age bracket with 46.0% of them unmarried.
| Age Bracket | Married | Unmarried |
| 15 to 19 years | 0 (0.0%) | 685 (100.0%) |
| 20 to 34 years | 1,624 (28.8%) | 4,015 (71.2%) |
| 35 to 50 years | 744 (54.0%) | 634 (46.0%) |
| Total | 2,365 (30.7%) | 5,337 (69.3%) |
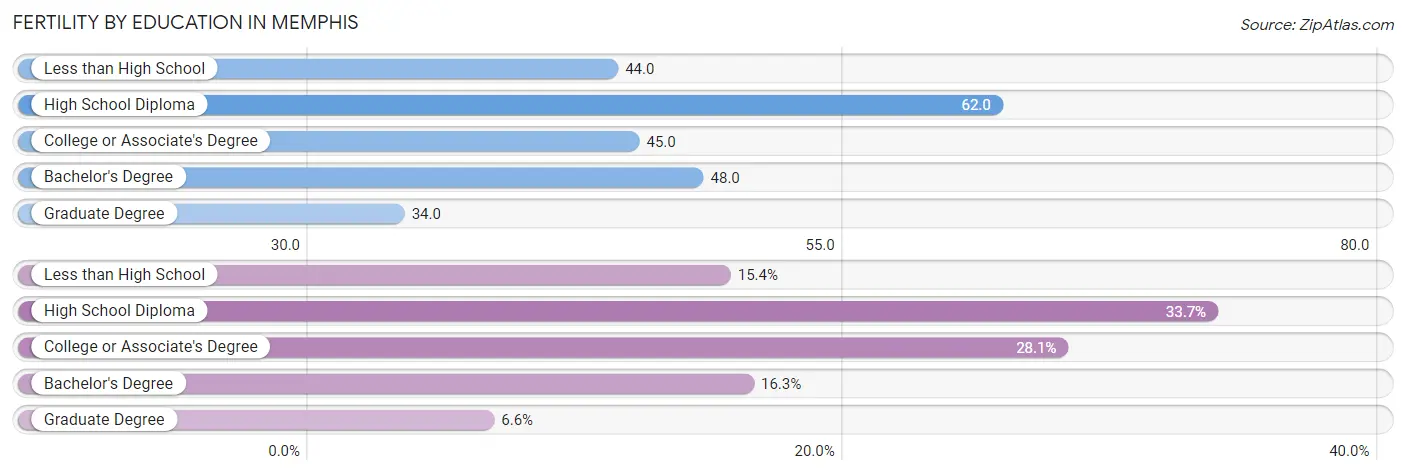
Fertility by Education in Memphis
Average fertility rate in Memphis is 49.0 births per 1,000 women. Women with the education attainment of high school diploma have the highest fertility rate of 62.0 births per 1,000 women, while women with the education attainment of graduate degree have the lowest fertility at 34.0 births per 1,000 women. Women with the education attainment of high school diploma represent 33.7% of all women with births.
| Educational Attainment | Women with Births | Births / 1,000 Women |
| Less than High School | 1,188 (15.4%) | 44.0 |
| High School Diploma | 2,593 (33.7%) | 62.0 |
| College or Associate's Degree | 2,161 (28.1%) | 45.0 |
| Bachelor's Degree | 1,255 (16.3%) | 48.0 |
| Graduate Degree | 505 (6.6%) | 34.0 |
| Total | 7,702 (100.0%) | 49.0 |
Fertility by Education by Marriage Status in Memphis
69.3% of women with births in Memphis are unmarried. Women with the educational attainment of graduate degree are most likely to be married with 85.9% of them married at childbirth, while women with the educational attainment of high school diploma are least likely to be married with 82.6% of them unmarried at childbirth.
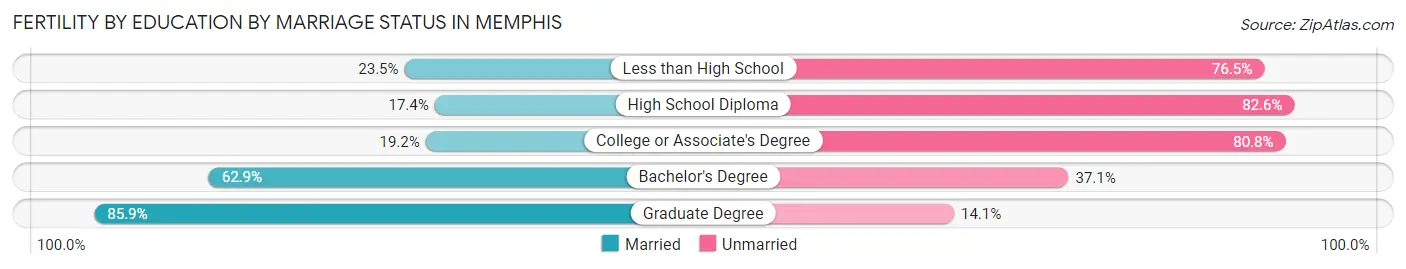
| Educational Attainment | Married | Unmarried |
| Less than High School | 279 (23.5%) | 909 (76.5%) |
| High School Diploma | 451 (17.4%) | 2,142 (82.6%) |
| College or Associate's Degree | 415 (19.2%) | 1,746 (80.8%) |
| Bachelor's Degree | 789 (62.9%) | 466 (37.1%) |
| Graduate Degree | 434 (85.9%) | 71 (14.1%) |
| Total | 2,365 (30.7%) | 5,337 (69.3%) |
Employment Characteristics in Memphis
Employment by Class of Employer in Memphis
Among the 279,354 employed individuals in Memphis, private company employees (199,206 | 71.3%), not-for-profit organizations (25,667 | 9.2%), and local government employees (16,950 | 6.1%) make up the most common classes of employment.
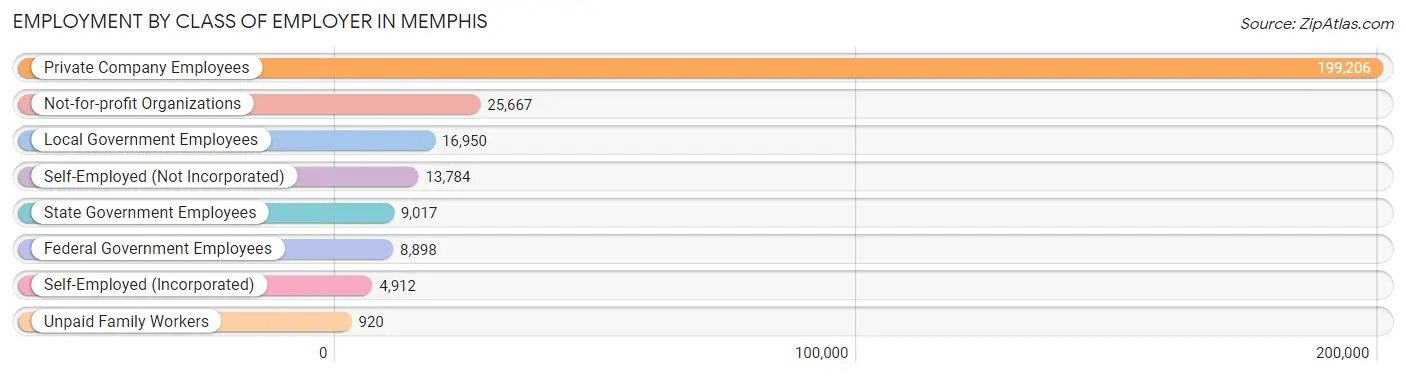
| Employer Class | # Employees | % Employees |
| Private Company Employees | 199,206 | 71.3% |
| Self-Employed (Incorporated) | 4,912 | 1.8% |
| Self-Employed (Not Incorporated) | 13,784 | 4.9% |
| Not-for-profit Organizations | 25,667 | 9.2% |
| Local Government Employees | 16,950 | 6.1% |
| State Government Employees | 9,017 | 3.2% |
| Federal Government Employees | 8,898 | 3.2% |
| Unpaid Family Workers | 920 | 0.3% |
| Total | 279,354 | 100.0% |
Employment Status by Age in Memphis
According to the labor force statistics for Memphis, out of the total population over 16 years of age (491,231), 63.6% or 312,423 individuals are in the labor force, with 8.6% or 26,868 of them unemployed. The age group with the highest labor force participation rate is 25 to 29 years, with 81.7% or 43,521 individuals in the labor force. Within the labor force, the 16 to 19 years age range has the highest percentage of unemployed individuals, with 26.7% or 3,014 of them being unemployed.
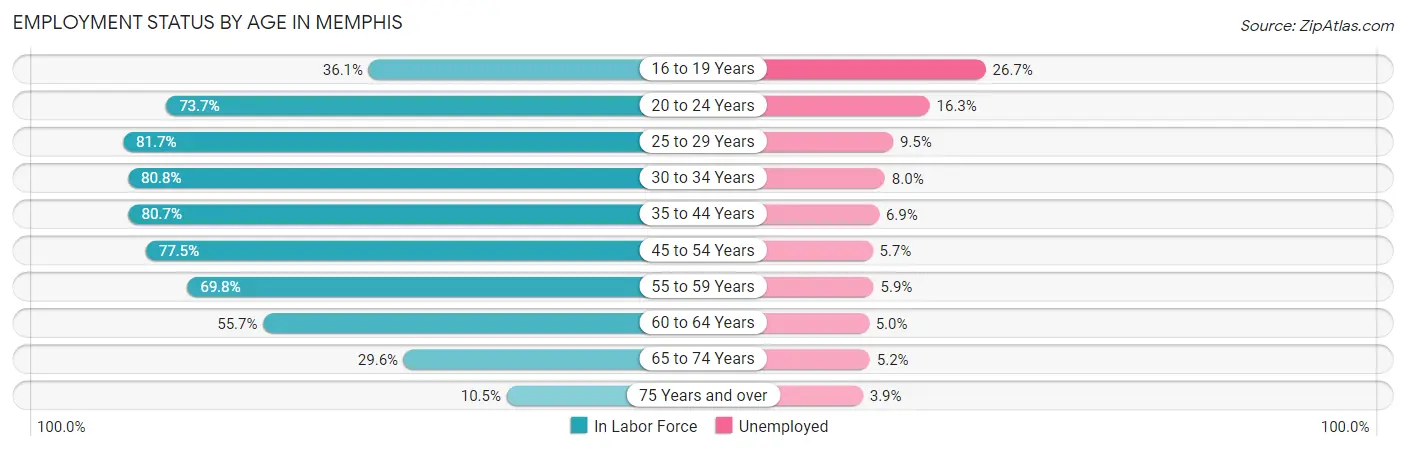
| Age Bracket | In Labor Force | Unemployed |
| 16 to 19 Years | 11,287 (36.1%) | 3,014 (26.7%) |
| 20 to 24 Years | 34,847 (73.7%) | 5,680 (16.3%) |
| 25 to 29 Years | 43,521 (81.7%) | 4,134 (9.5%) |
| 30 to 34 Years | 39,795 (80.8%) | 3,184 (8.0%) |
| 35 to 44 Years | 61,794 (80.7%) | 4,264 (6.9%) |
| 45 to 54 Years | 54,706 (77.5%) | 3,118 (5.7%) |
| 55 to 59 Years | 25,145 (69.8%) | 1,484 (5.9%) |
| 60 to 64 Years | 21,562 (55.7%) | 1,078 (5.0%) |
| 65 to 74 Years | 16,250 (29.6%) | 845 (5.2%) |
| 75 Years and over | 3,504 (10.5%) | 137 (3.9%) |
| Total | 312,423 (63.6%) | 26,868 (8.6%) |
Employment Status by Educational Attainment in Memphis
According to labor force statistics for Memphis, 76.0% of individuals (246,557) out of the total population between 25 and 64 years of age (324,417) are in the labor force, with 7.0% or 17,259 of them being unemployed. The group with the highest labor force participation rate are those with the educational attainment of bachelor's degree or higher, with 89.0% or 80,855 individuals in the labor force. Within the labor force, individuals with less than high school education have the highest percentage of unemployment, with 14.0% or 3,080 of them being unemployed.
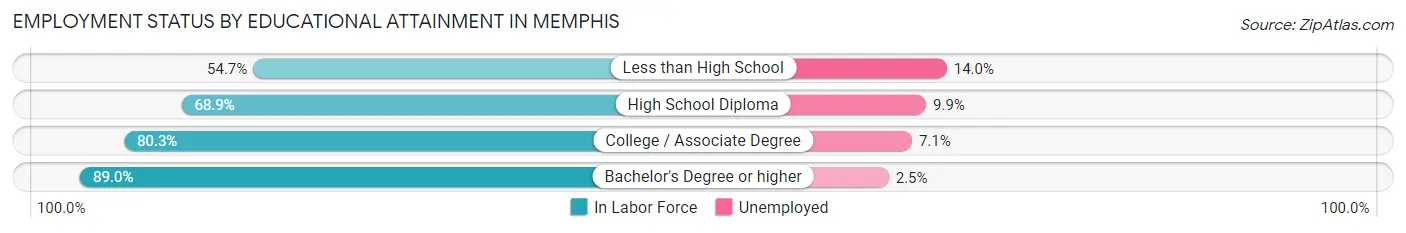
| Educational Attainment | In Labor Force | Unemployed |
| Less than High School | 22,000 (54.7%) | 5,631 (14.0%) |
| High School Diploma | 69,406 (68.9%) | 9,973 (9.9%) |
| College / Associate Degree | 74,370 (80.3%) | 6,576 (7.1%) |
| Bachelor's Degree or higher | 80,855 (89.0%) | 2,271 (2.5%) |
| Total | 246,557 (76.0%) | 22,709 (7.0%) |
Employment Occupations by Sex in Memphis
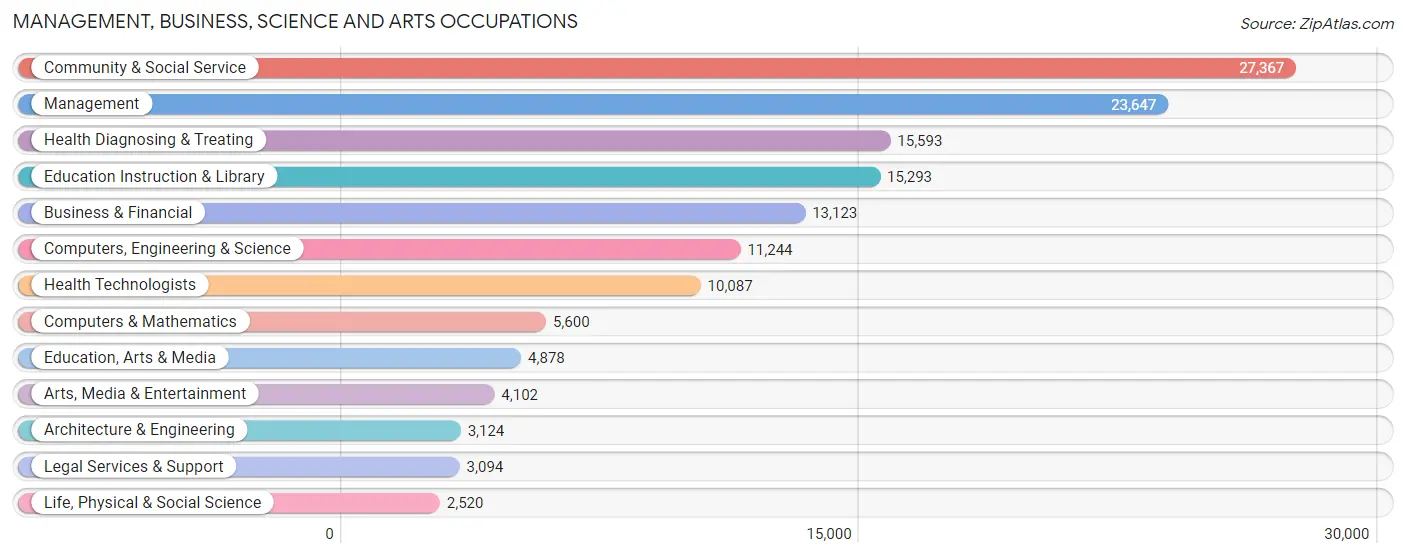
Management, Business, Science and Arts Occupations
The most common Management, Business, Science and Arts occupations in Memphis are Community & Social Service (27,367 | 9.6%), Management (23,647 | 8.3%), Health Diagnosing & Treating (15,593 | 5.5%), Education Instruction & Library (15,293 | 5.4%), and Business & Financial (13,123 | 4.6%).
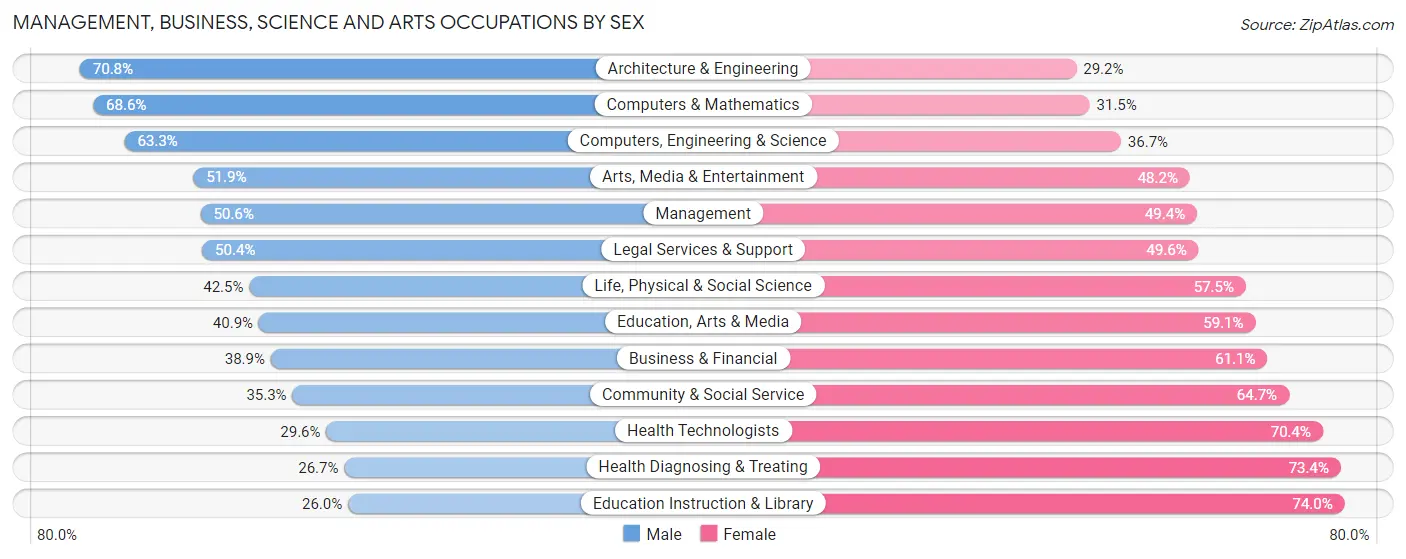
Management, Business, Science and Arts Occupations by Sex
Within the Management, Business, Science and Arts occupations in Memphis, the most male-oriented occupations are Architecture & Engineering (70.8%), Computers & Mathematics (68.5%), and Computers, Engineering & Science (63.3%), while the most female-oriented occupations are Education Instruction & Library (74.0%), Health Diagnosing & Treating (73.4%), and Health Technologists (70.4%).
| Occupation | Male | Female |
| Management | 11,975 (50.6%) | 11,672 (49.4%) |
| Business & Financial | 5,106 (38.9%) | 8,017 (61.1%) |
| Computers, Engineering & Science | 7,121 (63.3%) | 4,123 (36.7%) |
| Computers & Mathematics | 3,839 (68.5%) | 1,761 (31.5%) |
| Architecture & Engineering | 2,211 (70.8%) | 913 (29.2%) |
| Life, Physical & Social Science | 1,071 (42.5%) | 1,449 (57.5%) |
| Community & Social Service | 9,660 (35.3%) | 17,707 (64.7%) |
| Education, Arts & Media | 1,995 (40.9%) | 2,883 (59.1%) |
| Legal Services & Support | 1,558 (50.4%) | 1,536 (49.6%) |
| Education Instruction & Library | 3,980 (26.0%) | 11,313 (74.0%) |
| Arts, Media & Entertainment | 2,127 (51.8%) | 1,975 (48.1%) |
| Health Diagnosing & Treating | 4,156 (26.7%) | 11,437 (73.4%) |
| Health Technologists | 2,990 (29.6%) | 7,097 (70.4%) |
| Total (Category) | 38,018 (41.8%) | 52,956 (58.2%) |
| Total (Overall) | 139,187 (48.9%) | 145,434 (51.1%) |
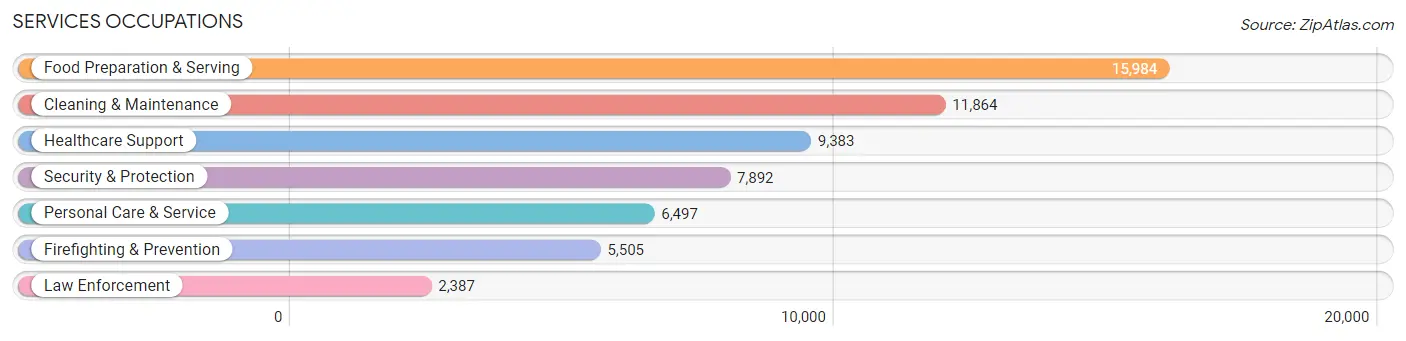
Services Occupations
The most common Services occupations in Memphis are Food Preparation & Serving (15,984 | 5.6%), Cleaning & Maintenance (11,864 | 4.2%), Healthcare Support (9,383 | 3.3%), Security & Protection (7,892 | 2.8%), and Personal Care & Service (6,497 | 2.3%).
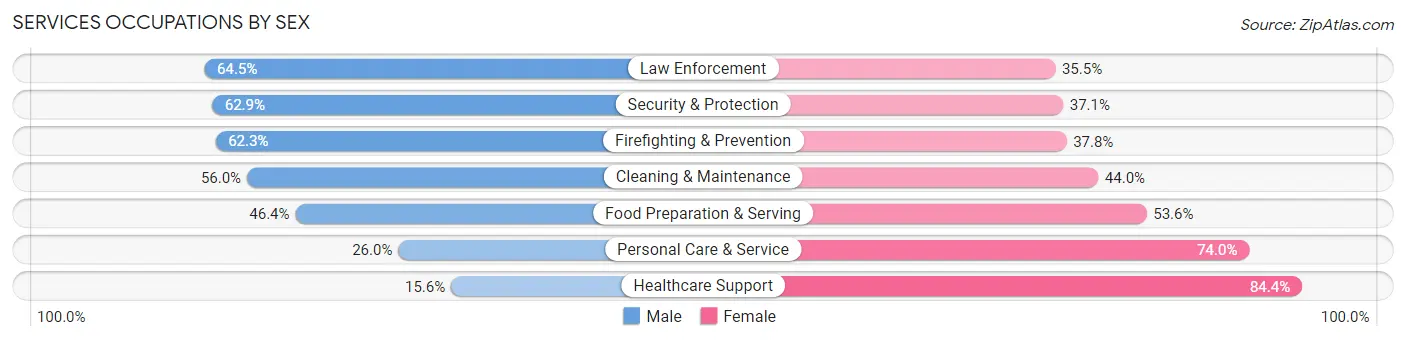
Services Occupations by Sex
Within the Services occupations in Memphis, the most male-oriented occupations are Law Enforcement (64.5%), Security & Protection (62.9%), and Firefighting & Prevention (62.3%), while the most female-oriented occupations are Healthcare Support (84.4%), Personal Care & Service (74.0%), and Food Preparation & Serving (53.6%).
| Occupation | Male | Female |
| Healthcare Support | 1,460 (15.6%) | 7,923 (84.4%) |
| Security & Protection | 4,966 (62.9%) | 2,926 (37.1%) |
| Firefighting & Prevention | 3,427 (62.3%) | 2,078 (37.8%) |
| Law Enforcement | 1,539 (64.5%) | 848 (35.5%) |
| Food Preparation & Serving | 7,414 (46.4%) | 8,570 (53.6%) |
| Cleaning & Maintenance | 6,640 (56.0%) | 5,224 (44.0%) |
| Personal Care & Service | 1,690 (26.0%) | 4,807 (74.0%) |
| Total (Category) | 22,170 (42.9%) | 29,450 (57.1%) |
| Total (Overall) | 139,187 (48.9%) | 145,434 (51.1%) |
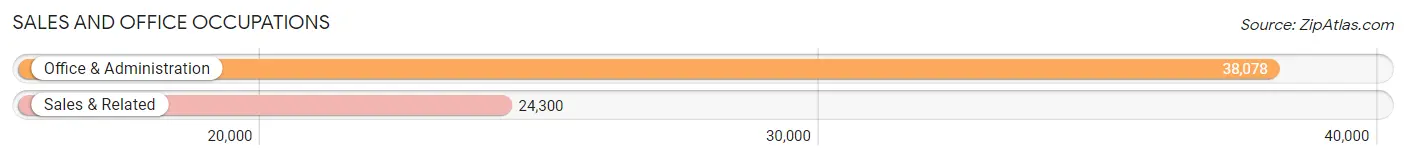
Sales and Office Occupations
The most common Sales and Office occupations in Memphis are Office & Administration (38,078 | 13.4%), and Sales & Related (24,300 | 8.5%).
Sales and Office Occupations by Sex
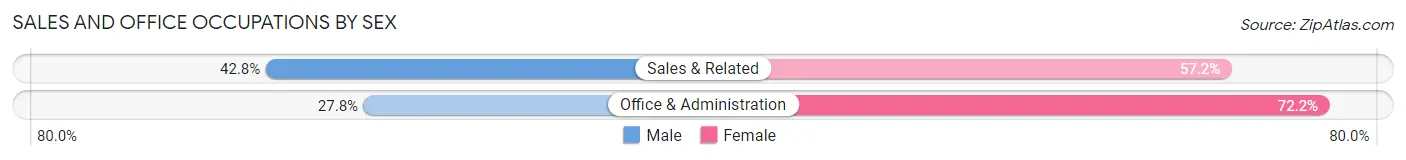
| Occupation | Male | Female |
| Sales & Related | 10,409 (42.8%) | 13,891 (57.2%) |
| Office & Administration | 10,584 (27.8%) | 27,494 (72.2%) |
| Total (Category) | 20,993 (33.7%) | 41,385 (66.3%) |
| Total (Overall) | 139,187 (48.9%) | 145,434 (51.1%) |
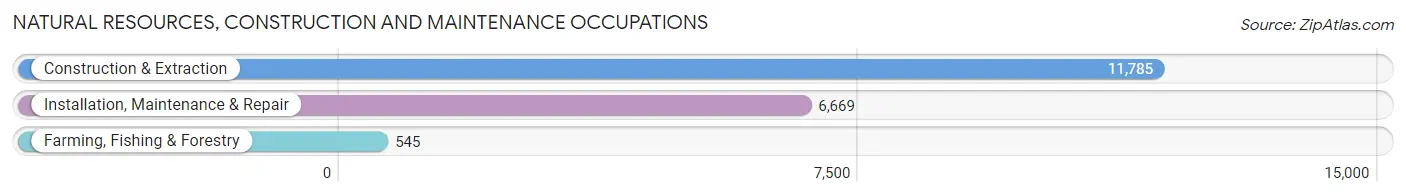
Natural Resources, Construction and Maintenance Occupations
The most common Natural Resources, Construction and Maintenance occupations in Memphis are Construction & Extraction (11,785 | 4.1%), Installation, Maintenance & Repair (6,669 | 2.3%), and Farming, Fishing & Forestry (545 | 0.2%).
Natural Resources, Construction and Maintenance Occupations by Sex
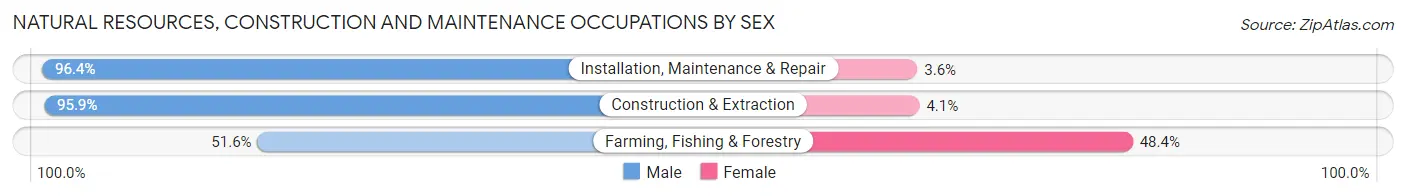
| Occupation | Male | Female |
| Farming, Fishing & Forestry | 281 (51.6%) | 264 (48.4%) |
| Construction & Extraction | 11,306 (95.9%) | 479 (4.1%) |
| Installation, Maintenance & Repair | 6,427 (96.4%) | 242 (3.6%) |
| Total (Category) | 18,014 (94.8%) | 985 (5.2%) |
| Total (Overall) | 139,187 (48.9%) | 145,434 (51.1%) |
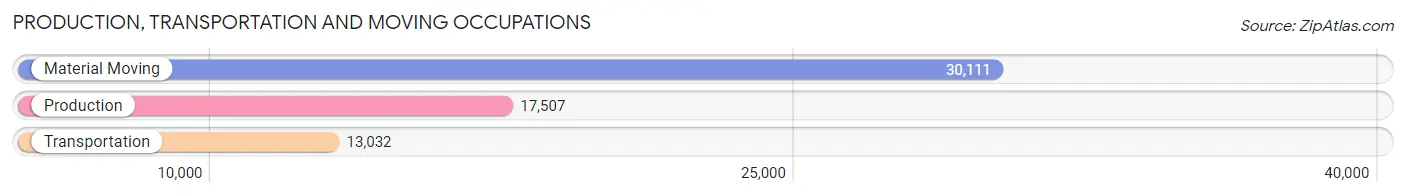
Production, Transportation and Moving Occupations
The most common Production, Transportation and Moving occupations in Memphis are Material Moving (30,111 | 10.6%), Production (17,507 | 6.1%), and Transportation (13,032 | 4.6%).
Production, Transportation and Moving Occupations by Sex
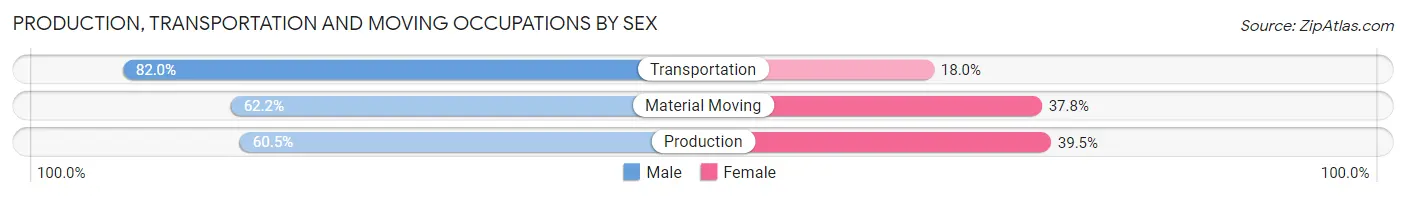
| Occupation | Male | Female |
| Production | 10,590 (60.5%) | 6,917 (39.5%) |
| Transportation | 10,681 (82.0%) | 2,351 (18.0%) |
| Material Moving | 18,721 (62.2%) | 11,390 (37.8%) |
| Total (Category) | 39,992 (65.9%) | 20,658 (34.1%) |
| Total (Overall) | 139,187 (48.9%) | 145,434 (51.1%) |
Employment Industries by Sex in Memphis
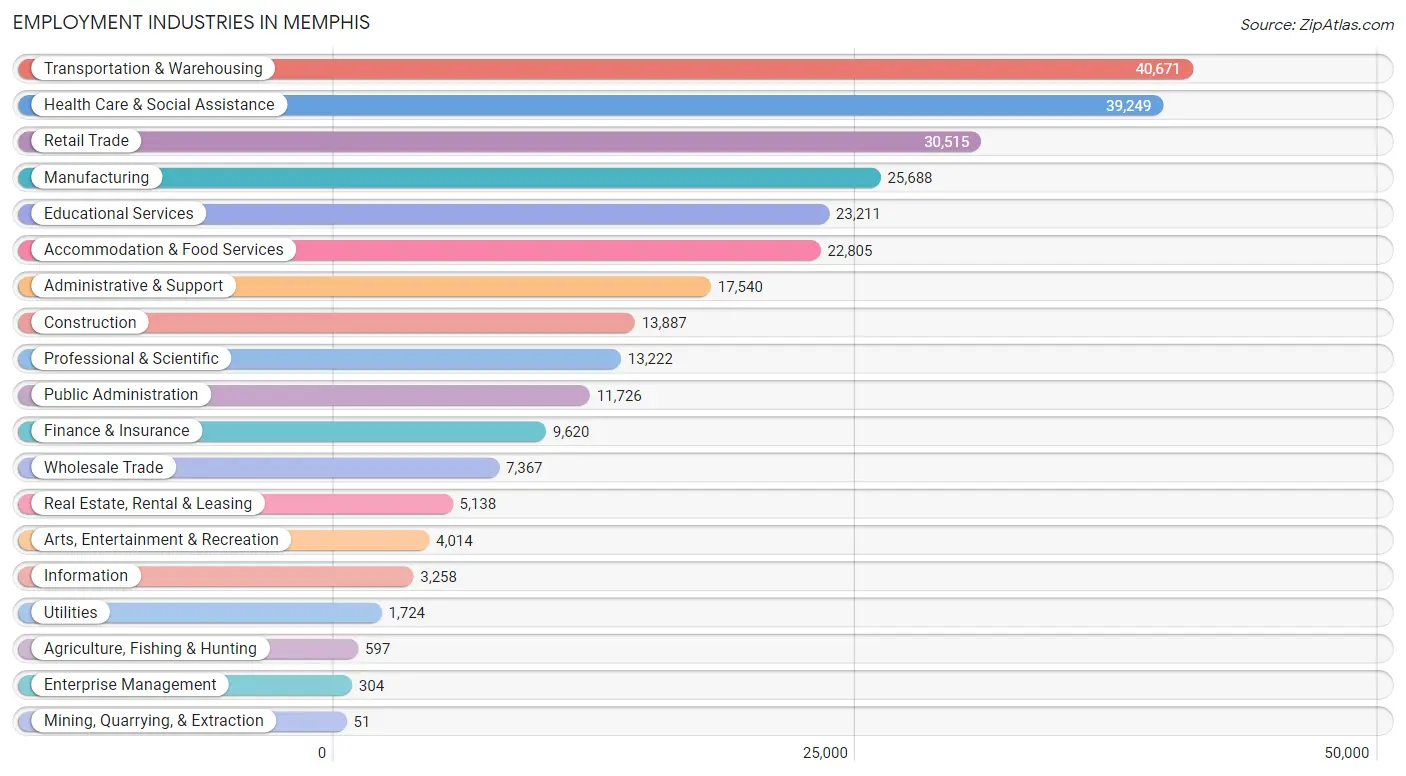
Employment Industries in Memphis
The major employment industries in Memphis include Transportation & Warehousing (40,671 | 14.3%), Health Care & Social Assistance (39,249 | 13.8%), Retail Trade (30,515 | 10.7%), Manufacturing (25,688 | 9.0%), and Educational Services (23,211 | 8.2%).
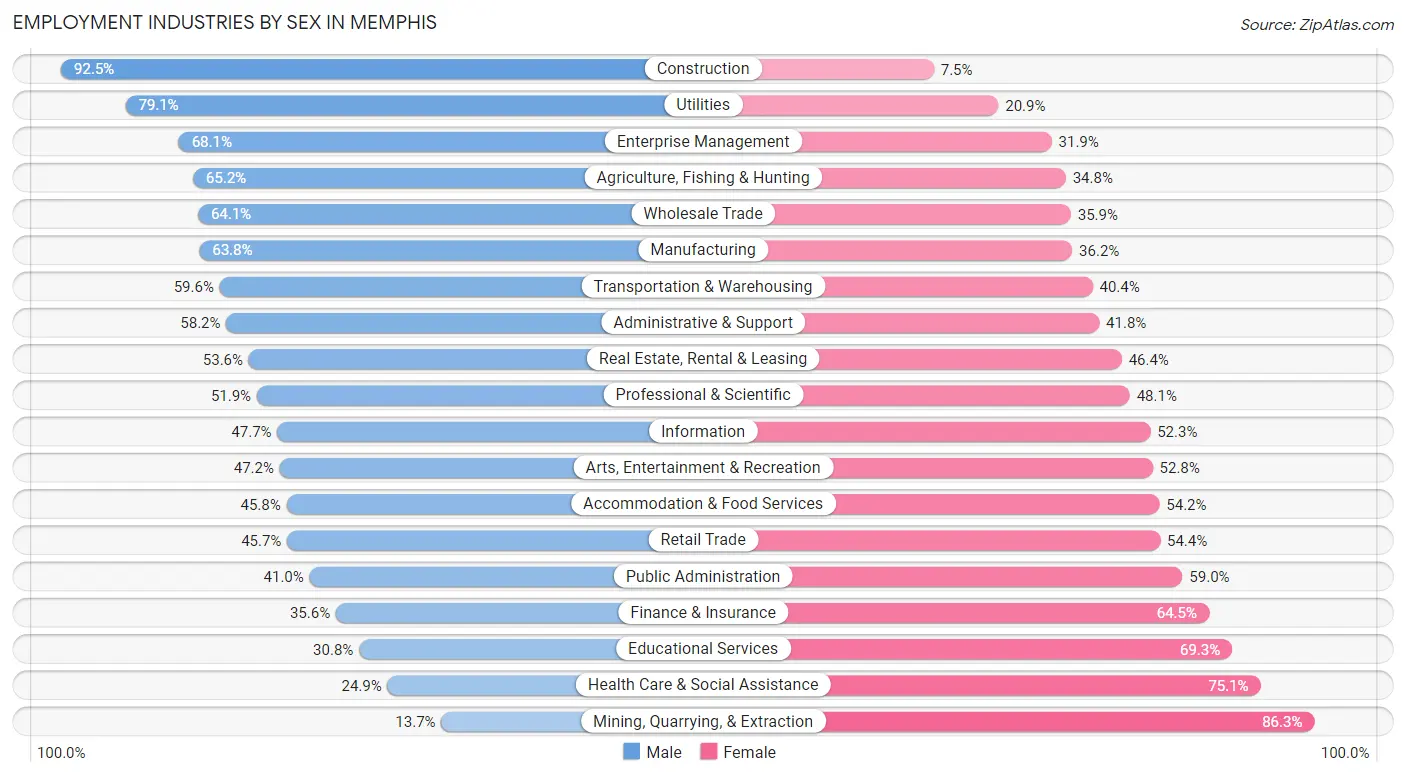
Employment Industries by Sex in Memphis
The Memphis industries that see more men than women are Construction (92.5%), Utilities (79.1%), and Enterprise Management (68.1%), whereas the industries that tend to have a higher number of women are Mining, Quarrying, & Extraction (86.3%), Health Care & Social Assistance (75.1%), and Educational Services (69.3%).
| Industry | Male | Female |
| Agriculture, Fishing & Hunting | 389 (65.2%) | 208 (34.8%) |
| Mining, Quarrying, & Extraction | 7 (13.7%) | 44 (86.3%) |
| Construction | 12,843 (92.5%) | 1,044 (7.5%) |
| Manufacturing | 16,396 (63.8%) | 9,292 (36.2%) |
| Wholesale Trade | 4,723 (64.1%) | 2,644 (35.9%) |
| Retail Trade | 13,930 (45.7%) | 16,585 (54.3%) |
| Transportation & Warehousing | 24,245 (59.6%) | 16,426 (40.4%) |
| Utilities | 1,364 (79.1%) | 360 (20.9%) |
| Information | 1,553 (47.7%) | 1,705 (52.3%) |
| Finance & Insurance | 3,420 (35.5%) | 6,200 (64.4%) |
| Real Estate, Rental & Leasing | 2,753 (53.6%) | 2,385 (46.4%) |
| Professional & Scientific | 6,863 (51.9%) | 6,359 (48.1%) |
| Enterprise Management | 207 (68.1%) | 97 (31.9%) |
| Administrative & Support | 10,216 (58.2%) | 7,324 (41.8%) |
| Educational Services | 7,138 (30.7%) | 16,073 (69.3%) |
| Health Care & Social Assistance | 9,761 (24.9%) | 29,488 (75.1%) |
| Arts, Entertainment & Recreation | 1,894 (47.2%) | 2,120 (52.8%) |
| Accommodation & Food Services | 10,439 (45.8%) | 12,366 (54.2%) |
| Public Administration | 4,809 (41.0%) | 6,917 (59.0%) |
| Total | 139,187 (48.9%) | 145,434 (51.1%) |
Education in Memphis
School Enrollment in Memphis
The most common levels of schooling among the 151,808 students in Memphis are middle school (33,757 | 22.2%), high school (31,871 | 21.0%), and elementary school (30,718 | 20.2%).
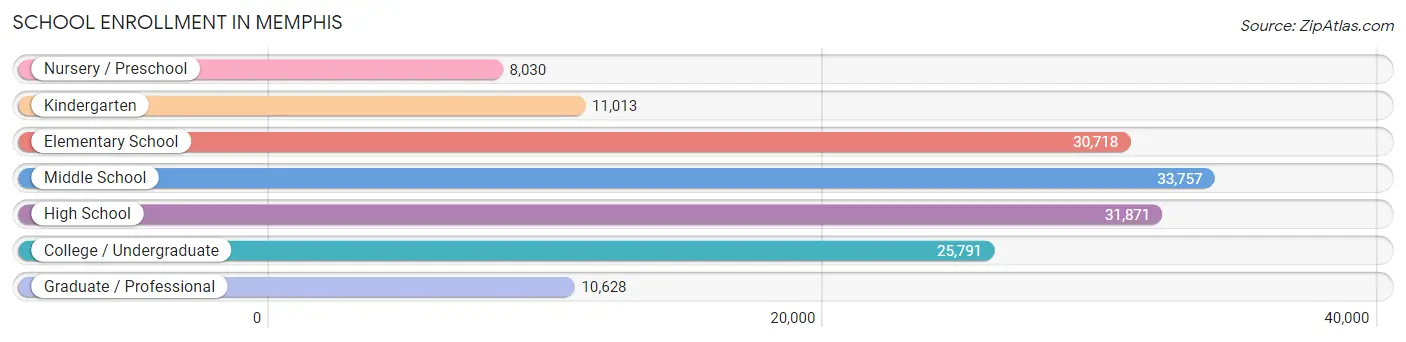
| School Level | # Students | % Students |
| Nursery / Preschool | 8,030 | 5.3% |
| Kindergarten | 11,013 | 7.2% |
| Elementary School | 30,718 | 20.2% |
| Middle School | 33,757 | 22.2% |
| High School | 31,871 | 21.0% |
| College / Undergraduate | 25,791 | 17.0% |
| Graduate / Professional | 10,628 | 7.0% |
| Total | 151,808 | 100.0% |
School Enrollment by Age by Funding Source in Memphis
Out of a total of 151,808 students who are enrolled in schools in Memphis, 26,415 (17.4%) attend a private institution, while the remaining 125,393 (82.6%) are enrolled in public schools. The age group of 3 to 4 year olds has the highest likelihood of being enrolled in private schools, with 2,813 (41.2% in the age bracket) enrolled. Conversely, the age group of 5 to 9 year old has the lowest likelihood of being enrolled in a private school, with 35,023 (89.3% in the age bracket) attending a public institution.
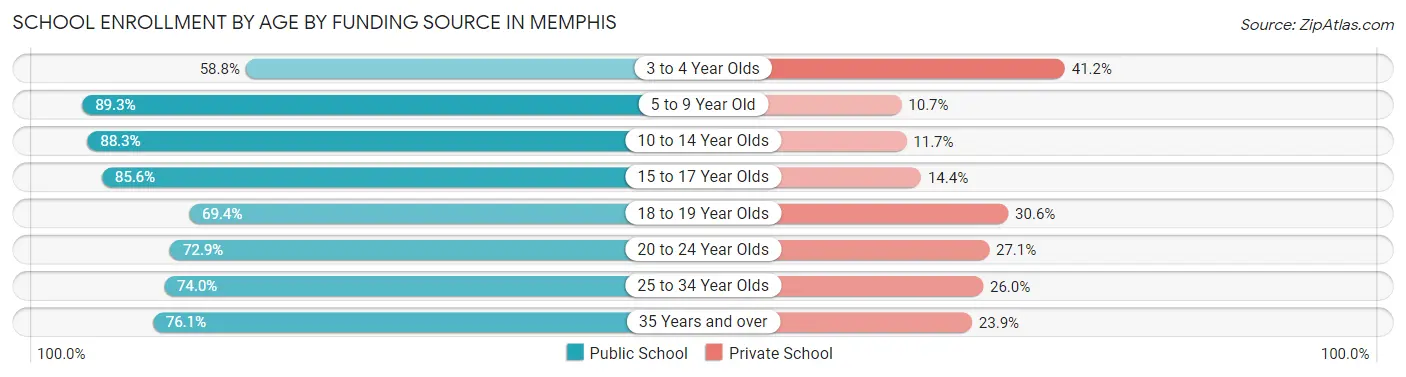
| Age Bracket | Public School | Private School |
| 3 to 4 Year Olds | 4,017 (58.8%) | 2,813 (41.2%) |
| 5 to 9 Year Old | 35,023 (89.3%) | 4,212 (10.7%) |
| 10 to 14 Year Olds | 36,484 (88.3%) | 4,823 (11.7%) |
| 15 to 17 Year Olds | 19,098 (85.6%) | 3,213 (14.4%) |
| 18 to 19 Year Olds | 6,313 (69.4%) | 2,789 (30.6%) |
| 20 to 24 Year Olds | 10,487 (72.9%) | 3,895 (27.1%) |
| 25 to 34 Year Olds | 8,484 (74.0%) | 2,975 (26.0%) |
| 35 Years and over | 5,466 (76.1%) | 1,716 (23.9%) |
| Total | 125,393 (82.6%) | 26,415 (17.4%) |
Educational Attainment by Field of Study in Memphis
Business (29,211 | 23.6%), education (13,902 | 11.3%), science & technology (11,701 | 9.5%), social sciences (9,726 | 7.9%), and bio, nature & agricultural (8,494 | 6.9%) are the most common fields of study among 123,590 individuals in Memphis who have obtained a bachelor's degree or higher.
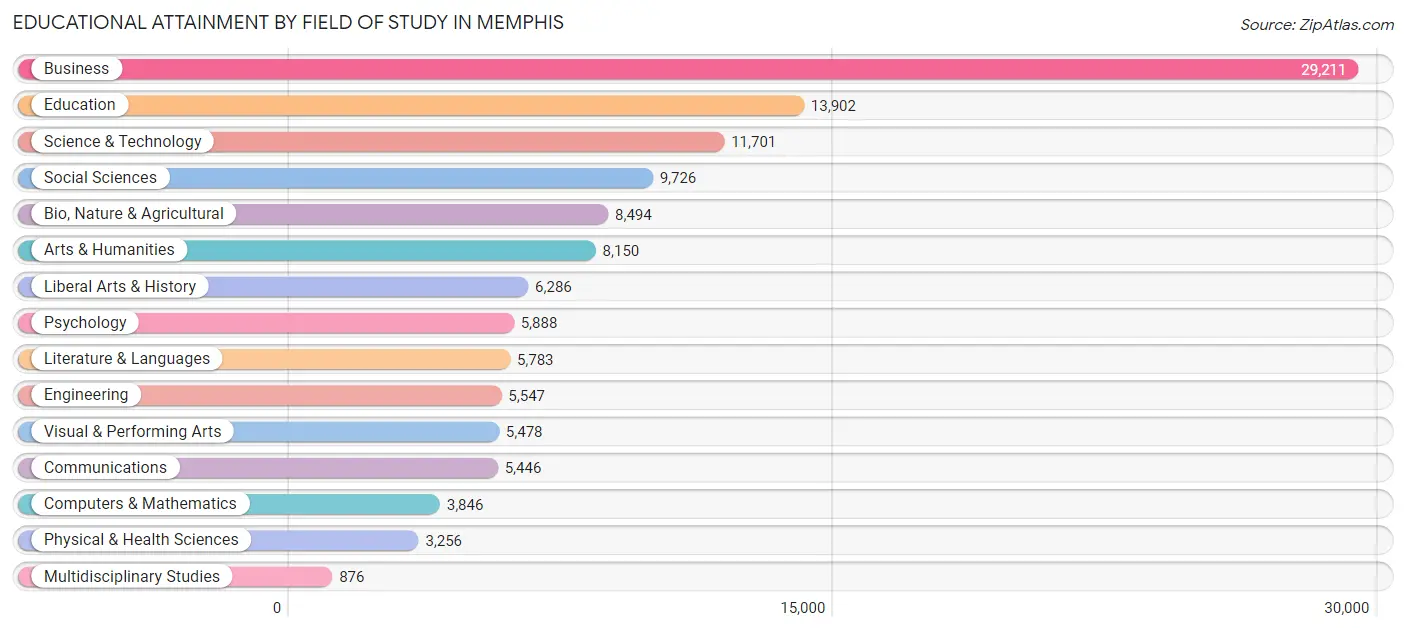
| Field of Study | # Graduates | % Graduates |
| Computers & Mathematics | 3,846 | 3.1% |
| Bio, Nature & Agricultural | 8,494 | 6.9% |
| Physical & Health Sciences | 3,256 | 2.6% |
| Psychology | 5,888 | 4.8% |
| Social Sciences | 9,726 | 7.9% |
| Engineering | 5,547 | 4.5% |
| Multidisciplinary Studies | 876 | 0.7% |
| Science & Technology | 11,701 | 9.5% |
| Business | 29,211 | 23.6% |
| Education | 13,902 | 11.3% |
| Literature & Languages | 5,783 | 4.7% |
| Liberal Arts & History | 6,286 | 5.1% |
| Visual & Performing Arts | 5,478 | 4.4% |
| Communications | 5,446 | 4.4% |
| Arts & Humanities | 8,150 | 6.6% |
| Total | 123,590 | 100.0% |
Transportation & Commute in Memphis
Vehicle Availability by Sex in Memphis
The most prevalent vehicle ownership categories in Memphis are males with 2 vehicles (57,730, accounting for 42.3%) and females with 2 vehicles (54,031, making up 40.9%).
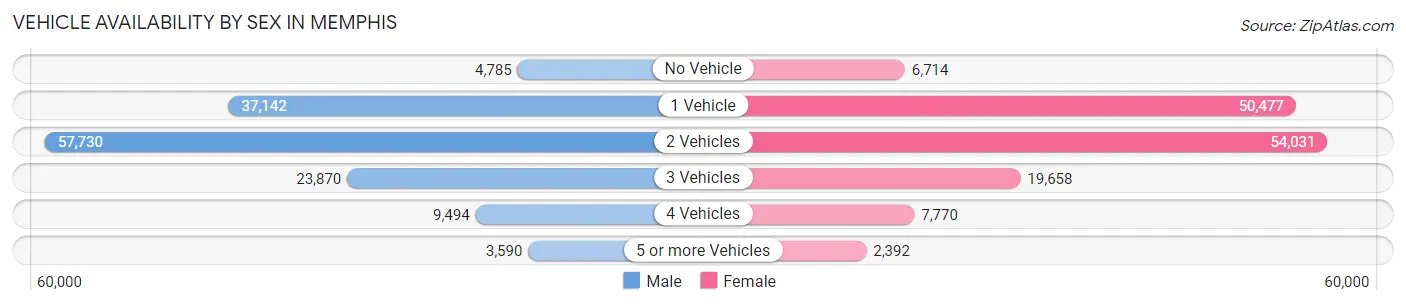
| Vehicles Available | Male | Female |
| No Vehicle | 4,785 (3.5%) | 6,714 (4.8%) |
| 1 Vehicle | 37,142 (27.2%) | 50,477 (35.8%) |
| 2 Vehicles | 57,730 (42.3%) | 54,031 (38.3%) |
| 3 Vehicles | 23,870 (17.5%) | 19,658 (13.9%) |
| 4 Vehicles | 9,494 (7.0%) | 7,770 (5.5%) |
| 5 or more Vehicles | 3,590 (2.6%) | 2,392 (1.7%) |
| Total | 136,611 (100.0%) | 141,042 (100.0%) |
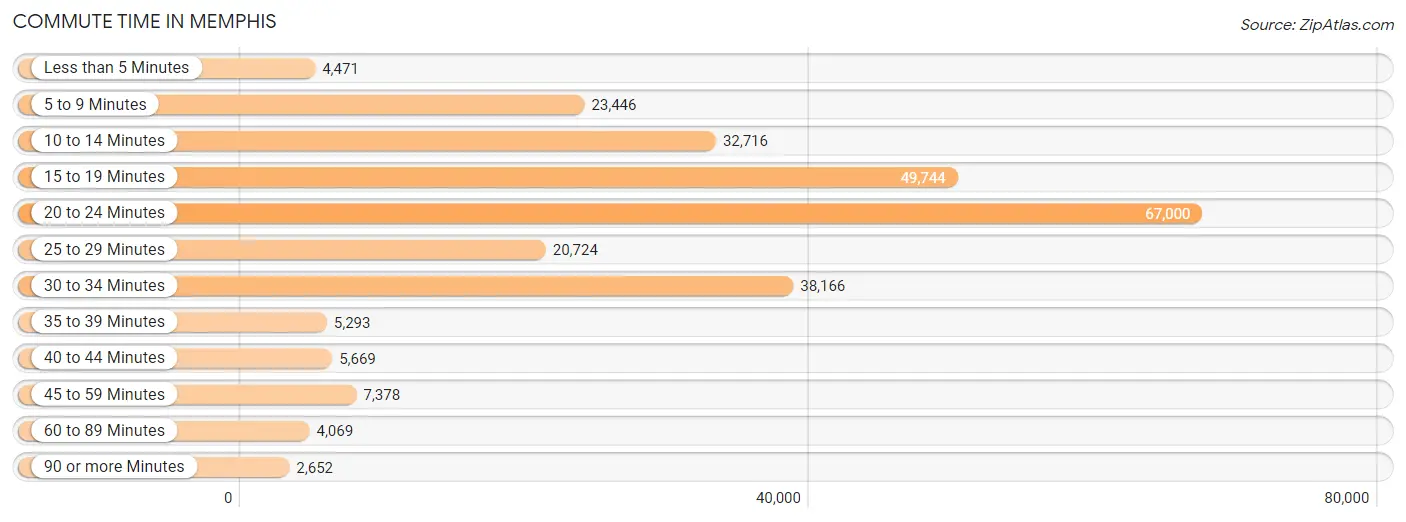
Commute Time in Memphis
The most frequently occuring commute durations in Memphis are 20 to 24 minutes (67,000 commuters, 25.6%), 15 to 19 minutes (49,744 commuters, 19.0%), and 30 to 34 minutes (38,166 commuters, 14.6%).
| Commute Time | # Commuters | % Commuters |
| Less than 5 Minutes | 4,471 | 1.7% |
| 5 to 9 Minutes | 23,446 | 9.0% |
| 10 to 14 Minutes | 32,716 | 12.5% |
| 15 to 19 Minutes | 49,744 | 19.0% |
| 20 to 24 Minutes | 67,000 | 25.6% |
| 25 to 29 Minutes | 20,724 | 7.9% |
| 30 to 34 Minutes | 38,166 | 14.6% |
| 35 to 39 Minutes | 5,293 | 2.0% |
| 40 to 44 Minutes | 5,669 | 2.2% |
| 45 to 59 Minutes | 7,378 | 2.8% |
| 60 to 89 Minutes | 4,069 | 1.6% |
| 90 or more Minutes | 2,652 | 1.0% |
Commute Time by Sex in Memphis
The most common commute times in Memphis are 20 to 24 minutes (33,476 commuters, 25.8%) for males and 20 to 24 minutes (33,524 commuters, 25.5%) for females.
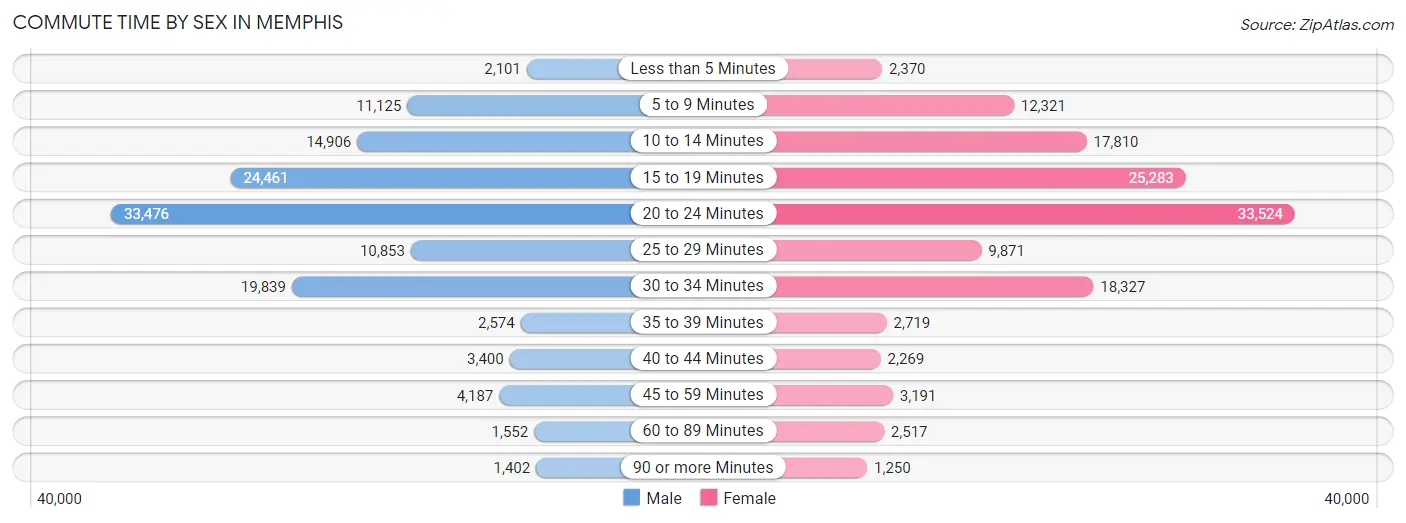
| Commute Time | Male | Female |
| Less than 5 Minutes | 2,101 (1.6%) | 2,370 (1.8%) |
| 5 to 9 Minutes | 11,125 (8.6%) | 12,321 (9.4%) |
| 10 to 14 Minutes | 14,906 (11.5%) | 17,810 (13.6%) |
| 15 to 19 Minutes | 24,461 (18.8%) | 25,283 (19.2%) |
| 20 to 24 Minutes | 33,476 (25.8%) | 33,524 (25.5%) |
| 25 to 29 Minutes | 10,853 (8.4%) | 9,871 (7.5%) |
| 30 to 34 Minutes | 19,839 (15.3%) | 18,327 (13.9%) |
| 35 to 39 Minutes | 2,574 (2.0%) | 2,719 (2.1%) |
| 40 to 44 Minutes | 3,400 (2.6%) | 2,269 (1.7%) |
| 45 to 59 Minutes | 4,187 (3.2%) | 3,191 (2.4%) |
| 60 to 89 Minutes | 1,552 (1.2%) | 2,517 (1.9%) |
| 90 or more Minutes | 1,402 (1.1%) | 1,250 (0.9%) |
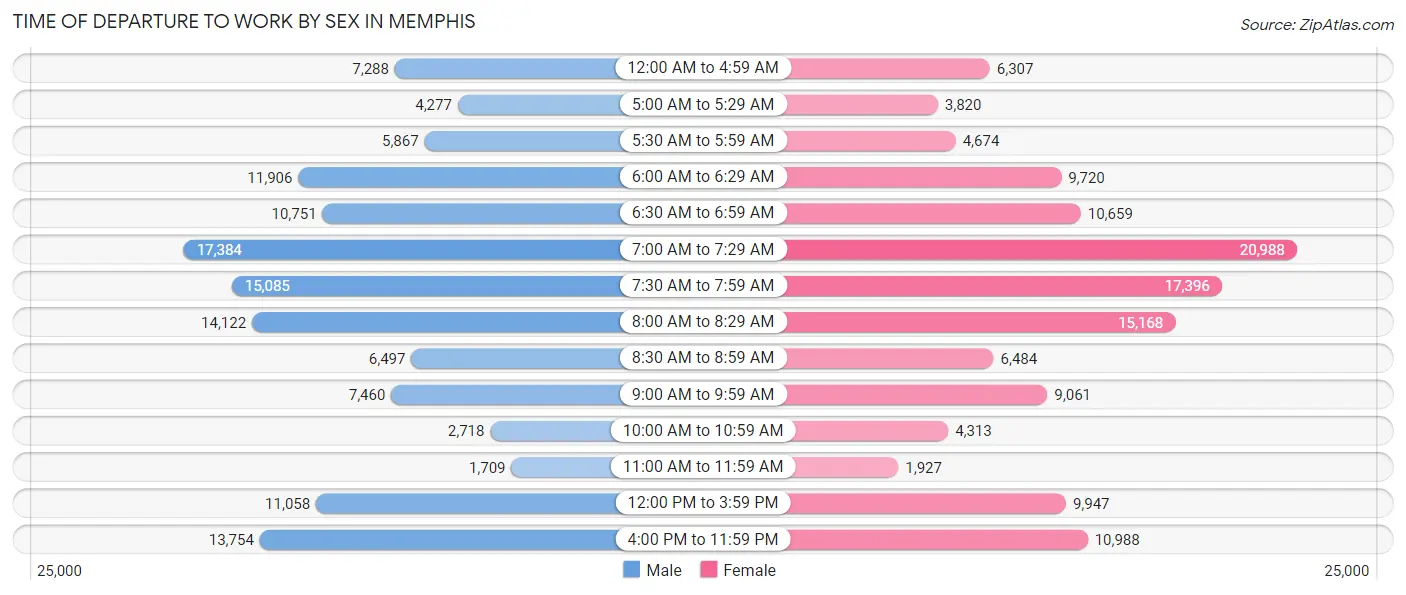
Time of Departure to Work by Sex in Memphis
The most frequent times of departure to work in Memphis are 7:00 AM to 7:29 AM (17,384, 13.4%) for males and 7:00 AM to 7:29 AM (20,988, 16.0%) for females.
| Time of Departure | Male | Female |
| 12:00 AM to 4:59 AM | 7,288 (5.6%) | 6,307 (4.8%) |
| 5:00 AM to 5:29 AM | 4,277 (3.3%) | 3,820 (2.9%) |
| 5:30 AM to 5:59 AM | 5,867 (4.5%) | 4,674 (3.6%) |
| 6:00 AM to 6:29 AM | 11,906 (9.2%) | 9,720 (7.4%) |
| 6:30 AM to 6:59 AM | 10,751 (8.3%) | 10,659 (8.1%) |
| 7:00 AM to 7:29 AM | 17,384 (13.4%) | 20,988 (16.0%) |
| 7:30 AM to 7:59 AM | 15,085 (11.6%) | 17,396 (13.2%) |
| 8:00 AM to 8:29 AM | 14,122 (10.9%) | 15,168 (11.5%) |
| 8:30 AM to 8:59 AM | 6,497 (5.0%) | 6,484 (4.9%) |
| 9:00 AM to 9:59 AM | 7,460 (5.7%) | 9,061 (6.9%) |
| 10:00 AM to 10:59 AM | 2,718 (2.1%) | 4,313 (3.3%) |
| 11:00 AM to 11:59 AM | 1,709 (1.3%) | 1,927 (1.5%) |
| 12:00 PM to 3:59 PM | 11,058 (8.5%) | 9,947 (7.6%) |
| 4:00 PM to 11:59 PM | 13,754 (10.6%) | 10,988 (8.4%) |
| Total | 129,876 (100.0%) | 131,452 (100.0%) |
Housing Occupancy in Memphis
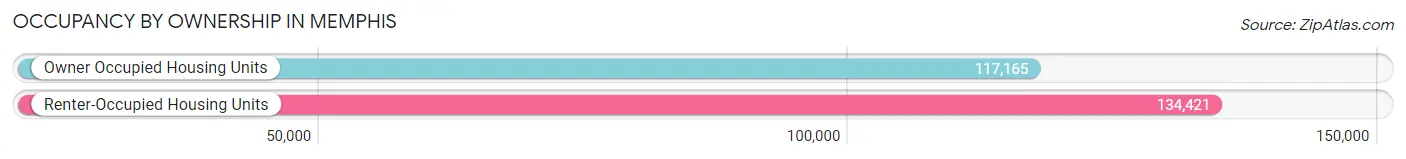
Occupancy by Ownership in Memphis
Of the total 251,586 dwellings in Memphis, owner-occupied units account for 117,165 (46.6%), while renter-occupied units make up 134,421 (53.4%).
| Occupancy | # Housing Units | % Housing Units |
| Owner Occupied Housing Units | 117,165 | 46.6% |
| Renter-Occupied Housing Units | 134,421 | 53.4% |
| Total Occupied Housing Units | 251,586 | 100.0% |
Occupancy by Household Size in Memphis
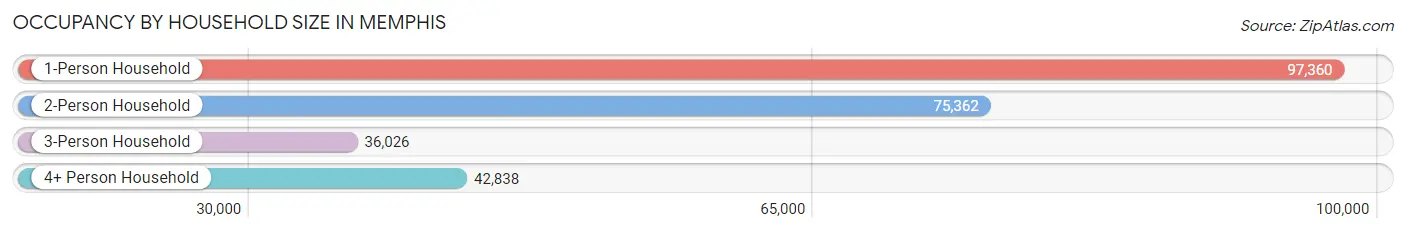
| Household Size | # Housing Units | % Housing Units |
| 1-Person Household | 97,360 | 38.7% |
| 2-Person Household | 75,362 | 29.9% |
| 3-Person Household | 36,026 | 14.3% |
| 4+ Person Household | 42,838 | 17.0% |
| Total Housing Units | 251,586 | 100.0% |
Occupancy by Ownership by Household Size in Memphis
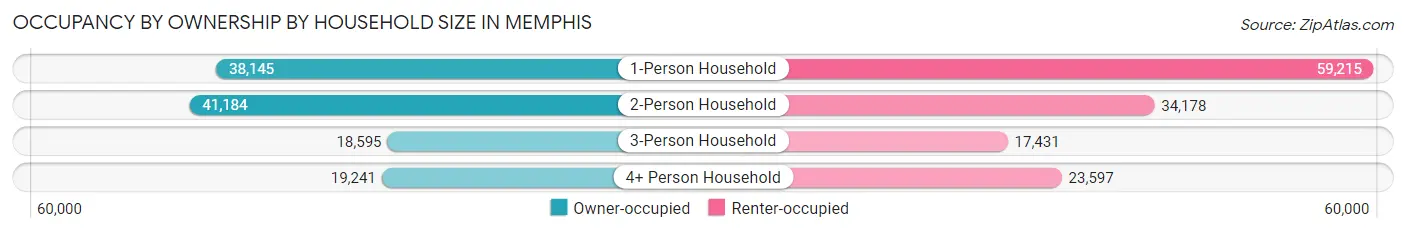
| Household Size | Owner-occupied | Renter-occupied |
| 1-Person Household | 38,145 (39.2%) | 59,215 (60.8%) |
| 2-Person Household | 41,184 (54.6%) | 34,178 (45.4%) |
| 3-Person Household | 18,595 (51.6%) | 17,431 (48.4%) |
| 4+ Person Household | 19,241 (44.9%) | 23,597 (55.1%) |
| Total Housing Units | 117,165 (46.6%) | 134,421 (53.4%) |
Occupancy by Educational Attainment in Memphis
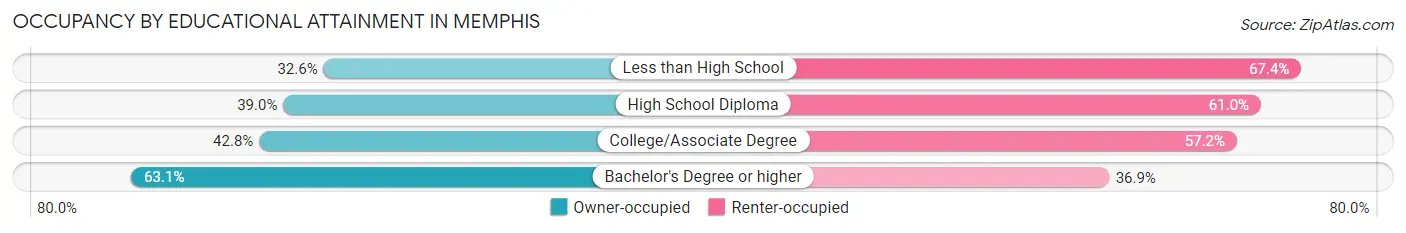
| Household Size | Owner-occupied | Renter-occupied |
| Less than High School | 9,140 (32.6%) | 18,908 (67.4%) |
| High School Diploma | 27,711 (39.0%) | 43,388 (61.0%) |
| College/Associate Degree | 33,513 (42.8%) | 44,783 (57.2%) |
| Bachelor's Degree or higher | 46,801 (63.1%) | 27,342 (36.9%) |
Occupancy by Age of Householder in Memphis
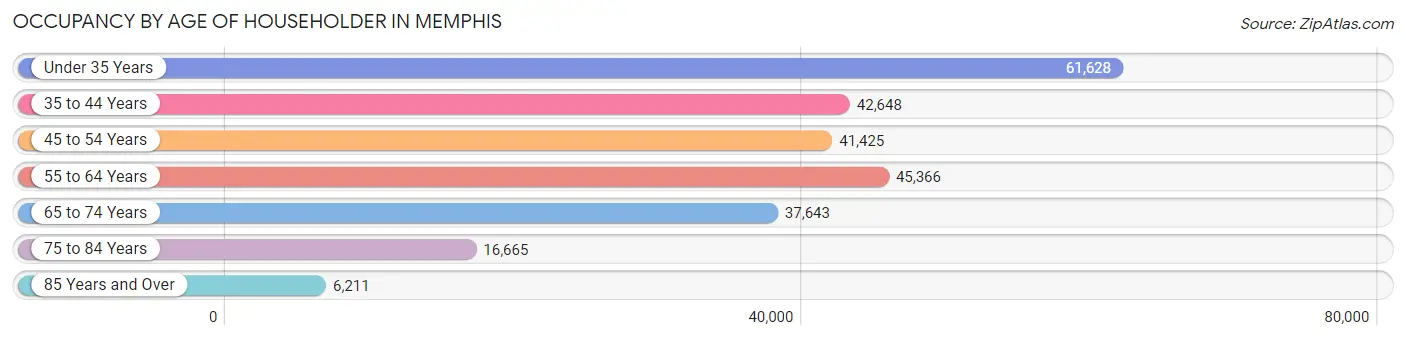
| Age Bracket | # Households | % Households |
| Under 35 Years | 61,628 | 24.5% |
| 35 to 44 Years | 42,648 | 17.0% |
| 45 to 54 Years | 41,425 | 16.5% |
| 55 to 64 Years | 45,366 | 18.0% |
| 65 to 74 Years | 37,643 | 15.0% |
| 75 to 84 Years | 16,665 | 6.6% |
| 85 Years and Over | 6,211 | 2.5% |
| Total | 251,586 | 100.0% |
Housing Finances in Memphis
Median Income by Occupancy in Memphis
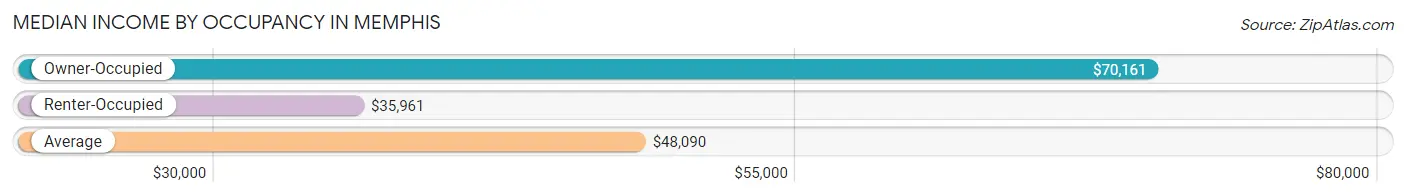
| Occupancy Type | # Households | Median Income |
| Owner-Occupied | 117,165 (46.6%) | $70,161 |
| Renter-Occupied | 134,421 (53.4%) | $35,961 |
| Average | 251,586 (100.0%) | $48,090 |
Occupancy by Householder Income Bracket in Memphis
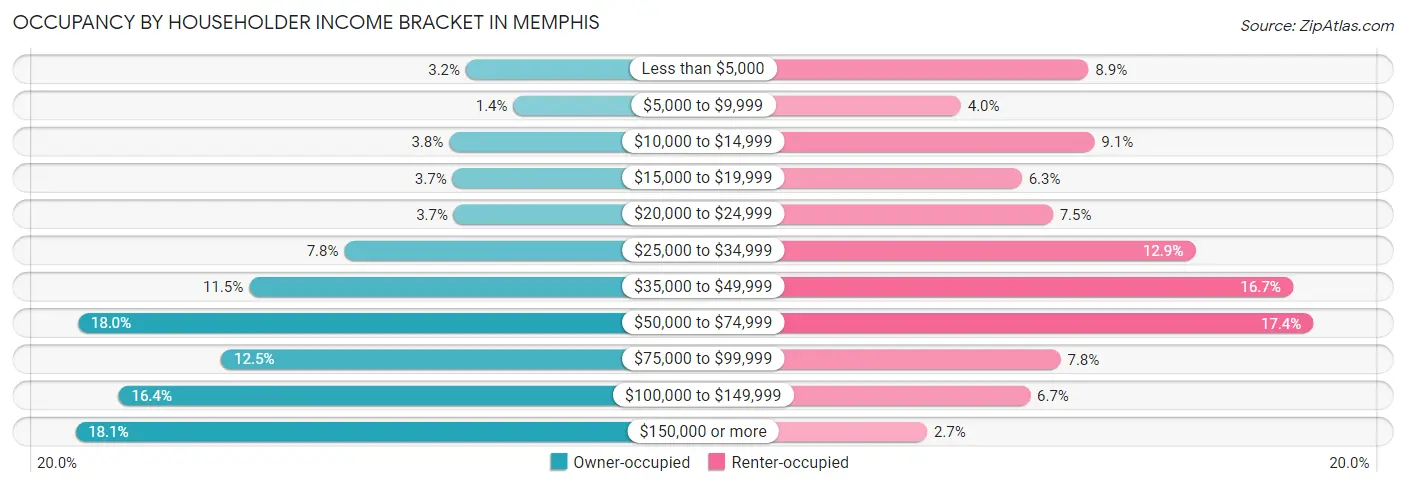
| Income Bracket | Owner-occupied | Renter-occupied |
| Less than $5,000 | 3,737 (3.2%) | 11,923 (8.9%) |
| $5,000 to $9,999 | 1,619 (1.4%) | 5,385 (4.0%) |
| $10,000 to $14,999 | 4,492 (3.8%) | 12,227 (9.1%) |
| $15,000 to $19,999 | 4,340 (3.7%) | 8,506 (6.3%) |
| $20,000 to $24,999 | 4,272 (3.6%) | 10,097 (7.5%) |
| $25,000 to $34,999 | 9,158 (7.8%) | 17,385 (12.9%) |
| $35,000 to $49,999 | 13,417 (11.5%) | 22,383 (16.7%) |
| $50,000 to $74,999 | 21,059 (18.0%) | 23,426 (17.4%) |
| $75,000 to $99,999 | 14,657 (12.5%) | 10,495 (7.8%) |
| $100,000 to $149,999 | 19,239 (16.4%) | 8,941 (6.7%) |
| $150,000 or more | 21,175 (18.1%) | 3,653 (2.7%) |
| Total | 117,165 (100.0%) | 134,421 (100.0%) |
Monthly Housing Cost Tiers in Memphis
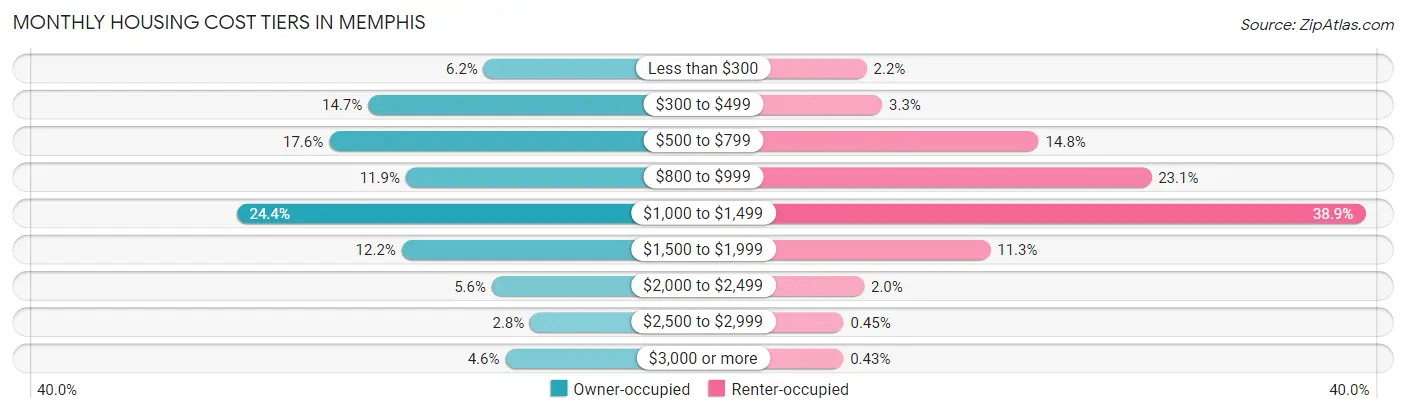
| Monthly Cost | Owner-occupied | Renter-occupied |
| Less than $300 | 7,255 (6.2%) | 2,893 (2.1%) |
| $300 to $499 | 17,226 (14.7%) | 4,422 (3.3%) |
| $500 to $799 | 20,602 (17.6%) | 19,918 (14.8%) |
| $800 to $999 | 13,983 (11.9%) | 31,064 (23.1%) |
| $1,000 to $1,499 | 28,580 (24.4%) | 52,231 (38.9%) |
| $1,500 to $1,999 | 14,324 (12.2%) | 15,138 (11.3%) |
| $2,000 to $2,499 | 6,553 (5.6%) | 2,631 (2.0%) |
| $2,500 to $2,999 | 3,251 (2.8%) | 607 (0.4%) |
| $3,000 or more | 5,391 (4.6%) | 584 (0.4%) |
| Total | 117,165 (100.0%) | 134,421 (100.0%) |
Physical Housing Characteristics in Memphis
Housing Structures in Memphis
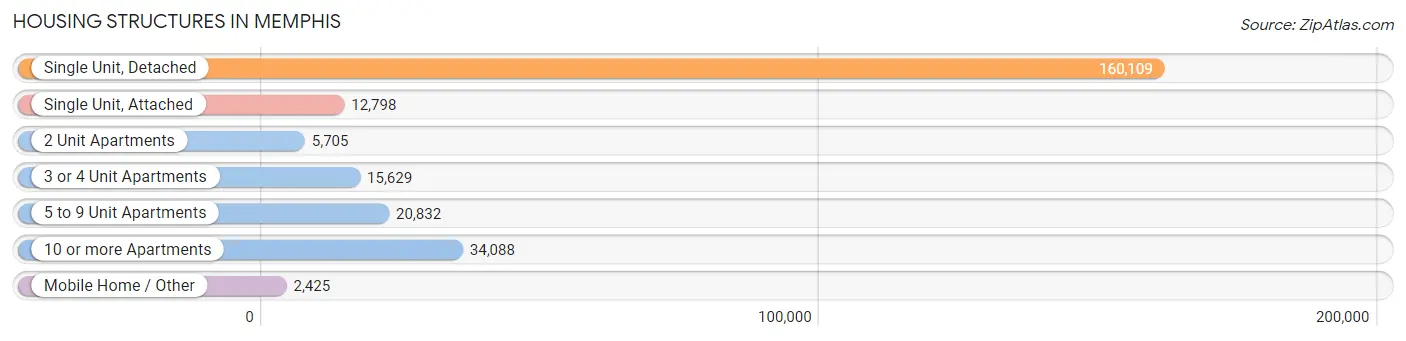
| Structure Type | # Housing Units | % Housing Units |
| Single Unit, Detached | 160,109 | 63.6% |
| Single Unit, Attached | 12,798 | 5.1% |
| 2 Unit Apartments | 5,705 | 2.3% |
| 3 or 4 Unit Apartments | 15,629 | 6.2% |
| 5 to 9 Unit Apartments | 20,832 | 8.3% |
| 10 or more Apartments | 34,088 | 13.6% |
| Mobile Home / Other | 2,425 | 1.0% |
| Total | 251,586 | 100.0% |
Housing Structures by Occupancy in Memphis
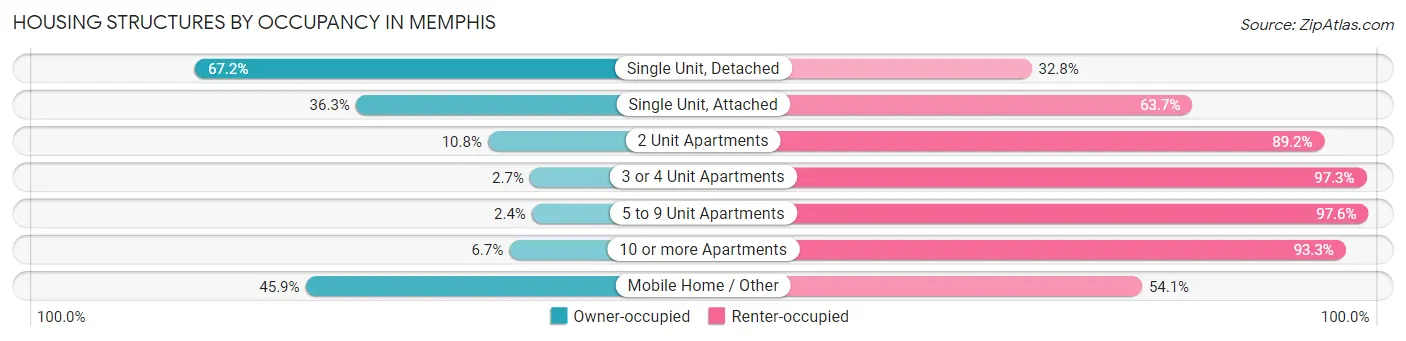
| Structure Type | Owner-occupied | Renter-occupied |
| Single Unit, Detached | 107,579 (67.2%) | 52,530 (32.8%) |
| Single Unit, Attached | 4,641 (36.3%) | 8,157 (63.7%) |
| 2 Unit Apartments | 618 (10.8%) | 5,087 (89.2%) |
| 3 or 4 Unit Apartments | 428 (2.7%) | 15,201 (97.3%) |
| 5 to 9 Unit Apartments | 493 (2.4%) | 20,339 (97.6%) |
| 10 or more Apartments | 2,292 (6.7%) | 31,796 (93.3%) |
| Mobile Home / Other | 1,114 (45.9%) | 1,311 (54.1%) |
| Total | 117,165 (46.6%) | 134,421 (53.4%) |
Housing Structures by Number of Rooms in Memphis
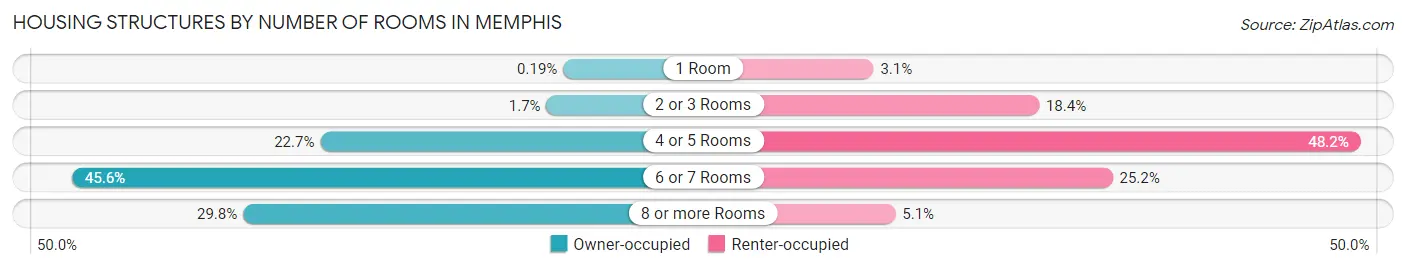
| Number of Rooms | Owner-occupied | Renter-occupied |
| 1 Room | 223 (0.2%) | 4,173 (3.1%) |
| 2 or 3 Rooms | 2,038 (1.7%) | 24,752 (18.4%) |
| 4 or 5 Rooms | 26,548 (22.7%) | 64,722 (48.1%) |
| 6 or 7 Rooms | 53,446 (45.6%) | 33,882 (25.2%) |
| 8 or more Rooms | 34,910 (29.8%) | 6,892 (5.1%) |
| Total | 117,165 (100.0%) | 134,421 (100.0%) |
Housing Structure by Heating Type in Memphis
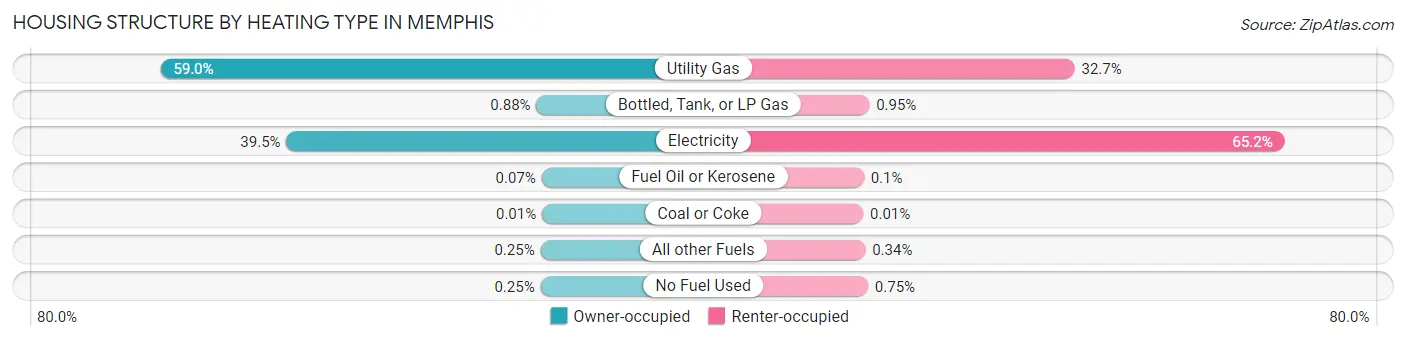
| Heating Type | Owner-occupied | Renter-occupied |
| Utility Gas | 69,144 (59.0%) | 43,955 (32.7%) |
| Bottled, Tank, or LP Gas | 1,033 (0.9%) | 1,273 (0.9%) |
| Electricity | 46,312 (39.5%) | 87,570 (65.1%) |
| Fuel Oil or Kerosene | 78 (0.1%) | 136 (0.1%) |
| Coal or Coke | 13 (0.0%) | 20 (0.0%) |
| All other Fuels | 294 (0.3%) | 461 (0.3%) |
| No Fuel Used | 291 (0.3%) | 1,006 (0.7%) |
| Total | 117,165 (100.0%) | 134,421 (100.0%) |
Household Vehicle Usage in Memphis
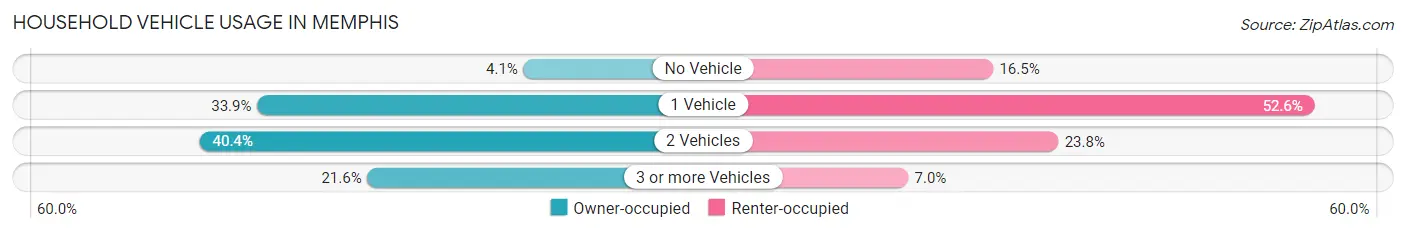
| Vehicles per Household | Owner-occupied | Renter-occupied |
| No Vehicle | 4,795 (4.1%) | 22,218 (16.5%) |
| 1 Vehicle | 39,759 (33.9%) | 70,733 (52.6%) |
| 2 Vehicles | 47,320 (40.4%) | 32,040 (23.8%) |
| 3 or more Vehicles | 25,291 (21.6%) | 9,430 (7.0%) |
| Total | 117,165 (100.0%) | 134,421 (100.0%) |
Real Estate & Mortgages in Memphis
Real Estate and Mortgage Overview in Memphis
| Characteristic | Without Mortgage | With Mortgage |
| Housing Units | 47,942 | 69,223 |
| Median Property Value | $104,300 | $160,500 |
| Median Household Income | $55,742 | $14,767 |
| Monthly Housing Costs | $503 | $4,754 |
| Real Estate Taxes | $1,439 | $3,824 |
Property Value by Mortgage Status in Memphis
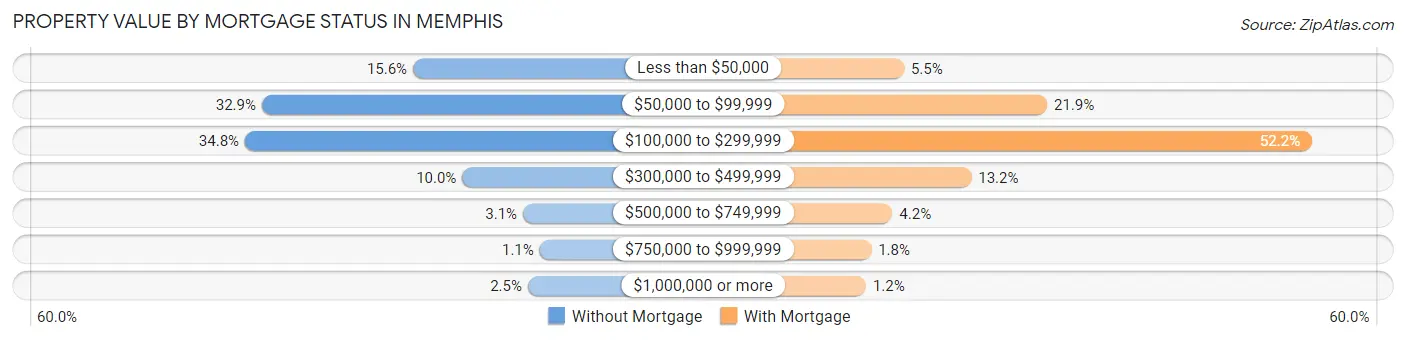
| Property Value | Without Mortgage | With Mortgage |
| Less than $50,000 | 7,489 (15.6%) | 3,830 (5.5%) |
| $50,000 to $99,999 | 15,766 (32.9%) | 15,153 (21.9%) |
| $100,000 to $299,999 | 16,694 (34.8%) | 36,105 (52.2%) |
| $300,000 to $499,999 | 4,788 (10.0%) | 9,159 (13.2%) |
| $500,000 to $749,999 | 1,463 (3.0%) | 2,914 (4.2%) |
| $750,000 to $999,999 | 547 (1.1%) | 1,238 (1.8%) |
| $1,000,000 or more | 1,195 (2.5%) | 824 (1.2%) |
| Total | 47,942 (100.0%) | 69,223 (100.0%) |
Household Income by Mortgage Status in Memphis
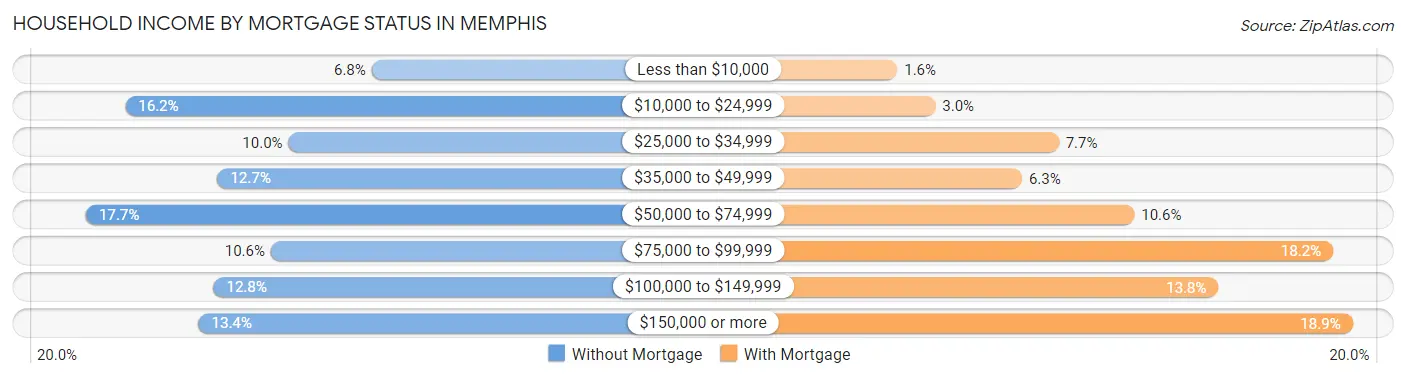
| Household Income | Without Mortgage | With Mortgage |
| Less than $10,000 | 3,251 (6.8%) | 1,100 (1.6%) |
| $10,000 to $24,999 | 7,748 (16.2%) | 2,105 (3.0%) |
| $25,000 to $34,999 | 4,772 (10.0%) | 5,356 (7.7%) |
| $35,000 to $49,999 | 6,067 (12.7%) | 4,386 (6.3%) |
| $50,000 to $74,999 | 8,467 (17.7%) | 7,350 (10.6%) |
| $75,000 to $99,999 | 5,092 (10.6%) | 12,592 (18.2%) |
| $100,000 to $149,999 | 6,137 (12.8%) | 9,565 (13.8%) |
| $150,000 or more | 6,408 (13.4%) | 13,102 (18.9%) |
| Total | 47,942 (100.0%) | 69,223 (100.0%) |
Property Value to Household Income Ratio in Memphis
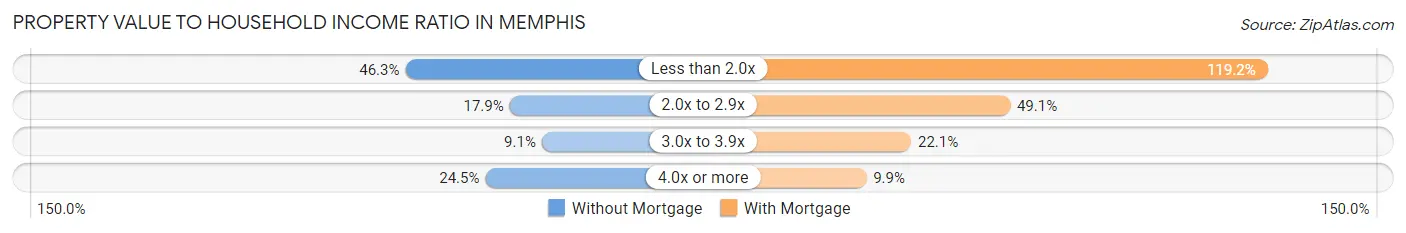
| Value-to-Income Ratio | Without Mortgage | With Mortgage |
| Less than 2.0x | 22,196 (46.3%) | 82,537 (119.2%) |
| 2.0x to 2.9x | 8,579 (17.9%) | 33,956 (49.0%) |
| 3.0x to 3.9x | 4,372 (9.1%) | 15,302 (22.1%) |
| 4.0x or more | 11,745 (24.5%) | 6,845 (9.9%) |
| Total | 47,942 (100.0%) | 69,223 (100.0%) |
Real Estate Taxes by Mortgage Status in Memphis
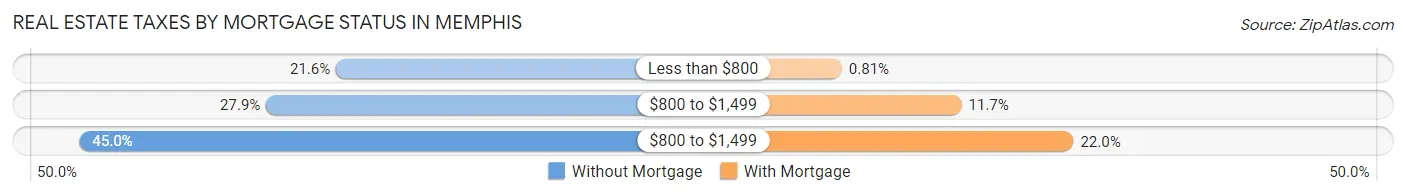
| Property Taxes | Without Mortgage | With Mortgage |
| Less than $800 | 10,336 (21.6%) | 563 (0.8%) |
| $800 to $1,499 | 13,396 (27.9%) | 8,128 (11.7%) |
| $800 to $1,499 | 21,570 (45.0%) | 15,203 (22.0%) |
| Total | 47,942 (100.0%) | 69,223 (100.0%) |
Health & Disability in Memphis
Health Insurance Coverage by Age in Memphis
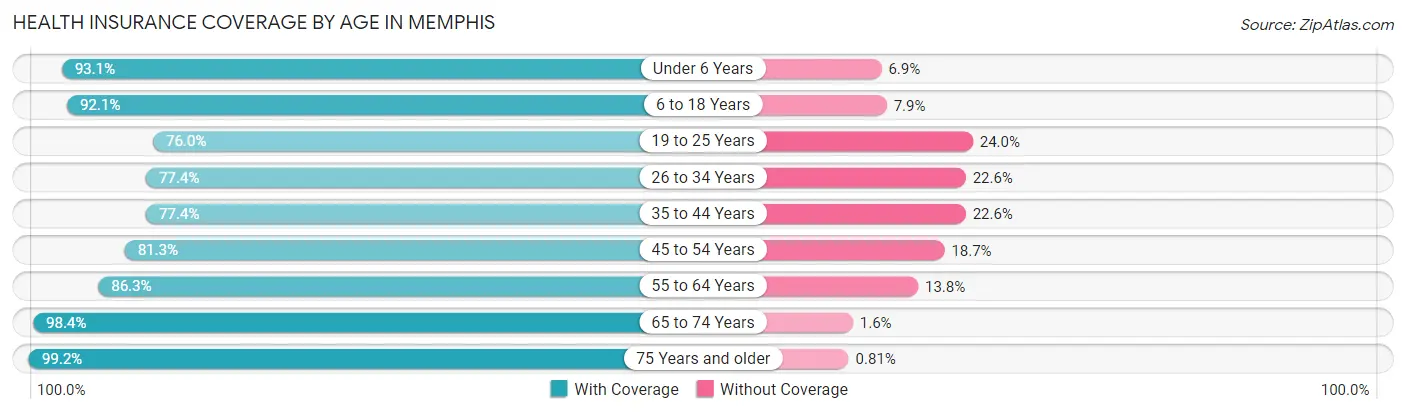
| Age Bracket | With Coverage | Without Coverage |
| Under 6 Years | 51,056 (93.1%) | 3,799 (6.9%) |
| 6 to 18 Years | 98,653 (92.1%) | 8,471 (7.9%) |
| 19 to 25 Years | 48,717 (76.0%) | 15,349 (24.0%) |
| 26 to 34 Years | 69,775 (77.4%) | 20,415 (22.6%) |
| 35 to 44 Years | 57,743 (77.4%) | 16,900 (22.6%) |
| 45 to 54 Years | 56,625 (81.3%) | 13,004 (18.7%) |
| 55 to 64 Years | 63,820 (86.3%) | 10,172 (13.8%) |
| 65 to 74 Years | 53,173 (98.4%) | 858 (1.6%) |
| 75 Years and older | 31,737 (99.2%) | 259 (0.8%) |
| Total | 531,299 (85.6%) | 89,227 (14.4%) |
Health Insurance Coverage by Citizenship Status in Memphis
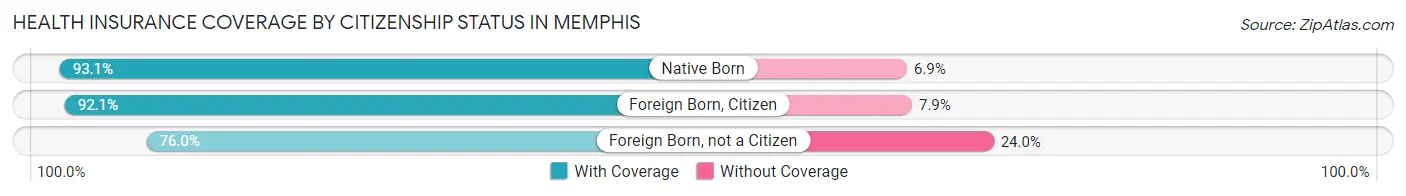
| Citizenship Status | With Coverage | Without Coverage |
| Native Born | 51,056 (93.1%) | 3,799 (6.9%) |
| Foreign Born, Citizen | 98,653 (92.1%) | 8,471 (7.9%) |
| Foreign Born, not a Citizen | 48,717 (76.0%) | 15,349 (24.0%) |
Health Insurance Coverage by Household Income in Memphis
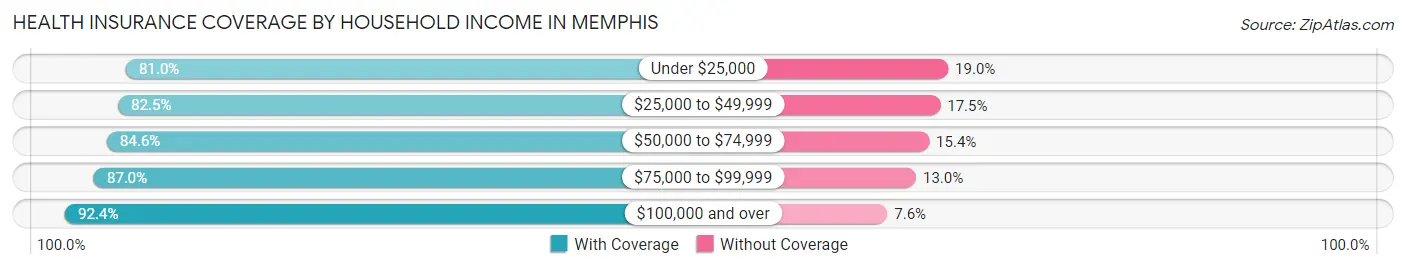
| Household Income | With Coverage | Without Coverage |
| Under $25,000 | 107,344 (81.0%) | 25,164 (19.0%) |
| $25,000 to $49,999 | 115,813 (82.5%) | 24,587 (17.5%) |
| $50,000 to $74,999 | 96,392 (84.6%) | 17,581 (15.4%) |
| $75,000 to $99,999 | 60,578 (87.0%) | 9,037 (13.0%) |
| $100,000 and over | 146,590 (92.4%) | 12,065 (7.6%) |
Public vs Private Health Insurance Coverage by Age in Memphis
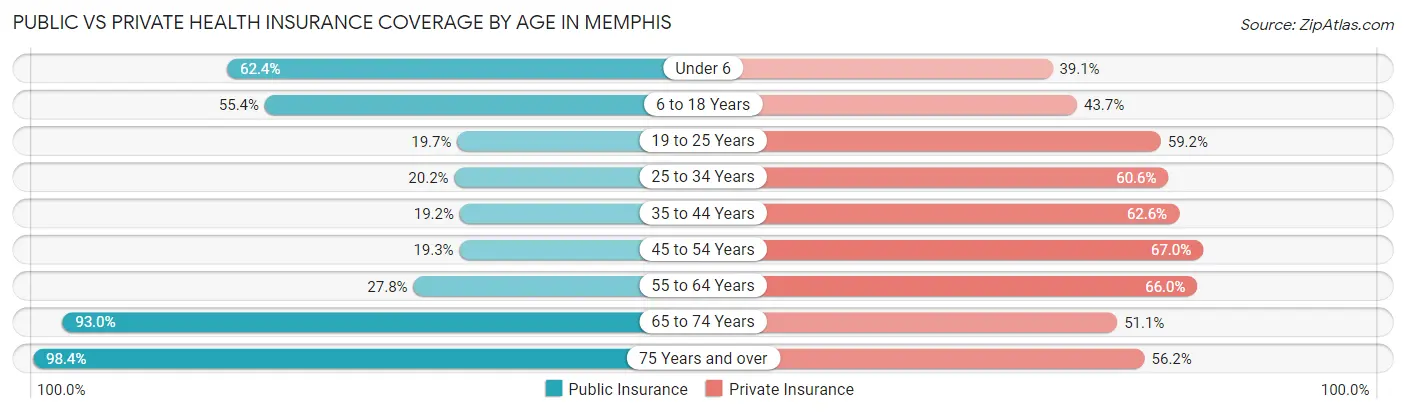
| Age Bracket | Public Insurance | Private Insurance |
| Under 6 | 34,241 (62.4%) | 21,450 (39.1%) |
| 6 to 18 Years | 59,351 (55.4%) | 46,783 (43.7%) |
| 19 to 25 Years | 12,606 (19.7%) | 37,935 (59.2%) |
| 25 to 34 Years | 18,238 (20.2%) | 54,655 (60.6%) |
| 35 to 44 Years | 14,347 (19.2%) | 46,703 (62.6%) |
| 45 to 54 Years | 13,431 (19.3%) | 46,681 (67.0%) |
| 55 to 64 Years | 20,593 (27.8%) | 48,820 (66.0%) |
| 65 to 74 Years | 50,244 (93.0%) | 27,622 (51.1%) |
| 75 Years and over | 31,494 (98.4%) | 17,985 (56.2%) |
| Total | 254,545 (41.0%) | 348,634 (56.2%) |
Disability Status by Sex by Age in Memphis
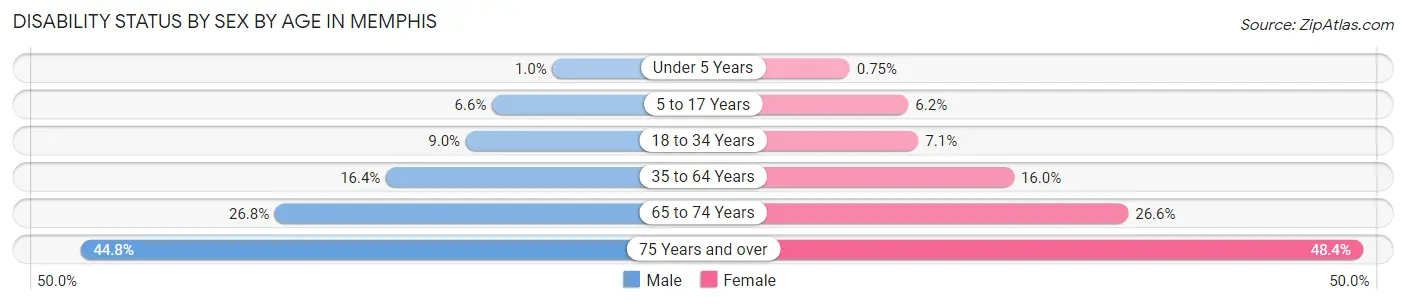
| Age Bracket | Male | Female |
| Under 5 Years | 231 (1.0%) | 165 (0.7%) |
| 5 to 17 Years | 3,707 (6.6%) | 3,293 (6.2%) |
| 18 to 34 Years | 6,982 (9.0%) | 5,991 (7.1%) |
| 35 to 64 Years | 16,725 (16.4%) | 18,626 (16.0%) |
| 65 to 74 Years | 6,184 (26.8%) | 8,224 (26.6%) |
| 75 Years and over | 5,061 (44.8%) | 10,009 (48.3%) |
Disability Class by Sex by Age in Memphis
Disability Class: Hearing Difficulty
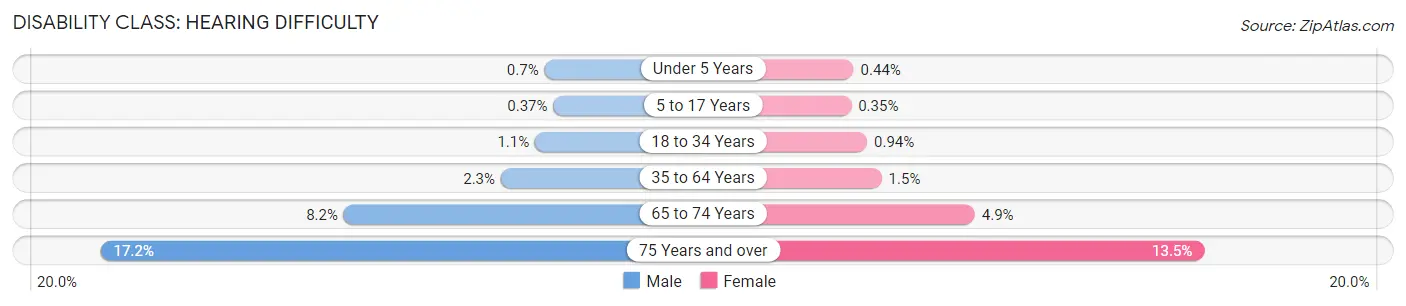
| Age Bracket | Male | Female |
| Under 5 Years | 163 (0.7%) | 96 (0.4%) |
| 5 to 17 Years | 207 (0.4%) | 184 (0.4%) |
| 18 to 34 Years | 814 (1.1%) | 793 (0.9%) |
| 35 to 64 Years | 2,363 (2.3%) | 1,721 (1.5%) |
| 65 to 74 Years | 1,882 (8.2%) | 1,527 (4.9%) |
| 75 Years and over | 1,940 (17.2%) | 2,785 (13.5%) |
Disability Class: Vision Difficulty
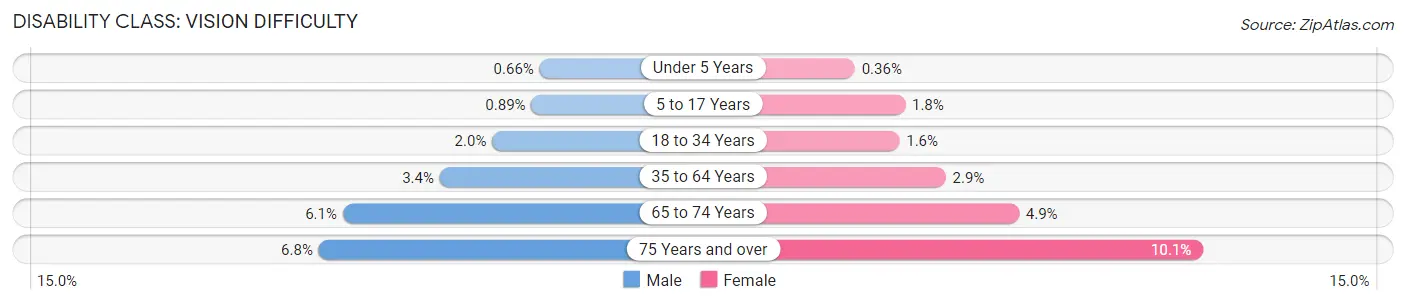
| Age Bracket | Male | Female |
| Under 5 Years | 152 (0.7%) | 80 (0.4%) |
| 5 to 17 Years | 500 (0.9%) | 936 (1.8%) |
| 18 to 34 Years | 1,532 (2.0%) | 1,347 (1.6%) |
| 35 to 64 Years | 3,498 (3.4%) | 3,365 (2.9%) |
| 65 to 74 Years | 1,418 (6.1%) | 1,525 (4.9%) |
| 75 Years and over | 769 (6.8%) | 2,082 (10.1%) |
Disability Class: Cognitive Difficulty
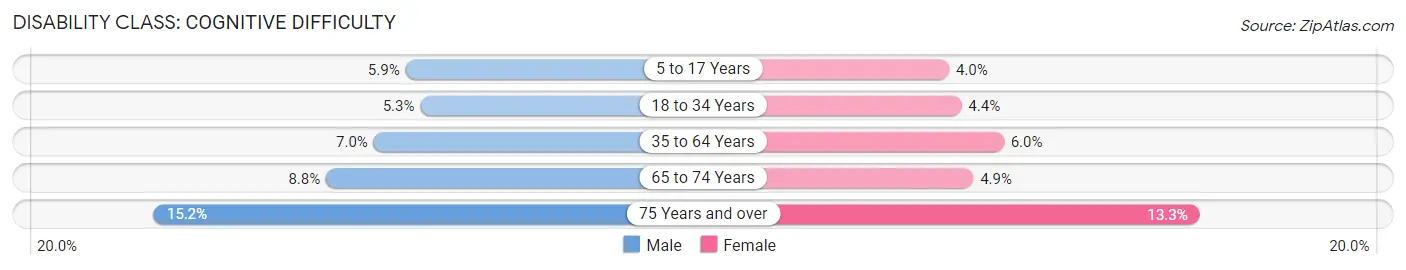
| Age Bracket | Male | Female |
| 5 to 17 Years | 3,295 (5.9%) | 2,121 (4.0%) |
| 18 to 34 Years | 4,101 (5.3%) | 3,741 (4.4%) |
| 35 to 64 Years | 7,158 (7.0%) | 7,000 (6.0%) |
| 65 to 74 Years | 2,035 (8.8%) | 1,508 (4.9%) |
| 75 Years and over | 1,717 (15.2%) | 2,749 (13.3%) |
Disability Class: Ambulatory Difficulty
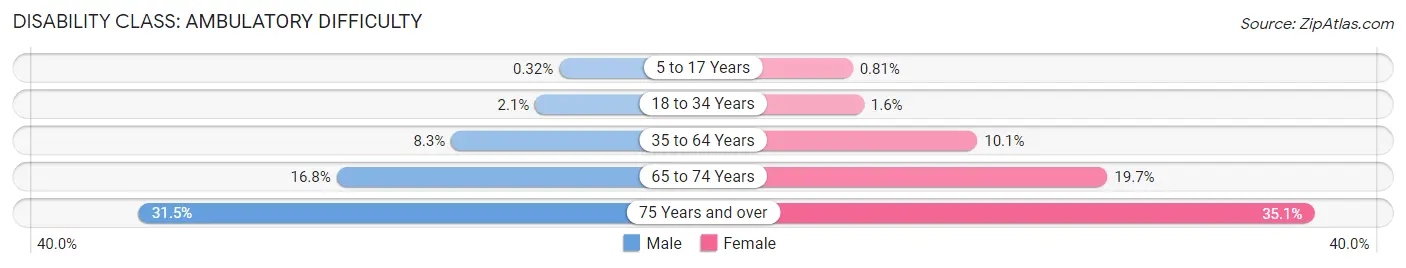
| Age Bracket | Male | Female |
| 5 to 17 Years | 179 (0.3%) | 429 (0.8%) |
| 18 to 34 Years | 1,614 (2.1%) | 1,382 (1.6%) |
| 35 to 64 Years | 8,486 (8.3%) | 11,731 (10.1%) |
| 65 to 74 Years | 3,891 (16.8%) | 6,099 (19.7%) |
| 75 Years and over | 3,559 (31.5%) | 7,260 (35.1%) |
Disability Class: Self-Care Difficulty
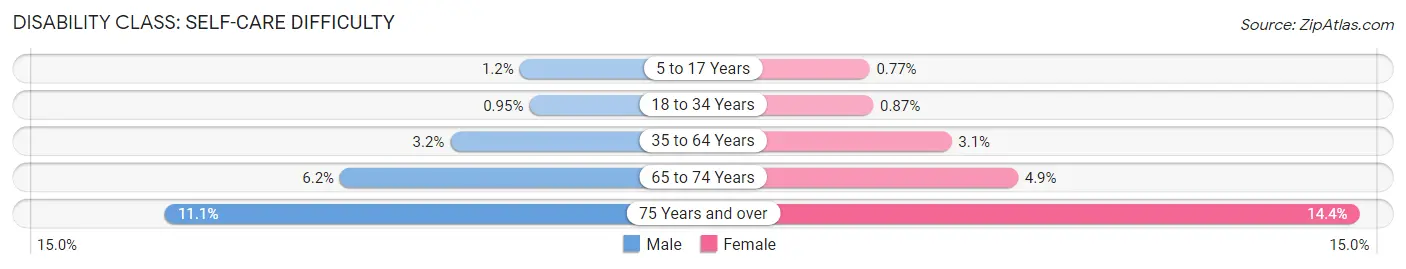
| Age Bracket | Male | Female |
| 5 to 17 Years | 684 (1.2%) | 412 (0.8%) |
| 18 to 34 Years | 733 (0.9%) | 733 (0.9%) |
| 35 to 64 Years | 3,200 (3.2%) | 3,552 (3.0%) |
| 65 to 74 Years | 1,438 (6.2%) | 1,514 (4.9%) |
| 75 Years and over | 1,253 (11.1%) | 2,983 (14.4%) |
Technology Access in Memphis
Computing Device Access in Memphis
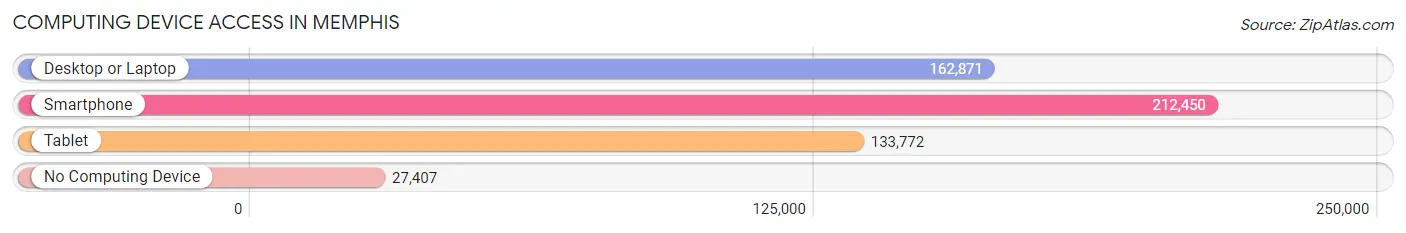
| Device Type | # Households | % Households |
| Desktop or Laptop | 162,871 | 64.7% |
| Smartphone | 212,450 | 84.4% |
| Tablet | 133,772 | 53.2% |
| No Computing Device | 27,407 | 10.9% |
| Total | 251,586 | 100.0% |
Internet Access in Memphis
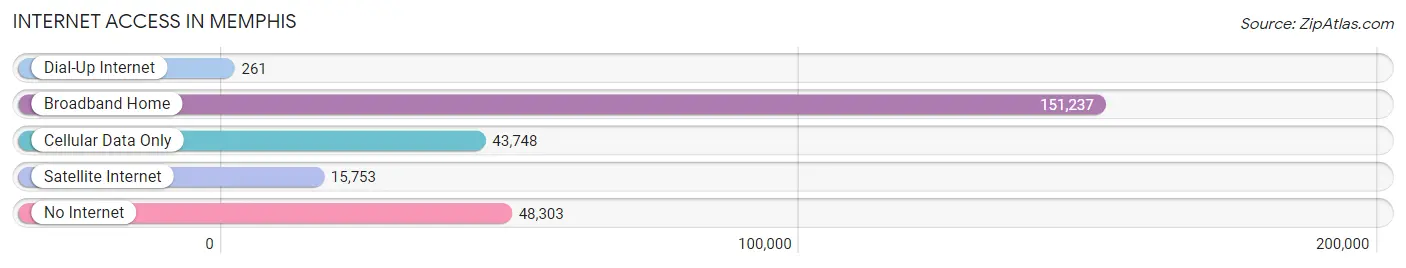
| Internet Type | # Households | % Households |
| Dial-Up Internet | 261 | 0.1% |
| Broadband Home | 151,237 | 60.1% |
| Cellular Data Only | 43,748 | 17.4% |
| Satellite Internet | 15,753 | 6.3% |
| No Internet | 48,303 | 19.2% |
| Total | 251,586 | 100.0% |
Memphis Summary
Memphis, Tennessee is a city located in the southwestern corner of the state, along the Mississippi River. It is the largest city in the state and the second largest in the Mid-South region. Memphis is known for its rich musical heritage, particularly in the genres of blues, soul, and rock and roll. It is also home to the National Civil Rights Museum, which commemorates the site of the assassination of Dr. Martin Luther King Jr.
Geography
Memphis is located in the southwestern corner of Tennessee, along the Mississippi River. It is the largest city in the state and the second largest in the Mid-South region. The city is situated on the fourth Chickasaw Bluff, south of the confluence of the Wolf and Mississippi rivers. The city is divided into three distinct geographic regions: Downtown, Midtown, and East Memphis. Downtown Memphis is the city's central business district and is home to the majority of the city's skyscrapers and cultural attractions. Midtown Memphis is the city's cultural center, home to the University of Memphis, the Memphis Zoo, and the Memphis Brooks Museum of Art. East Memphis is the city's residential and commercial center, and is home to many of the city's largest employers.
Economy
Memphis is a major economic center in the Mid-South region. The city is home to several Fortune 500 companies, including FedEx, AutoZone, International Paper, and ServiceMaster. The city is also home to the Memphis Medical District, which is home to several major medical institutions, including the University of Tennessee Health Science Center, St. Jude Children's Research Hospital, and Le Bonheur Children's Hospital. The city is also home to the Memphis International Airport, which serves as a major hub for FedEx Express.
Demographics
As of the 2010 census, Memphis had a population of 646,889, making it the largest city in Tennessee and the second largest in the Mid-South region. The city is racially diverse, with African Americans making up 63.3% of the population, whites making up 29.2%, and Hispanics making up 4.3%. The median household income in Memphis is $37,817, and the median home value is $97,400.
Conclusion
Memphis, Tennessee is a vibrant city with a rich history and culture. It is home to several Fortune 500 companies, major medical institutions, and the Memphis International Airport. The city is racially diverse, with African Americans making up the majority of the population. Memphis is a major economic center in the Mid-South region, and its economy is driven by the city's major employers, including FedEx, AutoZone, International Paper, and ServiceMaster.
Common Questions
What is Per Capita Income in Memphis?
Per Capita income in Memphis is $31,060.
What is the Median Family Income in Memphis?
Median Family Income in Memphis is $60,089.
What is the Median Household income in Memphis?
Median Household Income in Memphis is $48,090.
What is Income or Wage Gap in Memphis?
Income or Wage Gap in Memphis is 12.8%.
Women in Memphis earn 87.2 cents for every dollar earned by a man.
What is Family Income Deficit in Memphis?
Family Income Deficit in Memphis is $12,298.
Families that are below poverty line in Memphis earn $12,298 less on average than the poverty threshold level.
What is Inequality or Gini Index in Memphis?
Inequality or Gini Index in Memphis is 0.52.
What is the Total Population of Memphis?
Total Population of Memphis is 630,027.
What is the Total Male Population of Memphis?
Total Male Population of Memphis is 299,702.
What is the Total Female Population of Memphis?
Total Female Population of Memphis is 330,325.
What is the Ratio of Males per 100 Females in Memphis?
There are 90.73 Males per 100 Females in Memphis.
What is the Ratio of Females per 100 Males in Memphis?
There are 110.22 Females per 100 Males in Memphis.
What is the Median Population Age in Memphis?
Median Population Age in Memphis is 34.5 Years.
What is the Average Family Size in Memphis
Average Family Size in Memphis is 3.4 People.
What is the Average Household Size in Memphis
Average Household Size in Memphis is 2.5 People.
How Large is the Labor Force in Memphis?
There are 312,423 People in the Labor Forcein in Memphis.
What is the Percentage of People in the Labor Force in Memphis?
63.6% of People are in the Labor Force in Memphis.
What is the Unemployment Rate in Memphis?
Unemployment Rate in Memphis is 8.6%.