Miami, FL Map & Demographics
Miami Map
Miami Overview
$39,055
PER CAPITA INCOME
$59,015
AVG FAMILY INCOME
$54,858
AVG HOUSEHOLD INCOME
23.7%
WAGE / INCOME GAP [ % ]
76.3¢/ $1
WAGE / INCOME GAP [ $ ]
$8,763
FAMILY INCOME DEFICIT
0.55
INEQUALITY / GINI INDEX
443,665
TOTAL POPULATION
225,318
MALE POPULATION
218,347
FEMALE POPULATION
103.19
MALES / 100 FEMALES
96.91
FEMALES / 100 MALES
39.7
MEDIAN AGE
3.1
AVG FAMILY SIZE
2.3
AVG HOUSEHOLD SIZE
248,631
LABOR FORCE [ PEOPLE ]
65.8%
PERCENT IN LABOR FORCE
5.0%
UNEMPLOYMENT RATE
Miami Zip Codes
Income in Miami
Income Overview in Miami
Per Capita Income in Miami is $39,055, while median incomes of families and households are $59,015 and $54,858 respectively.
| Characteristic | Number | Measure |
| Per Capita Income | 443,665 | $39,055 |
| Median Family Income | 100,149 | $59,015 |
| Mean Family Income | 100,149 | $98,876 |
| Median Household Income | 186,137 | $54,858 |
| Mean Household Income | 186,137 | $90,171 |
| Income Deficit | 100,149 | $8,763 |
| Wage / Income Gap (%) | 443,665 | 23.73% |
| Wage / Income Gap ($) | 443,665 | 76.27¢ per $1 |
| Gini / Inequality Index | 443,665 | 0.55 |
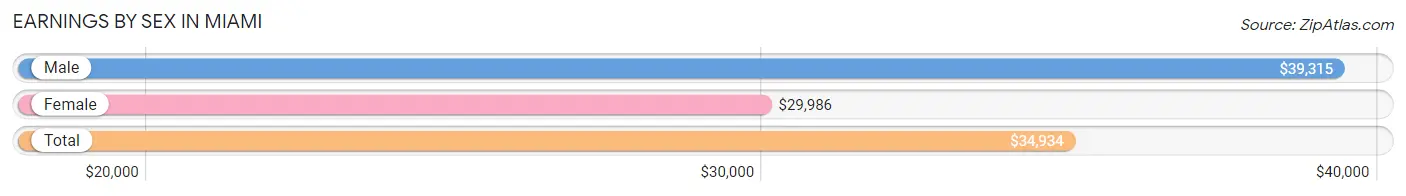
Earnings by Sex in Miami
Average Earnings in Miami are $34,934, $39,315 for men and $29,986 for women, a difference of 23.7%.
| Sex | Number | Average Earnings |
| Male | 137,591 (54.8%) | $39,315 |
| Female | 113,511 (45.2%) | $29,986 |
| Total | 251,102 (100.0%) | $34,934 |
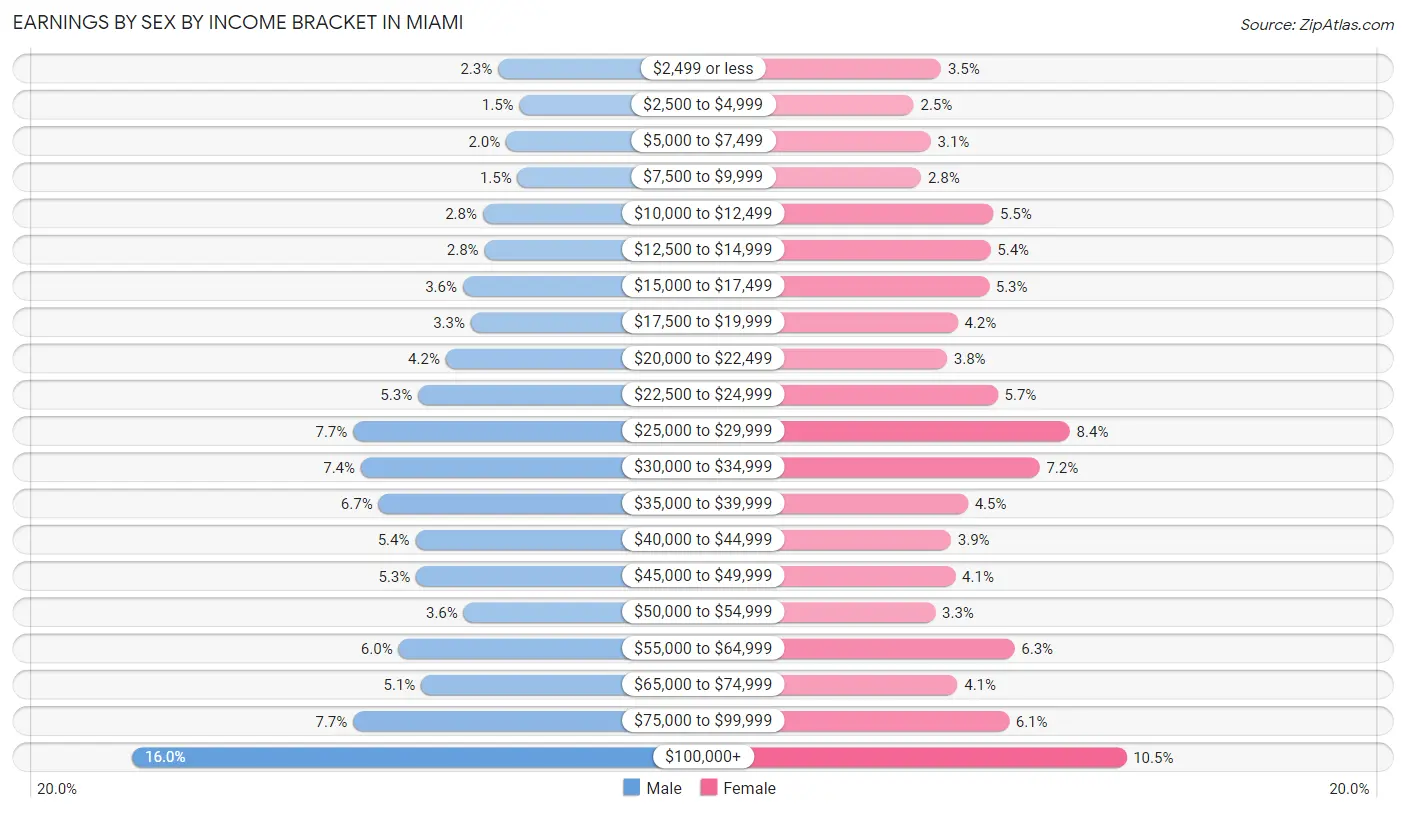
Earnings by Sex by Income Bracket in Miami
The most common earnings brackets in Miami are $100,000+ for men (21,971 | 16.0%) and $100,000+ for women (11,889 | 10.5%).
| Income | Male | Female |
| $2,499 or less | 3,103 (2.3%) | 4,010 (3.5%) |
| $2,500 to $4,999 | 2,007 (1.5%) | 2,836 (2.5%) |
| $5,000 to $7,499 | 2,697 (2.0%) | 3,562 (3.1%) |
| $7,500 to $9,999 | 2,105 (1.5%) | 3,150 (2.8%) |
| $10,000 to $12,499 | 3,888 (2.8%) | 6,224 (5.5%) |
| $12,500 to $14,999 | 3,810 (2.8%) | 6,106 (5.4%) |
| $15,000 to $17,499 | 4,924 (3.6%) | 6,041 (5.3%) |
| $17,500 to $19,999 | 4,509 (3.3%) | 4,710 (4.2%) |
| $20,000 to $22,499 | 5,806 (4.2%) | 4,260 (3.7%) |
| $22,500 to $24,999 | 7,241 (5.3%) | 6,410 (5.7%) |
| $25,000 to $29,999 | 10,576 (7.7%) | 9,474 (8.4%) |
| $30,000 to $34,999 | 10,187 (7.4%) | 8,196 (7.2%) |
| $35,000 to $39,999 | 9,278 (6.7%) | 5,137 (4.5%) |
| $40,000 to $44,999 | 7,368 (5.4%) | 4,422 (3.9%) |
| $45,000 to $49,999 | 7,335 (5.3%) | 4,609 (4.1%) |
| $50,000 to $54,999 | 4,887 (3.5%) | 3,759 (3.3%) |
| $55,000 to $64,999 | 8,239 (6.0%) | 7,123 (6.3%) |
| $65,000 to $74,999 | 7,075 (5.1%) | 4,703 (4.1%) |
| $75,000 to $99,999 | 10,585 (7.7%) | 6,890 (6.1%) |
| $100,000+ | 21,971 (16.0%) | 11,889 (10.5%) |
| Total | 137,591 (100.0%) | 113,511 (100.0%) |
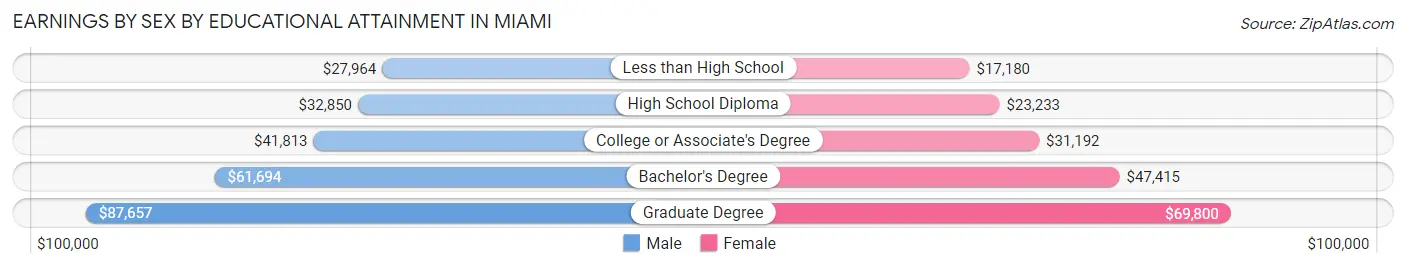
Earnings by Sex by Educational Attainment in Miami
Average earnings in Miami are $41,393 for men and $32,331 for women, a difference of 21.9%. Men with an educational attainment of graduate degree enjoy the highest average annual earnings of $87,657, while those with less than high school education earn the least with $27,964. Women with an educational attainment of graduate degree earn the most with the average annual earnings of $69,800, while those with less than high school education have the smallest earnings of $17,180.
| Educational Attainment | Male Income | Female Income |
| Less than High School | $27,964 | $17,180 |
| High School Diploma | $32,850 | $23,233 |
| College or Associate's Degree | $41,813 | $31,192 |
| Bachelor's Degree | $61,694 | $47,415 |
| Graduate Degree | $87,657 | $69,800 |
| Total | $41,393 | $32,331 |
Family Income in Miami
Family Income Brackets in Miami
According to the Miami family income data, there are 18,027 families falling into the $50,000 to $74,999 income range, which is the most common income bracket and makes up 18.0% of all families. Conversely, the less than $10,000 income bracket is the least frequent group with only 4,407 families (4.4%) belonging to this category.
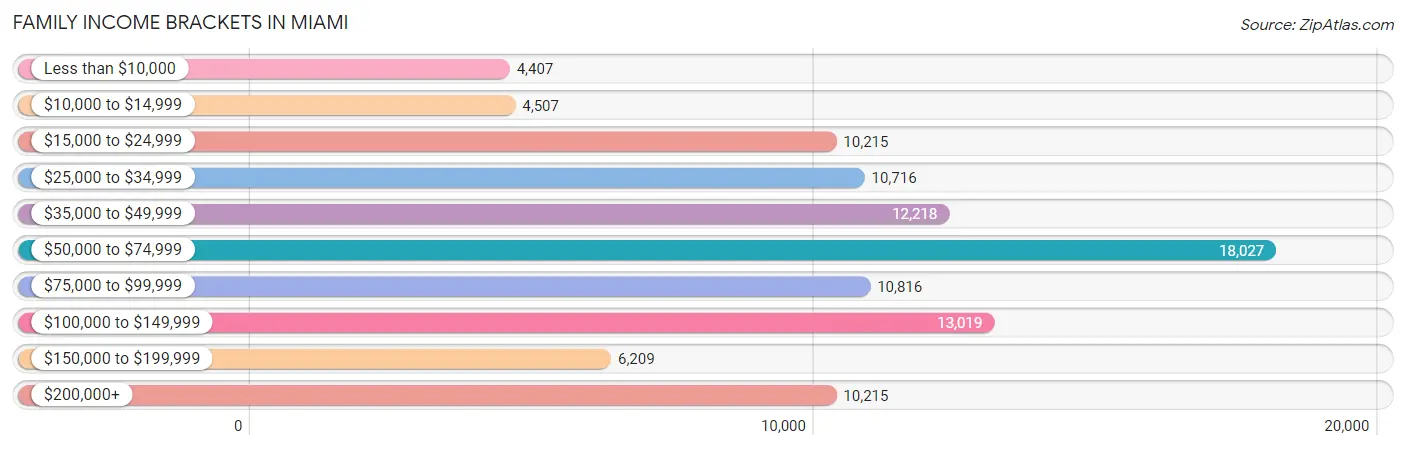
| Income Bracket | # Families | % Families |
| Less than $10,000 | 4,407 | 4.4% |
| $10,000 to $14,999 | 4,507 | 4.5% |
| $15,000 to $24,999 | 10,215 | 10.2% |
| $25,000 to $34,999 | 10,716 | 10.7% |
| $35,000 to $49,999 | 12,218 | 12.2% |
| $50,000 to $74,999 | 18,027 | 18.0% |
| $75,000 to $99,999 | 10,816 | 10.8% |
| $100,000 to $149,999 | 13,019 | 13.0% |
| $150,000 to $199,999 | 6,209 | 6.2% |
| $200,000+ | 10,215 | 10.2% |
Family Income by Famaliy Size in Miami
7+ person families (1,403 | 1.4%) account for the highest median family income in Miami with $101,909 per family, while 2-person families (48,396 | 48.3%) have the highest median income of $25,292 per family member.
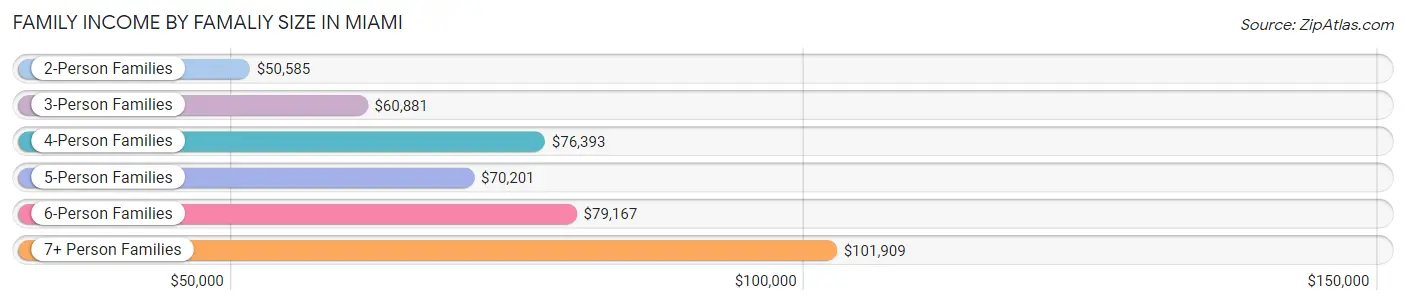
| Income Bracket | # Families | Median Income |
| 2-Person Families | 48,396 (48.3%) | $50,585 |
| 3-Person Families | 26,494 (26.5%) | $60,881 |
| 4-Person Families | 15,629 (15.6%) | $76,393 |
| 5-Person Families | 5,921 (5.9%) | $70,201 |
| 6-Person Families | 2,306 (2.3%) | $79,167 |
| 7+ Person Families | 1,403 (1.4%) | $101,909 |
| Total | 100,149 (100.0%) | $59,015 |
Family Income by Number of Earners in Miami
The median family income in Miami is $59,015, with families comprising 3+ earners (11,476) having the highest median family income of $97,176, while families with no earners (12,525) have the lowest median family income of $19,438, accounting for 11.5% and 12.5% of families, respectively.
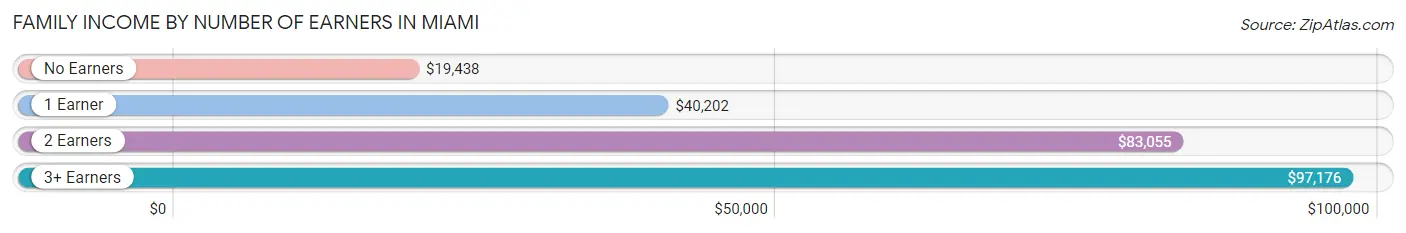
| Number of Earners | # Families | Median Income |
| No Earners | 12,525 (12.5%) | $19,438 |
| 1 Earner | 35,629 (35.6%) | $40,202 |
| 2 Earners | 40,519 (40.5%) | $83,055 |
| 3+ Earners | 11,476 (11.5%) | $97,176 |
| Total | 100,149 (100.0%) | $59,015 |
Household Income in Miami
Household Income Brackets in Miami
With 29,782 households falling in the category, the $50,000 to $74,999 income range is the most frequent in Miami, accounting for 16.0% of all households. In contrast, only 10,982 households (5.9%) fall into the $150,000 to $199,999 income bracket, making it the least populous group.
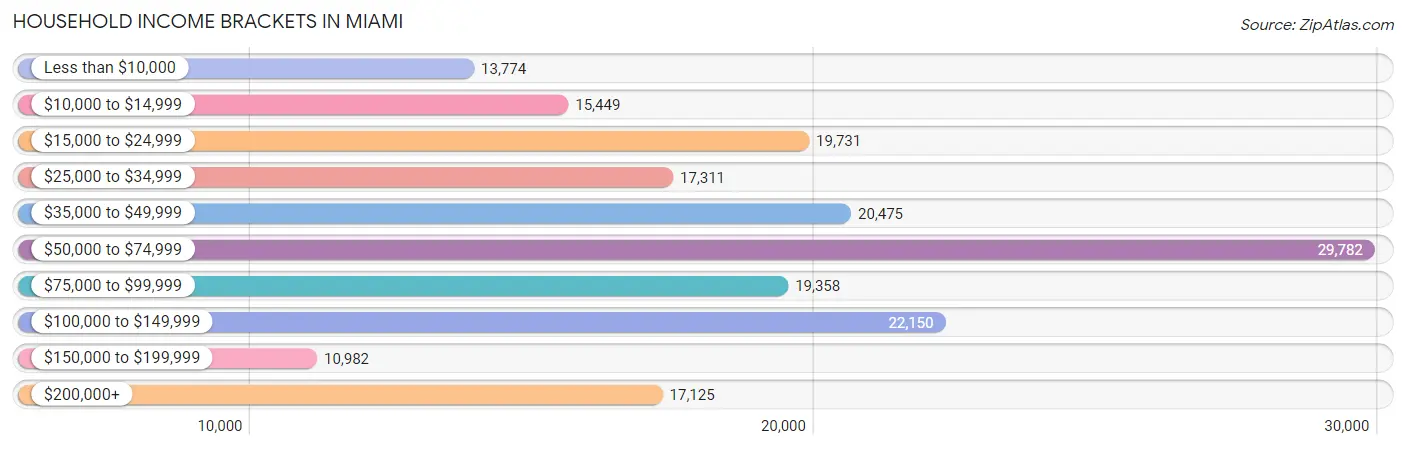
| Income Bracket | # Households | % Households |
| Less than $10,000 | 13,774 | 7.4% |
| $10,000 to $14,999 | 15,449 | 8.3% |
| $15,000 to $24,999 | 19,731 | 10.6% |
| $25,000 to $34,999 | 17,311 | 9.3% |
| $35,000 to $49,999 | 20,475 | 11.0% |
| $50,000 to $74,999 | 29,782 | 16.0% |
| $75,000 to $99,999 | 19,358 | 10.4% |
| $100,000 to $149,999 | 22,150 | 11.9% |
| $150,000 to $199,999 | 10,982 | 5.9% |
| $200,000+ | 17,125 | 9.2% |
Household Income by Householder Age in Miami
The median household income in Miami is $54,858, with the highest median household income of $69,400 found in the 25 to 44 years age bracket for the primary householder. A total of 70,403 households (37.8%) fall into this category. Meanwhile, the 65+ years age bracket for the primary householder has the lowest median household income of $25,117, with 43,703 households (23.5%) in this group.
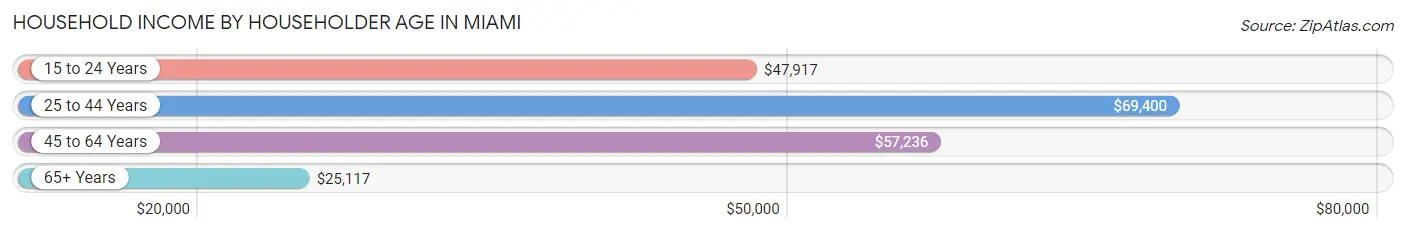
| Income Bracket | # Households | Median Income |
| 15 to 24 Years | 5,227 (2.8%) | $47,917 |
| 25 to 44 Years | 70,403 (37.8%) | $69,400 |
| 45 to 64 Years | 66,804 (35.9%) | $57,236 |
| 65+ Years | 43,703 (23.5%) | $25,117 |
| Total | 186,137 (100.0%) | $54,858 |
Poverty in Miami
Income Below Poverty by Sex and Age in Miami
With 17.8% poverty level for males and 22.3% for females among the residents of Miami, 5 year old males and 75 year old and over females are the most vulnerable to poverty, with 570 males (33.9%) and 7,040 females (34.4%) in their respective age groups living below the poverty level.
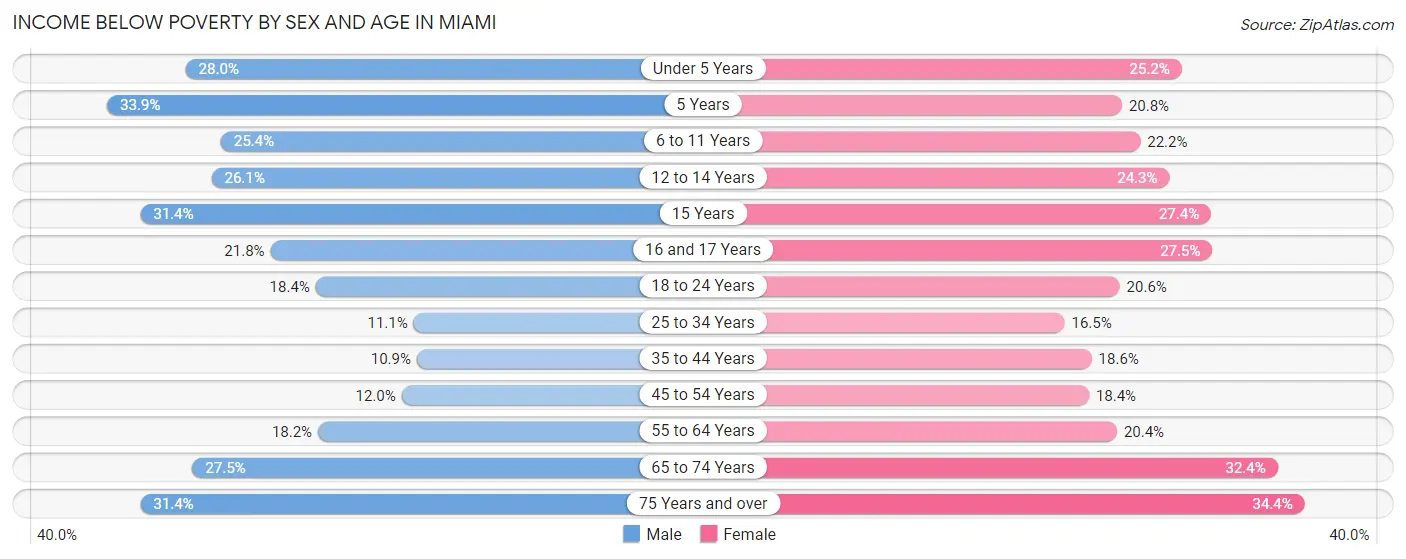
| Age Bracket | Male | Female |
| Under 5 Years | 3,544 (28.0%) | 2,904 (25.2%) |
| 5 Years | 570 (33.9%) | 476 (20.8%) |
| 6 to 11 Years | 2,950 (25.4%) | 2,351 (22.2%) |
| 12 to 14 Years | 1,578 (26.1%) | 1,132 (24.3%) |
| 15 Years | 654 (31.4%) | 552 (27.4%) |
| 16 and 17 Years | 817 (21.7%) | 1,048 (27.5%) |
| 18 to 24 Years | 2,972 (18.4%) | 3,353 (20.6%) |
| 25 to 34 Years | 4,616 (11.1%) | 6,179 (16.5%) |
| 35 to 44 Years | 3,829 (10.9%) | 5,827 (18.5%) |
| 45 to 54 Years | 3,917 (12.0%) | 5,155 (18.3%) |
| 55 to 64 Years | 5,059 (18.2%) | 5,742 (20.4%) |
| 65 to 74 Years | 4,508 (27.5%) | 6,346 (32.4%) |
| 75 Years and over | 4,262 (31.4%) | 7,040 (34.4%) |
| Total | 39,276 (17.8%) | 48,105 (22.3%) |
Income Above Poverty by Sex and Age in Miami
According to the poverty statistics in Miami, males aged 35 to 44 years and females aged 25 to 34 years are the age groups that are most secure financially, with 89.1% of males and 83.5% of females in these age groups living above the poverty line.
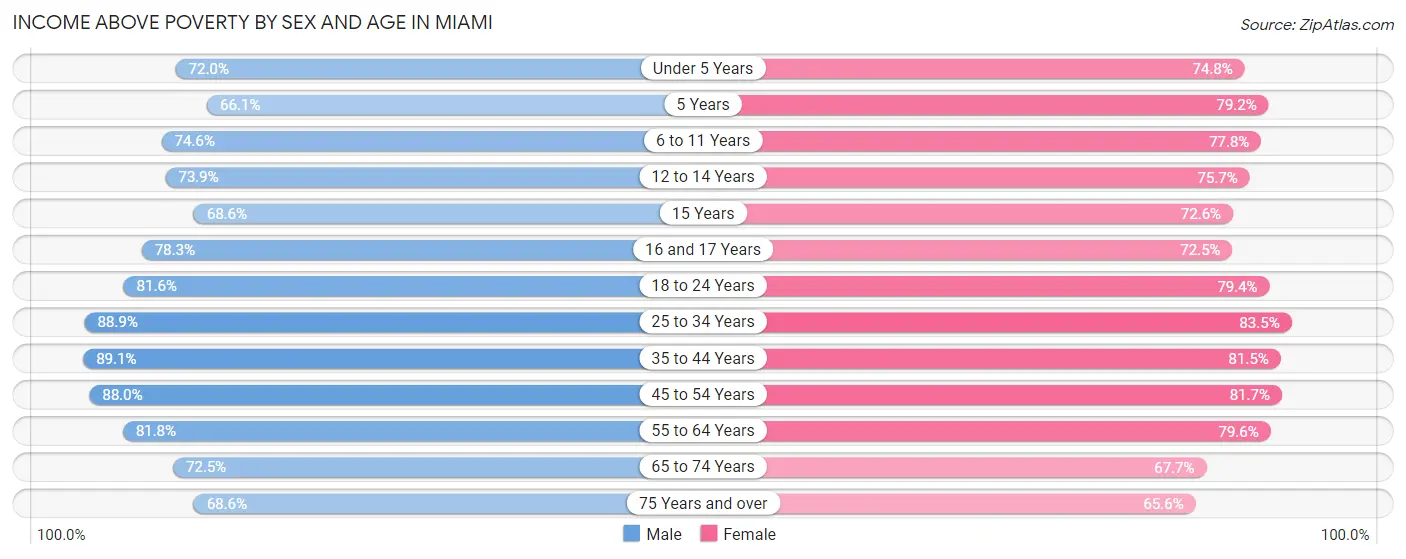
| Age Bracket | Male | Female |
| Under 5 Years | 9,097 (72.0%) | 8,605 (74.8%) |
| 5 Years | 1,113 (66.1%) | 1,812 (79.2%) |
| 6 to 11 Years | 8,650 (74.6%) | 8,260 (77.8%) |
| 12 to 14 Years | 4,464 (73.9%) | 3,525 (75.7%) |
| 15 Years | 1,428 (68.6%) | 1,462 (72.6%) |
| 16 and 17 Years | 2,939 (78.2%) | 2,763 (72.5%) |
| 18 to 24 Years | 13,186 (81.6%) | 12,900 (79.4%) |
| 25 to 34 Years | 36,904 (88.9%) | 31,188 (83.5%) |
| 35 to 44 Years | 31,359 (89.1%) | 25,577 (81.5%) |
| 45 to 54 Years | 28,696 (88.0%) | 22,933 (81.7%) |
| 55 to 64 Years | 22,707 (81.8%) | 22,364 (79.6%) |
| 65 to 74 Years | 11,858 (72.5%) | 13,270 (67.6%) |
| 75 Years and over | 9,313 (68.6%) | 13,448 (65.6%) |
| Total | 181,714 (82.2%) | 168,107 (77.7%) |
Income Below Poverty Among Married-Couple Families in Miami
The poverty statistics for married-couple families in Miami show that 11.6% or 6,653 of the total 57,252 families live below the poverty line. Families with 3 or 4 children have the highest poverty rate of 21.4%, comprising of 506 families. On the other hand, families with no children have the lowest poverty rate of 10.9%, which includes 3,842 families.
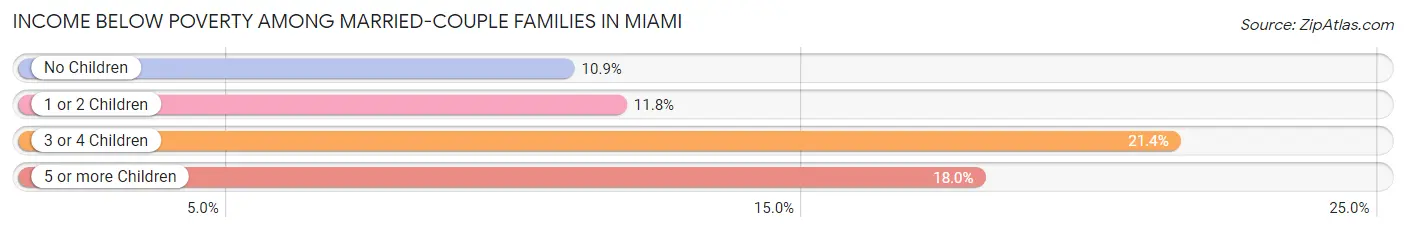
| Children | Above Poverty | Below Poverty |
| No Children | 31,546 (89.1%) | 3,842 (10.9%) |
| 1 or 2 Children | 17,064 (88.2%) | 2,276 (11.8%) |
| 3 or 4 Children | 1,857 (78.6%) | 506 (21.4%) |
| 5 or more Children | 132 (82.0%) | 29 (18.0%) |
| Total | 50,599 (88.4%) | 6,653 (11.6%) |
Income Below Poverty Among Single-Parent Households in Miami
According to the poverty data in Miami, 13.0% or 1,675 single-father households and 24.9% or 7,482 single-mother households are living below the poverty line. Among single-father households, those with 3 or 4 children have the highest poverty rate, with 86 households (40.2%) experiencing poverty. Likewise, among single-mother households, those with 5 or more children have the highest poverty rate, with 135 households (82.3%) falling below the poverty line.
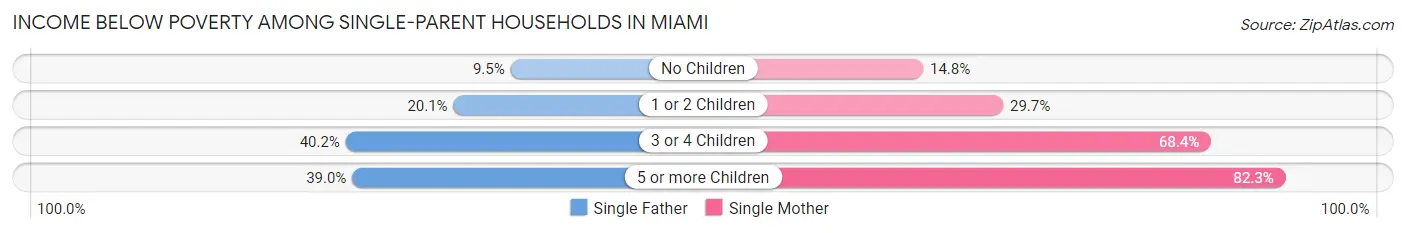
| Children | Single Father | Single Mother |
| No Children | 869 (9.5%) | 2,090 (14.8%) |
| 1 or 2 Children | 697 (20.1%) | 4,201 (29.7%) |
| 3 or 4 Children | 86 (40.2%) | 1,056 (68.4%) |
| 5 or more Children | 23 (39.0%) | 135 (82.3%) |
| Total | 1,675 (13.0%) | 7,482 (24.9%) |
Income Below Poverty Among Married-Couple vs Single-Parent Households in Miami
The poverty data for Miami shows that 6,653 of the married-couple family households (11.6%) and 9,157 of the single-parent households (21.3%) are living below the poverty level. Within the married-couple family households, those with 3 or 4 children have the highest poverty rate, with 506 households (21.4%) falling below the poverty line. Among the single-parent households, those with 5 or more children have the highest poverty rate, with 158 household (70.9%) living below poverty.
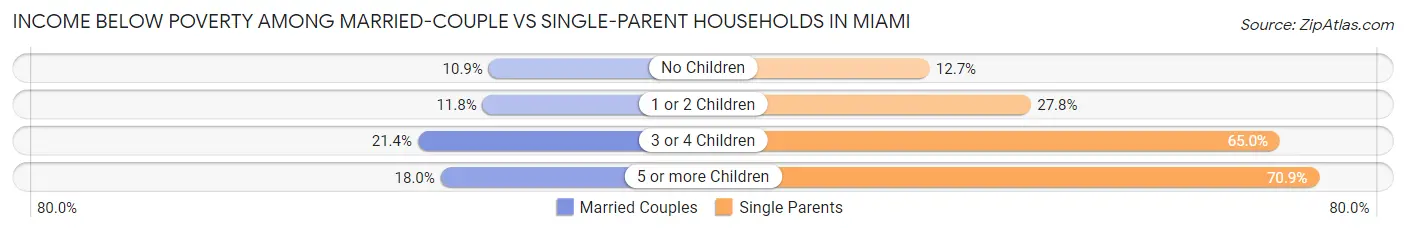
| Children | Married-Couple Families | Single-Parent Households |
| No Children | 3,842 (10.9%) | 2,959 (12.7%) |
| 1 or 2 Children | 2,276 (11.8%) | 4,898 (27.8%) |
| 3 or 4 Children | 506 (21.4%) | 1,142 (65.0%) |
| 5 or more Children | 29 (18.0%) | 158 (70.9%) |
| Total | 6,653 (11.6%) | 9,157 (21.3%) |
Race in Miami
The most populous races in Miami are Hispanic or Latino (320,599 | 72.3%), White / Caucasian (201,391 | 45.4%), and Two or more Races (143,341 | 32.3%).
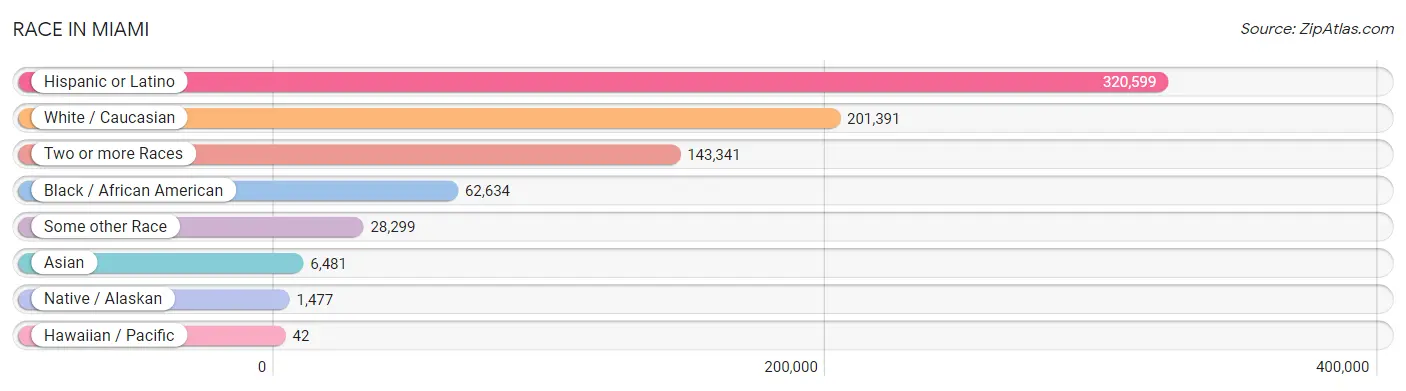
| Race | # Population | % Population |
| Asian | 6,481 | 1.5% |
| Black / African American | 62,634 | 14.1% |
| Hawaiian / Pacific | 42 | 0.0% |
| Hispanic or Latino | 320,599 | 72.3% |
| Native / Alaskan | 1,477 | 0.3% |
| White / Caucasian | 201,391 | 45.4% |
| Two or more Races | 143,341 | 32.3% |
| Some other Race | 28,299 | 6.4% |
| Total | 443,665 | 100.0% |
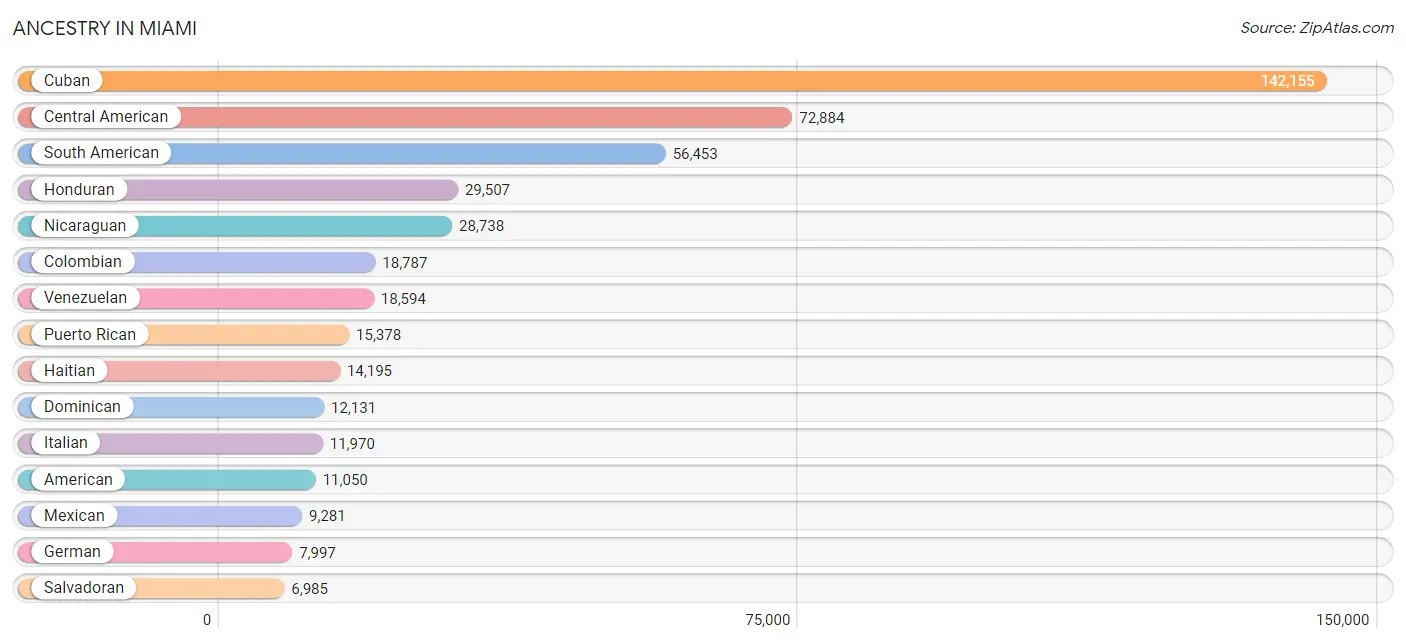
Ancestry in Miami
The most populous ancestries reported in Miami are Cuban (142,155 | 32.0%), Central American (72,884 | 16.4%), South American (56,453 | 12.7%), Honduran (29,507 | 6.7%), and Nicaraguan (28,738 | 6.5%), together accounting for 74.3% of all Miami residents.
| Ancestry | # Population | % Population |
| African | 1,626 | 0.4% |
| Albanian | 43 | 0.0% |
| American | 11,050 | 2.5% |
| Arab | 3,780 | 0.9% |
| Argentinean | 6,170 | 1.4% |
| Armenian | 275 | 0.1% |
| Australian | 103 | 0.0% |
| Austrian | 389 | 0.1% |
| Bahamian | 1,327 | 0.3% |
| Bangladeshi | 37 | 0.0% |
| Barbadian | 166 | 0.0% |
| Basque | 111 | 0.0% |
| Belgian | 585 | 0.1% |
| Belizean | 15 | 0.0% |
| Bermudan | 53 | 0.0% |
| Bhutanese | 185 | 0.0% |
| Blackfeet | 108 | 0.0% |
| Bolivian | 1,080 | 0.2% |
| Brazilian | 3,473 | 0.8% |
| British | 1,306 | 0.3% |
| British West Indian | 514 | 0.1% |
| Bulgarian | 101 | 0.0% |
| Burmese | 738 | 0.2% |
| Canadian | 484 | 0.1% |
| Cape Verdean | 17 | 0.0% |
| Celtic | 17 | 0.0% |
| Central American | 72,884 | 16.4% |
| Central American Indian | 869 | 0.2% |
| Cherokee | 82 | 0.0% |
| Chilean | 1,680 | 0.4% |
| Chippewa | 61 | 0.0% |
| Colombian | 18,787 | 4.2% |
| Costa Rican | 628 | 0.1% |
| Creek | 24 | 0.0% |
| Croatian | 95 | 0.0% |
| Cuban | 142,155 | 32.0% |
| Czech | 252 | 0.1% |
| Czechoslovakian | 48 | 0.0% |
| Danish | 168 | 0.0% |
| Dominican | 12,131 | 2.7% |
| Dutch | 667 | 0.2% |
| Eastern European | 905 | 0.2% |
| Ecuadorian | 3,163 | 0.7% |
| Egyptian | 68 | 0.0% |
| English | 4,911 | 1.1% |
| Estonian | 83 | 0.0% |
| Ethiopian | 162 | 0.0% |
| European | 2,460 | 0.5% |
| Filipino | 130 | 0.0% |
| Finnish | 115 | 0.0% |
| French | 4,008 | 0.9% |
| French American Indian | 46 | 0.0% |
| French Canadian | 421 | 0.1% |
| German | 7,997 | 1.8% |
| Greek | 1,019 | 0.2% |
| Guatemalan | 5,746 | 1.3% |
| Guyanese | 88 | 0.0% |
| Haitian | 14,195 | 3.2% |
| Honduran | 29,507 | 6.7% |
| Hungarian | 356 | 0.1% |
| Indian (Asian) | 2,205 | 0.5% |
| Indonesian | 187 | 0.0% |
| Iranian | 163 | 0.0% |
| Iraqi | 80 | 0.0% |
| Irish | 5,919 | 1.3% |
| Iroquois | 9 | 0.0% |
| Israeli | 501 | 0.1% |
| Italian | 11,970 | 2.7% |
| Jamaican | 2,999 | 0.7% |
| Japanese | 59 | 0.0% |
| Jordanian | 110 | 0.0% |
| Kenyan | 39 | 0.0% |
| Korean | 869 | 0.2% |
| Laotian | 63 | 0.0% |
| Latvian | 128 | 0.0% |
| Lebanese | 1,898 | 0.4% |
| Lithuanian | 252 | 0.1% |
| Macedonian | 40 | 0.0% |
| Malaysian | 51 | 0.0% |
| Maltese | 23 | 0.0% |
| Mexican | 9,281 | 2.1% |
| Mexican American Indian | 190 | 0.0% |
| Mongolian | 31 | 0.0% |
| Moroccan | 228 | 0.1% |
| Native Hawaiian | 42 | 0.0% |
| Nicaraguan | 28,738 | 6.5% |
| Nigerian | 141 | 0.0% |
| Northern European | 81 | 0.0% |
| Norwegian | 206 | 0.1% |
| Okinawan | 4 | 0.0% |
| Pakistani | 296 | 0.1% |
| Palestinian | 100 | 0.0% |
| Panamanian | 1,243 | 0.3% |
| Paraguayan | 403 | 0.1% |
| Pennsylvania German | 29 | 0.0% |
| Peruvian | 5,319 | 1.2% |
| Polish | 3,439 | 0.8% |
| Portuguese | 1,945 | 0.4% |
| Pueblo | 15 | 0.0% |
| Puerto Rican | 15,378 | 3.5% |
| Romanian | 338 | 0.1% |
| Russian | 2,388 | 0.5% |
| Salvadoran | 6,985 | 1.6% |
| Samoan | 10 | 0.0% |
| Scandinavian | 135 | 0.0% |
| Scotch-Irish | 226 | 0.1% |
| Scottish | 1,049 | 0.2% |
| Seminole | 59 | 0.0% |
| Serbian | 124 | 0.0% |
| Sioux | 12 | 0.0% |
| Slavic | 35 | 0.0% |
| Slovak | 270 | 0.1% |
| Slovene | 24 | 0.0% |
| South African | 37 | 0.0% |
| South American | 56,453 | 12.7% |
| South American Indian | 115 | 0.0% |
| Spaniard | 3,860 | 0.9% |
| Spanish | 1,767 | 0.4% |
| Spanish American | 76 | 0.0% |
| Spanish American Indian | 57 | 0.0% |
| Sri Lankan | 791 | 0.2% |
| Subsaharan African | 2,279 | 0.5% |
| Sudanese | 70 | 0.0% |
| Swedish | 602 | 0.1% |
| Swiss | 282 | 0.1% |
| Syrian | 462 | 0.1% |
| Thai | 2,355 | 0.5% |
| Trinidadian and Tobagonian | 460 | 0.1% |
| Turkish | 704 | 0.2% |
| U.S. Virgin Islander | 87 | 0.0% |
| Ukrainian | 474 | 0.1% |
| Uruguayan | 1,254 | 0.3% |
| Venezuelan | 18,594 | 4.2% |
| Vietnamese | 136 | 0.0% |
| Welsh | 300 | 0.1% |
| West Indian | 365 | 0.1% |
| Yugoslavian | 19 | 0.0% |
| Yup'ik | 22 | 0.0% | View All 138 Rows |
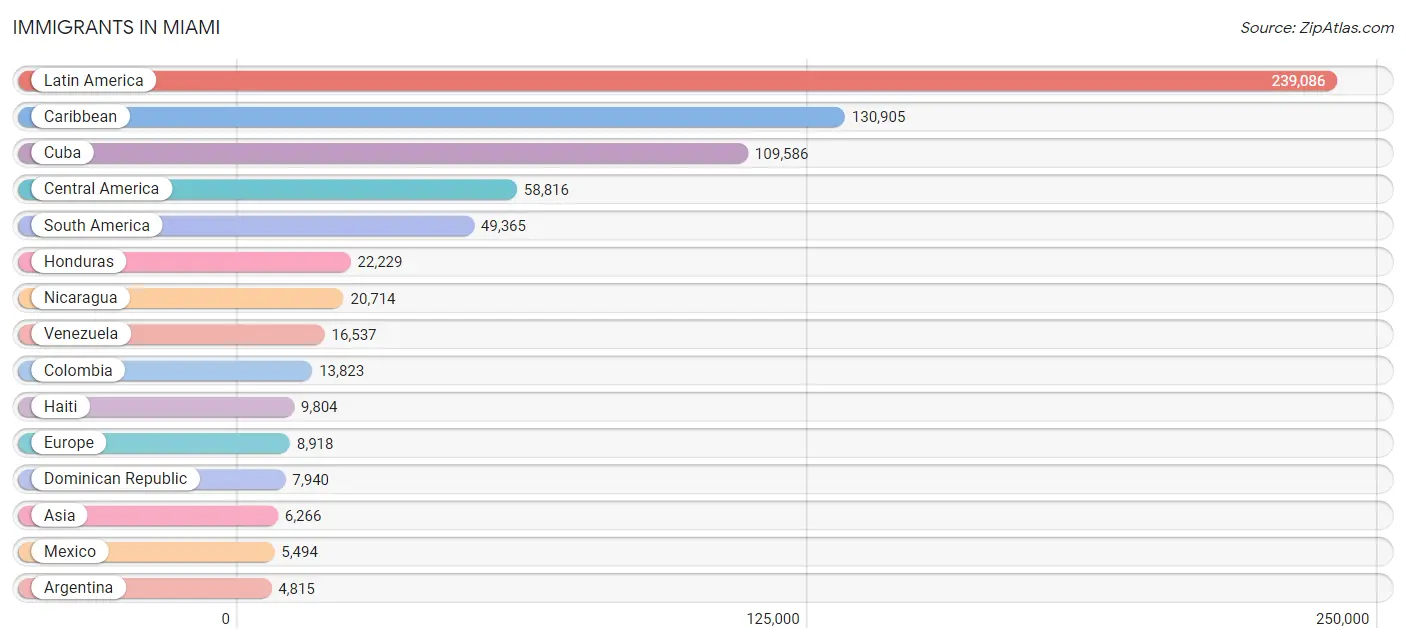
Immigrants in Miami
The most numerous immigrant groups reported in Miami came from Latin America (239,086 | 53.9%), Caribbean (130,905 | 29.5%), Cuba (109,586 | 24.7%), Central America (58,816 | 13.3%), and South America (49,365 | 11.1%), together accounting for 132.5% of all Miami residents.
| Immigration Origin | # Population | % Population |
| Afghanistan | 2 | 0.0% |
| Africa | 1,498 | 0.3% |
| Albania | 38 | 0.0% |
| Argentina | 4,815 | 1.1% |
| Armenia | 65 | 0.0% |
| Asia | 6,266 | 1.4% |
| Australia | 168 | 0.0% |
| Austria | 72 | 0.0% |
| Bahamas | 416 | 0.1% |
| Bangladesh | 241 | 0.1% |
| Belarus | 112 | 0.0% |
| Belgium | 231 | 0.1% |
| Belize | 26 | 0.0% |
| Bolivia | 785 | 0.2% |
| Bosnia and Herzegovina | 8 | 0.0% |
| Brazil | 3,848 | 0.9% |
| Bulgaria | 70 | 0.0% |
| Cambodia | 43 | 0.0% |
| Cameroon | 91 | 0.0% |
| Canada | 797 | 0.2% |
| Caribbean | 130,905 | 29.5% |
| Central America | 58,816 | 13.3% |
| Chile | 1,335 | 0.3% |
| China | 919 | 0.2% |
| Colombia | 13,823 | 3.1% |
| Costa Rica | 719 | 0.2% |
| Croatia | 8 | 0.0% |
| Cuba | 109,586 | 24.7% |
| Czechoslovakia | 108 | 0.0% |
| Denmark | 13 | 0.0% |
| Dominica | 51 | 0.0% |
| Dominican Republic | 7,940 | 1.8% |
| Eastern Africa | 277 | 0.1% |
| Eastern Asia | 1,244 | 0.3% |
| Eastern Europe | 1,968 | 0.4% |
| Ecuador | 2,584 | 0.6% |
| Egypt | 161 | 0.0% |
| El Salvador | 4,518 | 1.0% |
| England | 101 | 0.0% |
| Ethiopia | 97 | 0.0% |
| Europe | 8,918 | 2.0% |
| France | 1,494 | 0.3% |
| Germany | 629 | 0.1% |
| Greece | 137 | 0.0% |
| Grenada | 124 | 0.0% |
| Guatemala | 4,216 | 0.9% |
| Guyana | 70 | 0.0% |
| Haiti | 9,804 | 2.2% |
| Honduras | 22,229 | 5.0% |
| Hong Kong | 56 | 0.0% |
| Hungary | 70 | 0.0% |
| India | 935 | 0.2% |
| Indonesia | 6 | 0.0% |
| Iran | 97 | 0.0% |
| Iraq | 53 | 0.0% |
| Ireland | 29 | 0.0% |
| Israel | 437 | 0.1% |
| Italy | 978 | 0.2% |
| Jamaica | 2,040 | 0.5% |
| Japan | 87 | 0.0% |
| Kazakhstan | 22 | 0.0% |
| Kenya | 52 | 0.0% |
| Korea | 238 | 0.1% |
| Kuwait | 38 | 0.0% |
| Laos | 28 | 0.0% |
| Latin America | 239,086 | 53.9% |
| Latvia | 44 | 0.0% |
| Lebanon | 331 | 0.1% |
| Lithuania | 41 | 0.0% |
| Malaysia | 190 | 0.0% |
| Mexico | 5,494 | 1.2% |
| Middle Africa | 244 | 0.1% |
| Moldova | 58 | 0.0% |
| Morocco | 207 | 0.1% |
| Netherlands | 72 | 0.0% |
| Nicaragua | 20,714 | 4.7% |
| Nigeria | 46 | 0.0% |
| Northern Africa | 634 | 0.1% |
| Northern Europe | 545 | 0.1% |
| Norway | 28 | 0.0% |
| Oceania | 187 | 0.0% |
| Pakistan | 389 | 0.1% |
| Panama | 900 | 0.2% |
| Peru | 3,900 | 0.9% |
| Philippines | 270 | 0.1% |
| Poland | 261 | 0.1% |
| Portugal | 233 | 0.1% |
| Romania | 28 | 0.0% |
| Russia | 708 | 0.2% |
| Saudi Arabia | 439 | 0.1% |
| Scotland | 15 | 0.0% |
| Senegal | 9 | 0.0% |
| Serbia | 43 | 0.0% |
| Somalia | 12 | 0.0% |
| South Africa | 154 | 0.0% |
| South America | 49,365 | 11.1% |
| South Central Asia | 1,791 | 0.4% |
| South Eastern Asia | 900 | 0.2% |
| Southern Europe | 3,642 | 0.8% |
| Spain | 2,285 | 0.5% |
| Sri Lanka | 50 | 0.0% |
| St. Vincent and the Grenadines | 6 | 0.0% |
| Sudan | 104 | 0.0% |
| Sweden | 43 | 0.0% |
| Switzerland | 233 | 0.1% |
| Syria | 201 | 0.1% |
| Taiwan | 55 | 0.0% |
| Thailand | 232 | 0.1% |
| Trinidad and Tobago | 319 | 0.1% |
| Turkey | 556 | 0.1% |
| Ukraine | 150 | 0.0% |
| Uruguay | 1,104 | 0.3% |
| Uzbekistan | 12 | 0.0% |
| Venezuela | 16,537 | 3.7% |
| Vietnam | 131 | 0.0% |
| West Indies | 21 | 0.0% |
| Western Africa | 115 | 0.0% |
| Western Asia | 2,228 | 0.5% |
| Western Europe | 2,731 | 0.6% |
| Zaire | 94 | 0.0% | View All 120 Rows |
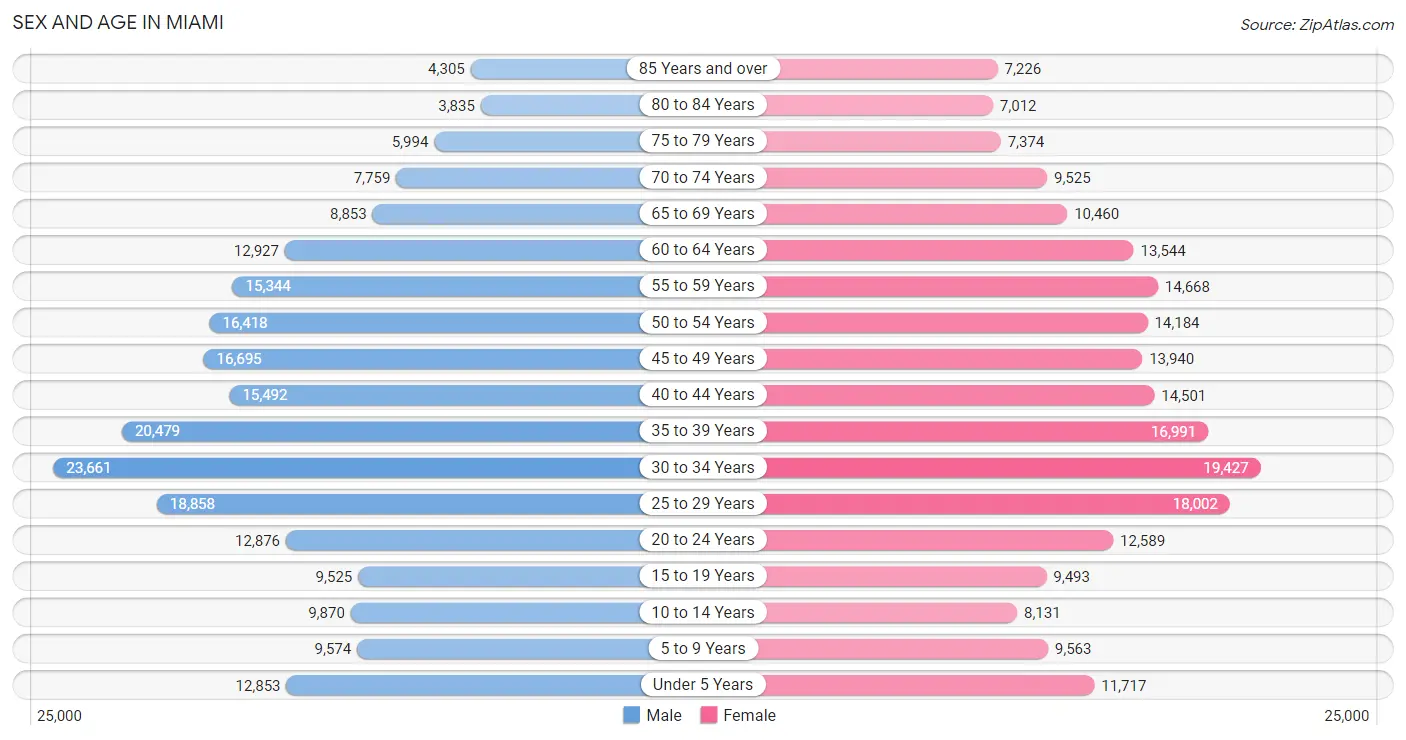
Sex and Age in Miami
Sex and Age in Miami
The most populous age groups in Miami are 30 to 34 Years (23,661 | 10.5%) for men and 30 to 34 Years (19,427 | 8.9%) for women.
| Age Bracket | Male | Female |
| Under 5 Years | 12,853 (5.7%) | 11,717 (5.4%) |
| 5 to 9 Years | 9,574 (4.3%) | 9,563 (4.4%) |
| 10 to 14 Years | 9,870 (4.4%) | 8,131 (3.7%) |
| 15 to 19 Years | 9,525 (4.2%) | 9,493 (4.3%) |
| 20 to 24 Years | 12,876 (5.7%) | 12,589 (5.8%) |
| 25 to 29 Years | 18,858 (8.4%) | 18,002 (8.2%) |
| 30 to 34 Years | 23,661 (10.5%) | 19,427 (8.9%) |
| 35 to 39 Years | 20,479 (9.1%) | 16,991 (7.8%) |
| 40 to 44 Years | 15,492 (6.9%) | 14,501 (6.6%) |
| 45 to 49 Years | 16,695 (7.4%) | 13,940 (6.4%) |
| 50 to 54 Years | 16,418 (7.3%) | 14,184 (6.5%) |
| 55 to 59 Years | 15,344 (6.8%) | 14,668 (6.7%) |
| 60 to 64 Years | 12,927 (5.7%) | 13,544 (6.2%) |
| 65 to 69 Years | 8,853 (3.9%) | 10,460 (4.8%) |
| 70 to 74 Years | 7,759 (3.4%) | 9,525 (4.4%) |
| 75 to 79 Years | 5,994 (2.7%) | 7,374 (3.4%) |
| 80 to 84 Years | 3,835 (1.7%) | 7,012 (3.2%) |
| 85 Years and over | 4,305 (1.9%) | 7,226 (3.3%) |
| Total | 225,318 (100.0%) | 218,347 (100.0%) |
Families and Households in Miami
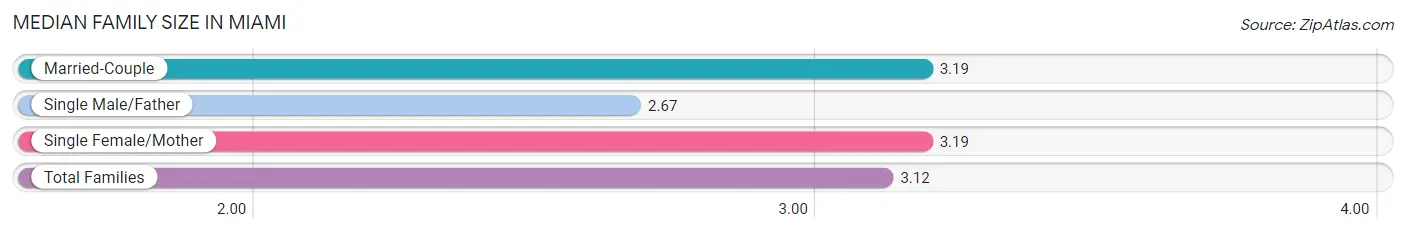
Median Family Size in Miami
The median family size in Miami is 3.12 persons per family, with married-couple families (57,252 | 57.2%) accounting for the largest median family size of 3.19 persons per family. On the other hand, single male/father families (12,905 | 12.9%) represent the smallest median family size with 2.67 persons per family.
| Family Type | # Families | Family Size |
| Married-Couple | 57,252 (57.2%) | 3.19 |
| Single Male/Father | 12,905 (12.9%) | 2.67 |
| Single Female/Mother | 29,992 (29.9%) | 3.19 |
| Total Families | 100,149 (100.0%) | 3.12 |
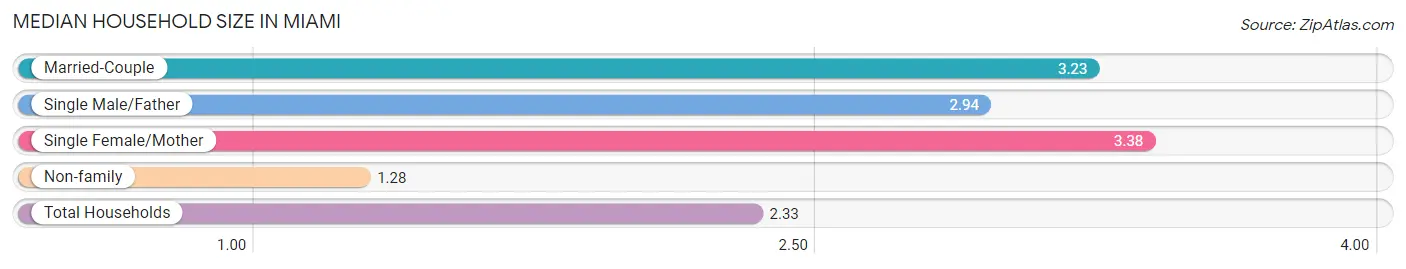
Median Household Size in Miami
The median household size in Miami is 2.33 persons per household, with single female/mother households (29,992 | 16.1%) accounting for the largest median household size of 3.38 persons per household. non-family households (85,988 | 46.2%) represent the smallest median household size with 1.28 persons per household.
| Household Type | # Households | Household Size |
| Married-Couple | 57,252 (30.8%) | 3.23 |
| Single Male/Father | 12,905 (6.9%) | 2.94 |
| Single Female/Mother | 29,992 (16.1%) | 3.38 |
| Non-family | 85,988 (46.2%) | 1.28 |
| Total Households | 186,137 (100.0%) | 2.33 |
Household Size by Marriage Status in Miami
Out of a total of 186,137 households in Miami, 100,149 (53.8%) are family households, while 85,988 (46.2%) are nonfamily households. The most numerous type of family households are 2-person households, comprising 43,977, and the most common type of nonfamily households are 1-person households, comprising 68,387.
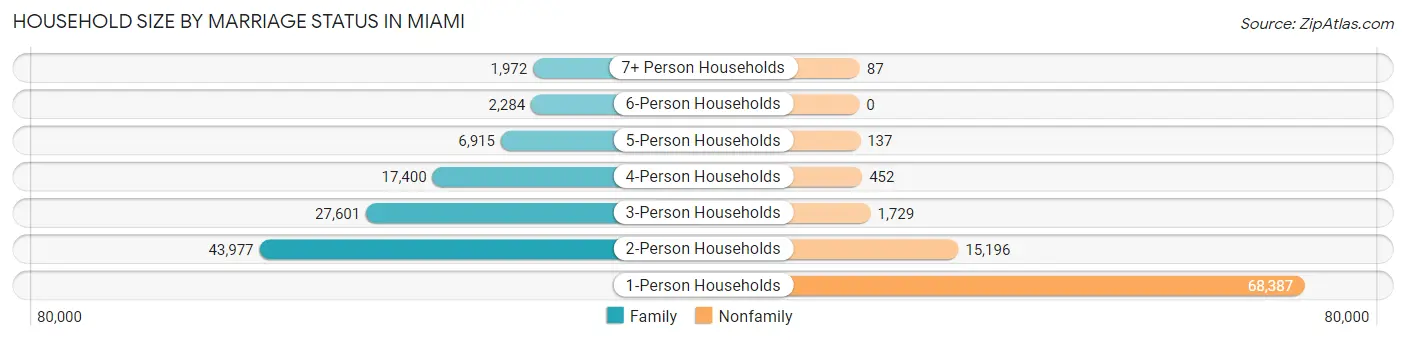
| Household Size | Family Households | Nonfamily Households |
| 1-Person Households | - | 68,387 (36.7%) |
| 2-Person Households | 43,977 (23.6%) | 15,196 (8.2%) |
| 3-Person Households | 27,601 (14.8%) | 1,729 (0.9%) |
| 4-Person Households | 17,400 (9.3%) | 452 (0.2%) |
| 5-Person Households | 6,915 (3.7%) | 137 (0.1%) |
| 6-Person Households | 2,284 (1.2%) | 0 (0.0%) |
| 7+ Person Households | 1,972 (1.1%) | 87 (0.1%) |
| Total | 100,149 (53.8%) | 85,988 (46.2%) |
Female Fertility in Miami
Fertility by Age in Miami
Average fertility rate in Miami is 51.0 births per 1,000 women. Women in the age bracket of 20 to 34 years have the highest fertility rate with 71.0 births per 1,000 women. Women in the age bracket of 20 to 34 years acount for 65.2% of all women with births.
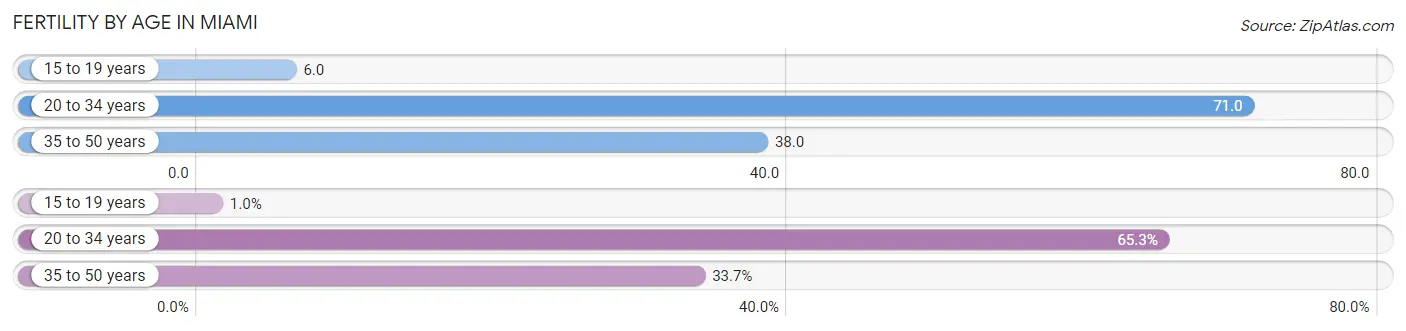
| Age Bracket | Women with Births | Births / 1,000 Women |
| 15 to 19 years | 55 (1.0%) | 6.0 |
| 20 to 34 years | 3,560 (65.2%) | 71.0 |
| 35 to 50 years | 1,841 (33.7%) | 38.0 |
| Total | 5,456 (100.0%) | 51.0 |
Fertility by Age by Marriage Status in Miami
54.1% of women with births (5,456) in Miami are married. The highest percentage of unmarried women with births falls into 15 to 19 years age bracket with 100.0% of them unmarried at the time of birth, while the lowest percentage of unmarried women with births belong to 35 to 50 years age bracket with 27.7% of them unmarried.
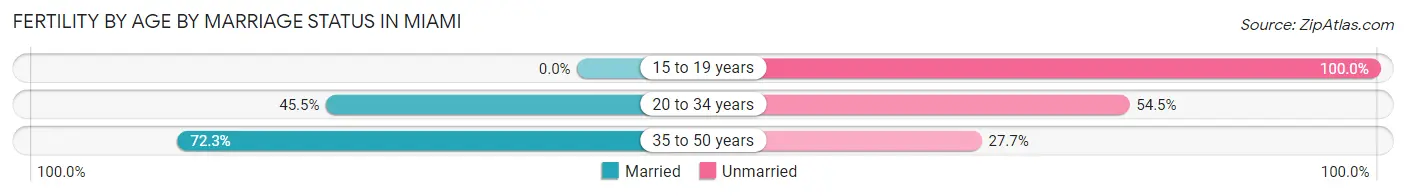
| Age Bracket | Married | Unmarried |
| 15 to 19 years | 0 (0.0%) | 55 (100.0%) |
| 20 to 34 years | 1,620 (45.5%) | 1,940 (54.5%) |
| 35 to 50 years | 1,331 (72.3%) | 510 (27.7%) |
| Total | 2,952 (54.1%) | 2,504 (45.9%) |
Fertility by Education in Miami
Average fertility rate in Miami is 51.0 births per 1,000 women. Women with the education attainment of high school diploma have the highest fertility rate of 73.0 births per 1,000 women, while women with the education attainment of graduate degree have the lowest fertility at 39.0 births per 1,000 women. Women with the education attainment of high school diploma represent 31.5% of all women with births.
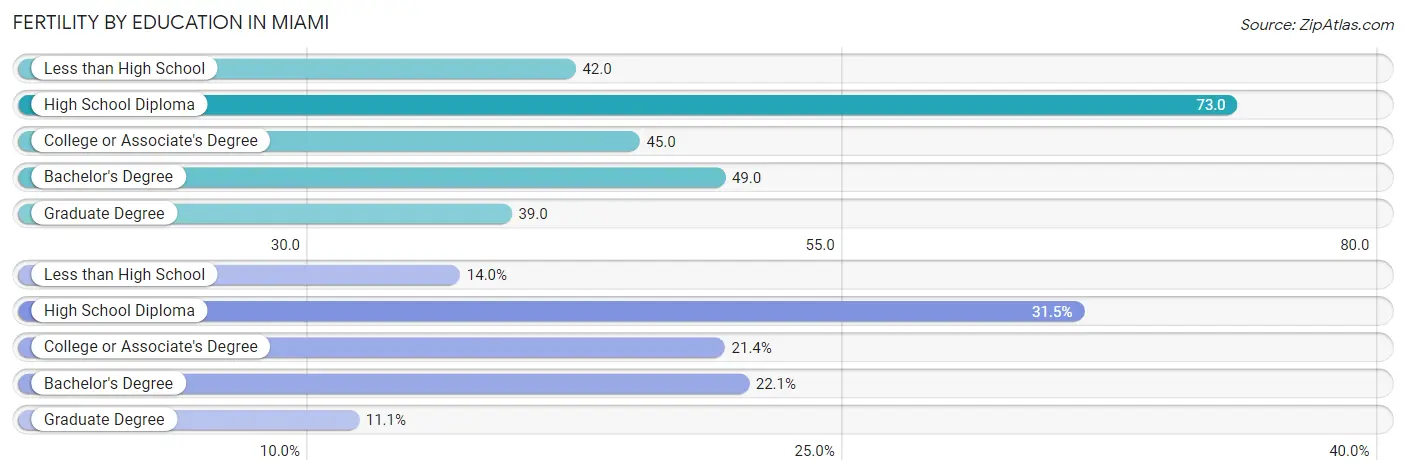
| Educational Attainment | Women with Births | Births / 1,000 Women |
| Less than High School | 761 (14.0%) | 42.0 |
| High School Diploma | 1,718 (31.5%) | 73.0 |
| College or Associate's Degree | 1,167 (21.4%) | 45.0 |
| Bachelor's Degree | 1,204 (22.1%) | 49.0 |
| Graduate Degree | 606 (11.1%) | 39.0 |
| Total | 5,456 (100.0%) | 51.0 |
Fertility by Education by Marriage Status in Miami
45.9% of women with births in Miami are unmarried. Women with the educational attainment of graduate degree are most likely to be married with 94.1% of them married at childbirth, while women with the educational attainment of college or associate's degree are least likely to be married with 76.7% of them unmarried at childbirth.
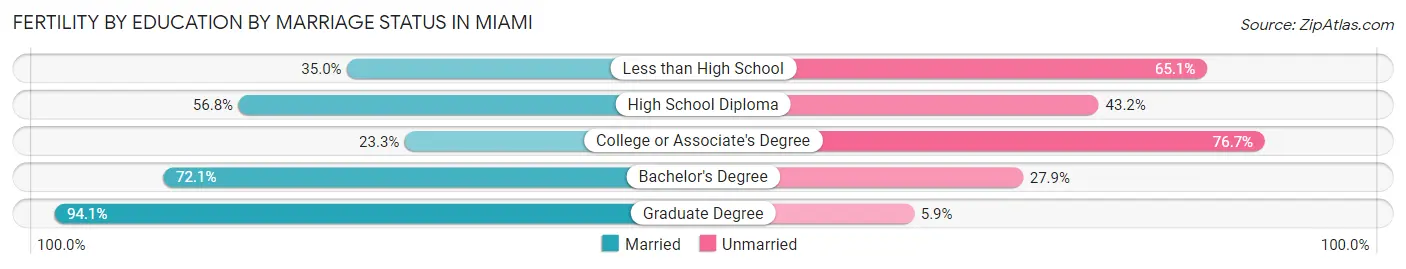
| Educational Attainment | Married | Unmarried |
| Less than High School | 266 (34.9%) | 495 (65.0%) |
| High School Diploma | 976 (56.8%) | 742 (43.2%) |
| College or Associate's Degree | 272 (23.3%) | 895 (76.7%) |
| Bachelor's Degree | 868 (72.1%) | 336 (27.9%) |
| Graduate Degree | 570 (94.1%) | 36 (5.9%) |
| Total | 2,952 (54.1%) | 2,504 (45.9%) |
Employment Characteristics in Miami
Employment by Class of Employer in Miami
Among the 232,163 employed individuals in Miami, private company employees (161,311 | 69.5%), self-employed (not incorporated) (24,469 | 10.5%), and self-employed (incorporated) (16,420 | 7.1%) make up the most common classes of employment.
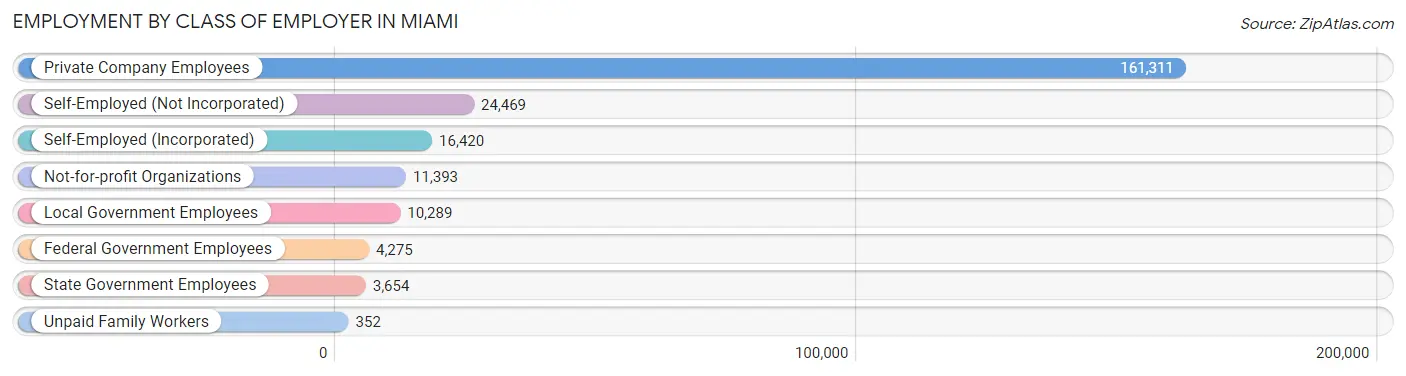
| Employer Class | # Employees | % Employees |
| Private Company Employees | 161,311 | 69.5% |
| Self-Employed (Incorporated) | 16,420 | 7.1% |
| Self-Employed (Not Incorporated) | 24,469 | 10.5% |
| Not-for-profit Organizations | 11,393 | 4.9% |
| Local Government Employees | 10,289 | 4.4% |
| State Government Employees | 3,654 | 1.6% |
| Federal Government Employees | 4,275 | 1.8% |
| Unpaid Family Workers | 352 | 0.2% |
| Total | 232,163 | 100.0% |
Employment Status by Age in Miami
According to the labor force statistics for Miami, out of the total population over 16 years of age (377,859), 65.8% or 248,631 individuals are in the labor force, with 5.0% or 12,432 of them unemployed. The age group with the highest labor force participation rate is 30 to 34 years, with 86.9% or 37,443 individuals in the labor force. Within the labor force, the 16 to 19 years age range has the highest percentage of unemployed individuals, with 16.1% or 620 of them being unemployed.
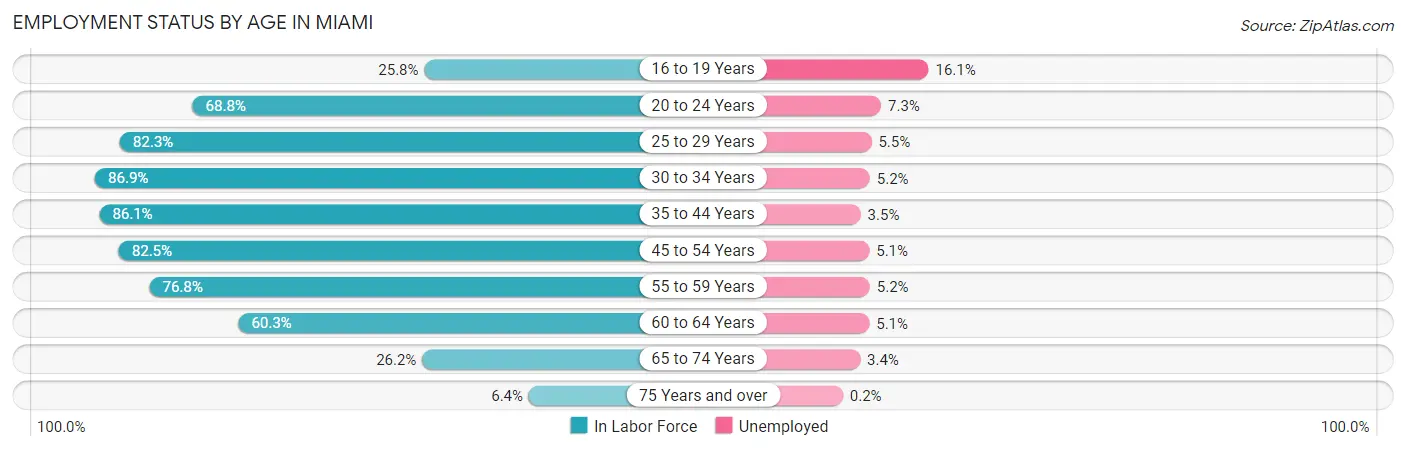
| Age Bracket | In Labor Force | Unemployed |
| 16 to 19 Years | 3,849 (25.8%) | 620 (16.1%) |
| 20 to 24 Years | 17,520 (68.8%) | 1,279 (7.3%) |
| 25 to 29 Years | 30,336 (82.3%) | 1,668 (5.5%) |
| 30 to 34 Years | 37,443 (86.9%) | 1,947 (5.2%) |
| 35 to 44 Years | 58,086 (86.1%) | 2,033 (3.5%) |
| 45 to 54 Years | 50,521 (82.5%) | 2,577 (5.1%) |
| 55 to 59 Years | 23,049 (76.8%) | 1,199 (5.2%) |
| 60 to 64 Years | 15,962 (60.3%) | 814 (5.1%) |
| 65 to 74 Years | 9,588 (26.2%) | 326 (3.4%) |
| 75 Years and over | 2,288 (6.4%) | 5 (0.2%) |
| Total | 248,631 (65.8%) | 12,432 (5.0%) |
Employment Status by Educational Attainment in Miami
According to labor force statistics for Miami, 81.2% of individuals (215,286) out of the total population between 25 and 64 years of age (265,131) are in the labor force, with 4.7% or 10,118 of them being unemployed. The group with the highest labor force participation rate are those with the educational attainment of bachelor's degree or higher, with 88.6% or 88,564 individuals in the labor force. Within the labor force, individuals with less than high school education have the highest percentage of unemployment, with 8.2% or 2,420 of them being unemployed.
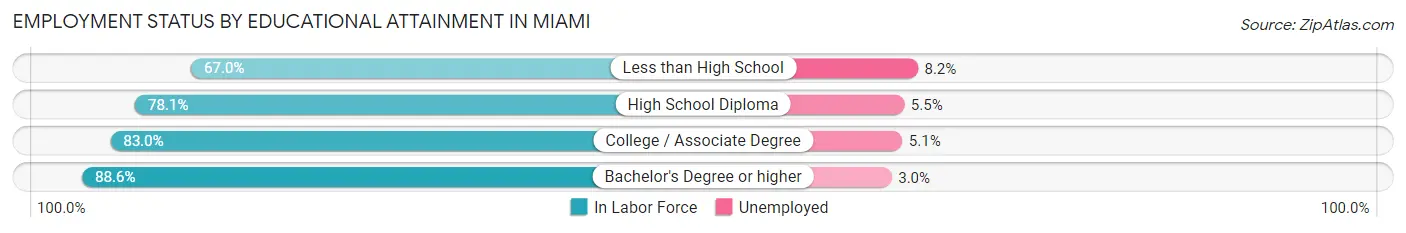
| Educational Attainment | In Labor Force | Unemployed |
| Less than High School | 29,513 (67.0%) | 3,612 (8.2%) |
| High School Diploma | 51,933 (78.1%) | 3,657 (5.5%) |
| College / Associate Degree | 45,340 (83.0%) | 2,786 (5.1%) |
| Bachelor's Degree or higher | 88,564 (88.6%) | 2,999 (3.0%) |
| Total | 215,286 (81.2%) | 12,461 (4.7%) |
Employment Occupations by Sex in Miami
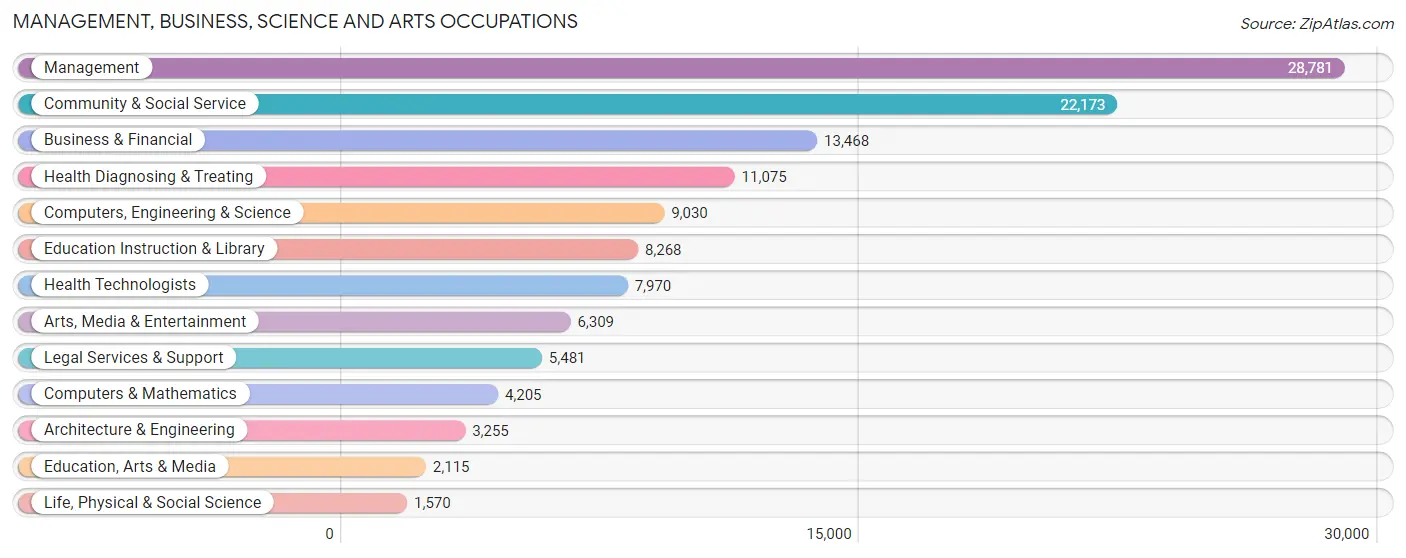
Management, Business, Science and Arts Occupations
The most common Management, Business, Science and Arts occupations in Miami are Management (28,781 | 12.2%), Community & Social Service (22,173 | 9.4%), Business & Financial (13,468 | 5.7%), Health Diagnosing & Treating (11,075 | 4.7%), and Computers, Engineering & Science (9,030 | 3.8%).
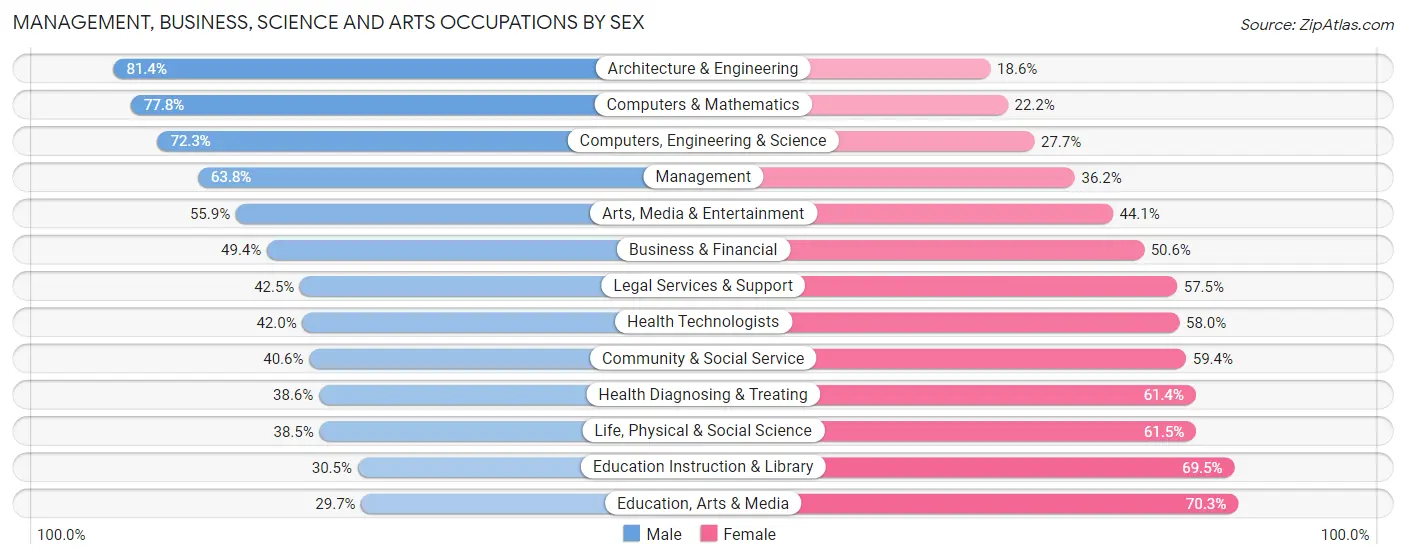
Management, Business, Science and Arts Occupations by Sex
Within the Management, Business, Science and Arts occupations in Miami, the most male-oriented occupations are Architecture & Engineering (81.4%), Computers & Mathematics (77.8%), and Computers, Engineering & Science (72.3%), while the most female-oriented occupations are Education, Arts & Media (70.3%), Education Instruction & Library (69.5%), and Life, Physical & Social Science (61.5%).
| Occupation | Male | Female |
| Management | 18,373 (63.8%) | 10,408 (36.2%) |
| Business & Financial | 6,654 (49.4%) | 6,814 (50.6%) |
| Computers, Engineering & Science | 6,527 (72.3%) | 2,503 (27.7%) |
| Computers & Mathematics | 3,272 (77.8%) | 933 (22.2%) |
| Architecture & Engineering | 2,651 (81.4%) | 604 (18.6%) |
| Life, Physical & Social Science | 604 (38.5%) | 966 (61.5%) |
| Community & Social Service | 9,007 (40.6%) | 13,166 (59.4%) |
| Education, Arts & Media | 629 (29.7%) | 1,486 (70.3%) |
| Legal Services & Support | 2,330 (42.5%) | 3,151 (57.5%) |
| Education Instruction & Library | 2,521 (30.5%) | 5,747 (69.5%) |
| Arts, Media & Entertainment | 3,527 (55.9%) | 2,782 (44.1%) |
| Health Diagnosing & Treating | 4,270 (38.6%) | 6,805 (61.4%) |
| Health Technologists | 3,350 (42.0%) | 4,620 (58.0%) |
| Total (Category) | 44,831 (53.0%) | 39,696 (47.0%) |
| Total (Overall) | 130,020 (55.1%) | 105,790 (44.9%) |
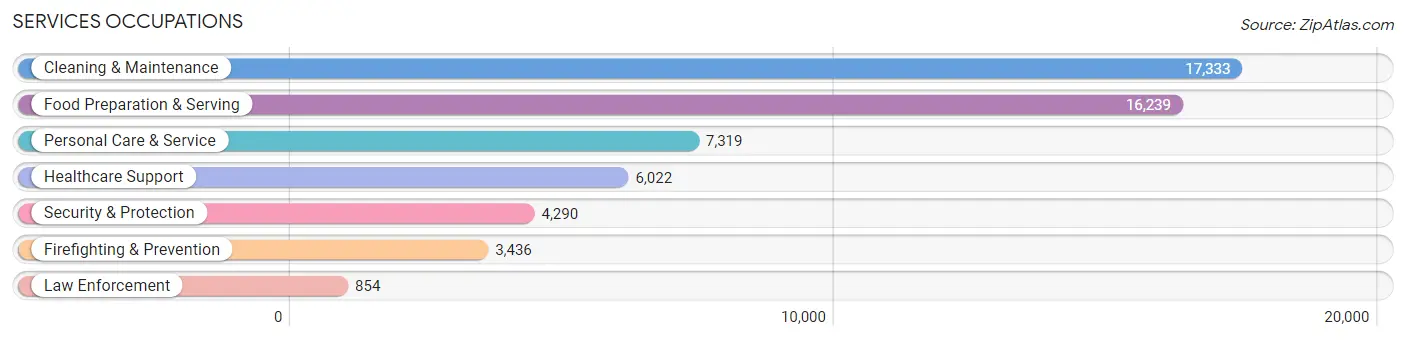
Services Occupations
The most common Services occupations in Miami are Cleaning & Maintenance (17,333 | 7.3%), Food Preparation & Serving (16,239 | 6.9%), Personal Care & Service (7,319 | 3.1%), Healthcare Support (6,022 | 2.5%), and Security & Protection (4,290 | 1.8%).
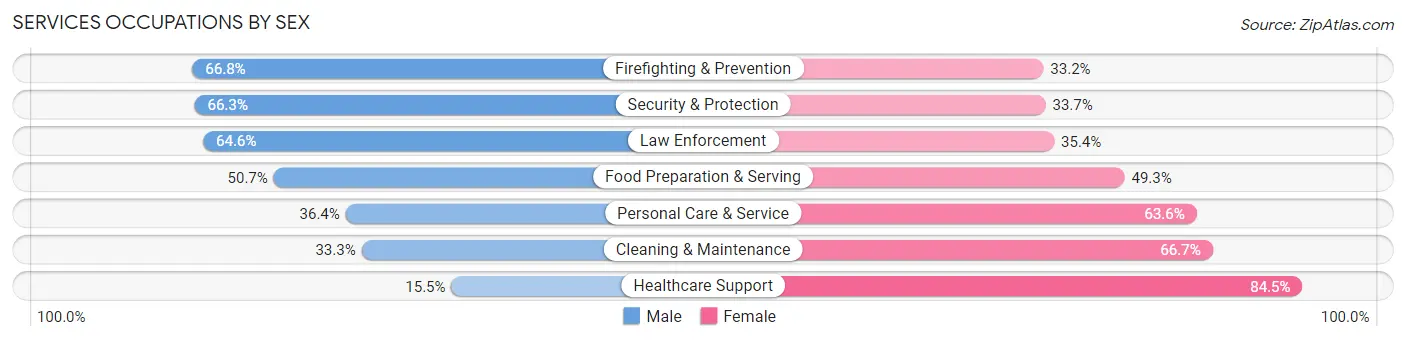
Services Occupations by Sex
Within the Services occupations in Miami, the most male-oriented occupations are Firefighting & Prevention (66.8%), Security & Protection (66.3%), and Law Enforcement (64.6%), while the most female-oriented occupations are Healthcare Support (84.5%), Cleaning & Maintenance (66.7%), and Personal Care & Service (63.6%).
| Occupation | Male | Female |
| Healthcare Support | 933 (15.5%) | 5,089 (84.5%) |
| Security & Protection | 2,846 (66.3%) | 1,444 (33.7%) |
| Firefighting & Prevention | 2,294 (66.8%) | 1,142 (33.2%) |
| Law Enforcement | 552 (64.6%) | 302 (35.4%) |
| Food Preparation & Serving | 8,231 (50.7%) | 8,008 (49.3%) |
| Cleaning & Maintenance | 5,770 (33.3%) | 11,563 (66.7%) |
| Personal Care & Service | 2,667 (36.4%) | 4,652 (63.6%) |
| Total (Category) | 20,447 (39.9%) | 30,756 (60.1%) |
| Total (Overall) | 130,020 (55.1%) | 105,790 (44.9%) |
Sales and Office Occupations
The most common Sales and Office occupations in Miami are Sales & Related (25,515 | 10.8%), and Office & Administration (23,633 | 10.0%).

Sales and Office Occupations by Sex
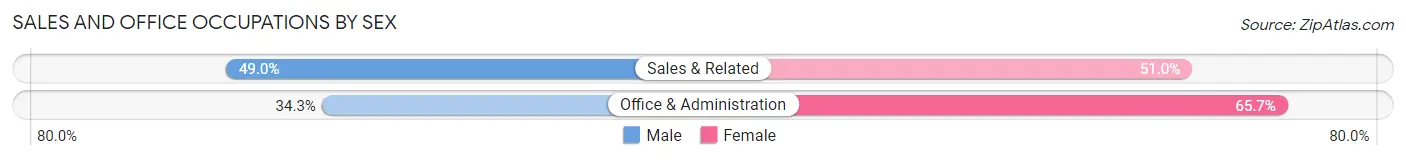
| Occupation | Male | Female |
| Sales & Related | 12,505 (49.0%) | 13,010 (51.0%) |
| Office & Administration | 8,105 (34.3%) | 15,528 (65.7%) |
| Total (Category) | 20,610 (41.9%) | 28,538 (58.1%) |
| Total (Overall) | 130,020 (55.1%) | 105,790 (44.9%) |
Natural Resources, Construction and Maintenance Occupations
The most common Natural Resources, Construction and Maintenance occupations in Miami are Construction & Extraction (21,615 | 9.2%), Installation, Maintenance & Repair (5,509 | 2.3%), and Farming, Fishing & Forestry (786 | 0.3%).

Natural Resources, Construction and Maintenance Occupations by Sex
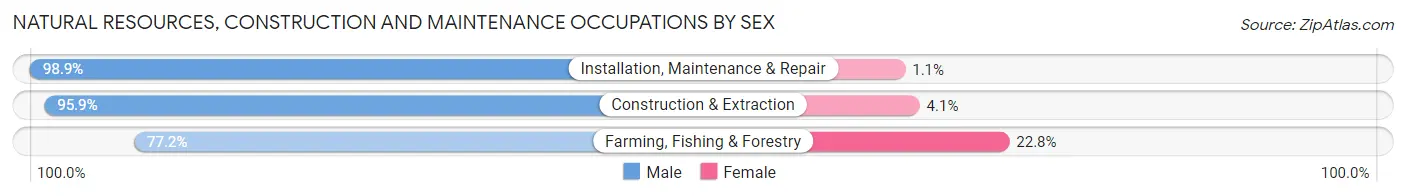
| Occupation | Male | Female |
| Farming, Fishing & Forestry | 607 (77.2%) | 179 (22.8%) |
| Construction & Extraction | 20,726 (95.9%) | 889 (4.1%) |
| Installation, Maintenance & Repair | 5,448 (98.9%) | 61 (1.1%) |
| Total (Category) | 26,781 (96.0%) | 1,129 (4.1%) |
| Total (Overall) | 130,020 (55.1%) | 105,790 (44.9%) |
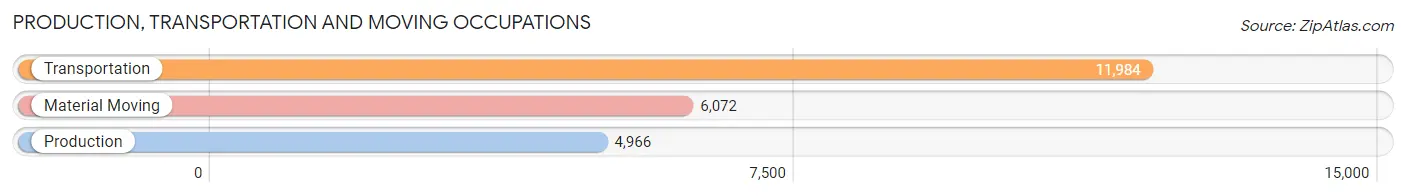
Production, Transportation and Moving Occupations
The most common Production, Transportation and Moving occupations in Miami are Transportation (11,984 | 5.1%), Material Moving (6,072 | 2.6%), and Production (4,966 | 2.1%).
Production, Transportation and Moving Occupations by Sex
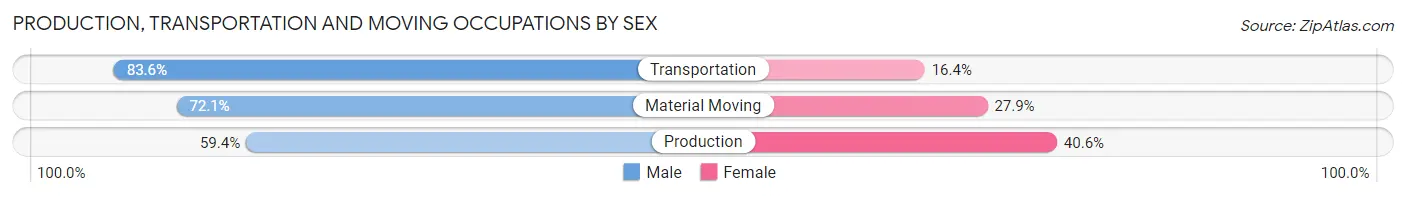
| Occupation | Male | Female |
| Production | 2,949 (59.4%) | 2,017 (40.6%) |
| Transportation | 10,022 (83.6%) | 1,962 (16.4%) |
| Material Moving | 4,380 (72.1%) | 1,692 (27.9%) |
| Total (Category) | 17,351 (75.4%) | 5,671 (24.6%) |
| Total (Overall) | 130,020 (55.1%) | 105,790 (44.9%) |
Employment Industries by Sex in Miami
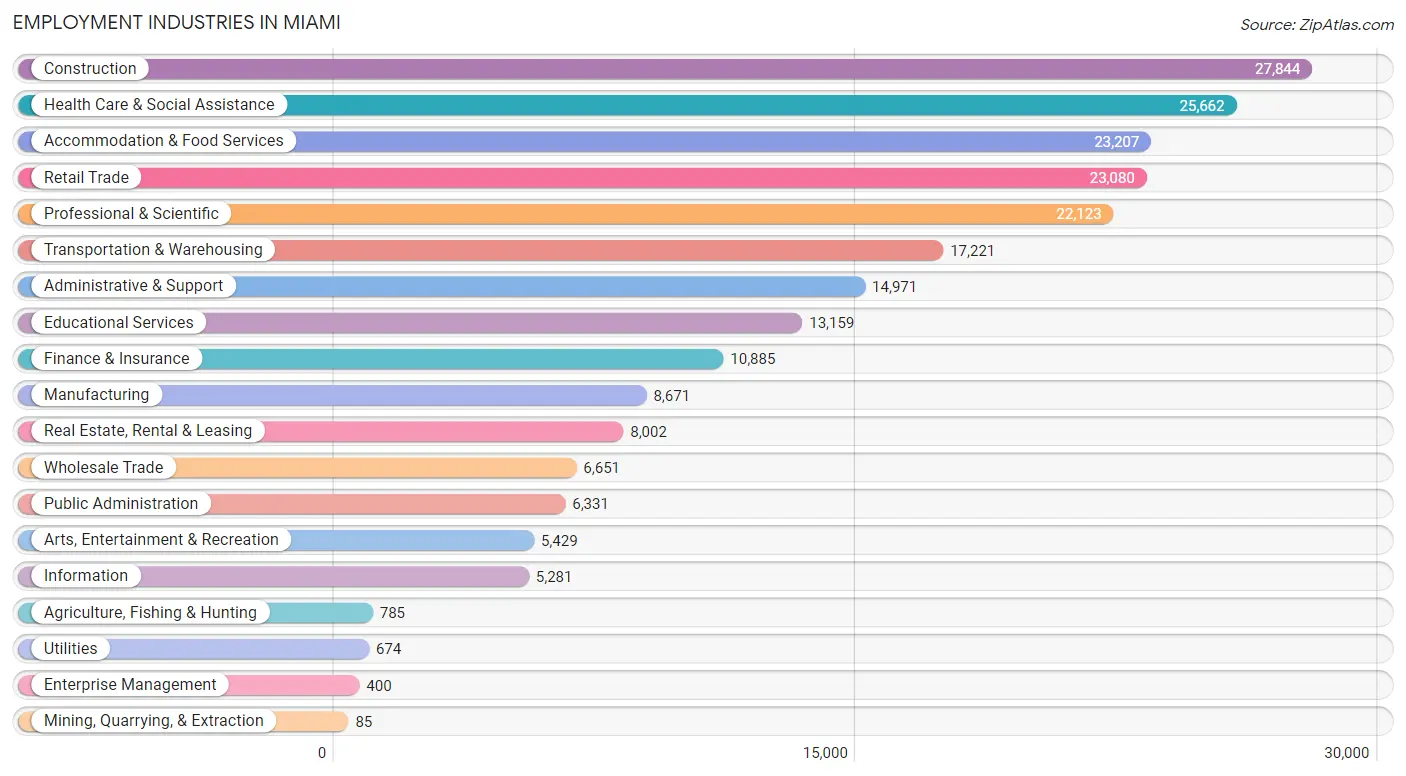
Employment Industries in Miami
The major employment industries in Miami include Construction (27,844 | 11.8%), Health Care & Social Assistance (25,662 | 10.9%), Accommodation & Food Services (23,207 | 9.8%), Retail Trade (23,080 | 9.8%), and Professional & Scientific (22,123 | 9.4%).
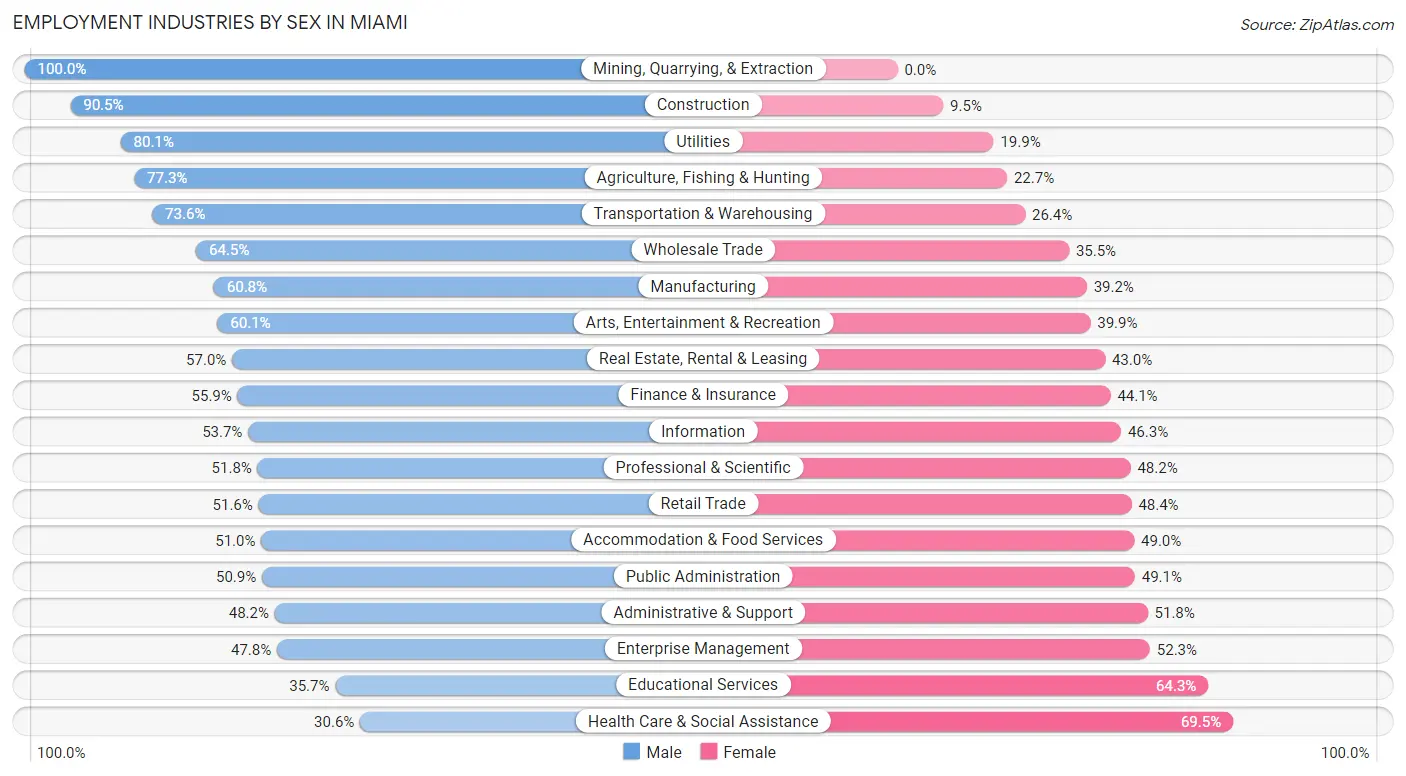
Employment Industries by Sex in Miami
The Miami industries that see more men than women are Mining, Quarrying, & Extraction (100.0%), Construction (90.5%), and Utilities (80.1%), whereas the industries that tend to have a higher number of women are Health Care & Social Assistance (69.5%), Educational Services (64.3%), and Enterprise Management (52.2%).
| Industry | Male | Female |
| Agriculture, Fishing & Hunting | 607 (77.3%) | 178 (22.7%) |
| Mining, Quarrying, & Extraction | 85 (100.0%) | 0 (0.0%) |
| Construction | 25,206 (90.5%) | 2,638 (9.5%) |
| Manufacturing | 5,274 (60.8%) | 3,397 (39.2%) |
| Wholesale Trade | 4,290 (64.5%) | 2,361 (35.5%) |
| Retail Trade | 11,900 (51.6%) | 11,180 (48.4%) |
| Transportation & Warehousing | 12,673 (73.6%) | 4,548 (26.4%) |
| Utilities | 540 (80.1%) | 134 (19.9%) |
| Information | 2,837 (53.7%) | 2,444 (46.3%) |
| Finance & Insurance | 6,086 (55.9%) | 4,799 (44.1%) |
| Real Estate, Rental & Leasing | 4,564 (57.0%) | 3,438 (43.0%) |
| Professional & Scientific | 11,450 (51.8%) | 10,673 (48.2%) |
| Enterprise Management | 191 (47.7%) | 209 (52.2%) |
| Administrative & Support | 7,219 (48.2%) | 7,752 (51.8%) |
| Educational Services | 4,697 (35.7%) | 8,462 (64.3%) |
| Health Care & Social Assistance | 7,840 (30.5%) | 17,822 (69.5%) |
| Arts, Entertainment & Recreation | 3,262 (60.1%) | 2,167 (39.9%) |
| Accommodation & Food Services | 11,838 (51.0%) | 11,369 (49.0%) |
| Public Administration | 3,220 (50.9%) | 3,111 (49.1%) |
| Total | 130,020 (55.1%) | 105,790 (44.9%) |
Education in Miami
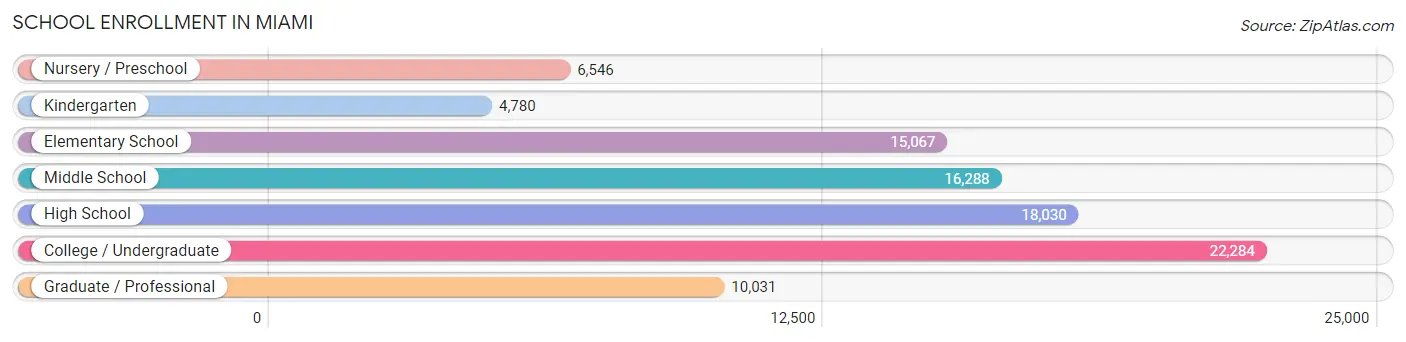
School Enrollment in Miami
The most common levels of schooling among the 93,026 students in Miami are college / undergraduate (22,284 | 23.9%), high school (18,030 | 19.4%), and middle school (16,288 | 17.5%).
| School Level | # Students | % Students |
| Nursery / Preschool | 6,546 | 7.0% |
| Kindergarten | 4,780 | 5.1% |
| Elementary School | 15,067 | 16.2% |
| Middle School | 16,288 | 17.5% |
| High School | 18,030 | 19.4% |
| College / Undergraduate | 22,284 | 23.9% |
| Graduate / Professional | 10,031 | 10.8% |
| Total | 93,026 | 100.0% |
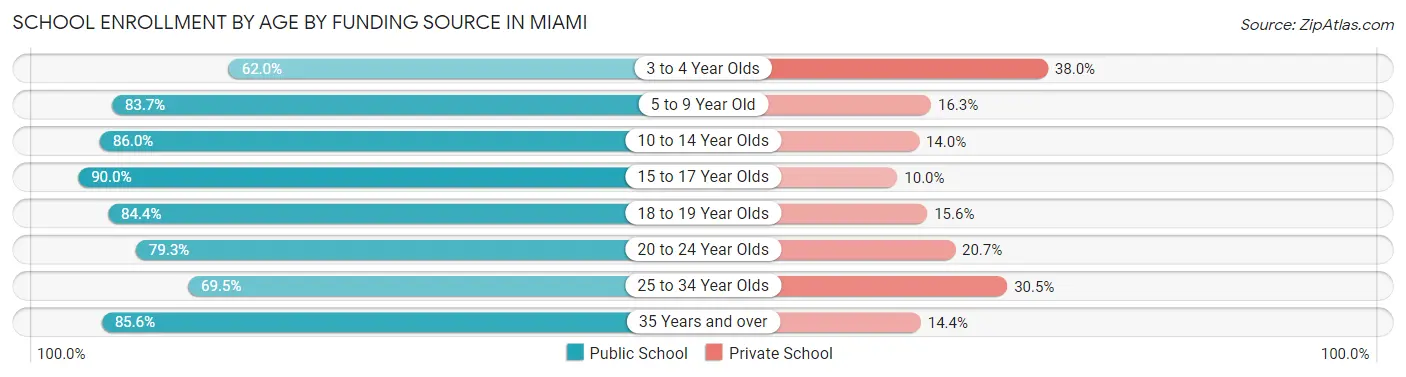
School Enrollment by Age by Funding Source in Miami
Out of a total of 93,026 students who are enrolled in schools in Miami, 17,024 (18.3%) attend a private institution, while the remaining 76,002 (81.7%) are enrolled in public schools. The age group of 3 to 4 year olds has the highest likelihood of being enrolled in private schools, with 2,361 (38.0% in the age bracket) enrolled. Conversely, the age group of 15 to 17 year olds has the lowest likelihood of being enrolled in a private school, with 9,857 (90.0% in the age bracket) attending a public institution.
| Age Bracket | Public School | Private School |
| 3 to 4 Year Olds | 3,845 (62.0%) | 2,361 (38.0%) |
| 5 to 9 Year Old | 15,330 (83.7%) | 2,978 (16.3%) |
| 10 to 14 Year Olds | 14,902 (86.0%) | 2,431 (14.0%) |
| 15 to 17 Year Olds | 9,857 (90.0%) | 1,095 (10.0%) |
| 18 to 19 Year Olds | 4,519 (84.4%) | 833 (15.6%) |
| 20 to 24 Year Olds | 8,070 (79.3%) | 2,112 (20.7%) |
| 25 to 34 Year Olds | 7,156 (69.5%) | 3,134 (30.5%) |
| 35 Years and over | 12,333 (85.6%) | 2,070 (14.4%) |
| Total | 76,002 (81.7%) | 17,024 (18.3%) |
Educational Attainment by Field of Study in Miami
Business (33,616 | 27.3%), engineering (12,446 | 10.1%), science & technology (12,015 | 9.8%), social sciences (11,093 | 9.0%), and education (8,903 | 7.2%) are the most common fields of study among 123,008 individuals in Miami who have obtained a bachelor's degree or higher.
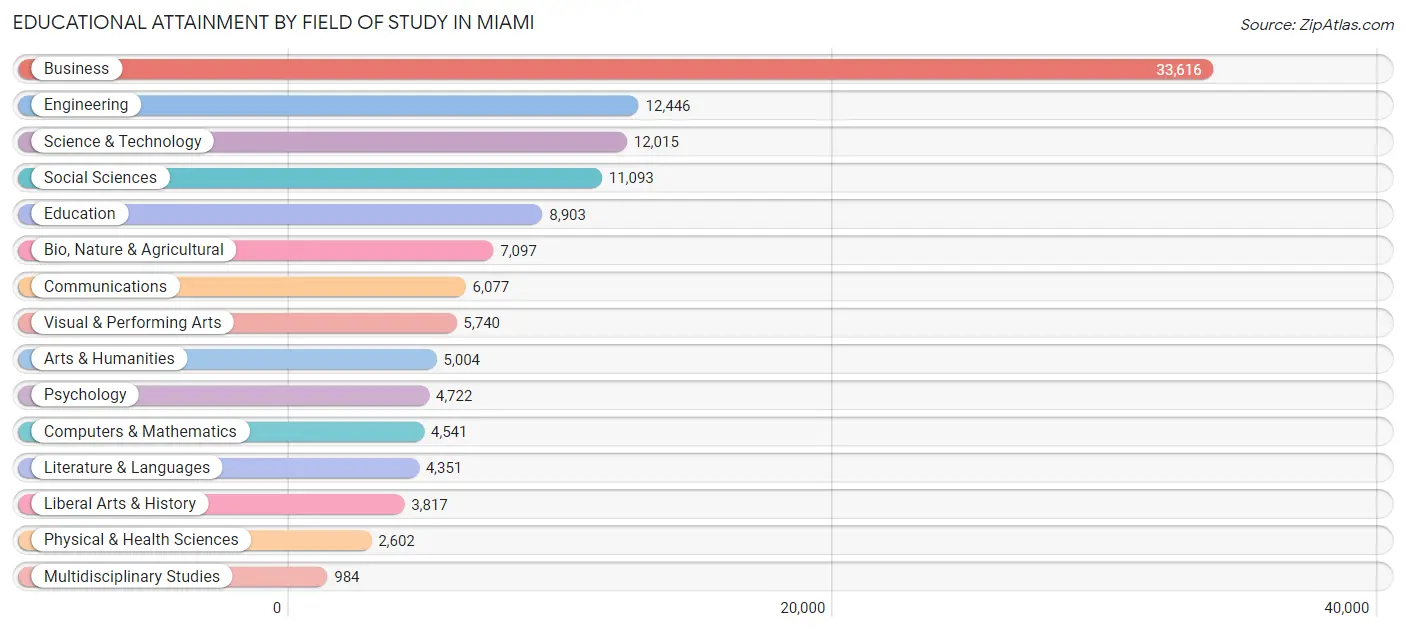
| Field of Study | # Graduates | % Graduates |
| Computers & Mathematics | 4,541 | 3.7% |
| Bio, Nature & Agricultural | 7,097 | 5.8% |
| Physical & Health Sciences | 2,602 | 2.1% |
| Psychology | 4,722 | 3.8% |
| Social Sciences | 11,093 | 9.0% |
| Engineering | 12,446 | 10.1% |
| Multidisciplinary Studies | 984 | 0.8% |
| Science & Technology | 12,015 | 9.8% |
| Business | 33,616 | 27.3% |
| Education | 8,903 | 7.2% |
| Literature & Languages | 4,351 | 3.5% |
| Liberal Arts & History | 3,817 | 3.1% |
| Visual & Performing Arts | 5,740 | 4.7% |
| Communications | 6,077 | 4.9% |
| Arts & Humanities | 5,004 | 4.1% |
| Total | 123,008 | 100.0% |
Transportation & Commute in Miami
Vehicle Availability by Sex in Miami
The most prevalent vehicle ownership categories in Miami are males with 1 vehicle (53,373, accounting for 41.7%) and females with 1 vehicle (42,754, making up 51.5%).
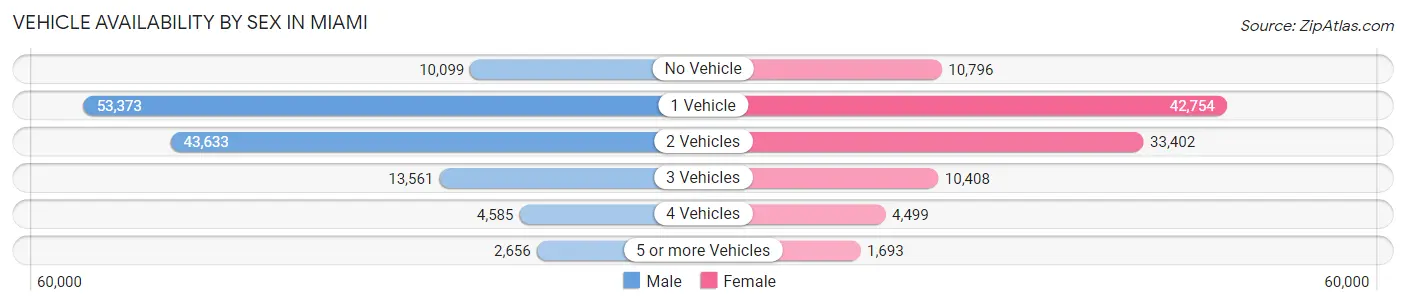
| Vehicles Available | Male | Female |
| No Vehicle | 10,099 (7.9%) | 10,796 (10.4%) |
| 1 Vehicle | 53,373 (41.7%) | 42,754 (41.3%) |
| 2 Vehicles | 43,633 (34.1%) | 33,402 (32.3%) |
| 3 Vehicles | 13,561 (10.6%) | 10,408 (10.1%) |
| 4 Vehicles | 4,585 (3.6%) | 4,499 (4.3%) |
| 5 or more Vehicles | 2,656 (2.1%) | 1,693 (1.6%) |
| Total | 127,907 (100.0%) | 103,552 (100.0%) |
Commute Time in Miami
The most frequently occuring commute durations in Miami are 30 to 34 minutes (43,219 commuters, 21.1%), 20 to 24 minutes (36,815 commuters, 18.0%), and 15 to 19 minutes (25,535 commuters, 12.5%).
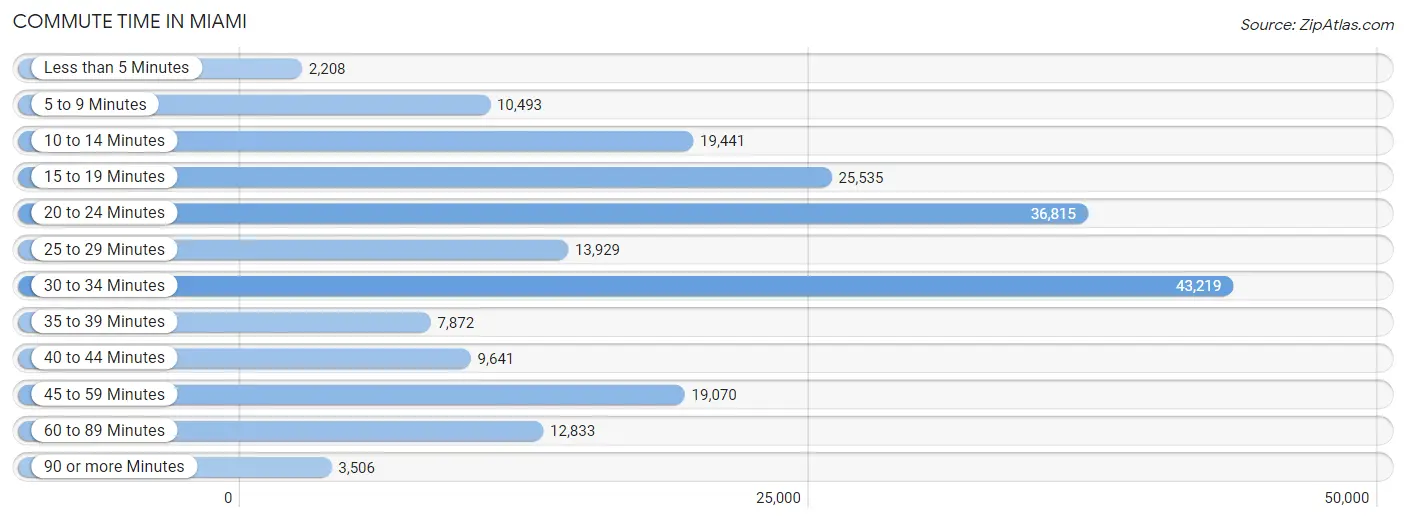
| Commute Time | # Commuters | % Commuters |
| Less than 5 Minutes | 2,208 | 1.1% |
| 5 to 9 Minutes | 10,493 | 5.1% |
| 10 to 14 Minutes | 19,441 | 9.5% |
| 15 to 19 Minutes | 25,535 | 12.5% |
| 20 to 24 Minutes | 36,815 | 18.0% |
| 25 to 29 Minutes | 13,929 | 6.8% |
| 30 to 34 Minutes | 43,219 | 21.1% |
| 35 to 39 Minutes | 7,872 | 3.8% |
| 40 to 44 Minutes | 9,641 | 4.7% |
| 45 to 59 Minutes | 19,070 | 9.3% |
| 60 to 89 Minutes | 12,833 | 6.3% |
| 90 or more Minutes | 3,506 | 1.7% |
Commute Time by Sex in Miami
The most common commute times in Miami are 30 to 34 minutes (23,939 commuters, 21.1%) for males and 30 to 34 minutes (19,280 commuters, 21.2%) for females.
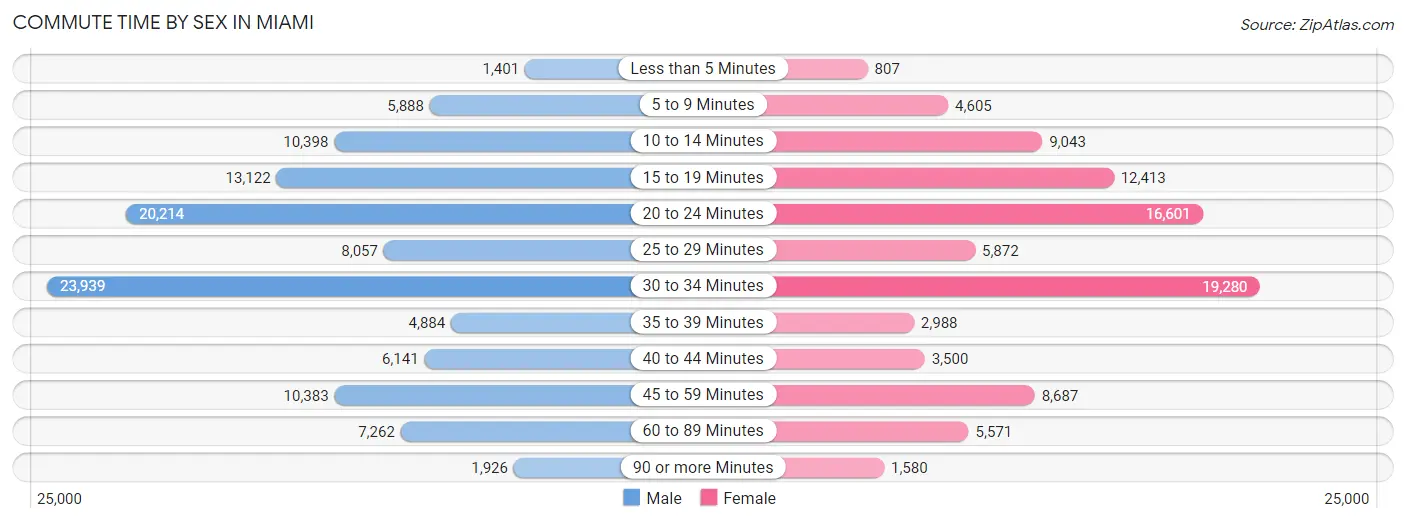
| Commute Time | Male | Female |
| Less than 5 Minutes | 1,401 (1.2%) | 807 (0.9%) |
| 5 to 9 Minutes | 5,888 (5.2%) | 4,605 (5.1%) |
| 10 to 14 Minutes | 10,398 (9.1%) | 9,043 (9.9%) |
| 15 to 19 Minutes | 13,122 (11.6%) | 12,413 (13.7%) |
| 20 to 24 Minutes | 20,214 (17.8%) | 16,601 (18.2%) |
| 25 to 29 Minutes | 8,057 (7.1%) | 5,872 (6.5%) |
| 30 to 34 Minutes | 23,939 (21.1%) | 19,280 (21.2%) |
| 35 to 39 Minutes | 4,884 (4.3%) | 2,988 (3.3%) |
| 40 to 44 Minutes | 6,141 (5.4%) | 3,500 (3.8%) |
| 45 to 59 Minutes | 10,383 (9.1%) | 8,687 (9.6%) |
| 60 to 89 Minutes | 7,262 (6.4%) | 5,571 (6.1%) |
| 90 or more Minutes | 1,926 (1.7%) | 1,580 (1.7%) |
Time of Departure to Work by Sex in Miami
The most frequent times of departure to work in Miami are 7:00 AM to 7:29 AM (20,029, 17.6%) for males and 8:00 AM to 8:29 AM (17,388, 19.1%) for females.
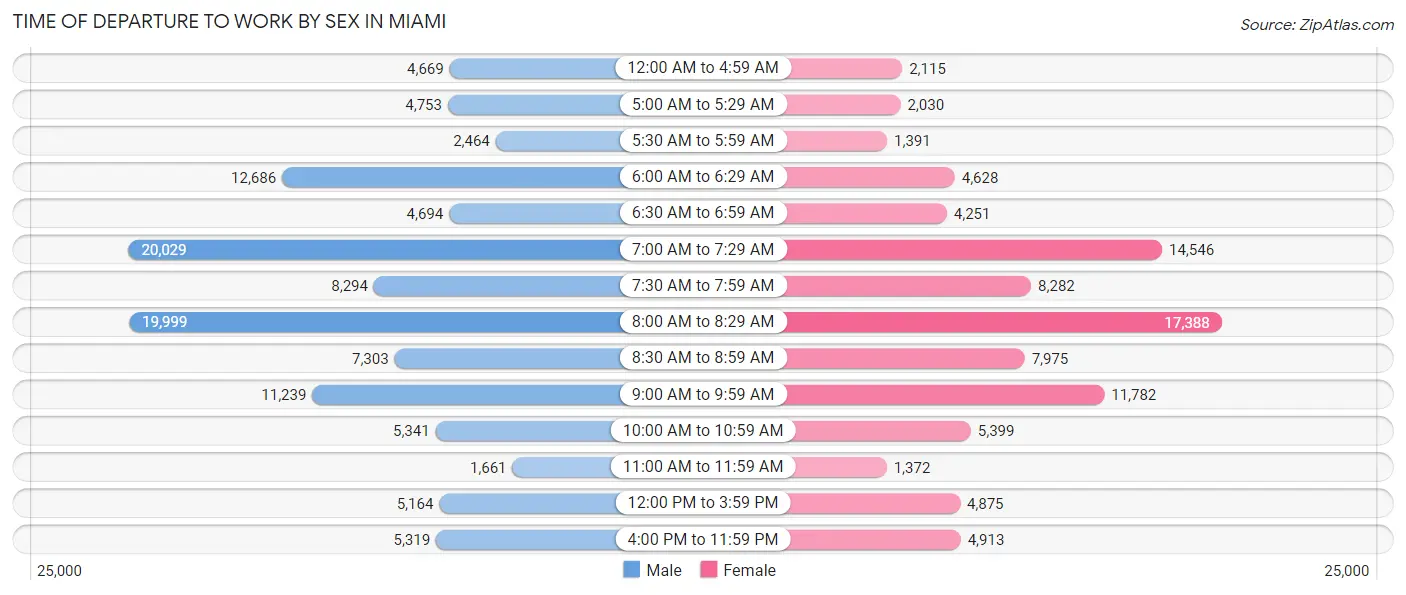
| Time of Departure | Male | Female |
| 12:00 AM to 4:59 AM | 4,669 (4.1%) | 2,115 (2.3%) |
| 5:00 AM to 5:29 AM | 4,753 (4.2%) | 2,030 (2.2%) |
| 5:30 AM to 5:59 AM | 2,464 (2.2%) | 1,391 (1.5%) |
| 6:00 AM to 6:29 AM | 12,686 (11.2%) | 4,628 (5.1%) |
| 6:30 AM to 6:59 AM | 4,694 (4.1%) | 4,251 (4.7%) |
| 7:00 AM to 7:29 AM | 20,029 (17.6%) | 14,546 (16.0%) |
| 7:30 AM to 7:59 AM | 8,294 (7.3%) | 8,282 (9.1%) |
| 8:00 AM to 8:29 AM | 19,999 (17.6%) | 17,388 (19.1%) |
| 8:30 AM to 8:59 AM | 7,303 (6.4%) | 7,975 (8.8%) |
| 9:00 AM to 9:59 AM | 11,239 (9.9%) | 11,782 (13.0%) |
| 10:00 AM to 10:59 AM | 5,341 (4.7%) | 5,399 (5.9%) |
| 11:00 AM to 11:59 AM | 1,661 (1.5%) | 1,372 (1.5%) |
| 12:00 PM to 3:59 PM | 5,164 (4.5%) | 4,875 (5.4%) |
| 4:00 PM to 11:59 PM | 5,319 (4.7%) | 4,913 (5.4%) |
| Total | 113,615 (100.0%) | 90,947 (100.0%) |
Housing Occupancy in Miami
Occupancy by Ownership in Miami
Of the total 186,137 dwellings in Miami, owner-occupied units account for 56,069 (30.1%), while renter-occupied units make up 130,068 (69.9%).
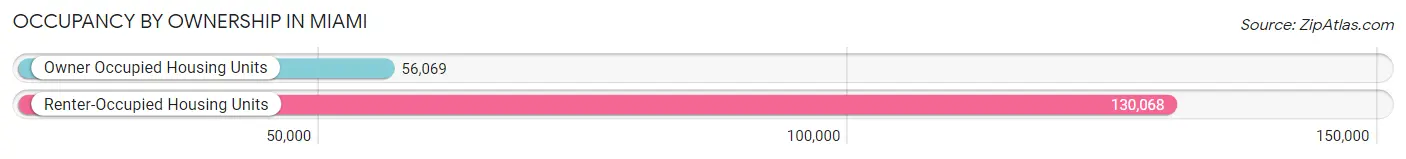
| Occupancy | # Housing Units | % Housing Units |
| Owner Occupied Housing Units | 56,069 | 30.1% |
| Renter-Occupied Housing Units | 130,068 | 69.9% |
| Total Occupied Housing Units | 186,137 | 100.0% |
Occupancy by Household Size in Miami
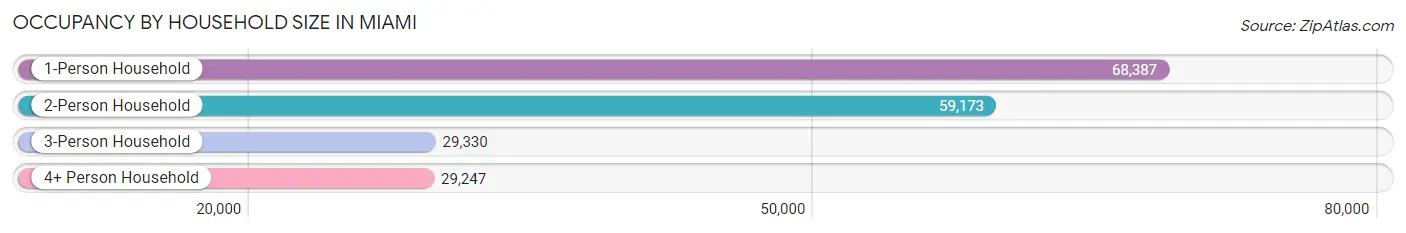
| Household Size | # Housing Units | % Housing Units |
| 1-Person Household | 68,387 | 36.7% |
| 2-Person Household | 59,173 | 31.8% |
| 3-Person Household | 29,330 | 15.8% |
| 4+ Person Household | 29,247 | 15.7% |
| Total Housing Units | 186,137 | 100.0% |
Occupancy by Ownership by Household Size in Miami
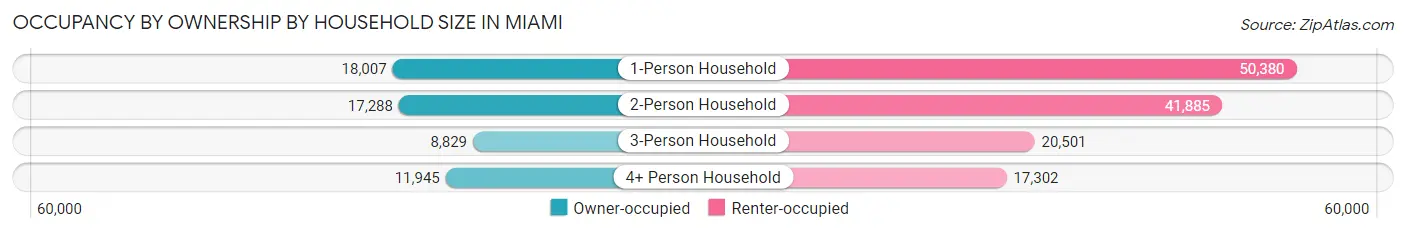
| Household Size | Owner-occupied | Renter-occupied |
| 1-Person Household | 18,007 (26.3%) | 50,380 (73.7%) |
| 2-Person Household | 17,288 (29.2%) | 41,885 (70.8%) |
| 3-Person Household | 8,829 (30.1%) | 20,501 (69.9%) |
| 4+ Person Household | 11,945 (40.8%) | 17,302 (59.2%) |
| Total Housing Units | 56,069 (30.1%) | 130,068 (69.9%) |
Occupancy by Educational Attainment in Miami
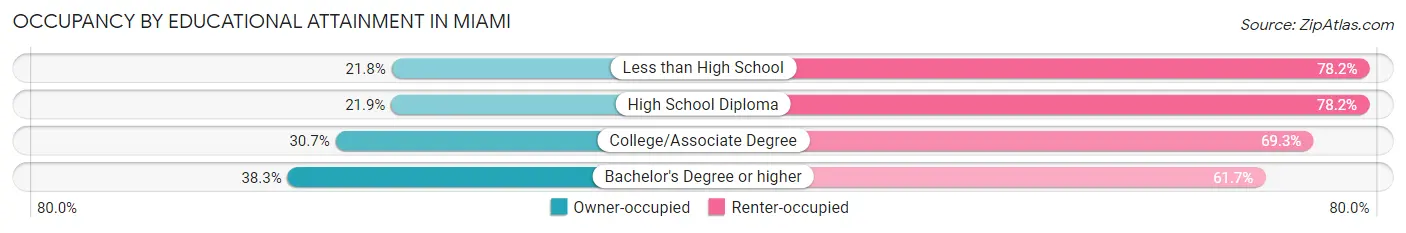
| Household Size | Owner-occupied | Renter-occupied |
| Less than High School | 7,831 (21.8%) | 28,098 (78.2%) |
| High School Diploma | 8,464 (21.8%) | 30,274 (78.1%) |
| College/Associate Degree | 11,775 (30.7%) | 26,594 (69.3%) |
| Bachelor's Degree or higher | 27,999 (38.3%) | 45,102 (61.7%) |
Occupancy by Age of Householder in Miami
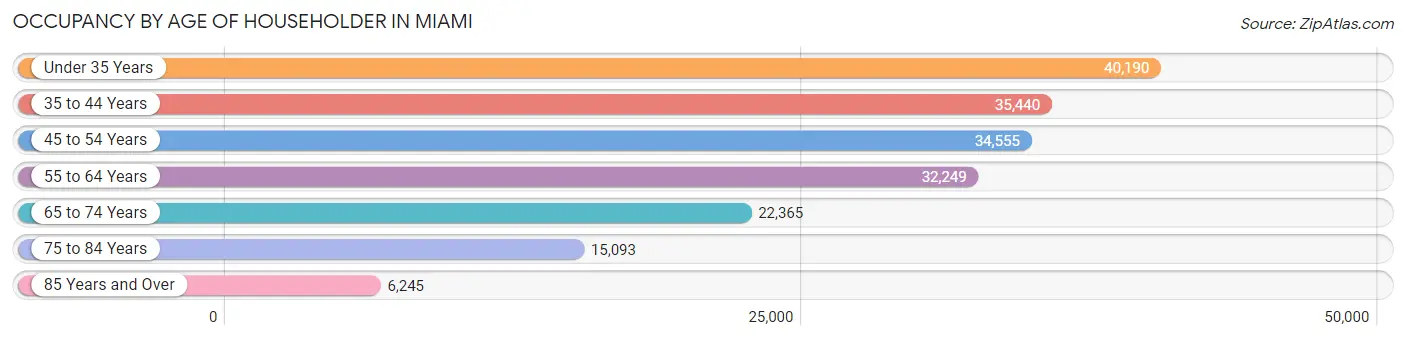
| Age Bracket | # Households | % Households |
| Under 35 Years | 40,190 | 21.6% |
| 35 to 44 Years | 35,440 | 19.0% |
| 45 to 54 Years | 34,555 | 18.6% |
| 55 to 64 Years | 32,249 | 17.3% |
| 65 to 74 Years | 22,365 | 12.0% |
| 75 to 84 Years | 15,093 | 8.1% |
| 85 Years and Over | 6,245 | 3.4% |
| Total | 186,137 | 100.0% |
Housing Finances in Miami
Median Income by Occupancy in Miami
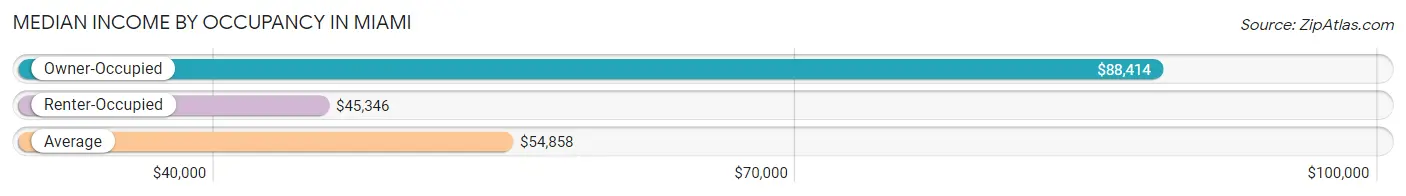
| Occupancy Type | # Households | Median Income |
| Owner-Occupied | 56,069 (30.1%) | $88,414 |
| Renter-Occupied | 130,068 (69.9%) | $45,346 |
| Average | 186,137 (100.0%) | $54,858 |
Occupancy by Householder Income Bracket in Miami
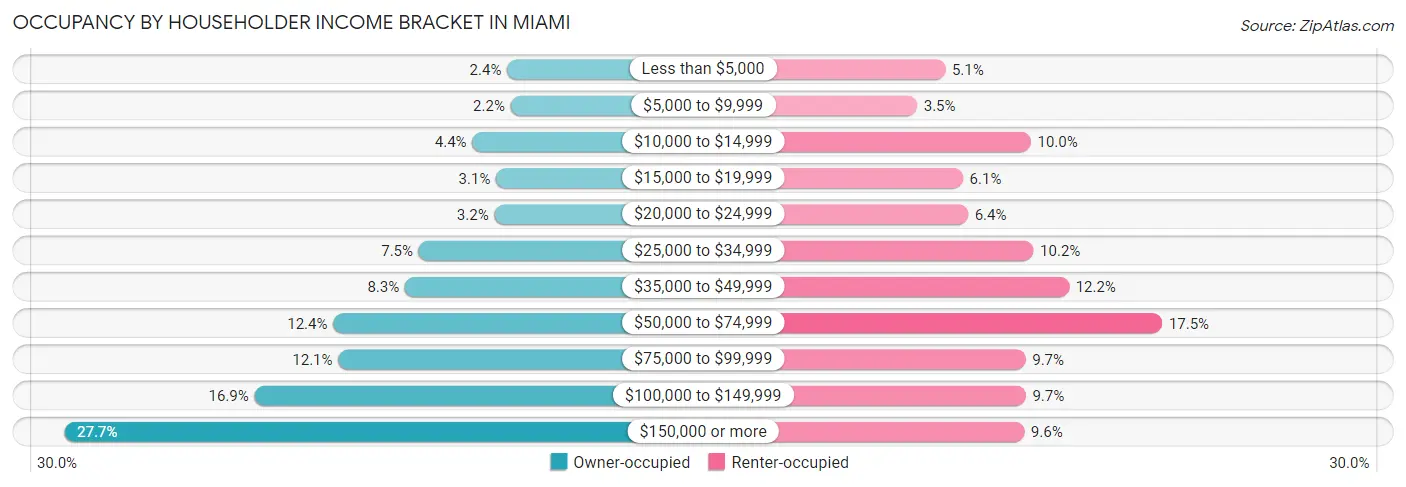
| Income Bracket | Owner-occupied | Renter-occupied |
| Less than $5,000 | 1,355 (2.4%) | 6,643 (5.1%) |
| $5,000 to $9,999 | 1,247 (2.2%) | 4,547 (3.5%) |
| $10,000 to $14,999 | 2,473 (4.4%) | 13,013 (10.0%) |
| $15,000 to $19,999 | 1,708 (3.0%) | 7,957 (6.1%) |
| $20,000 to $24,999 | 1,764 (3.2%) | 8,336 (6.4%) |
| $25,000 to $34,999 | 4,189 (7.5%) | 13,200 (10.2%) |
| $35,000 to $49,999 | 4,633 (8.3%) | 15,841 (12.2%) |
| $50,000 to $74,999 | 6,929 (12.4%) | 22,769 (17.5%) |
| $75,000 to $99,999 | 6,767 (12.1%) | 12,619 (9.7%) |
| $100,000 to $149,999 | 9,452 (16.9%) | 12,634 (9.7%) |
| $150,000 or more | 15,552 (27.7%) | 12,509 (9.6%) |
| Total | 56,069 (100.0%) | 130,068 (100.0%) |
Monthly Housing Cost Tiers in Miami
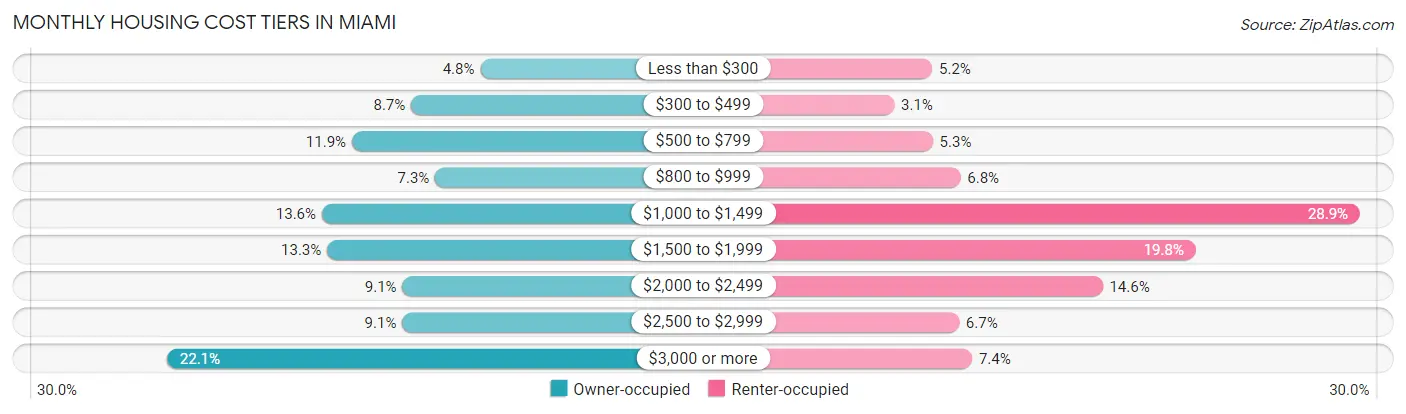
| Monthly Cost | Owner-occupied | Renter-occupied |
| Less than $300 | 2,708 (4.8%) | 6,803 (5.2%) |
| $300 to $499 | 4,849 (8.6%) | 4,072 (3.1%) |
| $500 to $799 | 6,684 (11.9%) | 6,842 (5.3%) |
| $800 to $999 | 4,104 (7.3%) | 8,835 (6.8%) |
| $1,000 to $1,499 | 7,613 (13.6%) | 37,537 (28.9%) |
| $1,500 to $1,999 | 7,453 (13.3%) | 25,744 (19.8%) |
| $2,000 to $2,499 | 5,120 (9.1%) | 19,040 (14.6%) |
| $2,500 to $2,999 | 5,124 (9.1%) | 8,729 (6.7%) |
| $3,000 or more | 12,414 (22.1%) | 9,664 (7.4%) |
| Total | 56,069 (100.0%) | 130,068 (100.0%) |
Physical Housing Characteristics in Miami
Housing Structures in Miami
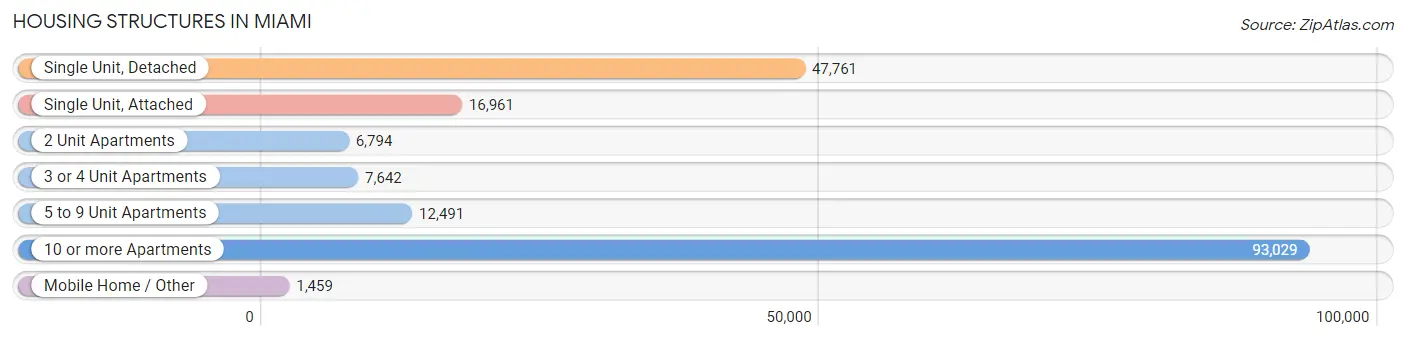
| Structure Type | # Housing Units | % Housing Units |
| Single Unit, Detached | 47,761 | 25.7% |
| Single Unit, Attached | 16,961 | 9.1% |
| 2 Unit Apartments | 6,794 | 3.6% |
| 3 or 4 Unit Apartments | 7,642 | 4.1% |
| 5 to 9 Unit Apartments | 12,491 | 6.7% |
| 10 or more Apartments | 93,029 | 50.0% |
| Mobile Home / Other | 1,459 | 0.8% |
| Total | 186,137 | 100.0% |
Housing Structures by Occupancy in Miami
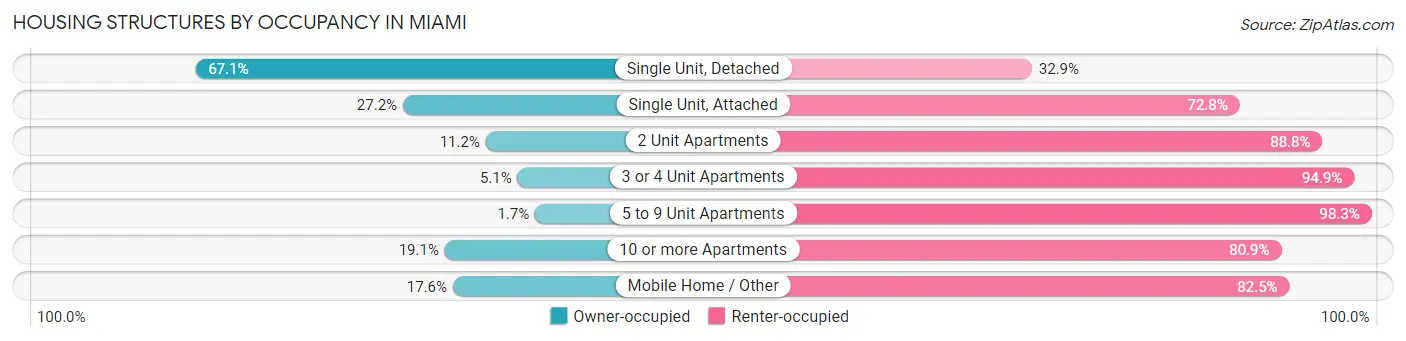
| Structure Type | Owner-occupied | Renter-occupied |
| Single Unit, Detached | 32,066 (67.1%) | 15,695 (32.9%) |
| Single Unit, Attached | 4,606 (27.2%) | 12,355 (72.8%) |
| 2 Unit Apartments | 762 (11.2%) | 6,032 (88.8%) |
| 3 or 4 Unit Apartments | 389 (5.1%) | 7,253 (94.9%) |
| 5 to 9 Unit Apartments | 215 (1.7%) | 12,276 (98.3%) |
| 10 or more Apartments | 17,775 (19.1%) | 75,254 (80.9%) |
| Mobile Home / Other | 256 (17.5%) | 1,203 (82.5%) |
| Total | 56,069 (30.1%) | 130,068 (69.9%) |
Housing Structures by Number of Rooms in Miami
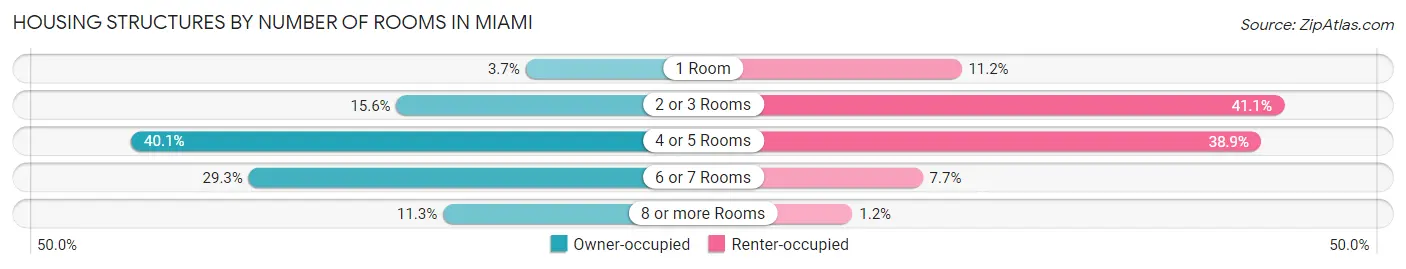
| Number of Rooms | Owner-occupied | Renter-occupied |
| 1 Room | 2,055 (3.7%) | 14,618 (11.2%) |
| 2 or 3 Rooms | 8,755 (15.6%) | 53,391 (41.0%) |
| 4 or 5 Rooms | 22,504 (40.1%) | 50,616 (38.9%) |
| 6 or 7 Rooms | 16,418 (29.3%) | 9,945 (7.6%) |
| 8 or more Rooms | 6,337 (11.3%) | 1,498 (1.1%) |
| Total | 56,069 (100.0%) | 130,068 (100.0%) |
Housing Structure by Heating Type in Miami
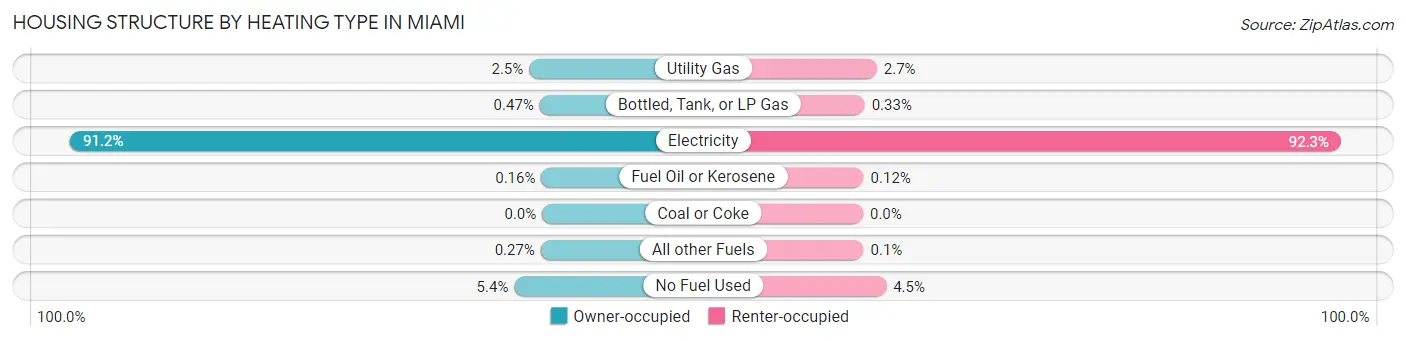
| Heating Type | Owner-occupied | Renter-occupied |
| Utility Gas | 1,410 (2.5%) | 3,469 (2.7%) |
| Bottled, Tank, or LP Gas | 265 (0.5%) | 426 (0.3%) |
| Electricity | 51,139 (91.2%) | 120,073 (92.3%) |
| Fuel Oil or Kerosene | 88 (0.2%) | 160 (0.1%) |
| Coal or Coke | 0 (0.0%) | 0 (0.0%) |
| All other Fuels | 153 (0.3%) | 124 (0.1%) |
| No Fuel Used | 3,014 (5.4%) | 5,816 (4.5%) |
| Total | 56,069 (100.0%) | 130,068 (100.0%) |
Household Vehicle Usage in Miami
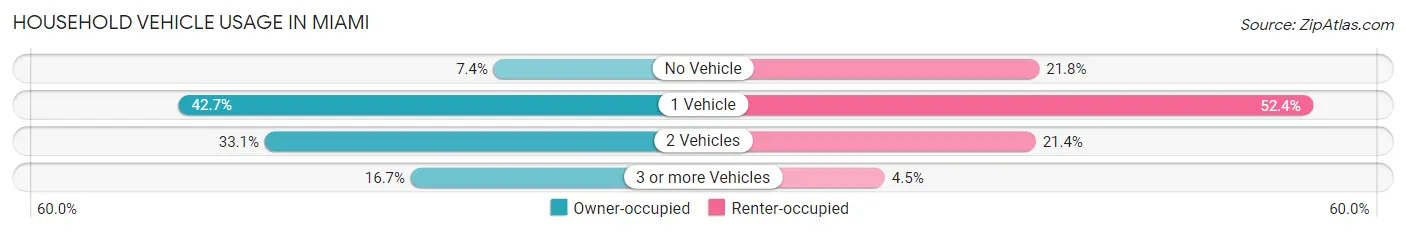
| Vehicles per Household | Owner-occupied | Renter-occupied |
| No Vehicle | 4,171 (7.4%) | 28,320 (21.8%) |
| 1 Vehicle | 23,962 (42.7%) | 68,130 (52.4%) |
| 2 Vehicles | 18,553 (33.1%) | 27,796 (21.4%) |
| 3 or more Vehicles | 9,383 (16.7%) | 5,822 (4.5%) |
| Total | 56,069 (100.0%) | 130,068 (100.0%) |
Real Estate & Mortgages in Miami
Real Estate and Mortgage Overview in Miami
| Characteristic | Without Mortgage | With Mortgage |
| Housing Units | 25,165 | 30,904 |
| Median Property Value | $417,800 | $445,600 |
| Median Household Income | $62,184 | $10,855 |
| Monthly Housing Costs | $735 | $11,089 |
| Real Estate Taxes | $3,169 | $856 |
Property Value by Mortgage Status in Miami
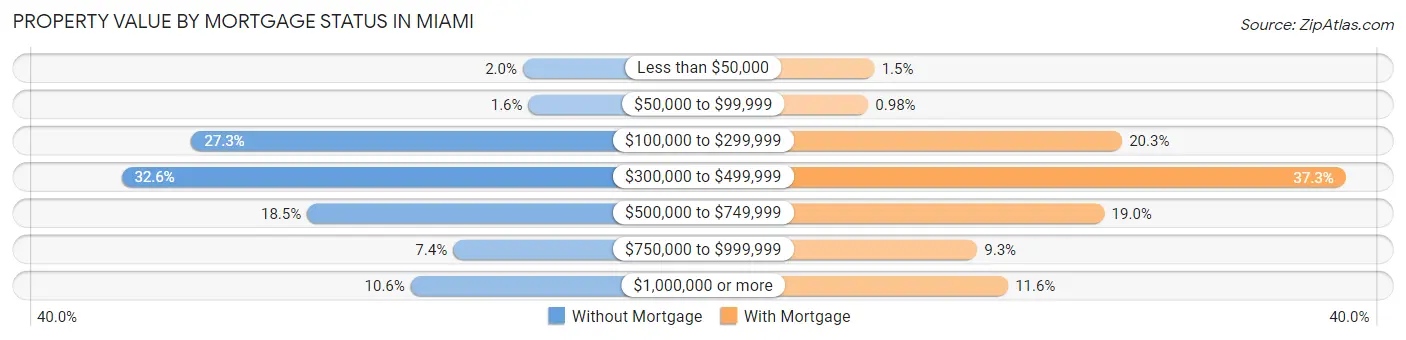
| Property Value | Without Mortgage | With Mortgage |
| Less than $50,000 | 514 (2.0%) | 450 (1.5%) |
| $50,000 to $99,999 | 407 (1.6%) | 304 (1.0%) |
| $100,000 to $299,999 | 6,867 (27.3%) | 6,281 (20.3%) |
| $300,000 to $499,999 | 8,209 (32.6%) | 11,539 (37.3%) |
| $500,000 to $749,999 | 4,651 (18.5%) | 5,866 (19.0%) |
| $750,000 to $999,999 | 1,852 (7.4%) | 2,869 (9.3%) |
| $1,000,000 or more | 2,665 (10.6%) | 3,595 (11.6%) |
| Total | 25,165 (100.0%) | 30,904 (100.0%) |
Household Income by Mortgage Status in Miami
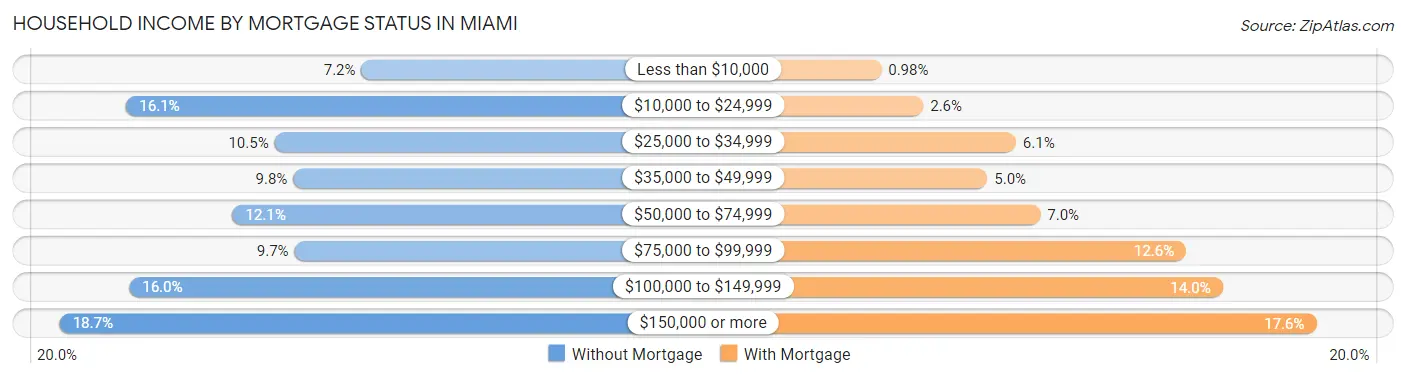
| Household Income | Without Mortgage | With Mortgage |
| Less than $10,000 | 1,804 (7.2%) | 302 (1.0%) |
| $10,000 to $24,999 | 4,056 (16.1%) | 798 (2.6%) |
| $25,000 to $34,999 | 2,637 (10.5%) | 1,889 (6.1%) |
| $35,000 to $49,999 | 2,458 (9.8%) | 1,552 (5.0%) |
| $50,000 to $74,999 | 3,039 (12.1%) | 2,175 (7.0%) |
| $75,000 to $99,999 | 2,446 (9.7%) | 3,890 (12.6%) |
| $100,000 to $149,999 | 4,028 (16.0%) | 4,321 (14.0%) |
| $150,000 or more | 4,697 (18.7%) | 5,424 (17.5%) |
| Total | 25,165 (100.0%) | 30,904 (100.0%) |
Property Value to Household Income Ratio in Miami
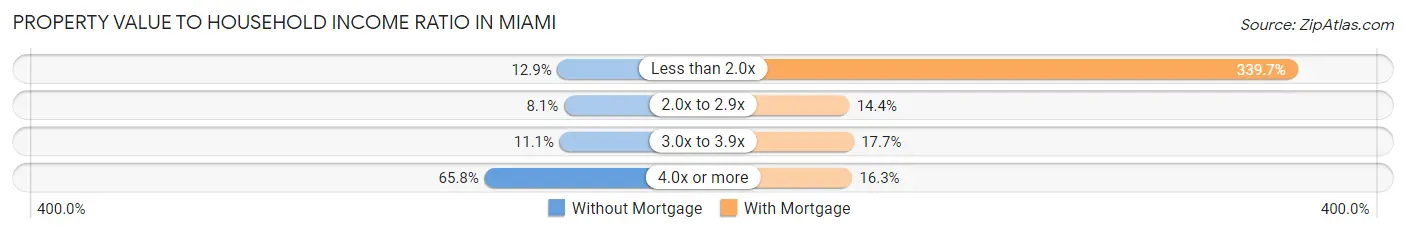
| Value-to-Income Ratio | Without Mortgage | With Mortgage |
| Less than 2.0x | 3,239 (12.9%) | 104,982 (339.7%) |
| 2.0x to 2.9x | 2,046 (8.1%) | 4,453 (14.4%) |
| 3.0x to 3.9x | 2,803 (11.1%) | 5,460 (17.7%) |
| 4.0x or more | 16,569 (65.8%) | 5,051 (16.3%) |
| Total | 25,165 (100.0%) | 30,904 (100.0%) |
Real Estate Taxes by Mortgage Status in Miami
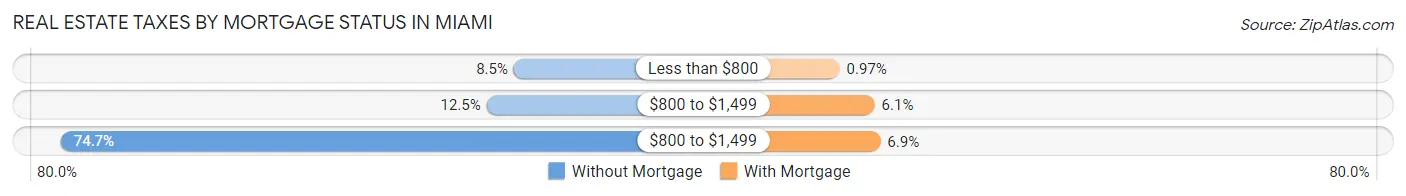
| Property Taxes | Without Mortgage | With Mortgage |
| Less than $800 | 2,143 (8.5%) | 299 (1.0%) |
| $800 to $1,499 | 3,146 (12.5%) | 1,880 (6.1%) |
| $800 to $1,499 | 18,797 (74.7%) | 2,139 (6.9%) |
| Total | 25,165 (100.0%) | 30,904 (100.0%) |
Health & Disability in Miami
Health Insurance Coverage by Age in Miami
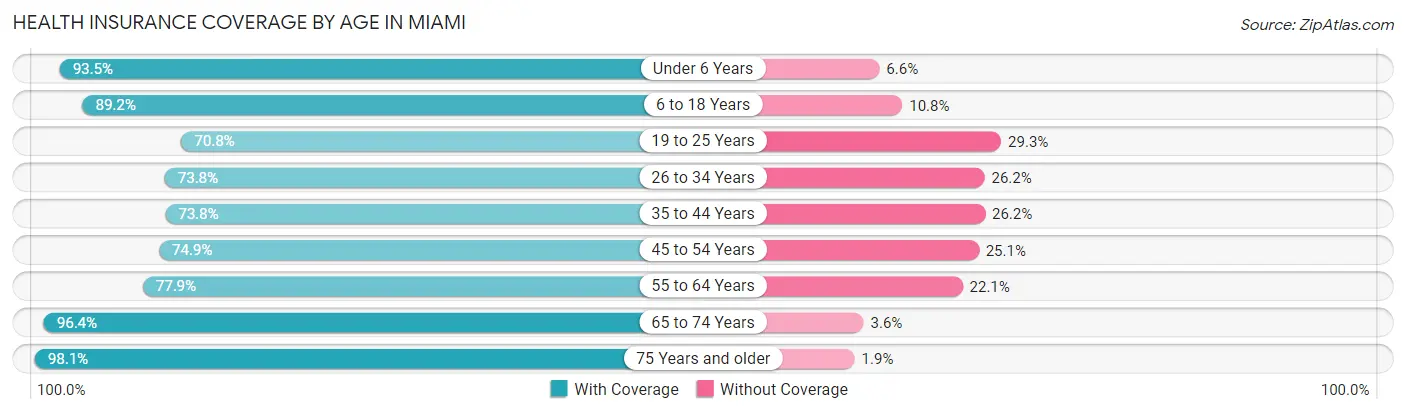
| Age Bracket | With Coverage | Without Coverage |
| Under 6 Years | 26,671 (93.4%) | 1,869 (6.6%) |
| 6 to 18 Years | 43,620 (89.2%) | 5,295 (10.8%) |
| 19 to 25 Years | 24,837 (70.8%) | 10,269 (29.2%) |
| 26 to 34 Years | 53,059 (73.8%) | 18,799 (26.2%) |
| 35 to 44 Years | 49,017 (73.8%) | 17,439 (26.2%) |
| 45 to 54 Years | 45,472 (74.9%) | 15,216 (25.1%) |
| 55 to 64 Years | 43,546 (77.9%) | 12,326 (22.1%) |
| 65 to 74 Years | 34,687 (96.4%) | 1,295 (3.6%) |
| 75 Years and older | 33,406 (98.1%) | 657 (1.9%) |
| Total | 354,315 (81.0%) | 83,165 (19.0%) |
Health Insurance Coverage by Citizenship Status in Miami
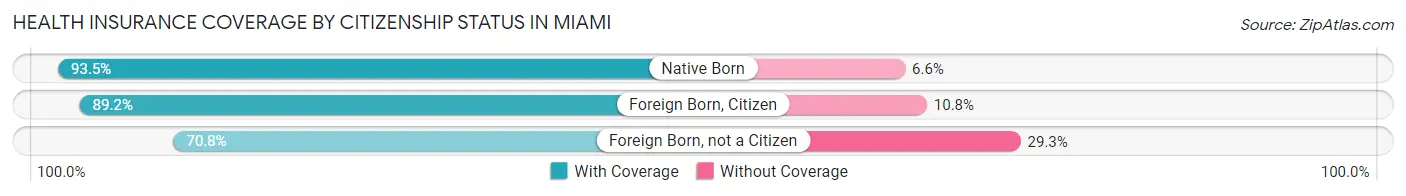
| Citizenship Status | With Coverage | Without Coverage |
| Native Born | 26,671 (93.4%) | 1,869 (6.6%) |
| Foreign Born, Citizen | 43,620 (89.2%) | 5,295 (10.8%) |
| Foreign Born, not a Citizen | 24,837 (70.8%) | 10,269 (29.2%) |
Health Insurance Coverage by Household Income in Miami
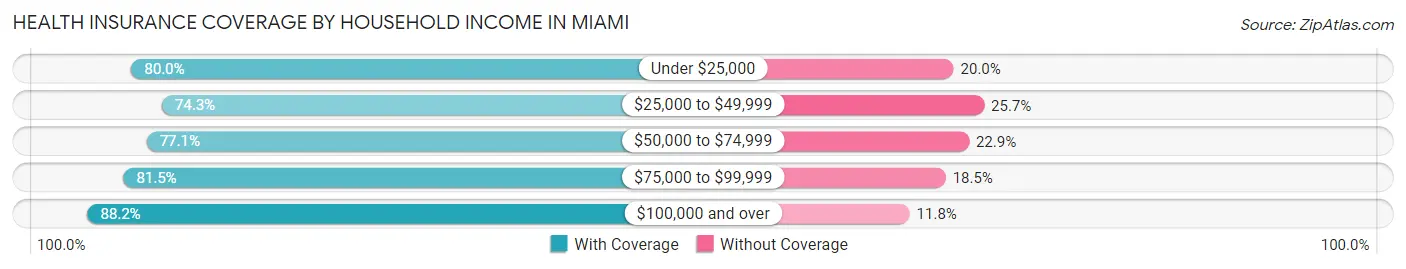
| Household Income | With Coverage | Without Coverage |
| Under $25,000 | 67,234 (80.0%) | 16,824 (20.0%) |
| $25,000 to $49,999 | 63,613 (74.3%) | 22,036 (25.7%) |
| $50,000 to $74,999 | 58,156 (77.1%) | 17,265 (22.9%) |
| $75,000 to $99,999 | 41,811 (81.5%) | 9,510 (18.5%) |
| $100,000 and over | 121,102 (88.2%) | 16,177 (11.8%) |
Public vs Private Health Insurance Coverage by Age in Miami
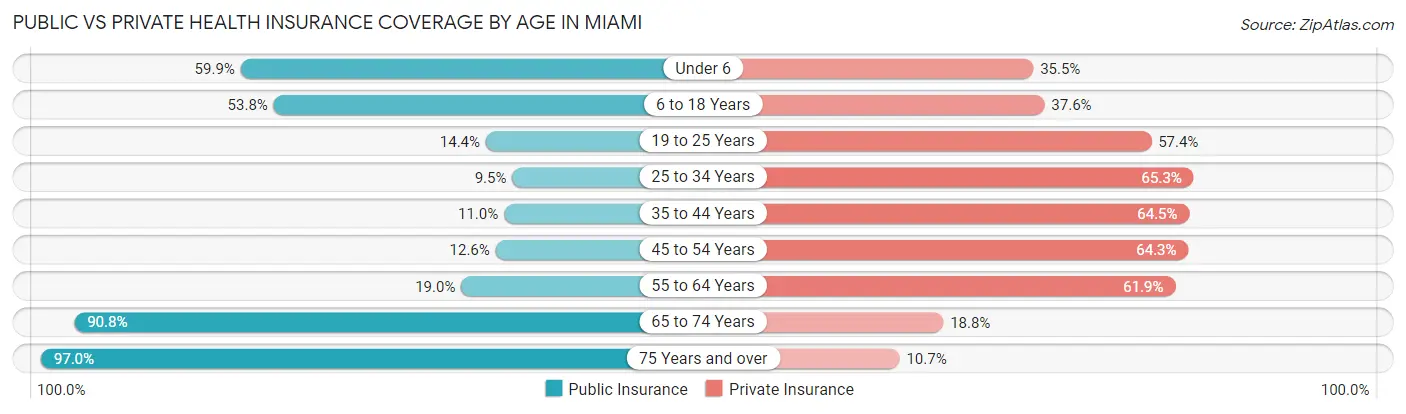
| Age Bracket | Public Insurance | Private Insurance |
| Under 6 | 17,095 (59.9%) | 10,141 (35.5%) |
| 6 to 18 Years | 26,302 (53.8%) | 18,398 (37.6%) |
| 19 to 25 Years | 5,049 (14.4%) | 20,160 (57.4%) |
| 25 to 34 Years | 6,808 (9.5%) | 46,923 (65.3%) |
| 35 to 44 Years | 7,307 (11.0%) | 42,874 (64.5%) |
| 45 to 54 Years | 7,630 (12.6%) | 39,037 (64.3%) |
| 55 to 64 Years | 10,590 (19.0%) | 34,579 (61.9%) |
| 65 to 74 Years | 32,663 (90.8%) | 6,772 (18.8%) |
| 75 Years and over | 33,030 (97.0%) | 3,648 (10.7%) |
| Total | 146,474 (33.5%) | 222,532 (50.9%) |
Disability Status by Sex by Age in Miami
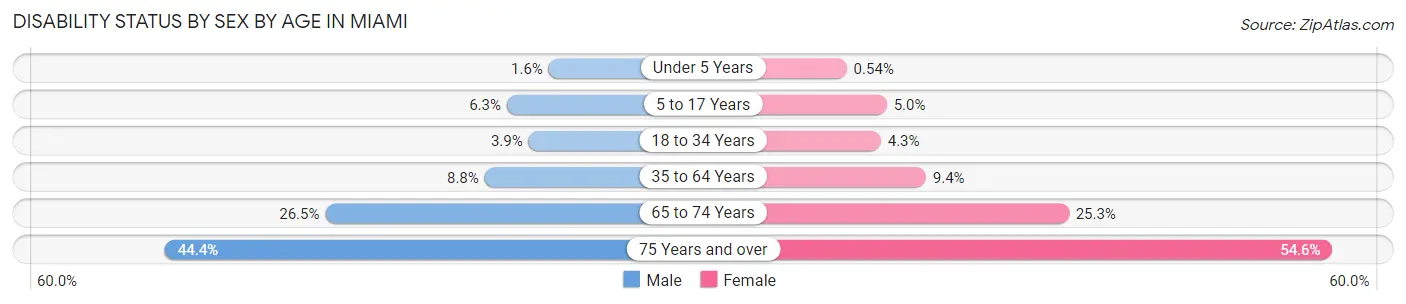
| Age Bracket | Male | Female |
| Under 5 Years | 210 (1.6%) | 63 (0.5%) |
| 5 to 17 Years | 1,592 (6.3%) | 1,175 (5.0%) |
| 18 to 34 Years | 2,228 (3.9%) | 2,325 (4.3%) |
| 35 to 64 Years | 8,368 (8.8%) | 8,196 (9.4%) |
| 65 to 74 Years | 4,339 (26.5%) | 4,957 (25.3%) |
| 75 Years and over | 6,023 (44.4%) | 11,190 (54.6%) |
Disability Class by Sex by Age in Miami
Disability Class: Hearing Difficulty
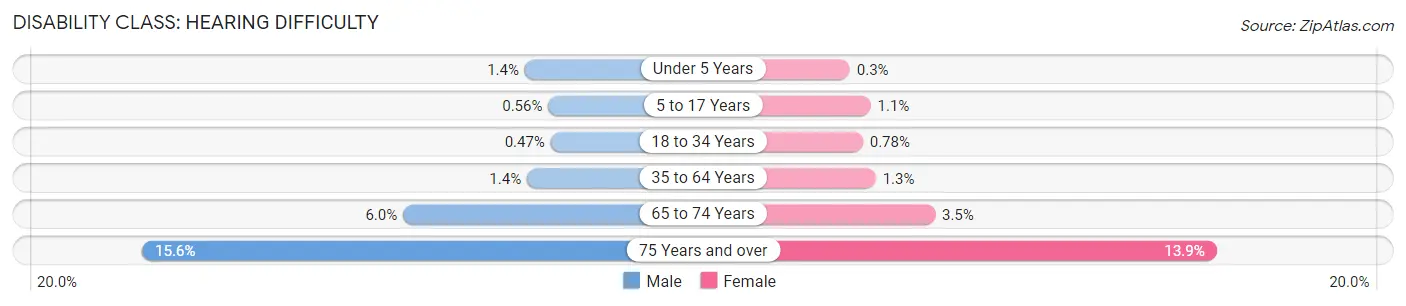
| Age Bracket | Male | Female |
| Under 5 Years | 184 (1.4%) | 35 (0.3%) |
| 5 to 17 Years | 142 (0.6%) | 251 (1.1%) |
| 18 to 34 Years | 271 (0.5%) | 419 (0.8%) |
| 35 to 64 Years | 1,285 (1.3%) | 1,106 (1.3%) |
| 65 to 74 Years | 973 (5.9%) | 678 (3.5%) |
| 75 Years and over | 2,123 (15.6%) | 2,850 (13.9%) |
Disability Class: Vision Difficulty
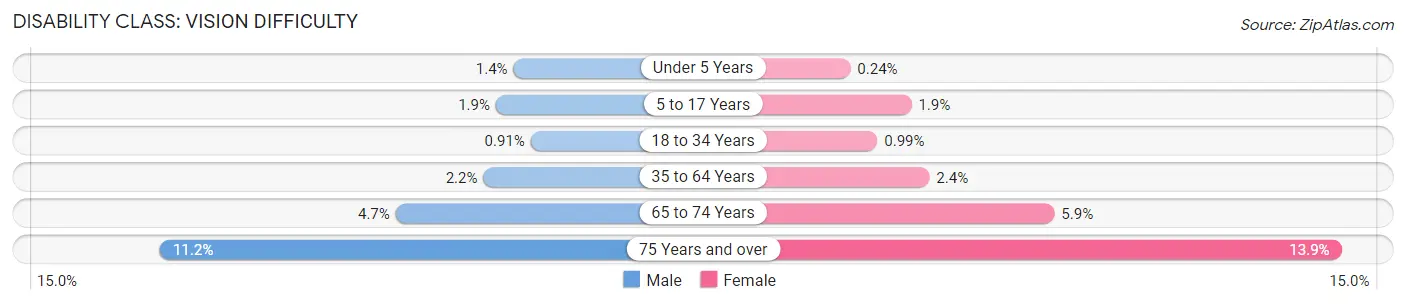
| Age Bracket | Male | Female |
| Under 5 Years | 179 (1.4%) | 28 (0.2%) |
| 5 to 17 Years | 476 (1.9%) | 456 (1.9%) |
| 18 to 34 Years | 524 (0.9%) | 532 (1.0%) |
| 35 to 64 Years | 2,125 (2.2%) | 2,136 (2.4%) |
| 65 to 74 Years | 765 (4.7%) | 1,161 (5.9%) |
| 75 Years and over | 1,525 (11.2%) | 2,850 (13.9%) |
Disability Class: Cognitive Difficulty
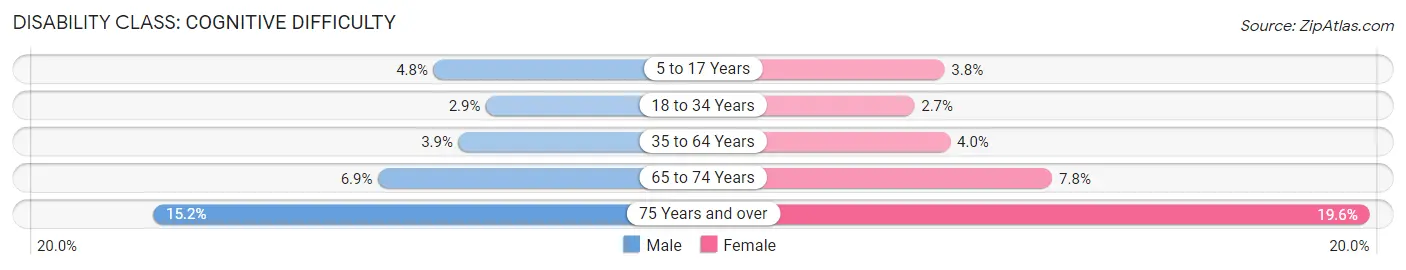
| Age Bracket | Male | Female |
| 5 to 17 Years | 1,216 (4.8%) | 897 (3.8%) |
| 18 to 34 Years | 1,644 (2.9%) | 1,443 (2.7%) |
| 35 to 64 Years | 3,706 (3.9%) | 3,524 (4.0%) |
| 65 to 74 Years | 1,124 (6.9%) | 1,532 (7.8%) |
| 75 Years and over | 2,067 (15.2%) | 4,013 (19.6%) |
Disability Class: Ambulatory Difficulty
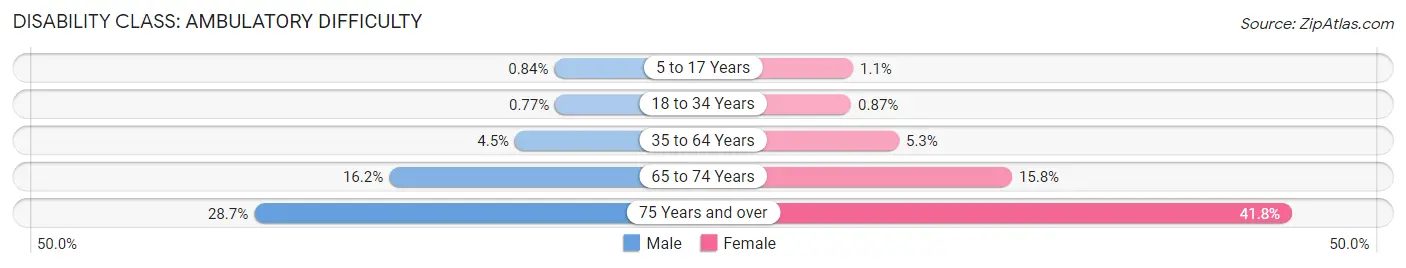
| Age Bracket | Male | Female |
| 5 to 17 Years | 213 (0.8%) | 246 (1.1%) |
| 18 to 34 Years | 441 (0.8%) | 464 (0.9%) |
| 35 to 64 Years | 4,288 (4.5%) | 4,654 (5.3%) |
| 65 to 74 Years | 2,648 (16.2%) | 3,098 (15.8%) |
| 75 Years and over | 3,897 (28.7%) | 8,558 (41.8%) |
Disability Class: Self-Care Difficulty
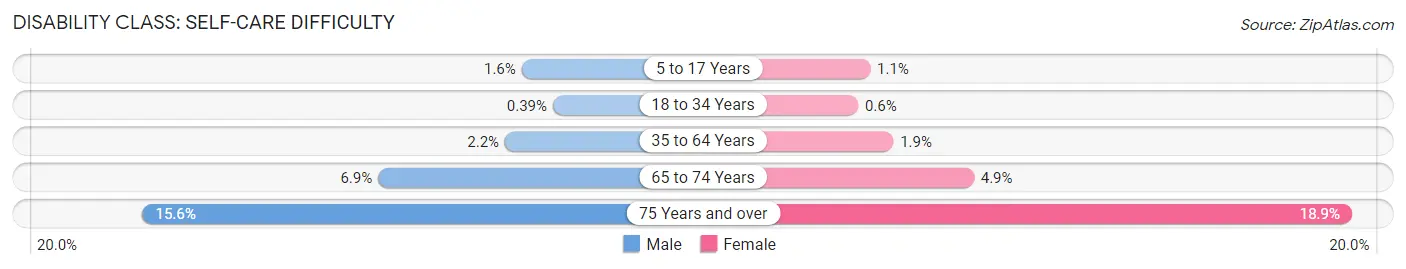
| Age Bracket | Male | Female |
| 5 to 17 Years | 392 (1.5%) | 246 (1.1%) |
| 18 to 34 Years | 227 (0.4%) | 323 (0.6%) |
| 35 to 64 Years | 2,067 (2.2%) | 1,676 (1.9%) |
| 65 to 74 Years | 1,126 (6.9%) | 961 (4.9%) |
| 75 Years and over | 2,121 (15.6%) | 3,878 (18.9%) |
Technology Access in Miami
Computing Device Access in Miami
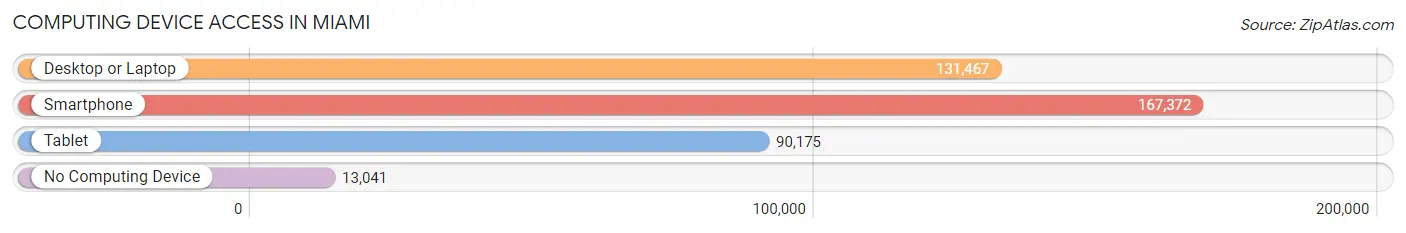
| Device Type | # Households | % Households |
| Desktop or Laptop | 131,467 | 70.6% |
| Smartphone | 167,372 | 89.9% |
| Tablet | 90,175 | 48.4% |
| No Computing Device | 13,041 | 7.0% |
| Total | 186,137 | 100.0% |
Internet Access in Miami
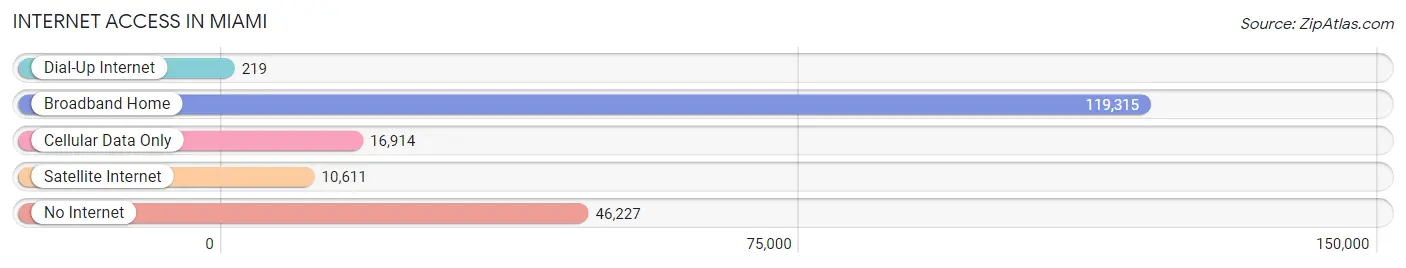
| Internet Type | # Households | % Households |
| Dial-Up Internet | 219 | 0.1% |
| Broadband Home | 119,315 | 64.1% |
| Cellular Data Only | 16,914 | 9.1% |
| Satellite Internet | 10,611 | 5.7% |
| No Internet | 46,227 | 24.8% |
| Total | 186,137 | 100.0% |
Miami Summary
Miami, Florida is a vibrant city located in the southeastern United States. It is the largest city in the state of Florida and the second-largest city in the United States after New York City. Miami is known for its diverse culture, beautiful beaches, and vibrant nightlife.
Geography
Miami is located in the southeastern corner of the state of Florida, on the Atlantic coast. It is bordered by the Everglades to the west, the Florida Keys to the south, and the Atlantic Ocean to the east. The city is situated on the Miami River, which flows into Biscayne Bay. The city is divided into several distinct neighborhoods, including Downtown, Little Havana, Coconut Grove, and South Beach.
History
Miami was founded in 1836 by a group of settlers led by William Brickell. The city was originally called Fort Dallas, but was later renamed Miami after the nearby Miami River. The city grew rapidly in the late 19th and early 20th centuries, becoming a major port and commercial center. In the 1920s, Miami became a popular destination for wealthy Americans, and the city experienced a real estate boom.
In the 1950s, Miami became a major center for Cuban immigrants fleeing the Cuban Revolution. This influx of immigrants transformed the city, and Miami became known as the “Capital of Latin America.” In the 1980s, Miami experienced a major economic boom, becoming a major financial and business center.
Economy
Miami’s economy is largely driven by tourism, international trade, and finance. The city is home to several major corporations, including American Airlines, Burger King, and Carnival Cruise Lines. Miami is also a major center for banking and finance, with several major banks and financial institutions based in the city.
The Port of Miami is one of the busiest ports in the United States, and is a major hub for international trade. Miami International Airport is one of the busiest airports in the world, and is a major hub for international travel.
Demographics
As of 2020, Miami had an estimated population of 478,000. The city is home to a diverse population, with large Hispanic, African American, and Caribbean communities. The city is also home to a large number of immigrants from Latin America, the Caribbean, and other parts of the world.
Miami is a major center for culture and the arts, with several major museums, galleries, and performing arts venues. The city is also home to several professional sports teams, including the Miami Dolphins, Miami Heat, and Miami Marlins.
Conclusion
Miami is a vibrant and diverse city located in the southeastern United States. It is known for its beautiful beaches, vibrant nightlife, and diverse culture. The city’s economy is largely driven by tourism, international trade, and finance. Miami is home to a diverse population, with large Hispanic, African American, and Caribbean communities. The city is also a major center for culture and the arts, with several major museums, galleries, and performing arts venues.
Common Questions
What is Per Capita Income in Miami?
Per Capita income in Miami is $39,055.
What is the Median Family Income in Miami?
Median Family Income in Miami is $59,015.
What is the Median Household income in Miami?
Median Household Income in Miami is $54,858.
What is Income or Wage Gap in Miami?
Income or Wage Gap in Miami is 23.7%.
Women in Miami earn 76.3 cents for every dollar earned by a man.
What is Family Income Deficit in Miami?
Family Income Deficit in Miami is $8,763.
Families that are below poverty line in Miami earn $8,763 less on average than the poverty threshold level.
What is Inequality or Gini Index in Miami?
Inequality or Gini Index in Miami is 0.55.
What is the Total Population of Miami?
Total Population of Miami is 443,665.
What is the Total Male Population of Miami?
Total Male Population of Miami is 225,318.
What is the Total Female Population of Miami?
Total Female Population of Miami is 218,347.
What is the Ratio of Males per 100 Females in Miami?
There are 103.19 Males per 100 Females in Miami.
What is the Ratio of Females per 100 Males in Miami?
There are 96.91 Females per 100 Males in Miami.
What is the Median Population Age in Miami?
Median Population Age in Miami is 39.7 Years.
What is the Average Family Size in Miami
Average Family Size in Miami is 3.1 People.
What is the Average Household Size in Miami
Average Household Size in Miami is 2.3 People.
How Large is the Labor Force in Miami?
There are 248,631 People in the Labor Forcein in Miami.
What is the Percentage of People in the Labor Force in Miami?
65.8% of People are in the Labor Force in Miami.
What is the Unemployment Rate in Miami?
Unemployment Rate in Miami is 5.0%.