West Palm Beach, FL Map & Demographics
West Palm Beach Map
West Palm Beach Overview
$41,610
PER CAPITA INCOME
$75,211
AVG FAMILY INCOME
$64,044
AVG HOUSEHOLD INCOME
23.5%
WAGE / INCOME GAP [ % ]
76.5¢/ $1
WAGE / INCOME GAP [ $ ]
$10,343
FAMILY INCOME DEFICIT
0.51
INEQUALITY / GINI INDEX
117,588
TOTAL POPULATION
56,854
MALE POPULATION
60,734
FEMALE POPULATION
93.61
MALES / 100 FEMALES
106.82
FEMALES / 100 MALES
40.2
MEDIAN AGE
3.1
AVG FAMILY SIZE
2.3
AVG HOUSEHOLD SIZE
62,516
LABOR FORCE [ PEOPLE ]
63.0%
PERCENT IN LABOR FORCE
6.2%
UNEMPLOYMENT RATE
West Palm Beach Zip Codes
West Palm Beach Area Codes
Income in West Palm Beach
Income Overview in West Palm Beach
Per Capita Income in West Palm Beach is $41,610, while median incomes of families and households are $75,211 and $64,044 respectively.
| Characteristic | Number | Measure |
| Per Capita Income | 117,588 | $41,610 |
| Median Family Income | 26,164 | $75,211 |
| Mean Family Income | 26,164 | $110,830 |
| Median Household Income | 49,348 | $64,044 |
| Mean Household Income | 49,348 | $94,255 |
| Income Deficit | 26,164 | $10,343 |
| Wage / Income Gap (%) | 117,588 | 23.48% |
| Wage / Income Gap ($) | 117,588 | 76.52¢ per $1 |
| Gini / Inequality Index | 117,588 | 0.51 |
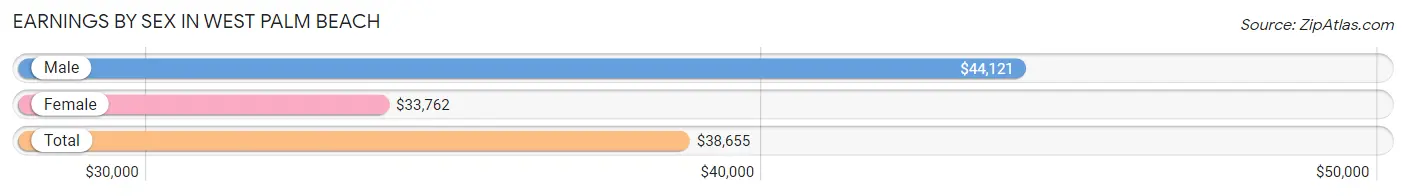
Earnings by Sex in West Palm Beach
Average Earnings in West Palm Beach are $38,655, $44,121 for men and $33,762 for women, a difference of 23.5%.
| Sex | Number | Average Earnings |
| Male | 32,841 (51.6%) | $44,121 |
| Female | 30,839 (48.4%) | $33,762 |
| Total | 63,680 (100.0%) | $38,655 |
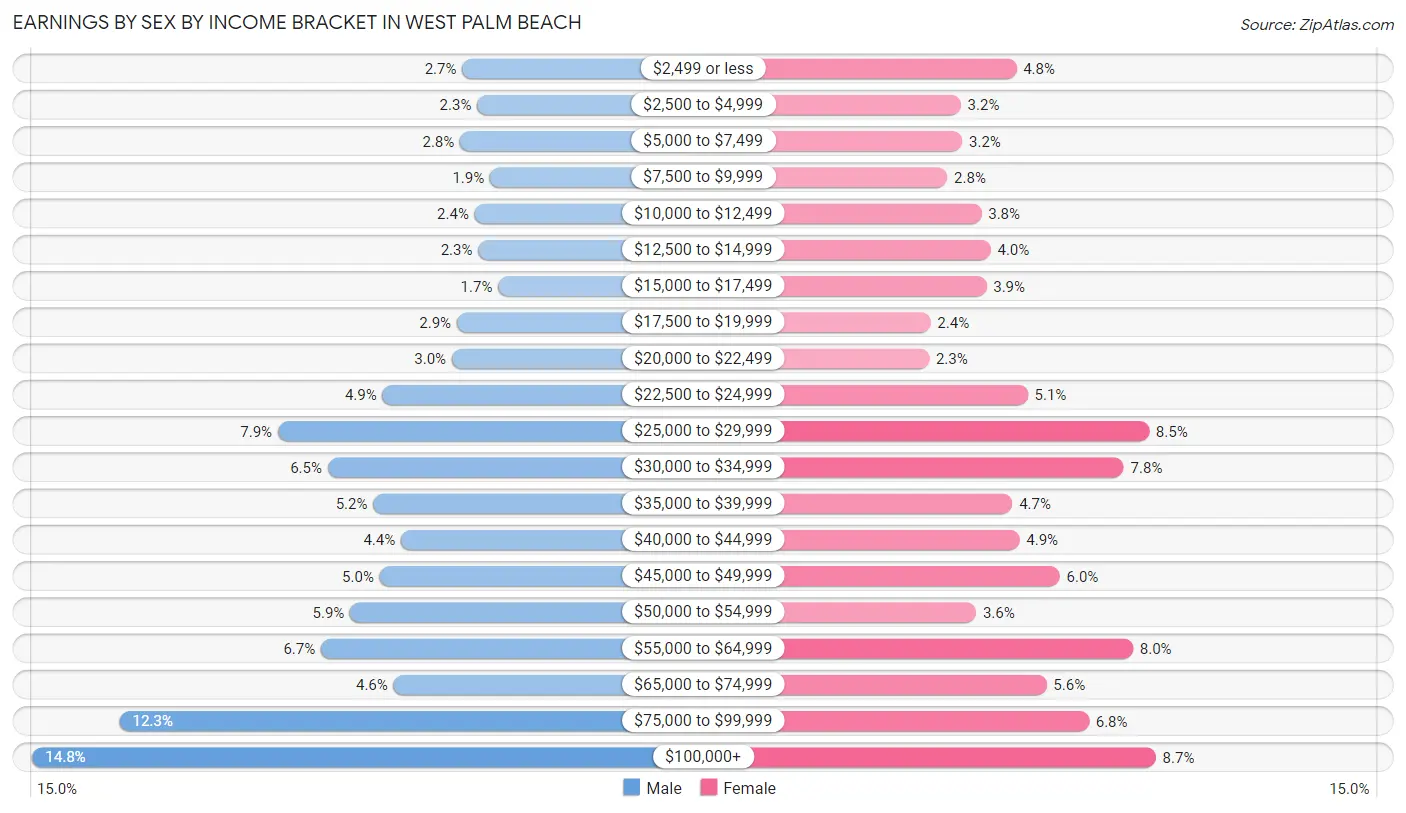
Earnings by Sex by Income Bracket in West Palm Beach
The most common earnings brackets in West Palm Beach are $100,000+ for men (4,854 | 14.8%) and $100,000+ for women (2,676 | 8.7%).
| Income | Male | Female |
| $2,499 or less | 887 (2.7%) | 1,468 (4.8%) |
| $2,500 to $4,999 | 750 (2.3%) | 988 (3.2%) |
| $5,000 to $7,499 | 907 (2.8%) | 1,000 (3.2%) |
| $7,500 to $9,999 | 631 (1.9%) | 870 (2.8%) |
| $10,000 to $12,499 | 773 (2.4%) | 1,167 (3.8%) |
| $12,500 to $14,999 | 738 (2.2%) | 1,245 (4.0%) |
| $15,000 to $17,499 | 554 (1.7%) | 1,210 (3.9%) |
| $17,500 to $19,999 | 937 (2.9%) | 724 (2.4%) |
| $20,000 to $22,499 | 983 (3.0%) | 711 (2.3%) |
| $22,500 to $24,999 | 1,621 (4.9%) | 1,566 (5.1%) |
| $25,000 to $29,999 | 2,587 (7.9%) | 2,618 (8.5%) |
| $30,000 to $34,999 | 2,128 (6.5%) | 2,398 (7.8%) |
| $35,000 to $39,999 | 1,709 (5.2%) | 1,434 (4.6%) |
| $40,000 to $44,999 | 1,451 (4.4%) | 1,497 (4.9%) |
| $45,000 to $49,999 | 1,649 (5.0%) | 1,844 (6.0%) |
| $50,000 to $54,999 | 1,920 (5.9%) | 1,119 (3.6%) |
| $55,000 to $64,999 | 2,191 (6.7%) | 2,478 (8.0%) |
| $65,000 to $74,999 | 1,521 (4.6%) | 1,730 (5.6%) |
| $75,000 to $99,999 | 4,050 (12.3%) | 2,096 (6.8%) |
| $100,000+ | 4,854 (14.8%) | 2,676 (8.7%) |
| Total | 32,841 (100.0%) | 30,839 (100.0%) |
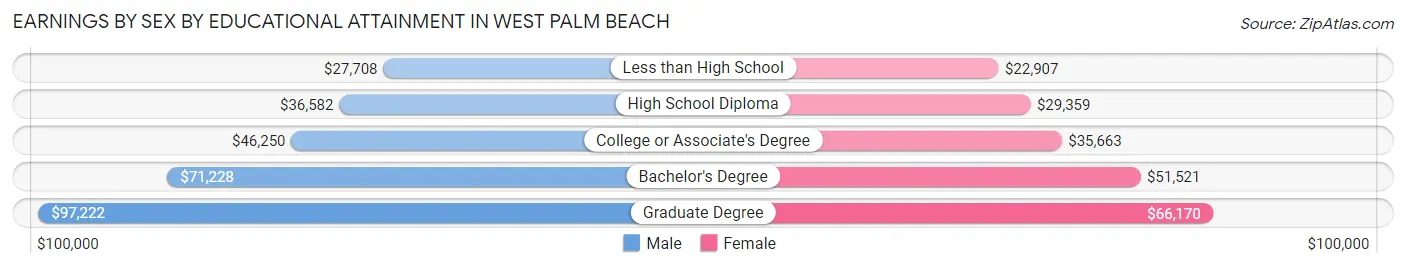
Earnings by Sex by Educational Attainment in West Palm Beach
Average earnings in West Palm Beach are $47,883 for men and $39,066 for women, a difference of 18.4%. Men with an educational attainment of graduate degree enjoy the highest average annual earnings of $97,222, while those with less than high school education earn the least with $27,708. Women with an educational attainment of graduate degree earn the most with the average annual earnings of $66,170, while those with less than high school education have the smallest earnings of $22,907.
| Educational Attainment | Male Income | Female Income |
| Less than High School | $27,708 | $22,907 |
| High School Diploma | $36,582 | $29,359 |
| College or Associate's Degree | $46,250 | $35,663 |
| Bachelor's Degree | $71,228 | $51,521 |
| Graduate Degree | $97,222 | $66,170 |
| Total | $47,883 | $39,066 |
Family Income in West Palm Beach
Family Income Brackets in West Palm Beach
According to the West Palm Beach family income data, there are 4,683 families falling into the $100,000 to $149,999 income range, which is the most common income bracket and makes up 17.9% of all families. Conversely, the $10,000 to $14,999 income bracket is the least frequent group with only 680 families (2.6%) belonging to this category.
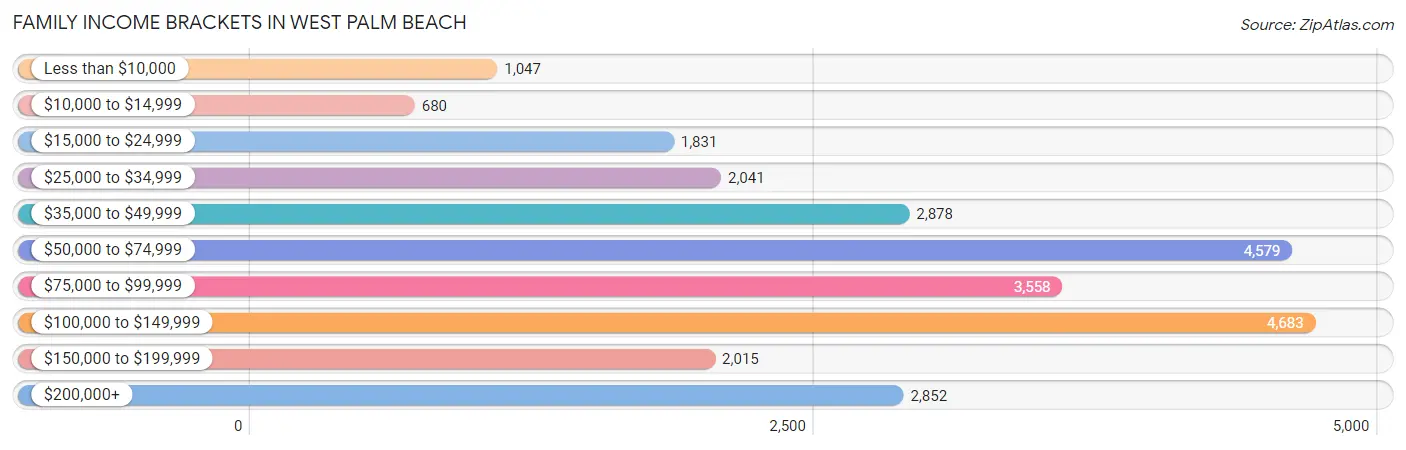
| Income Bracket | # Families | % Families |
| Less than $10,000 | 1,047 | 4.0% |
| $10,000 to $14,999 | 680 | 2.6% |
| $15,000 to $24,999 | 1,831 | 7.0% |
| $25,000 to $34,999 | 2,041 | 7.8% |
| $35,000 to $49,999 | 2,878 | 11.0% |
| $50,000 to $74,999 | 4,579 | 17.5% |
| $75,000 to $99,999 | 3,558 | 13.6% |
| $100,000 to $149,999 | 4,683 | 17.9% |
| $150,000 to $199,999 | 2,015 | 7.7% |
| $200,000+ | 2,852 | 10.9% |
Family Income by Famaliy Size in West Palm Beach
7+ person families (200 | 0.8%) account for the highest median family income in West Palm Beach with $105,813 per family, while 2-person families (14,056 | 53.7%) have the highest median income of $37,670 per family member.
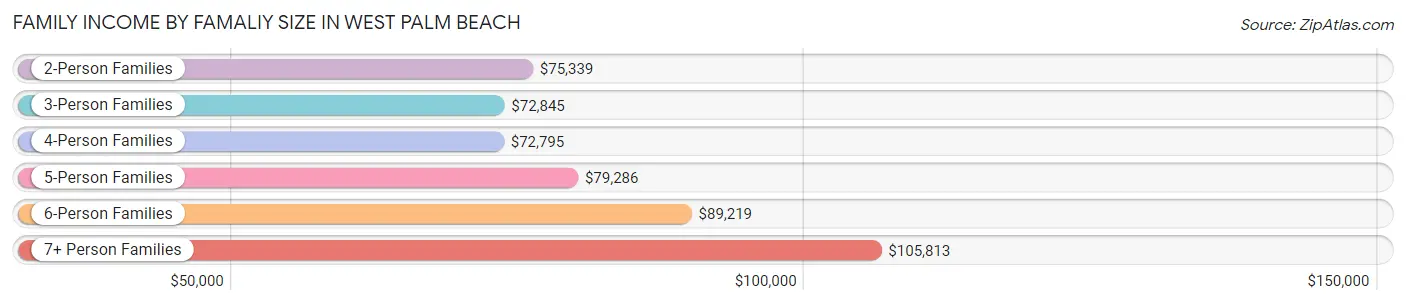
| Income Bracket | # Families | Median Income |
| 2-Person Families | 14,056 (53.7%) | $75,339 |
| 3-Person Families | 6,025 (23.0%) | $72,845 |
| 4-Person Families | 3,399 (13.0%) | $72,795 |
| 5-Person Families | 1,682 (6.4%) | $79,286 |
| 6-Person Families | 802 (3.1%) | $89,219 |
| 7+ Person Families | 200 (0.8%) | $105,813 |
| Total | 26,164 (100.0%) | $75,211 |
Family Income by Number of Earners in West Palm Beach
The median family income in West Palm Beach is $75,211, with families comprising 3+ earners (2,248) having the highest median family income of $100,815, while families with no earners (4,456) have the lowest median family income of $42,299, accounting for 8.6% and 17.0% of families, respectively.
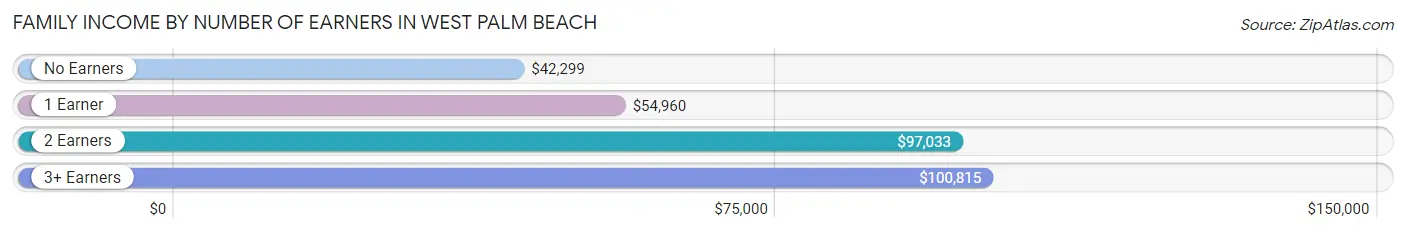
| Number of Earners | # Families | Median Income |
| No Earners | 4,456 (17.0%) | $42,299 |
| 1 Earner | 9,469 (36.2%) | $54,960 |
| 2 Earners | 9,991 (38.2%) | $97,033 |
| 3+ Earners | 2,248 (8.6%) | $100,815 |
| Total | 26,164 (100.0%) | $75,211 |
Household Income in West Palm Beach
Household Income Brackets in West Palm Beach
With 8,833 households falling in the category, the $50,000 to $74,999 income range is the most frequent in West Palm Beach, accounting for 17.9% of all households. In contrast, only 1,974 households (4.0%) fall into the $10,000 to $14,999 income bracket, making it the least populous group.
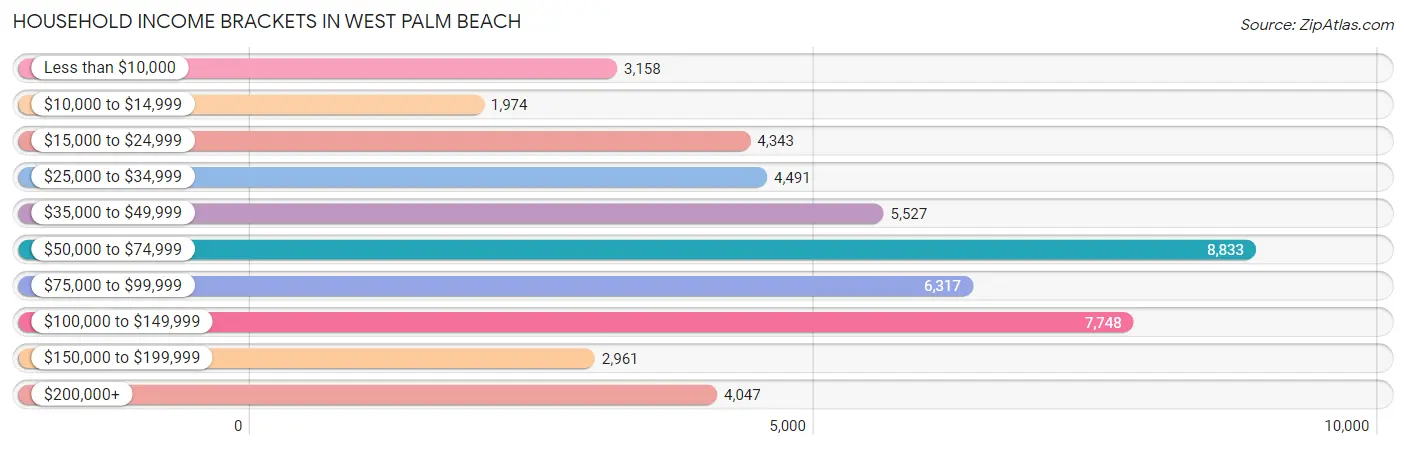
| Income Bracket | # Households | % Households |
| Less than $10,000 | 3,158 | 6.4% |
| $10,000 to $14,999 | 1,974 | 4.0% |
| $15,000 to $24,999 | 4,343 | 8.8% |
| $25,000 to $34,999 | 4,491 | 9.1% |
| $35,000 to $49,999 | 5,527 | 11.2% |
| $50,000 to $74,999 | 8,833 | 17.9% |
| $75,000 to $99,999 | 6,317 | 12.8% |
| $100,000 to $149,999 | 7,748 | 15.7% |
| $150,000 to $199,999 | 2,961 | 6.0% |
| $200,000+ | 4,047 | 8.2% |
Household Income by Householder Age in West Palm Beach
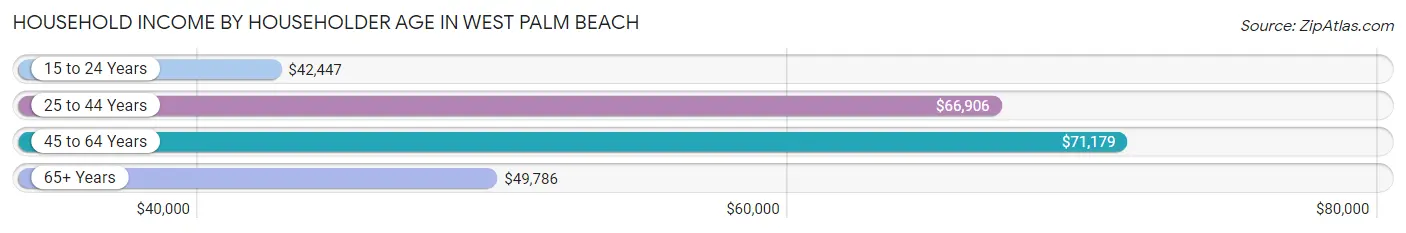
The median household income in West Palm Beach is $64,044, with the highest median household income of $71,179 found in the 45 to 64 years age bracket for the primary householder. A total of 16,252 households (32.9%) fall into this category. Meanwhile, the 15 to 24 years age bracket for the primary householder has the lowest median household income of $42,447, with 1,704 households (3.5%) in this group.
| Income Bracket | # Households | Median Income |
| 15 to 24 Years | 1,704 (3.5%) | $42,447 |
| 25 to 44 Years | 16,574 (33.6%) | $66,906 |
| 45 to 64 Years | 16,252 (32.9%) | $71,179 |
| 65+ Years | 14,818 (30.0%) | $49,786 |
| Total | 49,348 (100.0%) | $64,044 |
Poverty in West Palm Beach
Income Below Poverty by Sex and Age in West Palm Beach
With 14.1% poverty level for males and 17.7% for females among the residents of West Palm Beach, under 5 year old males and 15 year old females are the most vulnerable to poverty, with 1,149 males (35.7%) and 351 females (58.2%) in their respective age groups living below the poverty level.
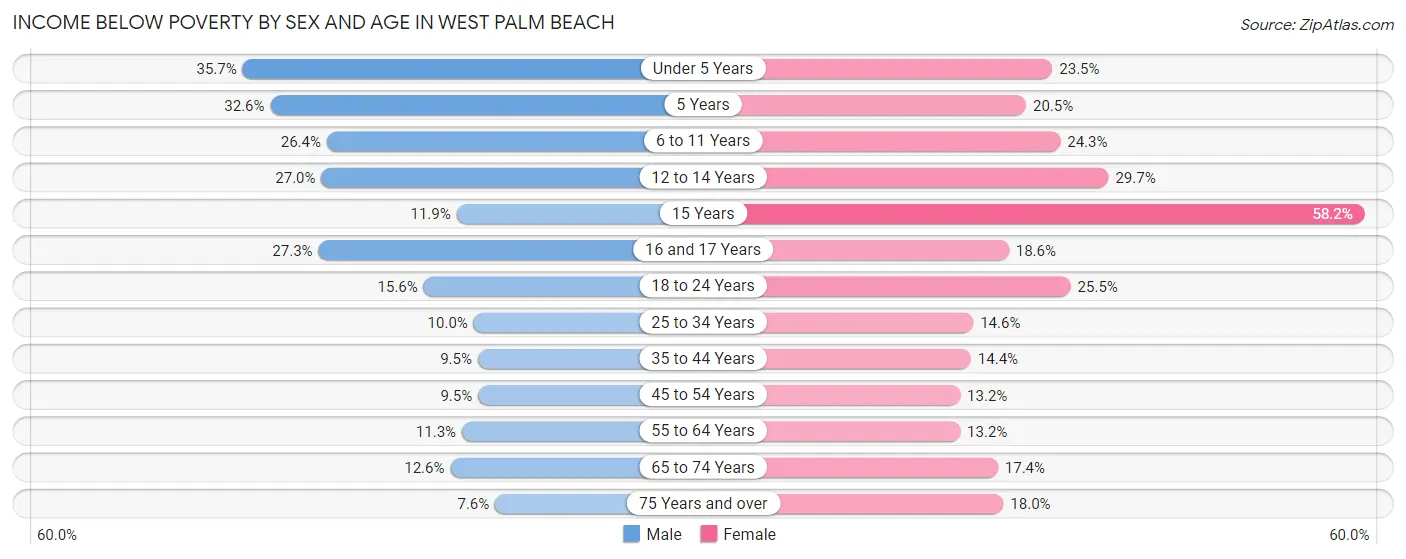
| Age Bracket | Male | Female |
| Under 5 Years | 1,149 (35.7%) | 792 (23.4%) |
| 5 Years | 216 (32.6%) | 87 (20.5%) |
| 6 to 11 Years | 853 (26.4%) | 580 (24.3%) |
| 12 to 14 Years | 398 (27.0%) | 450 (29.7%) |
| 15 Years | 92 (11.9%) | 351 (58.2%) |
| 16 and 17 Years | 344 (27.3%) | 196 (18.6%) |
| 18 to 24 Years | 711 (15.6%) | 1,273 (25.5%) |
| 25 to 34 Years | 931 (10.0%) | 1,353 (14.6%) |
| 35 to 44 Years | 719 (9.5%) | 1,020 (14.4%) |
| 45 to 54 Years | 659 (9.5%) | 972 (13.2%) |
| 55 to 64 Years | 737 (11.3%) | 1,018 (13.2%) |
| 65 to 74 Years | 634 (12.6%) | 1,208 (17.4%) |
| 75 Years and over | 335 (7.6%) | 1,045 (18.0%) |
| Total | 7,778 (14.1%) | 10,345 (17.7%) |
Income Above Poverty by Sex and Age in West Palm Beach
According to the poverty statistics in West Palm Beach, males aged 75 years and over and females aged 45 to 54 years are the age groups that are most secure financially, with 92.4% of males and 86.8% of females in these age groups living above the poverty line.
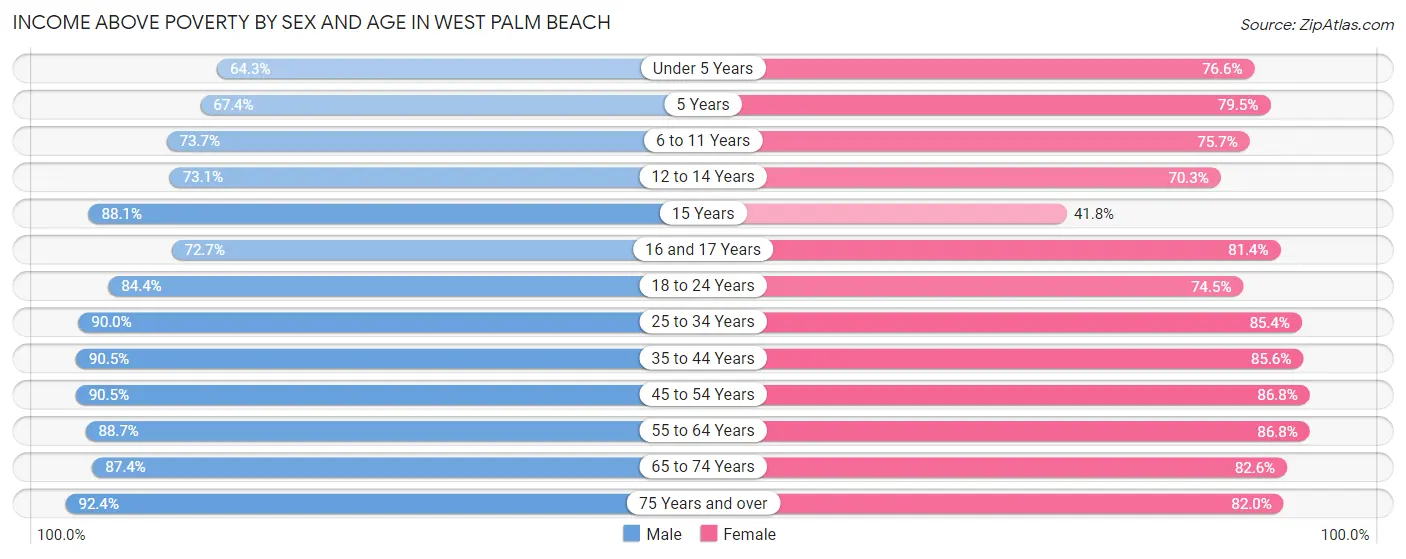
| Age Bracket | Male | Female |
| Under 5 Years | 2,067 (64.3%) | 2,586 (76.5%) |
| 5 Years | 446 (67.4%) | 337 (79.5%) |
| 6 to 11 Years | 2,384 (73.7%) | 1,804 (75.7%) |
| 12 to 14 Years | 1,079 (73.1%) | 1,065 (70.3%) |
| 15 Years | 682 (88.1%) | 252 (41.8%) |
| 16 and 17 Years | 917 (72.7%) | 858 (81.4%) |
| 18 to 24 Years | 3,858 (84.4%) | 3,721 (74.5%) |
| 25 to 34 Years | 8,386 (90.0%) | 7,888 (85.4%) |
| 35 to 44 Years | 6,827 (90.5%) | 6,074 (85.6%) |
| 45 to 54 Years | 6,277 (90.5%) | 6,402 (86.8%) |
| 55 to 64 Years | 5,787 (88.7%) | 6,705 (86.8%) |
| 65 to 74 Years | 4,401 (87.4%) | 5,744 (82.6%) |
| 75 Years and over | 4,071 (92.4%) | 4,761 (82.0%) |
| Total | 47,182 (85.9%) | 48,197 (82.3%) |
Income Below Poverty Among Married-Couple Families in West Palm Beach
The poverty statistics for married-couple families in West Palm Beach show that 5.9% or 950 of the total 16,032 families live below the poverty line. Families with 3 or 4 children have the highest poverty rate of 25.5%, comprising of 192 families. On the other hand, families with 5 or more children have the lowest poverty rate of 0.0%, which includes 0 families.
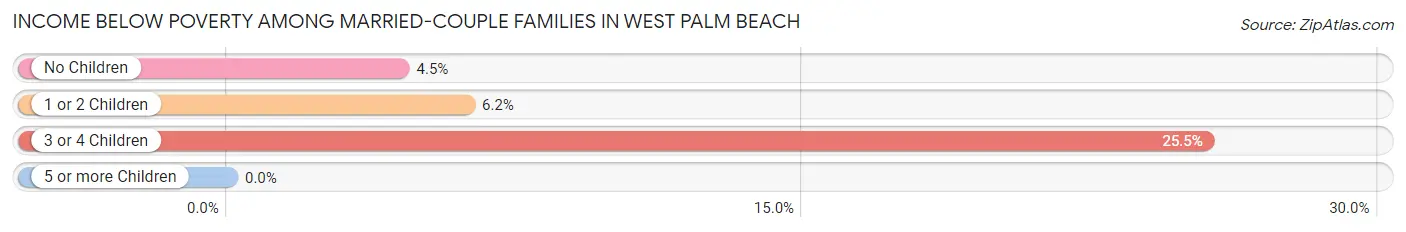
| Children | Above Poverty | Below Poverty |
| No Children | 10,372 (95.5%) | 486 (4.5%) |
| 1 or 2 Children | 4,123 (93.8%) | 272 (6.2%) |
| 3 or 4 Children | 561 (74.5%) | 192 (25.5%) |
| 5 or more Children | 26 (100.0%) | 0 (0.0%) |
| Total | 15,082 (94.1%) | 950 (5.9%) |
Income Below Poverty Among Single-Parent Households in West Palm Beach
According to the poverty data in West Palm Beach, 13.9% or 485 single-father households and 26.8% or 1,780 single-mother households are living below the poverty line. Among single-father households, those with 3 or 4 children have the highest poverty rate, with 222 households (53.7%) experiencing poverty. Likewise, among single-mother households, those with 3 or 4 children have the highest poverty rate, with 342 households (57.3%) falling below the poverty line.
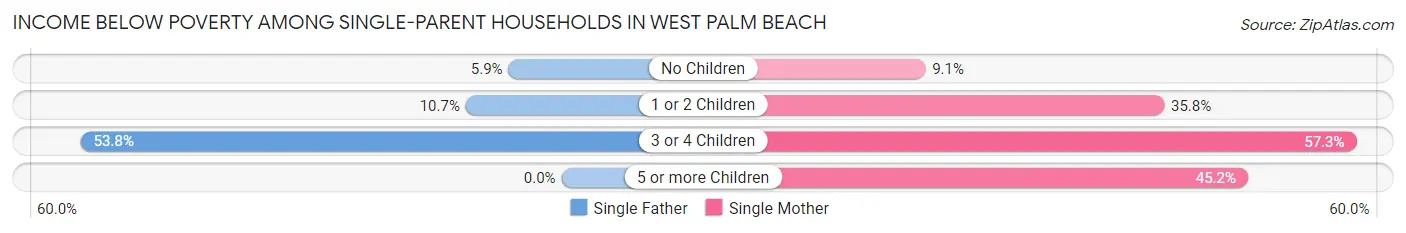
| Children | Single Father | Single Mother |
| No Children | 81 (5.9%) | 251 (9.1%) |
| 1 or 2 Children | 182 (10.7%) | 1,159 (35.8%) |
| 3 or 4 Children | 222 (53.7%) | 342 (57.3%) |
| 5 or more Children | 0 (0.0%) | 28 (45.2%) |
| Total | 485 (13.9%) | 1,780 (26.8%) |
Income Below Poverty Among Married-Couple vs Single-Parent Households in West Palm Beach
The poverty data for West Palm Beach shows that 950 of the married-couple family households (5.9%) and 2,265 of the single-parent households (22.4%) are living below the poverty level. Within the married-couple family households, those with 3 or 4 children have the highest poverty rate, with 192 households (25.5%) falling below the poverty line. Among the single-parent households, those with 3 or 4 children have the highest poverty rate, with 564 household (55.8%) living below poverty.
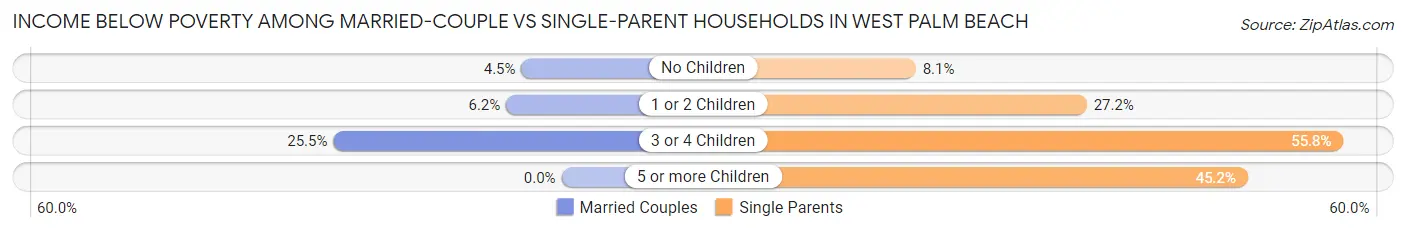
| Children | Married-Couple Families | Single-Parent Households |
| No Children | 486 (4.5%) | 332 (8.1%) |
| 1 or 2 Children | 272 (6.2%) | 1,341 (27.2%) |
| 3 or 4 Children | 192 (25.5%) | 564 (55.8%) |
| 5 or more Children | 0 (0.0%) | 28 (45.2%) |
| Total | 950 (5.9%) | 2,265 (22.4%) |
Race in West Palm Beach
The most populous races in West Palm Beach are White / Caucasian (56,731 | 48.2%), Black / African American (37,945 | 32.3%), and Hispanic or Latino (29,005 | 24.7%).
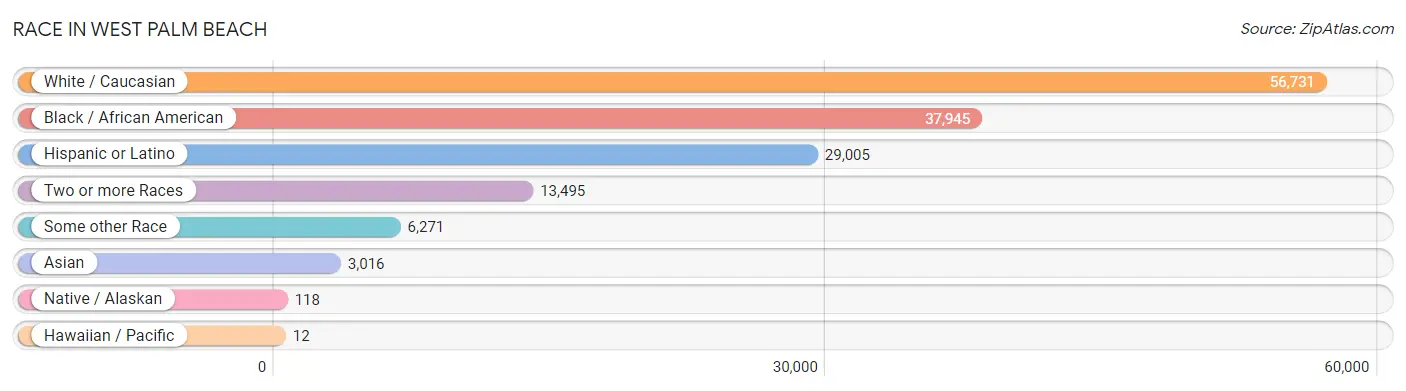
| Race | # Population | % Population |
| Asian | 3,016 | 2.6% |
| Black / African American | 37,945 | 32.3% |
| Hawaiian / Pacific | 12 | 0.0% |
| Hispanic or Latino | 29,005 | 24.7% |
| Native / Alaskan | 118 | 0.1% |
| White / Caucasian | 56,731 | 48.2% |
| Two or more Races | 13,495 | 11.5% |
| Some other Race | 6,271 | 5.3% |
| Total | 117,588 | 100.0% |
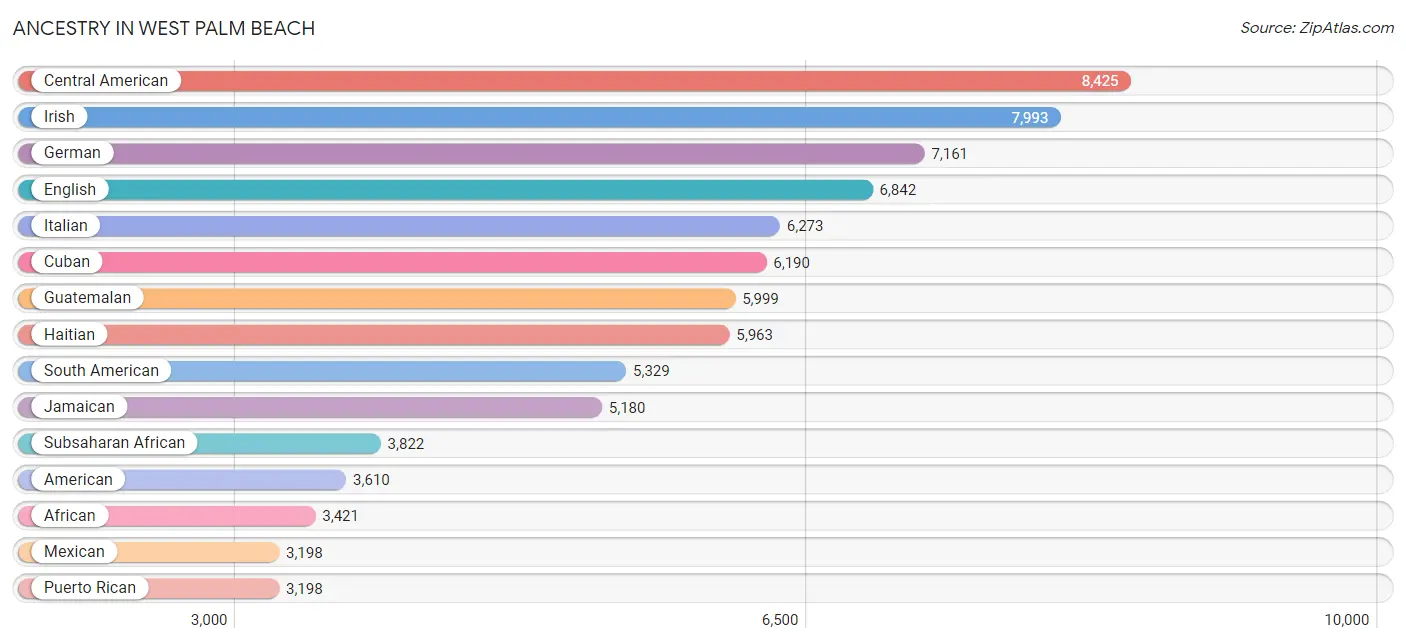
Ancestry in West Palm Beach
The most populous ancestries reported in West Palm Beach are Central American (8,425 | 7.2%), Irish (7,993 | 6.8%), German (7,161 | 6.1%), English (6,842 | 5.8%), and Italian (6,273 | 5.3%), together accounting for 31.2% of all West Palm Beach residents.
| Ancestry | # Population | % Population |
| African | 3,421 | 2.9% |
| Albanian | 80 | 0.1% |
| American | 3,610 | 3.1% |
| Apache | 8 | 0.0% |
| Arab | 984 | 0.8% |
| Argentinean | 363 | 0.3% |
| Armenian | 24 | 0.0% |
| Australian | 10 | 0.0% |
| Austrian | 496 | 0.4% |
| Bahamian | 370 | 0.3% |
| Barbadian | 180 | 0.2% |
| Belgian | 149 | 0.1% |
| Belizean | 12 | 0.0% |
| Bermudan | 16 | 0.0% |
| Bhutanese | 78 | 0.1% |
| Blackfeet | 42 | 0.0% |
| Bolivian | 82 | 0.1% |
| Brazilian | 397 | 0.3% |
| British | 490 | 0.4% |
| British West Indian | 83 | 0.1% |
| Bulgarian | 54 | 0.1% |
| Burmese | 293 | 0.3% |
| Canadian | 180 | 0.2% |
| Central American | 8,425 | 7.2% |
| Central American Indian | 151 | 0.1% |
| Cherokee | 16 | 0.0% |
| Cheyenne | 28 | 0.0% |
| Chilean | 346 | 0.3% |
| Chippewa | 22 | 0.0% |
| Colombian | 1,781 | 1.5% |
| Costa Rican | 218 | 0.2% |
| Croatian | 86 | 0.1% |
| Cuban | 6,190 | 5.3% |
| Czech | 103 | 0.1% |
| Czechoslovakian | 49 | 0.0% |
| Danish | 276 | 0.2% |
| Dominican | 1,248 | 1.1% |
| Dutch | 587 | 0.5% |
| Eastern European | 388 | 0.3% |
| Ecuadorian | 997 | 0.9% |
| Egyptian | 170 | 0.1% |
| English | 6,842 | 5.8% |
| Estonian | 7 | 0.0% |
| European | 887 | 0.7% |
| Finnish | 237 | 0.2% |
| French | 2,107 | 1.8% |
| French Canadian | 465 | 0.4% |
| German | 7,161 | 6.1% |
| Ghanaian | 172 | 0.2% |
| Greek | 403 | 0.3% |
| Guatemalan | 5,999 | 5.1% |
| Guyanese | 125 | 0.1% |
| Haitian | 5,963 | 5.1% |
| Honduran | 695 | 0.6% |
| Hungarian | 610 | 0.5% |
| Indian (Asian) | 685 | 0.6% |
| Iranian | 100 | 0.1% |
| Irish | 7,993 | 6.8% |
| Israeli | 86 | 0.1% |
| Italian | 6,273 | 5.3% |
| Jamaican | 5,180 | 4.4% |
| Jordanian | 161 | 0.1% |
| Korean | 790 | 0.7% |
| Laotian | 117 | 0.1% |
| Latvian | 167 | 0.1% |
| Lebanese | 438 | 0.4% |
| Lithuanian | 583 | 0.5% |
| Lumbee | 5 | 0.0% |
| Macedonian | 126 | 0.1% |
| Maltese | 54 | 0.1% |
| Mexican | 3,198 | 2.7% |
| Mongolian | 5 | 0.0% |
| Moroccan | 110 | 0.1% |
| Native Hawaiian | 12 | 0.0% |
| New Zealander | 10 | 0.0% |
| Nicaraguan | 950 | 0.8% |
| Nigerian | 155 | 0.1% |
| Northern European | 108 | 0.1% |
| Norwegian | 570 | 0.5% |
| Pakistani | 153 | 0.1% |
| Palestinian | 18 | 0.0% |
| Panamanian | 217 | 0.2% |
| Paraguayan | 17 | 0.0% |
| Pennsylvania German | 23 | 0.0% |
| Peruvian | 1,287 | 1.1% |
| Polish | 2,558 | 2.2% |
| Portuguese | 393 | 0.3% |
| Puerto Rican | 3,198 | 2.7% |
| Romanian | 272 | 0.2% |
| Russian | 2,309 | 2.0% |
| Salvadoran | 346 | 0.3% |
| Scandinavian | 88 | 0.1% |
| Scotch-Irish | 634 | 0.5% |
| Scottish | 1,508 | 1.3% |
| Seminole | 17 | 0.0% |
| Serbian | 45 | 0.0% |
| Sioux | 24 | 0.0% |
| Slavic | 9 | 0.0% |
| Slovak | 139 | 0.1% |
| Slovene | 9 | 0.0% |
| South African | 40 | 0.0% |
| South American | 5,329 | 4.5% |
| Spaniard | 320 | 0.3% |
| Spanish | 206 | 0.2% |
| Sri Lankan | 145 | 0.1% |
| Subsaharan African | 3,822 | 3.3% |
| Swedish | 353 | 0.3% |
| Swiss | 86 | 0.1% |
| Syrian | 54 | 0.1% |
| Thai | 887 | 0.7% |
| Trinidadian and Tobagonian | 128 | 0.1% |
| Turkish | 101 | 0.1% |
| U.S. Virgin Islander | 45 | 0.0% |
| Ukrainian | 612 | 0.5% |
| Uruguayan | 135 | 0.1% |
| Venezuelan | 282 | 0.2% |
| Vietnamese | 36 | 0.0% |
| Welsh | 275 | 0.2% |
| West Indian | 183 | 0.2% |
| Yugoslavian | 148 | 0.1% | View All 120 Rows |
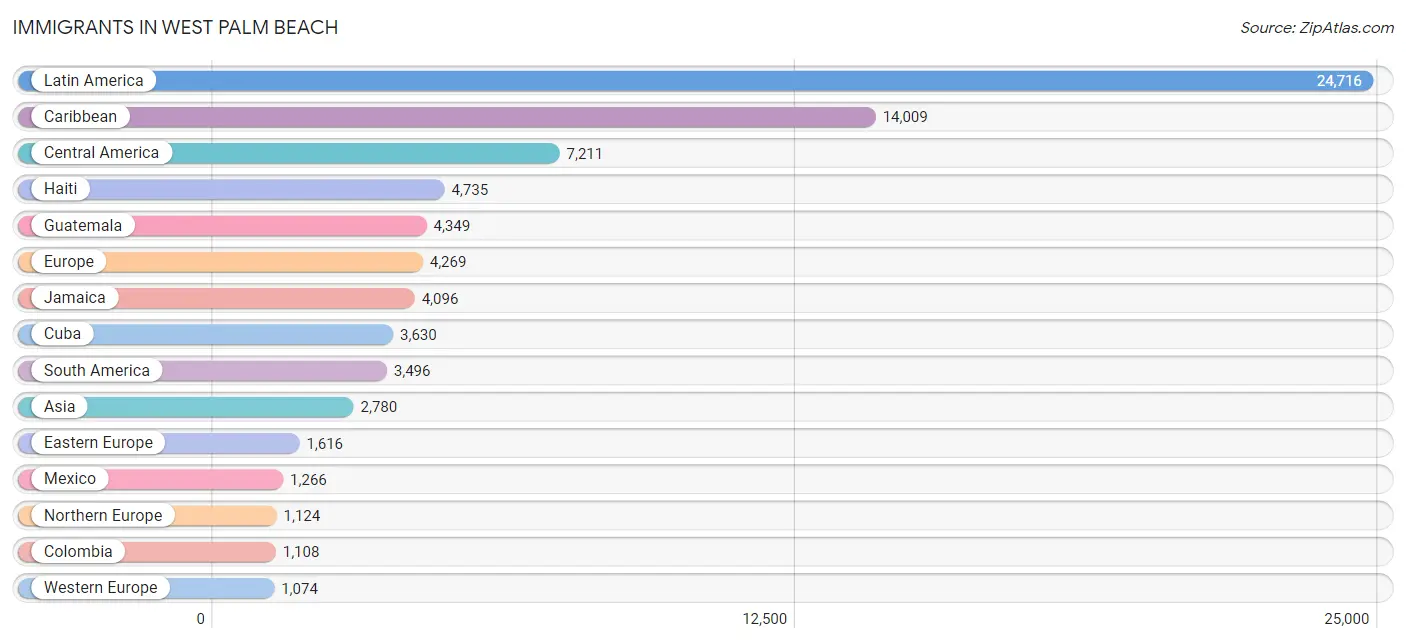
Immigrants in West Palm Beach
The most numerous immigrant groups reported in West Palm Beach came from Latin America (24,716 | 21.0%), Caribbean (14,009 | 11.9%), Central America (7,211 | 6.1%), Haiti (4,735 | 4.0%), and Guatemala (4,349 | 3.7%), together accounting for 46.8% of all West Palm Beach residents.
| Immigration Origin | # Population | % Population |
| Africa | 624 | 0.5% |
| Argentina | 202 | 0.2% |
| Asia | 2,780 | 2.4% |
| Austria | 100 | 0.1% |
| Azores | 25 | 0.0% |
| Bahamas | 125 | 0.1% |
| Bangladesh | 35 | 0.0% |
| Barbados | 267 | 0.2% |
| Belgium | 71 | 0.1% |
| Belize | 12 | 0.0% |
| Bolivia | 47 | 0.0% |
| Bosnia and Herzegovina | 36 | 0.0% |
| Brazil | 267 | 0.2% |
| Bulgaria | 25 | 0.0% |
| Canada | 608 | 0.5% |
| Caribbean | 14,009 | 11.9% |
| Central America | 7,211 | 6.1% |
| Chile | 243 | 0.2% |
| China | 500 | 0.4% |
| Colombia | 1,108 | 0.9% |
| Costa Rica | 124 | 0.1% |
| Croatia | 17 | 0.0% |
| Cuba | 3,630 | 3.1% |
| Czechoslovakia | 95 | 0.1% |
| Denmark | 16 | 0.0% |
| Dominica | 36 | 0.0% |
| Dominican Republic | 628 | 0.5% |
| Eastern Africa | 25 | 0.0% |
| Eastern Asia | 767 | 0.6% |
| Eastern Europe | 1,616 | 1.4% |
| Ecuador | 421 | 0.4% |
| Egypt | 149 | 0.1% |
| El Salvador | 333 | 0.3% |
| England | 725 | 0.6% |
| Europe | 4,269 | 3.6% |
| France | 289 | 0.3% |
| Germany | 482 | 0.4% |
| Ghana | 144 | 0.1% |
| Greece | 58 | 0.1% |
| Grenada | 18 | 0.0% |
| Guatemala | 4,349 | 3.7% |
| Guyana | 189 | 0.2% |
| Haiti | 4,735 | 4.0% |
| Honduras | 478 | 0.4% |
| Hong Kong | 21 | 0.0% |
| Hungary | 54 | 0.1% |
| India | 436 | 0.4% |
| Indonesia | 116 | 0.1% |
| Iran | 80 | 0.1% |
| Iraq | 58 | 0.1% |
| Ireland | 28 | 0.0% |
| Israel | 146 | 0.1% |
| Italy | 94 | 0.1% |
| Jamaica | 4,096 | 3.5% |
| Japan | 71 | 0.1% |
| Jordan | 103 | 0.1% |
| Kazakhstan | 18 | 0.0% |
| Kenya | 25 | 0.0% |
| Korea | 196 | 0.2% |
| Latin America | 24,716 | 21.0% |
| Latvia | 74 | 0.1% |
| Lebanon | 72 | 0.1% |
| Liberia | 22 | 0.0% |
| Lithuania | 185 | 0.2% |
| Malaysia | 5 | 0.0% |
| Mexico | 1,266 | 1.1% |
| Moldova | 21 | 0.0% |
| Morocco | 76 | 0.1% |
| Nepal | 39 | 0.0% |
| Netherlands | 112 | 0.1% |
| Nicaragua | 567 | 0.5% |
| Nigeria | 25 | 0.0% |
| North Macedonia | 51 | 0.0% |
| Northern Africa | 225 | 0.2% |
| Northern Europe | 1,124 | 1.0% |
| Norway | 89 | 0.1% |
| Oceania | 62 | 0.1% |
| Pakistan | 139 | 0.1% |
| Panama | 82 | 0.1% |
| Peru | 639 | 0.5% |
| Philippines | 428 | 0.4% |
| Poland | 234 | 0.2% |
| Portugal | 35 | 0.0% |
| Romania | 54 | 0.1% |
| Russia | 183 | 0.2% |
| Scotland | 17 | 0.0% |
| Serbia | 53 | 0.1% |
| South Africa | 170 | 0.1% |
| South America | 3,496 | 3.0% |
| South Central Asia | 777 | 0.7% |
| South Eastern Asia | 802 | 0.7% |
| Southern Europe | 455 | 0.4% |
| Spain | 268 | 0.2% |
| St. Vincent and the Grenadines | 18 | 0.0% |
| Sweden | 86 | 0.1% |
| Switzerland | 20 | 0.0% |
| Syria | 15 | 0.0% |
| Taiwan | 67 | 0.1% |
| Thailand | 130 | 0.1% |
| Trinidad and Tobago | 185 | 0.2% |
| Turkey | 13 | 0.0% |
| Ukraine | 379 | 0.3% |
| Uruguay | 135 | 0.1% |
| Uzbekistan | 15 | 0.0% |
| Venezuela | 245 | 0.2% |
| Vietnam | 123 | 0.1% |
| West Indies | 16 | 0.0% |
| Western Africa | 191 | 0.2% |
| Western Asia | 434 | 0.4% |
| Western Europe | 1,074 | 0.9% | View All 110 Rows |
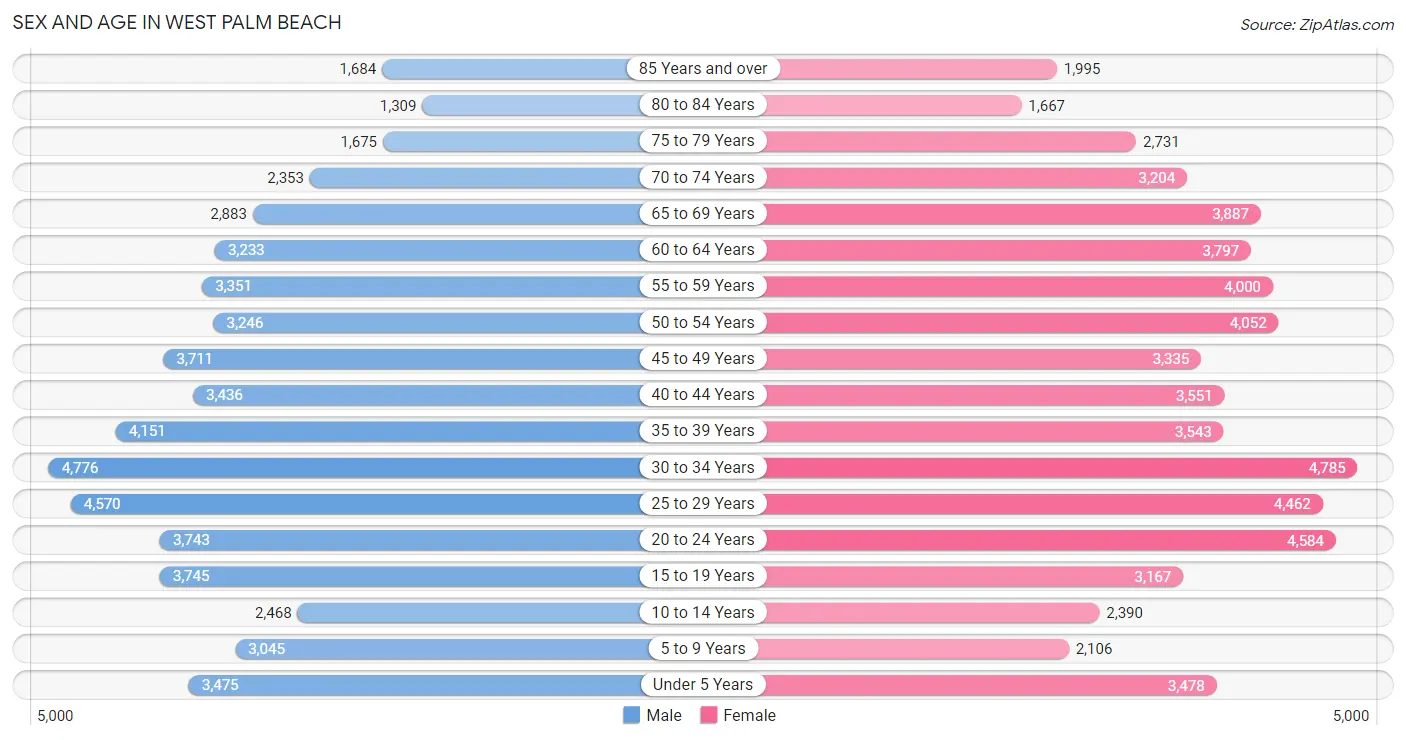
Sex and Age in West Palm Beach
Sex and Age in West Palm Beach
The most populous age groups in West Palm Beach are 30 to 34 Years (4,776 | 8.4%) for men and 30 to 34 Years (4,785 | 7.9%) for women.
| Age Bracket | Male | Female |
| Under 5 Years | 3,475 (6.1%) | 3,478 (5.7%) |
| 5 to 9 Years | 3,045 (5.4%) | 2,106 (3.5%) |
| 10 to 14 Years | 2,468 (4.3%) | 2,390 (3.9%) |
| 15 to 19 Years | 3,745 (6.6%) | 3,167 (5.2%) |
| 20 to 24 Years | 3,743 (6.6%) | 4,584 (7.5%) |
| 25 to 29 Years | 4,570 (8.0%) | 4,462 (7.3%) |
| 30 to 34 Years | 4,776 (8.4%) | 4,785 (7.9%) |
| 35 to 39 Years | 4,151 (7.3%) | 3,543 (5.8%) |
| 40 to 44 Years | 3,436 (6.0%) | 3,551 (5.9%) |
| 45 to 49 Years | 3,711 (6.5%) | 3,335 (5.5%) |
| 50 to 54 Years | 3,246 (5.7%) | 4,052 (6.7%) |
| 55 to 59 Years | 3,351 (5.9%) | 4,000 (6.6%) |
| 60 to 64 Years | 3,233 (5.7%) | 3,797 (6.2%) |
| 65 to 69 Years | 2,883 (5.1%) | 3,887 (6.4%) |
| 70 to 74 Years | 2,353 (4.1%) | 3,204 (5.3%) |
| 75 to 79 Years | 1,675 (2.9%) | 2,731 (4.5%) |
| 80 to 84 Years | 1,309 (2.3%) | 1,667 (2.7%) |
| 85 Years and over | 1,684 (3.0%) | 1,995 (3.3%) |
| Total | 56,854 (100.0%) | 60,734 (100.0%) |
Families and Households in West Palm Beach
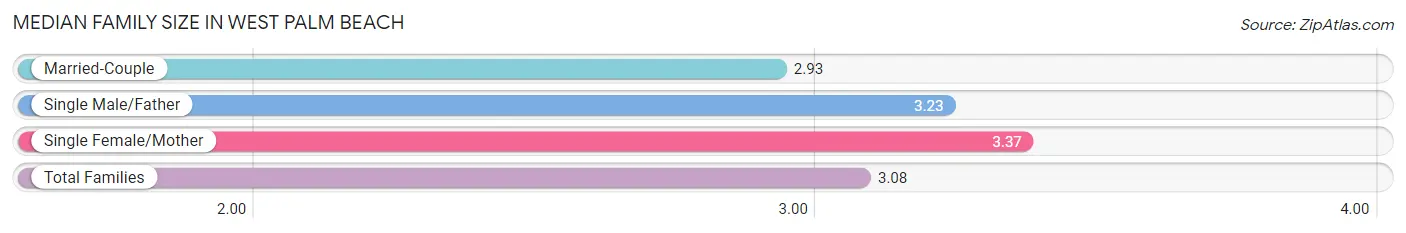
Median Family Size in West Palm Beach
The median family size in West Palm Beach is 3.08 persons per family, with single female/mother families (6,652 | 25.4%) accounting for the largest median family size of 3.37 persons per family. On the other hand, married-couple families (16,032 | 61.3%) represent the smallest median family size with 2.93 persons per family.
| Family Type | # Families | Family Size |
| Married-Couple | 16,032 (61.3%) | 2.93 |
| Single Male/Father | 3,480 (13.3%) | 3.23 |
| Single Female/Mother | 6,652 (25.4%) | 3.37 |
| Total Families | 26,164 (100.0%) | 3.08 |
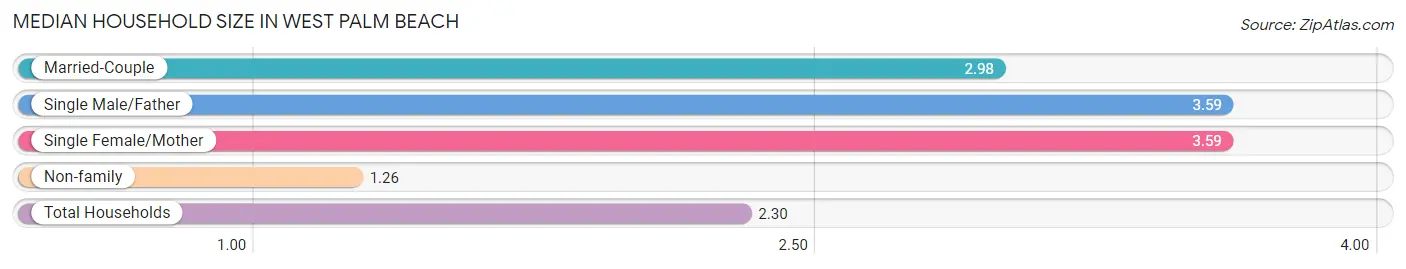
Median Household Size in West Palm Beach
The median household size in West Palm Beach is 2.30 persons per household, with single male/father households (3,480 | 7.0%) accounting for the largest median household size of 3.59 persons per household. non-family households (23,184 | 47.0%) represent the smallest median household size with 1.26 persons per household.
| Household Type | # Households | Household Size |
| Married-Couple | 16,032 (32.5%) | 2.98 |
| Single Male/Father | 3,480 (7.0%) | 3.59 |
| Single Female/Mother | 6,652 (13.5%) | 3.59 |
| Non-family | 23,184 (47.0%) | 1.26 |
| Total Households | 49,348 (100.0%) | 2.30 |
Household Size by Marriage Status in West Palm Beach
Out of a total of 49,348 households in West Palm Beach, 26,164 (53.0%) are family households, while 23,184 (47.0%) are nonfamily households. The most numerous type of family households are 2-person households, comprising 12,839, and the most common type of nonfamily households are 1-person households, comprising 18,829.
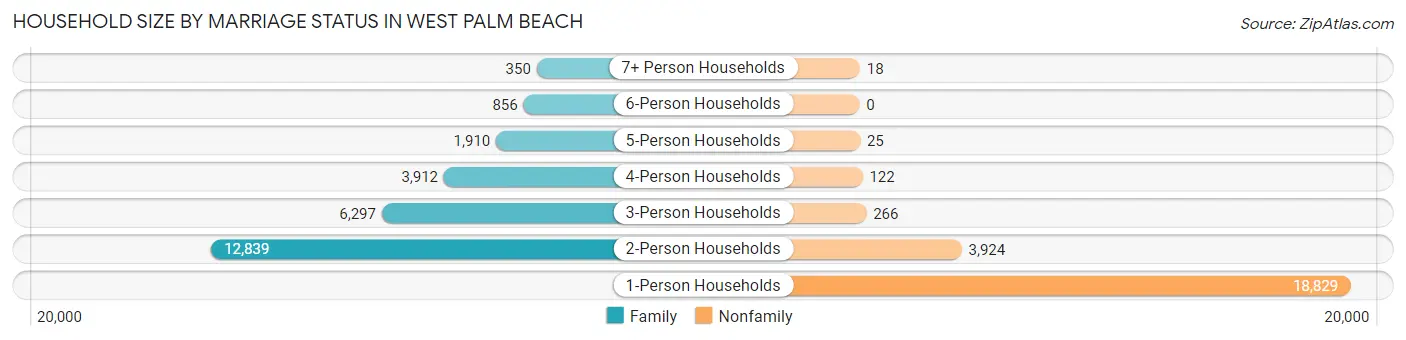
| Household Size | Family Households | Nonfamily Households |
| 1-Person Households | - | 18,829 (38.2%) |
| 2-Person Households | 12,839 (26.0%) | 3,924 (8.0%) |
| 3-Person Households | 6,297 (12.8%) | 266 (0.5%) |
| 4-Person Households | 3,912 (7.9%) | 122 (0.3%) |
| 5-Person Households | 1,910 (3.9%) | 25 (0.1%) |
| 6-Person Households | 856 (1.7%) | 0 (0.0%) |
| 7+ Person Households | 350 (0.7%) | 18 (0.0%) |
| Total | 26,164 (53.0%) | 23,184 (47.0%) |
Female Fertility in West Palm Beach
Fertility by Age in West Palm Beach
Average fertility rate in West Palm Beach is 62.0 births per 1,000 women. Women in the age bracket of 20 to 34 years have the highest fertility rate with 78.0 births per 1,000 women. Women in the age bracket of 20 to 34 years acount for 62.0% of all women with births.
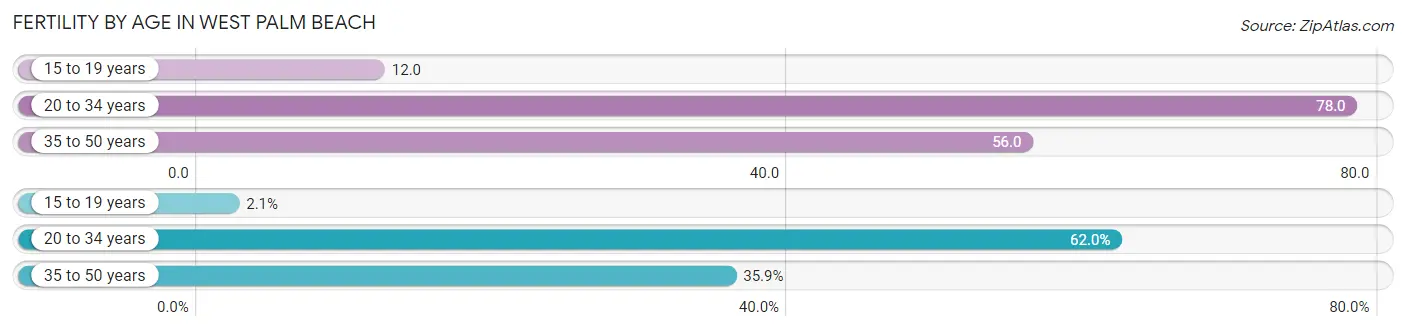
| Age Bracket | Women with Births | Births / 1,000 Women |
| 15 to 19 years | 37 (2.1%) | 12.0 |
| 20 to 34 years | 1,083 (62.0%) | 78.0 |
| 35 to 50 years | 626 (35.8%) | 56.0 |
| Total | 1,746 (100.0%) | 62.0 |
Fertility by Age by Marriage Status in West Palm Beach
56.8% of women with births (1,746) in West Palm Beach are married. The highest percentage of unmarried women with births falls into 15 to 19 years age bracket with 100.0% of them unmarried at the time of birth, while the lowest percentage of unmarried women with births belong to 35 to 50 years age bracket with 15.8% of them unmarried.
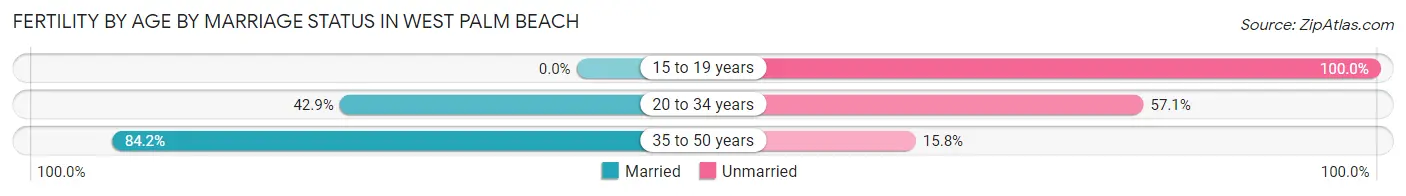
| Age Bracket | Married | Unmarried |
| 15 to 19 years | 0 (0.0%) | 37 (100.0%) |
| 20 to 34 years | 465 (42.9%) | 618 (57.1%) |
| 35 to 50 years | 527 (84.2%) | 99 (15.8%) |
| Total | 992 (56.8%) | 754 (43.2%) |
Fertility by Education in West Palm Beach
Average fertility rate in West Palm Beach is 62.0 births per 1,000 women. Women with the education attainment of high school diploma have the highest fertility rate of 95.0 births per 1,000 women, while women with the education attainment of bachelor's degree have the lowest fertility at 32.0 births per 1,000 women. Women with the education attainment of college or associate's degree represent 34.1% of all women with births.
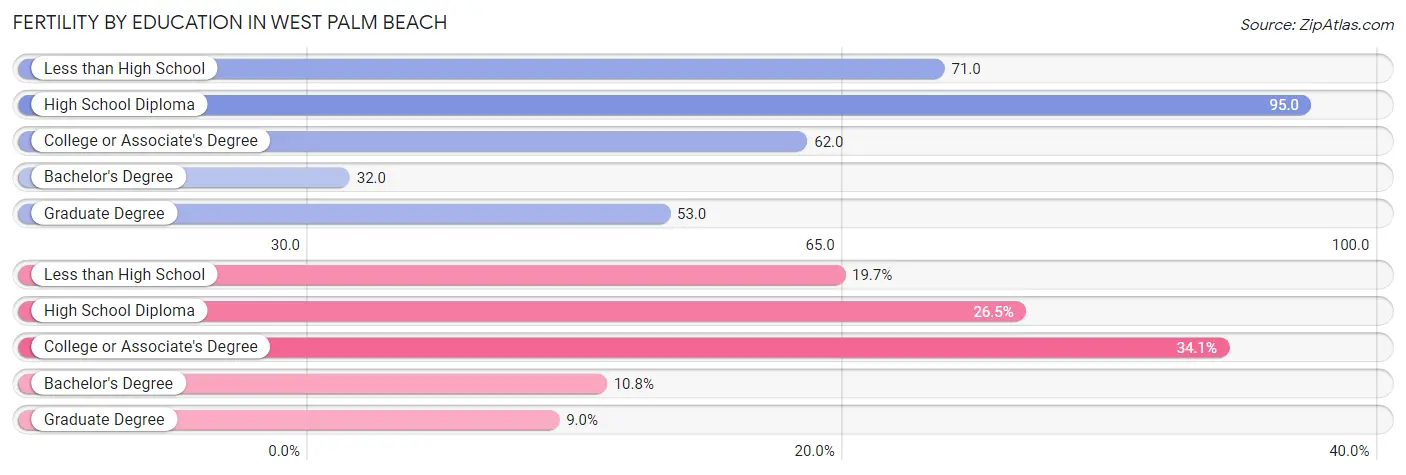
| Educational Attainment | Women with Births | Births / 1,000 Women |
| Less than High School | 344 (19.7%) | 71.0 |
| High School Diploma | 462 (26.5%) | 95.0 |
| College or Associate's Degree | 595 (34.1%) | 62.0 |
| Bachelor's Degree | 188 (10.8%) | 32.0 |
| Graduate Degree | 157 (9.0%) | 53.0 |
| Total | 1,746 (100.0%) | 62.0 |
Fertility by Education by Marriage Status in West Palm Beach
43.2% of women with births in West Palm Beach are unmarried. Women with the educational attainment of bachelor's degree are most likely to be married with 95.2% of them married at childbirth, while women with the educational attainment of high school diploma are least likely to be married with 64.1% of them unmarried at childbirth.
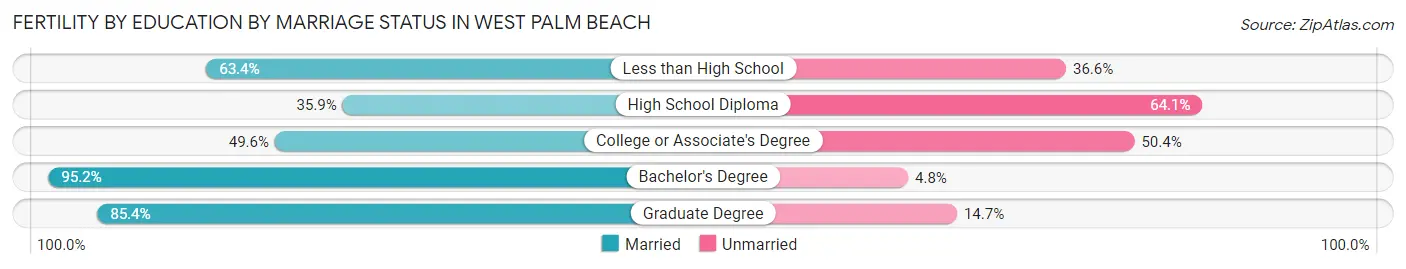
| Educational Attainment | Married | Unmarried |
| Less than High School | 218 (63.4%) | 126 (36.6%) |
| High School Diploma | 166 (35.9%) | 296 (64.1%) |
| College or Associate's Degree | 295 (49.6%) | 300 (50.4%) |
| Bachelor's Degree | 179 (95.2%) | 9 (4.8%) |
| Graduate Degree | 134 (85.4%) | 23 (14.6%) |
| Total | 992 (56.8%) | 754 (43.2%) |
Employment Characteristics in West Palm Beach
Employment by Class of Employer in West Palm Beach
Among the 57,008 employed individuals in West Palm Beach, private company employees (39,961 | 70.1%), local government employees (3,855 | 6.8%), and self-employed (incorporated) (3,660 | 6.4%) make up the most common classes of employment.
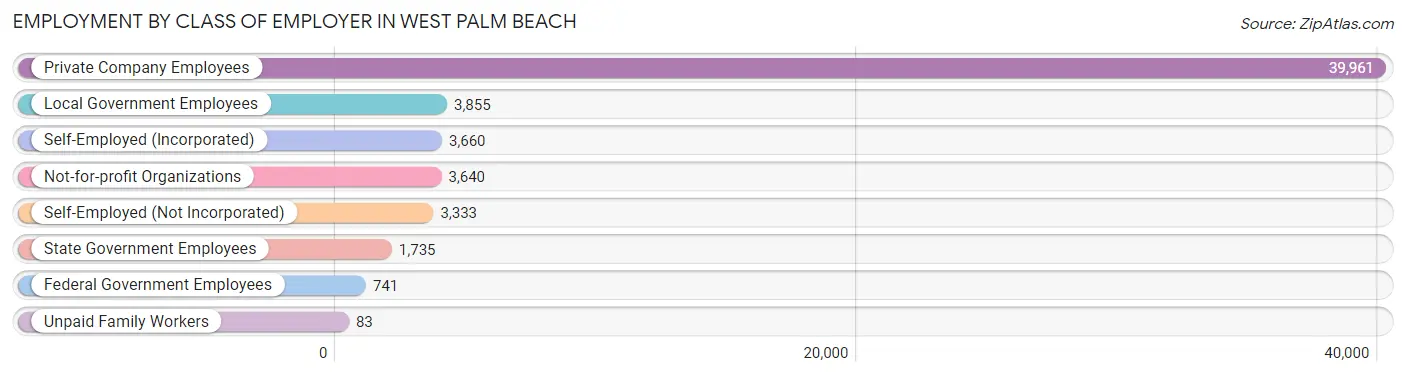
| Employer Class | # Employees | % Employees |
| Private Company Employees | 39,961 | 70.1% |
| Self-Employed (Incorporated) | 3,660 | 6.4% |
| Self-Employed (Not Incorporated) | 3,333 | 5.9% |
| Not-for-profit Organizations | 3,640 | 6.4% |
| Local Government Employees | 3,855 | 6.8% |
| State Government Employees | 1,735 | 3.0% |
| Federal Government Employees | 741 | 1.3% |
| Unpaid Family Workers | 83 | 0.2% |
| Total | 57,008 | 100.0% |
Employment Status by Age in West Palm Beach
According to the labor force statistics for West Palm Beach, out of the total population over 16 years of age (99,231), 63.0% or 62,516 individuals are in the labor force, with 6.2% or 3,876 of them unemployed. The age group with the highest labor force participation rate is 30 to 34 years, with 89.8% or 8,586 individuals in the labor force. Within the labor force, the 16 to 19 years age range has the highest percentage of unemployed individuals, with 28.6% or 557 of them being unemployed.
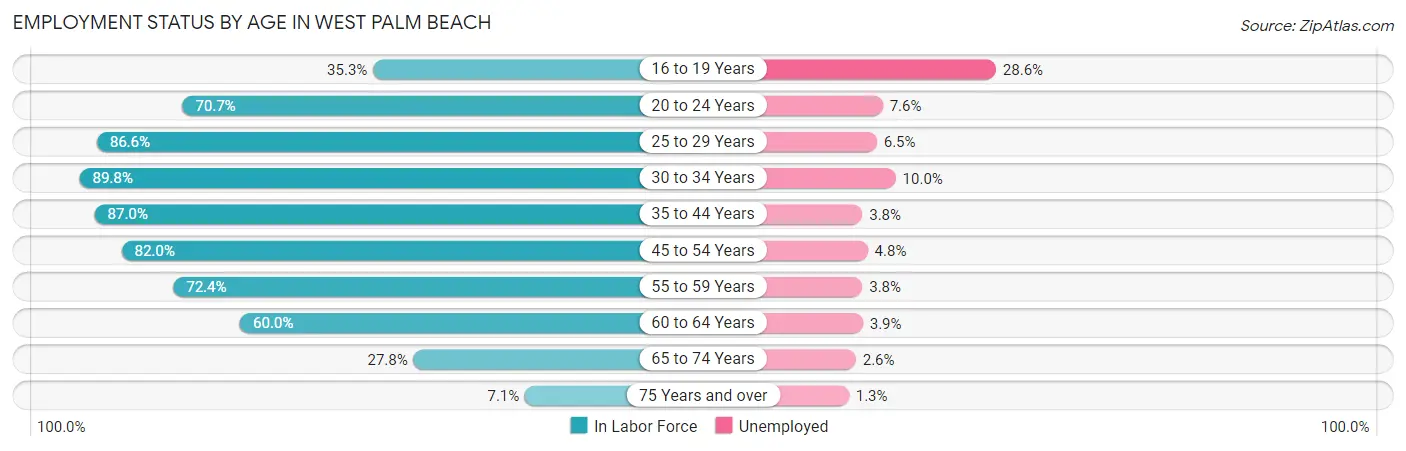
| Age Bracket | In Labor Force | Unemployed |
| 16 to 19 Years | 1,948 (35.3%) | 557 (28.6%) |
| 20 to 24 Years | 5,887 (70.7%) | 447 (7.6%) |
| 25 to 29 Years | 7,822 (86.6%) | 508 (6.5%) |
| 30 to 34 Years | 8,586 (89.8%) | 859 (10.0%) |
| 35 to 44 Years | 12,772 (87.0%) | 485 (3.8%) |
| 45 to 54 Years | 11,762 (82.0%) | 565 (4.8%) |
| 55 to 59 Years | 5,322 (72.4%) | 202 (3.8%) |
| 60 to 64 Years | 4,218 (60.0%) | 165 (3.9%) |
| 65 to 74 Years | 3,427 (27.8%) | 89 (2.6%) |
| 75 Years and over | 785 (7.1%) | 10 (1.3%) |
| Total | 62,516 (63.0%) | 3,876 (6.2%) |
Employment Status by Educational Attainment in West Palm Beach
According to labor force statistics for West Palm Beach, 81.4% of individuals (50,467) out of the total population between 25 and 64 years of age (61,999) are in the labor force, with 5.5% or 2,776 of them being unemployed. The group with the highest labor force participation rate are those with the educational attainment of bachelor's degree or higher, with 86.9% or 19,372 individuals in the labor force. Within the labor force, individuals with college / associate degree education have the highest percentage of unemployment, with 7.6% or 1,163 of them being unemployed.
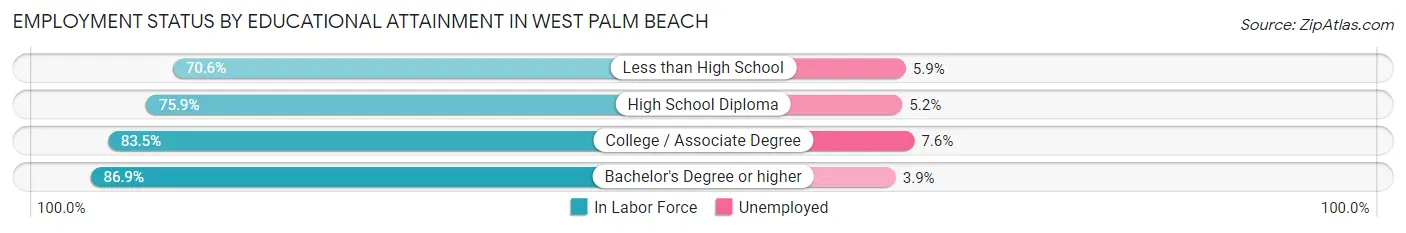
| Educational Attainment | In Labor Force | Unemployed |
| Less than High School | 5,694 (70.6%) | 476 (5.9%) |
| High School Diploma | 10,108 (75.9%) | 692 (5.2%) |
| College / Associate Degree | 15,301 (83.5%) | 1,393 (7.6%) |
| Bachelor's Degree or higher | 19,372 (86.9%) | 869 (3.9%) |
| Total | 50,467 (81.4%) | 3,410 (5.5%) |
Employment Occupations by Sex in West Palm Beach
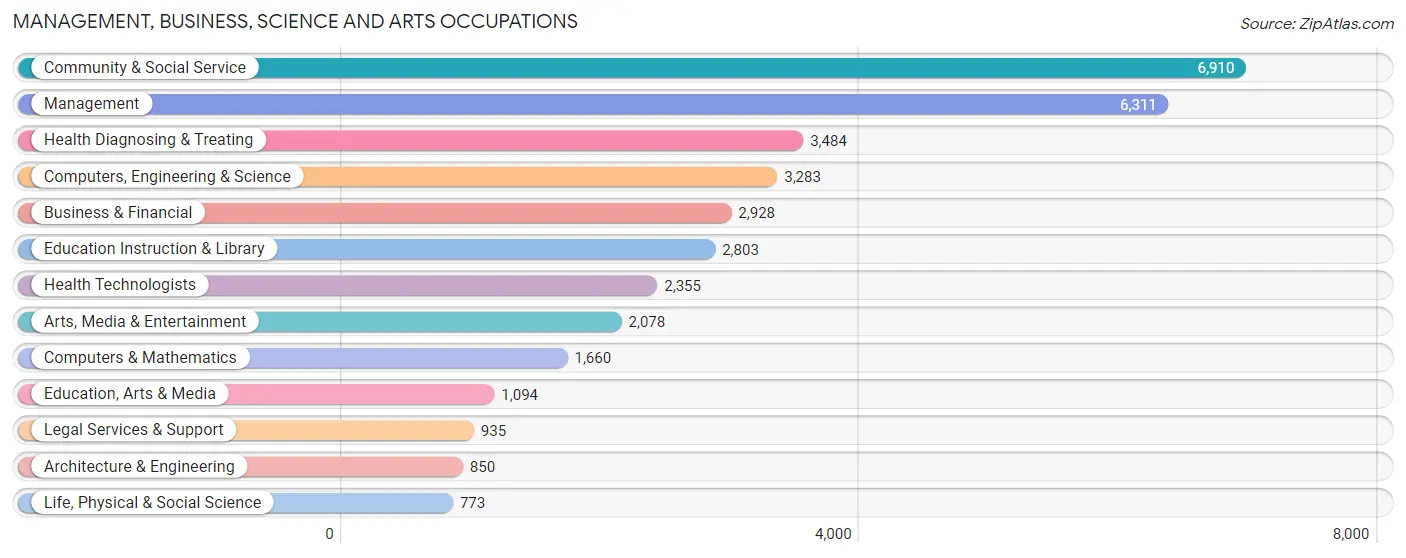
Management, Business, Science and Arts Occupations
The most common Management, Business, Science and Arts occupations in West Palm Beach are Community & Social Service (6,910 | 11.8%), Management (6,311 | 10.8%), Health Diagnosing & Treating (3,484 | 5.9%), Computers, Engineering & Science (3,283 | 5.6%), and Business & Financial (2,928 | 5.0%).
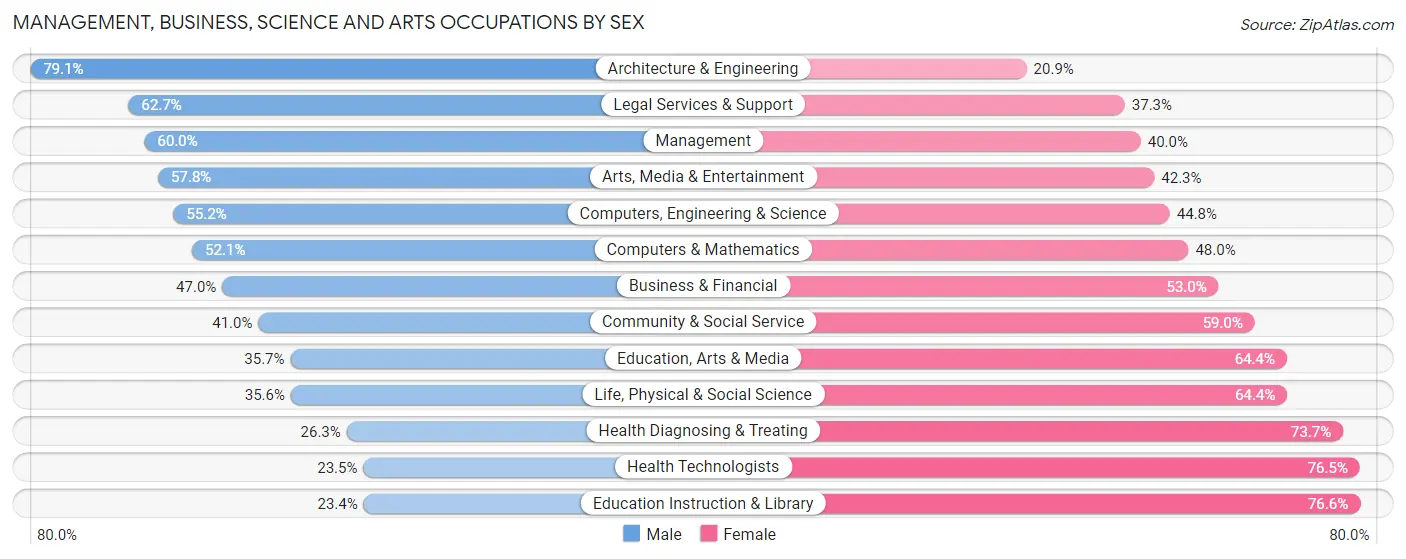
Management, Business, Science and Arts Occupations by Sex
Within the Management, Business, Science and Arts occupations in West Palm Beach, the most male-oriented occupations are Architecture & Engineering (79.1%), Legal Services & Support (62.7%), and Management (60.0%), while the most female-oriented occupations are Education Instruction & Library (76.6%), Health Technologists (76.5%), and Health Diagnosing & Treating (73.7%).
| Occupation | Male | Female |
| Management | 3,787 (60.0%) | 2,524 (40.0%) |
| Business & Financial | 1,377 (47.0%) | 1,551 (53.0%) |
| Computers, Engineering & Science | 1,811 (55.2%) | 1,472 (44.8%) |
| Computers & Mathematics | 864 (52.0%) | 796 (47.9%) |
| Architecture & Engineering | 672 (79.1%) | 178 (20.9%) |
| Life, Physical & Social Science | 275 (35.6%) | 498 (64.4%) |
| Community & Social Service | 2,833 (41.0%) | 4,077 (59.0%) |
| Education, Arts & Media | 390 (35.6%) | 704 (64.3%) |
| Legal Services & Support | 586 (62.7%) | 349 (37.3%) |
| Education Instruction & Library | 657 (23.4%) | 2,146 (76.6%) |
| Arts, Media & Entertainment | 1,200 (57.8%) | 878 (42.2%) |
| Health Diagnosing & Treating | 915 (26.3%) | 2,569 (73.7%) |
| Health Technologists | 553 (23.5%) | 1,802 (76.5%) |
| Total (Category) | 10,723 (46.8%) | 12,193 (53.2%) |
| Total (Overall) | 30,324 (51.8%) | 28,258 (48.2%) |
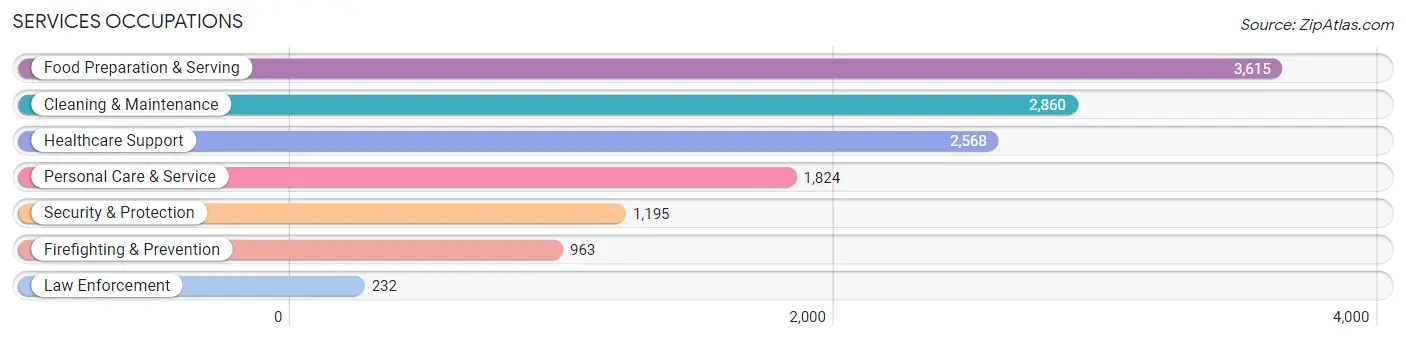
Services Occupations
The most common Services occupations in West Palm Beach are Food Preparation & Serving (3,615 | 6.2%), Cleaning & Maintenance (2,860 | 4.9%), Healthcare Support (2,568 | 4.4%), Personal Care & Service (1,824 | 3.1%), and Security & Protection (1,195 | 2.0%).
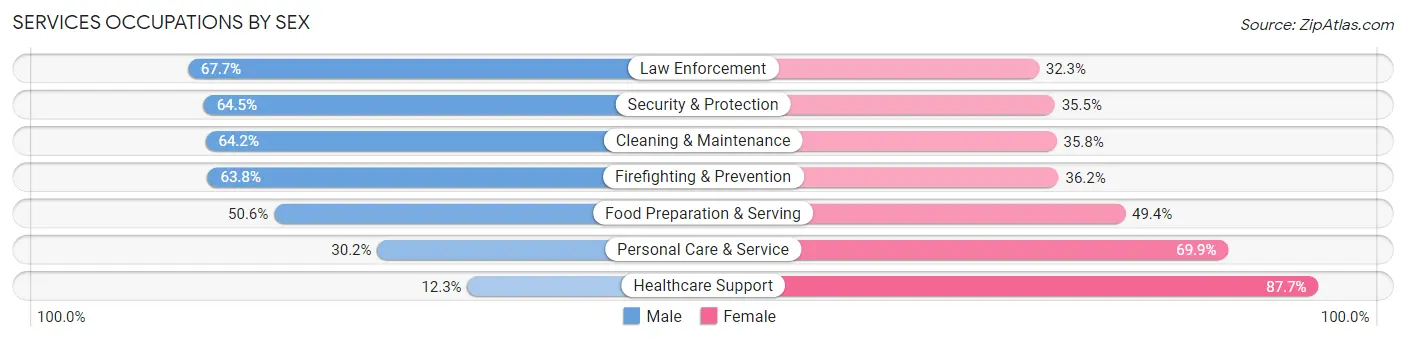
Services Occupations by Sex
Within the Services occupations in West Palm Beach, the most male-oriented occupations are Law Enforcement (67.7%), Security & Protection (64.5%), and Cleaning & Maintenance (64.2%), while the most female-oriented occupations are Healthcare Support (87.7%), Personal Care & Service (69.9%), and Food Preparation & Serving (49.4%).
| Occupation | Male | Female |
| Healthcare Support | 316 (12.3%) | 2,252 (87.7%) |
| Security & Protection | 771 (64.5%) | 424 (35.5%) |
| Firefighting & Prevention | 614 (63.8%) | 349 (36.2%) |
| Law Enforcement | 157 (67.7%) | 75 (32.3%) |
| Food Preparation & Serving | 1,829 (50.6%) | 1,786 (49.4%) |
| Cleaning & Maintenance | 1,835 (64.2%) | 1,025 (35.8%) |
| Personal Care & Service | 550 (30.1%) | 1,274 (69.9%) |
| Total (Category) | 5,301 (44.0%) | 6,761 (56.0%) |
| Total (Overall) | 30,324 (51.8%) | 28,258 (48.2%) |
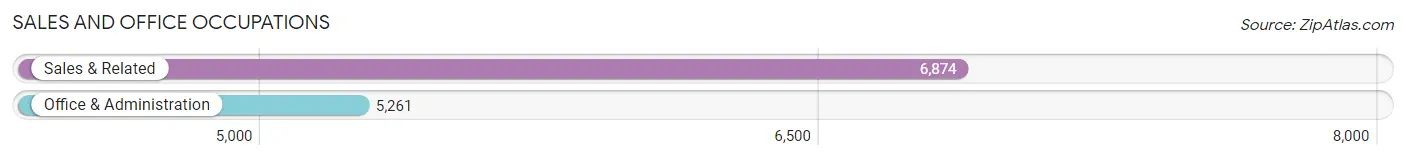
Sales and Office Occupations
The most common Sales and Office occupations in West Palm Beach are Sales & Related (6,874 | 11.7%), and Office & Administration (5,261 | 9.0%).
Sales and Office Occupations by Sex
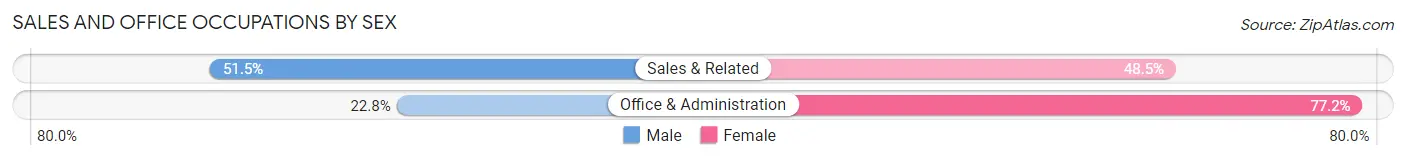
| Occupation | Male | Female |
| Sales & Related | 3,539 (51.5%) | 3,335 (48.5%) |
| Office & Administration | 1,199 (22.8%) | 4,062 (77.2%) |
| Total (Category) | 4,738 (39.0%) | 7,397 (61.0%) |
| Total (Overall) | 30,324 (51.8%) | 28,258 (48.2%) |
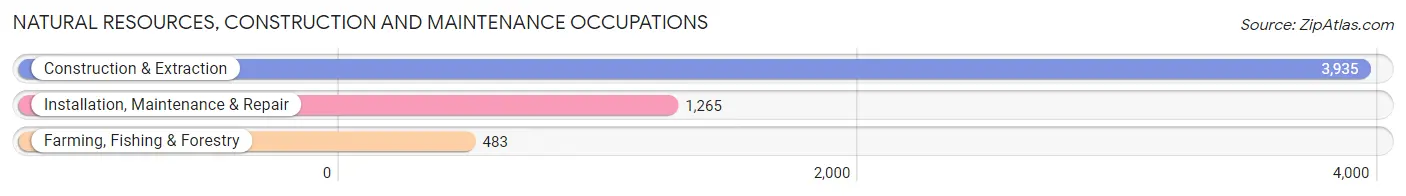
Natural Resources, Construction and Maintenance Occupations
The most common Natural Resources, Construction and Maintenance occupations in West Palm Beach are Construction & Extraction (3,935 | 6.7%), Installation, Maintenance & Repair (1,265 | 2.2%), and Farming, Fishing & Forestry (483 | 0.8%).
Natural Resources, Construction and Maintenance Occupations by Sex
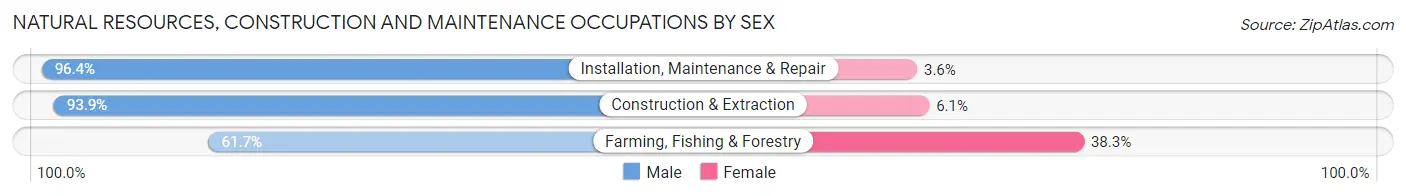
| Occupation | Male | Female |
| Farming, Fishing & Forestry | 298 (61.7%) | 185 (38.3%) |
| Construction & Extraction | 3,695 (93.9%) | 240 (6.1%) |
| Installation, Maintenance & Repair | 1,220 (96.4%) | 45 (3.6%) |
| Total (Category) | 5,213 (91.7%) | 470 (8.3%) |
| Total (Overall) | 30,324 (51.8%) | 28,258 (48.2%) |
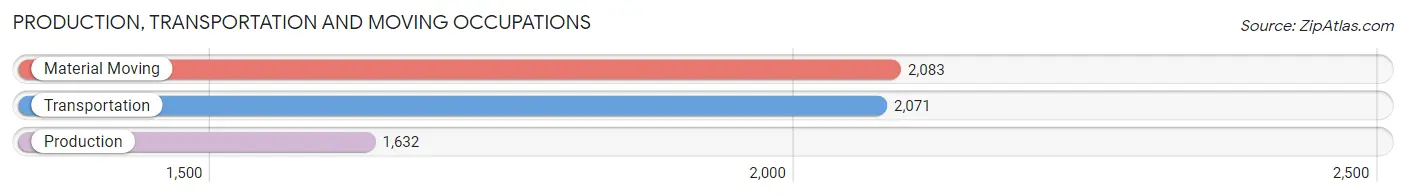
Production, Transportation and Moving Occupations
The most common Production, Transportation and Moving occupations in West Palm Beach are Material Moving (2,083 | 3.6%), Transportation (2,071 | 3.5%), and Production (1,632 | 2.8%).
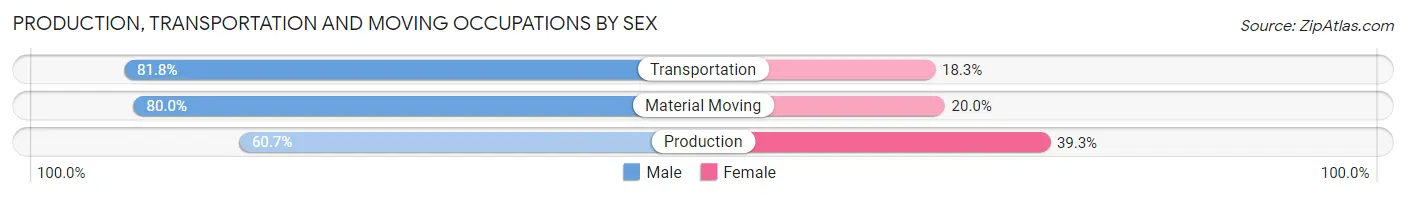
Production, Transportation and Moving Occupations by Sex
| Occupation | Male | Female |
| Production | 990 (60.7%) | 642 (39.3%) |
| Transportation | 1,693 (81.8%) | 378 (18.2%) |
| Material Moving | 1,666 (80.0%) | 417 (20.0%) |
| Total (Category) | 4,349 (75.2%) | 1,437 (24.8%) |
| Total (Overall) | 30,324 (51.8%) | 28,258 (48.2%) |
Employment Industries by Sex in West Palm Beach
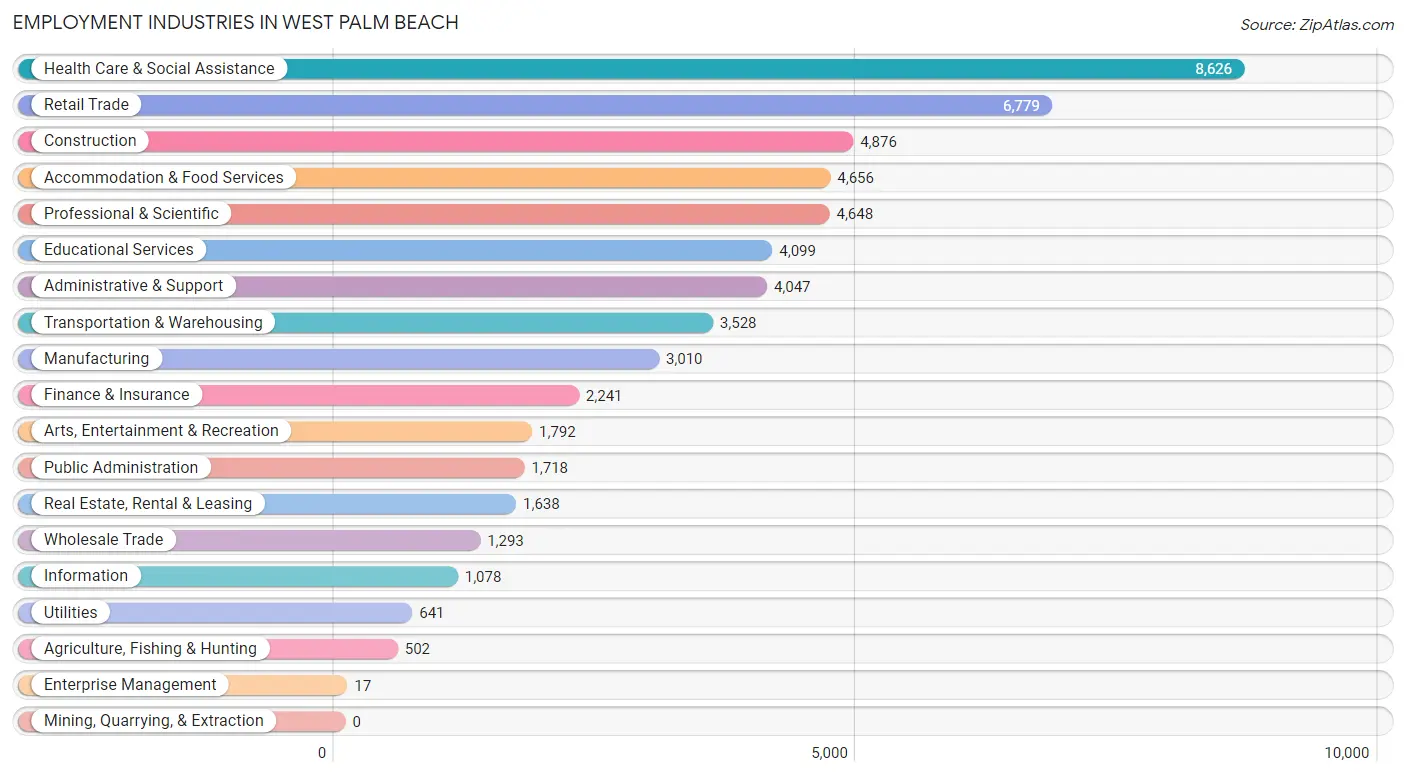
Employment Industries in West Palm Beach
The major employment industries in West Palm Beach include Health Care & Social Assistance (8,626 | 14.7%), Retail Trade (6,779 | 11.6%), Construction (4,876 | 8.3%), Accommodation & Food Services (4,656 | 8.0%), and Professional & Scientific (4,648 | 7.9%).
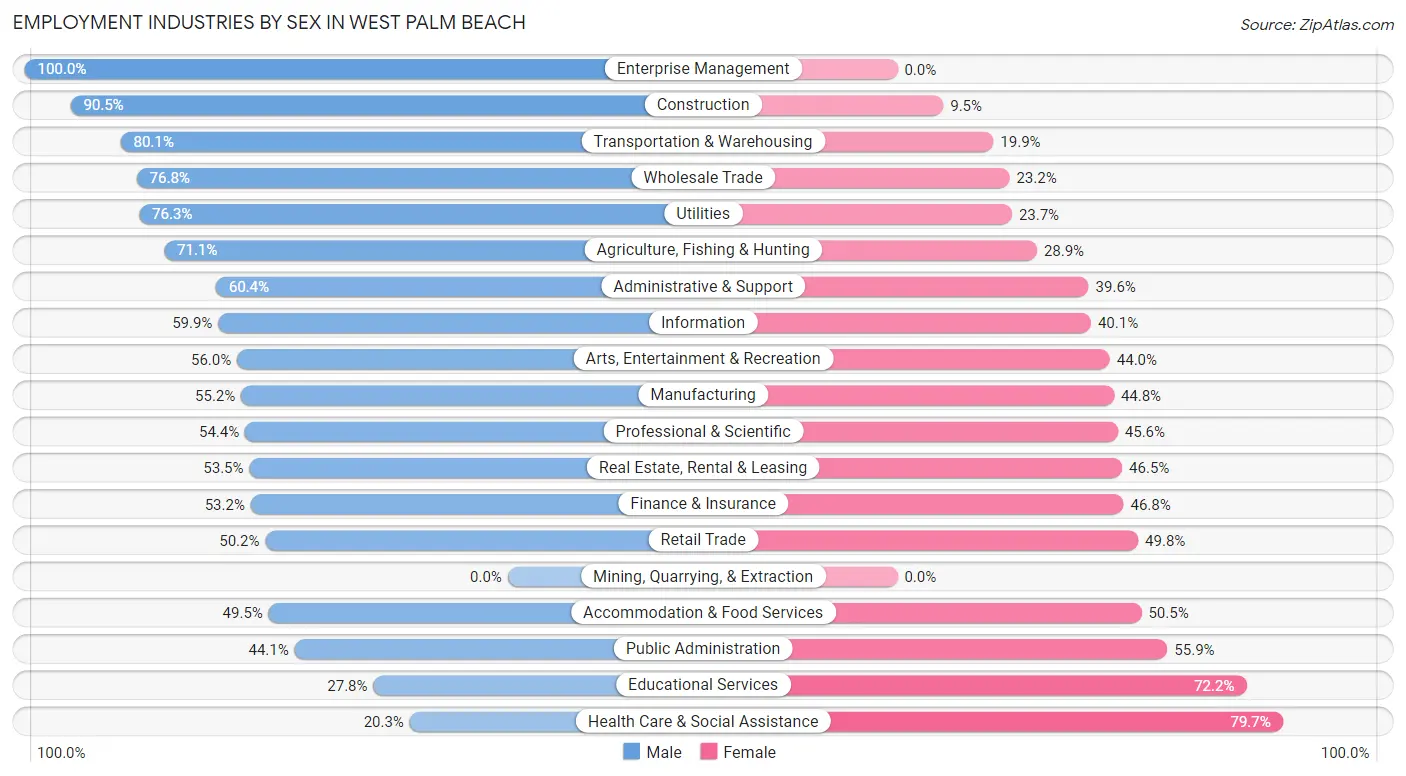
Employment Industries by Sex in West Palm Beach
The West Palm Beach industries that see more men than women are Enterprise Management (100.0%), Construction (90.5%), and Transportation & Warehousing (80.1%), whereas the industries that tend to have a higher number of women are Health Care & Social Assistance (79.7%), Educational Services (72.2%), and Public Administration (55.9%).
| Industry | Male | Female |
| Agriculture, Fishing & Hunting | 357 (71.1%) | 145 (28.9%) |
| Mining, Quarrying, & Extraction | 0 (0.0%) | 0 (0.0%) |
| Construction | 4,413 (90.5%) | 463 (9.5%) |
| Manufacturing | 1,661 (55.2%) | 1,349 (44.8%) |
| Wholesale Trade | 993 (76.8%) | 300 (23.2%) |
| Retail Trade | 3,401 (50.2%) | 3,378 (49.8%) |
| Transportation & Warehousing | 2,827 (80.1%) | 701 (19.9%) |
| Utilities | 489 (76.3%) | 152 (23.7%) |
| Information | 646 (59.9%) | 432 (40.1%) |
| Finance & Insurance | 1,192 (53.2%) | 1,049 (46.8%) |
| Real Estate, Rental & Leasing | 876 (53.5%) | 762 (46.5%) |
| Professional & Scientific | 2,527 (54.4%) | 2,121 (45.6%) |
| Enterprise Management | 17 (100.0%) | 0 (0.0%) |
| Administrative & Support | 2,445 (60.4%) | 1,602 (39.6%) |
| Educational Services | 1,140 (27.8%) | 2,959 (72.2%) |
| Health Care & Social Assistance | 1,750 (20.3%) | 6,876 (79.7%) |
| Arts, Entertainment & Recreation | 1,004 (56.0%) | 788 (44.0%) |
| Accommodation & Food Services | 2,304 (49.5%) | 2,352 (50.5%) |
| Public Administration | 758 (44.1%) | 960 (55.9%) |
| Total | 30,324 (51.8%) | 28,258 (48.2%) |
Education in West Palm Beach
School Enrollment in West Palm Beach
The most common levels of schooling among the 23,421 students in West Palm Beach are college / undergraduate (6,729 | 28.7%), high school (4,679 | 20.0%), and middle school (4,002 | 17.1%).
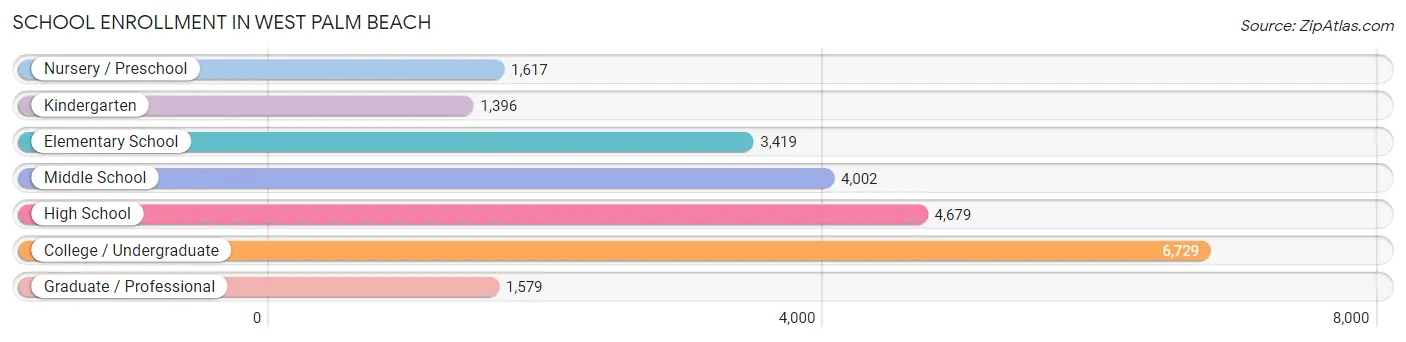
| School Level | # Students | % Students |
| Nursery / Preschool | 1,617 | 6.9% |
| Kindergarten | 1,396 | 6.0% |
| Elementary School | 3,419 | 14.6% |
| Middle School | 4,002 | 17.1% |
| High School | 4,679 | 20.0% |
| College / Undergraduate | 6,729 | 28.7% |
| Graduate / Professional | 1,579 | 6.7% |
| Total | 23,421 | 100.0% |
School Enrollment by Age by Funding Source in West Palm Beach
Out of a total of 23,421 students who are enrolled in schools in West Palm Beach, 5,644 (24.1%) attend a private institution, while the remaining 17,777 (75.9%) are enrolled in public schools. The age group of 35 years and over has the highest likelihood of being enrolled in private schools, with 700 (42.0% in the age bracket) enrolled. Conversely, the age group of 15 to 17 year olds has the lowest likelihood of being enrolled in a private school, with 3,125 (89.8% in the age bracket) attending a public institution.
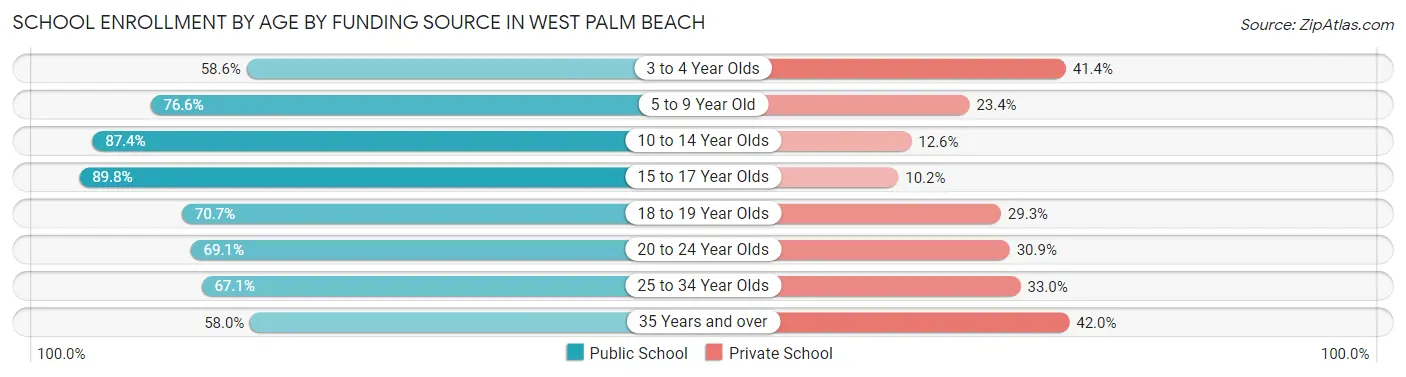
| Age Bracket | Public School | Private School |
| 3 to 4 Year Olds | 778 (58.6%) | 549 (41.4%) |
| 5 to 9 Year Old | 3,628 (76.6%) | 1,110 (23.4%) |
| 10 to 14 Year Olds | 4,074 (87.4%) | 588 (12.6%) |
| 15 to 17 Year Olds | 3,125 (89.8%) | 354 (10.2%) |
| 18 to 19 Year Olds | 1,649 (70.7%) | 683 (29.3%) |
| 20 to 24 Year Olds | 2,220 (69.1%) | 994 (30.9%) |
| 25 to 34 Year Olds | 1,343 (67.0%) | 660 (33.0%) |
| 35 Years and over | 966 (58.0%) | 700 (42.0%) |
| Total | 17,777 (75.9%) | 5,644 (24.1%) |
Educational Attainment by Field of Study in West Palm Beach
Business (8,333 | 24.2%), education (3,479 | 10.1%), social sciences (3,255 | 9.5%), science & technology (3,043 | 8.9%), and arts & humanities (2,366 | 6.9%) are the most common fields of study among 34,361 individuals in West Palm Beach who have obtained a bachelor's degree or higher.
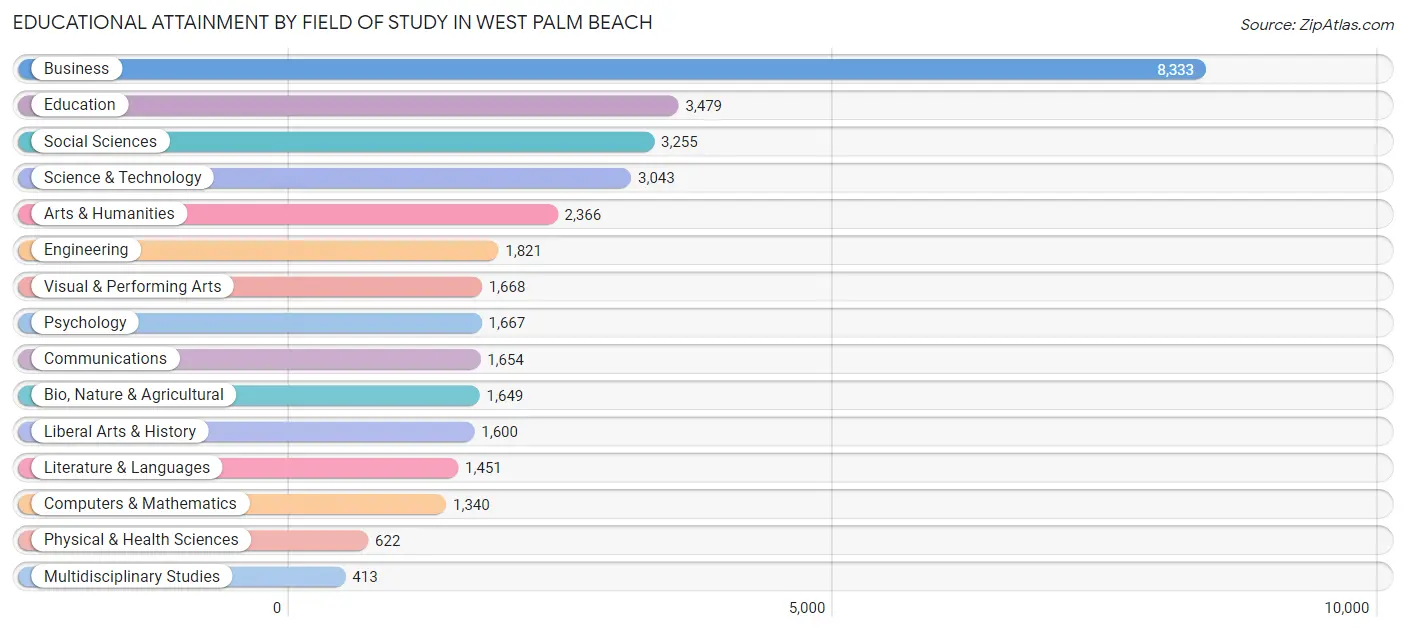
| Field of Study | # Graduates | % Graduates |
| Computers & Mathematics | 1,340 | 3.9% |
| Bio, Nature & Agricultural | 1,649 | 4.8% |
| Physical & Health Sciences | 622 | 1.8% |
| Psychology | 1,667 | 4.9% |
| Social Sciences | 3,255 | 9.5% |
| Engineering | 1,821 | 5.3% |
| Multidisciplinary Studies | 413 | 1.2% |
| Science & Technology | 3,043 | 8.9% |
| Business | 8,333 | 24.2% |
| Education | 3,479 | 10.1% |
| Literature & Languages | 1,451 | 4.2% |
| Liberal Arts & History | 1,600 | 4.7% |
| Visual & Performing Arts | 1,668 | 4.9% |
| Communications | 1,654 | 4.8% |
| Arts & Humanities | 2,366 | 6.9% |
| Total | 34,361 | 100.0% |
Transportation & Commute in West Palm Beach
Vehicle Availability by Sex in West Palm Beach
The most prevalent vehicle ownership categories in West Palm Beach are males with 2 vehicles (12,314, accounting for 41.7%) and females with 2 vehicles (11,261, making up 46.0%).
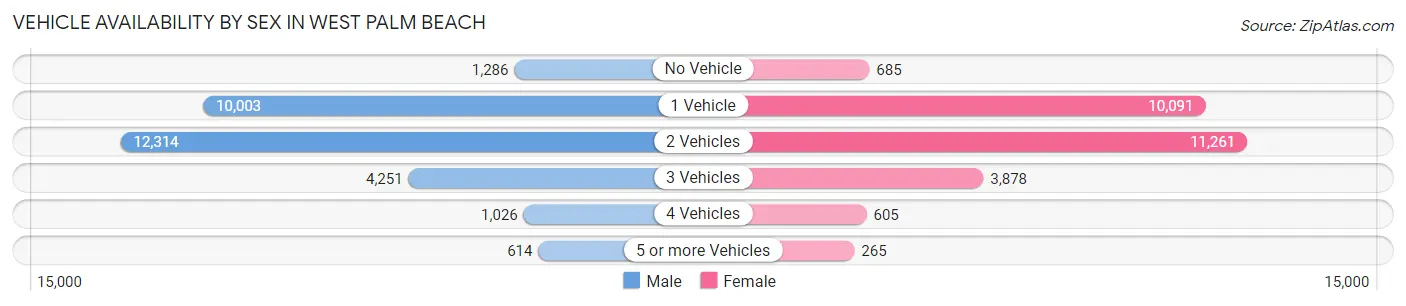
| Vehicles Available | Male | Female |
| No Vehicle | 1,286 (4.4%) | 685 (2.6%) |
| 1 Vehicle | 10,003 (33.9%) | 10,091 (37.7%) |
| 2 Vehicles | 12,314 (41.7%) | 11,261 (42.0%) |
| 3 Vehicles | 4,251 (14.4%) | 3,878 (14.5%) |
| 4 Vehicles | 1,026 (3.5%) | 605 (2.3%) |
| 5 or more Vehicles | 614 (2.1%) | 265 (1.0%) |
| Total | 29,494 (100.0%) | 26,785 (100.0%) |
Commute Time in West Palm Beach
The most frequently occuring commute durations in West Palm Beach are 15 to 19 minutes (9,853 commuters, 19.6%), 20 to 24 minutes (9,067 commuters, 18.0%), and 10 to 14 minutes (8,312 commuters, 16.5%).
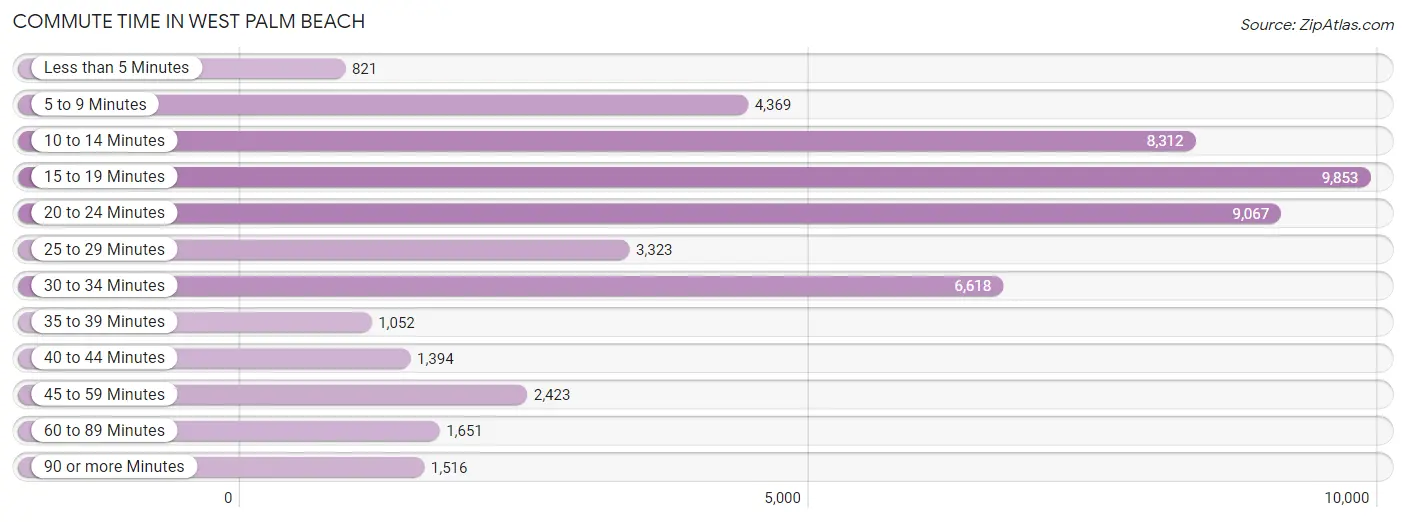
| Commute Time | # Commuters | % Commuters |
| Less than 5 Minutes | 821 | 1.6% |
| 5 to 9 Minutes | 4,369 | 8.7% |
| 10 to 14 Minutes | 8,312 | 16.5% |
| 15 to 19 Minutes | 9,853 | 19.6% |
| 20 to 24 Minutes | 9,067 | 18.0% |
| 25 to 29 Minutes | 3,323 | 6.6% |
| 30 to 34 Minutes | 6,618 | 13.1% |
| 35 to 39 Minutes | 1,052 | 2.1% |
| 40 to 44 Minutes | 1,394 | 2.8% |
| 45 to 59 Minutes | 2,423 | 4.8% |
| 60 to 89 Minutes | 1,651 | 3.3% |
| 90 or more Minutes | 1,516 | 3.0% |
Commute Time by Sex in West Palm Beach
The most common commute times in West Palm Beach are 15 to 19 minutes (5,404 commuters, 20.4%) for males and 15 to 19 minutes (4,449 commuters, 18.6%) for females.
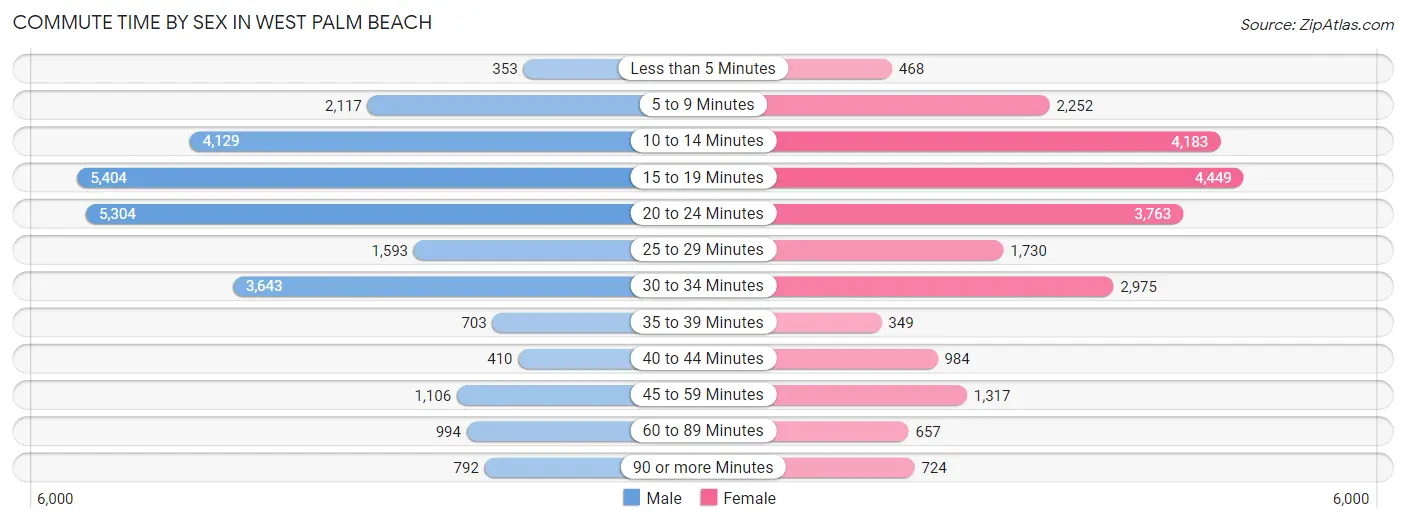
| Commute Time | Male | Female |
| Less than 5 Minutes | 353 (1.3%) | 468 (2.0%) |
| 5 to 9 Minutes | 2,117 (8.0%) | 2,252 (9.4%) |
| 10 to 14 Minutes | 4,129 (15.5%) | 4,183 (17.5%) |
| 15 to 19 Minutes | 5,404 (20.4%) | 4,449 (18.6%) |
| 20 to 24 Minutes | 5,304 (20.0%) | 3,763 (15.8%) |
| 25 to 29 Minutes | 1,593 (6.0%) | 1,730 (7.2%) |
| 30 to 34 Minutes | 3,643 (13.7%) | 2,975 (12.5%) |
| 35 to 39 Minutes | 703 (2.6%) | 349 (1.5%) |
| 40 to 44 Minutes | 410 (1.5%) | 984 (4.1%) |
| 45 to 59 Minutes | 1,106 (4.2%) | 1,317 (5.5%) |
| 60 to 89 Minutes | 994 (3.7%) | 657 (2.8%) |
| 90 or more Minutes | 792 (3.0%) | 724 (3.0%) |
Time of Departure to Work by Sex in West Palm Beach
The most frequent times of departure to work in West Palm Beach are 8:00 AM to 8:29 AM (3,400, 12.8%) for males and 8:00 AM to 8:29 AM (4,063, 17.0%) for females.
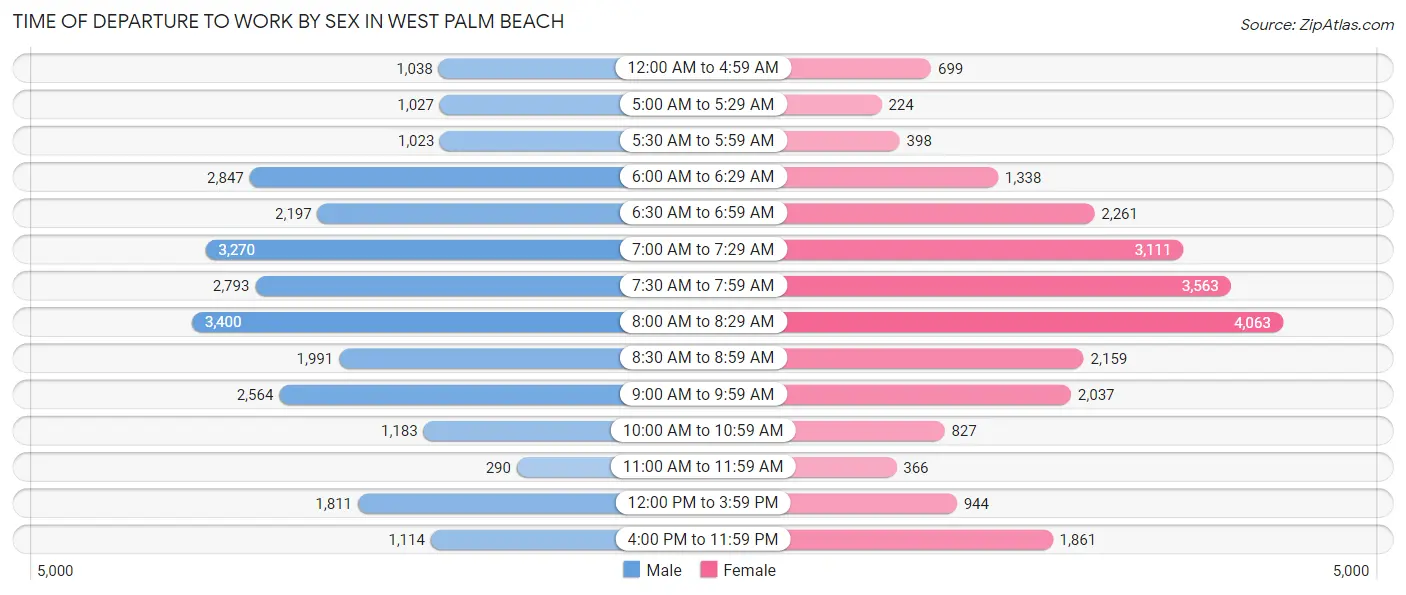
| Time of Departure | Male | Female |
| 12:00 AM to 4:59 AM | 1,038 (3.9%) | 699 (2.9%) |
| 5:00 AM to 5:29 AM | 1,027 (3.9%) | 224 (0.9%) |
| 5:30 AM to 5:59 AM | 1,023 (3.8%) | 398 (1.7%) |
| 6:00 AM to 6:29 AM | 2,847 (10.7%) | 1,338 (5.6%) |
| 6:30 AM to 6:59 AM | 2,197 (8.3%) | 2,261 (9.5%) |
| 7:00 AM to 7:29 AM | 3,270 (12.3%) | 3,111 (13.0%) |
| 7:30 AM to 7:59 AM | 2,793 (10.5%) | 3,563 (14.9%) |
| 8:00 AM to 8:29 AM | 3,400 (12.8%) | 4,063 (17.0%) |
| 8:30 AM to 8:59 AM | 1,991 (7.5%) | 2,159 (9.0%) |
| 9:00 AM to 9:59 AM | 2,564 (9.7%) | 2,037 (8.5%) |
| 10:00 AM to 10:59 AM | 1,183 (4.5%) | 827 (3.5%) |
| 11:00 AM to 11:59 AM | 290 (1.1%) | 366 (1.5%) |
| 12:00 PM to 3:59 PM | 1,811 (6.8%) | 944 (4.0%) |
| 4:00 PM to 11:59 PM | 1,114 (4.2%) | 1,861 (7.8%) |
| Total | 26,548 (100.0%) | 23,851 (100.0%) |
Housing Occupancy in West Palm Beach
Occupancy by Ownership in West Palm Beach
Of the total 49,348 dwellings in West Palm Beach, owner-occupied units account for 24,552 (49.7%), while renter-occupied units make up 24,796 (50.2%).
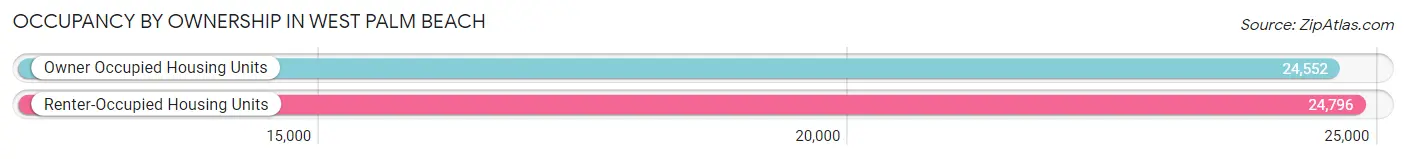
| Occupancy | # Housing Units | % Housing Units |
| Owner Occupied Housing Units | 24,552 | 49.7% |
| Renter-Occupied Housing Units | 24,796 | 50.2% |
| Total Occupied Housing Units | 49,348 | 100.0% |
Occupancy by Household Size in West Palm Beach
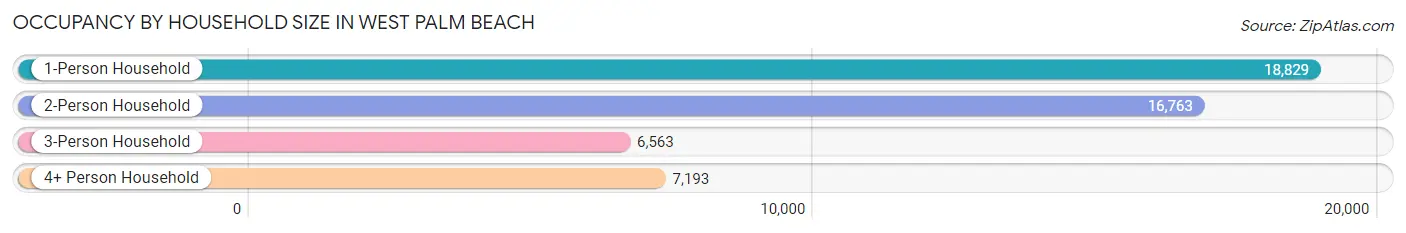
| Household Size | # Housing Units | % Housing Units |
| 1-Person Household | 18,829 | 38.2% |
| 2-Person Household | 16,763 | 34.0% |
| 3-Person Household | 6,563 | 13.3% |
| 4+ Person Household | 7,193 | 14.6% |
| Total Housing Units | 49,348 | 100.0% |
Occupancy by Ownership by Household Size in West Palm Beach
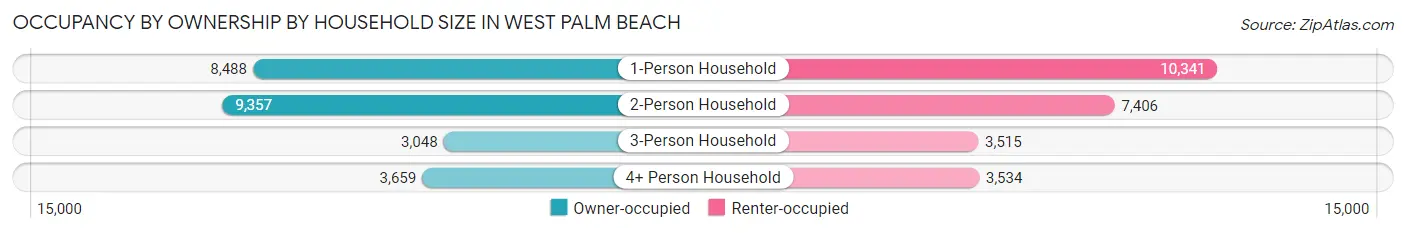
| Household Size | Owner-occupied | Renter-occupied |
| 1-Person Household | 8,488 (45.1%) | 10,341 (54.9%) |
| 2-Person Household | 9,357 (55.8%) | 7,406 (44.2%) |
| 3-Person Household | 3,048 (46.4%) | 3,515 (53.6%) |
| 4+ Person Household | 3,659 (50.9%) | 3,534 (49.1%) |
| Total Housing Units | 24,552 (49.7%) | 24,796 (50.2%) |
Occupancy by Educational Attainment in West Palm Beach
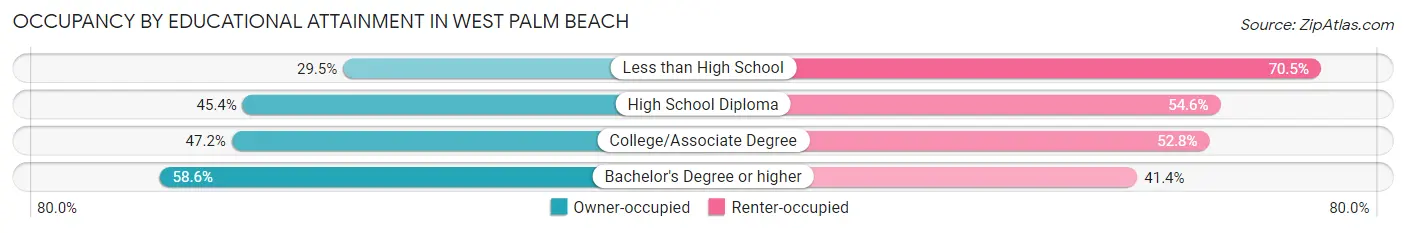
| Household Size | Owner-occupied | Renter-occupied |
| Less than High School | 1,481 (29.5%) | 3,541 (70.5%) |
| High School Diploma | 4,247 (45.4%) | 5,104 (54.6%) |
| College/Associate Degree | 6,864 (47.2%) | 7,690 (52.8%) |
| Bachelor's Degree or higher | 11,960 (58.6%) | 8,461 (41.4%) |
Occupancy by Age of Householder in West Palm Beach
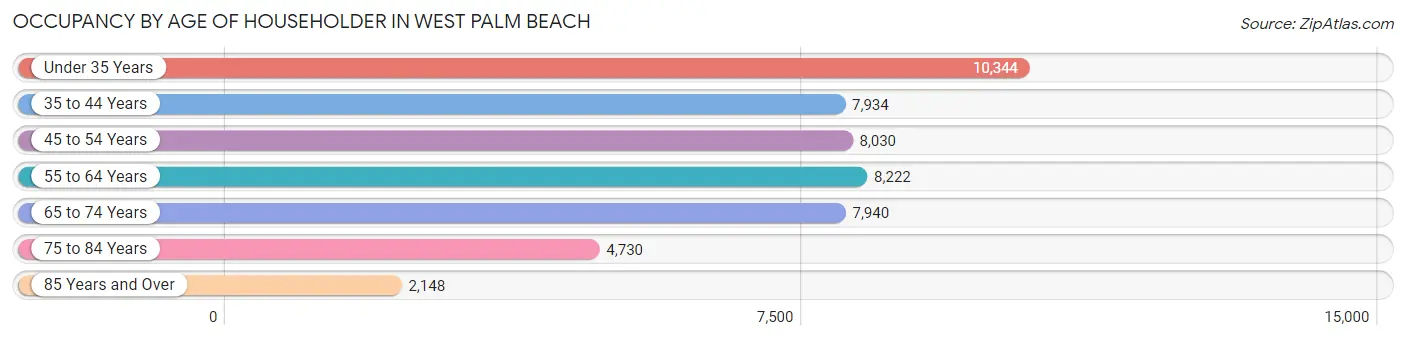
| Age Bracket | # Households | % Households |
| Under 35 Years | 10,344 | 21.0% |
| 35 to 44 Years | 7,934 | 16.1% |
| 45 to 54 Years | 8,030 | 16.3% |
| 55 to 64 Years | 8,222 | 16.7% |
| 65 to 74 Years | 7,940 | 16.1% |
| 75 to 84 Years | 4,730 | 9.6% |
| 85 Years and Over | 2,148 | 4.3% |
| Total | 49,348 | 100.0% |
Housing Finances in West Palm Beach
Median Income by Occupancy in West Palm Beach
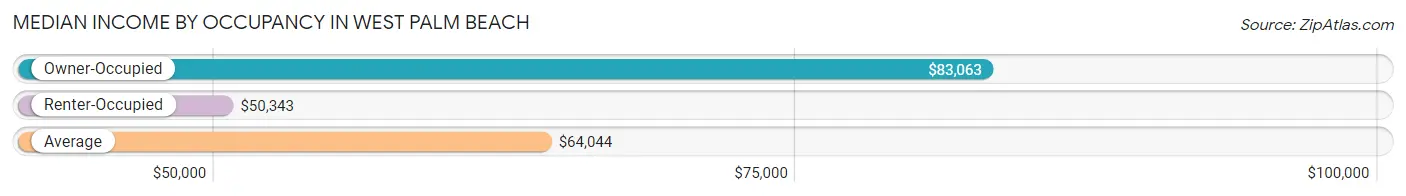
| Occupancy Type | # Households | Median Income |
| Owner-Occupied | 24,552 (49.7%) | $83,063 |
| Renter-Occupied | 24,796 (50.2%) | $50,343 |
| Average | 49,348 (100.0%) | $64,044 |
Occupancy by Householder Income Bracket in West Palm Beach
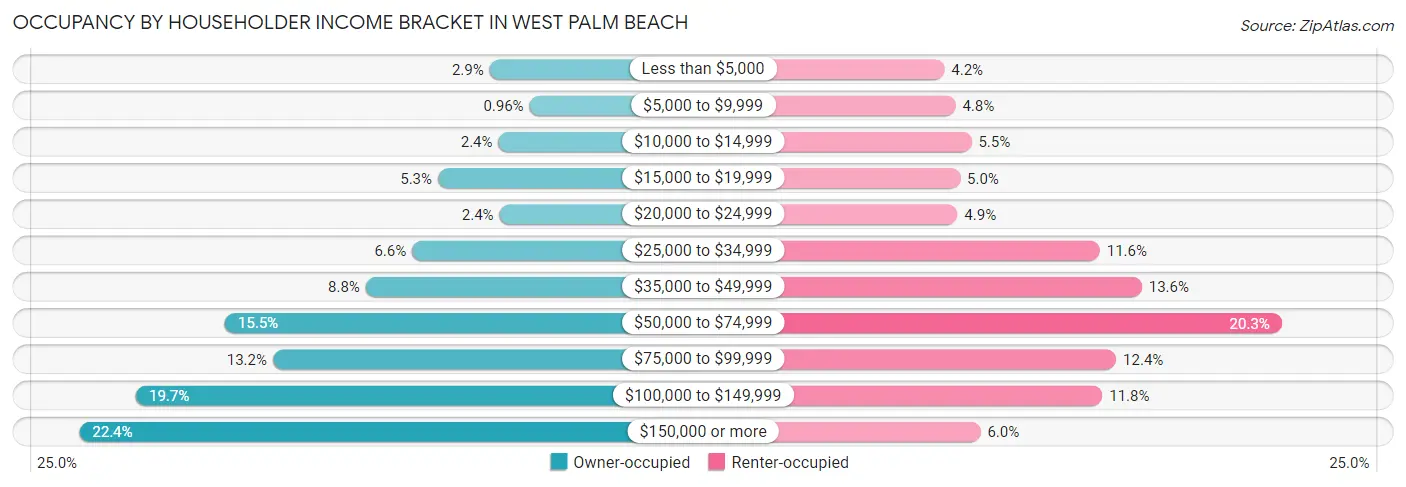
| Income Bracket | Owner-occupied | Renter-occupied |
| Less than $5,000 | 701 (2.9%) | 1,048 (4.2%) |
| $5,000 to $9,999 | 235 (1.0%) | 1,181 (4.8%) |
| $10,000 to $14,999 | 599 (2.4%) | 1,369 (5.5%) |
| $15,000 to $19,999 | 1,305 (5.3%) | 1,235 (5.0%) |
| $20,000 to $24,999 | 588 (2.4%) | 1,202 (4.9%) |
| $25,000 to $34,999 | 1,609 (6.6%) | 2,883 (11.6%) |
| $35,000 to $49,999 | 2,150 (8.8%) | 3,380 (13.6%) |
| $50,000 to $74,999 | 3,796 (15.5%) | 5,031 (20.3%) |
| $75,000 to $99,999 | 3,237 (13.2%) | 3,077 (12.4%) |
| $100,000 to $149,999 | 4,835 (19.7%) | 2,914 (11.7%) |
| $150,000 or more | 5,497 (22.4%) | 1,476 (5.9%) |
| Total | 24,552 (100.0%) | 24,796 (100.0%) |
Monthly Housing Cost Tiers in West Palm Beach
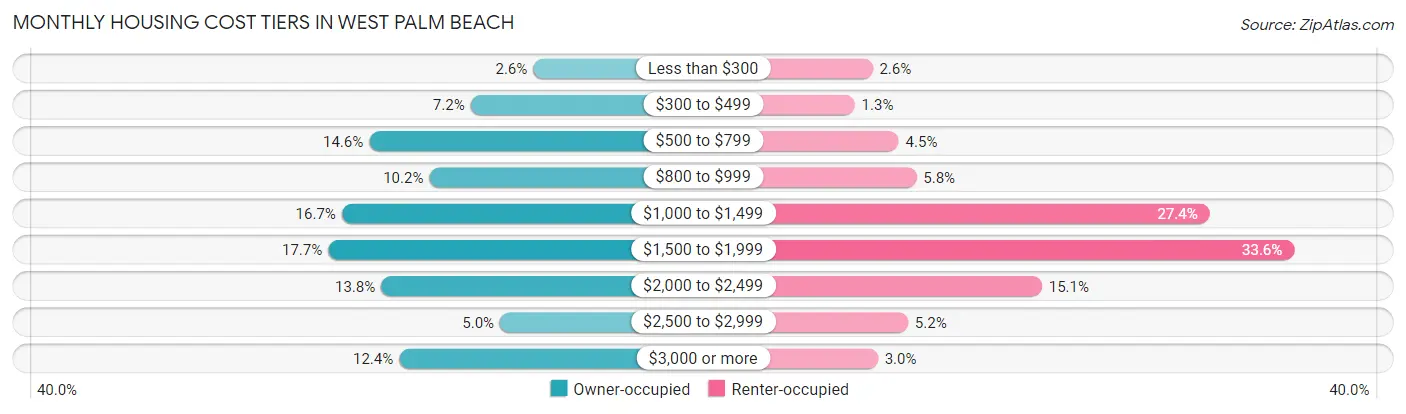
| Monthly Cost | Owner-occupied | Renter-occupied |
| Less than $300 | 625 (2.5%) | 640 (2.6%) |
| $300 to $499 | 1,759 (7.2%) | 316 (1.3%) |
| $500 to $799 | 3,591 (14.6%) | 1,118 (4.5%) |
| $800 to $999 | 2,505 (10.2%) | 1,440 (5.8%) |
| $1,000 to $1,499 | 4,088 (16.7%) | 6,794 (27.4%) |
| $1,500 to $1,999 | 4,333 (17.6%) | 8,338 (33.6%) |
| $2,000 to $2,499 | 3,376 (13.8%) | 3,733 (15.0%) |
| $2,500 to $2,999 | 1,225 (5.0%) | 1,286 (5.2%) |
| $3,000 or more | 3,050 (12.4%) | 737 (3.0%) |
| Total | 24,552 (100.0%) | 24,796 (100.0%) |
Physical Housing Characteristics in West Palm Beach
Housing Structures in West Palm Beach
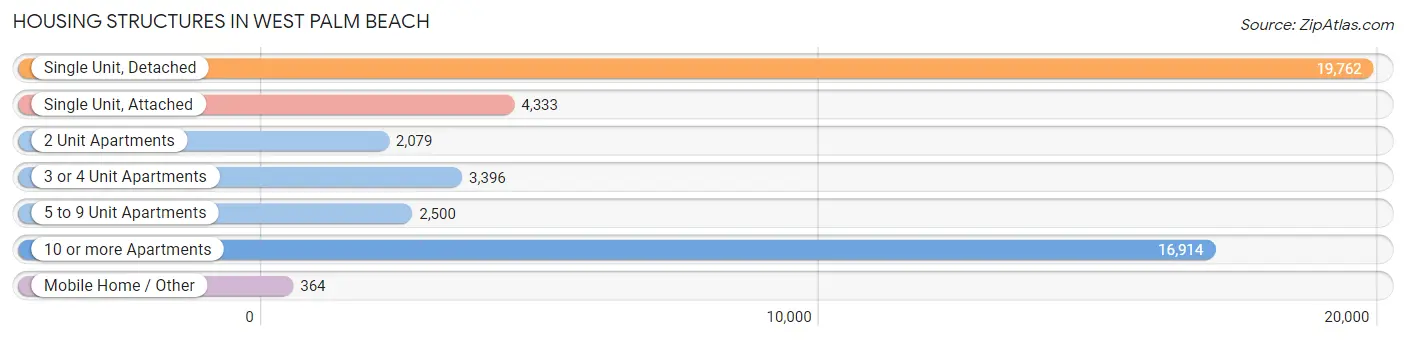
| Structure Type | # Housing Units | % Housing Units |
| Single Unit, Detached | 19,762 | 40.1% |
| Single Unit, Attached | 4,333 | 8.8% |
| 2 Unit Apartments | 2,079 | 4.2% |
| 3 or 4 Unit Apartments | 3,396 | 6.9% |
| 5 to 9 Unit Apartments | 2,500 | 5.1% |
| 10 or more Apartments | 16,914 | 34.3% |
| Mobile Home / Other | 364 | 0.7% |
| Total | 49,348 | 100.0% |
Housing Structures by Occupancy in West Palm Beach
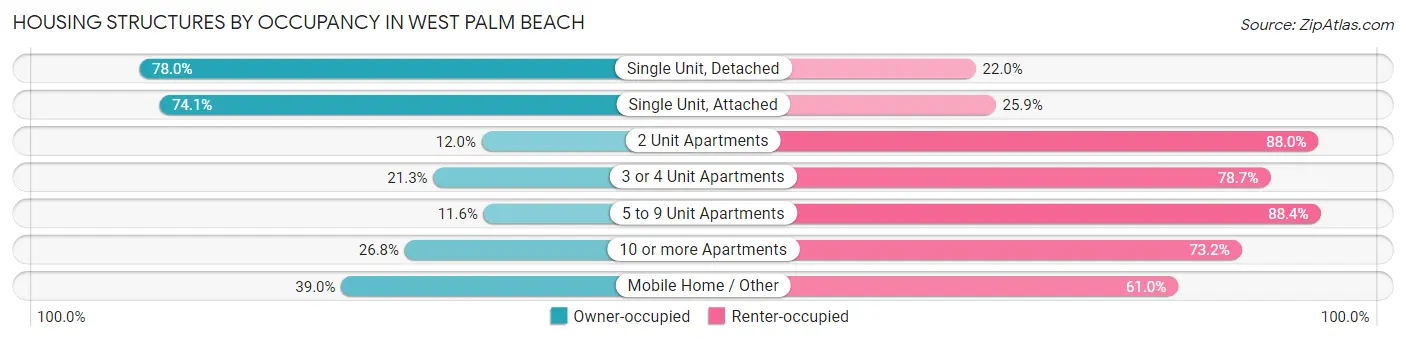
| Structure Type | Owner-occupied | Renter-occupied |
| Single Unit, Detached | 15,407 (78.0%) | 4,355 (22.0%) |
| Single Unit, Attached | 3,212 (74.1%) | 1,121 (25.9%) |
| 2 Unit Apartments | 249 (12.0%) | 1,830 (88.0%) |
| 3 or 4 Unit Apartments | 723 (21.3%) | 2,673 (78.7%) |
| 5 to 9 Unit Apartments | 290 (11.6%) | 2,210 (88.4%) |
| 10 or more Apartments | 4,529 (26.8%) | 12,385 (73.2%) |
| Mobile Home / Other | 142 (39.0%) | 222 (61.0%) |
| Total | 24,552 (49.7%) | 24,796 (50.2%) |
Housing Structures by Number of Rooms in West Palm Beach
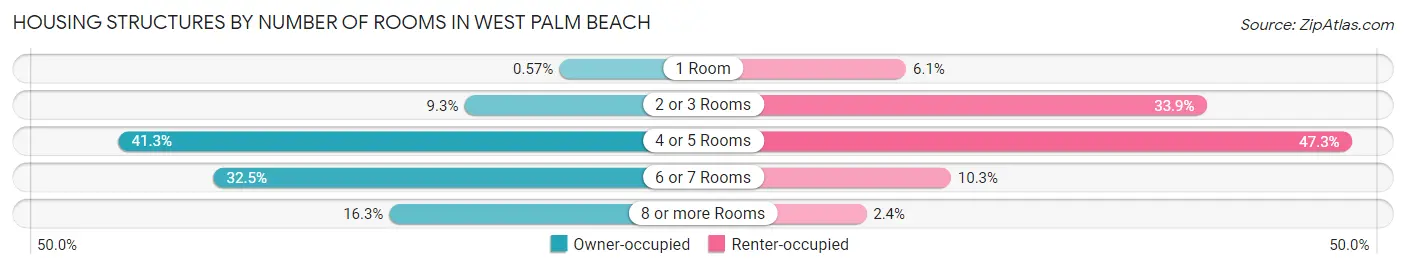
| Number of Rooms | Owner-occupied | Renter-occupied |
| 1 Room | 139 (0.6%) | 1,517 (6.1%) |
| 2 or 3 Rooms | 2,294 (9.3%) | 8,401 (33.9%) |
| 4 or 5 Rooms | 10,139 (41.3%) | 11,729 (47.3%) |
| 6 or 7 Rooms | 7,983 (32.5%) | 2,544 (10.3%) |
| 8 or more Rooms | 3,997 (16.3%) | 605 (2.4%) |
| Total | 24,552 (100.0%) | 24,796 (100.0%) |
Housing Structure by Heating Type in West Palm Beach
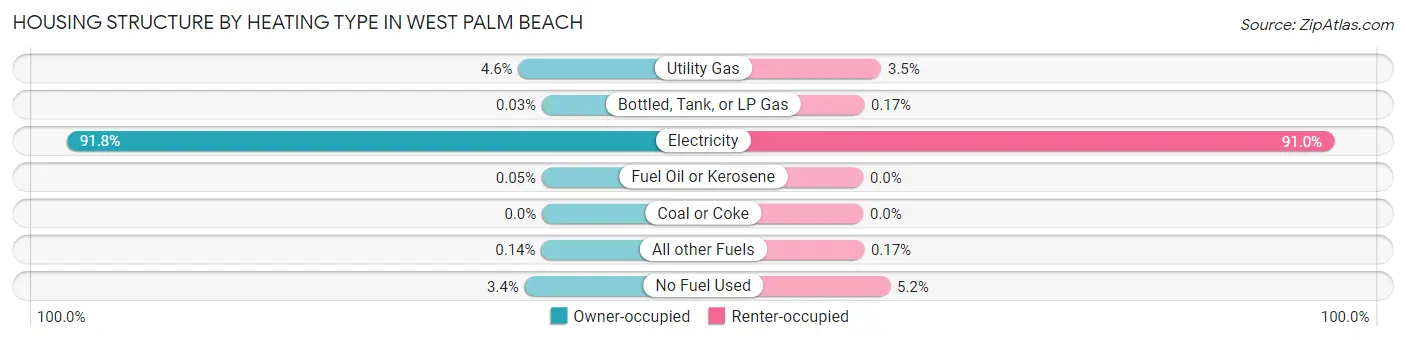
| Heating Type | Owner-occupied | Renter-occupied |
| Utility Gas | 1,124 (4.6%) | 858 (3.5%) |
| Bottled, Tank, or LP Gas | 8 (0.0%) | 43 (0.2%) |
| Electricity | 22,546 (91.8%) | 22,563 (91.0%) |
| Fuel Oil or Kerosene | 12 (0.1%) | 0 (0.0%) |
| Coal or Coke | 0 (0.0%) | 0 (0.0%) |
| All other Fuels | 34 (0.1%) | 41 (0.2%) |
| No Fuel Used | 828 (3.4%) | 1,291 (5.2%) |
| Total | 24,552 (100.0%) | 24,796 (100.0%) |
Household Vehicle Usage in West Palm Beach
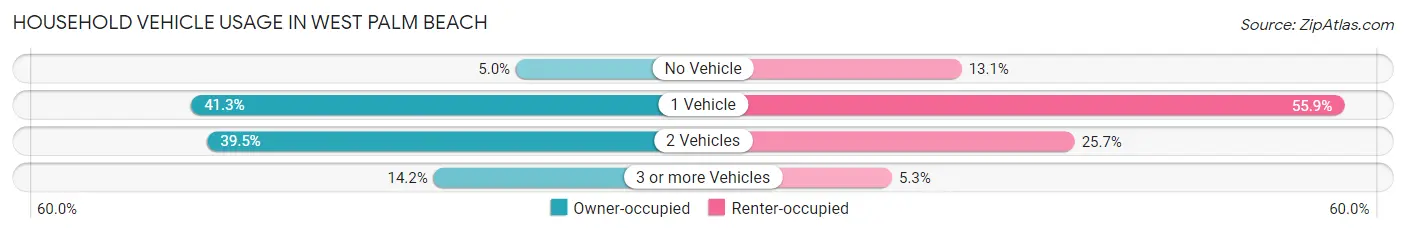
| Vehicles per Household | Owner-occupied | Renter-occupied |
| No Vehicle | 1,219 (5.0%) | 3,244 (13.1%) |
| 1 Vehicle | 10,147 (41.3%) | 13,861 (55.9%) |
| 2 Vehicles | 9,703 (39.5%) | 6,382 (25.7%) |
| 3 or more Vehicles | 3,483 (14.2%) | 1,309 (5.3%) |
| Total | 24,552 (100.0%) | 24,796 (100.0%) |
Real Estate & Mortgages in West Palm Beach
Real Estate and Mortgage Overview in West Palm Beach
| Characteristic | Without Mortgage | With Mortgage |
| Housing Units | 11,135 | 13,417 |
| Median Property Value | $307,600 | $334,700 |
| Median Household Income | $69,372 | $3,281 |
| Monthly Housing Costs | $782 | $2,754 |
| Real Estate Taxes | $2,879 | $227 |
Property Value by Mortgage Status in West Palm Beach
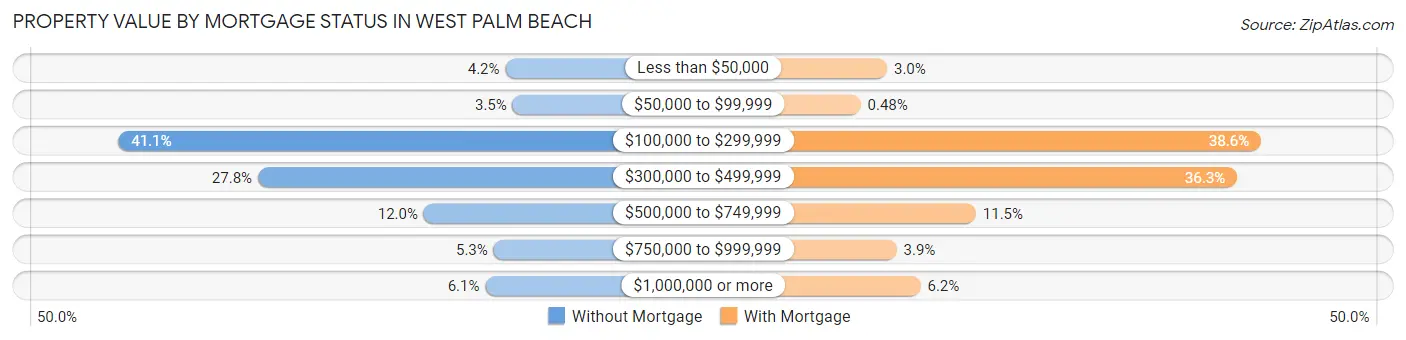
| Property Value | Without Mortgage | With Mortgage |
| Less than $50,000 | 469 (4.2%) | 402 (3.0%) |
| $50,000 to $99,999 | 392 (3.5%) | 65 (0.5%) |
| $100,000 to $299,999 | 4,573 (41.1%) | 5,182 (38.6%) |
| $300,000 to $499,999 | 3,093 (27.8%) | 4,876 (36.3%) |
| $500,000 to $749,999 | 1,334 (12.0%) | 1,538 (11.5%) |
| $750,000 to $999,999 | 593 (5.3%) | 524 (3.9%) |
| $1,000,000 or more | 681 (6.1%) | 830 (6.2%) |
| Total | 11,135 (100.0%) | 13,417 (100.0%) |
Household Income by Mortgage Status in West Palm Beach
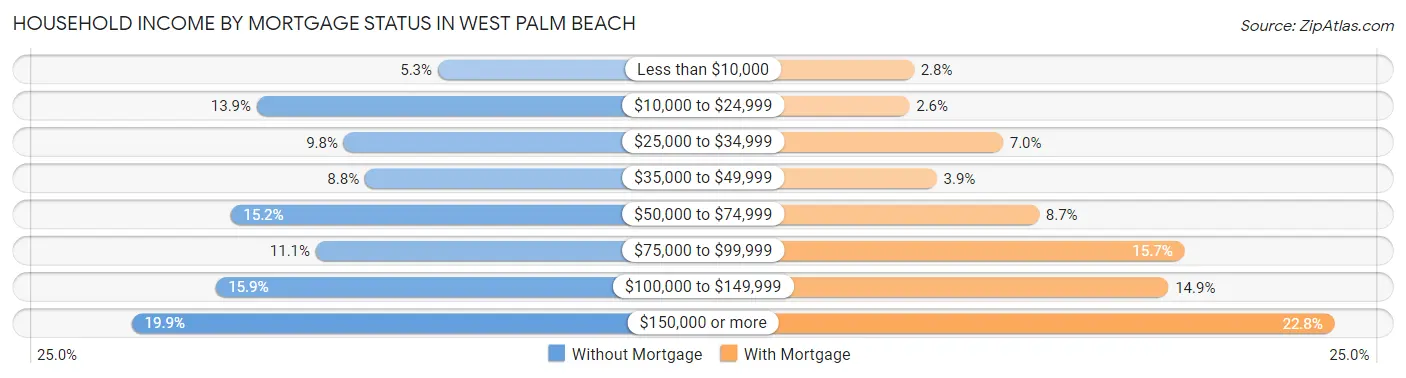
| Household Income | Without Mortgage | With Mortgage |
| Less than $10,000 | 592 (5.3%) | 371 (2.8%) |
| $10,000 to $24,999 | 1,552 (13.9%) | 344 (2.6%) |
| $25,000 to $34,999 | 1,091 (9.8%) | 940 (7.0%) |
| $35,000 to $49,999 | 979 (8.8%) | 518 (3.9%) |
| $50,000 to $74,999 | 1,693 (15.2%) | 1,171 (8.7%) |
| $75,000 to $99,999 | 1,239 (11.1%) | 2,103 (15.7%) |
| $100,000 to $149,999 | 1,773 (15.9%) | 1,998 (14.9%) |
| $150,000 or more | 2,216 (19.9%) | 3,062 (22.8%) |
| Total | 11,135 (100.0%) | 13,417 (100.0%) |
Property Value to Household Income Ratio in West Palm Beach
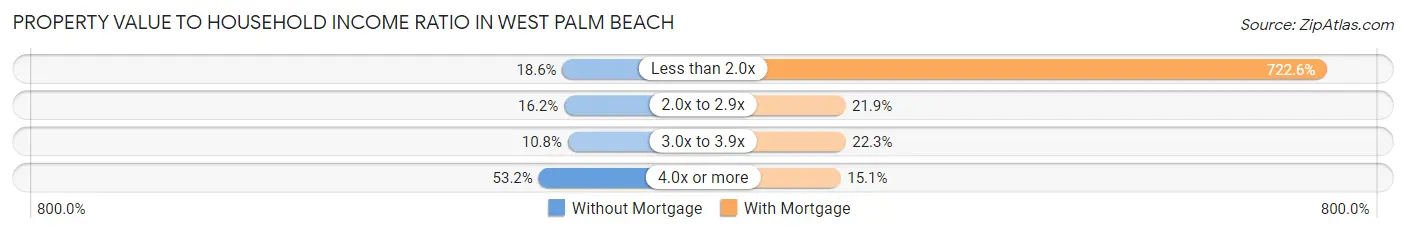
| Value-to-Income Ratio | Without Mortgage | With Mortgage |
| Less than 2.0x | 2,065 (18.5%) | 96,950 (722.6%) |
| 2.0x to 2.9x | 1,802 (16.2%) | 2,944 (21.9%) |
| 3.0x to 3.9x | 1,200 (10.8%) | 2,992 (22.3%) |
| 4.0x or more | 5,927 (53.2%) | 2,019 (15.0%) |
| Total | 11,135 (100.0%) | 13,417 (100.0%) |
Real Estate Taxes by Mortgage Status in West Palm Beach
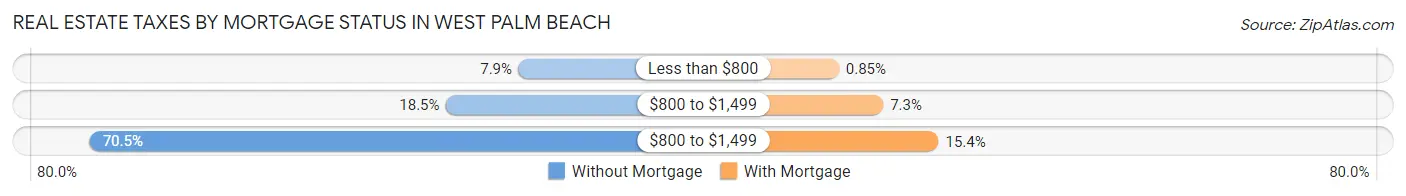
| Property Taxes | Without Mortgage | With Mortgage |
| Less than $800 | 882 (7.9%) | 114 (0.9%) |
| $800 to $1,499 | 2,062 (18.5%) | 983 (7.3%) |
| $800 to $1,499 | 7,848 (70.5%) | 2,069 (15.4%) |
| Total | 11,135 (100.0%) | 13,417 (100.0%) |
Health & Disability in West Palm Beach
Health Insurance Coverage by Age in West Palm Beach
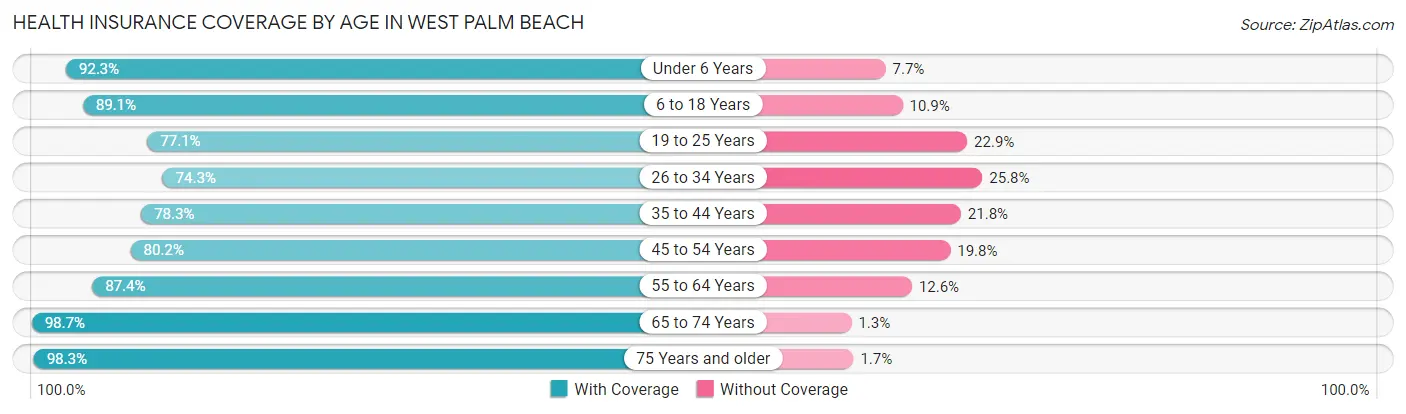
| Age Bracket | With Coverage | Without Coverage |
| Under 6 Years | 7,521 (92.3%) | 627 (7.7%) |
| 6 to 18 Years | 12,577 (89.1%) | 1,532 (10.9%) |
| 19 to 25 Years | 9,076 (77.1%) | 2,698 (22.9%) |
| 26 to 34 Years | 12,368 (74.3%) | 4,289 (25.8%) |
| 35 to 44 Years | 11,440 (78.2%) | 3,180 (21.7%) |
| 45 to 54 Years | 11,483 (80.2%) | 2,827 (19.8%) |
| 55 to 64 Years | 12,449 (87.4%) | 1,798 (12.6%) |
| 65 to 74 Years | 11,828 (98.7%) | 159 (1.3%) |
| 75 Years and older | 10,037 (98.3%) | 175 (1.7%) |
| Total | 98,779 (85.1%) | 17,285 (14.9%) |
Health Insurance Coverage by Citizenship Status in West Palm Beach
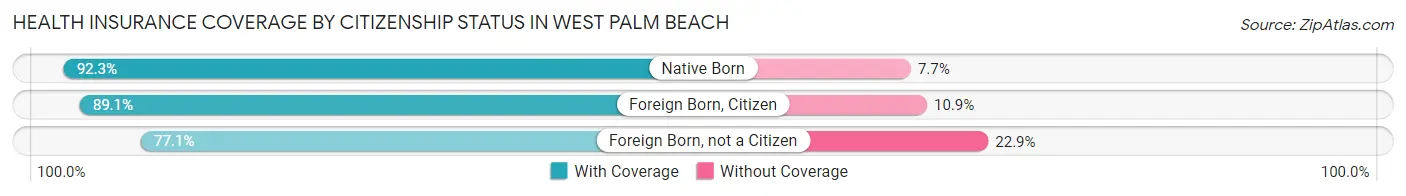
| Citizenship Status | With Coverage | Without Coverage |
| Native Born | 7,521 (92.3%) | 627 (7.7%) |
| Foreign Born, Citizen | 12,577 (89.1%) | 1,532 (10.9%) |
| Foreign Born, not a Citizen | 9,076 (77.1%) | 2,698 (22.9%) |
Health Insurance Coverage by Household Income in West Palm Beach
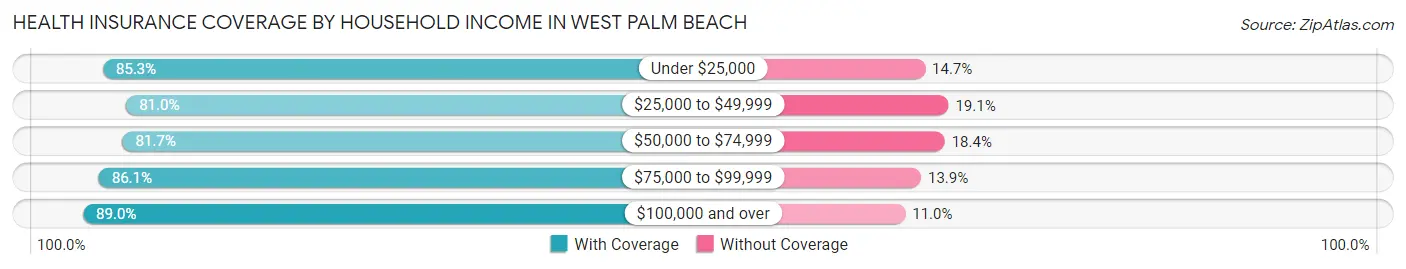
| Household Income | With Coverage | Without Coverage |
| Under $25,000 | 14,249 (85.3%) | 2,450 (14.7%) |
| $25,000 to $49,999 | 17,836 (80.9%) | 4,197 (19.1%) |
| $50,000 to $74,999 | 16,357 (81.7%) | 3,675 (18.3%) |
| $75,000 to $99,999 | 13,335 (86.1%) | 2,155 (13.9%) |
| $100,000 and over | 34,754 (89.0%) | 4,280 (11.0%) |
Public vs Private Health Insurance Coverage by Age in West Palm Beach
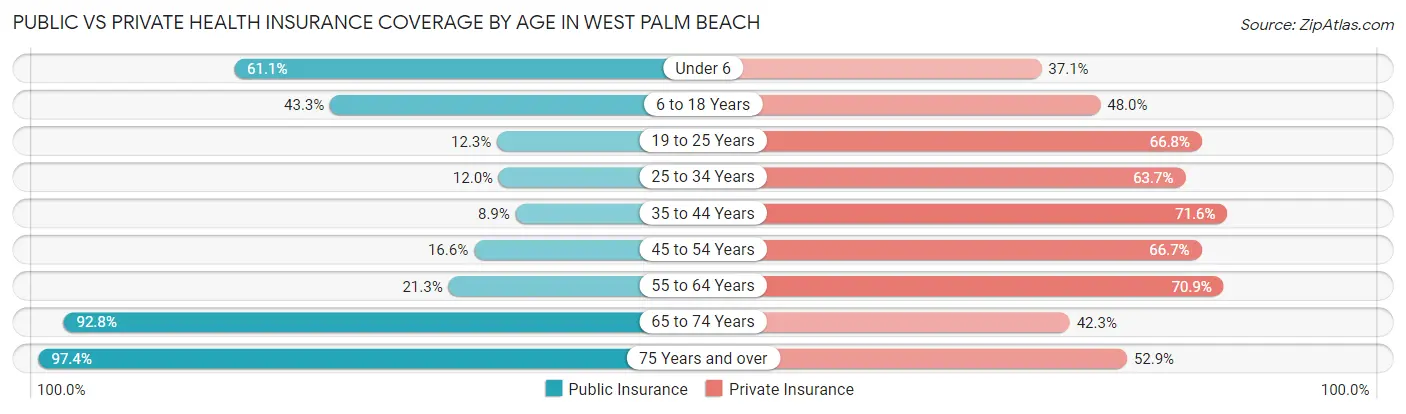
| Age Bracket | Public Insurance | Private Insurance |
| Under 6 | 4,980 (61.1%) | 3,019 (37.0%) |
| 6 to 18 Years | 6,108 (43.3%) | 6,770 (48.0%) |
| 19 to 25 Years | 1,447 (12.3%) | 7,868 (66.8%) |
| 25 to 34 Years | 1,992 (12.0%) | 10,618 (63.7%) |
| 35 to 44 Years | 1,295 (8.9%) | 10,462 (71.6%) |
| 45 to 54 Years | 2,374 (16.6%) | 9,550 (66.7%) |
| 55 to 64 Years | 3,038 (21.3%) | 10,098 (70.9%) |
| 65 to 74 Years | 11,119 (92.8%) | 5,072 (42.3%) |
| 75 Years and over | 9,947 (97.4%) | 5,405 (52.9%) |
| Total | 42,300 (36.4%) | 68,862 (59.3%) |
Disability Status by Sex by Age in West Palm Beach
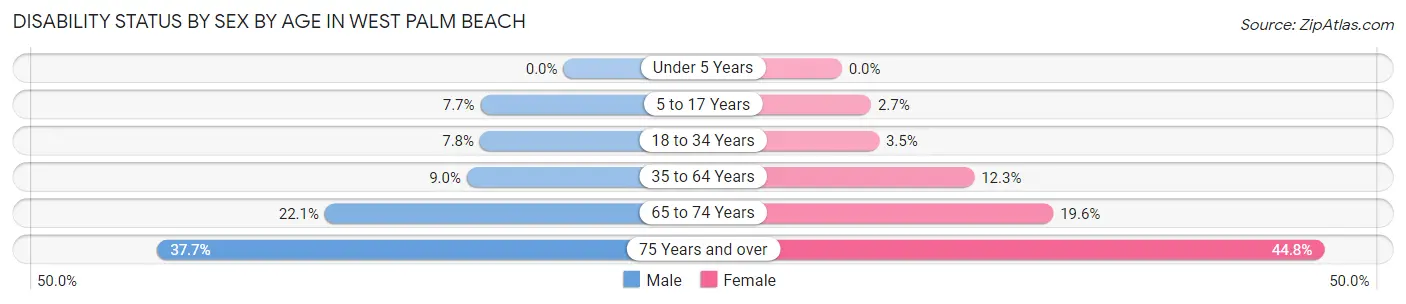
| Age Bracket | Male | Female |
| Under 5 Years | 0 (0.0%) | 0 (0.0%) |
| 5 to 17 Years | 580 (7.7%) | 167 (2.7%) |
| 18 to 34 Years | 1,139 (7.7%) | 529 (3.5%) |
| 35 to 64 Years | 1,880 (9.0%) | 2,728 (12.3%) |
| 65 to 74 Years | 1,115 (22.1%) | 1,364 (19.6%) |
| 75 Years and over | 1,660 (37.7%) | 2,599 (44.8%) |
Disability Class by Sex by Age in West Palm Beach
Disability Class: Hearing Difficulty
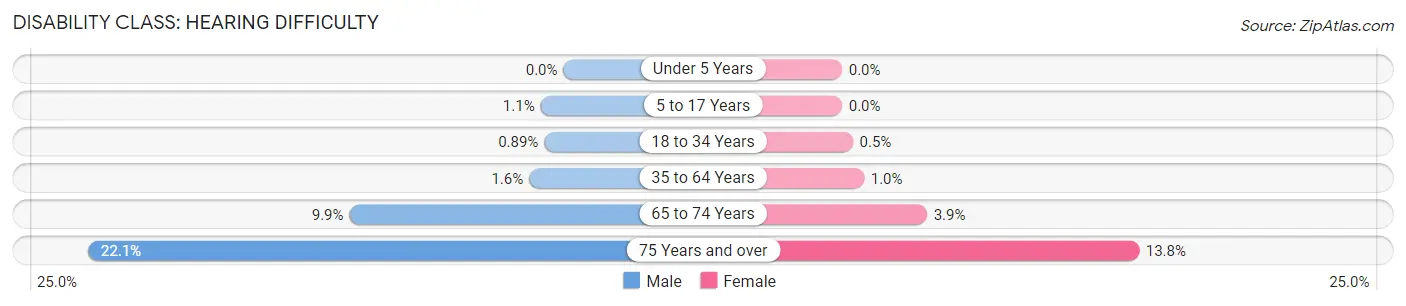
| Age Bracket | Male | Female |
| Under 5 Years | 0 (0.0%) | 0 (0.0%) |
| 5 to 17 Years | 80 (1.1%) | 0 (0.0%) |
| 18 to 34 Years | 131 (0.9%) | 76 (0.5%) |
| 35 to 64 Years | 334 (1.6%) | 226 (1.0%) |
| 65 to 74 Years | 500 (9.9%) | 274 (3.9%) |
| 75 Years and over | 972 (22.1%) | 800 (13.8%) |
Disability Class: Vision Difficulty
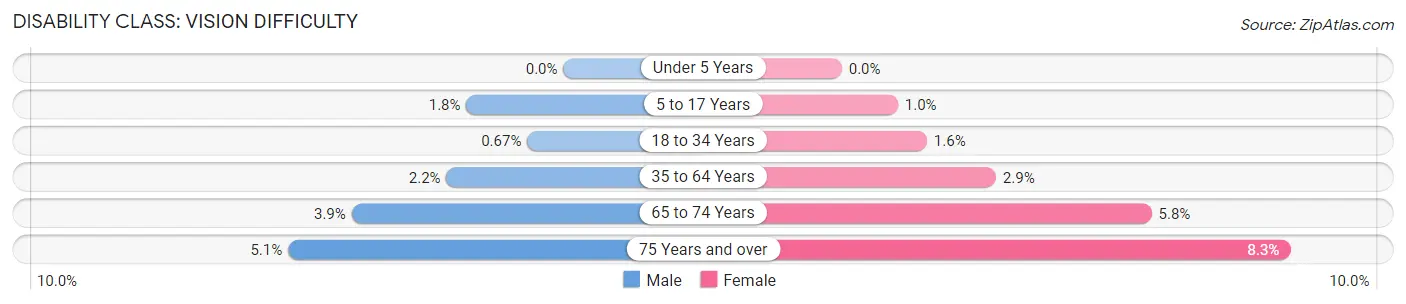
| Age Bracket | Male | Female |
| Under 5 Years | 0 (0.0%) | 0 (0.0%) |
| 5 to 17 Years | 136 (1.8%) | 64 (1.0%) |
| 18 to 34 Years | 99 (0.7%) | 242 (1.6%) |
| 35 to 64 Years | 455 (2.2%) | 634 (2.9%) |
| 65 to 74 Years | 198 (3.9%) | 400 (5.8%) |
| 75 Years and over | 225 (5.1%) | 484 (8.3%) |
Disability Class: Cognitive Difficulty
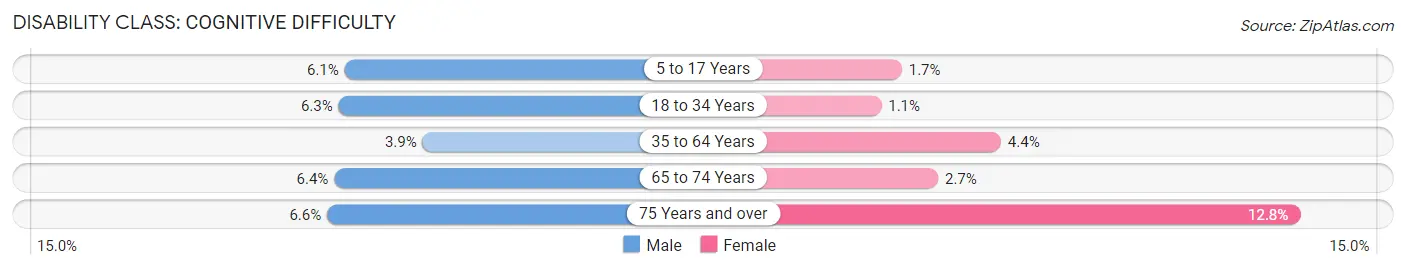
| Age Bracket | Male | Female |
| 5 to 17 Years | 459 (6.1%) | 103 (1.7%) |
| 18 to 34 Years | 920 (6.3%) | 169 (1.1%) |
| 35 to 64 Years | 823 (3.9%) | 982 (4.4%) |
| 65 to 74 Years | 321 (6.4%) | 186 (2.7%) |
| 75 Years and over | 290 (6.6%) | 741 (12.8%) |
Disability Class: Ambulatory Difficulty
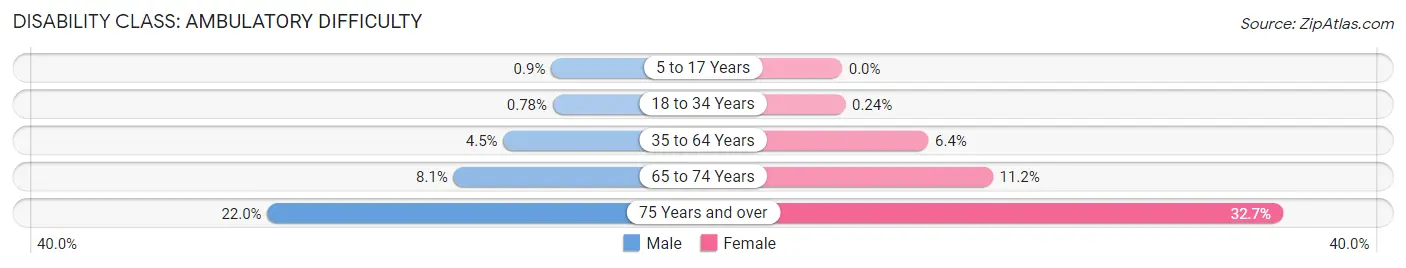
| Age Bracket | Male | Female |
| 5 to 17 Years | 68 (0.9%) | 0 (0.0%) |
| 18 to 34 Years | 114 (0.8%) | 37 (0.2%) |
| 35 to 64 Years | 934 (4.4%) | 1,422 (6.4%) |
| 65 to 74 Years | 410 (8.1%) | 778 (11.2%) |
| 75 Years and over | 968 (22.0%) | 1,901 (32.7%) |
Disability Class: Self-Care Difficulty
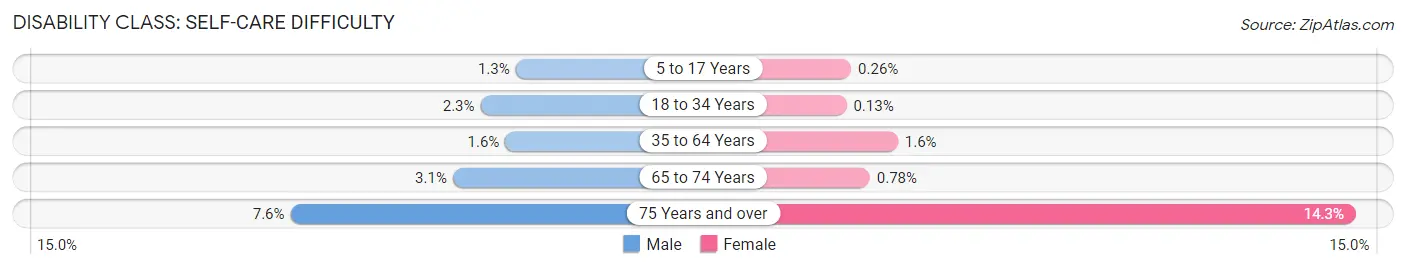
| Age Bracket | Male | Female |
| 5 to 17 Years | 100 (1.3%) | 16 (0.3%) |
| 18 to 34 Years | 339 (2.3%) | 20 (0.1%) |
| 35 to 64 Years | 340 (1.6%) | 346 (1.6%) |
| 65 to 74 Years | 155 (3.1%) | 54 (0.8%) |
| 75 Years and over | 335 (7.6%) | 831 (14.3%) |
Technology Access in West Palm Beach
Computing Device Access in West Palm Beach
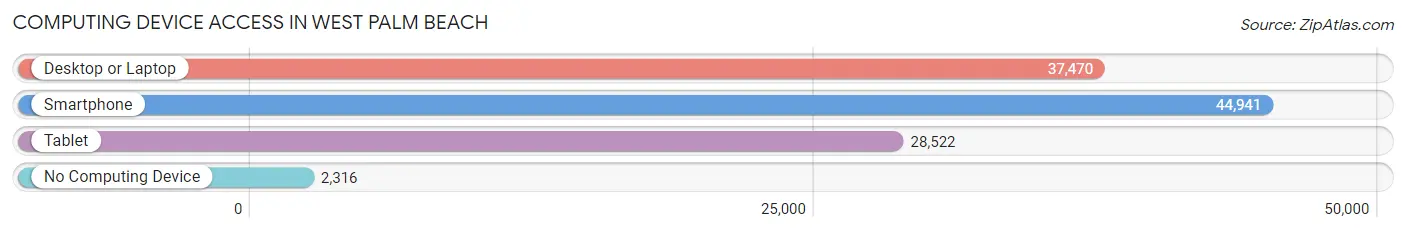
| Device Type | # Households | % Households |
| Desktop or Laptop | 37,470 | 75.9% |
| Smartphone | 44,941 | 91.1% |
| Tablet | 28,522 | 57.8% |
| No Computing Device | 2,316 | 4.7% |
| Total | 49,348 | 100.0% |
Internet Access in West Palm Beach
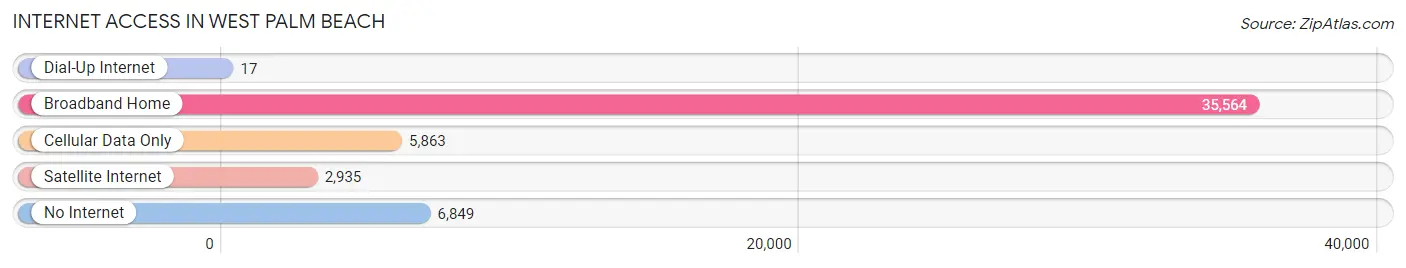
| Internet Type | # Households | % Households |
| Dial-Up Internet | 17 | 0.0% |
| Broadband Home | 35,564 | 72.1% |
| Cellular Data Only | 5,863 | 11.9% |
| Satellite Internet | 2,935 | 5.9% |
| No Internet | 6,849 | 13.9% |
| Total | 49,348 | 100.0% |
West Palm Beach Summary
West Palm Beach is a city located in Palm Beach County, Florida, United States. It is the county seat and largest city in the county. As of the 2010 census, the city had a population of 99,919. The city is located approximately 68 miles north of Miami.
History
West Palm Beach was founded in 1894 by Henry Flagler, a railroad magnate. Flagler had purchased the land from the Seminole Indians and developed it into a resort town. The city was incorporated in 1894 and was named after Flagler's Palm Beach Hotel.
In the early 1900s, the city experienced a period of growth and development. The city was home to many wealthy residents, including the Vanderbilts, the Astors, and the DuPonts. The city was also home to many celebrities, including President John F. Kennedy, who spent his honeymoon in West Palm Beach.
In the 1950s, the city experienced a period of decline as many of its wealthy residents moved away. The city was also hit hard by the Great Depression and World War II.
In the 1960s, the city began to experience a period of revitalization. The city was home to many new businesses and industries, including the IBM Corporation. The city also experienced a population boom, as many people moved to the city from other parts of the country.
Geography
West Palm Beach is located in southeastern Florida, on the Atlantic coast. The city is located on the eastern shore of Lake Okeechobee, the largest lake in the state. The city is located approximately 68 miles north of Miami.
The city has a total area of 55.6 square miles, of which 54.2 square miles is land and 1.4 square miles is water. The city is located at an elevation of 10 feet above sea level.
Economy
West Palm Beach is a major economic center in the state of Florida. The city is home to many large corporations, including IBM, Office Depot, and the Florida East Coast Railway. The city is also home to many small businesses, including restaurants, retail stores, and professional services.
The city is also home to many tourist attractions, including the Flagler Museum, the Norton Museum of Art, and the Palm Beach Zoo. The city is also home to many cultural events, including the SunFest music festival and the Palm Beach International Film Festival.
Demographics
As of the 2010 census, the city had a population of 99,919. The racial makeup of the city was 57.2% White, 28.3% African American, 0.4% Native American, 2.2% Asian, 0.1% Pacific Islander, 8.3% from other races, and 3.5% from two or more races. Hispanic or Latino of any race were 20.2% of the population.
The median income for a household in the city was $41,939, and the median income for a family was $50,819. The per capita income for the city was $25,845. About 16.2% of the population was below the poverty line.
Common Questions
What is Per Capita Income in West Palm Beach?
Per Capita income in West Palm Beach is $41,610.
What is the Median Family Income in West Palm Beach?
Median Family Income in West Palm Beach is $75,211.
What is the Median Household income in West Palm Beach?
Median Household Income in West Palm Beach is $64,044.
What is Income or Wage Gap in West Palm Beach?
Income or Wage Gap in West Palm Beach is 23.5%.
Women in West Palm Beach earn 76.5 cents for every dollar earned by a man.
What is Family Income Deficit in West Palm Beach?
Family Income Deficit in West Palm Beach is $10,343.
Families that are below poverty line in West Palm Beach earn $10,343 less on average than the poverty threshold level.
What is Inequality or Gini Index in West Palm Beach?
Inequality or Gini Index in West Palm Beach is 0.51.
What is the Total Population of West Palm Beach?
Total Population of West Palm Beach is 117,588.
What is the Total Male Population of West Palm Beach?
Total Male Population of West Palm Beach is 56,854.
What is the Total Female Population of West Palm Beach?
Total Female Population of West Palm Beach is 60,734.
What is the Ratio of Males per 100 Females in West Palm Beach?
There are 93.61 Males per 100 Females in West Palm Beach.
What is the Ratio of Females per 100 Males in West Palm Beach?
There are 106.82 Females per 100 Males in West Palm Beach.
What is the Median Population Age in West Palm Beach?
Median Population Age in West Palm Beach is 40.2 Years.
What is the Average Family Size in West Palm Beach
Average Family Size in West Palm Beach is 3.1 People.
What is the Average Household Size in West Palm Beach
Average Household Size in West Palm Beach is 2.3 People.
How Large is the Labor Force in West Palm Beach?
There are 62,516 People in the Labor Forcein in West Palm Beach.
What is the Percentage of People in the Labor Force in West Palm Beach?
63.0% of People are in the Labor Force in West Palm Beach.
What is the Unemployment Rate in West Palm Beach?
Unemployment Rate in West Palm Beach is 6.2%.