Charlotte, NC Map & Demographics
Charlotte Map
Charlotte Overview
$47,476
PER CAPITA INCOME
$93,023
AVG FAMILY INCOME
$74,070
AVG HOUSEHOLD INCOME
22.2%
WAGE / INCOME GAP [ % ]
77.8¢/ $1
WAGE / INCOME GAP [ $ ]
$10,992
FAMILY INCOME DEFICIT
0.50
INEQUALITY / GINI INDEX
875,045
TOTAL POPULATION
424,173
MALE POPULATION
450,872
FEMALE POPULATION
94.08
MALES / 100 FEMALES
106.29
FEMALES / 100 MALES
34.5
MEDIAN AGE
3.2
AVG FAMILY SIZE
2.4
AVG HOUSEHOLD SIZE
502,387
LABOR FORCE [ PEOPLE ]
72.1%
PERCENT IN LABOR FORCE
4.7%
UNEMPLOYMENT RATE
Charlotte Zip Codes
Income in Charlotte
Income Overview in Charlotte
Per Capita Income in Charlotte is $47,476, while median incomes of families and households are $93,023 and $74,070 respectively.
| Characteristic | Number | Measure |
| Per Capita Income | 875,045 | $47,476 |
| Median Family Income | 200,040 | $93,023 |
| Mean Family Income | 200,040 | $140,424 |
| Median Household Income | 354,442 | $74,070 |
| Mean Household Income | 354,442 | $113,613 |
| Income Deficit | 200,040 | $10,992 |
| Wage / Income Gap (%) | 875,045 | 22.16% |
| Wage / Income Gap ($) | 875,045 | 77.84¢ per $1 |
| Gini / Inequality Index | 875,045 | 0.50 |
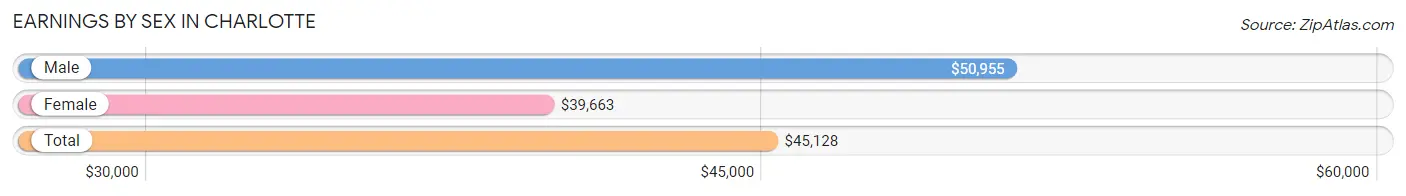
Earnings by Sex in Charlotte
Average Earnings in Charlotte are $45,128, $50,955 for men and $39,663 for women, a difference of 22.2%.
| Sex | Number | Average Earnings |
| Male | 264,575 (51.1%) | $50,955 |
| Female | 252,794 (48.9%) | $39,663 |
| Total | 517,369 (100.0%) | $45,128 |
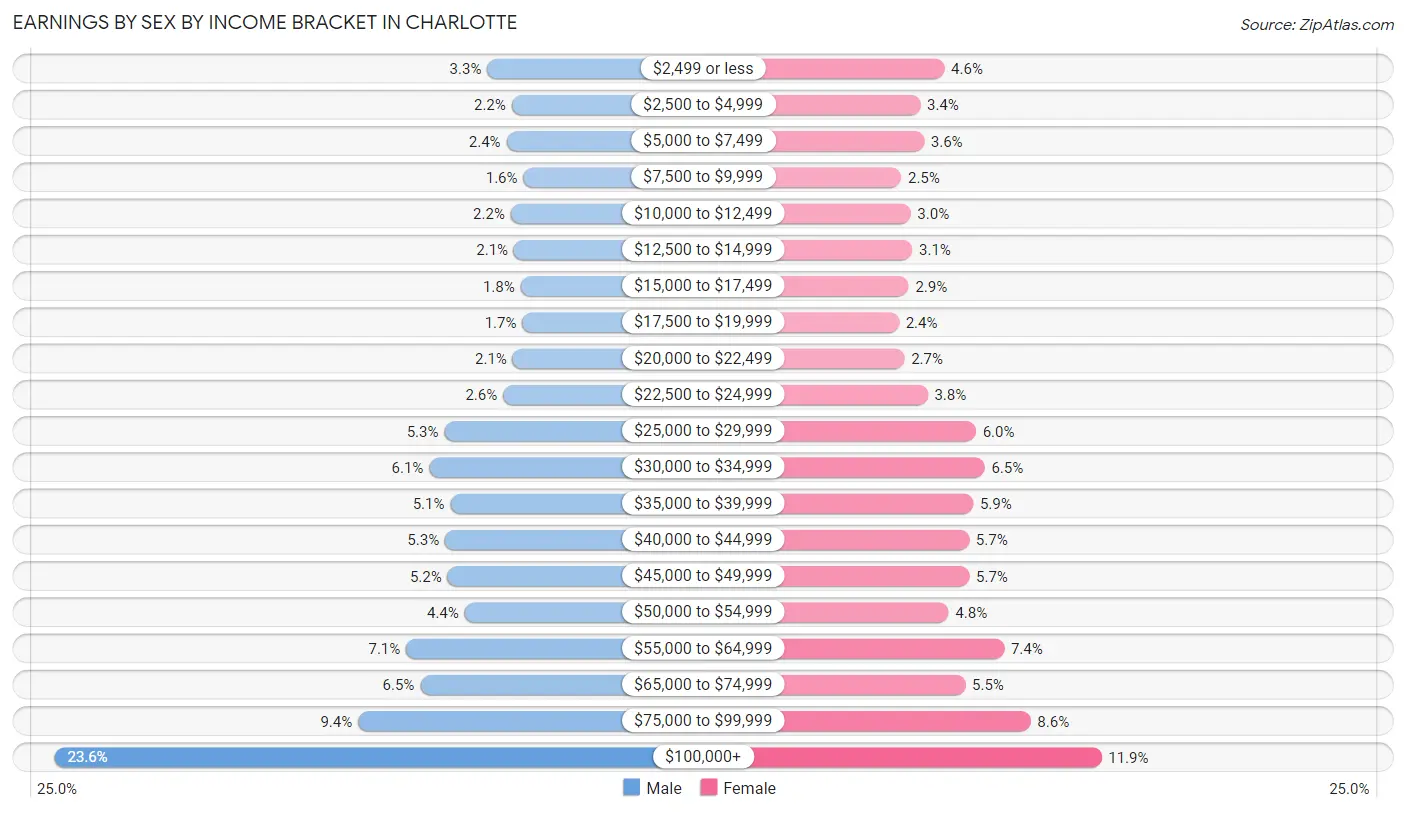
Earnings by Sex by Income Bracket in Charlotte
The most common earnings brackets in Charlotte are $100,000+ for men (62,450 | 23.6%) and $100,000+ for women (30,127 | 11.9%).
| Income | Male | Female |
| $2,499 or less | 8,799 (3.3%) | 11,539 (4.6%) |
| $2,500 to $4,999 | 5,785 (2.2%) | 8,665 (3.4%) |
| $5,000 to $7,499 | 6,425 (2.4%) | 9,125 (3.6%) |
| $7,500 to $9,999 | 4,330 (1.6%) | 6,409 (2.5%) |
| $10,000 to $12,499 | 5,893 (2.2%) | 7,543 (3.0%) |
| $12,500 to $14,999 | 5,511 (2.1%) | 7,727 (3.1%) |
| $15,000 to $17,499 | 4,673 (1.8%) | 7,310 (2.9%) |
| $17,500 to $19,999 | 4,473 (1.7%) | 6,147 (2.4%) |
| $20,000 to $22,499 | 5,666 (2.1%) | 6,796 (2.7%) |
| $22,500 to $24,999 | 6,853 (2.6%) | 9,557 (3.8%) |
| $25,000 to $29,999 | 14,137 (5.3%) | 15,277 (6.0%) |
| $30,000 to $34,999 | 16,013 (6.0%) | 16,315 (6.5%) |
| $35,000 to $39,999 | 13,395 (5.1%) | 14,940 (5.9%) |
| $40,000 to $44,999 | 14,037 (5.3%) | 14,457 (5.7%) |
| $45,000 to $49,999 | 13,726 (5.2%) | 14,475 (5.7%) |
| $50,000 to $54,999 | 11,604 (4.4%) | 12,029 (4.8%) |
| $55,000 to $64,999 | 18,858 (7.1%) | 18,617 (7.4%) |
| $65,000 to $74,999 | 17,121 (6.5%) | 14,009 (5.5%) |
| $75,000 to $99,999 | 24,826 (9.4%) | 21,730 (8.6%) |
| $100,000+ | 62,450 (23.6%) | 30,127 (11.9%) |
| Total | 264,575 (100.0%) | 252,794 (100.0%) |
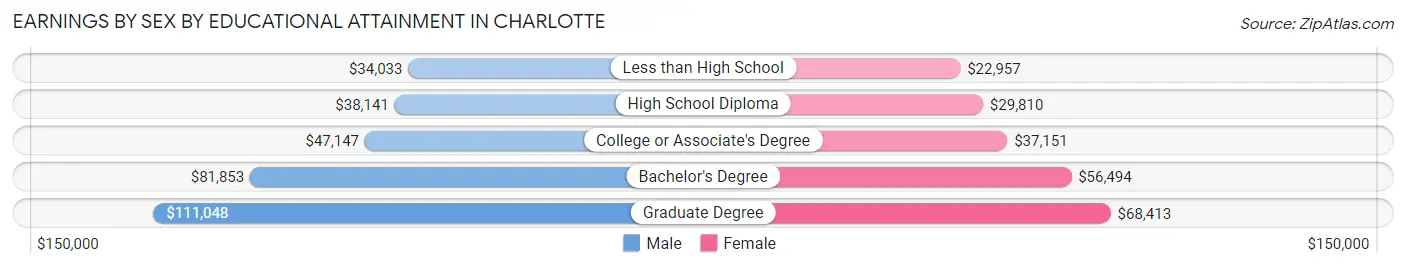
Earnings by Sex by Educational Attainment in Charlotte
Average earnings in Charlotte are $58,305 for men and $44,573 for women, a difference of 23.5%. Men with an educational attainment of graduate degree enjoy the highest average annual earnings of $111,048, while those with less than high school education earn the least with $34,033. Women with an educational attainment of graduate degree earn the most with the average annual earnings of $68,413, while those with less than high school education have the smallest earnings of $22,957.
| Educational Attainment | Male Income | Female Income |
| Less than High School | $34,033 | $22,957 |
| High School Diploma | $38,141 | $29,810 |
| College or Associate's Degree | $47,147 | $37,151 |
| Bachelor's Degree | $81,853 | $56,494 |
| Graduate Degree | $111,048 | $68,413 |
| Total | $58,305 | $44,573 |
Family Income in Charlotte
Family Income Brackets in Charlotte
According to the Charlotte family income data, there are 35,807 families falling into the $100,000 to $149,999 income range, which is the most common income bracket and makes up 17.9% of all families. Conversely, the $10,000 to $14,999 income bracket is the least frequent group with only 3,601 families (1.8%) belonging to this category.
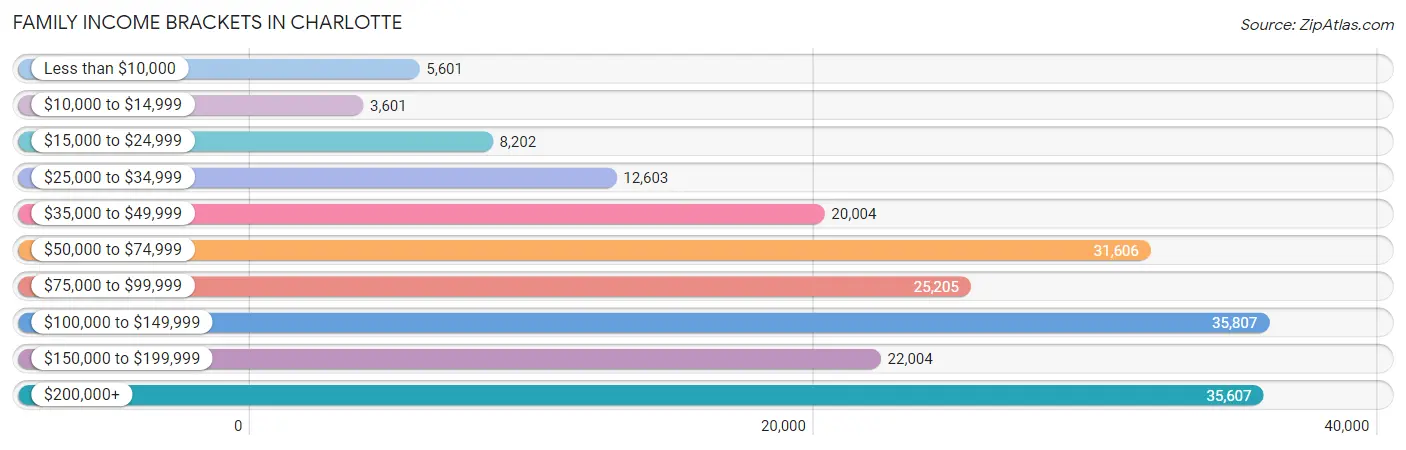
| Income Bracket | # Families | % Families |
| Less than $10,000 | 5,601 | 2.8% |
| $10,000 to $14,999 | 3,601 | 1.8% |
| $15,000 to $24,999 | 8,202 | 4.1% |
| $25,000 to $34,999 | 12,603 | 6.3% |
| $35,000 to $49,999 | 20,004 | 10.0% |
| $50,000 to $74,999 | 31,606 | 15.8% |
| $75,000 to $99,999 | 25,205 | 12.6% |
| $100,000 to $149,999 | 35,807 | 17.9% |
| $150,000 to $199,999 | 22,004 | 11.0% |
| $200,000+ | 35,607 | 17.8% |
Family Income by Famaliy Size in Charlotte
4-person families (38,079 | 19.0%) account for the highest median family income in Charlotte with $115,680 per family, while 2-person families (92,479 | 46.2%) have the highest median income of $42,640 per family member.
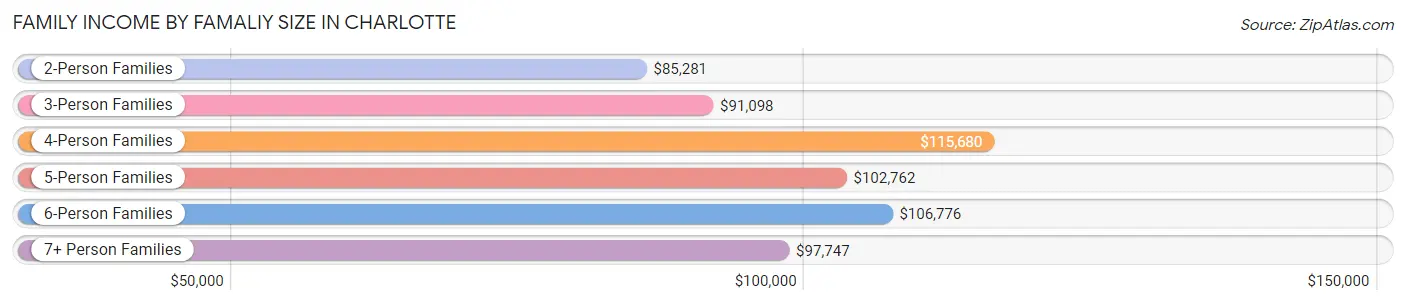
| Income Bracket | # Families | Median Income |
| 2-Person Families | 92,479 (46.2%) | $85,281 |
| 3-Person Families | 47,563 (23.8%) | $91,098 |
| 4-Person Families | 38,079 (19.0%) | $115,680 |
| 5-Person Families | 14,088 (7.0%) | $102,762 |
| 6-Person Families | 4,877 (2.4%) | $106,776 |
| 7+ Person Families | 2,954 (1.5%) | $97,747 |
| Total | 200,040 (100.0%) | $93,023 |
Family Income by Number of Earners in Charlotte
The median family income in Charlotte is $93,023, with families comprising 3+ earners (20,687) having the highest median family income of $129,761, while families with no earners (17,894) have the lowest median family income of $46,536, accounting for 10.3% and 8.9% of families, respectively.
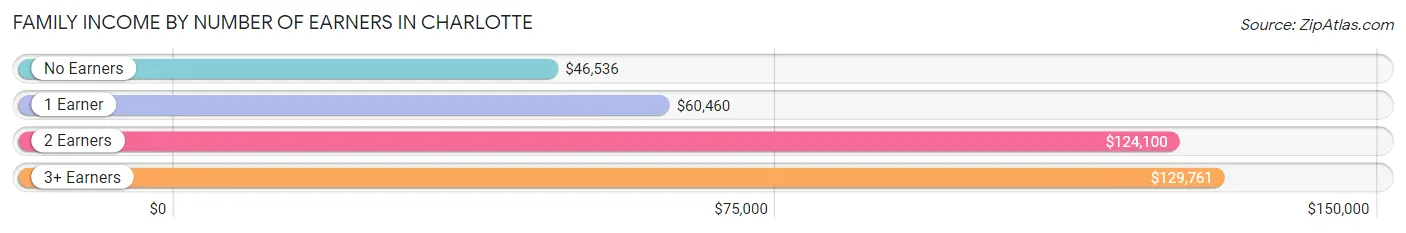
| Number of Earners | # Families | Median Income |
| No Earners | 17,894 (8.9%) | $46,536 |
| 1 Earner | 71,688 (35.8%) | $60,460 |
| 2 Earners | 89,771 (44.9%) | $124,100 |
| 3+ Earners | 20,687 (10.3%) | $129,761 |
| Total | 200,040 (100.0%) | $93,023 |
Household Income in Charlotte
Household Income Brackets in Charlotte
With 64,508 households falling in the category, the $50,000 to $74,999 income range is the most frequent in Charlotte, accounting for 18.2% of all households. In contrast, only 10,633 households (3.0%) fall into the $10,000 to $14,999 income bracket, making it the least populous group.
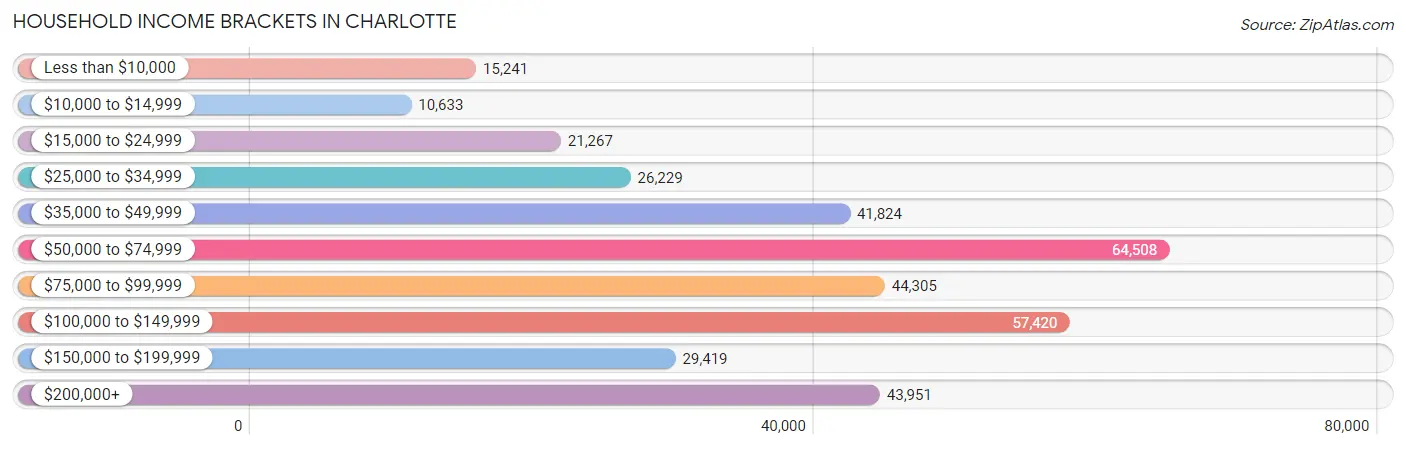
| Income Bracket | # Households | % Households |
| Less than $10,000 | 15,241 | 4.3% |
| $10,000 to $14,999 | 10,633 | 3.0% |
| $15,000 to $24,999 | 21,267 | 6.0% |
| $25,000 to $34,999 | 26,229 | 7.4% |
| $35,000 to $49,999 | 41,824 | 11.8% |
| $50,000 to $74,999 | 64,508 | 18.2% |
| $75,000 to $99,999 | 44,305 | 12.5% |
| $100,000 to $149,999 | 57,420 | 16.2% |
| $150,000 to $199,999 | 29,419 | 8.3% |
| $200,000+ | 43,951 | 12.4% |
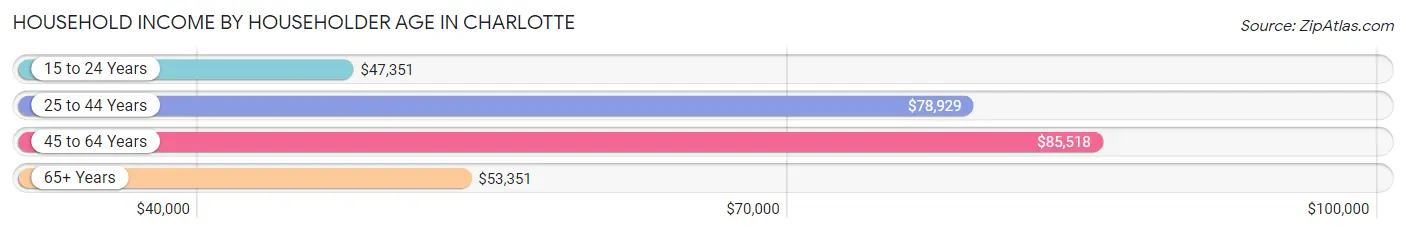
Household Income by Householder Age in Charlotte
The median household income in Charlotte is $74,070, with the highest median household income of $85,518 found in the 45 to 64 years age bracket for the primary householder. A total of 123,913 households (35.0%) fall into this category. Meanwhile, the 15 to 24 years age bracket for the primary householder has the lowest median household income of $47,351, with 17,563 households (5.0%) in this group.
| Income Bracket | # Households | Median Income |
| 15 to 24 Years | 17,563 (5.0%) | $47,351 |
| 25 to 44 Years | 154,851 (43.7%) | $78,929 |
| 45 to 64 Years | 123,913 (35.0%) | $85,518 |
| 65+ Years | 58,115 (16.4%) | $53,351 |
| Total | 354,442 (100.0%) | $74,070 |
Poverty in Charlotte
Income Below Poverty by Sex and Age in Charlotte
With 10.4% poverty level for males and 12.9% for females among the residents of Charlotte, 12 to 14 year old males and 18 to 24 year old females are the most vulnerable to poverty, with 3,388 males (20.0%) and 8,631 females (21.0%) in their respective age groups living below the poverty level.
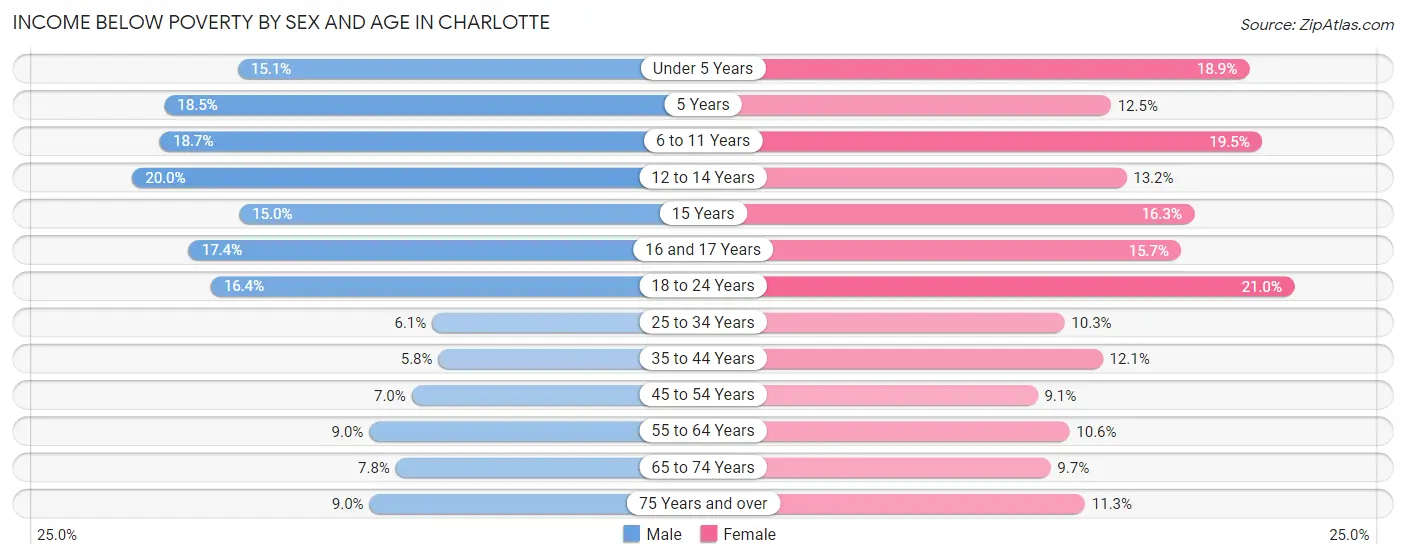
| Age Bracket | Male | Female |
| Under 5 Years | 4,279 (15.1%) | 5,148 (18.9%) |
| 5 Years | 953 (18.5%) | 674 (12.5%) |
| 6 to 11 Years | 6,338 (18.7%) | 5,904 (19.5%) |
| 12 to 14 Years | 3,388 (20.0%) | 2,117 (13.2%) |
| 15 Years | 864 (15.0%) | 894 (16.3%) |
| 16 and 17 Years | 1,919 (17.4%) | 1,700 (15.7%) |
| 18 to 24 Years | 6,256 (16.4%) | 8,631 (21.0%) |
| 25 to 34 Years | 4,726 (6.1%) | 8,380 (10.3%) |
| 35 to 44 Years | 3,638 (5.8%) | 7,927 (12.1%) |
| 45 to 54 Years | 3,762 (7.0%) | 5,299 (9.1%) |
| 55 to 64 Years | 4,074 (9.0%) | 5,181 (10.6%) |
| 65 to 74 Years | 1,979 (7.8%) | 3,133 (9.7%) |
| 75 Years and over | 1,159 (9.0%) | 2,378 (11.3%) |
| Total | 43,335 (10.4%) | 57,366 (12.9%) |
Income Above Poverty by Sex and Age in Charlotte
According to the poverty statistics in Charlotte, males aged 35 to 44 years and females aged 45 to 54 years are the age groups that are most secure financially, with 94.2% of males and 90.9% of females in these age groups living above the poverty line.
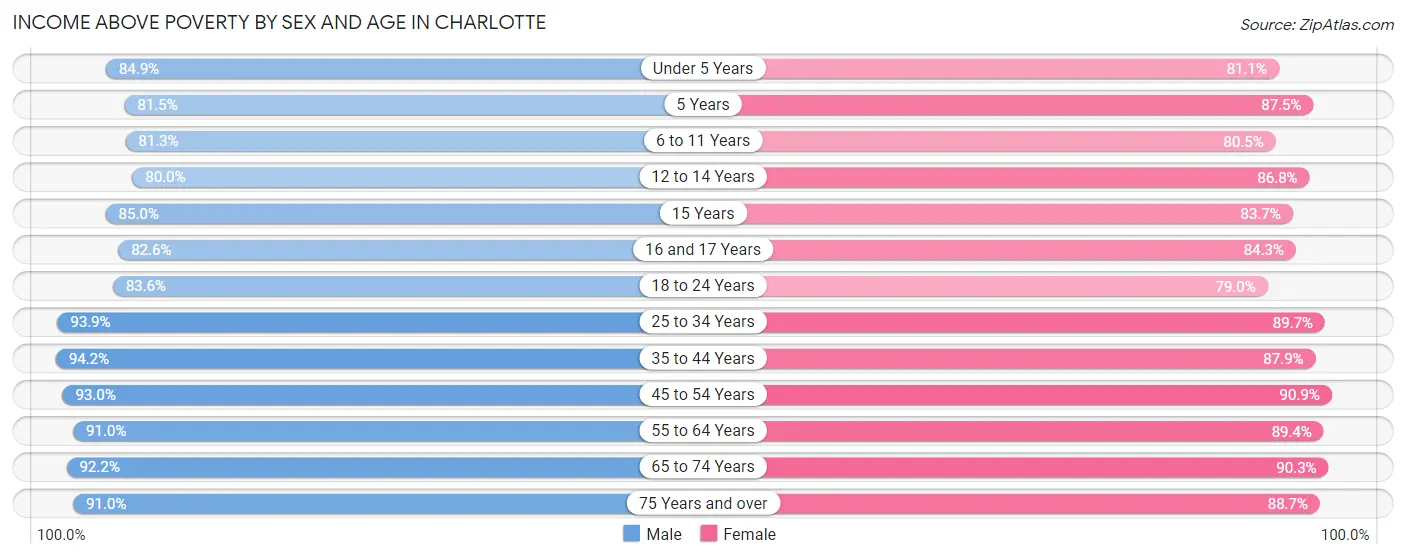
| Age Bracket | Male | Female |
| Under 5 Years | 24,067 (84.9%) | 22,085 (81.1%) |
| 5 Years | 4,195 (81.5%) | 4,726 (87.5%) |
| 6 to 11 Years | 27,531 (81.3%) | 24,404 (80.5%) |
| 12 to 14 Years | 13,551 (80.0%) | 13,925 (86.8%) |
| 15 Years | 4,881 (85.0%) | 4,581 (83.7%) |
| 16 and 17 Years | 9,124 (82.6%) | 9,104 (84.3%) |
| 18 to 24 Years | 31,990 (83.6%) | 32,533 (79.0%) |
| 25 to 34 Years | 72,895 (93.9%) | 72,716 (89.7%) |
| 35 to 44 Years | 59,083 (94.2%) | 57,597 (87.9%) |
| 45 to 54 Years | 49,664 (93.0%) | 53,069 (90.9%) |
| 55 to 64 Years | 41,162 (91.0%) | 43,898 (89.4%) |
| 65 to 74 Years | 23,446 (92.2%) | 29,238 (90.3%) |
| 75 Years and over | 11,720 (91.0%) | 18,697 (88.7%) |
| Total | 373,309 (89.6%) | 386,573 (87.1%) |
Income Below Poverty Among Married-Couple Families in Charlotte
The poverty statistics for married-couple families in Charlotte show that 3.7% or 4,990 of the total 135,444 families live below the poverty line. Families with 5 or more children have the highest poverty rate of 22.7%, comprising of 112 families. On the other hand, families with no children have the lowest poverty rate of 2.3%, which includes 1,693 families.
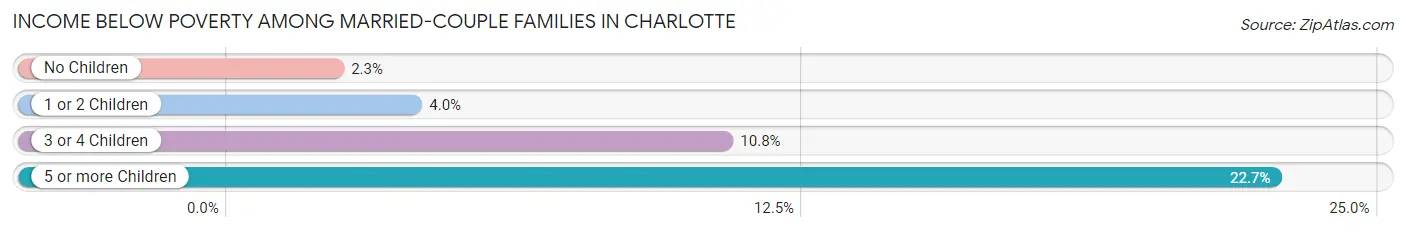
| Children | Above Poverty | Below Poverty |
| No Children | 71,511 (97.7%) | 1,693 (2.3%) |
| 1 or 2 Children | 49,217 (96.0%) | 2,056 (4.0%) |
| 3 or 4 Children | 9,345 (89.2%) | 1,129 (10.8%) |
| 5 or more Children | 381 (77.3%) | 112 (22.7%) |
| Total | 130,454 (96.3%) | 4,990 (3.7%) |
Income Below Poverty Among Single-Parent Households in Charlotte
According to the poverty data in Charlotte, 10.0% or 1,607 single-father households and 21.2% or 10,279 single-mother households are living below the poverty line. Among single-father households, those with 5 or more children have the highest poverty rate, with 134 households (93.7%) experiencing poverty. Likewise, among single-mother households, those with 5 or more children have the highest poverty rate, with 274 households (71.4%) falling below the poverty line.
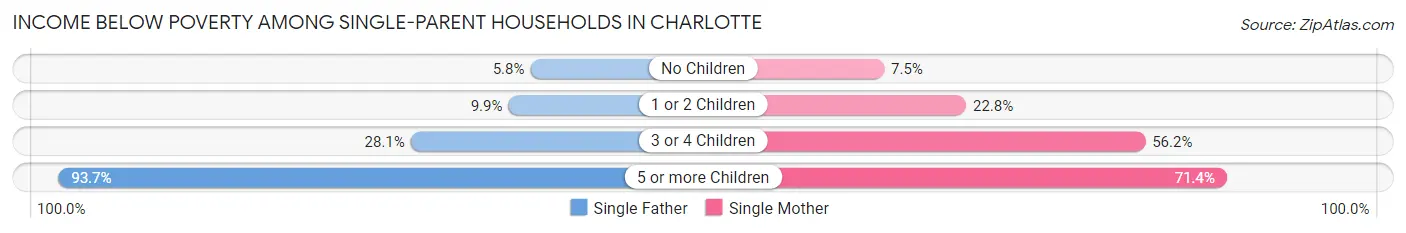
| Children | Single Father | Single Mother |
| No Children | 414 (5.8%) | 1,244 (7.5%) |
| 1 or 2 Children | 771 (9.9%) | 6,142 (22.8%) |
| 3 or 4 Children | 288 (28.1%) | 2,619 (56.2%) |
| 5 or more Children | 134 (93.7%) | 274 (71.4%) |
| Total | 1,607 (10.0%) | 10,279 (21.2%) |
Income Below Poverty Among Married-Couple vs Single-Parent Households in Charlotte
The poverty data for Charlotte shows that 4,990 of the married-couple family households (3.7%) and 11,886 of the single-parent households (18.4%) are living below the poverty level. Within the married-couple family households, those with 5 or more children have the highest poverty rate, with 112 households (22.7%) falling below the poverty line. Among the single-parent households, those with 5 or more children have the highest poverty rate, with 408 household (77.4%) living below poverty.
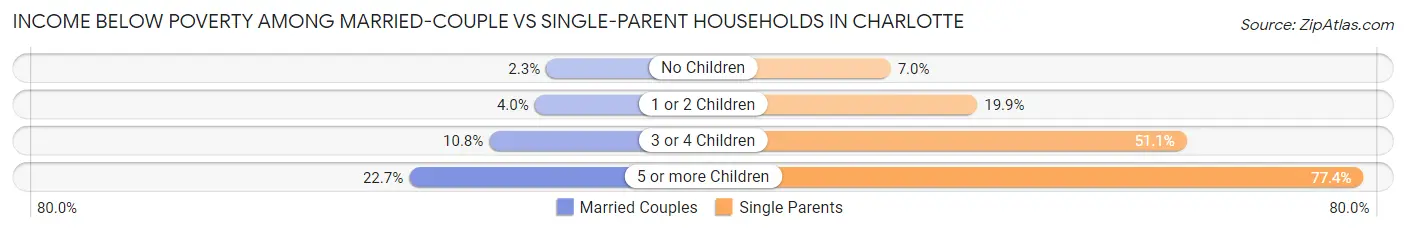
| Children | Married-Couple Families | Single-Parent Households |
| No Children | 1,693 (2.3%) | 1,658 (7.0%) |
| 1 or 2 Children | 2,056 (4.0%) | 6,913 (19.9%) |
| 3 or 4 Children | 1,129 (10.8%) | 2,907 (51.1%) |
| 5 or more Children | 112 (22.7%) | 408 (77.4%) |
| Total | 4,990 (3.7%) | 11,886 (18.4%) |
Race in Charlotte
The most populous races in Charlotte are White / Caucasian (377,125 | 43.1%), Black / African American (308,131 | 35.2%), and Hispanic or Latino (134,058 | 15.3%).
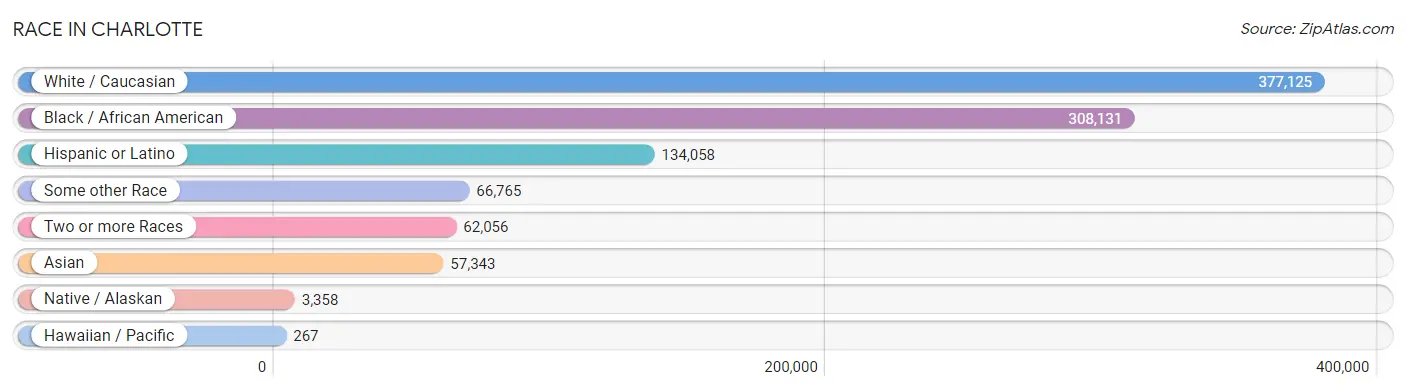
| Race | # Population | % Population |
| Asian | 57,343 | 6.6% |
| Black / African American | 308,131 | 35.2% |
| Hawaiian / Pacific | 267 | 0.0% |
| Hispanic or Latino | 134,058 | 15.3% |
| Native / Alaskan | 3,358 | 0.4% |
| White / Caucasian | 377,125 | 43.1% |
| Two or more Races | 62,056 | 7.1% |
| Some other Race | 66,765 | 7.6% |
| Total | 875,045 | 100.0% |
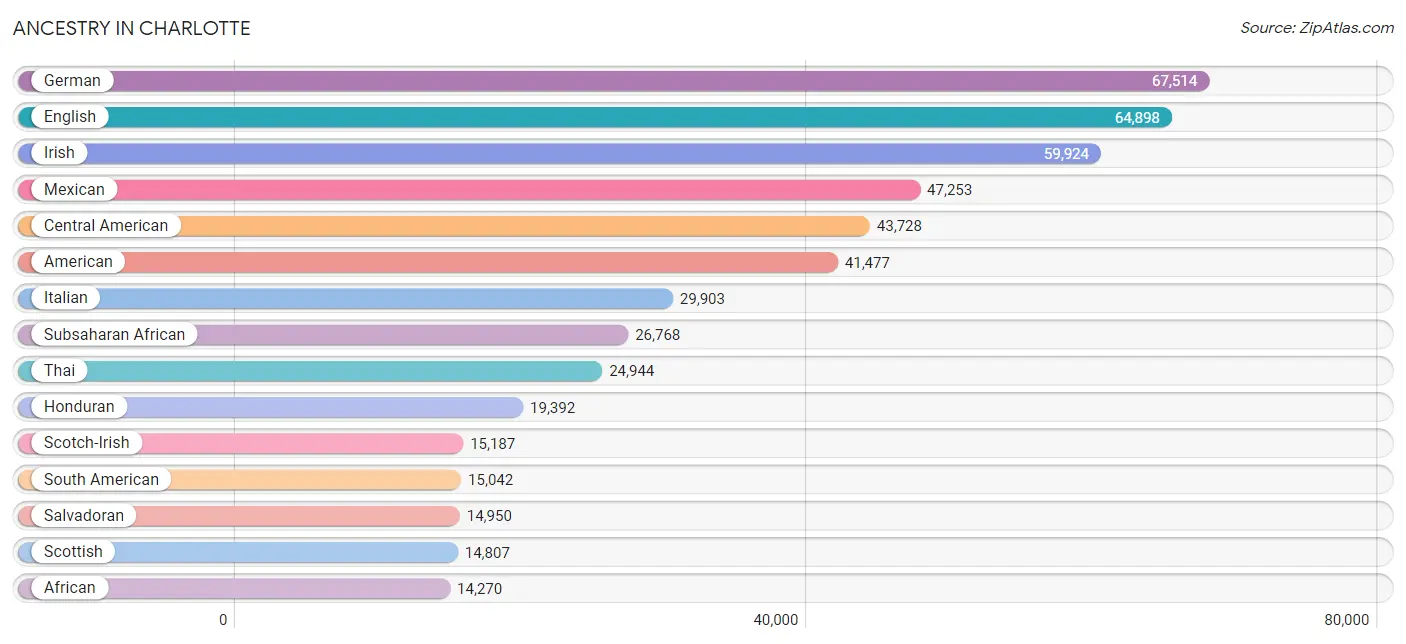
Ancestry in Charlotte
The most populous ancestries reported in Charlotte are German (67,514 | 7.7%), English (64,898 | 7.4%), Irish (59,924 | 6.9%), Mexican (47,253 | 5.4%), and Central American (43,728 | 5.0%), together accounting for 32.4% of all Charlotte residents.
| Ancestry | # Population | % Population |
| Afghan | 186 | 0.0% |
| African | 14,270 | 1.6% |
| Albanian | 111 | 0.0% |
| Alsatian | 24 | 0.0% |
| American | 41,477 | 4.7% |
| Apache | 112 | 0.0% |
| Arab | 6,533 | 0.7% |
| Argentinean | 606 | 0.1% |
| Armenian | 303 | 0.0% |
| Assyrian / Chaldean / Syriac | 6 | 0.0% |
| Australian | 161 | 0.0% |
| Austrian | 881 | 0.1% |
| Bahamian | 78 | 0.0% |
| Bangladeshi | 1,444 | 0.2% |
| Barbadian | 334 | 0.0% |
| Basque | 8 | 0.0% |
| Belgian | 437 | 0.1% |
| Belizean | 68 | 0.0% |
| Bhutanese | 1,825 | 0.2% |
| Blackfeet | 412 | 0.1% |
| Bolivian | 94 | 0.0% |
| Brazilian | 1,353 | 0.2% |
| British | 5,377 | 0.6% |
| British West Indian | 169 | 0.0% |
| Bulgarian | 297 | 0.0% |
| Burmese | 3,053 | 0.4% |
| Cajun | 86 | 0.0% |
| Cambodian | 79 | 0.0% |
| Canadian | 1,061 | 0.1% |
| Cape Verdean | 167 | 0.0% |
| Carpatho Rusyn | 11 | 0.0% |
| Celtic | 77 | 0.0% |
| Central American | 43,728 | 5.0% |
| Central American Indian | 1,063 | 0.1% |
| Cherokee | 2,689 | 0.3% |
| Cheyenne | 17 | 0.0% |
| Chickasaw | 26 | 0.0% |
| Chilean | 214 | 0.0% |
| Chippewa | 115 | 0.0% |
| Choctaw | 190 | 0.0% |
| Colombian | 5,199 | 0.6% |
| Costa Rican | 475 | 0.1% |
| Creek | 177 | 0.0% |
| Croatian | 428 | 0.1% |
| Crow | 11 | 0.0% |
| Cuban | 4,385 | 0.5% |
| Czech | 1,669 | 0.2% |
| Czechoslovakian | 286 | 0.0% |
| Danish | 814 | 0.1% |
| Delaware | 29 | 0.0% |
| Dominican | 7,976 | 0.9% |
| Dutch | 4,734 | 0.5% |
| Dutch West Indian | 45 | 0.0% |
| Eastern European | 1,696 | 0.2% |
| Ecuadorian | 4,721 | 0.5% |
| Egyptian | 734 | 0.1% |
| English | 64,898 | 7.4% |
| Estonian | 29 | 0.0% |
| Ethiopian | 2,748 | 0.3% |
| European | 10,575 | 1.2% |
| Filipino | 500 | 0.1% |
| Finnish | 545 | 0.1% |
| French | 11,533 | 1.3% |
| French American Indian | 20 | 0.0% |
| French Canadian | 2,338 | 0.3% |
| German | 67,514 | 7.7% |
| German Russian | 56 | 0.0% |
| Ghanaian | 924 | 0.1% |
| Greek | 4,698 | 0.5% |
| Guamanian / Chamorro | 106 | 0.0% |
| Guatemalan | 6,529 | 0.7% |
| Guyanese | 580 | 0.1% |
| Haitian | 1,233 | 0.1% |
| Honduran | 19,392 | 2.2% |
| Houma | 19 | 0.0% |
| Hungarian | 2,763 | 0.3% |
| Icelander | 24 | 0.0% |
| Indian (Asian) | 9,010 | 1.0% |
| Indonesian | 1,638 | 0.2% |
| Inupiat | 16 | 0.0% |
| Iranian | 1,274 | 0.2% |
| Iraqi | 146 | 0.0% |
| Irish | 59,924 | 6.9% |
| Iroquois | 62 | 0.0% |
| Israeli | 123 | 0.0% |
| Italian | 29,903 | 3.4% |
| Jamaican | 3,862 | 0.4% |
| Japanese | 1,474 | 0.2% |
| Jordanian | 276 | 0.0% |
| Kenyan | 271 | 0.0% |
| Kiowa | 30 | 0.0% |
| Korean | 4,032 | 0.5% |
| Laotian | 221 | 0.0% |
| Latvian | 110 | 0.0% |
| Lebanese | 1,795 | 0.2% |
| Liberian | 1,495 | 0.2% |
| Lithuanian | 887 | 0.1% |
| Lumbee | 933 | 0.1% |
| Luxembourger | 5 | 0.0% |
| Macedonian | 213 | 0.0% |
| Malaysian | 1,571 | 0.2% |
| Maltese | 40 | 0.0% |
| Mexican | 47,253 | 5.4% |
| Mexican American Indian | 634 | 0.1% |
| Mongolian | 31 | 0.0% |
| Moroccan | 632 | 0.1% |
| Native Hawaiian | 255 | 0.0% |
| Navajo | 66 | 0.0% |
| New Zealander | 22 | 0.0% |
| Nicaraguan | 1,204 | 0.1% |
| Nigerian | 1,606 | 0.2% |
| Northern European | 544 | 0.1% |
| Norwegian | 3,290 | 0.4% |
| Osage | 51 | 0.0% |
| Ottawa | 5 | 0.0% |
| Pakistani | 719 | 0.1% |
| Palestinian | 526 | 0.1% |
| Panamanian | 1,072 | 0.1% |
| Paraguayan | 22 | 0.0% |
| Pennsylvania German | 60 | 0.0% |
| Peruvian | 1,939 | 0.2% |
| Polish | 12,961 | 1.5% |
| Portuguese | 1,580 | 0.2% |
| Puerto Rican | 9,932 | 1.1% |
| Romanian | 1,289 | 0.2% |
| Russian | 5,051 | 0.6% |
| Salvadoran | 14,950 | 1.7% |
| Samoan | 48 | 0.0% |
| Scandinavian | 1,268 | 0.1% |
| Scotch-Irish | 15,187 | 1.7% |
| Scottish | 14,807 | 1.7% |
| Seminole | 91 | 0.0% |
| Senegalese | 514 | 0.1% |
| Serbian | 334 | 0.0% |
| Sierra Leonean | 83 | 0.0% |
| Sioux | 44 | 0.0% |
| Slavic | 580 | 0.1% |
| Slovak | 1,253 | 0.1% |
| Slovene | 149 | 0.0% |
| Somali | 398 | 0.1% |
| South African | 484 | 0.1% |
| South American | 15,042 | 1.7% |
| South American Indian | 288 | 0.0% |
| Spaniard | 872 | 0.1% |
| Spanish | 1,156 | 0.1% |
| Sri Lankan | 8,701 | 1.0% |
| Subsaharan African | 26,768 | 3.1% |
| Sudanese | 228 | 0.0% |
| Swedish | 4,236 | 0.5% |
| Swiss | 1,133 | 0.1% |
| Syrian | 329 | 0.0% |
| Taiwanese | 95 | 0.0% |
| Thai | 24,944 | 2.9% |
| Tlingit-Haida | 15 | 0.0% |
| Tongan | 48 | 0.0% |
| Trinidadian and Tobagonian | 646 | 0.1% |
| Turkish | 585 | 0.1% |
| U.S. Virgin Islander | 20 | 0.0% |
| Ukrainian | 3,236 | 0.4% |
| Uruguayan | 766 | 0.1% |
| Venezuelan | 1,476 | 0.2% |
| Vietnamese | 168 | 0.0% |
| Welsh | 4,030 | 0.5% |
| West Indian | 1,587 | 0.2% |
| Yaqui | 39 | 0.0% |
| Yugoslavian | 490 | 0.1% |
| Yuman | 18 | 0.0% |
| Yup'ik | 135 | 0.0% |
| Zimbabwean | 111 | 0.0% | View All 169 Rows |
Immigrants in Charlotte
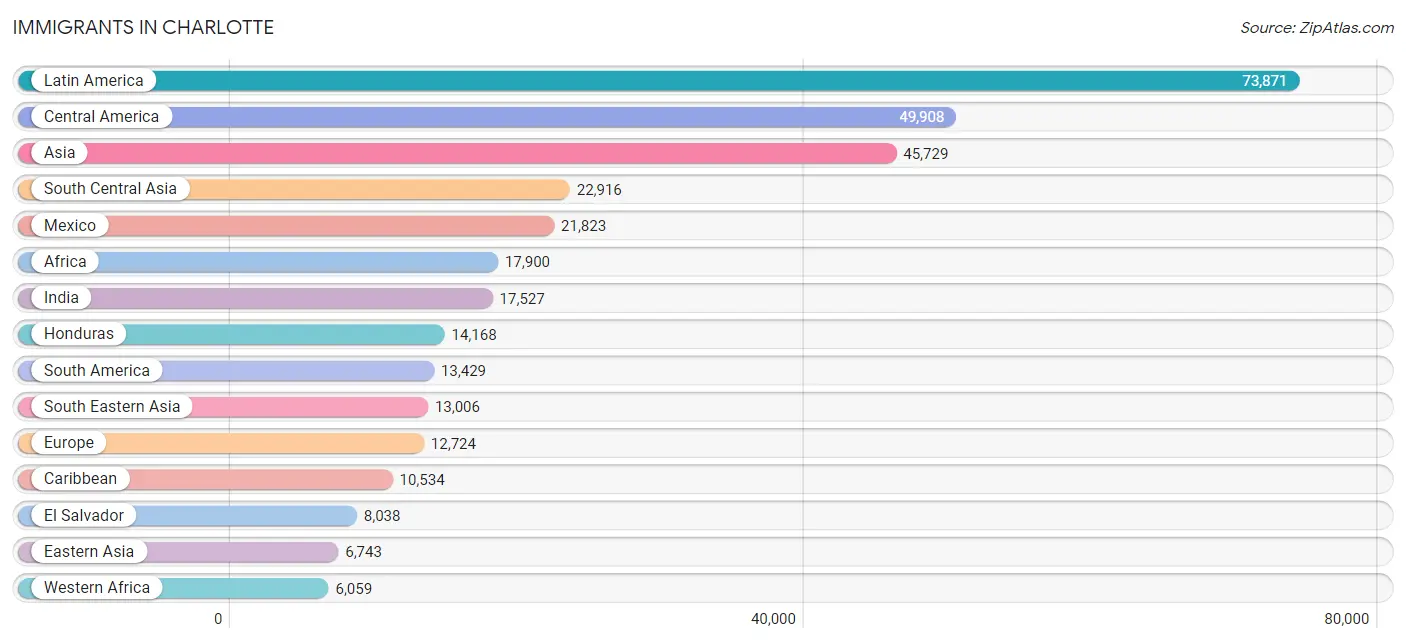
The most numerous immigrant groups reported in Charlotte came from Latin America (73,871 | 8.4%), Central America (49,908 | 5.7%), Asia (45,729 | 5.2%), South Central Asia (22,916 | 2.6%), and Mexico (21,823 | 2.5%), together accounting for 24.5% of all Charlotte residents.
| Immigration Origin | # Population | % Population |
| Afghanistan | 207 | 0.0% |
| Africa | 17,900 | 2.1% |
| Albania | 97 | 0.0% |
| Argentina | 431 | 0.1% |
| Armenia | 11 | 0.0% |
| Asia | 45,729 | 5.2% |
| Australia | 106 | 0.0% |
| Austria | 144 | 0.0% |
| Bahamas | 53 | 0.0% |
| Bangladesh | 213 | 0.0% |
| Barbados | 413 | 0.1% |
| Belarus | 143 | 0.0% |
| Belgium | 130 | 0.0% |
| Belize | 34 | 0.0% |
| Bolivia | 16 | 0.0% |
| Bosnia and Herzegovina | 304 | 0.0% |
| Brazil | 1,622 | 0.2% |
| Bulgaria | 163 | 0.0% |
| Cabo Verde | 96 | 0.0% |
| Cambodia | 444 | 0.1% |
| Cameroon | 387 | 0.0% |
| Canada | 1,937 | 0.2% |
| Caribbean | 10,534 | 1.2% |
| Central America | 49,908 | 5.7% |
| Chile | 170 | 0.0% |
| China | 4,617 | 0.5% |
| Colombia | 3,462 | 0.4% |
| Congo | 1,257 | 0.1% |
| Costa Rica | 437 | 0.1% |
| Croatia | 116 | 0.0% |
| Cuba | 1,599 | 0.2% |
| Czechoslovakia | 84 | 0.0% |
| Denmark | 79 | 0.0% |
| Dominica | 91 | 0.0% |
| Dominican Republic | 4,160 | 0.5% |
| Eastern Africa | 4,333 | 0.5% |
| Eastern Asia | 6,743 | 0.8% |
| Eastern Europe | 5,421 | 0.6% |
| Ecuador | 3,353 | 0.4% |
| Egypt | 630 | 0.1% |
| El Salvador | 8,038 | 0.9% |
| England | 1,329 | 0.2% |
| Eritrea | 892 | 0.1% |
| Ethiopia | 1,766 | 0.2% |
| Europe | 12,724 | 1.5% |
| Fiji | 46 | 0.0% |
| France | 366 | 0.0% |
| Germany | 1,235 | 0.1% |
| Ghana | 1,076 | 0.1% |
| Greece | 894 | 0.1% |
| Grenada | 21 | 0.0% |
| Guatemala | 4,097 | 0.5% |
| Guyana | 556 | 0.1% |
| Haiti | 509 | 0.1% |
| Honduras | 14,168 | 1.6% |
| Hong Kong | 384 | 0.0% |
| Hungary | 83 | 0.0% |
| India | 17,527 | 2.0% |
| Indonesia | 258 | 0.0% |
| Iran | 978 | 0.1% |
| Iraq | 312 | 0.0% |
| Ireland | 262 | 0.0% |
| Israel | 138 | 0.0% |
| Italy | 448 | 0.1% |
| Jamaica | 2,449 | 0.3% |
| Japan | 790 | 0.1% |
| Jordan | 400 | 0.1% |
| Kazakhstan | 87 | 0.0% |
| Kenya | 406 | 0.1% |
| Korea | 1,336 | 0.2% |
| Kuwait | 192 | 0.0% |
| Laos | 783 | 0.1% |
| Latin America | 73,871 | 8.4% |
| Latvia | 67 | 0.0% |
| Lebanon | 529 | 0.1% |
| Liberia | 2,086 | 0.2% |
| Lithuania | 60 | 0.0% |
| Malaysia | 728 | 0.1% |
| Mexico | 21,823 | 2.5% |
| Middle Africa | 3,389 | 0.4% |
| Moldova | 229 | 0.0% |
| Morocco | 436 | 0.1% |
| Nepal | 1,772 | 0.2% |
| Netherlands | 143 | 0.0% |
| Nicaragua | 866 | 0.1% |
| Nigeria | 1,309 | 0.2% |
| Northern Africa | 1,765 | 0.2% |
| Northern Europe | 3,495 | 0.4% |
| Norway | 50 | 0.0% |
| Oceania | 182 | 0.0% |
| Pakistan | 969 | 0.1% |
| Panama | 428 | 0.1% |
| Peru | 1,422 | 0.2% |
| Philippines | 1,951 | 0.2% |
| Poland | 469 | 0.1% |
| Portugal | 50 | 0.0% |
| Romania | 431 | 0.1% |
| Russia | 1,278 | 0.2% |
| Saudi Arabia | 212 | 0.0% |
| Scotland | 207 | 0.0% |
| Senegal | 382 | 0.0% |
| Serbia | 41 | 0.0% |
| Sierra Leone | 143 | 0.0% |
| Singapore | 84 | 0.0% |
| Somalia | 515 | 0.1% |
| South Africa | 855 | 0.1% |
| South America | 13,429 | 1.5% |
| South Central Asia | 22,916 | 2.6% |
| South Eastern Asia | 13,006 | 1.5% |
| Southern Europe | 1,651 | 0.2% |
| Spain | 253 | 0.0% |
| Sri Lanka | 98 | 0.0% |
| St. Vincent and the Grenadines | 24 | 0.0% |
| Sudan | 540 | 0.1% |
| Sweden | 100 | 0.0% |
| Switzerland | 65 | 0.0% |
| Syria | 450 | 0.1% |
| Taiwan | 549 | 0.1% |
| Thailand | 1,108 | 0.1% |
| Trinidad and Tobago | 948 | 0.1% |
| Turkey | 387 | 0.0% |
| Uganda | 89 | 0.0% |
| Ukraine | 1,648 | 0.2% |
| Uruguay | 384 | 0.0% |
| Uzbekistan | 59 | 0.0% |
| Venezuela | 1,943 | 0.2% |
| Vietnam | 5,826 | 0.7% |
| West Indies | 15 | 0.0% |
| Western Africa | 6,059 | 0.7% |
| Western Asia | 3,024 | 0.4% |
| Western Europe | 2,083 | 0.2% |
| Zaire | 1,711 | 0.2% |
| Zimbabwe | 257 | 0.0% | View All 133 Rows |
Sex and Age in Charlotte
Sex and Age in Charlotte
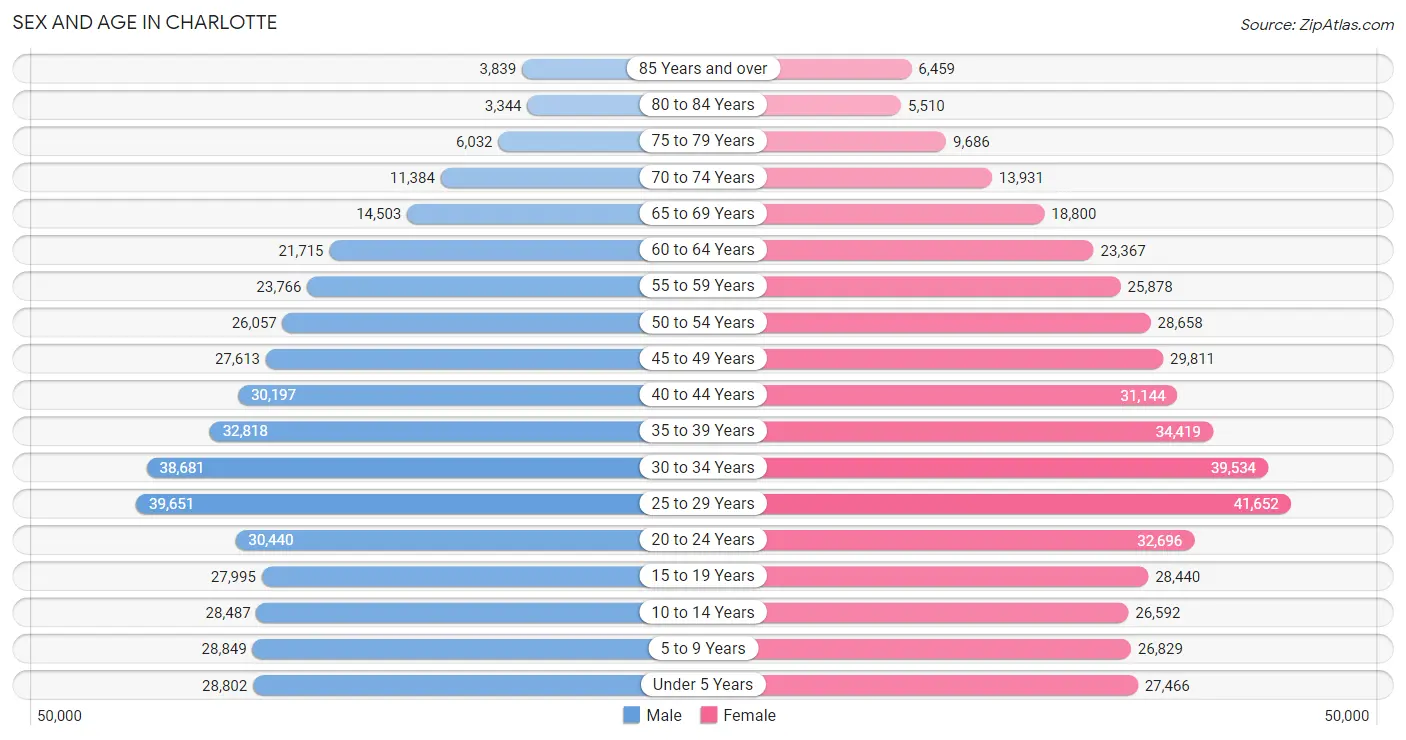
The most populous age groups in Charlotte are 25 to 29 Years (39,651 | 9.3%) for men and 25 to 29 Years (41,652 | 9.2%) for women.
| Age Bracket | Male | Female |
| Under 5 Years | 28,802 (6.8%) | 27,466 (6.1%) |
| 5 to 9 Years | 28,849 (6.8%) | 26,829 (5.9%) |
| 10 to 14 Years | 28,487 (6.7%) | 26,592 (5.9%) |
| 15 to 19 Years | 27,995 (6.6%) | 28,440 (6.3%) |
| 20 to 24 Years | 30,440 (7.2%) | 32,696 (7.2%) |
| 25 to 29 Years | 39,651 (9.3%) | 41,652 (9.2%) |
| 30 to 34 Years | 38,681 (9.1%) | 39,534 (8.8%) |
| 35 to 39 Years | 32,818 (7.7%) | 34,419 (7.6%) |
| 40 to 44 Years | 30,197 (7.1%) | 31,144 (6.9%) |
| 45 to 49 Years | 27,613 (6.5%) | 29,811 (6.6%) |
| 50 to 54 Years | 26,057 (6.1%) | 28,658 (6.4%) |
| 55 to 59 Years | 23,766 (5.6%) | 25,878 (5.7%) |
| 60 to 64 Years | 21,715 (5.1%) | 23,367 (5.2%) |
| 65 to 69 Years | 14,503 (3.4%) | 18,800 (4.2%) |
| 70 to 74 Years | 11,384 (2.7%) | 13,931 (3.1%) |
| 75 to 79 Years | 6,032 (1.4%) | 9,686 (2.1%) |
| 80 to 84 Years | 3,344 (0.8%) | 5,510 (1.2%) |
| 85 Years and over | 3,839 (0.9%) | 6,459 (1.4%) |
| Total | 424,173 (100.0%) | 450,872 (100.0%) |
Families and Households in Charlotte
Median Family Size in Charlotte
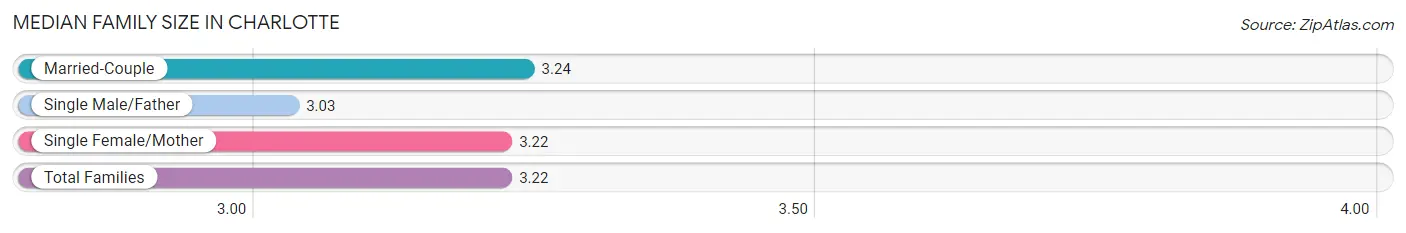
The median family size in Charlotte is 3.22 persons per family, with married-couple families (135,444 | 67.7%) accounting for the largest median family size of 3.24 persons per family. On the other hand, single male/father families (16,090 | 8.0%) represent the smallest median family size with 3.03 persons per family.
| Family Type | # Families | Family Size |
| Married-Couple | 135,444 (67.7%) | 3.24 |
| Single Male/Father | 16,090 (8.0%) | 3.03 |
| Single Female/Mother | 48,506 (24.2%) | 3.22 |
| Total Families | 200,040 (100.0%) | 3.22 |
Median Household Size in Charlotte
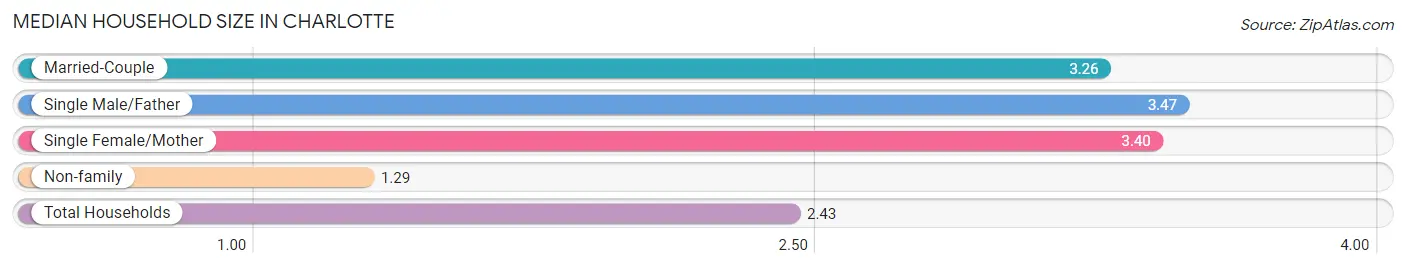
The median household size in Charlotte is 2.43 persons per household, with single male/father households (16,090 | 4.5%) accounting for the largest median household size of 3.47 persons per household. non-family households (154,402 | 43.6%) represent the smallest median household size with 1.29 persons per household.
| Household Type | # Households | Household Size |
| Married-Couple | 135,444 (38.2%) | 3.26 |
| Single Male/Father | 16,090 (4.5%) | 3.47 |
| Single Female/Mother | 48,506 (13.7%) | 3.40 |
| Non-family | 154,402 (43.6%) | 1.29 |
| Total Households | 354,442 (100.0%) | 2.43 |
Household Size by Marriage Status in Charlotte
Out of a total of 354,442 households in Charlotte, 200,040 (56.4%) are family households, while 154,402 (43.6%) are nonfamily households. The most numerous type of family households are 2-person households, comprising 86,077, and the most common type of nonfamily households are 1-person households, comprising 123,095.
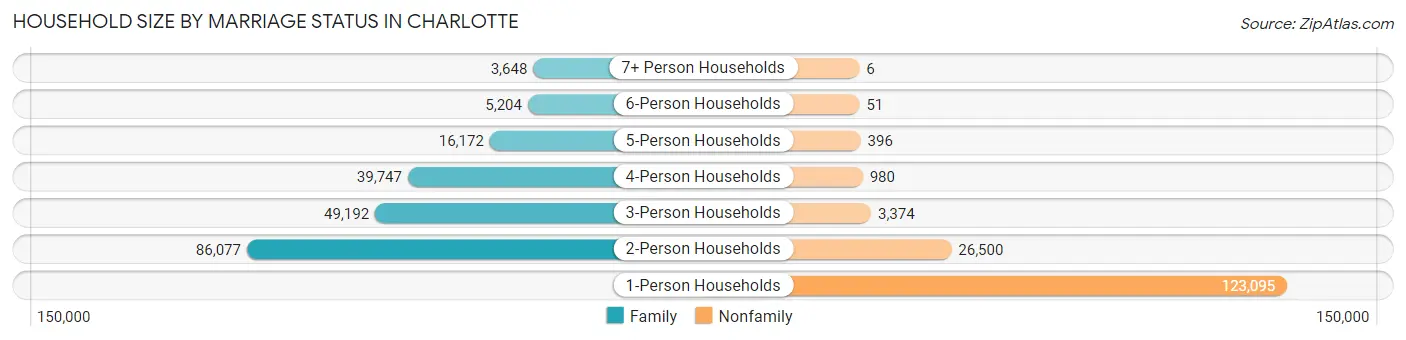
| Household Size | Family Households | Nonfamily Households |
| 1-Person Households | - | 123,095 (34.7%) |
| 2-Person Households | 86,077 (24.3%) | 26,500 (7.5%) |
| 3-Person Households | 49,192 (13.9%) | 3,374 (0.9%) |
| 4-Person Households | 39,747 (11.2%) | 980 (0.3%) |
| 5-Person Households | 16,172 (4.6%) | 396 (0.1%) |
| 6-Person Households | 5,204 (1.5%) | 51 (0.0%) |
| 7+ Person Households | 3,648 (1.0%) | 6 (0.0%) |
| Total | 200,040 (56.4%) | 154,402 (43.6%) |
Female Fertility in Charlotte
Fertility by Age in Charlotte
Average fertility rate in Charlotte is 51.0 births per 1,000 women. Women in the age bracket of 20 to 34 years have the highest fertility rate with 73.0 births per 1,000 women. Women in the age bracket of 20 to 34 years acount for 67.4% of all women with births.
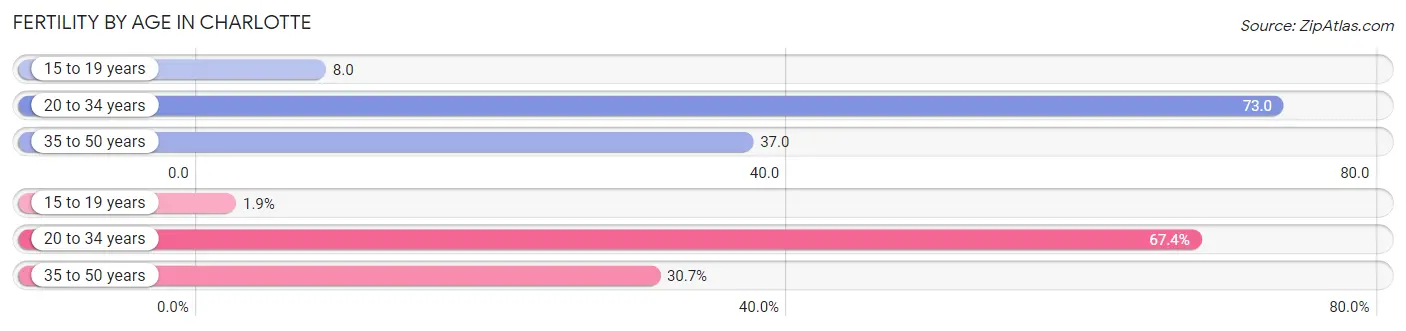
| Age Bracket | Women with Births | Births / 1,000 Women |
| 15 to 19 years | 234 (1.9%) | 8.0 |
| 20 to 34 years | 8,315 (67.4%) | 73.0 |
| 35 to 50 years | 3,782 (30.7%) | 37.0 |
| Total | 12,331 (100.0%) | 51.0 |
Fertility by Age by Marriage Status in Charlotte
65.8% of women with births (12,331) in Charlotte are married. The highest percentage of unmarried women with births falls into 15 to 19 years age bracket with 91.0% of them unmarried at the time of birth, while the lowest percentage of unmarried women with births belong to 35 to 50 years age bracket with 23.8% of them unmarried.
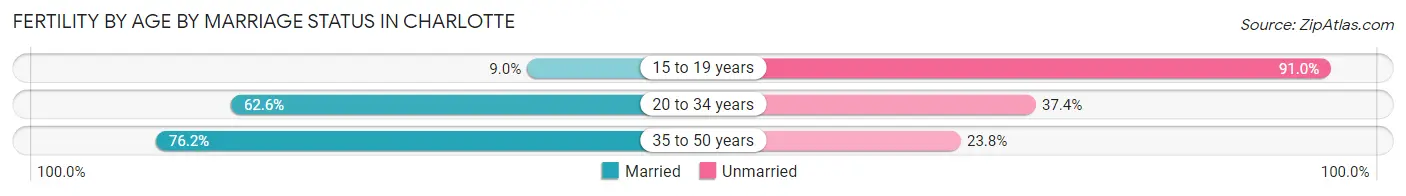
| Age Bracket | Married | Unmarried |
| 15 to 19 years | 21 (9.0%) | 213 (91.0%) |
| 20 to 34 years | 5,205 (62.6%) | 3,110 (37.4%) |
| 35 to 50 years | 2,882 (76.2%) | 900 (23.8%) |
| Total | 8,114 (65.8%) | 4,217 (34.2%) |
Fertility by Education in Charlotte
Average fertility rate in Charlotte is 51.0 births per 1,000 women. Women with the education attainment of graduate degree have the highest fertility rate of 71.0 births per 1,000 women, while women with the education attainment of less than high school have the lowest fertility at 40.0 births per 1,000 women. Women with the education attainment of bachelor's degree represent 26.7% of all women with births.
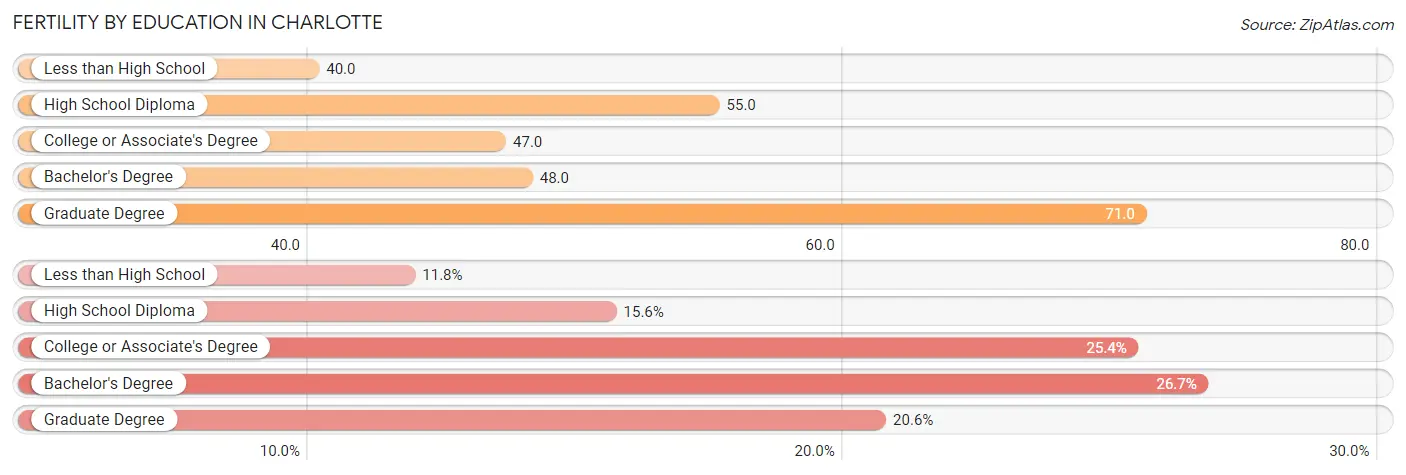
| Educational Attainment | Women with Births | Births / 1,000 Women |
| Less than High School | 1,455 (11.8%) | 40.0 |
| High School Diploma | 1,920 (15.6%) | 55.0 |
| College or Associate's Degree | 3,126 (25.4%) | 47.0 |
| Bachelor's Degree | 3,287 (26.7%) | 48.0 |
| Graduate Degree | 2,543 (20.6%) | 71.0 |
| Total | 12,331 (100.0%) | 51.0 |
Fertility by Education by Marriage Status in Charlotte
34.2% of women with births in Charlotte are unmarried. Women with the educational attainment of graduate degree are most likely to be married with 89.5% of them married at childbirth, while women with the educational attainment of less than high school are least likely to be married with 55.3% of them unmarried at childbirth.
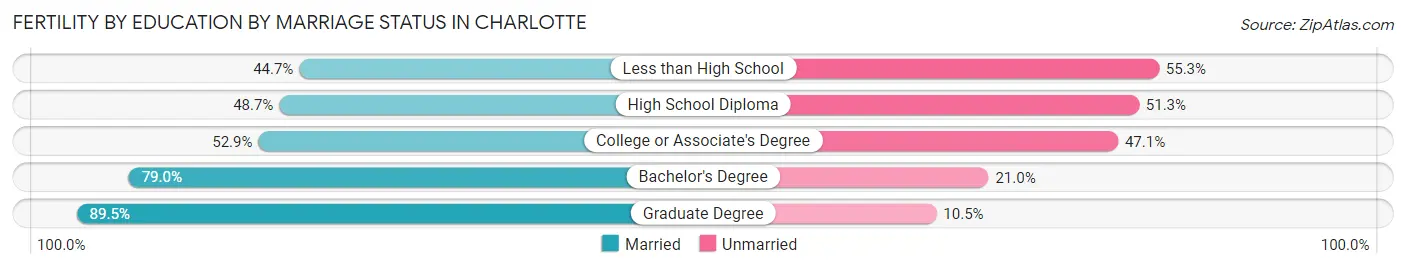
| Educational Attainment | Married | Unmarried |
| Less than High School | 650 (44.7%) | 805 (55.3%) |
| High School Diploma | 935 (48.7%) | 985 (51.3%) |
| College or Associate's Degree | 1,654 (52.9%) | 1,472 (47.1%) |
| Bachelor's Degree | 2,597 (79.0%) | 690 (21.0%) |
| Graduate Degree | 2,276 (89.5%) | 267 (10.5%) |
| Total | 8,114 (65.8%) | 4,217 (34.2%) |
Employment Characteristics in Charlotte
Employment by Class of Employer in Charlotte
Among the 466,770 employed individuals in Charlotte, private company employees (356,616 | 76.4%), not-for-profit organizations (29,352 | 6.3%), and self-employed (not incorporated) (22,064 | 4.7%) make up the most common classes of employment.
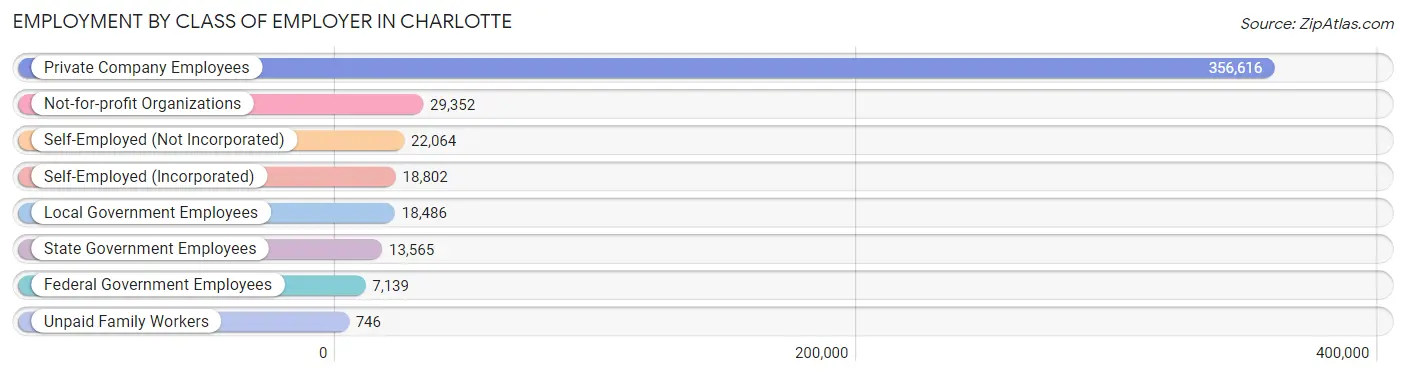
| Employer Class | # Employees | % Employees |
| Private Company Employees | 356,616 | 76.4% |
| Self-Employed (Incorporated) | 18,802 | 4.0% |
| Self-Employed (Not Incorporated) | 22,064 | 4.7% |
| Not-for-profit Organizations | 29,352 | 6.3% |
| Local Government Employees | 18,486 | 4.0% |
| State Government Employees | 13,565 | 2.9% |
| Federal Government Employees | 7,139 | 1.5% |
| Unpaid Family Workers | 746 | 0.2% |
| Total | 466,770 | 100.0% |
Employment Status by Age in Charlotte
According to the labor force statistics for Charlotte, out of the total population over 16 years of age (696,792), 72.1% or 502,387 individuals are in the labor force, with 4.7% or 23,612 of them unemployed. The age group with the highest labor force participation rate is 25 to 29 years, with 88.3% or 71,791 individuals in the labor force. Within the labor force, the 16 to 19 years age range has the highest percentage of unemployed individuals, with 16.7% or 3,148 of them being unemployed.
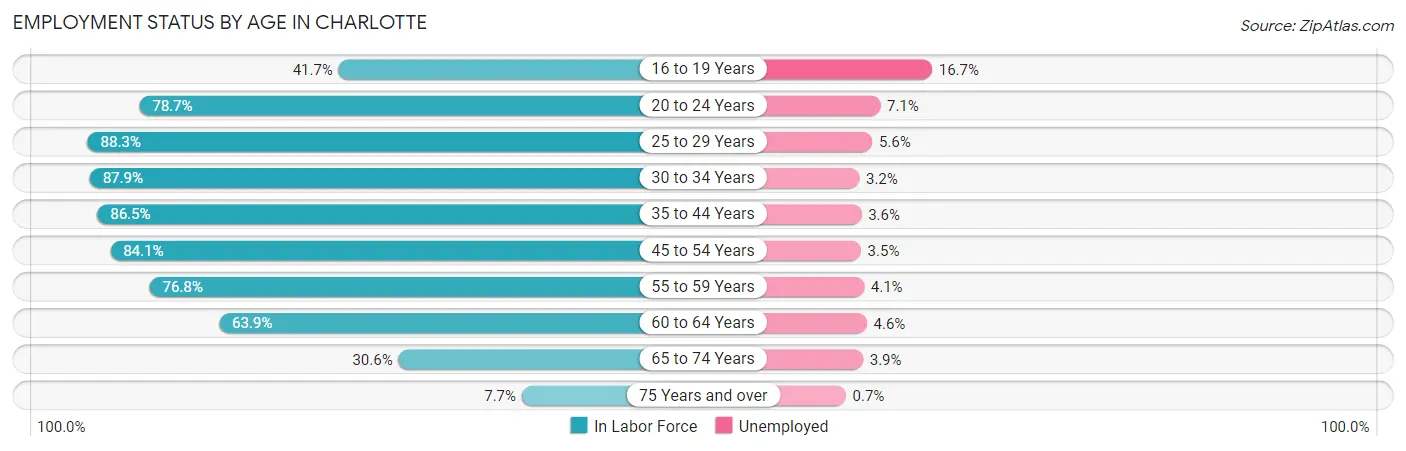
| Age Bracket | In Labor Force | Unemployed |
| 16 to 19 Years | 18,851 (41.7%) | 3,148 (16.7%) |
| 20 to 24 Years | 49,688 (78.7%) | 3,528 (7.1%) |
| 25 to 29 Years | 71,791 (88.3%) | 4,020 (5.6%) |
| 30 to 34 Years | 68,751 (87.9%) | 2,200 (3.2%) |
| 35 to 44 Years | 111,220 (86.5%) | 4,004 (3.6%) |
| 45 to 54 Years | 94,309 (84.1%) | 3,301 (3.5%) |
| 55 to 59 Years | 38,127 (76.8%) | 1,563 (4.1%) |
| 60 to 64 Years | 28,807 (63.9%) | 1,325 (4.6%) |
| 65 to 74 Years | 17,937 (30.6%) | 700 (3.9%) |
| 75 Years and over | 2,685 (7.7%) | 19 (0.7%) |
| Total | 502,387 (72.1%) | 23,612 (4.7%) |
Employment Status by Educational Attainment in Charlotte
According to labor force statistics for Charlotte, 83.4% of individuals (412,797) out of the total population between 25 and 64 years of age (494,961) are in the labor force, with 4.0% or 16,512 of them being unemployed. The group with the highest labor force participation rate are those with the educational attainment of bachelor's degree or higher, with 88.7% or 212,978 individuals in the labor force. Within the labor force, individuals with less than high school education have the highest percentage of unemployment, with 7.4% or 2,558 of them being unemployed.
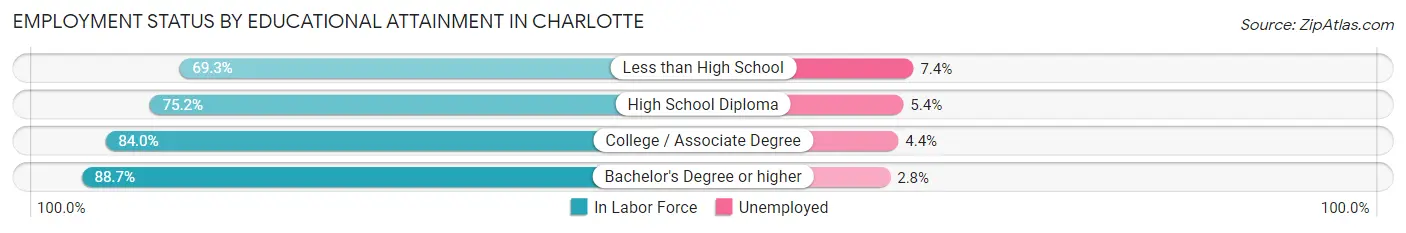
| Educational Attainment | In Labor Force | Unemployed |
| Less than High School | 34,565 (69.3%) | 3,691 (7.4%) |
| High School Diploma | 57,510 (75.2%) | 4,130 (5.4%) |
| College / Associate Degree | 107,937 (84.0%) | 5,654 (4.4%) |
| Bachelor's Degree or higher | 212,978 (88.7%) | 6,723 (2.8%) |
| Total | 412,797 (83.4%) | 19,798 (4.0%) |
Employment Occupations by Sex in Charlotte
Management, Business, Science and Arts Occupations
The most common Management, Business, Science and Arts occupations in Charlotte are Management (63,534 | 13.3%), Community & Social Service (49,166 | 10.3%), Business & Financial (45,044 | 9.4%), Computers, Engineering & Science (38,330 | 8.0%), and Computers & Mathematics (26,220 | 5.5%).

Management, Business, Science and Arts Occupations by Sex
Within the Management, Business, Science and Arts occupations in Charlotte, the most male-oriented occupations are Architecture & Engineering (82.0%), Computers & Mathematics (72.2%), and Computers, Engineering & Science (72.2%), while the most female-oriented occupations are Health Technologists (75.0%), Health Diagnosing & Treating (73.5%), and Education Instruction & Library (73.3%).
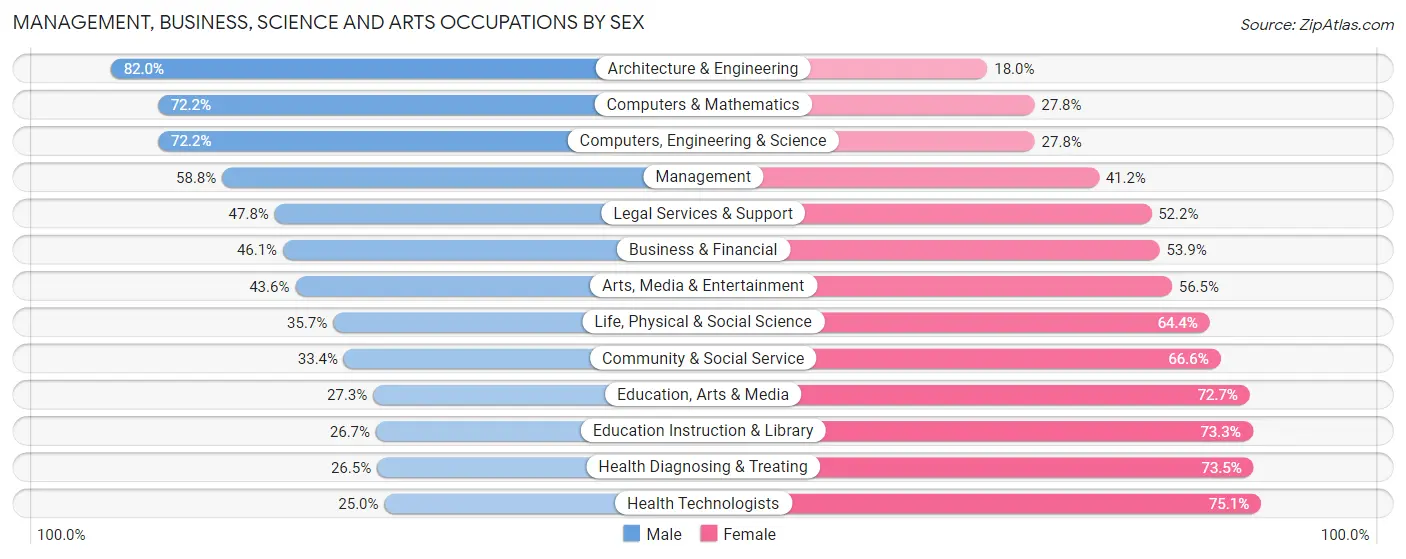
| Occupation | Male | Female |
| Management | 37,360 (58.8%) | 26,174 (41.2%) |
| Business & Financial | 20,768 (46.1%) | 24,276 (53.9%) |
| Computers, Engineering & Science | 27,659 (72.2%) | 10,671 (27.8%) |
| Computers & Mathematics | 18,937 (72.2%) | 7,283 (27.8%) |
| Architecture & Engineering | 7,790 (82.0%) | 1,706 (18.0%) |
| Life, Physical & Social Science | 932 (35.6%) | 1,682 (64.3%) |
| Community & Social Service | 16,420 (33.4%) | 32,746 (66.6%) |
| Education, Arts & Media | 2,289 (27.3%) | 6,095 (72.7%) |
| Legal Services & Support | 3,350 (47.8%) | 3,652 (52.2%) |
| Education Instruction & Library | 6,237 (26.7%) | 17,109 (73.3%) |
| Arts, Media & Entertainment | 4,544 (43.5%) | 5,890 (56.5%) |
| Health Diagnosing & Treating | 6,037 (26.5%) | 16,750 (73.5%) |
| Health Technologists | 4,041 (24.9%) | 12,155 (75.0%) |
| Total (Category) | 108,244 (49.5%) | 110,617 (50.5%) |
| Total (Overall) | 245,384 (51.4%) | 231,765 (48.6%) |
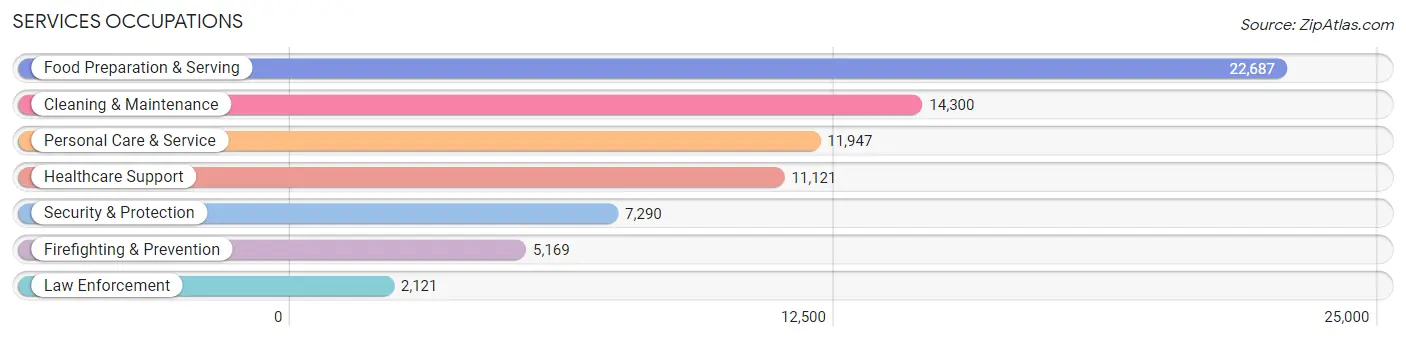
Services Occupations
The most common Services occupations in Charlotte are Food Preparation & Serving (22,687 | 4.8%), Cleaning & Maintenance (14,300 | 3.0%), Personal Care & Service (11,947 | 2.5%), Healthcare Support (11,121 | 2.3%), and Security & Protection (7,290 | 1.5%).
Services Occupations by Sex
Within the Services occupations in Charlotte, the most male-oriented occupations are Law Enforcement (73.6%), Security & Protection (59.6%), and Cleaning & Maintenance (56.1%), while the most female-oriented occupations are Healthcare Support (88.2%), Personal Care & Service (76.8%), and Food Preparation & Serving (53.7%).
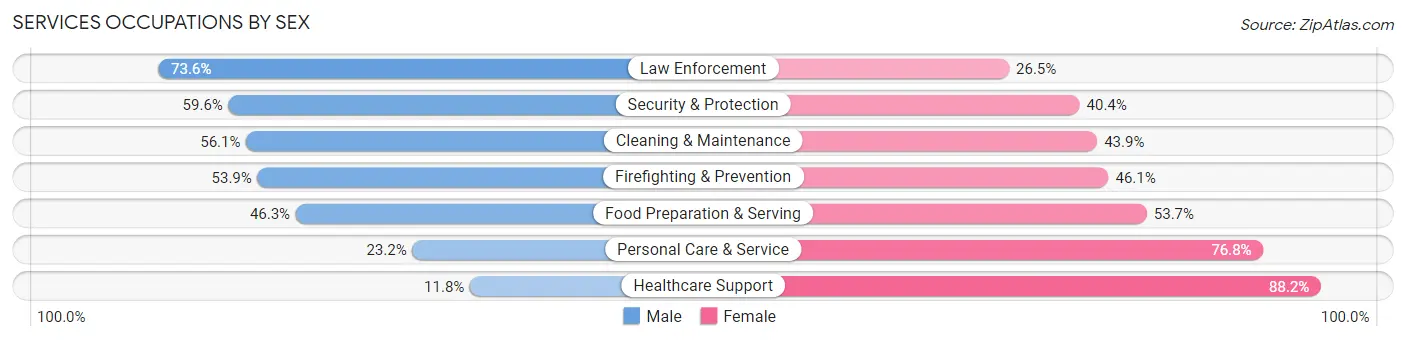
| Occupation | Male | Female |
| Healthcare Support | 1,309 (11.8%) | 9,812 (88.2%) |
| Security & Protection | 4,344 (59.6%) | 2,946 (40.4%) |
| Firefighting & Prevention | 2,784 (53.9%) | 2,385 (46.1%) |
| Law Enforcement | 1,560 (73.6%) | 561 (26.5%) |
| Food Preparation & Serving | 10,497 (46.3%) | 12,190 (53.7%) |
| Cleaning & Maintenance | 8,022 (56.1%) | 6,278 (43.9%) |
| Personal Care & Service | 2,771 (23.2%) | 9,176 (76.8%) |
| Total (Category) | 26,943 (40.0%) | 40,402 (60.0%) |
| Total (Overall) | 245,384 (51.4%) | 231,765 (48.6%) |
Sales and Office Occupations
The most common Sales and Office occupations in Charlotte are Sales & Related (51,221 | 10.7%), and Office & Administration (49,481 | 10.4%).

Sales and Office Occupations by Sex
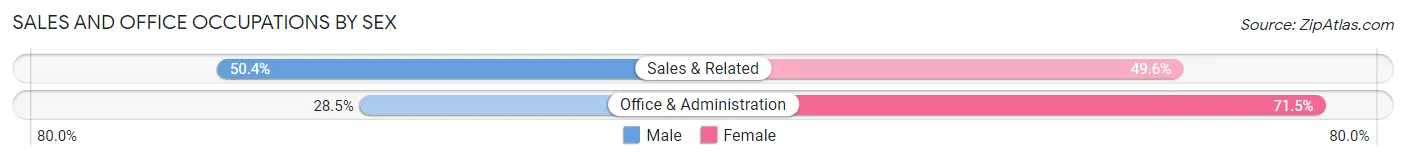
| Occupation | Male | Female |
| Sales & Related | 25,823 (50.4%) | 25,398 (49.6%) |
| Office & Administration | 14,091 (28.5%) | 35,390 (71.5%) |
| Total (Category) | 39,914 (39.6%) | 60,788 (60.4%) |
| Total (Overall) | 245,384 (51.4%) | 231,765 (48.6%) |
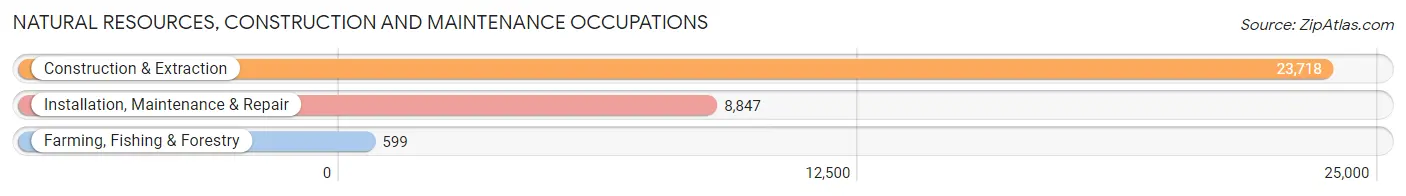
Natural Resources, Construction and Maintenance Occupations
The most common Natural Resources, Construction and Maintenance occupations in Charlotte are Construction & Extraction (23,718 | 5.0%), Installation, Maintenance & Repair (8,847 | 1.8%), and Farming, Fishing & Forestry (599 | 0.1%).
Natural Resources, Construction and Maintenance Occupations by Sex
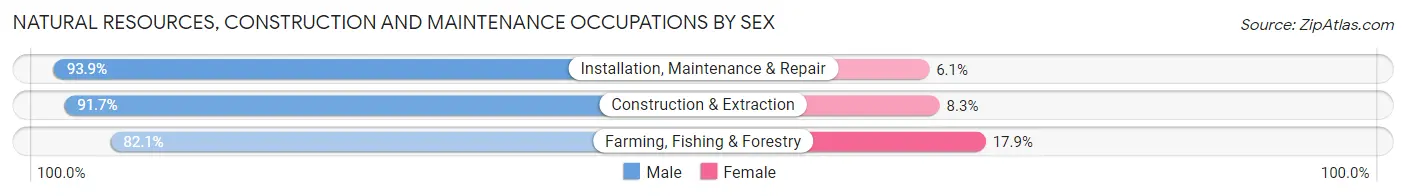
| Occupation | Male | Female |
| Farming, Fishing & Forestry | 492 (82.1%) | 107 (17.9%) |
| Construction & Extraction | 21,757 (91.7%) | 1,961 (8.3%) |
| Installation, Maintenance & Repair | 8,308 (93.9%) | 539 (6.1%) |
| Total (Category) | 30,557 (92.1%) | 2,607 (7.9%) |
| Total (Overall) | 245,384 (51.4%) | 231,765 (48.6%) |
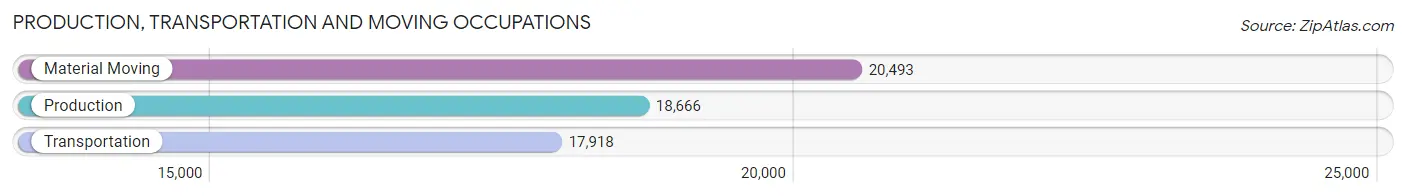
Production, Transportation and Moving Occupations
The most common Production, Transportation and Moving occupations in Charlotte are Material Moving (20,493 | 4.3%), Production (18,666 | 3.9%), and Transportation (17,918 | 3.8%).
Production, Transportation and Moving Occupations by Sex
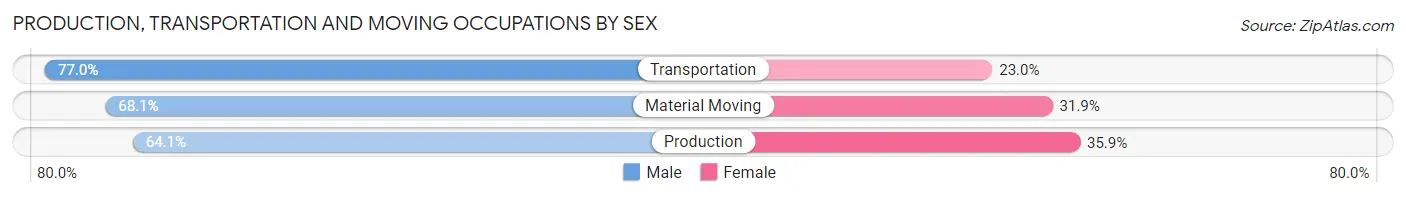
| Occupation | Male | Female |
| Production | 11,967 (64.1%) | 6,699 (35.9%) |
| Transportation | 13,795 (77.0%) | 4,123 (23.0%) |
| Material Moving | 13,964 (68.1%) | 6,529 (31.9%) |
| Total (Category) | 39,726 (69.6%) | 17,351 (30.4%) |
| Total (Overall) | 245,384 (51.4%) | 231,765 (48.6%) |
Employment Industries by Sex in Charlotte
Employment Industries in Charlotte
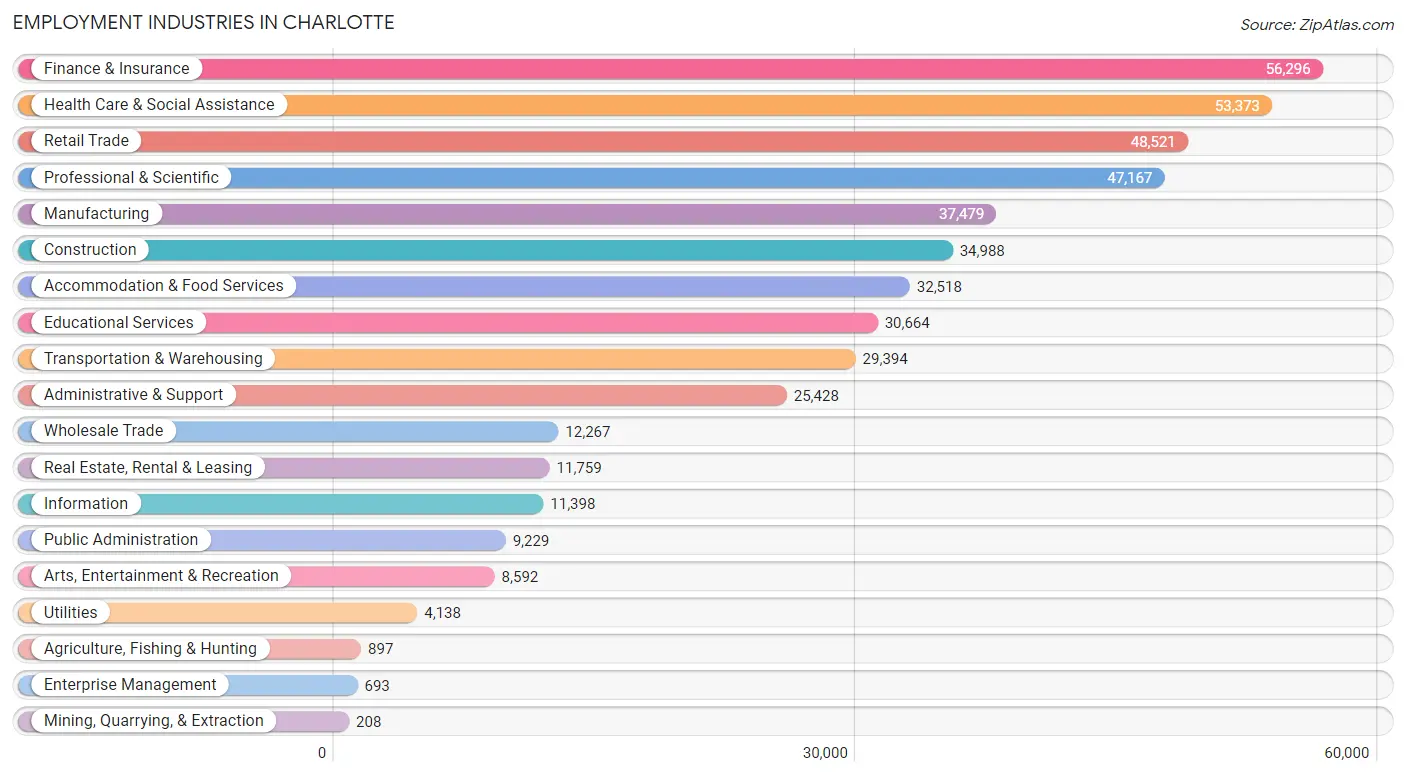
The major employment industries in Charlotte include Finance & Insurance (56,296 | 11.8%), Health Care & Social Assistance (53,373 | 11.2%), Retail Trade (48,521 | 10.2%), Professional & Scientific (47,167 | 9.9%), and Manufacturing (37,479 | 7.9%).
Employment Industries by Sex in Charlotte
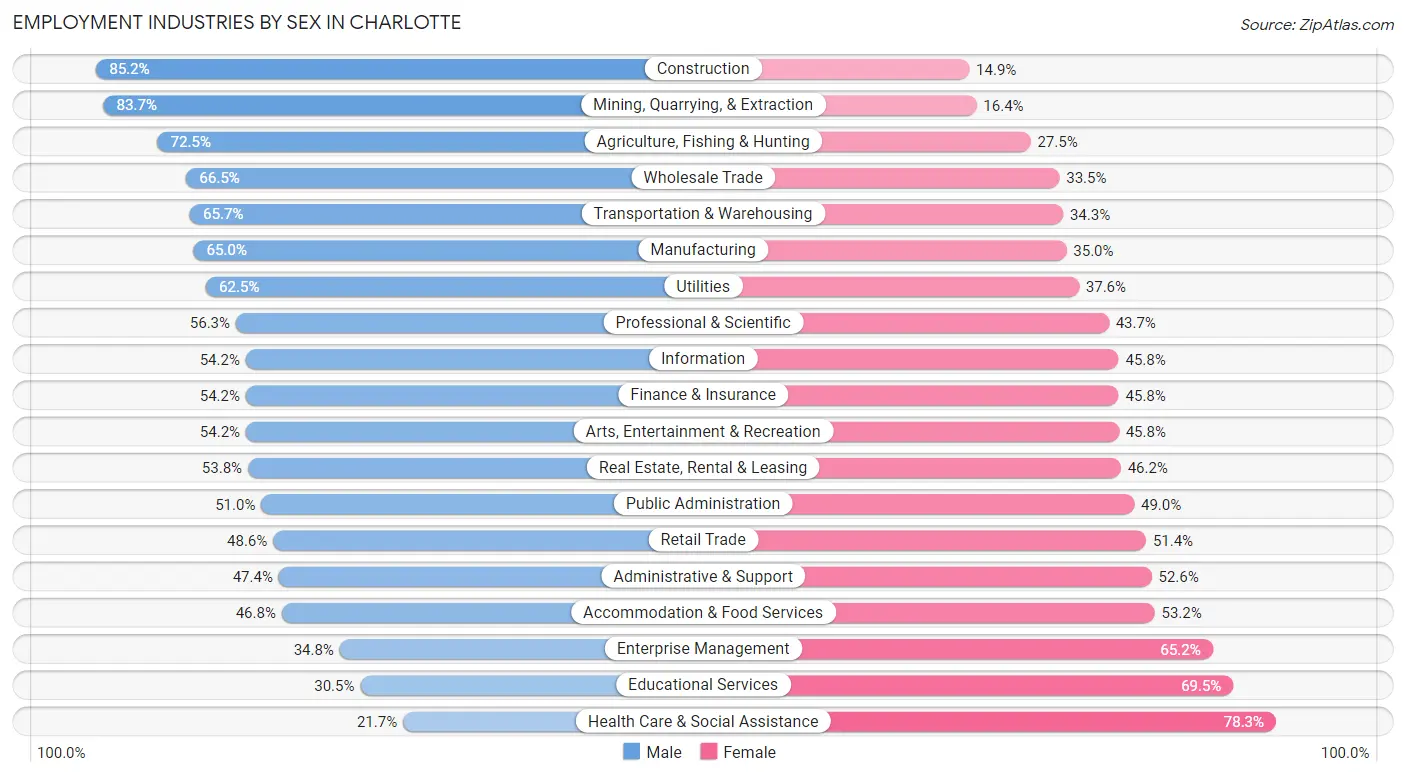
The Charlotte industries that see more men than women are Construction (85.2%), Mining, Quarrying, & Extraction (83.7%), and Agriculture, Fishing & Hunting (72.5%), whereas the industries that tend to have a higher number of women are Health Care & Social Assistance (78.3%), Educational Services (69.5%), and Enterprise Management (65.2%).
| Industry | Male | Female |
| Agriculture, Fishing & Hunting | 650 (72.5%) | 247 (27.5%) |
| Mining, Quarrying, & Extraction | 174 (83.7%) | 34 (16.4%) |
| Construction | 29,791 (85.2%) | 5,197 (14.8%) |
| Manufacturing | 24,373 (65.0%) | 13,106 (35.0%) |
| Wholesale Trade | 8,157 (66.5%) | 4,110 (33.5%) |
| Retail Trade | 23,560 (48.6%) | 24,961 (51.4%) |
| Transportation & Warehousing | 19,322 (65.7%) | 10,072 (34.3%) |
| Utilities | 2,584 (62.5%) | 1,554 (37.6%) |
| Information | 6,181 (54.2%) | 5,217 (45.8%) |
| Finance & Insurance | 30,525 (54.2%) | 25,771 (45.8%) |
| Real Estate, Rental & Leasing | 6,324 (53.8%) | 5,435 (46.2%) |
| Professional & Scientific | 26,543 (56.3%) | 20,624 (43.7%) |
| Enterprise Management | 241 (34.8%) | 452 (65.2%) |
| Administrative & Support | 12,054 (47.4%) | 13,374 (52.6%) |
| Educational Services | 9,356 (30.5%) | 21,308 (69.5%) |
| Health Care & Social Assistance | 11,572 (21.7%) | 41,801 (78.3%) |
| Arts, Entertainment & Recreation | 4,656 (54.2%) | 3,936 (45.8%) |
| Accommodation & Food Services | 15,211 (46.8%) | 17,307 (53.2%) |
| Public Administration | 4,709 (51.0%) | 4,520 (49.0%) |
| Total | 245,384 (51.4%) | 231,765 (48.6%) |
Education in Charlotte
School Enrollment in Charlotte
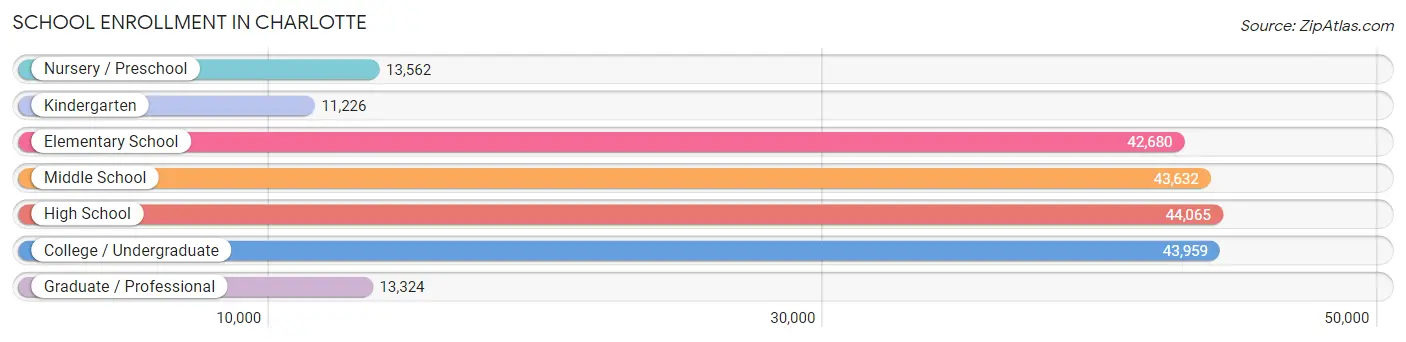
The most common levels of schooling among the 212,448 students in Charlotte are high school (44,065 | 20.7%), college / undergraduate (43,959 | 20.7%), and middle school (43,632 | 20.5%).
| School Level | # Students | % Students |
| Nursery / Preschool | 13,562 | 6.4% |
| Kindergarten | 11,226 | 5.3% |
| Elementary School | 42,680 | 20.1% |
| Middle School | 43,632 | 20.5% |
| High School | 44,065 | 20.7% |
| College / Undergraduate | 43,959 | 20.7% |
| Graduate / Professional | 13,324 | 6.3% |
| Total | 212,448 | 100.0% |
School Enrollment by Age by Funding Source in Charlotte
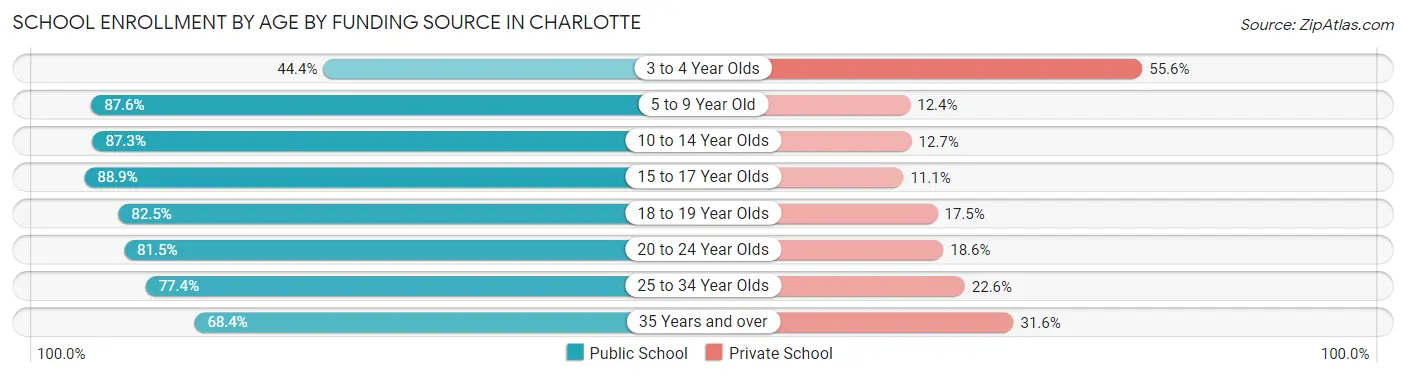
Out of a total of 212,448 students who are enrolled in schools in Charlotte, 36,329 (17.1%) attend a private institution, while the remaining 176,119 (82.9%) are enrolled in public schools. The age group of 3 to 4 year olds has the highest likelihood of being enrolled in private schools, with 5,747 (55.6% in the age bracket) enrolled. Conversely, the age group of 15 to 17 year olds has the lowest likelihood of being enrolled in a private school, with 28,475 (88.9% in the age bracket) attending a public institution.
| Age Bracket | Public School | Private School |
| 3 to 4 Year Olds | 4,583 (44.4%) | 5,747 (55.6%) |
| 5 to 9 Year Old | 45,716 (87.6%) | 6,477 (12.4%) |
| 10 to 14 Year Olds | 47,253 (87.3%) | 6,847 (12.7%) |
| 15 to 17 Year Olds | 28,475 (88.9%) | 3,569 (11.1%) |
| 18 to 19 Year Olds | 13,158 (82.5%) | 2,788 (17.5%) |
| 20 to 24 Year Olds | 17,746 (81.5%) | 4,042 (18.5%) |
| 25 to 34 Year Olds | 11,043 (77.4%) | 3,218 (22.6%) |
| 35 Years and over | 8,057 (68.4%) | 3,729 (31.6%) |
| Total | 176,119 (82.9%) | 36,329 (17.1%) |
Educational Attainment by Field of Study in Charlotte
Business (78,072 | 26.6%), social sciences (26,836 | 9.1%), science & technology (21,640 | 7.4%), engineering (21,394 | 7.3%), and education (20,792 | 7.1%) are the most common fields of study among 293,721 individuals in Charlotte who have obtained a bachelor's degree or higher.
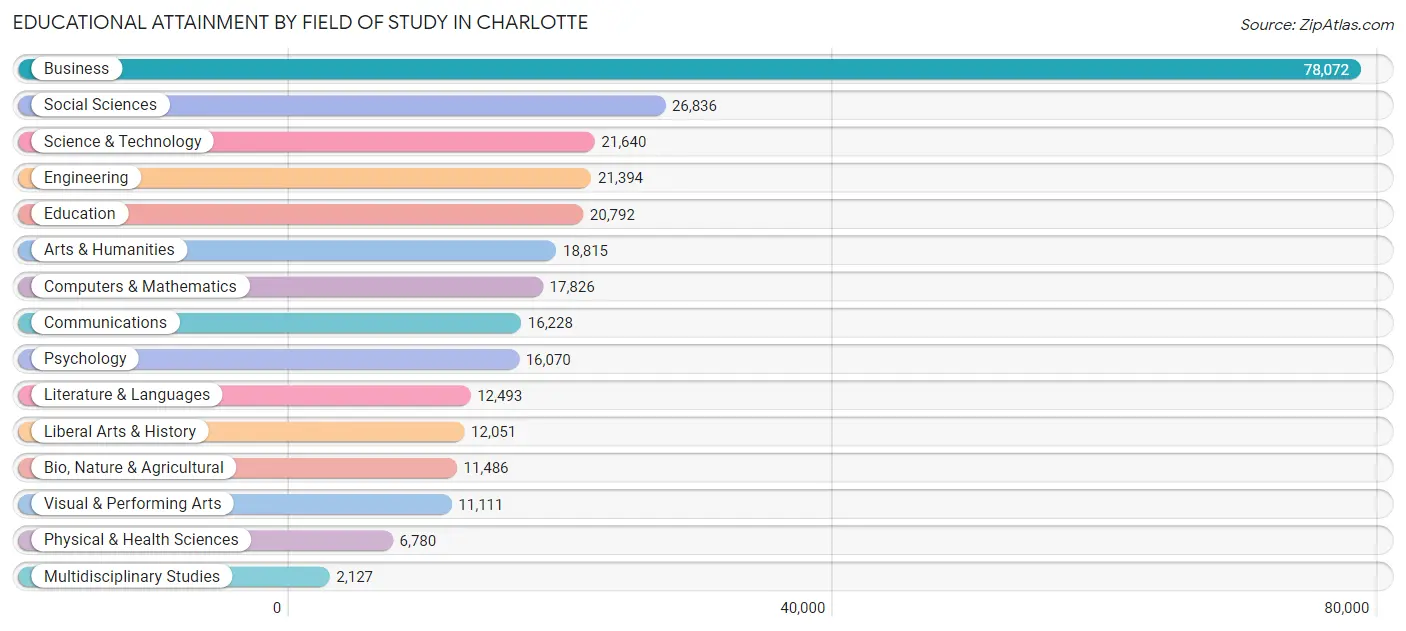
| Field of Study | # Graduates | % Graduates |
| Computers & Mathematics | 17,826 | 6.1% |
| Bio, Nature & Agricultural | 11,486 | 3.9% |
| Physical & Health Sciences | 6,780 | 2.3% |
| Psychology | 16,070 | 5.5% |
| Social Sciences | 26,836 | 9.1% |
| Engineering | 21,394 | 7.3% |
| Multidisciplinary Studies | 2,127 | 0.7% |
| Science & Technology | 21,640 | 7.4% |
| Business | 78,072 | 26.6% |
| Education | 20,792 | 7.1% |
| Literature & Languages | 12,493 | 4.3% |
| Liberal Arts & History | 12,051 | 4.1% |
| Visual & Performing Arts | 11,111 | 3.8% |
| Communications | 16,228 | 5.5% |
| Arts & Humanities | 18,815 | 6.4% |
| Total | 293,721 | 100.0% |
Transportation & Commute in Charlotte
Vehicle Availability by Sex in Charlotte
The most prevalent vehicle ownership categories in Charlotte are males with 2 vehicles (106,633, accounting for 44.4%) and females with 2 vehicles (90,635, making up 47.6%).
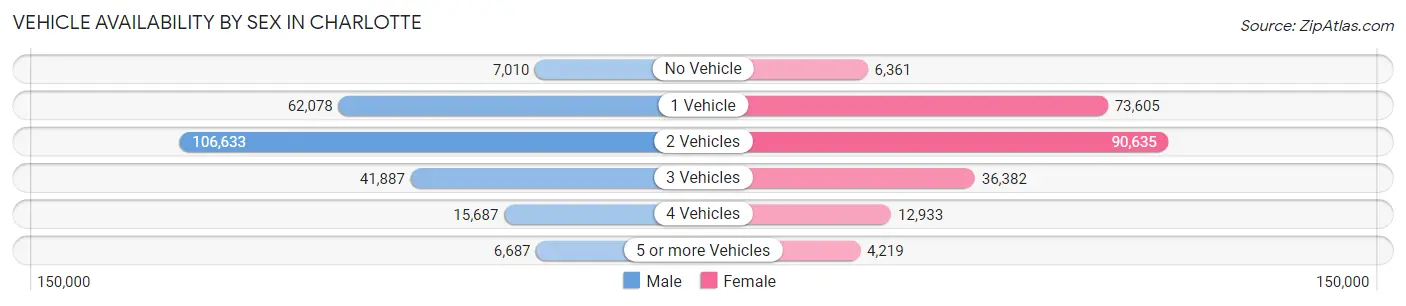
| Vehicles Available | Male | Female |
| No Vehicle | 7,010 (2.9%) | 6,361 (2.8%) |
| 1 Vehicle | 62,078 (25.9%) | 73,605 (32.8%) |
| 2 Vehicles | 106,633 (44.4%) | 90,635 (40.4%) |
| 3 Vehicles | 41,887 (17.4%) | 36,382 (16.2%) |
| 4 Vehicles | 15,687 (6.5%) | 12,933 (5.8%) |
| 5 or more Vehicles | 6,687 (2.8%) | 4,219 (1.9%) |
| Total | 239,982 (100.0%) | 224,135 (100.0%) |
Commute Time in Charlotte
The most frequently occuring commute durations in Charlotte are 20 to 24 minutes (65,258 commuters, 17.7%), 15 to 19 minutes (62,295 commuters, 17.0%), and 30 to 34 minutes (59,596 commuters, 16.2%).
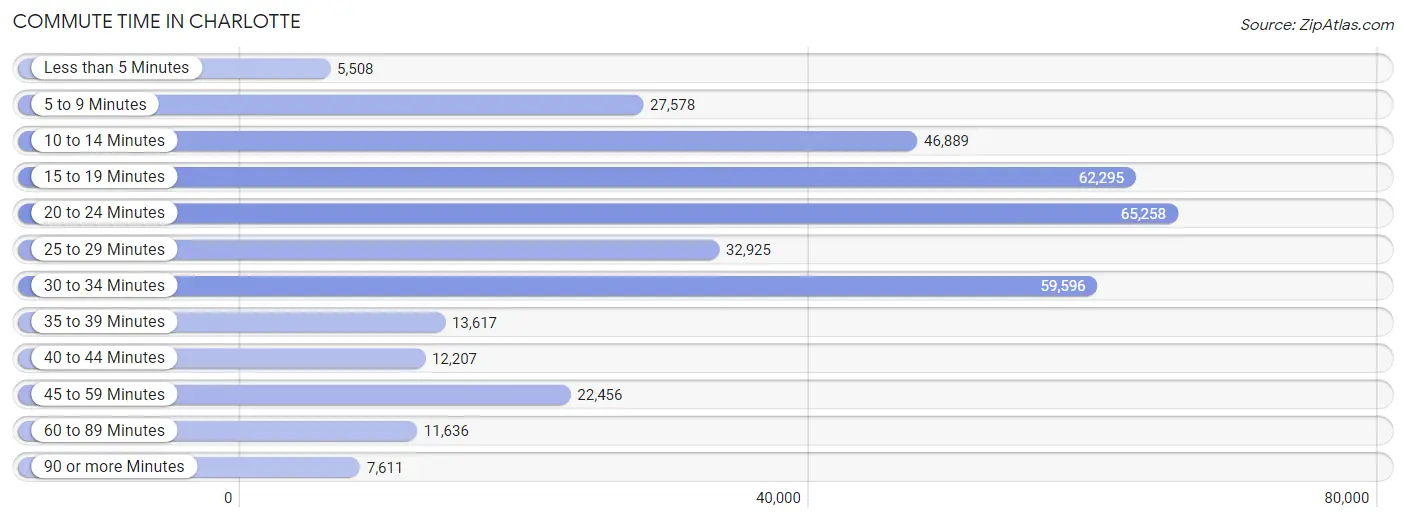
| Commute Time | # Commuters | % Commuters |
| Less than 5 Minutes | 5,508 | 1.5% |
| 5 to 9 Minutes | 27,578 | 7.5% |
| 10 to 14 Minutes | 46,889 | 12.8% |
| 15 to 19 Minutes | 62,295 | 17.0% |
| 20 to 24 Minutes | 65,258 | 17.7% |
| 25 to 29 Minutes | 32,925 | 9.0% |
| 30 to 34 Minutes | 59,596 | 16.2% |
| 35 to 39 Minutes | 13,617 | 3.7% |
| 40 to 44 Minutes | 12,207 | 3.3% |
| 45 to 59 Minutes | 22,456 | 6.1% |
| 60 to 89 Minutes | 11,636 | 3.2% |
| 90 or more Minutes | 7,611 | 2.1% |
Commute Time by Sex in Charlotte
The most common commute times in Charlotte are 20 to 24 minutes (33,212 commuters, 17.4%) for males and 20 to 24 minutes (32,046 commuters, 18.1%) for females.
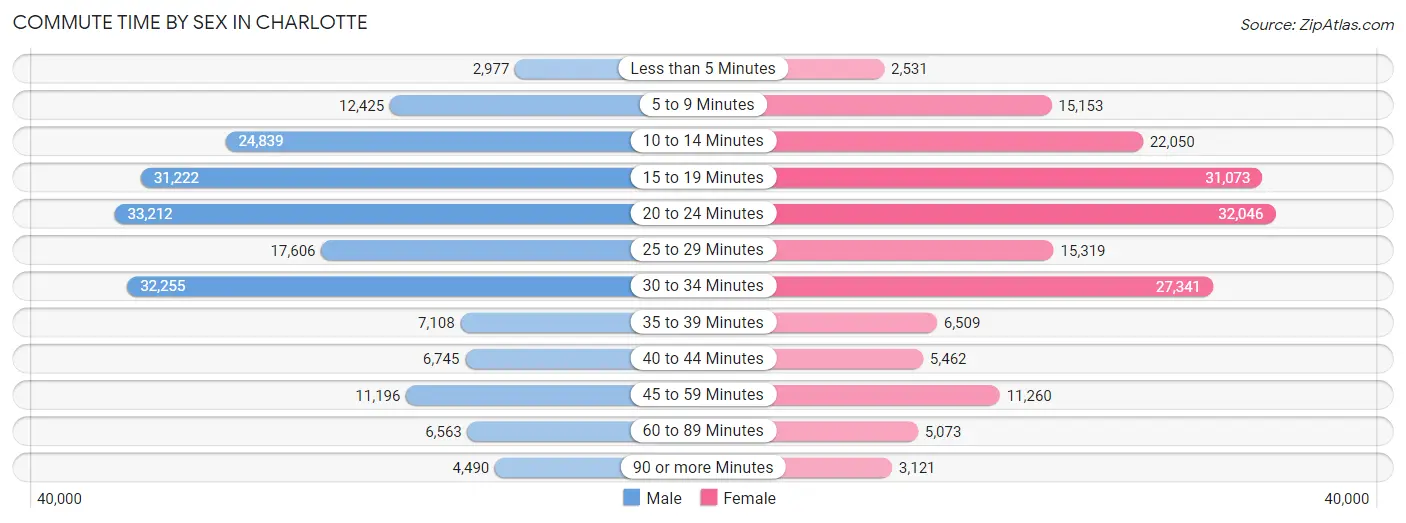
| Commute Time | Male | Female |
| Less than 5 Minutes | 2,977 (1.6%) | 2,531 (1.4%) |
| 5 to 9 Minutes | 12,425 (6.5%) | 15,153 (8.6%) |
| 10 to 14 Minutes | 24,839 (13.0%) | 22,050 (12.5%) |
| 15 to 19 Minutes | 31,222 (16.4%) | 31,073 (17.6%) |
| 20 to 24 Minutes | 33,212 (17.4%) | 32,046 (18.1%) |
| 25 to 29 Minutes | 17,606 (9.2%) | 15,319 (8.7%) |
| 30 to 34 Minutes | 32,255 (16.9%) | 27,341 (15.4%) |
| 35 to 39 Minutes | 7,108 (3.7%) | 6,509 (3.7%) |
| 40 to 44 Minutes | 6,745 (3.5%) | 5,462 (3.1%) |
| 45 to 59 Minutes | 11,196 (5.9%) | 11,260 (6.4%) |
| 60 to 89 Minutes | 6,563 (3.4%) | 5,073 (2.9%) |
| 90 or more Minutes | 4,490 (2.4%) | 3,121 (1.8%) |
Time of Departure to Work by Sex in Charlotte
The most frequent times of departure to work in Charlotte are 7:00 AM to 7:29 AM (28,028, 14.7%) for males and 7:00 AM to 7:29 AM (25,386, 14.3%) for females.
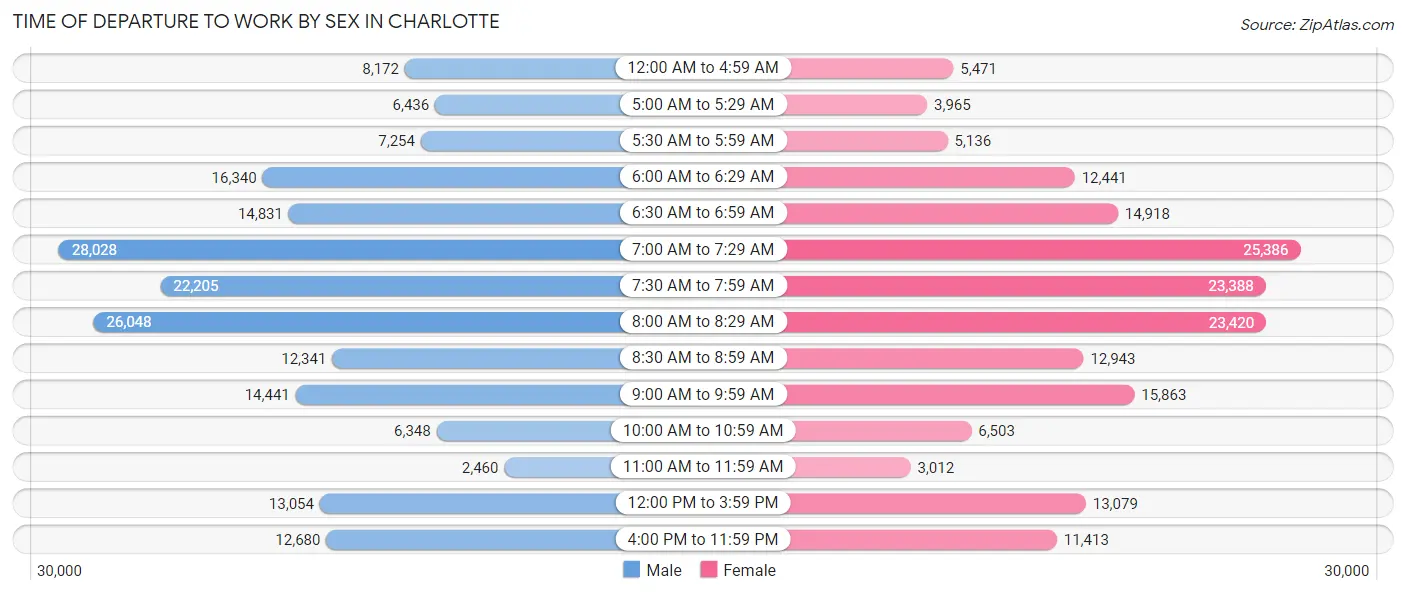
| Time of Departure | Male | Female |
| 12:00 AM to 4:59 AM | 8,172 (4.3%) | 5,471 (3.1%) |
| 5:00 AM to 5:29 AM | 6,436 (3.4%) | 3,965 (2.2%) |
| 5:30 AM to 5:59 AM | 7,254 (3.8%) | 5,136 (2.9%) |
| 6:00 AM to 6:29 AM | 16,340 (8.6%) | 12,441 (7.0%) |
| 6:30 AM to 6:59 AM | 14,831 (7.8%) | 14,918 (8.4%) |
| 7:00 AM to 7:29 AM | 28,028 (14.7%) | 25,386 (14.3%) |
| 7:30 AM to 7:59 AM | 22,205 (11.7%) | 23,388 (13.2%) |
| 8:00 AM to 8:29 AM | 26,048 (13.7%) | 23,420 (13.2%) |
| 8:30 AM to 8:59 AM | 12,341 (6.5%) | 12,943 (7.3%) |
| 9:00 AM to 9:59 AM | 14,441 (7.6%) | 15,863 (9.0%) |
| 10:00 AM to 10:59 AM | 6,348 (3.3%) | 6,503 (3.7%) |
| 11:00 AM to 11:59 AM | 2,460 (1.3%) | 3,012 (1.7%) |
| 12:00 PM to 3:59 PM | 13,054 (6.9%) | 13,079 (7.4%) |
| 4:00 PM to 11:59 PM | 12,680 (6.7%) | 11,413 (6.5%) |
| Total | 190,638 (100.0%) | 176,938 (100.0%) |
Housing Occupancy in Charlotte
Occupancy by Ownership in Charlotte
Of the total 354,442 dwellings in Charlotte, owner-occupied units account for 184,774 (52.1%), while renter-occupied units make up 169,668 (47.9%).
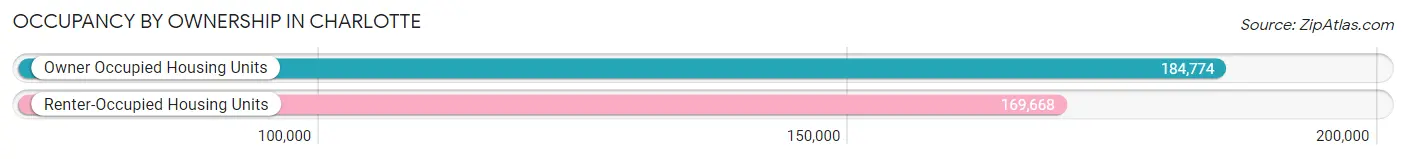
| Occupancy | # Housing Units | % Housing Units |
| Owner Occupied Housing Units | 184,774 | 52.1% |
| Renter-Occupied Housing Units | 169,668 | 47.9% |
| Total Occupied Housing Units | 354,442 | 100.0% |
Occupancy by Household Size in Charlotte
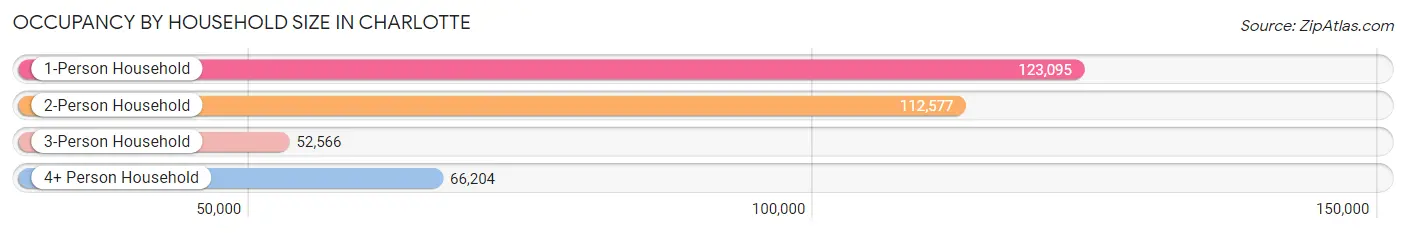
| Household Size | # Housing Units | % Housing Units |
| 1-Person Household | 123,095 | 34.7% |
| 2-Person Household | 112,577 | 31.8% |
| 3-Person Household | 52,566 | 14.8% |
| 4+ Person Household | 66,204 | 18.7% |
| Total Housing Units | 354,442 | 100.0% |
Occupancy by Ownership by Household Size in Charlotte
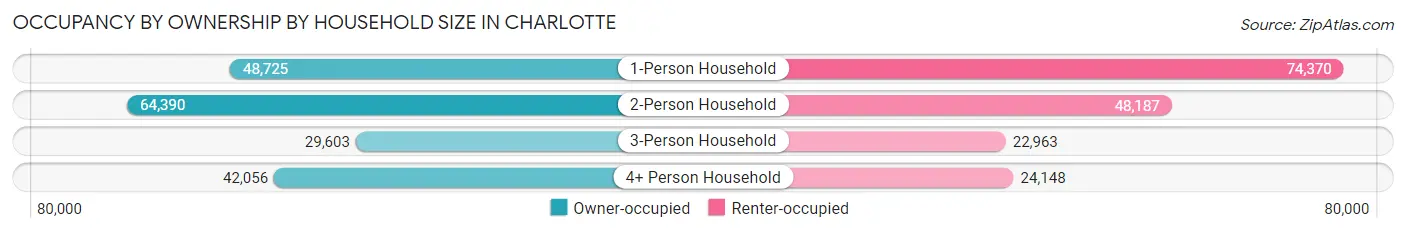
| Household Size | Owner-occupied | Renter-occupied |
| 1-Person Household | 48,725 (39.6%) | 74,370 (60.4%) |
| 2-Person Household | 64,390 (57.2%) | 48,187 (42.8%) |
| 3-Person Household | 29,603 (56.3%) | 22,963 (43.7%) |
| 4+ Person Household | 42,056 (63.5%) | 24,148 (36.5%) |
| Total Housing Units | 184,774 (52.1%) | 169,668 (47.9%) |
Occupancy by Educational Attainment in Charlotte
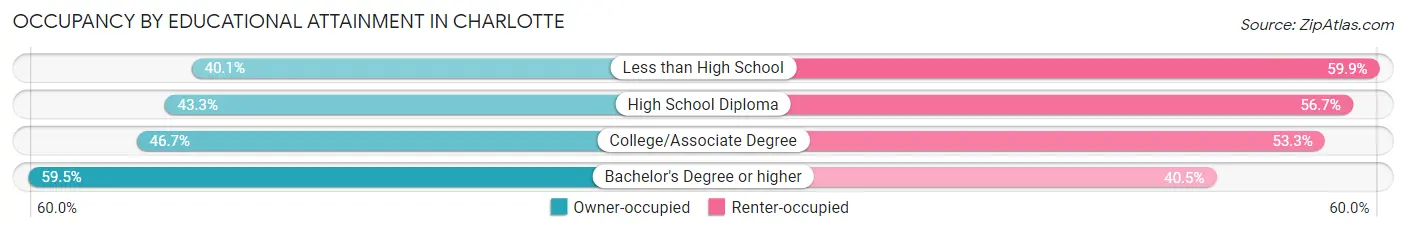
| Household Size | Owner-occupied | Renter-occupied |
| Less than High School | 11,203 (40.1%) | 16,710 (59.9%) |
| High School Diploma | 21,329 (43.3%) | 27,884 (56.7%) |
| College/Associate Degree | 46,657 (46.7%) | 53,323 (53.3%) |
| Bachelor's Degree or higher | 105,585 (59.5%) | 71,751 (40.5%) |
Occupancy by Age of Householder in Charlotte
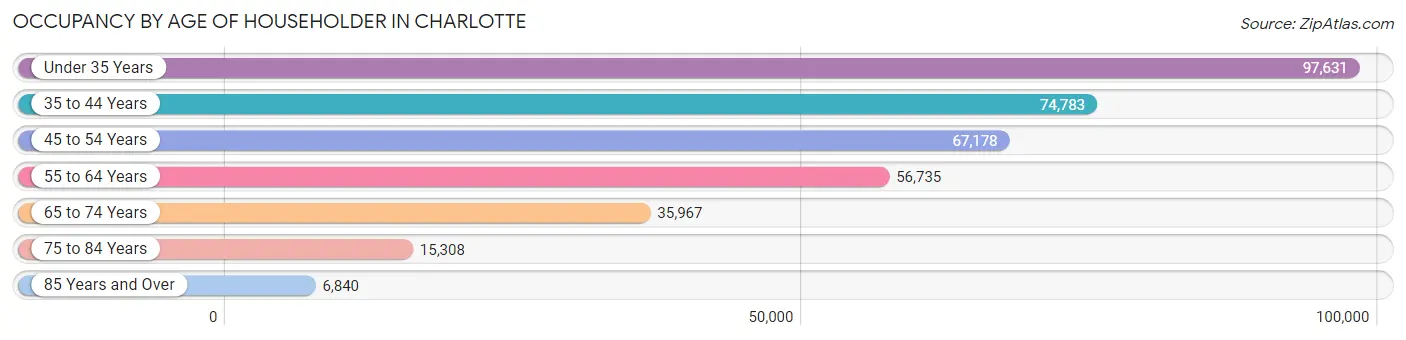
| Age Bracket | # Households | % Households |
| Under 35 Years | 97,631 | 27.5% |
| 35 to 44 Years | 74,783 | 21.1% |
| 45 to 54 Years | 67,178 | 19.0% |
| 55 to 64 Years | 56,735 | 16.0% |
| 65 to 74 Years | 35,967 | 10.2% |
| 75 to 84 Years | 15,308 | 4.3% |
| 85 Years and Over | 6,840 | 1.9% |
| Total | 354,442 | 100.0% |
Housing Finances in Charlotte
Median Income by Occupancy in Charlotte
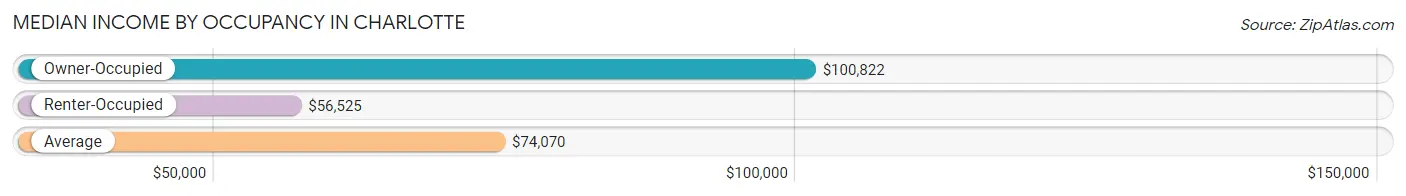
| Occupancy Type | # Households | Median Income |
| Owner-Occupied | 184,774 (52.1%) | $100,822 |
| Renter-Occupied | 169,668 (47.9%) | $56,525 |
| Average | 354,442 (100.0%) | $74,070 |
Occupancy by Householder Income Bracket in Charlotte
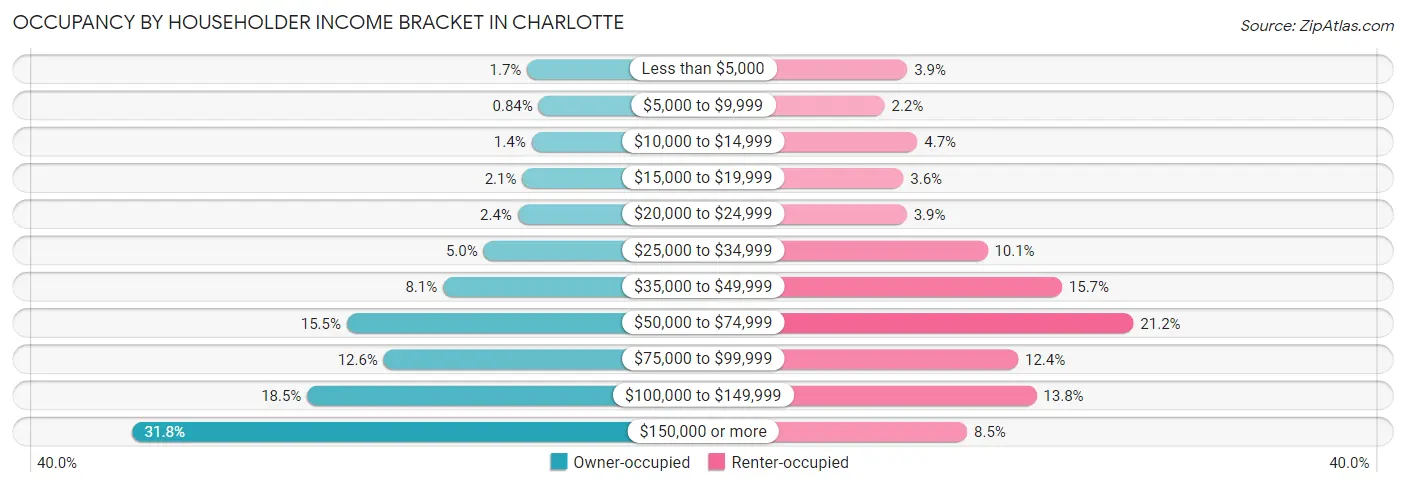
| Income Bracket | Owner-occupied | Renter-occupied |
| Less than $5,000 | 3,163 (1.7%) | 6,691 (3.9%) |
| $5,000 to $9,999 | 1,560 (0.8%) | 3,747 (2.2%) |
| $10,000 to $14,999 | 2,556 (1.4%) | 7,987 (4.7%) |
| $15,000 to $19,999 | 3,839 (2.1%) | 6,169 (3.6%) |
| $20,000 to $24,999 | 4,489 (2.4%) | 6,612 (3.9%) |
| $25,000 to $34,999 | 9,296 (5.0%) | 17,049 (10.1%) |
| $35,000 to $49,999 | 15,001 (8.1%) | 26,676 (15.7%) |
| $50,000 to $74,999 | 28,552 (15.4%) | 35,924 (21.2%) |
| $75,000 to $99,999 | 23,355 (12.6%) | 21,005 (12.4%) |
| $100,000 to $149,999 | 34,133 (18.5%) | 23,386 (13.8%) |
| $150,000 or more | 58,830 (31.8%) | 14,422 (8.5%) |
| Total | 184,774 (100.0%) | 169,668 (100.0%) |
Monthly Housing Cost Tiers in Charlotte
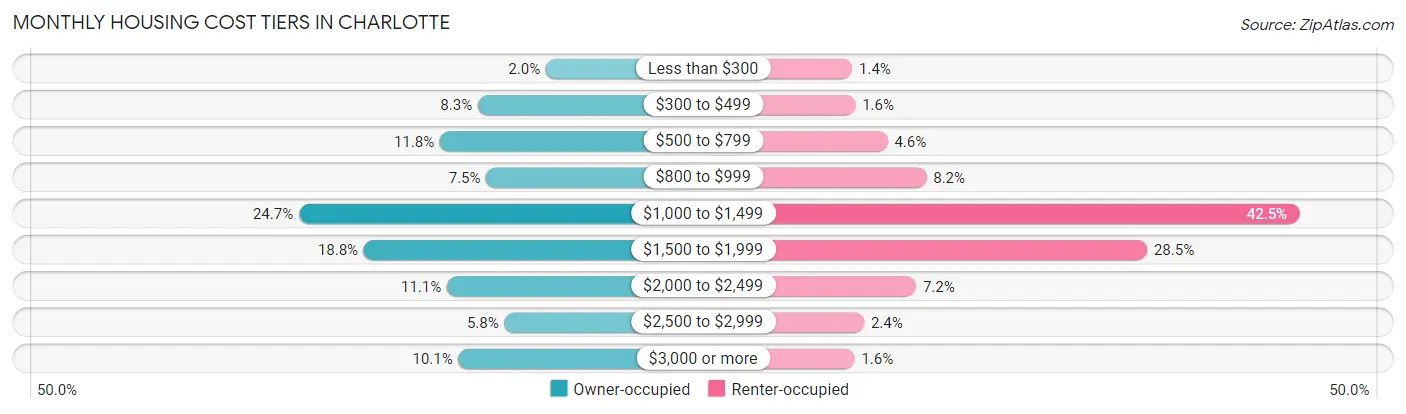
| Monthly Cost | Owner-occupied | Renter-occupied |
| Less than $300 | 3,688 (2.0%) | 2,293 (1.3%) |
| $300 to $499 | 15,257 (8.3%) | 2,781 (1.6%) |
| $500 to $799 | 21,733 (11.8%) | 7,816 (4.6%) |
| $800 to $999 | 13,843 (7.5%) | 13,875 (8.2%) |
| $1,000 to $1,499 | 45,706 (24.7%) | 72,080 (42.5%) |
| $1,500 to $1,999 | 34,672 (18.8%) | 48,347 (28.5%) |
| $2,000 to $2,499 | 20,533 (11.1%) | 12,271 (7.2%) |
| $2,500 to $2,999 | 10,763 (5.8%) | 4,135 (2.4%) |
| $3,000 or more | 18,579 (10.1%) | 2,668 (1.6%) |
| Total | 184,774 (100.0%) | 169,668 (100.0%) |
Physical Housing Characteristics in Charlotte
Housing Structures in Charlotte
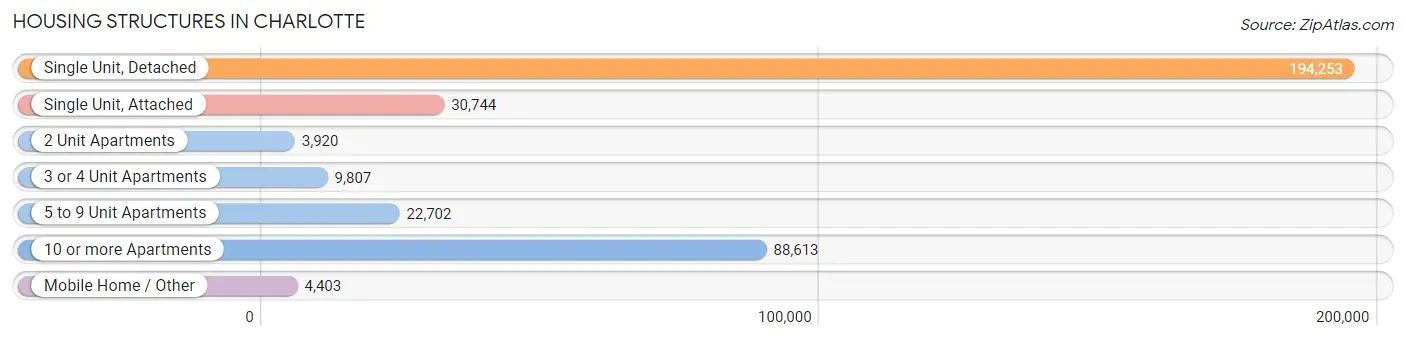
| Structure Type | # Housing Units | % Housing Units |
| Single Unit, Detached | 194,253 | 54.8% |
| Single Unit, Attached | 30,744 | 8.7% |
| 2 Unit Apartments | 3,920 | 1.1% |
| 3 or 4 Unit Apartments | 9,807 | 2.8% |
| 5 to 9 Unit Apartments | 22,702 | 6.4% |
| 10 or more Apartments | 88,613 | 25.0% |
| Mobile Home / Other | 4,403 | 1.2% |
| Total | 354,442 | 100.0% |
Housing Structures by Occupancy in Charlotte
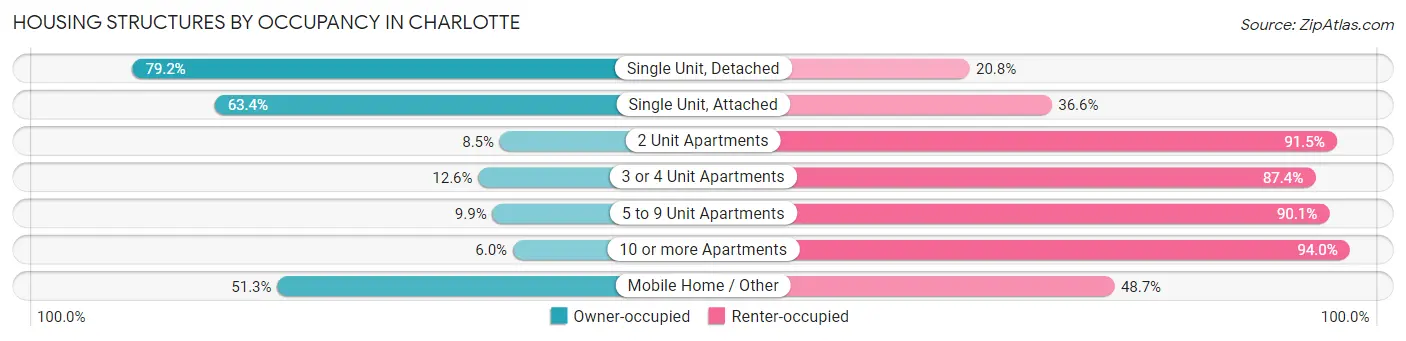
| Structure Type | Owner-occupied | Renter-occupied |
| Single Unit, Detached | 153,901 (79.2%) | 40,352 (20.8%) |
| Single Unit, Attached | 19,490 (63.4%) | 11,254 (36.6%) |
| 2 Unit Apartments | 333 (8.5%) | 3,587 (91.5%) |
| 3 or 4 Unit Apartments | 1,239 (12.6%) | 8,568 (87.4%) |
| 5 to 9 Unit Apartments | 2,249 (9.9%) | 20,453 (90.1%) |
| 10 or more Apartments | 5,302 (6.0%) | 83,311 (94.0%) |
| Mobile Home / Other | 2,260 (51.3%) | 2,143 (48.7%) |
| Total | 184,774 (52.1%) | 169,668 (47.9%) |
Housing Structures by Number of Rooms in Charlotte
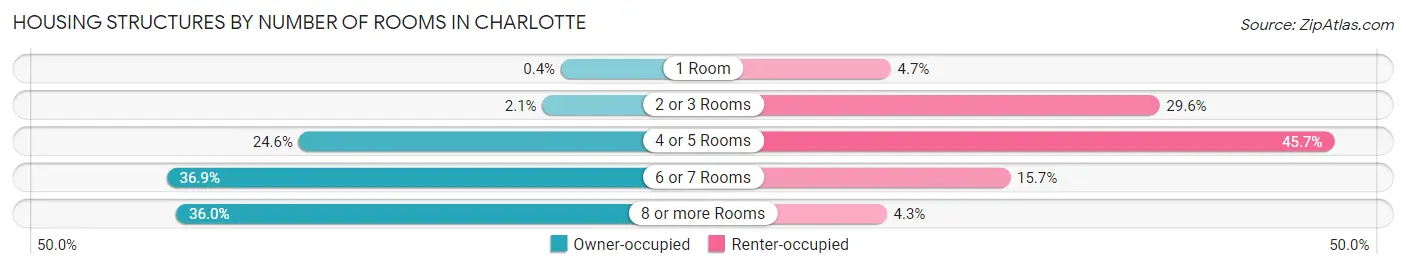
| Number of Rooms | Owner-occupied | Renter-occupied |
| 1 Room | 736 (0.4%) | 7,952 (4.7%) |
| 2 or 3 Rooms | 3,901 (2.1%) | 50,141 (29.5%) |
| 4 or 5 Rooms | 45,531 (24.6%) | 77,548 (45.7%) |
| 6 or 7 Rooms | 68,117 (36.9%) | 26,689 (15.7%) |
| 8 or more Rooms | 66,489 (36.0%) | 7,338 (4.3%) |
| Total | 184,774 (100.0%) | 169,668 (100.0%) |
Housing Structure by Heating Type in Charlotte
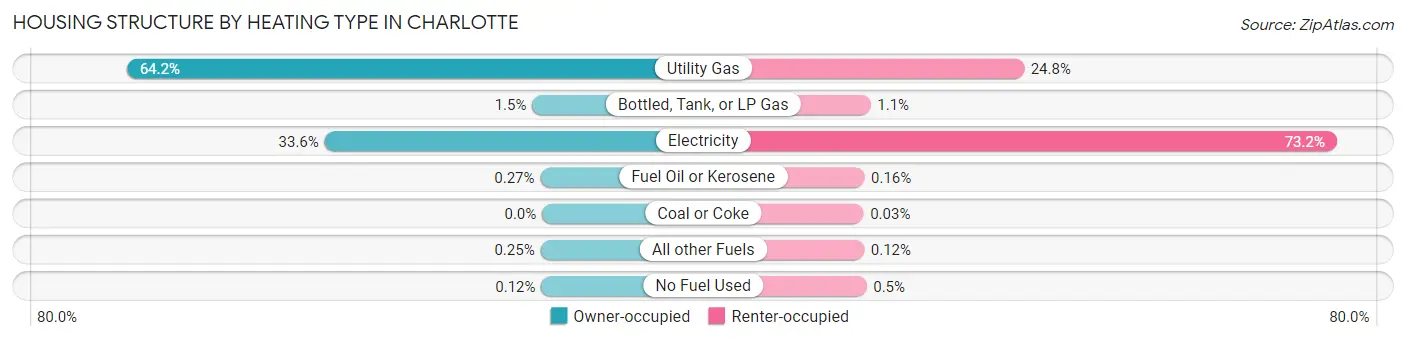
| Heating Type | Owner-occupied | Renter-occupied |
| Utility Gas | 118,646 (64.2%) | 42,154 (24.8%) |
| Bottled, Tank, or LP Gas | 2,808 (1.5%) | 1,922 (1.1%) |
| Electricity | 62,125 (33.6%) | 124,224 (73.2%) |
| Fuel Oil or Kerosene | 504 (0.3%) | 273 (0.2%) |
| Coal or Coke | 9 (0.0%) | 49 (0.0%) |
| All other Fuels | 460 (0.3%) | 197 (0.1%) |
| No Fuel Used | 222 (0.1%) | 849 (0.5%) |
| Total | 184,774 (100.0%) | 169,668 (100.0%) |
Household Vehicle Usage in Charlotte
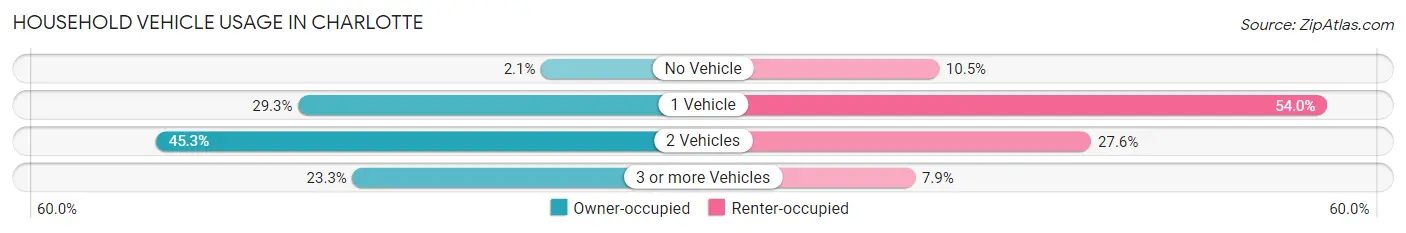
| Vehicles per Household | Owner-occupied | Renter-occupied |
| No Vehicle | 3,908 (2.1%) | 17,872 (10.5%) |
| 1 Vehicle | 54,217 (29.3%) | 91,691 (54.0%) |
| 2 Vehicles | 83,695 (45.3%) | 46,787 (27.6%) |
| 3 or more Vehicles | 42,954 (23.3%) | 13,318 (7.9%) |
| Total | 184,774 (100.0%) | 169,668 (100.0%) |
Real Estate & Mortgages in Charlotte
Real Estate and Mortgage Overview in Charlotte
| Characteristic | Without Mortgage | With Mortgage |
| Housing Units | 45,787 | 138,987 |
| Median Property Value | $290,700 | $319,200 |
| Median Household Income | $72,767 | $48,157 |
| Monthly Housing Costs | $567 | $18,203 |
| Real Estate Taxes | $2,481 | $1,943 |
Property Value by Mortgage Status in Charlotte
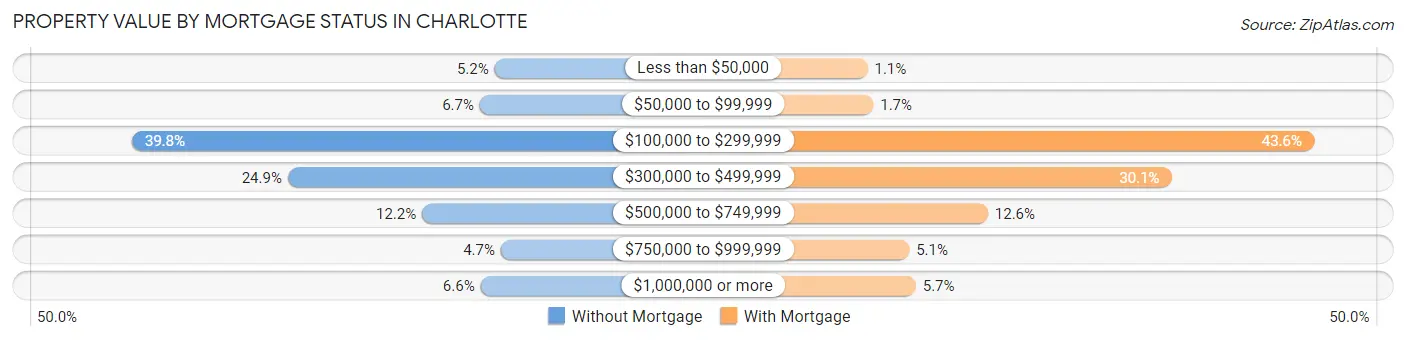
| Property Value | Without Mortgage | With Mortgage |
| Less than $50,000 | 2,397 (5.2%) | 1,582 (1.1%) |
| $50,000 to $99,999 | 3,045 (6.7%) | 2,348 (1.7%) |
| $100,000 to $299,999 | 18,219 (39.8%) | 60,655 (43.6%) |
| $300,000 to $499,999 | 11,419 (24.9%) | 41,802 (30.1%) |
| $500,000 to $749,999 | 5,564 (12.1%) | 17,512 (12.6%) |
| $750,000 to $999,999 | 2,130 (4.6%) | 7,109 (5.1%) |
| $1,000,000 or more | 3,013 (6.6%) | 7,979 (5.7%) |
| Total | 45,787 (100.0%) | 138,987 (100.0%) |
Household Income by Mortgage Status in Charlotte
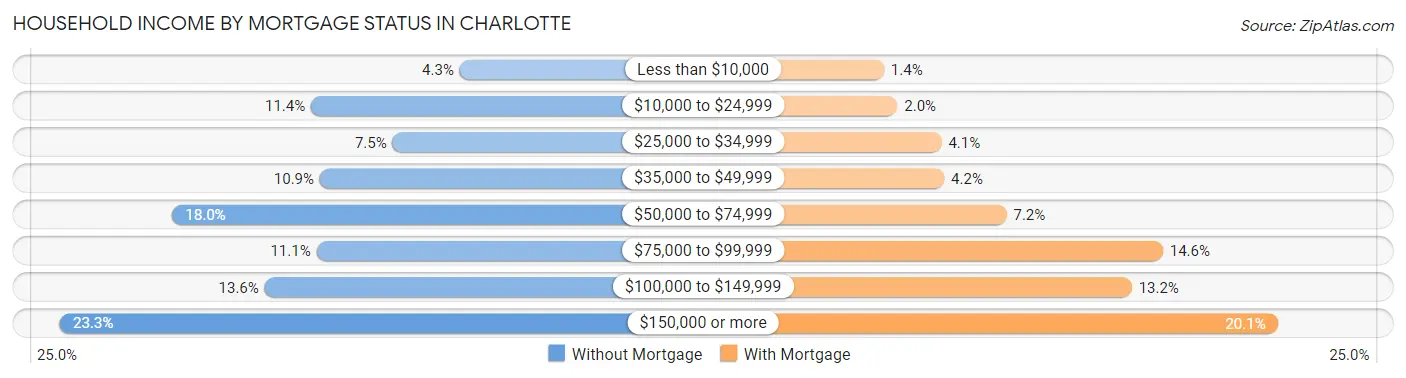
| Household Income | Without Mortgage | With Mortgage |
| Less than $10,000 | 1,959 (4.3%) | 1,882 (1.3%) |
| $10,000 to $24,999 | 5,200 (11.4%) | 2,764 (2.0%) |
| $25,000 to $34,999 | 3,427 (7.5%) | 5,684 (4.1%) |
| $35,000 to $49,999 | 5,009 (10.9%) | 5,869 (4.2%) |
| $50,000 to $74,999 | 8,222 (18.0%) | 9,992 (7.2%) |
| $75,000 to $99,999 | 5,084 (11.1%) | 20,330 (14.6%) |
| $100,000 to $149,999 | 6,213 (13.6%) | 18,271 (13.2%) |
| $150,000 or more | 10,673 (23.3%) | 27,920 (20.1%) |
| Total | 45,787 (100.0%) | 138,987 (100.0%) |
Property Value to Household Income Ratio in Charlotte
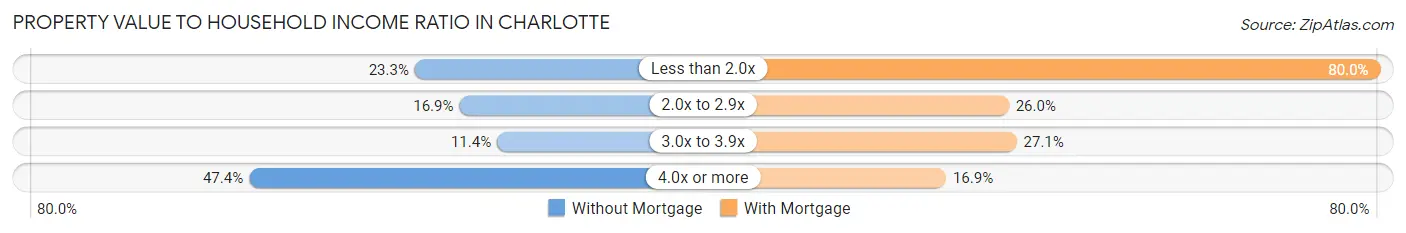
| Value-to-Income Ratio | Without Mortgage | With Mortgage |
| Less than 2.0x | 10,678 (23.3%) | 111,157 (80.0%) |
| 2.0x to 2.9x | 7,717 (16.9%) | 36,109 (26.0%) |
| 3.0x to 3.9x | 5,208 (11.4%) | 37,697 (27.1%) |
| 4.0x or more | 21,702 (47.4%) | 23,440 (16.9%) |
| Total | 45,787 (100.0%) | 138,987 (100.0%) |
Real Estate Taxes by Mortgage Status in Charlotte
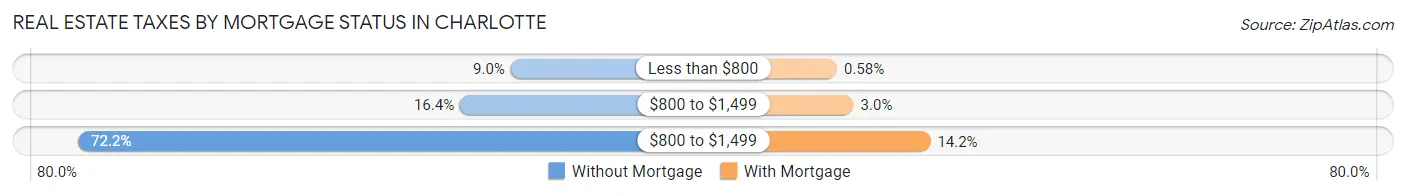
| Property Taxes | Without Mortgage | With Mortgage |
| Less than $800 | 4,109 (9.0%) | 800 (0.6%) |
| $800 to $1,499 | 7,499 (16.4%) | 4,181 (3.0%) |
| $800 to $1,499 | 33,051 (72.2%) | 19,781 (14.2%) |
| Total | 45,787 (100.0%) | 138,987 (100.0%) |
Health & Disability in Charlotte
Health Insurance Coverage by Age in Charlotte
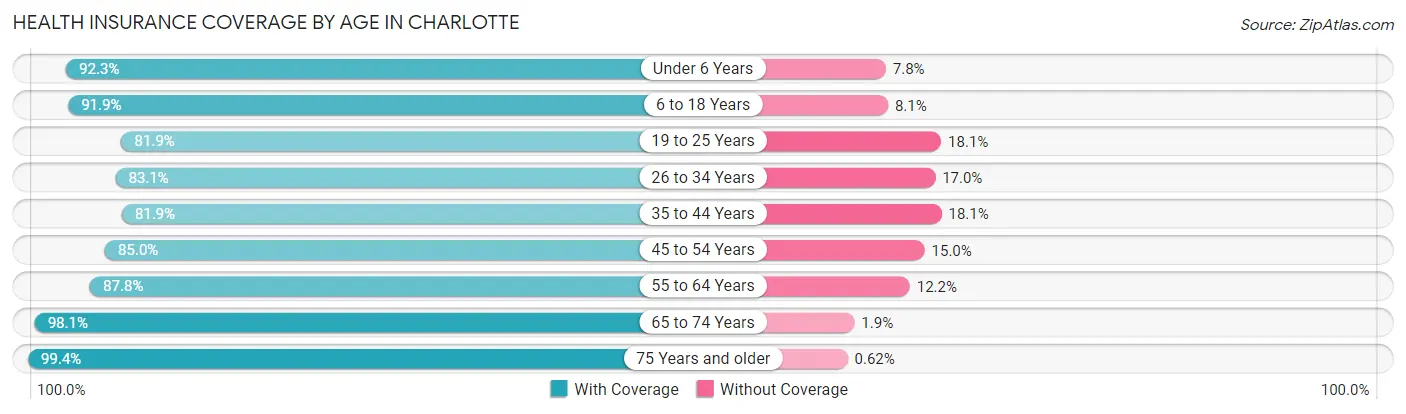
| Age Bracket | With Coverage | Without Coverage |
| Under 6 Years | 62,145 (92.2%) | 5,224 (7.7%) |
| 6 to 18 Years | 132,902 (91.9%) | 11,771 (8.1%) |
| 19 to 25 Years | 74,147 (81.9%) | 16,345 (18.1%) |
| 26 to 34 Years | 117,667 (83.1%) | 24,011 (17.0%) |
| 35 to 44 Years | 104,779 (81.9%) | 23,218 (18.1%) |
| 45 to 54 Years | 94,979 (85.0%) | 16,739 (15.0%) |
| 55 to 64 Years | 82,722 (87.8%) | 11,502 (12.2%) |
| 65 to 74 Years | 56,702 (98.1%) | 1,094 (1.9%) |
| 75 Years and older | 33,743 (99.4%) | 211 (0.6%) |
| Total | 759,786 (87.3%) | 110,115 (12.7%) |
Health Insurance Coverage by Citizenship Status in Charlotte
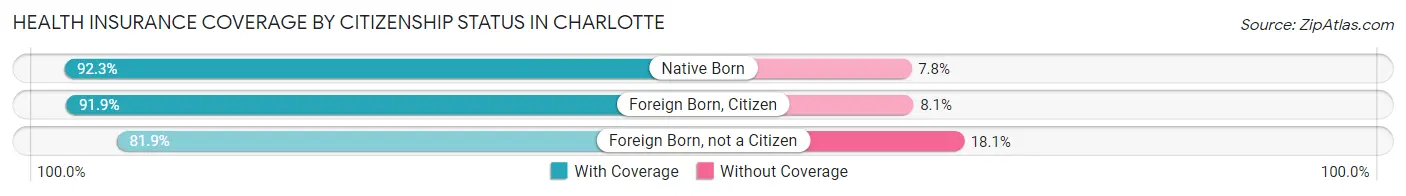
| Citizenship Status | With Coverage | Without Coverage |
| Native Born | 62,145 (92.2%) | 5,224 (7.7%) |
| Foreign Born, Citizen | 132,902 (91.9%) | 11,771 (8.1%) |
| Foreign Born, not a Citizen | 74,147 (81.9%) | 16,345 (18.1%) |
Health Insurance Coverage by Household Income in Charlotte
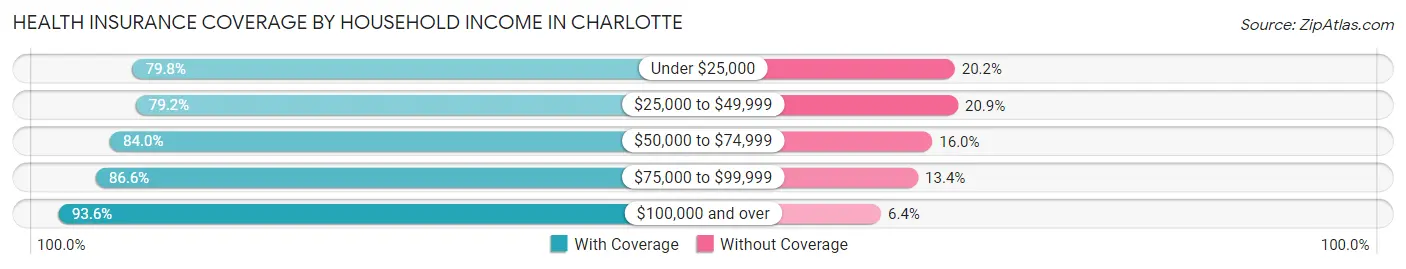
| Household Income | With Coverage | Without Coverage |
| Under $25,000 | 67,467 (79.8%) | 17,125 (20.2%) |
| $25,000 to $49,999 | 113,973 (79.1%) | 30,017 (20.8%) |
| $50,000 to $74,999 | 121,916 (84.0%) | 23,276 (16.0%) |
| $75,000 to $99,999 | 94,242 (86.6%) | 14,550 (13.4%) |
| $100,000 and over | 354,337 (93.6%) | 24,365 (6.4%) |
Public vs Private Health Insurance Coverage by Age in Charlotte
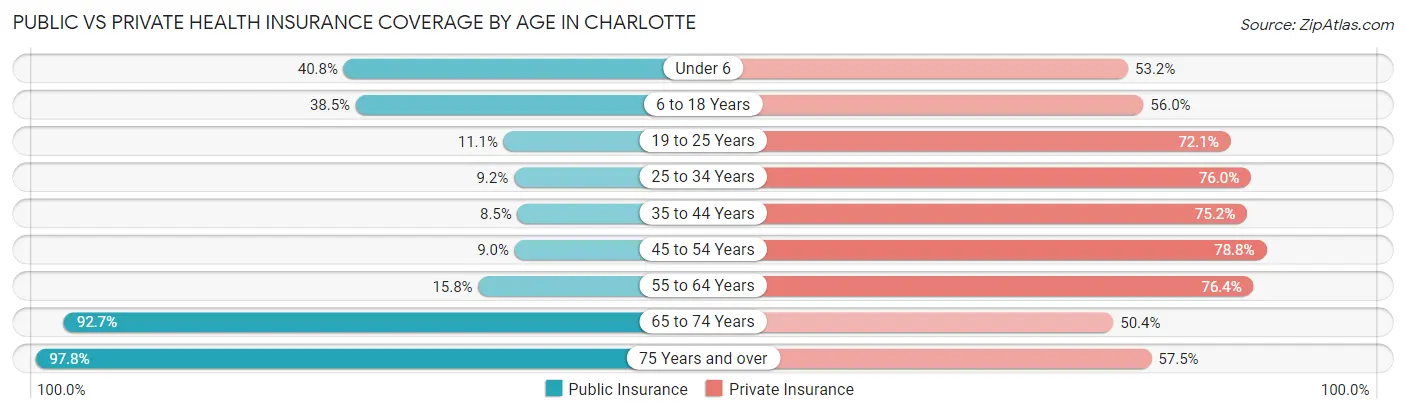
| Age Bracket | Public Insurance | Private Insurance |
| Under 6 | 27,452 (40.7%) | 35,809 (53.1%) |
| 6 to 18 Years | 55,706 (38.5%) | 80,983 (56.0%) |
| 19 to 25 Years | 9,995 (11.1%) | 65,283 (72.1%) |
| 25 to 34 Years | 12,968 (9.1%) | 107,611 (75.9%) |
| 35 to 44 Years | 10,869 (8.5%) | 96,261 (75.2%) |
| 45 to 54 Years | 10,069 (9.0%) | 88,026 (78.8%) |
| 55 to 64 Years | 14,845 (15.8%) | 72,010 (76.4%) |
| 65 to 74 Years | 53,591 (92.7%) | 29,131 (50.4%) |
| 75 Years and over | 33,217 (97.8%) | 19,515 (57.5%) |
| Total | 228,712 (26.3%) | 594,629 (68.4%) |
Disability Status by Sex by Age in Charlotte
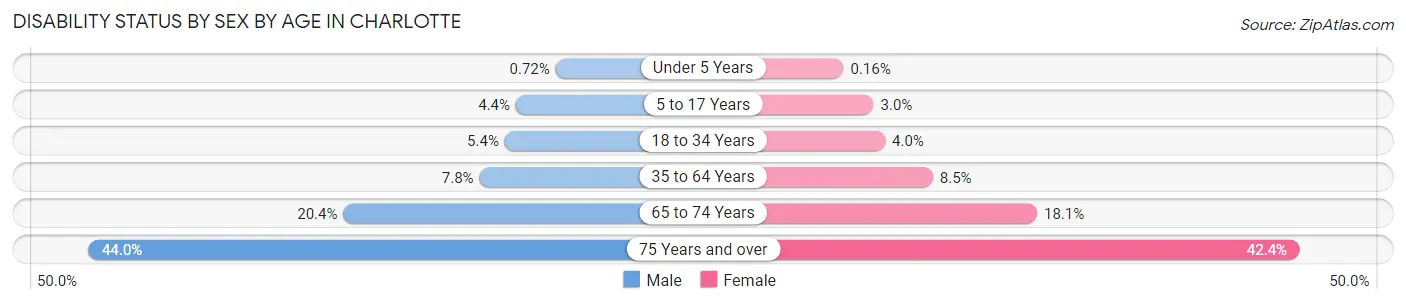
| Age Bracket | Male | Female |
| Under 5 Years | 206 (0.7%) | 43 (0.2%) |
| 5 to 17 Years | 3,269 (4.4%) | 2,057 (2.9%) |
| 18 to 34 Years | 6,448 (5.4%) | 5,051 (4.0%) |
| 35 to 64 Years | 12,540 (7.8%) | 14,610 (8.5%) |
| 65 to 74 Years | 5,193 (20.4%) | 5,867 (18.1%) |
| 75 Years and over | 5,670 (44.0%) | 8,941 (42.4%) |
Disability Class by Sex by Age in Charlotte
Disability Class: Hearing Difficulty
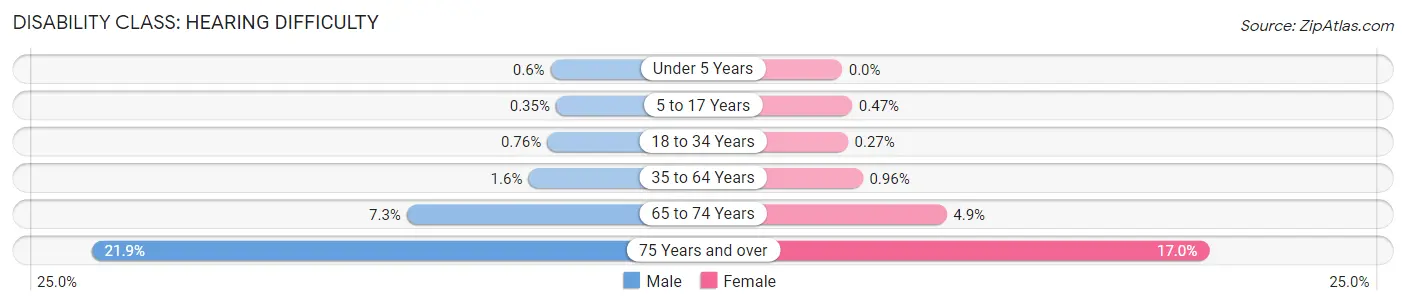
| Age Bracket | Male | Female |
| Under 5 Years | 173 (0.6%) | 0 (0.0%) |
| 5 to 17 Years | 259 (0.4%) | 328 (0.5%) |
| 18 to 34 Years | 899 (0.8%) | 334 (0.3%) |
| 35 to 64 Years | 2,626 (1.6%) | 1,665 (1.0%) |
| 65 to 74 Years | 1,848 (7.3%) | 1,570 (4.9%) |
| 75 Years and over | 2,819 (21.9%) | 3,591 (17.0%) |
Disability Class: Vision Difficulty
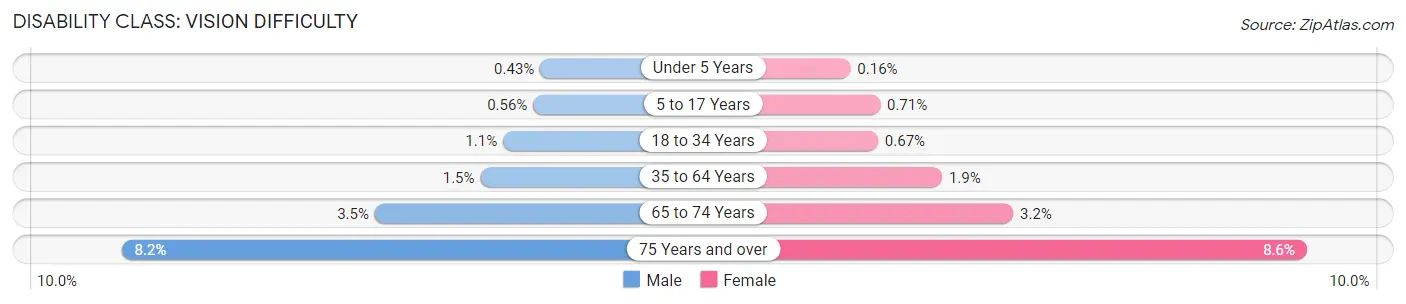
| Age Bracket | Male | Female |
| Under 5 Years | 125 (0.4%) | 43 (0.2%) |
| 5 to 17 Years | 413 (0.6%) | 492 (0.7%) |
| 18 to 34 Years | 1,327 (1.1%) | 840 (0.7%) |
| 35 to 64 Years | 2,477 (1.5%) | 3,224 (1.9%) |
| 65 to 74 Years | 891 (3.5%) | 1,031 (3.2%) |
| 75 Years and over | 1,056 (8.2%) | 1,818 (8.6%) |
Disability Class: Cognitive Difficulty
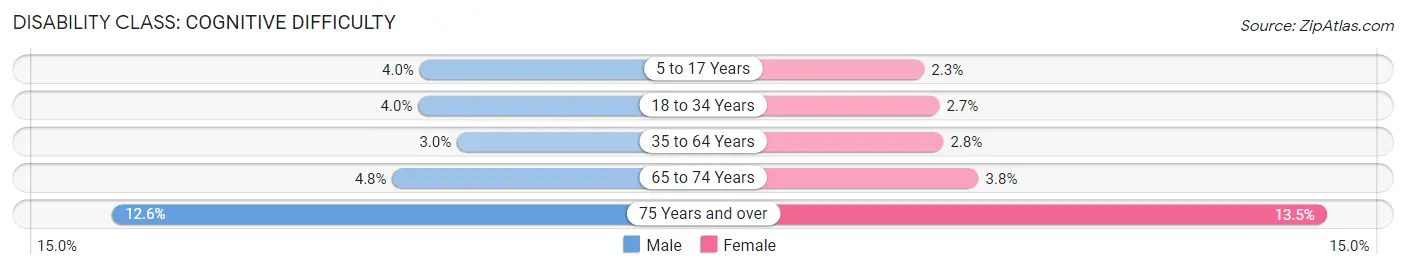
| Age Bracket | Male | Female |
| 5 to 17 Years | 2,966 (4.0%) | 1,601 (2.3%) |
| 18 to 34 Years | 4,791 (4.0%) | 3,414 (2.7%) |
| 35 to 64 Years | 4,767 (3.0%) | 4,891 (2.8%) |
| 65 to 74 Years | 1,210 (4.8%) | 1,233 (3.8%) |
| 75 Years and over | 1,617 (12.6%) | 2,845 (13.5%) |
Disability Class: Ambulatory Difficulty
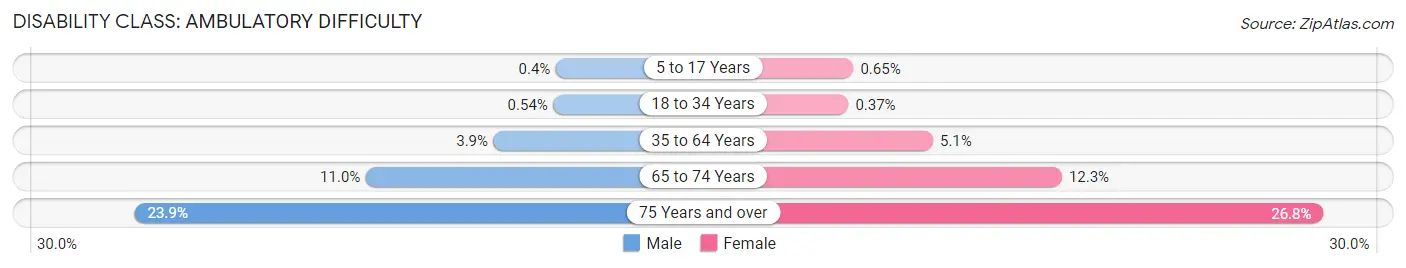
| Age Bracket | Male | Female |
| 5 to 17 Years | 294 (0.4%) | 455 (0.6%) |
| 18 to 34 Years | 642 (0.5%) | 466 (0.4%) |
| 35 to 64 Years | 6,235 (3.9%) | 8,784 (5.1%) |
| 65 to 74 Years | 2,792 (11.0%) | 3,968 (12.3%) |
| 75 Years and over | 3,075 (23.9%) | 5,650 (26.8%) |
Disability Class: Self-Care Difficulty
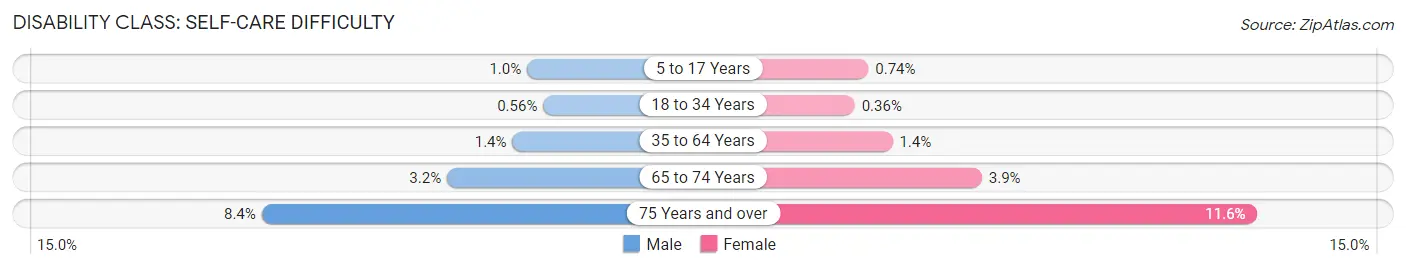
| Age Bracket | Male | Female |
| 5 to 17 Years | 746 (1.0%) | 516 (0.7%) |
| 18 to 34 Years | 669 (0.6%) | 452 (0.4%) |
| 35 to 64 Years | 2,292 (1.4%) | 2,433 (1.4%) |
| 65 to 74 Years | 825 (3.2%) | 1,262 (3.9%) |
| 75 Years and over | 1,082 (8.4%) | 2,438 (11.6%) |
Technology Access in Charlotte
Computing Device Access in Charlotte
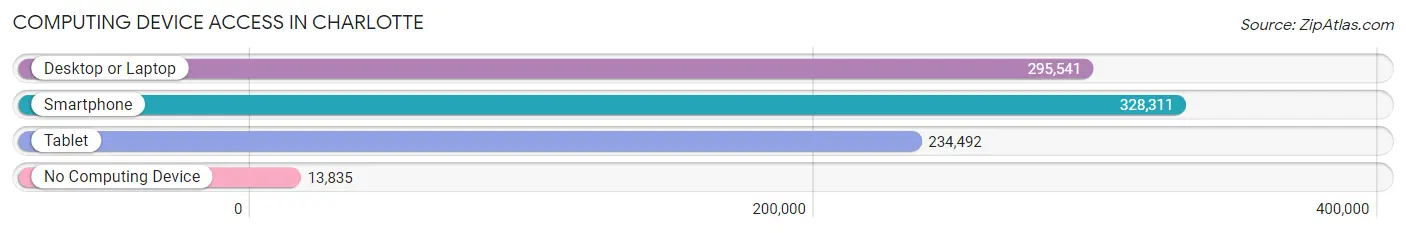
| Device Type | # Households | % Households |
| Desktop or Laptop | 295,541 | 83.4% |
| Smartphone | 328,311 | 92.6% |
| Tablet | 234,492 | 66.2% |
| No Computing Device | 13,835 | 3.9% |
| Total | 354,442 | 100.0% |
Internet Access in Charlotte
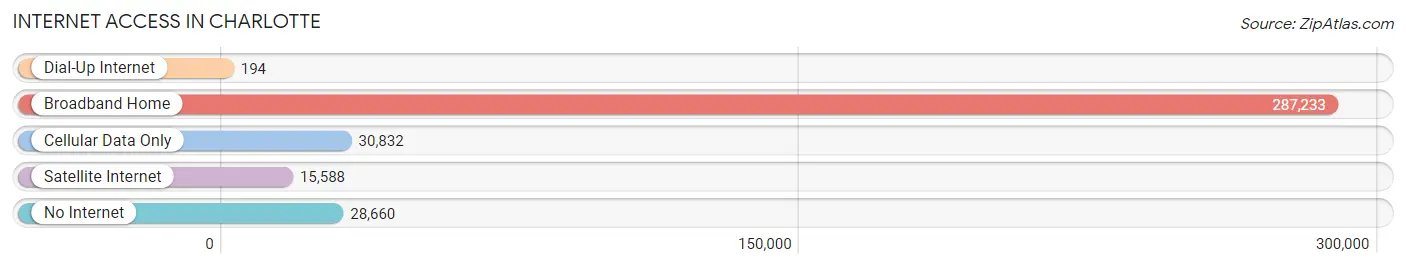
| Internet Type | # Households | % Households |
| Dial-Up Internet | 194 | 0.1% |
| Broadband Home | 287,233 | 81.0% |
| Cellular Data Only | 30,832 | 8.7% |
| Satellite Internet | 15,588 | 4.4% |
| No Internet | 28,660 | 8.1% |
| Total | 354,442 | 100.0% |
Charlotte Summary
Charlotte, North Carolina is the largest city in the state and the 17th largest city in the United States. It is located in the Piedmont region of North Carolina, and is the county seat of Mecklenburg County. Charlotte is the second-largest banking center in the United States, and is home to the headquarters of Bank of America and the East Coast operations of Wells Fargo.
History
Charlotte was founded in 1768 by Thomas Polk, a Revolutionary War veteran and a cousin of President James K. Polk. The city was named after Queen Charlotte of Mecklenburg-Strelitz, the wife of King George III of England. The city was initially a small trading post, but it quickly grew into a major trading center for the region.
In the 19th century, Charlotte became a major railroad hub, and the city was home to the first gold rush in the United States. The city was also the site of the first cotton mill in the South, and the first public library in the state.
In the 20th century, Charlotte experienced a period of rapid growth, becoming a major banking center and a hub for the automotive industry. The city was also the site of the first NASCAR race in 1949.
Geography
Charlotte is located in the Piedmont region of North Carolina, and is situated at the intersection of two major rivers, the Catawba and the Yadkin. The city is located at the foothills of the Blue Ridge Mountains, and is surrounded by rolling hills and forests.
The city has a humid subtropical climate, with hot, humid summers and mild winters. The average annual temperature is around 61°F (16°C).
Economy
Charlotte is a major banking center, and is home to the headquarters of Bank of America and the East Coast operations of Wells Fargo. The city is also a major center for the automotive industry, and is home to several major auto manufacturers, including Honda, BMW, and Mercedes-Benz.
Charlotte is also a major center for the energy industry, and is home to several major energy companies, including Duke Energy and Piedmont Natural Gas. The city is also home to several major healthcare companies, including Novant Health and Atrium Health.
Demographics
As of 2019, Charlotte had an estimated population of 872,498, making it the 17th largest city in the United States. The city has a diverse population, with a majority of the population being African American (35.2%), followed by White (30.2%), Hispanic or Latino (15.2%), and Asian (7.2%).
The median household income in Charlotte is $60,845, and the median home value is $223,400. The city has a poverty rate of 17.2%, and the unemployment rate is 4.2%.
Common Questions
What is Per Capita Income in Charlotte?
Per Capita income in Charlotte is $47,476.
What is the Median Family Income in Charlotte?
Median Family Income in Charlotte is $93,023.
What is the Median Household income in Charlotte?
Median Household Income in Charlotte is $74,070.
What is Income or Wage Gap in Charlotte?
Income or Wage Gap in Charlotte is 22.2%.
Women in Charlotte earn 77.8 cents for every dollar earned by a man.
What is Family Income Deficit in Charlotte?
Family Income Deficit in Charlotte is $10,992.
Families that are below poverty line in Charlotte earn $10,992 less on average than the poverty threshold level.
What is Inequality or Gini Index in Charlotte?
Inequality or Gini Index in Charlotte is 0.50.
What is the Total Population of Charlotte?
Total Population of Charlotte is 875,045.
What is the Total Male Population of Charlotte?
Total Male Population of Charlotte is 424,173.
What is the Total Female Population of Charlotte?
Total Female Population of Charlotte is 450,872.
What is the Ratio of Males per 100 Females in Charlotte?
There are 94.08 Males per 100 Females in Charlotte.
What is the Ratio of Females per 100 Males in Charlotte?
There are 106.29 Females per 100 Males in Charlotte.
What is the Median Population Age in Charlotte?
Median Population Age in Charlotte is 34.5 Years.
What is the Average Family Size in Charlotte
Average Family Size in Charlotte is 3.2 People.
What is the Average Household Size in Charlotte
Average Household Size in Charlotte is 2.4 People.
How Large is the Labor Force in Charlotte?
There are 502,387 People in the Labor Forcein in Charlotte.
What is the Percentage of People in the Labor Force in Charlotte?
72.1% of People are in the Labor Force in Charlotte.
What is the Unemployment Rate in Charlotte?
Unemployment Rate in Charlotte is 4.7%.