Oklahoma City, OK Map & Demographics
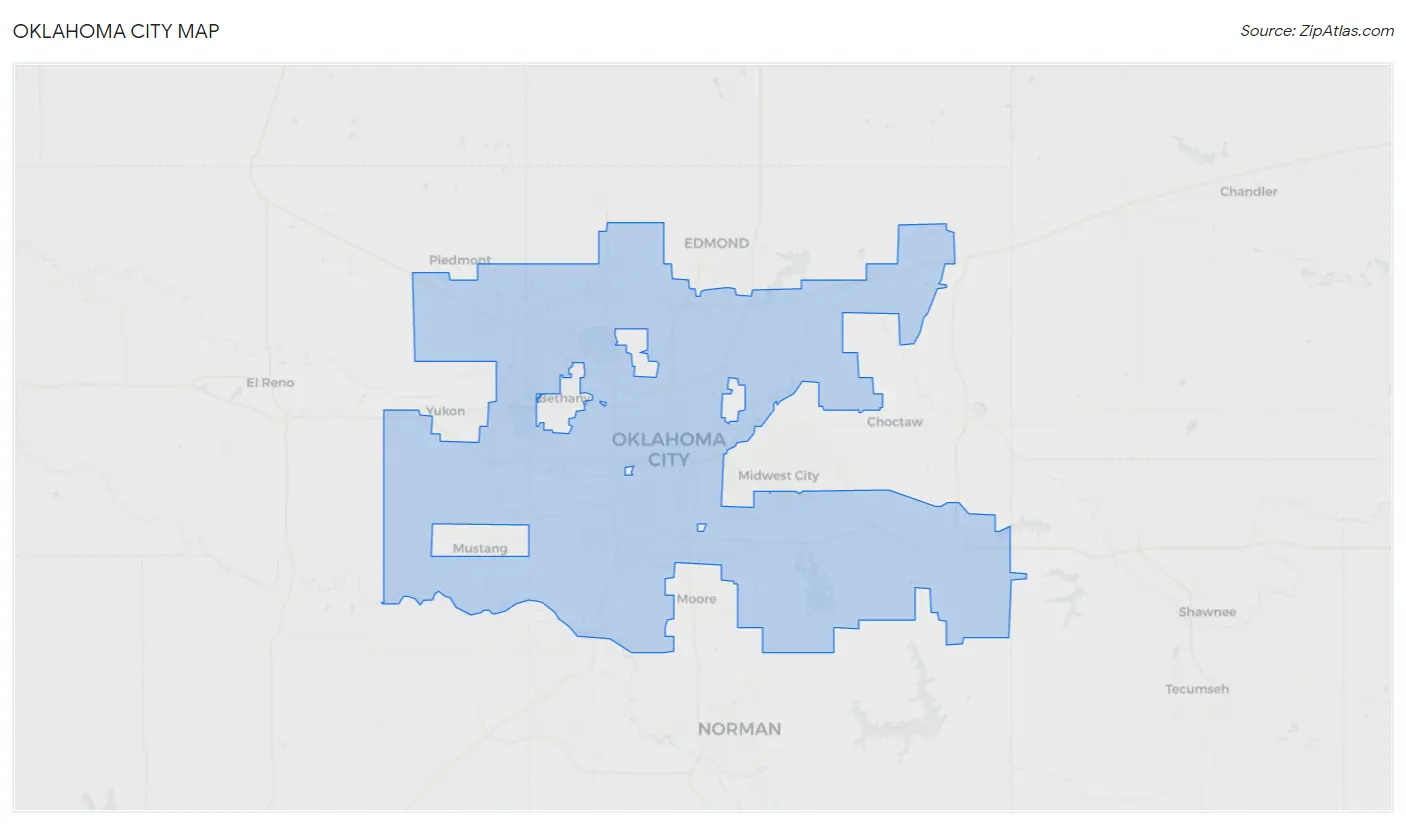
Oklahoma City Map
Oklahoma City Overview
$35,954
PER CAPITA INCOME
$79,514
AVG FAMILY INCOME
$64,251
AVG HOUSEHOLD INCOME
27.5%
WAGE / INCOME GAP [ % ]
72.5¢/ $1
WAGE / INCOME GAP [ $ ]
$11,430
FAMILY INCOME DEFICIT
0.47
INEQUALITY / GINI INDEX
681,088
TOTAL POPULATION
337,235
MALE POPULATION
343,853
FEMALE POPULATION
98.08
MALES / 100 FEMALES
101.96
FEMALES / 100 MALES
34.9
MEDIAN AGE
3.2
AVG FAMILY SIZE
2.5
AVG HOUSEHOLD SIZE
357,126
LABOR FORCE [ PEOPLE ]
67.4%
PERCENT IN LABOR FORCE
4.5%
UNEMPLOYMENT RATE
Oklahoma City Zip Codes
Income in Oklahoma City
Income Overview in Oklahoma City
Per Capita Income in Oklahoma City is $35,954, while median incomes of families and households are $79,514 and $64,251 respectively.
| Characteristic | Number | Measure |
| Per Capita Income | 681,088 | $35,954 |
| Median Family Income | 165,899 | $79,514 |
| Mean Family Income | 165,899 | $105,570 |
| Median Household Income | 270,070 | $64,251 |
| Mean Household Income | 270,070 | $88,664 |
| Income Deficit | 165,899 | $11,430 |
| Wage / Income Gap (%) | 681,088 | 27.50% |
| Wage / Income Gap ($) | 681,088 | 72.50¢ per $1 |
| Gini / Inequality Index | 681,088 | 0.47 |
Earnings by Sex in Oklahoma City
Average Earnings in Oklahoma City are $39,485, $45,607 for men and $33,065 for women, a difference of 27.5%.
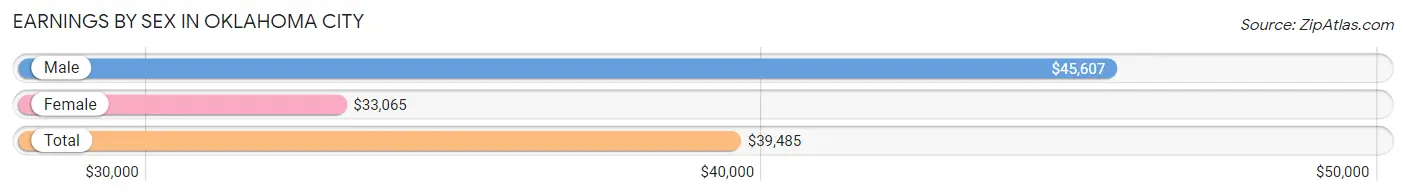
| Sex | Number | Average Earnings |
| Male | 195,754 (53.0%) | $45,607 |
| Female | 173,433 (47.0%) | $33,065 |
| Total | 369,187 (100.0%) | $39,485 |
Earnings by Sex by Income Bracket in Oklahoma City
The most common earnings brackets in Oklahoma City are $100,000+ for men (30,149 | 15.4%) and $25,000 to $29,999 for women (13,684 | 7.9%).
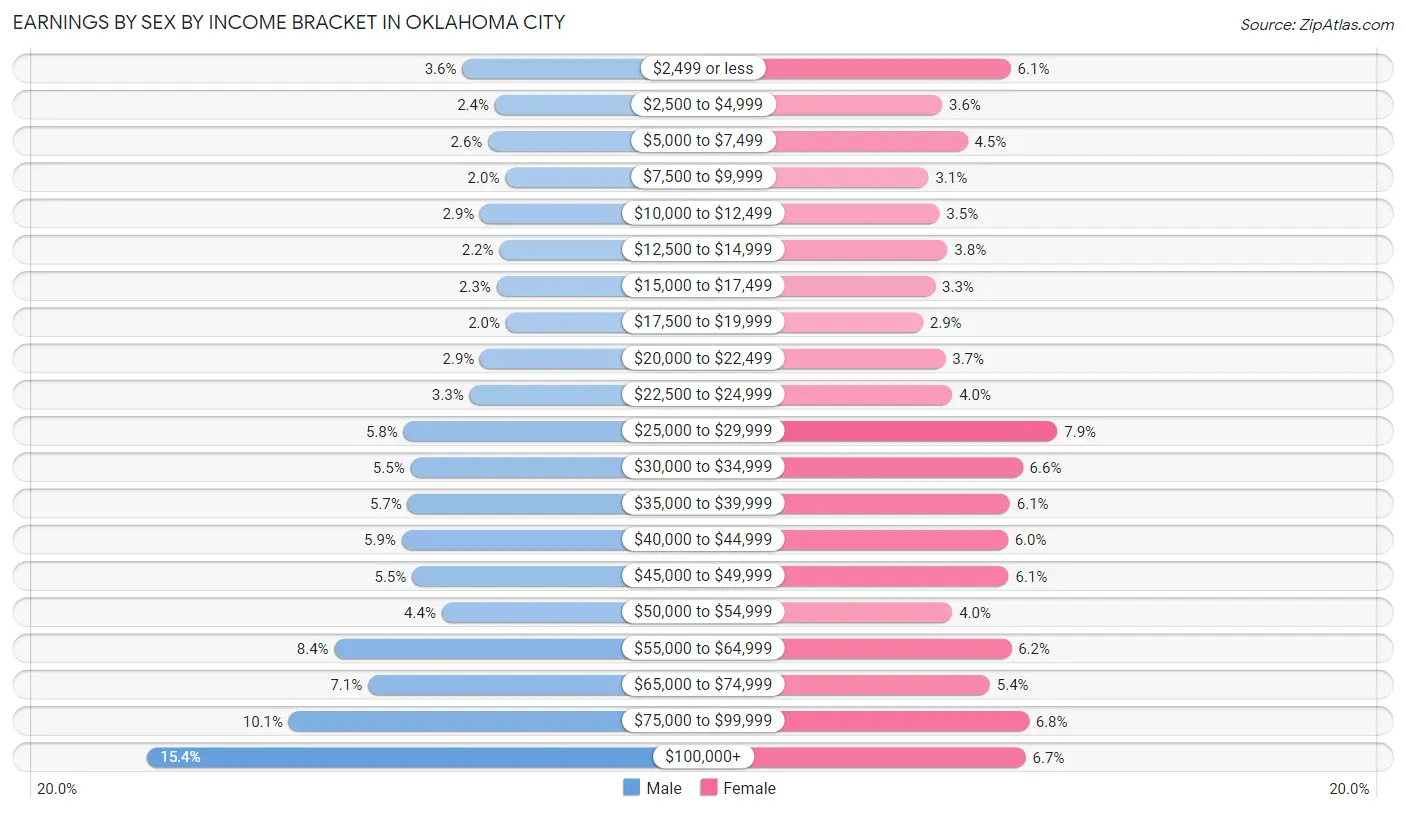
| Income | Male | Female |
| $2,499 or less | 7,047 (3.6%) | 10,650 (6.1%) |
| $2,500 to $4,999 | 4,650 (2.4%) | 6,187 (3.6%) |
| $5,000 to $7,499 | 5,141 (2.6%) | 7,834 (4.5%) |
| $7,500 to $9,999 | 3,893 (2.0%) | 5,305 (3.1%) |
| $10,000 to $12,499 | 5,732 (2.9%) | 6,015 (3.5%) |
| $12,500 to $14,999 | 4,334 (2.2%) | 6,545 (3.8%) |
| $15,000 to $17,499 | 4,518 (2.3%) | 5,741 (3.3%) |
| $17,500 to $19,999 | 3,858 (2.0%) | 4,937 (2.9%) |
| $20,000 to $22,499 | 5,727 (2.9%) | 6,393 (3.7%) |
| $22,500 to $24,999 | 6,521 (3.3%) | 6,845 (4.0%) |
| $25,000 to $29,999 | 11,363 (5.8%) | 13,684 (7.9%) |
| $30,000 to $34,999 | 10,847 (5.5%) | 11,432 (6.6%) |
| $35,000 to $39,999 | 11,064 (5.7%) | 10,602 (6.1%) |
| $40,000 to $44,999 | 11,497 (5.9%) | 10,463 (6.0%) |
| $45,000 to $49,999 | 10,720 (5.5%) | 10,503 (6.1%) |
| $50,000 to $54,999 | 8,550 (4.4%) | 6,855 (4.0%) |
| $55,000 to $64,999 | 16,416 (8.4%) | 10,692 (6.2%) |
| $65,000 to $74,999 | 13,964 (7.1%) | 9,298 (5.4%) |
| $75,000 to $99,999 | 19,763 (10.1%) | 11,829 (6.8%) |
| $100,000+ | 30,149 (15.4%) | 11,623 (6.7%) |
| Total | 195,754 (100.0%) | 173,433 (100.0%) |
Earnings by Sex by Educational Attainment in Oklahoma City
Average earnings in Oklahoma City are $51,755 for men and $37,832 for women, a difference of 26.9%. Men with an educational attainment of graduate degree enjoy the highest average annual earnings of $89,434, while those with less than high school education earn the least with $34,476. Women with an educational attainment of graduate degree earn the most with the average annual earnings of $63,225, while those with less than high school education have the smallest earnings of $22,188.
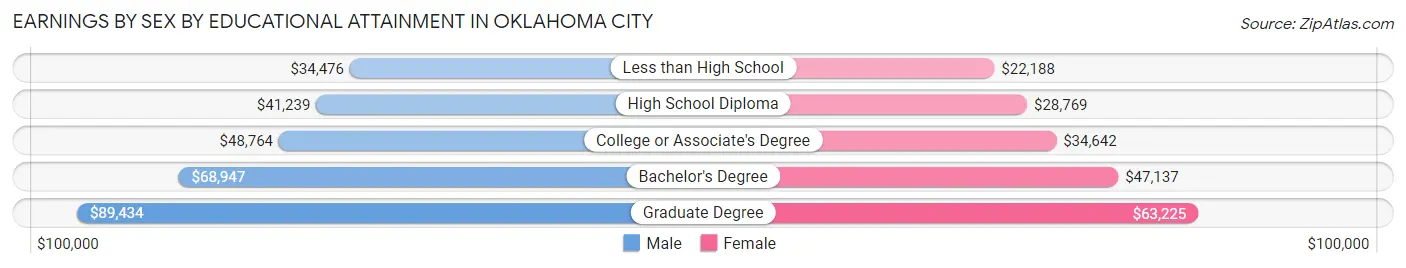
| Educational Attainment | Male Income | Female Income |
| Less than High School | $34,476 | $22,188 |
| High School Diploma | $41,239 | $28,769 |
| College or Associate's Degree | $48,764 | $34,642 |
| Bachelor's Degree | $68,947 | $47,137 |
| Graduate Degree | $89,434 | $63,225 |
| Total | $51,755 | $37,832 |
Family Income in Oklahoma City
Family Income Brackets in Oklahoma City
According to the Oklahoma City family income data, there are 31,521 families falling into the $100,000 to $149,999 income range, which is the most common income bracket and makes up 19.0% of all families. Conversely, the $10,000 to $14,999 income bracket is the least frequent group with only 3,982 families (2.4%) belonging to this category.
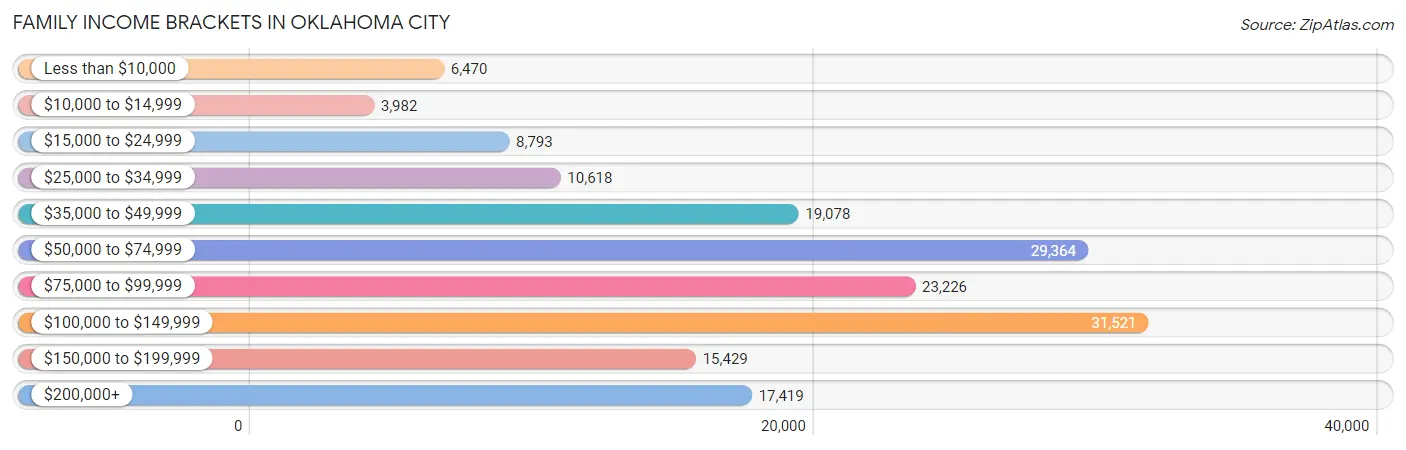
| Income Bracket | # Families | % Families |
| Less than $10,000 | 6,470 | 3.9% |
| $10,000 to $14,999 | 3,982 | 2.4% |
| $15,000 to $24,999 | 8,793 | 5.3% |
| $25,000 to $34,999 | 10,618 | 6.4% |
| $35,000 to $49,999 | 19,078 | 11.5% |
| $50,000 to $74,999 | 29,364 | 17.7% |
| $75,000 to $99,999 | 23,226 | 14.0% |
| $100,000 to $149,999 | 31,521 | 19.0% |
| $150,000 to $199,999 | 15,429 | 9.3% |
| $200,000+ | 17,419 | 10.5% |
Family Income by Famaliy Size in Oklahoma City
6-person families (5,939 | 3.6%) account for the highest median family income in Oklahoma City with $89,781 per family, while 2-person families (75,093 | 45.3%) have the highest median income of $37,106 per family member.
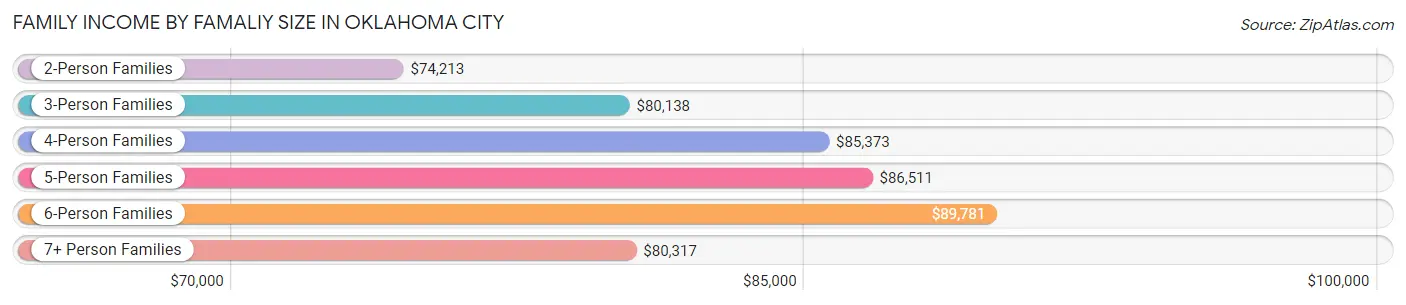
| Income Bracket | # Families | Median Income |
| 2-Person Families | 75,093 (45.3%) | $74,213 |
| 3-Person Families | 36,080 (21.7%) | $80,138 |
| 4-Person Families | 31,115 (18.8%) | $85,373 |
| 5-Person Families | 15,222 (9.2%) | $86,511 |
| 6-Person Families | 5,939 (3.6%) | $89,781 |
| 7+ Person Families | 2,450 (1.5%) | $80,317 |
| Total | 165,899 (100.0%) | $79,514 |
Family Income by Number of Earners in Oklahoma City
The median family income in Oklahoma City is $79,514, with families comprising 3+ earners (16,398) having the highest median family income of $122,203, while families with no earners (19,047) have the lowest median family income of $42,511, accounting for 9.9% and 11.5% of families, respectively.
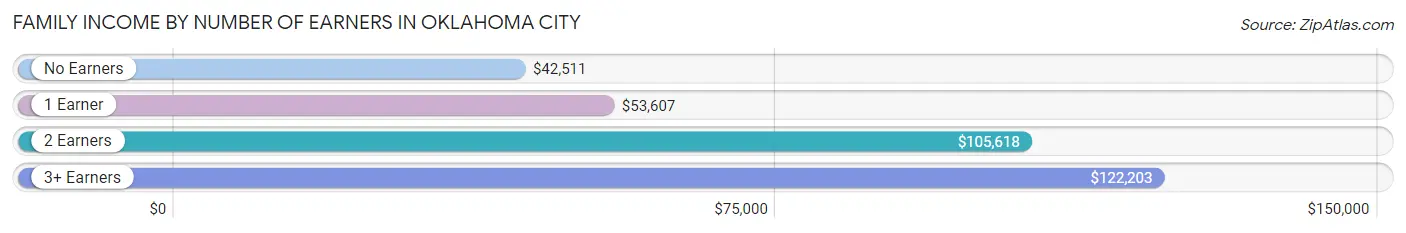
| Number of Earners | # Families | Median Income |
| No Earners | 19,047 (11.5%) | $42,511 |
| 1 Earner | 58,568 (35.3%) | $53,607 |
| 2 Earners | 71,886 (43.3%) | $105,618 |
| 3+ Earners | 16,398 (9.9%) | $122,203 |
| Total | 165,899 (100.0%) | $79,514 |
Household Income in Oklahoma City
Household Income Brackets in Oklahoma City
With 48,883 households falling in the category, the $50,000 to $74,999 income range is the most frequent in Oklahoma City, accounting for 18.1% of all households. In contrast, only 11,883 households (4.4%) fall into the $10,000 to $14,999 income bracket, making it the least populous group.
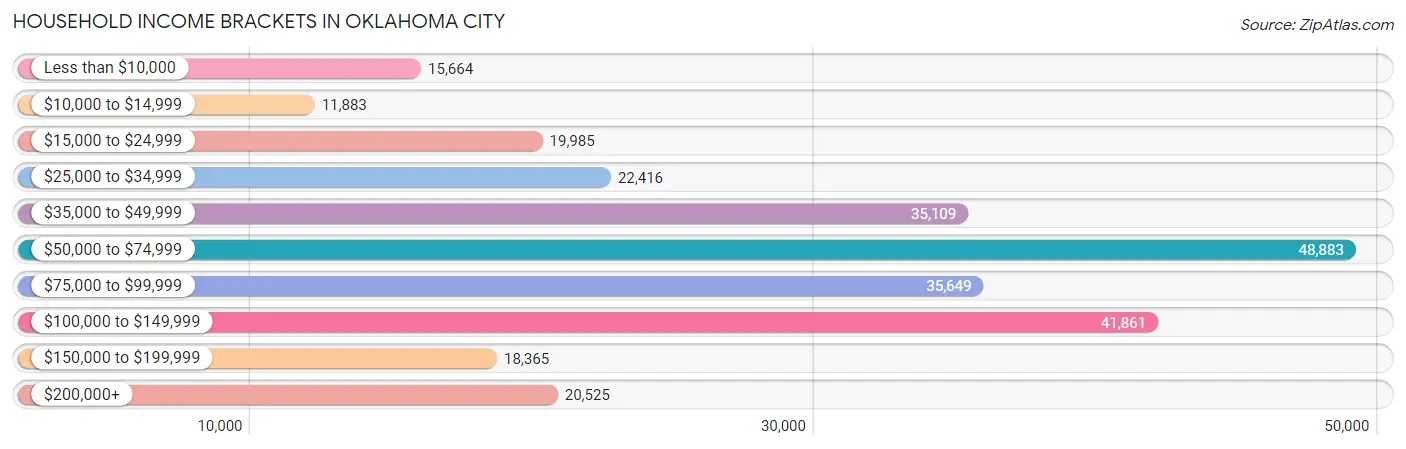
| Income Bracket | # Households | % Households |
| Less than $10,000 | 15,664 | 5.8% |
| $10,000 to $14,999 | 11,883 | 4.4% |
| $15,000 to $24,999 | 19,985 | 7.4% |
| $25,000 to $34,999 | 22,416 | 8.3% |
| $35,000 to $49,999 | 35,109 | 13.0% |
| $50,000 to $74,999 | 48,883 | 18.1% |
| $75,000 to $99,999 | 35,649 | 13.2% |
| $100,000 to $149,999 | 41,861 | 15.5% |
| $150,000 to $199,999 | 18,365 | 6.8% |
| $200,000+ | 20,525 | 7.6% |
Household Income by Householder Age in Oklahoma City
The median household income in Oklahoma City is $64,251, with the highest median household income of $74,337 found in the 45 to 64 years age bracket for the primary householder. A total of 91,245 households (33.8%) fall into this category. Meanwhile, the 15 to 24 years age bracket for the primary householder has the lowest median household income of $38,753, with 14,789 households (5.5%) in this group.
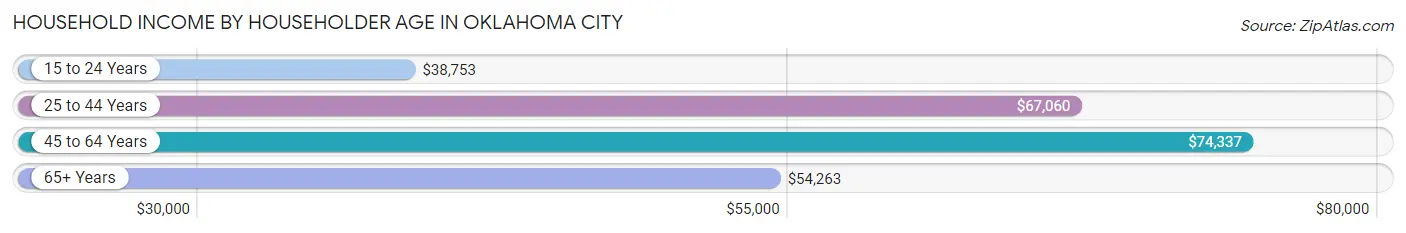
| Income Bracket | # Households | Median Income |
| 15 to 24 Years | 14,789 (5.5%) | $38,753 |
| 25 to 44 Years | 105,679 (39.1%) | $67,060 |
| 45 to 64 Years | 91,245 (33.8%) | $74,337 |
| 65+ Years | 58,357 (21.6%) | $54,263 |
| Total | 270,070 (100.0%) | $64,251 |
Poverty in Oklahoma City
Income Below Poverty by Sex and Age in Oklahoma City
With 13.5% poverty level for males and 16.4% for females among the residents of Oklahoma City, 6 to 11 year old males and under 5 year old females are the most vulnerable to poverty, with 6,759 males (23.1%) and 5,206 females (23.1%) in their respective age groups living below the poverty level.
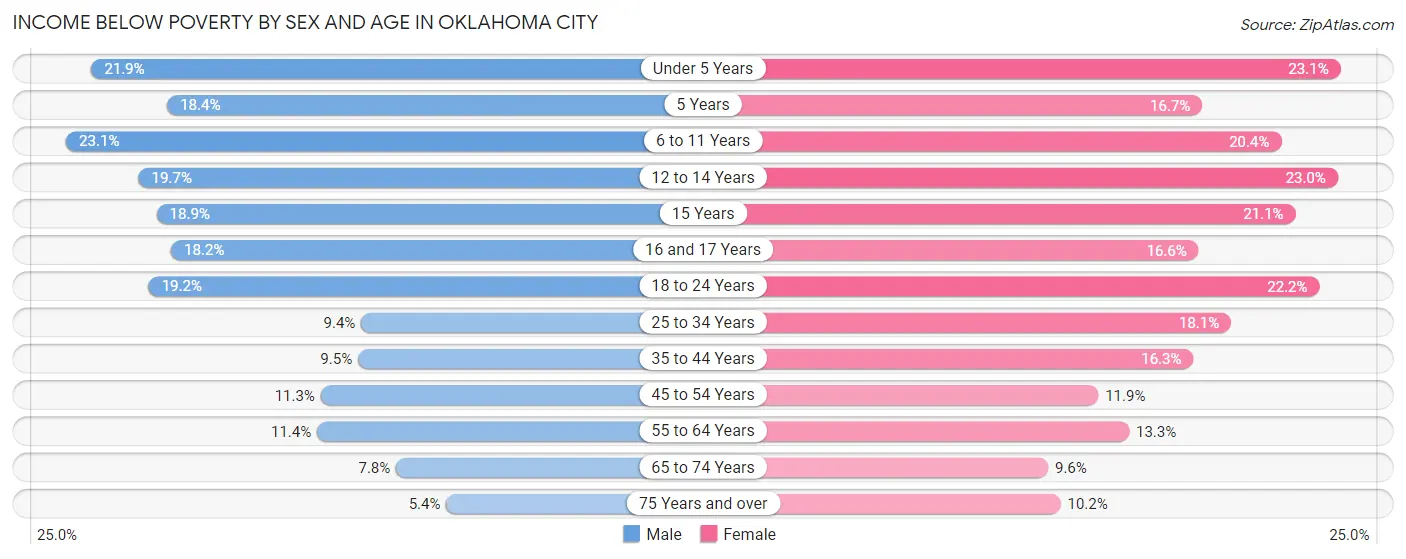
| Age Bracket | Male | Female |
| Under 5 Years | 4,981 (21.9%) | 5,206 (23.1%) |
| 5 Years | 882 (18.4%) | 817 (16.7%) |
| 6 to 11 Years | 6,759 (23.1%) | 5,654 (20.4%) |
| 12 to 14 Years | 2,883 (19.7%) | 3,062 (23.0%) |
| 15 Years | 892 (18.9%) | 942 (21.0%) |
| 16 and 17 Years | 1,794 (18.2%) | 1,516 (16.6%) |
| 18 to 24 Years | 5,773 (19.2%) | 6,632 (22.2%) |
| 25 to 34 Years | 4,907 (9.4%) | 9,567 (18.1%) |
| 35 to 44 Years | 4,518 (9.5%) | 7,692 (16.3%) |
| 45 to 54 Years | 4,359 (11.3%) | 4,598 (11.9%) |
| 55 to 64 Years | 4,222 (11.4%) | 5,239 (13.3%) |
| 65 to 74 Years | 1,950 (7.8%) | 2,765 (9.6%) |
| 75 Years and over | 712 (5.4%) | 2,025 (10.2%) |
| Total | 44,632 (13.5%) | 55,715 (16.4%) |
Income Above Poverty by Sex and Age in Oklahoma City
According to the poverty statistics in Oklahoma City, males aged 75 years and over and females aged 65 to 74 years are the age groups that are most secure financially, with 94.6% of males and 90.4% of females in these age groups living above the poverty line.
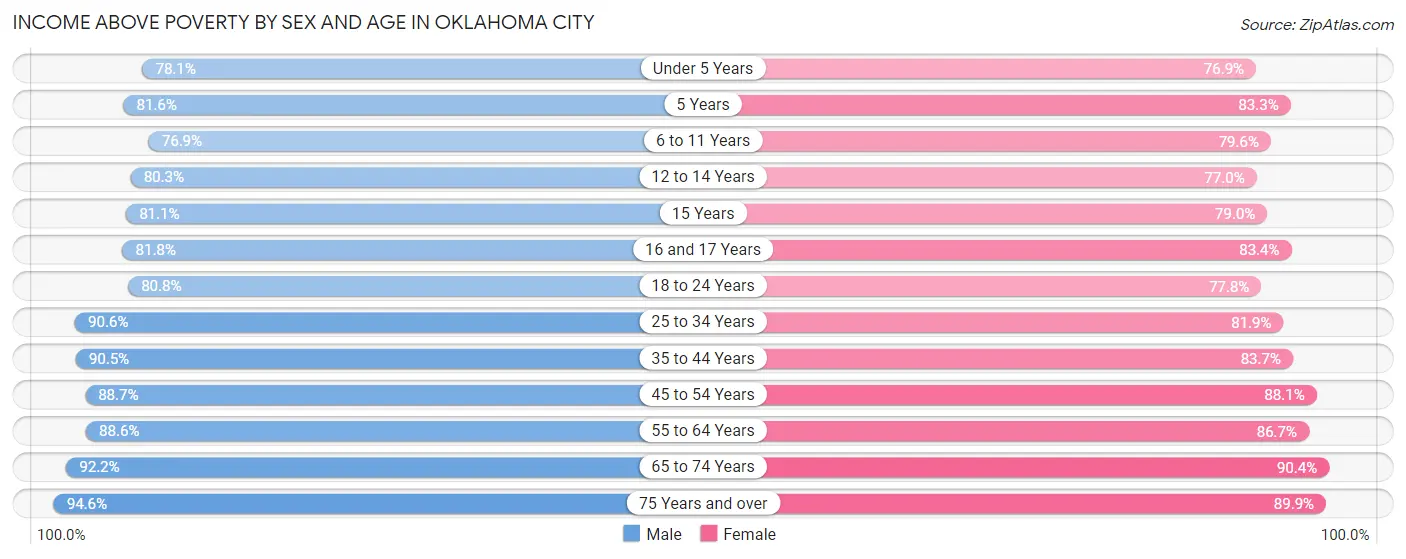
| Age Bracket | Male | Female |
| Under 5 Years | 17,767 (78.1%) | 17,294 (76.9%) |
| 5 Years | 3,918 (81.6%) | 4,070 (83.3%) |
| 6 to 11 Years | 22,537 (76.9%) | 22,082 (79.6%) |
| 12 to 14 Years | 11,742 (80.3%) | 10,244 (77.0%) |
| 15 Years | 3,836 (81.1%) | 3,534 (78.9%) |
| 16 and 17 Years | 8,063 (81.8%) | 7,636 (83.4%) |
| 18 to 24 Years | 24,235 (80.8%) | 23,292 (77.8%) |
| 25 to 34 Years | 47,384 (90.6%) | 43,395 (81.9%) |
| 35 to 44 Years | 42,884 (90.5%) | 39,480 (83.7%) |
| 45 to 54 Years | 34,351 (88.7%) | 34,047 (88.1%) |
| 55 to 64 Years | 32,707 (88.6%) | 34,063 (86.7%) |
| 65 to 74 Years | 23,185 (92.2%) | 26,120 (90.4%) |
| 75 Years and over | 12,402 (94.6%) | 17,927 (89.8%) |
| Total | 285,011 (86.5%) | 283,184 (83.6%) |
Income Below Poverty Among Married-Couple Families in Oklahoma City
The poverty statistics for married-couple families in Oklahoma City show that 5.1% or 5,925 of the total 115,657 families live below the poverty line. Families with 5 or more children have the highest poverty rate of 34.2%, comprising of 355 families. On the other hand, families with no children have the lowest poverty rate of 3.7%, which includes 2,334 families.
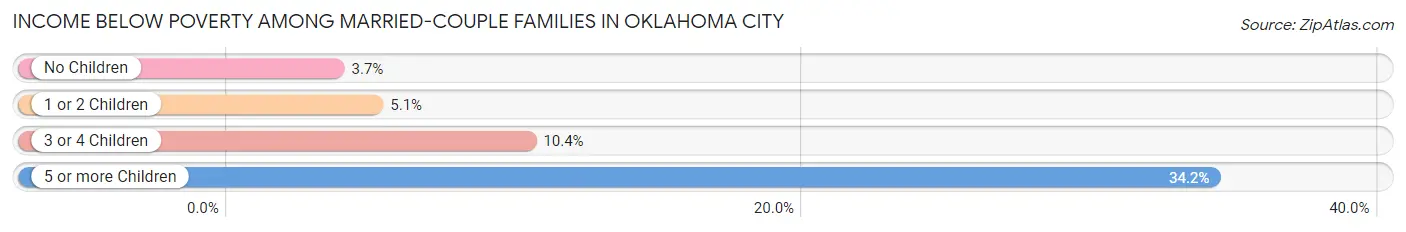
| Children | Above Poverty | Below Poverty |
| No Children | 60,500 (96.3%) | 2,334 (3.7%) |
| 1 or 2 Children | 38,213 (94.9%) | 2,038 (5.1%) |
| 3 or 4 Children | 10,337 (89.6%) | 1,198 (10.4%) |
| 5 or more Children | 682 (65.8%) | 355 (34.2%) |
| Total | 109,732 (94.9%) | 5,925 (5.1%) |
Income Below Poverty Among Single-Parent Households in Oklahoma City
According to the poverty data in Oklahoma City, 13.6% or 1,910 single-father households and 30.3% or 10,963 single-mother households are living below the poverty line. Among single-father households, those with 5 or more children have the highest poverty rate, with 123 households (79.9%) experiencing poverty. Likewise, among single-mother households, those with 5 or more children have the highest poverty rate, with 487 households (80.1%) falling below the poverty line.
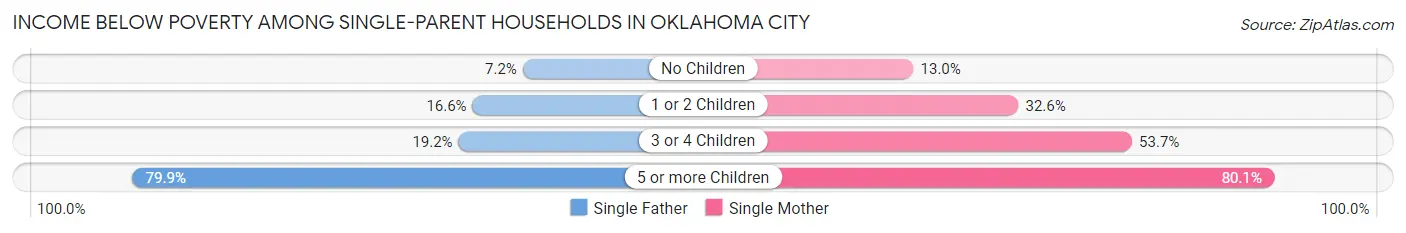
| Children | Single Father | Single Mother |
| No Children | 425 (7.2%) | 1,500 (13.0%) |
| 1 or 2 Children | 1,078 (16.6%) | 6,112 (32.6%) |
| 3 or 4 Children | 284 (19.2%) | 2,864 (53.7%) |
| 5 or more Children | 123 (79.9%) | 487 (80.1%) |
| Total | 1,910 (13.6%) | 10,963 (30.3%) |
Income Below Poverty Among Married-Couple vs Single-Parent Households in Oklahoma City
The poverty data for Oklahoma City shows that 5,925 of the married-couple family households (5.1%) and 12,873 of the single-parent households (25.6%) are living below the poverty level. Within the married-couple family households, those with 5 or more children have the highest poverty rate, with 355 households (34.2%) falling below the poverty line. Among the single-parent households, those with 5 or more children have the highest poverty rate, with 610 household (80.0%) living below poverty.
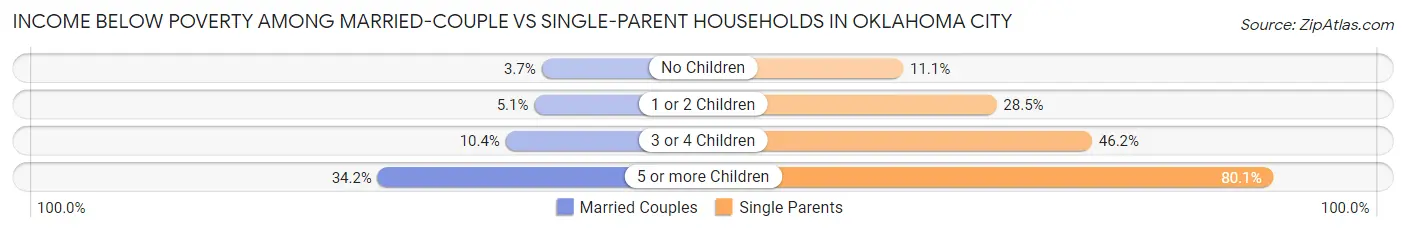
| Children | Married-Couple Families | Single-Parent Households |
| No Children | 2,334 (3.7%) | 1,925 (11.1%) |
| 1 or 2 Children | 2,038 (5.1%) | 7,190 (28.4%) |
| 3 or 4 Children | 1,198 (10.4%) | 3,148 (46.2%) |
| 5 or more Children | 355 (34.2%) | 610 (80.0%) |
| Total | 5,925 (5.1%) | 12,873 (25.6%) |
Race in Oklahoma City
The most populous races in Oklahoma City are White / Caucasian (418,451 | 61.4%), Hispanic or Latino (136,732 | 20.1%), and Black / African American (93,143 | 13.7%).
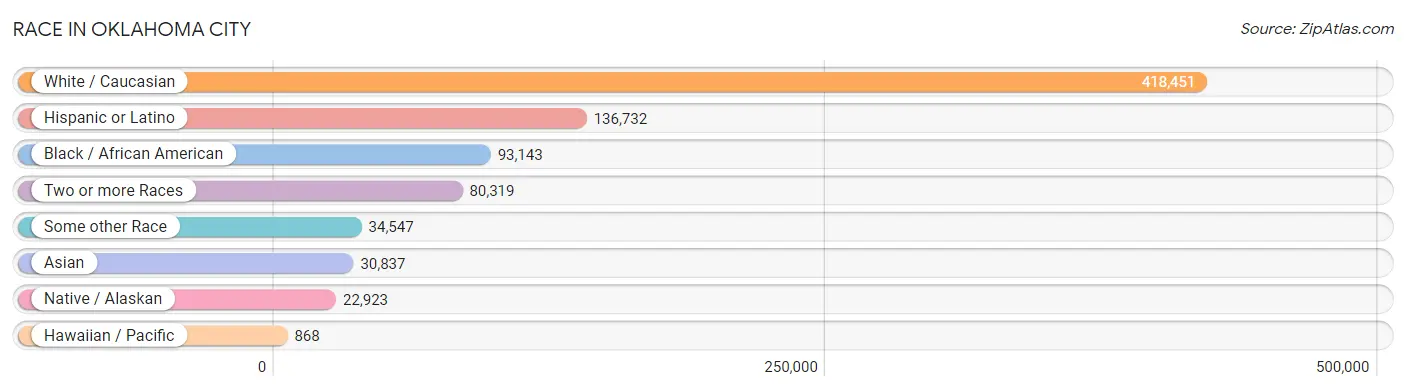
| Race | # Population | % Population |
| Asian | 30,837 | 4.5% |
| Black / African American | 93,143 | 13.7% |
| Hawaiian / Pacific | 868 | 0.1% |
| Hispanic or Latino | 136,732 | 20.1% |
| Native / Alaskan | 22,923 | 3.4% |
| White / Caucasian | 418,451 | 61.4% |
| Two or more Races | 80,319 | 11.8% |
| Some other Race | 34,547 | 5.1% |
| Total | 681,088 | 100.0% |
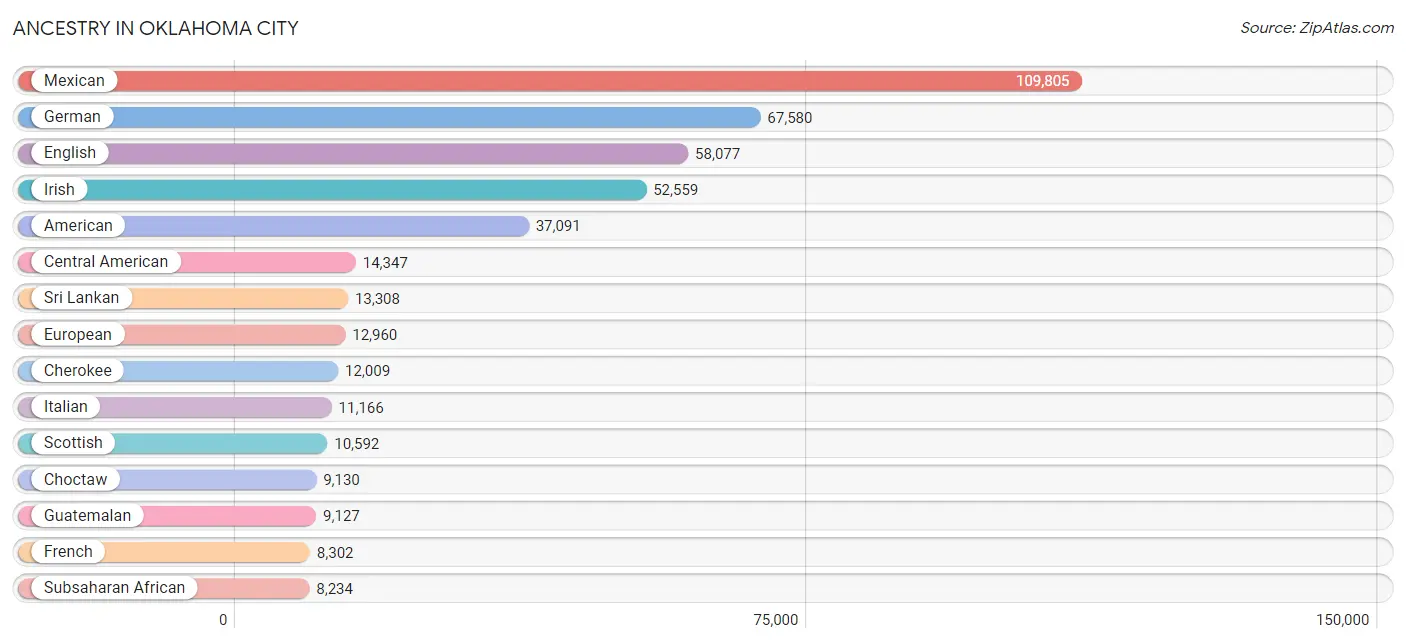
Ancestry in Oklahoma City
The most populous ancestries reported in Oklahoma City are Mexican (109,805 | 16.1%), German (67,580 | 9.9%), English (58,077 | 8.5%), Irish (52,559 | 7.7%), and American (37,091 | 5.4%), together accounting for 47.7% of all Oklahoma City residents.
| Ancestry | # Population | % Population |
| Afghan | 46 | 0.0% |
| African | 4,186 | 0.6% |
| Alaska Native | 59 | 0.0% |
| Albanian | 14 | 0.0% |
| American | 37,091 | 5.4% |
| Apache | 1,026 | 0.2% |
| Arab | 2,826 | 0.4% |
| Arapaho | 101 | 0.0% |
| Argentinean | 362 | 0.1% |
| Armenian | 159 | 0.0% |
| Australian | 73 | 0.0% |
| Austrian | 349 | 0.1% |
| Bahamian | 47 | 0.0% |
| Bangladeshi | 459 | 0.1% |
| Barbadian | 21 | 0.0% |
| Basque | 36 | 0.0% |
| Belgian | 167 | 0.0% |
| Bermudan | 41 | 0.0% |
| Bhutanese | 2,357 | 0.4% |
| Blackfeet | 623 | 0.1% |
| Bolivian | 55 | 0.0% |
| Brazilian | 252 | 0.0% |
| British | 4,958 | 0.7% |
| British West Indian | 29 | 0.0% |
| Bulgarian | 222 | 0.0% |
| Burmese | 3,083 | 0.4% |
| Cajun | 346 | 0.1% |
| Cambodian | 3 | 0.0% |
| Canadian | 809 | 0.1% |
| Cape Verdean | 37 | 0.0% |
| Carpatho Rusyn | 10 | 0.0% |
| Celtic | 54 | 0.0% |
| Central American | 14,347 | 2.1% |
| Central American Indian | 527 | 0.1% |
| Cherokee | 12,009 | 1.8% |
| Cheyenne | 585 | 0.1% |
| Chickasaw | 3,864 | 0.6% |
| Chilean | 173 | 0.0% |
| Chinese | 4 | 0.0% |
| Chippewa | 68 | 0.0% |
| Choctaw | 9,130 | 1.3% |
| Colombian | 779 | 0.1% |
| Colville | 6 | 0.0% |
| Comanche | 818 | 0.1% |
| Costa Rican | 255 | 0.0% |
| Cree | 36 | 0.0% |
| Creek | 4,321 | 0.6% |
| Croatian | 87 | 0.0% |
| Cuban | 667 | 0.1% |
| Czech | 3,079 | 0.4% |
| Czechoslovakian | 553 | 0.1% |
| Danish | 1,090 | 0.2% |
| Delaware | 438 | 0.1% |
| Dominican | 432 | 0.1% |
| Dutch | 5,712 | 0.8% |
| Dutch West Indian | 821 | 0.1% |
| Eastern European | 871 | 0.1% |
| Ecuadorian | 344 | 0.1% |
| Egyptian | 115 | 0.0% |
| English | 58,077 | 8.5% |
| Estonian | 7 | 0.0% |
| Ethiopian | 929 | 0.1% |
| European | 12,960 | 1.9% |
| Fijian | 143 | 0.0% |
| Filipino | 369 | 0.1% |
| Finnish | 409 | 0.1% |
| French | 8,302 | 1.2% |
| French American Indian | 70 | 0.0% |
| French Canadian | 1,000 | 0.2% |
| German | 67,580 | 9.9% |
| German Russian | 24 | 0.0% |
| Ghanaian | 243 | 0.0% |
| Greek | 1,042 | 0.2% |
| Guamanian / Chamorro | 482 | 0.1% |
| Guatemalan | 9,127 | 1.3% |
| Guyanese | 58 | 0.0% |
| Haitian | 261 | 0.0% |
| Honduran | 2,448 | 0.4% |
| Hopi | 20 | 0.0% |
| Hungarian | 1,102 | 0.2% |
| Icelander | 77 | 0.0% |
| Indian (Asian) | 3,948 | 0.6% |
| Indonesian | 810 | 0.1% |
| Inupiat | 17 | 0.0% |
| Iranian | 1,003 | 0.2% |
| Iraqi | 244 | 0.0% |
| Irish | 52,559 | 7.7% |
| Iroquois | 230 | 0.0% |
| Israeli | 149 | 0.0% |
| Italian | 11,166 | 1.6% |
| Jamaican | 516 | 0.1% |
| Japanese | 529 | 0.1% |
| Jordanian | 119 | 0.0% |
| Kenyan | 243 | 0.0% |
| Kiowa | 696 | 0.1% |
| Korean | 3,695 | 0.5% |
| Laotian | 396 | 0.1% |
| Latvian | 37 | 0.0% |
| Lebanese | 1,202 | 0.2% |
| Liberian | 163 | 0.0% |
| Lithuanian | 233 | 0.0% |
| Luxembourger | 17 | 0.0% |
| Macedonian | 8 | 0.0% |
| Malaysian | 902 | 0.1% |
| Maltese | 7 | 0.0% |
| Marshallese | 80 | 0.0% |
| Menominee | 22 | 0.0% |
| Mexican | 109,805 | 16.1% |
| Mexican American Indian | 2,868 | 0.4% |
| Mongolian | 59 | 0.0% |
| Moroccan | 408 | 0.1% |
| Native Hawaiian | 566 | 0.1% |
| Navajo | 362 | 0.1% |
| New Zealander | 8 | 0.0% |
| Nicaraguan | 408 | 0.1% |
| Nigerian | 1,622 | 0.2% |
| Northern European | 878 | 0.1% |
| Norwegian | 4,451 | 0.6% |
| Okinawan | 43 | 0.0% |
| Osage | 420 | 0.1% |
| Ottawa | 13 | 0.0% |
| Paiute | 35 | 0.0% |
| Pakistani | 784 | 0.1% |
| Palestinian | 36 | 0.0% |
| Panamanian | 345 | 0.1% |
| Pennsylvania German | 210 | 0.0% |
| Peruvian | 935 | 0.1% |
| Pima | 50 | 0.0% |
| Polish | 5,081 | 0.7% |
| Portuguese | 1,151 | 0.2% |
| Potawatomi | 1,575 | 0.2% |
| Pueblo | 127 | 0.0% |
| Puerto Rican | 2,978 | 0.4% |
| Romanian | 277 | 0.0% |
| Russian | 1,725 | 0.3% |
| Salvadoran | 1,689 | 0.3% |
| Samoan | 96 | 0.0% |
| Scandinavian | 2,458 | 0.4% |
| Scotch-Irish | 4,843 | 0.7% |
| Scottish | 10,592 | 1.6% |
| Seminole | 2,334 | 0.3% |
| Senegalese | 44 | 0.0% |
| Serbian | 143 | 0.0% |
| Shoshone | 27 | 0.0% |
| Sierra Leonean | 40 | 0.0% |
| Sioux | 366 | 0.1% |
| Slavic | 29 | 0.0% |
| Slovak | 162 | 0.0% |
| Slovene | 54 | 0.0% |
| Somali | 116 | 0.0% |
| South African | 222 | 0.0% |
| South American | 3,719 | 0.5% |
| South American Indian | 244 | 0.0% |
| Spaniard | 1,113 | 0.2% |
| Spanish | 1,068 | 0.2% |
| Spanish American | 8 | 0.0% |
| Spanish American Indian | 313 | 0.1% |
| Sri Lankan | 13,308 | 1.9% |
| Subsaharan African | 8,234 | 1.2% |
| Sudanese | 19 | 0.0% |
| Swedish | 3,941 | 0.6% |
| Swiss | 1,240 | 0.2% |
| Syrian | 202 | 0.0% |
| Thai | 7,038 | 1.0% |
| Tlingit-Haida | 30 | 0.0% |
| Tongan | 12 | 0.0% |
| Trinidadian and Tobagonian | 215 | 0.0% |
| Turkish | 111 | 0.0% |
| U.S. Virgin Islander | 34 | 0.0% |
| Ugandan | 46 | 0.0% |
| Ukrainian | 564 | 0.1% |
| Uruguayan | 43 | 0.0% |
| Venezuelan | 1,017 | 0.2% |
| Vietnamese | 731 | 0.1% |
| Welsh | 3,079 | 0.4% |
| West Indian | 95 | 0.0% |
| Yugoslavian | 142 | 0.0% |
| Zimbabwean | 139 | 0.0% | View All 178 Rows |
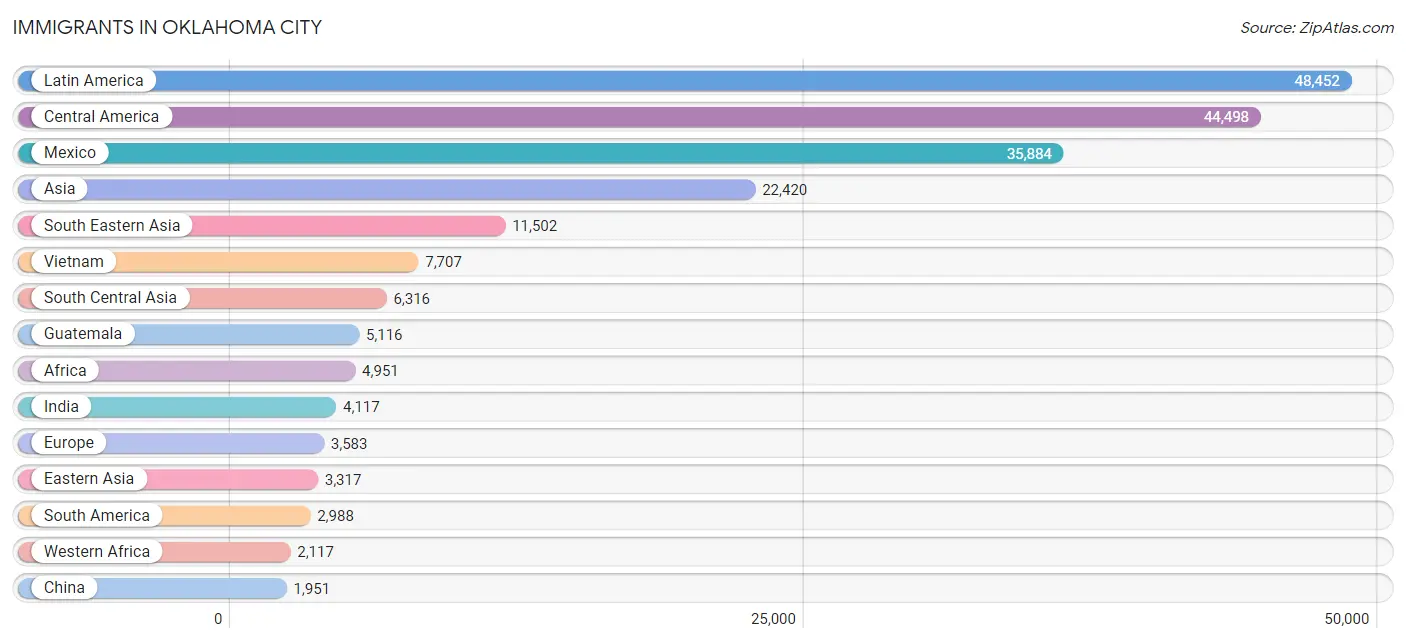
Immigrants in Oklahoma City
The most numerous immigrant groups reported in Oklahoma City came from Latin America (48,452 | 7.1%), Central America (44,498 | 6.5%), Mexico (35,884 | 5.3%), Asia (22,420 | 3.3%), and South Eastern Asia (11,502 | 1.7%), together accounting for 23.9% of all Oklahoma City residents.
| Immigration Origin | # Population | % Population |
| Afghanistan | 22 | 0.0% |
| Africa | 4,951 | 0.7% |
| Argentina | 314 | 0.1% |
| Asia | 22,420 | 3.3% |
| Australia | 46 | 0.0% |
| Austria | 14 | 0.0% |
| Bahamas | 16 | 0.0% |
| Bangladesh | 729 | 0.1% |
| Barbados | 5 | 0.0% |
| Bolivia | 17 | 0.0% |
| Bosnia and Herzegovina | 66 | 0.0% |
| Brazil | 262 | 0.0% |
| Bulgaria | 128 | 0.0% |
| Cambodia | 183 | 0.0% |
| Cameroon | 545 | 0.1% |
| Canada | 1,318 | 0.2% |
| Caribbean | 966 | 0.1% |
| Central America | 44,498 | 6.5% |
| Chile | 148 | 0.0% |
| China | 1,951 | 0.3% |
| Colombia | 552 | 0.1% |
| Costa Rica | 48 | 0.0% |
| Croatia | 6 | 0.0% |
| Cuba | 248 | 0.0% |
| Czechoslovakia | 15 | 0.0% |
| Denmark | 10 | 0.0% |
| Dominican Republic | 170 | 0.0% |
| Eastern Africa | 1,516 | 0.2% |
| Eastern Asia | 3,317 | 0.5% |
| Eastern Europe | 965 | 0.1% |
| Ecuador | 234 | 0.0% |
| Egypt | 59 | 0.0% |
| El Salvador | 1,263 | 0.2% |
| England | 427 | 0.1% |
| Eritrea | 188 | 0.0% |
| Ethiopia | 491 | 0.1% |
| Europe | 3,583 | 0.5% |
| Fiji | 7 | 0.0% |
| France | 64 | 0.0% |
| Germany | 1,178 | 0.2% |
| Ghana | 557 | 0.1% |
| Greece | 36 | 0.0% |
| Grenada | 26 | 0.0% |
| Guatemala | 5,116 | 0.7% |
| Guyana | 74 | 0.0% |
| Haiti | 35 | 0.0% |
| Honduras | 1,624 | 0.2% |
| Hong Kong | 91 | 0.0% |
| Hungary | 44 | 0.0% |
| India | 4,117 | 0.6% |
| Indonesia | 247 | 0.0% |
| Iran | 540 | 0.1% |
| Iraq | 119 | 0.0% |
| Ireland | 19 | 0.0% |
| Israel | 97 | 0.0% |
| Italy | 104 | 0.0% |
| Jamaica | 225 | 0.0% |
| Japan | 309 | 0.1% |
| Jordan | 78 | 0.0% |
| Kazakhstan | 134 | 0.0% |
| Kenya | 435 | 0.1% |
| Korea | 1,057 | 0.2% |
| Kuwait | 226 | 0.0% |
| Laos | 544 | 0.1% |
| Latin America | 48,452 | 7.1% |
| Lebanon | 104 | 0.0% |
| Liberia | 174 | 0.0% |
| Lithuania | 6 | 0.0% |
| Malaysia | 232 | 0.0% |
| Mexico | 35,884 | 5.3% |
| Micronesia | 12 | 0.0% |
| Middle Africa | 581 | 0.1% |
| Morocco | 198 | 0.0% |
| Nepal | 262 | 0.0% |
| Netherlands | 12 | 0.0% |
| Nicaragua | 308 | 0.1% |
| Nigeria | 1,223 | 0.2% |
| Northern Africa | 309 | 0.1% |
| Northern Europe | 856 | 0.1% |
| Norway | 21 | 0.0% |
| Oceania | 160 | 0.0% |
| Pakistan | 474 | 0.1% |
| Panama | 192 | 0.0% |
| Peru | 489 | 0.1% |
| Philippines | 1,237 | 0.2% |
| Poland | 104 | 0.0% |
| Portugal | 284 | 0.0% |
| Romania | 65 | 0.0% |
| Russia | 353 | 0.1% |
| Saudi Arabia | 254 | 0.0% |
| Scotland | 56 | 0.0% |
| Senegal | 12 | 0.0% |
| Serbia | 72 | 0.0% |
| Sierra Leone | 40 | 0.0% |
| Singapore | 50 | 0.0% |
| Somalia | 80 | 0.0% |
| South Africa | 78 | 0.0% |
| South America | 2,988 | 0.4% |
| South Central Asia | 6,316 | 0.9% |
| South Eastern Asia | 11,502 | 1.7% |
| Southern Europe | 475 | 0.1% |
| Spain | 51 | 0.0% |
| Sri Lanka | 23 | 0.0% |
| Sudan | 24 | 0.0% |
| Sweden | 13 | 0.0% |
| Switzerland | 16 | 0.0% |
| Syria | 233 | 0.0% |
| Taiwan | 437 | 0.1% |
| Thailand | 710 | 0.1% |
| Trinidad and Tobago | 139 | 0.0% |
| Turkey | 19 | 0.0% |
| Uganda | 36 | 0.0% |
| Ukraine | 102 | 0.0% |
| Uzbekistan | 15 | 0.0% |
| Venezuela | 898 | 0.1% |
| Vietnam | 7,707 | 1.1% |
| Western Africa | 2,117 | 0.3% |
| Western Asia | 1,178 | 0.2% |
| Western Europe | 1,284 | 0.2% |
| Yemen | 4 | 0.0% |
| Zaire | 36 | 0.0% |
| Zimbabwe | 225 | 0.0% | View All 122 Rows |
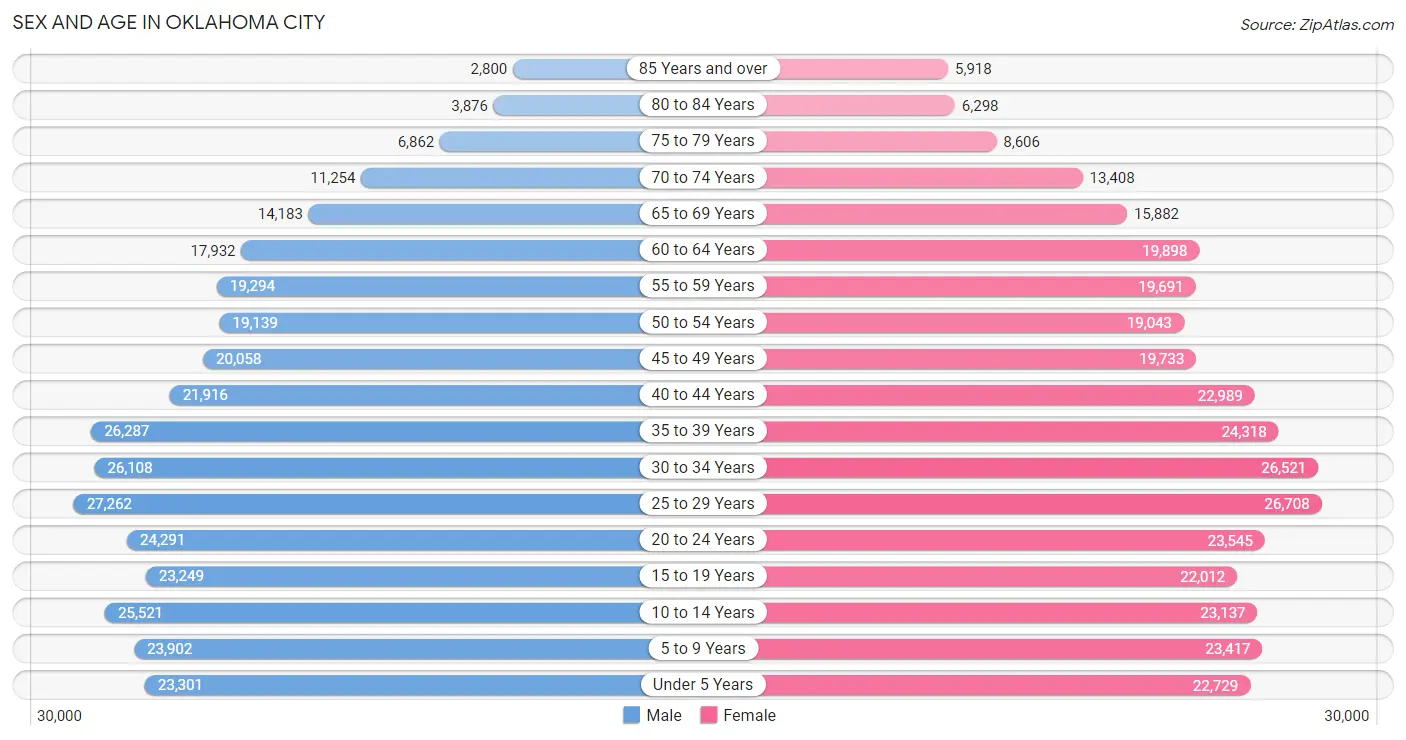
Sex and Age in Oklahoma City
Sex and Age in Oklahoma City
The most populous age groups in Oklahoma City are 25 to 29 Years (27,262 | 8.1%) for men and 25 to 29 Years (26,708 | 7.8%) for women.
| Age Bracket | Male | Female |
| Under 5 Years | 23,301 (6.9%) | 22,729 (6.6%) |
| 5 to 9 Years | 23,902 (7.1%) | 23,417 (6.8%) |
| 10 to 14 Years | 25,521 (7.6%) | 23,137 (6.7%) |
| 15 to 19 Years | 23,249 (6.9%) | 22,012 (6.4%) |
| 20 to 24 Years | 24,291 (7.2%) | 23,545 (6.9%) |
| 25 to 29 Years | 27,262 (8.1%) | 26,708 (7.8%) |
| 30 to 34 Years | 26,108 (7.7%) | 26,521 (7.7%) |
| 35 to 39 Years | 26,287 (7.8%) | 24,318 (7.1%) |
| 40 to 44 Years | 21,916 (6.5%) | 22,989 (6.7%) |
| 45 to 49 Years | 20,058 (5.9%) | 19,733 (5.7%) |
| 50 to 54 Years | 19,139 (5.7%) | 19,043 (5.5%) |
| 55 to 59 Years | 19,294 (5.7%) | 19,691 (5.7%) |
| 60 to 64 Years | 17,932 (5.3%) | 19,898 (5.8%) |
| 65 to 69 Years | 14,183 (4.2%) | 15,882 (4.6%) |
| 70 to 74 Years | 11,254 (3.3%) | 13,408 (3.9%) |
| 75 to 79 Years | 6,862 (2.0%) | 8,606 (2.5%) |
| 80 to 84 Years | 3,876 (1.1%) | 6,298 (1.8%) |
| 85 Years and over | 2,800 (0.8%) | 5,918 (1.7%) |
| Total | 337,235 (100.0%) | 343,853 (100.0%) |
Families and Households in Oklahoma City
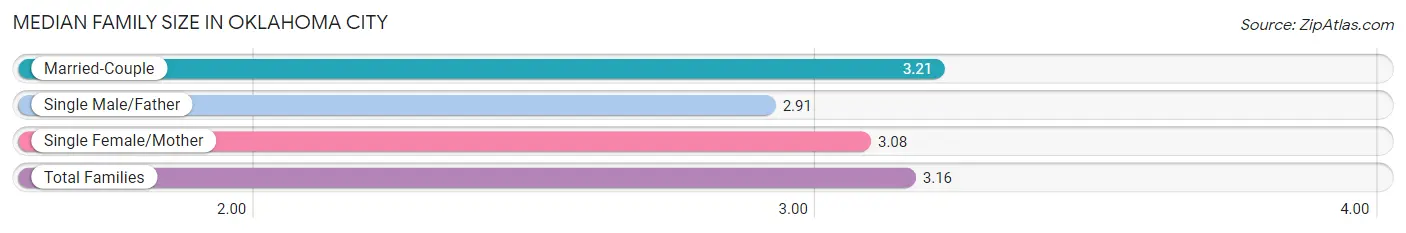
Median Family Size in Oklahoma City
The median family size in Oklahoma City is 3.16 persons per family, with married-couple families (115,657 | 69.7%) accounting for the largest median family size of 3.21 persons per family. On the other hand, single male/father families (14,023 | 8.5%) represent the smallest median family size with 2.91 persons per family.
| Family Type | # Families | Family Size |
| Married-Couple | 115,657 (69.7%) | 3.21 |
| Single Male/Father | 14,023 (8.5%) | 2.91 |
| Single Female/Mother | 36,219 (21.8%) | 3.08 |
| Total Families | 165,899 (100.0%) | 3.16 |
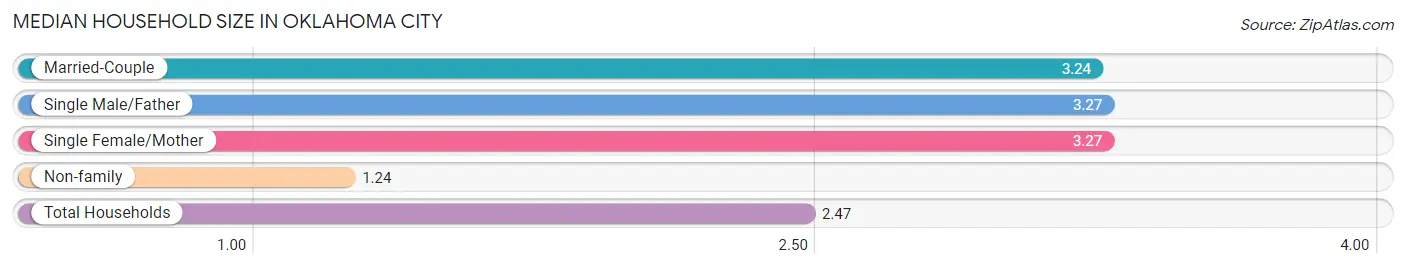
Median Household Size in Oklahoma City
The median household size in Oklahoma City is 2.47 persons per household, with single male/father households (14,023 | 5.2%) accounting for the largest median household size of 3.27 persons per household. non-family households (104,171 | 38.6%) represent the smallest median household size with 1.24 persons per household.
| Household Type | # Households | Household Size |
| Married-Couple | 115,657 (42.8%) | 3.24 |
| Single Male/Father | 14,023 (5.2%) | 3.27 |
| Single Female/Mother | 36,219 (13.4%) | 3.27 |
| Non-family | 104,171 (38.6%) | 1.24 |
| Total Households | 270,070 (100.0%) | 2.47 |
Household Size by Marriage Status in Oklahoma City
Out of a total of 270,070 households in Oklahoma City, 165,899 (61.4%) are family households, while 104,171 (38.6%) are nonfamily households. The most numerous type of family households are 2-person households, comprising 69,290, and the most common type of nonfamily households are 1-person households, comprising 84,958.
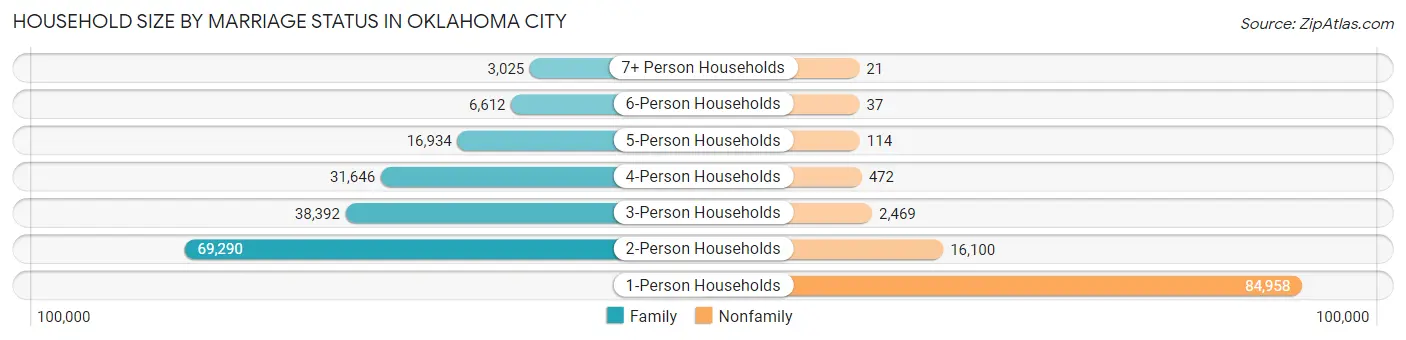
| Household Size | Family Households | Nonfamily Households |
| 1-Person Households | - | 84,958 (31.5%) |
| 2-Person Households | 69,290 (25.7%) | 16,100 (6.0%) |
| 3-Person Households | 38,392 (14.2%) | 2,469 (0.9%) |
| 4-Person Households | 31,646 (11.7%) | 472 (0.2%) |
| 5-Person Households | 16,934 (6.3%) | 114 (0.0%) |
| 6-Person Households | 6,612 (2.5%) | 37 (0.0%) |
| 7+ Person Households | 3,025 (1.1%) | 21 (0.0%) |
| Total | 165,899 (61.4%) | 104,171 (38.6%) |
Female Fertility in Oklahoma City
Fertility by Age in Oklahoma City
Average fertility rate in Oklahoma City is 55.0 births per 1,000 women. Women in the age bracket of 20 to 34 years have the highest fertility rate with 95.0 births per 1,000 women. Women in the age bracket of 20 to 34 years acount for 77.9% of all women with births.
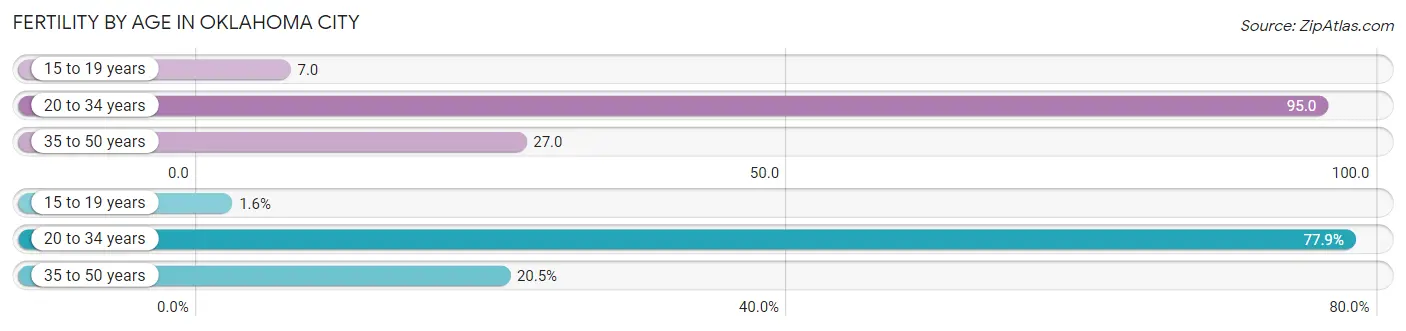
| Age Bracket | Women with Births | Births / 1,000 Women |
| 15 to 19 years | 154 (1.6%) | 7.0 |
| 20 to 34 years | 7,318 (77.9%) | 95.0 |
| 35 to 50 years | 1,925 (20.5%) | 27.0 |
| Total | 9,397 (100.0%) | 55.0 |
Fertility by Age by Marriage Status in Oklahoma City
67.1% of women with births (9,397) in Oklahoma City are married. The highest percentage of unmarried women with births falls into 15 to 19 years age bracket with 63.6% of them unmarried at the time of birth, while the lowest percentage of unmarried women with births belong to 35 to 50 years age bracket with 18.3% of them unmarried.
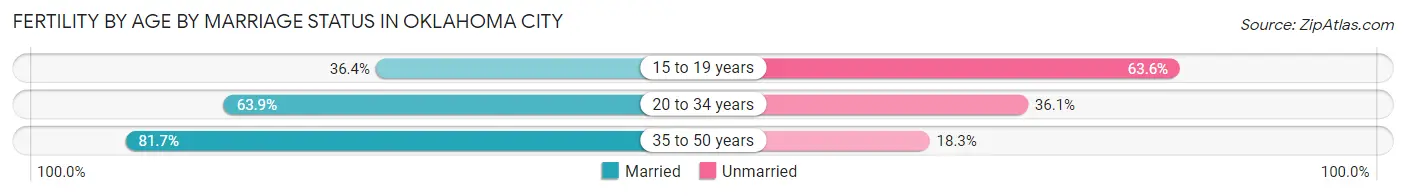
| Age Bracket | Married | Unmarried |
| 15 to 19 years | 56 (36.4%) | 98 (63.6%) |
| 20 to 34 years | 4,676 (63.9%) | 2,642 (36.1%) |
| 35 to 50 years | 1,573 (81.7%) | 352 (18.3%) |
| Total | 6,305 (67.1%) | 3,092 (32.9%) |
Fertility by Education in Oklahoma City
Average fertility rate in Oklahoma City is 55.0 births per 1,000 women. Women with the education attainment of high school diploma have the highest fertility rate of 65.0 births per 1,000 women, while women with the education attainment of less than high school have the lowest fertility at 31.0 births per 1,000 women. Women with the education attainment of college or associate's degree represent 33.7% of all women with births.
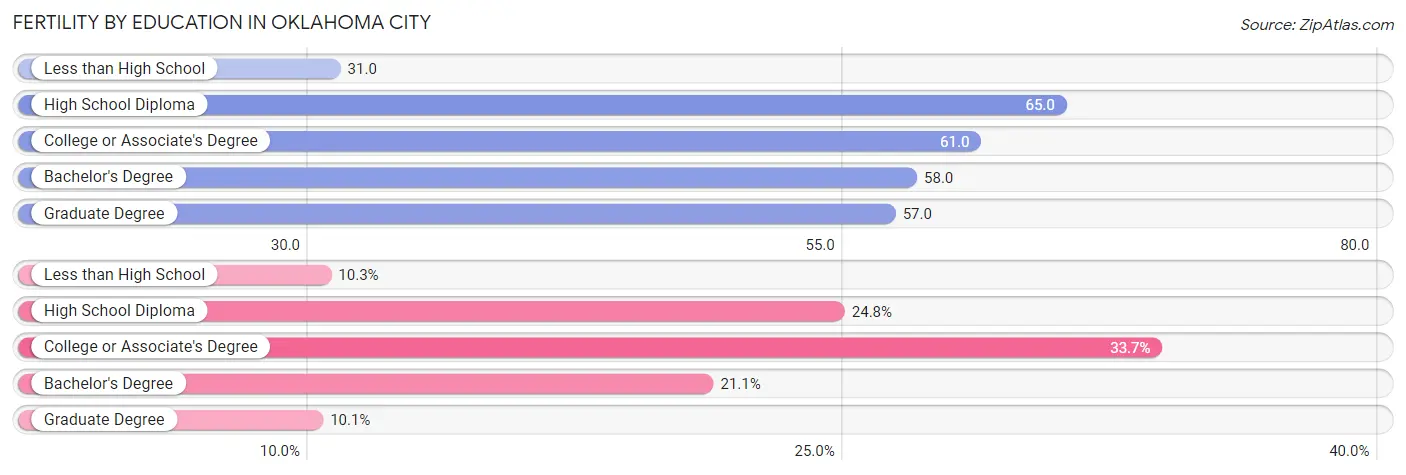
| Educational Attainment | Women with Births | Births / 1,000 Women |
| Less than High School | 972 (10.3%) | 31.0 |
| High School Diploma | 2,328 (24.8%) | 65.0 |
| College or Associate's Degree | 3,166 (33.7%) | 61.0 |
| Bachelor's Degree | 1,981 (21.1%) | 58.0 |
| Graduate Degree | 950 (10.1%) | 57.0 |
| Total | 9,397 (100.0%) | 55.0 |
Fertility by Education by Marriage Status in Oklahoma City
32.9% of women with births in Oklahoma City are unmarried. Women with the educational attainment of graduate degree are most likely to be married with 97.6% of them married at childbirth, while women with the educational attainment of high school diploma are least likely to be married with 48.3% of them unmarried at childbirth.
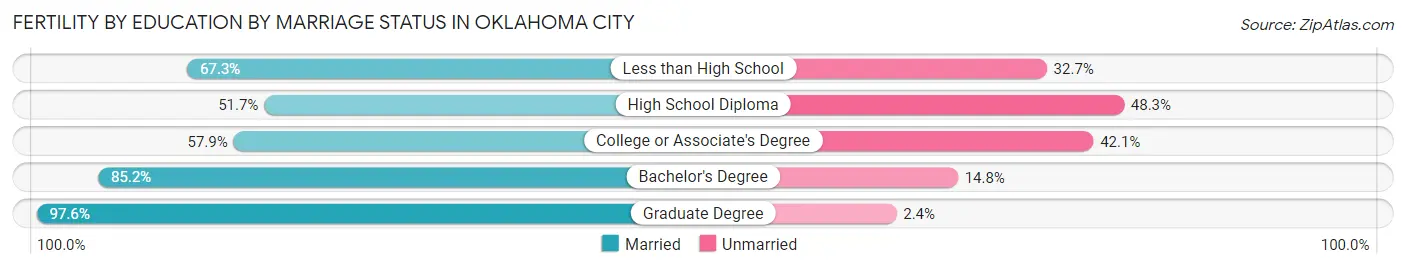
| Educational Attainment | Married | Unmarried |
| Less than High School | 654 (67.3%) | 318 (32.7%) |
| High School Diploma | 1,204 (51.7%) | 1,124 (48.3%) |
| College or Associate's Degree | 1,833 (57.9%) | 1,333 (42.1%) |
| Bachelor's Degree | 1,688 (85.2%) | 293 (14.8%) |
| Graduate Degree | 927 (97.6%) | 23 (2.4%) |
| Total | 6,305 (67.1%) | 3,092 (32.9%) |
Employment Characteristics in Oklahoma City
Employment by Class of Employer in Oklahoma City
Among the 336,569 employed individuals in Oklahoma City, private company employees (217,962 | 64.8%), not-for-profit organizations (24,572 | 7.3%), and federal government employees (23,349 | 6.9%) make up the most common classes of employment.
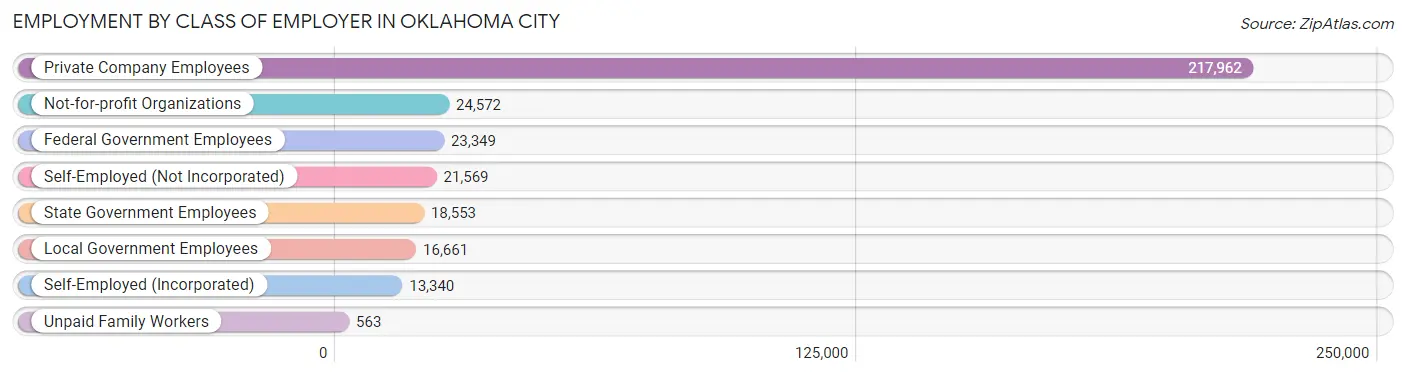
| Employer Class | # Employees | % Employees |
| Private Company Employees | 217,962 | 64.8% |
| Self-Employed (Incorporated) | 13,340 | 4.0% |
| Self-Employed (Not Incorporated) | 21,569 | 6.4% |
| Not-for-profit Organizations | 24,572 | 7.3% |
| Local Government Employees | 16,661 | 5.0% |
| State Government Employees | 18,553 | 5.5% |
| Federal Government Employees | 23,349 | 6.9% |
| Unpaid Family Workers | 563 | 0.2% |
| Total | 336,569 | 100.0% |
Employment Status by Age in Oklahoma City
According to the labor force statistics for Oklahoma City, out of the total population over 16 years of age (529,860), 67.4% or 357,126 individuals are in the labor force, with 4.5% or 16,071 of them unemployed. The age group with the highest labor force participation rate is 30 to 34 years, with 84.1% or 44,261 individuals in the labor force. Within the labor force, the 16 to 19 years age range has the highest percentage of unemployed individuals, with 10.6% or 1,540 of them being unemployed.
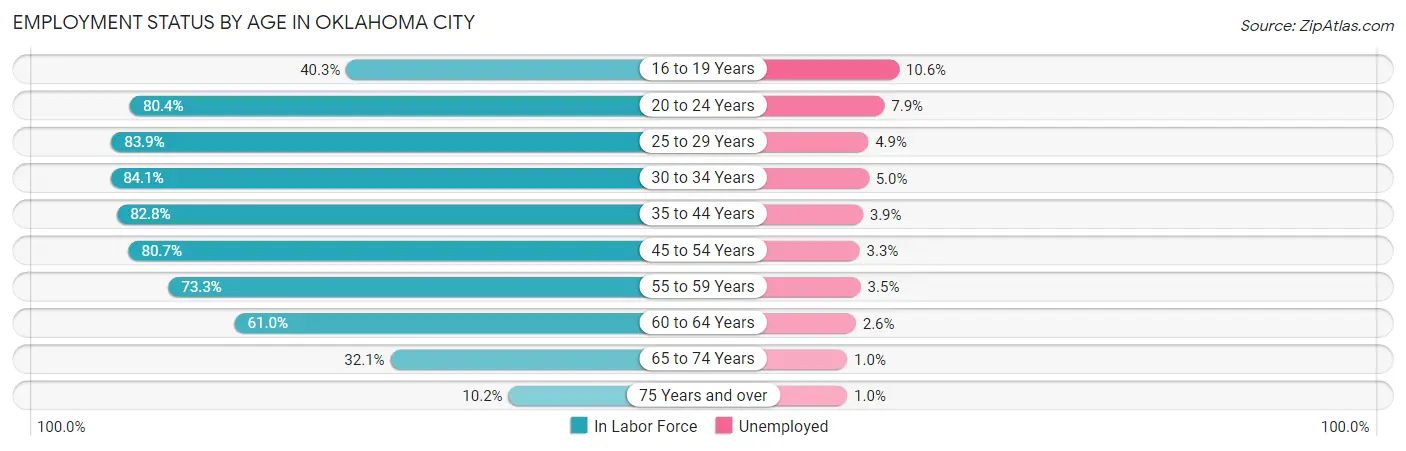
| Age Bracket | In Labor Force | Unemployed |
| 16 to 19 Years | 14,524 (40.3%) | 1,540 (10.6%) |
| 20 to 24 Years | 38,460 (80.4%) | 3,038 (7.9%) |
| 25 to 29 Years | 45,281 (83.9%) | 2,219 (4.9%) |
| 30 to 34 Years | 44,261 (84.1%) | 2,213 (5.0%) |
| 35 to 44 Years | 79,082 (82.8%) | 3,084 (3.9%) |
| 45 to 54 Years | 62,924 (80.7%) | 2,076 (3.3%) |
| 55 to 59 Years | 28,576 (73.3%) | 1,000 (3.5%) |
| 60 to 64 Years | 23,076 (61.0%) | 600 (2.6%) |
| 65 to 74 Years | 17,567 (32.1%) | 176 (1.0%) |
| 75 Years and over | 3,505 (10.2%) | 35 (1.0%) |
| Total | 357,126 (67.4%) | 16,071 (4.5%) |
Employment Status by Educational Attainment in Oklahoma City
According to labor force statistics for Oklahoma City, 79.4% of individuals (283,376) out of the total population between 25 and 64 years of age (356,897) are in the labor force, with 4.0% or 11,335 of them being unemployed. The group with the highest labor force participation rate are those with the educational attainment of bachelor's degree or higher, with 88.2% or 105,410 individuals in the labor force. Within the labor force, individuals with high school diploma education have the highest percentage of unemployment, with 6.6% or 4,079 of them being unemployed.
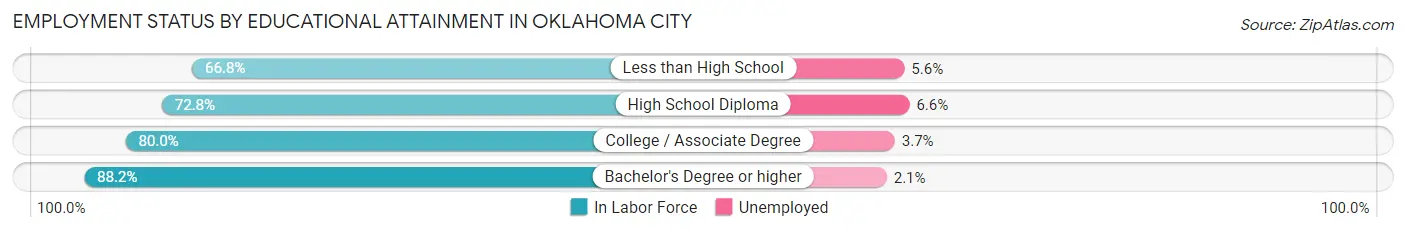
| Educational Attainment | In Labor Force | Unemployed |
| Less than High School | 30,634 (66.8%) | 2,568 (5.6%) |
| High School Diploma | 61,806 (72.8%) | 5,603 (6.6%) |
| College / Associate Degree | 85,300 (80.0%) | 3,945 (3.7%) |
| Bachelor's Degree or higher | 105,410 (88.2%) | 2,510 (2.1%) |
| Total | 283,376 (79.4%) | 14,276 (4.0%) |
Employment Occupations by Sex in Oklahoma City
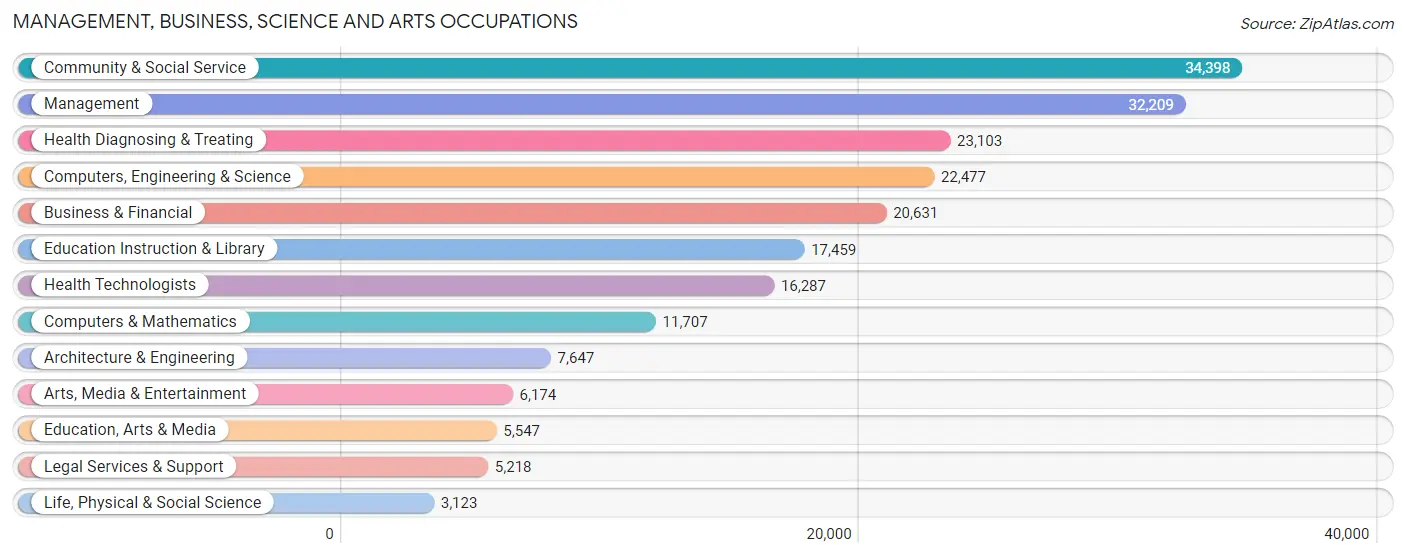
Management, Business, Science and Arts Occupations
The most common Management, Business, Science and Arts occupations in Oklahoma City are Community & Social Service (34,398 | 10.2%), Management (32,209 | 9.6%), Health Diagnosing & Treating (23,103 | 6.9%), Computers, Engineering & Science (22,477 | 6.7%), and Business & Financial (20,631 | 6.1%).
Management, Business, Science and Arts Occupations by Sex
Within the Management, Business, Science and Arts occupations in Oklahoma City, the most male-oriented occupations are Architecture & Engineering (83.6%), Computers, Engineering & Science (75.2%), and Computers & Mathematics (74.5%), while the most female-oriented occupations are Education Instruction & Library (72.5%), Health Diagnosing & Treating (70.2%), and Health Technologists (69.4%).
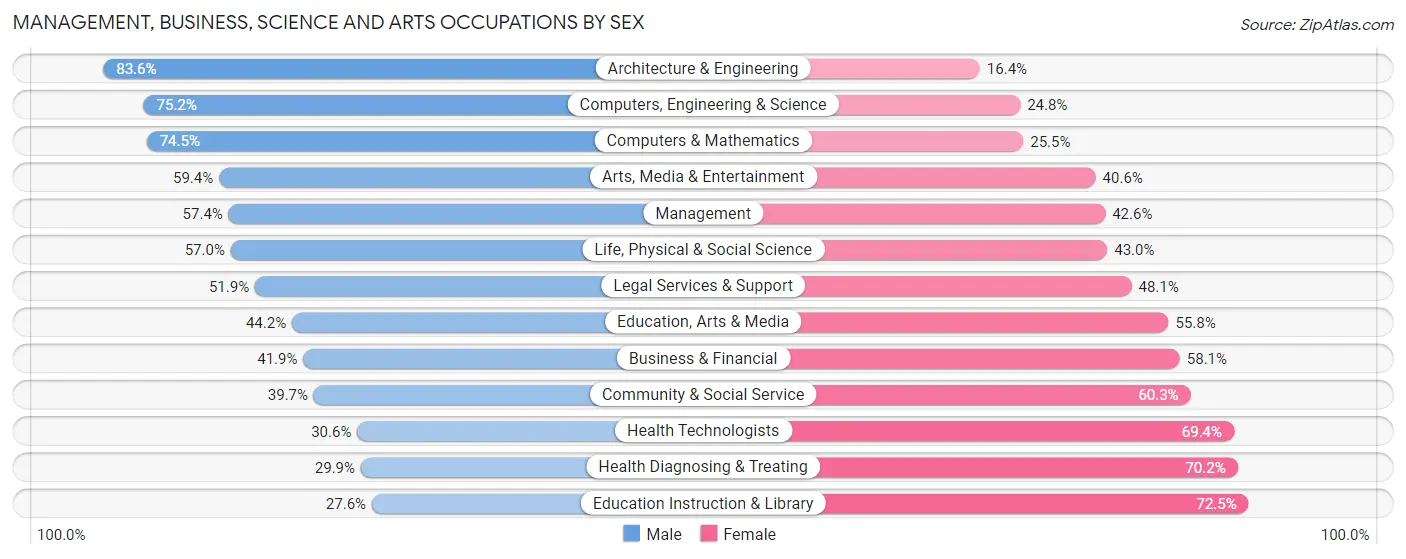
| Occupation | Male | Female |
| Management | 18,498 (57.4%) | 13,711 (42.6%) |
| Business & Financial | 8,636 (41.9%) | 11,995 (58.1%) |
| Computers, Engineering & Science | 16,895 (75.2%) | 5,582 (24.8%) |
| Computers & Mathematics | 8,724 (74.5%) | 2,983 (25.5%) |
| Architecture & Engineering | 6,391 (83.6%) | 1,256 (16.4%) |
| Life, Physical & Social Science | 1,780 (57.0%) | 1,343 (43.0%) |
| Community & Social Service | 13,642 (39.7%) | 20,756 (60.3%) |
| Education, Arts & Media | 2,453 (44.2%) | 3,094 (55.8%) |
| Legal Services & Support | 2,710 (51.9%) | 2,508 (48.1%) |
| Education Instruction & Library | 4,810 (27.6%) | 12,649 (72.5%) |
| Arts, Media & Entertainment | 3,669 (59.4%) | 2,505 (40.6%) |
| Health Diagnosing & Treating | 6,897 (29.8%) | 16,206 (70.2%) |
| Health Technologists | 4,985 (30.6%) | 11,302 (69.4%) |
| Total (Category) | 64,568 (48.6%) | 68,250 (51.4%) |
| Total (Overall) | 178,554 (53.1%) | 157,860 (46.9%) |
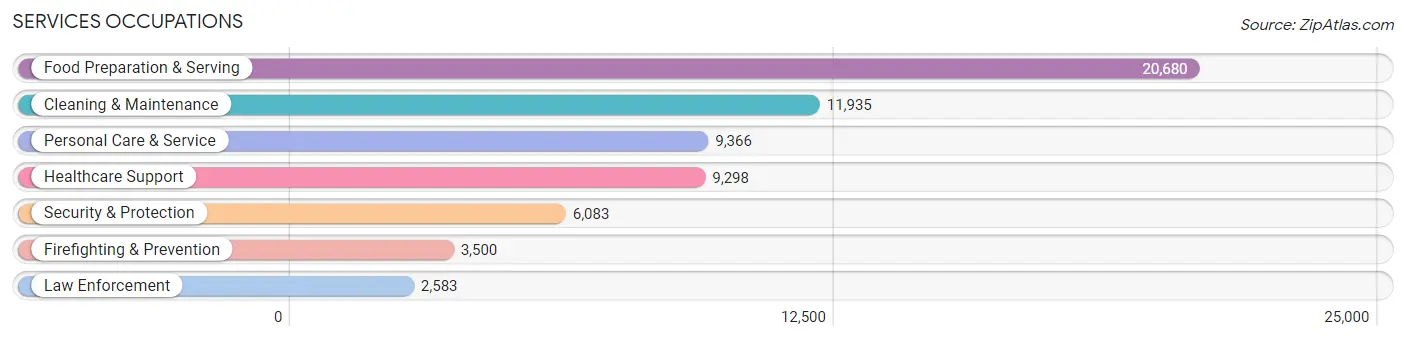
Services Occupations
The most common Services occupations in Oklahoma City are Food Preparation & Serving (20,680 | 6.1%), Cleaning & Maintenance (11,935 | 3.5%), Personal Care & Service (9,366 | 2.8%), Healthcare Support (9,298 | 2.8%), and Security & Protection (6,083 | 1.8%).
Services Occupations by Sex
Within the Services occupations in Oklahoma City, the most male-oriented occupations are Law Enforcement (76.7%), Security & Protection (76.0%), and Firefighting & Prevention (75.4%), while the most female-oriented occupations are Healthcare Support (85.3%), Personal Care & Service (75.1%), and Food Preparation & Serving (58.4%).
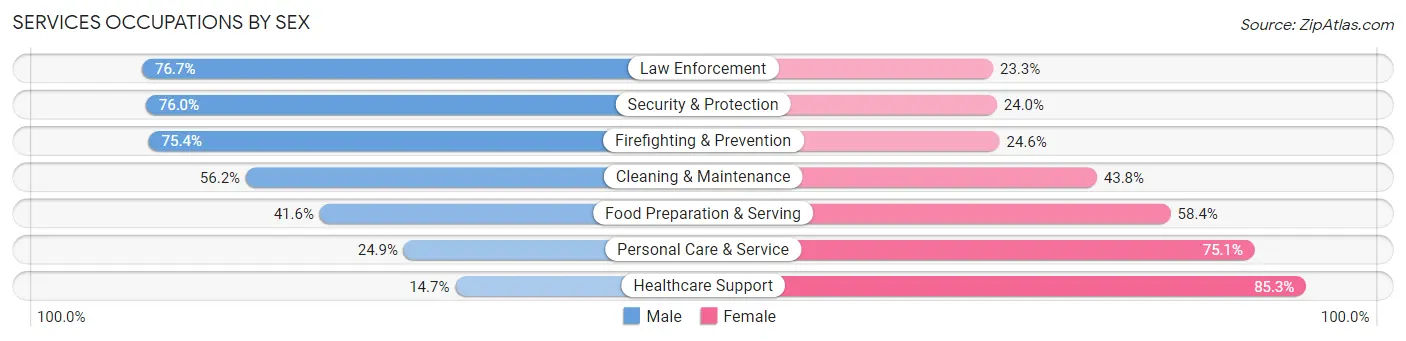
| Occupation | Male | Female |
| Healthcare Support | 1,370 (14.7%) | 7,928 (85.3%) |
| Security & Protection | 4,622 (76.0%) | 1,461 (24.0%) |
| Firefighting & Prevention | 2,640 (75.4%) | 860 (24.6%) |
| Law Enforcement | 1,982 (76.7%) | 601 (23.3%) |
| Food Preparation & Serving | 8,595 (41.6%) | 12,085 (58.4%) |
| Cleaning & Maintenance | 6,705 (56.2%) | 5,230 (43.8%) |
| Personal Care & Service | 2,333 (24.9%) | 7,033 (75.1%) |
| Total (Category) | 23,625 (41.2%) | 33,737 (58.8%) |
| Total (Overall) | 178,554 (53.1%) | 157,860 (46.9%) |
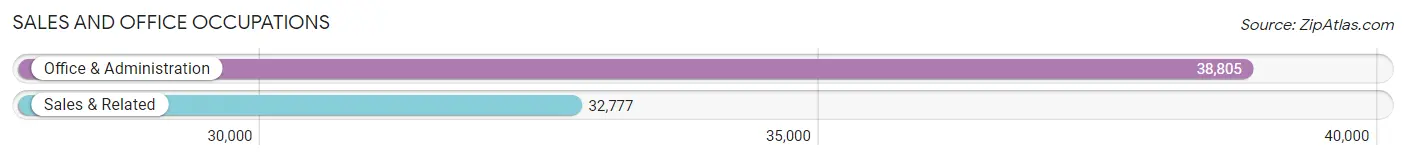
Sales and Office Occupations
The most common Sales and Office occupations in Oklahoma City are Office & Administration (38,805 | 11.5%), and Sales & Related (32,777 | 9.7%).
Sales and Office Occupations by Sex
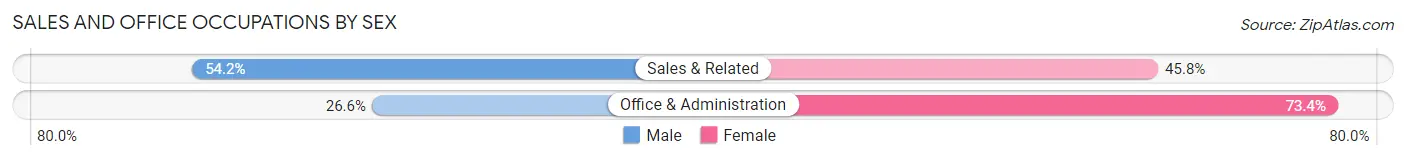
| Occupation | Male | Female |
| Sales & Related | 17,769 (54.2%) | 15,008 (45.8%) |
| Office & Administration | 10,320 (26.6%) | 28,485 (73.4%) |
| Total (Category) | 28,089 (39.2%) | 43,493 (60.8%) |
| Total (Overall) | 178,554 (53.1%) | 157,860 (46.9%) |
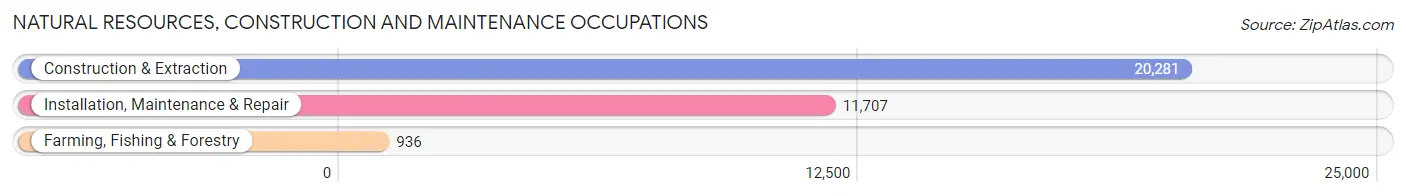
Natural Resources, Construction and Maintenance Occupations
The most common Natural Resources, Construction and Maintenance occupations in Oklahoma City are Construction & Extraction (20,281 | 6.0%), Installation, Maintenance & Repair (11,707 | 3.5%), and Farming, Fishing & Forestry (936 | 0.3%).
Natural Resources, Construction and Maintenance Occupations by Sex
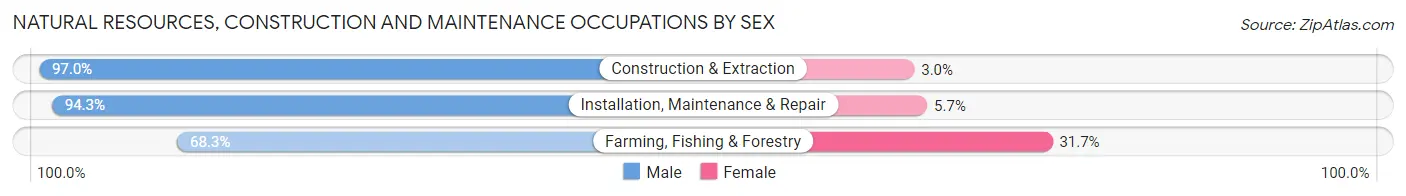
| Occupation | Male | Female |
| Farming, Fishing & Forestry | 639 (68.3%) | 297 (31.7%) |
| Construction & Extraction | 19,674 (97.0%) | 607 (3.0%) |
| Installation, Maintenance & Repair | 11,043 (94.3%) | 664 (5.7%) |
| Total (Category) | 31,356 (95.2%) | 1,568 (4.8%) |
| Total (Overall) | 178,554 (53.1%) | 157,860 (46.9%) |
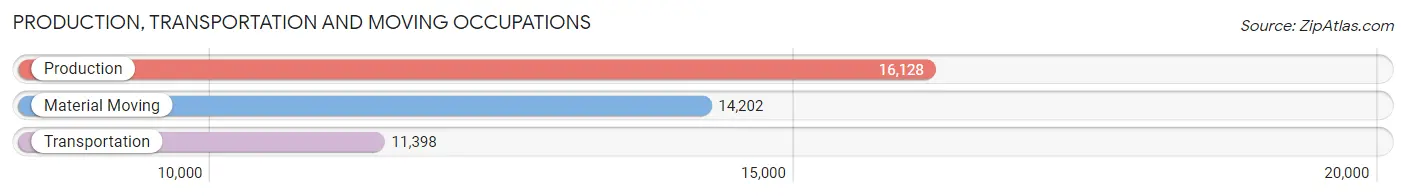
Production, Transportation and Moving Occupations
The most common Production, Transportation and Moving occupations in Oklahoma City are Production (16,128 | 4.8%), Material Moving (14,202 | 4.2%), and Transportation (11,398 | 3.4%).
Production, Transportation and Moving Occupations by Sex
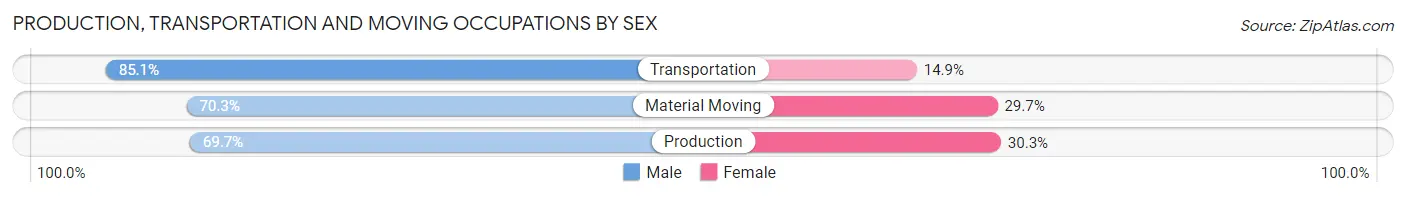
| Occupation | Male | Female |
| Production | 11,234 (69.7%) | 4,894 (30.3%) |
| Transportation | 9,699 (85.1%) | 1,699 (14.9%) |
| Material Moving | 9,983 (70.3%) | 4,219 (29.7%) |
| Total (Category) | 30,916 (74.1%) | 10,812 (25.9%) |
| Total (Overall) | 178,554 (53.1%) | 157,860 (46.9%) |
Employment Industries by Sex in Oklahoma City
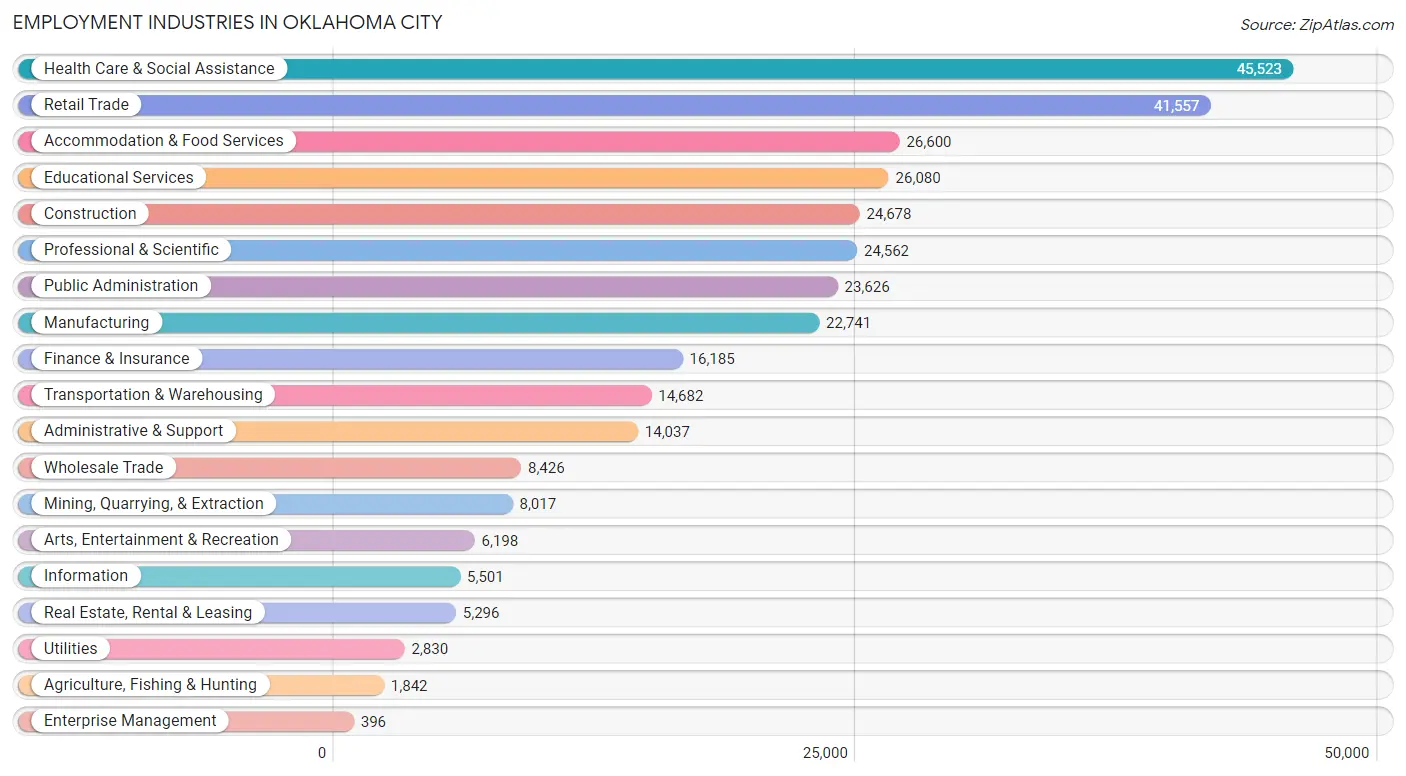
Employment Industries in Oklahoma City
The major employment industries in Oklahoma City include Health Care & Social Assistance (45,523 | 13.5%), Retail Trade (41,557 | 12.3%), Accommodation & Food Services (26,600 | 7.9%), Educational Services (26,080 | 7.7%), and Construction (24,678 | 7.3%).
Employment Industries by Sex in Oklahoma City
The Oklahoma City industries that see more men than women are Construction (89.8%), Mining, Quarrying, & Extraction (77.3%), and Wholesale Trade (76.9%), whereas the industries that tend to have a higher number of women are Health Care & Social Assistance (75.7%), Educational Services (67.3%), and Finance & Insurance (60.1%).
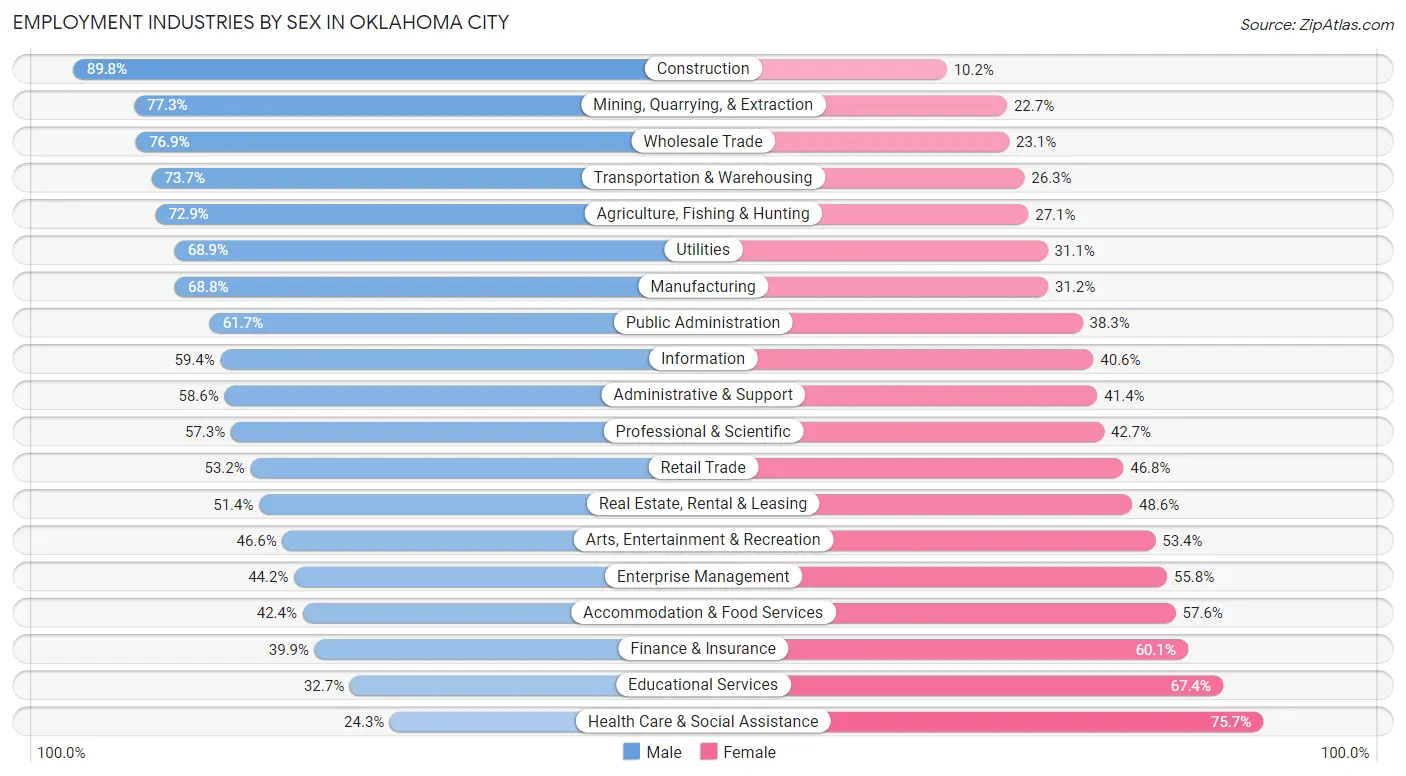
| Industry | Male | Female |
| Agriculture, Fishing & Hunting | 1,343 (72.9%) | 499 (27.1%) |
| Mining, Quarrying, & Extraction | 6,199 (77.3%) | 1,818 (22.7%) |
| Construction | 22,162 (89.8%) | 2,516 (10.2%) |
| Manufacturing | 15,652 (68.8%) | 7,089 (31.2%) |
| Wholesale Trade | 6,478 (76.9%) | 1,948 (23.1%) |
| Retail Trade | 22,126 (53.2%) | 19,431 (46.8%) |
| Transportation & Warehousing | 10,825 (73.7%) | 3,857 (26.3%) |
| Utilities | 1,950 (68.9%) | 880 (31.1%) |
| Information | 3,270 (59.4%) | 2,231 (40.6%) |
| Finance & Insurance | 6,461 (39.9%) | 9,724 (60.1%) |
| Real Estate, Rental & Leasing | 2,723 (51.4%) | 2,573 (48.6%) |
| Professional & Scientific | 14,066 (57.3%) | 10,496 (42.7%) |
| Enterprise Management | 175 (44.2%) | 221 (55.8%) |
| Administrative & Support | 8,227 (58.6%) | 5,810 (41.4%) |
| Educational Services | 8,515 (32.7%) | 17,565 (67.3%) |
| Health Care & Social Assistance | 11,076 (24.3%) | 34,447 (75.7%) |
| Arts, Entertainment & Recreation | 2,889 (46.6%) | 3,309 (53.4%) |
| Accommodation & Food Services | 11,281 (42.4%) | 15,319 (57.6%) |
| Public Administration | 14,569 (61.7%) | 9,057 (38.3%) |
| Total | 178,554 (53.1%) | 157,860 (46.9%) |
Education in Oklahoma City
School Enrollment in Oklahoma City
The most common levels of schooling among the 176,795 students in Oklahoma City are middle school (38,743 | 21.9%), high school (37,189 | 21.0%), and elementary school (36,946 | 20.9%).
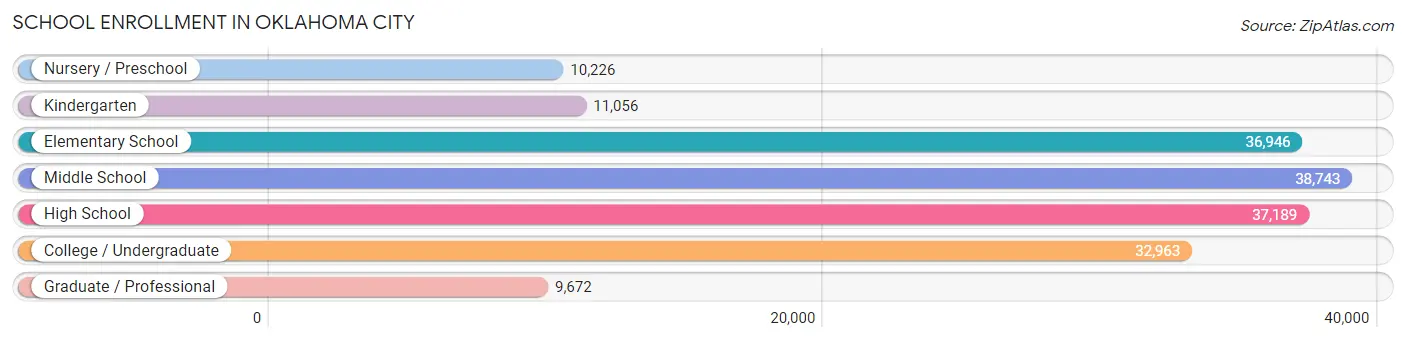
| School Level | # Students | % Students |
| Nursery / Preschool | 10,226 | 5.8% |
| Kindergarten | 11,056 | 6.2% |
| Elementary School | 36,946 | 20.9% |
| Middle School | 38,743 | 21.9% |
| High School | 37,189 | 21.0% |
| College / Undergraduate | 32,963 | 18.6% |
| Graduate / Professional | 9,672 | 5.5% |
| Total | 176,795 | 100.0% |
School Enrollment by Age by Funding Source in Oklahoma City
Out of a total of 176,795 students who are enrolled in schools in Oklahoma City, 27,757 (15.7%) attend a private institution, while the remaining 149,038 (84.3%) are enrolled in public schools. The age group of 3 to 4 year olds has the highest likelihood of being enrolled in private schools, with 2,301 (29.8% in the age bracket) enrolled. Conversely, the age group of 5 to 9 year old has the lowest likelihood of being enrolled in a private school, with 39,386 (87.8% in the age bracket) attending a public institution.
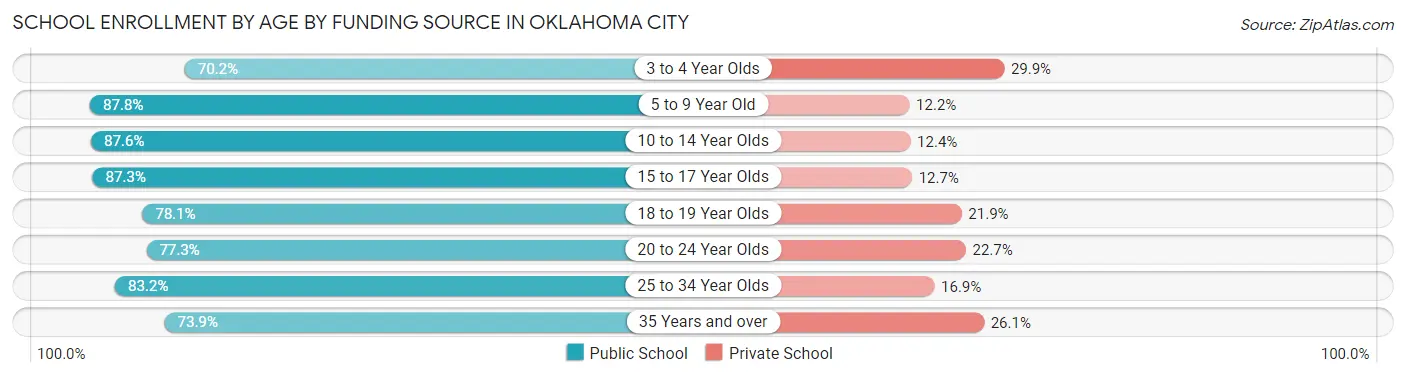
| Age Bracket | Public School | Private School |
| 3 to 4 Year Olds | 5,408 (70.2%) | 2,301 (29.8%) |
| 5 to 9 Year Old | 39,386 (87.8%) | 5,472 (12.2%) |
| 10 to 14 Year Olds | 42,026 (87.6%) | 5,936 (12.4%) |
| 15 to 17 Year Olds | 23,997 (87.3%) | 3,483 (12.7%) |
| 18 to 19 Year Olds | 8,462 (78.1%) | 2,377 (21.9%) |
| 20 to 24 Year Olds | 12,353 (77.3%) | 3,627 (22.7%) |
| 25 to 34 Year Olds | 10,850 (83.2%) | 2,199 (16.9%) |
| 35 Years and over | 6,591 (73.9%) | 2,327 (26.1%) |
| Total | 149,038 (84.3%) | 27,757 (15.7%) |
Educational Attainment by Field of Study in Oklahoma City
Business (38,077 | 23.8%), education (17,752 | 11.1%), science & technology (17,321 | 10.8%), arts & humanities (11,136 | 7.0%), and bio, nature & agricultural (11,132 | 7.0%) are the most common fields of study among 160,060 individuals in Oklahoma City who have obtained a bachelor's degree or higher.
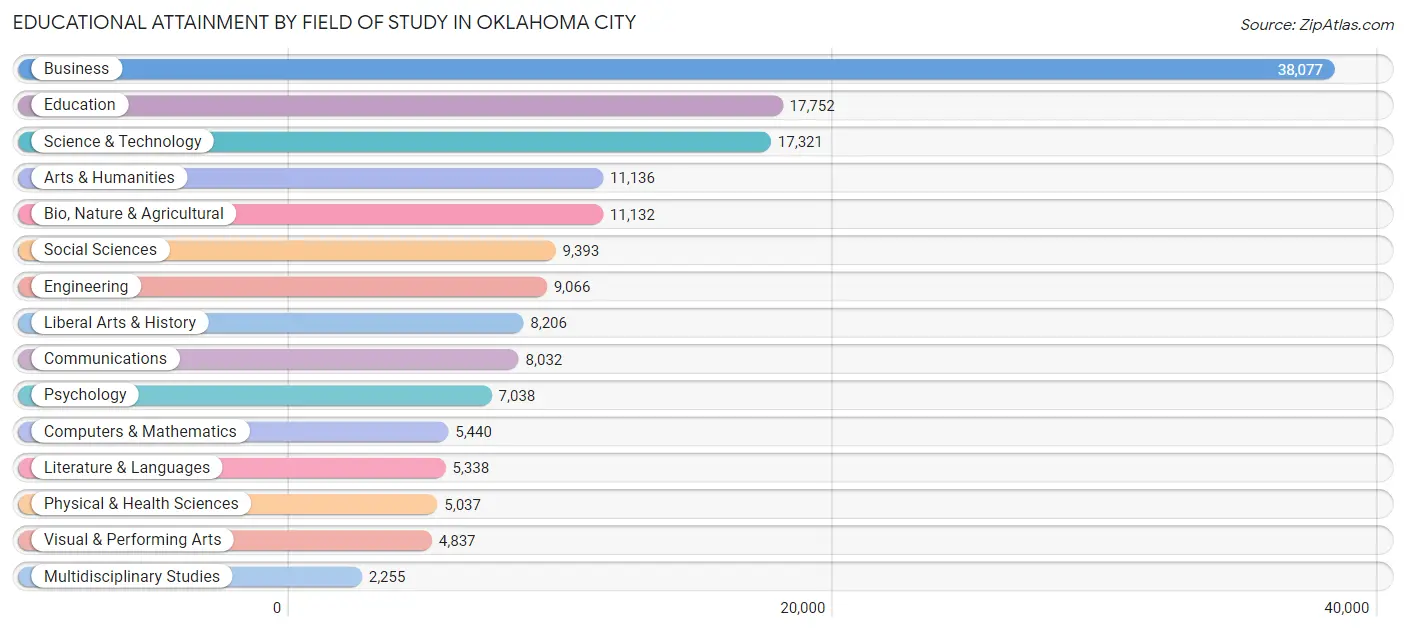
| Field of Study | # Graduates | % Graduates |
| Computers & Mathematics | 5,440 | 3.4% |
| Bio, Nature & Agricultural | 11,132 | 7.0% |
| Physical & Health Sciences | 5,037 | 3.2% |
| Psychology | 7,038 | 4.4% |
| Social Sciences | 9,393 | 5.9% |
| Engineering | 9,066 | 5.7% |
| Multidisciplinary Studies | 2,255 | 1.4% |
| Science & Technology | 17,321 | 10.8% |
| Business | 38,077 | 23.8% |
| Education | 17,752 | 11.1% |
| Literature & Languages | 5,338 | 3.3% |
| Liberal Arts & History | 8,206 | 5.1% |
| Visual & Performing Arts | 4,837 | 3.0% |
| Communications | 8,032 | 5.0% |
| Arts & Humanities | 11,136 | 7.0% |
| Total | 160,060 | 100.0% |
Transportation & Commute in Oklahoma City
Vehicle Availability by Sex in Oklahoma City
The most prevalent vehicle ownership categories in Oklahoma City are males with 2 vehicles (81,705, accounting for 45.7%) and females with 2 vehicles (66,533, making up 52.7%).
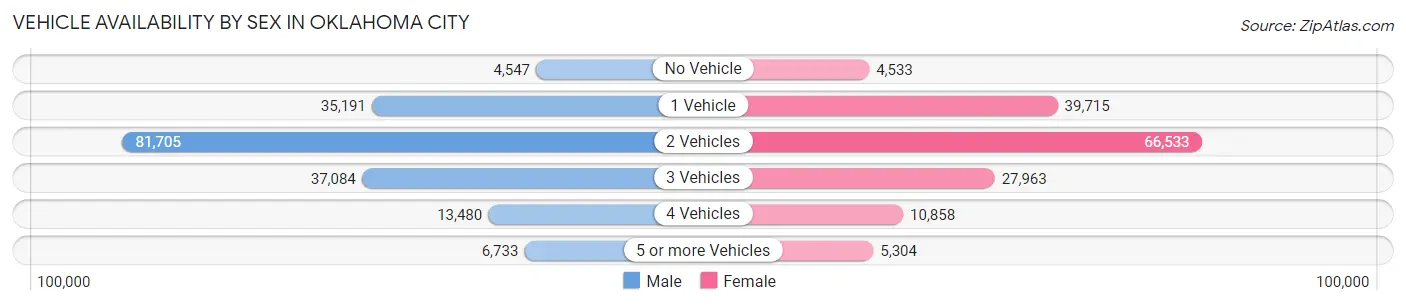
| Vehicles Available | Male | Female |
| No Vehicle | 4,547 (2.5%) | 4,533 (2.9%) |
| 1 Vehicle | 35,191 (19.7%) | 39,715 (25.6%) |
| 2 Vehicles | 81,705 (45.7%) | 66,533 (42.9%) |
| 3 Vehicles | 37,084 (20.7%) | 27,963 (18.0%) |
| 4 Vehicles | 13,480 (7.5%) | 10,858 (7.0%) |
| 5 or more Vehicles | 6,733 (3.8%) | 5,304 (3.4%) |
| Total | 178,740 (100.0%) | 154,906 (100.0%) |
Commute Time in Oklahoma City
The most frequently occuring commute durations in Oklahoma City are 15 to 19 minutes (62,460 commuters, 20.3%), 20 to 24 minutes (62,155 commuters, 20.2%), and 10 to 14 minutes (45,859 commuters, 14.9%).
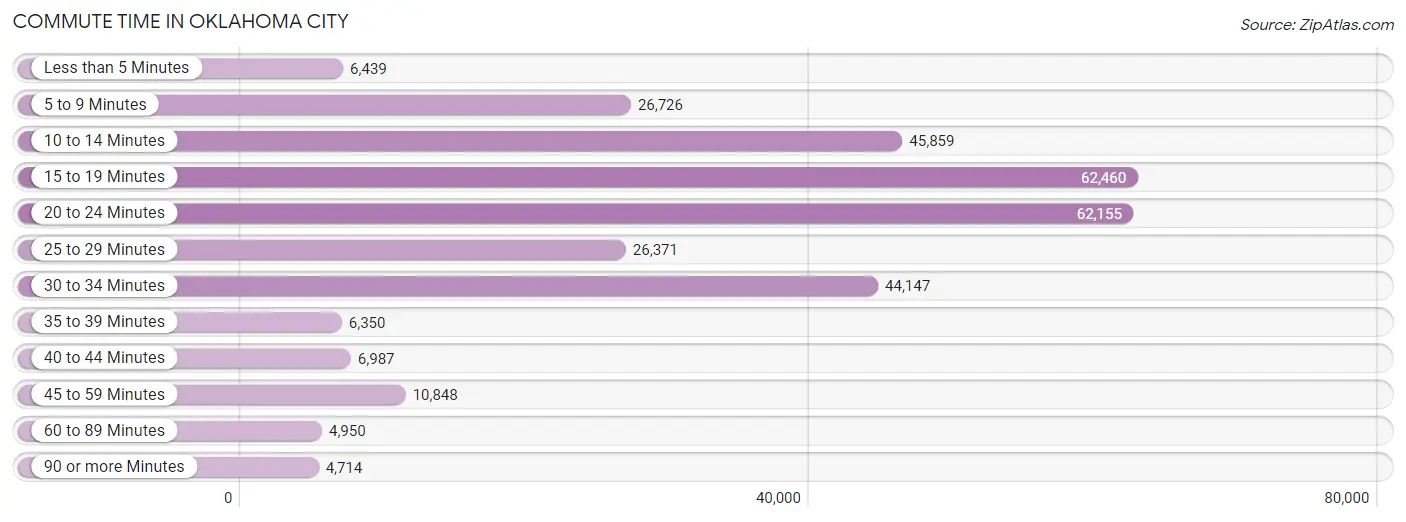
| Commute Time | # Commuters | % Commuters |
| Less than 5 Minutes | 6,439 | 2.1% |
| 5 to 9 Minutes | 26,726 | 8.7% |
| 10 to 14 Minutes | 45,859 | 14.9% |
| 15 to 19 Minutes | 62,460 | 20.3% |
| 20 to 24 Minutes | 62,155 | 20.2% |
| 25 to 29 Minutes | 26,371 | 8.6% |
| 30 to 34 Minutes | 44,147 | 14.3% |
| 35 to 39 Minutes | 6,350 | 2.1% |
| 40 to 44 Minutes | 6,987 | 2.3% |
| 45 to 59 Minutes | 10,848 | 3.5% |
| 60 to 89 Minutes | 4,950 | 1.6% |
| 90 or more Minutes | 4,714 | 1.5% |
Commute Time by Sex in Oklahoma City
The most common commute times in Oklahoma City are 20 to 24 minutes (33,578 commuters, 20.0%) for males and 15 to 19 minutes (29,201 commuters, 20.9%) for females.
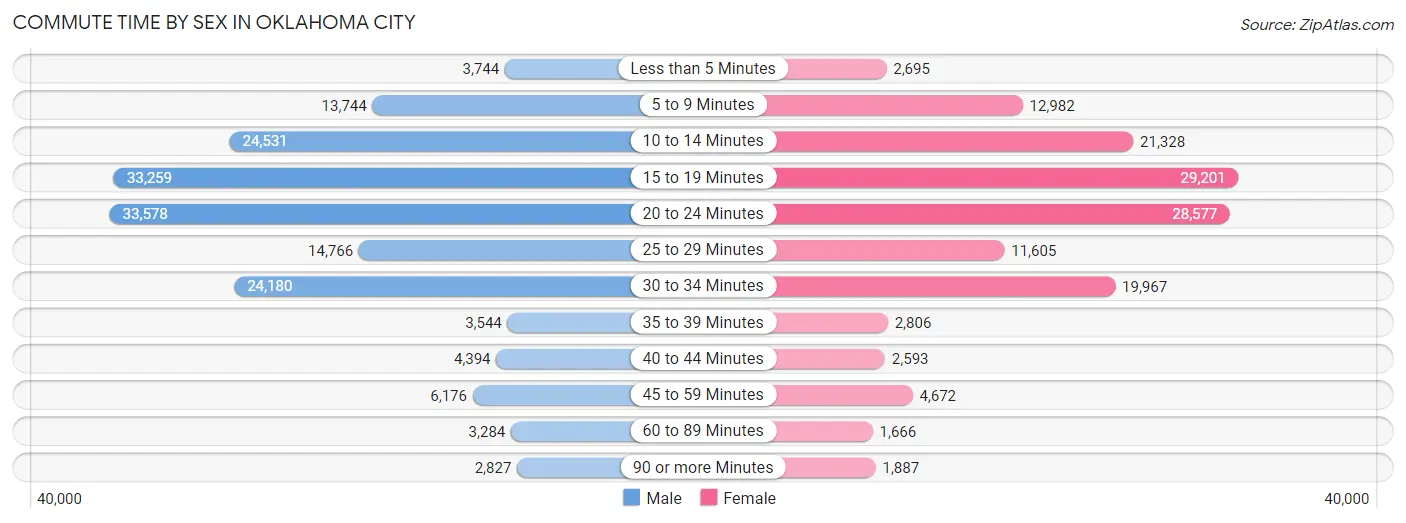
| Commute Time | Male | Female |
| Less than 5 Minutes | 3,744 (2.2%) | 2,695 (1.9%) |
| 5 to 9 Minutes | 13,744 (8.2%) | 12,982 (9.3%) |
| 10 to 14 Minutes | 24,531 (14.6%) | 21,328 (15.2%) |
| 15 to 19 Minutes | 33,259 (19.8%) | 29,201 (20.9%) |
| 20 to 24 Minutes | 33,578 (20.0%) | 28,577 (20.4%) |
| 25 to 29 Minutes | 14,766 (8.8%) | 11,605 (8.3%) |
| 30 to 34 Minutes | 24,180 (14.4%) | 19,967 (14.3%) |
| 35 to 39 Minutes | 3,544 (2.1%) | 2,806 (2.0%) |
| 40 to 44 Minutes | 4,394 (2.6%) | 2,593 (1.8%) |
| 45 to 59 Minutes | 6,176 (3.7%) | 4,672 (3.3%) |
| 60 to 89 Minutes | 3,284 (1.9%) | 1,666 (1.2%) |
| 90 or more Minutes | 2,827 (1.7%) | 1,887 (1.3%) |
Time of Departure to Work by Sex in Oklahoma City
The most frequent times of departure to work in Oklahoma City are 7:00 AM to 7:29 AM (25,013, 14.9%) for males and 7:00 AM to 7:29 AM (22,329, 16.0%) for females.
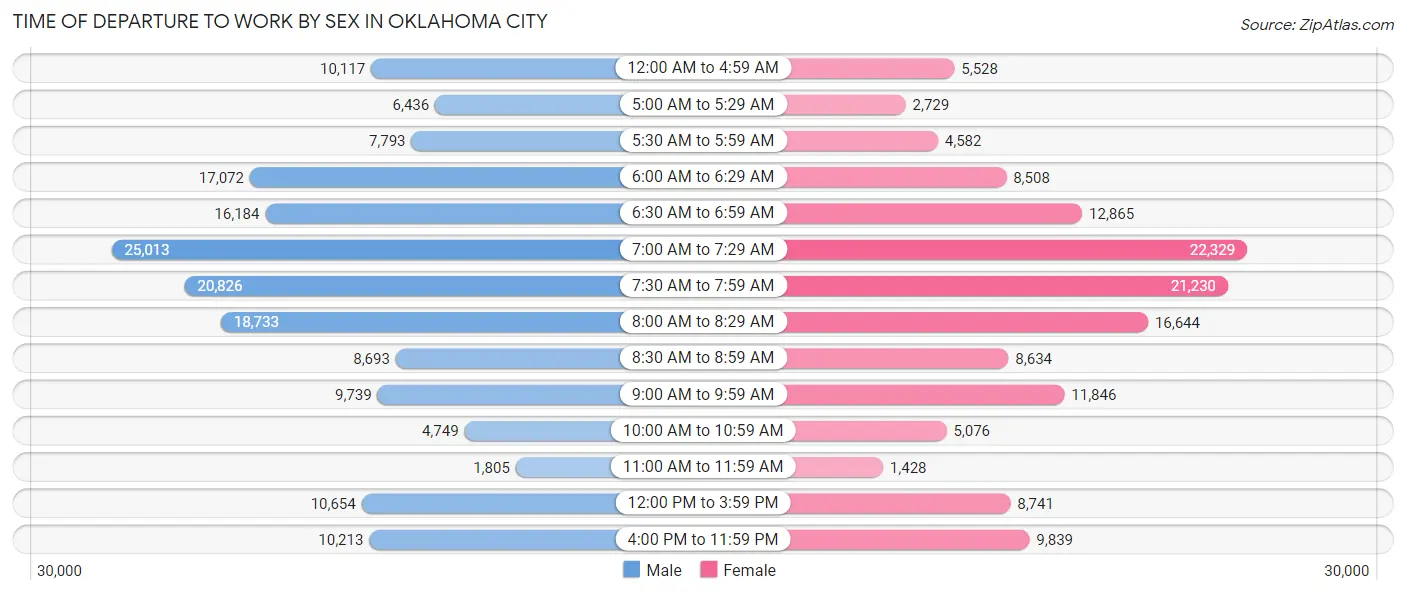
| Time of Departure | Male | Female |
| 12:00 AM to 4:59 AM | 10,117 (6.0%) | 5,528 (4.0%) |
| 5:00 AM to 5:29 AM | 6,436 (3.8%) | 2,729 (1.9%) |
| 5:30 AM to 5:59 AM | 7,793 (4.6%) | 4,582 (3.3%) |
| 6:00 AM to 6:29 AM | 17,072 (10.2%) | 8,508 (6.1%) |
| 6:30 AM to 6:59 AM | 16,184 (9.6%) | 12,865 (9.2%) |
| 7:00 AM to 7:29 AM | 25,013 (14.9%) | 22,329 (16.0%) |
| 7:30 AM to 7:59 AM | 20,826 (12.4%) | 21,230 (15.2%) |
| 8:00 AM to 8:29 AM | 18,733 (11.2%) | 16,644 (11.9%) |
| 8:30 AM to 8:59 AM | 8,693 (5.2%) | 8,634 (6.2%) |
| 9:00 AM to 9:59 AM | 9,739 (5.8%) | 11,846 (8.5%) |
| 10:00 AM to 10:59 AM | 4,749 (2.8%) | 5,076 (3.6%) |
| 11:00 AM to 11:59 AM | 1,805 (1.1%) | 1,428 (1.0%) |
| 12:00 PM to 3:59 PM | 10,654 (6.3%) | 8,741 (6.2%) |
| 4:00 PM to 11:59 PM | 10,213 (6.1%) | 9,839 (7.0%) |
| Total | 168,027 (100.0%) | 139,979 (100.0%) |
Housing Occupancy in Oklahoma City
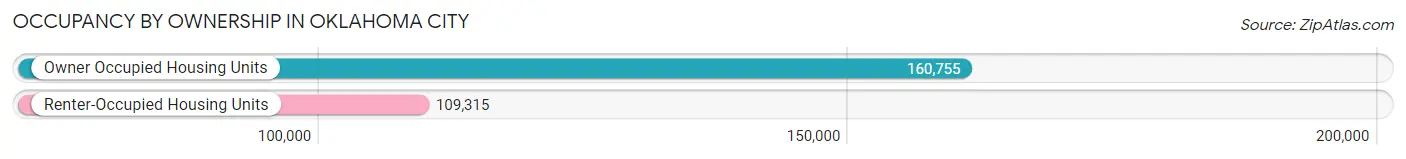
Occupancy by Ownership in Oklahoma City
Of the total 270,070 dwellings in Oklahoma City, owner-occupied units account for 160,755 (59.5%), while renter-occupied units make up 109,315 (40.5%).
| Occupancy | # Housing Units | % Housing Units |
| Owner Occupied Housing Units | 160,755 | 59.5% |
| Renter-Occupied Housing Units | 109,315 | 40.5% |
| Total Occupied Housing Units | 270,070 | 100.0% |
Occupancy by Household Size in Oklahoma City
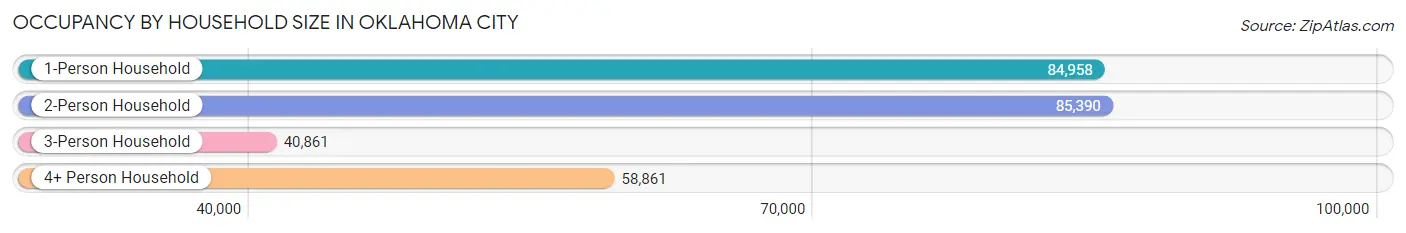
| Household Size | # Housing Units | % Housing Units |
| 1-Person Household | 84,958 | 31.5% |
| 2-Person Household | 85,390 | 31.6% |
| 3-Person Household | 40,861 | 15.1% |
| 4+ Person Household | 58,861 | 21.8% |
| Total Housing Units | 270,070 | 100.0% |
Occupancy by Ownership by Household Size in Oklahoma City
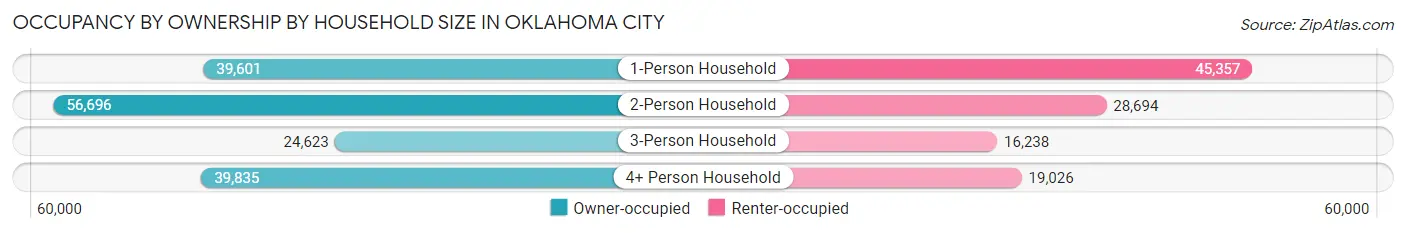
| Household Size | Owner-occupied | Renter-occupied |
| 1-Person Household | 39,601 (46.6%) | 45,357 (53.4%) |
| 2-Person Household | 56,696 (66.4%) | 28,694 (33.6%) |
| 3-Person Household | 24,623 (60.3%) | 16,238 (39.7%) |
| 4+ Person Household | 39,835 (67.7%) | 19,026 (32.3%) |
| Total Housing Units | 160,755 (59.5%) | 109,315 (40.5%) |
Occupancy by Educational Attainment in Oklahoma City
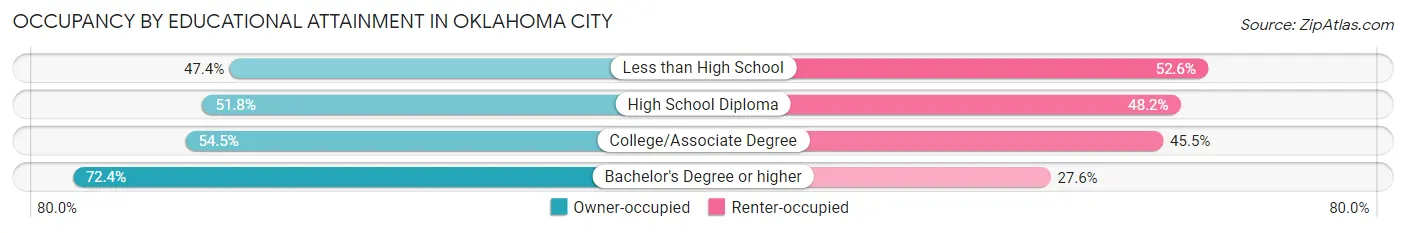
| Household Size | Owner-occupied | Renter-occupied |
| Less than High School | 13,106 (47.4%) | 14,537 (52.6%) |
| High School Diploma | 30,622 (51.8%) | 28,534 (48.2%) |
| College/Associate Degree | 47,505 (54.5%) | 39,685 (45.5%) |
| Bachelor's Degree or higher | 69,522 (72.4%) | 26,559 (27.6%) |
Occupancy by Age of Householder in Oklahoma City
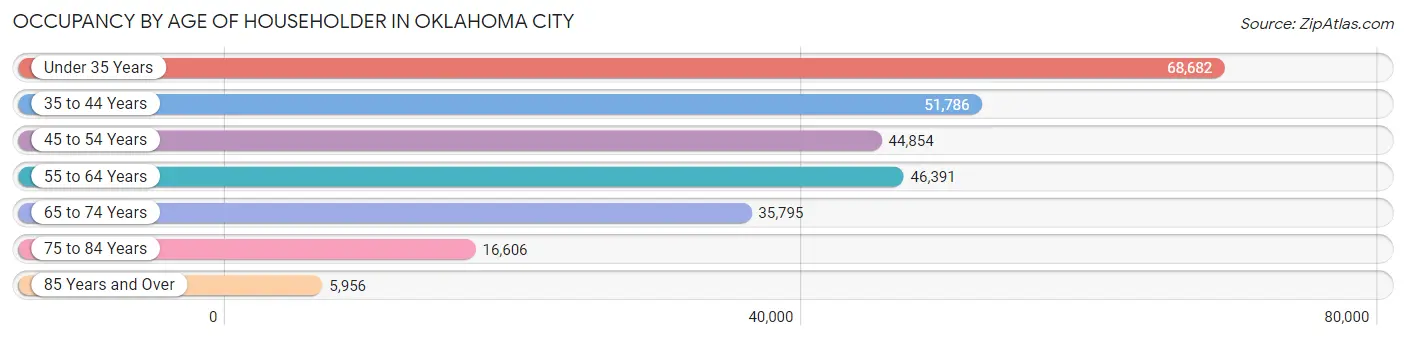
| Age Bracket | # Households | % Households |
| Under 35 Years | 68,682 | 25.4% |
| 35 to 44 Years | 51,786 | 19.2% |
| 45 to 54 Years | 44,854 | 16.6% |
| 55 to 64 Years | 46,391 | 17.2% |
| 65 to 74 Years | 35,795 | 13.3% |
| 75 to 84 Years | 16,606 | 6.1% |
| 85 Years and Over | 5,956 | 2.2% |
| Total | 270,070 | 100.0% |
Housing Finances in Oklahoma City
Median Income by Occupancy in Oklahoma City
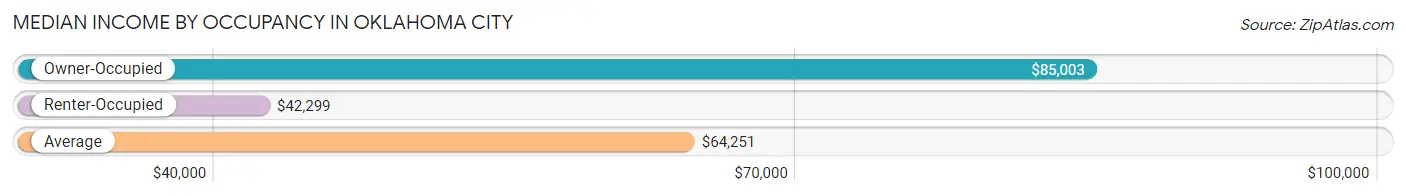
| Occupancy Type | # Households | Median Income |
| Owner-Occupied | 160,755 (59.5%) | $85,003 |
| Renter-Occupied | 109,315 (40.5%) | $42,299 |
| Average | 270,070 (100.0%) | $64,251 |
Occupancy by Householder Income Bracket in Oklahoma City
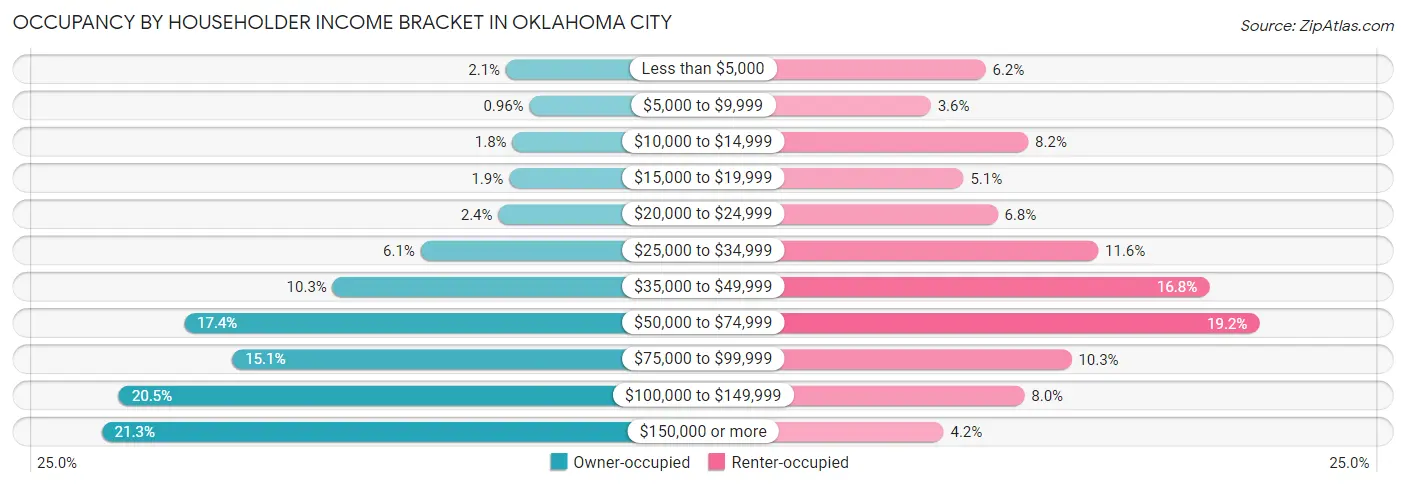
| Income Bracket | Owner-occupied | Renter-occupied |
| Less than $5,000 | 3,344 (2.1%) | 6,763 (6.2%) |
| $5,000 to $9,999 | 1,543 (1.0%) | 3,911 (3.6%) |
| $10,000 to $14,999 | 2,838 (1.8%) | 8,990 (8.2%) |
| $15,000 to $19,999 | 3,100 (1.9%) | 5,615 (5.1%) |
| $20,000 to $24,999 | 3,918 (2.4%) | 7,391 (6.8%) |
| $25,000 to $34,999 | 9,865 (6.1%) | 12,628 (11.6%) |
| $35,000 to $49,999 | 16,607 (10.3%) | 18,395 (16.8%) |
| $50,000 to $74,999 | 27,983 (17.4%) | 21,007 (19.2%) |
| $75,000 to $99,999 | 24,293 (15.1%) | 11,243 (10.3%) |
| $100,000 to $149,999 | 32,974 (20.5%) | 8,788 (8.0%) |
| $150,000 or more | 34,290 (21.3%) | 4,584 (4.2%) |
| Total | 160,755 (100.0%) | 109,315 (100.0%) |
Monthly Housing Cost Tiers in Oklahoma City
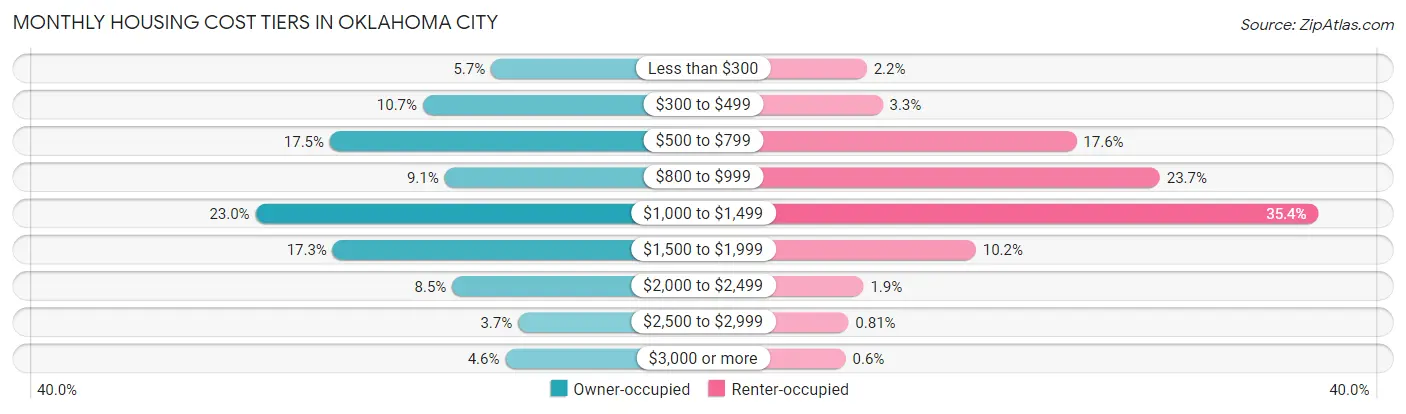
| Monthly Cost | Owner-occupied | Renter-occupied |
| Less than $300 | 9,085 (5.7%) | 2,365 (2.2%) |
| $300 to $499 | 17,154 (10.7%) | 3,628 (3.3%) |
| $500 to $799 | 28,161 (17.5%) | 19,235 (17.6%) |
| $800 to $999 | 14,578 (9.1%) | 25,956 (23.7%) |
| $1,000 to $1,499 | 36,968 (23.0%) | 38,720 (35.4%) |
| $1,500 to $1,999 | 27,830 (17.3%) | 11,135 (10.2%) |
| $2,000 to $2,499 | 13,687 (8.5%) | 2,100 (1.9%) |
| $2,500 to $2,999 | 5,891 (3.7%) | 889 (0.8%) |
| $3,000 or more | 7,401 (4.6%) | 659 (0.6%) |
| Total | 160,755 (100.0%) | 109,315 (100.0%) |
Physical Housing Characteristics in Oklahoma City
Housing Structures in Oklahoma City
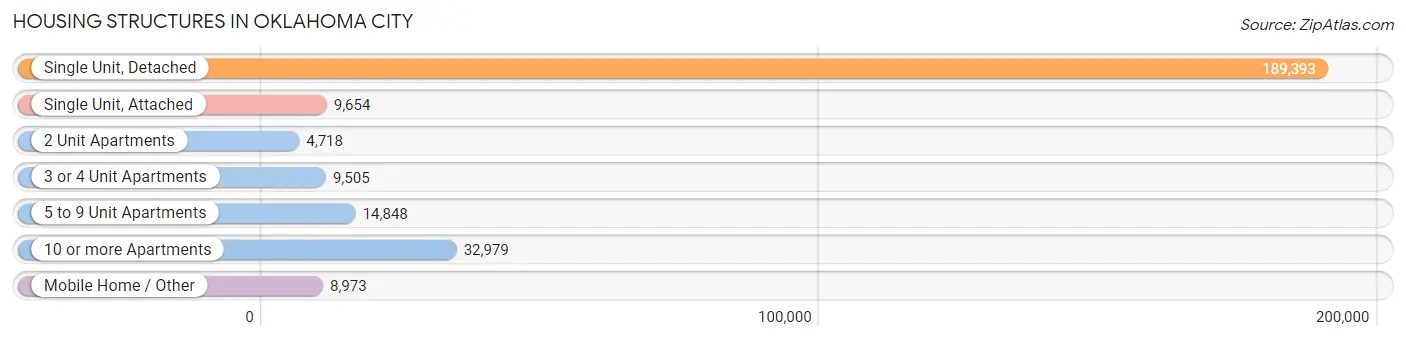
| Structure Type | # Housing Units | % Housing Units |
| Single Unit, Detached | 189,393 | 70.1% |
| Single Unit, Attached | 9,654 | 3.6% |
| 2 Unit Apartments | 4,718 | 1.8% |
| 3 or 4 Unit Apartments | 9,505 | 3.5% |
| 5 to 9 Unit Apartments | 14,848 | 5.5% |
| 10 or more Apartments | 32,979 | 12.2% |
| Mobile Home / Other | 8,973 | 3.3% |
| Total | 270,070 | 100.0% |
Housing Structures by Occupancy in Oklahoma City
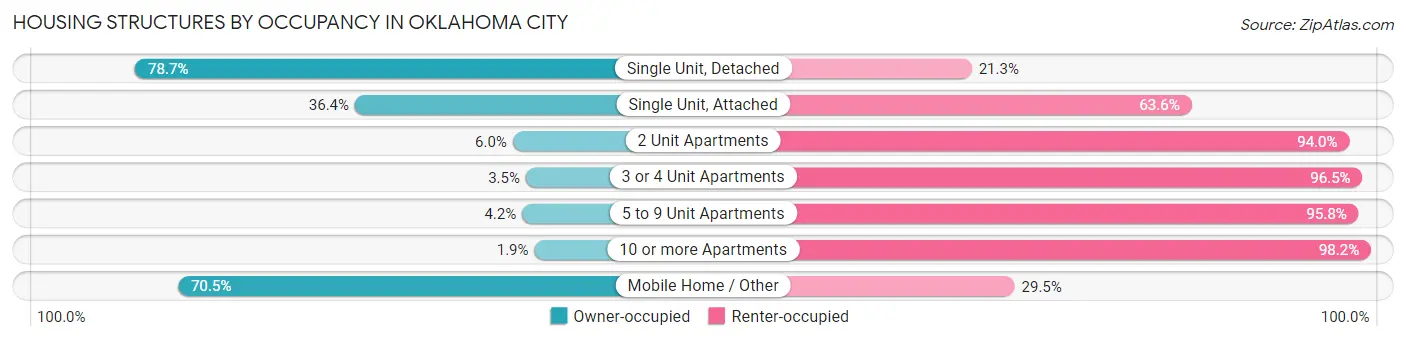
| Structure Type | Owner-occupied | Renter-occupied |
| Single Unit, Detached | 149,064 (78.7%) | 40,329 (21.3%) |
| Single Unit, Attached | 3,515 (36.4%) | 6,139 (63.6%) |
| 2 Unit Apartments | 284 (6.0%) | 4,434 (94.0%) |
| 3 or 4 Unit Apartments | 333 (3.5%) | 9,172 (96.5%) |
| 5 to 9 Unit Apartments | 627 (4.2%) | 14,221 (95.8%) |
| 10 or more Apartments | 610 (1.8%) | 32,369 (98.2%) |
| Mobile Home / Other | 6,322 (70.5%) | 2,651 (29.5%) |
| Total | 160,755 (59.5%) | 109,315 (40.5%) |
Housing Structures by Number of Rooms in Oklahoma City
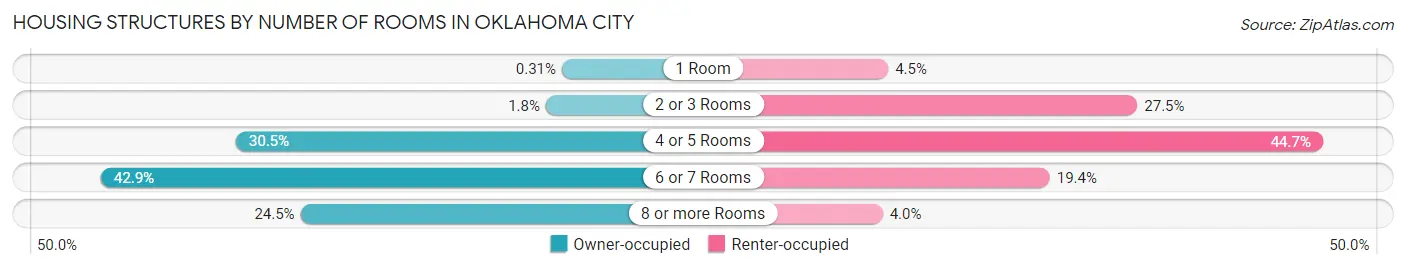
| Number of Rooms | Owner-occupied | Renter-occupied |
| 1 Room | 503 (0.3%) | 4,889 (4.5%) |
| 2 or 3 Rooms | 2,886 (1.8%) | 30,069 (27.5%) |
| 4 or 5 Rooms | 48,964 (30.5%) | 48,806 (44.7%) |
| 6 or 7 Rooms | 69,029 (42.9%) | 21,218 (19.4%) |
| 8 or more Rooms | 39,373 (24.5%) | 4,333 (4.0%) |
| Total | 160,755 (100.0%) | 109,315 (100.0%) |
Housing Structure by Heating Type in Oklahoma City
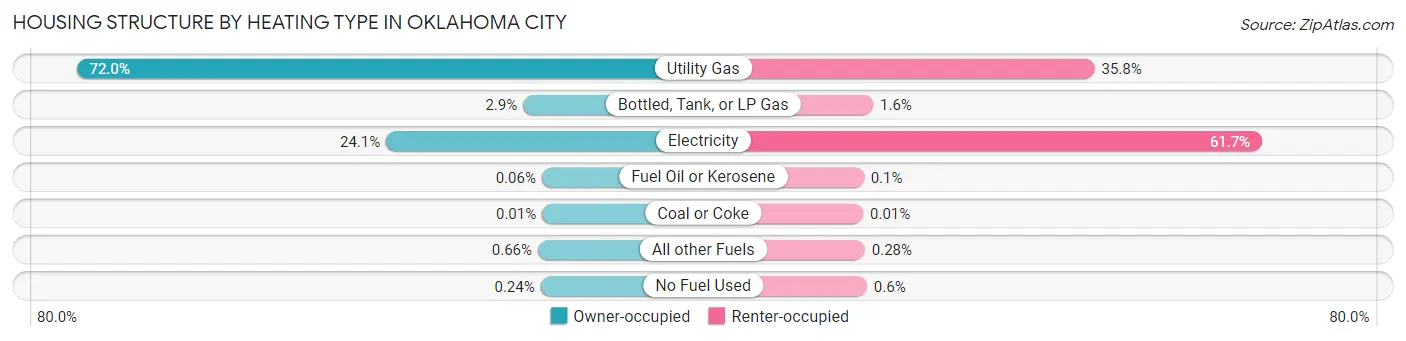
| Heating Type | Owner-occupied | Renter-occupied |
| Utility Gas | 115,696 (72.0%) | 39,128 (35.8%) |
| Bottled, Tank, or LP Gas | 4,733 (2.9%) | 1,703 (1.6%) |
| Electricity | 38,768 (24.1%) | 67,409 (61.7%) |
| Fuel Oil or Kerosene | 102 (0.1%) | 107 (0.1%) |
| Coal or Coke | 12 (0.0%) | 6 (0.0%) |
| All other Fuels | 1,061 (0.7%) | 304 (0.3%) |
| No Fuel Used | 383 (0.2%) | 658 (0.6%) |
| Total | 160,755 (100.0%) | 109,315 (100.0%) |
Household Vehicle Usage in Oklahoma City
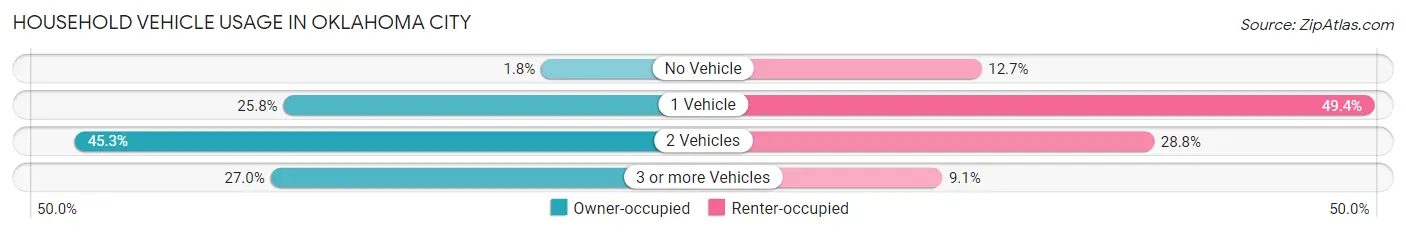
| Vehicles per Household | Owner-occupied | Renter-occupied |
| No Vehicle | 2,883 (1.8%) | 13,914 (12.7%) |
| 1 Vehicle | 41,541 (25.8%) | 53,980 (49.4%) |
| 2 Vehicles | 72,861 (45.3%) | 31,522 (28.8%) |
| 3 or more Vehicles | 43,470 (27.0%) | 9,899 (9.1%) |
| Total | 160,755 (100.0%) | 109,315 (100.0%) |
Real Estate & Mortgages in Oklahoma City
Real Estate and Mortgage Overview in Oklahoma City
| Characteristic | Without Mortgage | With Mortgage |
| Housing Units | 63,156 | 97,599 |
| Median Property Value | $171,100 | $210,200 |
| Median Household Income | $64,721 | $24,406 |
| Monthly Housing Costs | $565 | $7,210 |
| Real Estate Taxes | $1,702 | $4,251 |
Property Value by Mortgage Status in Oklahoma City
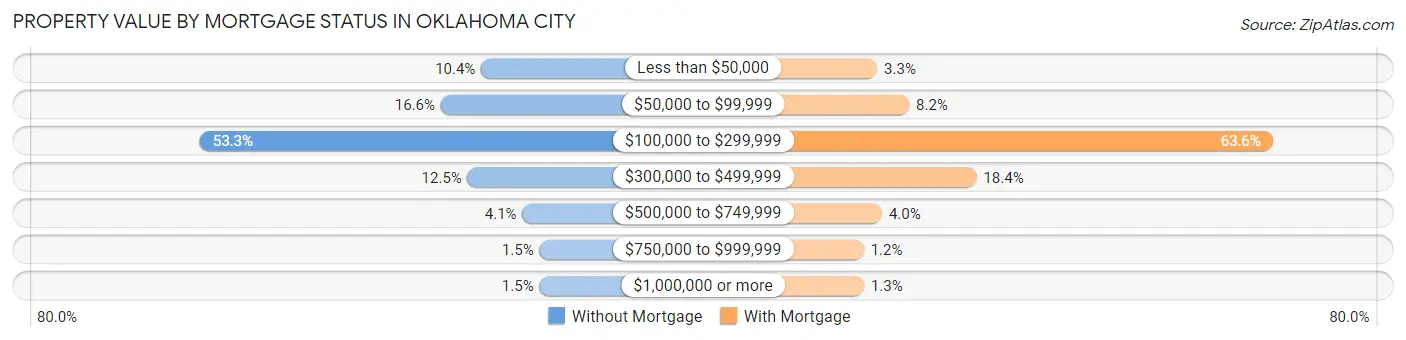
| Property Value | Without Mortgage | With Mortgage |
| Less than $50,000 | 6,582 (10.4%) | 3,215 (3.3%) |
| $50,000 to $99,999 | 10,467 (16.6%) | 7,962 (8.2%) |
| $100,000 to $299,999 | 33,664 (53.3%) | 62,040 (63.6%) |
| $300,000 to $499,999 | 7,890 (12.5%) | 17,990 (18.4%) |
| $500,000 to $749,999 | 2,615 (4.1%) | 3,933 (4.0%) |
| $750,000 to $999,999 | 965 (1.5%) | 1,210 (1.2%) |
| $1,000,000 or more | 973 (1.5%) | 1,249 (1.3%) |
| Total | 63,156 (100.0%) | 97,599 (100.0%) |
Household Income by Mortgage Status in Oklahoma City
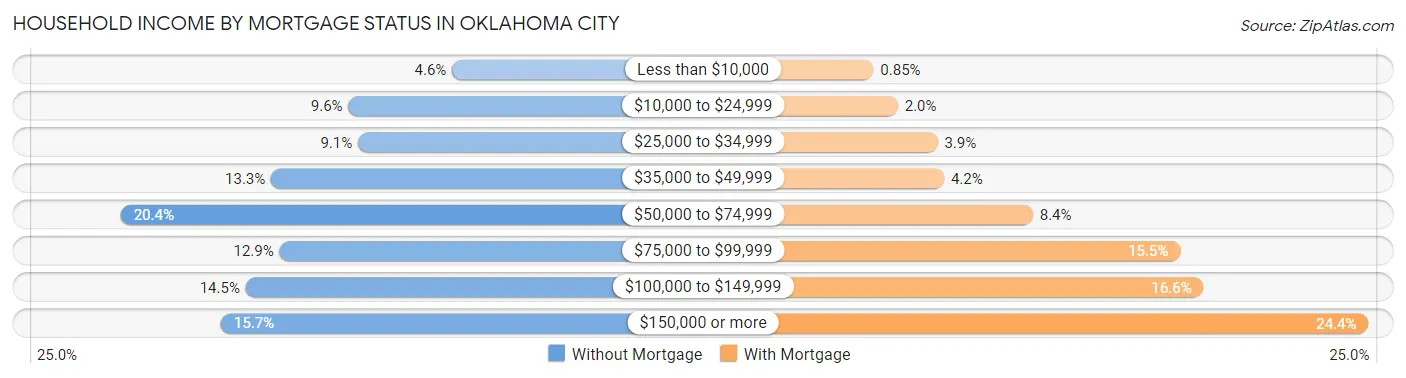
| Household Income | Without Mortgage | With Mortgage |
| Less than $10,000 | 2,929 (4.6%) | 825 (0.9%) |
| $10,000 to $24,999 | 6,048 (9.6%) | 1,958 (2.0%) |
| $25,000 to $34,999 | 5,759 (9.1%) | 3,808 (3.9%) |
| $35,000 to $49,999 | 8,374 (13.3%) | 4,106 (4.2%) |
| $50,000 to $74,999 | 12,898 (20.4%) | 8,233 (8.4%) |
| $75,000 to $99,999 | 8,125 (12.9%) | 15,085 (15.5%) |
| $100,000 to $149,999 | 9,139 (14.5%) | 16,168 (16.6%) |
| $150,000 or more | 9,884 (15.7%) | 23,835 (24.4%) |
| Total | 63,156 (100.0%) | 97,599 (100.0%) |
Property Value to Household Income Ratio in Oklahoma City
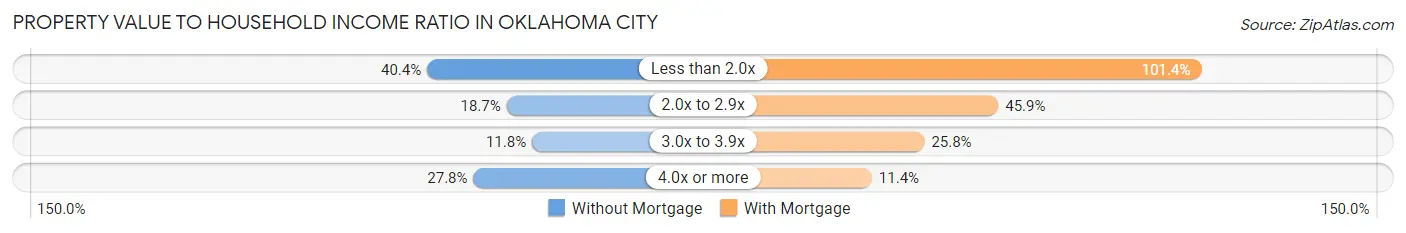
| Value-to-Income Ratio | Without Mortgage | With Mortgage |
| Less than 2.0x | 25,495 (40.4%) | 98,976 (101.4%) |
| 2.0x to 2.9x | 11,808 (18.7%) | 44,767 (45.9%) |
| 3.0x to 3.9x | 7,441 (11.8%) | 25,131 (25.8%) |
| 4.0x or more | 17,524 (27.8%) | 11,170 (11.4%) |
| Total | 63,156 (100.0%) | 97,599 (100.0%) |
Real Estate Taxes by Mortgage Status in Oklahoma City
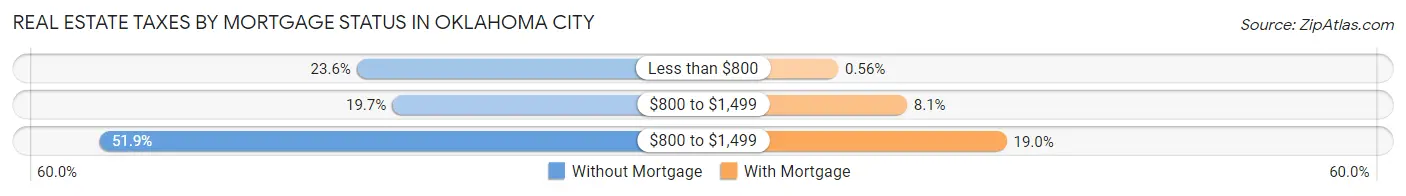
| Property Taxes | Without Mortgage | With Mortgage |
| Less than $800 | 14,908 (23.6%) | 543 (0.6%) |
| $800 to $1,499 | 12,461 (19.7%) | 7,895 (8.1%) |
| $800 to $1,499 | 32,748 (51.8%) | 18,556 (19.0%) |
| Total | 63,156 (100.0%) | 97,599 (100.0%) |
Health & Disability in Oklahoma City
Health Insurance Coverage by Age in Oklahoma City
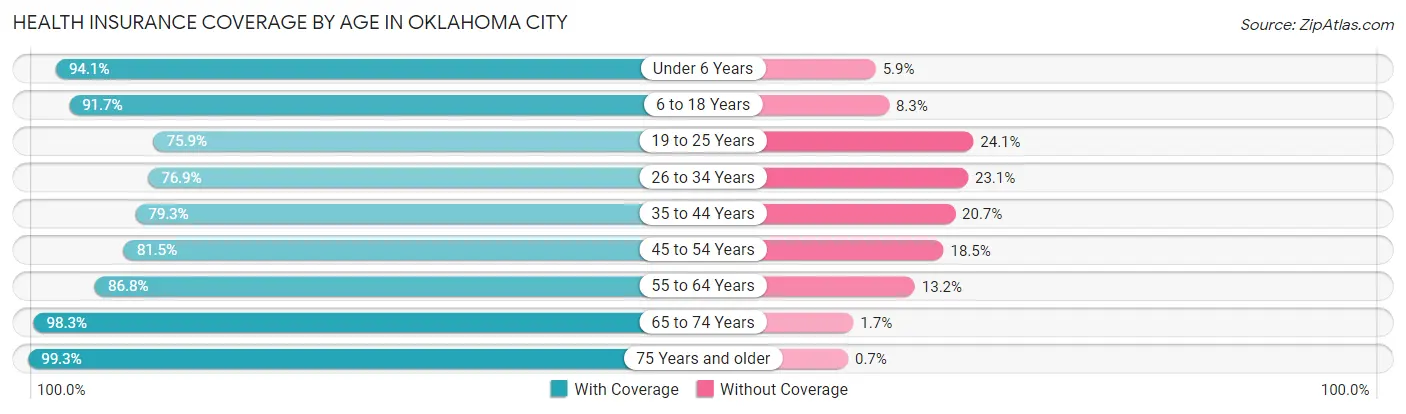
| Age Bracket | With Coverage | Without Coverage |
| Under 6 Years | 52,533 (94.1%) | 3,273 (5.9%) |
| 6 to 18 Years | 112,528 (91.7%) | 10,227 (8.3%) |
| 19 to 25 Years | 48,860 (75.9%) | 15,488 (24.1%) |
| 26 to 34 Years | 71,635 (76.9%) | 21,500 (23.1%) |
| 35 to 44 Years | 74,227 (79.3%) | 19,326 (20.7%) |
| 45 to 54 Years | 62,894 (81.5%) | 14,287 (18.5%) |
| 55 to 64 Years | 66,180 (86.8%) | 10,027 (13.2%) |
| 65 to 74 Years | 53,100 (98.3%) | 920 (1.7%) |
| 75 Years and older | 32,834 (99.3%) | 232 (0.7%) |
| Total | 574,791 (85.8%) | 95,280 (14.2%) |
Health Insurance Coverage by Citizenship Status in Oklahoma City
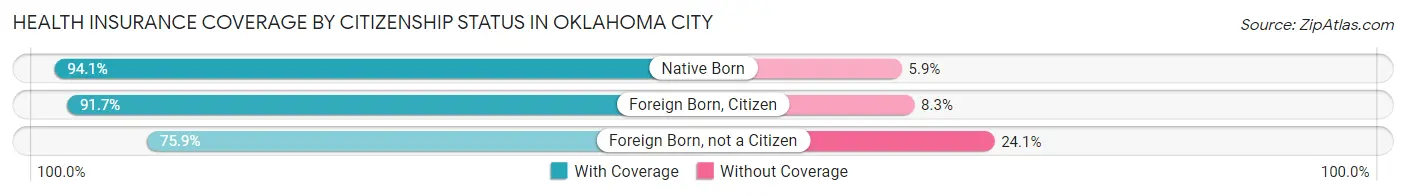
| Citizenship Status | With Coverage | Without Coverage |
| Native Born | 52,533 (94.1%) | 3,273 (5.9%) |
| Foreign Born, Citizen | 112,528 (91.7%) | 10,227 (8.3%) |
| Foreign Born, not a Citizen | 48,860 (75.9%) | 15,488 (24.1%) |
Health Insurance Coverage by Household Income in Oklahoma City
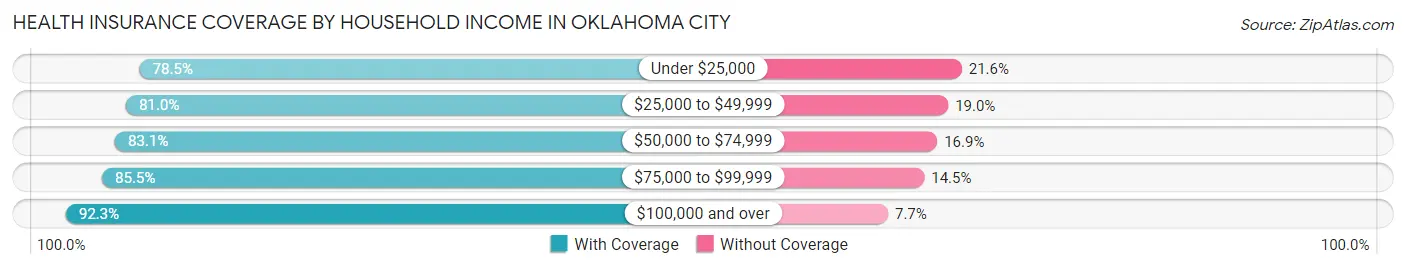
| Household Income | With Coverage | Without Coverage |
| Under $25,000 | 66,540 (78.4%) | 18,281 (21.5%) |
| $25,000 to $49,999 | 100,632 (81.0%) | 23,606 (19.0%) |
| $50,000 to $74,999 | 99,384 (83.1%) | 20,268 (16.9%) |
| $75,000 to $99,999 | 80,035 (85.5%) | 13,593 (14.5%) |
| $100,000 and over | 223,317 (92.3%) | 18,718 (7.7%) |
Public vs Private Health Insurance Coverage by Age in Oklahoma City
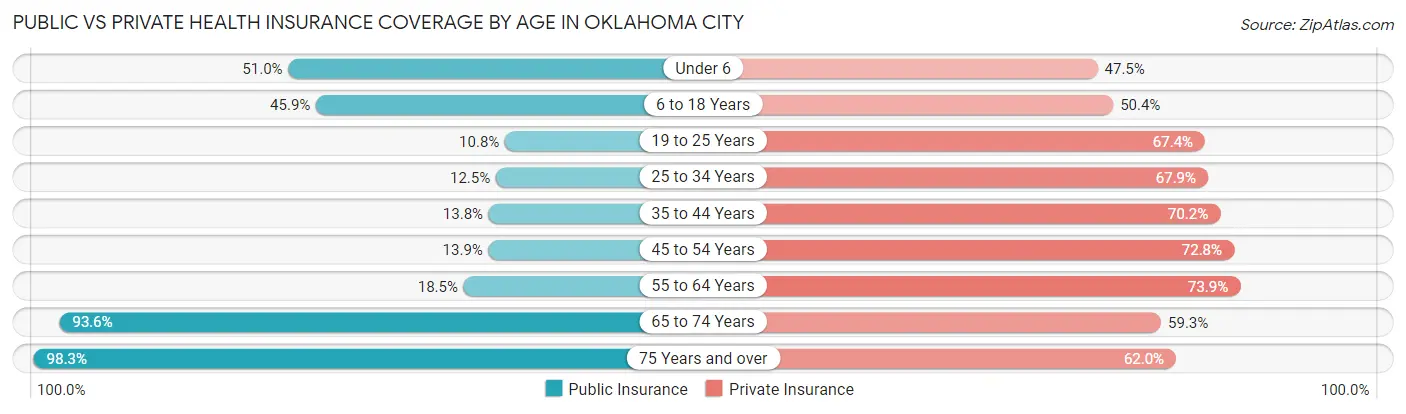
| Age Bracket | Public Insurance | Private Insurance |
| Under 6 | 28,478 (51.0%) | 26,499 (47.5%) |
| 6 to 18 Years | 56,321 (45.9%) | 61,845 (50.4%) |
| 19 to 25 Years | 6,949 (10.8%) | 43,361 (67.4%) |
| 25 to 34 Years | 11,632 (12.5%) | 63,274 (67.9%) |
| 35 to 44 Years | 12,925 (13.8%) | 65,683 (70.2%) |
| 45 to 54 Years | 10,694 (13.9%) | 56,165 (72.8%) |
| 55 to 64 Years | 14,083 (18.5%) | 56,323 (73.9%) |
| 65 to 74 Years | 50,537 (93.5%) | 32,018 (59.3%) |
| 75 Years and over | 32,512 (98.3%) | 20,507 (62.0%) |
| Total | 224,131 (33.5%) | 425,675 (63.5%) |
Disability Status by Sex by Age in Oklahoma City
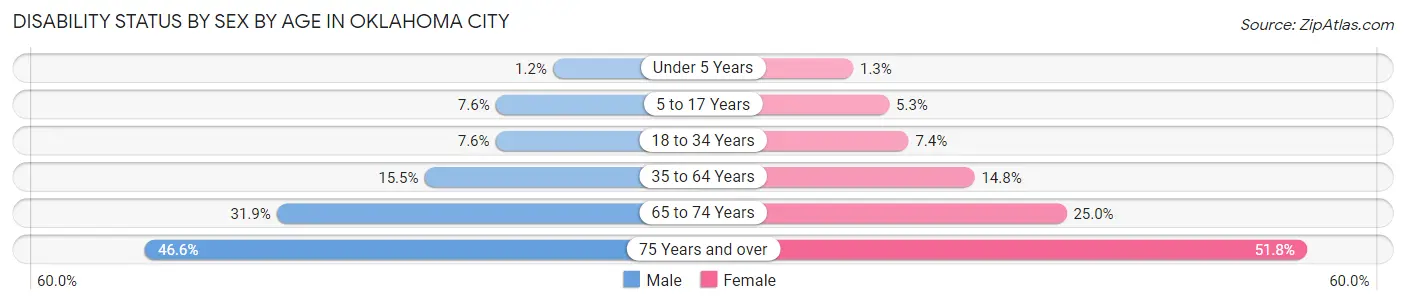
| Age Bracket | Male | Female |
| Under 5 Years | 276 (1.2%) | 283 (1.3%) |
| 5 to 17 Years | 4,838 (7.6%) | 3,174 (5.3%) |
| 18 to 34 Years | 6,201 (7.6%) | 6,238 (7.4%) |
| 35 to 64 Years | 18,886 (15.5%) | 18,474 (14.8%) |
| 65 to 74 Years | 8,028 (31.9%) | 7,227 (25.0%) |
| 75 Years and over | 6,109 (46.6%) | 10,330 (51.8%) |
Disability Class by Sex by Age in Oklahoma City
Disability Class: Hearing Difficulty
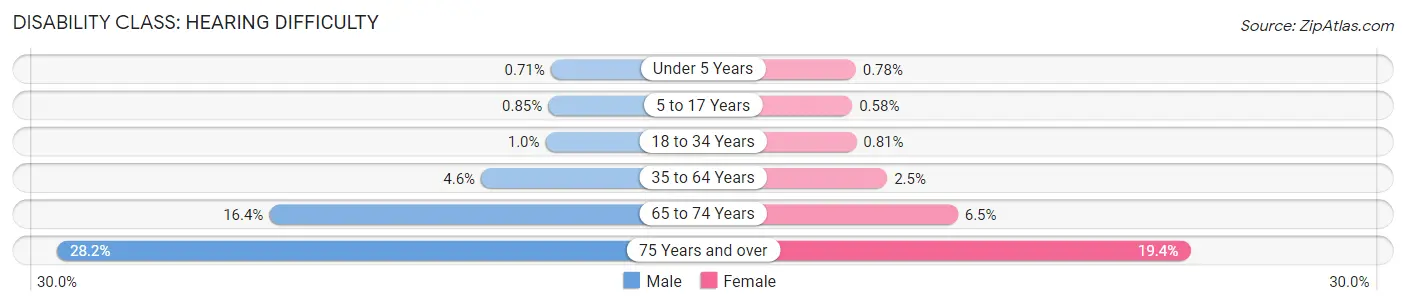
| Age Bracket | Male | Female |
| Under 5 Years | 166 (0.7%) | 178 (0.8%) |
| 5 to 17 Years | 541 (0.9%) | 349 (0.6%) |
| 18 to 34 Years | 818 (1.0%) | 683 (0.8%) |
| 35 to 64 Years | 5,602 (4.6%) | 3,167 (2.5%) |
| 65 to 74 Years | 4,118 (16.4%) | 1,866 (6.5%) |
| 75 Years and over | 3,697 (28.2%) | 3,868 (19.4%) |
Disability Class: Vision Difficulty
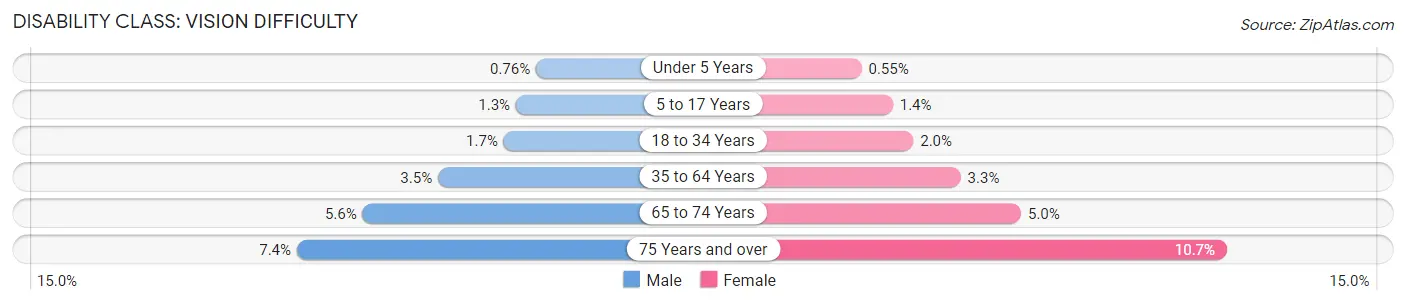
| Age Bracket | Male | Female |
| Under 5 Years | 178 (0.8%) | 126 (0.5%) |
| 5 to 17 Years | 843 (1.3%) | 856 (1.4%) |
| 18 to 34 Years | 1,358 (1.7%) | 1,666 (2.0%) |
| 35 to 64 Years | 4,256 (3.5%) | 4,136 (3.3%) |
| 65 to 74 Years | 1,404 (5.6%) | 1,441 (5.0%) |
| 75 Years and over | 973 (7.4%) | 2,139 (10.7%) |
Disability Class: Cognitive Difficulty
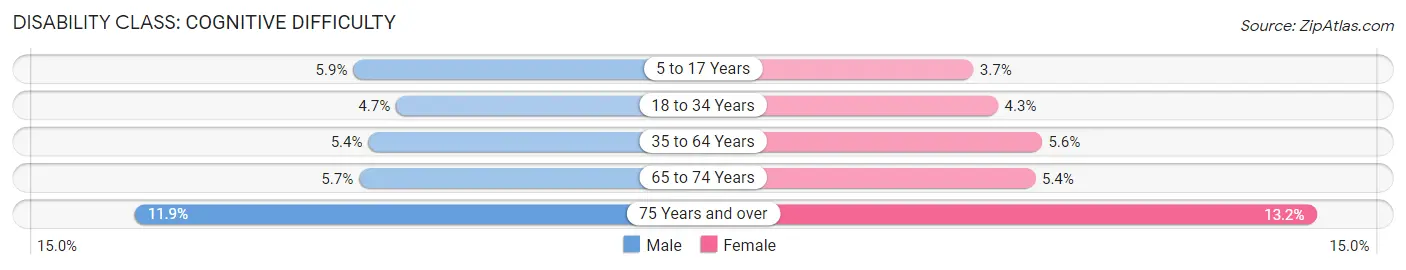
| Age Bracket | Male | Female |
| 5 to 17 Years | 3,742 (5.9%) | 2,194 (3.6%) |
| 18 to 34 Years | 3,817 (4.7%) | 3,642 (4.3%) |
| 35 to 64 Years | 6,619 (5.4%) | 6,946 (5.6%) |
| 65 to 74 Years | 1,431 (5.7%) | 1,553 (5.4%) |
| 75 Years and over | 1,565 (11.9%) | 2,635 (13.2%) |
Disability Class: Ambulatory Difficulty
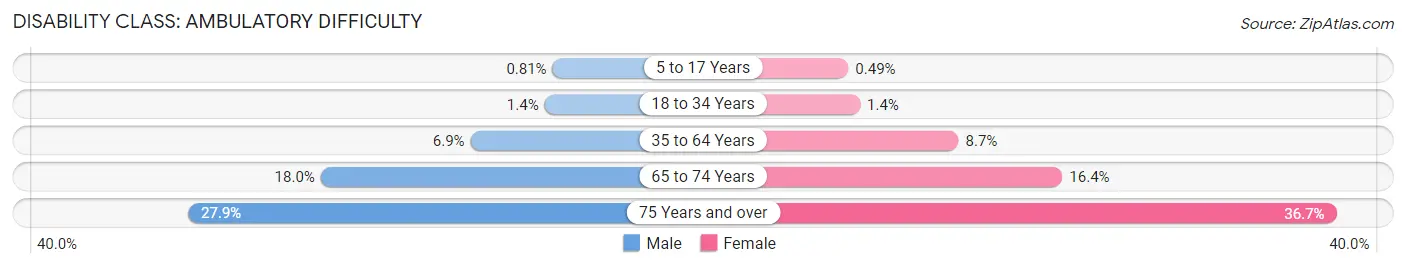
| Age Bracket | Male | Female |
| 5 to 17 Years | 521 (0.8%) | 292 (0.5%) |
| 18 to 34 Years | 1,149 (1.4%) | 1,139 (1.4%) |
| 35 to 64 Years | 8,416 (6.9%) | 10,843 (8.7%) |
| 65 to 74 Years | 4,529 (18.0%) | 4,731 (16.4%) |
| 75 Years and over | 3,655 (27.9%) | 7,326 (36.7%) |
Disability Class: Self-Care Difficulty
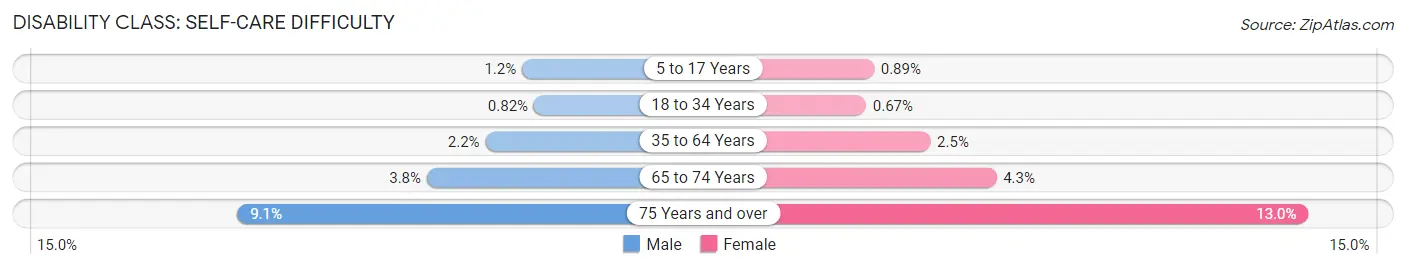
| Age Bracket | Male | Female |
| 5 to 17 Years | 737 (1.1%) | 538 (0.9%) |
| 18 to 34 Years | 673 (0.8%) | 559 (0.7%) |
| 35 to 64 Years | 2,641 (2.2%) | 3,074 (2.5%) |
| 65 to 74 Years | 956 (3.8%) | 1,242 (4.3%) |
| 75 Years and over | 1,191 (9.1%) | 2,591 (13.0%) |
Technology Access in Oklahoma City
Computing Device Access in Oklahoma City
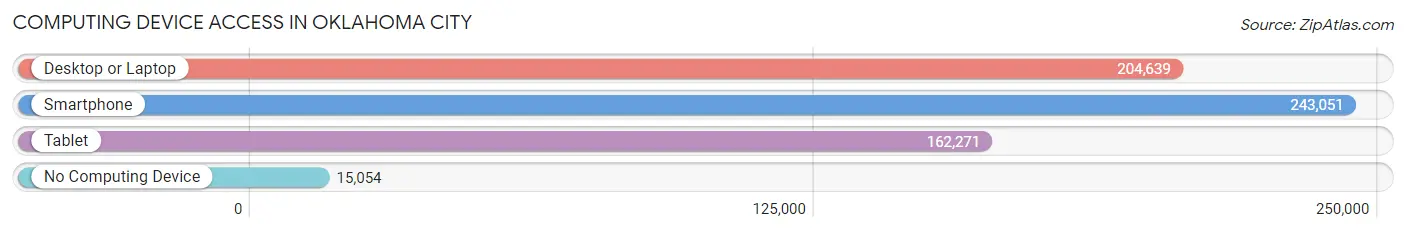
| Device Type | # Households | % Households |
| Desktop or Laptop | 204,639 | 75.8% |
| Smartphone | 243,051 | 90.0% |
| Tablet | 162,271 | 60.1% |
| No Computing Device | 15,054 | 5.6% |
| Total | 270,070 | 100.0% |
Internet Access in Oklahoma City
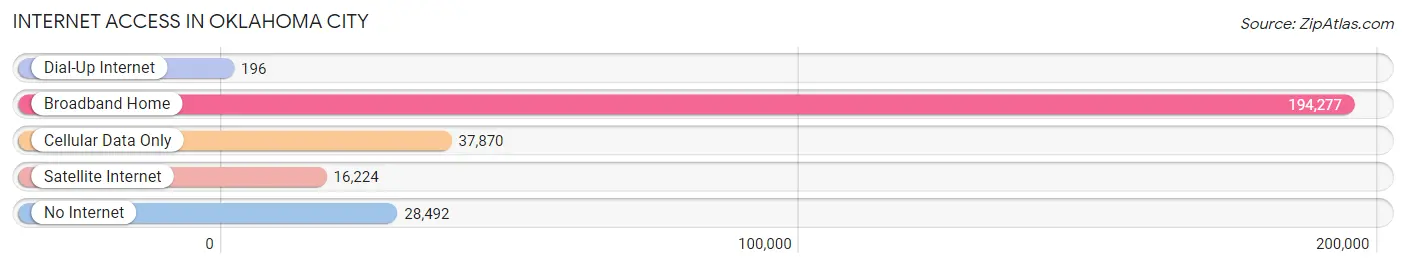
| Internet Type | # Households | % Households |
| Dial-Up Internet | 196 | 0.1% |
| Broadband Home | 194,277 | 71.9% |
| Cellular Data Only | 37,870 | 14.0% |
| Satellite Internet | 16,224 | 6.0% |
| No Internet | 28,492 | 10.5% |
| Total | 270,070 | 100.0% |
Oklahoma City Summary
Oklahoma City is the capital and largest city in the state of Oklahoma. It is located in the central part of the state, along the North Canadian River. The city is the county seat of Oklahoma County and is the principal city of the Oklahoma City metropolitan area, which is the largest metropolitan area in the state. As of 2019, the population of Oklahoma City was 649,021, making it the 8th largest city in the United States.
History
The area that is now Oklahoma City was first settled by Native American tribes in the late 1700s. The area was part of the Louisiana Purchase in 1803, and was part of the Indian Territory until 1907, when it became part of the newly formed state of Oklahoma. The city was founded in 1889, when the Unassigned Lands were opened for settlement. The city was named after the Choctaw words okla and humma, meaning "red people."
The city grew rapidly in the early 20th century, and by the 1920s it was the largest city in the state. During the Great Depression, the city was hit hard, but it recovered quickly and continued to grow. During World War II, the city was a major center for the war effort, and it continued to grow after the war.
In 1995, the city was hit by the worst terrorist attack in U.S. history, when a truck bomb exploded outside the Alfred P. Murrah Federal Building, killing 168 people and injuring hundreds more. The city has since recovered from the attack, and has continued to grow and develop.
Geography
Oklahoma City is located in the central part of the state, along the North Canadian River. The city is situated in the Great Plains region of the United States, and is part of the Tornado Alley region. The city has a total area of 607.3 square miles, of which 599.3 square miles is land and 8.0 square miles is water.
The city is located in a humid subtropical climate zone, with hot, humid summers and mild winters. The average annual temperature is 61.2°F, and the average annual precipitation is 35.2 inches.
Economy
Oklahoma City is a major economic center in the state, and is home to a variety of industries. The city is a major center for the oil and gas industry, and is also home to a large number of manufacturing and technology companies. The city is also a major center for the aerospace industry, and is home to Tinker Air Force Base.
The city is also a major center for the healthcare industry, and is home to several major hospitals and medical centers. The city is also a major center for the finance and banking industry, and is home to several major banks and financial institutions.
Demographics
As of 2019, the population of Oklahoma City was 649,021, making it the 8th largest city in the United States. The city has a population density of 1,072 people per square mile. The racial makeup of the city is 63.2% White, 25.2% African American, 5.3% Hispanic or Latino, 3.2% Asian, and 3.1% other.
The median household income in the city is $50,821, and the median family income is $62,845. The per capita income in the city is $27,845. The poverty rate in the city is 17.3%.
Conclusion
Oklahoma City is the capital and largest city in the state of Oklahoma. It is located in the central part of the state, along the North Canadian River. The city is the county seat of Oklahoma County and is the principal city of the Oklahoma City metropolitan area, which is the largest metropolitan area in the state. The city has a long and rich history, and has grown and developed over the years. The city is a major economic center in the state, and is home to a variety of industries. The population of the city is 649,021, and the city has a population density of 1,072 people per square mile. The median household income in the city is $50,821, and the poverty rate is 17.3%.
Common Questions
What is Per Capita Income in Oklahoma City?
Per Capita income in Oklahoma City is $35,954.
What is the Median Family Income in Oklahoma City?
Median Family Income in Oklahoma City is $79,514.
What is the Median Household income in Oklahoma City?
Median Household Income in Oklahoma City is $64,251.
What is Income or Wage Gap in Oklahoma City?
Income or Wage Gap in Oklahoma City is 27.5%.
Women in Oklahoma City earn 72.5 cents for every dollar earned by a man.
What is Family Income Deficit in Oklahoma City?
Family Income Deficit in Oklahoma City is $11,430.
Families that are below poverty line in Oklahoma City earn $11,430 less on average than the poverty threshold level.
What is Inequality or Gini Index in Oklahoma City?
Inequality or Gini Index in Oklahoma City is 0.47.
What is the Total Population of Oklahoma City?
Total Population of Oklahoma City is 681,088.
What is the Total Male Population of Oklahoma City?
Total Male Population of Oklahoma City is 337,235.
What is the Total Female Population of Oklahoma City?
Total Female Population of Oklahoma City is 343,853.
What is the Ratio of Males per 100 Females in Oklahoma City?
There are 98.08 Males per 100 Females in Oklahoma City.
What is the Ratio of Females per 100 Males in Oklahoma City?
There are 101.96 Females per 100 Males in Oklahoma City.
What is the Median Population Age in Oklahoma City?
Median Population Age in Oklahoma City is 34.9 Years.
What is the Average Family Size in Oklahoma City
Average Family Size in Oklahoma City is 3.2 People.
What is the Average Household Size in Oklahoma City
Average Household Size in Oklahoma City is 2.5 People.
How Large is the Labor Force in Oklahoma City?
There are 357,126 People in the Labor Forcein in Oklahoma City.
What is the Percentage of People in the Labor Force in Oklahoma City?
67.4% of People are in the Labor Force in Oklahoma City.
What is the Unemployment Rate in Oklahoma City?
Unemployment Rate in Oklahoma City is 4.5%.