Central Falls, RI Map & Demographics
Central Falls Map
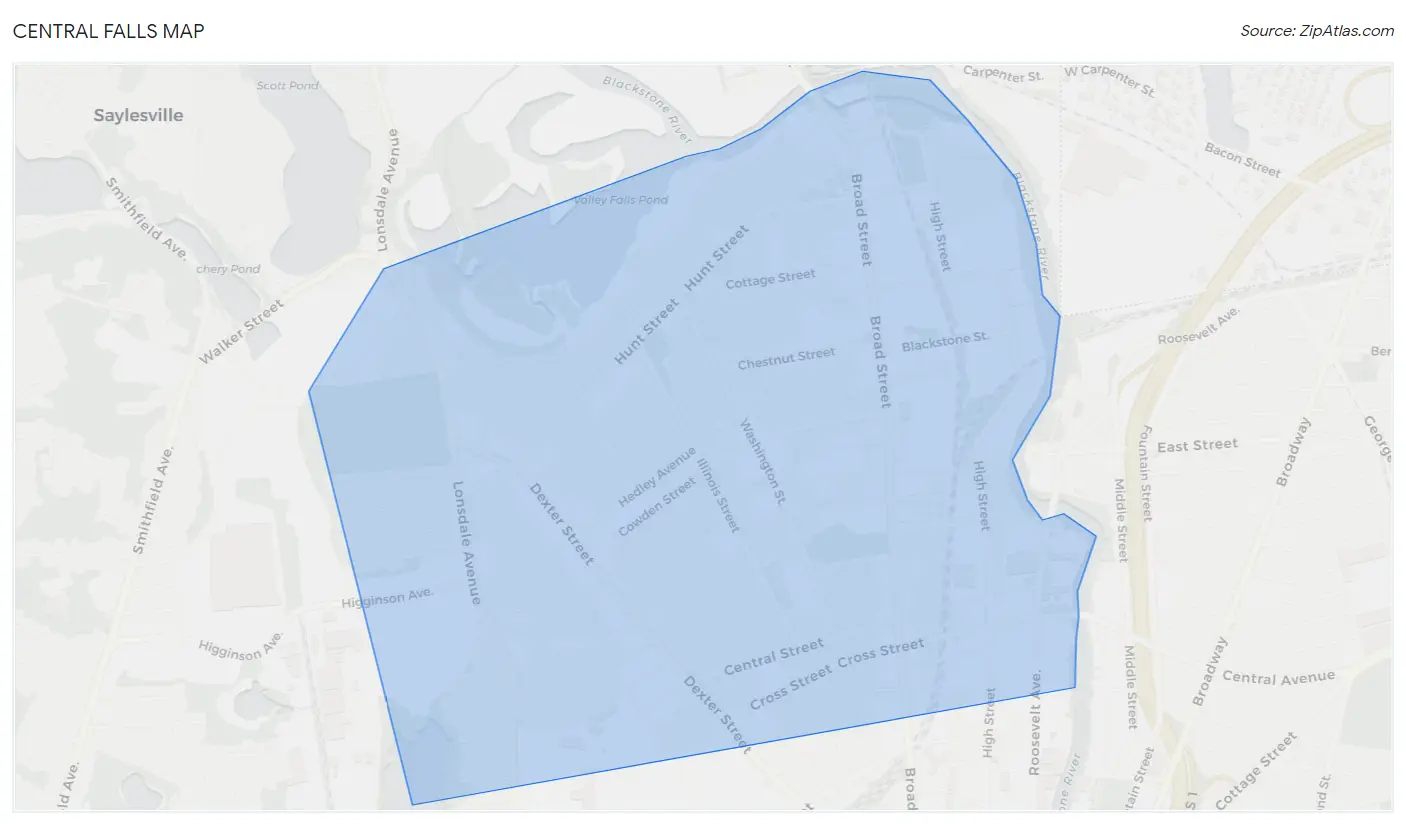
Central Falls Overview
$19,552
PER CAPITA INCOME
$47,716
AVG FAMILY INCOME
$43,092
AVG HOUSEHOLD INCOME
26.1%
WAGE / INCOME GAP [ % ]
73.9¢/ $1
WAGE / INCOME GAP [ $ ]
$9,470
FAMILY INCOME DEFICIT
0.42
INEQUALITY / GINI INDEX
22,359
TOTAL POPULATION
11,847
MALE POPULATION
10,512
FEMALE POPULATION
112.70
MALES / 100 FEMALES
88.73
FEMALES / 100 MALES
31.5
MEDIAN AGE
3.5
AVG FAMILY SIZE
3.0
AVG HOUSEHOLD SIZE
10,533
LABOR FORCE [ PEOPLE ]
62.0%
PERCENT IN LABOR FORCE
8.3%
UNEMPLOYMENT RATE
Central Falls Zip Codes
Central Falls Area Codes
Income in Central Falls
Income Overview in Central Falls
Per Capita Income in Central Falls is $19,552, while median incomes of families and households are $47,716 and $43,092 respectively.
| Characteristic | Number | Measure |
| Per Capita Income | 22,359 | $19,552 |
| Median Family Income | 5,094 | $47,716 |
| Mean Family Income | 5,094 | $59,945 |
| Median Household Income | 7,358 | $43,092 |
| Mean Household Income | 7,358 | $54,340 |
| Income Deficit | 5,094 | $9,470 |
| Wage / Income Gap (%) | 22,359 | 26.05% |
| Wage / Income Gap ($) | 22,359 | 73.95¢ per $1 |
| Gini / Inequality Index | 22,359 | 0.42 |
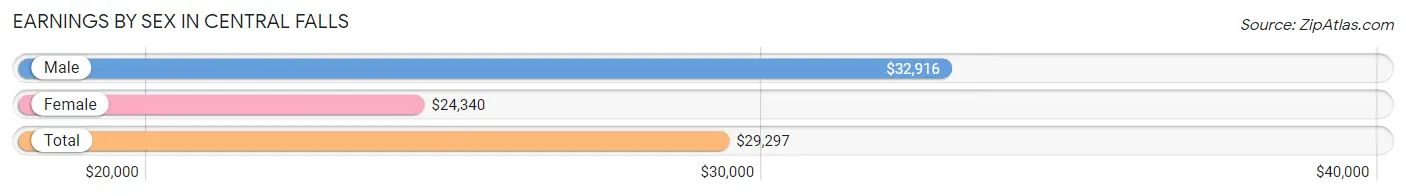
Earnings by Sex in Central Falls
Average Earnings in Central Falls are $29,297, $32,916 for men and $24,340 for women, a difference of 26.1%.
| Sex | Number | Average Earnings |
| Male | 6,108 (55.4%) | $32,916 |
| Female | 4,910 (44.6%) | $24,340 |
| Total | 11,018 (100.0%) | $29,297 |
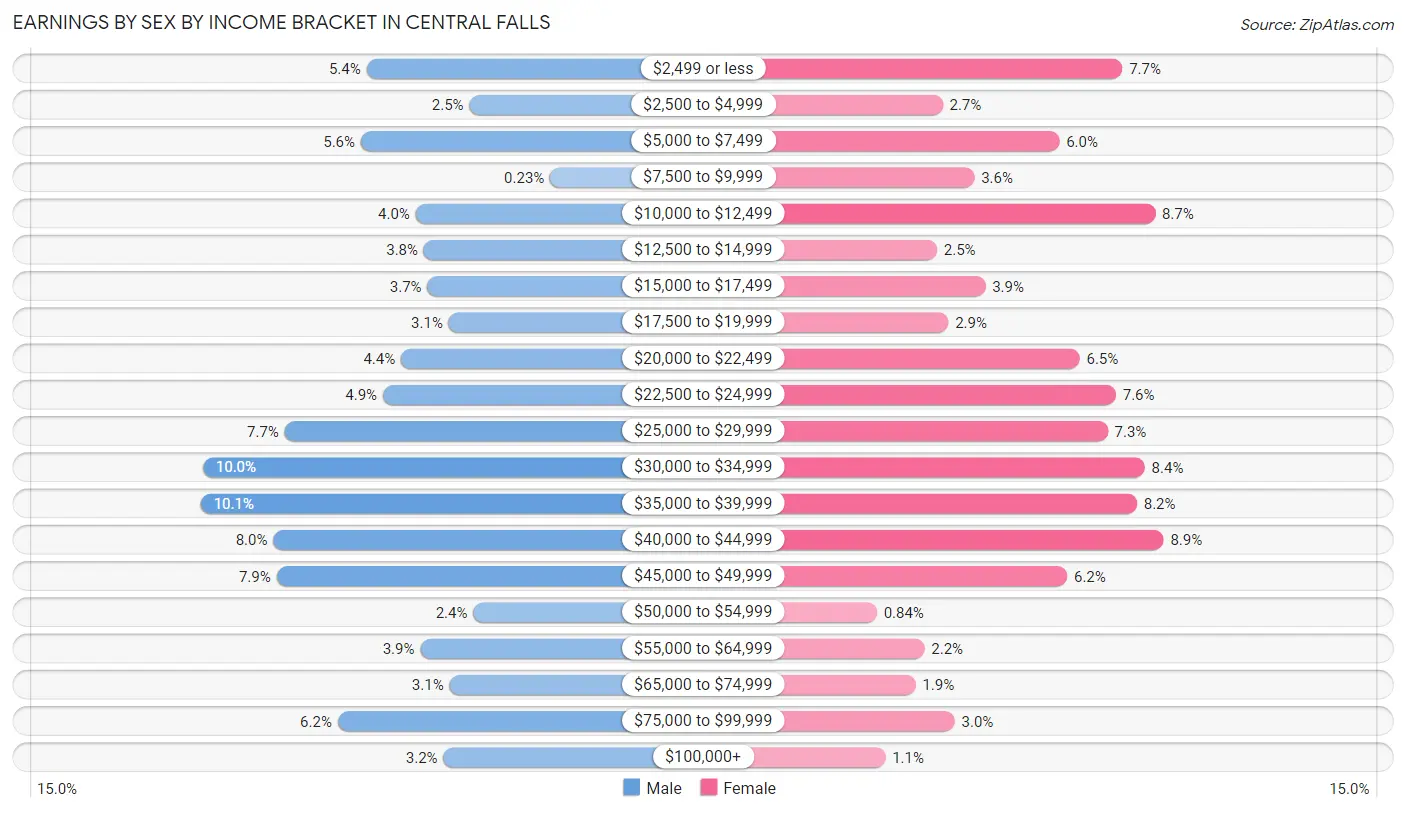
Earnings by Sex by Income Bracket in Central Falls
The most common earnings brackets in Central Falls are $35,000 to $39,999 for men (614 | 10.1%) and $40,000 to $44,999 for women (437 | 8.9%).
| Income | Male | Female |
| $2,499 or less | 329 (5.4%) | 380 (7.7%) |
| $2,500 to $4,999 | 153 (2.5%) | 132 (2.7%) |
| $5,000 to $7,499 | 339 (5.6%) | 293 (6.0%) |
| $7,500 to $9,999 | 14 (0.2%) | 176 (3.6%) |
| $10,000 to $12,499 | 245 (4.0%) | 425 (8.7%) |
| $12,500 to $14,999 | 231 (3.8%) | 124 (2.5%) |
| $15,000 to $17,499 | 225 (3.7%) | 191 (3.9%) |
| $17,500 to $19,999 | 188 (3.1%) | 140 (2.9%) |
| $20,000 to $22,499 | 270 (4.4%) | 321 (6.5%) |
| $22,500 to $24,999 | 301 (4.9%) | 371 (7.6%) |
| $25,000 to $29,999 | 470 (7.7%) | 360 (7.3%) |
| $30,000 to $34,999 | 610 (10.0%) | 411 (8.4%) |
| $35,000 to $39,999 | 614 (10.1%) | 400 (8.2%) |
| $40,000 to $44,999 | 489 (8.0%) | 437 (8.9%) |
| $45,000 to $49,999 | 484 (7.9%) | 304 (6.2%) |
| $50,000 to $54,999 | 146 (2.4%) | 41 (0.8%) |
| $55,000 to $64,999 | 237 (3.9%) | 107 (2.2%) |
| $65,000 to $74,999 | 187 (3.1%) | 95 (1.9%) |
| $75,000 to $99,999 | 379 (6.2%) | 149 (3.0%) |
| $100,000+ | 197 (3.2%) | 53 (1.1%) |
| Total | 6,108 (100.0%) | 4,910 (100.0%) |
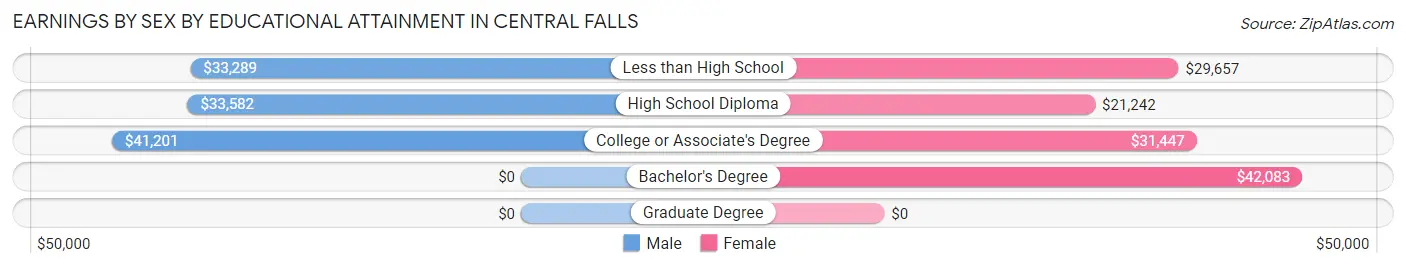
Earnings by Sex by Educational Attainment in Central Falls
Average earnings in Central Falls are $36,701 for men and $28,596 for women, a difference of 22.1%. Men with an educational attainment of college or associate's degree enjoy the highest average annual earnings of $41,201, while those with less than high school education earn the least with $33,289. Women with an educational attainment of bachelor's degree earn the most with the average annual earnings of $42,083, while those with high school diploma education have the smallest earnings of $21,242.
| Educational Attainment | Male Income | Female Income |
| Less than High School | $33,289 | $29,657 |
| High School Diploma | $33,582 | $21,242 |
| College or Associate's Degree | $41,201 | $31,447 |
| Bachelor's Degree | - | - |
| Graduate Degree | - | - |
| Total | $36,701 | $28,596 |
Family Income in Central Falls
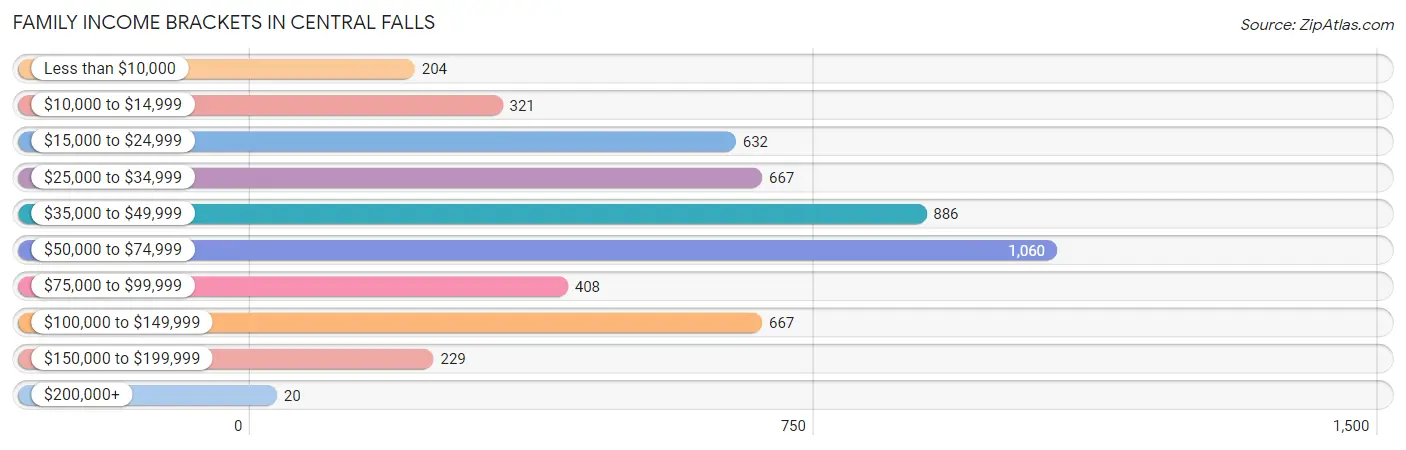
Family Income Brackets in Central Falls
According to the Central Falls family income data, there are 1,060 families falling into the $50,000 to $74,999 income range, which is the most common income bracket and makes up 20.8% of all families. Conversely, the $200,000+ income bracket is the least frequent group with only 20 families (0.4%) belonging to this category.
| Income Bracket | # Families | % Families |
| Less than $10,000 | 204 | 4.0% |
| $10,000 to $14,999 | 321 | 6.3% |
| $15,000 to $24,999 | 632 | 12.4% |
| $25,000 to $34,999 | 667 | 13.1% |
| $35,000 to $49,999 | 886 | 17.4% |
| $50,000 to $74,999 | 1,060 | 20.8% |
| $75,000 to $99,999 | 408 | 8.0% |
| $100,000 to $149,999 | 667 | 13.1% |
| $150,000 to $199,999 | 229 | 4.5% |
| $200,000+ | 20 | 0.4% |
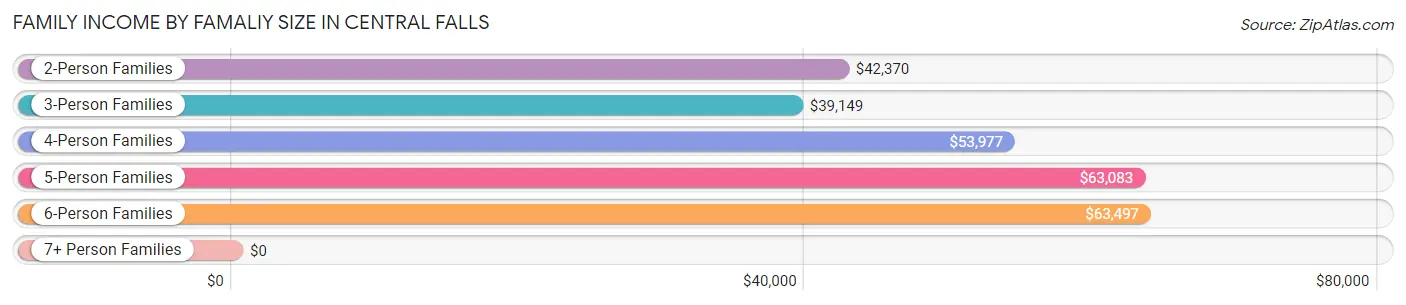
Family Income by Famaliy Size in Central Falls
6-person families (389 | 7.6%) account for the highest median family income in Central Falls with $63,497 per family, while 2-person families (2,019 | 39.6%) have the highest median income of $21,185 per family member.
| Income Bracket | # Families | Median Income |
| 2-Person Families | 2,019 (39.6%) | $42,370 |
| 3-Person Families | 1,100 (21.6%) | $39,149 |
| 4-Person Families | 910 (17.9%) | $53,977 |
| 5-Person Families | 622 (12.2%) | $63,083 |
| 6-Person Families | 389 (7.6%) | $63,497 |
| 7+ Person Families | 54 (1.1%) | $0 |
| Total | 5,094 (100.0%) | $47,716 |
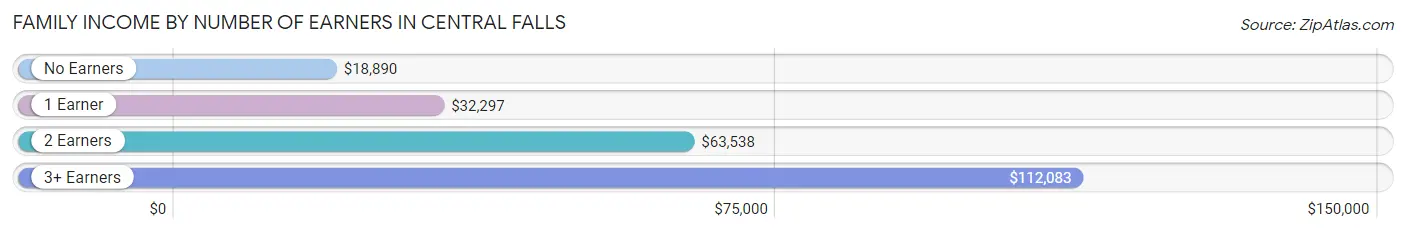
Family Income by Number of Earners in Central Falls
The median family income in Central Falls is $47,716, with families comprising 3+ earners (861) having the highest median family income of $112,083, while families with no earners (771) have the lowest median family income of $18,890, accounting for 16.9% and 15.1% of families, respectively.
| Number of Earners | # Families | Median Income |
| No Earners | 771 (15.1%) | $18,890 |
| 1 Earner | 1,902 (37.3%) | $32,297 |
| 2 Earners | 1,560 (30.6%) | $63,538 |
| 3+ Earners | 861 (16.9%) | $112,083 |
| Total | 5,094 (100.0%) | $47,716 |
Household Income in Central Falls
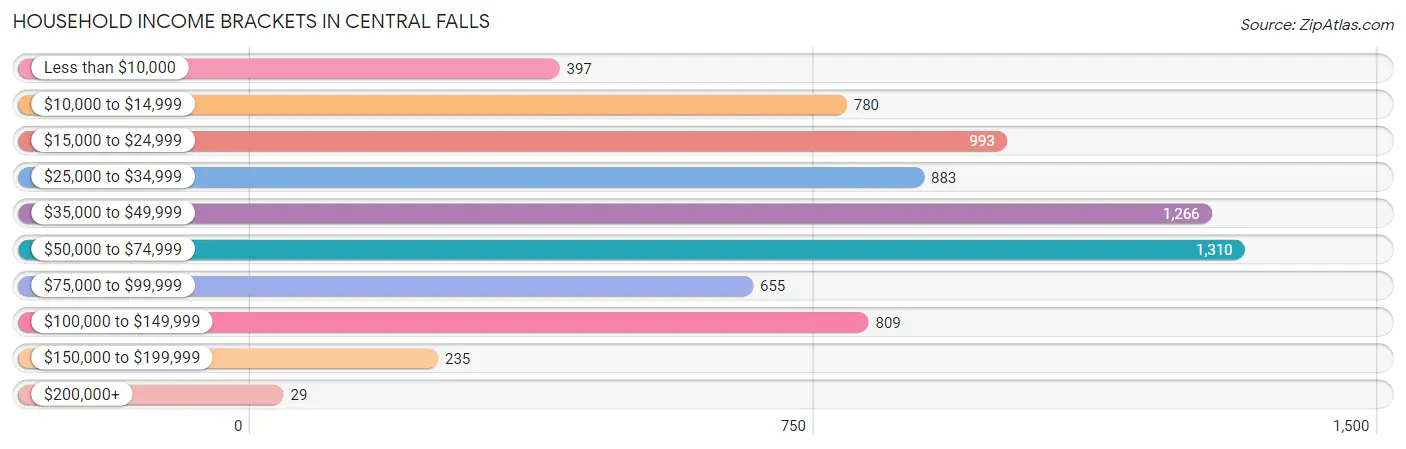
Household Income Brackets in Central Falls
With 1,310 households falling in the category, the $50,000 to $74,999 income range is the most frequent in Central Falls, accounting for 17.8% of all households. In contrast, only 29 households (0.4%) fall into the $200,000+ income bracket, making it the least populous group.
| Income Bracket | # Households | % Households |
| Less than $10,000 | 397 | 5.4% |
| $10,000 to $14,999 | 780 | 10.6% |
| $15,000 to $24,999 | 993 | 13.5% |
| $25,000 to $34,999 | 883 | 12.0% |
| $35,000 to $49,999 | 1,266 | 17.2% |
| $50,000 to $74,999 | 1,310 | 17.8% |
| $75,000 to $99,999 | 655 | 8.9% |
| $100,000 to $149,999 | 809 | 11.0% |
| $150,000 to $199,999 | 235 | 3.2% |
| $200,000+ | 29 | 0.4% |
Household Income by Householder Age in Central Falls
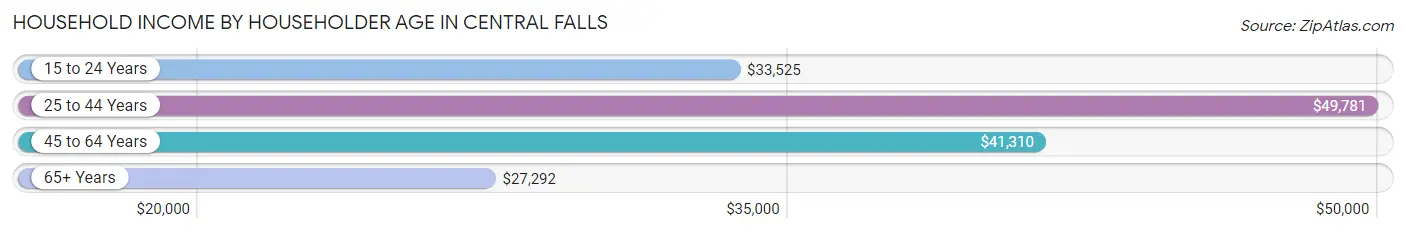
The median household income in Central Falls is $43,092, with the highest median household income of $49,781 found in the 25 to 44 years age bracket for the primary householder. A total of 3,045 households (41.4%) fall into this category. Meanwhile, the 65+ years age bracket for the primary householder has the lowest median household income of $27,292, with 1,109 households (15.1%) in this group.
| Income Bracket | # Households | Median Income |
| 15 to 24 Years | 299 (4.1%) | $33,525 |
| 25 to 44 Years | 3,045 (41.4%) | $49,781 |
| 45 to 64 Years | 2,905 (39.5%) | $41,310 |
| 65+ Years | 1,109 (15.1%) | $27,292 |
| Total | 7,358 (100.0%) | $43,092 |
Poverty in Central Falls
Income Below Poverty by Sex and Age in Central Falls
With 21.8% poverty level for males and 27.3% for females among the residents of Central Falls, 15 year old males and 45 to 54 year old females are the most vulnerable to poverty, with 55 males (40.7%) and 562 females (41.6%) in their respective age groups living below the poverty level.
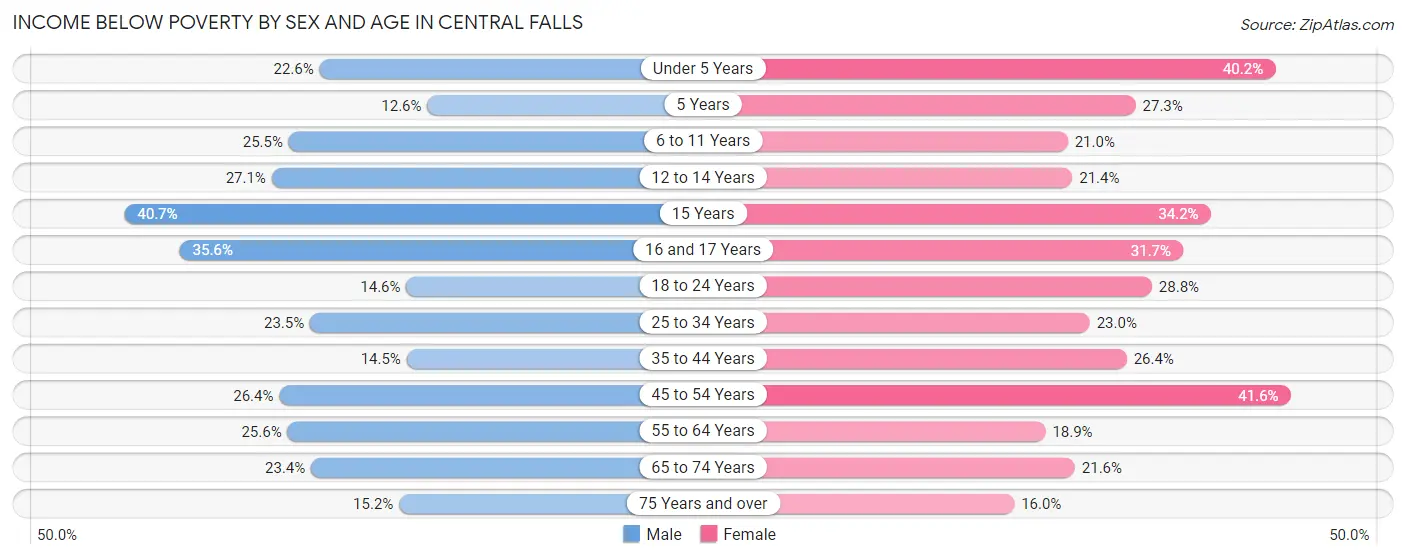
| Age Bracket | Male | Female |
| Under 5 Years | 220 (22.6%) | 363 (40.2%) |
| 5 Years | 13 (12.6%) | 45 (27.3%) |
| 6 to 11 Years | 306 (25.5%) | 138 (21.0%) |
| 12 to 14 Years | 147 (27.1%) | 123 (21.4%) |
| 15 Years | 55 (40.7%) | 26 (34.2%) |
| 16 and 17 Years | 120 (35.6%) | 188 (31.7%) |
| 18 to 24 Years | 199 (14.6%) | 221 (28.8%) |
| 25 to 34 Years | 459 (23.5%) | 396 (23.0%) |
| 35 to 44 Years | 288 (14.5%) | 325 (26.4%) |
| 45 to 54 Years | 243 (26.4%) | 562 (41.6%) |
| 55 to 64 Years | 257 (25.6%) | 251 (18.9%) |
| 65 to 74 Years | 107 (23.4%) | 149 (21.6%) |
| 75 Years and over | 55 (15.2%) | 56 (16.0%) |
| Total | 2,469 (21.8%) | 2,843 (27.3%) |
Income Above Poverty by Sex and Age in Central Falls
According to the poverty statistics in Central Falls, males aged 5 years and females aged 75 years and over are the age groups that are most secure financially, with 87.4% of males and 84.0% of females in these age groups living above the poverty line.
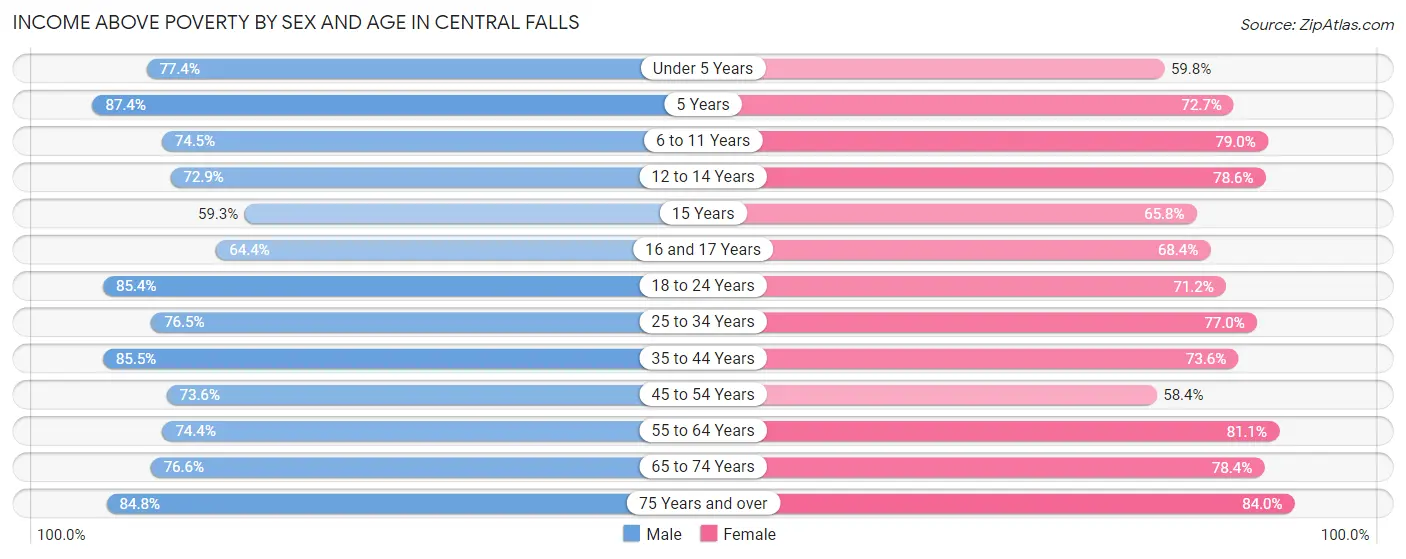
| Age Bracket | Male | Female |
| Under 5 Years | 752 (77.4%) | 540 (59.8%) |
| 5 Years | 90 (87.4%) | 120 (72.7%) |
| 6 to 11 Years | 895 (74.5%) | 520 (79.0%) |
| 12 to 14 Years | 396 (72.9%) | 452 (78.6%) |
| 15 Years | 80 (59.3%) | 50 (65.8%) |
| 16 and 17 Years | 217 (64.4%) | 406 (68.3%) |
| 18 to 24 Years | 1,167 (85.4%) | 547 (71.2%) |
| 25 to 34 Years | 1,493 (76.5%) | 1,325 (77.0%) |
| 35 to 44 Years | 1,693 (85.5%) | 904 (73.6%) |
| 45 to 54 Years | 679 (73.6%) | 788 (58.4%) |
| 55 to 64 Years | 747 (74.4%) | 1,077 (81.1%) |
| 65 to 74 Years | 350 (76.6%) | 540 (78.4%) |
| 75 Years and over | 306 (84.8%) | 294 (84.0%) |
| Total | 8,865 (78.2%) | 7,563 (72.7%) |
Income Below Poverty Among Married-Couple Families in Central Falls
The poverty statistics for married-couple families in Central Falls show that 12.1% or 344 of the total 2,853 families live below the poverty line. Families with 3 or 4 children have the highest poverty rate of 13.3%, comprising of 79 families. On the other hand, families with no children have the lowest poverty rate of 11.3%, which includes 140 families.
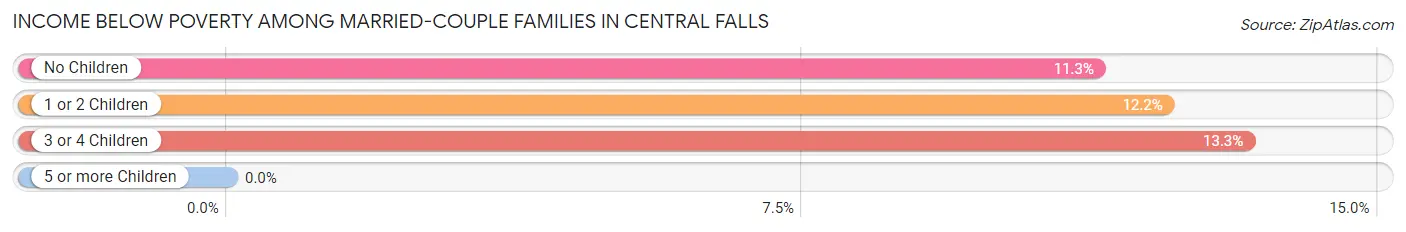
| Children | Above Poverty | Below Poverty |
| No Children | 1,096 (88.7%) | 140 (11.3%) |
| 1 or 2 Children | 897 (87.8%) | 125 (12.2%) |
| 3 or 4 Children | 516 (86.7%) | 79 (13.3%) |
| 5 or more Children | 0 (0.0%) | 0 (0.0%) |
| Total | 2,509 (87.9%) | 344 (12.1%) |
Income Below Poverty Among Single-Parent Households in Central Falls
According to the poverty data in Central Falls, 14.4% or 106 single-father households and 39.3% or 591 single-mother households are living below the poverty line. Among single-father households, those with 1 or 2 children have the highest poverty rate, with 64 households (18.0%) experiencing poverty. Likewise, among single-mother households, those with 3 or 4 children have the highest poverty rate, with 67 households (100.0%) falling below the poverty line.
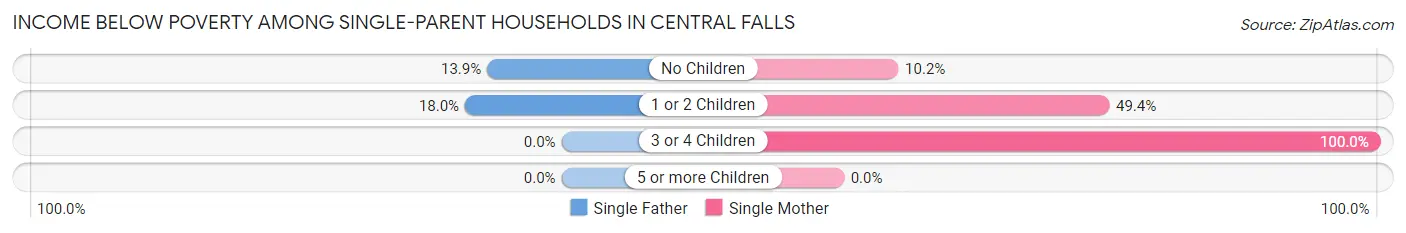
| Children | Single Father | Single Mother |
| No Children | 42 (13.9%) | 48 (10.2%) |
| 1 or 2 Children | 64 (18.0%) | 476 (49.4%) |
| 3 or 4 Children | 0 (0.0%) | 67 (100.0%) |
| 5 or more Children | 0 (0.0%) | 0 (0.0%) |
| Total | 106 (14.4%) | 591 (39.3%) |
Income Below Poverty Among Married-Couple vs Single-Parent Households in Central Falls
The poverty data for Central Falls shows that 344 of the married-couple family households (12.1%) and 697 of the single-parent households (31.1%) are living below the poverty level. Within the married-couple family households, those with 3 or 4 children have the highest poverty rate, with 79 households (13.3%) falling below the poverty line. Among the single-parent households, those with 3 or 4 children have the highest poverty rate, with 67 household (45.9%) living below poverty.
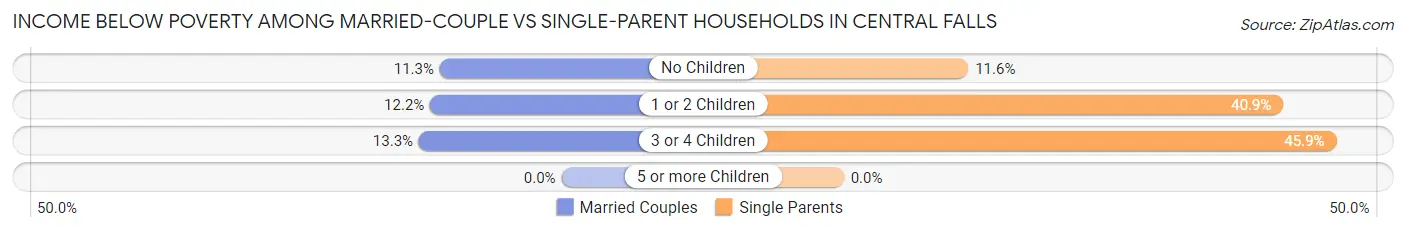
| Children | Married-Couple Families | Single-Parent Households |
| No Children | 140 (11.3%) | 90 (11.6%) |
| 1 or 2 Children | 125 (12.2%) | 540 (40.9%) |
| 3 or 4 Children | 79 (13.3%) | 67 (45.9%) |
| 5 or more Children | 0 (0.0%) | 0 (0.0%) |
| Total | 344 (12.1%) | 697 (31.1%) |
Race in Central Falls
The most populous races in Central Falls are Hispanic or Latino (15,447 | 69.1%), Some other Race (9,071 | 40.6%), and White / Caucasian (7,170 | 32.1%).
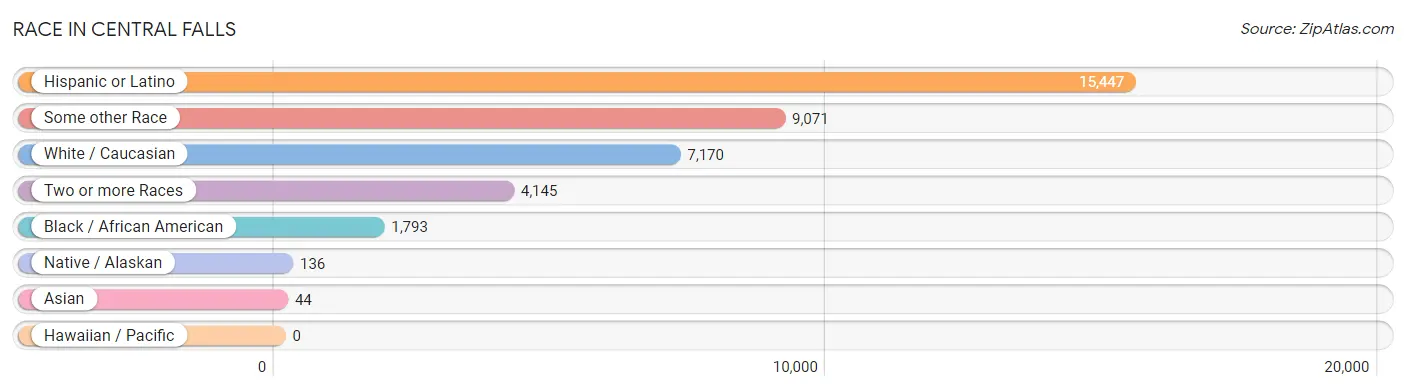
| Race | # Population | % Population |
| Asian | 44 | 0.2% |
| Black / African American | 1,793 | 8.0% |
| Hawaiian / Pacific | 0 | 0.0% |
| Hispanic or Latino | 15,447 | 69.1% |
| Native / Alaskan | 136 | 0.6% |
| White / Caucasian | 7,170 | 32.1% |
| Two or more Races | 4,145 | 18.5% |
| Some other Race | 9,071 | 40.6% |
| Total | 22,359 | 100.0% |
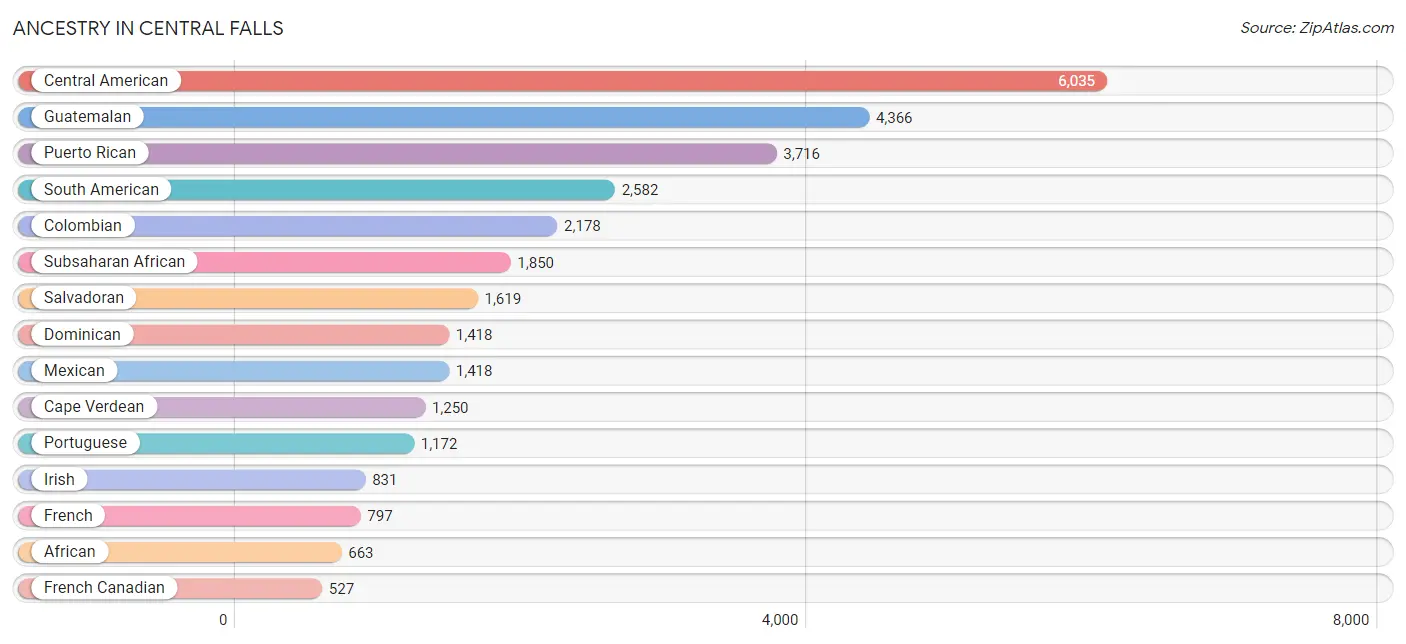
Ancestry in Central Falls
The most populous ancestries reported in Central Falls are Central American (6,035 | 27.0%), Guatemalan (4,366 | 19.5%), Puerto Rican (3,716 | 16.6%), South American (2,582 | 11.6%), and Colombian (2,178 | 9.7%), together accounting for 84.4% of all Central Falls residents.
| Ancestry | # Population | % Population |
| African | 663 | 3.0% |
| American | 416 | 1.9% |
| Arab | 171 | 0.8% |
| Armenian | 3 | 0.0% |
| Bhutanese | 35 | 0.2% |
| Blackfeet | 21 | 0.1% |
| Brazilian | 19 | 0.1% |
| British | 19 | 0.1% |
| Burmese | 14 | 0.1% |
| Canadian | 57 | 0.3% |
| Cape Verdean | 1,250 | 5.6% |
| Central American | 6,035 | 27.0% |
| Central American Indian | 147 | 0.7% |
| Colombian | 2,178 | 9.7% |
| Cuban | 10 | 0.0% |
| Danish | 20 | 0.1% |
| Dominican | 1,418 | 6.3% |
| Ecuadorian | 156 | 0.7% |
| English | 407 | 1.8% |
| European | 14 | 0.1% |
| French | 797 | 3.6% |
| French Canadian | 527 | 2.4% |
| German | 105 | 0.5% |
| Guatemalan | 4,366 | 19.5% |
| Haitian | 64 | 0.3% |
| Honduran | 35 | 0.2% |
| Hungarian | 50 | 0.2% |
| Indian (Asian) | 8 | 0.0% |
| Irish | 831 | 3.7% |
| Italian | 527 | 2.4% |
| Jamaican | 253 | 1.1% |
| Lebanese | 35 | 0.2% |
| Lithuanian | 30 | 0.1% |
| Mexican | 1,418 | 6.3% |
| Native Hawaiian | 16 | 0.1% |
| Panamanian | 15 | 0.1% |
| Peruvian | 50 | 0.2% |
| Polish | 293 | 1.3% |
| Portuguese | 1,172 | 5.2% |
| Puerto Rican | 3,716 | 16.6% |
| Russian | 16 | 0.1% |
| Salvadoran | 1,619 | 7.2% |
| Scottish | 59 | 0.3% |
| South American | 2,582 | 11.6% |
| Spaniard | 47 | 0.2% |
| Spanish | 66 | 0.3% |
| Sri Lankan | 8 | 0.0% |
| Subsaharan African | 1,850 | 8.3% |
| Swedish | 198 | 0.9% |
| Syrian | 109 | 0.5% |
| Thai | 22 | 0.1% |
| Ukrainian | 58 | 0.3% |
| Venezuelan | 198 | 0.9% |
| Welsh | 20 | 0.1% | View All 54 Rows |
Immigrants in Central Falls
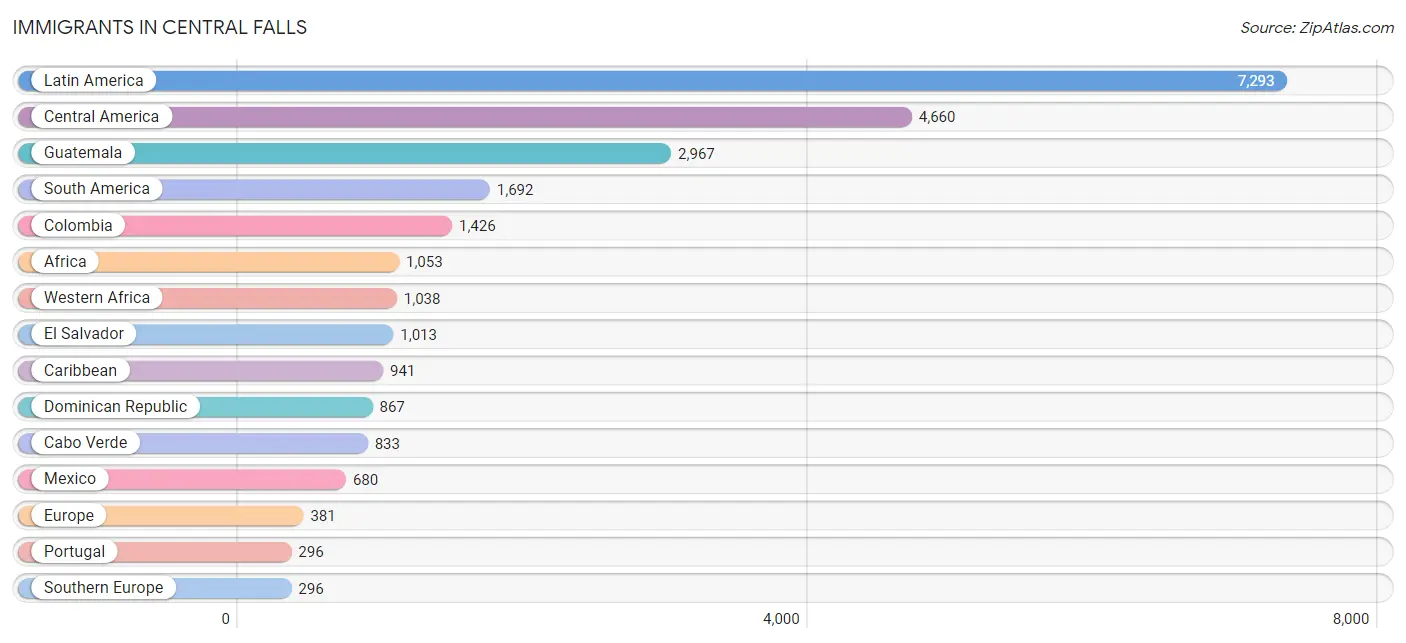
The most numerous immigrant groups reported in Central Falls came from Latin America (7,293 | 32.6%), Central America (4,660 | 20.8%), Guatemala (2,967 | 13.3%), South America (1,692 | 7.6%), and Colombia (1,426 | 6.4%), together accounting for 80.7% of all Central Falls residents.
| Immigration Origin | # Population | % Population |
| Africa | 1,053 | 4.7% |
| Asia | 71 | 0.3% |
| Azores | 81 | 0.4% |
| Brazil | 22 | 0.1% |
| Cabo Verde | 833 | 3.7% |
| Canada | 21 | 0.1% |
| Caribbean | 941 | 4.2% |
| Central America | 4,660 | 20.8% |
| Colombia | 1,426 | 6.4% |
| Cuba | 10 | 0.0% |
| Dominican Republic | 867 | 3.9% |
| Eastern Africa | 15 | 0.1% |
| Eastern Asia | 14 | 0.1% |
| Eastern Europe | 85 | 0.4% |
| Ecuador | 105 | 0.5% |
| El Salvador | 1,013 | 4.5% |
| Europe | 381 | 1.7% |
| Guatemala | 2,967 | 13.3% |
| Guyana | 13 | 0.1% |
| Haiti | 64 | 0.3% |
| India | 22 | 0.1% |
| Japan | 14 | 0.1% |
| Latin America | 7,293 | 32.6% |
| Lebanon | 35 | 0.2% |
| Lithuania | 30 | 0.1% |
| Mexico | 680 | 3.0% |
| Peru | 13 | 0.1% |
| Poland | 55 | 0.3% |
| Portugal | 296 | 1.3% |
| Senegal | 165 | 0.7% |
| South America | 1,692 | 7.6% |
| South Central Asia | 22 | 0.1% |
| Southern Europe | 296 | 1.3% |
| Venezuela | 113 | 0.5% |
| Western Africa | 1,038 | 4.6% |
| Western Asia | 35 | 0.2% | View All 36 Rows |
Sex and Age in Central Falls
Sex and Age in Central Falls
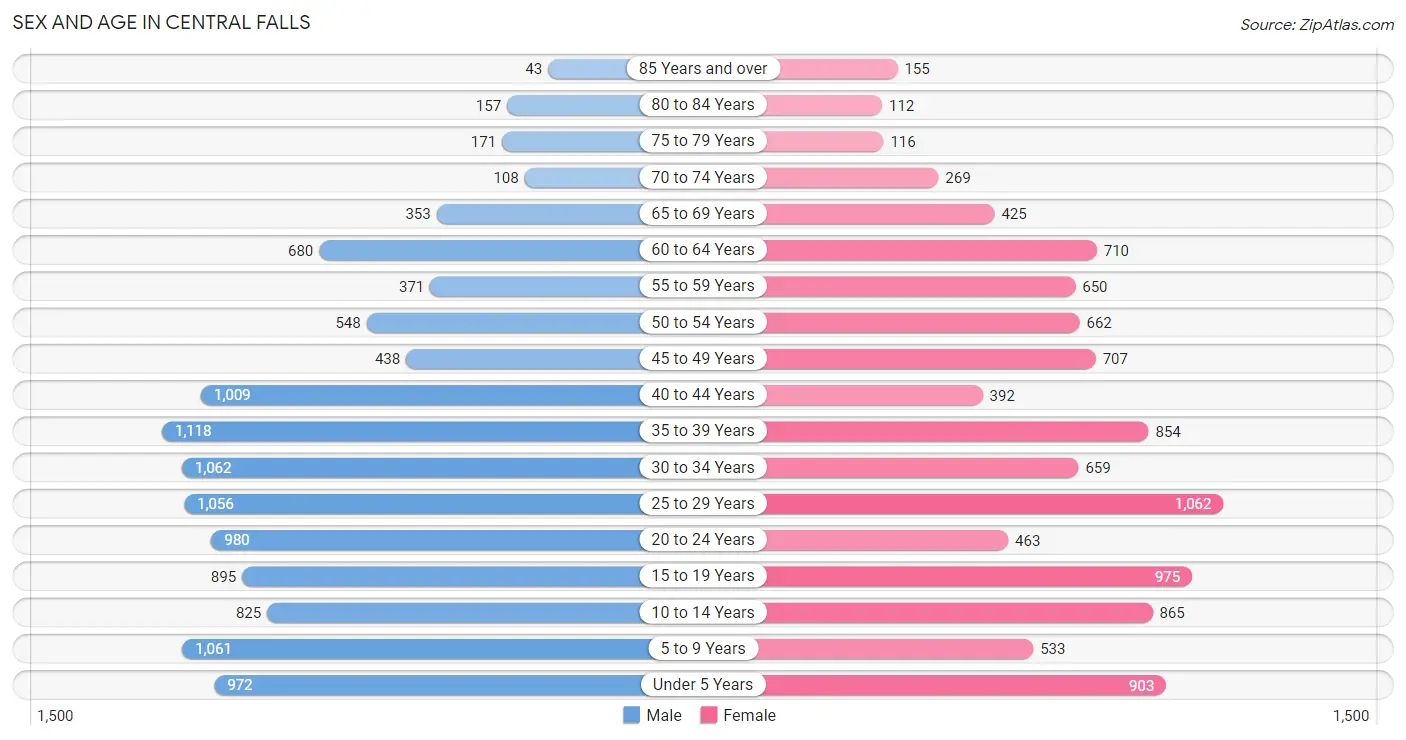
The most populous age groups in Central Falls are 35 to 39 Years (1,118 | 9.4%) for men and 25 to 29 Years (1,062 | 10.1%) for women.
| Age Bracket | Male | Female |
| Under 5 Years | 972 (8.2%) | 903 (8.6%) |
| 5 to 9 Years | 1,061 (9.0%) | 533 (5.1%) |
| 10 to 14 Years | 825 (7.0%) | 865 (8.2%) |
| 15 to 19 Years | 895 (7.5%) | 975 (9.3%) |
| 20 to 24 Years | 980 (8.3%) | 463 (4.4%) |
| 25 to 29 Years | 1,056 (8.9%) | 1,062 (10.1%) |
| 30 to 34 Years | 1,062 (9.0%) | 659 (6.3%) |
| 35 to 39 Years | 1,118 (9.4%) | 854 (8.1%) |
| 40 to 44 Years | 1,009 (8.5%) | 392 (3.7%) |
| 45 to 49 Years | 438 (3.7%) | 707 (6.7%) |
| 50 to 54 Years | 548 (4.6%) | 662 (6.3%) |
| 55 to 59 Years | 371 (3.1%) | 650 (6.2%) |
| 60 to 64 Years | 680 (5.7%) | 710 (6.8%) |
| 65 to 69 Years | 353 (3.0%) | 425 (4.0%) |
| 70 to 74 Years | 108 (0.9%) | 269 (2.6%) |
| 75 to 79 Years | 171 (1.4%) | 116 (1.1%) |
| 80 to 84 Years | 157 (1.3%) | 112 (1.1%) |
| 85 Years and over | 43 (0.4%) | 155 (1.5%) |
| Total | 11,847 (100.0%) | 10,512 (100.0%) |
Families and Households in Central Falls
Median Family Size in Central Falls
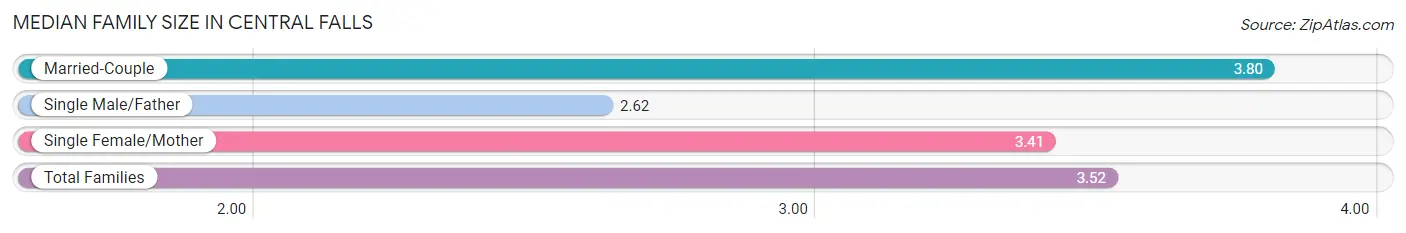
The median family size in Central Falls is 3.52 persons per family, with married-couple families (2,853 | 56.0%) accounting for the largest median family size of 3.8 persons per family. On the other hand, single male/father families (738 | 14.5%) represent the smallest median family size with 2.62 persons per family.
| Family Type | # Families | Family Size |
| Married-Couple | 2,853 (56.0%) | 3.80 |
| Single Male/Father | 738 (14.5%) | 2.62 |
| Single Female/Mother | 1,503 (29.5%) | 3.41 |
| Total Families | 5,094 (100.0%) | 3.52 |
Median Household Size in Central Falls
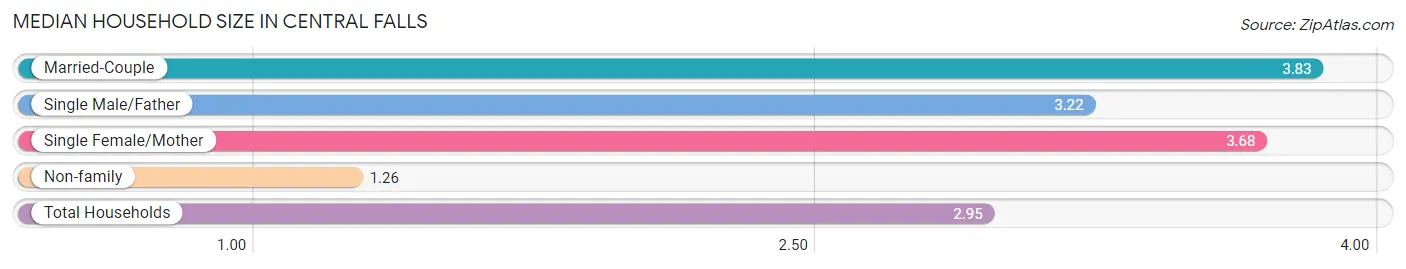
The median household size in Central Falls is 2.95 persons per household, with married-couple households (2,853 | 38.8%) accounting for the largest median household size of 3.83 persons per household. non-family households (2,264 | 30.8%) represent the smallest median household size with 1.26 persons per household.
| Household Type | # Households | Household Size |
| Married-Couple | 2,853 (38.8%) | 3.83 |
| Single Male/Father | 738 (10.0%) | 3.22 |
| Single Female/Mother | 1,503 (20.4%) | 3.68 |
| Non-family | 2,264 (30.8%) | 1.26 |
| Total Households | 7,358 (100.0%) | 2.95 |
Household Size by Marriage Status in Central Falls
Out of a total of 7,358 households in Central Falls, 5,094 (69.2%) are family households, while 2,264 (30.8%) are nonfamily households. The most numerous type of family households are 2-person households, comprising 1,717, and the most common type of nonfamily households are 1-person households, comprising 1,815.
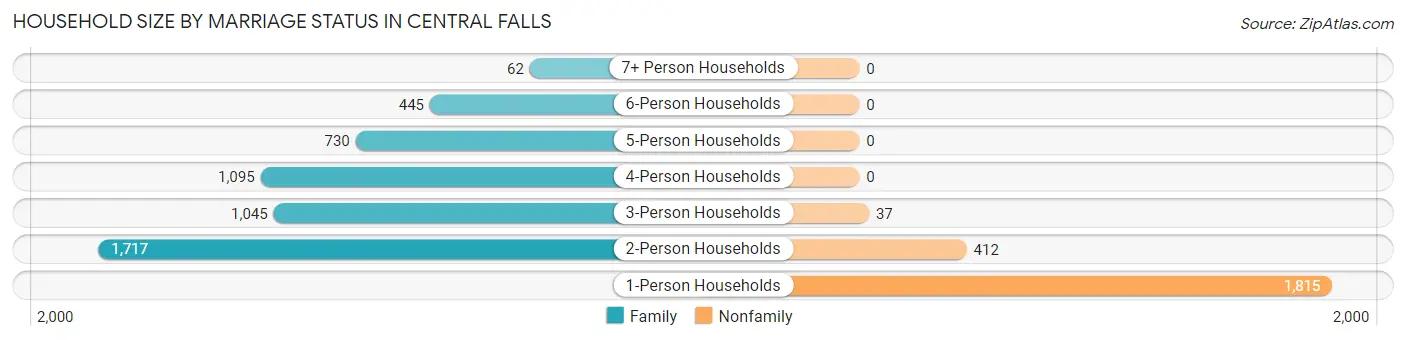
| Household Size | Family Households | Nonfamily Households |
| 1-Person Households | - | 1,815 (24.7%) |
| 2-Person Households | 1,717 (23.3%) | 412 (5.6%) |
| 3-Person Households | 1,045 (14.2%) | 37 (0.5%) |
| 4-Person Households | 1,095 (14.9%) | 0 (0.0%) |
| 5-Person Households | 730 (9.9%) | 0 (0.0%) |
| 6-Person Households | 445 (6.0%) | 0 (0.0%) |
| 7+ Person Households | 62 (0.8%) | 0 (0.0%) |
| Total | 5,094 (69.2%) | 2,264 (30.8%) |
Female Fertility in Central Falls
Fertility by Age in Central Falls
Average fertility rate in Central Falls is 71.0 births per 1,000 women. Women in the age bracket of 20 to 34 years have the highest fertility rate with 92.0 births per 1,000 women. Women in the age bracket of 20 to 34 years acount for 54.9% of all women with births.
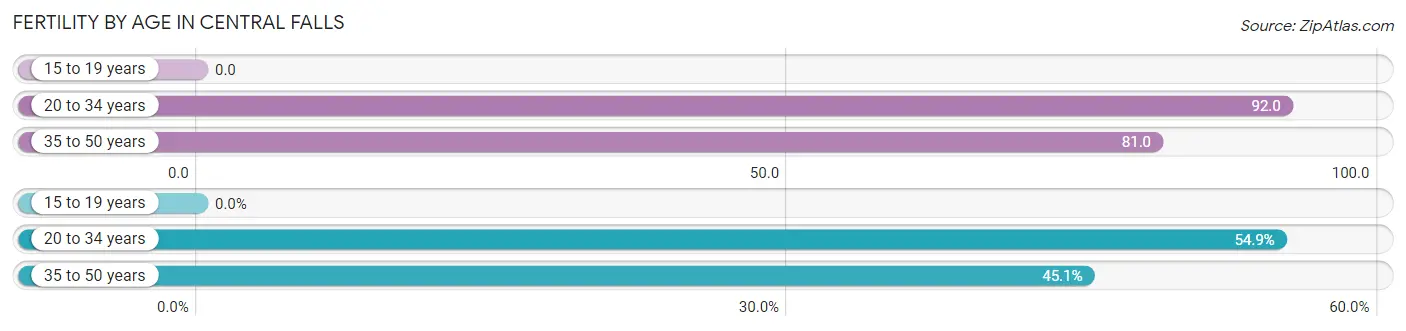
| Age Bracket | Women with Births | Births / 1,000 Women |
| 15 to 19 years | 0 (0.0%) | 0.0 |
| 20 to 34 years | 202 (54.9%) | 92.0 |
| 35 to 50 years | 166 (45.1%) | 81.0 |
| Total | 368 (100.0%) | 71.0 |
Fertility by Age by Marriage Status in Central Falls
72.3% of women with births (368) in Central Falls are married. The highest percentage of unmarried women with births falls into 20 to 34 years age bracket with 50.5% of them unmarried at the time of birth, while the lowest percentage of unmarried women with births belong to 35 to 50 years age bracket with 0.0% of them unmarried.
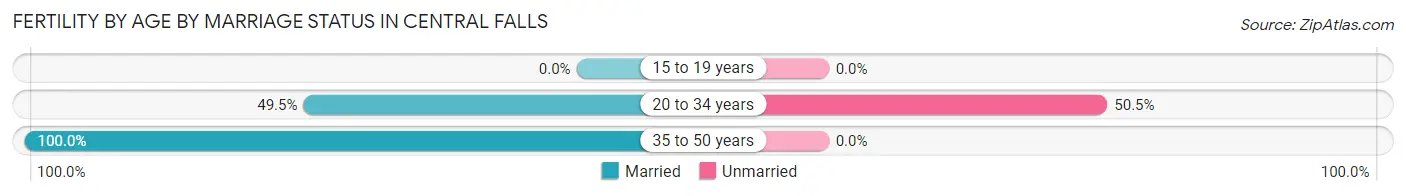
| Age Bracket | Married | Unmarried |
| 15 to 19 years | 0 (0.0%) | 0 (0.0%) |
| 20 to 34 years | 100 (49.5%) | 102 (50.5%) |
| 35 to 50 years | 166 (100.0%) | 0 (0.0%) |
| Total | 266 (72.3%) | 102 (27.7%) |
Fertility by Education in Central Falls
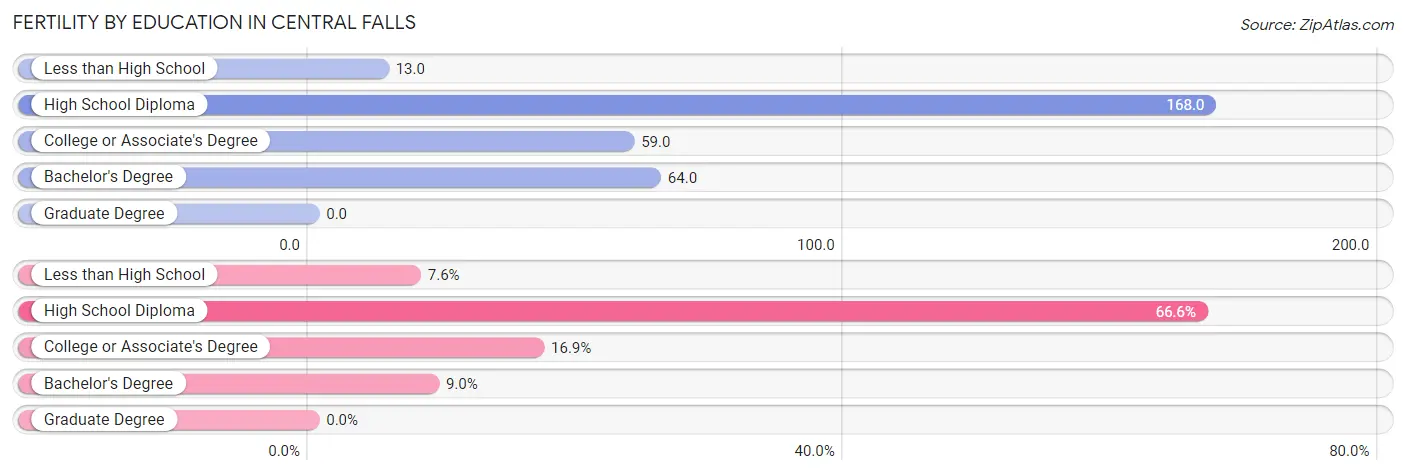
| Educational Attainment | Women with Births | Births / 1,000 Women |
| Less than High School | 28 (7.6%) | 13.0 |
| High School Diploma | 245 (66.6%) | 168.0 |
| College or Associate's Degree | 62 (16.9%) | 59.0 |
| Bachelor's Degree | 33 (9.0%) | 64.0 |
| Graduate Degree | 0 (0.0%) | 0.0 |
| Total | 368 (100.0%) | 71.0 |
Fertility by Education by Marriage Status in Central Falls
27.7% of women with births in Central Falls are unmarried. Women with the educational attainment of less than high school are most likely to be married with 100.0% of them married at childbirth, while women with the educational attainment of college or associate's degree are least likely to be married with 56.5% of them unmarried at childbirth.
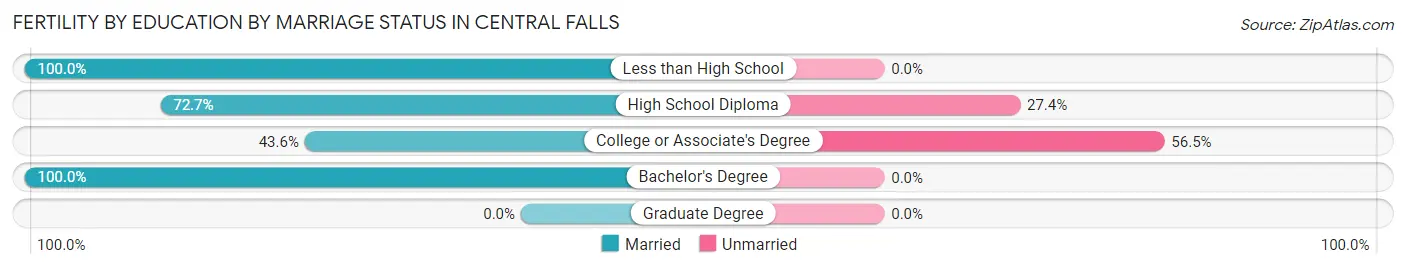
| Educational Attainment | Married | Unmarried |
| Less than High School | 28 (100.0%) | 0 (0.0%) |
| High School Diploma | 178 (72.7%) | 67 (27.4%) |
| College or Associate's Degree | 27 (43.5%) | 35 (56.5%) |
| Bachelor's Degree | 33 (100.0%) | 0 (0.0%) |
| Graduate Degree | 0 (0.0%) | 0 (0.0%) |
| Total | 266 (72.3%) | 102 (27.7%) |
Employment Characteristics in Central Falls
Employment by Class of Employer in Central Falls
Among the 9,228 employed individuals in Central Falls, private company employees (7,361 | 79.8%), not-for-profit organizations (663 | 7.2%), and local government employees (402 | 4.4%) make up the most common classes of employment.
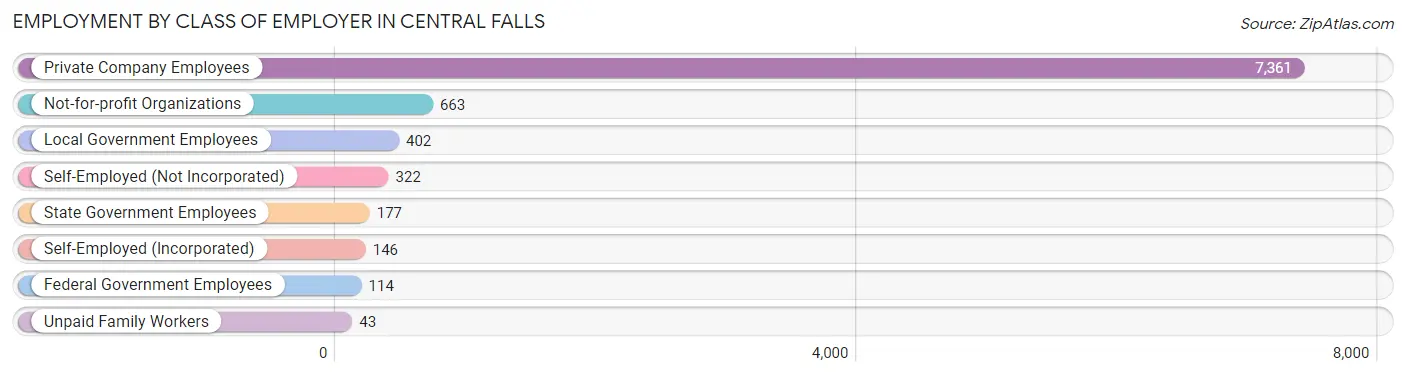
| Employer Class | # Employees | % Employees |
| Private Company Employees | 7,361 | 79.8% |
| Self-Employed (Incorporated) | 146 | 1.6% |
| Self-Employed (Not Incorporated) | 322 | 3.5% |
| Not-for-profit Organizations | 663 | 7.2% |
| Local Government Employees | 402 | 4.4% |
| State Government Employees | 177 | 1.9% |
| Federal Government Employees | 114 | 1.2% |
| Unpaid Family Workers | 43 | 0.5% |
| Total | 9,228 | 100.0% |
Employment Status by Age in Central Falls
According to the labor force statistics for Central Falls, out of the total population over 16 years of age (16,989), 62.0% or 10,533 individuals are in the labor force, with 8.3% or 874 of them unemployed. The age group with the highest labor force participation rate is 25 to 29 years, with 79.5% or 1,684 individuals in the labor force. Within the labor force, the 16 to 19 years age range has the highest percentage of unemployed individuals, with 26.0% or 212 of them being unemployed.
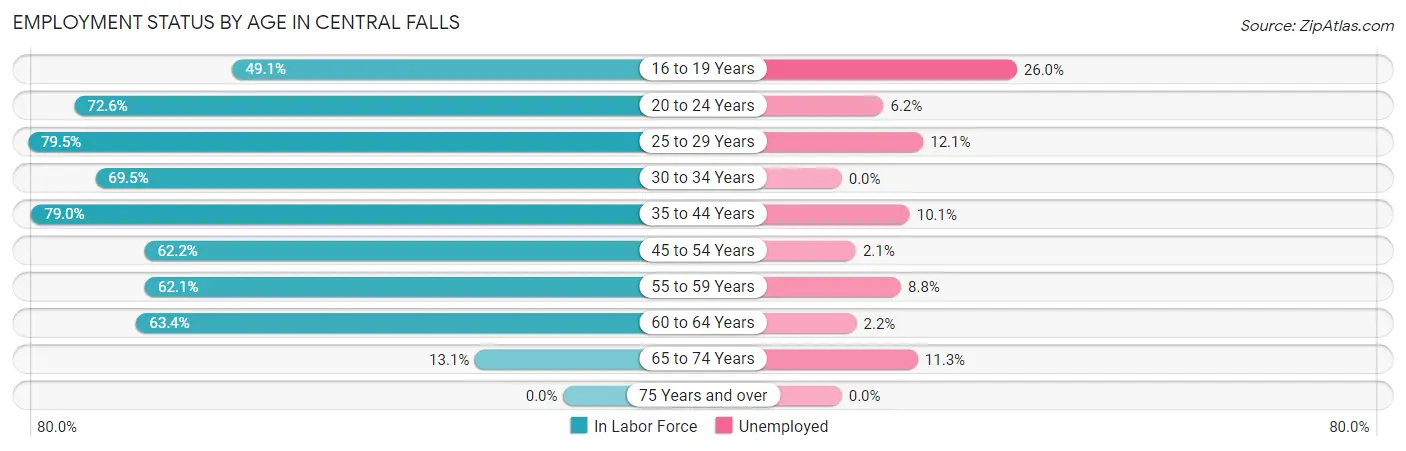
| Age Bracket | In Labor Force | Unemployed |
| 16 to 19 Years | 815 (49.1%) | 212 (26.0%) |
| 20 to 24 Years | 1,048 (72.6%) | 65 (6.2%) |
| 25 to 29 Years | 1,684 (79.5%) | 204 (12.1%) |
| 30 to 34 Years | 1,196 (69.5%) | 0 (0.0%) |
| 35 to 44 Years | 2,665 (79.0%) | 269 (10.1%) |
| 45 to 54 Years | 1,465 (62.2%) | 31 (2.1%) |
| 55 to 59 Years | 634 (62.1%) | 56 (8.8%) |
| 60 to 64 Years | 881 (63.4%) | 19 (2.2%) |
| 65 to 74 Years | 151 (13.1%) | 17 (11.3%) |
| 75 Years and over | 0 (0.0%) | 0 (0.0%) |
| Total | 10,533 (62.0%) | 874 (8.3%) |
Employment Status by Educational Attainment in Central Falls
According to labor force statistics for Central Falls, 71.2% of individuals (8,528) out of the total population between 25 and 64 years of age (11,978) are in the labor force, with 6.8% or 580 of them being unemployed. The group with the highest labor force participation rate are those with the educational attainment of bachelor's degree or higher, with 77.3% or 839 individuals in the labor force. Within the labor force, individuals with high school diploma education have the highest percentage of unemployment, with 10.0% or 273 of them being unemployed.
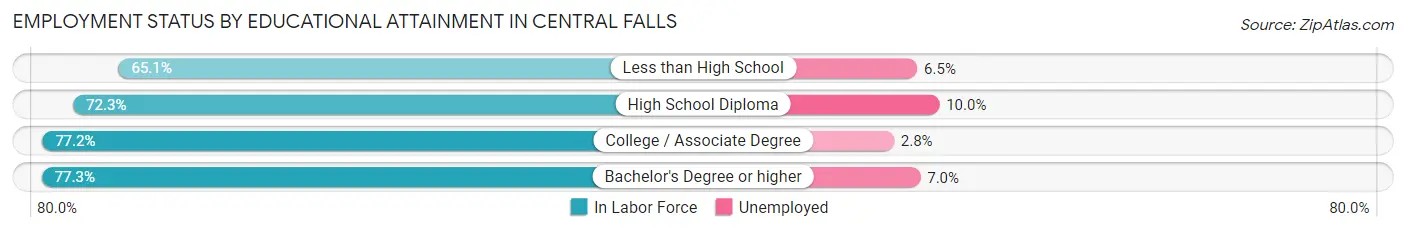
| Educational Attainment | In Labor Force | Unemployed |
| Less than High School | 2,898 (65.1%) | 289 (6.5%) |
| High School Diploma | 2,728 (72.3%) | 377 (10.0%) |
| College / Associate Degree | 2,060 (77.2%) | 75 (2.8%) |
| Bachelor's Degree or higher | 839 (77.3%) | 76 (7.0%) |
| Total | 8,528 (71.2%) | 815 (6.8%) |
Employment Occupations by Sex in Central Falls
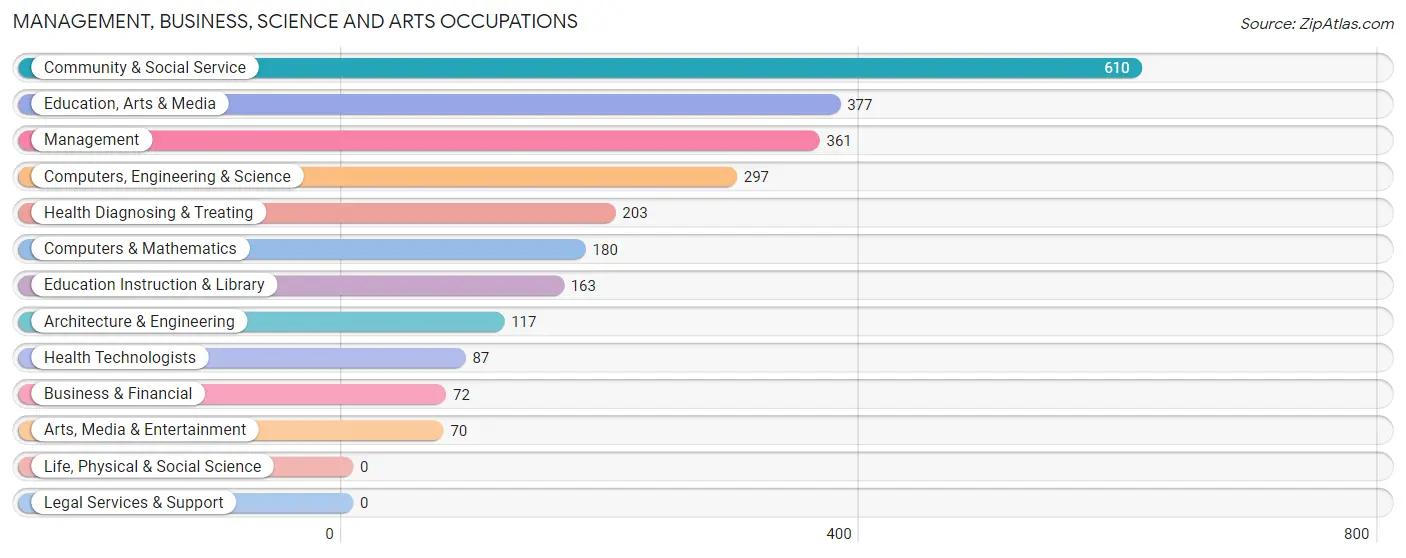
Management, Business, Science and Arts Occupations
The most common Management, Business, Science and Arts occupations in Central Falls are Community & Social Service (610 | 6.3%), Education, Arts & Media (377 | 3.9%), Management (361 | 3.7%), Computers, Engineering & Science (297 | 3.1%), and Health Diagnosing & Treating (203 | 2.1%).
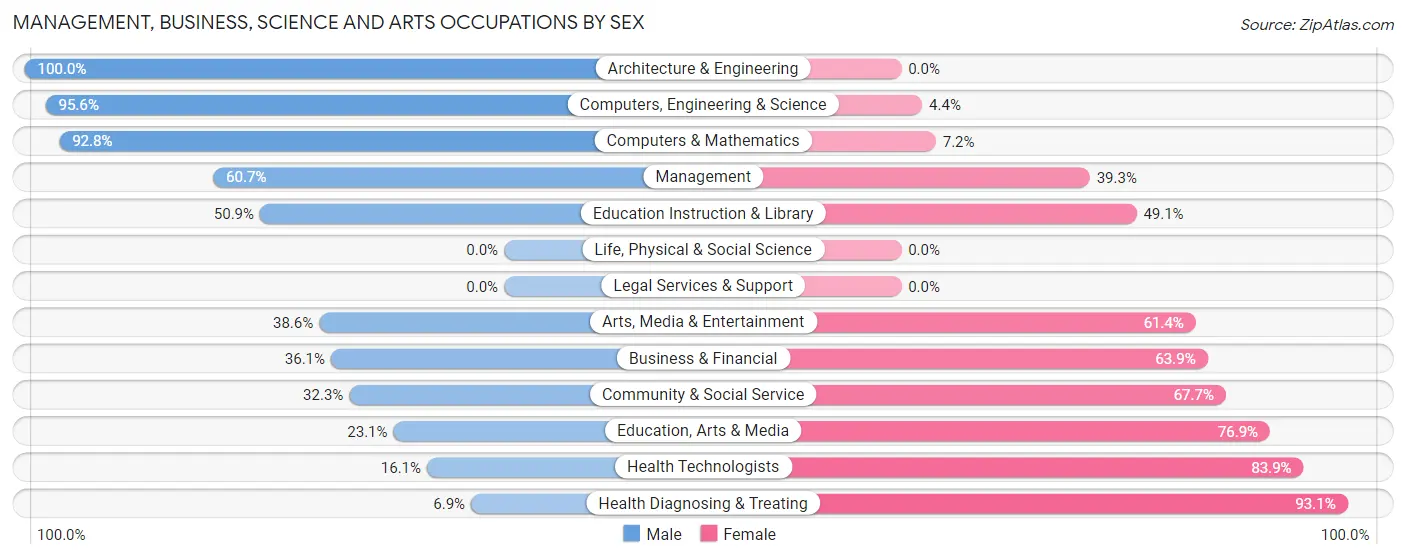
Management, Business, Science and Arts Occupations by Sex
Within the Management, Business, Science and Arts occupations in Central Falls, the most male-oriented occupations are Architecture & Engineering (100.0%), Computers, Engineering & Science (95.6%), and Computers & Mathematics (92.8%), while the most female-oriented occupations are Health Diagnosing & Treating (93.1%), Health Technologists (83.9%), and Education, Arts & Media (76.9%).
| Occupation | Male | Female |
| Management | 219 (60.7%) | 142 (39.3%) |
| Business & Financial | 26 (36.1%) | 46 (63.9%) |
| Computers, Engineering & Science | 284 (95.6%) | 13 (4.4%) |
| Computers & Mathematics | 167 (92.8%) | 13 (7.2%) |
| Architecture & Engineering | 117 (100.0%) | 0 (0.0%) |
| Life, Physical & Social Science | 0 (0.0%) | 0 (0.0%) |
| Community & Social Service | 197 (32.3%) | 413 (67.7%) |
| Education, Arts & Media | 87 (23.1%) | 290 (76.9%) |
| Legal Services & Support | 0 (0.0%) | 0 (0.0%) |
| Education Instruction & Library | 83 (50.9%) | 80 (49.1%) |
| Arts, Media & Entertainment | 27 (38.6%) | 43 (61.4%) |
| Health Diagnosing & Treating | 14 (6.9%) | 189 (93.1%) |
| Health Technologists | 14 (16.1%) | 73 (83.9%) |
| Total (Category) | 740 (48.0%) | 803 (52.0%) |
| Total (Overall) | 5,296 (54.8%) | 4,370 (45.2%) |
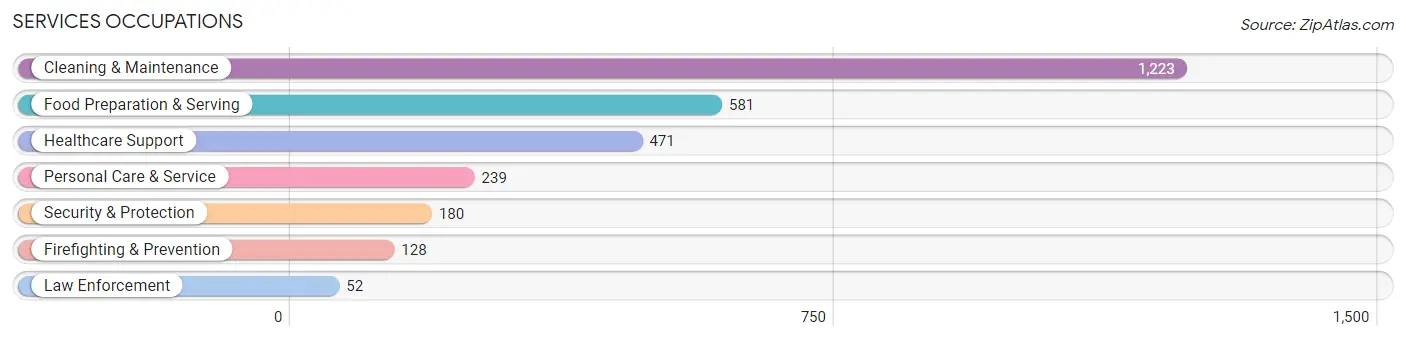
Services Occupations
The most common Services occupations in Central Falls are Cleaning & Maintenance (1,223 | 12.7%), Food Preparation & Serving (581 | 6.0%), Healthcare Support (471 | 4.9%), Personal Care & Service (239 | 2.5%), and Security & Protection (180 | 1.9%).
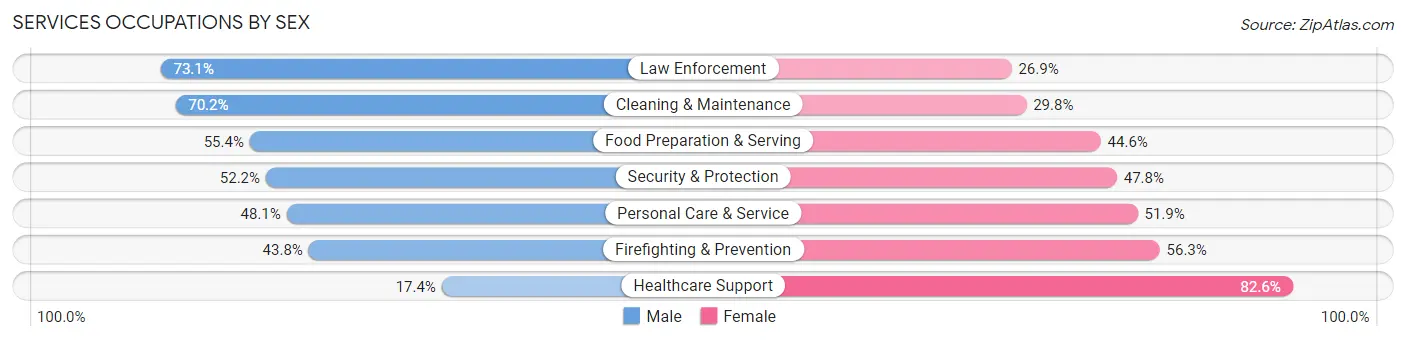
Services Occupations by Sex
Within the Services occupations in Central Falls, the most male-oriented occupations are Law Enforcement (73.1%), Cleaning & Maintenance (70.2%), and Food Preparation & Serving (55.4%), while the most female-oriented occupations are Healthcare Support (82.6%), Firefighting & Prevention (56.2%), and Personal Care & Service (51.9%).
| Occupation | Male | Female |
| Healthcare Support | 82 (17.4%) | 389 (82.6%) |
| Security & Protection | 94 (52.2%) | 86 (47.8%) |
| Firefighting & Prevention | 56 (43.8%) | 72 (56.2%) |
| Law Enforcement | 38 (73.1%) | 14 (26.9%) |
| Food Preparation & Serving | 322 (55.4%) | 259 (44.6%) |
| Cleaning & Maintenance | 858 (70.2%) | 365 (29.8%) |
| Personal Care & Service | 115 (48.1%) | 124 (51.9%) |
| Total (Category) | 1,471 (54.6%) | 1,223 (45.4%) |
| Total (Overall) | 5,296 (54.8%) | 4,370 (45.2%) |
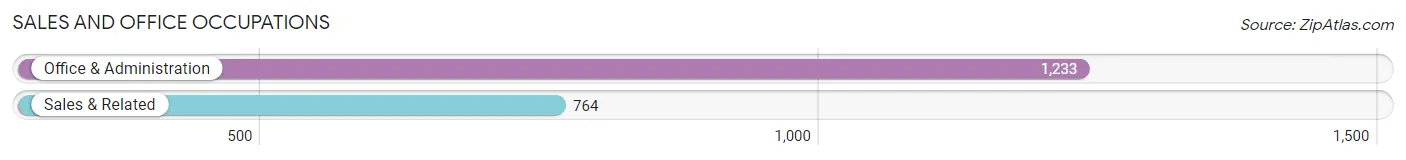
Sales and Office Occupations
The most common Sales and Office occupations in Central Falls are Office & Administration (1,233 | 12.8%), and Sales & Related (764 | 7.9%).
Sales and Office Occupations by Sex
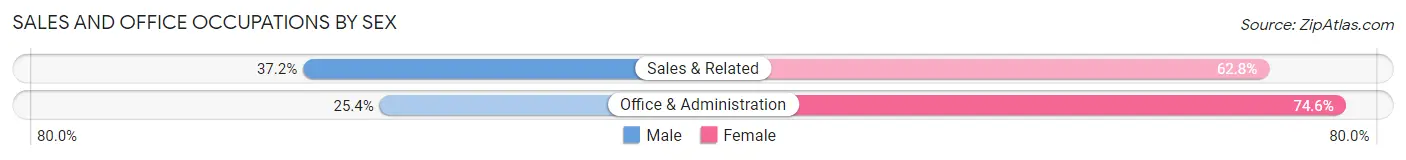
| Occupation | Male | Female |
| Sales & Related | 284 (37.2%) | 480 (62.8%) |
| Office & Administration | 313 (25.4%) | 920 (74.6%) |
| Total (Category) | 597 (29.9%) | 1,400 (70.1%) |
| Total (Overall) | 5,296 (54.8%) | 4,370 (45.2%) |
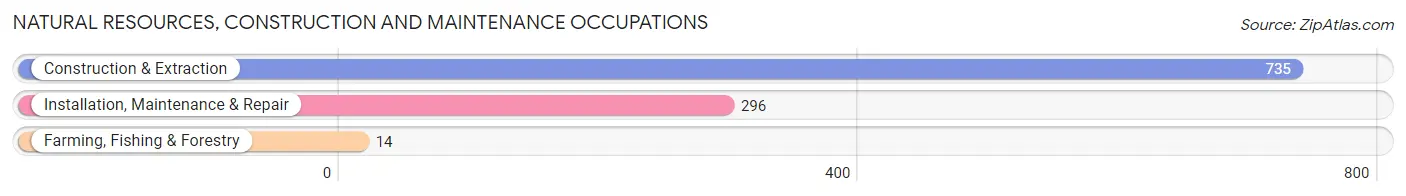
Natural Resources, Construction and Maintenance Occupations
The most common Natural Resources, Construction and Maintenance occupations in Central Falls are Construction & Extraction (735 | 7.6%), Installation, Maintenance & Repair (296 | 3.1%), and Farming, Fishing & Forestry (14 | 0.1%).
Natural Resources, Construction and Maintenance Occupations by Sex
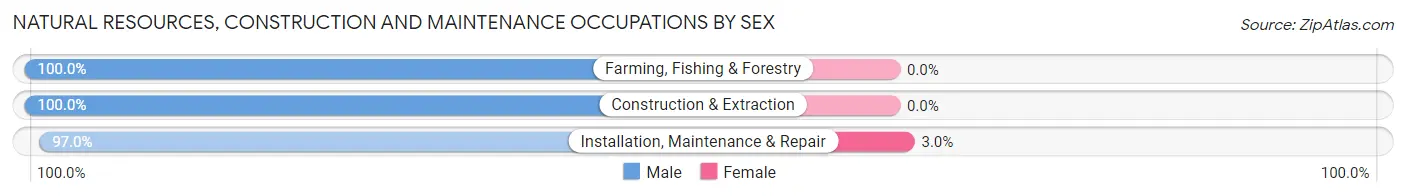
| Occupation | Male | Female |
| Farming, Fishing & Forestry | 14 (100.0%) | 0 (0.0%) |
| Construction & Extraction | 735 (100.0%) | 0 (0.0%) |
| Installation, Maintenance & Repair | 287 (97.0%) | 9 (3.0%) |
| Total (Category) | 1,036 (99.1%) | 9 (0.9%) |
| Total (Overall) | 5,296 (54.8%) | 4,370 (45.2%) |
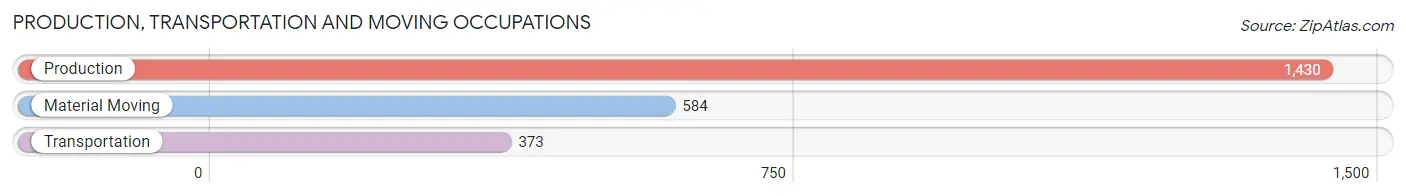
Production, Transportation and Moving Occupations
The most common Production, Transportation and Moving occupations in Central Falls are Production (1,430 | 14.8%), Material Moving (584 | 6.0%), and Transportation (373 | 3.9%).
Production, Transportation and Moving Occupations by Sex
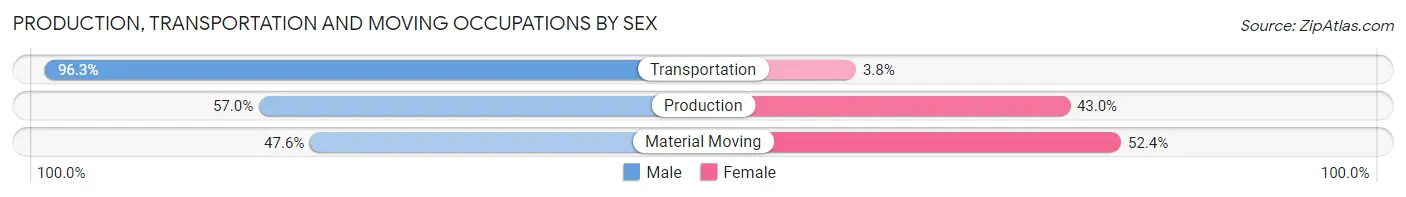
| Occupation | Male | Female |
| Production | 815 (57.0%) | 615 (43.0%) |
| Transportation | 359 (96.3%) | 14 (3.7%) |
| Material Moving | 278 (47.6%) | 306 (52.4%) |
| Total (Category) | 1,452 (60.8%) | 935 (39.2%) |
| Total (Overall) | 5,296 (54.8%) | 4,370 (45.2%) |
Employment Industries by Sex in Central Falls
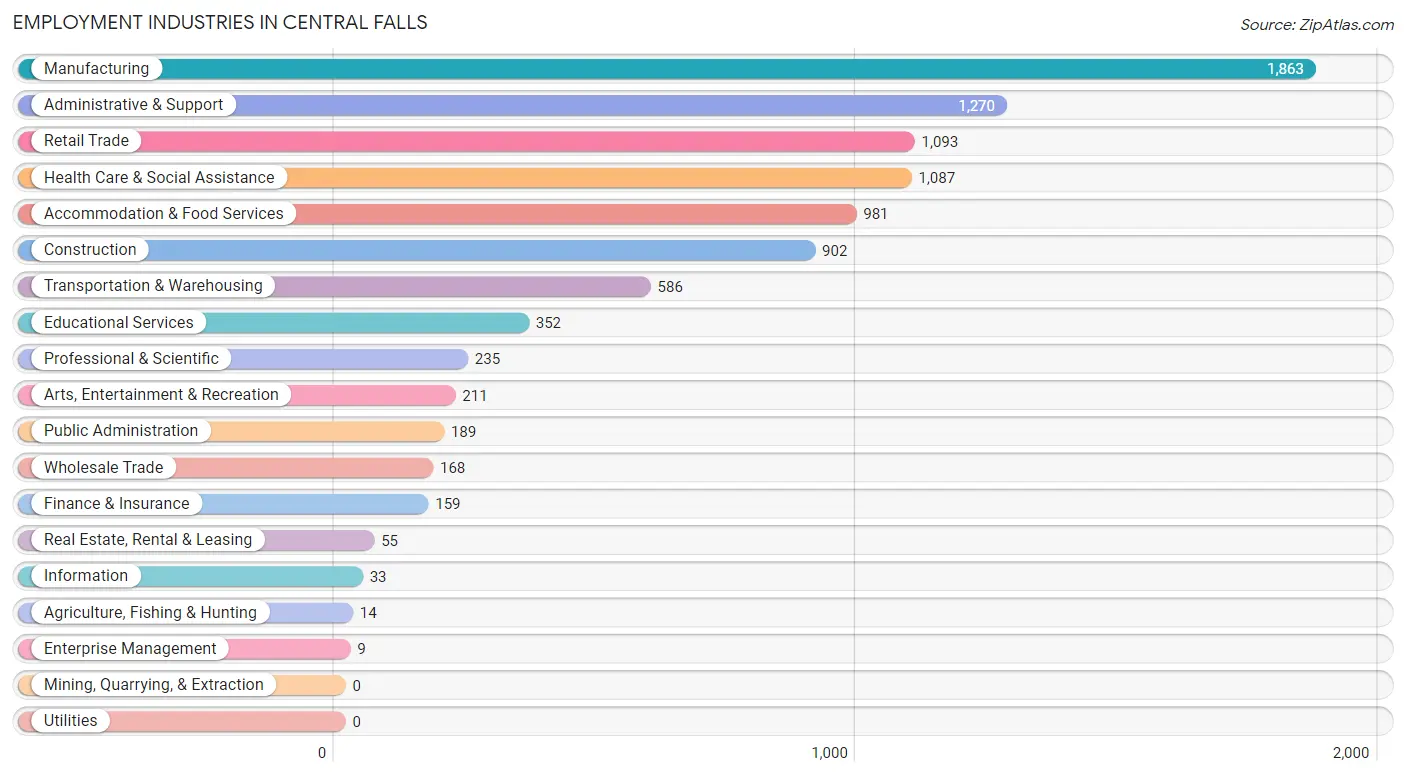
Employment Industries in Central Falls
The major employment industries in Central Falls include Manufacturing (1,863 | 19.3%), Administrative & Support (1,270 | 13.1%), Retail Trade (1,093 | 11.3%), Health Care & Social Assistance (1,087 | 11.3%), and Accommodation & Food Services (981 | 10.2%).
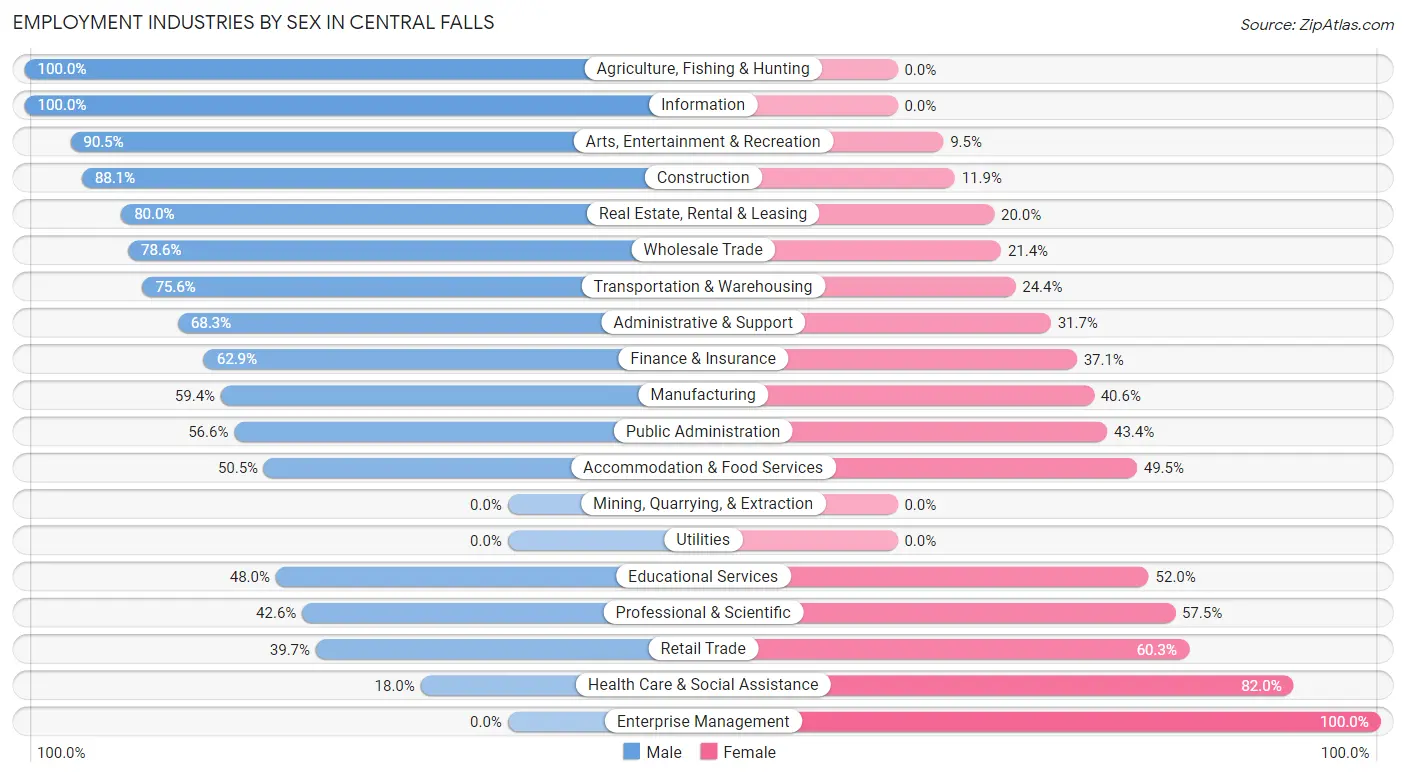
Employment Industries by Sex in Central Falls
The Central Falls industries that see more men than women are Agriculture, Fishing & Hunting (100.0%), Information (100.0%), and Arts, Entertainment & Recreation (90.5%), whereas the industries that tend to have a higher number of women are Enterprise Management (100.0%), Health Care & Social Assistance (82.0%), and Retail Trade (60.3%).
| Industry | Male | Female |
| Agriculture, Fishing & Hunting | 14 (100.0%) | 0 (0.0%) |
| Mining, Quarrying, & Extraction | 0 (0.0%) | 0 (0.0%) |
| Construction | 795 (88.1%) | 107 (11.9%) |
| Manufacturing | 1,106 (59.4%) | 757 (40.6%) |
| Wholesale Trade | 132 (78.6%) | 36 (21.4%) |
| Retail Trade | 434 (39.7%) | 659 (60.3%) |
| Transportation & Warehousing | 443 (75.6%) | 143 (24.4%) |
| Utilities | 0 (0.0%) | 0 (0.0%) |
| Information | 33 (100.0%) | 0 (0.0%) |
| Finance & Insurance | 100 (62.9%) | 59 (37.1%) |
| Real Estate, Rental & Leasing | 44 (80.0%) | 11 (20.0%) |
| Professional & Scientific | 100 (42.5%) | 135 (57.5%) |
| Enterprise Management | 0 (0.0%) | 9 (100.0%) |
| Administrative & Support | 867 (68.3%) | 403 (31.7%) |
| Educational Services | 169 (48.0%) | 183 (52.0%) |
| Health Care & Social Assistance | 196 (18.0%) | 891 (82.0%) |
| Arts, Entertainment & Recreation | 191 (90.5%) | 20 (9.5%) |
| Accommodation & Food Services | 495 (50.5%) | 486 (49.5%) |
| Public Administration | 107 (56.6%) | 82 (43.4%) |
| Total | 5,296 (54.8%) | 4,370 (45.2%) |
Education in Central Falls
School Enrollment in Central Falls
The most common levels of schooling among the 6,323 students in Central Falls are high school (1,716 | 27.1%), middle school (1,502 | 23.7%), and elementary school (1,104 | 17.5%).
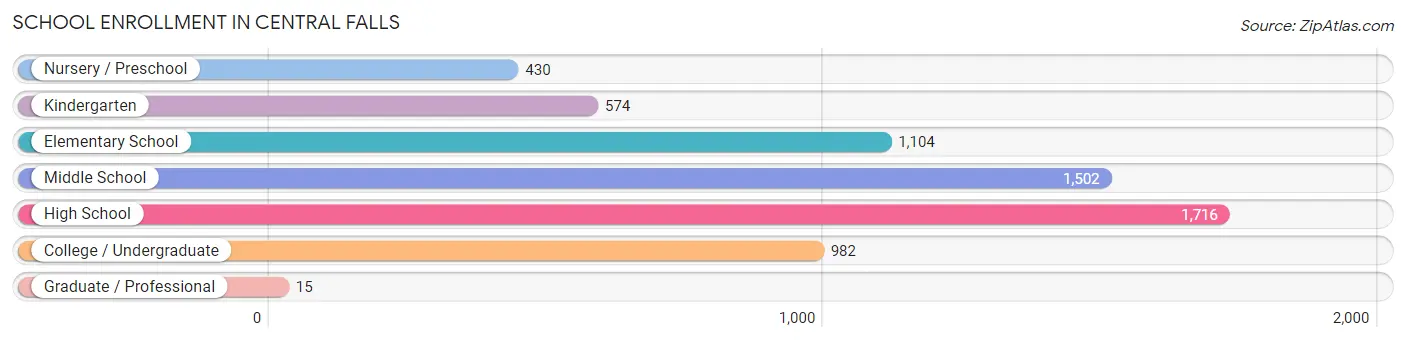
| School Level | # Students | % Students |
| Nursery / Preschool | 430 | 6.8% |
| Kindergarten | 574 | 9.1% |
| Elementary School | 1,104 | 17.5% |
| Middle School | 1,502 | 23.7% |
| High School | 1,716 | 27.1% |
| College / Undergraduate | 982 | 15.5% |
| Graduate / Professional | 15 | 0.2% |
| Total | 6,323 | 100.0% |
School Enrollment by Age by Funding Source in Central Falls
Out of a total of 6,323 students who are enrolled in schools in Central Falls, 784 (12.4%) attend a private institution, while the remaining 5,539 (87.6%) are enrolled in public schools. The age group of 25 to 34 year olds has the highest likelihood of being enrolled in private schools, with 85 (39.5% in the age bracket) enrolled. Conversely, the age group of 3 to 4 year olds has the lowest likelihood of being enrolled in a private school, with 544 (100.0% in the age bracket) attending a public institution.
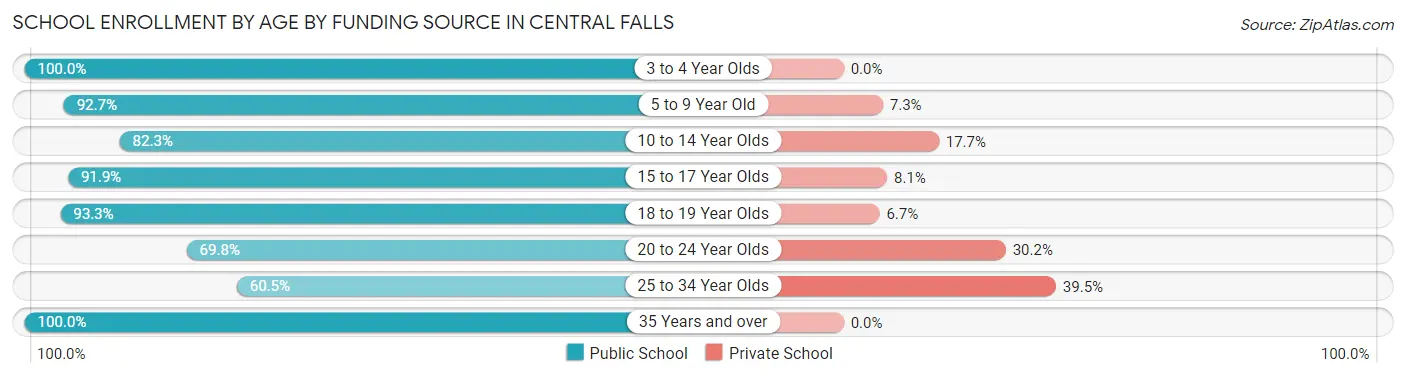
| Age Bracket | Public School | Private School |
| 3 to 4 Year Olds | 544 (100.0%) | 0 (0.0%) |
| 5 to 9 Year Old | 1,410 (92.7%) | 111 (7.3%) |
| 10 to 14 Year Olds | 1,380 (82.3%) | 297 (17.7%) |
| 15 to 17 Year Olds | 1,035 (91.9%) | 91 (8.1%) |
| 18 to 19 Year Olds | 546 (93.3%) | 39 (6.7%) |
| 20 to 24 Year Olds | 370 (69.8%) | 160 (30.2%) |
| 25 to 34 Year Olds | 130 (60.5%) | 85 (39.5%) |
| 35 Years and over | 125 (100.0%) | 0 (0.0%) |
| Total | 5,539 (87.6%) | 784 (12.4%) |
Educational Attainment by Field of Study in Central Falls
Business (287 | 21.3%), arts & humanities (258 | 19.2%), education (211 | 15.7%), science & technology (113 | 8.4%), and social sciences (89 | 6.6%) are the most common fields of study among 1,347 individuals in Central Falls who have obtained a bachelor's degree or higher.
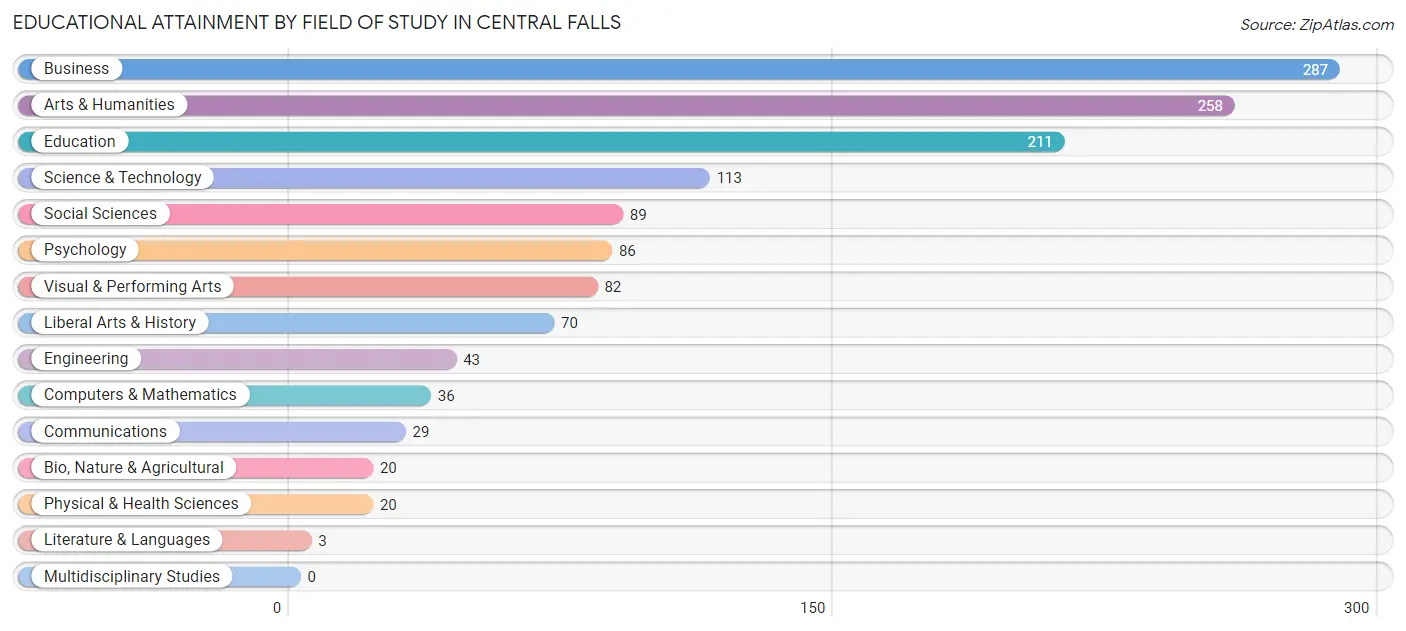
| Field of Study | # Graduates | % Graduates |
| Computers & Mathematics | 36 | 2.7% |
| Bio, Nature & Agricultural | 20 | 1.5% |
| Physical & Health Sciences | 20 | 1.5% |
| Psychology | 86 | 6.4% |
| Social Sciences | 89 | 6.6% |
| Engineering | 43 | 3.2% |
| Multidisciplinary Studies | 0 | 0.0% |
| Science & Technology | 113 | 8.4% |
| Business | 287 | 21.3% |
| Education | 211 | 15.7% |
| Literature & Languages | 3 | 0.2% |
| Liberal Arts & History | 70 | 5.2% |
| Visual & Performing Arts | 82 | 6.1% |
| Communications | 29 | 2.1% |
| Arts & Humanities | 258 | 19.2% |
| Total | 1,347 | 100.0% |
Transportation & Commute in Central Falls
Vehicle Availability by Sex in Central Falls
The most prevalent vehicle ownership categories in Central Falls are males with 1 vehicle (1,746, accounting for 33.7%) and females with 1 vehicle (1,086, making up 43.2%).
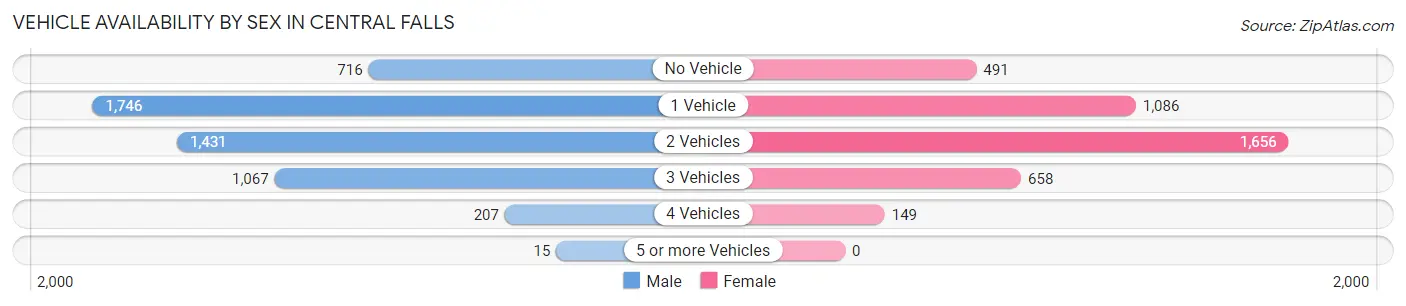
| Vehicles Available | Male | Female |
| No Vehicle | 716 (13.8%) | 491 (12.1%) |
| 1 Vehicle | 1,746 (33.7%) | 1,086 (26.9%) |
| 2 Vehicles | 1,431 (27.6%) | 1,656 (41.0%) |
| 3 Vehicles | 1,067 (20.6%) | 658 (16.3%) |
| 4 Vehicles | 207 (4.0%) | 149 (3.7%) |
| 5 or more Vehicles | 15 (0.3%) | 0 (0.0%) |
| Total | 5,182 (100.0%) | 4,040 (100.0%) |
Commute Time in Central Falls
The most frequently occuring commute durations in Central Falls are 15 to 19 minutes (1,696 commuters, 19.0%), 20 to 24 minutes (1,514 commuters, 17.0%), and 30 to 34 minutes (1,308 commuters, 14.6%).
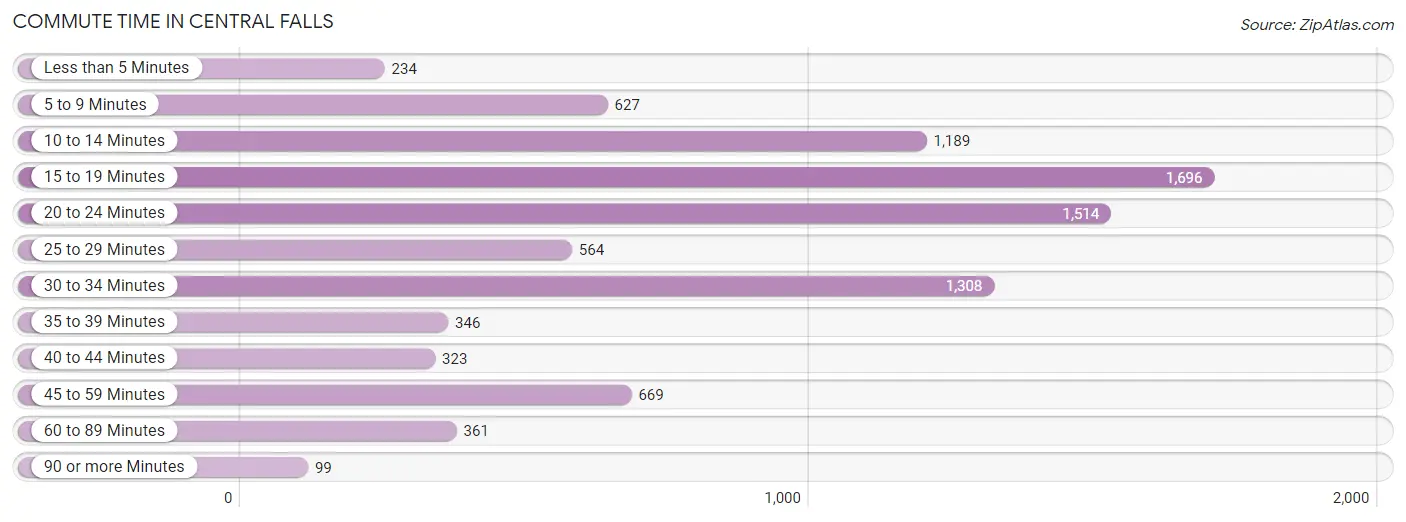
| Commute Time | # Commuters | % Commuters |
| Less than 5 Minutes | 234 | 2.6% |
| 5 to 9 Minutes | 627 | 7.0% |
| 10 to 14 Minutes | 1,189 | 13.3% |
| 15 to 19 Minutes | 1,696 | 19.0% |
| 20 to 24 Minutes | 1,514 | 17.0% |
| 25 to 29 Minutes | 564 | 6.3% |
| 30 to 34 Minutes | 1,308 | 14.6% |
| 35 to 39 Minutes | 346 | 3.9% |
| 40 to 44 Minutes | 323 | 3.6% |
| 45 to 59 Minutes | 669 | 7.5% |
| 60 to 89 Minutes | 361 | 4.0% |
| 90 or more Minutes | 99 | 1.1% |
Commute Time by Sex in Central Falls
The most common commute times in Central Falls are 30 to 34 minutes (946 commuters, 18.7%) for males and 15 to 19 minutes (880 commuters, 22.8%) for females.
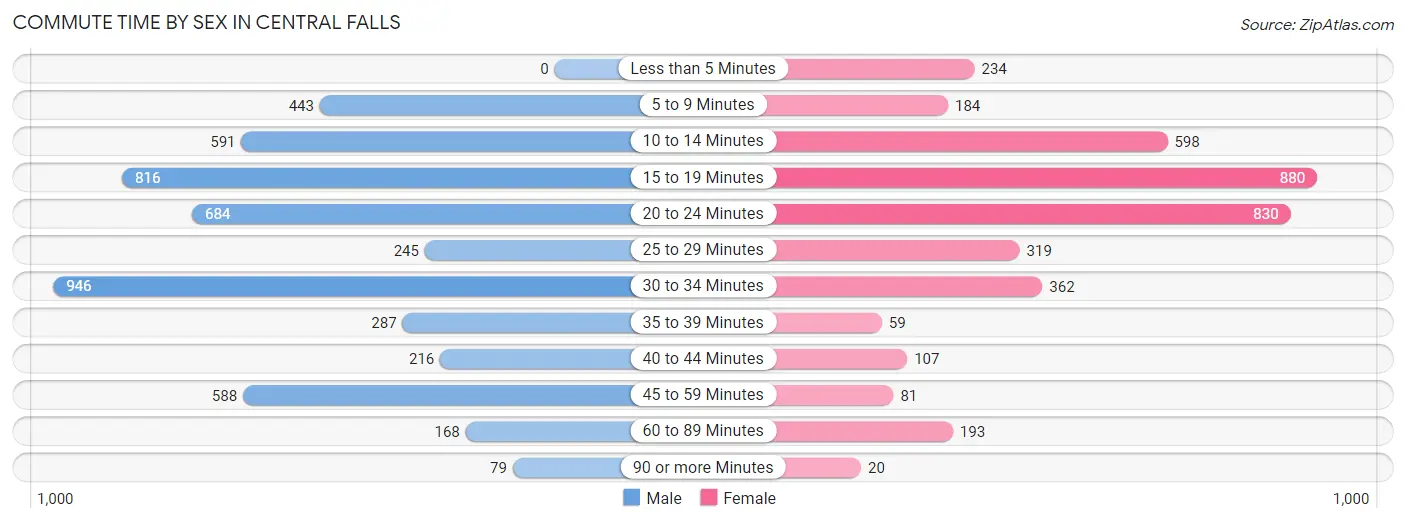
| Commute Time | Male | Female |
| Less than 5 Minutes | 0 (0.0%) | 234 (6.0%) |
| 5 to 9 Minutes | 443 (8.7%) | 184 (4.8%) |
| 10 to 14 Minutes | 591 (11.7%) | 598 (15.5%) |
| 15 to 19 Minutes | 816 (16.1%) | 880 (22.8%) |
| 20 to 24 Minutes | 684 (13.5%) | 830 (21.5%) |
| 25 to 29 Minutes | 245 (4.8%) | 319 (8.3%) |
| 30 to 34 Minutes | 946 (18.7%) | 362 (9.4%) |
| 35 to 39 Minutes | 287 (5.7%) | 59 (1.5%) |
| 40 to 44 Minutes | 216 (4.3%) | 107 (2.8%) |
| 45 to 59 Minutes | 588 (11.6%) | 81 (2.1%) |
| 60 to 89 Minutes | 168 (3.3%) | 193 (5.0%) |
| 90 or more Minutes | 79 (1.6%) | 20 (0.5%) |
Time of Departure to Work by Sex in Central Falls
The most frequent times of departure to work in Central Falls are 7:00 AM to 7:29 AM (1,172, 23.2%) for males and 8:00 AM to 8:29 AM (689, 17.8%) for females.
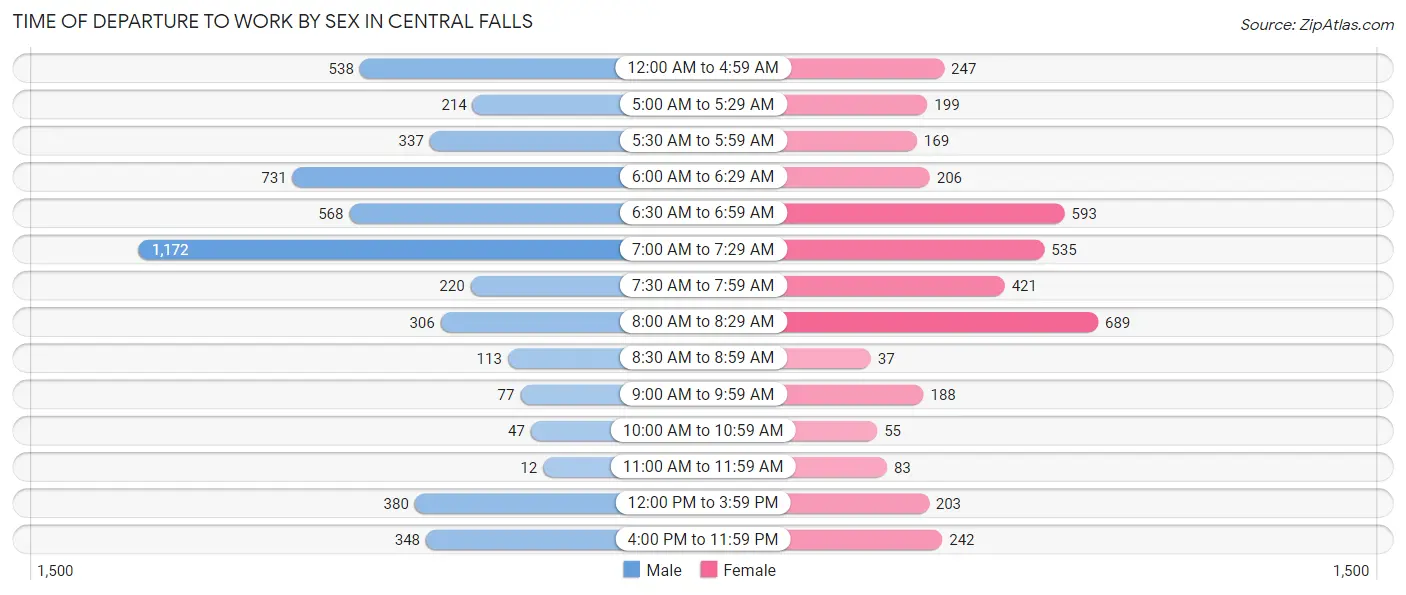
| Time of Departure | Male | Female |
| 12:00 AM to 4:59 AM | 538 (10.6%) | 247 (6.4%) |
| 5:00 AM to 5:29 AM | 214 (4.2%) | 199 (5.1%) |
| 5:30 AM to 5:59 AM | 337 (6.7%) | 169 (4.4%) |
| 6:00 AM to 6:29 AM | 731 (14.4%) | 206 (5.3%) |
| 6:30 AM to 6:59 AM | 568 (11.2%) | 593 (15.3%) |
| 7:00 AM to 7:29 AM | 1,172 (23.2%) | 535 (13.8%) |
| 7:30 AM to 7:59 AM | 220 (4.3%) | 421 (10.9%) |
| 8:00 AM to 8:29 AM | 306 (6.0%) | 689 (17.8%) |
| 8:30 AM to 8:59 AM | 113 (2.2%) | 37 (1.0%) |
| 9:00 AM to 9:59 AM | 77 (1.5%) | 188 (4.9%) |
| 10:00 AM to 10:59 AM | 47 (0.9%) | 55 (1.4%) |
| 11:00 AM to 11:59 AM | 12 (0.2%) | 83 (2.1%) |
| 12:00 PM to 3:59 PM | 380 (7.5%) | 203 (5.2%) |
| 4:00 PM to 11:59 PM | 348 (6.9%) | 242 (6.3%) |
| Total | 5,063 (100.0%) | 3,867 (100.0%) |
Housing Occupancy in Central Falls
Occupancy by Ownership in Central Falls
Of the total 7,358 dwellings in Central Falls, owner-occupied units account for 1,914 (26.0%), while renter-occupied units make up 5,444 (74.0%).
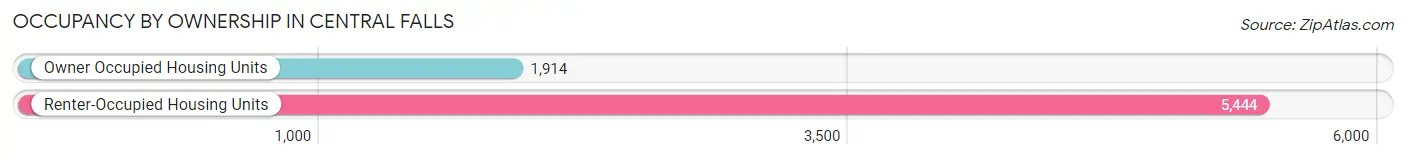
| Occupancy | # Housing Units | % Housing Units |
| Owner Occupied Housing Units | 1,914 | 26.0% |
| Renter-Occupied Housing Units | 5,444 | 74.0% |
| Total Occupied Housing Units | 7,358 | 100.0% |
Occupancy by Household Size in Central Falls
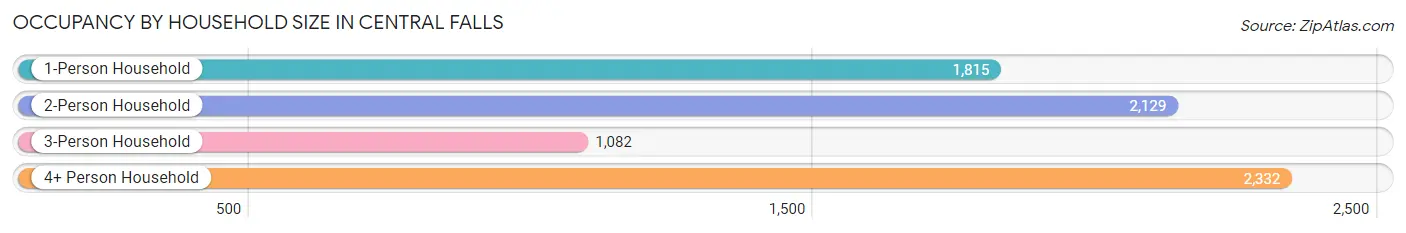
| Household Size | # Housing Units | % Housing Units |
| 1-Person Household | 1,815 | 24.7% |
| 2-Person Household | 2,129 | 28.9% |
| 3-Person Household | 1,082 | 14.7% |
| 4+ Person Household | 2,332 | 31.7% |
| Total Housing Units | 7,358 | 100.0% |
Occupancy by Ownership by Household Size in Central Falls
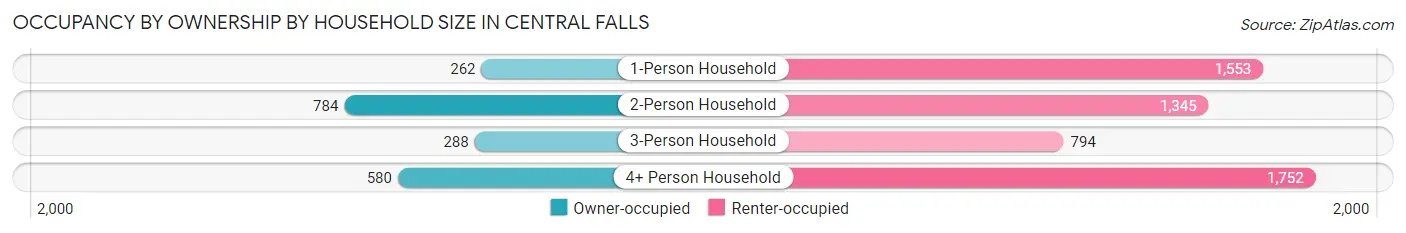
| Household Size | Owner-occupied | Renter-occupied |
| 1-Person Household | 262 (14.4%) | 1,553 (85.6%) |
| 2-Person Household | 784 (36.8%) | 1,345 (63.2%) |
| 3-Person Household | 288 (26.6%) | 794 (73.4%) |
| 4+ Person Household | 580 (24.9%) | 1,752 (75.1%) |
| Total Housing Units | 1,914 (26.0%) | 5,444 (74.0%) |
Occupancy by Educational Attainment in Central Falls
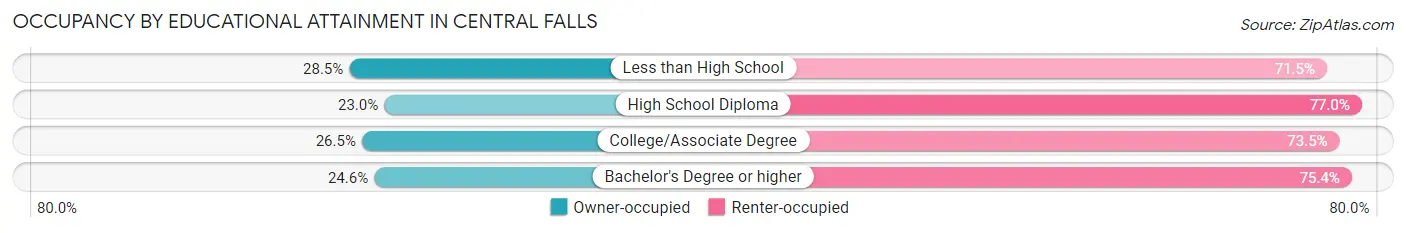
| Household Size | Owner-occupied | Renter-occupied |
| Less than High School | 768 (28.5%) | 1,924 (71.5%) |
| High School Diploma | 477 (23.0%) | 1,598 (77.0%) |
| College/Associate Degree | 437 (26.5%) | 1,210 (73.5%) |
| Bachelor's Degree or higher | 232 (24.6%) | 712 (75.4%) |
Occupancy by Age of Householder in Central Falls
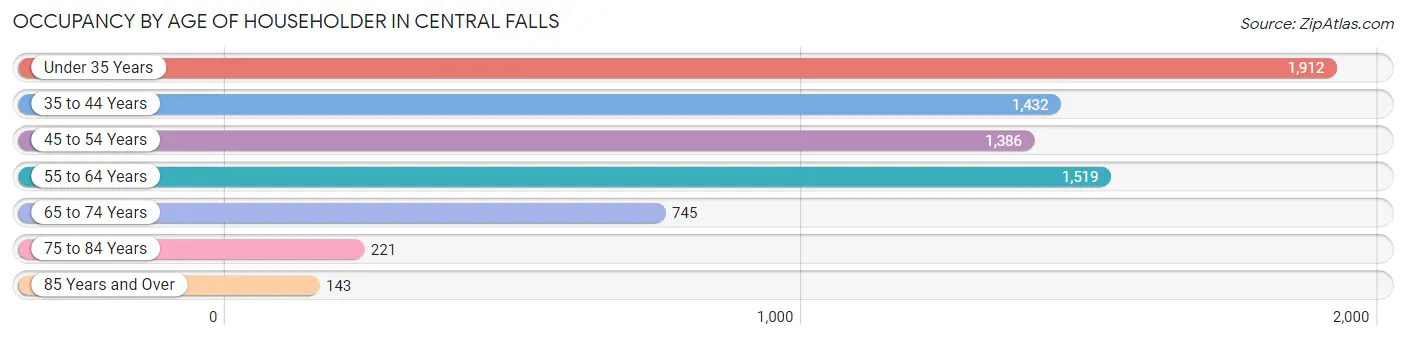
| Age Bracket | # Households | % Households |
| Under 35 Years | 1,912 | 26.0% |
| 35 to 44 Years | 1,432 | 19.5% |
| 45 to 54 Years | 1,386 | 18.8% |
| 55 to 64 Years | 1,519 | 20.6% |
| 65 to 74 Years | 745 | 10.1% |
| 75 to 84 Years | 221 | 3.0% |
| 85 Years and Over | 143 | 1.9% |
| Total | 7,358 | 100.0% |
Housing Finances in Central Falls
Median Income by Occupancy in Central Falls
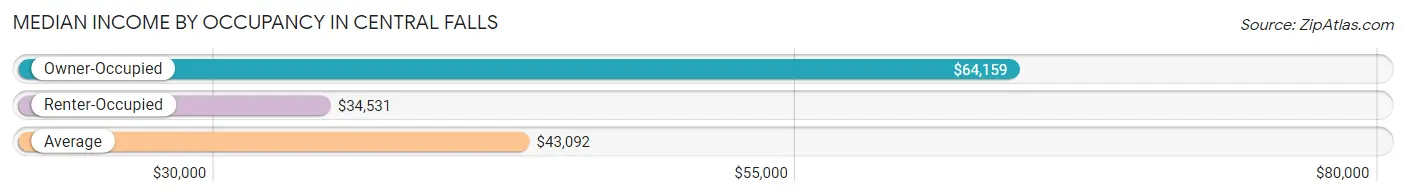
| Occupancy Type | # Households | Median Income |
| Owner-Occupied | 1,914 (26.0%) | $64,159 |
| Renter-Occupied | 5,444 (74.0%) | $34,531 |
| Average | 7,358 (100.0%) | $43,092 |
Occupancy by Householder Income Bracket in Central Falls
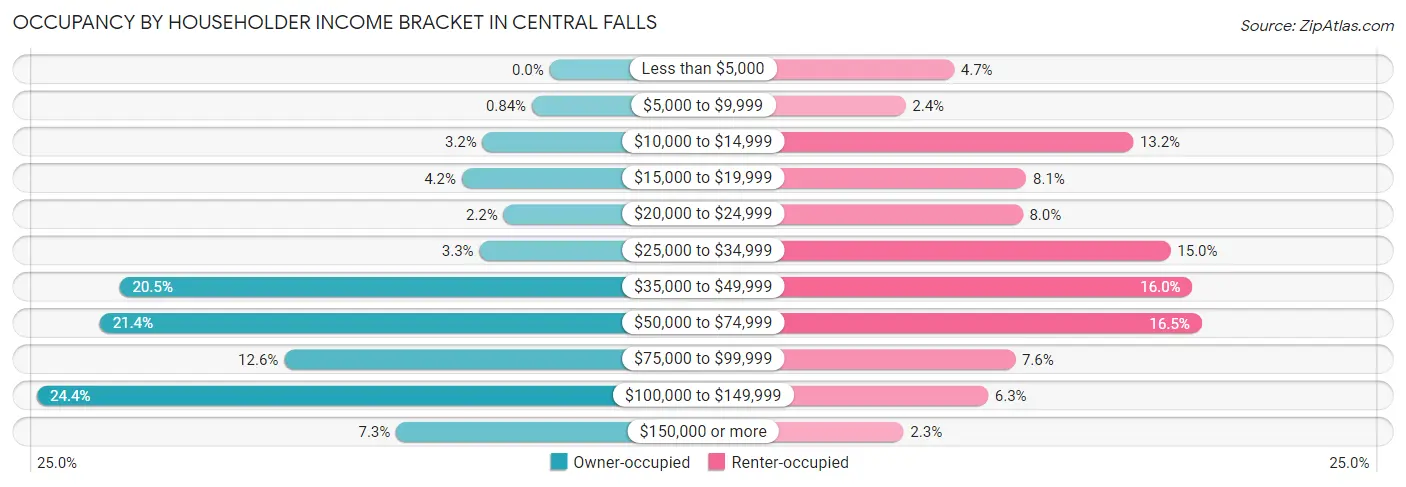
| Income Bracket | Owner-occupied | Renter-occupied |
| Less than $5,000 | 0 (0.0%) | 255 (4.7%) |
| $5,000 to $9,999 | 16 (0.8%) | 129 (2.4%) |
| $10,000 to $14,999 | 61 (3.2%) | 719 (13.2%) |
| $15,000 to $19,999 | 80 (4.2%) | 442 (8.1%) |
| $20,000 to $24,999 | 42 (2.2%) | 433 (8.0%) |
| $25,000 to $34,999 | 64 (3.3%) | 816 (15.0%) |
| $35,000 to $49,999 | 392 (20.5%) | 873 (16.0%) |
| $50,000 to $74,999 | 410 (21.4%) | 897 (16.5%) |
| $75,000 to $99,999 | 242 (12.6%) | 413 (7.6%) |
| $100,000 to $149,999 | 467 (24.4%) | 343 (6.3%) |
| $150,000 or more | 140 (7.3%) | 124 (2.3%) |
| Total | 1,914 (100.0%) | 5,444 (100.0%) |
Monthly Housing Cost Tiers in Central Falls
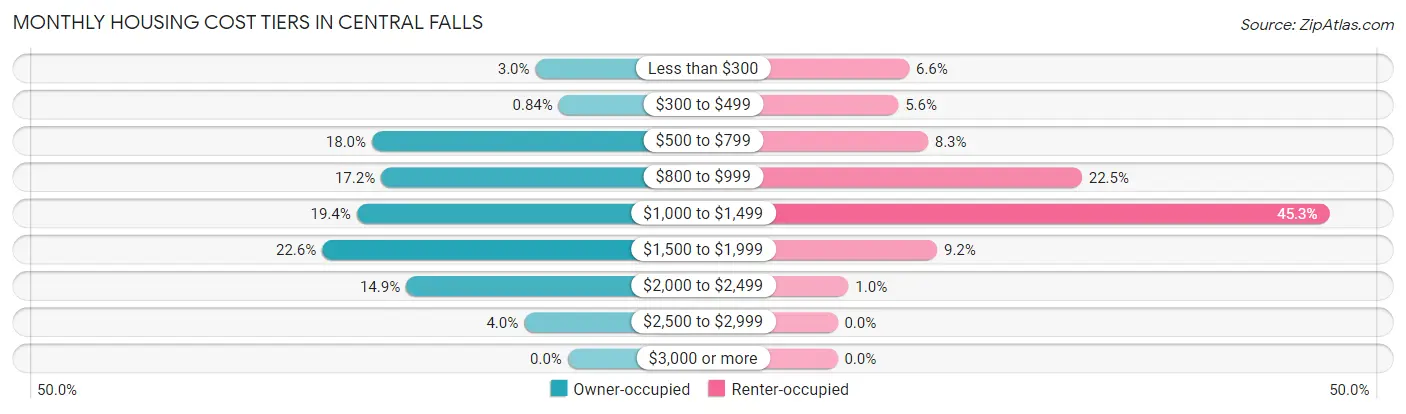
| Monthly Cost | Owner-occupied | Renter-occupied |
| Less than $300 | 57 (3.0%) | 359 (6.6%) |
| $300 to $499 | 16 (0.8%) | 305 (5.6%) |
| $500 to $799 | 345 (18.0%) | 453 (8.3%) |
| $800 to $999 | 329 (17.2%) | 1,225 (22.5%) |
| $1,000 to $1,499 | 372 (19.4%) | 2,465 (45.3%) |
| $1,500 to $1,999 | 433 (22.6%) | 499 (9.2%) |
| $2,000 to $2,499 | 285 (14.9%) | 55 (1.0%) |
| $2,500 to $2,999 | 77 (4.0%) | 0 (0.0%) |
| $3,000 or more | 0 (0.0%) | 0 (0.0%) |
| Total | 1,914 (100.0%) | 5,444 (100.0%) |
Physical Housing Characteristics in Central Falls
Housing Structures in Central Falls
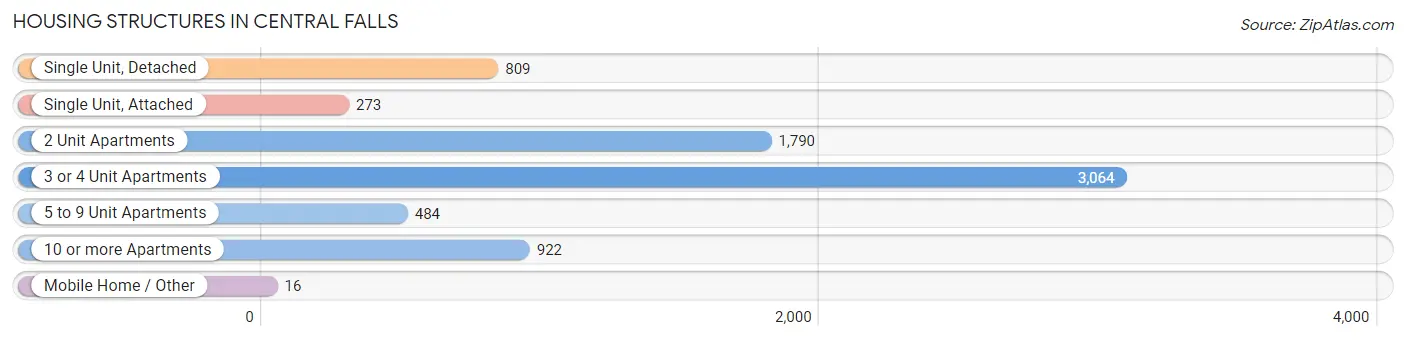
| Structure Type | # Housing Units | % Housing Units |
| Single Unit, Detached | 809 | 11.0% |
| Single Unit, Attached | 273 | 3.7% |
| 2 Unit Apartments | 1,790 | 24.3% |
| 3 or 4 Unit Apartments | 3,064 | 41.6% |
| 5 to 9 Unit Apartments | 484 | 6.6% |
| 10 or more Apartments | 922 | 12.5% |
| Mobile Home / Other | 16 | 0.2% |
| Total | 7,358 | 100.0% |
Housing Structures by Occupancy in Central Falls
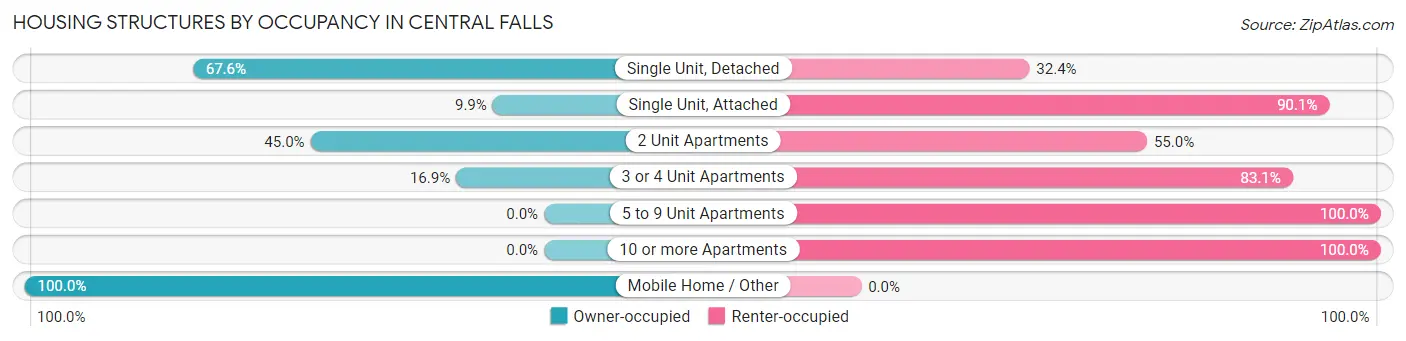
| Structure Type | Owner-occupied | Renter-occupied |
| Single Unit, Detached | 547 (67.6%) | 262 (32.4%) |
| Single Unit, Attached | 27 (9.9%) | 246 (90.1%) |
| 2 Unit Apartments | 805 (45.0%) | 985 (55.0%) |
| 3 or 4 Unit Apartments | 519 (16.9%) | 2,545 (83.1%) |
| 5 to 9 Unit Apartments | 0 (0.0%) | 484 (100.0%) |
| 10 or more Apartments | 0 (0.0%) | 922 (100.0%) |
| Mobile Home / Other | 16 (100.0%) | 0 (0.0%) |
| Total | 1,914 (26.0%) | 5,444 (74.0%) |
Housing Structures by Number of Rooms in Central Falls
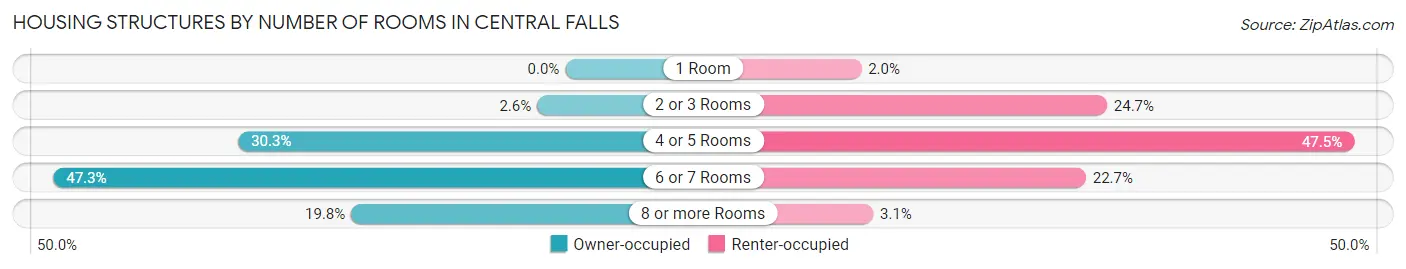
| Number of Rooms | Owner-occupied | Renter-occupied |
| 1 Room | 0 (0.0%) | 107 (2.0%) |
| 2 or 3 Rooms | 50 (2.6%) | 1,344 (24.7%) |
| 4 or 5 Rooms | 579 (30.2%) | 2,588 (47.5%) |
| 6 or 7 Rooms | 906 (47.3%) | 1,238 (22.7%) |
| 8 or more Rooms | 379 (19.8%) | 167 (3.1%) |
| Total | 1,914 (100.0%) | 5,444 (100.0%) |
Housing Structure by Heating Type in Central Falls
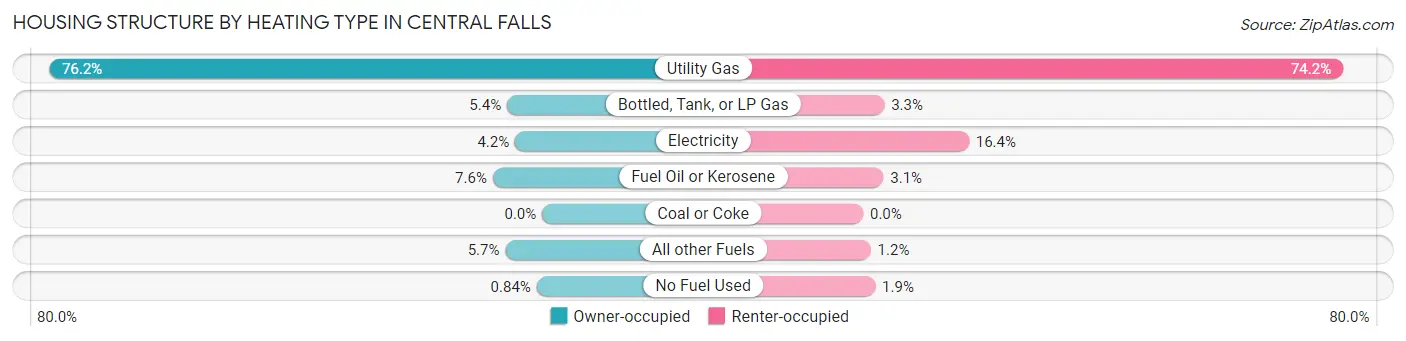
| Heating Type | Owner-occupied | Renter-occupied |
| Utility Gas | 1,459 (76.2%) | 4,039 (74.2%) |
| Bottled, Tank, or LP Gas | 104 (5.4%) | 178 (3.3%) |
| Electricity | 80 (4.2%) | 890 (16.4%) |
| Fuel Oil or Kerosene | 146 (7.6%) | 171 (3.1%) |
| Coal or Coke | 0 (0.0%) | 0 (0.0%) |
| All other Fuels | 109 (5.7%) | 64 (1.2%) |
| No Fuel Used | 16 (0.8%) | 102 (1.9%) |
| Total | 1,914 (100.0%) | 5,444 (100.0%) |
Household Vehicle Usage in Central Falls
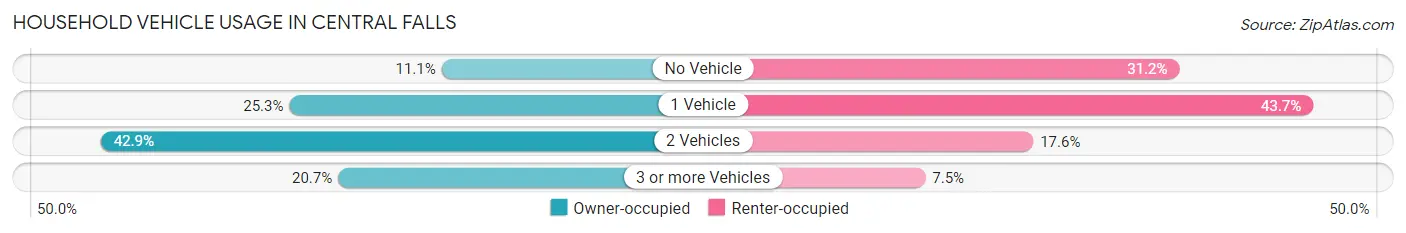
| Vehicles per Household | Owner-occupied | Renter-occupied |
| No Vehicle | 212 (11.1%) | 1,699 (31.2%) |
| 1 Vehicle | 484 (25.3%) | 2,379 (43.7%) |
| 2 Vehicles | 821 (42.9%) | 957 (17.6%) |
| 3 or more Vehicles | 397 (20.7%) | 409 (7.5%) |
| Total | 1,914 (100.0%) | 5,444 (100.0%) |
Real Estate & Mortgages in Central Falls
Real Estate and Mortgage Overview in Central Falls
| Characteristic | Without Mortgage | With Mortgage |
| Housing Units | 735 | 1,179 |
| Median Property Value | $255,500 | $237,900 |
| Median Household Income | $56,045 | $86 |
| Monthly Housing Costs | $813 | $0 |
| Real Estate Taxes | $3,661 | $8 |
Property Value by Mortgage Status in Central Falls
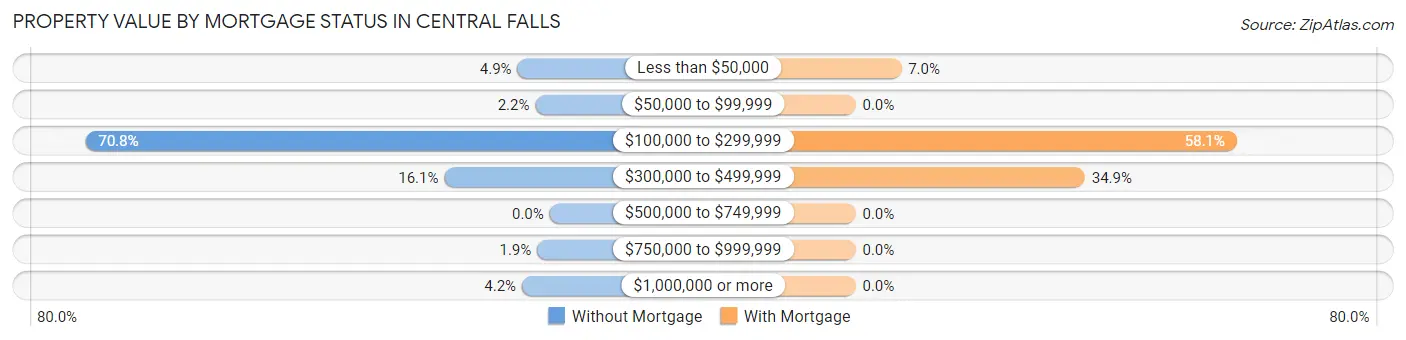
| Property Value | Without Mortgage | With Mortgage |
| Less than $50,000 | 36 (4.9%) | 82 (7.0%) |
| $50,000 to $99,999 | 16 (2.2%) | 0 (0.0%) |
| $100,000 to $299,999 | 520 (70.8%) | 685 (58.1%) |
| $300,000 to $499,999 | 118 (16.1%) | 412 (34.9%) |
| $500,000 to $749,999 | 0 (0.0%) | 0 (0.0%) |
| $750,000 to $999,999 | 14 (1.9%) | 0 (0.0%) |
| $1,000,000 or more | 31 (4.2%) | 0 (0.0%) |
| Total | 735 (100.0%) | 1,179 (100.0%) |
Household Income by Mortgage Status in Central Falls
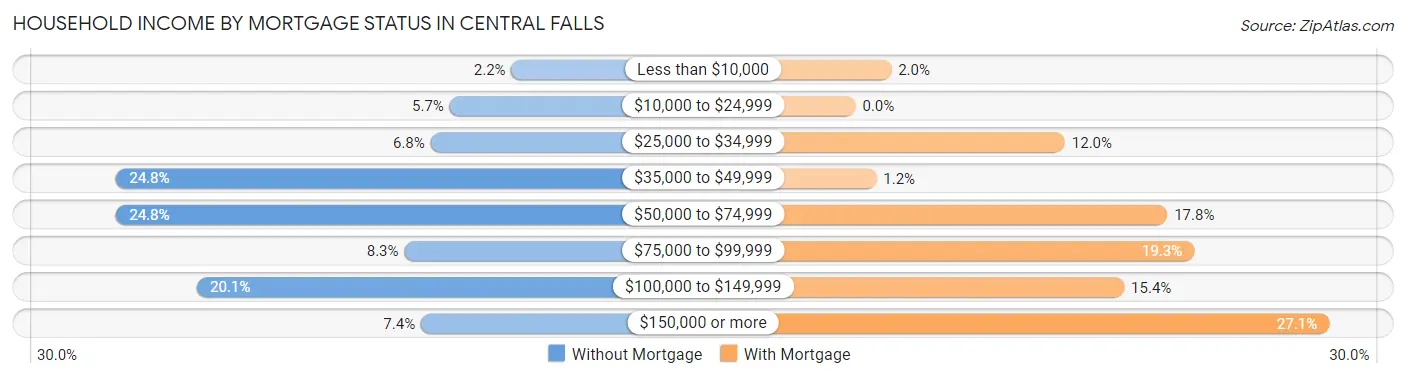
| Household Income | Without Mortgage | With Mortgage |
| Less than $10,000 | 16 (2.2%) | 24 (2.0%) |
| $10,000 to $24,999 | 42 (5.7%) | 0 (0.0%) |
| $25,000 to $34,999 | 50 (6.8%) | 141 (12.0%) |
| $35,000 to $49,999 | 182 (24.8%) | 14 (1.2%) |
| $50,000 to $74,999 | 182 (24.8%) | 210 (17.8%) |
| $75,000 to $99,999 | 61 (8.3%) | 228 (19.3%) |
| $100,000 to $149,999 | 148 (20.1%) | 181 (15.3%) |
| $150,000 or more | 54 (7.3%) | 319 (27.1%) |
| Total | 735 (100.0%) | 1,179 (100.0%) |
Property Value to Household Income Ratio in Central Falls
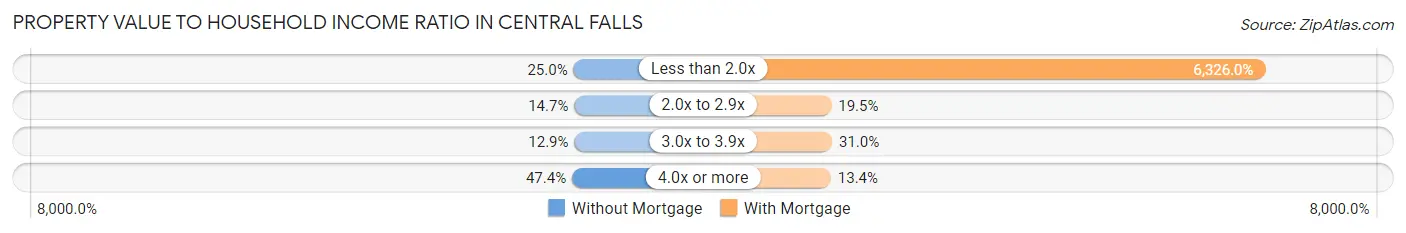
| Value-to-Income Ratio | Without Mortgage | With Mortgage |
| Less than 2.0x | 184 (25.0%) | 74,583 (6,326.0%) |
| 2.0x to 2.9x | 108 (14.7%) | 230 (19.5%) |
| 3.0x to 3.9x | 95 (12.9%) | 365 (31.0%) |
| 4.0x or more | 348 (47.3%) | 158 (13.4%) |
| Total | 735 (100.0%) | 1,179 (100.0%) |
Real Estate Taxes by Mortgage Status in Central Falls
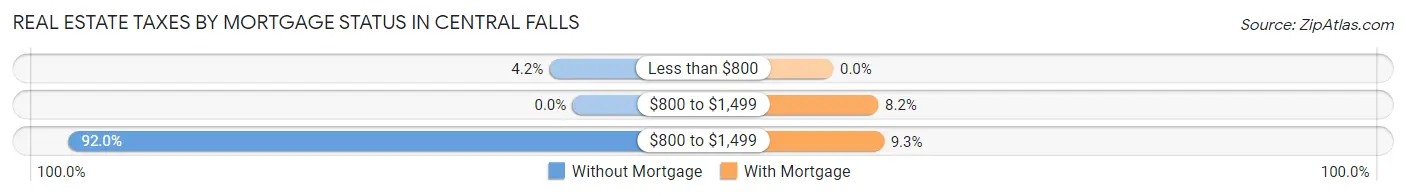
| Property Taxes | Without Mortgage | With Mortgage |
| Less than $800 | 31 (4.2%) | 0 (0.0%) |
| $800 to $1,499 | 0 (0.0%) | 97 (8.2%) |
| $800 to $1,499 | 676 (92.0%) | 109 (9.2%) |
| Total | 735 (100.0%) | 1,179 (100.0%) |
Health & Disability in Central Falls
Health Insurance Coverage by Age in Central Falls

| Age Bracket | With Coverage | Without Coverage |
| Under 6 Years | 2,122 (99.0%) | 21 (1.0%) |
| 6 to 18 Years | 4,177 (93.0%) | 313 (7.0%) |
| 19 to 25 Years | 1,774 (81.1%) | 413 (18.9%) |
| 26 to 34 Years | 2,655 (80.7%) | 633 (19.3%) |
| 35 to 44 Years | 2,064 (64.3%) | 1,146 (35.7%) |
| 45 to 54 Years | 1,799 (79.2%) | 473 (20.8%) |
| 55 to 64 Years | 2,226 (95.5%) | 106 (4.5%) |
| 65 to 74 Years | 1,128 (98.4%) | 18 (1.6%) |
| 75 Years and older | 627 (88.2%) | 84 (11.8%) |
| Total | 18,572 (85.3%) | 3,207 (14.7%) |
Health Insurance Coverage by Citizenship Status in Central Falls
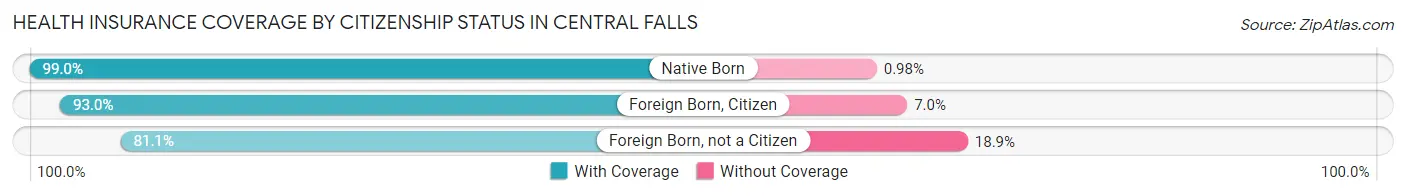
| Citizenship Status | With Coverage | Without Coverage |
| Native Born | 2,122 (99.0%) | 21 (1.0%) |
| Foreign Born, Citizen | 4,177 (93.0%) | 313 (7.0%) |
| Foreign Born, not a Citizen | 1,774 (81.1%) | 413 (18.9%) |
Health Insurance Coverage by Household Income in Central Falls
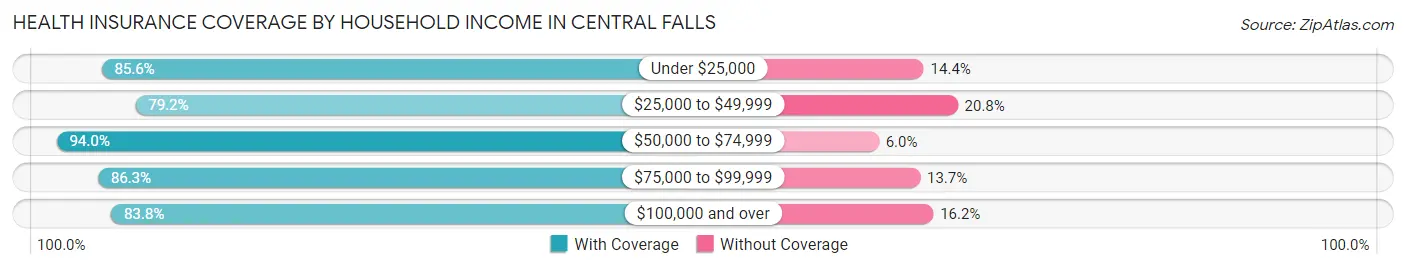
| Household Income | With Coverage | Without Coverage |
| Under $25,000 | 3,639 (85.6%) | 612 (14.4%) |
| $25,000 to $49,999 | 5,026 (79.2%) | 1,317 (20.8%) |
| $50,000 to $74,999 | 4,509 (94.0%) | 287 (6.0%) |
| $75,000 to $99,999 | 1,918 (86.3%) | 305 (13.7%) |
| $100,000 and over | 3,416 (83.8%) | 660 (16.2%) |
Public vs Private Health Insurance Coverage by Age in Central Falls
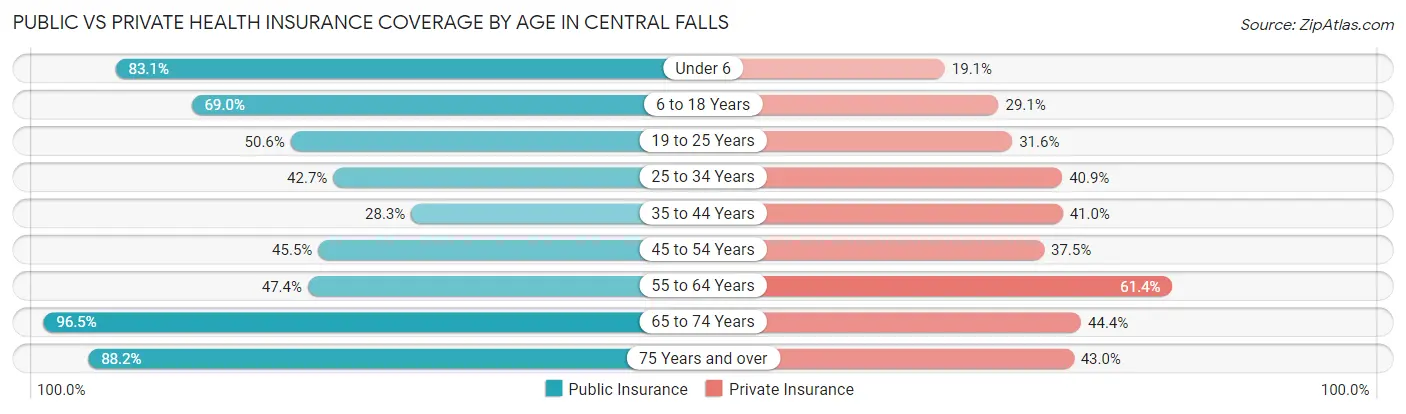
| Age Bracket | Public Insurance | Private Insurance |
| Under 6 | 1,781 (83.1%) | 410 (19.1%) |
| 6 to 18 Years | 3,099 (69.0%) | 1,306 (29.1%) |
| 19 to 25 Years | 1,107 (50.6%) | 692 (31.6%) |
| 25 to 34 Years | 1,405 (42.7%) | 1,345 (40.9%) |
| 35 to 44 Years | 907 (28.3%) | 1,316 (41.0%) |
| 45 to 54 Years | 1,034 (45.5%) | 853 (37.5%) |
| 55 to 64 Years | 1,106 (47.4%) | 1,431 (61.4%) |
| 65 to 74 Years | 1,106 (96.5%) | 509 (44.4%) |
| 75 Years and over | 627 (88.2%) | 306 (43.0%) |
| Total | 12,172 (55.9%) | 8,168 (37.5%) |
Disability Status by Sex by Age in Central Falls
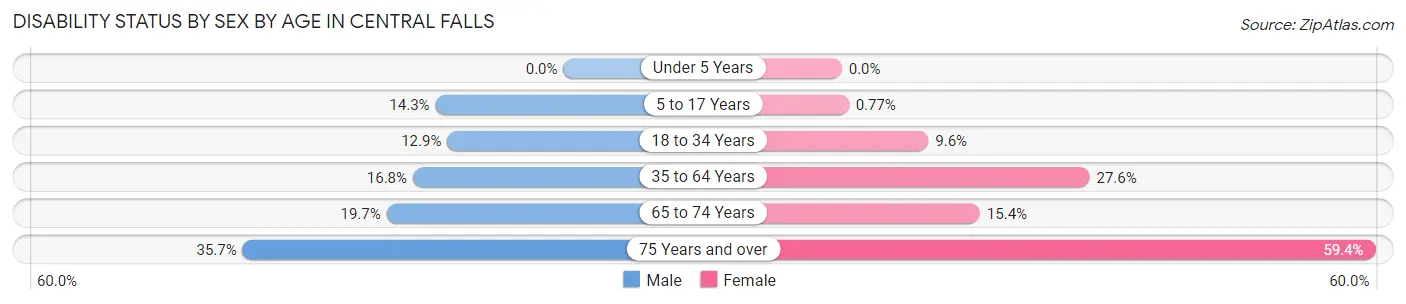
| Age Bracket | Male | Female |
| Under 5 Years | 0 (0.0%) | 0 (0.0%) |
| 5 to 17 Years | 336 (14.2%) | 16 (0.8%) |
| 18 to 34 Years | 429 (12.9%) | 240 (9.6%) |
| 35 to 64 Years | 655 (16.8%) | 1,078 (27.6%) |
| 65 to 74 Years | 90 (19.7%) | 106 (15.4%) |
| 75 Years and over | 129 (35.7%) | 208 (59.4%) |
Disability Class by Sex by Age in Central Falls
Disability Class: Hearing Difficulty
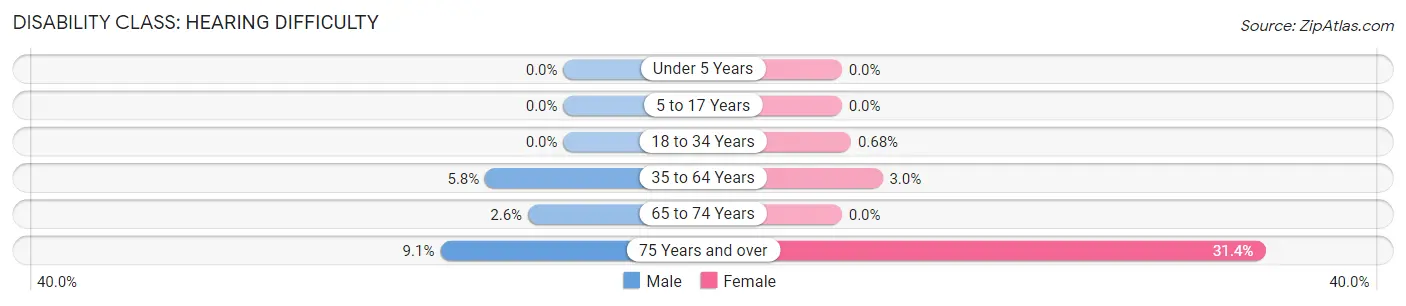
| Age Bracket | Male | Female |
| Under 5 Years | 0 (0.0%) | 0 (0.0%) |
| 5 to 17 Years | 0 (0.0%) | 0 (0.0%) |
| 18 to 34 Years | 0 (0.0%) | 17 (0.7%) |
| 35 to 64 Years | 227 (5.8%) | 118 (3.0%) |
| 65 to 74 Years | 12 (2.6%) | 0 (0.0%) |
| 75 Years and over | 33 (9.1%) | 110 (31.4%) |
Disability Class: Vision Difficulty
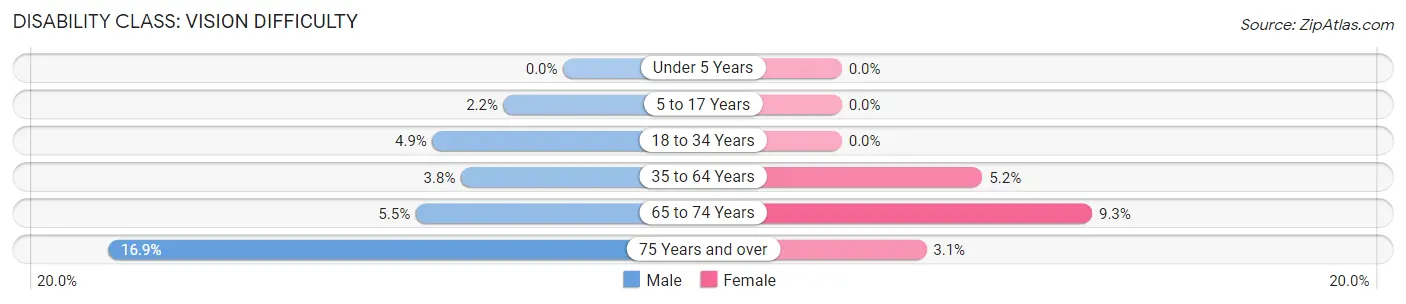
| Age Bracket | Male | Female |
| Under 5 Years | 0 (0.0%) | 0 (0.0%) |
| 5 to 17 Years | 52 (2.2%) | 0 (0.0%) |
| 18 to 34 Years | 161 (4.9%) | 0 (0.0%) |
| 35 to 64 Years | 148 (3.8%) | 204 (5.2%) |
| 65 to 74 Years | 25 (5.5%) | 64 (9.3%) |
| 75 Years and over | 61 (16.9%) | 11 (3.1%) |
Disability Class: Cognitive Difficulty
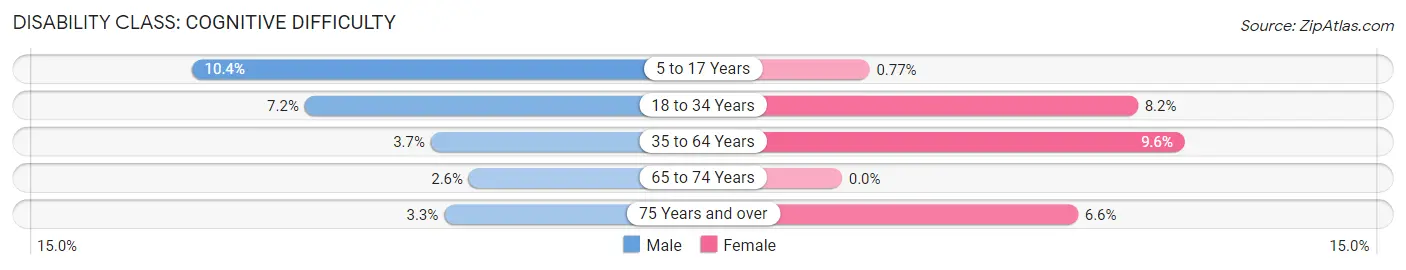
| Age Bracket | Male | Female |
| 5 to 17 Years | 244 (10.3%) | 16 (0.8%) |
| 18 to 34 Years | 239 (7.2%) | 205 (8.2%) |
| 35 to 64 Years | 144 (3.7%) | 373 (9.6%) |
| 65 to 74 Years | 12 (2.6%) | 0 (0.0%) |
| 75 Years and over | 12 (3.3%) | 23 (6.6%) |
Disability Class: Ambulatory Difficulty
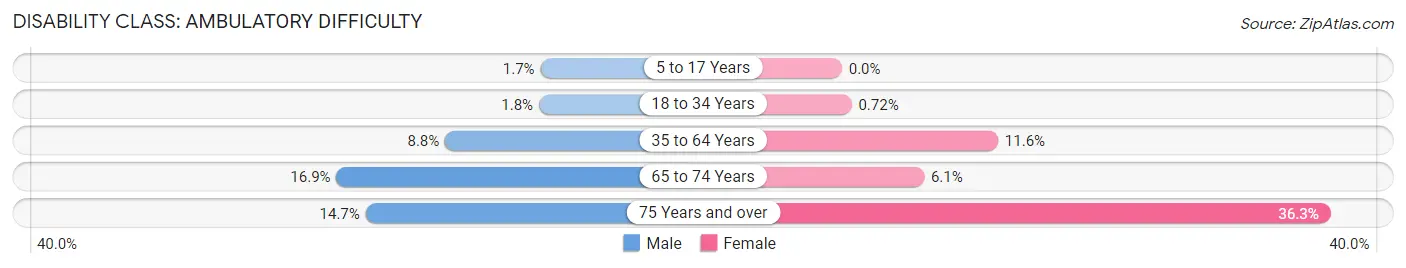
| Age Bracket | Male | Female |
| 5 to 17 Years | 40 (1.7%) | 0 (0.0%) |
| 18 to 34 Years | 60 (1.8%) | 18 (0.7%) |
| 35 to 64 Years | 343 (8.8%) | 453 (11.6%) |
| 65 to 74 Years | 77 (16.9%) | 42 (6.1%) |
| 75 Years and over | 53 (14.7%) | 127 (36.3%) |
Disability Class: Self-Care Difficulty
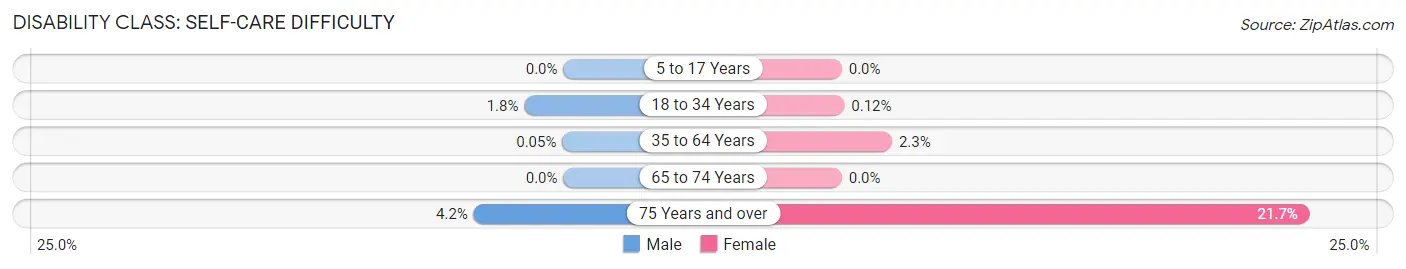
| Age Bracket | Male | Female |
| 5 to 17 Years | 0 (0.0%) | 0 (0.0%) |
| 18 to 34 Years | 60 (1.8%) | 3 (0.1%) |
| 35 to 64 Years | 2 (0.1%) | 91 (2.3%) |
| 65 to 74 Years | 0 (0.0%) | 0 (0.0%) |
| 75 Years and over | 15 (4.2%) | 76 (21.7%) |
Technology Access in Central Falls
Computing Device Access in Central Falls
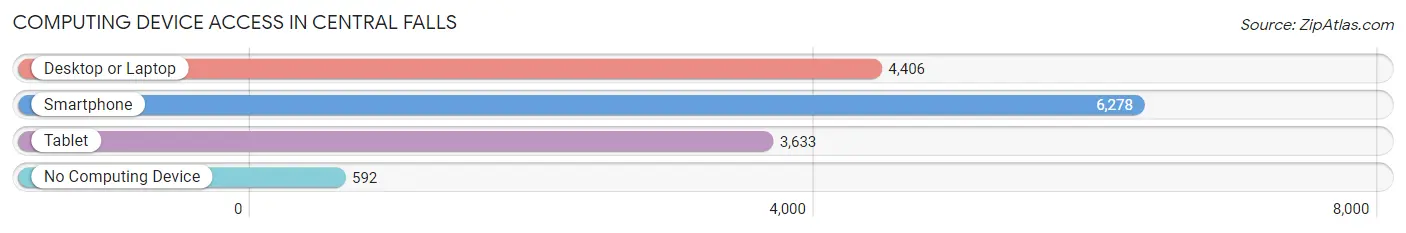
| Device Type | # Households | % Households |
| Desktop or Laptop | 4,406 | 59.9% |
| Smartphone | 6,278 | 85.3% |
| Tablet | 3,633 | 49.4% |
| No Computing Device | 592 | 8.1% |
| Total | 7,358 | 100.0% |
Internet Access in Central Falls
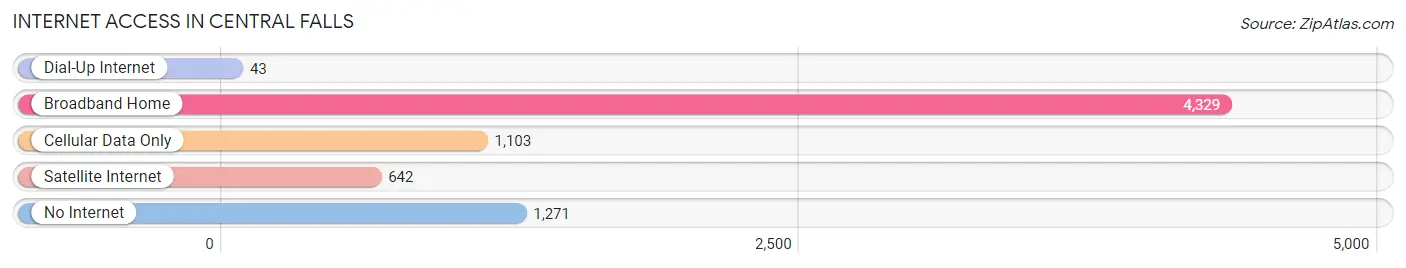
| Internet Type | # Households | % Households |
| Dial-Up Internet | 43 | 0.6% |
| Broadband Home | 4,329 | 58.8% |
| Cellular Data Only | 1,103 | 15.0% |
| Satellite Internet | 642 | 8.7% |
| No Internet | 1,271 | 17.3% |
| Total | 7,358 | 100.0% |
Central Falls Summary
History
The city of Central Falls, Rhode Island is located in Providence County and is the smallest city in the state. It is bordered by the cities of Pawtucket and Lincoln, as well as the towns of Cumberland and North Smithfield. Central Falls was originally part of the town of Smithfield, which was established in 1636. In 1895, the city was incorporated as the Town of Central Falls. The city was named after a waterfall on the Blackstone River, which was the source of power for the early mills in the area.
Central Falls has a long history of industrialization and manufacturing. In the 19th century, the city was home to several textile mills, which were powered by the Blackstone River. The city was also home to several paper mills, which were powered by the Woonasquatucket River. The city was also home to several rubber factories, which were powered by the Moshassuck River.
The city experienced a period of decline in the mid-20th century, as the mills and factories closed and the population decreased. In the late 20th century, the city experienced a period of revitalization, as new businesses and housing developments were built.
Geography
Central Falls is located in the Blackstone Valley region of Rhode Island. The city is situated on the banks of the Blackstone River, which is the source of power for the city’s early mills. The city is also bordered by the Woonasquatucket and Moshassuck Rivers.
The city has a total area of 1.3 square miles, all of which is land. The city is located at an elevation of approximately 50 feet above sea level.
Economy
Central Falls has a diverse economy, with a mix of manufacturing, retail, and service industries. The city is home to several manufacturing companies, including a paper mill, a rubber factory, and a plastics factory. The city is also home to several retail stores, restaurants, and other businesses.
The city is also home to several educational institutions, including the Central Falls School District, the Community College of Rhode Island, and the Rhode Island School of Design.
Demographics
As of the 2010 census, the city of Central Falls had a population of 19,376. The population is racially and ethnically diverse, with a majority of the population being Hispanic or Latino (63.3%). The city also has a large population of African Americans (17.2%) and Asians (7.2%).
The median household income in Central Falls is $30,945, which is lower than the state median of $60,839. The median home value in Central Falls is $153,400, which is lower than the state median of $248,400.
Conclusion
Central Falls is a small city in Rhode Island with a long history of industrialization and manufacturing. The city has experienced a period of revitalization in recent years, with new businesses and housing developments being built. The city has a diverse economy, with a mix of manufacturing, retail, and service industries. The population of Central Falls is racially and ethnically diverse, with a majority of the population being Hispanic or Latino. The median household income in Central Falls is lower than the state median, and the median home value is also lower than the state median.
Common Questions
What is Per Capita Income in Central Falls?
Per Capita income in Central Falls is $19,552.
What is the Median Family Income in Central Falls?
Median Family Income in Central Falls is $47,716.
What is the Median Household income in Central Falls?
Median Household Income in Central Falls is $43,092.
What is Income or Wage Gap in Central Falls?
Income or Wage Gap in Central Falls is 26.1%.
Women in Central Falls earn 73.9 cents for every dollar earned by a man.
What is Family Income Deficit in Central Falls?
Family Income Deficit in Central Falls is $9,470.
Families that are below poverty line in Central Falls earn $9,470 less on average than the poverty threshold level.
What is Inequality or Gini Index in Central Falls?
Inequality or Gini Index in Central Falls is 0.42.
What is the Total Population of Central Falls?
Total Population of Central Falls is 22,359.
What is the Total Male Population of Central Falls?
Total Male Population of Central Falls is 11,847.
What is the Total Female Population of Central Falls?
Total Female Population of Central Falls is 10,512.
What is the Ratio of Males per 100 Females in Central Falls?
There are 112.70 Males per 100 Females in Central Falls.
What is the Ratio of Females per 100 Males in Central Falls?
There are 88.73 Females per 100 Males in Central Falls.
What is the Median Population Age in Central Falls?
Median Population Age in Central Falls is 31.5 Years.
What is the Average Family Size in Central Falls
Average Family Size in Central Falls is 3.5 People.
What is the Average Household Size in Central Falls
Average Household Size in Central Falls is 3.0 People.
How Large is the Labor Force in Central Falls?
There are 10,533 People in the Labor Forcein in Central Falls.
What is the Percentage of People in the Labor Force in Central Falls?
62.0% of People are in the Labor Force in Central Falls.
What is the Unemployment Rate in Central Falls?
Unemployment Rate in Central Falls is 8.3%.