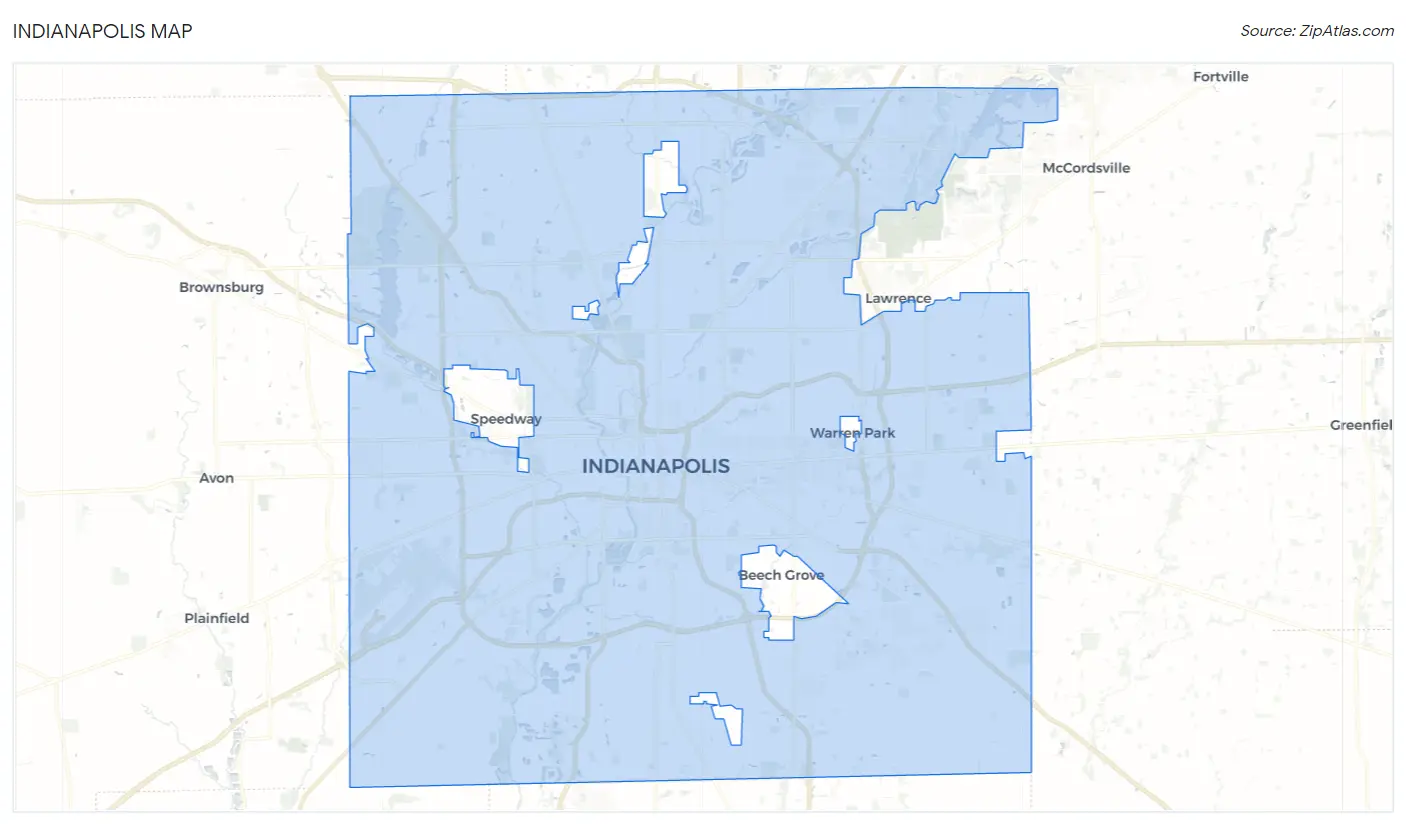
Indianapolis, IN Map & Demographics
Indianapolis Map
Indianapolis Overview
$34,592
PER CAPITA INCOME
$75,991
AVG FAMILY INCOME
$59,110
AVG HOUSEHOLD INCOME
18.9%
WAGE / INCOME GAP [ % ]
81.1¢/ $1
WAGE / INCOME GAP [ $ ]
$12,098
FAMILY INCOME DEFICIT
0.48
INEQUALITY / GINI INDEX
882,006
TOTAL POPULATION
428,950
MALE POPULATION
453,056
FEMALE POPULATION
94.68
MALES / 100 FEMALES
105.62
FEMALES / 100 MALES
34.3
MEDIAN AGE
3.3
AVG FAMILY SIZE
2.4
AVG HOUSEHOLD SIZE
463,306
LABOR FORCE [ PEOPLE ]
67.2%
PERCENT IN LABOR FORCE
5.6%
UNEMPLOYMENT RATE
Indianapolis Zip Codes
Income in Indianapolis
Income Overview in Indianapolis
Per Capita Income in Indianapolis is $34,592, while median incomes of families and households are $75,991 and $59,110 respectively.
| Characteristic | Number | Measure |
| Per Capita Income | 882,006 | $34,592 |
| Median Family Income | 194,451 | $75,991 |
| Mean Family Income | 194,451 | $101,747 |
| Median Household Income | 356,357 | $59,110 |
| Mean Household Income | 356,357 | $82,697 |
| Income Deficit | 194,451 | $12,098 |
| Wage / Income Gap (%) | 882,006 | 18.92% |
| Wage / Income Gap ($) | 882,006 | 81.08¢ per $1 |
| Gini / Inequality Index | 882,006 | 0.48 |
Earnings by Sex in Indianapolis
Average Earnings in Indianapolis are $39,080, $43,000 for men and $34,864 for women, a difference of 18.9%.
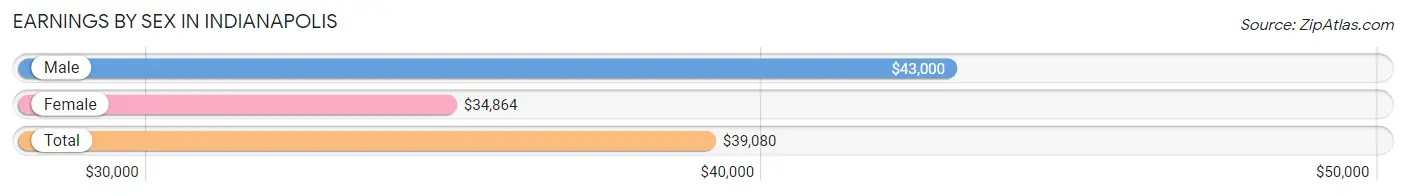
| Sex | Number | Average Earnings |
| Male | 243,239 (50.5%) | $43,000 |
| Female | 238,578 (49.5%) | $34,864 |
| Total | 481,817 (100.0%) | $39,080 |
Earnings by Sex by Income Bracket in Indianapolis
The most common earnings brackets in Indianapolis are $100,000+ for men (30,650 | 12.6%) and $75,000 to $99,999 for women (17,397 | 7.3%).
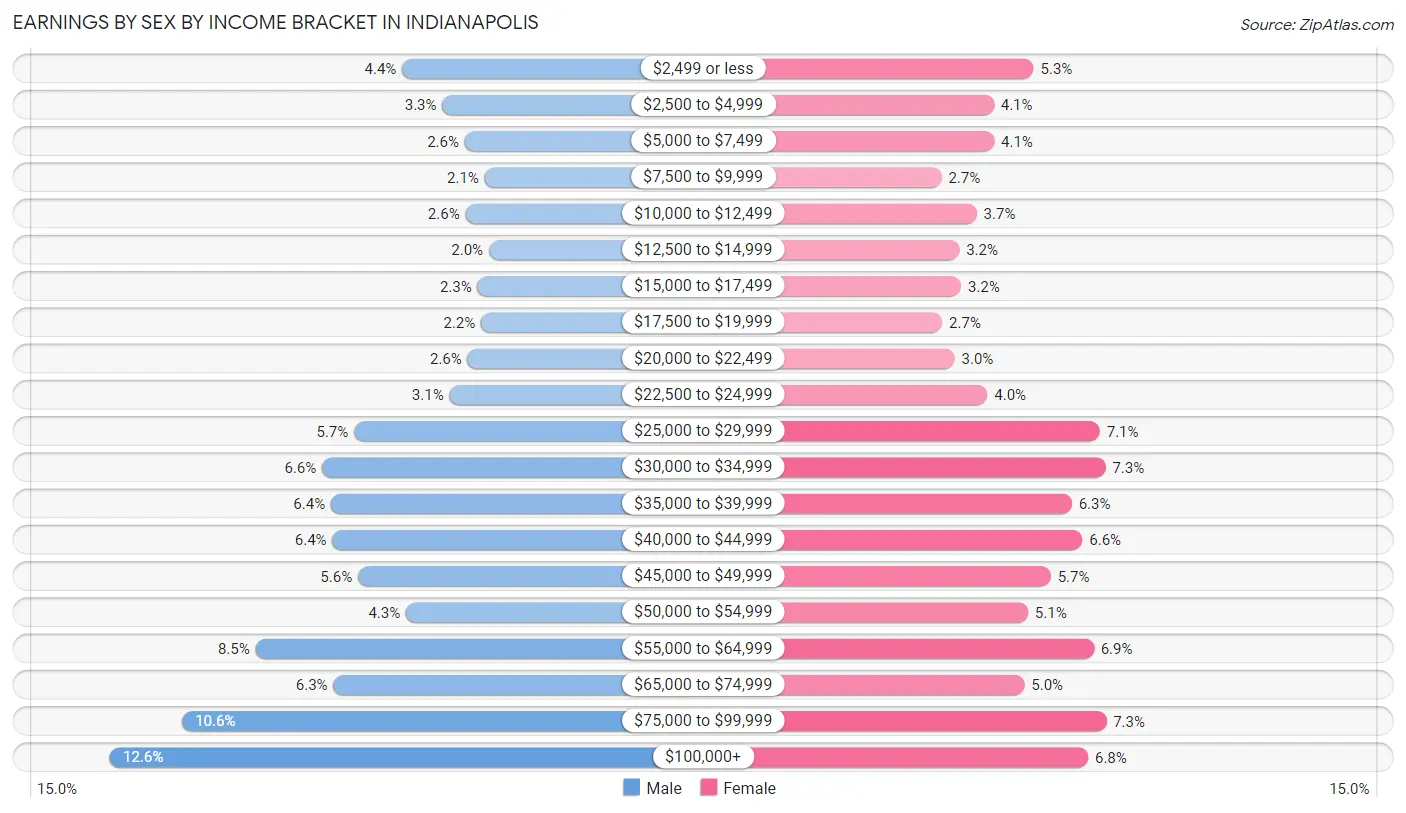
| Income | Male | Female |
| $2,499 or less | 10,681 (4.4%) | 12,532 (5.2%) |
| $2,500 to $4,999 | 7,918 (3.3%) | 9,851 (4.1%) |
| $5,000 to $7,499 | 6,393 (2.6%) | 9,872 (4.1%) |
| $7,500 to $9,999 | 5,042 (2.1%) | 6,356 (2.7%) |
| $10,000 to $12,499 | 6,349 (2.6%) | 8,704 (3.6%) |
| $12,500 to $14,999 | 4,755 (1.9%) | 7,536 (3.2%) |
| $15,000 to $17,499 | 5,522 (2.3%) | 7,653 (3.2%) |
| $17,500 to $19,999 | 5,289 (2.2%) | 6,393 (2.7%) |
| $20,000 to $22,499 | 6,211 (2.5%) | 7,222 (3.0%) |
| $22,500 to $24,999 | 7,445 (3.1%) | 9,431 (4.0%) |
| $25,000 to $29,999 | 13,963 (5.7%) | 16,953 (7.1%) |
| $30,000 to $34,999 | 16,142 (6.6%) | 17,352 (7.3%) |
| $35,000 to $39,999 | 15,549 (6.4%) | 15,076 (6.3%) |
| $40,000 to $44,999 | 15,443 (6.4%) | 15,783 (6.6%) |
| $45,000 to $49,999 | 13,698 (5.6%) | 13,679 (5.7%) |
| $50,000 to $54,999 | 10,403 (4.3%) | 12,138 (5.1%) |
| $55,000 to $64,999 | 20,703 (8.5%) | 16,563 (6.9%) |
| $65,000 to $74,999 | 15,376 (6.3%) | 11,902 (5.0%) |
| $75,000 to $99,999 | 25,707 (10.6%) | 17,397 (7.3%) |
| $100,000+ | 30,650 (12.6%) | 16,185 (6.8%) |
| Total | 243,239 (100.0%) | 238,578 (100.0%) |
Earnings by Sex by Educational Attainment in Indianapolis
Average earnings in Indianapolis are $48,230 for men and $39,662 for women, a difference of 17.8%. Men with an educational attainment of graduate degree enjoy the highest average annual earnings of $81,298, while those with less than high school education earn the least with $33,860. Women with an educational attainment of graduate degree earn the most with the average annual earnings of $67,053, while those with less than high school education have the smallest earnings of $23,296.
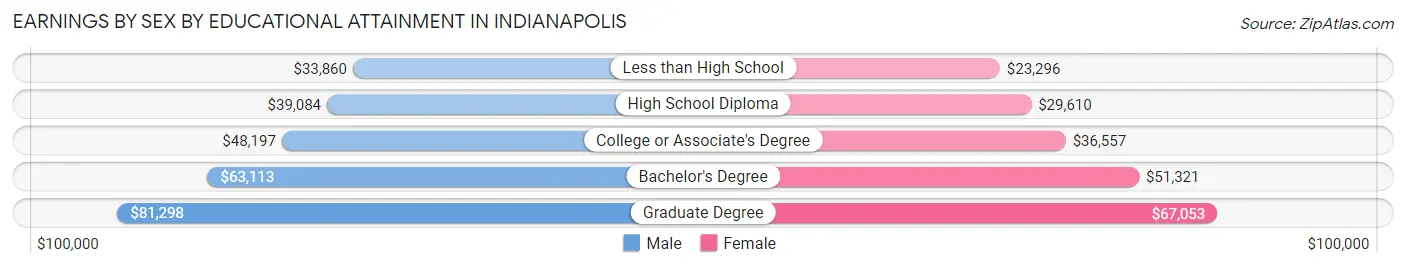
| Educational Attainment | Male Income | Female Income |
| Less than High School | $33,860 | $23,296 |
| High School Diploma | $39,084 | $29,610 |
| College or Associate's Degree | $48,197 | $36,557 |
| Bachelor's Degree | $63,113 | $51,321 |
| Graduate Degree | $81,298 | $67,053 |
| Total | $48,230 | $39,662 |
Family Income in Indianapolis
Family Income Brackets in Indianapolis
According to the Indianapolis family income data, there are 35,973 families falling into the $100,000 to $149,999 income range, which is the most common income bracket and makes up 18.5% of all families. Conversely, the $10,000 to $14,999 income bracket is the least frequent group with only 4,861 families (2.5%) belonging to this category.
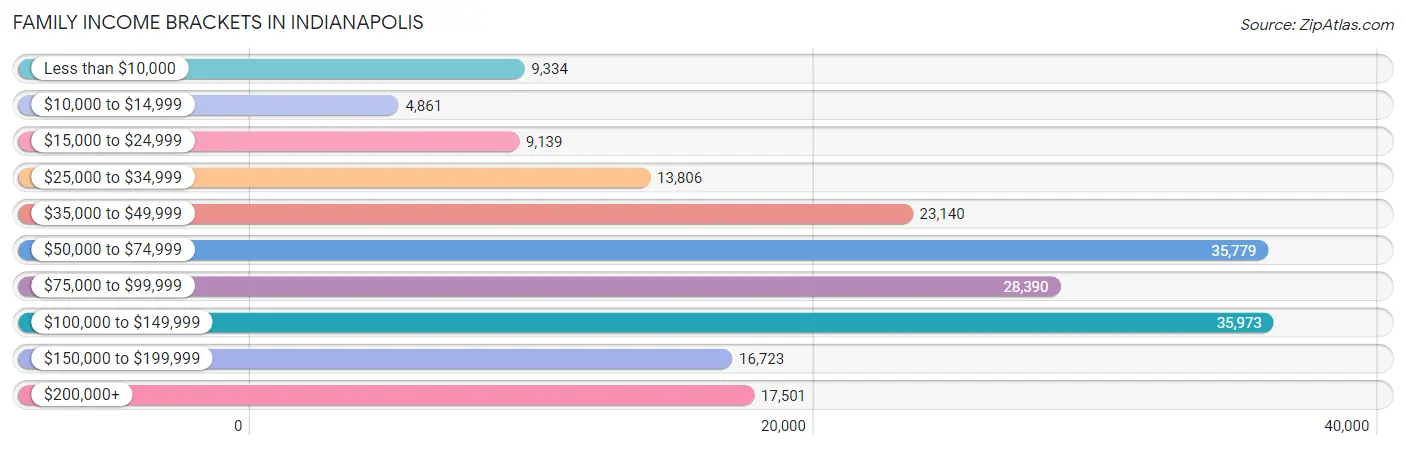
| Income Bracket | # Families | % Families |
| Less than $10,000 | 9,334 | 4.8% |
| $10,000 to $14,999 | 4,861 | 2.5% |
| $15,000 to $24,999 | 9,139 | 4.7% |
| $25,000 to $34,999 | 13,806 | 7.1% |
| $35,000 to $49,999 | 23,140 | 11.9% |
| $50,000 to $74,999 | 35,779 | 18.4% |
| $75,000 to $99,999 | 28,390 | 14.6% |
| $100,000 to $149,999 | 35,973 | 18.5% |
| $150,000 to $199,999 | 16,723 | 8.6% |
| $200,000+ | 17,501 | 9.0% |
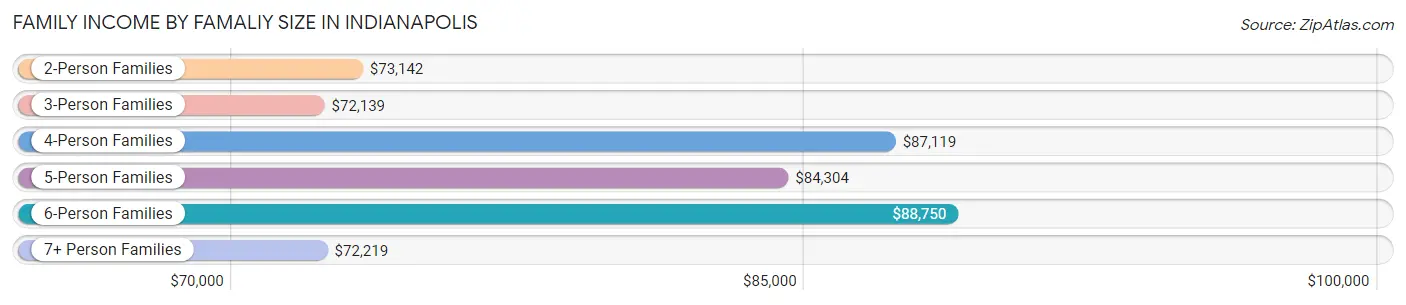
Family Income by Famaliy Size in Indianapolis
6-person families (5,710 | 2.9%) account for the highest median family income in Indianapolis with $88,750 per family, while 2-person families (95,480 | 49.1%) have the highest median income of $36,571 per family member.
| Income Bracket | # Families | Median Income |
| 2-Person Families | 95,480 (49.1%) | $73,142 |
| 3-Person Families | 43,633 (22.4%) | $72,139 |
| 4-Person Families | 30,045 (15.4%) | $87,119 |
| 5-Person Families | 15,795 (8.1%) | $84,304 |
| 6-Person Families | 5,710 (2.9%) | $88,750 |
| 7+ Person Families | 3,788 (1.9%) | $72,219 |
| Total | 194,451 (100.0%) | $75,991 |
Family Income by Number of Earners in Indianapolis
The median family income in Indianapolis is $75,991, with families comprising 3+ earners (18,909) having the highest median family income of $123,017, while families with no earners (24,331) have the lowest median family income of $39,072, accounting for 9.7% and 12.5% of families, respectively.
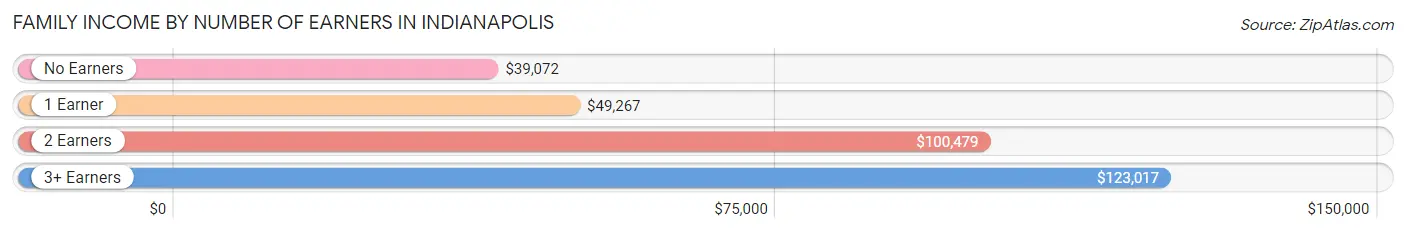
| Number of Earners | # Families | Median Income |
| No Earners | 24,331 (12.5%) | $39,072 |
| 1 Earner | 65,982 (33.9%) | $49,267 |
| 2 Earners | 85,229 (43.8%) | $100,479 |
| 3+ Earners | 18,909 (9.7%) | $123,017 |
| Total | 194,451 (100.0%) | $75,991 |
Household Income in Indianapolis
Household Income Brackets in Indianapolis
With 64,857 households falling in the category, the $50,000 to $74,999 income range is the most frequent in Indianapolis, accounting for 18.2% of all households. In contrast, only 14,967 households (4.2%) fall into the $10,000 to $14,999 income bracket, making it the least populous group.
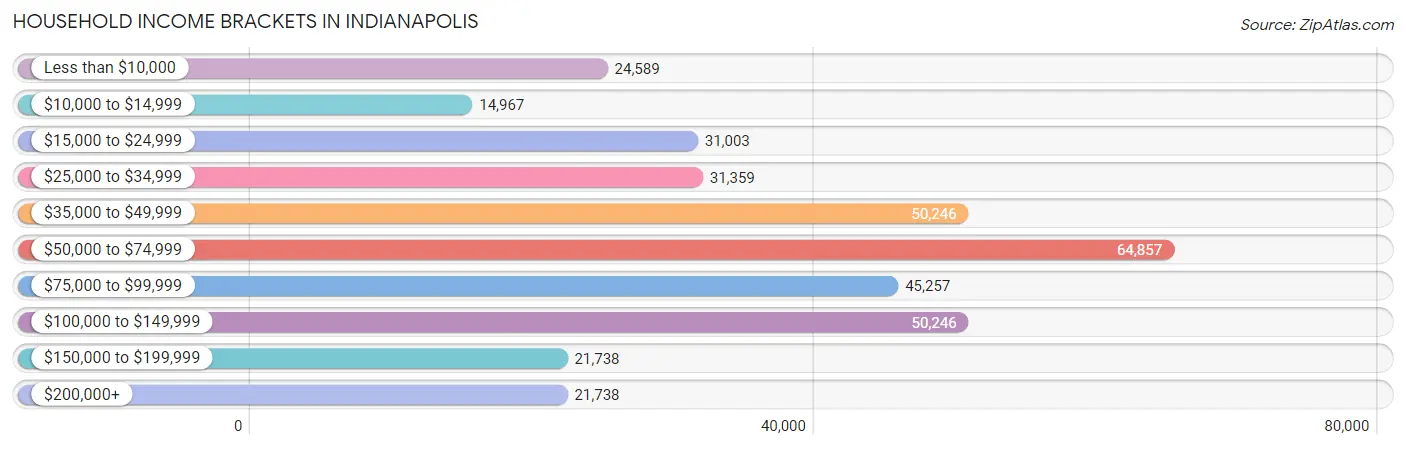
| Income Bracket | # Households | % Households |
| Less than $10,000 | 24,589 | 6.9% |
| $10,000 to $14,999 | 14,967 | 4.2% |
| $15,000 to $24,999 | 31,003 | 8.7% |
| $25,000 to $34,999 | 31,359 | 8.8% |
| $35,000 to $49,999 | 50,246 | 14.1% |
| $50,000 to $74,999 | 64,857 | 18.2% |
| $75,000 to $99,999 | 45,257 | 12.7% |
| $100,000 to $149,999 | 50,246 | 14.1% |
| $150,000 to $199,999 | 21,738 | 6.1% |
| $200,000+ | 21,738 | 6.1% |
Household Income by Householder Age in Indianapolis
The median household income in Indianapolis is $59,110, with the highest median household income of $67,954 found in the 45 to 64 years age bracket for the primary householder. A total of 122,673 households (34.4%) fall into this category. Meanwhile, the 15 to 24 years age bracket for the primary householder has the lowest median household income of $37,535, with 20,074 households (5.6%) in this group.
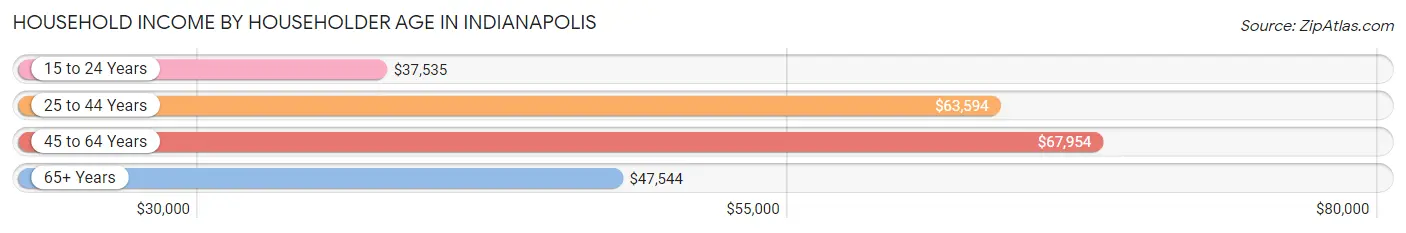
| Income Bracket | # Households | Median Income |
| 15 to 24 Years | 20,074 (5.6%) | $37,535 |
| 25 to 44 Years | 140,877 (39.5%) | $63,594 |
| 45 to 64 Years | 122,673 (34.4%) | $67,954 |
| 65+ Years | 72,733 (20.4%) | $47,544 |
| Total | 356,357 (100.0%) | $59,110 |
Poverty in Indianapolis
Income Below Poverty by Sex and Age in Indianapolis
With 14.4% poverty level for males and 17.2% for females among the residents of Indianapolis, under 5 year old males and 5 year old females are the most vulnerable to poverty, with 7,182 males (23.3%) and 1,703 females (34.5%) in their respective age groups living below the poverty level.
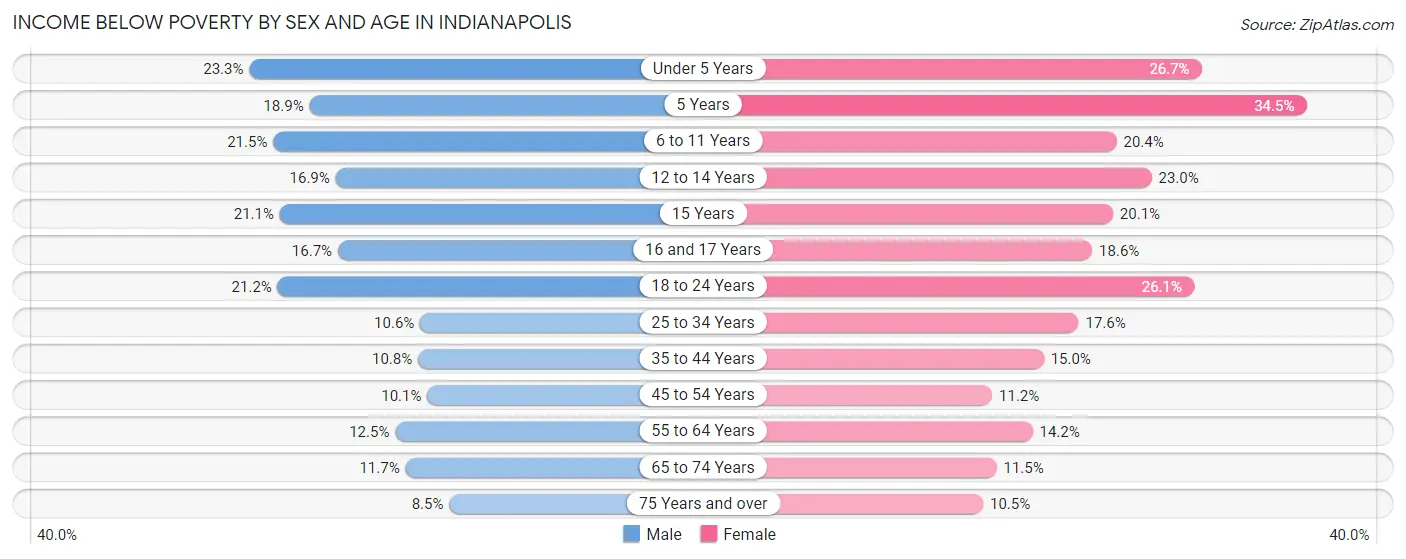
| Age Bracket | Male | Female |
| Under 5 Years | 7,182 (23.3%) | 7,892 (26.7%) |
| 5 Years | 1,227 (18.9%) | 1,703 (34.5%) |
| 6 to 11 Years | 7,868 (21.5%) | 6,739 (20.4%) |
| 12 to 14 Years | 2,870 (16.9%) | 4,109 (23.0%) |
| 15 Years | 1,188 (21.0%) | 1,104 (20.1%) |
| 16 and 17 Years | 2,062 (16.7%) | 2,030 (18.6%) |
| 18 to 24 Years | 8,511 (21.2%) | 10,816 (26.1%) |
| 25 to 34 Years | 7,550 (10.6%) | 13,281 (17.6%) |
| 35 to 44 Years | 6,052 (10.8%) | 8,701 (15.0%) |
| 45 to 54 Years | 4,901 (10.1%) | 5,697 (11.2%) |
| 55 to 64 Years | 6,099 (12.5%) | 7,541 (14.2%) |
| 65 to 74 Years | 3,642 (11.7%) | 4,307 (11.5%) |
| 75 Years and over | 1,340 (8.5%) | 2,633 (10.5%) |
| Total | 60,492 (14.4%) | 76,553 (17.2%) |
Income Above Poverty by Sex and Age in Indianapolis
According to the poverty statistics in Indianapolis, males aged 75 years and over and females aged 75 years and over are the age groups that are most secure financially, with 91.5% of males and 89.5% of females in these age groups living above the poverty line.
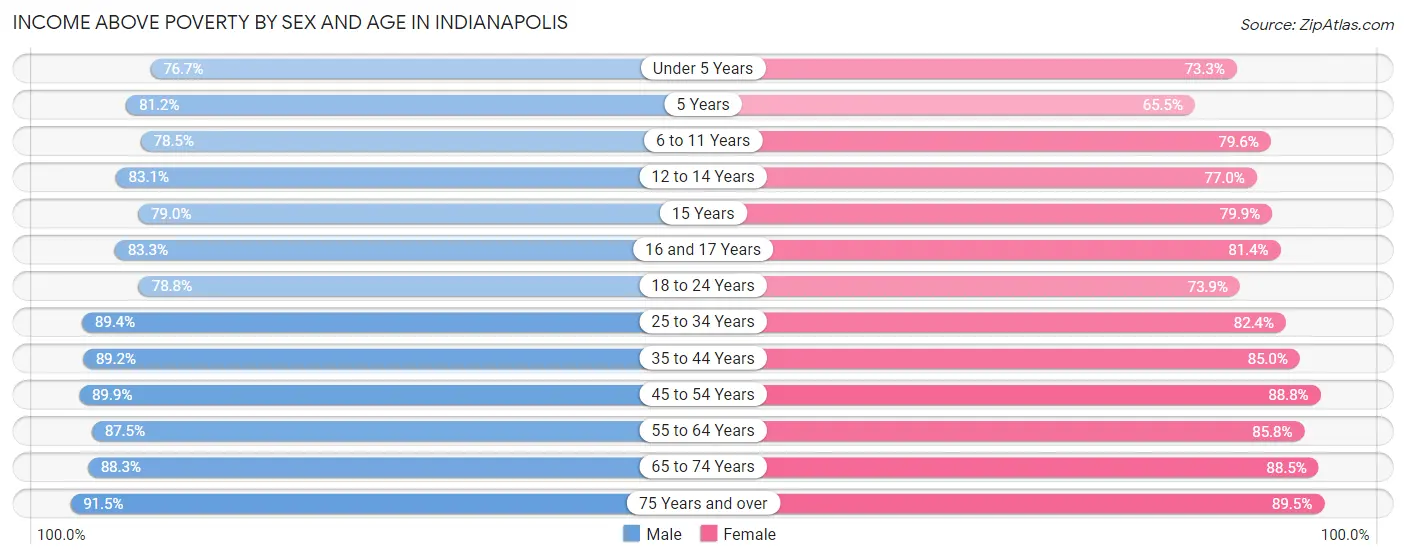
| Age Bracket | Male | Female |
| Under 5 Years | 23,620 (76.7%) | 21,663 (73.3%) |
| 5 Years | 5,282 (81.1%) | 3,236 (65.5%) |
| 6 to 11 Years | 28,655 (78.5%) | 26,294 (79.6%) |
| 12 to 14 Years | 14,098 (83.1%) | 13,755 (77.0%) |
| 15 Years | 4,455 (78.9%) | 4,379 (79.9%) |
| 16 and 17 Years | 10,259 (83.3%) | 8,890 (81.4%) |
| 18 to 24 Years | 31,616 (78.8%) | 30,576 (73.9%) |
| 25 to 34 Years | 63,507 (89.4%) | 62,278 (82.4%) |
| 35 to 44 Years | 50,012 (89.2%) | 49,343 (85.0%) |
| 45 to 54 Years | 43,640 (89.9%) | 45,332 (88.8%) |
| 55 to 64 Years | 42,771 (87.5%) | 45,717 (85.8%) |
| 65 to 74 Years | 27,446 (88.3%) | 33,174 (88.5%) |
| 75 Years and over | 14,477 (91.5%) | 22,478 (89.5%) |
| Total | 359,838 (85.6%) | 367,115 (82.8%) |
Income Below Poverty Among Married-Couple Families in Indianapolis
The poverty statistics for married-couple families in Indianapolis show that 4.7% or 5,989 of the total 126,966 families live below the poverty line. Families with 5 or more children have the highest poverty rate of 25.2%, comprising of 259 families. On the other hand, families with no children have the lowest poverty rate of 3.2%, which includes 2,422 families.
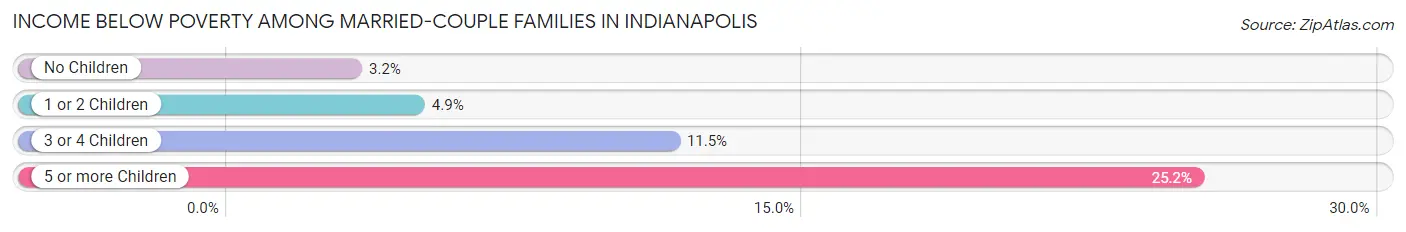
| Children | Above Poverty | Below Poverty |
| No Children | 72,242 (96.8%) | 2,422 (3.2%) |
| 1 or 2 Children | 37,242 (95.1%) | 1,909 (4.9%) |
| 3 or 4 Children | 10,725 (88.5%) | 1,399 (11.5%) |
| 5 or more Children | 768 (74.8%) | 259 (25.2%) |
| Total | 120,977 (95.3%) | 5,989 (4.7%) |
Income Below Poverty Among Single-Parent Households in Indianapolis
According to the poverty data in Indianapolis, 13.0% or 2,174 single-father households and 28.0% or 14,222 single-mother households are living below the poverty line. Among single-father households, those with 5 or more children have the highest poverty rate, with 30 households (31.2%) experiencing poverty. Likewise, among single-mother households, those with 5 or more children have the highest poverty rate, with 469 households (73.2%) falling below the poverty line.
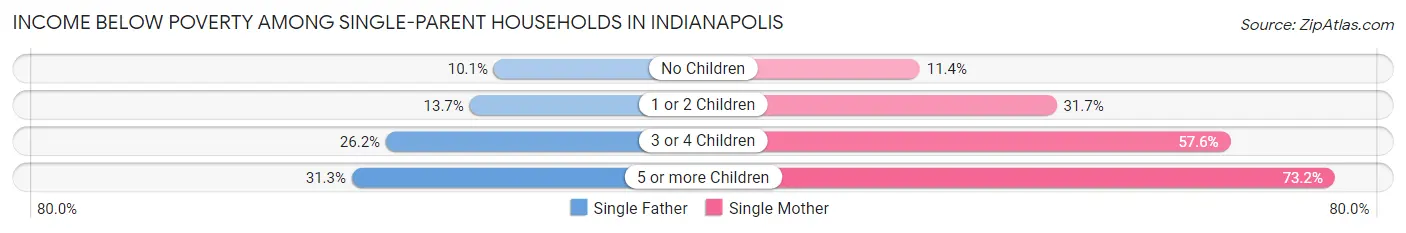
| Children | Single Father | Single Mother |
| No Children | 760 (10.1%) | 1,961 (11.4%) |
| 1 or 2 Children | 1,092 (13.7%) | 8,725 (31.7%) |
| 3 or 4 Children | 292 (26.2%) | 3,067 (57.6%) |
| 5 or more Children | 30 (31.2%) | 469 (73.2%) |
| Total | 2,174 (13.0%) | 14,222 (28.0%) |
Income Below Poverty Among Married-Couple vs Single-Parent Households in Indianapolis
The poverty data for Indianapolis shows that 5,989 of the married-couple family households (4.7%) and 16,396 of the single-parent households (24.3%) are living below the poverty level. Within the married-couple family households, those with 5 or more children have the highest poverty rate, with 259 households (25.2%) falling below the poverty line. Among the single-parent households, those with 5 or more children have the highest poverty rate, with 499 household (67.7%) living below poverty.
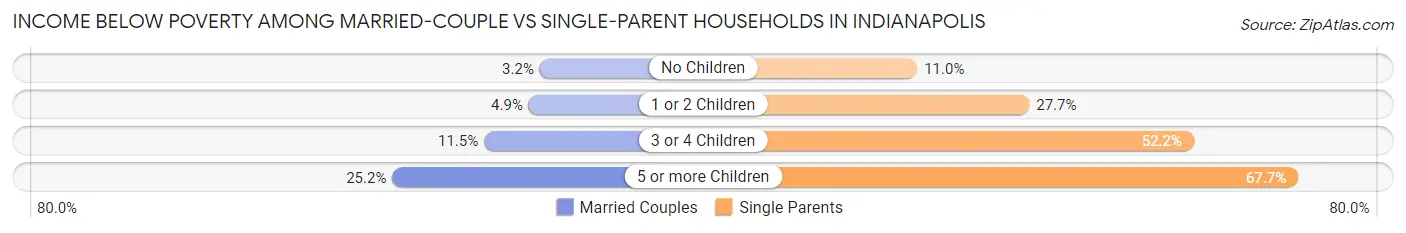
| Children | Married-Couple Families | Single-Parent Households |
| No Children | 2,422 (3.2%) | 2,721 (11.0%) |
| 1 or 2 Children | 1,909 (4.9%) | 9,817 (27.7%) |
| 3 or 4 Children | 1,399 (11.5%) | 3,359 (52.2%) |
| 5 or more Children | 259 (25.2%) | 499 (67.7%) |
| Total | 5,989 (4.7%) | 16,396 (24.3%) |
Race in Indianapolis
The most populous races in Indianapolis are White / Caucasian (491,429 | 55.7%), Black / African American (254,390 | 28.8%), and Hispanic or Latino (96,262 | 10.9%).
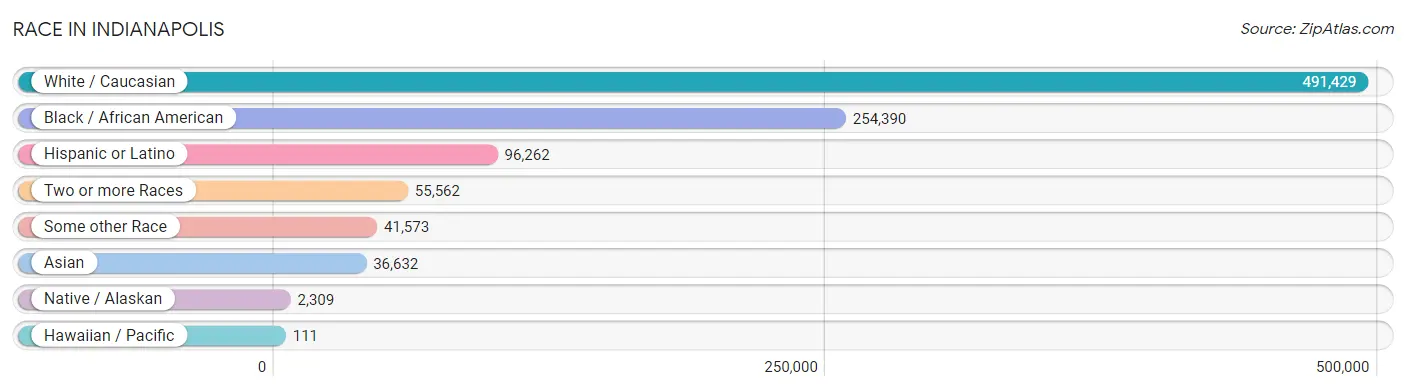
| Race | # Population | % Population |
| Asian | 36,632 | 4.2% |
| Black / African American | 254,390 | 28.8% |
| Hawaiian / Pacific | 111 | 0.0% |
| Hispanic or Latino | 96,262 | 10.9% |
| Native / Alaskan | 2,309 | 0.3% |
| White / Caucasian | 491,429 | 55.7% |
| Two or more Races | 55,562 | 6.3% |
| Some other Race | 41,573 | 4.7% |
| Total | 882,006 | 100.0% |
Ancestry in Indianapolis
The most populous ancestries reported in Indianapolis are German (113,280 | 12.8%), Irish (69,130 | 7.8%), English (66,632 | 7.5%), Mexican (65,276 | 7.4%), and American (43,189 | 4.9%), together accounting for 40.5% of all Indianapolis residents.
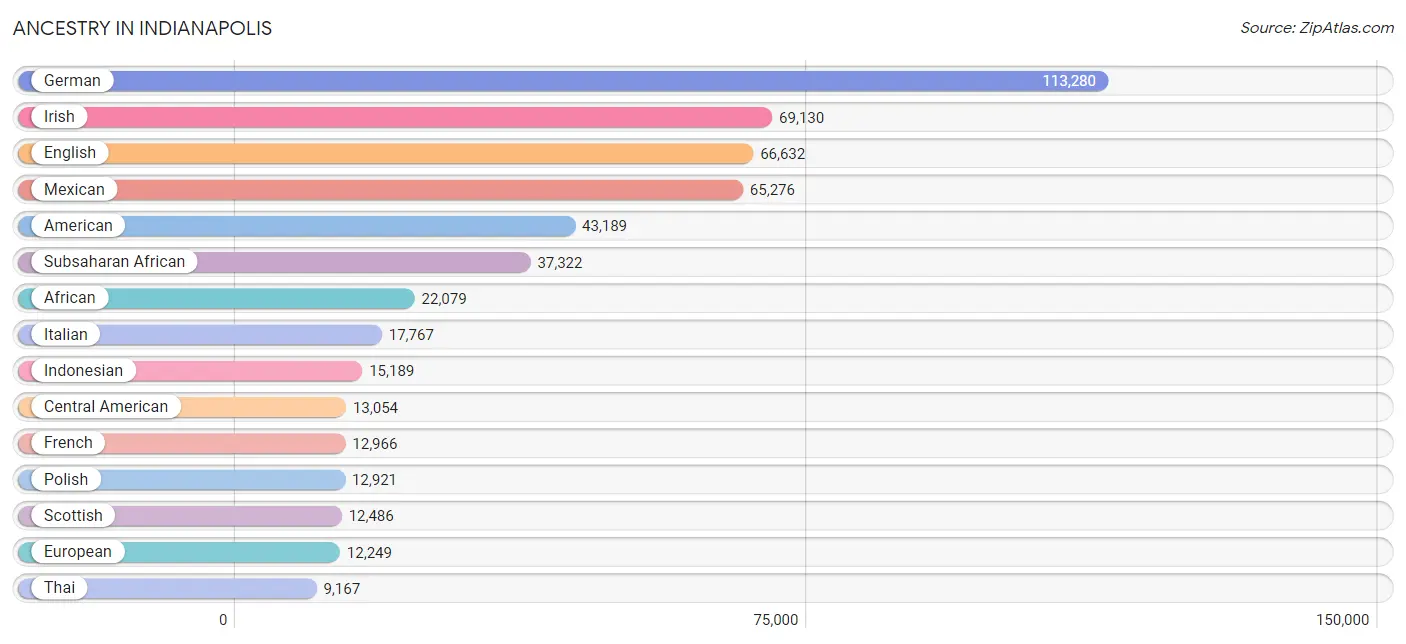
| Ancestry | # Population | % Population |
| Afghan | 111 | 0.0% |
| African | 22,079 | 2.5% |
| Alaskan Athabascan | 112 | 0.0% |
| Albanian | 15 | 0.0% |
| Alsatian | 2 | 0.0% |
| American | 43,189 | 4.9% |
| Apache | 37 | 0.0% |
| Arab | 3,392 | 0.4% |
| Arapaho | 37 | 0.0% |
| Argentinean | 160 | 0.0% |
| Armenian | 252 | 0.0% |
| Australian | 146 | 0.0% |
| Austrian | 1,089 | 0.1% |
| Bahamian | 83 | 0.0% |
| Bangladeshi | 180 | 0.0% |
| Barbadian | 212 | 0.0% |
| Basque | 38 | 0.0% |
| Belgian | 1,081 | 0.1% |
| Belizean | 27 | 0.0% |
| Bhutanese | 1,908 | 0.2% |
| Blackfeet | 265 | 0.0% |
| Bolivian | 28 | 0.0% |
| Brazilian | 343 | 0.0% |
| British | 4,149 | 0.5% |
| British West Indian | 28 | 0.0% |
| Bulgarian | 112 | 0.0% |
| Burmese | 2,074 | 0.2% |
| Cajun | 54 | 0.0% |
| Canadian | 487 | 0.1% |
| Cape Verdean | 21 | 0.0% |
| Carpatho Rusyn | 24 | 0.0% |
| Celtic | 110 | 0.0% |
| Central American | 13,054 | 1.5% |
| Central American Indian | 404 | 0.1% |
| Cherokee | 2,372 | 0.3% |
| Chickasaw | 13 | 0.0% |
| Chilean | 155 | 0.0% |
| Chinese | 20 | 0.0% |
| Chippewa | 153 | 0.0% |
| Choctaw | 182 | 0.0% |
| Colombian | 707 | 0.1% |
| Costa Rican | 152 | 0.0% |
| Cree | 16 | 0.0% |
| Creek | 7 | 0.0% |
| Croatian | 649 | 0.1% |
| Crow | 28 | 0.0% |
| Cuban | 1,940 | 0.2% |
| Cypriot | 32 | 0.0% |
| Czech | 1,213 | 0.1% |
| Czechoslovakian | 256 | 0.0% |
| Danish | 1,362 | 0.2% |
| Dominican | 1,945 | 0.2% |
| Dutch | 6,867 | 0.8% |
| Eastern European | 1,233 | 0.1% |
| Ecuadorian | 173 | 0.0% |
| Egyptian | 262 | 0.0% |
| English | 66,632 | 7.5% |
| Estonian | 48 | 0.0% |
| Ethiopian | 1,018 | 0.1% |
| European | 12,249 | 1.4% |
| Fijian | 9 | 0.0% |
| Filipino | 44 | 0.0% |
| Finnish | 757 | 0.1% |
| French | 12,966 | 1.5% |
| French American Indian | 7 | 0.0% |
| French Canadian | 1,390 | 0.2% |
| German | 113,280 | 12.8% |
| German Russian | 41 | 0.0% |
| Ghanaian | 752 | 0.1% |
| Greek | 2,056 | 0.2% |
| Guamanian / Chamorro | 71 | 0.0% |
| Guatemalan | 3,404 | 0.4% |
| Guyanese | 79 | 0.0% |
| Haitian | 2,860 | 0.3% |
| Honduran | 3,546 | 0.4% |
| Hopi | 5 | 0.0% |
| Hungarian | 1,729 | 0.2% |
| Icelander | 7 | 0.0% |
| Indian (Asian) | 4,930 | 0.6% |
| Indonesian | 15,189 | 1.7% |
| Inupiat | 31 | 0.0% |
| Iranian | 528 | 0.1% |
| Iraqi | 149 | 0.0% |
| Irish | 69,130 | 7.8% |
| Iroquois | 61 | 0.0% |
| Israeli | 303 | 0.0% |
| Italian | 17,767 | 2.0% |
| Jamaican | 990 | 0.1% |
| Japanese | 461 | 0.1% |
| Jordanian | 169 | 0.0% |
| Kenyan | 730 | 0.1% |
| Kiowa | 12 | 0.0% |
| Korean | 5,327 | 0.6% |
| Laotian | 53 | 0.0% |
| Latvian | 274 | 0.0% |
| Lebanese | 959 | 0.1% |
| Liberian | 479 | 0.1% |
| Lithuanian | 1,109 | 0.1% |
| Luxembourger | 54 | 0.0% |
| Macedonian | 191 | 0.0% |
| Malaysian | 653 | 0.1% |
| Menominee | 23 | 0.0% |
| Mexican | 65,276 | 7.4% |
| Mexican American Indian | 1,673 | 0.2% |
| Mongolian | 160 | 0.0% |
| Moroccan | 213 | 0.0% |
| Native Hawaiian | 266 | 0.0% |
| Navajo | 21 | 0.0% |
| New Zealander | 136 | 0.0% |
| Nicaraguan | 1,169 | 0.1% |
| Nigerian | 7,885 | 0.9% |
| Northern European | 954 | 0.1% |
| Norwegian | 3,962 | 0.4% |
| Pakistani | 586 | 0.1% |
| Palestinian | 298 | 0.0% |
| Panamanian | 573 | 0.1% |
| Pennsylvania German | 199 | 0.0% |
| Peruvian | 664 | 0.1% |
| Pima | 14 | 0.0% |
| Polish | 12,921 | 1.5% |
| Portuguese | 497 | 0.1% |
| Potawatomi | 127 | 0.0% |
| Pueblo | 29 | 0.0% |
| Puerto Rican | 5,572 | 0.6% |
| Romanian | 983 | 0.1% |
| Russian | 2,226 | 0.3% |
| Salvadoran | 4,210 | 0.5% |
| Samoan | 134 | 0.0% |
| Scandinavian | 1,728 | 0.2% |
| Scotch-Irish | 5,793 | 0.7% |
| Scottish | 12,486 | 1.4% |
| Seminole | 42 | 0.0% |
| Senegalese | 343 | 0.0% |
| Serbian | 639 | 0.1% |
| Sierra Leonean | 48 | 0.0% |
| Sioux | 219 | 0.0% |
| Slavic | 502 | 0.1% |
| Slovak | 1,137 | 0.1% |
| Slovene | 645 | 0.1% |
| Somali | 125 | 0.0% |
| South African | 83 | 0.0% |
| South American | 3,726 | 0.4% |
| South American Indian | 64 | 0.0% |
| Soviet Union | 10 | 0.0% |
| Spaniard | 835 | 0.1% |
| Spanish | 821 | 0.1% |
| Spanish American | 49 | 0.0% |
| Sri Lankan | 1,321 | 0.2% |
| Subsaharan African | 37,322 | 4.2% |
| Sudanese | 130 | 0.0% |
| Swedish | 4,122 | 0.5% |
| Swiss | 2,267 | 0.3% |
| Syrian | 326 | 0.0% |
| Thai | 9,167 | 1.0% |
| Tongan | 37 | 0.0% |
| Trinidadian and Tobagonian | 197 | 0.0% |
| Turkish | 164 | 0.0% |
| U.S. Virgin Islander | 50 | 0.0% |
| Ugandan | 25 | 0.0% |
| Ukrainian | 1,271 | 0.1% |
| Uruguayan | 43 | 0.0% |
| Venezuelan | 1,796 | 0.2% |
| Vietnamese | 736 | 0.1% |
| Welsh | 4,171 | 0.5% |
| West Indian | 272 | 0.0% |
| Yaqui | 6 | 0.0% |
| Yugoslavian | 229 | 0.0% |
| Zimbabwean | 92 | 0.0% | View All 168 Rows |
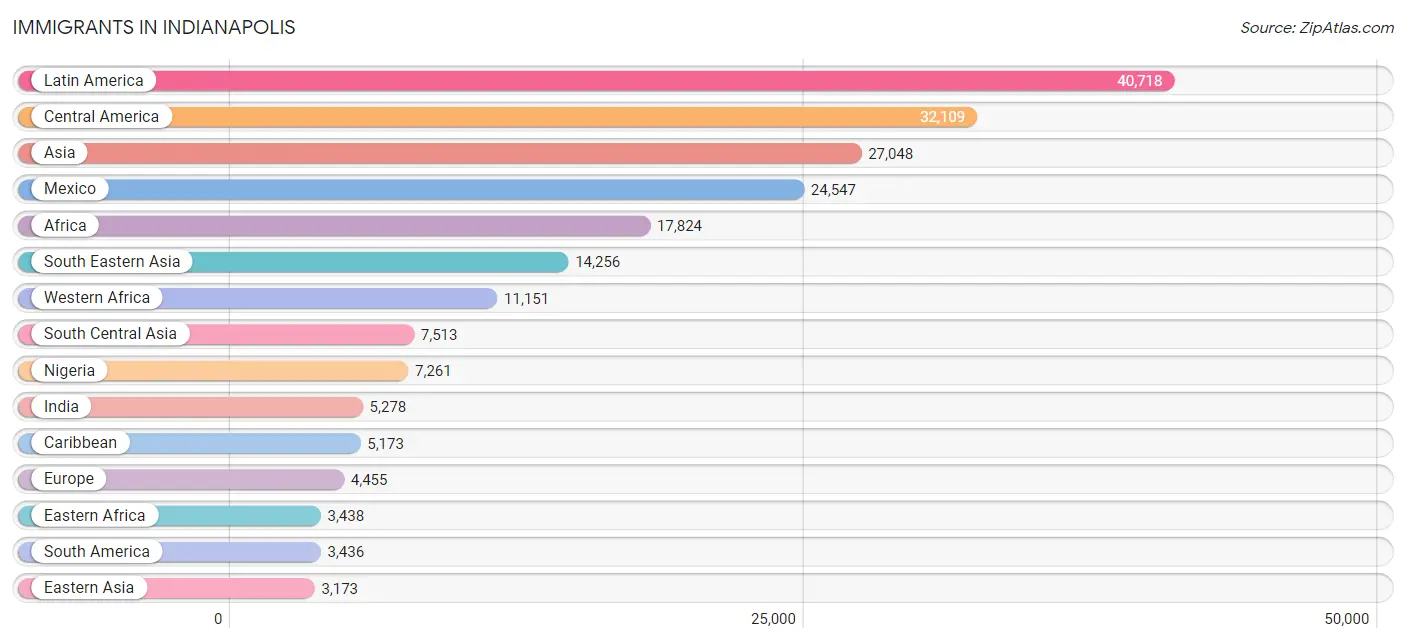
Immigrants in Indianapolis
The most numerous immigrant groups reported in Indianapolis came from Latin America (40,718 | 4.6%), Central America (32,109 | 3.6%), Asia (27,048 | 3.1%), Mexico (24,547 | 2.8%), and Africa (17,824 | 2.0%), together accounting for 16.1% of all Indianapolis residents.
| Immigration Origin | # Population | % Population |
| Afghanistan | 274 | 0.0% |
| Africa | 17,824 | 2.0% |
| Albania | 7 | 0.0% |
| Argentina | 23 | 0.0% |
| Asia | 27,048 | 3.1% |
| Australia | 112 | 0.0% |
| Austria | 40 | 0.0% |
| Bahamas | 230 | 0.0% |
| Bangladesh | 847 | 0.1% |
| Barbados | 197 | 0.0% |
| Belarus | 39 | 0.0% |
| Belgium | 12 | 0.0% |
| Belize | 34 | 0.0% |
| Bolivia | 37 | 0.0% |
| Bosnia and Herzegovina | 146 | 0.0% |
| Brazil | 406 | 0.1% |
| Bulgaria | 57 | 0.0% |
| Cambodia | 239 | 0.0% |
| Cameroon | 520 | 0.1% |
| Canada | 510 | 0.1% |
| Caribbean | 5,173 | 0.6% |
| Central America | 32,109 | 3.6% |
| Chile | 159 | 0.0% |
| China | 1,981 | 0.2% |
| Colombia | 588 | 0.1% |
| Congo | 537 | 0.1% |
| Costa Rica | 66 | 0.0% |
| Croatia | 24 | 0.0% |
| Cuba | 302 | 0.0% |
| Czechoslovakia | 5 | 0.0% |
| Denmark | 25 | 0.0% |
| Dominica | 24 | 0.0% |
| Dominican Republic | 1,547 | 0.2% |
| Eastern Africa | 3,438 | 0.4% |
| Eastern Asia | 3,173 | 0.4% |
| Eastern Europe | 2,106 | 0.2% |
| Ecuador | 109 | 0.0% |
| Egypt | 178 | 0.0% |
| El Salvador | 2,660 | 0.3% |
| England | 362 | 0.0% |
| Eritrea | 486 | 0.1% |
| Ethiopia | 644 | 0.1% |
| Europe | 4,455 | 0.5% |
| France | 70 | 0.0% |
| Germany | 617 | 0.1% |
| Ghana | 552 | 0.1% |
| Greece | 132 | 0.0% |
| Guatemala | 1,779 | 0.2% |
| Guyana | 48 | 0.0% |
| Haiti | 2,041 | 0.2% |
| Honduras | 2,268 | 0.3% |
| Hong Kong | 66 | 0.0% |
| Hungary | 22 | 0.0% |
| India | 5,278 | 0.6% |
| Indonesia | 17 | 0.0% |
| Iran | 367 | 0.0% |
| Iraq | 235 | 0.0% |
| Ireland | 65 | 0.0% |
| Israel | 104 | 0.0% |
| Italy | 158 | 0.0% |
| Jamaica | 515 | 0.1% |
| Japan | 399 | 0.1% |
| Jordan | 233 | 0.0% |
| Kazakhstan | 13 | 0.0% |
| Kenya | 1,097 | 0.1% |
| Korea | 793 | 0.1% |
| Kuwait | 17 | 0.0% |
| Laos | 298 | 0.0% |
| Latin America | 40,718 | 4.6% |
| Latvia | 52 | 0.0% |
| Lebanon | 215 | 0.0% |
| Liberia | 491 | 0.1% |
| Lithuania | 14 | 0.0% |
| Malaysia | 1,049 | 0.1% |
| Mexico | 24,547 | 2.8% |
| Middle Africa | 1,551 | 0.2% |
| Moldova | 40 | 0.0% |
| Morocco | 105 | 0.0% |
| Nepal | 20 | 0.0% |
| Netherlands | 91 | 0.0% |
| Nicaragua | 639 | 0.1% |
| Nigeria | 7,261 | 0.8% |
| North Macedonia | 14 | 0.0% |
| Northern Africa | 736 | 0.1% |
| Northern Europe | 1,006 | 0.1% |
| Norway | 53 | 0.0% |
| Oceania | 264 | 0.0% |
| Pakistan | 615 | 0.1% |
| Panama | 116 | 0.0% |
| Peru | 449 | 0.1% |
| Philippines | 1,831 | 0.2% |
| Poland | 125 | 0.0% |
| Portugal | 87 | 0.0% |
| Romania | 346 | 0.0% |
| Russia | 557 | 0.1% |
| Saudi Arabia | 552 | 0.1% |
| Scotland | 50 | 0.0% |
| Senegal | 422 | 0.1% |
| Serbia | 49 | 0.0% |
| Sierra Leone | 170 | 0.0% |
| Singapore | 28 | 0.0% |
| Somalia | 77 | 0.0% |
| South Africa | 82 | 0.0% |
| South America | 3,436 | 0.4% |
| South Central Asia | 7,513 | 0.9% |
| South Eastern Asia | 14,256 | 1.6% |
| Southern Europe | 513 | 0.1% |
| Spain | 136 | 0.0% |
| Sri Lanka | 43 | 0.0% |
| St. Vincent and the Grenadines | 91 | 0.0% |
| Sudan | 262 | 0.0% |
| Sweden | 9 | 0.0% |
| Syria | 158 | 0.0% |
| Taiwan | 80 | 0.0% |
| Thailand | 655 | 0.1% |
| Trinidad and Tobago | 104 | 0.0% |
| Turkey | 129 | 0.0% |
| Uganda | 304 | 0.0% |
| Ukraine | 507 | 0.1% |
| Uruguay | 38 | 0.0% |
| Uzbekistan | 12 | 0.0% |
| Venezuela | 1,579 | 0.2% |
| Vietnam | 642 | 0.1% |
| West Indies | 43 | 0.0% |
| Western Africa | 11,151 | 1.3% |
| Western Asia | 2,013 | 0.2% |
| Western Europe | 830 | 0.1% |
| Yemen | 37 | 0.0% |
| Zaire | 398 | 0.1% |
| Zimbabwe | 329 | 0.0% | View All 130 Rows |
Sex and Age in Indianapolis
Sex and Age in Indianapolis
The most populous age groups in Indianapolis are 25 to 29 Years (37,318 | 8.7%) for men and 25 to 29 Years (39,142 | 8.6%) for women.
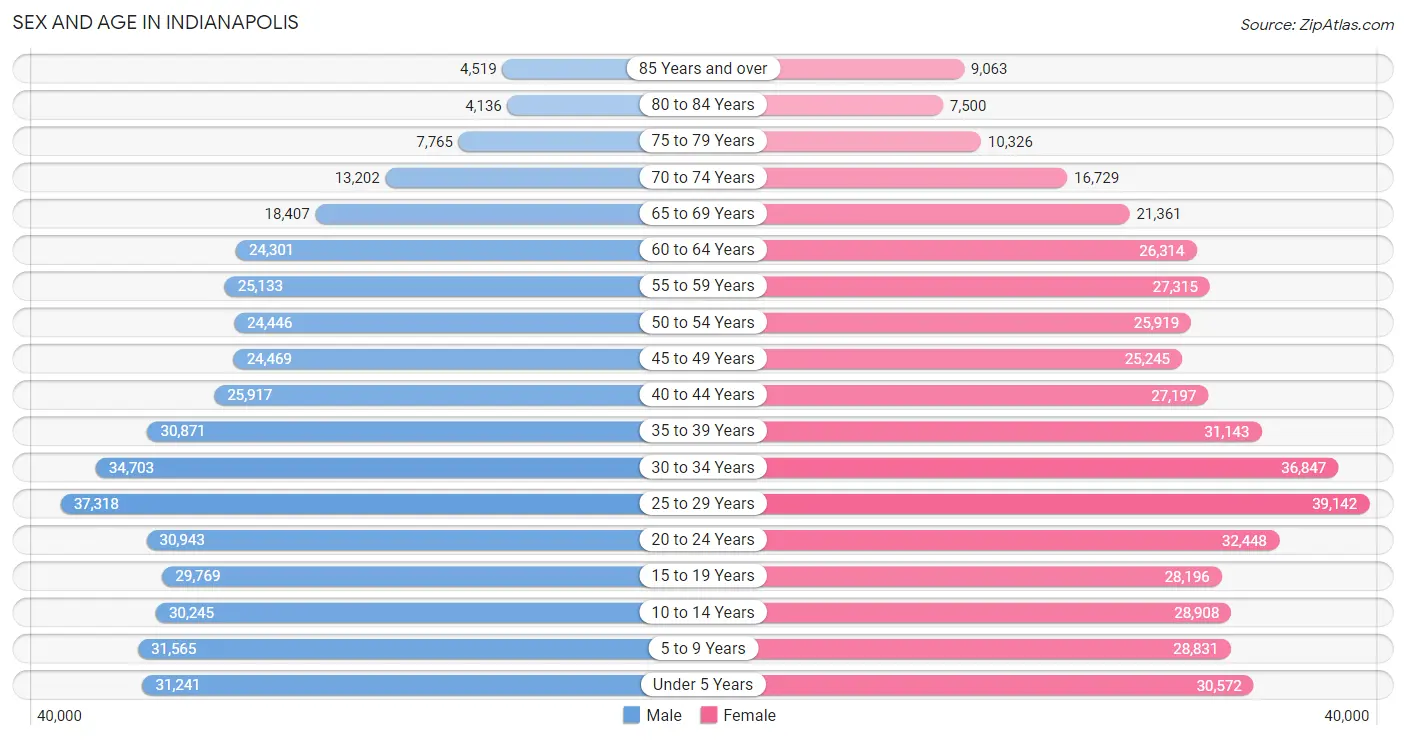
| Age Bracket | Male | Female |
| Under 5 Years | 31,241 (7.3%) | 30,572 (6.8%) |
| 5 to 9 Years | 31,565 (7.4%) | 28,831 (6.4%) |
| 10 to 14 Years | 30,245 (7.0%) | 28,908 (6.4%) |
| 15 to 19 Years | 29,769 (6.9%) | 28,196 (6.2%) |
| 20 to 24 Years | 30,943 (7.2%) | 32,448 (7.2%) |
| 25 to 29 Years | 37,318 (8.7%) | 39,142 (8.6%) |
| 30 to 34 Years | 34,703 (8.1%) | 36,847 (8.1%) |
| 35 to 39 Years | 30,871 (7.2%) | 31,143 (6.9%) |
| 40 to 44 Years | 25,917 (6.0%) | 27,197 (6.0%) |
| 45 to 49 Years | 24,469 (5.7%) | 25,245 (5.6%) |
| 50 to 54 Years | 24,446 (5.7%) | 25,919 (5.7%) |
| 55 to 59 Years | 25,133 (5.9%) | 27,315 (6.0%) |
| 60 to 64 Years | 24,301 (5.7%) | 26,314 (5.8%) |
| 65 to 69 Years | 18,407 (4.3%) | 21,361 (4.7%) |
| 70 to 74 Years | 13,202 (3.1%) | 16,729 (3.7%) |
| 75 to 79 Years | 7,765 (1.8%) | 10,326 (2.3%) |
| 80 to 84 Years | 4,136 (1.0%) | 7,500 (1.7%) |
| 85 Years and over | 4,519 (1.1%) | 9,063 (2.0%) |
| Total | 428,950 (100.0%) | 453,056 (100.0%) |
Families and Households in Indianapolis
Median Family Size in Indianapolis
The median family size in Indianapolis is 3.30 persons per family, with single female/mother families (50,762 | 26.1%) accounting for the largest median family size of 3.39 persons per family. On the other hand, single male/father families (16,723 | 8.6%) represent the smallest median family size with 3.14 persons per family.
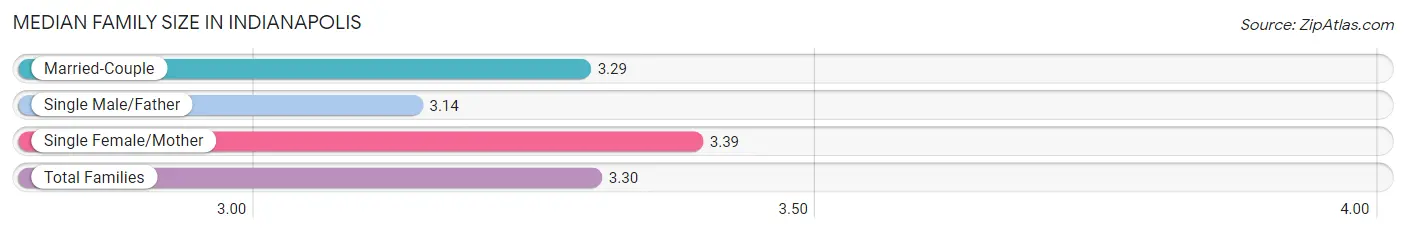
| Family Type | # Families | Family Size |
| Married-Couple | 126,966 (65.3%) | 3.29 |
| Single Male/Father | 16,723 (8.6%) | 3.14 |
| Single Female/Mother | 50,762 (26.1%) | 3.39 |
| Total Families | 194,451 (100.0%) | 3.30 |
Median Household Size in Indianapolis
The median household size in Indianapolis is 2.43 persons per household, with single female/mother households (50,762 | 14.2%) accounting for the largest median household size of 3.59 persons per household. non-family households (161,906 | 45.4%) represent the smallest median household size with 1.25 persons per household.
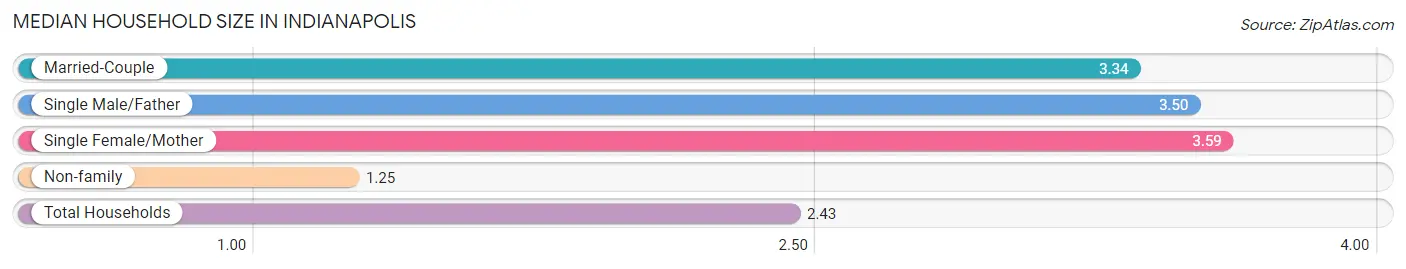
| Household Type | # Households | Household Size |
| Married-Couple | 126,966 (35.6%) | 3.34 |
| Single Male/Father | 16,723 (4.7%) | 3.50 |
| Single Female/Mother | 50,762 (14.2%) | 3.59 |
| Non-family | 161,906 (45.4%) | 1.25 |
| Total Households | 356,357 (100.0%) | 2.43 |
Household Size by Marriage Status in Indianapolis
Out of a total of 356,357 households in Indianapolis, 194,451 (54.6%) are family households, while 161,906 (45.4%) are nonfamily households. The most numerous type of family households are 2-person households, comprising 89,082, and the most common type of nonfamily households are 1-person households, comprising 132,246.
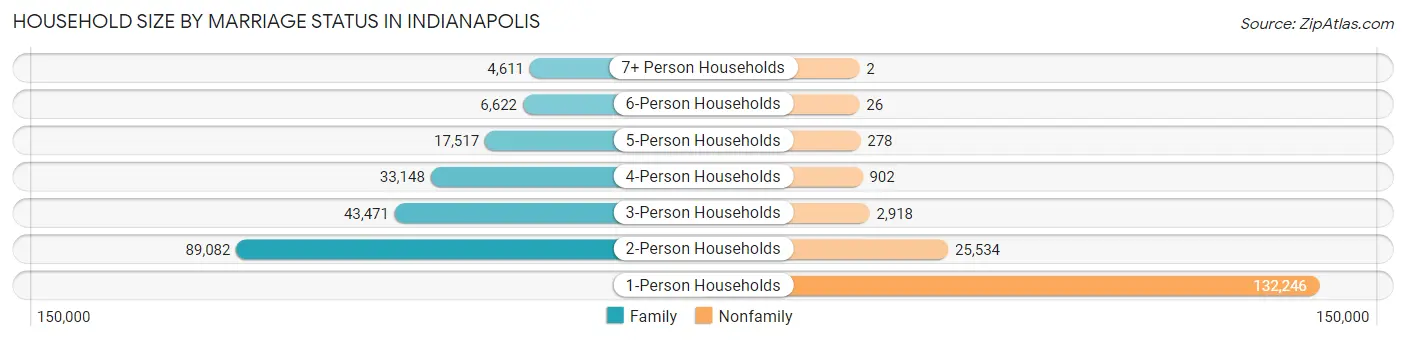
| Household Size | Family Households | Nonfamily Households |
| 1-Person Households | - | 132,246 (37.1%) |
| 2-Person Households | 89,082 (25.0%) | 25,534 (7.2%) |
| 3-Person Households | 43,471 (12.2%) | 2,918 (0.8%) |
| 4-Person Households | 33,148 (9.3%) | 902 (0.3%) |
| 5-Person Households | 17,517 (4.9%) | 278 (0.1%) |
| 6-Person Households | 6,622 (1.9%) | 26 (0.0%) |
| 7+ Person Households | 4,611 (1.3%) | 2 (0.0%) |
| Total | 194,451 (54.6%) | 161,906 (45.4%) |
Female Fertility in Indianapolis
Fertility by Age in Indianapolis
Average fertility rate in Indianapolis is 57.0 births per 1,000 women. Women in the age bracket of 20 to 34 years have the highest fertility rate with 91.0 births per 1,000 women. Women in the age bracket of 20 to 34 years acount for 77.4% of all women with births.
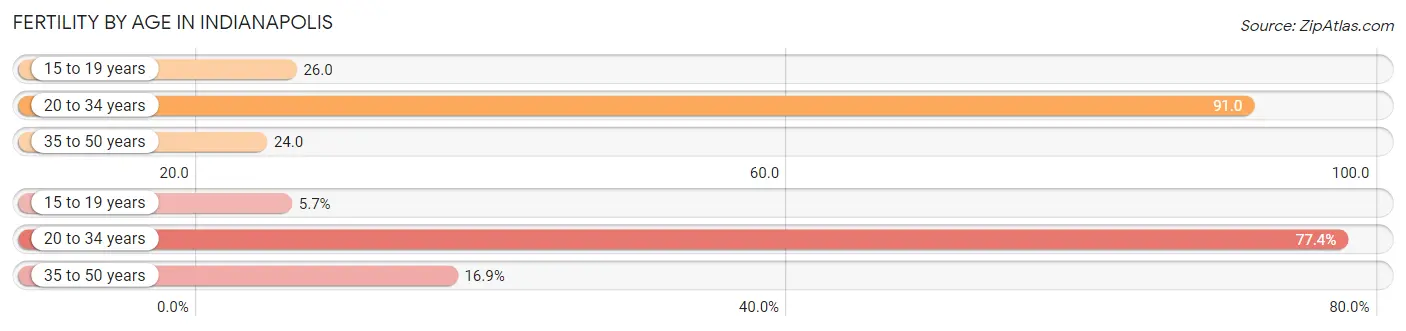
| Age Bracket | Women with Births | Births / 1,000 Women |
| 15 to 19 years | 727 (5.7%) | 26.0 |
| 20 to 34 years | 9,883 (77.4%) | 91.0 |
| 35 to 50 years | 2,163 (16.9%) | 24.0 |
| Total | 12,773 (100.0%) | 57.0 |
Fertility by Age by Marriage Status in Indianapolis
54.7% of women with births (12,773) in Indianapolis are married. The highest percentage of unmarried women with births falls into 15 to 19 years age bracket with 98.6% of them unmarried at the time of birth, while the lowest percentage of unmarried women with births belong to 35 to 50 years age bracket with 39.4% of them unmarried.
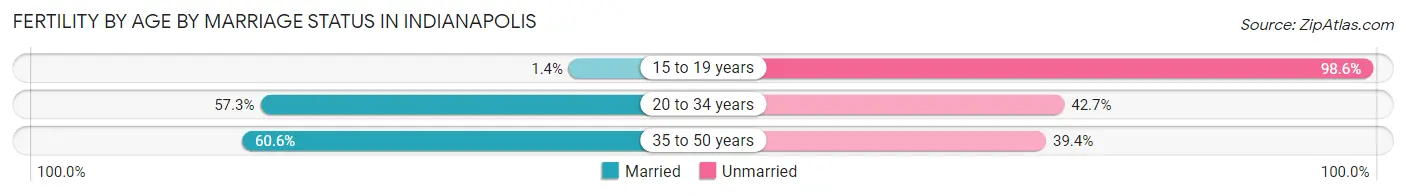
| Age Bracket | Married | Unmarried |
| 15 to 19 years | 10 (1.4%) | 717 (98.6%) |
| 20 to 34 years | 5,663 (57.3%) | 4,220 (42.7%) |
| 35 to 50 years | 1,311 (60.6%) | 852 (39.4%) |
| Total | 6,987 (54.7%) | 5,786 (45.3%) |
Fertility by Education in Indianapolis
Average fertility rate in Indianapolis is 57.0 births per 1,000 women. Women with the education attainment of high school diploma have the highest fertility rate of 73.0 births per 1,000 women, while women with the education attainment of less than high school have the lowest fertility at 47.0 births per 1,000 women. Women with the education attainment of high school diploma represent 28.5% of all women with births.
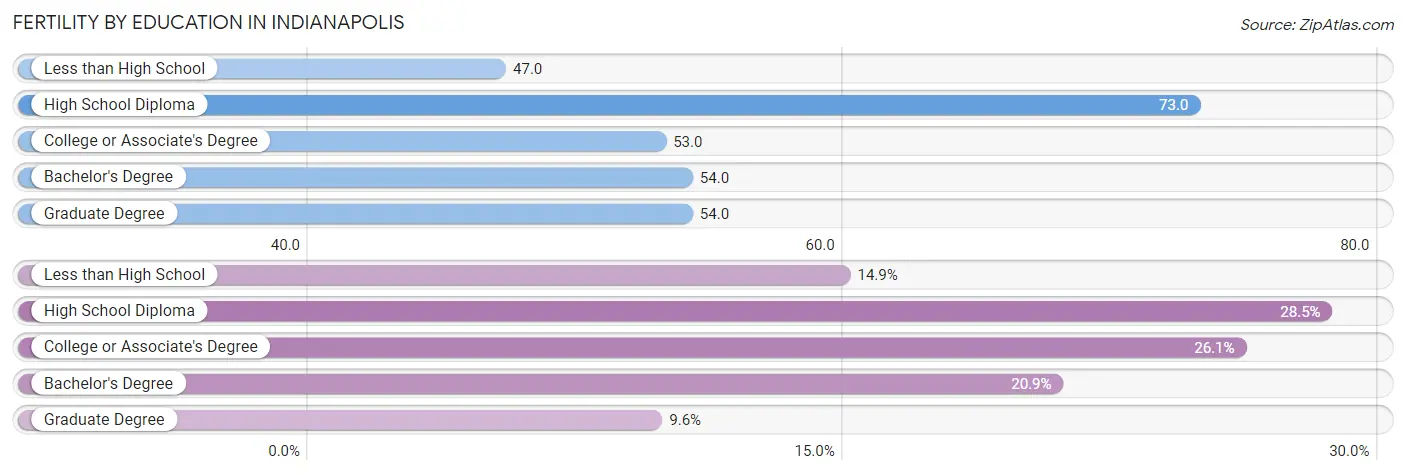
| Educational Attainment | Women with Births | Births / 1,000 Women |
| Less than High School | 1,907 (14.9%) | 47.0 |
| High School Diploma | 3,636 (28.5%) | 73.0 |
| College or Associate's Degree | 3,328 (26.1%) | 53.0 |
| Bachelor's Degree | 2,671 (20.9%) | 54.0 |
| Graduate Degree | 1,231 (9.6%) | 54.0 |
| Total | 12,773 (100.0%) | 57.0 |
Fertility by Education by Marriage Status in Indianapolis
45.3% of women with births in Indianapolis are unmarried. Women with the educational attainment of graduate degree are most likely to be married with 92.0% of them married at childbirth, while women with the educational attainment of less than high school are least likely to be married with 70.0% of them unmarried at childbirth.
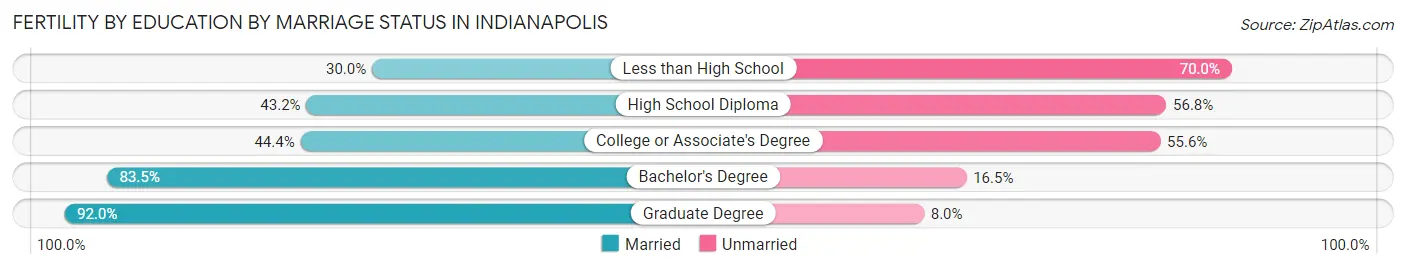
| Educational Attainment | Married | Unmarried |
| Less than High School | 572 (30.0%) | 1,335 (70.0%) |
| High School Diploma | 1,571 (43.2%) | 2,065 (56.8%) |
| College or Associate's Degree | 1,478 (44.4%) | 1,850 (55.6%) |
| Bachelor's Degree | 2,230 (83.5%) | 441 (16.5%) |
| Graduate Degree | 1,133 (92.0%) | 98 (8.0%) |
| Total | 6,987 (54.7%) | 5,786 (45.3%) |
Employment Characteristics in Indianapolis
Employment by Class of Employer in Indianapolis
Among the 428,882 employed individuals in Indianapolis, private company employees (307,019 | 71.6%), not-for-profit organizations (45,871 | 10.7%), and local government employees (19,882 | 4.6%) make up the most common classes of employment.
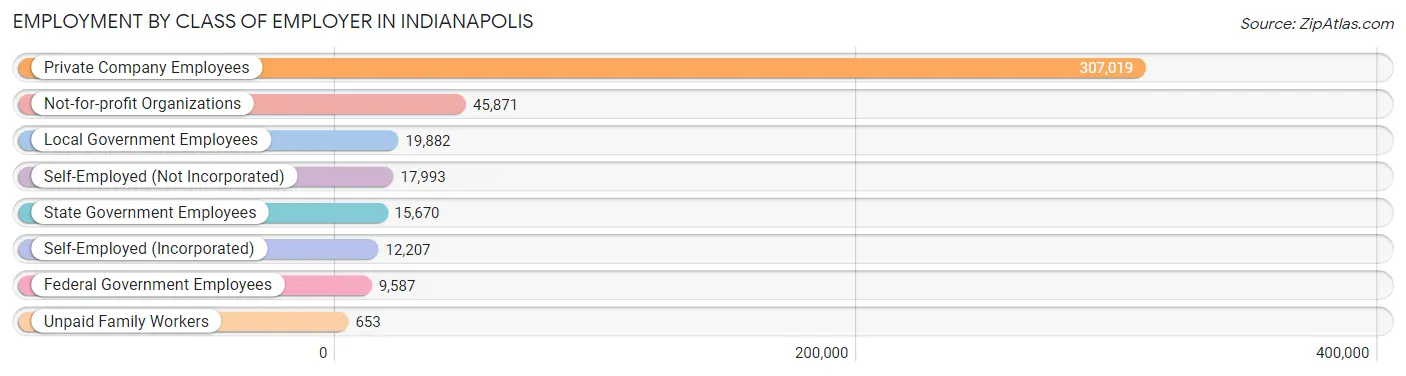
| Employer Class | # Employees | % Employees |
| Private Company Employees | 307,019 | 71.6% |
| Self-Employed (Incorporated) | 12,207 | 2.9% |
| Self-Employed (Not Incorporated) | 17,993 | 4.2% |
| Not-for-profit Organizations | 45,871 | 10.7% |
| Local Government Employees | 19,882 | 4.6% |
| State Government Employees | 15,670 | 3.6% |
| Federal Government Employees | 9,587 | 2.2% |
| Unpaid Family Workers | 653 | 0.2% |
| Total | 428,882 | 100.0% |
Employment Status by Age in Indianapolis
According to the labor force statistics for Indianapolis, out of the total population over 16 years of age (689,443), 67.2% or 463,306 individuals are in the labor force, with 5.6% or 25,945 of them unemployed. The age group with the highest labor force participation rate is 25 to 29 years, with 85.3% or 65,220 individuals in the labor force. Within the labor force, the 16 to 19 years age range has the highest percentage of unemployed individuals, with 15.1% or 2,846 of them being unemployed.
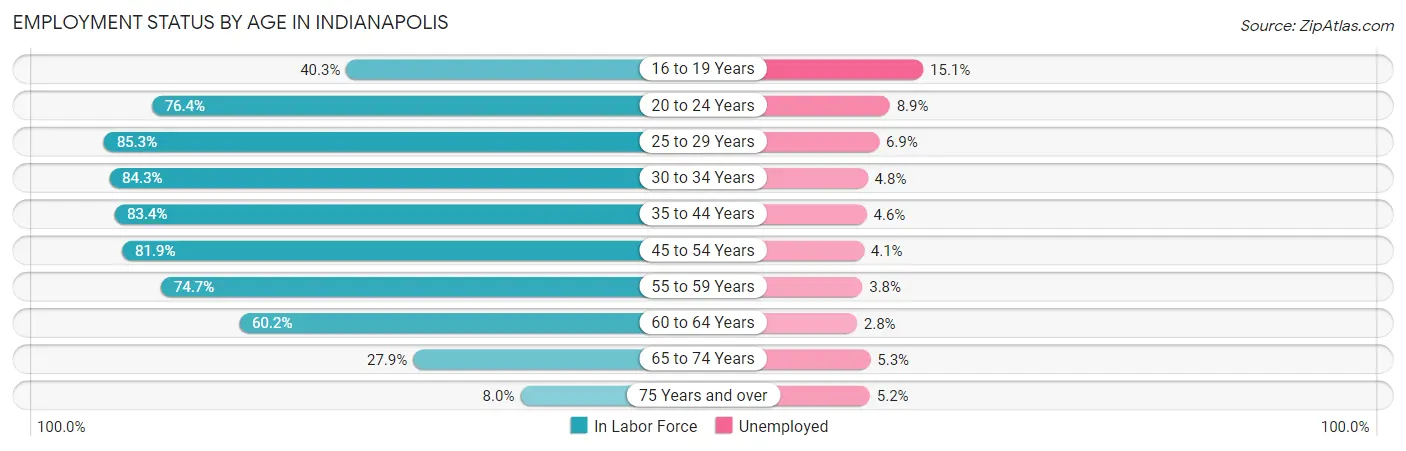
| Age Bracket | In Labor Force | Unemployed |
| 16 to 19 Years | 18,846 (40.3%) | 2,846 (15.1%) |
| 20 to 24 Years | 48,431 (76.4%) | 4,310 (8.9%) |
| 25 to 29 Years | 65,220 (85.3%) | 4,500 (6.9%) |
| 30 to 34 Years | 60,317 (84.3%) | 2,895 (4.8%) |
| 35 to 44 Years | 96,017 (83.4%) | 4,417 (4.6%) |
| 45 to 54 Years | 81,965 (81.9%) | 3,361 (4.1%) |
| 55 to 59 Years | 39,179 (74.7%) | 1,489 (3.8%) |
| 60 to 64 Years | 30,470 (60.2%) | 853 (2.8%) |
| 65 to 74 Years | 19,446 (27.9%) | 1,031 (5.3%) |
| 75 Years and over | 3,465 (8.0%) | 180 (5.2%) |
| Total | 463,306 (67.2%) | 25,945 (5.6%) |
Employment Status by Educational Attainment in Indianapolis
According to labor force statistics for Indianapolis, 80.0% of individuals (373,024) out of the total population between 25 and 64 years of age (466,280) are in the labor force, with 4.7% or 17,532 of them being unemployed. The group with the highest labor force participation rate are those with the educational attainment of bachelor's degree or higher, with 90.0% or 144,782 individuals in the labor force. Within the labor force, individuals with less than high school education have the highest percentage of unemployment, with 9.2% or 3,278 of them being unemployed.
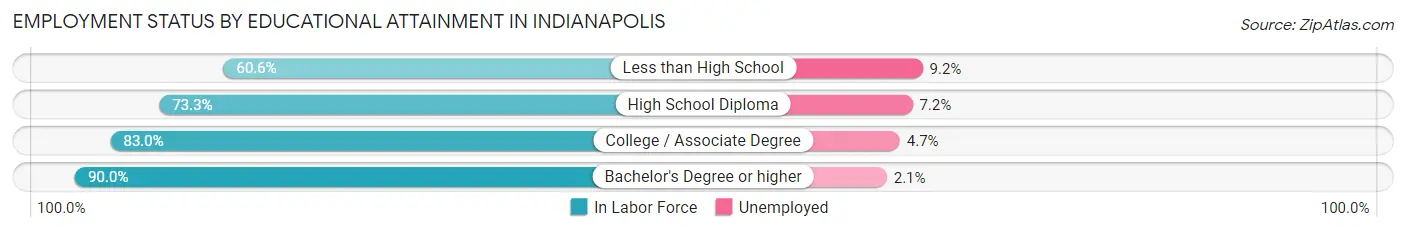
| Educational Attainment | In Labor Force | Unemployed |
| Less than High School | 35,626 (60.6%) | 5,408 (9.2%) |
| High School Diploma | 89,254 (73.3%) | 8,767 (7.2%) |
| College / Associate Degree | 103,631 (83.0%) | 5,868 (4.7%) |
| Bachelor's Degree or higher | 144,782 (90.0%) | 3,378 (2.1%) |
| Total | 373,024 (80.0%) | 21,915 (4.7%) |
Employment Occupations by Sex in Indianapolis
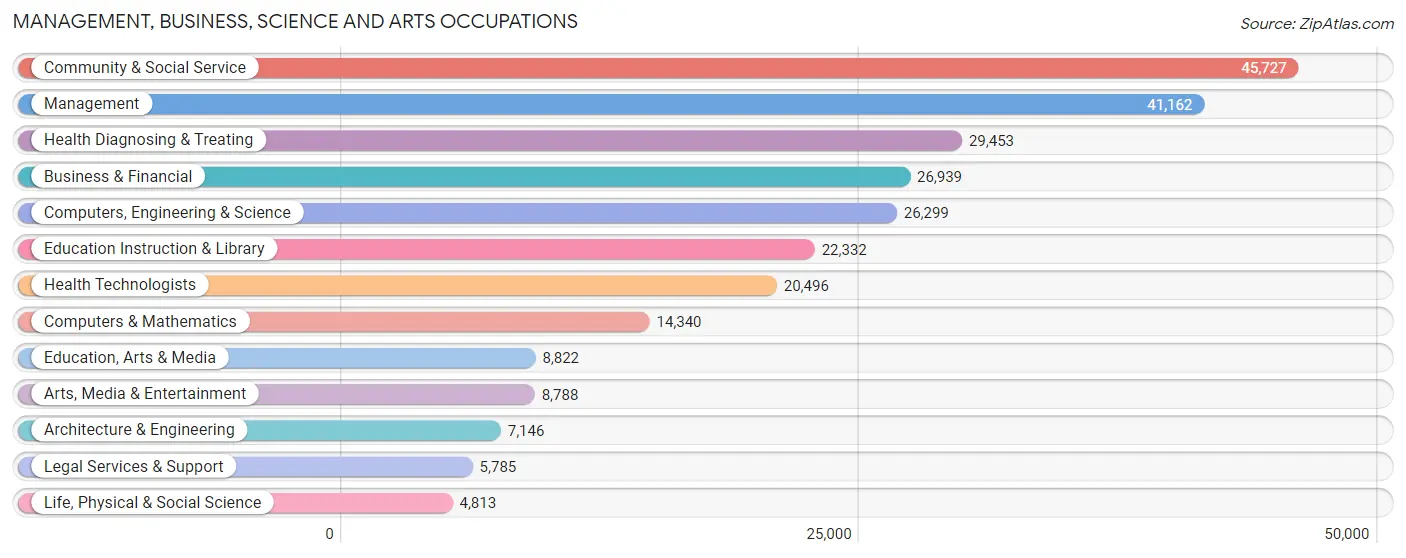
Management, Business, Science and Arts Occupations
The most common Management, Business, Science and Arts occupations in Indianapolis are Community & Social Service (45,727 | 10.5%), Management (41,162 | 9.4%), Health Diagnosing & Treating (29,453 | 6.7%), Business & Financial (26,939 | 6.2%), and Computers, Engineering & Science (26,299 | 6.0%).
Management, Business, Science and Arts Occupations by Sex
Within the Management, Business, Science and Arts occupations in Indianapolis, the most male-oriented occupations are Architecture & Engineering (79.6%), Computers & Mathematics (70.4%), and Computers, Engineering & Science (68.8%), while the most female-oriented occupations are Health Diagnosing & Treating (79.8%), Health Technologists (78.9%), and Education Instruction & Library (72.3%).
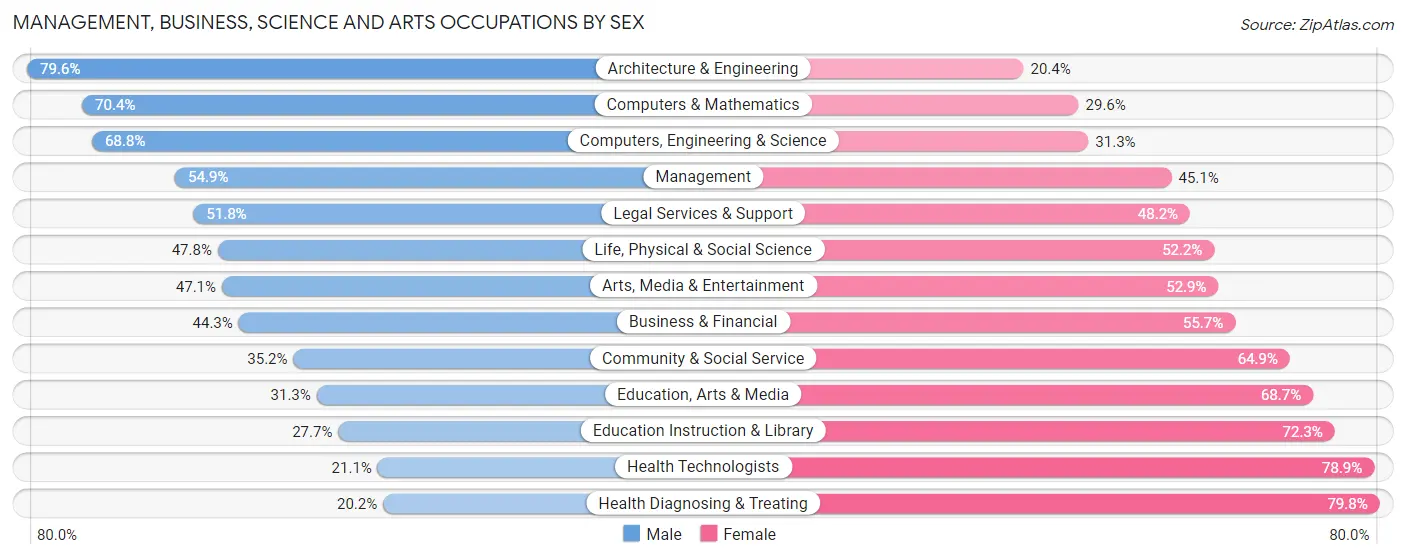
| Occupation | Male | Female |
| Management | 22,591 (54.9%) | 18,571 (45.1%) |
| Business & Financial | 11,928 (44.3%) | 15,011 (55.7%) |
| Computers, Engineering & Science | 18,080 (68.8%) | 8,219 (31.2%) |
| Computers & Mathematics | 10,094 (70.4%) | 4,246 (29.6%) |
| Architecture & Engineering | 5,687 (79.6%) | 1,459 (20.4%) |
| Life, Physical & Social Science | 2,299 (47.8%) | 2,514 (52.2%) |
| Community & Social Service | 16,072 (35.1%) | 29,655 (64.8%) |
| Education, Arts & Media | 2,759 (31.3%) | 6,063 (68.7%) |
| Legal Services & Support | 2,998 (51.8%) | 2,787 (48.2%) |
| Education Instruction & Library | 6,178 (27.7%) | 16,154 (72.3%) |
| Arts, Media & Entertainment | 4,137 (47.1%) | 4,651 (52.9%) |
| Health Diagnosing & Treating | 5,943 (20.2%) | 23,510 (79.8%) |
| Health Technologists | 4,321 (21.1%) | 16,175 (78.9%) |
| Total (Category) | 74,614 (44.0%) | 94,966 (56.0%) |
| Total (Overall) | 220,293 (50.4%) | 216,723 (49.6%) |
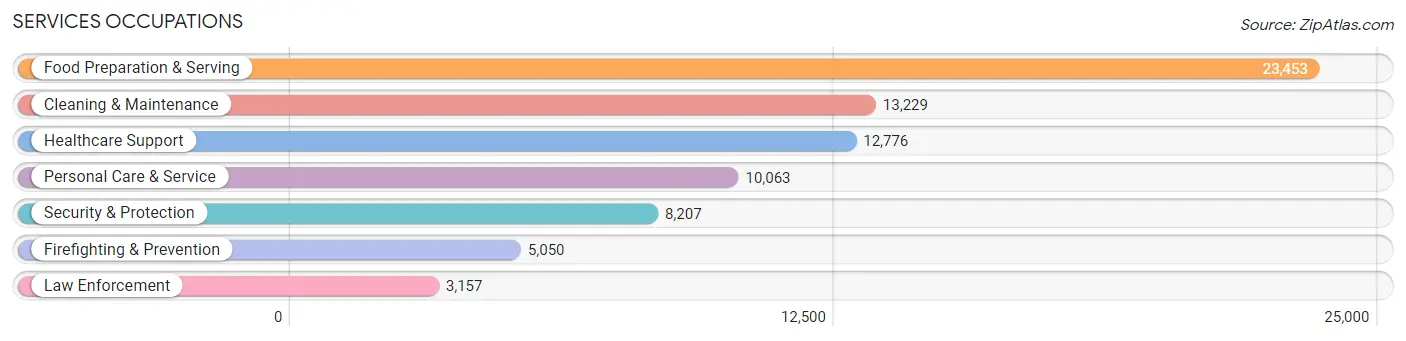
Services Occupations
The most common Services occupations in Indianapolis are Food Preparation & Serving (23,453 | 5.4%), Cleaning & Maintenance (13,229 | 3.0%), Healthcare Support (12,776 | 2.9%), Personal Care & Service (10,063 | 2.3%), and Security & Protection (8,207 | 1.9%).
Services Occupations by Sex
Within the Services occupations in Indianapolis, the most male-oriented occupations are Law Enforcement (74.4%), Security & Protection (68.6%), and Firefighting & Prevention (65.0%), while the most female-oriented occupations are Healthcare Support (87.0%), Personal Care & Service (77.5%), and Food Preparation & Serving (56.1%).
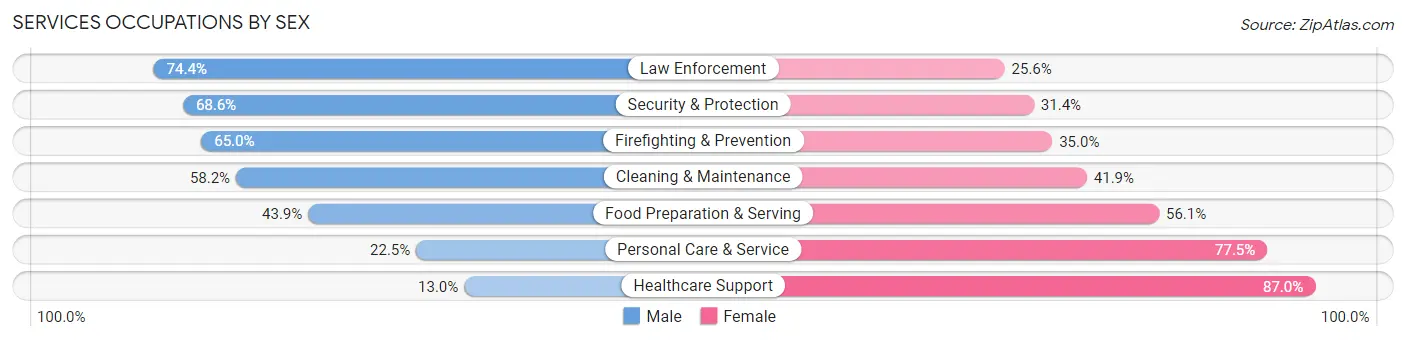
| Occupation | Male | Female |
| Healthcare Support | 1,657 (13.0%) | 11,119 (87.0%) |
| Security & Protection | 5,633 (68.6%) | 2,574 (31.4%) |
| Firefighting & Prevention | 3,283 (65.0%) | 1,767 (35.0%) |
| Law Enforcement | 2,350 (74.4%) | 807 (25.6%) |
| Food Preparation & Serving | 10,287 (43.9%) | 13,166 (56.1%) |
| Cleaning & Maintenance | 7,693 (58.2%) | 5,536 (41.8%) |
| Personal Care & Service | 2,261 (22.5%) | 7,802 (77.5%) |
| Total (Category) | 27,531 (40.6%) | 40,197 (59.4%) |
| Total (Overall) | 220,293 (50.4%) | 216,723 (49.6%) |
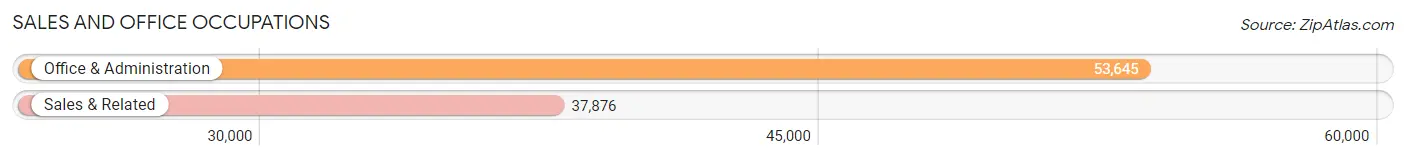
Sales and Office Occupations
The most common Sales and Office occupations in Indianapolis are Office & Administration (53,645 | 12.3%), and Sales & Related (37,876 | 8.7%).
Sales and Office Occupations by Sex
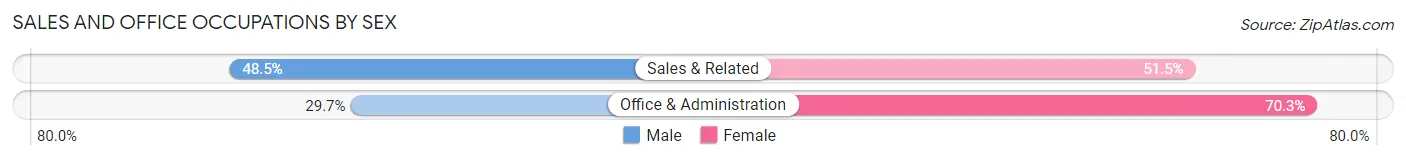
| Occupation | Male | Female |
| Sales & Related | 18,362 (48.5%) | 19,514 (51.5%) |
| Office & Administration | 15,946 (29.7%) | 37,699 (70.3%) |
| Total (Category) | 34,308 (37.5%) | 57,213 (62.5%) |
| Total (Overall) | 220,293 (50.4%) | 216,723 (49.6%) |
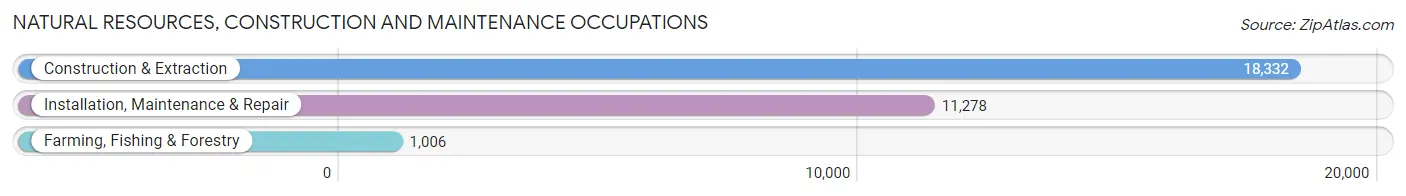
Natural Resources, Construction and Maintenance Occupations
The most common Natural Resources, Construction and Maintenance occupations in Indianapolis are Construction & Extraction (18,332 | 4.2%), Installation, Maintenance & Repair (11,278 | 2.6%), and Farming, Fishing & Forestry (1,006 | 0.2%).
Natural Resources, Construction and Maintenance Occupations by Sex
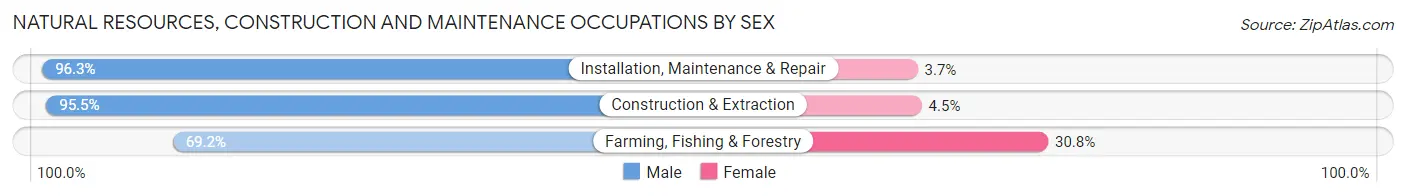
| Occupation | Male | Female |
| Farming, Fishing & Forestry | 696 (69.2%) | 310 (30.8%) |
| Construction & Extraction | 17,503 (95.5%) | 829 (4.5%) |
| Installation, Maintenance & Repair | 10,864 (96.3%) | 414 (3.7%) |
| Total (Category) | 29,063 (94.9%) | 1,553 (5.1%) |
| Total (Overall) | 220,293 (50.4%) | 216,723 (49.6%) |
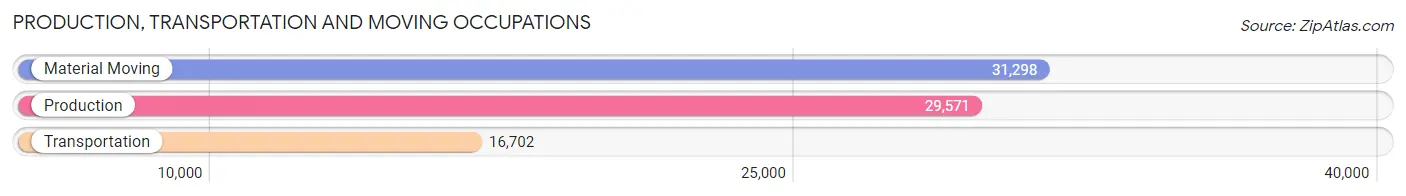
Production, Transportation and Moving Occupations
The most common Production, Transportation and Moving occupations in Indianapolis are Material Moving (31,298 | 7.2%), Production (29,571 | 6.8%), and Transportation (16,702 | 3.8%).
Production, Transportation and Moving Occupations by Sex
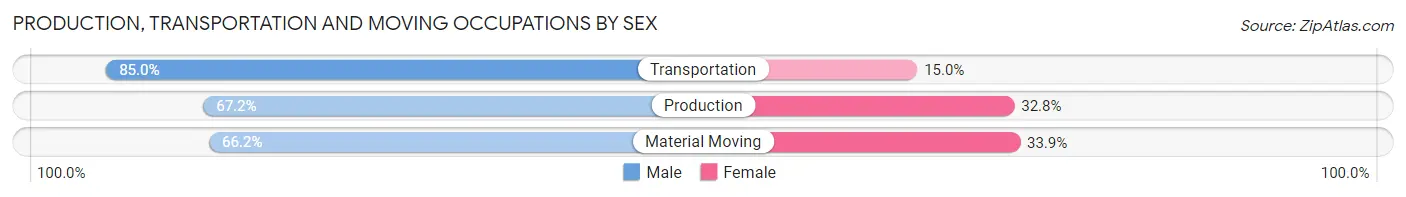
| Occupation | Male | Female |
| Production | 19,873 (67.2%) | 9,698 (32.8%) |
| Transportation | 14,200 (85.0%) | 2,502 (15.0%) |
| Material Moving | 20,704 (66.1%) | 10,594 (33.9%) |
| Total (Category) | 54,777 (70.6%) | 22,794 (29.4%) |
| Total (Overall) | 220,293 (50.4%) | 216,723 (49.6%) |
Employment Industries by Sex in Indianapolis
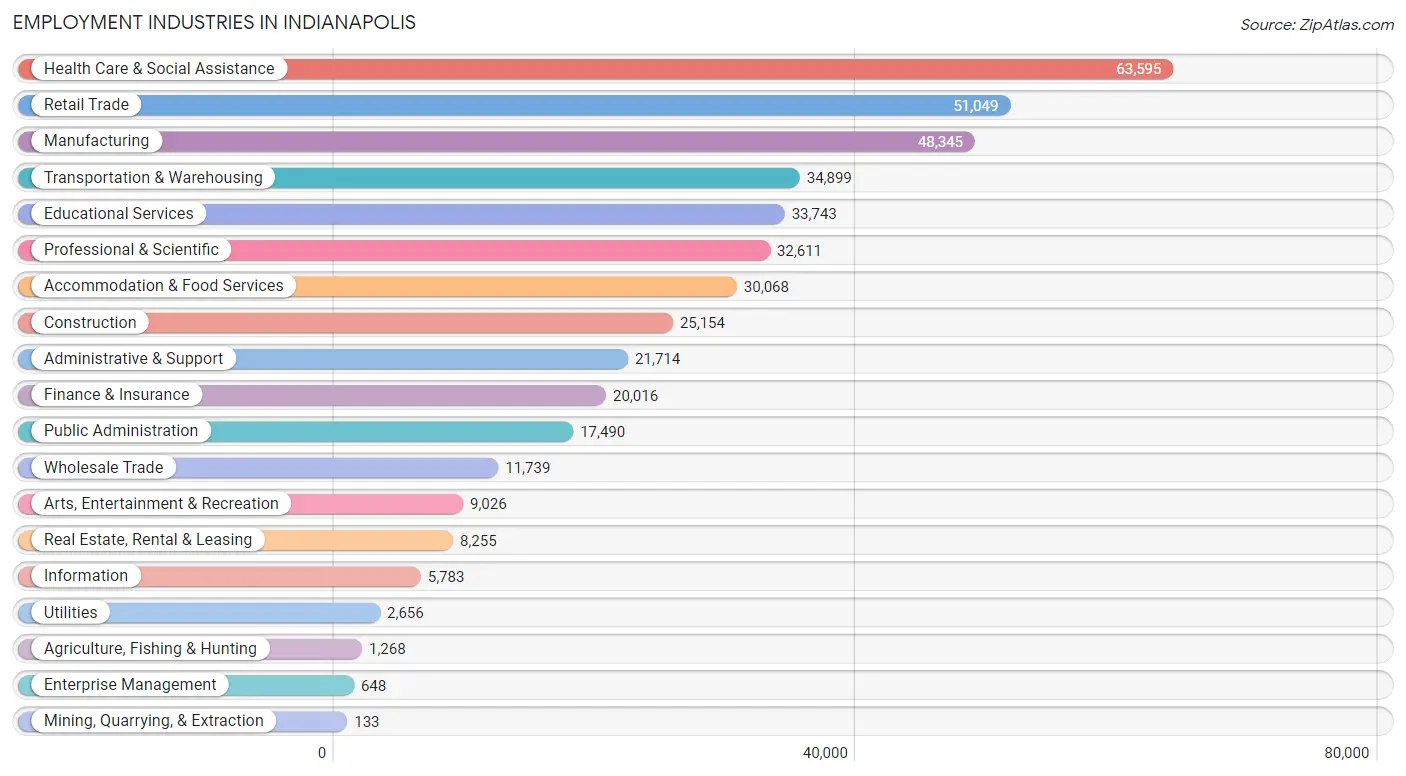
Employment Industries in Indianapolis
The major employment industries in Indianapolis include Health Care & Social Assistance (63,595 | 14.5%), Retail Trade (51,049 | 11.7%), Manufacturing (48,345 | 11.1%), Transportation & Warehousing (34,899 | 8.0%), and Educational Services (33,743 | 7.7%).
Employment Industries by Sex in Indianapolis
The Indianapolis industries that see more men than women are Construction (89.4%), Utilities (85.1%), and Mining, Quarrying, & Extraction (83.5%), whereas the industries that tend to have a higher number of women are Health Care & Social Assistance (81.2%), Enterprise Management (74.4%), and Educational Services (68.1%).
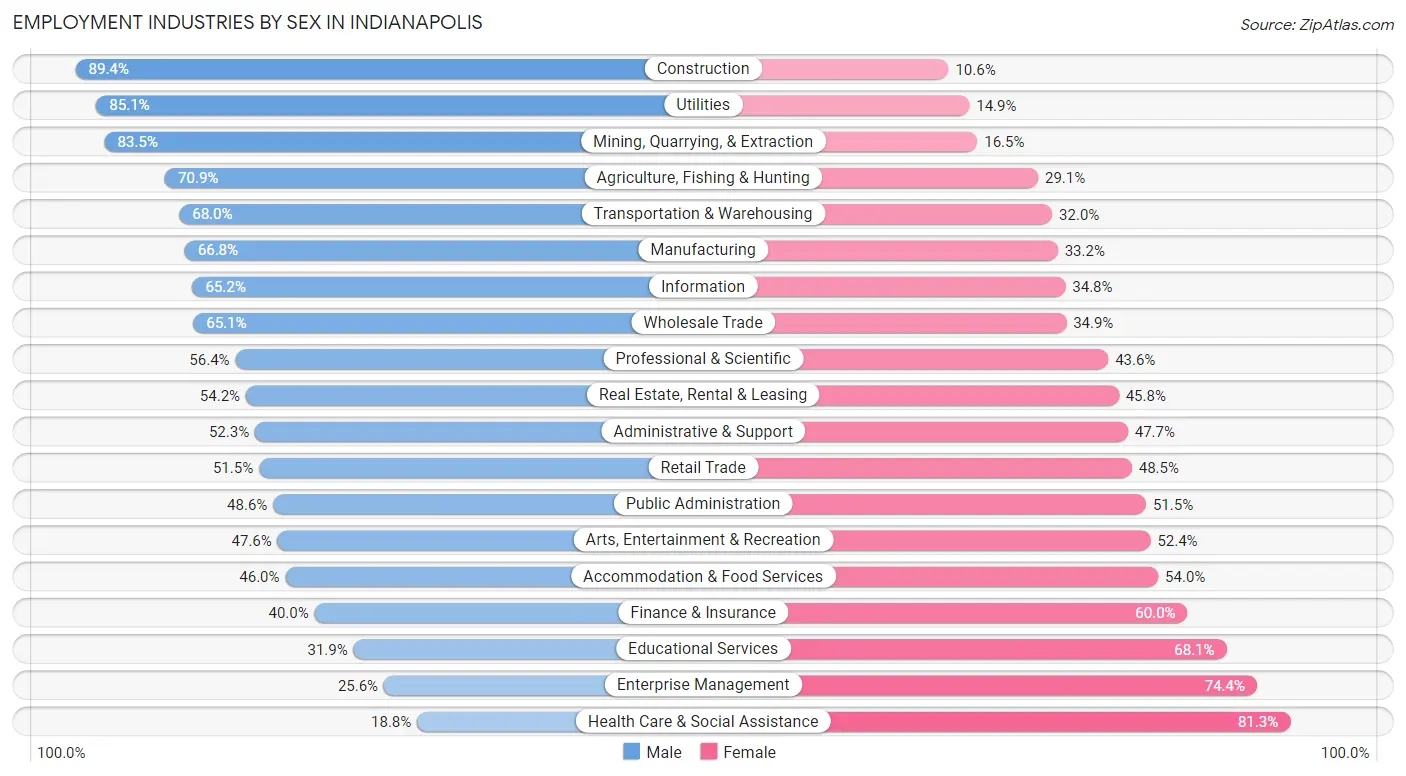
| Industry | Male | Female |
| Agriculture, Fishing & Hunting | 899 (70.9%) | 369 (29.1%) |
| Mining, Quarrying, & Extraction | 111 (83.5%) | 22 (16.5%) |
| Construction | 22,496 (89.4%) | 2,658 (10.6%) |
| Manufacturing | 32,306 (66.8%) | 16,039 (33.2%) |
| Wholesale Trade | 7,638 (65.1%) | 4,101 (34.9%) |
| Retail Trade | 26,286 (51.5%) | 24,763 (48.5%) |
| Transportation & Warehousing | 23,722 (68.0%) | 11,177 (32.0%) |
| Utilities | 2,261 (85.1%) | 395 (14.9%) |
| Information | 3,773 (65.2%) | 2,010 (34.8%) |
| Finance & Insurance | 8,004 (40.0%) | 12,012 (60.0%) |
| Real Estate, Rental & Leasing | 4,473 (54.2%) | 3,782 (45.8%) |
| Professional & Scientific | 18,384 (56.4%) | 14,227 (43.6%) |
| Enterprise Management | 166 (25.6%) | 482 (74.4%) |
| Administrative & Support | 11,358 (52.3%) | 10,356 (47.7%) |
| Educational Services | 10,770 (31.9%) | 22,973 (68.1%) |
| Health Care & Social Assistance | 11,927 (18.8%) | 51,668 (81.2%) |
| Arts, Entertainment & Recreation | 4,299 (47.6%) | 4,727 (52.4%) |
| Accommodation & Food Services | 13,841 (46.0%) | 16,227 (54.0%) |
| Public Administration | 8,491 (48.5%) | 8,999 (51.4%) |
| Total | 220,293 (50.4%) | 216,723 (49.6%) |
Education in Indianapolis
School Enrollment in Indianapolis
The most common levels of schooling among the 217,085 students in Indianapolis are elementary school (46,985 | 21.6%), high school (46,925 | 21.6%), and middle school (46,778 | 21.5%).
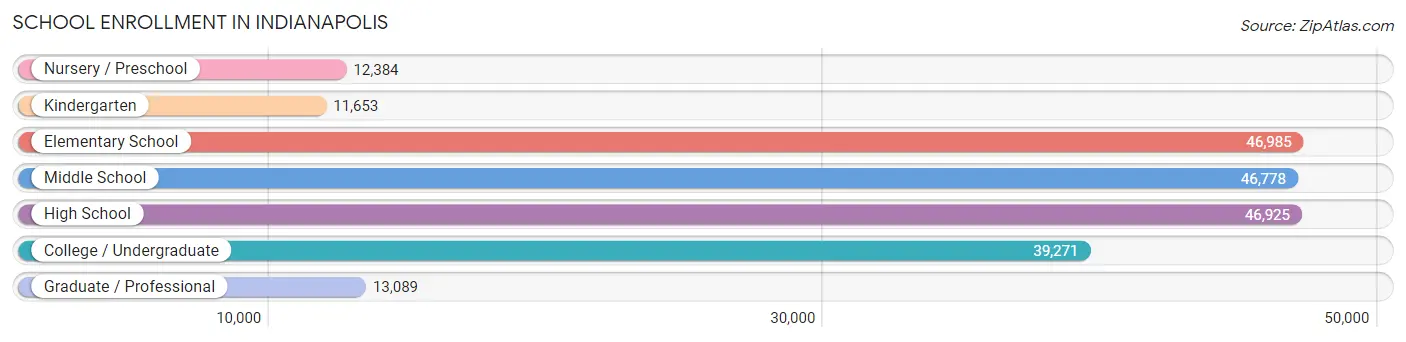
| School Level | # Students | % Students |
| Nursery / Preschool | 12,384 | 5.7% |
| Kindergarten | 11,653 | 5.4% |
| Elementary School | 46,985 | 21.6% |
| Middle School | 46,778 | 21.5% |
| High School | 46,925 | 21.6% |
| College / Undergraduate | 39,271 | 18.1% |
| Graduate / Professional | 13,089 | 6.0% |
| Total | 217,085 | 100.0% |
School Enrollment by Age by Funding Source in Indianapolis
Out of a total of 217,085 students who are enrolled in schools in Indianapolis, 43,200 (19.9%) attend a private institution, while the remaining 173,885 (80.1%) are enrolled in public schools. The age group of 3 to 4 year olds has the highest likelihood of being enrolled in private schools, with 3,967 (42.6% in the age bracket) enrolled. Conversely, the age group of 15 to 17 year olds has the lowest likelihood of being enrolled in a private school, with 28,577 (86.6% in the age bracket) attending a public institution.
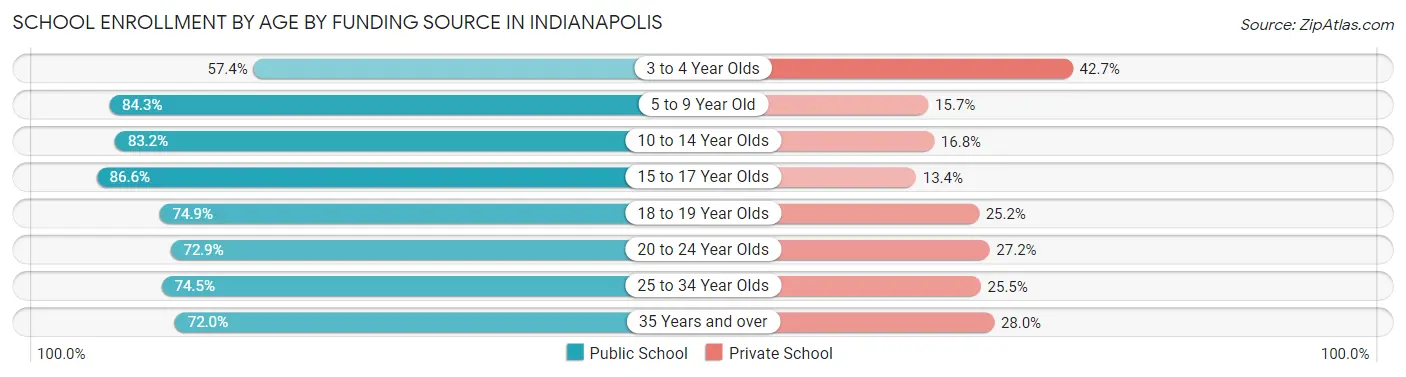
| Age Bracket | Public School | Private School |
| 3 to 4 Year Olds | 5,334 (57.4%) | 3,967 (42.6%) |
| 5 to 9 Year Old | 46,993 (84.3%) | 8,776 (15.7%) |
| 10 to 14 Year Olds | 47,550 (83.2%) | 9,608 (16.8%) |
| 15 to 17 Year Olds | 28,577 (86.6%) | 4,434 (13.4%) |
| 18 to 19 Year Olds | 11,951 (74.9%) | 4,015 (25.2%) |
| 20 to 24 Year Olds | 15,185 (72.9%) | 5,659 (27.2%) |
| 25 to 34 Year Olds | 10,254 (74.5%) | 3,512 (25.5%) |
| 35 Years and over | 8,115 (72.0%) | 3,155 (28.0%) |
| Total | 173,885 (80.1%) | 43,200 (19.9%) |
Educational Attainment by Field of Study in Indianapolis
Business (41,910 | 19.8%), science & technology (23,359 | 11.0%), education (22,927 | 10.8%), social sciences (14,191 | 6.7%), and arts & humanities (14,097 | 6.7%) are the most common fields of study among 212,069 individuals in Indianapolis who have obtained a bachelor's degree or higher.
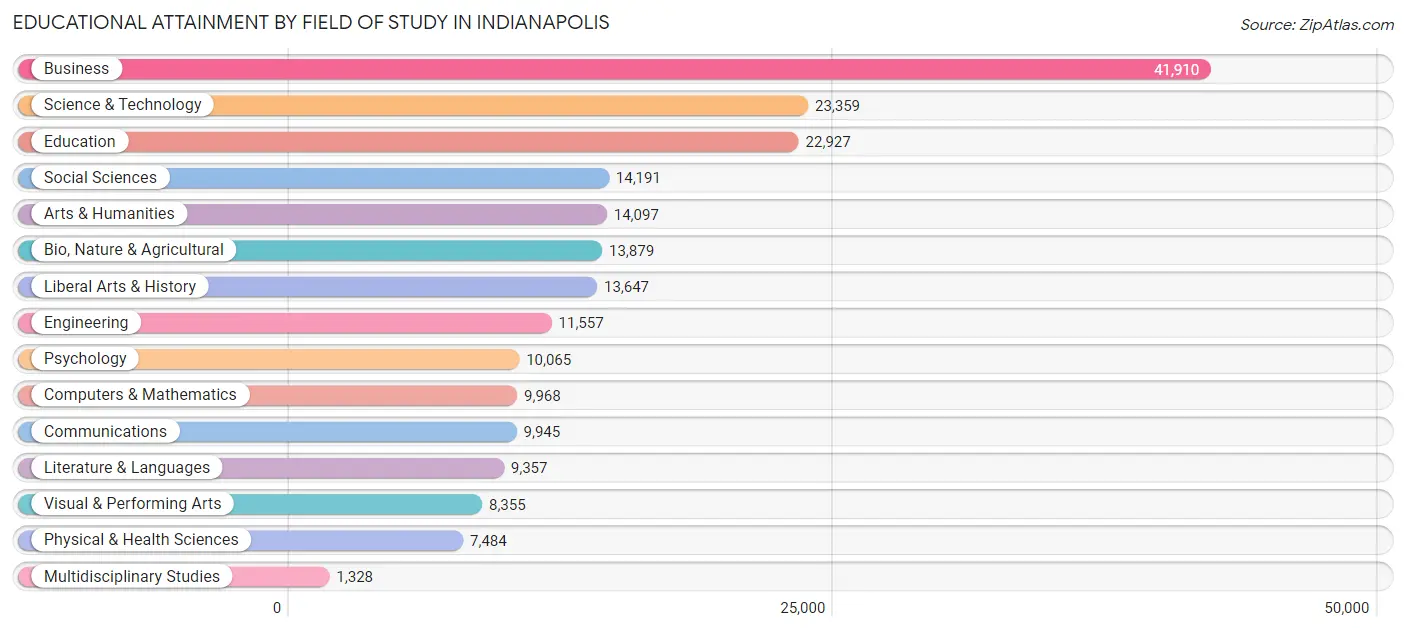
| Field of Study | # Graduates | % Graduates |
| Computers & Mathematics | 9,968 | 4.7% |
| Bio, Nature & Agricultural | 13,879 | 6.5% |
| Physical & Health Sciences | 7,484 | 3.5% |
| Psychology | 10,065 | 4.8% |
| Social Sciences | 14,191 | 6.7% |
| Engineering | 11,557 | 5.4% |
| Multidisciplinary Studies | 1,328 | 0.6% |
| Science & Technology | 23,359 | 11.0% |
| Business | 41,910 | 19.8% |
| Education | 22,927 | 10.8% |
| Literature & Languages | 9,357 | 4.4% |
| Liberal Arts & History | 13,647 | 6.4% |
| Visual & Performing Arts | 8,355 | 3.9% |
| Communications | 9,945 | 4.7% |
| Arts & Humanities | 14,097 | 6.7% |
| Total | 212,069 | 100.0% |
Transportation & Commute in Indianapolis
Vehicle Availability by Sex in Indianapolis
The most prevalent vehicle ownership categories in Indianapolis are males with 2 vehicles (95,348, accounting for 44.2%) and females with 2 vehicles (87,546, making up 45.2%).
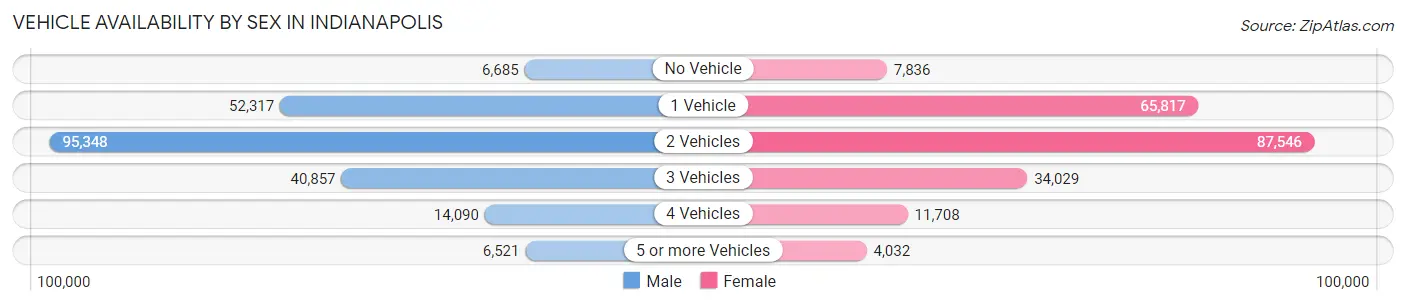
| Vehicles Available | Male | Female |
| No Vehicle | 6,685 (3.1%) | 7,836 (3.7%) |
| 1 Vehicle | 52,317 (24.2%) | 65,817 (31.2%) |
| 2 Vehicles | 95,348 (44.2%) | 87,546 (41.5%) |
| 3 Vehicles | 40,857 (18.9%) | 34,029 (16.1%) |
| 4 Vehicles | 14,090 (6.5%) | 11,708 (5.6%) |
| 5 or more Vehicles | 6,521 (3.0%) | 4,032 (1.9%) |
| Total | 215,818 (100.0%) | 210,968 (100.0%) |
Commute Time in Indianapolis
The most frequently occuring commute durations in Indianapolis are 20 to 24 minutes (72,221 commuters, 18.8%), 15 to 19 minutes (66,329 commuters, 17.2%), and 30 to 34 minutes (62,066 commuters, 16.1%).
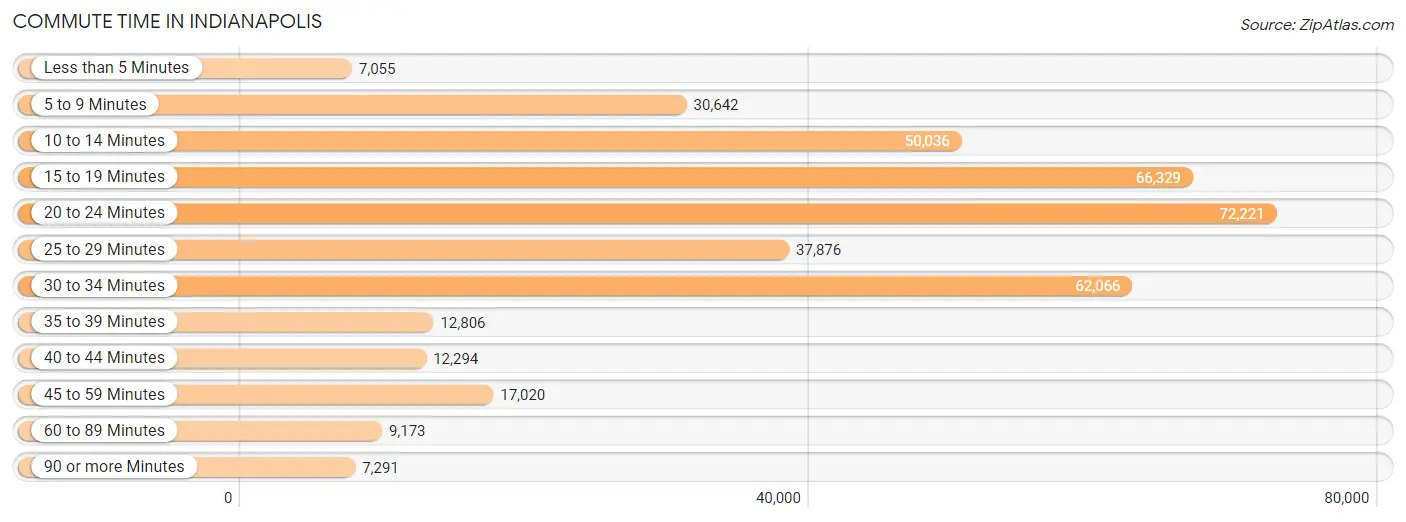
| Commute Time | # Commuters | % Commuters |
| Less than 5 Minutes | 7,055 | 1.8% |
| 5 to 9 Minutes | 30,642 | 8.0% |
| 10 to 14 Minutes | 50,036 | 13.0% |
| 15 to 19 Minutes | 66,329 | 17.2% |
| 20 to 24 Minutes | 72,221 | 18.8% |
| 25 to 29 Minutes | 37,876 | 9.8% |
| 30 to 34 Minutes | 62,066 | 16.1% |
| 35 to 39 Minutes | 12,806 | 3.3% |
| 40 to 44 Minutes | 12,294 | 3.2% |
| 45 to 59 Minutes | 17,020 | 4.4% |
| 60 to 89 Minutes | 9,173 | 2.4% |
| 90 or more Minutes | 7,291 | 1.9% |
Commute Time by Sex in Indianapolis
The most common commute times in Indianapolis are 20 to 24 minutes (36,935 commuters, 18.9%) for males and 20 to 24 minutes (35,286 commuters, 18.7%) for females.
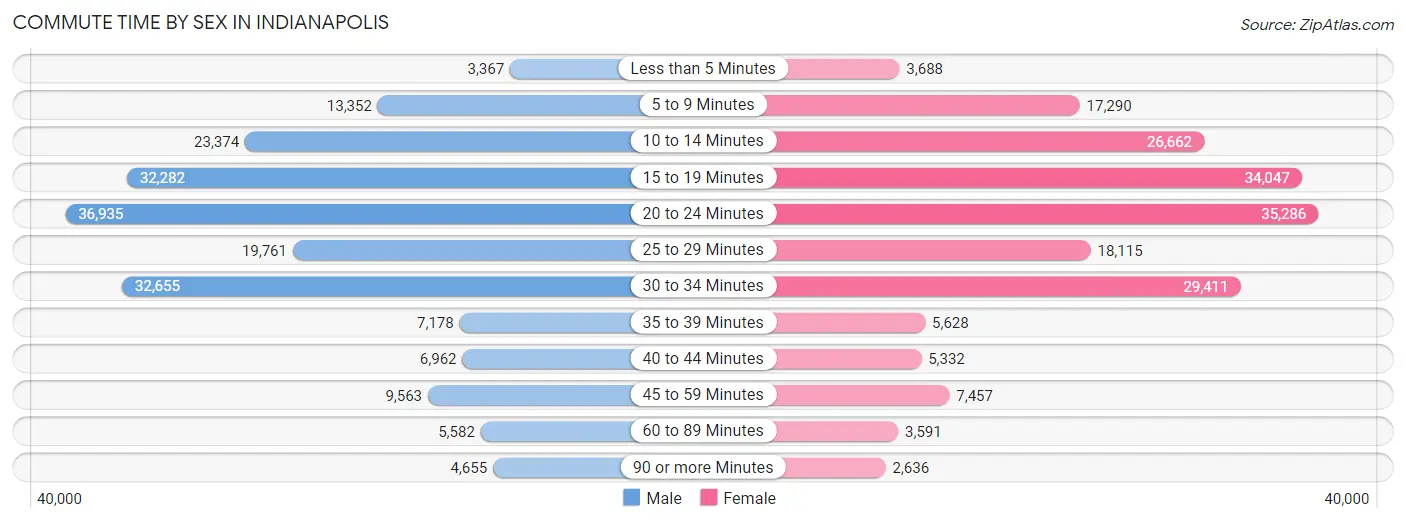
| Commute Time | Male | Female |
| Less than 5 Minutes | 3,367 (1.7%) | 3,688 (1.9%) |
| 5 to 9 Minutes | 13,352 (6.8%) | 17,290 (9.1%) |
| 10 to 14 Minutes | 23,374 (11.9%) | 26,662 (14.1%) |
| 15 to 19 Minutes | 32,282 (16.5%) | 34,047 (18.0%) |
| 20 to 24 Minutes | 36,935 (18.9%) | 35,286 (18.7%) |
| 25 to 29 Minutes | 19,761 (10.1%) | 18,115 (9.6%) |
| 30 to 34 Minutes | 32,655 (16.7%) | 29,411 (15.5%) |
| 35 to 39 Minutes | 7,178 (3.7%) | 5,628 (3.0%) |
| 40 to 44 Minutes | 6,962 (3.6%) | 5,332 (2.8%) |
| 45 to 59 Minutes | 9,563 (4.9%) | 7,457 (3.9%) |
| 60 to 89 Minutes | 5,582 (2.9%) | 3,591 (1.9%) |
| 90 or more Minutes | 4,655 (2.4%) | 2,636 (1.4%) |
Time of Departure to Work by Sex in Indianapolis
The most frequent times of departure to work in Indianapolis are 7:00 AM to 7:29 AM (30,441, 15.6%) for males and 7:00 AM to 7:29 AM (30,649, 16.2%) for females.
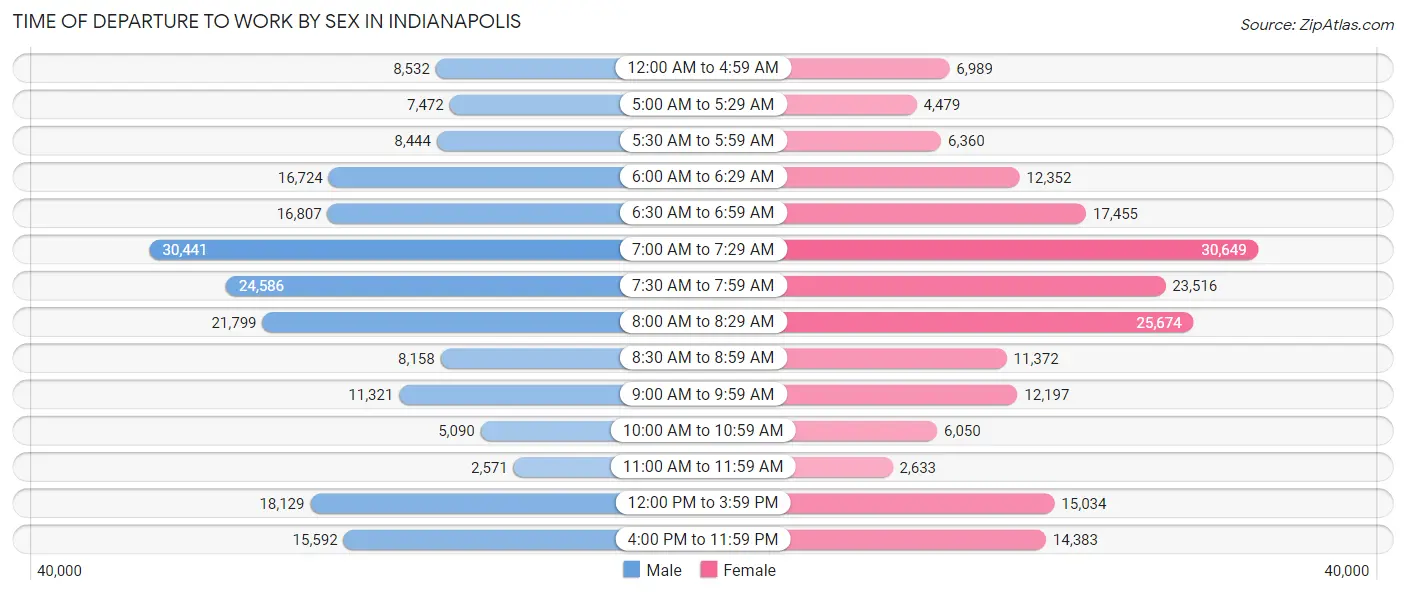
| Time of Departure | Male | Female |
| 12:00 AM to 4:59 AM | 8,532 (4.4%) | 6,989 (3.7%) |
| 5:00 AM to 5:29 AM | 7,472 (3.8%) | 4,479 (2.4%) |
| 5:30 AM to 5:59 AM | 8,444 (4.3%) | 6,360 (3.4%) |
| 6:00 AM to 6:29 AM | 16,724 (8.6%) | 12,352 (6.5%) |
| 6:30 AM to 6:59 AM | 16,807 (8.6%) | 17,455 (9.2%) |
| 7:00 AM to 7:29 AM | 30,441 (15.6%) | 30,649 (16.2%) |
| 7:30 AM to 7:59 AM | 24,586 (12.6%) | 23,516 (12.4%) |
| 8:00 AM to 8:29 AM | 21,799 (11.1%) | 25,674 (13.6%) |
| 8:30 AM to 8:59 AM | 8,158 (4.2%) | 11,372 (6.0%) |
| 9:00 AM to 9:59 AM | 11,321 (5.8%) | 12,197 (6.5%) |
| 10:00 AM to 10:59 AM | 5,090 (2.6%) | 6,050 (3.2%) |
| 11:00 AM to 11:59 AM | 2,571 (1.3%) | 2,633 (1.4%) |
| 12:00 PM to 3:59 PM | 18,129 (9.3%) | 15,034 (8.0%) |
| 4:00 PM to 11:59 PM | 15,592 (8.0%) | 14,383 (7.6%) |
| Total | 195,666 (100.0%) | 189,143 (100.0%) |
Housing Occupancy in Indianapolis
Occupancy by Ownership in Indianapolis
Of the total 356,357 dwellings in Indianapolis, owner-occupied units account for 195,696 (54.9%), while renter-occupied units make up 160,661 (45.1%).
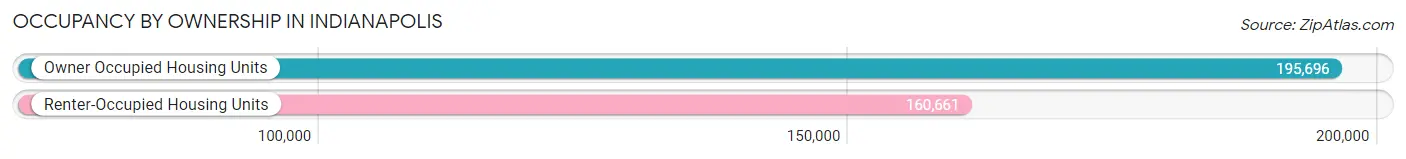
| Occupancy | # Housing Units | % Housing Units |
| Owner Occupied Housing Units | 195,696 | 54.9% |
| Renter-Occupied Housing Units | 160,661 | 45.1% |
| Total Occupied Housing Units | 356,357 | 100.0% |
Occupancy by Household Size in Indianapolis
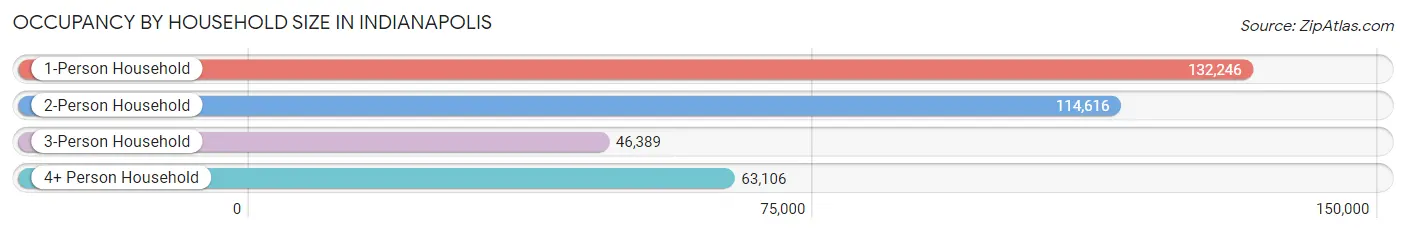
| Household Size | # Housing Units | % Housing Units |
| 1-Person Household | 132,246 | 37.1% |
| 2-Person Household | 114,616 | 32.2% |
| 3-Person Household | 46,389 | 13.0% |
| 4+ Person Household | 63,106 | 17.7% |
| Total Housing Units | 356,357 | 100.0% |
Occupancy by Ownership by Household Size in Indianapolis
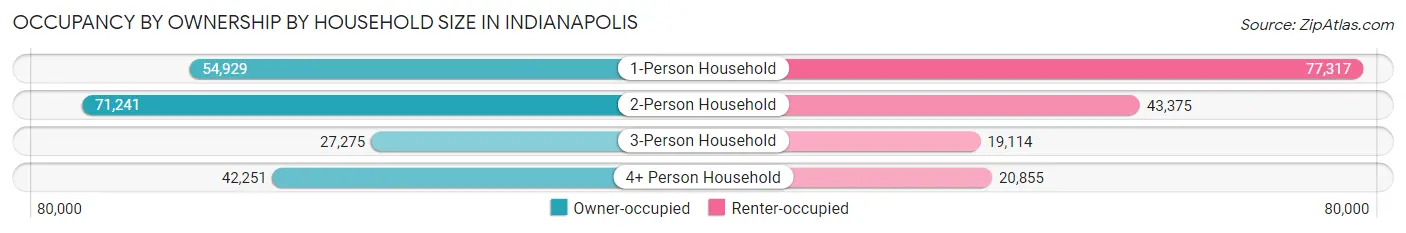
| Household Size | Owner-occupied | Renter-occupied |
| 1-Person Household | 54,929 (41.5%) | 77,317 (58.5%) |
| 2-Person Household | 71,241 (62.2%) | 43,375 (37.8%) |
| 3-Person Household | 27,275 (58.8%) | 19,114 (41.2%) |
| 4+ Person Household | 42,251 (66.9%) | 20,855 (33.1%) |
| Total Housing Units | 195,696 (54.9%) | 160,661 (45.1%) |
Occupancy by Educational Attainment in Indianapolis
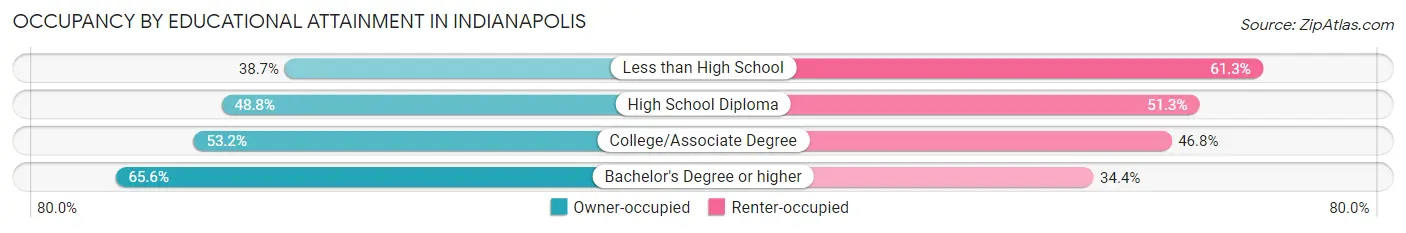
| Household Size | Owner-occupied | Renter-occupied |
| Less than High School | 14,640 (38.7%) | 23,170 (61.3%) |
| High School Diploma | 43,029 (48.7%) | 45,241 (51.2%) |
| College/Associate Degree | 55,813 (53.2%) | 49,101 (46.8%) |
| Bachelor's Degree or higher | 82,214 (65.6%) | 43,149 (34.4%) |
Occupancy by Age of Householder in Indianapolis
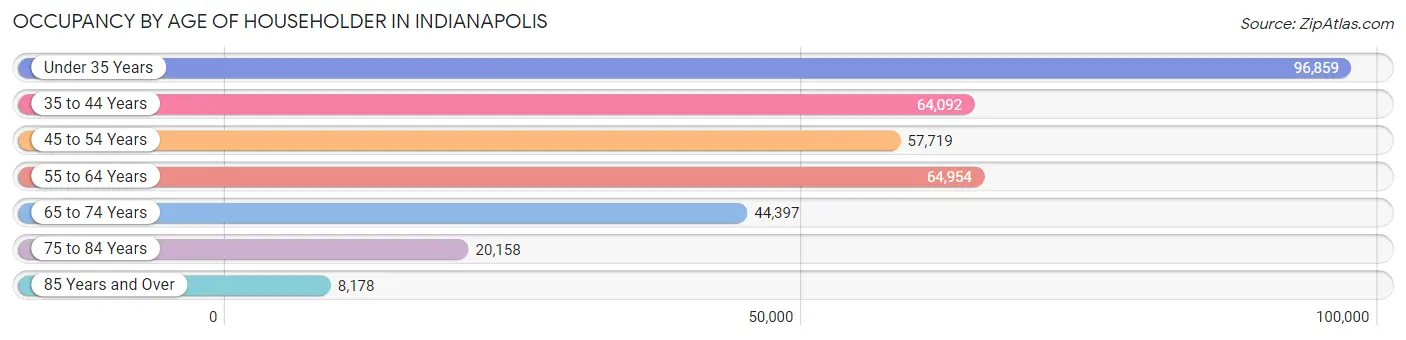
| Age Bracket | # Households | % Households |
| Under 35 Years | 96,859 | 27.2% |
| 35 to 44 Years | 64,092 | 18.0% |
| 45 to 54 Years | 57,719 | 16.2% |
| 55 to 64 Years | 64,954 | 18.2% |
| 65 to 74 Years | 44,397 | 12.5% |
| 75 to 84 Years | 20,158 | 5.7% |
| 85 Years and Over | 8,178 | 2.3% |
| Total | 356,357 | 100.0% |
Housing Finances in Indianapolis
Median Income by Occupancy in Indianapolis
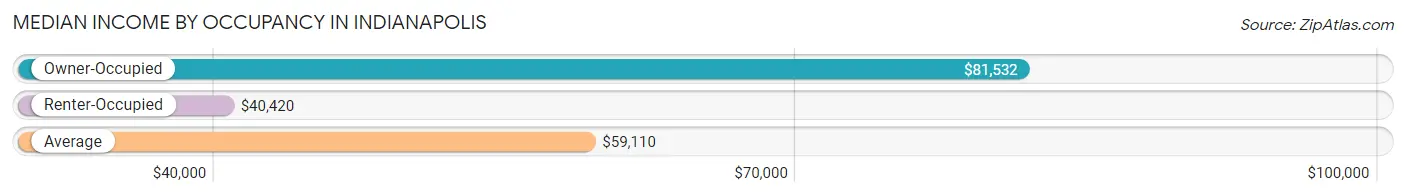
| Occupancy Type | # Households | Median Income |
| Owner-Occupied | 195,696 (54.9%) | $81,532 |
| Renter-Occupied | 160,661 (45.1%) | $40,420 |
| Average | 356,357 (100.0%) | $59,110 |
Occupancy by Householder Income Bracket in Indianapolis
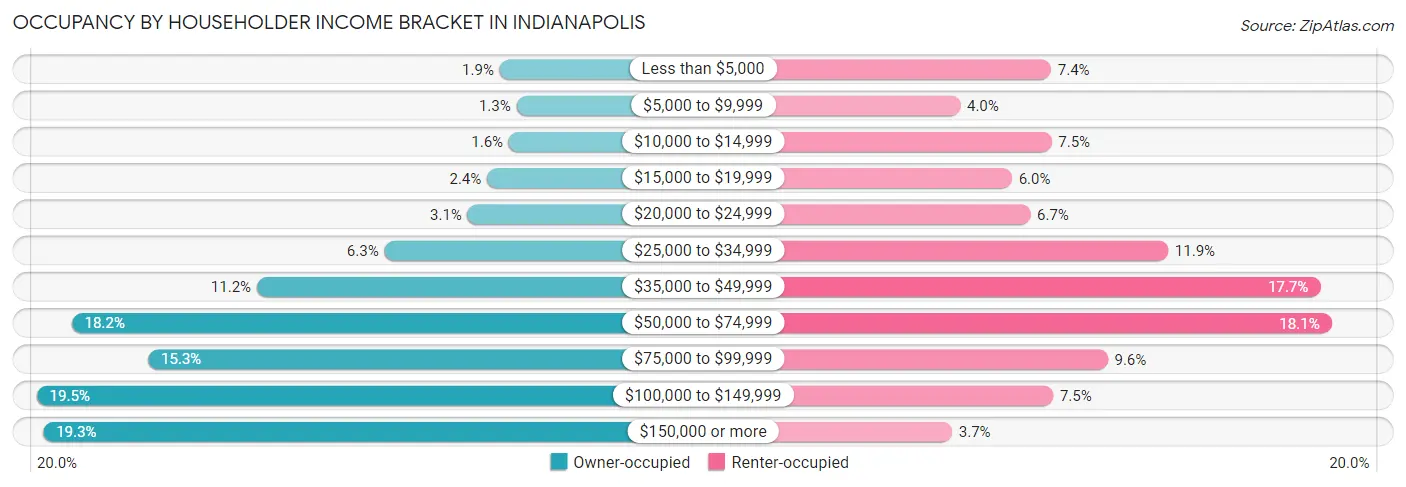
| Income Bracket | Owner-occupied | Renter-occupied |
| Less than $5,000 | 3,717 (1.9%) | 11,957 (7.4%) |
| $5,000 to $9,999 | 2,468 (1.3%) | 6,402 (4.0%) |
| $10,000 to $14,999 | 3,041 (1.5%) | 11,987 (7.5%) |
| $15,000 to $19,999 | 4,652 (2.4%) | 9,553 (5.9%) |
| $20,000 to $24,999 | 6,114 (3.1%) | 10,685 (6.7%) |
| $25,000 to $34,999 | 12,317 (6.3%) | 19,115 (11.9%) |
| $35,000 to $49,999 | 21,827 (11.2%) | 28,431 (17.7%) |
| $50,000 to $74,999 | 35,636 (18.2%) | 29,125 (18.1%) |
| $75,000 to $99,999 | 29,934 (15.3%) | 15,428 (9.6%) |
| $100,000 to $149,999 | 38,236 (19.5%) | 12,077 (7.5%) |
| $150,000 or more | 37,754 (19.3%) | 5,901 (3.7%) |
| Total | 195,696 (100.0%) | 160,661 (100.0%) |
Monthly Housing Cost Tiers in Indianapolis
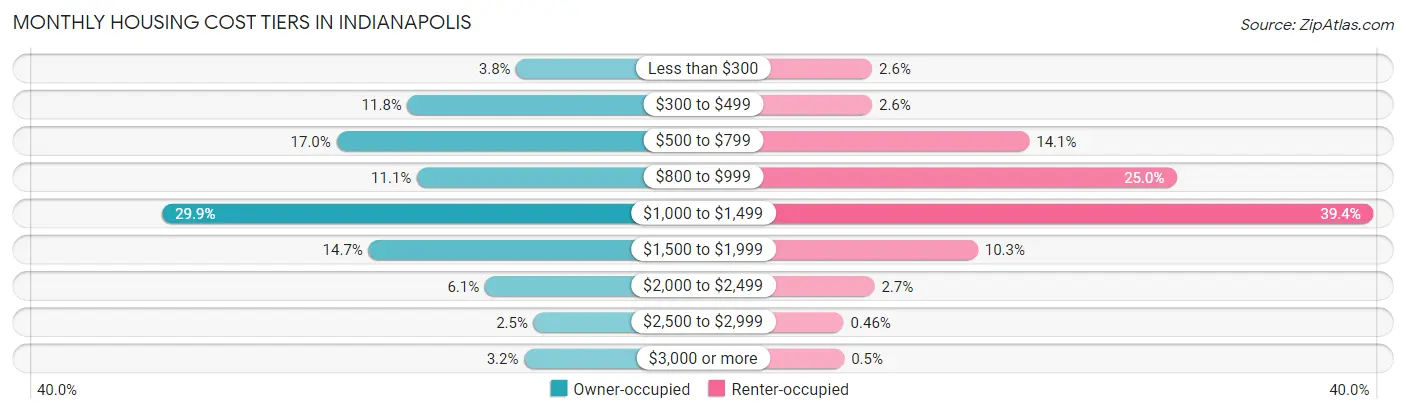
| Monthly Cost | Owner-occupied | Renter-occupied |
| Less than $300 | 7,405 (3.8%) | 4,111 (2.6%) |
| $300 to $499 | 23,071 (11.8%) | 4,094 (2.5%) |
| $500 to $799 | 33,303 (17.0%) | 22,694 (14.1%) |
| $800 to $999 | 21,698 (11.1%) | 40,086 (24.9%) |
| $1,000 to $1,499 | 58,454 (29.9%) | 63,323 (39.4%) |
| $1,500 to $1,999 | 28,697 (14.7%) | 16,609 (10.3%) |
| $2,000 to $2,499 | 11,922 (6.1%) | 4,384 (2.7%) |
| $2,500 to $2,999 | 4,891 (2.5%) | 732 (0.5%) |
| $3,000 or more | 6,255 (3.2%) | 802 (0.5%) |
| Total | 195,696 (100.0%) | 160,661 (100.0%) |
Physical Housing Characteristics in Indianapolis
Housing Structures in Indianapolis
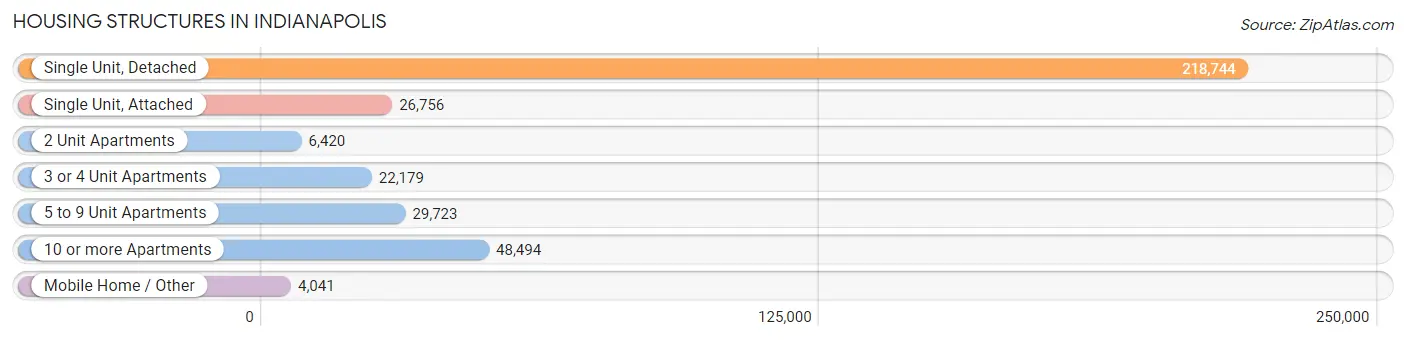
| Structure Type | # Housing Units | % Housing Units |
| Single Unit, Detached | 218,744 | 61.4% |
| Single Unit, Attached | 26,756 | 7.5% |
| 2 Unit Apartments | 6,420 | 1.8% |
| 3 or 4 Unit Apartments | 22,179 | 6.2% |
| 5 to 9 Unit Apartments | 29,723 | 8.3% |
| 10 or more Apartments | 48,494 | 13.6% |
| Mobile Home / Other | 4,041 | 1.1% |
| Total | 356,357 | 100.0% |
Housing Structures by Occupancy in Indianapolis
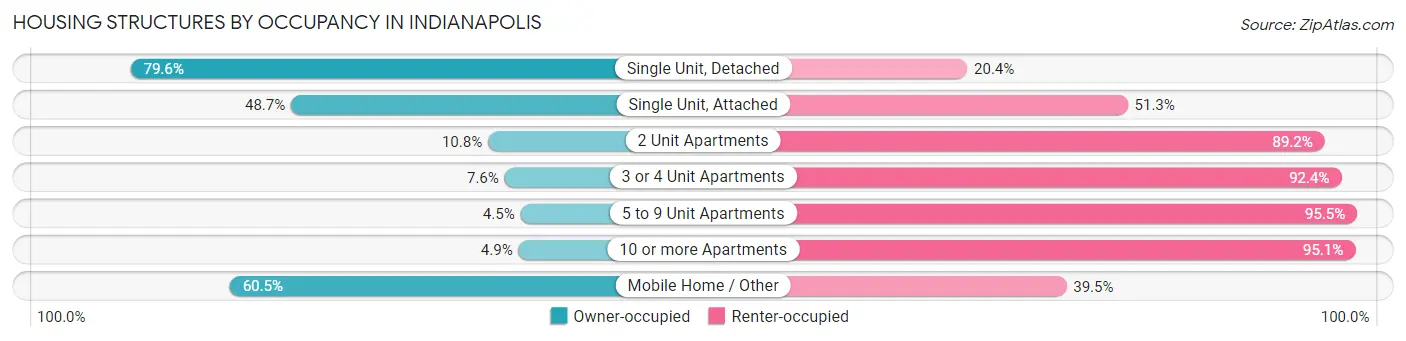
| Structure Type | Owner-occupied | Renter-occupied |
| Single Unit, Detached | 174,121 (79.6%) | 44,623 (20.4%) |
| Single Unit, Attached | 13,031 (48.7%) | 13,725 (51.3%) |
| 2 Unit Apartments | 692 (10.8%) | 5,728 (89.2%) |
| 3 or 4 Unit Apartments | 1,681 (7.6%) | 20,498 (92.4%) |
| 5 to 9 Unit Apartments | 1,344 (4.5%) | 28,379 (95.5%) |
| 10 or more Apartments | 2,382 (4.9%) | 46,112 (95.1%) |
| Mobile Home / Other | 2,445 (60.5%) | 1,596 (39.5%) |
| Total | 195,696 (54.9%) | 160,661 (45.1%) |
Housing Structures by Number of Rooms in Indianapolis
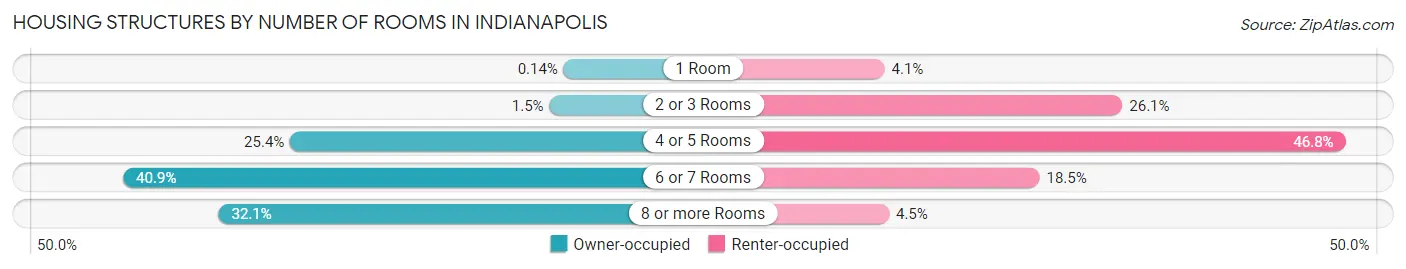
| Number of Rooms | Owner-occupied | Renter-occupied |
| 1 Room | 270 (0.1%) | 6,628 (4.1%) |
| 2 or 3 Rooms | 2,859 (1.5%) | 41,972 (26.1%) |
| 4 or 5 Rooms | 49,784 (25.4%) | 75,105 (46.8%) |
| 6 or 7 Rooms | 80,017 (40.9%) | 29,665 (18.5%) |
| 8 or more Rooms | 62,766 (32.1%) | 7,291 (4.5%) |
| Total | 195,696 (100.0%) | 160,661 (100.0%) |
Housing Structure by Heating Type in Indianapolis
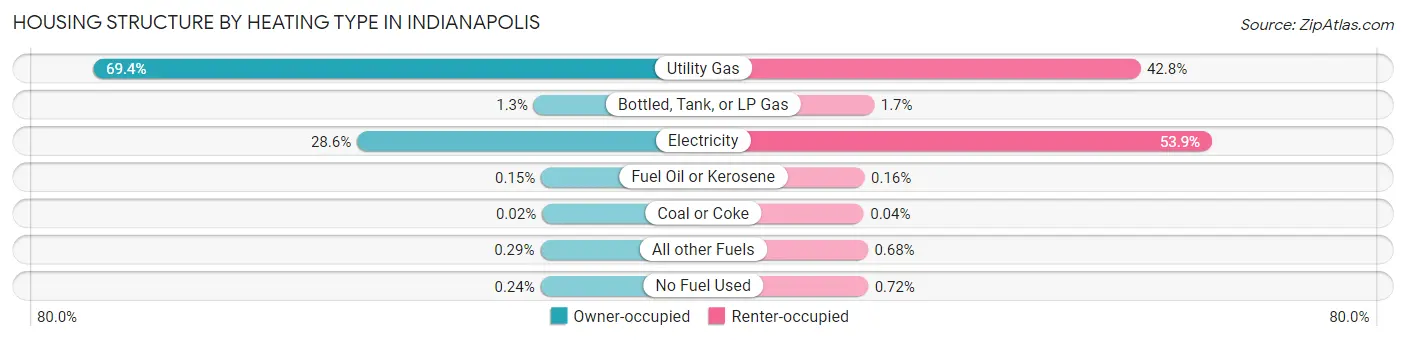
| Heating Type | Owner-occupied | Renter-occupied |
| Utility Gas | 135,834 (69.4%) | 68,774 (42.8%) |
| Bottled, Tank, or LP Gas | 2,477 (1.3%) | 2,675 (1.7%) |
| Electricity | 56,009 (28.6%) | 86,641 (53.9%) |
| Fuel Oil or Kerosene | 298 (0.2%) | 256 (0.2%) |
| Coal or Coke | 39 (0.0%) | 66 (0.0%) |
| All other Fuels | 572 (0.3%) | 1,088 (0.7%) |
| No Fuel Used | 467 (0.2%) | 1,161 (0.7%) |
| Total | 195,696 (100.0%) | 160,661 (100.0%) |
Household Vehicle Usage in Indianapolis
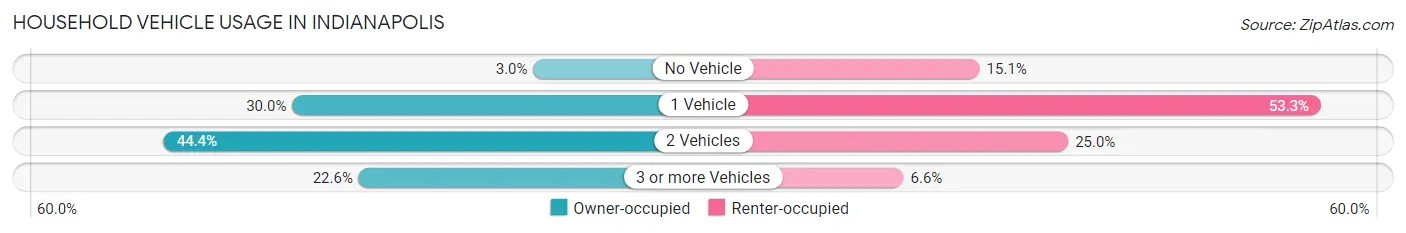
| Vehicles per Household | Owner-occupied | Renter-occupied |
| No Vehicle | 5,884 (3.0%) | 24,240 (15.1%) |
| 1 Vehicle | 58,745 (30.0%) | 85,672 (53.3%) |
| 2 Vehicles | 86,898 (44.4%) | 40,187 (25.0%) |
| 3 or more Vehicles | 44,169 (22.6%) | 10,562 (6.6%) |
| Total | 195,696 (100.0%) | 160,661 (100.0%) |
Real Estate & Mortgages in Indianapolis
Real Estate and Mortgage Overview in Indianapolis
| Characteristic | Without Mortgage | With Mortgage |
| Housing Units | 61,311 | 134,385 |
| Median Property Value | $158,900 | $194,300 |
| Median Household Income | $61,618 | $29,053 |
| Monthly Housing Costs | $513 | $6,036 |
| Real Estate Taxes | $1,549 | $4,223 |
Property Value by Mortgage Status in Indianapolis
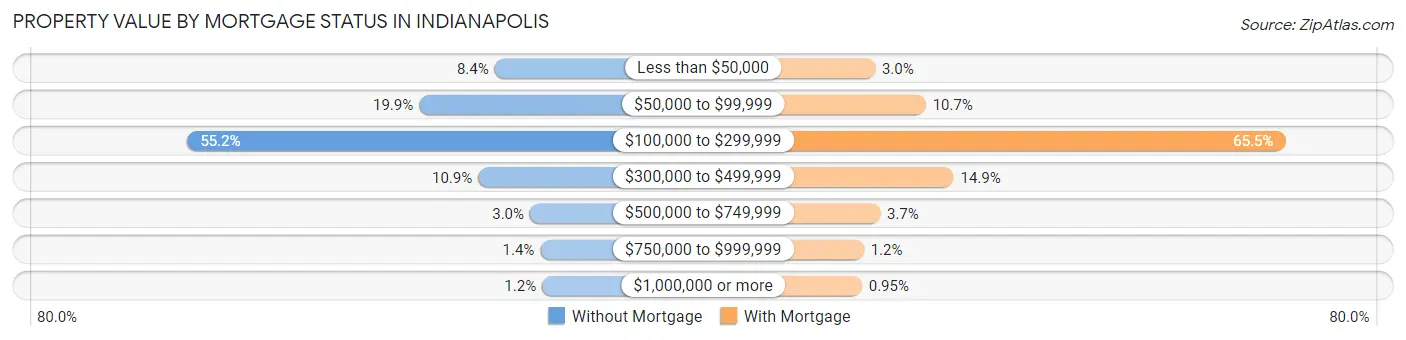
| Property Value | Without Mortgage | With Mortgage |
| Less than $50,000 | 5,143 (8.4%) | 3,980 (3.0%) |
| $50,000 to $99,999 | 12,195 (19.9%) | 14,370 (10.7%) |
| $100,000 to $299,999 | 33,851 (55.2%) | 88,013 (65.5%) |
| $300,000 to $499,999 | 6,692 (10.9%) | 20,066 (14.9%) |
| $500,000 to $749,999 | 1,843 (3.0%) | 5,010 (3.7%) |
| $750,000 to $999,999 | 878 (1.4%) | 1,663 (1.2%) |
| $1,000,000 or more | 709 (1.2%) | 1,283 (0.9%) |
| Total | 61,311 (100.0%) | 134,385 (100.0%) |
Household Income by Mortgage Status in Indianapolis
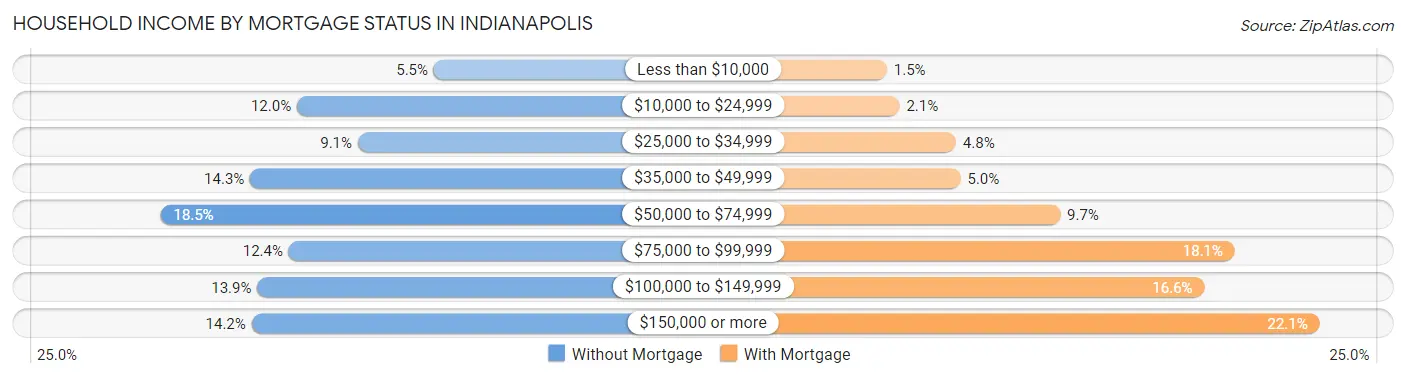
| Household Income | Without Mortgage | With Mortgage |
| Less than $10,000 | 3,377 (5.5%) | 2,002 (1.5%) |
| $10,000 to $24,999 | 7,378 (12.0%) | 2,808 (2.1%) |
| $25,000 to $34,999 | 5,597 (9.1%) | 6,429 (4.8%) |
| $35,000 to $49,999 | 8,744 (14.3%) | 6,720 (5.0%) |
| $50,000 to $74,999 | 11,361 (18.5%) | 13,083 (9.7%) |
| $75,000 to $99,999 | 7,616 (12.4%) | 24,275 (18.1%) |
| $100,000 to $149,999 | 8,537 (13.9%) | 22,318 (16.6%) |
| $150,000 or more | 8,701 (14.2%) | 29,699 (22.1%) |
| Total | 61,311 (100.0%) | 134,385 (100.0%) |
Property Value to Household Income Ratio in Indianapolis
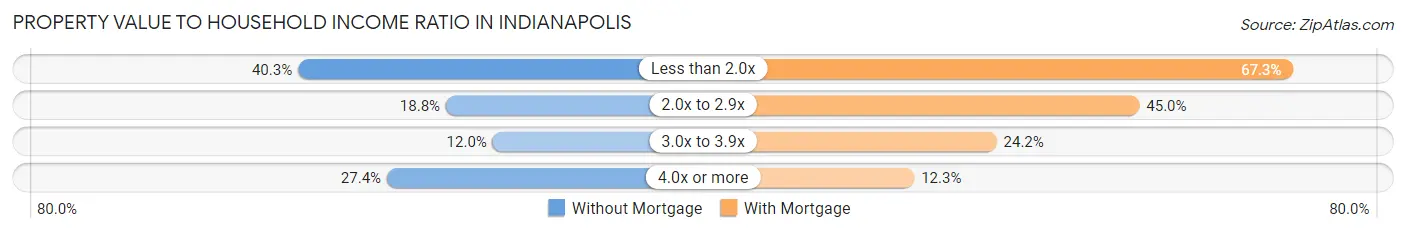
| Value-to-Income Ratio | Without Mortgage | With Mortgage |
| Less than 2.0x | 24,697 (40.3%) | 90,464 (67.3%) |
| 2.0x to 2.9x | 11,520 (18.8%) | 60,413 (45.0%) |
| 3.0x to 3.9x | 7,359 (12.0%) | 32,547 (24.2%) |
| 4.0x or more | 16,776 (27.4%) | 16,468 (12.2%) |
| Total | 61,311 (100.0%) | 134,385 (100.0%) |
Real Estate Taxes by Mortgage Status in Indianapolis
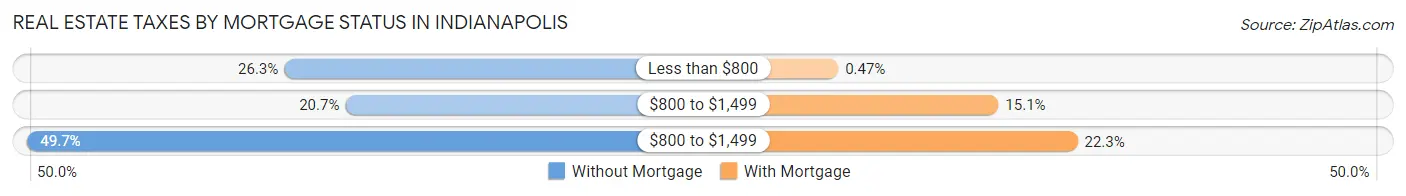
| Property Taxes | Without Mortgage | With Mortgage |
| Less than $800 | 16,126 (26.3%) | 632 (0.5%) |
| $800 to $1,499 | 12,704 (20.7%) | 20,286 (15.1%) |
| $800 to $1,499 | 30,496 (49.7%) | 30,008 (22.3%) |
| Total | 61,311 (100.0%) | 134,385 (100.0%) |
Health & Disability in Indianapolis
Health Insurance Coverage by Age in Indianapolis

| Age Bracket | With Coverage | Without Coverage |
| Under 6 Years | 69,772 (94.8%) | 3,863 (5.2%) |
| 6 to 18 Years | 143,937 (93.5%) | 10,037 (6.5%) |
| 19 to 25 Years | 75,159 (84.5%) | 13,750 (15.5%) |
| 26 to 34 Years | 113,338 (86.1%) | 18,347 (13.9%) |
| 35 to 44 Years | 97,696 (85.7%) | 16,300 (14.3%) |
| 45 to 54 Years | 88,046 (88.5%) | 11,398 (11.5%) |
| 55 to 64 Years | 94,452 (92.5%) | 7,673 (7.5%) |
| 65 to 74 Years | 67,851 (99.0%) | 718 (1.1%) |
| 75 Years and older | 40,789 (99.7%) | 139 (0.3%) |
| Total | 791,040 (90.6%) | 82,225 (9.4%) |
Health Insurance Coverage by Citizenship Status in Indianapolis
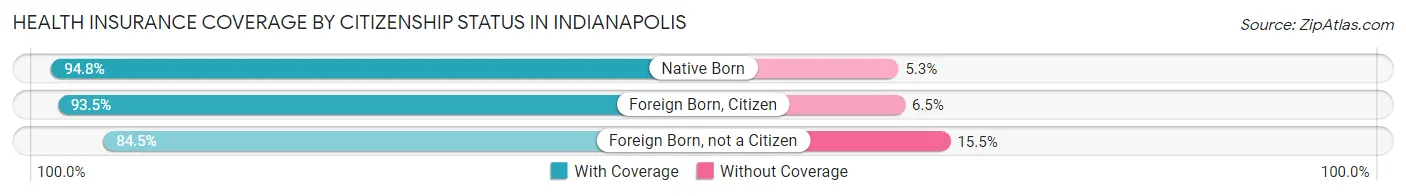
| Citizenship Status | With Coverage | Without Coverage |
| Native Born | 69,772 (94.8%) | 3,863 (5.2%) |
| Foreign Born, Citizen | 143,937 (93.5%) | 10,037 (6.5%) |
| Foreign Born, not a Citizen | 75,159 (84.5%) | 13,750 (15.5%) |
Health Insurance Coverage by Household Income in Indianapolis
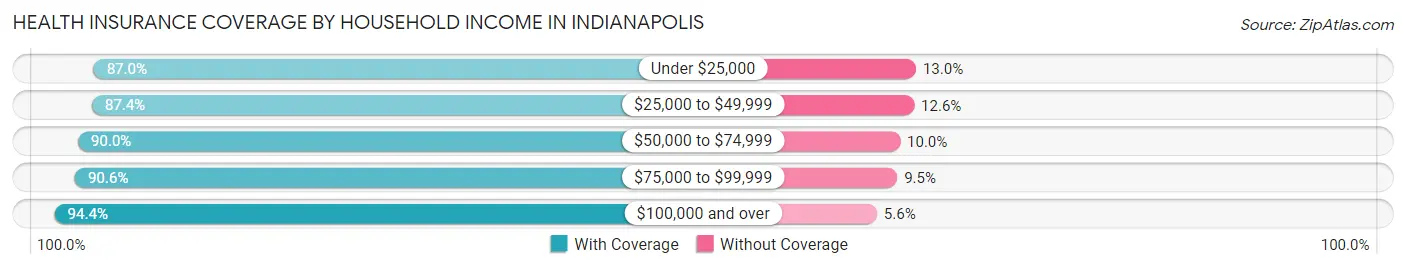
| Household Income | With Coverage | Without Coverage |
| Under $25,000 | 112,272 (87.0%) | 16,723 (13.0%) |
| $25,000 to $49,999 | 150,989 (87.4%) | 21,805 (12.6%) |
| $50,000 to $74,999 | 141,053 (90.0%) | 15,654 (10.0%) |
| $75,000 to $99,999 | 109,802 (90.5%) | 11,456 (9.5%) |
| $100,000 and over | 270,793 (94.4%) | 16,192 (5.6%) |
Public vs Private Health Insurance Coverage by Age in Indianapolis
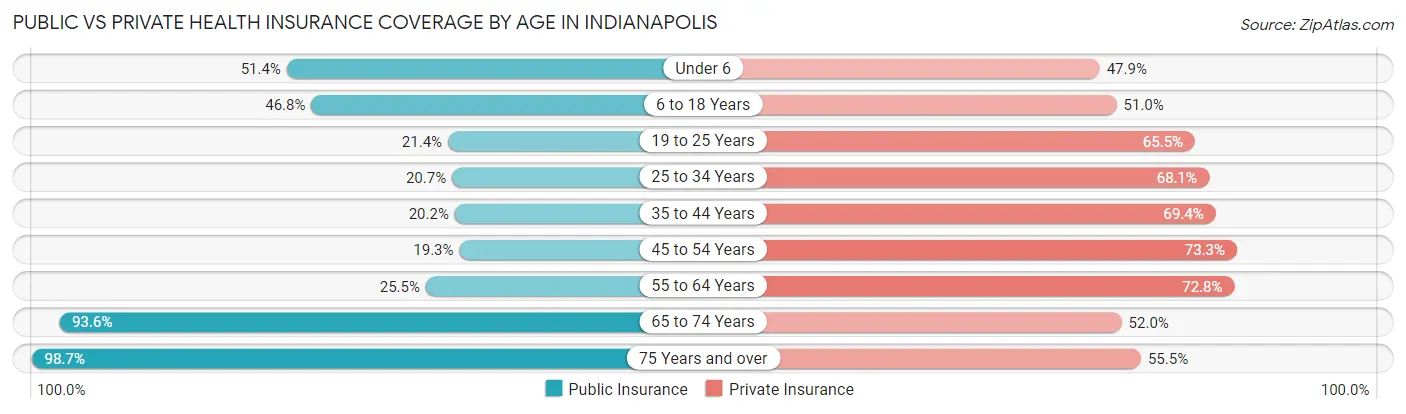
| Age Bracket | Public Insurance | Private Insurance |
| Under 6 | 37,815 (51.3%) | 35,257 (47.9%) |
| 6 to 18 Years | 72,035 (46.8%) | 78,544 (51.0%) |
| 19 to 25 Years | 19,057 (21.4%) | 58,274 (65.5%) |
| 25 to 34 Years | 27,225 (20.7%) | 89,709 (68.1%) |
| 35 to 44 Years | 22,978 (20.2%) | 79,097 (69.4%) |
| 45 to 54 Years | 19,197 (19.3%) | 72,908 (73.3%) |
| 55 to 64 Years | 26,085 (25.5%) | 74,392 (72.8%) |
| 65 to 74 Years | 64,188 (93.6%) | 35,619 (51.9%) |
| 75 Years and over | 40,394 (98.7%) | 22,729 (55.5%) |
| Total | 328,974 (37.7%) | 546,529 (62.6%) |
Disability Status by Sex by Age in Indianapolis
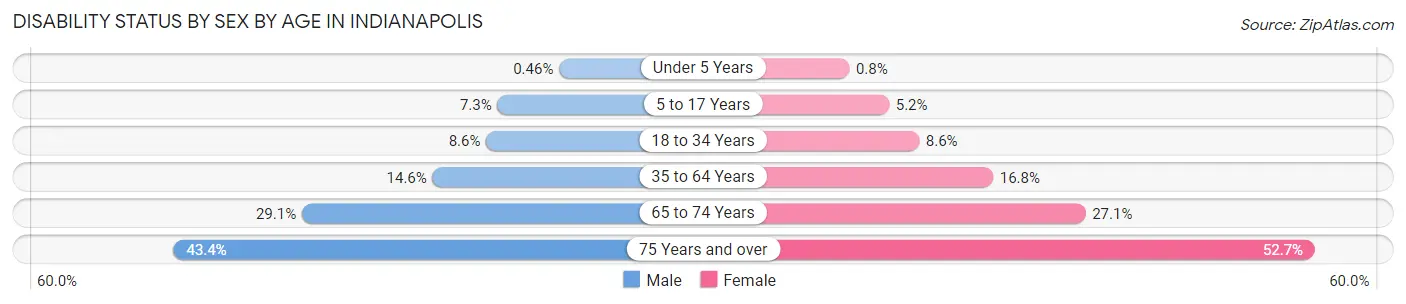
| Age Bracket | Male | Female |
| Under 5 Years | 145 (0.5%) | 246 (0.8%) |
| 5 to 17 Years | 5,841 (7.3%) | 3,874 (5.2%) |
| 18 to 34 Years | 9,696 (8.6%) | 10,248 (8.6%) |
| 35 to 64 Years | 22,313 (14.6%) | 27,300 (16.8%) |
| 65 to 74 Years | 9,050 (29.1%) | 10,161 (27.1%) |
| 75 Years and over | 6,868 (43.4%) | 13,231 (52.7%) |
Disability Class by Sex by Age in Indianapolis
Disability Class: Hearing Difficulty
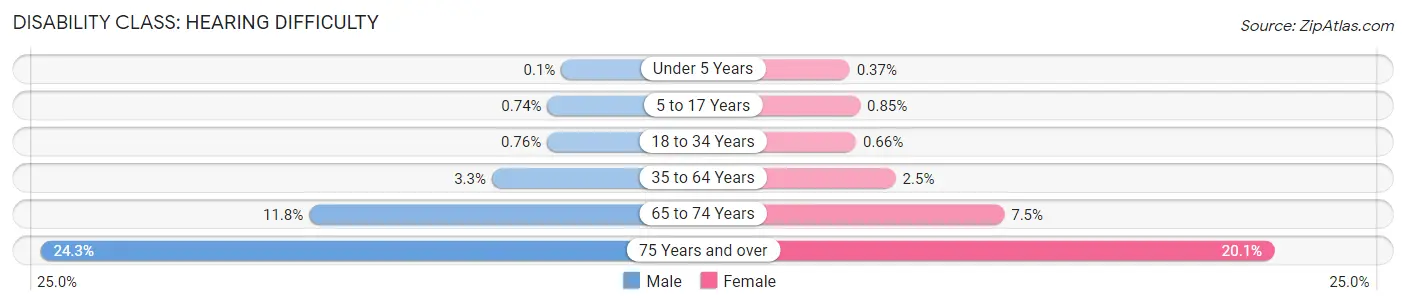
| Age Bracket | Male | Female |
| Under 5 Years | 30 (0.1%) | 113 (0.4%) |
| 5 to 17 Years | 588 (0.7%) | 627 (0.9%) |
| 18 to 34 Years | 860 (0.8%) | 790 (0.7%) |
| 35 to 64 Years | 5,086 (3.3%) | 4,058 (2.5%) |
| 65 to 74 Years | 3,668 (11.8%) | 2,825 (7.5%) |
| 75 Years and over | 3,837 (24.3%) | 5,035 (20.1%) |
Disability Class: Vision Difficulty
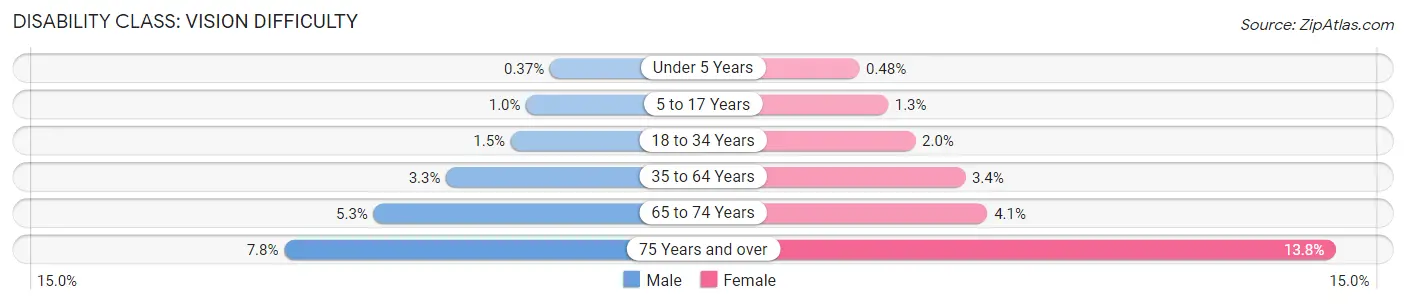
| Age Bracket | Male | Female |
| Under 5 Years | 115 (0.4%) | 147 (0.5%) |
| 5 to 17 Years | 824 (1.0%) | 951 (1.3%) |
| 18 to 34 Years | 1,646 (1.5%) | 2,442 (2.0%) |
| 35 to 64 Years | 5,000 (3.3%) | 5,563 (3.4%) |
| 65 to 74 Years | 1,642 (5.3%) | 1,518 (4.1%) |
| 75 Years and over | 1,229 (7.8%) | 3,455 (13.8%) |
Disability Class: Cognitive Difficulty

| Age Bracket | Male | Female |
| 5 to 17 Years | 4,592 (5.8%) | 2,691 (3.6%) |
| 18 to 34 Years | 6,335 (5.6%) | 6,355 (5.3%) |
| 35 to 64 Years | 9,450 (6.2%) | 10,313 (6.4%) |
| 65 to 74 Years | 2,043 (6.6%) | 1,850 (4.9%) |
| 75 Years and over | 1,820 (11.5%) | 3,811 (15.2%) |
Disability Class: Ambulatory Difficulty
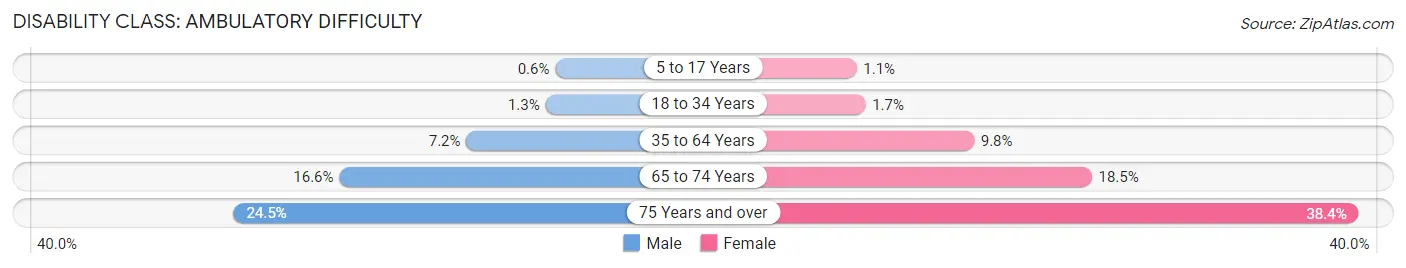
| Age Bracket | Male | Female |
| 5 to 17 Years | 475 (0.6%) | 800 (1.1%) |
| 18 to 34 Years | 1,489 (1.3%) | 2,085 (1.7%) |
| 35 to 64 Years | 11,037 (7.2%) | 15,904 (9.8%) |
| 65 to 74 Years | 5,170 (16.6%) | 6,950 (18.5%) |
| 75 Years and over | 3,874 (24.5%) | 9,632 (38.4%) |
Disability Class: Self-Care Difficulty
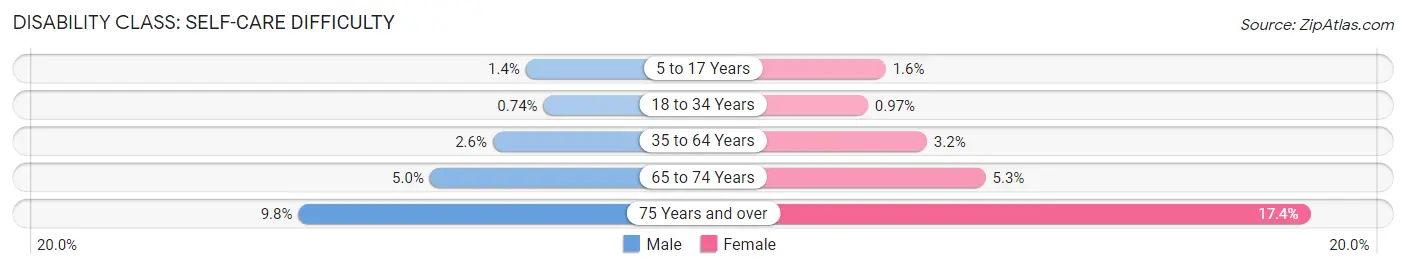
| Age Bracket | Male | Female |
| 5 to 17 Years | 1,116 (1.4%) | 1,205 (1.6%) |
| 18 to 34 Years | 834 (0.7%) | 1,159 (1.0%) |
| 35 to 64 Years | 4,022 (2.6%) | 5,132 (3.2%) |
| 65 to 74 Years | 1,543 (5.0%) | 2,001 (5.3%) |
| 75 Years and over | 1,557 (9.8%) | 4,367 (17.4%) |
Technology Access in Indianapolis
Computing Device Access in Indianapolis
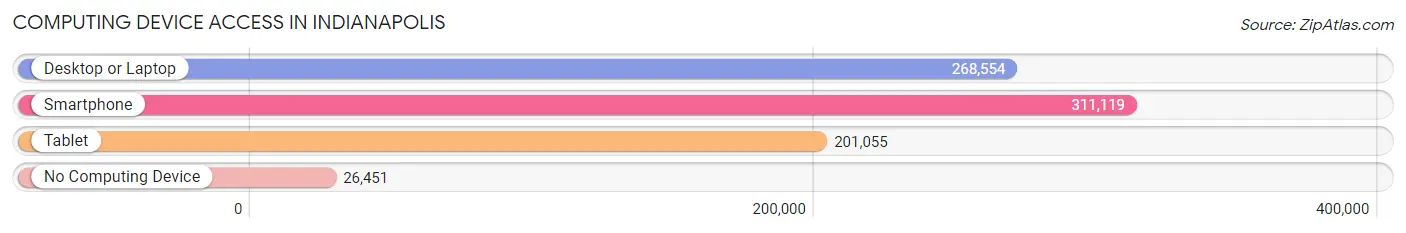
| Device Type | # Households | % Households |
| Desktop or Laptop | 268,554 | 75.4% |
| Smartphone | 311,119 | 87.3% |
| Tablet | 201,055 | 56.4% |
| No Computing Device | 26,451 | 7.4% |
| Total | 356,357 | 100.0% |
Internet Access in Indianapolis
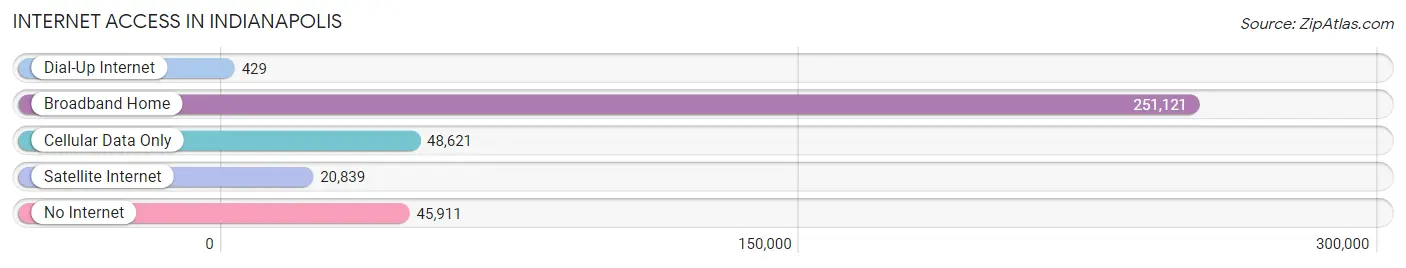
| Internet Type | # Households | % Households |
| Dial-Up Internet | 429 | 0.1% |
| Broadband Home | 251,121 | 70.5% |
| Cellular Data Only | 48,621 | 13.6% |
| Satellite Internet | 20,839 | 5.9% |
| No Internet | 45,911 | 12.9% |
| Total | 356,357 | 100.0% |
Indianapolis Summary
Indianapolis, Indiana is the capital and most populous city of the state of Indiana. It is located in the center of the state, in Marion County, and is the county seat. The city has a population of 872,680, making it the 16th most populous city in the United States. It is the second-largest city in the Midwest, after Chicago.
History
The area that is now Indianapolis was first settled in 1820 by the Delaware, Miami, and Potawatomi Native American tribes. The first non-Native American settlers arrived in 1821, and the city was officially founded in 1825. The city was named after the state’s first governor, Jonathan Jennings.
In 1847, Indianapolis was chosen as the state capital, and the city began to grow rapidly. The city was connected to the rest of the country by the National Road in 1852, and the first railroad arrived in 1853. The city was also home to the first professional baseball team in the National League, the Indianapolis Hoosiers, in 1878.
In the late 19th century, Indianapolis became a major industrial center, with factories producing automobiles, steel, and other products. The city was also home to the first professional basketball team, the Indianapolis Olympians, in 1949.
Geography
Indianapolis is located in the center of the state of Indiana, in Marion County. It is situated on the White River, and is surrounded by several smaller towns and cities. The city has a total area of 369.2 square miles, of which 361.5 square miles is land and 7.7 square miles is water.
The city is located in the Central Till Plains region of the Midwest, and has a humid continental climate. Summers are hot and humid, with temperatures reaching up to 90 degrees Fahrenheit, while winters are cold and snowy, with temperatures dropping to as low as 10 degrees Fahrenheit.
Economy
Indianapolis is a major economic center in the Midwest. The city’s economy is largely based on manufacturing, with major employers including Eli Lilly and Company, Rolls-Royce, and Cummins. The city is also home to several major universities, including Indiana University-Purdue University Indianapolis, Butler University, and the University of Indianapolis.
The city is also home to several major sports teams, including the Indianapolis Colts of the National Football League, the Indiana Pacers of the National Basketball Association, and the Indianapolis Indians of Minor League Baseball.
Demographics
As of the 2020 census, the population of Indianapolis was 872,680. The city is racially diverse, with the largest racial groups being White (63.2%), Black or African American (27.3%), and Hispanic or Latino (7.2%). The median household income is $50,867, and the median age is 34.7 years.
Indianapolis is home to several major religions, including Christianity (63.2%), Judaism (2.2%), and Islam (1.2%). The city is also home to a large LGBT community, with an estimated 8.3% of the population identifying as LGBT.
Conclusion
Indianapolis is a major city in the Midwest, with a population of 872,680. The city is home to several major industries, universities, and sports teams, and is racially and religiously diverse. The city has a humid continental climate, with hot and humid summers and cold and snowy winters. Indianapolis is a major economic center in the Midwest, and is an important cultural and historical hub in the state of Indiana.
Common Questions
What is Per Capita Income in Indianapolis?
Per Capita income in Indianapolis is $34,592.
What is the Median Family Income in Indianapolis?
Median Family Income in Indianapolis is $75,991.
What is the Median Household income in Indianapolis?
Median Household Income in Indianapolis is $59,110.
What is Income or Wage Gap in Indianapolis?
Income or Wage Gap in Indianapolis is 18.9%.
Women in Indianapolis earn 81.1 cents for every dollar earned by a man.
What is Family Income Deficit in Indianapolis?
Family Income Deficit in Indianapolis is $12,098.
Families that are below poverty line in Indianapolis earn $12,098 less on average than the poverty threshold level.
What is Inequality or Gini Index in Indianapolis?
Inequality or Gini Index in Indianapolis is 0.48.
What is the Total Population of Indianapolis?
Total Population of Indianapolis is 882,006.
What is the Total Male Population of Indianapolis?
Total Male Population of Indianapolis is 428,950.
What is the Total Female Population of Indianapolis?
Total Female Population of Indianapolis is 453,056.
What is the Ratio of Males per 100 Females in Indianapolis?
There are 94.68 Males per 100 Females in Indianapolis.
What is the Ratio of Females per 100 Males in Indianapolis?
There are 105.62 Females per 100 Males in Indianapolis.
What is the Median Population Age in Indianapolis?
Median Population Age in Indianapolis is 34.3 Years.
What is the Average Family Size in Indianapolis
Average Family Size in Indianapolis is 3.3 People.
What is the Average Household Size in Indianapolis
Average Household Size in Indianapolis is 2.4 People.
How Large is the Labor Force in Indianapolis?
There are 463,306 People in the Labor Forcein in Indianapolis.
What is the Percentage of People in the Labor Force in Indianapolis?
67.2% of People are in the Labor Force in Indianapolis.
What is the Unemployment Rate in Indianapolis?
Unemployment Rate in Indianapolis is 5.6%.