Chamblee, GA Map & Demographics
Chamblee Map
Chamblee Overview
$45,713
PER CAPITA INCOME
$103,388
AVG FAMILY INCOME
$76,682
AVG HOUSEHOLD INCOME
1.9%
WAGE / INCOME GAP [ % ]
98.1¢/ $1
WAGE / INCOME GAP [ $ ]
$11,285
FAMILY INCOME DEFICIT
0.49
INEQUALITY / GINI INDEX
29,980
TOTAL POPULATION
15,847
MALE POPULATION
14,133
FEMALE POPULATION
112.13
MALES / 100 FEMALES
89.18
FEMALES / 100 MALES
33.3
MEDIAN AGE
3.4
AVG FAMILY SIZE
2.4
AVG HOUSEHOLD SIZE
18,409
LABOR FORCE [ PEOPLE ]
76.1%
PERCENT IN LABOR FORCE
1.9%
UNEMPLOYMENT RATE
Income in Chamblee
Income Overview in Chamblee
Per Capita Income in Chamblee is $45,713, while median incomes of families and households are $103,388 and $76,682 respectively.
| Characteristic | Number | Measure |
| Per Capita Income | 29,980 | $45,713 |
| Median Family Income | 5,833 | $103,388 |
| Mean Family Income | 5,833 | $142,685 |
| Median Household Income | 12,259 | $76,682 |
| Mean Household Income | 12,259 | $108,545 |
| Income Deficit | 5,833 | $11,285 |
| Wage / Income Gap (%) | 29,980 | 1.94% |
| Wage / Income Gap ($) | 29,980 | 98.06¢ per $1 |
| Gini / Inequality Index | 29,980 | 0.49 |
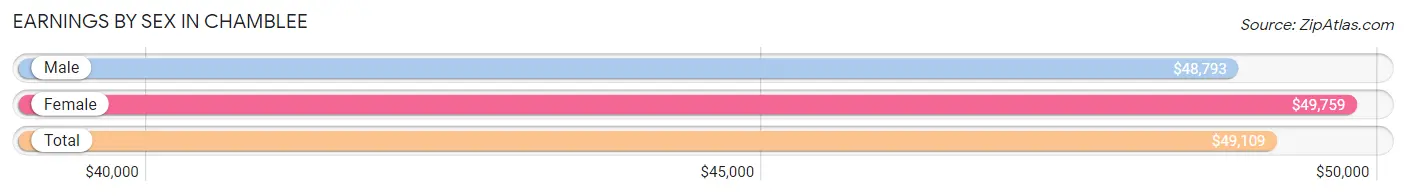
Earnings by Sex in Chamblee
Average Earnings in Chamblee are $49,109, $48,793 for men and $49,759 for women, a difference of 1.9%.
| Sex | Number | Average Earnings |
| Male | 10,453 (56.2%) | $48,793 |
| Female | 8,129 (43.8%) | $49,759 |
| Total | 18,582 (100.0%) | $49,109 |
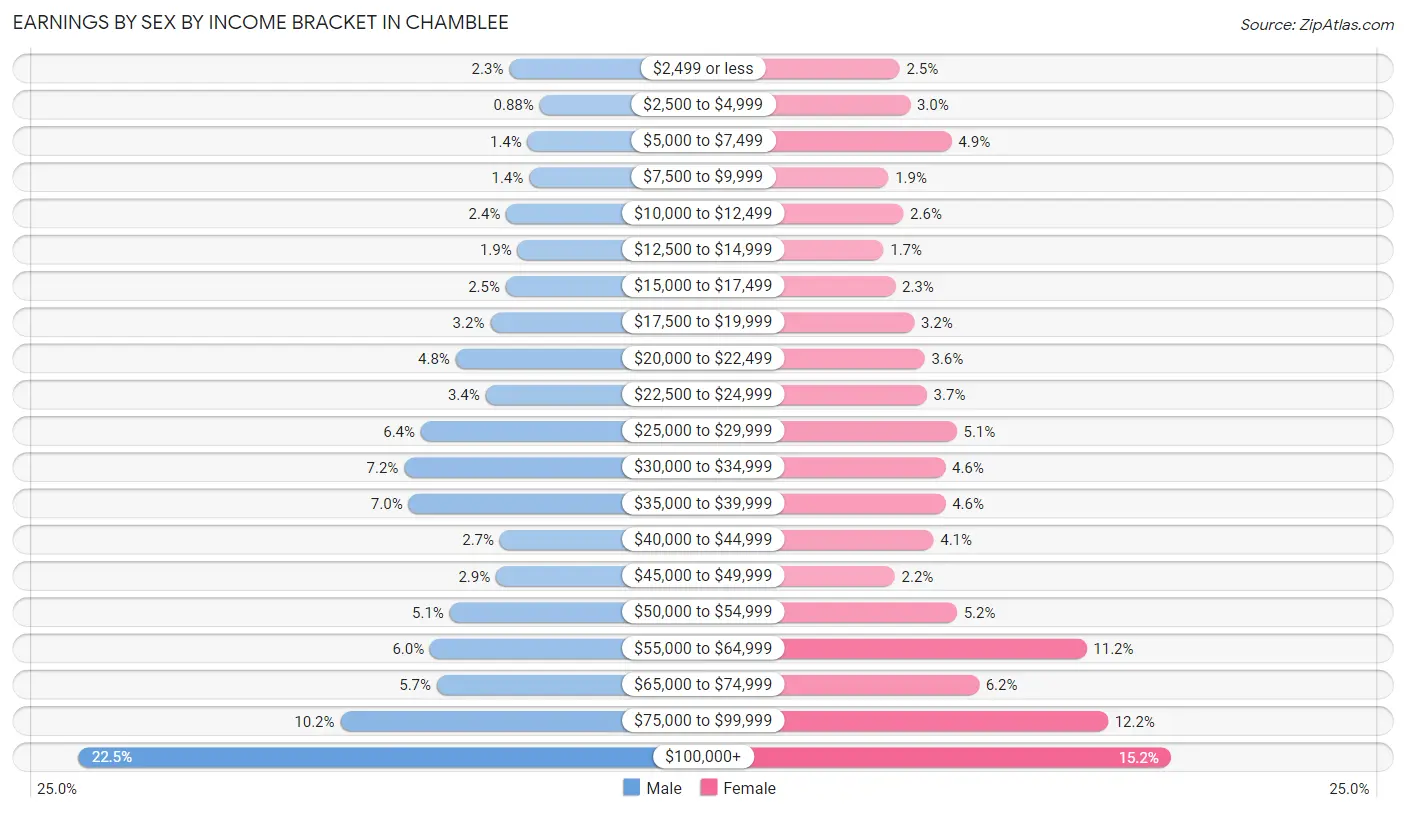
Earnings by Sex by Income Bracket in Chamblee
The most common earnings brackets in Chamblee are $100,000+ for men (2,348 | 22.5%) and $100,000+ for women (1,233 | 15.2%).
| Income | Male | Female |
| $2,499 or less | 240 (2.3%) | 201 (2.5%) |
| $2,500 to $4,999 | 92 (0.9%) | 241 (3.0%) |
| $5,000 to $7,499 | 151 (1.4%) | 398 (4.9%) |
| $7,500 to $9,999 | 143 (1.4%) | 158 (1.9%) |
| $10,000 to $12,499 | 255 (2.4%) | 215 (2.6%) |
| $12,500 to $14,999 | 200 (1.9%) | 139 (1.7%) |
| $15,000 to $17,499 | 257 (2.5%) | 184 (2.3%) |
| $17,500 to $19,999 | 333 (3.2%) | 256 (3.2%) |
| $20,000 to $22,499 | 503 (4.8%) | 296 (3.6%) |
| $22,500 to $24,999 | 356 (3.4%) | 304 (3.7%) |
| $25,000 to $29,999 | 673 (6.4%) | 418 (5.1%) |
| $30,000 to $34,999 | 755 (7.2%) | 374 (4.6%) |
| $35,000 to $39,999 | 734 (7.0%) | 375 (4.6%) |
| $40,000 to $44,999 | 286 (2.7%) | 329 (4.1%) |
| $45,000 to $49,999 | 305 (2.9%) | 182 (2.2%) |
| $50,000 to $54,999 | 532 (5.1%) | 419 (5.1%) |
| $55,000 to $64,999 | 628 (6.0%) | 912 (11.2%) |
| $65,000 to $74,999 | 595 (5.7%) | 502 (6.2%) |
| $75,000 to $99,999 | 1,067 (10.2%) | 993 (12.2%) |
| $100,000+ | 2,348 (22.5%) | 1,233 (15.2%) |
| Total | 10,453 (100.0%) | 8,129 (100.0%) |
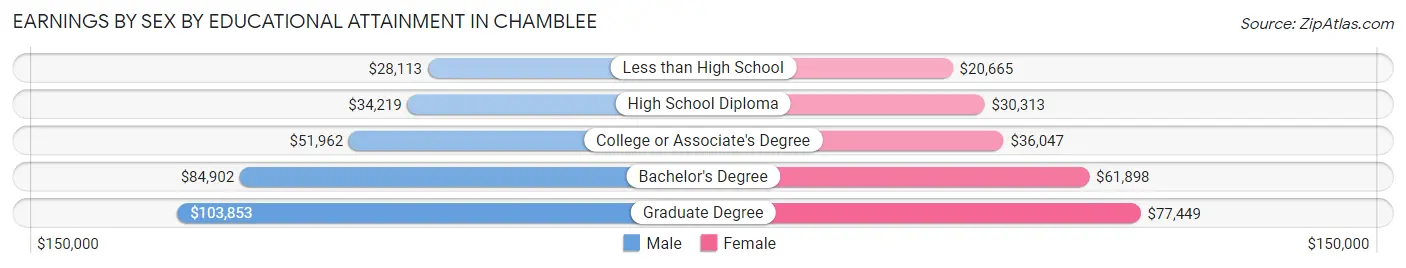
Earnings by Sex by Educational Attainment in Chamblee
Average earnings in Chamblee are $52,591 for men and $54,566 for women, a difference of 3.6%. Men with an educational attainment of graduate degree enjoy the highest average annual earnings of $103,853, while those with less than high school education earn the least with $28,113. Women with an educational attainment of graduate degree earn the most with the average annual earnings of $77,449, while those with less than high school education have the smallest earnings of $20,665.
| Educational Attainment | Male Income | Female Income |
| Less than High School | $28,113 | $20,665 |
| High School Diploma | $34,219 | $30,313 |
| College or Associate's Degree | $51,962 | $36,047 |
| Bachelor's Degree | $84,902 | $61,898 |
| Graduate Degree | $103,853 | $77,449 |
| Total | $52,591 | $54,566 |
Family Income in Chamblee
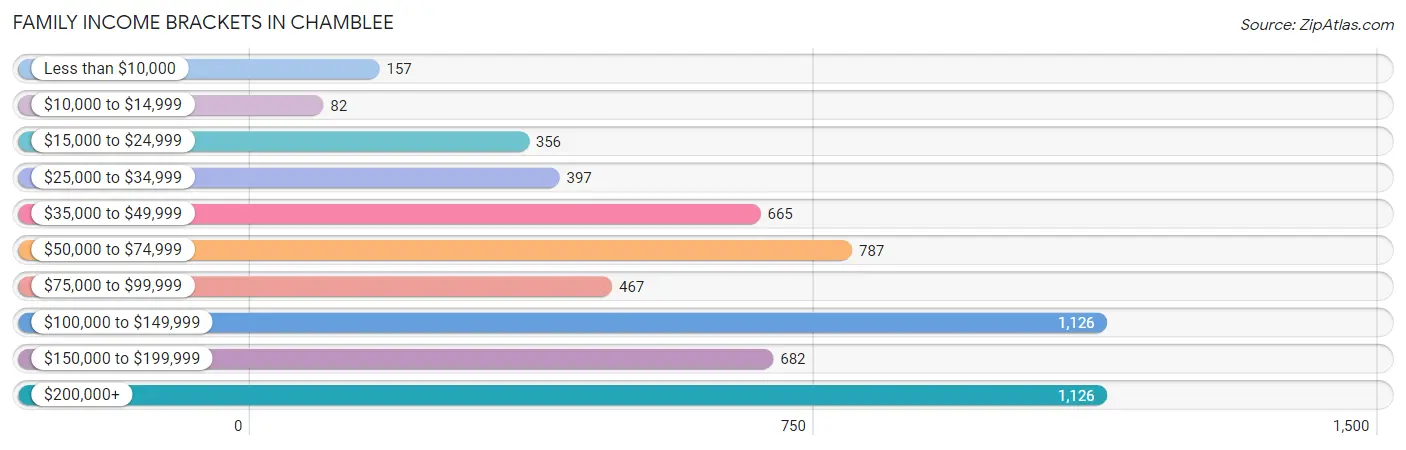
Family Income Brackets in Chamblee
According to the Chamblee family income data, there are 1,126 families falling into the $100,000 to $149,999 income range, which is the most common income bracket and makes up 19.3% of all families. Conversely, the $10,000 to $14,999 income bracket is the least frequent group with only 82 families (1.4%) belonging to this category.
| Income Bracket | # Families | % Families |
| Less than $10,000 | 157 | 2.7% |
| $10,000 to $14,999 | 82 | 1.4% |
| $15,000 to $24,999 | 356 | 6.1% |
| $25,000 to $34,999 | 397 | 6.8% |
| $35,000 to $49,999 | 665 | 11.4% |
| $50,000 to $74,999 | 787 | 13.5% |
| $75,000 to $99,999 | 467 | 8.0% |
| $100,000 to $149,999 | 1,126 | 19.3% |
| $150,000 to $199,999 | 682 | 11.7% |
| $200,000+ | 1,126 | 19.3% |
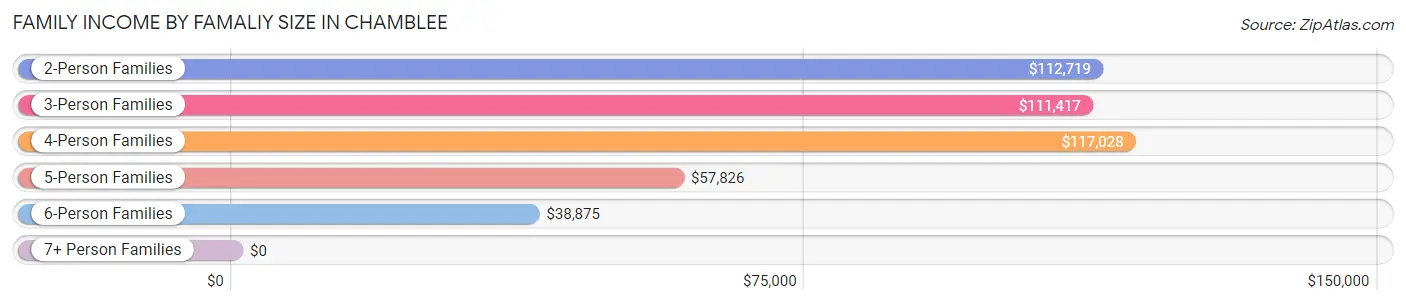
Family Income by Famaliy Size in Chamblee
4-person families (861 | 14.8%) account for the highest median family income in Chamblee with $117,028 per family, while 2-person families (3,086 | 52.9%) have the highest median income of $56,360 per family member.
| Income Bracket | # Families | Median Income |
| 2-Person Families | 3,086 (52.9%) | $112,719 |
| 3-Person Families | 1,213 (20.8%) | $111,417 |
| 4-Person Families | 861 (14.8%) | $117,028 |
| 5-Person Families | 400 (6.9%) | $57,826 |
| 6-Person Families | 119 (2.0%) | $38,875 |
| 7+ Person Families | 154 (2.6%) | $0 |
| Total | 5,833 (100.0%) | $103,388 |
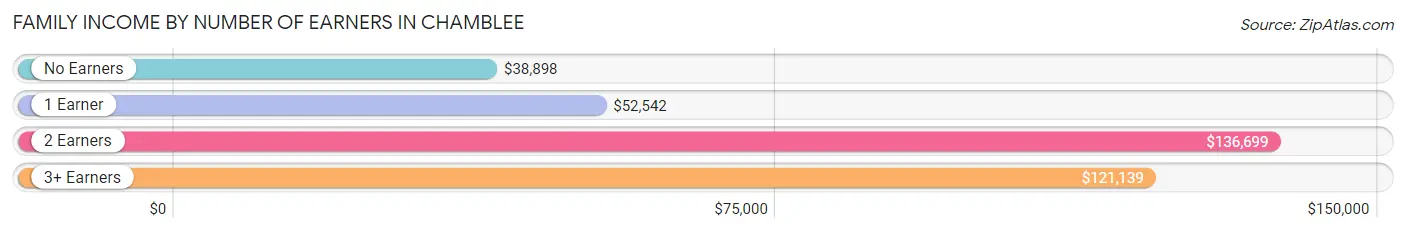
Family Income by Number of Earners in Chamblee
The median family income in Chamblee is $103,388, with families comprising 2 earners (2,977) having the highest median family income of $136,699, while families with no earners (349) have the lowest median family income of $38,898, accounting for 51.0% and 6.0% of families, respectively.
| Number of Earners | # Families | Median Income |
| No Earners | 349 (6.0%) | $38,898 |
| 1 Earner | 1,964 (33.7%) | $52,542 |
| 2 Earners | 2,977 (51.0%) | $136,699 |
| 3+ Earners | 543 (9.3%) | $121,139 |
| Total | 5,833 (100.0%) | $103,388 |
Household Income in Chamblee
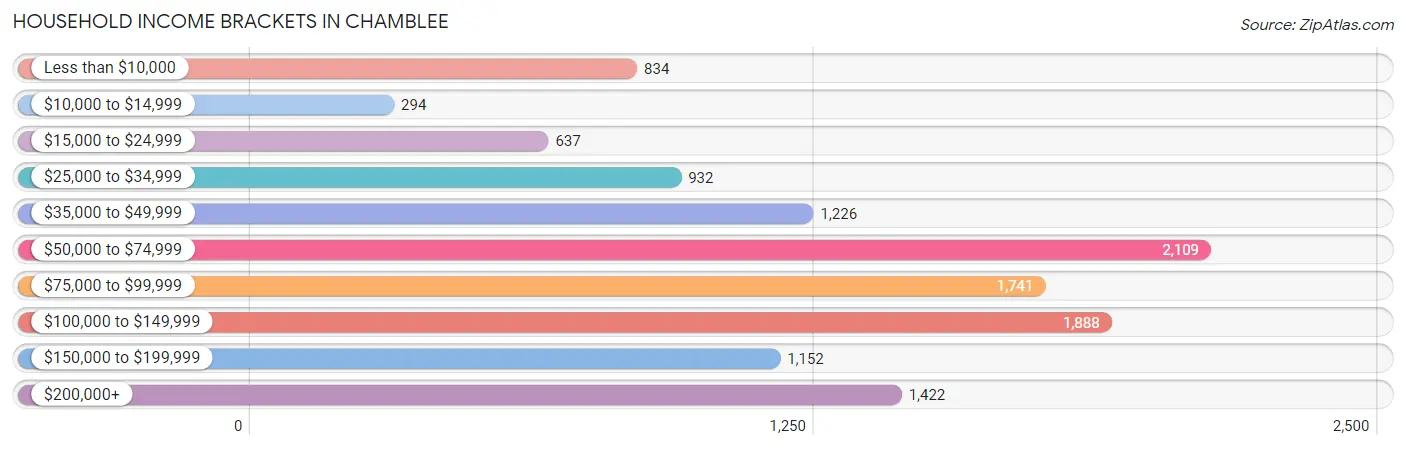
Household Income Brackets in Chamblee
With 2,109 households falling in the category, the $50,000 to $74,999 income range is the most frequent in Chamblee, accounting for 17.2% of all households. In contrast, only 294 households (2.4%) fall into the $10,000 to $14,999 income bracket, making it the least populous group.
| Income Bracket | # Households | % Households |
| Less than $10,000 | 834 | 6.8% |
| $10,000 to $14,999 | 294 | 2.4% |
| $15,000 to $24,999 | 637 | 5.2% |
| $25,000 to $34,999 | 932 | 7.6% |
| $35,000 to $49,999 | 1,226 | 10.0% |
| $50,000 to $74,999 | 2,109 | 17.2% |
| $75,000 to $99,999 | 1,741 | 14.2% |
| $100,000 to $149,999 | 1,888 | 15.4% |
| $150,000 to $199,999 | 1,152 | 9.4% |
| $200,000+ | 1,422 | 11.6% |
Household Income by Householder Age in Chamblee
The median household income in Chamblee is $76,682, with the highest median household income of $82,652 found in the 45 to 64 years age bracket for the primary householder. A total of 3,588 households (29.3%) fall into this category. Meanwhile, the 65+ years age bracket for the primary householder has the lowest median household income of $39,589, with 1,494 households (12.2%) in this group.
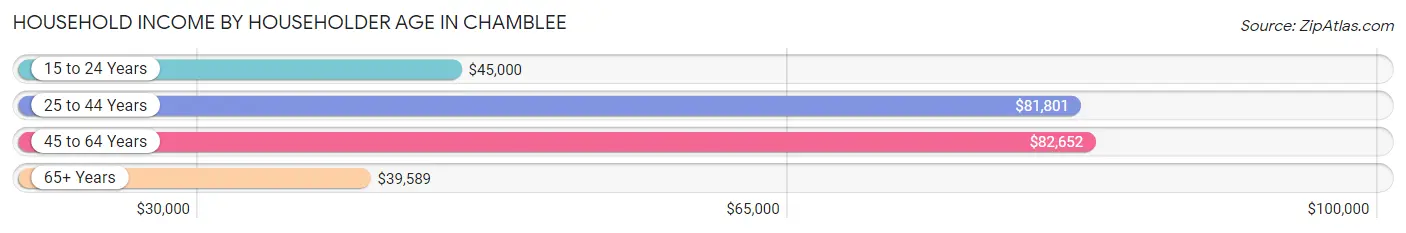
| Income Bracket | # Households | Median Income |
| 15 to 24 Years | 878 (7.2%) | $45,000 |
| 25 to 44 Years | 6,299 (51.4%) | $81,801 |
| 45 to 64 Years | 3,588 (29.3%) | $82,652 |
| 65+ Years | 1,494 (12.2%) | $39,589 |
| Total | 12,259 (100.0%) | $76,682 |
Poverty in Chamblee
Income Below Poverty by Sex and Age in Chamblee
With 17.3% poverty level for males and 17.3% for females among the residents of Chamblee, 12 to 14 year old males and 15 year old females are the most vulnerable to poverty, with 368 males (47.8%) and 44 females (45.4%) in their respective age groups living below the poverty level.
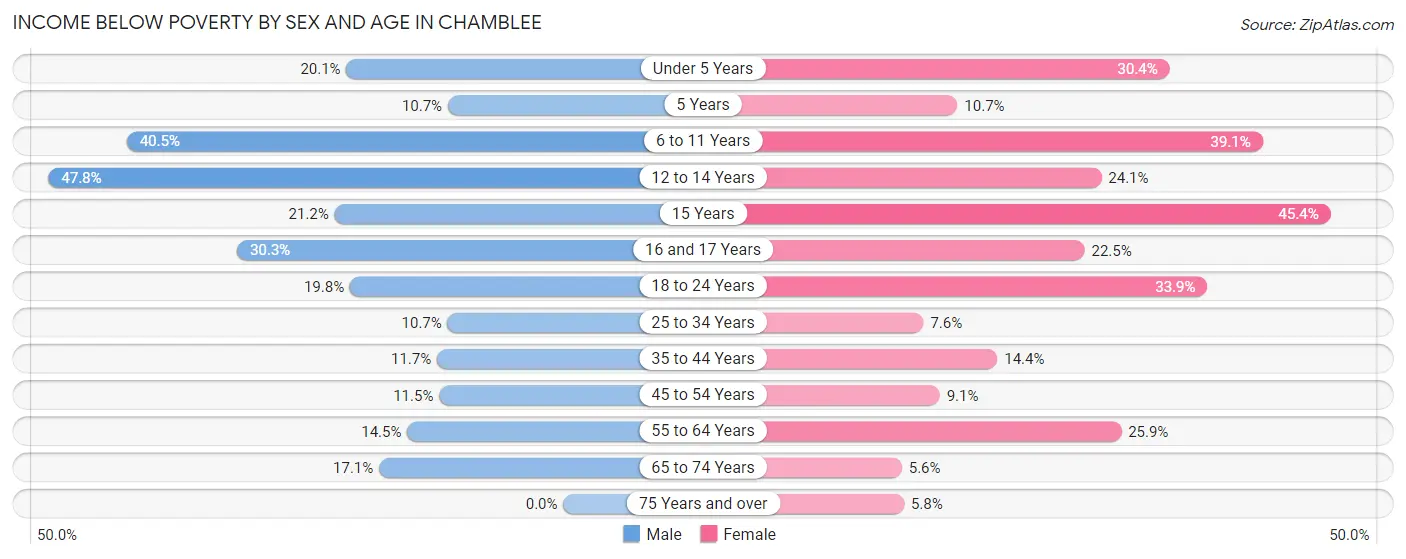
| Age Bracket | Male | Female |
| Under 5 Years | 285 (20.1%) | 223 (30.4%) |
| 5 Years | 9 (10.7%) | 22 (10.7%) |
| 6 to 11 Years | 466 (40.5%) | 314 (39.1%) |
| 12 to 14 Years | 368 (47.8%) | 73 (24.1%) |
| 15 Years | 31 (21.2%) | 44 (45.4%) |
| 16 and 17 Years | 83 (30.3%) | 155 (22.5%) |
| 18 to 24 Years | 254 (19.8%) | 502 (33.9%) |
| 25 to 34 Years | 375 (10.7%) | 220 (7.6%) |
| 35 to 44 Years | 315 (11.7%) | 376 (14.4%) |
| 45 to 54 Years | 242 (11.5%) | 160 (9.1%) |
| 55 to 64 Years | 180 (14.5%) | 257 (25.9%) |
| 65 to 74 Years | 113 (17.1%) | 51 (5.6%) |
| 75 Years and over | 0 (0.0%) | 29 (5.8%) |
| Total | 2,721 (17.3%) | 2,426 (17.3%) |
Income Above Poverty by Sex and Age in Chamblee
According to the poverty statistics in Chamblee, males aged 75 years and over and females aged 65 to 74 years are the age groups that are most secure financially, with 100.0% of males and 94.4% of females in these age groups living above the poverty line.
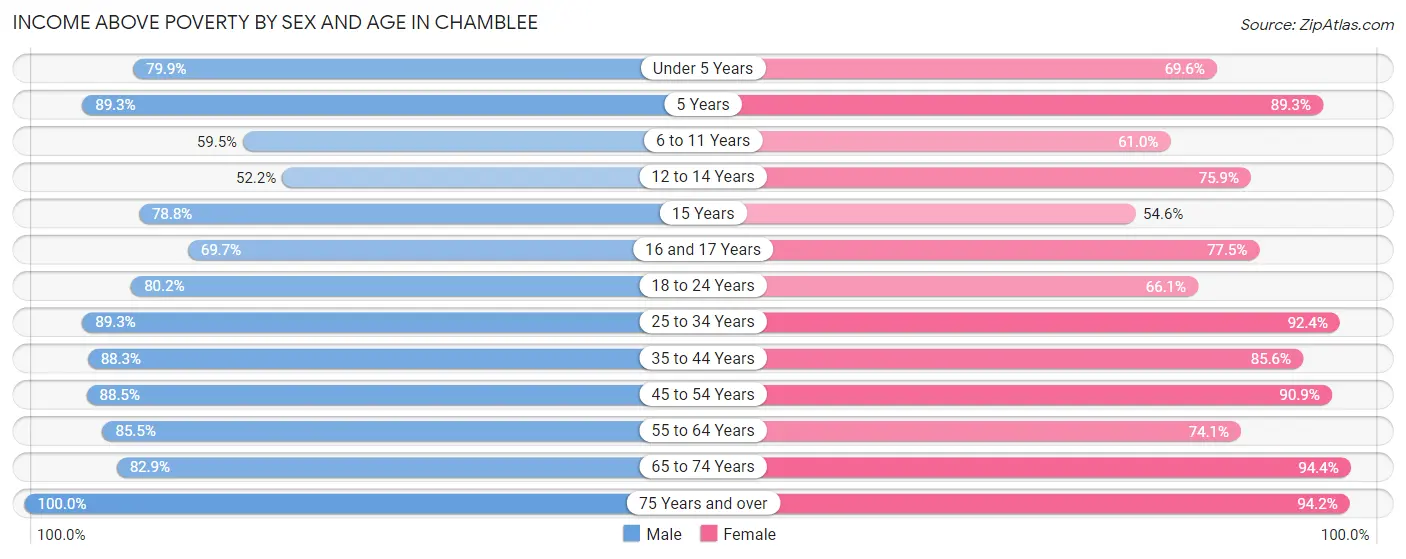
| Age Bracket | Male | Female |
| Under 5 Years | 1,131 (79.9%) | 510 (69.6%) |
| 5 Years | 75 (89.3%) | 183 (89.3%) |
| 6 to 11 Years | 684 (59.5%) | 490 (61.0%) |
| 12 to 14 Years | 402 (52.2%) | 230 (75.9%) |
| 15 Years | 115 (78.8%) | 53 (54.6%) |
| 16 and 17 Years | 191 (69.7%) | 533 (77.5%) |
| 18 to 24 Years | 1,029 (80.2%) | 978 (66.1%) |
| 25 to 34 Years | 3,117 (89.3%) | 2,683 (92.4%) |
| 35 to 44 Years | 2,373 (88.3%) | 2,230 (85.6%) |
| 45 to 54 Years | 1,859 (88.5%) | 1,600 (90.9%) |
| 55 to 64 Years | 1,063 (85.5%) | 734 (74.1%) |
| 65 to 74 Years | 548 (82.9%) | 865 (94.4%) |
| 75 Years and over | 458 (100.0%) | 474 (94.2%) |
| Total | 13,045 (82.7%) | 11,563 (82.7%) |
Income Below Poverty Among Married-Couple Families in Chamblee
The poverty statistics for married-couple families in Chamblee show that 9.1% or 366 of the total 4,031 families live below the poverty line. Families with 3 or 4 children have the highest poverty rate of 43.0%, comprising of 151 families. On the other hand, families with no children have the lowest poverty rate of 1.8%, which includes 44 families.
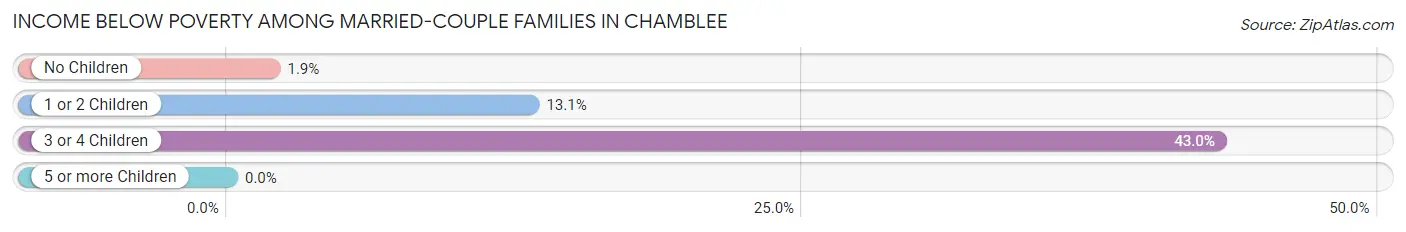
| Children | Above Poverty | Below Poverty |
| No Children | 2,333 (98.2%) | 44 (1.8%) |
| 1 or 2 Children | 1,132 (86.9%) | 171 (13.1%) |
| 3 or 4 Children | 200 (57.0%) | 151 (43.0%) |
| 5 or more Children | 0 (0.0%) | 0 (0.0%) |
| Total | 3,665 (90.9%) | 366 (9.1%) |
Income Below Poverty Among Single-Parent Households in Chamblee
According to the poverty data in Chamblee, 16.4% or 114 single-father households and 18.5% or 205 single-mother households are living below the poverty line. Among single-father households, those with 3 or 4 children have the highest poverty rate, with 58 households (79.4%) experiencing poverty. Likewise, among single-mother households, those with 5 or more children have the highest poverty rate, with 20 households (100.0%) falling below the poverty line.
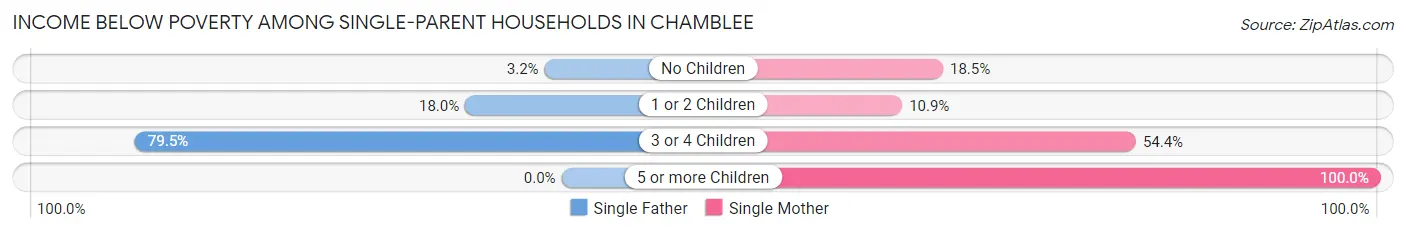
| Children | Single Father | Single Mother |
| No Children | 12 (3.2%) | 67 (18.5%) |
| 1 or 2 Children | 44 (18.0%) | 69 (10.9%) |
| 3 or 4 Children | 58 (79.4%) | 49 (54.4%) |
| 5 or more Children | 0 (0.0%) | 20 (100.0%) |
| Total | 114 (16.4%) | 205 (18.5%) |
Income Below Poverty Among Married-Couple vs Single-Parent Households in Chamblee
The poverty data for Chamblee shows that 366 of the married-couple family households (9.1%) and 319 of the single-parent households (17.7%) are living below the poverty level. Within the married-couple family households, those with 3 or 4 children have the highest poverty rate, with 151 households (43.0%) falling below the poverty line. Among the single-parent households, those with 5 or more children have the highest poverty rate, with 20 household (100.0%) living below poverty.
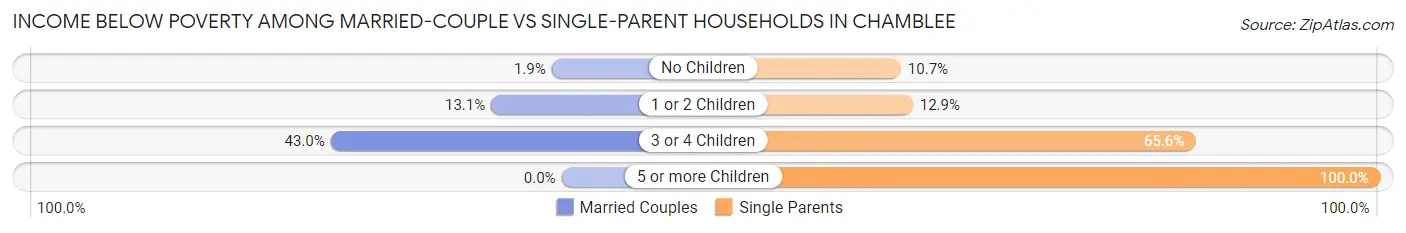
| Children | Married-Couple Families | Single-Parent Households |
| No Children | 44 (1.8%) | 79 (10.7%) |
| 1 or 2 Children | 171 (13.1%) | 113 (12.9%) |
| 3 or 4 Children | 151 (43.0%) | 107 (65.6%) |
| 5 or more Children | 0 (0.0%) | 20 (100.0%) |
| Total | 366 (9.1%) | 319 (17.7%) |
Race in Chamblee
The most populous races in Chamblee are White / Caucasian (13,887 | 46.3%), Hispanic or Latino (10,373 | 34.6%), and Black / African American (5,487 | 18.3%).
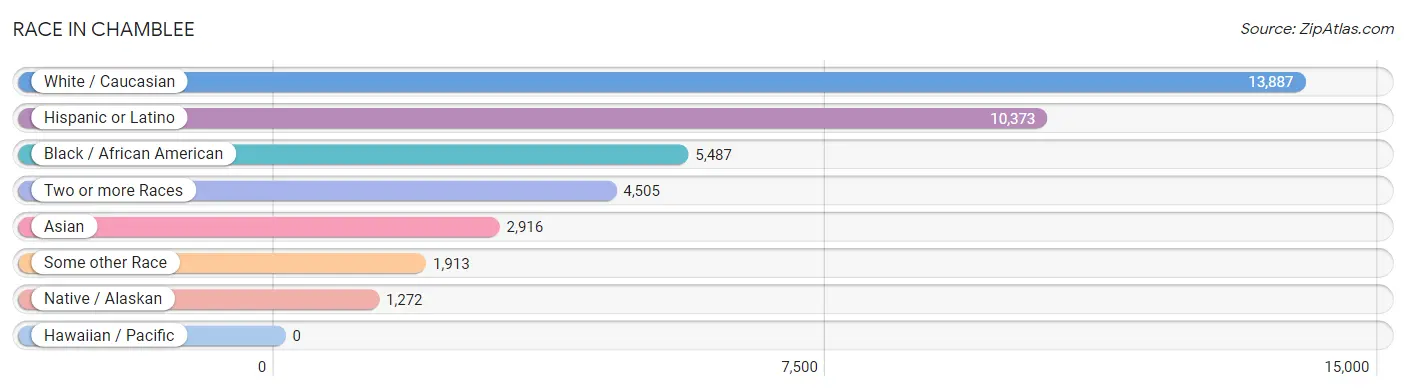
| Race | # Population | % Population |
| Asian | 2,916 | 9.7% |
| Black / African American | 5,487 | 18.3% |
| Hawaiian / Pacific | 0 | 0.0% |
| Hispanic or Latino | 10,373 | 34.6% |
| Native / Alaskan | 1,272 | 4.2% |
| White / Caucasian | 13,887 | 46.3% |
| Two or more Races | 4,505 | 15.0% |
| Some other Race | 1,913 | 6.4% |
| Total | 29,980 | 100.0% |
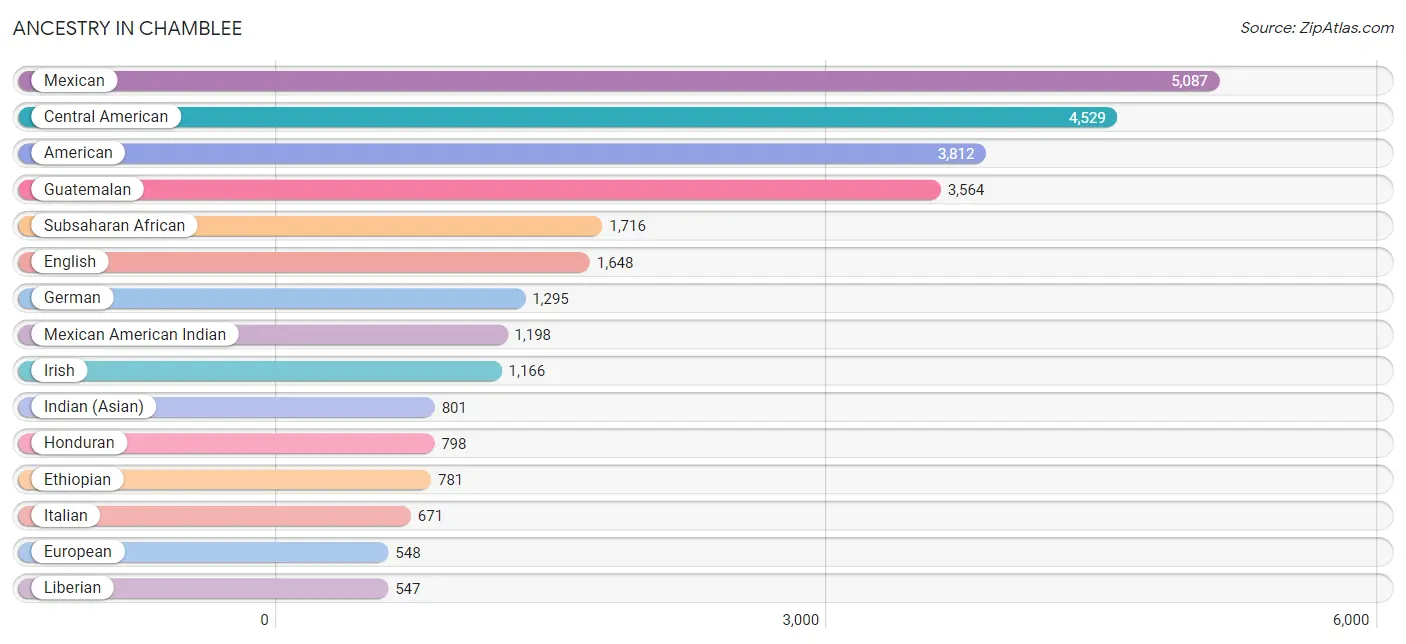
Ancestry in Chamblee
The most populous ancestries reported in Chamblee are Mexican (5,087 | 17.0%), Central American (4,529 | 15.1%), American (3,812 | 12.7%), Guatemalan (3,564 | 11.9%), and Subsaharan African (1,716 | 5.7%), together accounting for 62.4% of all Chamblee residents.
| Ancestry | # Population | % Population |
| African | 143 | 0.5% |
| American | 3,812 | 12.7% |
| Arab | 139 | 0.5% |
| Argentinean | 10 | 0.0% |
| Belizean | 48 | 0.2% |
| Bermudan | 15 | 0.1% |
| Bhutanese | 11 | 0.0% |
| Brazilian | 75 | 0.3% |
| British | 139 | 0.5% |
| Burmese | 495 | 1.7% |
| Cajun | 69 | 0.2% |
| Canadian | 12 | 0.0% |
| Central American | 4,529 | 15.1% |
| Central American Indian | 213 | 0.7% |
| Cherokee | 81 | 0.3% |
| Chippewa | 30 | 0.1% |
| Colombian | 50 | 0.2% |
| Croatian | 63 | 0.2% |
| Cuban | 91 | 0.3% |
| Czech | 81 | 0.3% |
| Danish | 16 | 0.1% |
| Dominican | 68 | 0.2% |
| Dutch | 85 | 0.3% |
| Eastern European | 19 | 0.1% |
| Ecuadorian | 140 | 0.5% |
| Egyptian | 14 | 0.1% |
| English | 1,648 | 5.5% |
| Estonian | 13 | 0.0% |
| Ethiopian | 781 | 2.6% |
| European | 548 | 1.8% |
| French | 440 | 1.5% |
| French Canadian | 39 | 0.1% |
| German | 1,295 | 4.3% |
| Greek | 110 | 0.4% |
| Guatemalan | 3,564 | 11.9% |
| Haitian | 23 | 0.1% |
| Honduran | 798 | 2.7% |
| Hungarian | 50 | 0.2% |
| Indian (Asian) | 801 | 2.7% |
| Iranian | 44 | 0.2% |
| Irish | 1,166 | 3.9% |
| Israeli | 77 | 0.3% |
| Italian | 671 | 2.2% |
| Japanese | 3 | 0.0% |
| Korean | 150 | 0.5% |
| Laotian | 198 | 0.7% |
| Latvian | 15 | 0.1% |
| Lebanese | 26 | 0.1% |
| Liberian | 547 | 1.8% |
| Lithuanian | 31 | 0.1% |
| Mexican | 5,087 | 17.0% |
| Mexican American Indian | 1,198 | 4.0% |
| Mongolian | 28 | 0.1% |
| Moroccan | 28 | 0.1% |
| Navajo | 5 | 0.0% |
| Nicaraguan | 20 | 0.1% |
| Nigerian | 205 | 0.7% |
| Northern European | 21 | 0.1% |
| Norwegian | 101 | 0.3% |
| Okinawan | 13 | 0.0% |
| Pakistani | 29 | 0.1% |
| Panamanian | 20 | 0.1% |
| Peruvian | 61 | 0.2% |
| Polish | 212 | 0.7% |
| Portuguese | 51 | 0.2% |
| Potawatomi | 1 | 0.0% |
| Puerto Rican | 238 | 0.8% |
| Romanian | 29 | 0.1% |
| Russian | 173 | 0.6% |
| Salvadoran | 127 | 0.4% |
| Scandinavian | 167 | 0.6% |
| Scotch-Irish | 184 | 0.6% |
| Scottish | 457 | 1.5% |
| Senegalese | 30 | 0.1% |
| Slavic | 31 | 0.1% |
| South American | 292 | 1.0% |
| South American Indian | 47 | 0.2% |
| Spaniard | 10 | 0.0% |
| Sri Lankan | 511 | 1.7% |
| Subsaharan African | 1,716 | 5.7% |
| Swedish | 163 | 0.5% |
| Swiss | 35 | 0.1% |
| Syrian | 9 | 0.0% |
| Thai | 541 | 1.8% |
| Turkish | 60 | 0.2% |
| Ugandan | 10 | 0.0% |
| Ukrainian | 56 | 0.2% |
| Venezuelan | 31 | 0.1% |
| Vietnamese | 482 | 1.6% |
| Welsh | 236 | 0.8% |
| Yugoslavian | 10 | 0.0% | View All 91 Rows |
Immigrants in Chamblee
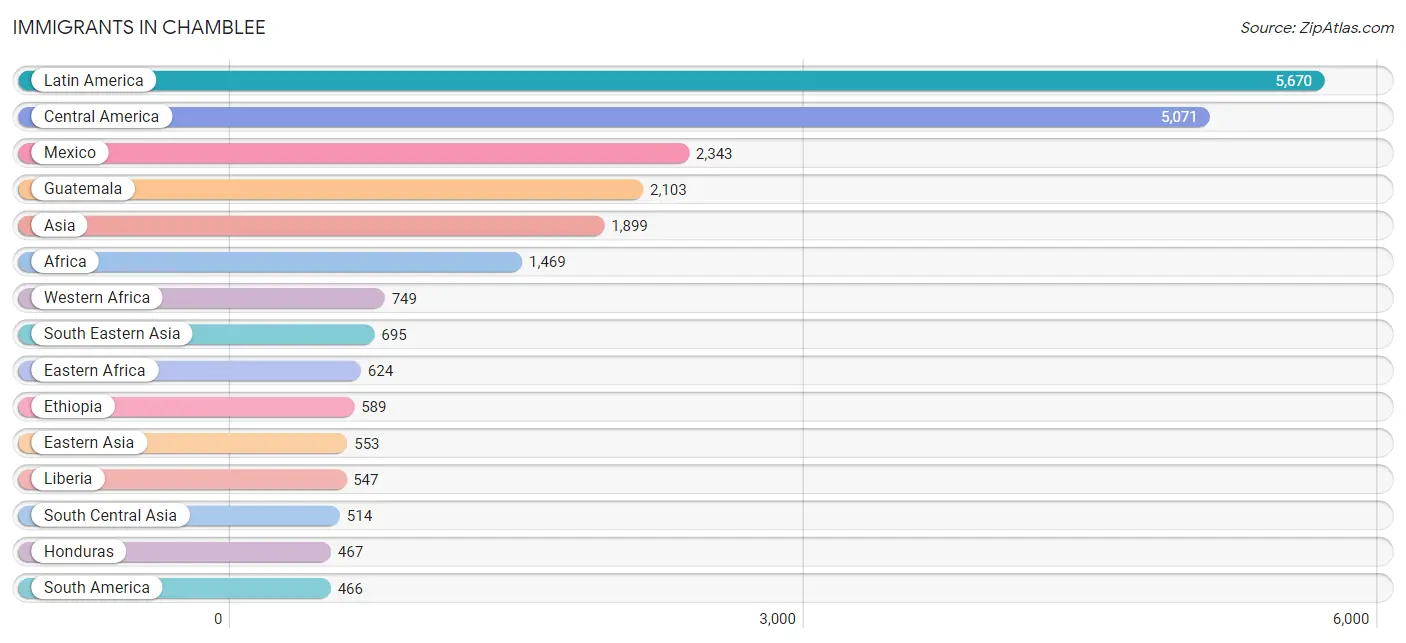
The most numerous immigrant groups reported in Chamblee came from Latin America (5,670 | 18.9%), Central America (5,071 | 16.9%), Mexico (2,343 | 7.8%), Guatemala (2,103 | 7.0%), and Asia (1,899 | 6.3%), together accounting for 57.0% of all Chamblee residents.
| Immigration Origin | # Population | % Population |
| Africa | 1,469 | 4.9% |
| Argentina | 26 | 0.1% |
| Asia | 1,899 | 6.3% |
| Bangladesh | 308 | 1.0% |
| Belize | 11 | 0.0% |
| Brazil | 75 | 0.3% |
| Cambodia | 3 | 0.0% |
| Canada | 38 | 0.1% |
| Caribbean | 133 | 0.4% |
| Central America | 5,071 | 16.9% |
| Chile | 5 | 0.0% |
| China | 349 | 1.2% |
| Colombia | 37 | 0.1% |
| Cuba | 84 | 0.3% |
| Denmark | 11 | 0.0% |
| Dominican Republic | 35 | 0.1% |
| Eastern Africa | 624 | 2.1% |
| Eastern Asia | 553 | 1.8% |
| Eastern Europe | 105 | 0.4% |
| Ecuador | 97 | 0.3% |
| Egypt | 6 | 0.0% |
| El Salvador | 122 | 0.4% |
| England | 19 | 0.1% |
| Eritrea | 25 | 0.1% |
| Ethiopia | 589 | 2.0% |
| Europe | 320 | 1.1% |
| France | 51 | 0.2% |
| Germany | 47 | 0.2% |
| Greece | 10 | 0.0% |
| Guatemala | 2,103 | 7.0% |
| Guyana | 134 | 0.4% |
| Honduras | 467 | 1.6% |
| Hong Kong | 47 | 0.2% |
| Hungary | 12 | 0.0% |
| India | 176 | 0.6% |
| Indonesia | 127 | 0.4% |
| Israel | 53 | 0.2% |
| Jamaica | 14 | 0.1% |
| Japan | 49 | 0.2% |
| Kenya | 10 | 0.0% |
| Korea | 155 | 0.5% |
| Laos | 15 | 0.1% |
| Latin America | 5,670 | 18.9% |
| Liberia | 547 | 1.8% |
| Malaysia | 28 | 0.1% |
| Mexico | 2,343 | 7.8% |
| Middle Africa | 42 | 0.1% |
| Morocco | 30 | 0.1% |
| Nicaragua | 20 | 0.1% |
| Nigeria | 172 | 0.6% |
| Northern Africa | 36 | 0.1% |
| Northern Europe | 34 | 0.1% |
| Pakistan | 23 | 0.1% |
| Panama | 5 | 0.0% |
| Peru | 49 | 0.2% |
| Philippines | 46 | 0.2% |
| Poland | 10 | 0.0% |
| Romania | 18 | 0.1% |
| Russia | 34 | 0.1% |
| Saudi Arabia | 8 | 0.0% |
| Senegal | 30 | 0.1% |
| South Africa | 18 | 0.1% |
| South America | 466 | 1.5% |
| South Central Asia | 514 | 1.7% |
| South Eastern Asia | 695 | 2.3% |
| Southern Europe | 31 | 0.1% |
| Spain | 21 | 0.1% |
| Thailand | 29 | 0.1% |
| Turkey | 60 | 0.2% |
| Uzbekistan | 7 | 0.0% |
| Venezuela | 43 | 0.1% |
| Vietnam | 447 | 1.5% |
| Western Africa | 749 | 2.5% |
| Western Asia | 137 | 0.5% |
| Western Europe | 98 | 0.3% |
| Zaire | 42 | 0.1% | View All 76 Rows |
Sex and Age in Chamblee
Sex and Age in Chamblee
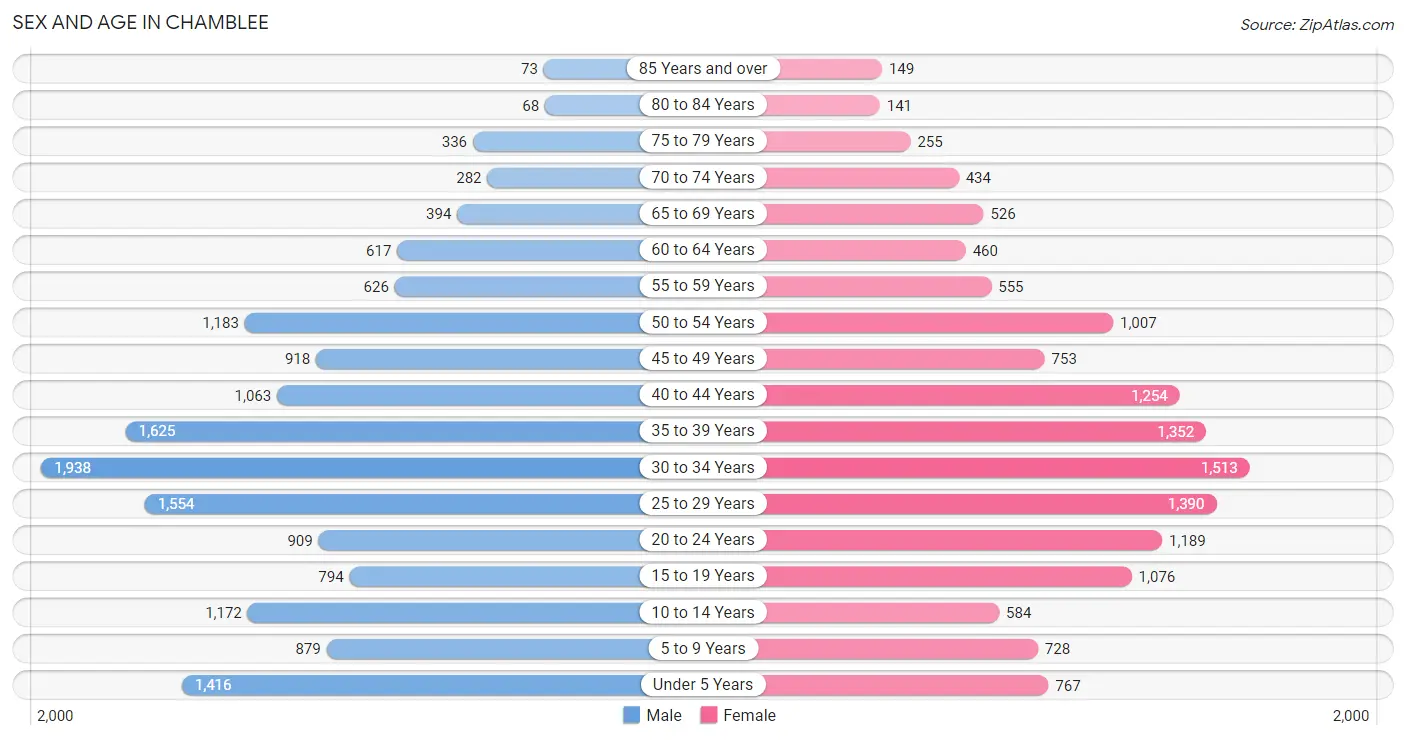
The most populous age groups in Chamblee are 30 to 34 Years (1,938 | 12.2%) for men and 30 to 34 Years (1,513 | 10.7%) for women.
| Age Bracket | Male | Female |
| Under 5 Years | 1,416 (8.9%) | 767 (5.4%) |
| 5 to 9 Years | 879 (5.6%) | 728 (5.1%) |
| 10 to 14 Years | 1,172 (7.4%) | 584 (4.1%) |
| 15 to 19 Years | 794 (5.0%) | 1,076 (7.6%) |
| 20 to 24 Years | 909 (5.7%) | 1,189 (8.4%) |
| 25 to 29 Years | 1,554 (9.8%) | 1,390 (9.8%) |
| 30 to 34 Years | 1,938 (12.2%) | 1,513 (10.7%) |
| 35 to 39 Years | 1,625 (10.2%) | 1,352 (9.6%) |
| 40 to 44 Years | 1,063 (6.7%) | 1,254 (8.9%) |
| 45 to 49 Years | 918 (5.8%) | 753 (5.3%) |
| 50 to 54 Years | 1,183 (7.5%) | 1,007 (7.1%) |
| 55 to 59 Years | 626 (4.0%) | 555 (3.9%) |
| 60 to 64 Years | 617 (3.9%) | 460 (3.3%) |
| 65 to 69 Years | 394 (2.5%) | 526 (3.7%) |
| 70 to 74 Years | 282 (1.8%) | 434 (3.1%) |
| 75 to 79 Years | 336 (2.1%) | 255 (1.8%) |
| 80 to 84 Years | 68 (0.4%) | 141 (1.0%) |
| 85 Years and over | 73 (0.5%) | 149 (1.1%) |
| Total | 15,847 (100.0%) | 14,133 (100.0%) |
Families and Households in Chamblee
Median Family Size in Chamblee
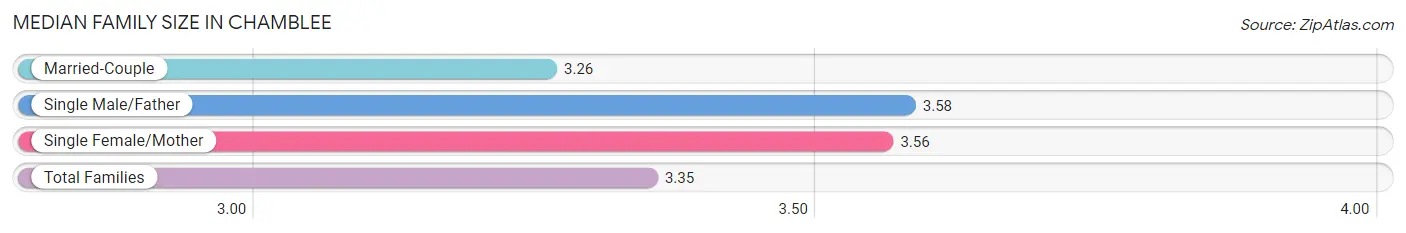
The median family size in Chamblee is 3.35 persons per family, with single male/father families (697 | 11.9%) accounting for the largest median family size of 3.58 persons per family. On the other hand, married-couple families (4,031 | 69.1%) represent the smallest median family size with 3.26 persons per family.
| Family Type | # Families | Family Size |
| Married-Couple | 4,031 (69.1%) | 3.26 |
| Single Male/Father | 697 (11.9%) | 3.58 |
| Single Female/Mother | 1,105 (18.9%) | 3.56 |
| Total Families | 5,833 (100.0%) | 3.35 |
Median Household Size in Chamblee
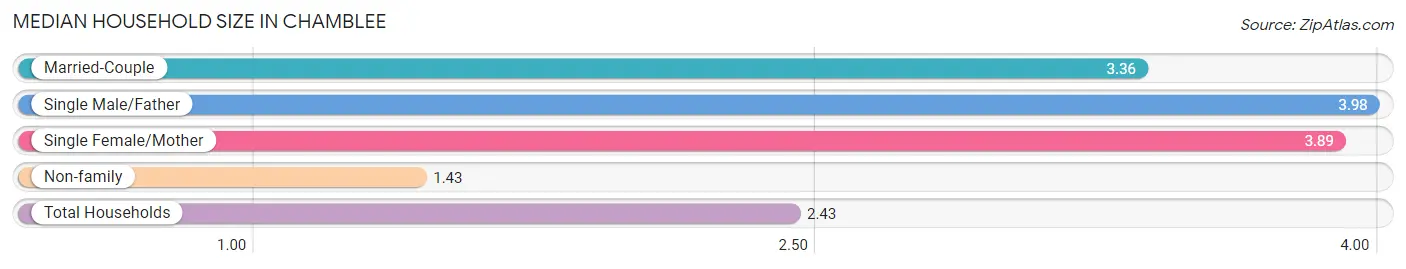
The median household size in Chamblee is 2.43 persons per household, with single male/father households (697 | 5.7%) accounting for the largest median household size of 3.98 persons per household. non-family households (6,426 | 52.4%) represent the smallest median household size with 1.43 persons per household.
| Household Type | # Households | Household Size |
| Married-Couple | 4,031 (32.9%) | 3.36 |
| Single Male/Father | 697 (5.7%) | 3.98 |
| Single Female/Mother | 1,105 (9.0%) | 3.89 |
| Non-family | 6,426 (52.4%) | 1.43 |
| Total Households | 12,259 (100.0%) | 2.43 |
Household Size by Marriage Status in Chamblee
Out of a total of 12,259 households in Chamblee, 5,833 (47.6%) are family households, while 6,426 (52.4%) are nonfamily households. The most numerous type of family households are 2-person households, comprising 2,911, and the most common type of nonfamily households are 1-person households, comprising 4,988.
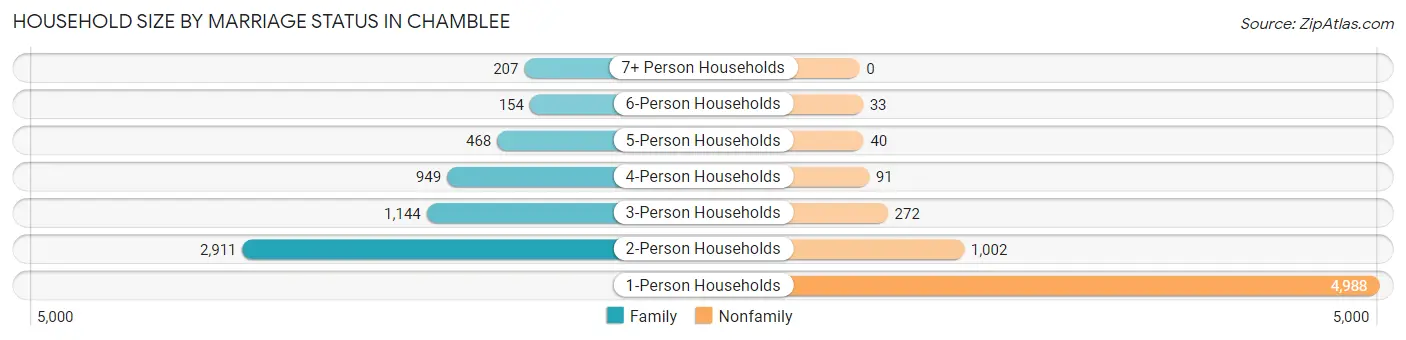
| Household Size | Family Households | Nonfamily Households |
| 1-Person Households | - | 4,988 (40.7%) |
| 2-Person Households | 2,911 (23.7%) | 1,002 (8.2%) |
| 3-Person Households | 1,144 (9.3%) | 272 (2.2%) |
| 4-Person Households | 949 (7.7%) | 91 (0.7%) |
| 5-Person Households | 468 (3.8%) | 40 (0.3%) |
| 6-Person Households | 154 (1.3%) | 33 (0.3%) |
| 7+ Person Households | 207 (1.7%) | 0 (0.0%) |
| Total | 5,833 (47.6%) | 6,426 (52.4%) |
Female Fertility in Chamblee
Fertility by Age in Chamblee
Average fertility rate in Chamblee is 34.0 births per 1,000 women. Women in the age bracket of 20 to 34 years have the highest fertility rate with 47.0 births per 1,000 women. Women in the age bracket of 20 to 34 years acount for 61.7% of all women with births.
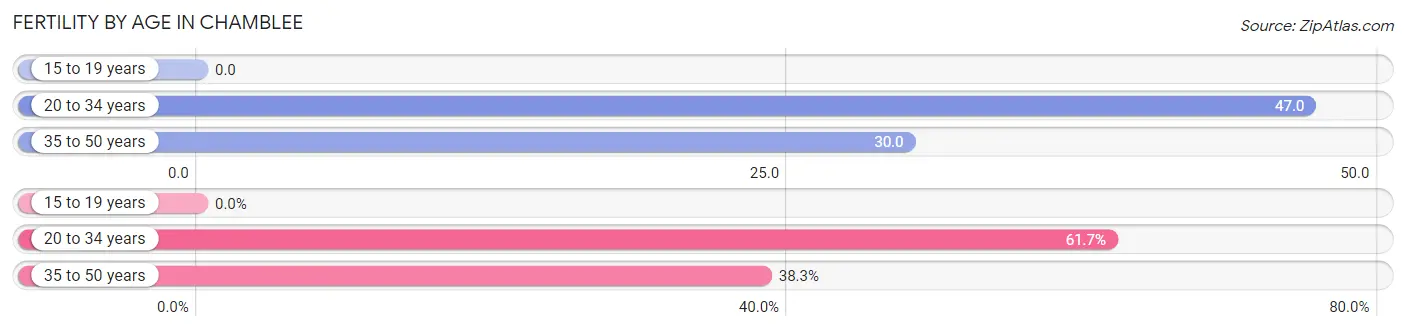
| Age Bracket | Women with Births | Births / 1,000 Women |
| 15 to 19 years | 0 (0.0%) | 0.0 |
| 20 to 34 years | 192 (61.7%) | 47.0 |
| 35 to 50 years | 119 (38.3%) | 30.0 |
| Total | 311 (100.0%) | 34.0 |
Fertility by Age by Marriage Status in Chamblee
93.6% of women with births (311) in Chamblee are married. The highest percentage of unmarried women with births falls into 35 to 50 years age bracket with 9.2% of them unmarried at the time of birth, while the lowest percentage of unmarried women with births belong to 20 to 34 years age bracket with 4.7% of them unmarried.
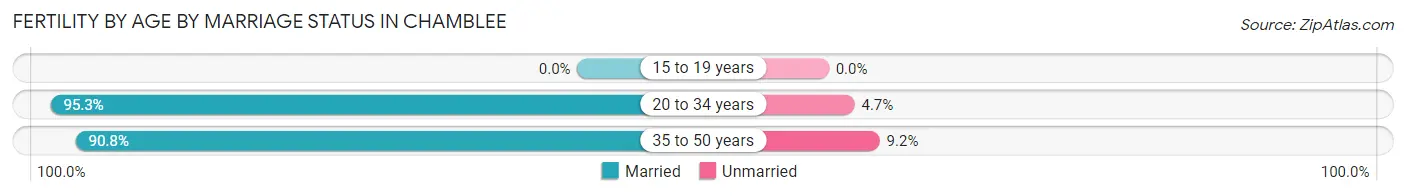
| Age Bracket | Married | Unmarried |
| 15 to 19 years | 0 (0.0%) | 0 (0.0%) |
| 20 to 34 years | 183 (95.3%) | 9 (4.7%) |
| 35 to 50 years | 108 (90.8%) | 11 (9.2%) |
| Total | 291 (93.6%) | 20 (6.4%) |
Fertility by Education in Chamblee
Average fertility rate in Chamblee is 34.0 births per 1,000 women. Women with the education attainment of high school diploma have the highest fertility rate of 69.0 births per 1,000 women, while women with the education attainment of bachelor's degree have the lowest fertility at 14.0 births per 1,000 women. Women with the education attainment of graduate degree represent 37.0% of all women with births.
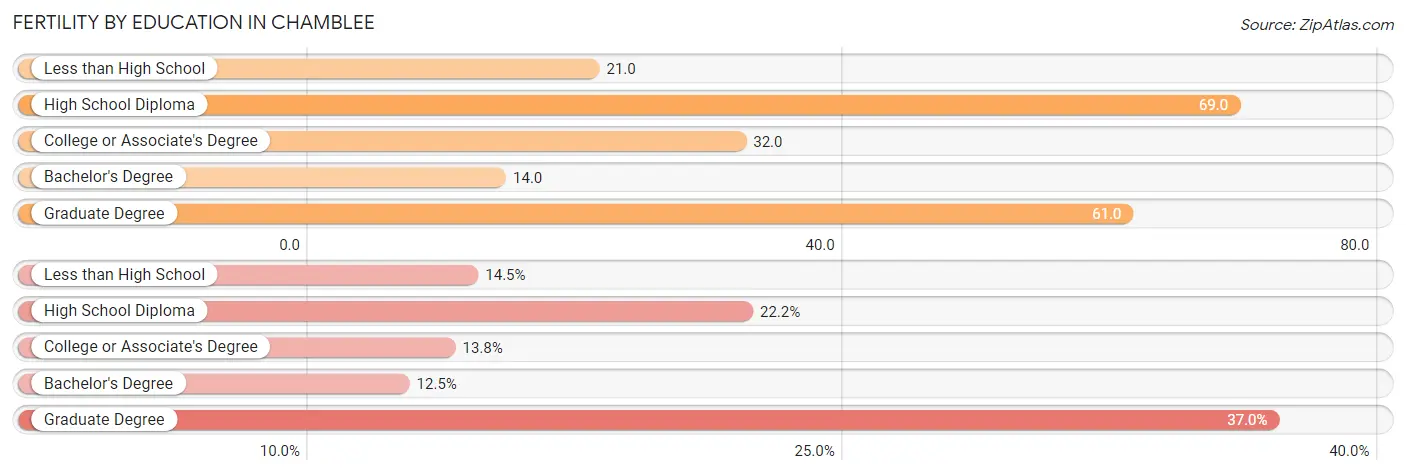
| Educational Attainment | Women with Births | Births / 1,000 Women |
| Less than High School | 45 (14.5%) | 21.0 |
| High School Diploma | 69 (22.2%) | 69.0 |
| College or Associate's Degree | 43 (13.8%) | 32.0 |
| Bachelor's Degree | 39 (12.5%) | 14.0 |
| Graduate Degree | 115 (37.0%) | 61.0 |
| Total | 311 (100.0%) | 34.0 |
Fertility by Education by Marriage Status in Chamblee
6.4% of women with births in Chamblee are unmarried. Women with the educational attainment of high school diploma are most likely to be married with 100.0% of them married at childbirth, while women with the educational attainment of less than high school are least likely to be married with 20.0% of them unmarried at childbirth.
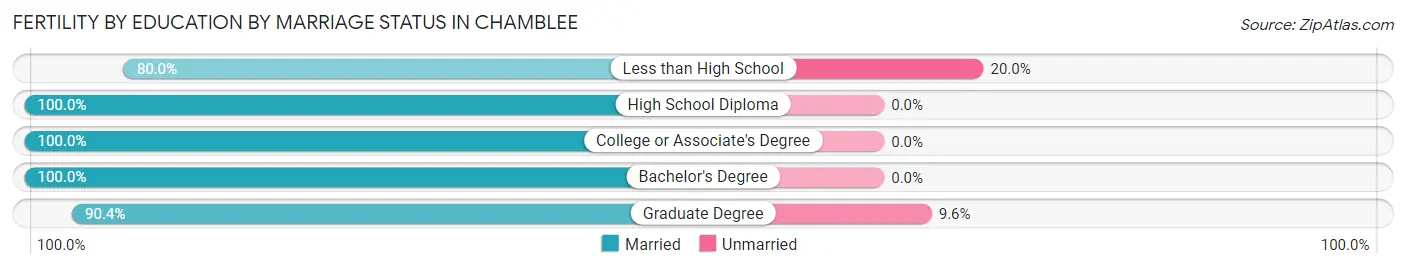
| Educational Attainment | Married | Unmarried |
| Less than High School | 36 (80.0%) | 9 (20.0%) |
| High School Diploma | 69 (100.0%) | 0 (0.0%) |
| College or Associate's Degree | 43 (100.0%) | 0 (0.0%) |
| Bachelor's Degree | 39 (100.0%) | 0 (0.0%) |
| Graduate Degree | 104 (90.4%) | 11 (9.6%) |
| Total | 291 (93.6%) | 20 (6.4%) |
Employment Characteristics in Chamblee
Employment by Class of Employer in Chamblee
Among the 17,385 employed individuals in Chamblee, private company employees (13,584 | 78.1%), not-for-profit organizations (1,053 | 6.1%), and self-employed (not incorporated) (956 | 5.5%) make up the most common classes of employment.
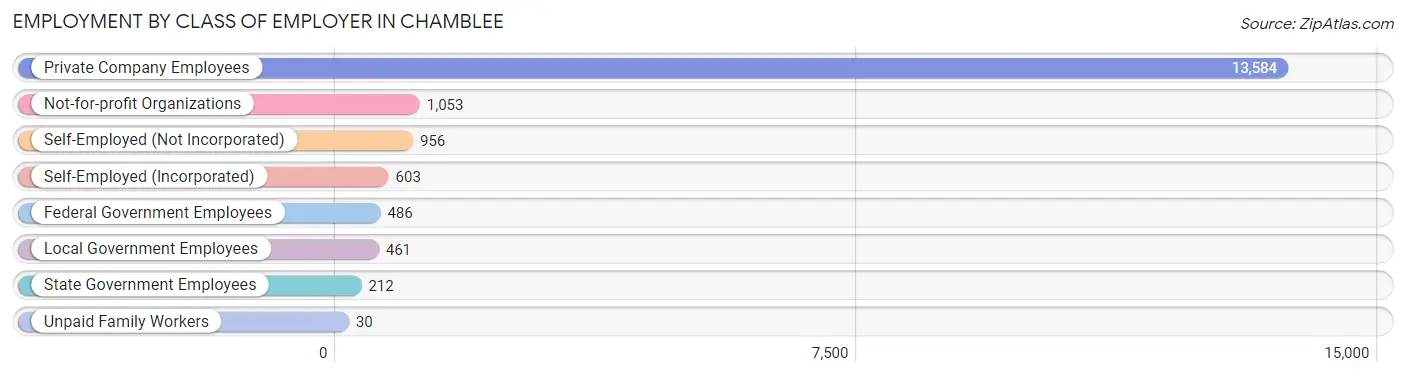
| Employer Class | # Employees | % Employees |
| Private Company Employees | 13,584 | 78.1% |
| Self-Employed (Incorporated) | 603 | 3.5% |
| Self-Employed (Not Incorporated) | 956 | 5.5% |
| Not-for-profit Organizations | 1,053 | 6.1% |
| Local Government Employees | 461 | 2.6% |
| State Government Employees | 212 | 1.2% |
| Federal Government Employees | 486 | 2.8% |
| Unpaid Family Workers | 30 | 0.2% |
| Total | 17,385 | 100.0% |
Employment Status by Age in Chamblee
According to the labor force statistics for Chamblee, out of the total population over 16 years of age (24,191), 76.1% or 18,409 individuals are in the labor force, with 1.9% or 350 of them unemployed. The age group with the highest labor force participation rate is 30 to 34 years, with 92.0% or 3,175 individuals in the labor force. Within the labor force, the 65 to 74 years age range has the highest percentage of unemployed individuals, with 4.2% or 22 of them being unemployed.
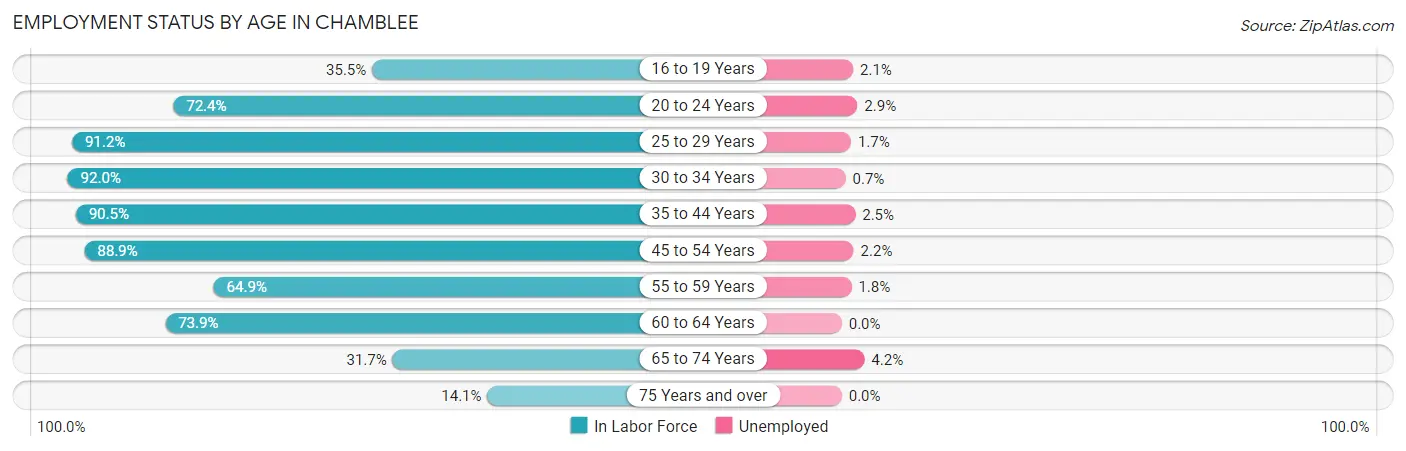
| Age Bracket | In Labor Force | Unemployed |
| 16 to 19 Years | 578 (35.5%) | 12 (2.1%) |
| 20 to 24 Years | 1,519 (72.4%) | 44 (2.9%) |
| 25 to 29 Years | 2,685 (91.2%) | 46 (1.7%) |
| 30 to 34 Years | 3,175 (92.0%) | 22 (0.7%) |
| 35 to 44 Years | 4,791 (90.5%) | 120 (2.5%) |
| 45 to 54 Years | 3,432 (88.9%) | 76 (2.2%) |
| 55 to 59 Years | 766 (64.9%) | 14 (1.8%) |
| 60 to 64 Years | 796 (73.9%) | 0 (0.0%) |
| 65 to 74 Years | 519 (31.7%) | 22 (4.2%) |
| 75 Years and over | 144 (14.1%) | 0 (0.0%) |
| Total | 18,409 (76.1%) | 350 (1.9%) |
Employment Status by Educational Attainment in Chamblee
According to labor force statistics for Chamblee, 87.9% of individuals (15,653) out of the total population between 25 and 64 years of age (17,808) are in the labor force, with 1.7% or 266 of them being unemployed. The group with the highest labor force participation rate are those with the educational attainment of bachelor's degree or higher, with 92.5% or 8,333 individuals in the labor force. Within the labor force, individuals with high school diploma education have the highest percentage of unemployment, with 7.9% or 151 of them being unemployed.
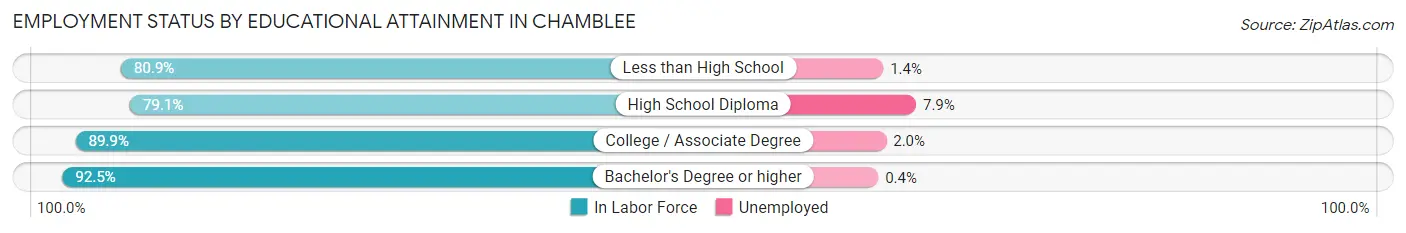
| Educational Attainment | In Labor Force | Unemployed |
| Less than High School | 3,004 (80.9%) | 52 (1.4%) |
| High School Diploma | 1,915 (79.1%) | 191 (7.9%) |
| College / Associate Degree | 2,396 (89.9%) | 53 (2.0%) |
| Bachelor's Degree or higher | 8,333 (92.5%) | 36 (0.4%) |
| Total | 15,653 (87.9%) | 303 (1.7%) |
Employment Occupations by Sex in Chamblee
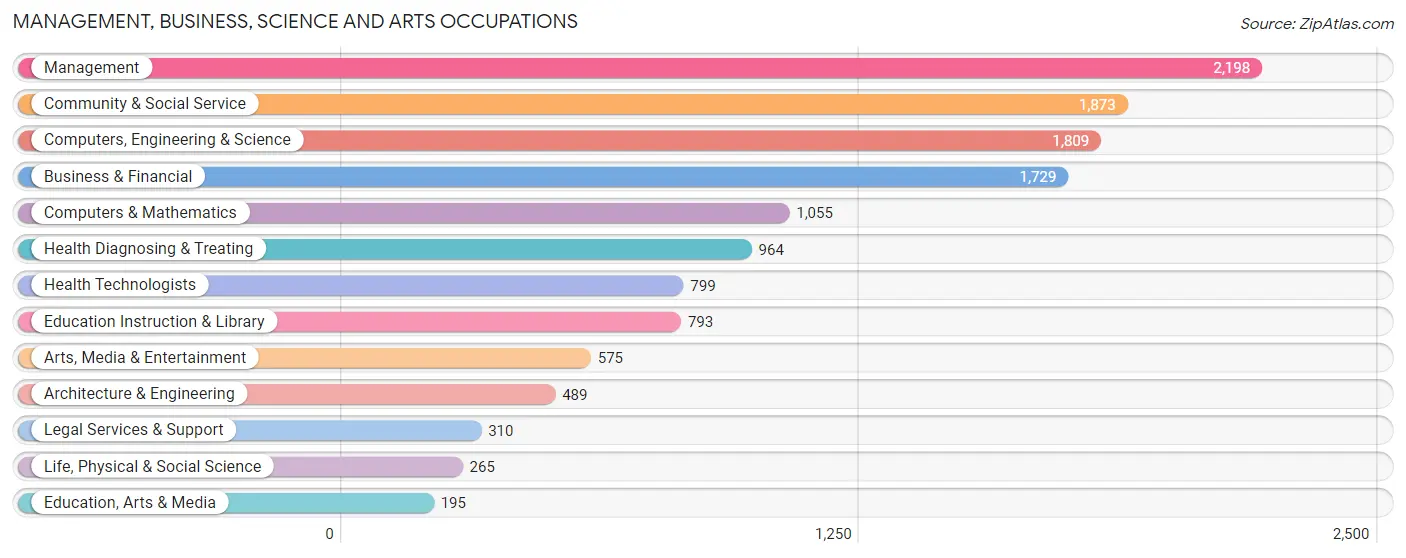
Management, Business, Science and Arts Occupations
The most common Management, Business, Science and Arts occupations in Chamblee are Management (2,198 | 12.2%), Community & Social Service (1,873 | 10.4%), Computers, Engineering & Science (1,809 | 10.0%), Business & Financial (1,729 | 9.6%), and Computers & Mathematics (1,055 | 5.9%).
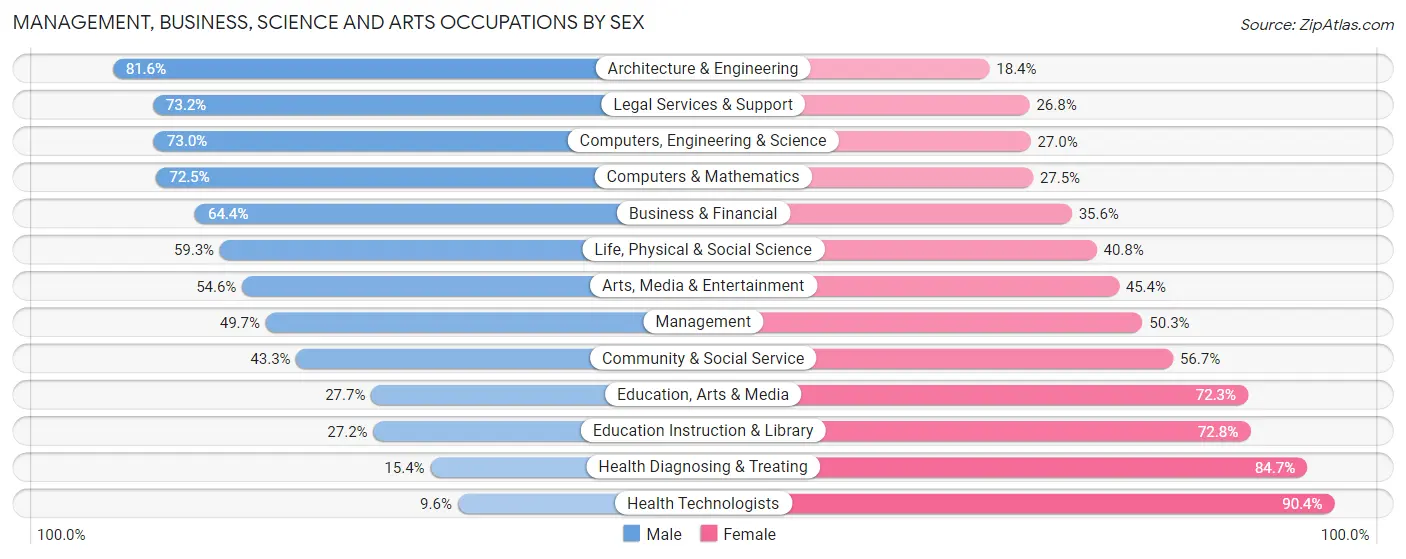
Management, Business, Science and Arts Occupations by Sex
Within the Management, Business, Science and Arts occupations in Chamblee, the most male-oriented occupations are Architecture & Engineering (81.6%), Legal Services & Support (73.2%), and Computers, Engineering & Science (73.0%), while the most female-oriented occupations are Health Technologists (90.4%), Health Diagnosing & Treating (84.7%), and Education Instruction & Library (72.8%).
| Occupation | Male | Female |
| Management | 1,092 (49.7%) | 1,106 (50.3%) |
| Business & Financial | 1,114 (64.4%) | 615 (35.6%) |
| Computers, Engineering & Science | 1,321 (73.0%) | 488 (27.0%) |
| Computers & Mathematics | 765 (72.5%) | 290 (27.5%) |
| Architecture & Engineering | 399 (81.6%) | 90 (18.4%) |
| Life, Physical & Social Science | 157 (59.3%) | 108 (40.7%) |
| Community & Social Service | 811 (43.3%) | 1,062 (56.7%) |
| Education, Arts & Media | 54 (27.7%) | 141 (72.3%) |
| Legal Services & Support | 227 (73.2%) | 83 (26.8%) |
| Education Instruction & Library | 216 (27.2%) | 577 (72.8%) |
| Arts, Media & Entertainment | 314 (54.6%) | 261 (45.4%) |
| Health Diagnosing & Treating | 148 (15.3%) | 816 (84.7%) |
| Health Technologists | 77 (9.6%) | 722 (90.4%) |
| Total (Category) | 4,486 (52.3%) | 4,087 (47.7%) |
| Total (Overall) | 10,222 (56.7%) | 7,812 (43.3%) |
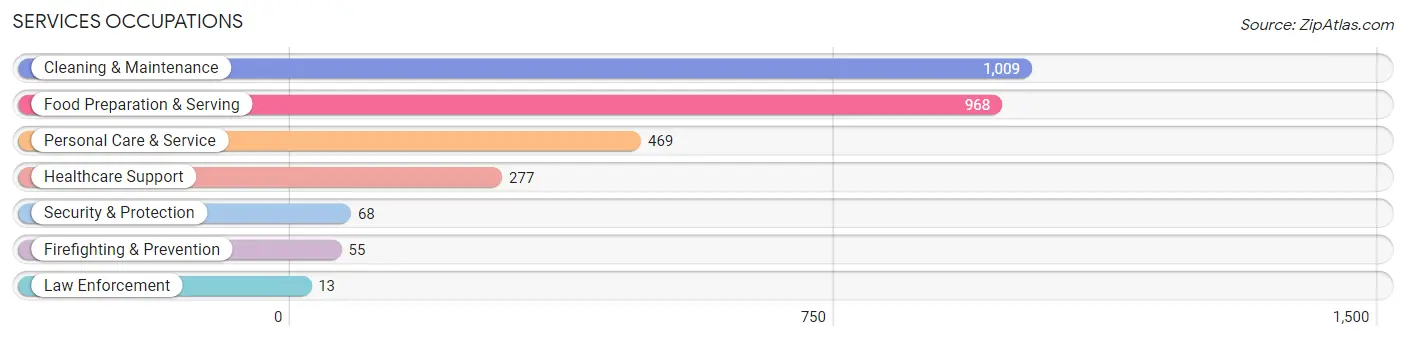
Services Occupations
The most common Services occupations in Chamblee are Cleaning & Maintenance (1,009 | 5.6%), Food Preparation & Serving (968 | 5.4%), Personal Care & Service (469 | 2.6%), Healthcare Support (277 | 1.5%), and Security & Protection (68 | 0.4%).
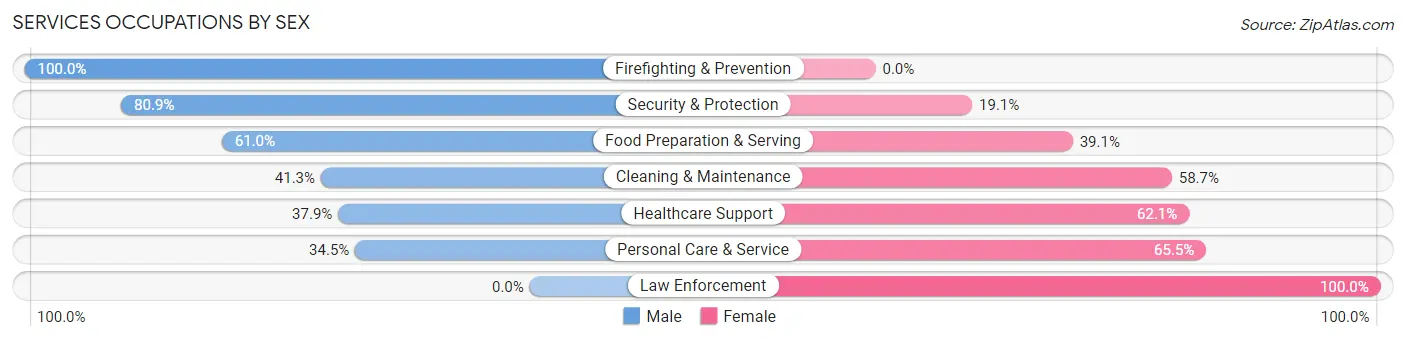
Services Occupations by Sex
Within the Services occupations in Chamblee, the most male-oriented occupations are Firefighting & Prevention (100.0%), Security & Protection (80.9%), and Food Preparation & Serving (61.0%), while the most female-oriented occupations are Law Enforcement (100.0%), Personal Care & Service (65.5%), and Healthcare Support (62.1%).
| Occupation | Male | Female |
| Healthcare Support | 105 (37.9%) | 172 (62.1%) |
| Security & Protection | 55 (80.9%) | 13 (19.1%) |
| Firefighting & Prevention | 55 (100.0%) | 0 (0.0%) |
| Law Enforcement | 0 (0.0%) | 13 (100.0%) |
| Food Preparation & Serving | 590 (61.0%) | 378 (39.1%) |
| Cleaning & Maintenance | 417 (41.3%) | 592 (58.7%) |
| Personal Care & Service | 162 (34.5%) | 307 (65.5%) |
| Total (Category) | 1,329 (47.6%) | 1,462 (52.4%) |
| Total (Overall) | 10,222 (56.7%) | 7,812 (43.3%) |
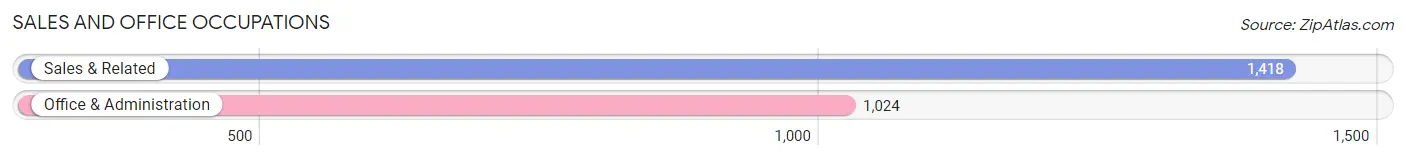
Sales and Office Occupations
The most common Sales and Office occupations in Chamblee are Sales & Related (1,418 | 7.9%), and Office & Administration (1,024 | 5.7%).
Sales and Office Occupations by Sex
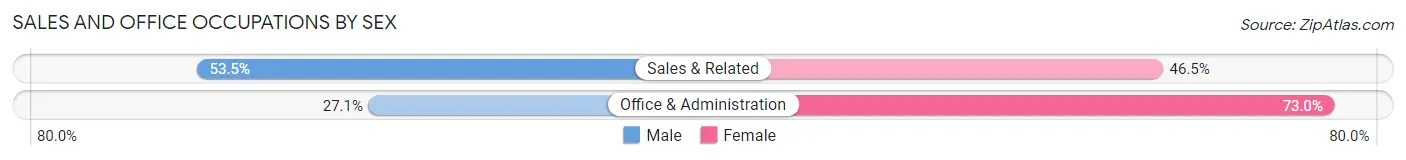
| Occupation | Male | Female |
| Sales & Related | 759 (53.5%) | 659 (46.5%) |
| Office & Administration | 277 (27.1%) | 747 (73.0%) |
| Total (Category) | 1,036 (42.4%) | 1,406 (57.6%) |
| Total (Overall) | 10,222 (56.7%) | 7,812 (43.3%) |
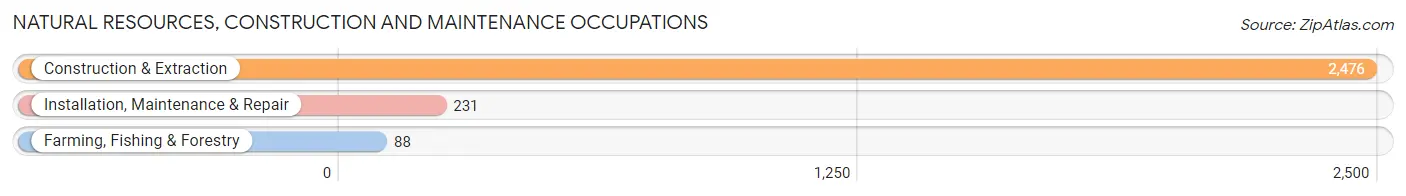
Natural Resources, Construction and Maintenance Occupations
The most common Natural Resources, Construction and Maintenance occupations in Chamblee are Construction & Extraction (2,476 | 13.7%), Installation, Maintenance & Repair (231 | 1.3%), and Farming, Fishing & Forestry (88 | 0.5%).
Natural Resources, Construction and Maintenance Occupations by Sex
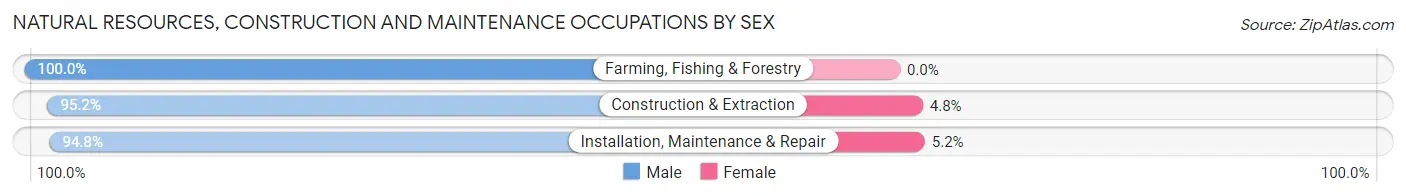
| Occupation | Male | Female |
| Farming, Fishing & Forestry | 88 (100.0%) | 0 (0.0%) |
| Construction & Extraction | 2,358 (95.2%) | 118 (4.8%) |
| Installation, Maintenance & Repair | 219 (94.8%) | 12 (5.2%) |
| Total (Category) | 2,665 (95.4%) | 130 (4.6%) |
| Total (Overall) | 10,222 (56.7%) | 7,812 (43.3%) |
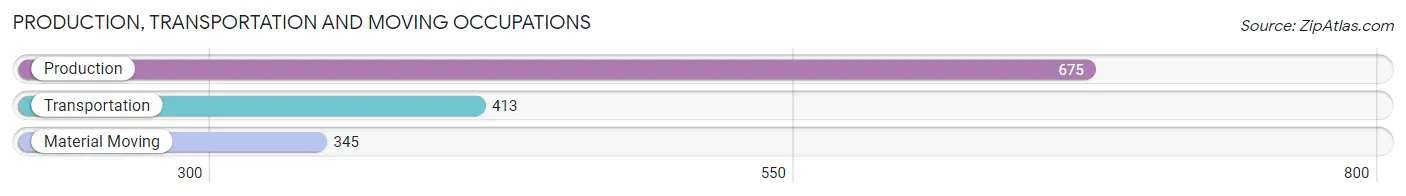
Production, Transportation and Moving Occupations
The most common Production, Transportation and Moving occupations in Chamblee are Production (675 | 3.7%), Transportation (413 | 2.3%), and Material Moving (345 | 1.9%).
Production, Transportation and Moving Occupations by Sex
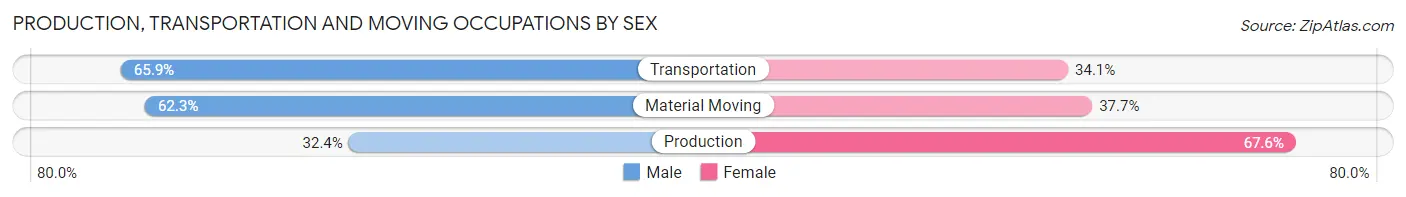
| Occupation | Male | Female |
| Production | 219 (32.4%) | 456 (67.6%) |
| Transportation | 272 (65.9%) | 141 (34.1%) |
| Material Moving | 215 (62.3%) | 130 (37.7%) |
| Total (Category) | 706 (49.3%) | 727 (50.7%) |
| Total (Overall) | 10,222 (56.7%) | 7,812 (43.3%) |
Employment Industries by Sex in Chamblee
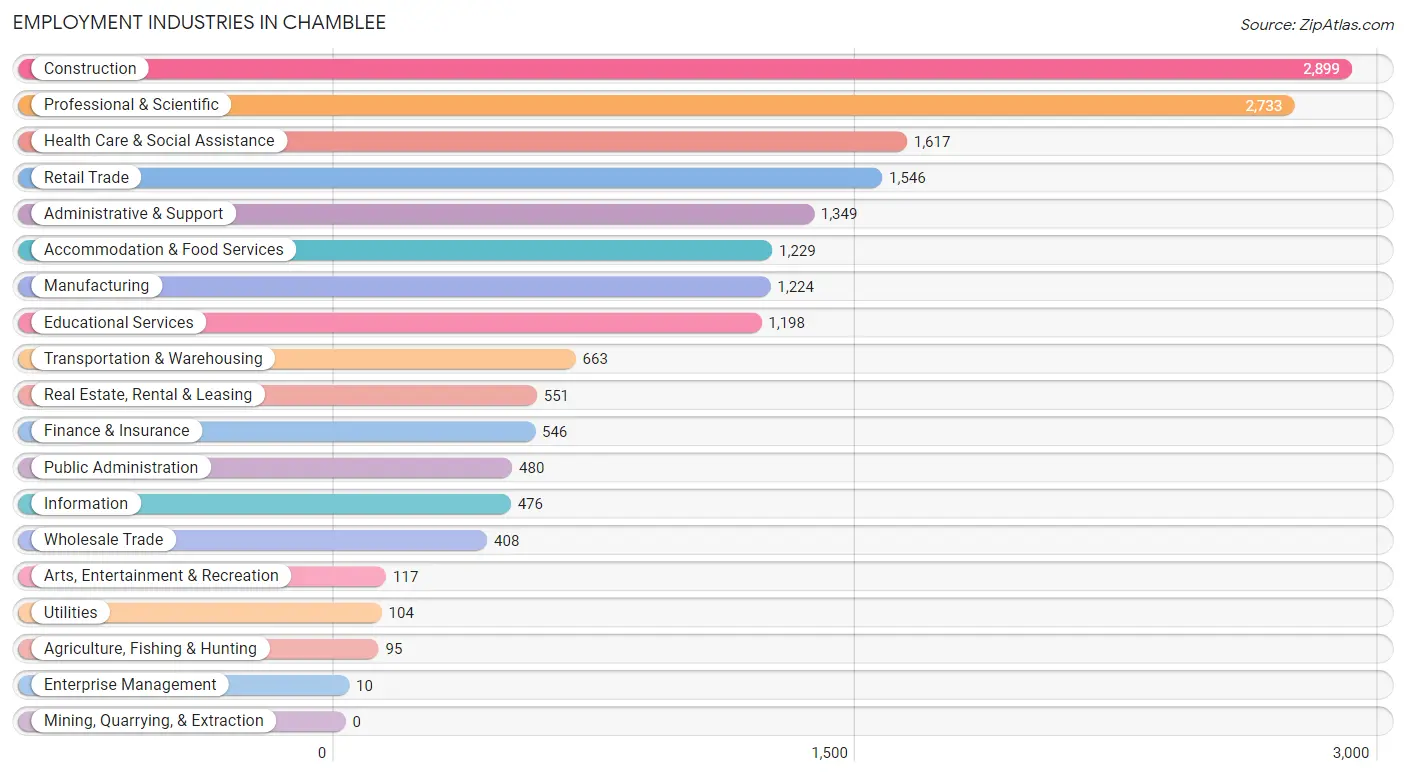
Employment Industries in Chamblee
The major employment industries in Chamblee include Construction (2,899 | 16.1%), Professional & Scientific (2,733 | 15.1%), Health Care & Social Assistance (1,617 | 9.0%), Retail Trade (1,546 | 8.6%), and Administrative & Support (1,349 | 7.5%).
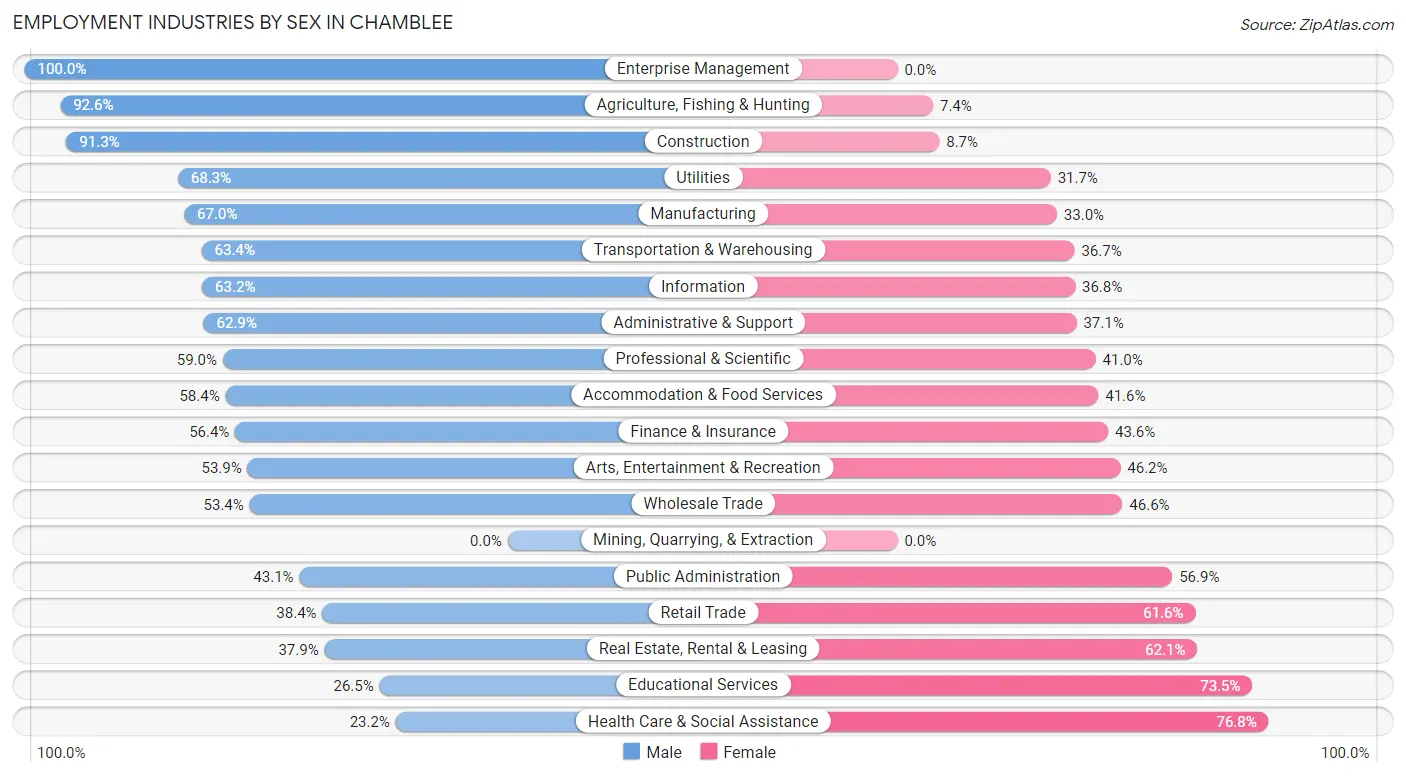
Employment Industries by Sex in Chamblee
The Chamblee industries that see more men than women are Enterprise Management (100.0%), Agriculture, Fishing & Hunting (92.6%), and Construction (91.3%), whereas the industries that tend to have a higher number of women are Health Care & Social Assistance (76.8%), Educational Services (73.5%), and Real Estate, Rental & Leasing (62.1%).
| Industry | Male | Female |
| Agriculture, Fishing & Hunting | 88 (92.6%) | 7 (7.4%) |
| Mining, Quarrying, & Extraction | 0 (0.0%) | 0 (0.0%) |
| Construction | 2,648 (91.3%) | 251 (8.7%) |
| Manufacturing | 820 (67.0%) | 404 (33.0%) |
| Wholesale Trade | 218 (53.4%) | 190 (46.6%) |
| Retail Trade | 593 (38.4%) | 953 (61.6%) |
| Transportation & Warehousing | 420 (63.3%) | 243 (36.6%) |
| Utilities | 71 (68.3%) | 33 (31.7%) |
| Information | 301 (63.2%) | 175 (36.8%) |
| Finance & Insurance | 308 (56.4%) | 238 (43.6%) |
| Real Estate, Rental & Leasing | 209 (37.9%) | 342 (62.1%) |
| Professional & Scientific | 1,612 (59.0%) | 1,121 (41.0%) |
| Enterprise Management | 10 (100.0%) | 0 (0.0%) |
| Administrative & Support | 849 (62.9%) | 500 (37.1%) |
| Educational Services | 318 (26.5%) | 880 (73.5%) |
| Health Care & Social Assistance | 375 (23.2%) | 1,242 (76.8%) |
| Arts, Entertainment & Recreation | 63 (53.8%) | 54 (46.2%) |
| Accommodation & Food Services | 718 (58.4%) | 511 (41.6%) |
| Public Administration | 207 (43.1%) | 273 (56.9%) |
| Total | 10,222 (56.7%) | 7,812 (43.3%) |
Education in Chamblee
School Enrollment in Chamblee
The most common levels of schooling among the 7,021 students in Chamblee are high school (1,492 | 21.2%), middle school (1,479 | 21.1%), and elementary school (1,410 | 20.1%).
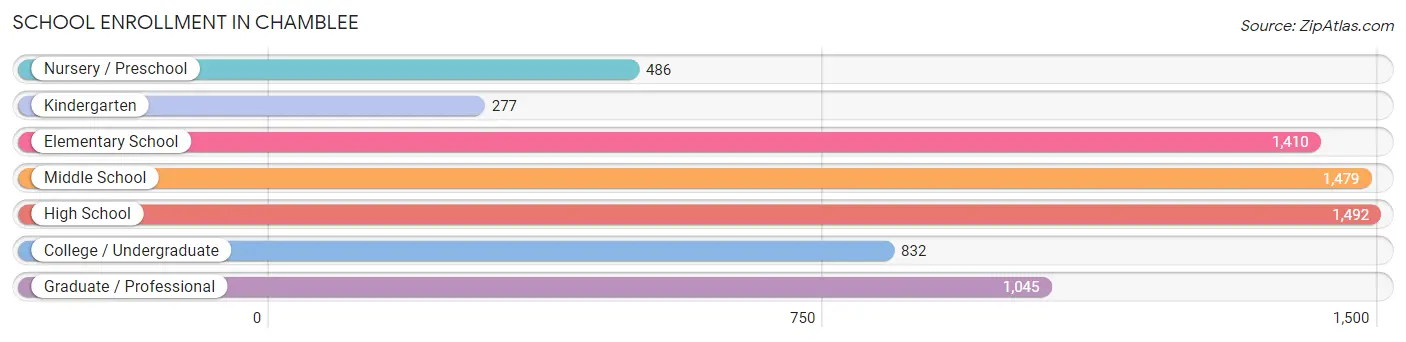
| School Level | # Students | % Students |
| Nursery / Preschool | 486 | 6.9% |
| Kindergarten | 277 | 4.0% |
| Elementary School | 1,410 | 20.1% |
| Middle School | 1,479 | 21.1% |
| High School | 1,492 | 21.2% |
| College / Undergraduate | 832 | 11.8% |
| Graduate / Professional | 1,045 | 14.9% |
| Total | 7,021 | 100.0% |
School Enrollment by Age by Funding Source in Chamblee
Out of a total of 7,021 students who are enrolled in schools in Chamblee, 1,292 (18.4%) attend a private institution, while the remaining 5,729 (81.6%) are enrolled in public schools. The age group of 20 to 24 year olds has the highest likelihood of being enrolled in private schools, with 305 (44.3% in the age bracket) enrolled. Conversely, the age group of 15 to 17 year olds has the lowest likelihood of being enrolled in a private school, with 1,011 (91.2% in the age bracket) attending a public institution.
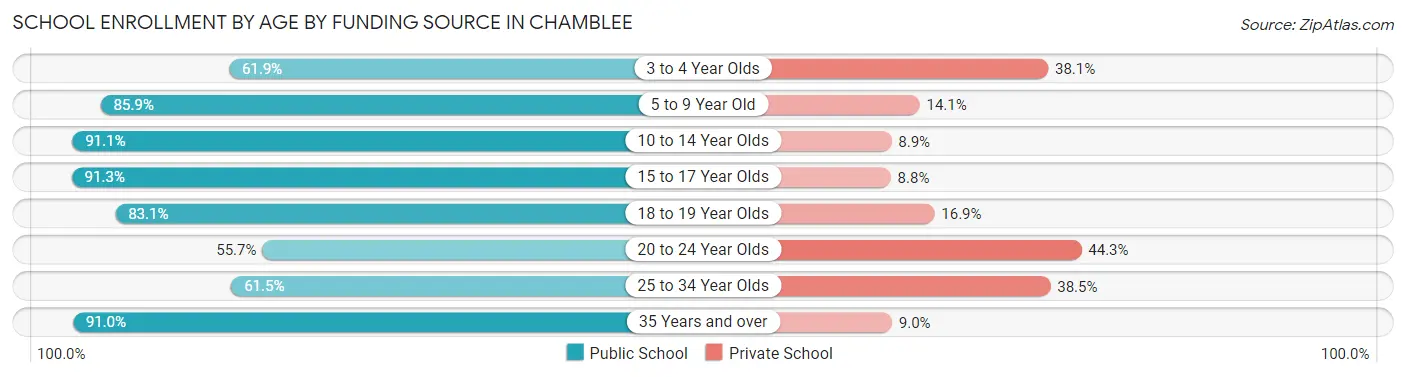
| Age Bracket | Public School | Private School |
| 3 to 4 Year Olds | 283 (61.9%) | 174 (38.1%) |
| 5 to 9 Year Old | 1,336 (85.9%) | 220 (14.1%) |
| 10 to 14 Year Olds | 1,600 (91.1%) | 156 (8.9%) |
| 15 to 17 Year Olds | 1,011 (91.2%) | 97 (8.7%) |
| 18 to 19 Year Olds | 374 (83.1%) | 76 (16.9%) |
| 20 to 24 Year Olds | 384 (55.7%) | 305 (44.3%) |
| 25 to 34 Year Olds | 358 (61.5%) | 224 (38.5%) |
| 35 Years and over | 385 (91.0%) | 38 (9.0%) |
| Total | 5,729 (81.6%) | 1,292 (18.4%) |
Educational Attainment by Field of Study in Chamblee
Business (2,891 | 26.8%), science & technology (954 | 8.8%), engineering (832 | 7.7%), social sciences (792 | 7.3%), and computers & mathematics (728 | 6.7%) are the most common fields of study among 10,807 individuals in Chamblee who have obtained a bachelor's degree or higher.
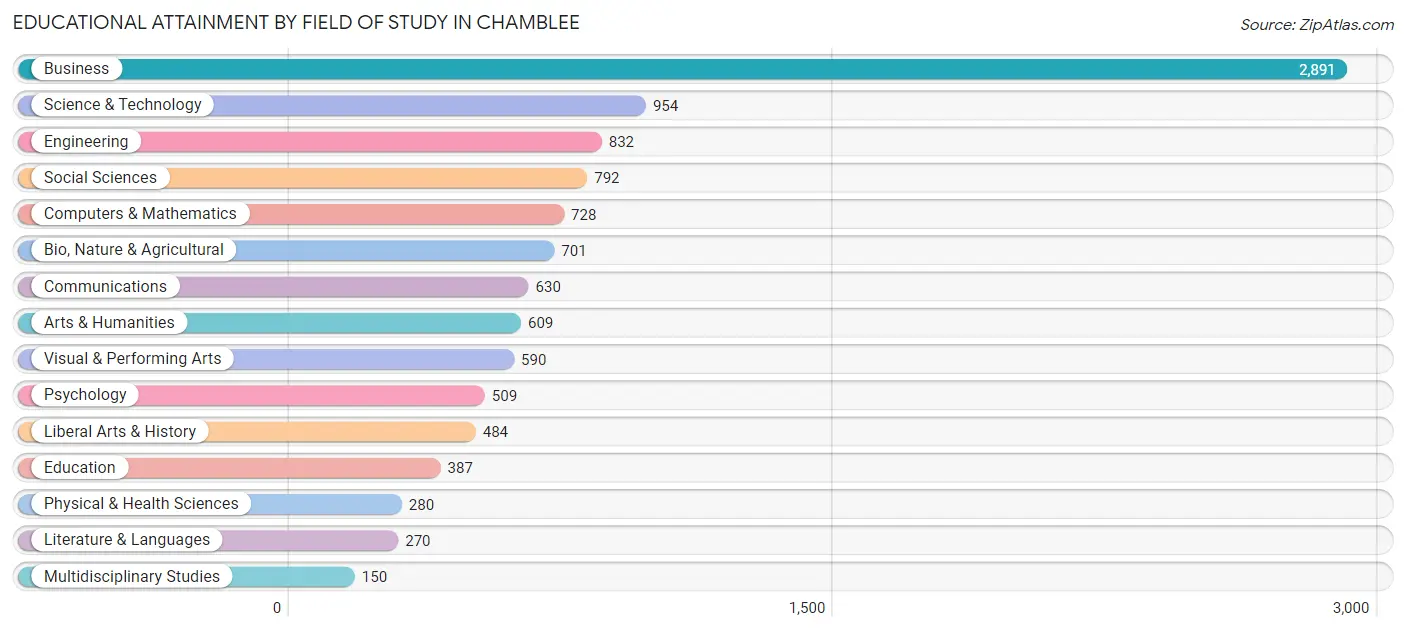
| Field of Study | # Graduates | % Graduates |
| Computers & Mathematics | 728 | 6.7% |
| Bio, Nature & Agricultural | 701 | 6.5% |
| Physical & Health Sciences | 280 | 2.6% |
| Psychology | 509 | 4.7% |
| Social Sciences | 792 | 7.3% |
| Engineering | 832 | 7.7% |
| Multidisciplinary Studies | 150 | 1.4% |
| Science & Technology | 954 | 8.8% |
| Business | 2,891 | 26.8% |
| Education | 387 | 3.6% |
| Literature & Languages | 270 | 2.5% |
| Liberal Arts & History | 484 | 4.5% |
| Visual & Performing Arts | 590 | 5.5% |
| Communications | 630 | 5.8% |
| Arts & Humanities | 609 | 5.6% |
| Total | 10,807 | 100.0% |
Transportation & Commute in Chamblee
Vehicle Availability by Sex in Chamblee
The most prevalent vehicle ownership categories in Chamblee are males with 2 vehicles (4,370, accounting for 44.5%) and females with 2 vehicles (3,277, making up 57.8%).
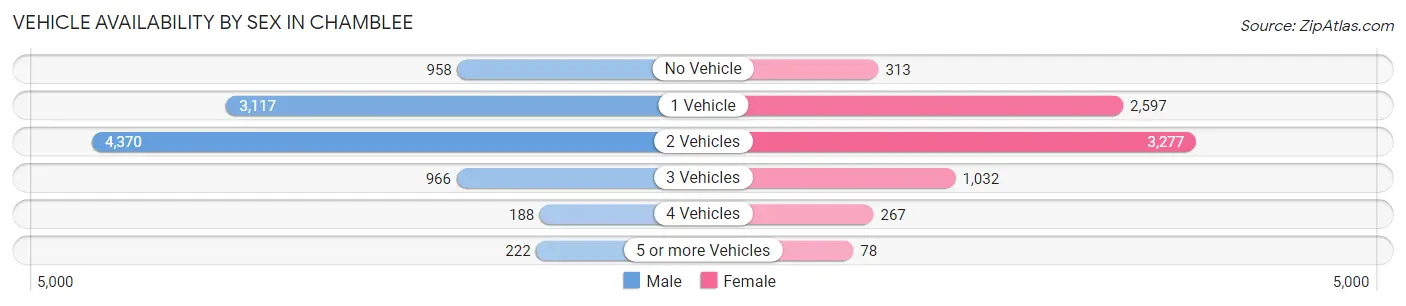
| Vehicles Available | Male | Female |
| No Vehicle | 958 (9.8%) | 313 (4.1%) |
| 1 Vehicle | 3,117 (31.7%) | 2,597 (34.3%) |
| 2 Vehicles | 4,370 (44.5%) | 3,277 (43.3%) |
| 3 Vehicles | 966 (9.8%) | 1,032 (13.6%) |
| 4 Vehicles | 188 (1.9%) | 267 (3.5%) |
| 5 or more Vehicles | 222 (2.3%) | 78 (1.0%) |
| Total | 9,821 (100.0%) | 7,564 (100.0%) |
Commute Time in Chamblee
The most frequently occuring commute durations in Chamblee are 30 to 34 minutes (2,913 commuters, 20.2%), 15 to 19 minutes (2,801 commuters, 19.4%), and 20 to 24 minutes (2,723 commuters, 18.8%).
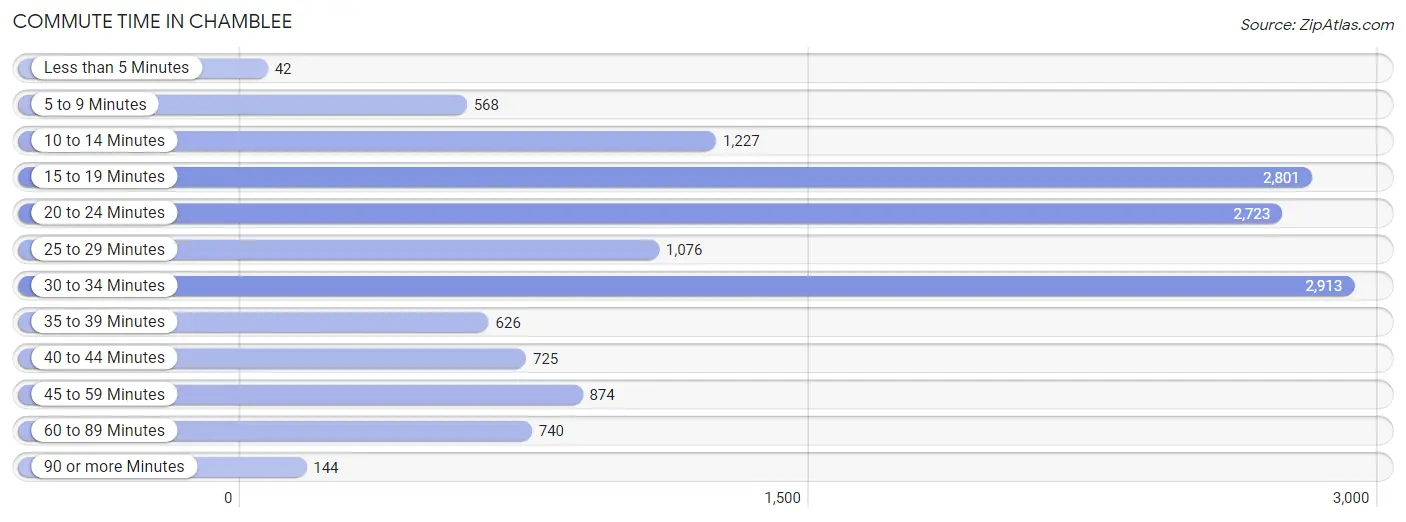
| Commute Time | # Commuters | % Commuters |
| Less than 5 Minutes | 42 | 0.3% |
| 5 to 9 Minutes | 568 | 3.9% |
| 10 to 14 Minutes | 1,227 | 8.5% |
| 15 to 19 Minutes | 2,801 | 19.4% |
| 20 to 24 Minutes | 2,723 | 18.8% |
| 25 to 29 Minutes | 1,076 | 7.4% |
| 30 to 34 Minutes | 2,913 | 20.2% |
| 35 to 39 Minutes | 626 | 4.3% |
| 40 to 44 Minutes | 725 | 5.0% |
| 45 to 59 Minutes | 874 | 6.0% |
| 60 to 89 Minutes | 740 | 5.1% |
| 90 or more Minutes | 144 | 1.0% |
Commute Time by Sex in Chamblee
The most common commute times in Chamblee are 20 to 24 minutes (1,818 commuters, 22.3%) for males and 15 to 19 minutes (1,501 commuters, 23.8%) for females.
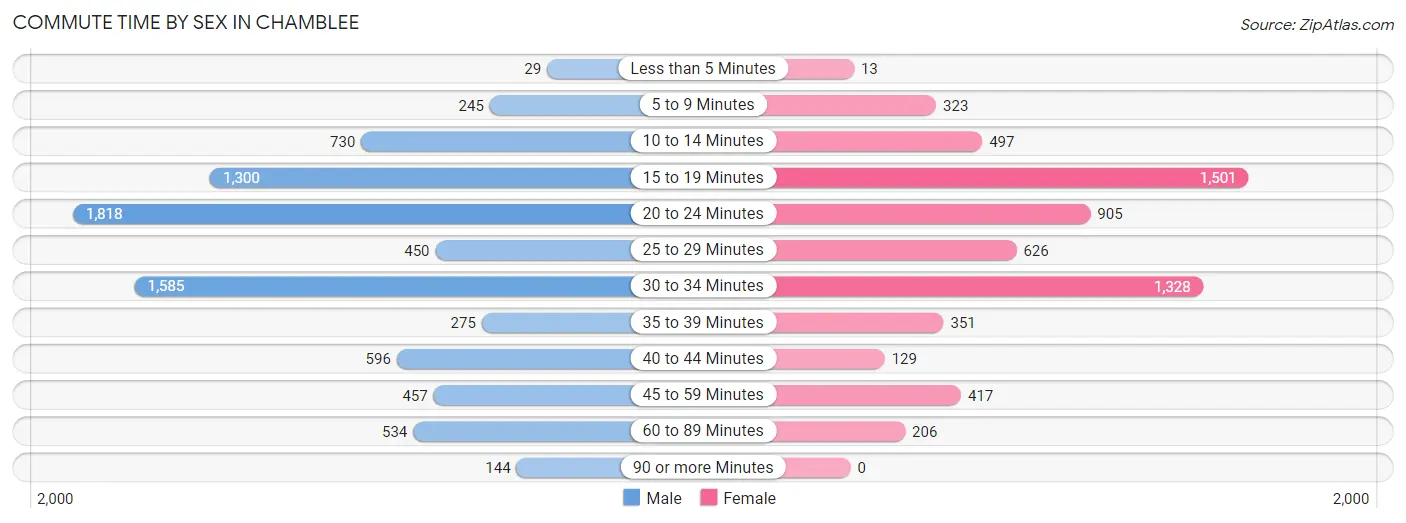
| Commute Time | Male | Female |
| Less than 5 Minutes | 29 (0.4%) | 13 (0.2%) |
| 5 to 9 Minutes | 245 (3.0%) | 323 (5.1%) |
| 10 to 14 Minutes | 730 (8.9%) | 497 (7.9%) |
| 15 to 19 Minutes | 1,300 (15.9%) | 1,501 (23.8%) |
| 20 to 24 Minutes | 1,818 (22.3%) | 905 (14.4%) |
| 25 to 29 Minutes | 450 (5.5%) | 626 (9.9%) |
| 30 to 34 Minutes | 1,585 (19.4%) | 1,328 (21.1%) |
| 35 to 39 Minutes | 275 (3.4%) | 351 (5.6%) |
| 40 to 44 Minutes | 596 (7.3%) | 129 (2.1%) |
| 45 to 59 Minutes | 457 (5.6%) | 417 (6.6%) |
| 60 to 89 Minutes | 534 (6.5%) | 206 (3.3%) |
| 90 or more Minutes | 144 (1.8%) | 0 (0.0%) |
Time of Departure to Work by Sex in Chamblee
The most frequent times of departure to work in Chamblee are 7:00 AM to 7:29 AM (1,752, 21.5%) for males and 7:30 AM to 7:59 AM (1,363, 21.6%) for females.
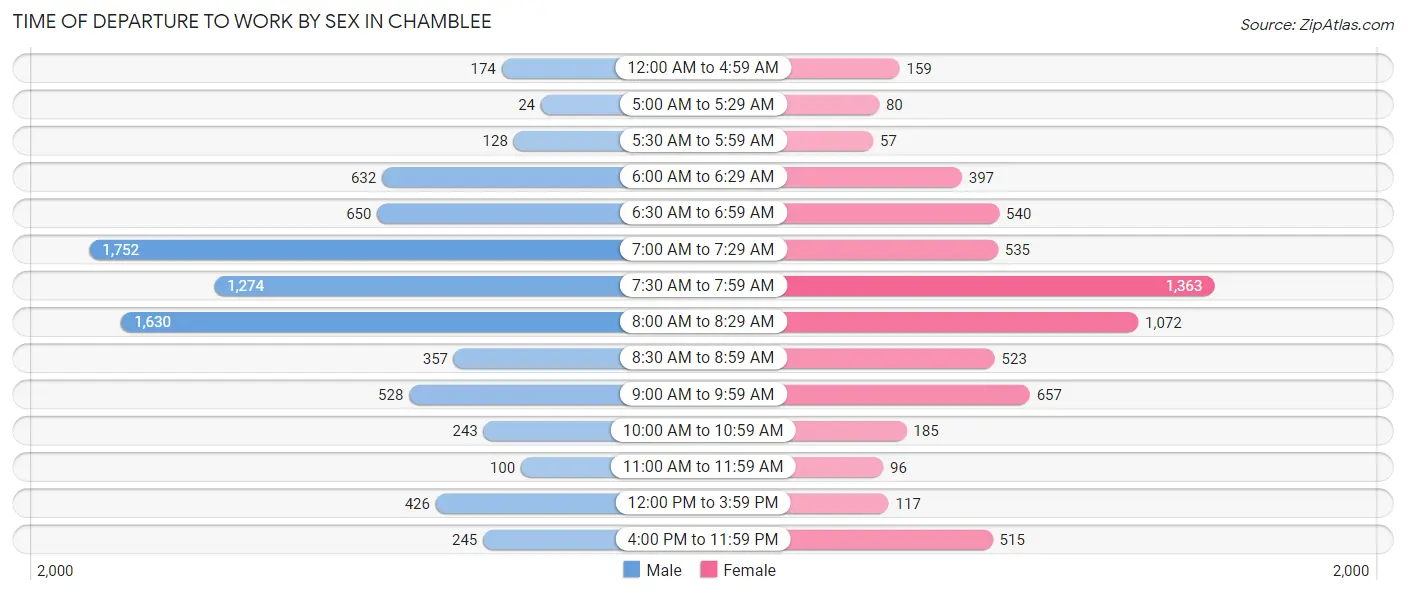
| Time of Departure | Male | Female |
| 12:00 AM to 4:59 AM | 174 (2.1%) | 159 (2.5%) |
| 5:00 AM to 5:29 AM | 24 (0.3%) | 80 (1.3%) |
| 5:30 AM to 5:59 AM | 128 (1.6%) | 57 (0.9%) |
| 6:00 AM to 6:29 AM | 632 (7.7%) | 397 (6.3%) |
| 6:30 AM to 6:59 AM | 650 (8.0%) | 540 (8.6%) |
| 7:00 AM to 7:29 AM | 1,752 (21.5%) | 535 (8.5%) |
| 7:30 AM to 7:59 AM | 1,274 (15.6%) | 1,363 (21.6%) |
| 8:00 AM to 8:29 AM | 1,630 (20.0%) | 1,072 (17.0%) |
| 8:30 AM to 8:59 AM | 357 (4.4%) | 523 (8.3%) |
| 9:00 AM to 9:59 AM | 528 (6.5%) | 657 (10.4%) |
| 10:00 AM to 10:59 AM | 243 (3.0%) | 185 (2.9%) |
| 11:00 AM to 11:59 AM | 100 (1.2%) | 96 (1.5%) |
| 12:00 PM to 3:59 PM | 426 (5.2%) | 117 (1.9%) |
| 4:00 PM to 11:59 PM | 245 (3.0%) | 515 (8.2%) |
| Total | 8,163 (100.0%) | 6,296 (100.0%) |
Housing Occupancy in Chamblee
Occupancy by Ownership in Chamblee
Of the total 12,259 dwellings in Chamblee, owner-occupied units account for 4,879 (39.8%), while renter-occupied units make up 7,380 (60.2%).
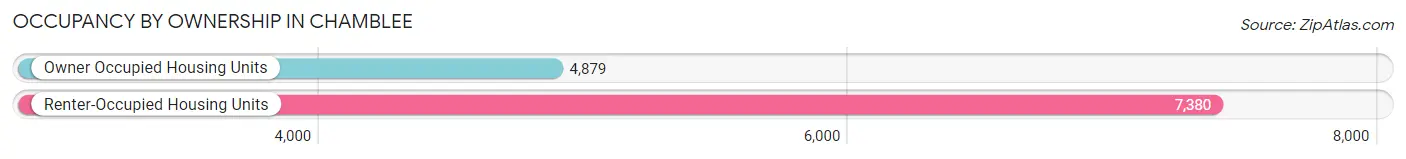
| Occupancy | # Housing Units | % Housing Units |
| Owner Occupied Housing Units | 4,879 | 39.8% |
| Renter-Occupied Housing Units | 7,380 | 60.2% |
| Total Occupied Housing Units | 12,259 | 100.0% |
Occupancy by Household Size in Chamblee
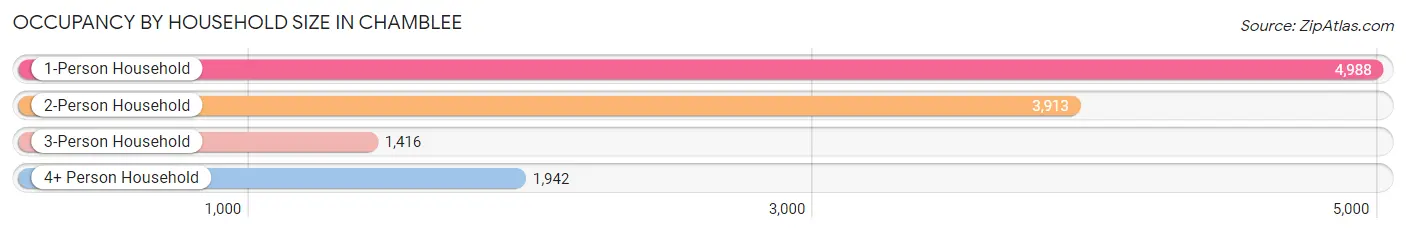
| Household Size | # Housing Units | % Housing Units |
| 1-Person Household | 4,988 | 40.7% |
| 2-Person Household | 3,913 | 31.9% |
| 3-Person Household | 1,416 | 11.6% |
| 4+ Person Household | 1,942 | 15.8% |
| Total Housing Units | 12,259 | 100.0% |
Occupancy by Ownership by Household Size in Chamblee
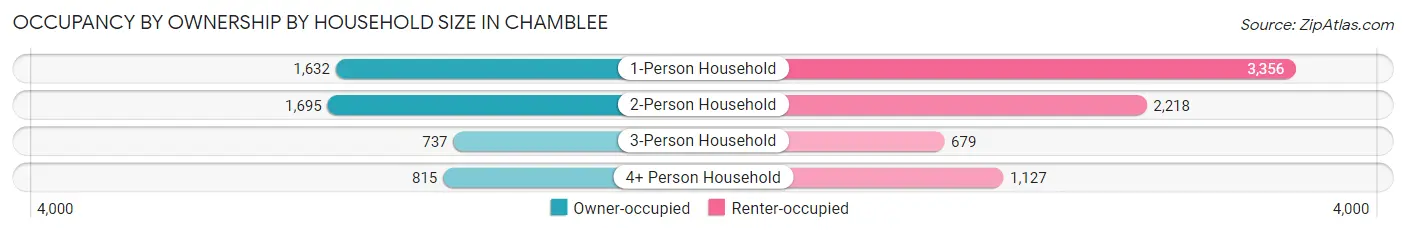
| Household Size | Owner-occupied | Renter-occupied |
| 1-Person Household | 1,632 (32.7%) | 3,356 (67.3%) |
| 2-Person Household | 1,695 (43.3%) | 2,218 (56.7%) |
| 3-Person Household | 737 (52.0%) | 679 (47.9%) |
| 4+ Person Household | 815 (42.0%) | 1,127 (58.0%) |
| Total Housing Units | 4,879 (39.8%) | 7,380 (60.2%) |
Occupancy by Educational Attainment in Chamblee
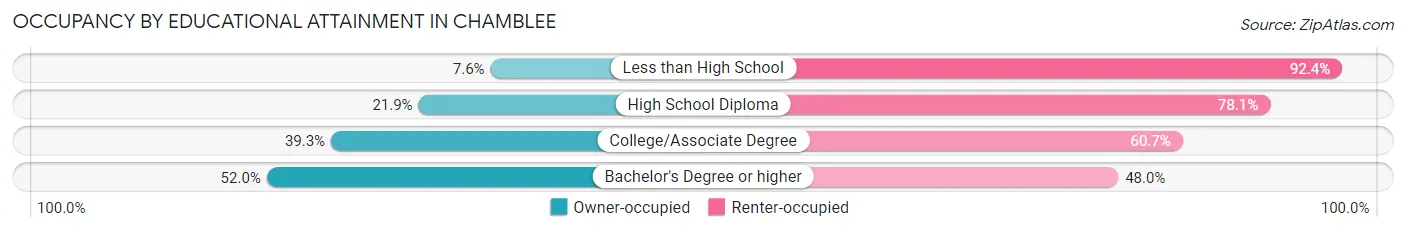
| Household Size | Owner-occupied | Renter-occupied |
| Less than High School | 134 (7.6%) | 1,621 (92.4%) |
| High School Diploma | 348 (21.9%) | 1,240 (78.1%) |
| College/Associate Degree | 740 (39.3%) | 1,145 (60.7%) |
| Bachelor's Degree or higher | 3,657 (52.0%) | 3,374 (48.0%) |
Occupancy by Age of Householder in Chamblee
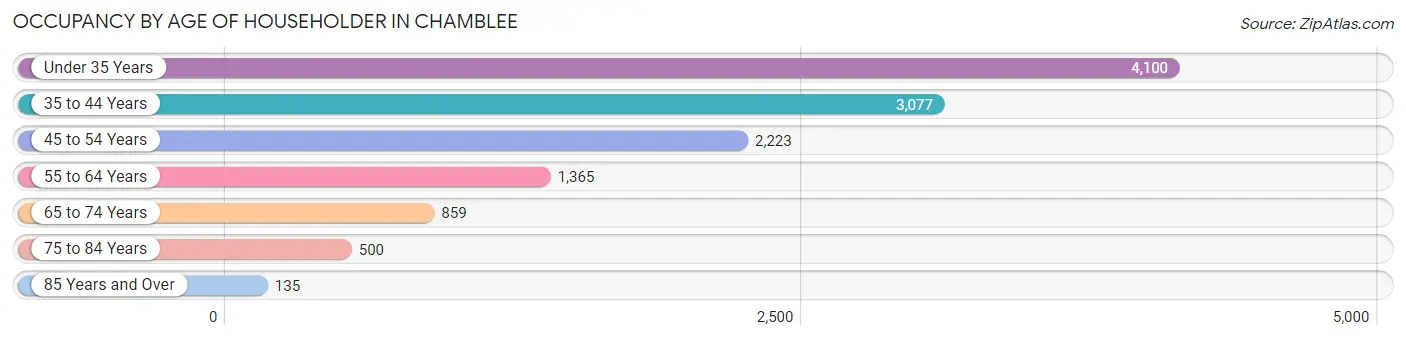
| Age Bracket | # Households | % Households |
| Under 35 Years | 4,100 | 33.4% |
| 35 to 44 Years | 3,077 | 25.1% |
| 45 to 54 Years | 2,223 | 18.1% |
| 55 to 64 Years | 1,365 | 11.1% |
| 65 to 74 Years | 859 | 7.0% |
| 75 to 84 Years | 500 | 4.1% |
| 85 Years and Over | 135 | 1.1% |
| Total | 12,259 | 100.0% |
Housing Finances in Chamblee
Median Income by Occupancy in Chamblee
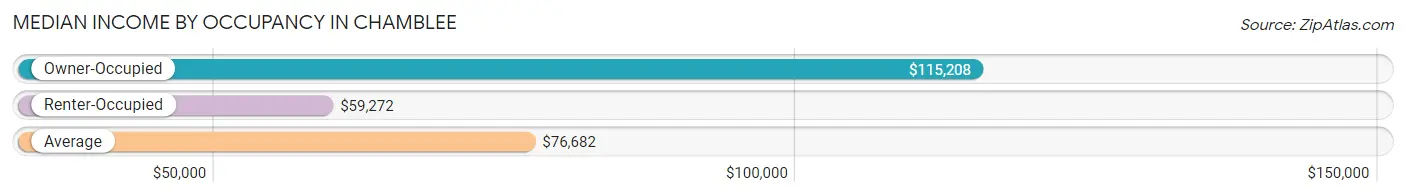
| Occupancy Type | # Households | Median Income |
| Owner-Occupied | 4,879 (39.8%) | $115,208 |
| Renter-Occupied | 7,380 (60.2%) | $59,272 |
| Average | 12,259 (100.0%) | $76,682 |
Occupancy by Householder Income Bracket in Chamblee
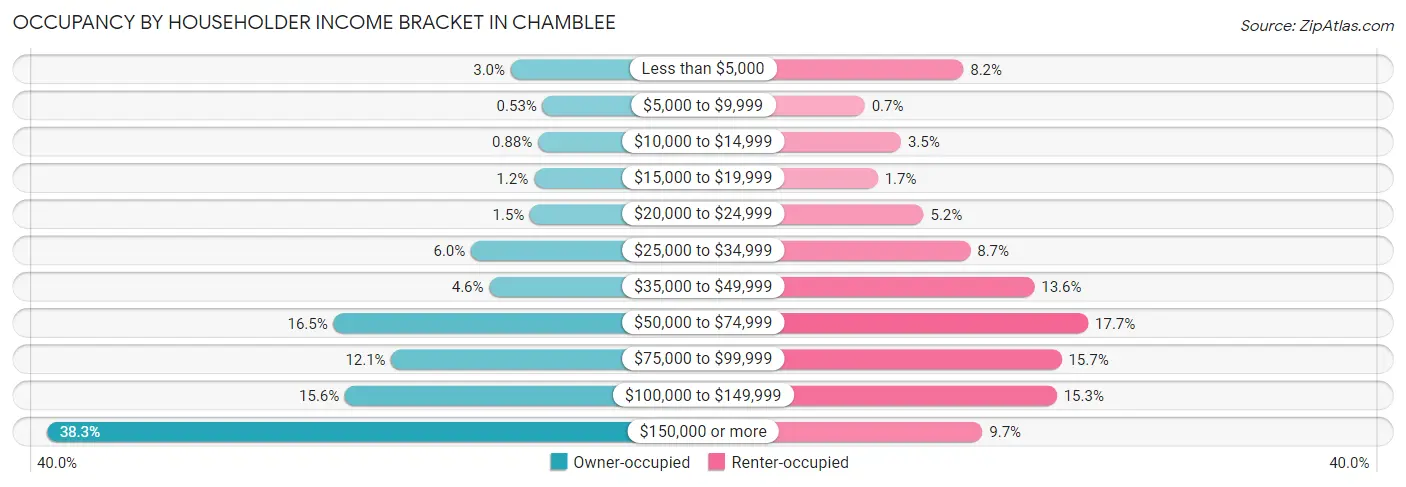
| Income Bracket | Owner-occupied | Renter-occupied |
| Less than $5,000 | 144 (2.9%) | 606 (8.2%) |
| $5,000 to $9,999 | 26 (0.5%) | 52 (0.7%) |
| $10,000 to $14,999 | 43 (0.9%) | 255 (3.5%) |
| $15,000 to $19,999 | 58 (1.2%) | 125 (1.7%) |
| $20,000 to $24,999 | 72 (1.5%) | 382 (5.2%) |
| $25,000 to $34,999 | 292 (6.0%) | 645 (8.7%) |
| $35,000 to $49,999 | 224 (4.6%) | 1,005 (13.6%) |
| $50,000 to $74,999 | 803 (16.5%) | 1,308 (17.7%) |
| $75,000 to $99,999 | 588 (12.0%) | 1,158 (15.7%) |
| $100,000 to $149,999 | 760 (15.6%) | 1,131 (15.3%) |
| $150,000 or more | 1,869 (38.3%) | 713 (9.7%) |
| Total | 4,879 (100.0%) | 7,380 (100.0%) |
Monthly Housing Cost Tiers in Chamblee
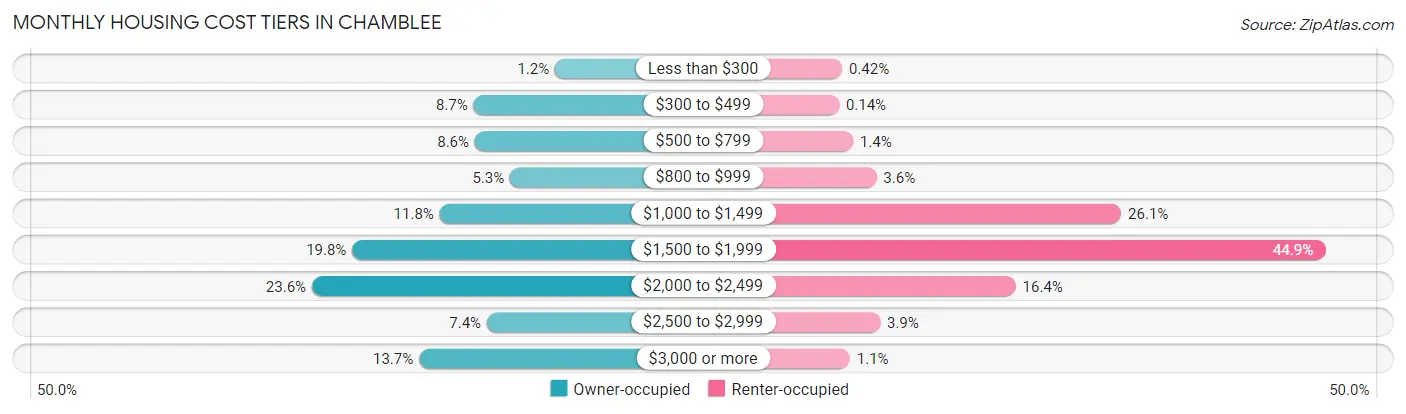
| Monthly Cost | Owner-occupied | Renter-occupied |
| Less than $300 | 57 (1.2%) | 31 (0.4%) |
| $300 to $499 | 423 (8.7%) | 10 (0.1%) |
| $500 to $799 | 417 (8.6%) | 106 (1.4%) |
| $800 to $999 | 259 (5.3%) | 265 (3.6%) |
| $1,000 to $1,499 | 575 (11.8%) | 1,928 (26.1%) |
| $1,500 to $1,999 | 968 (19.8%) | 3,313 (44.9%) |
| $2,000 to $2,499 | 1,149 (23.5%) | 1,211 (16.4%) |
| $2,500 to $2,999 | 363 (7.4%) | 289 (3.9%) |
| $3,000 or more | 668 (13.7%) | 84 (1.1%) |
| Total | 4,879 (100.0%) | 7,380 (100.0%) |
Physical Housing Characteristics in Chamblee
Housing Structures in Chamblee
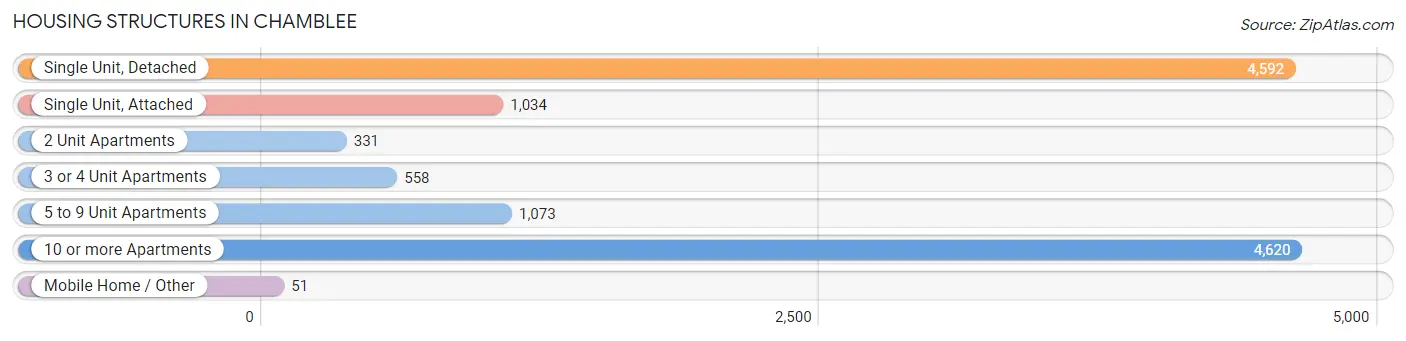
| Structure Type | # Housing Units | % Housing Units |
| Single Unit, Detached | 4,592 | 37.5% |
| Single Unit, Attached | 1,034 | 8.4% |
| 2 Unit Apartments | 331 | 2.7% |
| 3 or 4 Unit Apartments | 558 | 4.5% |
| 5 to 9 Unit Apartments | 1,073 | 8.7% |
| 10 or more Apartments | 4,620 | 37.7% |
| Mobile Home / Other | 51 | 0.4% |
| Total | 12,259 | 100.0% |
Housing Structures by Occupancy in Chamblee
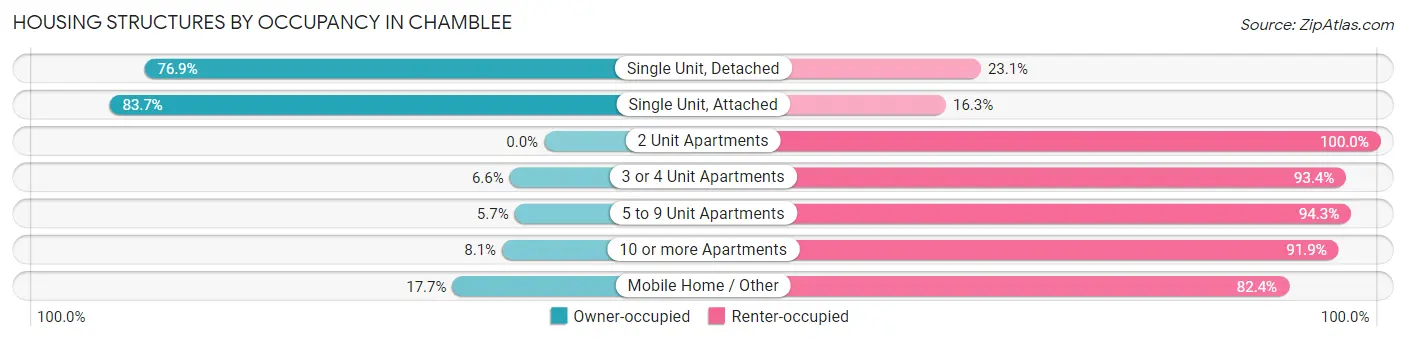
| Structure Type | Owner-occupied | Renter-occupied |
| Single Unit, Detached | 3,533 (76.9%) | 1,059 (23.1%) |
| Single Unit, Attached | 865 (83.7%) | 169 (16.3%) |
| 2 Unit Apartments | 0 (0.0%) | 331 (100.0%) |
| 3 or 4 Unit Apartments | 37 (6.6%) | 521 (93.4%) |
| 5 to 9 Unit Apartments | 61 (5.7%) | 1,012 (94.3%) |
| 10 or more Apartments | 374 (8.1%) | 4,246 (91.9%) |
| Mobile Home / Other | 9 (17.6%) | 42 (82.4%) |
| Total | 4,879 (39.8%) | 7,380 (60.2%) |
Housing Structures by Number of Rooms in Chamblee
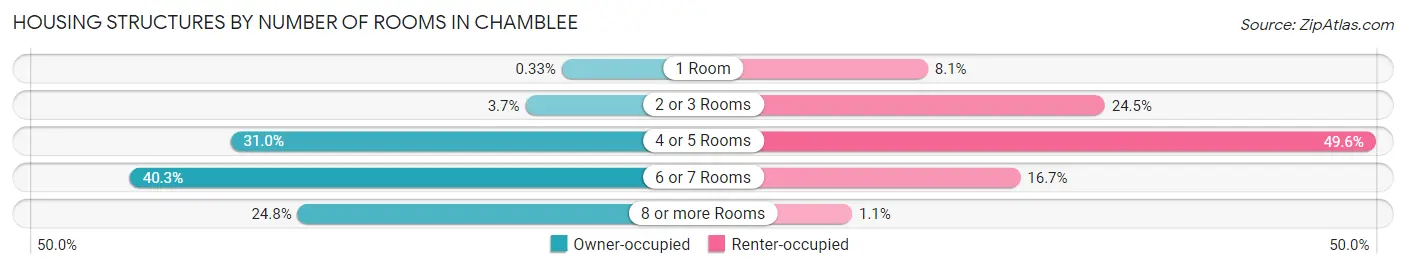
| Number of Rooms | Owner-occupied | Renter-occupied |
| 1 Room | 16 (0.3%) | 600 (8.1%) |
| 2 or 3 Rooms | 180 (3.7%) | 1,808 (24.5%) |
| 4 or 5 Rooms | 1,510 (30.9%) | 3,657 (49.5%) |
| 6 or 7 Rooms | 1,965 (40.3%) | 1,232 (16.7%) |
| 8 or more Rooms | 1,208 (24.8%) | 83 (1.1%) |
| Total | 4,879 (100.0%) | 7,380 (100.0%) |
Housing Structure by Heating Type in Chamblee
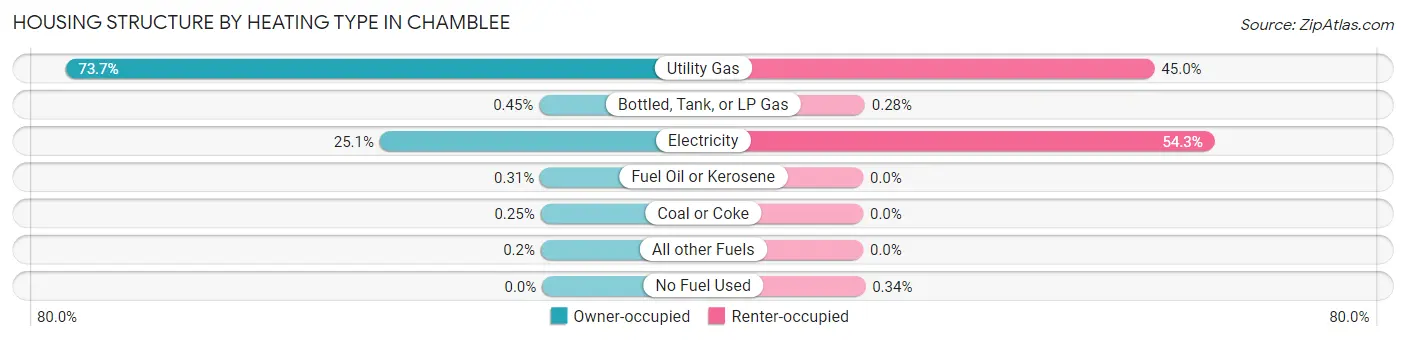
| Heating Type | Owner-occupied | Renter-occupied |
| Utility Gas | 3,596 (73.7%) | 3,324 (45.0%) |
| Bottled, Tank, or LP Gas | 22 (0.4%) | 21 (0.3%) |
| Electricity | 1,224 (25.1%) | 4,010 (54.3%) |
| Fuel Oil or Kerosene | 15 (0.3%) | 0 (0.0%) |
| Coal or Coke | 12 (0.3%) | 0 (0.0%) |
| All other Fuels | 10 (0.2%) | 0 (0.0%) |
| No Fuel Used | 0 (0.0%) | 25 (0.3%) |
| Total | 4,879 (100.0%) | 7,380 (100.0%) |
Household Vehicle Usage in Chamblee
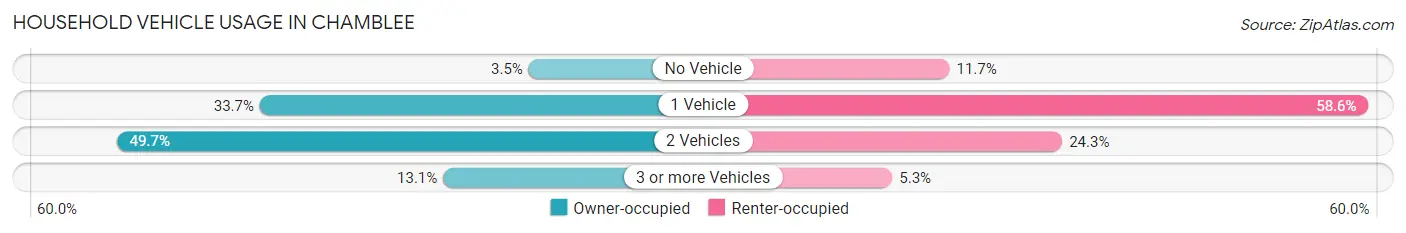
| Vehicles per Household | Owner-occupied | Renter-occupied |
| No Vehicle | 172 (3.5%) | 865 (11.7%) |
| 1 Vehicle | 1,642 (33.7%) | 4,327 (58.6%) |
| 2 Vehicles | 2,425 (49.7%) | 1,796 (24.3%) |
| 3 or more Vehicles | 640 (13.1%) | 392 (5.3%) |
| Total | 4,879 (100.0%) | 7,380 (100.0%) |
Real Estate & Mortgages in Chamblee
Real Estate and Mortgage Overview in Chamblee
| Characteristic | Without Mortgage | With Mortgage |
| Housing Units | 1,204 | 3,675 |
| Median Property Value | $397,000 | $395,300 |
| Median Household Income | $77,639 | $1,509 |
| Monthly Housing Costs | $611 | $647 |
| Real Estate Taxes | $3,171 | $28 |
Property Value by Mortgage Status in Chamblee
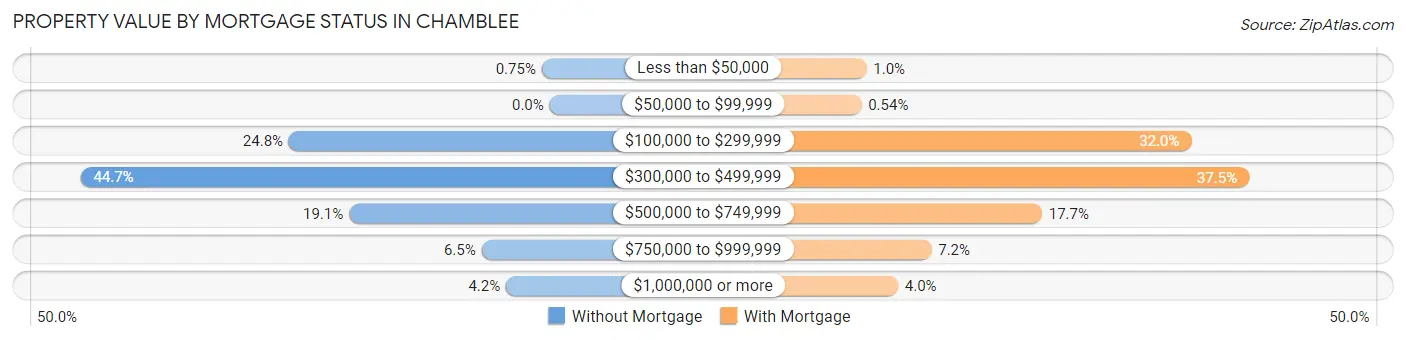
| Property Value | Without Mortgage | With Mortgage |
| Less than $50,000 | 9 (0.7%) | 38 (1.0%) |
| $50,000 to $99,999 | 0 (0.0%) | 20 (0.5%) |
| $100,000 to $299,999 | 299 (24.8%) | 1,175 (32.0%) |
| $300,000 to $499,999 | 538 (44.7%) | 1,377 (37.5%) |
| $500,000 to $749,999 | 230 (19.1%) | 652 (17.7%) |
| $750,000 to $999,999 | 78 (6.5%) | 265 (7.2%) |
| $1,000,000 or more | 50 (4.2%) | 148 (4.0%) |
| Total | 1,204 (100.0%) | 3,675 (100.0%) |
Household Income by Mortgage Status in Chamblee
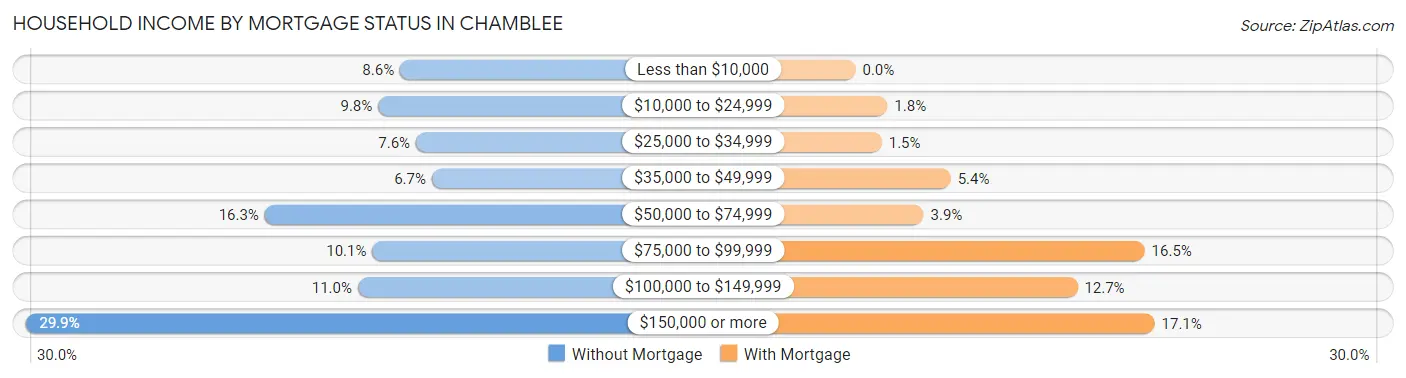
| Household Income | Without Mortgage | With Mortgage |
| Less than $10,000 | 103 (8.6%) | 0 (0.0%) |
| $10,000 to $24,999 | 118 (9.8%) | 67 (1.8%) |
| $25,000 to $34,999 | 92 (7.6%) | 55 (1.5%) |
| $35,000 to $49,999 | 81 (6.7%) | 200 (5.4%) |
| $50,000 to $74,999 | 196 (16.3%) | 143 (3.9%) |
| $75,000 to $99,999 | 122 (10.1%) | 607 (16.5%) |
| $100,000 to $149,999 | 132 (11.0%) | 466 (12.7%) |
| $150,000 or more | 360 (29.9%) | 628 (17.1%) |
| Total | 1,204 (100.0%) | 3,675 (100.0%) |
Property Value to Household Income Ratio in Chamblee
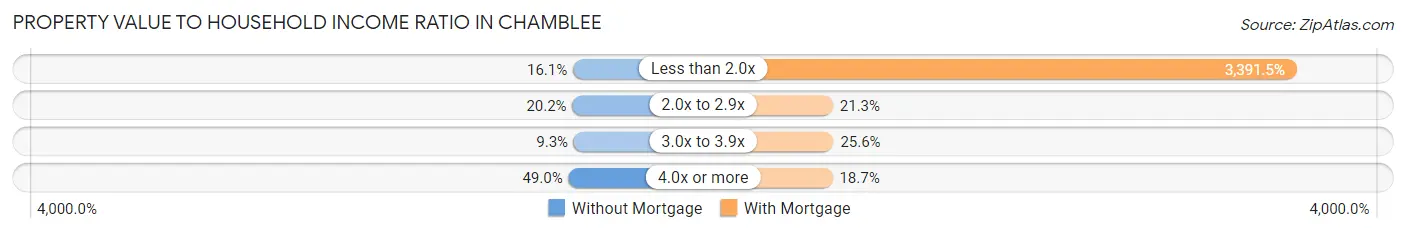
| Value-to-Income Ratio | Without Mortgage | With Mortgage |
| Less than 2.0x | 194 (16.1%) | 124,639 (3,391.5%) |
| 2.0x to 2.9x | 243 (20.2%) | 782 (21.3%) |
| 3.0x to 3.9x | 112 (9.3%) | 939 (25.6%) |
| 4.0x or more | 590 (49.0%) | 688 (18.7%) |
| Total | 1,204 (100.0%) | 3,675 (100.0%) |
Real Estate Taxes by Mortgage Status in Chamblee
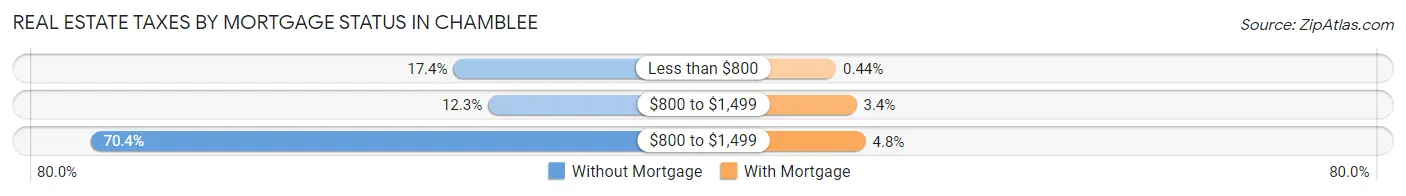
| Property Taxes | Without Mortgage | With Mortgage |
| Less than $800 | 209 (17.4%) | 16 (0.4%) |
| $800 to $1,499 | 148 (12.3%) | 126 (3.4%) |
| $800 to $1,499 | 847 (70.4%) | 175 (4.8%) |
| Total | 1,204 (100.0%) | 3,675 (100.0%) |
Health & Disability in Chamblee
Health Insurance Coverage by Age in Chamblee
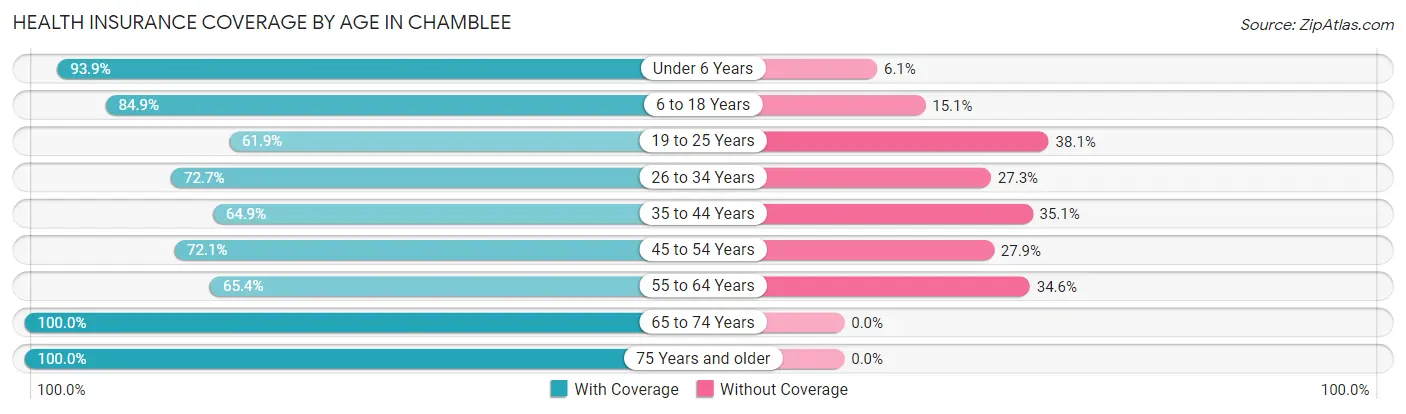
| Age Bracket | With Coverage | Without Coverage |
| Under 6 Years | 2,321 (93.9%) | 151 (6.1%) |
| 6 to 18 Years | 3,961 (84.9%) | 705 (15.1%) |
| 19 to 25 Years | 1,752 (61.9%) | 1,079 (38.1%) |
| 26 to 34 Years | 4,311 (72.7%) | 1,622 (27.3%) |
| 35 to 44 Years | 3,423 (64.9%) | 1,852 (35.1%) |
| 45 to 54 Years | 2,784 (72.1%) | 1,077 (27.9%) |
| 55 to 64 Years | 1,461 (65.4%) | 773 (34.6%) |
| 65 to 74 Years | 1,577 (100.0%) | 0 (0.0%) |
| 75 Years and older | 961 (100.0%) | 0 (0.0%) |
| Total | 22,551 (75.6%) | 7,259 (24.3%) |
Health Insurance Coverage by Citizenship Status in Chamblee
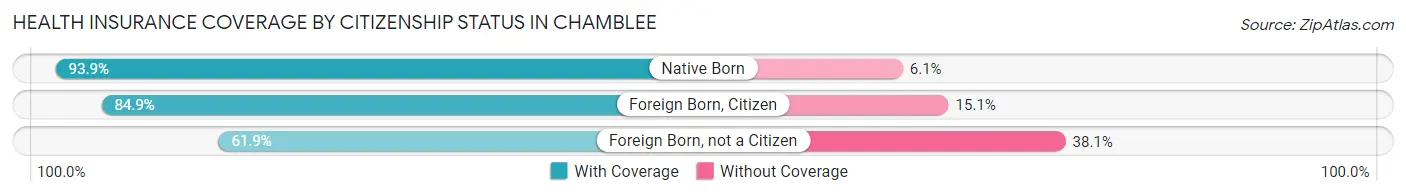
| Citizenship Status | With Coverage | Without Coverage |
| Native Born | 2,321 (93.9%) | 151 (6.1%) |
| Foreign Born, Citizen | 3,961 (84.9%) | 705 (15.1%) |
| Foreign Born, not a Citizen | 1,752 (61.9%) | 1,079 (38.1%) |
Health Insurance Coverage by Household Income in Chamblee
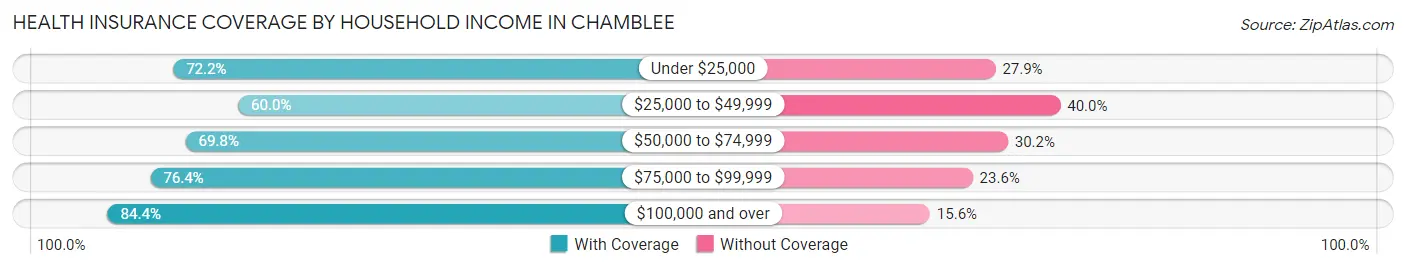
| Household Income | With Coverage | Without Coverage |
| Under $25,000 | 2,513 (72.2%) | 970 (27.9%) |
| $25,000 to $49,999 | 3,107 (60.0%) | 2,071 (40.0%) |
| $50,000 to $74,999 | 3,047 (69.8%) | 1,316 (30.2%) |
| $75,000 to $99,999 | 2,749 (76.4%) | 848 (23.6%) |
| $100,000 and over | 11,125 (84.4%) | 2,052 (15.6%) |
Public vs Private Health Insurance Coverage by Age in Chamblee
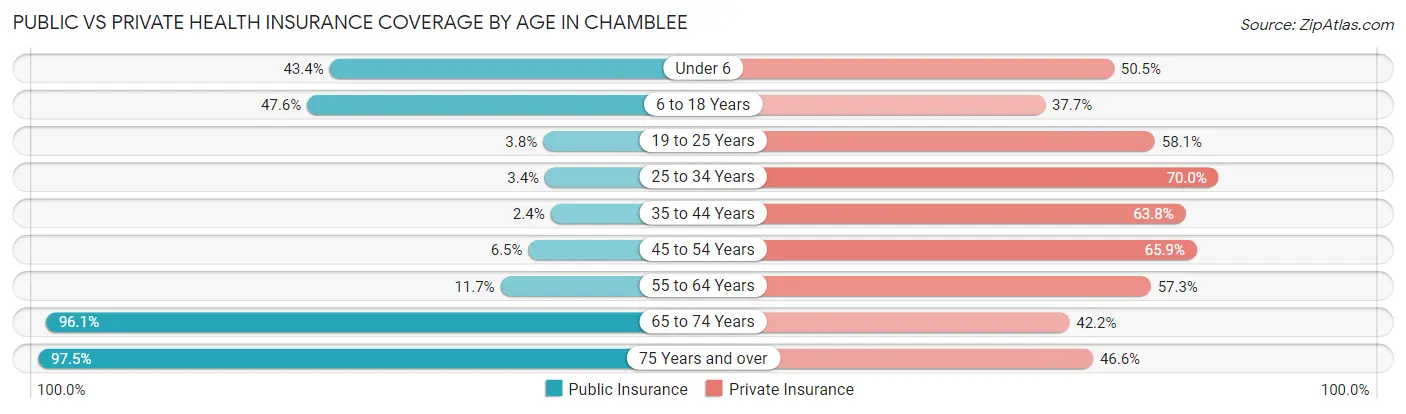
| Age Bracket | Public Insurance | Private Insurance |
| Under 6 | 1,073 (43.4%) | 1,248 (50.5%) |
| 6 to 18 Years | 2,219 (47.6%) | 1,760 (37.7%) |
| 19 to 25 Years | 107 (3.8%) | 1,645 (58.1%) |
| 25 to 34 Years | 203 (3.4%) | 4,150 (70.0%) |
| 35 to 44 Years | 126 (2.4%) | 3,365 (63.8%) |
| 45 to 54 Years | 251 (6.5%) | 2,544 (65.9%) |
| 55 to 64 Years | 261 (11.7%) | 1,281 (57.3%) |
| 65 to 74 Years | 1,515 (96.1%) | 666 (42.2%) |
| 75 Years and over | 937 (97.5%) | 448 (46.6%) |
| Total | 6,692 (22.5%) | 17,107 (57.4%) |
Disability Status by Sex by Age in Chamblee
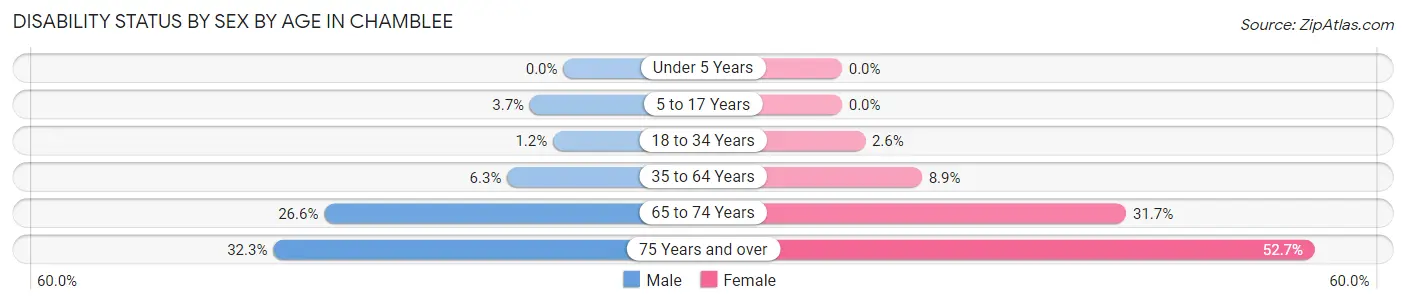
| Age Bracket | Male | Female |
| Under 5 Years | 0 (0.0%) | 0 (0.0%) |
| 5 to 17 Years | 92 (3.7%) | 0 (0.0%) |
| 18 to 34 Years | 55 (1.1%) | 113 (2.6%) |
| 35 to 64 Years | 376 (6.2%) | 477 (8.9%) |
| 65 to 74 Years | 176 (26.6%) | 290 (31.7%) |
| 75 Years and over | 148 (32.3%) | 265 (52.7%) |
Disability Class by Sex by Age in Chamblee
Disability Class: Hearing Difficulty
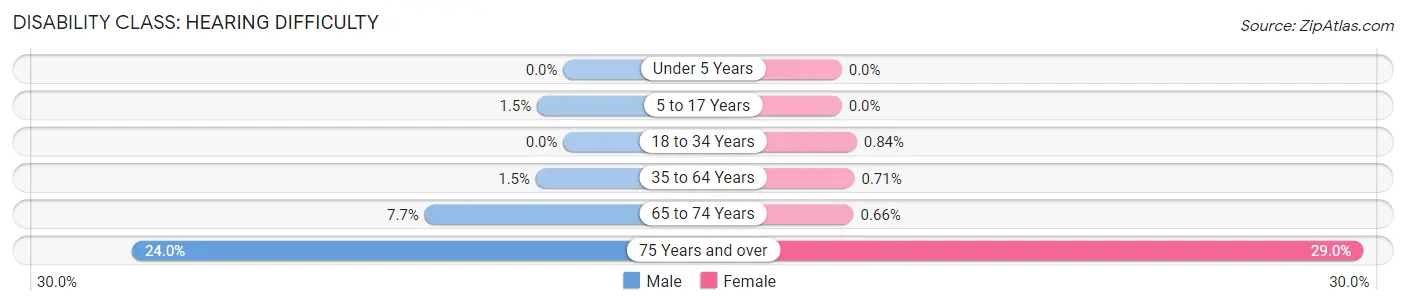
| Age Bracket | Male | Female |
| Under 5 Years | 0 (0.0%) | 0 (0.0%) |
| 5 to 17 Years | 36 (1.5%) | 0 (0.0%) |
| 18 to 34 Years | 0 (0.0%) | 37 (0.8%) |
| 35 to 64 Years | 92 (1.5%) | 38 (0.7%) |
| 65 to 74 Years | 51 (7.7%) | 6 (0.7%) |
| 75 Years and over | 110 (24.0%) | 146 (29.0%) |
Disability Class: Vision Difficulty
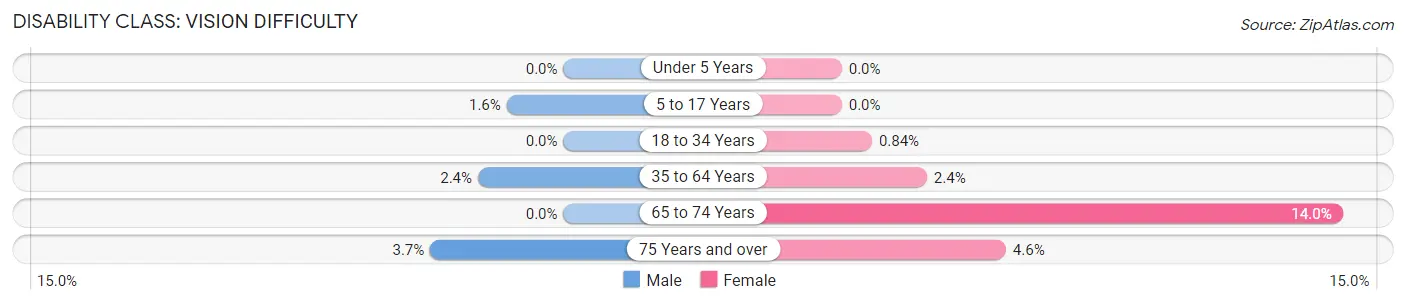
| Age Bracket | Male | Female |
| Under 5 Years | 0 (0.0%) | 0 (0.0%) |
| 5 to 17 Years | 39 (1.6%) | 0 (0.0%) |
| 18 to 34 Years | 0 (0.0%) | 37 (0.8%) |
| 35 to 64 Years | 143 (2.4%) | 127 (2.4%) |
| 65 to 74 Years | 0 (0.0%) | 128 (14.0%) |
| 75 Years and over | 17 (3.7%) | 23 (4.6%) |
Disability Class: Cognitive Difficulty
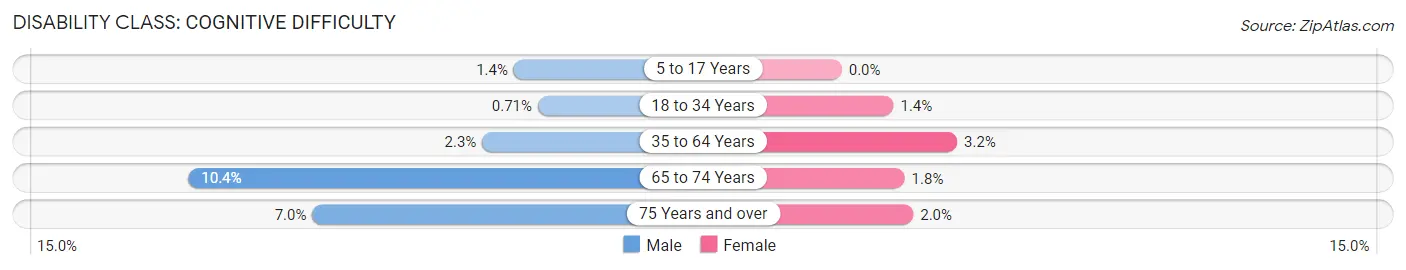
| Age Bracket | Male | Female |
| 5 to 17 Years | 34 (1.4%) | 0 (0.0%) |
| 18 to 34 Years | 34 (0.7%) | 63 (1.4%) |
| 35 to 64 Years | 136 (2.3%) | 172 (3.2%) |
| 65 to 74 Years | 69 (10.4%) | 16 (1.8%) |
| 75 Years and over | 32 (7.0%) | 10 (2.0%) |
Disability Class: Ambulatory Difficulty
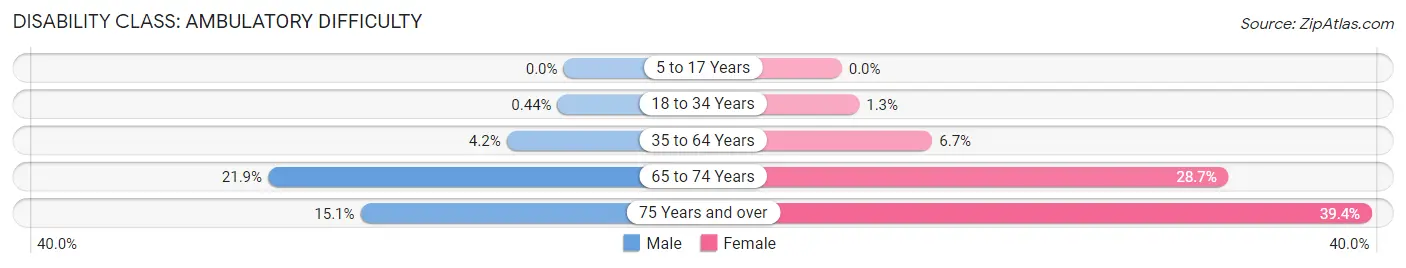
| Age Bracket | Male | Female |
| 5 to 17 Years | 0 (0.0%) | 0 (0.0%) |
| 18 to 34 Years | 21 (0.4%) | 57 (1.3%) |
| 35 to 64 Years | 254 (4.2%) | 360 (6.7%) |
| 65 to 74 Years | 145 (21.9%) | 263 (28.7%) |
| 75 Years and over | 69 (15.1%) | 198 (39.4%) |
Disability Class: Self-Care Difficulty
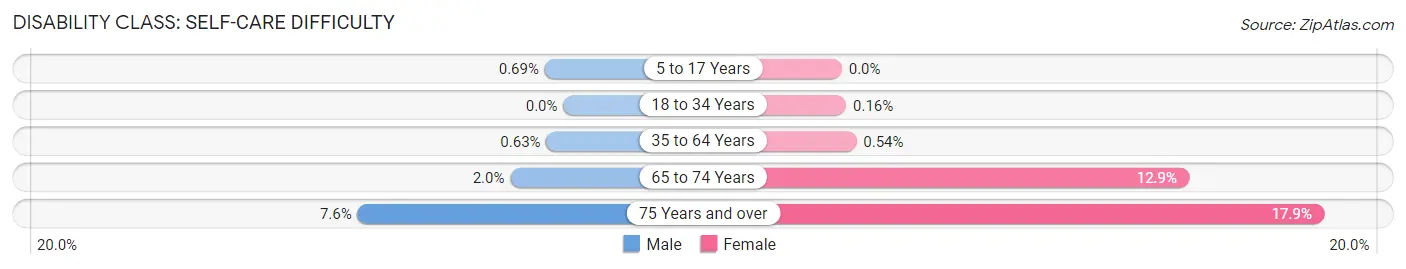
| Age Bracket | Male | Female |
| 5 to 17 Years | 17 (0.7%) | 0 (0.0%) |
| 18 to 34 Years | 0 (0.0%) | 7 (0.2%) |
| 35 to 64 Years | 38 (0.6%) | 29 (0.5%) |
| 65 to 74 Years | 13 (2.0%) | 118 (12.9%) |
| 75 Years and over | 35 (7.6%) | 90 (17.9%) |
Technology Access in Chamblee
Computing Device Access in Chamblee
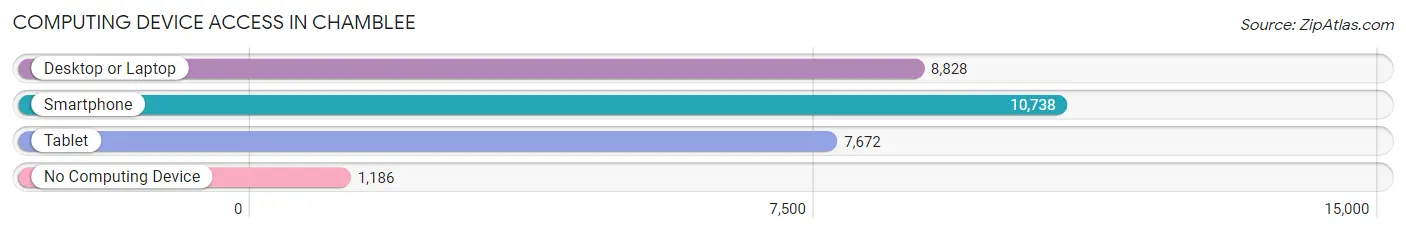
| Device Type | # Households | % Households |
| Desktop or Laptop | 8,828 | 72.0% |
| Smartphone | 10,738 | 87.6% |
| Tablet | 7,672 | 62.6% |
| No Computing Device | 1,186 | 9.7% |
| Total | 12,259 | 100.0% |
Internet Access in Chamblee
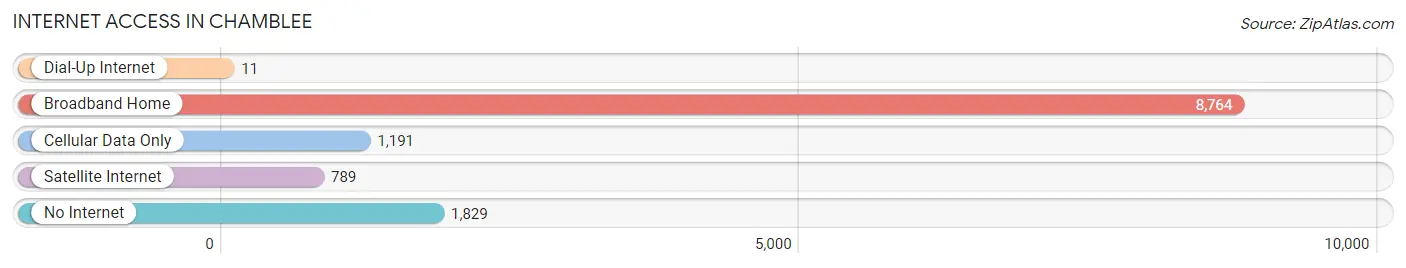
| Internet Type | # Households | % Households |
| Dial-Up Internet | 11 | 0.1% |
| Broadband Home | 8,764 | 71.5% |
| Cellular Data Only | 1,191 | 9.7% |
| Satellite Internet | 789 | 6.4% |
| No Internet | 1,829 | 14.9% |
| Total | 12,259 | 100.0% |
Chamblee Summary
Chamblee, Georgia is a city located in DeKalb County, Georgia, United States. It is a suburb of Atlanta and is located approximately 15 miles northeast of downtown Atlanta. The population of Chamblee was 26,000 as of the 2010 census.
History
Chamblee was founded in 1908 by the Seaboard Air Line Railway. The city was named after Colonel Lemuel P. Chamblee, a civil engineer for the railroad. The city was incorporated in 1908 and was the first city in DeKalb County to be incorporated.
In the early 20th century, Chamblee was a small farming community. The city was home to a number of dairy farms and was known for its production of eggs and poultry. The city was also home to a number of small businesses, including a cotton gin, a grist mill, and a sawmill.
In the 1950s, the city began to experience rapid growth as Atlanta's suburbs began to expand. The city was annexed by the City of Atlanta in 1952, but was later reincorporated as a city in 1959.
Geography
Chamblee is located in DeKalb County, Georgia, approximately 15 miles northeast of downtown Atlanta. The city is bordered by Doraville to the north, Dunwoody to the east, Brookhaven to the south, and Tucker to the west.
The city has a total area of 4.2 square miles, all of which is land. The city is located in the Piedmont region of Georgia and is characterized by rolling hills and wooded areas.
Economy
Chamblee is a major commercial center in the Atlanta metropolitan area. The city is home to a number of major corporations, including UPS, Siemens, and NCR Corporation. The city is also home to a number of small businesses, including restaurants, retail stores, and professional services.
The city is also home to a number of industrial parks, including the Peachtree Industrial Park and the Chamblee Industrial Park. These parks are home to a number of manufacturing and distribution companies.
Demographics
As of the 2010 census, the population of Chamblee was 26,000. The racial makeup of the city was 57.3% White, 24.2% African American, 0.3% Native American, 8.2% Asian, 0.1% Pacific Islander, 5.2% from other races, and 4.9% from two or more races. Hispanic or Latino of any race were 11.3% of the population.
The median household income in the city was $50,945 and the median family income was $60,945. The per capita income in the city was $27,945. The poverty rate in the city was 11.3%.
Conclusion
Chamblee, Georgia is a city located in DeKalb County, Georgia, United States. It is a suburb of Atlanta and is located approximately 15 miles northeast of downtown Atlanta. The city was founded in 1908 by the Seaboard Air Line Railway and was named after Colonel Lemuel P. Chamblee, a civil engineer for the railroad. The city has experienced rapid growth since the 1950s and is now a major commercial center in the Atlanta metropolitan area. The population of Chamblee was 26,000 as of the 2010 census and the racial makeup of the city was 57.3% White, 24.2% African American, 0.3% Native American, 8.2% Asian, 0.1% Pacific Islander, 5.2% from other races, and 4.9% from two or more races. The median household income in the city was $50,945 and the median family income was $60,945. The per capita income in the city was $27,945. The poverty rate in the city was 11.3%.
Common Questions
What is Per Capita Income in Chamblee?
Per Capita income in Chamblee is $45,713.
What is the Median Family Income in Chamblee?
Median Family Income in Chamblee is $103,388.
What is the Median Household income in Chamblee?
Median Household Income in Chamblee is $76,682.
What is Income or Wage Gap in Chamblee?
Income or Wage Gap in Chamblee is 1.9%.
Women in Chamblee earn 98.1 cents for every dollar earned by a man.
What is Family Income Deficit in Chamblee?
Family Income Deficit in Chamblee is $11,285.
Families that are below poverty line in Chamblee earn $11,285 less on average than the poverty threshold level.
What is Inequality or Gini Index in Chamblee?
Inequality or Gini Index in Chamblee is 0.49.
What is the Total Population of Chamblee?
Total Population of Chamblee is 29,980.
What is the Total Male Population of Chamblee?
Total Male Population of Chamblee is 15,847.
What is the Total Female Population of Chamblee?
Total Female Population of Chamblee is 14,133.
What is the Ratio of Males per 100 Females in Chamblee?
There are 112.13 Males per 100 Females in Chamblee.
What is the Ratio of Females per 100 Males in Chamblee?
There are 89.18 Females per 100 Males in Chamblee.
What is the Median Population Age in Chamblee?
Median Population Age in Chamblee is 33.3 Years.
What is the Average Family Size in Chamblee
Average Family Size in Chamblee is 3.4 People.
What is the Average Household Size in Chamblee
Average Household Size in Chamblee is 2.4 People.
How Large is the Labor Force in Chamblee?
There are 18,409 People in the Labor Forcein in Chamblee.
What is the Percentage of People in the Labor Force in Chamblee?
76.1% of People are in the Labor Force in Chamblee.
What is the Unemployment Rate in Chamblee?
Unemployment Rate in Chamblee is 1.9%.