San Antonio, TX Map & Demographics
San Antonio Map
San Antonio Overview
$31,148
PER CAPITA INCOME
$72,452
AVG FAMILY INCOME
$59,593
AVG HOUSEHOLD INCOME
19.9%
WAGE / INCOME GAP [ % ]
80.1¢/ $1
WAGE / INCOME GAP [ $ ]
$11,584
FAMILY INCOME DEFICIT
0.46
INEQUALITY / GINI INDEX
1,445,662
TOTAL POPULATION
717,891
MALE POPULATION
727,771
FEMALE POPULATION
98.64
MALES / 100 FEMALES
101.38
FEMALES / 100 MALES
34.1
MEDIAN AGE
3.4
AVG FAMILY SIZE
2.6
AVG HOUSEHOLD SIZE
748,736
LABOR FORCE [ PEOPLE ]
65.8%
PERCENT IN LABOR FORCE
5.9%
UNEMPLOYMENT RATE
San Antonio Zip Codes
Income in San Antonio
Income Overview in San Antonio
Per Capita Income in San Antonio is $31,148, while median incomes of families and households are $72,452 and $59,593 respectively.
| Characteristic | Number | Measure |
| Per Capita Income | 1,445,662 | $31,148 |
| Median Family Income | 334,441 | $72,452 |
| Mean Family Income | 334,441 | $94,034 |
| Median Household Income | 542,817 | $59,593 |
| Mean Household Income | 542,817 | $80,313 |
| Income Deficit | 334,441 | $11,584 |
| Wage / Income Gap (%) | 1,445,662 | 19.89% |
| Wage / Income Gap ($) | 1,445,662 | 80.11¢ per $1 |
| Gini / Inequality Index | 1,445,662 | 0.46 |
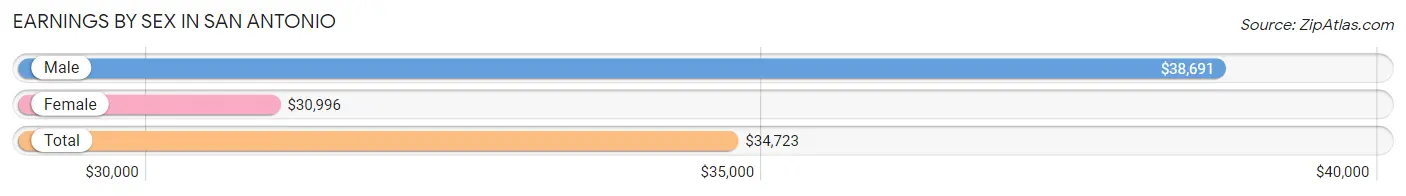
Earnings by Sex in San Antonio
Average Earnings in San Antonio are $34,723, $38,691 for men and $30,996 for women, a difference of 19.9%.
| Sex | Number | Average Earnings |
| Male | 410,927 (53.2%) | $38,691 |
| Female | 361,477 (46.8%) | $30,996 |
| Total | 772,404 (100.0%) | $34,723 |
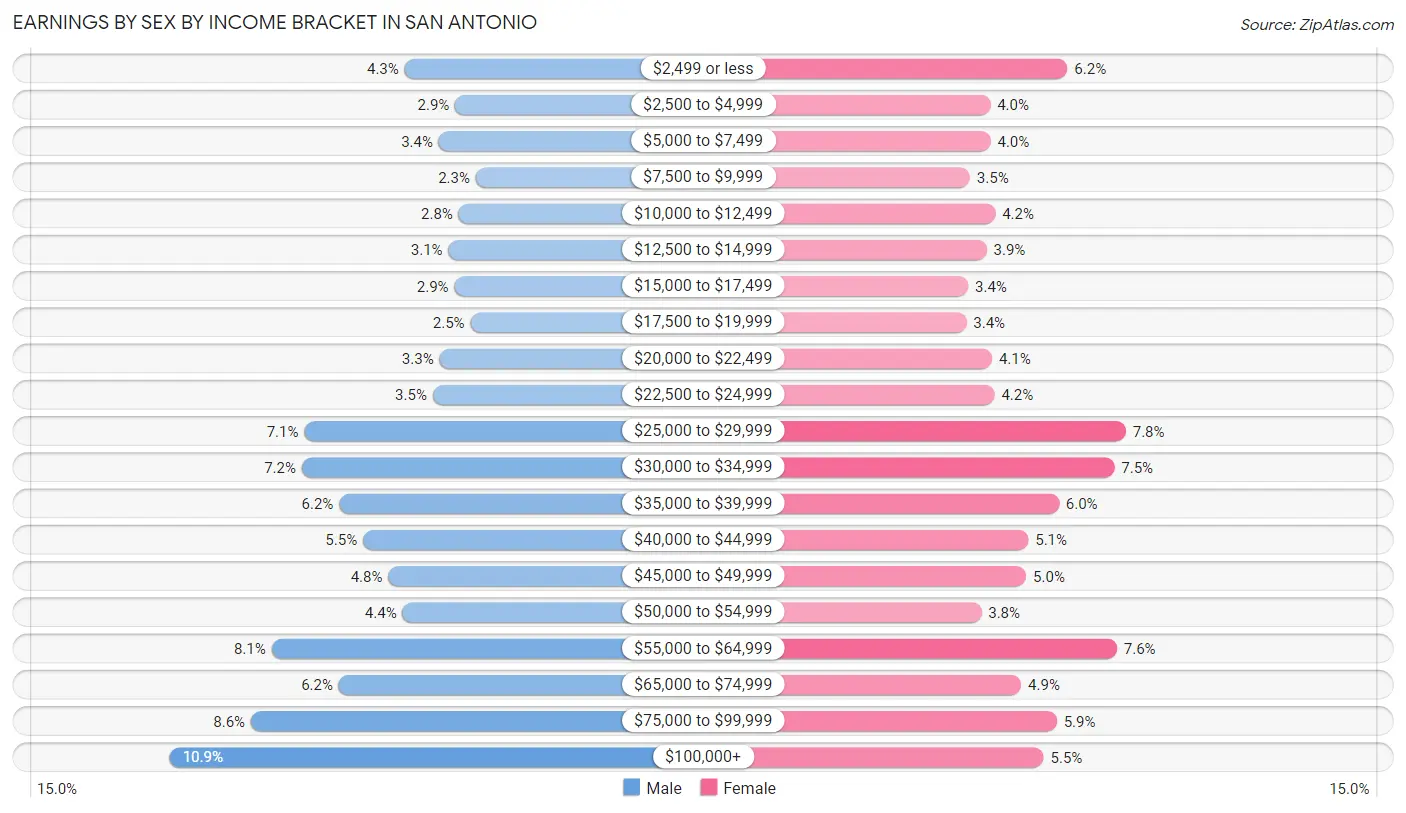
Earnings by Sex by Income Bracket in San Antonio
The most common earnings brackets in San Antonio are $100,000+ for men (44,859 | 10.9%) and $25,000 to $29,999 for women (28,342 | 7.8%).
| Income | Male | Female |
| $2,499 or less | 17,735 (4.3%) | 22,396 (6.2%) |
| $2,500 to $4,999 | 11,931 (2.9%) | 14,581 (4.0%) |
| $5,000 to $7,499 | 13,823 (3.4%) | 14,594 (4.0%) |
| $7,500 to $9,999 | 9,521 (2.3%) | 12,515 (3.5%) |
| $10,000 to $12,499 | 11,492 (2.8%) | 15,060 (4.2%) |
| $12,500 to $14,999 | 12,710 (3.1%) | 14,209 (3.9%) |
| $15,000 to $17,499 | 12,011 (2.9%) | 12,316 (3.4%) |
| $17,500 to $19,999 | 10,150 (2.5%) | 12,162 (3.4%) |
| $20,000 to $22,499 | 13,723 (3.3%) | 14,758 (4.1%) |
| $22,500 to $24,999 | 14,506 (3.5%) | 15,004 (4.2%) |
| $25,000 to $29,999 | 29,341 (7.1%) | 28,342 (7.8%) |
| $30,000 to $34,999 | 29,622 (7.2%) | 27,179 (7.5%) |
| $35,000 to $39,999 | 25,301 (6.2%) | 21,558 (6.0%) |
| $40,000 to $44,999 | 22,544 (5.5%) | 18,438 (5.1%) |
| $45,000 to $49,999 | 19,629 (4.8%) | 18,234 (5.0%) |
| $50,000 to $54,999 | 18,001 (4.4%) | 13,659 (3.8%) |
| $55,000 to $64,999 | 33,140 (8.1%) | 27,439 (7.6%) |
| $65,000 to $74,999 | 25,372 (6.2%) | 17,715 (4.9%) |
| $75,000 to $99,999 | 35,516 (8.6%) | 21,345 (5.9%) |
| $100,000+ | 44,859 (10.9%) | 19,973 (5.5%) |
| Total | 410,927 (100.0%) | 361,477 (100.0%) |
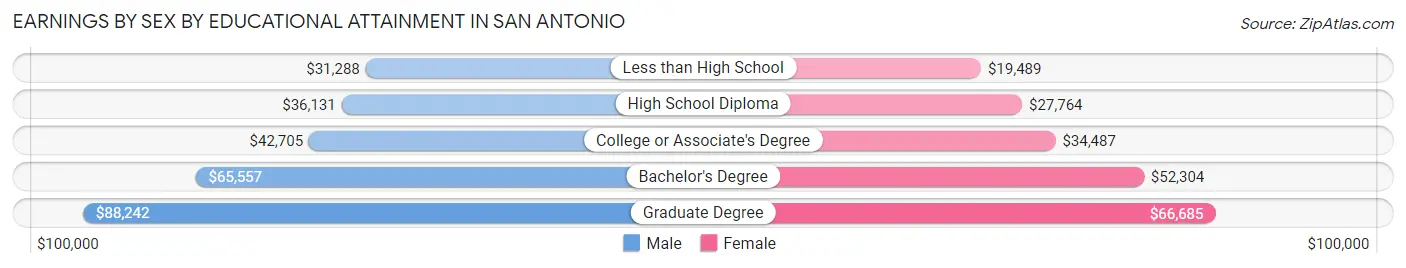
Earnings by Sex by Educational Attainment in San Antonio
Average earnings in San Antonio are $44,318 for men and $35,472 for women, a difference of 20.0%. Men with an educational attainment of graduate degree enjoy the highest average annual earnings of $88,242, while those with less than high school education earn the least with $31,288. Women with an educational attainment of graduate degree earn the most with the average annual earnings of $66,685, while those with less than high school education have the smallest earnings of $19,489.
| Educational Attainment | Male Income | Female Income |
| Less than High School | $31,288 | $19,489 |
| High School Diploma | $36,131 | $27,764 |
| College or Associate's Degree | $42,705 | $34,487 |
| Bachelor's Degree | $65,557 | $52,304 |
| Graduate Degree | $88,242 | $66,685 |
| Total | $44,318 | $35,472 |
Family Income in San Antonio
Family Income Brackets in San Antonio
According to the San Antonio family income data, there are 58,527 families falling into the $50,000 to $74,999 income range, which is the most common income bracket and makes up 17.5% of all families. Conversely, the $10,000 to $14,999 income bracket is the least frequent group with only 9,364 families (2.8%) belonging to this category.
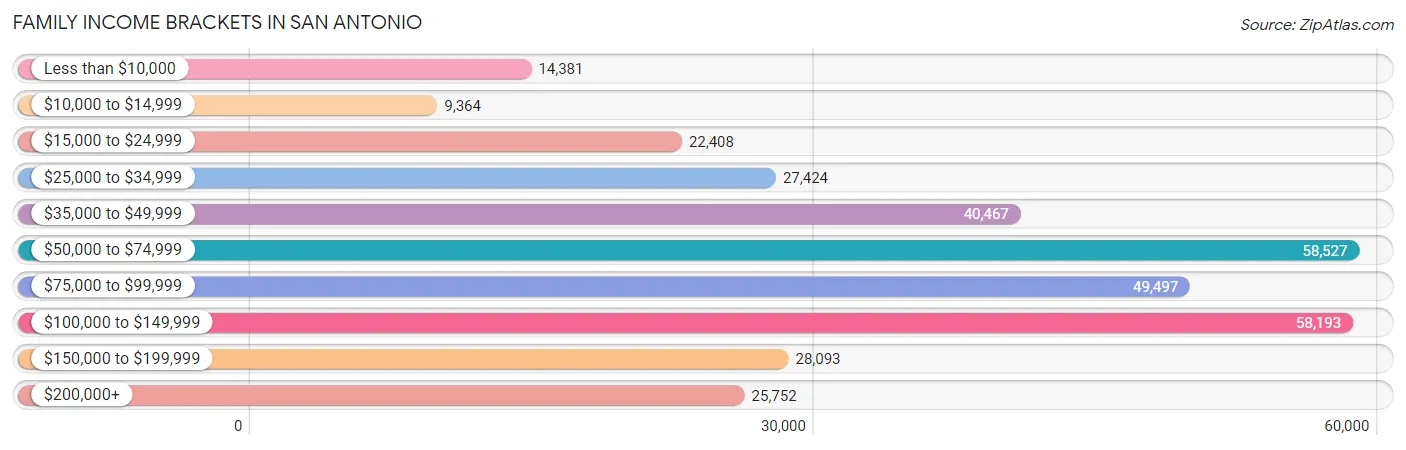
| Income Bracket | # Families | % Families |
| Less than $10,000 | 14,381 | 4.3% |
| $10,000 to $14,999 | 9,364 | 2.8% |
| $15,000 to $24,999 | 22,408 | 6.7% |
| $25,000 to $34,999 | 27,424 | 8.2% |
| $35,000 to $49,999 | 40,467 | 12.1% |
| $50,000 to $74,999 | 58,527 | 17.5% |
| $75,000 to $99,999 | 49,497 | 14.8% |
| $100,000 to $149,999 | 58,193 | 17.4% |
| $150,000 to $199,999 | 28,093 | 8.4% |
| $200,000+ | 25,752 | 7.7% |
Family Income by Famaliy Size in San Antonio
4-person families (62,925 | 18.8%) account for the highest median family income in San Antonio with $83,578 per family, while 2-person families (138,294 | 41.3%) have the highest median income of $33,530 per family member.
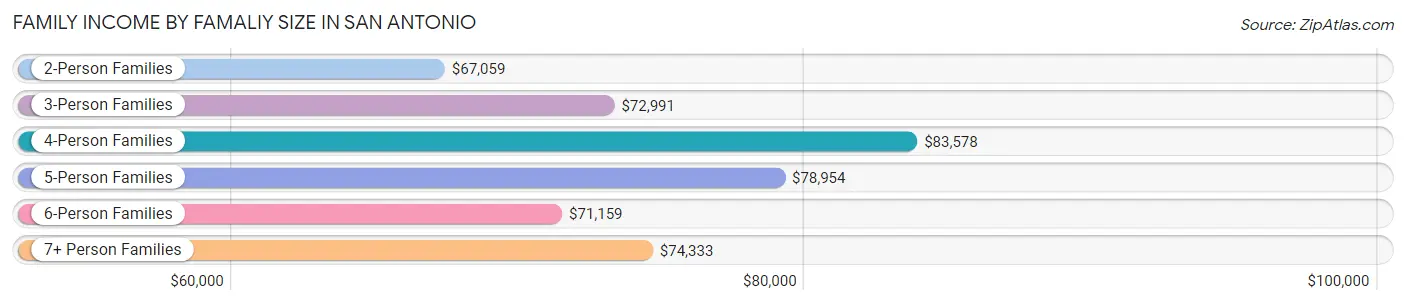
| Income Bracket | # Families | Median Income |
| 2-Person Families | 138,294 (41.3%) | $67,059 |
| 3-Person Families | 78,845 (23.6%) | $72,991 |
| 4-Person Families | 62,925 (18.8%) | $83,578 |
| 5-Person Families | 33,399 (10.0%) | $78,954 |
| 6-Person Families | 13,082 (3.9%) | $71,159 |
| 7+ Person Families | 7,896 (2.4%) | $74,333 |
| Total | 334,441 (100.0%) | $72,452 |
Family Income by Number of Earners in San Antonio
The median family income in San Antonio is $72,452, with families comprising 3+ earners (41,800) having the highest median family income of $118,336, while families with no earners (39,302) have the lowest median family income of $33,700, accounting for 12.5% and 11.7% of families, respectively.
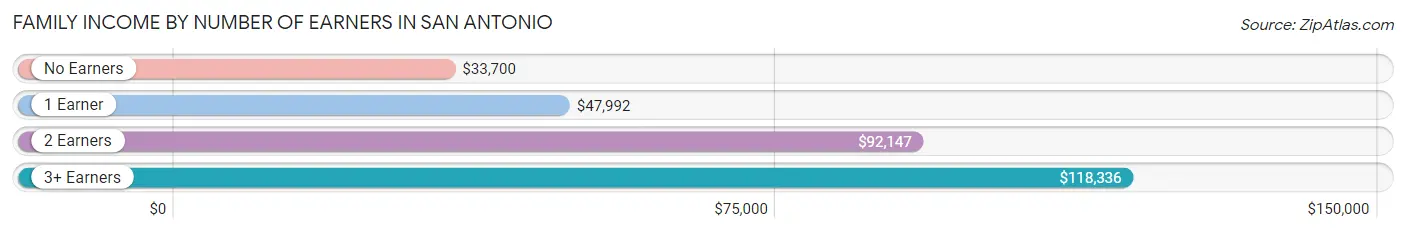
| Number of Earners | # Families | Median Income |
| No Earners | 39,302 (11.7%) | $33,700 |
| 1 Earner | 122,139 (36.5%) | $47,992 |
| 2 Earners | 131,200 (39.2%) | $92,147 |
| 3+ Earners | 41,800 (12.5%) | $118,336 |
| Total | 334,441 (100.0%) | $72,452 |
Household Income in San Antonio
Household Income Brackets in San Antonio
With 100,421 households falling in the category, the $50,000 to $74,999 income range is the most frequent in San Antonio, accounting for 18.5% of all households. In contrast, only 26,055 households (4.8%) fall into the $10,000 to $14,999 income bracket, making it the least populous group.
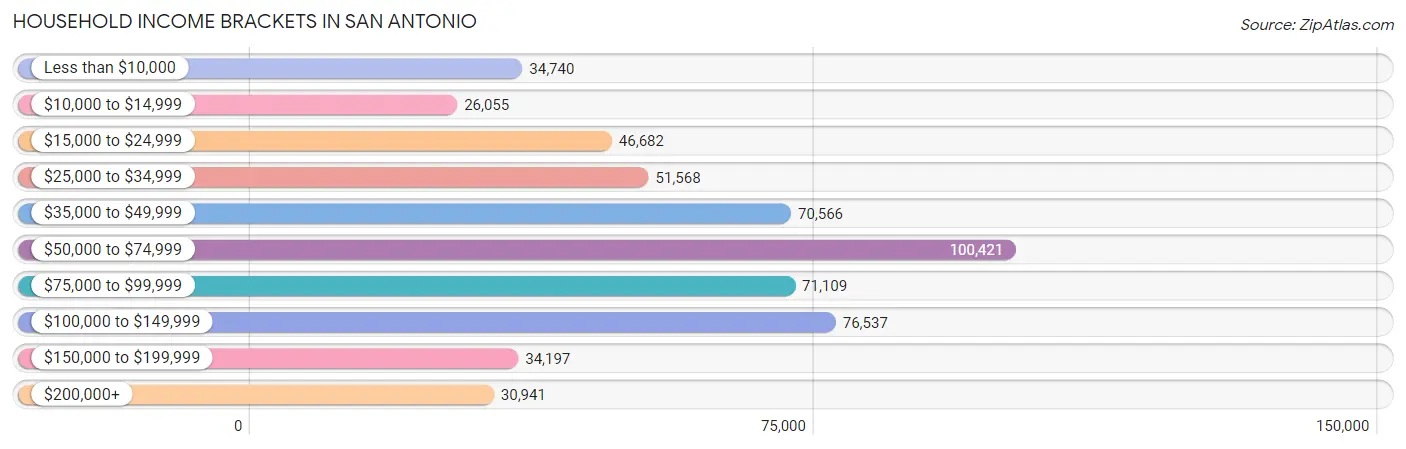
| Income Bracket | # Households | % Households |
| Less than $10,000 | 34,740 | 6.4% |
| $10,000 to $14,999 | 26,055 | 4.8% |
| $15,000 to $24,999 | 46,682 | 8.6% |
| $25,000 to $34,999 | 51,568 | 9.5% |
| $35,000 to $49,999 | 70,566 | 13.0% |
| $50,000 to $74,999 | 100,421 | 18.5% |
| $75,000 to $99,999 | 71,109 | 13.1% |
| $100,000 to $149,999 | 76,537 | 14.1% |
| $150,000 to $199,999 | 34,197 | 6.3% |
| $200,000+ | 30,941 | 5.7% |
Household Income by Householder Age in San Antonio
The median household income in San Antonio is $59,593, with the highest median household income of $68,850 found in the 45 to 64 years age bracket for the primary householder. A total of 183,798 households (33.9%) fall into this category. Meanwhile, the 15 to 24 years age bracket for the primary householder has the lowest median household income of $36,615, with 31,687 households (5.8%) in this group.
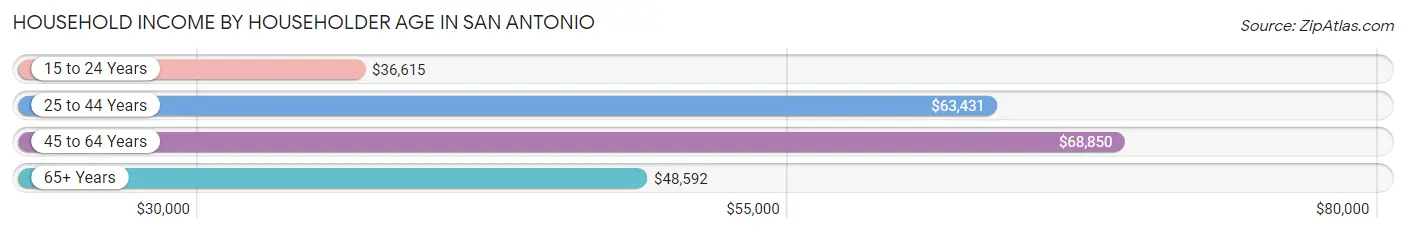
| Income Bracket | # Households | Median Income |
| 15 to 24 Years | 31,687 (5.8%) | $36,615 |
| 25 to 44 Years | 210,099 (38.7%) | $63,431 |
| 45 to 64 Years | 183,798 (33.9%) | $68,850 |
| 65+ Years | 117,233 (21.6%) | $48,592 |
| Total | 542,817 (100.0%) | $59,593 |
Poverty in San Antonio
Income Below Poverty by Sex and Age in San Antonio
With 16.4% poverty level for males and 19.0% for females among the residents of San Antonio, under 5 year old males and 5 year old females are the most vulnerable to poverty, with 13,409 males (28.9%) and 2,788 females (30.0%) in their respective age groups living below the poverty level.
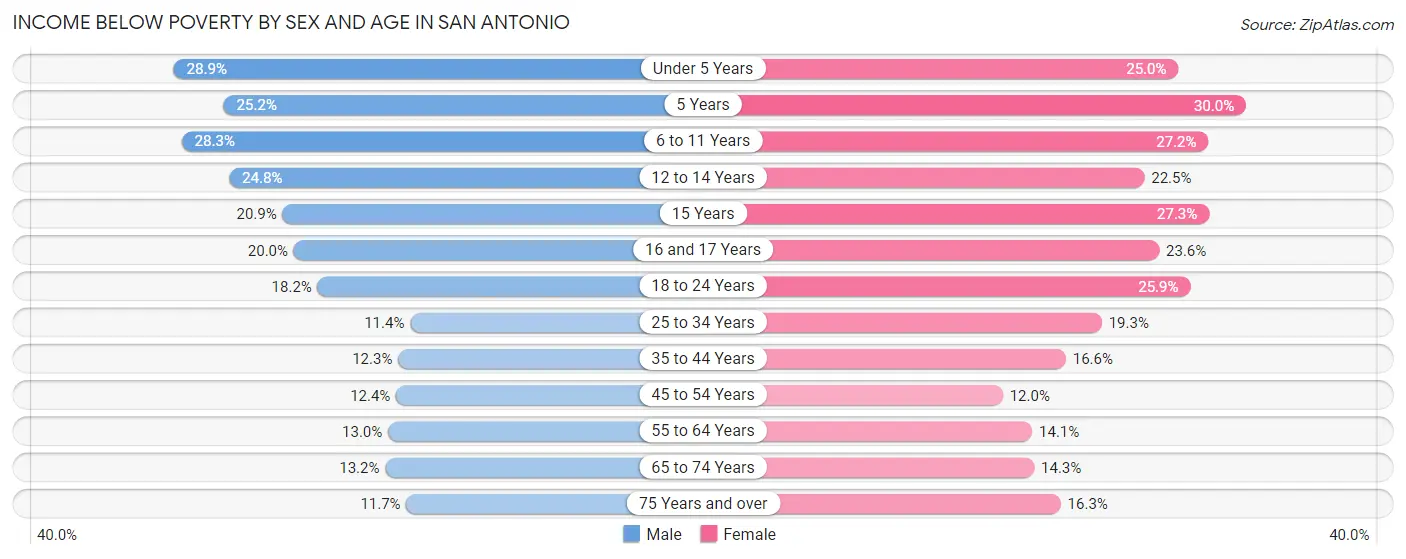
| Age Bracket | Male | Female |
| Under 5 Years | 13,409 (28.9%) | 11,284 (25.0%) |
| 5 Years | 2,406 (25.2%) | 2,788 (30.0%) |
| 6 to 11 Years | 16,853 (28.3%) | 14,594 (27.2%) |
| 12 to 14 Years | 7,253 (24.8%) | 6,598 (22.5%) |
| 15 Years | 2,200 (20.8%) | 2,763 (27.3%) |
| 16 and 17 Years | 4,100 (20.0%) | 4,668 (23.6%) |
| 18 to 24 Years | 13,934 (18.2%) | 18,877 (25.9%) |
| 25 to 34 Years | 13,515 (11.4%) | 21,860 (19.3%) |
| 35 to 44 Years | 12,137 (12.3%) | 15,996 (16.6%) |
| 45 to 54 Years | 10,342 (12.4%) | 10,165 (11.9%) |
| 55 to 64 Years | 9,586 (13.0%) | 11,037 (14.1%) |
| 65 to 74 Years | 6,476 (13.2%) | 8,574 (14.3%) |
| 75 Years and over | 3,289 (11.7%) | 7,097 (16.3%) |
| Total | 115,500 (16.4%) | 136,301 (19.0%) |
Income Above Poverty by Sex and Age in San Antonio
According to the poverty statistics in San Antonio, males aged 25 to 34 years and females aged 45 to 54 years are the age groups that are most secure financially, with 88.6% of males and 88.0% of females in these age groups living above the poverty line.
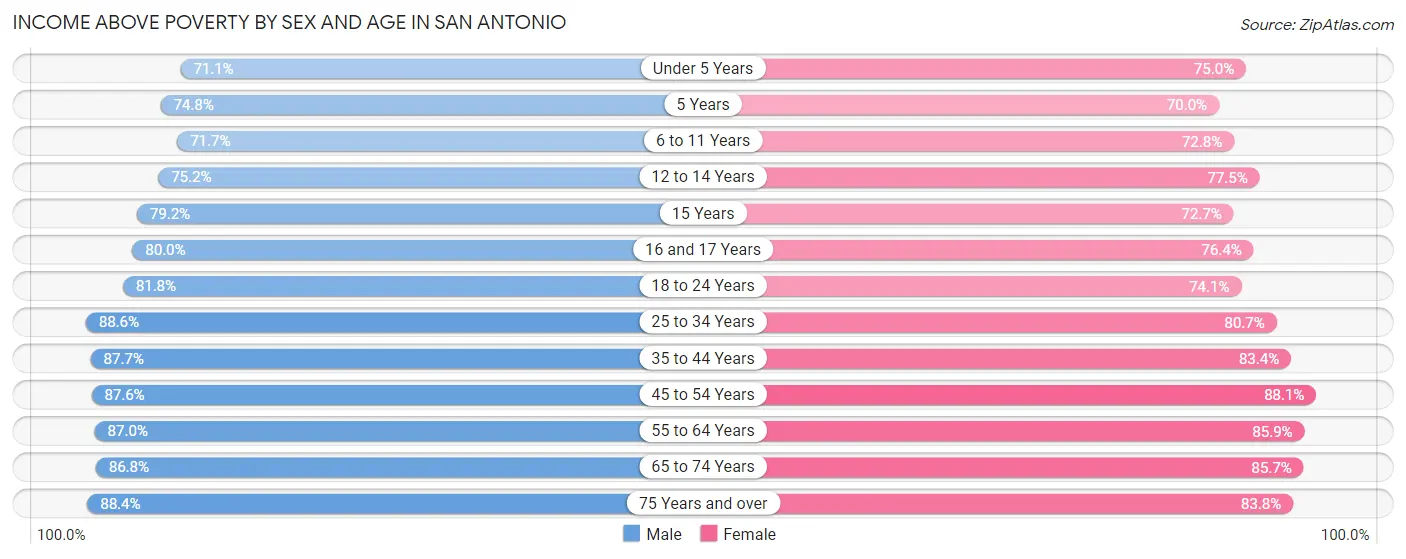
| Age Bracket | Male | Female |
| Under 5 Years | 32,940 (71.1%) | 33,884 (75.0%) |
| 5 Years | 7,131 (74.8%) | 6,502 (70.0%) |
| 6 to 11 Years | 42,606 (71.7%) | 39,049 (72.8%) |
| 12 to 14 Years | 21,983 (75.2%) | 22,781 (77.5%) |
| 15 Years | 8,353 (79.1%) | 7,369 (72.7%) |
| 16 and 17 Years | 16,385 (80.0%) | 15,146 (76.4%) |
| 18 to 24 Years | 62,441 (81.8%) | 54,095 (74.1%) |
| 25 to 34 Years | 105,367 (88.6%) | 91,394 (80.7%) |
| 35 to 44 Years | 86,834 (87.7%) | 80,191 (83.4%) |
| 45 to 54 Years | 73,004 (87.6%) | 74,872 (88.0%) |
| 55 to 64 Years | 64,116 (87.0%) | 67,068 (85.9%) |
| 65 to 74 Years | 42,509 (86.8%) | 51,472 (85.7%) |
| 75 Years and over | 24,949 (88.3%) | 36,573 (83.8%) |
| Total | 588,618 (83.6%) | 580,396 (81.0%) |
Income Below Poverty Among Married-Couple Families in San Antonio
The poverty statistics for married-couple families in San Antonio show that 7.9% or 16,770 of the total 211,293 families live below the poverty line. Families with 5 or more children have the highest poverty rate of 40.3%, comprising of 833 families. On the other hand, families with no children have the lowest poverty rate of 5.0%, which includes 5,695 families.
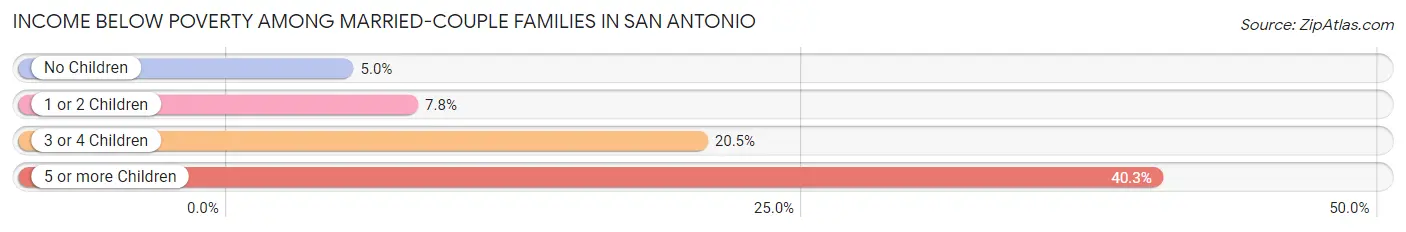
| Children | Above Poverty | Below Poverty |
| No Children | 107,521 (95.0%) | 5,695 (5.0%) |
| 1 or 2 Children | 68,651 (92.2%) | 5,843 (7.8%) |
| 3 or 4 Children | 17,116 (79.5%) | 4,399 (20.4%) |
| 5 or more Children | 1,235 (59.7%) | 833 (40.3%) |
| Total | 194,523 (92.1%) | 16,770 (7.9%) |
Income Below Poverty Among Single-Parent Households in San Antonio
According to the poverty data in San Antonio, 12.4% or 3,992 single-father households and 27.5% or 24,955 single-mother households are living below the poverty line. Among single-father households, those with 5 or more children have the highest poverty rate, with 68 households (41.7%) experiencing poverty. Likewise, among single-mother households, those with 5 or more children have the highest poverty rate, with 1,240 households (72.3%) falling below the poverty line.
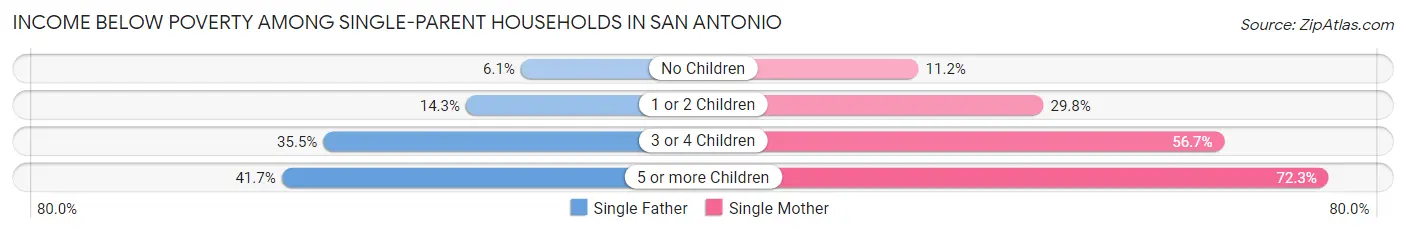
| Children | Single Father | Single Mother |
| No Children | 951 (6.1%) | 3,746 (11.2%) |
| 1 or 2 Children | 1,925 (14.3%) | 12,831 (29.8%) |
| 3 or 4 Children | 1,048 (35.5%) | 7,138 (56.7%) |
| 5 or more Children | 68 (41.7%) | 1,240 (72.3%) |
| Total | 3,992 (12.4%) | 24,955 (27.5%) |
Income Below Poverty Among Married-Couple vs Single-Parent Households in San Antonio
The poverty data for San Antonio shows that 16,770 of the married-couple family households (7.9%) and 28,947 of the single-parent households (23.5%) are living below the poverty level. Within the married-couple family households, those with 5 or more children have the highest poverty rate, with 833 households (40.3%) falling below the poverty line. Among the single-parent households, those with 5 or more children have the highest poverty rate, with 1,308 household (69.6%) living below poverty.
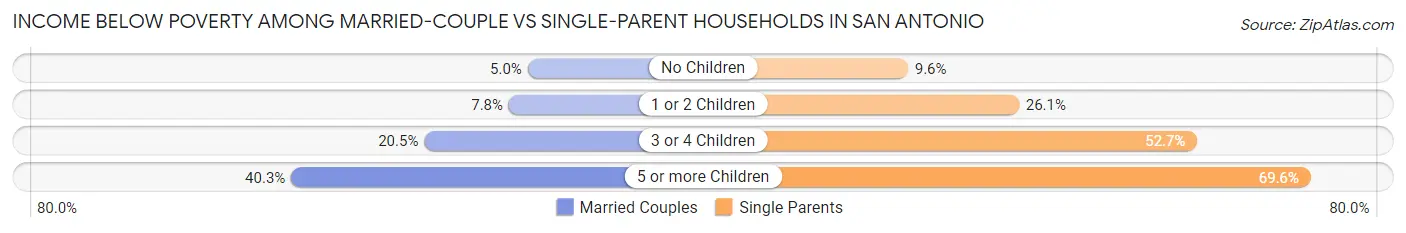
| Children | Married-Couple Families | Single-Parent Households |
| No Children | 5,695 (5.0%) | 4,697 (9.6%) |
| 1 or 2 Children | 5,843 (7.8%) | 14,756 (26.1%) |
| 3 or 4 Children | 4,399 (20.4%) | 8,186 (52.7%) |
| 5 or more Children | 833 (40.3%) | 1,308 (69.6%) |
| Total | 16,770 (7.9%) | 28,947 (23.5%) |
Race in San Antonio
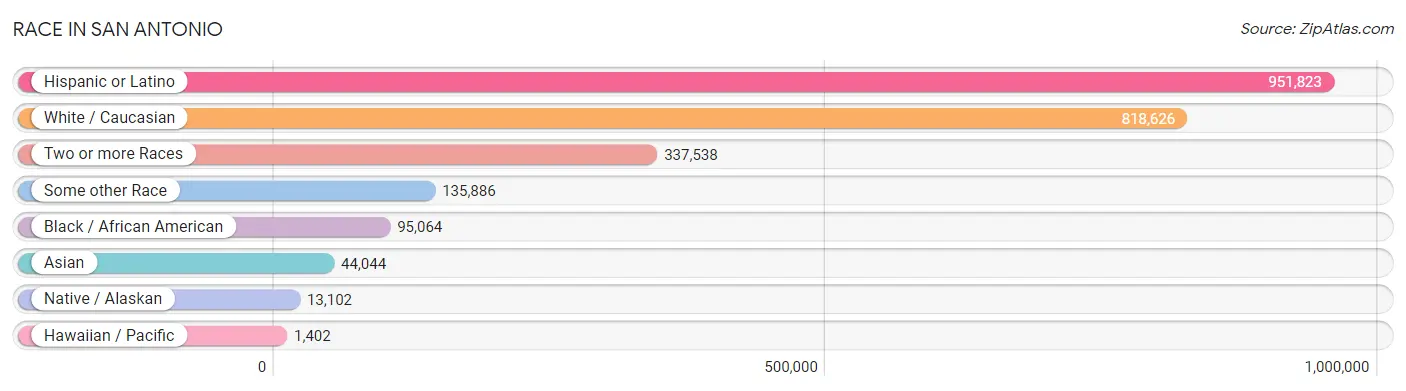
The most populous races in San Antonio are Hispanic or Latino (951,823 | 65.8%), White / Caucasian (818,626 | 56.6%), and Two or more Races (337,538 | 23.4%).
| Race | # Population | % Population |
| Asian | 44,044 | 3.0% |
| Black / African American | 95,064 | 6.6% |
| Hawaiian / Pacific | 1,402 | 0.1% |
| Hispanic or Latino | 951,823 | 65.8% |
| Native / Alaskan | 13,102 | 0.9% |
| White / Caucasian | 818,626 | 56.6% |
| Two or more Races | 337,538 | 23.4% |
| Some other Race | 135,886 | 9.4% |
| Total | 1,445,662 | 100.0% |
Ancestry in San Antonio
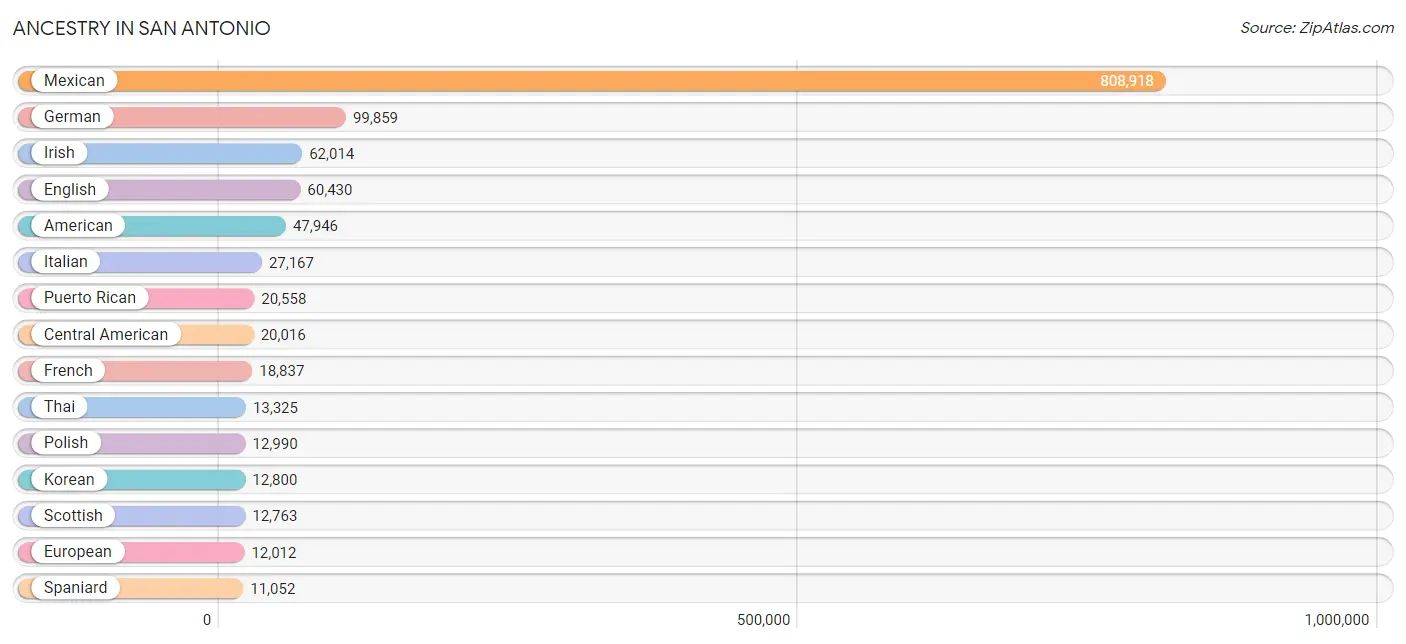
The most populous ancestries reported in San Antonio are Mexican (808,918 | 55.9%), German (99,859 | 6.9%), Irish (62,014 | 4.3%), English (60,430 | 4.2%), and American (47,946 | 3.3%), together accounting for 74.7% of all San Antonio residents.
| Ancestry | # Population | % Population |
| Afghan | 3,146 | 0.2% |
| African | 5,791 | 0.4% |
| Alaskan Athabascan | 7 | 0.0% |
| Albanian | 47 | 0.0% |
| Aleut | 11 | 0.0% |
| Alsatian | 278 | 0.0% |
| American | 47,946 | 3.3% |
| Apache | 1,529 | 0.1% |
| Arab | 9,554 | 0.7% |
| Argentinean | 1,241 | 0.1% |
| Armenian | 161 | 0.0% |
| Assyrian / Chaldean / Syriac | 8 | 0.0% |
| Australian | 121 | 0.0% |
| Austrian | 1,712 | 0.1% |
| Bahamian | 17 | 0.0% |
| Bangladeshi | 49 | 0.0% |
| Barbadian | 72 | 0.0% |
| Basque | 402 | 0.0% |
| Belgian | 736 | 0.1% |
| Belizean | 139 | 0.0% |
| Bermudan | 17 | 0.0% |
| Bhutanese | 4,530 | 0.3% |
| Blackfeet | 305 | 0.0% |
| Bolivian | 139 | 0.0% |
| Brazilian | 882 | 0.1% |
| British | 4,759 | 0.3% |
| British West Indian | 10 | 0.0% |
| Bulgarian | 164 | 0.0% |
| Burmese | 3,994 | 0.3% |
| Cajun | 249 | 0.0% |
| Cambodian | 178 | 0.0% |
| Canadian | 1,130 | 0.1% |
| Cape Verdean | 127 | 0.0% |
| Celtic | 135 | 0.0% |
| Central American | 20,016 | 1.4% |
| Central American Indian | 3,459 | 0.2% |
| Cherokee | 3,348 | 0.2% |
| Cheyenne | 12 | 0.0% |
| Chickasaw | 232 | 0.0% |
| Chilean | 378 | 0.0% |
| Chinese | 78 | 0.0% |
| Chippewa | 220 | 0.0% |
| Choctaw | 854 | 0.1% |
| Colombian | 3,921 | 0.3% |
| Comanche | 619 | 0.0% |
| Costa Rican | 621 | 0.0% |
| Creek | 191 | 0.0% |
| Croatian | 540 | 0.0% |
| Cuban | 5,166 | 0.4% |
| Czech | 4,369 | 0.3% |
| Czechoslovakian | 958 | 0.1% |
| Danish | 1,708 | 0.1% |
| Dominican | 1,336 | 0.1% |
| Dutch | 5,001 | 0.4% |
| Dutch West Indian | 24 | 0.0% |
| Eastern European | 1,790 | 0.1% |
| Ecuadorian | 1,052 | 0.1% |
| Egyptian | 756 | 0.1% |
| English | 60,430 | 4.2% |
| Ethiopian | 199 | 0.0% |
| European | 12,012 | 0.8% |
| Filipino | 378 | 0.0% |
| Finnish | 577 | 0.0% |
| French | 18,837 | 1.3% |
| French American Indian | 113 | 0.0% |
| French Canadian | 1,912 | 0.1% |
| German | 99,859 | 6.9% |
| German Russian | 124 | 0.0% |
| Ghanaian | 246 | 0.0% |
| Greek | 2,151 | 0.2% |
| Guamanian / Chamorro | 1,114 | 0.1% |
| Guatemalan | 3,113 | 0.2% |
| Guyanese | 220 | 0.0% |
| Haitian | 606 | 0.0% |
| Hmong | 23 | 0.0% |
| Honduran | 6,813 | 0.5% |
| Hopi | 35 | 0.0% |
| Hungarian | 1,612 | 0.1% |
| Icelander | 353 | 0.0% |
| Indian (Asian) | 8,252 | 0.6% |
| Indonesian | 868 | 0.1% |
| Inupiat | 48 | 0.0% |
| Iranian | 1,605 | 0.1% |
| Iraqi | 1,459 | 0.1% |
| Irish | 62,014 | 4.3% |
| Iroquois | 201 | 0.0% |
| Israeli | 173 | 0.0% |
| Italian | 27,167 | 1.9% |
| Jamaican | 2,032 | 0.1% |
| Japanese | 102 | 0.0% |
| Jordanian | 430 | 0.0% |
| Kenyan | 81 | 0.0% |
| Kiowa | 39 | 0.0% |
| Korean | 12,800 | 0.9% |
| Laotian | 317 | 0.0% |
| Latvian | 27 | 0.0% |
| Lebanese | 1,737 | 0.1% |
| Liberian | 109 | 0.0% |
| Lithuanian | 576 | 0.0% |
| Lumbee | 9 | 0.0% |
| Luxembourger | 50 | 0.0% |
| Macedonian | 154 | 0.0% |
| Malaysian | 191 | 0.0% |
| Mexican | 808,918 | 55.9% |
| Mexican American Indian | 5,089 | 0.4% |
| Mongolian | 55 | 0.0% |
| Moroccan | 414 | 0.0% |
| Native Hawaiian | 1,307 | 0.1% |
| Navajo | 808 | 0.1% |
| New Zealander | 76 | 0.0% |
| Nicaraguan | 1,658 | 0.1% |
| Nigerian | 1,513 | 0.1% |
| Northern European | 1,238 | 0.1% |
| Norwegian | 5,166 | 0.4% |
| Okinawan | 23 | 0.0% |
| Ottawa | 10 | 0.0% |
| Pakistani | 1,199 | 0.1% |
| Palestinian | 514 | 0.0% |
| Panamanian | 1,616 | 0.1% |
| Paraguayan | 151 | 0.0% |
| Pennsylvania German | 53 | 0.0% |
| Peruvian | 1,825 | 0.1% |
| Pima | 26 | 0.0% |
| Polish | 12,990 | 0.9% |
| Portuguese | 2,997 | 0.2% |
| Potawatomi | 99 | 0.0% |
| Pueblo | 89 | 0.0% |
| Puerto Rican | 20,558 | 1.4% |
| Romanian | 1,699 | 0.1% |
| Russian | 3,425 | 0.2% |
| Salvadoran | 6,109 | 0.4% |
| Samoan | 557 | 0.0% |
| Scandinavian | 1,990 | 0.1% |
| Scotch-Irish | 7,651 | 0.5% |
| Scottish | 12,763 | 0.9% |
| Seminole | 136 | 0.0% |
| Senegalese | 40 | 0.0% |
| Serbian | 185 | 0.0% |
| Shoshone | 54 | 0.0% |
| Sierra Leonean | 65 | 0.0% |
| Sioux | 100 | 0.0% |
| Slavic | 218 | 0.0% |
| Slovak | 532 | 0.0% |
| Slovene | 227 | 0.0% |
| Somali | 423 | 0.0% |
| South African | 182 | 0.0% |
| South American | 10,447 | 0.7% |
| South American Indian | 302 | 0.0% |
| Soviet Union | 22 | 0.0% |
| Spaniard | 11,052 | 0.8% |
| Spanish | 6,395 | 0.4% |
| Spanish American | 115 | 0.0% |
| Spanish American Indian | 73 | 0.0% |
| Sri Lankan | 6,637 | 0.5% |
| Subsaharan African | 9,694 | 0.7% |
| Sudanese | 132 | 0.0% |
| Swedish | 4,582 | 0.3% |
| Swiss | 1,563 | 0.1% |
| Syrian | 484 | 0.0% |
| Thai | 13,325 | 0.9% |
| Tlingit-Haida | 8 | 0.0% |
| Tohono O'Odham | 14 | 0.0% |
| Trinidadian and Tobagonian | 120 | 0.0% |
| Turkish | 882 | 0.1% |
| U.S. Virgin Islander | 19 | 0.0% |
| Ugandan | 27 | 0.0% |
| Ukrainian | 1,368 | 0.1% |
| Uruguayan | 67 | 0.0% |
| Ute | 18 | 0.0% |
| Venezuelan | 1,478 | 0.1% |
| Vietnamese | 479 | 0.0% |
| Welsh | 4,603 | 0.3% |
| West Indian | 470 | 0.0% |
| Yaqui | 234 | 0.0% |
| Yugoslavian | 270 | 0.0% |
| Yuman | 8 | 0.0% | View All 176 Rows |
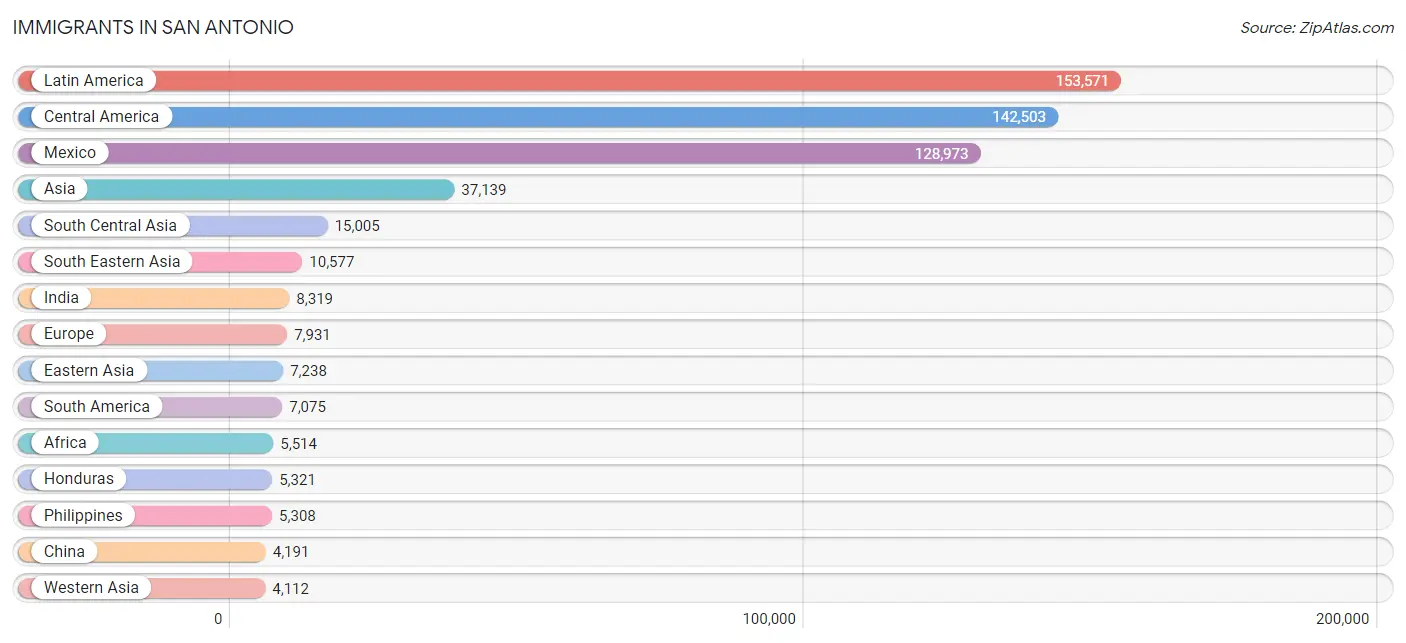
Immigrants in San Antonio
The most numerous immigrant groups reported in San Antonio came from Latin America (153,571 | 10.6%), Central America (142,503 | 9.9%), Mexico (128,973 | 8.9%), Asia (37,139 | 2.6%), and South Central Asia (15,005 | 1.0%), together accounting for 33.0% of all San Antonio residents.
| Immigration Origin | # Population | % Population |
| Afghanistan | 3,379 | 0.2% |
| Africa | 5,514 | 0.4% |
| Argentina | 711 | 0.1% |
| Asia | 37,139 | 2.6% |
| Australia | 220 | 0.0% |
| Austria | 152 | 0.0% |
| Azores | 7 | 0.0% |
| Bahamas | 4 | 0.0% |
| Bangladesh | 715 | 0.1% |
| Barbados | 48 | 0.0% |
| Belarus | 23 | 0.0% |
| Belgium | 9 | 0.0% |
| Belize | 105 | 0.0% |
| Bolivia | 83 | 0.0% |
| Bosnia and Herzegovina | 20 | 0.0% |
| Brazil | 746 | 0.1% |
| Bulgaria | 114 | 0.0% |
| Cambodia | 36 | 0.0% |
| Cameroon | 151 | 0.0% |
| Canada | 1,301 | 0.1% |
| Caribbean | 3,993 | 0.3% |
| Central America | 142,503 | 9.9% |
| Chile | 181 | 0.0% |
| China | 4,191 | 0.3% |
| Colombia | 2,325 | 0.2% |
| Congo | 447 | 0.0% |
| Costa Rica | 319 | 0.0% |
| Cuba | 2,255 | 0.2% |
| Czechoslovakia | 107 | 0.0% |
| Denmark | 71 | 0.0% |
| Dominican Republic | 486 | 0.0% |
| Eastern Africa | 974 | 0.1% |
| Eastern Asia | 7,238 | 0.5% |
| Eastern Europe | 2,449 | 0.2% |
| Ecuador | 445 | 0.0% |
| Egypt | 773 | 0.1% |
| El Salvador | 3,671 | 0.3% |
| England | 698 | 0.1% |
| Eritrea | 229 | 0.0% |
| Ethiopia | 75 | 0.0% |
| Europe | 7,931 | 0.5% |
| Fiji | 30 | 0.0% |
| France | 457 | 0.0% |
| Germany | 1,855 | 0.1% |
| Ghana | 193 | 0.0% |
| Greece | 49 | 0.0% |
| Guatemala | 2,330 | 0.2% |
| Guyana | 48 | 0.0% |
| Haiti | 186 | 0.0% |
| Honduras | 5,321 | 0.4% |
| Hong Kong | 215 | 0.0% |
| Hungary | 79 | 0.0% |
| India | 8,319 | 0.6% |
| Indonesia | 264 | 0.0% |
| Iran | 1,294 | 0.1% |
| Iraq | 1,932 | 0.1% |
| Ireland | 312 | 0.0% |
| Israel | 181 | 0.0% |
| Italy | 248 | 0.0% |
| Jamaica | 711 | 0.1% |
| Japan | 1,103 | 0.1% |
| Jordan | 377 | 0.0% |
| Kenya | 279 | 0.0% |
| Korea | 1,944 | 0.1% |
| Kuwait | 34 | 0.0% |
| Laos | 105 | 0.0% |
| Latin America | 153,571 | 10.6% |
| Latvia | 25 | 0.0% |
| Lebanon | 320 | 0.0% |
| Liberia | 118 | 0.0% |
| Lithuania | 32 | 0.0% |
| Malaysia | 208 | 0.0% |
| Mexico | 128,973 | 8.9% |
| Middle Africa | 964 | 0.1% |
| Moldova | 20 | 0.0% |
| Morocco | 270 | 0.0% |
| Nepal | 233 | 0.0% |
| Netherlands | 79 | 0.0% |
| Nicaragua | 928 | 0.1% |
| Nigeria | 776 | 0.1% |
| North Macedonia | 14 | 0.0% |
| Northern Africa | 1,816 | 0.1% |
| Northern Europe | 1,872 | 0.1% |
| Norway | 16 | 0.0% |
| Oceania | 564 | 0.0% |
| Pakistan | 742 | 0.1% |
| Panama | 856 | 0.1% |
| Peru | 1,163 | 0.1% |
| Philippines | 5,308 | 0.4% |
| Poland | 272 | 0.0% |
| Portugal | 54 | 0.0% |
| Romania | 357 | 0.0% |
| Russia | 817 | 0.1% |
| Saudi Arabia | 514 | 0.0% |
| Scotland | 98 | 0.0% |
| Senegal | 73 | 0.0% |
| Serbia | 79 | 0.0% |
| Sierra Leone | 44 | 0.0% |
| Singapore | 46 | 0.0% |
| Somalia | 197 | 0.0% |
| South Africa | 235 | 0.0% |
| South America | 7,075 | 0.5% |
| South Central Asia | 15,005 | 1.0% |
| South Eastern Asia | 10,577 | 0.7% |
| Southern Europe | 971 | 0.1% |
| Spain | 620 | 0.0% |
| Sri Lanka | 98 | 0.0% |
| Sudan | 399 | 0.0% |
| Sweden | 54 | 0.0% |
| Switzerland | 32 | 0.0% |
| Syria | 56 | 0.0% |
| Taiwan | 485 | 0.0% |
| Thailand | 683 | 0.1% |
| Trinidad and Tobago | 289 | 0.0% |
| Turkey | 576 | 0.0% |
| Uganda | 87 | 0.0% |
| Ukraine | 258 | 0.0% |
| Uruguay | 52 | 0.0% |
| Uzbekistan | 18 | 0.0% |
| Venezuela | 1,238 | 0.1% |
| Vietnam | 3,058 | 0.2% |
| Western Africa | 1,278 | 0.1% |
| Western Asia | 4,112 | 0.3% |
| Western Europe | 2,584 | 0.2% |
| Zaire | 354 | 0.0% |
| Zimbabwe | 26 | 0.0% | View All 126 Rows |
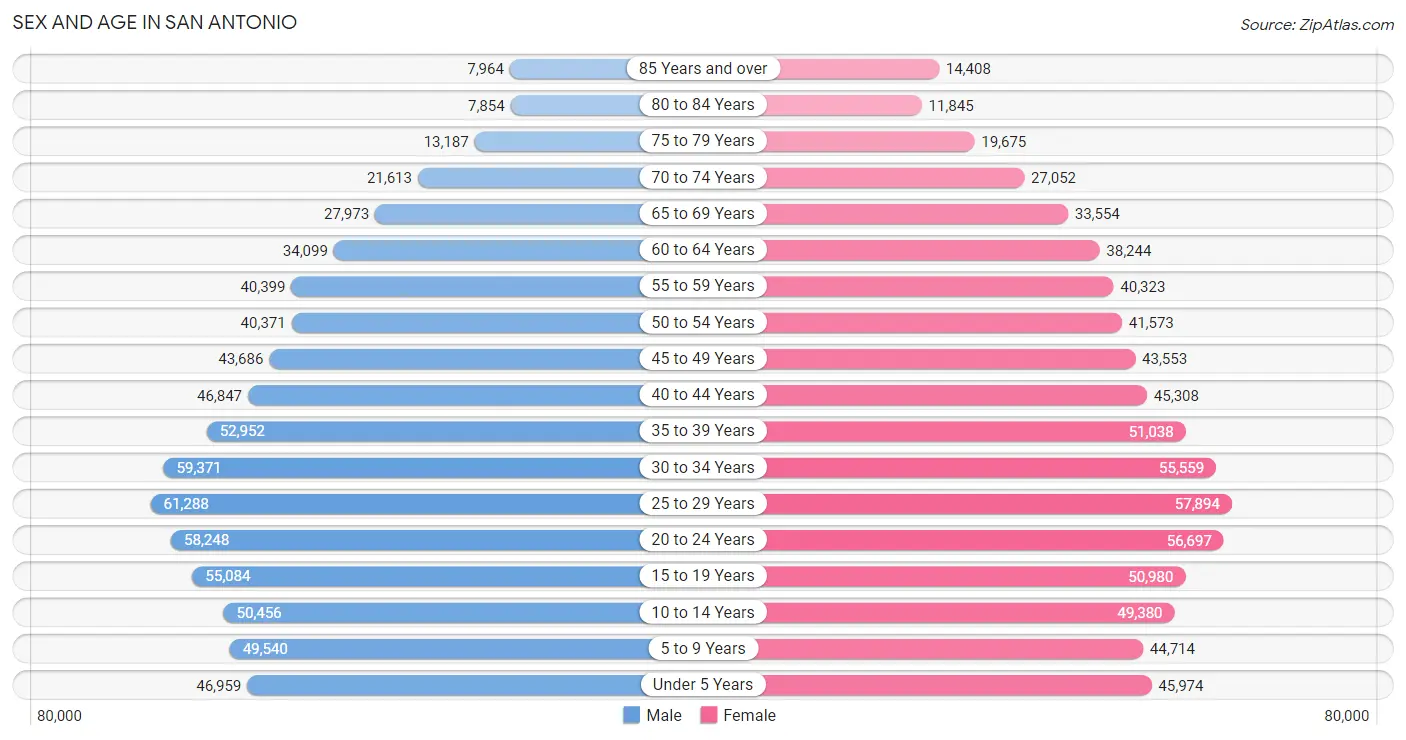
Sex and Age in San Antonio
Sex and Age in San Antonio
The most populous age groups in San Antonio are 25 to 29 Years (61,288 | 8.5%) for men and 25 to 29 Years (57,894 | 8.0%) for women.
| Age Bracket | Male | Female |
| Under 5 Years | 46,959 (6.5%) | 45,974 (6.3%) |
| 5 to 9 Years | 49,540 (6.9%) | 44,714 (6.1%) |
| 10 to 14 Years | 50,456 (7.0%) | 49,380 (6.8%) |
| 15 to 19 Years | 55,084 (7.7%) | 50,980 (7.0%) |
| 20 to 24 Years | 58,248 (8.1%) | 56,697 (7.8%) |
| 25 to 29 Years | 61,288 (8.5%) | 57,894 (8.0%) |
| 30 to 34 Years | 59,371 (8.3%) | 55,559 (7.6%) |
| 35 to 39 Years | 52,952 (7.4%) | 51,038 (7.0%) |
| 40 to 44 Years | 46,847 (6.5%) | 45,308 (6.2%) |
| 45 to 49 Years | 43,686 (6.1%) | 43,553 (6.0%) |
| 50 to 54 Years | 40,371 (5.6%) | 41,573 (5.7%) |
| 55 to 59 Years | 40,399 (5.6%) | 40,323 (5.5%) |
| 60 to 64 Years | 34,099 (4.8%) | 38,244 (5.2%) |
| 65 to 69 Years | 27,973 (3.9%) | 33,554 (4.6%) |
| 70 to 74 Years | 21,613 (3.0%) | 27,052 (3.7%) |
| 75 to 79 Years | 13,187 (1.8%) | 19,675 (2.7%) |
| 80 to 84 Years | 7,854 (1.1%) | 11,845 (1.6%) |
| 85 Years and over | 7,964 (1.1%) | 14,408 (2.0%) |
| Total | 717,891 (100.0%) | 727,771 (100.0%) |
Families and Households in San Antonio
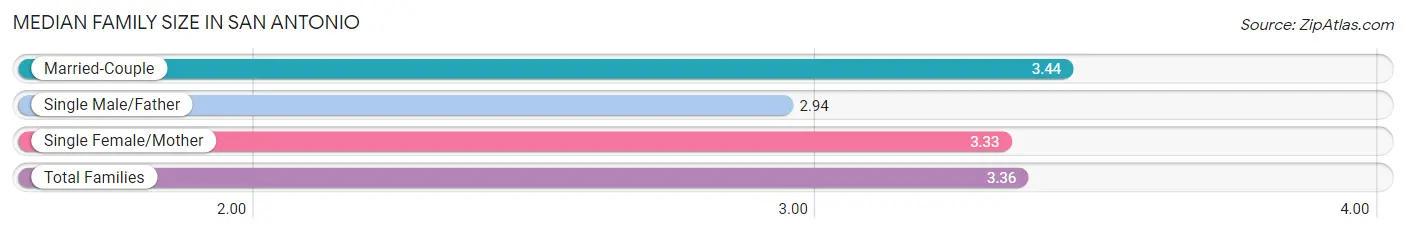
Median Family Size in San Antonio
The median family size in San Antonio is 3.36 persons per family, with married-couple families (211,293 | 63.2%) accounting for the largest median family size of 3.44 persons per family. On the other hand, single male/father families (32,250 | 9.6%) represent the smallest median family size with 2.94 persons per family.
| Family Type | # Families | Family Size |
| Married-Couple | 211,293 (63.2%) | 3.44 |
| Single Male/Father | 32,250 (9.6%) | 2.94 |
| Single Female/Mother | 90,898 (27.2%) | 3.33 |
| Total Families | 334,441 (100.0%) | 3.36 |
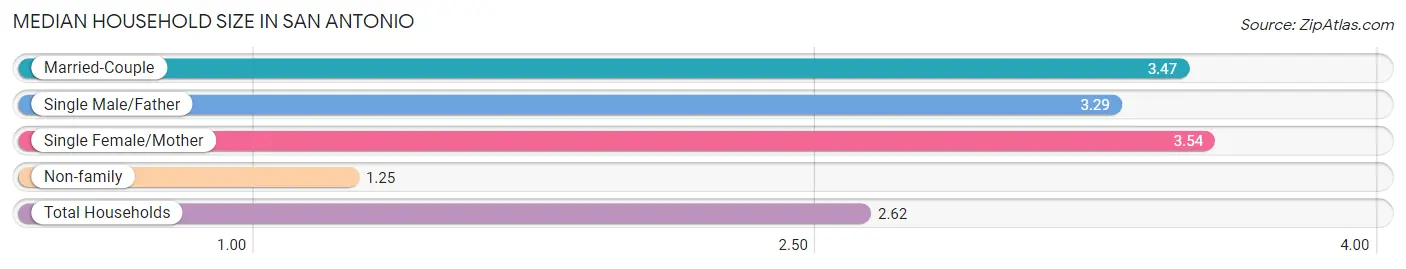
Median Household Size in San Antonio
The median household size in San Antonio is 2.62 persons per household, with single female/mother households (90,898 | 16.8%) accounting for the largest median household size of 3.54 persons per household. non-family households (208,376 | 38.4%) represent the smallest median household size with 1.25 persons per household.
| Household Type | # Households | Household Size |
| Married-Couple | 211,293 (38.9%) | 3.47 |
| Single Male/Father | 32,250 (5.9%) | 3.29 |
| Single Female/Mother | 90,898 (16.8%) | 3.54 |
| Non-family | 208,376 (38.4%) | 1.25 |
| Total Households | 542,817 (100.0%) | 2.62 |
Household Size by Marriage Status in San Antonio
Out of a total of 542,817 households in San Antonio, 334,441 (61.6%) are family households, while 208,376 (38.4%) are nonfamily households. The most numerous type of family households are 2-person households, comprising 127,251, and the most common type of nonfamily households are 1-person households, comprising 170,113.
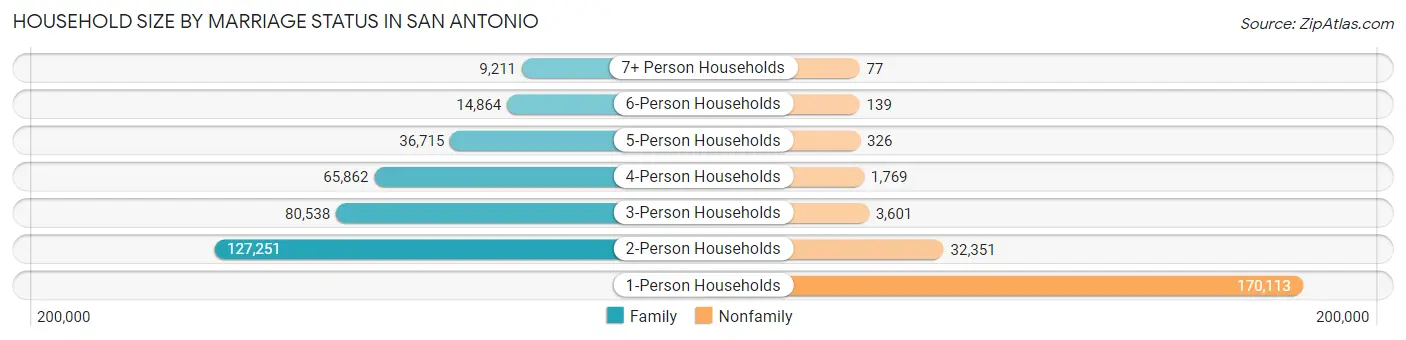
| Household Size | Family Households | Nonfamily Households |
| 1-Person Households | - | 170,113 (31.3%) |
| 2-Person Households | 127,251 (23.4%) | 32,351 (6.0%) |
| 3-Person Households | 80,538 (14.8%) | 3,601 (0.7%) |
| 4-Person Households | 65,862 (12.1%) | 1,769 (0.3%) |
| 5-Person Households | 36,715 (6.8%) | 326 (0.1%) |
| 6-Person Households | 14,864 (2.7%) | 139 (0.0%) |
| 7+ Person Households | 9,211 (1.7%) | 77 (0.0%) |
| Total | 334,441 (61.6%) | 208,376 (38.4%) |
Female Fertility in San Antonio
Fertility by Age in San Antonio
Average fertility rate in San Antonio is 55.0 births per 1,000 women. Women in the age bracket of 20 to 34 years have the highest fertility rate with 84.0 births per 1,000 women. Women in the age bracket of 20 to 34 years acount for 70.4% of all women with births.
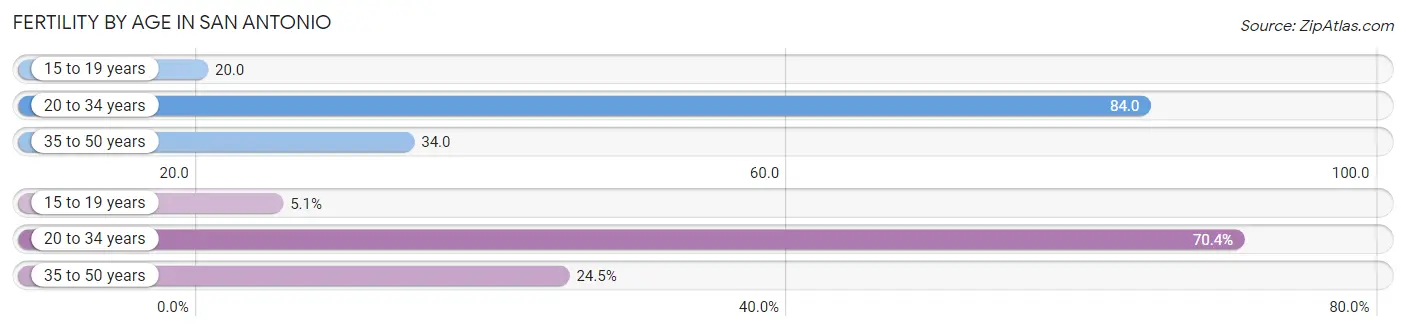
| Age Bracket | Women with Births | Births / 1,000 Women |
| 15 to 19 years | 1,034 (5.1%) | 20.0 |
| 20 to 34 years | 14,281 (70.4%) | 84.0 |
| 35 to 50 years | 4,978 (24.5%) | 34.0 |
| Total | 20,293 (100.0%) | 55.0 |
Fertility by Age by Marriage Status in San Antonio
59.7% of women with births (20,293) in San Antonio are married. The highest percentage of unmarried women with births falls into 15 to 19 years age bracket with 91.2% of them unmarried at the time of birth, while the lowest percentage of unmarried women with births belong to 35 to 50 years age bracket with 27.4% of them unmarried.
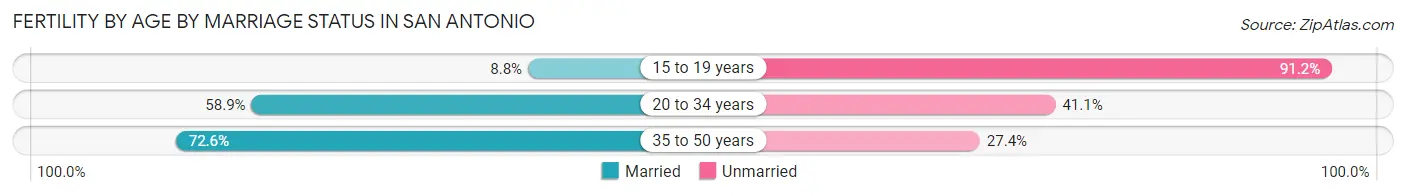
| Age Bracket | Married | Unmarried |
| 15 to 19 years | 91 (8.8%) | 943 (91.2%) |
| 20 to 34 years | 8,412 (58.9%) | 5,869 (41.1%) |
| 35 to 50 years | 3,614 (72.6%) | 1,364 (27.4%) |
| Total | 12,115 (59.7%) | 8,178 (40.3%) |
Fertility by Education in San Antonio
Average fertility rate in San Antonio is 55.0 births per 1,000 women. Women with the education attainment of graduate degree have the highest fertility rate of 64.0 births per 1,000 women, while women with the education attainment of less than high school have the lowest fertility at 41.0 births per 1,000 women. Women with the education attainment of college or associate's degree represent 34.0% of all women with births.
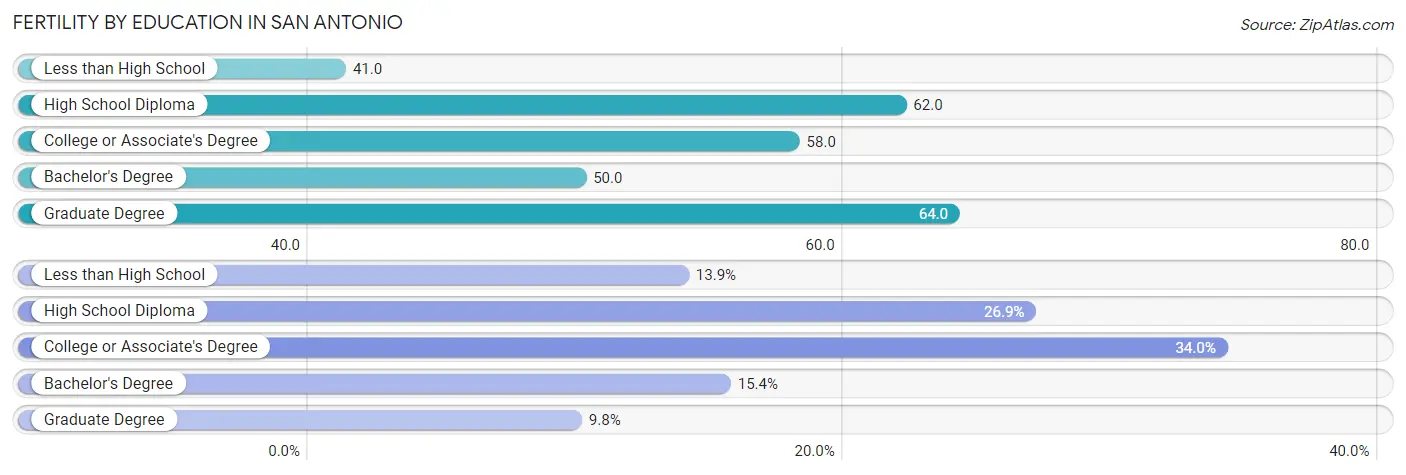
| Educational Attainment | Women with Births | Births / 1,000 Women |
| Less than High School | 2,810 (13.9%) | 41.0 |
| High School Diploma | 5,451 (26.9%) | 62.0 |
| College or Associate's Degree | 6,906 (34.0%) | 58.0 |
| Bachelor's Degree | 3,129 (15.4%) | 50.0 |
| Graduate Degree | 1,997 (9.8%) | 64.0 |
| Total | 20,293 (100.0%) | 55.0 |
Fertility by Education by Marriage Status in San Antonio
40.3% of women with births in San Antonio are unmarried. Women with the educational attainment of graduate degree are most likely to be married with 89.0% of them married at childbirth, while women with the educational attainment of less than high school are least likely to be married with 55.2% of them unmarried at childbirth.
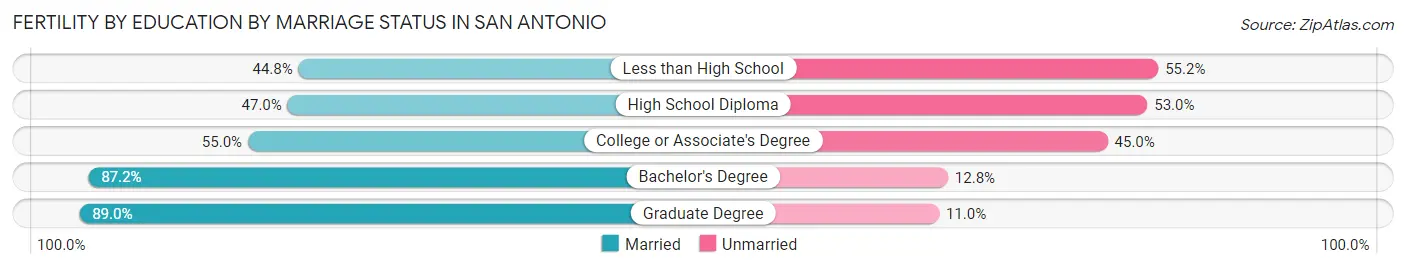
| Educational Attainment | Married | Unmarried |
| Less than High School | 1,259 (44.8%) | 1,551 (55.2%) |
| High School Diploma | 2,562 (47.0%) | 2,889 (53.0%) |
| College or Associate's Degree | 3,798 (55.0%) | 3,108 (45.0%) |
| Bachelor's Degree | 2,728 (87.2%) | 401 (12.8%) |
| Graduate Degree | 1,777 (89.0%) | 220 (11.0%) |
| Total | 12,115 (59.7%) | 8,178 (40.3%) |
Employment Characteristics in San Antonio
Employment by Class of Employer in San Antonio
Among the 690,443 employed individuals in San Antonio, private company employees (480,691 | 69.6%), local government employees (45,434 | 6.6%), and not-for-profit organizations (44,002 | 6.4%) make up the most common classes of employment.
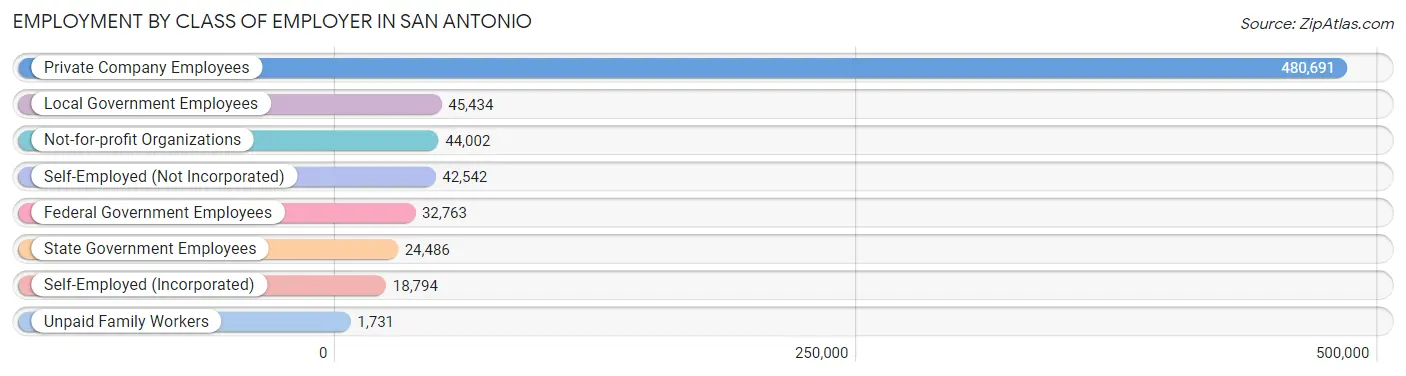
| Employer Class | # Employees | % Employees |
| Private Company Employees | 480,691 | 69.6% |
| Self-Employed (Incorporated) | 18,794 | 2.7% |
| Self-Employed (Not Incorporated) | 42,542 | 6.2% |
| Not-for-profit Organizations | 44,002 | 6.4% |
| Local Government Employees | 45,434 | 6.6% |
| State Government Employees | 24,486 | 3.5% |
| Federal Government Employees | 32,763 | 4.8% |
| Unpaid Family Workers | 1,731 | 0.3% |
| Total | 690,443 | 100.0% |
Employment Status by Age in San Antonio
According to the labor force statistics for San Antonio, out of the total population over 16 years of age (1,137,897), 65.8% or 748,736 individuals are in the labor force, with 5.9% or 44,175 of them unemployed. The age group with the highest labor force participation rate is 25 to 29 years, with 85.1% or 101,424 individuals in the labor force. Within the labor force, the 16 to 19 years age range has the highest percentage of unemployed individuals, with 16.8% or 5,275 of them being unemployed.
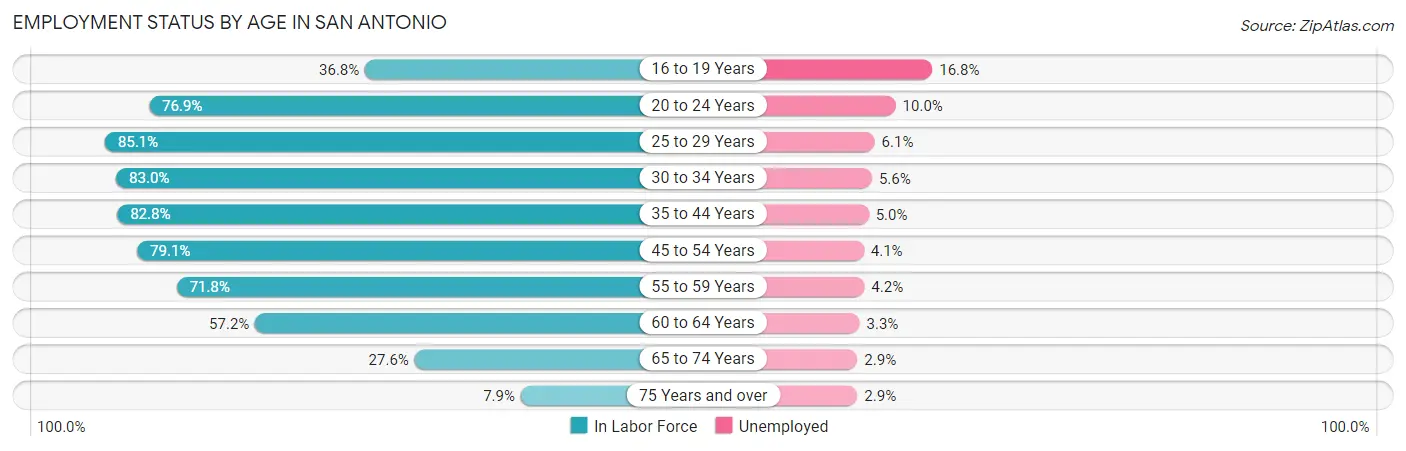
| Age Bracket | In Labor Force | Unemployed |
| 16 to 19 Years | 31,398 (36.8%) | 5,275 (16.8%) |
| 20 to 24 Years | 88,393 (76.9%) | 8,839 (10.0%) |
| 25 to 29 Years | 101,424 (85.1%) | 6,187 (6.1%) |
| 30 to 34 Years | 95,392 (83.0%) | 5,342 (5.6%) |
| 35 to 44 Years | 162,408 (82.8%) | 8,120 (5.0%) |
| 45 to 54 Years | 133,824 (79.1%) | 5,487 (4.1%) |
| 55 to 59 Years | 57,958 (71.8%) | 2,434 (4.2%) |
| 60 to 64 Years | 41,380 (57.2%) | 1,366 (3.3%) |
| 65 to 74 Years | 30,413 (27.6%) | 882 (2.9%) |
| 75 Years and over | 5,920 (7.9%) | 172 (2.9%) |
| Total | 748,736 (65.8%) | 44,175 (5.9%) |
Employment Status by Educational Attainment in San Antonio
According to labor force statistics for San Antonio, 78.7% of individuals (592,221) out of the total population between 25 and 64 years of age (752,505) are in the labor force, with 4.9% or 29,019 of them being unemployed. The group with the highest labor force participation rate are those with the educational attainment of bachelor's degree or higher, with 87.7% or 187,440 individuals in the labor force. Within the labor force, individuals with high school diploma education have the highest percentage of unemployment, with 6.4% or 9,242 of them being unemployed.
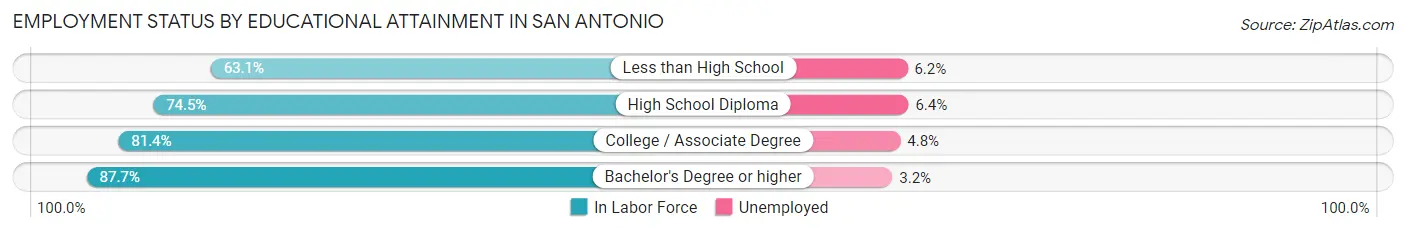
| Educational Attainment | In Labor Force | Unemployed |
| Less than High School | 69,817 (63.1%) | 6,860 (6.2%) |
| High School Diploma | 144,413 (74.5%) | 12,406 (6.4%) |
| College / Associate Degree | 190,710 (81.4%) | 11,246 (4.8%) |
| Bachelor's Degree or higher | 187,440 (87.7%) | 6,839 (3.2%) |
| Total | 592,221 (78.7%) | 36,873 (4.9%) |
Employment Occupations by Sex in San Antonio
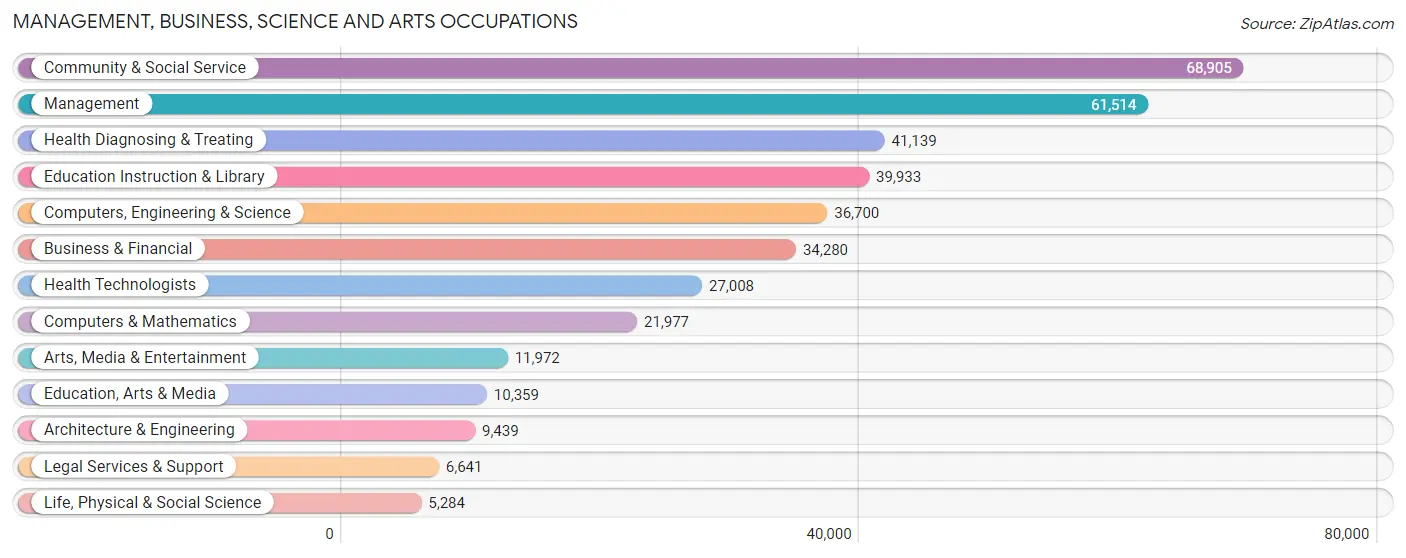
Management, Business, Science and Arts Occupations
The most common Management, Business, Science and Arts occupations in San Antonio are Community & Social Service (68,905 | 9.9%), Management (61,514 | 8.9%), Health Diagnosing & Treating (41,139 | 5.9%), Education Instruction & Library (39,933 | 5.8%), and Computers, Engineering & Science (36,700 | 5.3%).
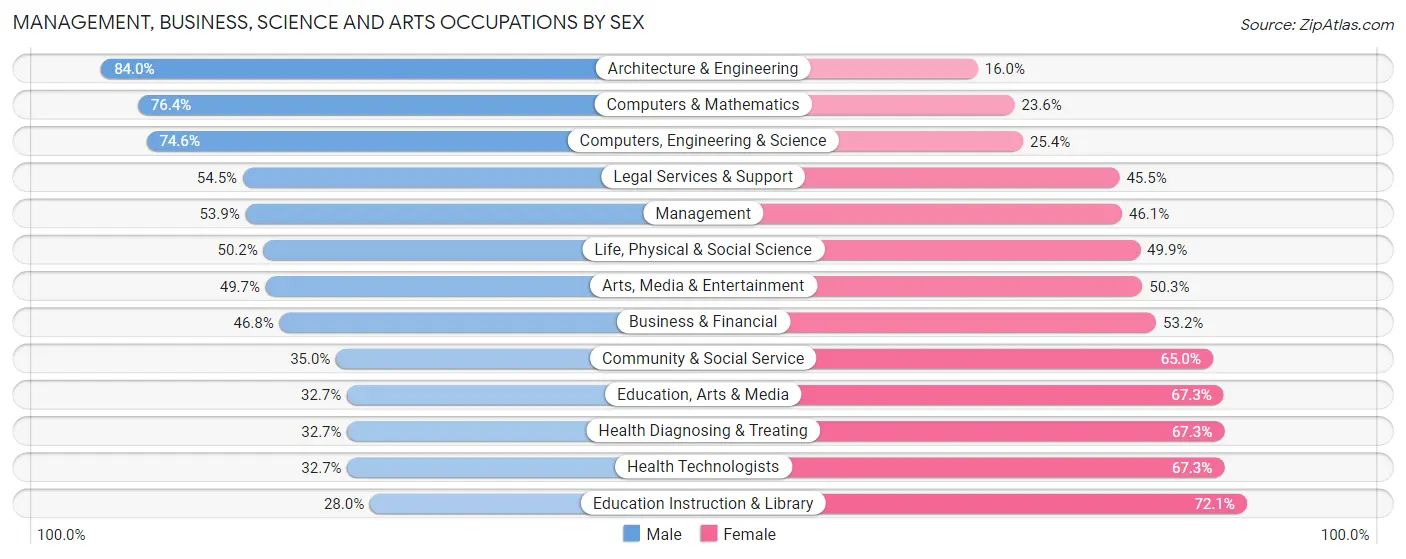
Management, Business, Science and Arts Occupations by Sex
Within the Management, Business, Science and Arts occupations in San Antonio, the most male-oriented occupations are Architecture & Engineering (84.0%), Computers & Mathematics (76.4%), and Computers, Engineering & Science (74.6%), while the most female-oriented occupations are Education Instruction & Library (72.1%), Health Technologists (67.3%), and Health Diagnosing & Treating (67.3%).
| Occupation | Male | Female |
| Management | 33,167 (53.9%) | 28,347 (46.1%) |
| Business & Financial | 16,045 (46.8%) | 18,235 (53.2%) |
| Computers, Engineering & Science | 27,362 (74.6%) | 9,338 (25.4%) |
| Computers & Mathematics | 16,782 (76.4%) | 5,195 (23.6%) |
| Architecture & Engineering | 7,930 (84.0%) | 1,509 (16.0%) |
| Life, Physical & Social Science | 2,650 (50.1%) | 2,634 (49.8%) |
| Community & Social Service | 24,117 (35.0%) | 44,788 (65.0%) |
| Education, Arts & Media | 3,391 (32.7%) | 6,968 (67.3%) |
| Legal Services & Support | 3,617 (54.5%) | 3,024 (45.5%) |
| Education Instruction & Library | 11,160 (28.0%) | 28,773 (72.1%) |
| Arts, Media & Entertainment | 5,949 (49.7%) | 6,023 (50.3%) |
| Health Diagnosing & Treating | 13,440 (32.7%) | 27,699 (67.3%) |
| Health Technologists | 8,820 (32.7%) | 18,188 (67.3%) |
| Total (Category) | 114,131 (47.1%) | 128,407 (52.9%) |
| Total (Overall) | 369,148 (53.2%) | 325,121 (46.8%) |
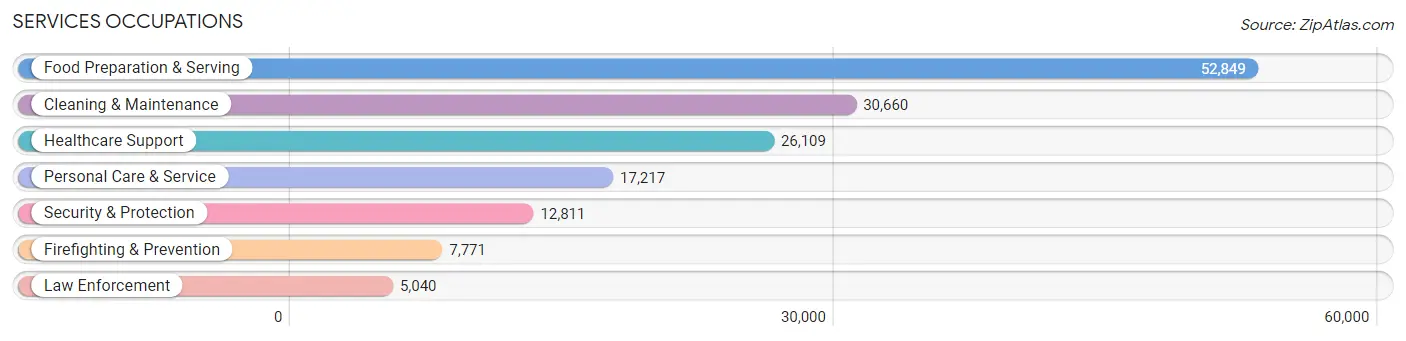
Services Occupations
The most common Services occupations in San Antonio are Food Preparation & Serving (52,849 | 7.6%), Cleaning & Maintenance (30,660 | 4.4%), Healthcare Support (26,109 | 3.8%), Personal Care & Service (17,217 | 2.5%), and Security & Protection (12,811 | 1.8%).
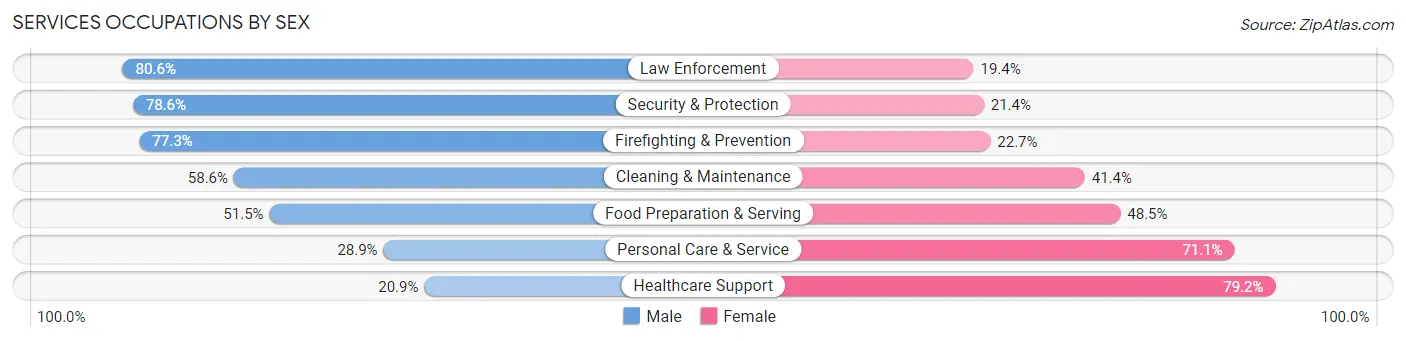
Services Occupations by Sex
Within the Services occupations in San Antonio, the most male-oriented occupations are Law Enforcement (80.6%), Security & Protection (78.6%), and Firefighting & Prevention (77.3%), while the most female-oriented occupations are Healthcare Support (79.1%), Personal Care & Service (71.1%), and Food Preparation & Serving (48.5%).
| Occupation | Male | Female |
| Healthcare Support | 5,444 (20.8%) | 20,665 (79.1%) |
| Security & Protection | 10,065 (78.6%) | 2,746 (21.4%) |
| Firefighting & Prevention | 6,004 (77.3%) | 1,767 (22.7%) |
| Law Enforcement | 4,061 (80.6%) | 979 (19.4%) |
| Food Preparation & Serving | 27,226 (51.5%) | 25,623 (48.5%) |
| Cleaning & Maintenance | 17,954 (58.6%) | 12,706 (41.4%) |
| Personal Care & Service | 4,983 (28.9%) | 12,234 (71.1%) |
| Total (Category) | 65,672 (47.0%) | 73,974 (53.0%) |
| Total (Overall) | 369,148 (53.2%) | 325,121 (46.8%) |
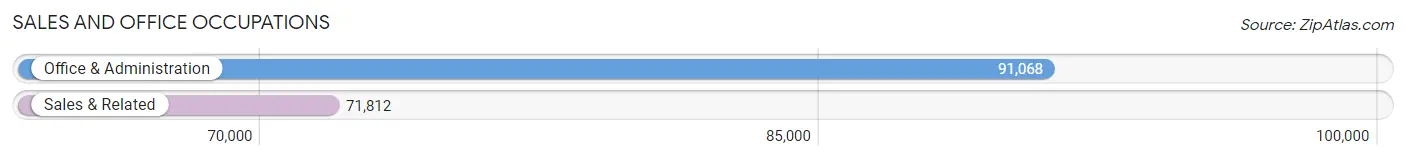
Sales and Office Occupations
The most common Sales and Office occupations in San Antonio are Office & Administration (91,068 | 13.1%), and Sales & Related (71,812 | 10.3%).
Sales and Office Occupations by Sex
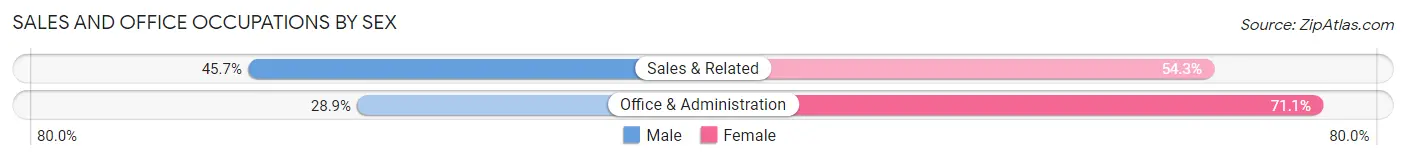
| Occupation | Male | Female |
| Sales & Related | 32,797 (45.7%) | 39,015 (54.3%) |
| Office & Administration | 26,302 (28.9%) | 64,766 (71.1%) |
| Total (Category) | 59,099 (36.3%) | 103,781 (63.7%) |
| Total (Overall) | 369,148 (53.2%) | 325,121 (46.8%) |
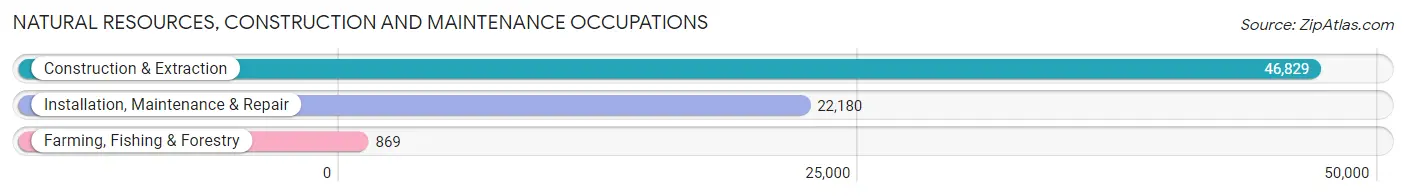
Natural Resources, Construction and Maintenance Occupations
The most common Natural Resources, Construction and Maintenance occupations in San Antonio are Construction & Extraction (46,829 | 6.8%), Installation, Maintenance & Repair (22,180 | 3.2%), and Farming, Fishing & Forestry (869 | 0.1%).
Natural Resources, Construction and Maintenance Occupations by Sex
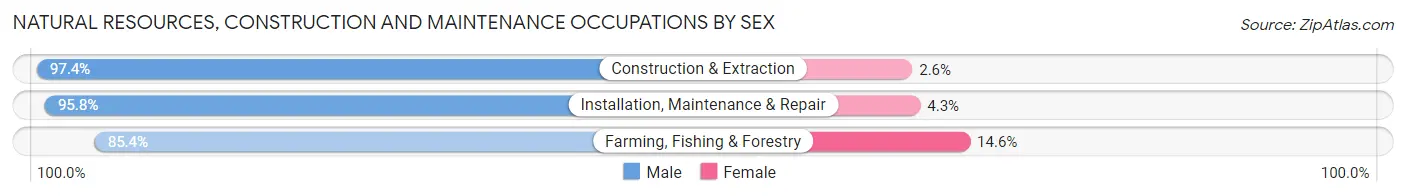
| Occupation | Male | Female |
| Farming, Fishing & Forestry | 742 (85.4%) | 127 (14.6%) |
| Construction & Extraction | 45,626 (97.4%) | 1,203 (2.6%) |
| Installation, Maintenance & Repair | 21,238 (95.8%) | 942 (4.3%) |
| Total (Category) | 67,606 (96.8%) | 2,272 (3.3%) |
| Total (Overall) | 369,148 (53.2%) | 325,121 (46.8%) |
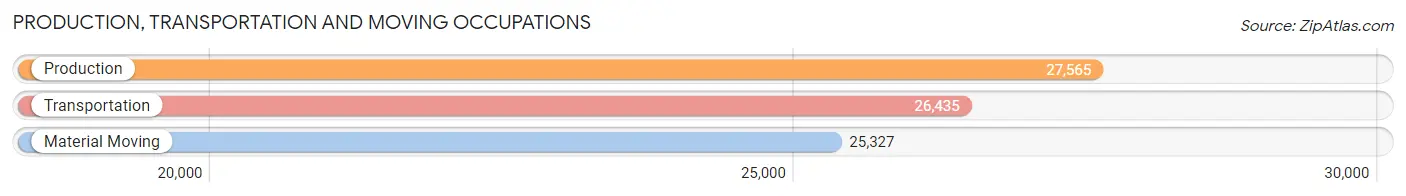
Production, Transportation and Moving Occupations
The most common Production, Transportation and Moving occupations in San Antonio are Production (27,565 | 4.0%), Transportation (26,435 | 3.8%), and Material Moving (25,327 | 3.6%).
Production, Transportation and Moving Occupations by Sex
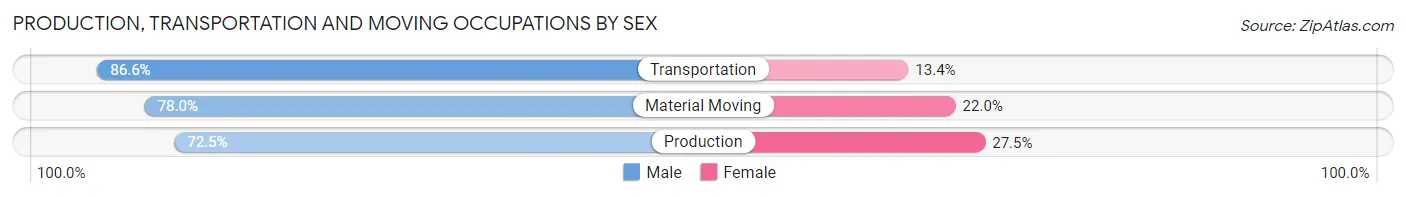
| Occupation | Male | Female |
| Production | 19,994 (72.5%) | 7,571 (27.5%) |
| Transportation | 22,900 (86.6%) | 3,535 (13.4%) |
| Material Moving | 19,746 (78.0%) | 5,581 (22.0%) |
| Total (Category) | 62,640 (79.0%) | 16,687 (21.0%) |
| Total (Overall) | 369,148 (53.2%) | 325,121 (46.8%) |
Employment Industries by Sex in San Antonio
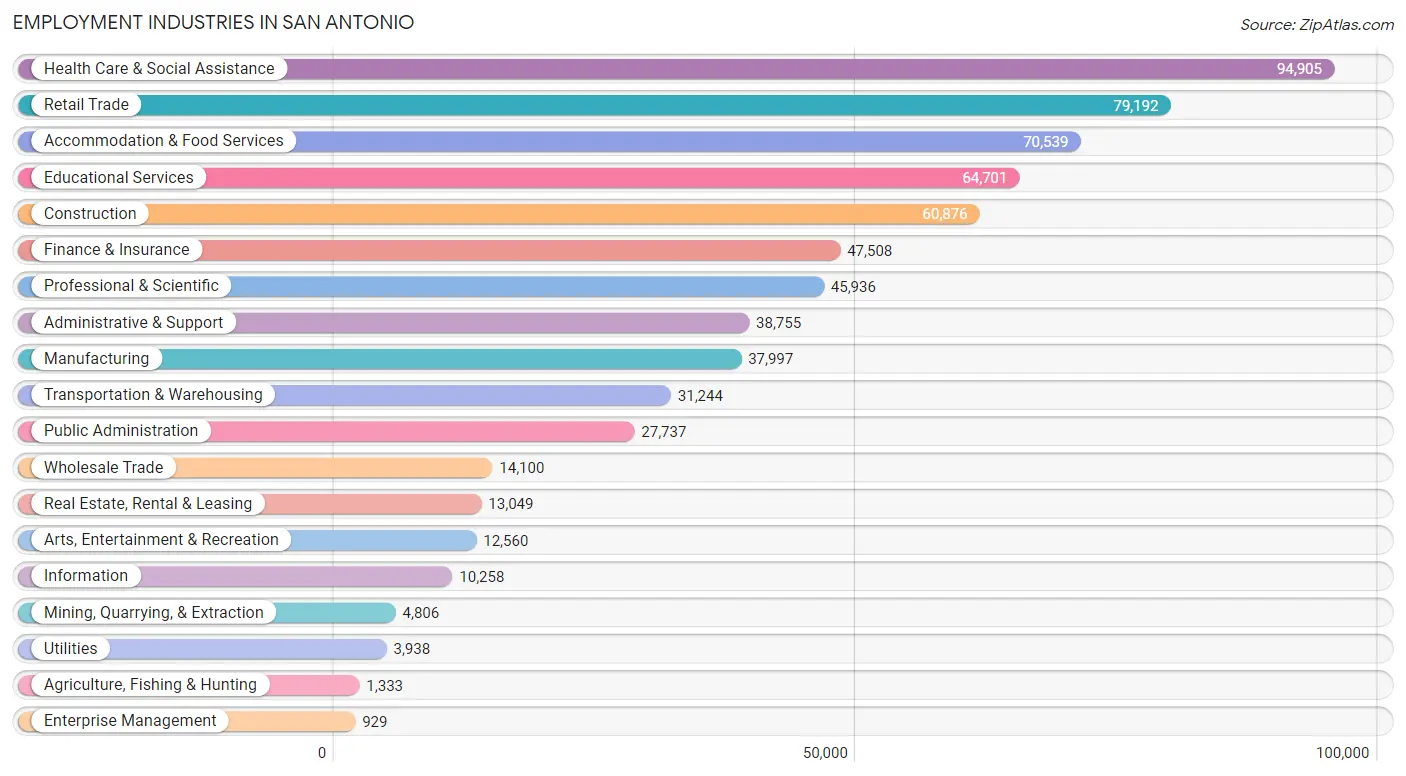
Employment Industries in San Antonio
The major employment industries in San Antonio include Health Care & Social Assistance (94,905 | 13.7%), Retail Trade (79,192 | 11.4%), Accommodation & Food Services (70,539 | 10.2%), Educational Services (64,701 | 9.3%), and Construction (60,876 | 8.8%).
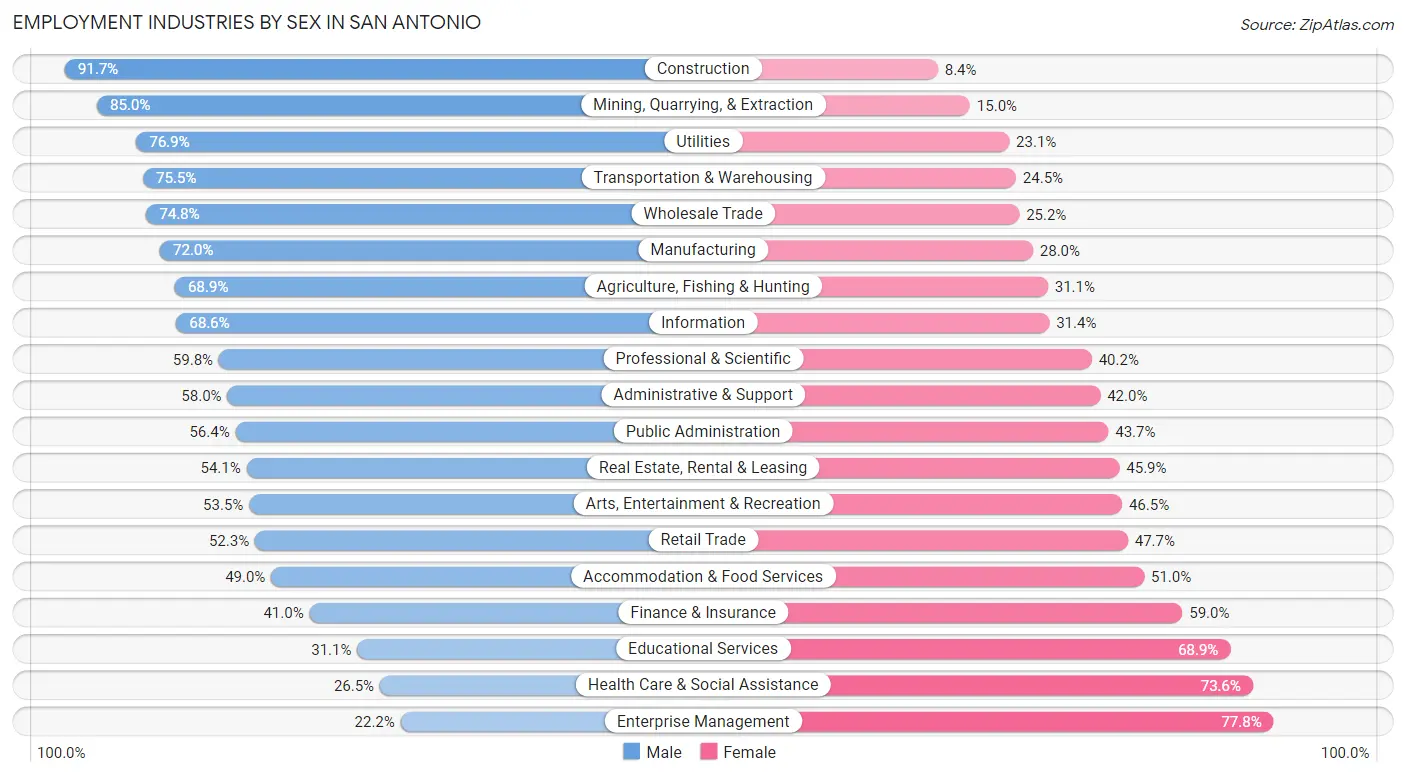
Employment Industries by Sex in San Antonio
The San Antonio industries that see more men than women are Construction (91.6%), Mining, Quarrying, & Extraction (85.0%), and Utilities (76.9%), whereas the industries that tend to have a higher number of women are Enterprise Management (77.8%), Health Care & Social Assistance (73.6%), and Educational Services (68.9%).
| Industry | Male | Female |
| Agriculture, Fishing & Hunting | 918 (68.9%) | 415 (31.1%) |
| Mining, Quarrying, & Extraction | 4,085 (85.0%) | 721 (15.0%) |
| Construction | 55,792 (91.6%) | 5,084 (8.4%) |
| Manufacturing | 27,342 (72.0%) | 10,655 (28.0%) |
| Wholesale Trade | 10,546 (74.8%) | 3,554 (25.2%) |
| Retail Trade | 41,427 (52.3%) | 37,765 (47.7%) |
| Transportation & Warehousing | 23,584 (75.5%) | 7,660 (24.5%) |
| Utilities | 3,027 (76.9%) | 911 (23.1%) |
| Information | 7,035 (68.6%) | 3,223 (31.4%) |
| Finance & Insurance | 19,492 (41.0%) | 28,016 (59.0%) |
| Real Estate, Rental & Leasing | 7,054 (54.1%) | 5,995 (45.9%) |
| Professional & Scientific | 27,462 (59.8%) | 18,474 (40.2%) |
| Enterprise Management | 206 (22.2%) | 723 (77.8%) |
| Administrative & Support | 22,486 (58.0%) | 16,269 (42.0%) |
| Educational Services | 20,139 (31.1%) | 44,562 (68.9%) |
| Health Care & Social Assistance | 25,099 (26.5%) | 69,806 (73.6%) |
| Arts, Entertainment & Recreation | 6,722 (53.5%) | 5,838 (46.5%) |
| Accommodation & Food Services | 34,539 (49.0%) | 36,000 (51.0%) |
| Public Administration | 15,630 (56.4%) | 12,107 (43.6%) |
| Total | 369,148 (53.2%) | 325,121 (46.8%) |
Education in San Antonio
School Enrollment in San Antonio
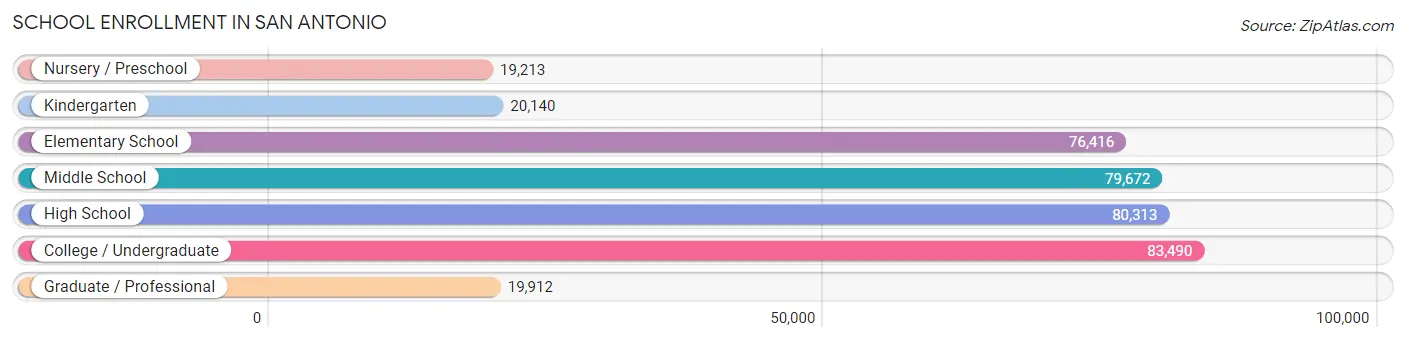
The most common levels of schooling among the 379,156 students in San Antonio are college / undergraduate (83,490 | 22.0%), high school (80,313 | 21.2%), and middle school (79,672 | 21.0%).
| School Level | # Students | % Students |
| Nursery / Preschool | 19,213 | 5.1% |
| Kindergarten | 20,140 | 5.3% |
| Elementary School | 76,416 | 20.2% |
| Middle School | 79,672 | 21.0% |
| High School | 80,313 | 21.2% |
| College / Undergraduate | 83,490 | 22.0% |
| Graduate / Professional | 19,912 | 5.2% |
| Total | 379,156 | 100.0% |
School Enrollment by Age by Funding Source in San Antonio
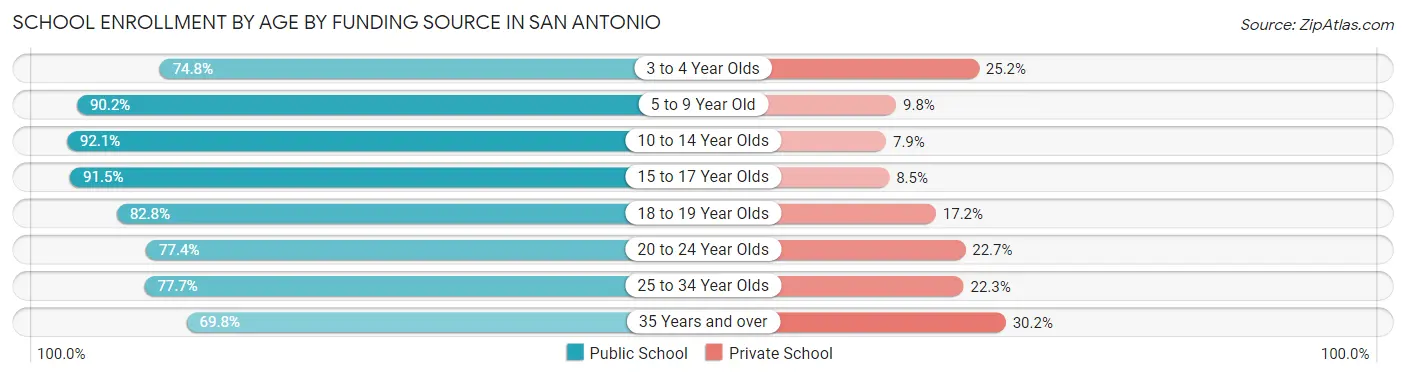
Out of a total of 379,156 students who are enrolled in schools in San Antonio, 51,944 (13.7%) attend a private institution, while the remaining 327,212 (86.3%) are enrolled in public schools. The age group of 35 years and over has the highest likelihood of being enrolled in private schools, with 5,969 (30.2% in the age bracket) enrolled. Conversely, the age group of 10 to 14 year olds has the lowest likelihood of being enrolled in a private school, with 89,894 (92.1% in the age bracket) attending a public institution.
| Age Bracket | Public School | Private School |
| 3 to 4 Year Olds | 11,616 (74.8%) | 3,910 (25.2%) |
| 5 to 9 Year Old | 80,356 (90.2%) | 8,694 (9.8%) |
| 10 to 14 Year Olds | 89,894 (92.1%) | 7,698 (7.9%) |
| 15 to 17 Year Olds | 53,915 (91.5%) | 4,995 (8.5%) |
| 18 to 19 Year Olds | 24,549 (82.8%) | 5,089 (17.2%) |
| 20 to 24 Year Olds | 30,741 (77.3%) | 9,000 (22.7%) |
| 25 to 34 Year Olds | 22,468 (77.7%) | 6,459 (22.3%) |
| 35 Years and over | 13,803 (69.8%) | 5,969 (30.2%) |
| Total | 327,212 (86.3%) | 51,944 (13.7%) |
Educational Attainment by Field of Study in San Antonio
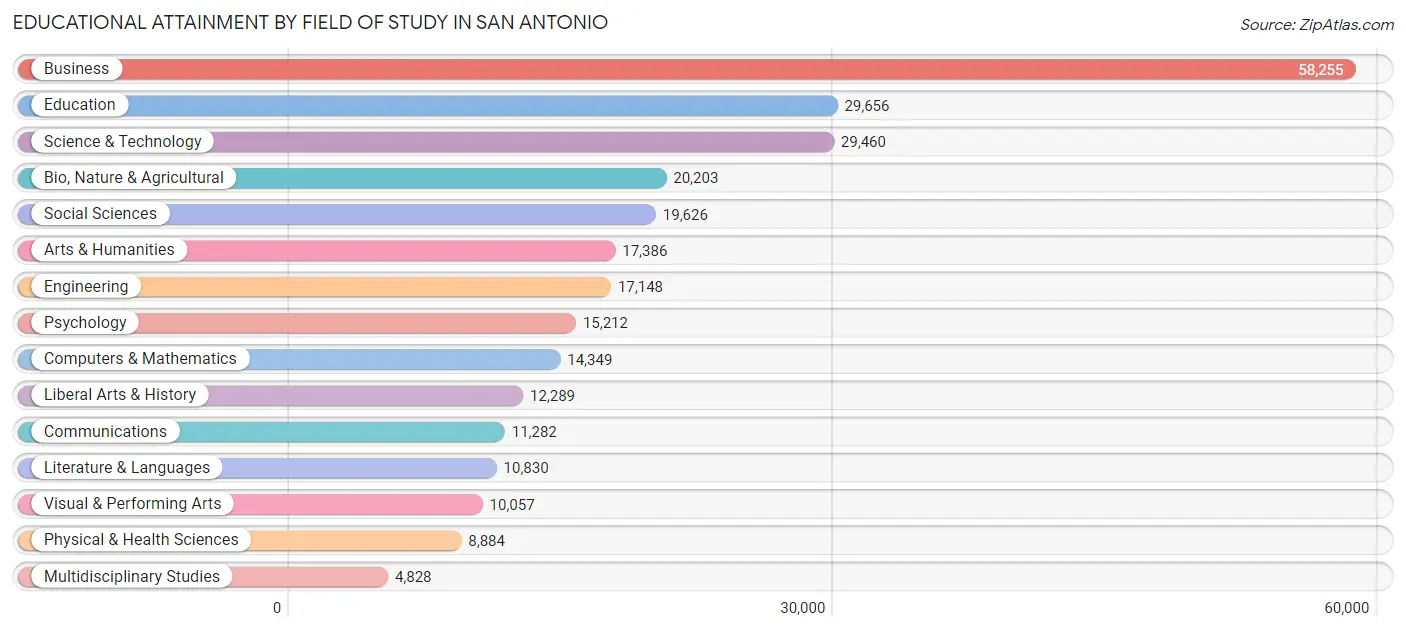
Business (58,255 | 20.8%), education (29,656 | 10.6%), science & technology (29,460 | 10.5%), bio, nature & agricultural (20,203 | 7.2%), and social sciences (19,626 | 7.0%) are the most common fields of study among 279,465 individuals in San Antonio who have obtained a bachelor's degree or higher.
| Field of Study | # Graduates | % Graduates |
| Computers & Mathematics | 14,349 | 5.1% |
| Bio, Nature & Agricultural | 20,203 | 7.2% |
| Physical & Health Sciences | 8,884 | 3.2% |
| Psychology | 15,212 | 5.4% |
| Social Sciences | 19,626 | 7.0% |
| Engineering | 17,148 | 6.1% |
| Multidisciplinary Studies | 4,828 | 1.7% |
| Science & Technology | 29,460 | 10.5% |
| Business | 58,255 | 20.8% |
| Education | 29,656 | 10.6% |
| Literature & Languages | 10,830 | 3.9% |
| Liberal Arts & History | 12,289 | 4.4% |
| Visual & Performing Arts | 10,057 | 3.6% |
| Communications | 11,282 | 4.0% |
| Arts & Humanities | 17,386 | 6.2% |
| Total | 279,465 | 100.0% |
Transportation & Commute in San Antonio
Vehicle Availability by Sex in San Antonio
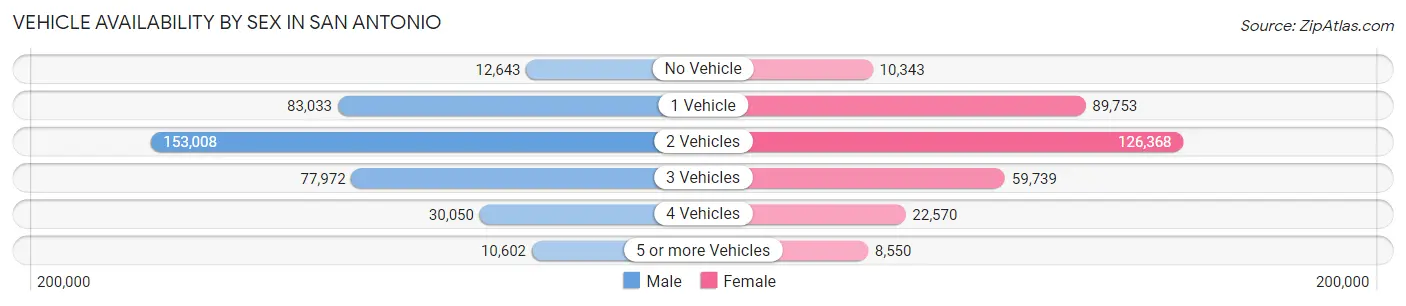
The most prevalent vehicle ownership categories in San Antonio are males with 2 vehicles (153,008, accounting for 41.7%) and females with 2 vehicles (126,368, making up 48.2%).
| Vehicles Available | Male | Female |
| No Vehicle | 12,643 (3.4%) | 10,343 (3.3%) |
| 1 Vehicle | 83,033 (22.6%) | 89,753 (28.3%) |
| 2 Vehicles | 153,008 (41.7%) | 126,368 (39.8%) |
| 3 Vehicles | 77,972 (21.2%) | 59,739 (18.8%) |
| 4 Vehicles | 30,050 (8.2%) | 22,570 (7.1%) |
| 5 or more Vehicles | 10,602 (2.9%) | 8,550 (2.7%) |
| Total | 367,308 (100.0%) | 317,323 (100.0%) |
Commute Time in San Antonio
The most frequently occuring commute durations in San Antonio are 20 to 24 minutes (111,130 commuters, 17.8%), 15 to 19 minutes (108,872 commuters, 17.5%), and 30 to 34 minutes (98,197 commuters, 15.8%).
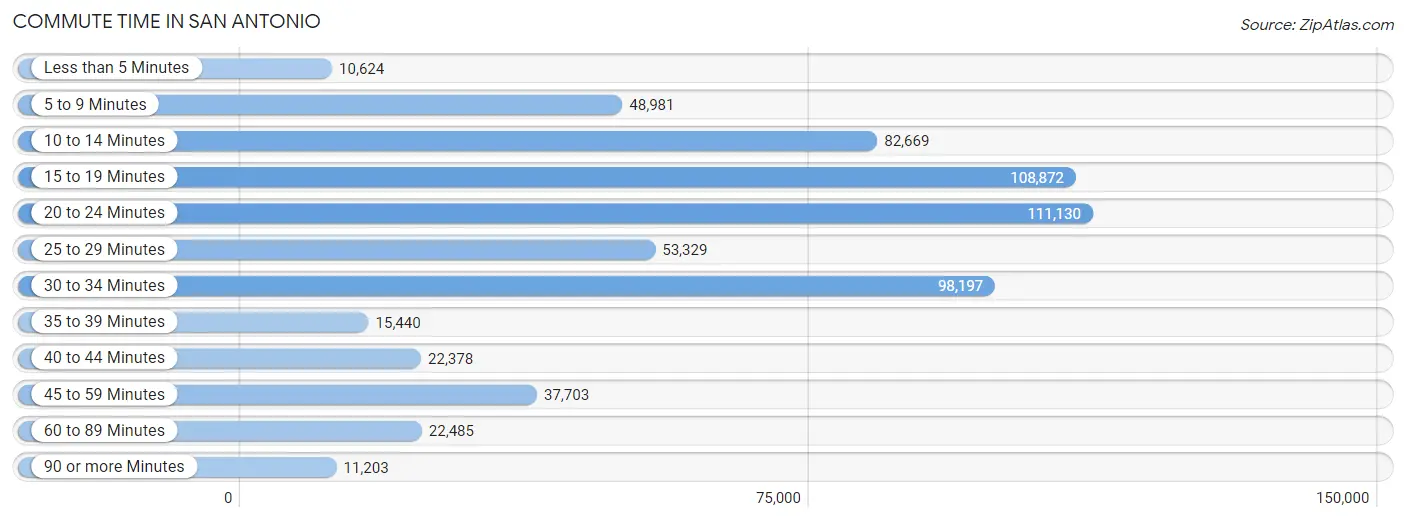
| Commute Time | # Commuters | % Commuters |
| Less than 5 Minutes | 10,624 | 1.7% |
| 5 to 9 Minutes | 48,981 | 7.9% |
| 10 to 14 Minutes | 82,669 | 13.3% |
| 15 to 19 Minutes | 108,872 | 17.5% |
| 20 to 24 Minutes | 111,130 | 17.8% |
| 25 to 29 Minutes | 53,329 | 8.6% |
| 30 to 34 Minutes | 98,197 | 15.8% |
| 35 to 39 Minutes | 15,440 | 2.5% |
| 40 to 44 Minutes | 22,378 | 3.6% |
| 45 to 59 Minutes | 37,703 | 6.0% |
| 60 to 89 Minutes | 22,485 | 3.6% |
| 90 or more Minutes | 11,203 | 1.8% |
Commute Time by Sex in San Antonio
The most common commute times in San Antonio are 20 to 24 minutes (60,702 commuters, 17.9%) for males and 15 to 19 minutes (53,120 commuters, 18.7%) for females.
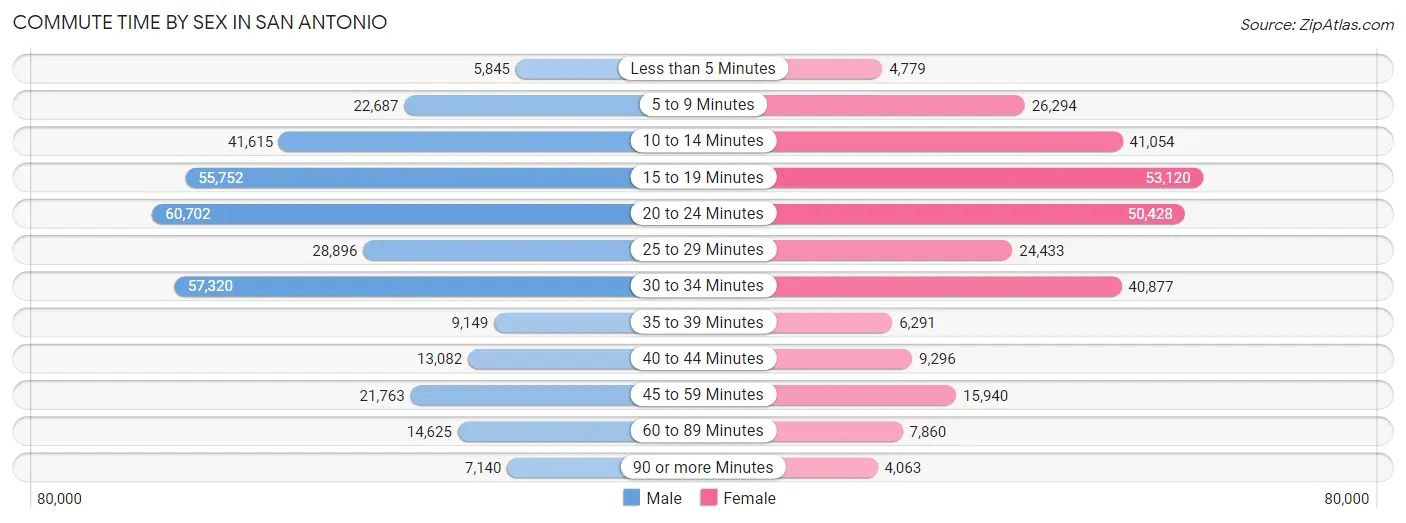
| Commute Time | Male | Female |
| Less than 5 Minutes | 5,845 (1.7%) | 4,779 (1.7%) |
| 5 to 9 Minutes | 22,687 (6.7%) | 26,294 (9.2%) |
| 10 to 14 Minutes | 41,615 (12.3%) | 41,054 (14.4%) |
| 15 to 19 Minutes | 55,752 (16.5%) | 53,120 (18.7%) |
| 20 to 24 Minutes | 60,702 (17.9%) | 50,428 (17.7%) |
| 25 to 29 Minutes | 28,896 (8.5%) | 24,433 (8.6%) |
| 30 to 34 Minutes | 57,320 (16.9%) | 40,877 (14.4%) |
| 35 to 39 Minutes | 9,149 (2.7%) | 6,291 (2.2%) |
| 40 to 44 Minutes | 13,082 (3.9%) | 9,296 (3.3%) |
| 45 to 59 Minutes | 21,763 (6.4%) | 15,940 (5.6%) |
| 60 to 89 Minutes | 14,625 (4.3%) | 7,860 (2.8%) |
| 90 or more Minutes | 7,140 (2.1%) | 4,063 (1.4%) |
Time of Departure to Work by Sex in San Antonio
The most frequent times of departure to work in San Antonio are 7:00 AM to 7:29 AM (47,637, 14.1%) for males and 7:00 AM to 7:29 AM (46,338, 16.3%) for females.
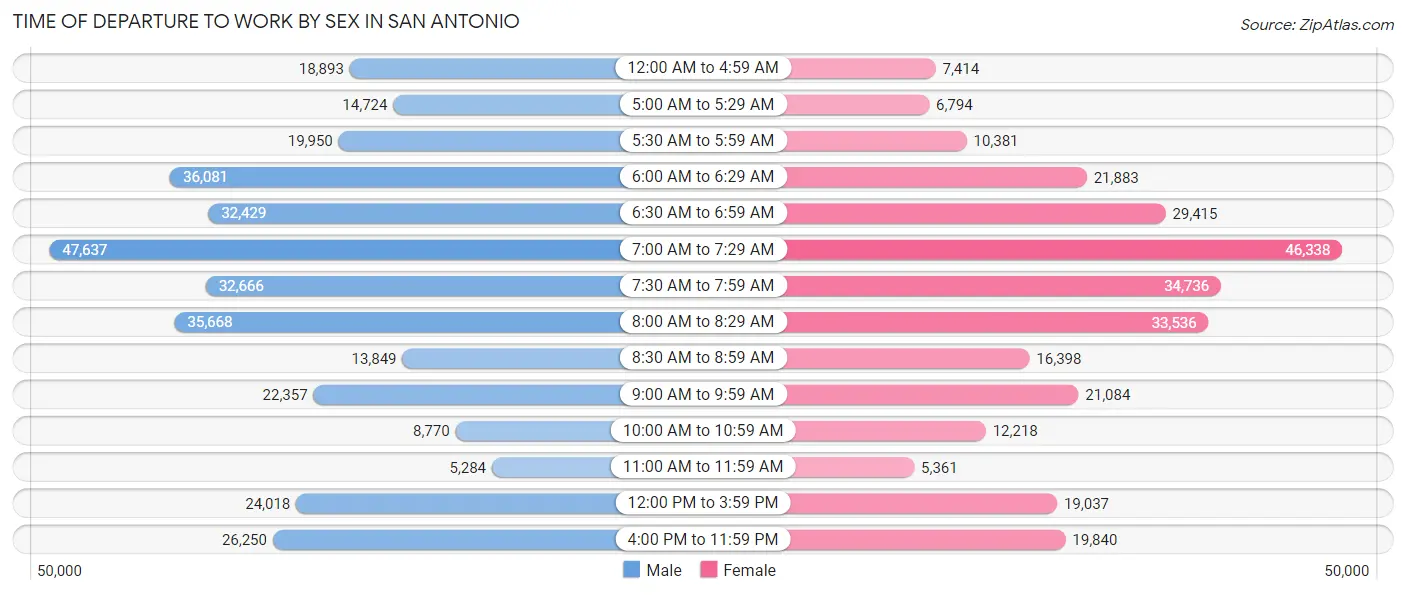
| Time of Departure | Male | Female |
| 12:00 AM to 4:59 AM | 18,893 (5.6%) | 7,414 (2.6%) |
| 5:00 AM to 5:29 AM | 14,724 (4.3%) | 6,794 (2.4%) |
| 5:30 AM to 5:59 AM | 19,950 (5.9%) | 10,381 (3.6%) |
| 6:00 AM to 6:29 AM | 36,081 (10.7%) | 21,883 (7.7%) |
| 6:30 AM to 6:59 AM | 32,429 (9.6%) | 29,415 (10.3%) |
| 7:00 AM to 7:29 AM | 47,637 (14.1%) | 46,338 (16.3%) |
| 7:30 AM to 7:59 AM | 32,666 (9.7%) | 34,736 (12.2%) |
| 8:00 AM to 8:29 AM | 35,668 (10.5%) | 33,536 (11.8%) |
| 8:30 AM to 8:59 AM | 13,849 (4.1%) | 16,398 (5.8%) |
| 9:00 AM to 9:59 AM | 22,357 (6.6%) | 21,084 (7.4%) |
| 10:00 AM to 10:59 AM | 8,770 (2.6%) | 12,218 (4.3%) |
| 11:00 AM to 11:59 AM | 5,284 (1.6%) | 5,361 (1.9%) |
| 12:00 PM to 3:59 PM | 24,018 (7.1%) | 19,037 (6.7%) |
| 4:00 PM to 11:59 PM | 26,250 (7.7%) | 19,840 (7.0%) |
| Total | 338,576 (100.0%) | 284,435 (100.0%) |
Housing Occupancy in San Antonio
Occupancy by Ownership in San Antonio
Of the total 542,817 dwellings in San Antonio, owner-occupied units account for 281,930 (51.9%), while renter-occupied units make up 260,887 (48.1%).
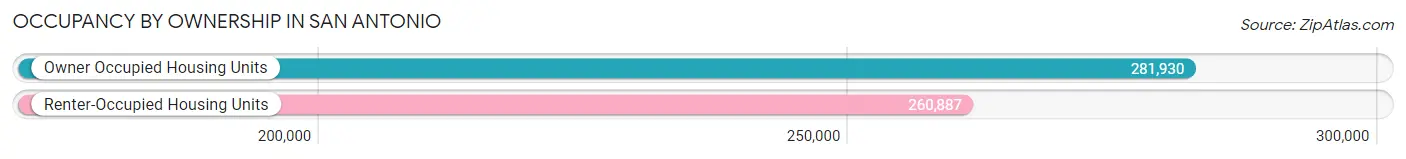
| Occupancy | # Housing Units | % Housing Units |
| Owner Occupied Housing Units | 281,930 | 51.9% |
| Renter-Occupied Housing Units | 260,887 | 48.1% |
| Total Occupied Housing Units | 542,817 | 100.0% |
Occupancy by Household Size in San Antonio
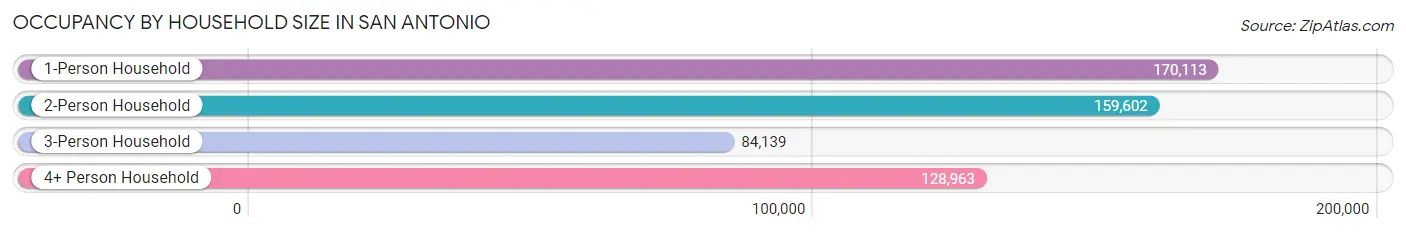
| Household Size | # Housing Units | % Housing Units |
| 1-Person Household | 170,113 | 31.3% |
| 2-Person Household | 159,602 | 29.4% |
| 3-Person Household | 84,139 | 15.5% |
| 4+ Person Household | 128,963 | 23.8% |
| Total Housing Units | 542,817 | 100.0% |
Occupancy by Ownership by Household Size in San Antonio
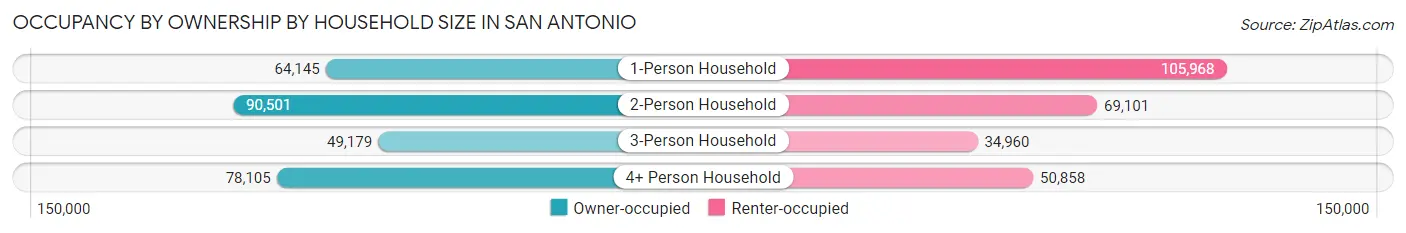
| Household Size | Owner-occupied | Renter-occupied |
| 1-Person Household | 64,145 (37.7%) | 105,968 (62.3%) |
| 2-Person Household | 90,501 (56.7%) | 69,101 (43.3%) |
| 3-Person Household | 49,179 (58.5%) | 34,960 (41.5%) |
| 4+ Person Household | 78,105 (60.6%) | 50,858 (39.4%) |
| Total Housing Units | 281,930 (51.9%) | 260,887 (48.1%) |
Occupancy by Educational Attainment in San Antonio
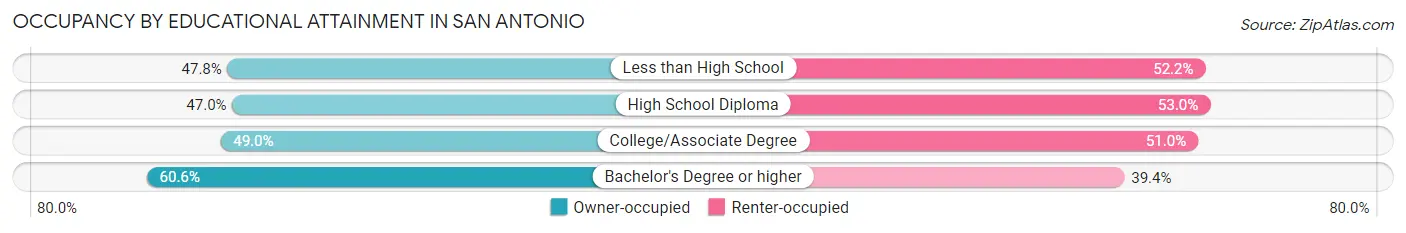
| Household Size | Owner-occupied | Renter-occupied |
| Less than High School | 35,693 (47.8%) | 38,984 (52.2%) |
| High School Diploma | 59,006 (47.0%) | 66,444 (53.0%) |
| College/Associate Degree | 86,281 (49.0%) | 89,948 (51.0%) |
| Bachelor's Degree or higher | 100,950 (60.6%) | 65,511 (39.4%) |
Occupancy by Age of Householder in San Antonio
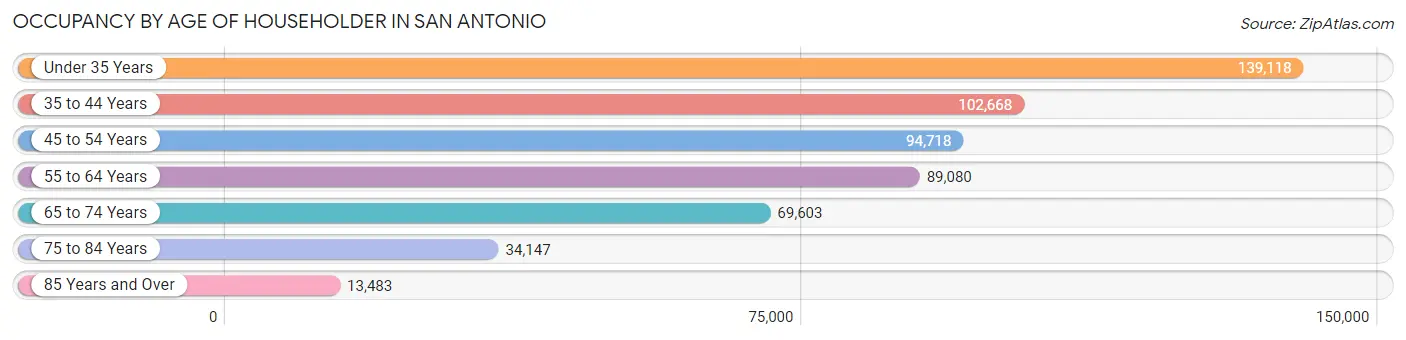
| Age Bracket | # Households | % Households |
| Under 35 Years | 139,118 | 25.6% |
| 35 to 44 Years | 102,668 | 18.9% |
| 45 to 54 Years | 94,718 | 17.4% |
| 55 to 64 Years | 89,080 | 16.4% |
| 65 to 74 Years | 69,603 | 12.8% |
| 75 to 84 Years | 34,147 | 6.3% |
| 85 Years and Over | 13,483 | 2.5% |
| Total | 542,817 | 100.0% |
Housing Finances in San Antonio
Median Income by Occupancy in San Antonio
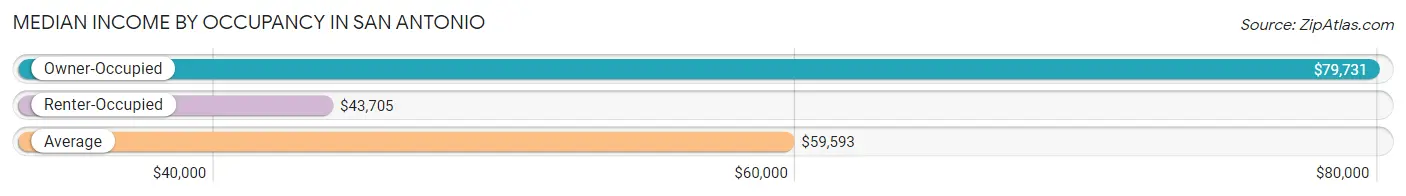
| Occupancy Type | # Households | Median Income |
| Owner-Occupied | 281,930 (51.9%) | $79,731 |
| Renter-Occupied | 260,887 (48.1%) | $43,705 |
| Average | 542,817 (100.0%) | $59,593 |
Occupancy by Householder Income Bracket in San Antonio
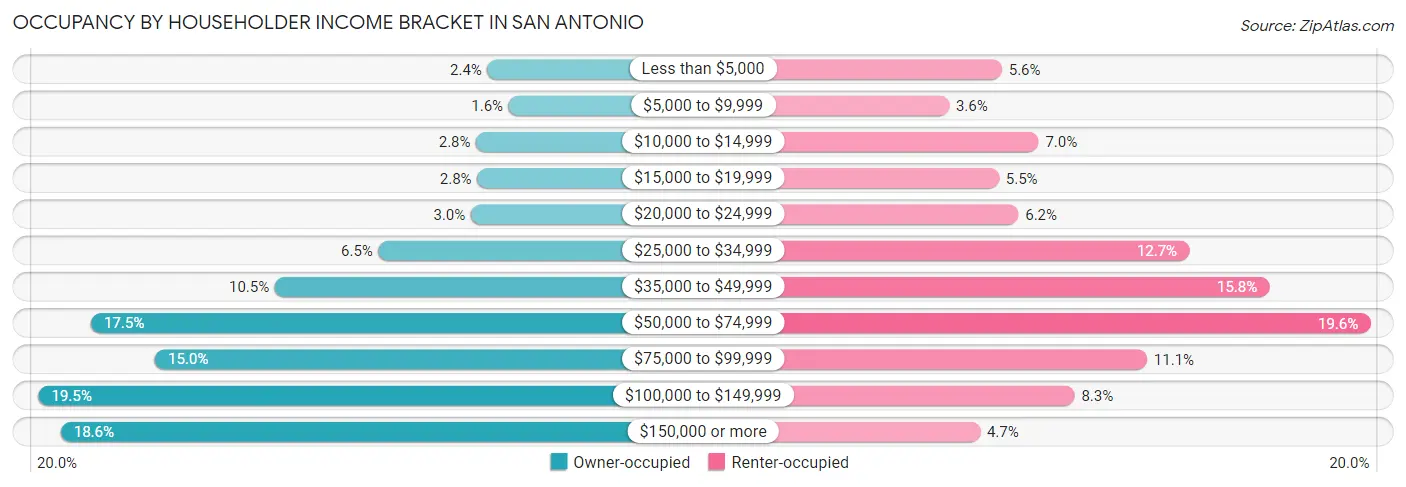
| Income Bracket | Owner-occupied | Renter-occupied |
| Less than $5,000 | 6,646 (2.4%) | 14,526 (5.6%) |
| $5,000 to $9,999 | 4,376 (1.5%) | 9,296 (3.6%) |
| $10,000 to $14,999 | 7,868 (2.8%) | 18,187 (7.0%) |
| $15,000 to $19,999 | 7,760 (2.8%) | 14,249 (5.5%) |
| $20,000 to $24,999 | 8,437 (3.0%) | 16,188 (6.2%) |
| $25,000 to $34,999 | 18,346 (6.5%) | 33,121 (12.7%) |
| $35,000 to $49,999 | 29,492 (10.5%) | 41,088 (15.8%) |
| $50,000 to $74,999 | 49,256 (17.5%) | 51,137 (19.6%) |
| $75,000 to $99,999 | 42,360 (15.0%) | 28,971 (11.1%) |
| $100,000 to $149,999 | 54,900 (19.5%) | 21,763 (8.3%) |
| $150,000 or more | 52,489 (18.6%) | 12,361 (4.7%) |
| Total | 281,930 (100.0%) | 260,887 (100.0%) |
Monthly Housing Cost Tiers in San Antonio
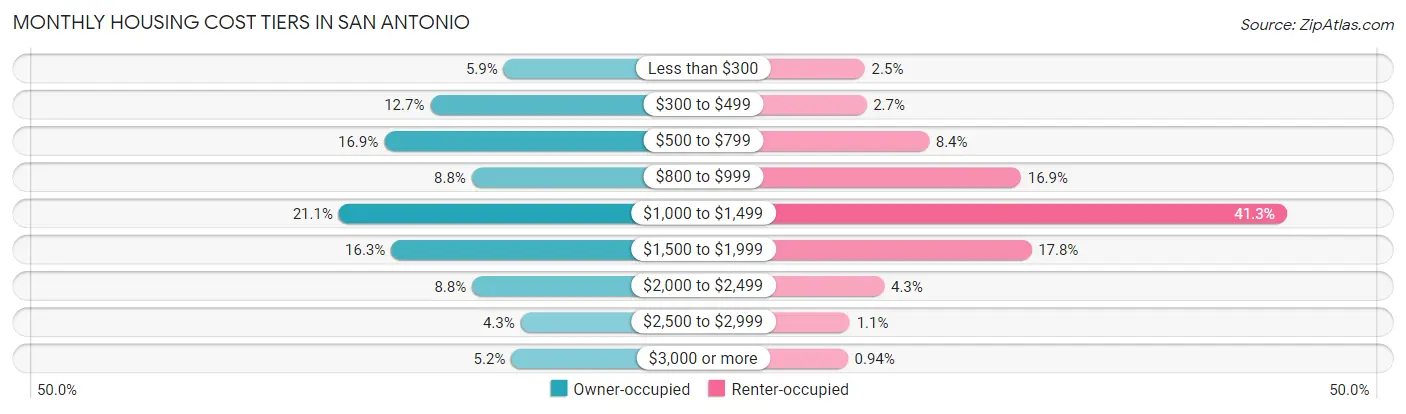
| Monthly Cost | Owner-occupied | Renter-occupied |
| Less than $300 | 16,654 (5.9%) | 6,548 (2.5%) |
| $300 to $499 | 35,682 (12.7%) | 6,914 (2.6%) |
| $500 to $799 | 47,665 (16.9%) | 21,948 (8.4%) |
| $800 to $999 | 24,911 (8.8%) | 44,048 (16.9%) |
| $1,000 to $1,499 | 59,427 (21.1%) | 107,838 (41.3%) |
| $1,500 to $1,999 | 45,835 (16.3%) | 46,549 (17.8%) |
| $2,000 to $2,499 | 24,852 (8.8%) | 11,194 (4.3%) |
| $2,500 to $2,999 | 12,236 (4.3%) | 2,960 (1.1%) |
| $3,000 or more | 14,668 (5.2%) | 2,465 (0.9%) |
| Total | 281,930 (100.0%) | 260,887 (100.0%) |
Physical Housing Characteristics in San Antonio
Housing Structures in San Antonio
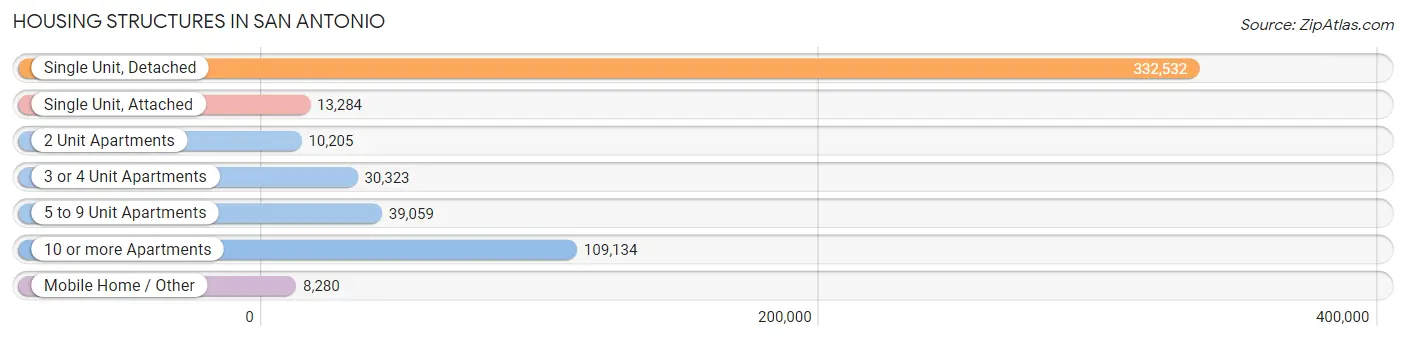
| Structure Type | # Housing Units | % Housing Units |
| Single Unit, Detached | 332,532 | 61.3% |
| Single Unit, Attached | 13,284 | 2.5% |
| 2 Unit Apartments | 10,205 | 1.9% |
| 3 or 4 Unit Apartments | 30,323 | 5.6% |
| 5 to 9 Unit Apartments | 39,059 | 7.2% |
| 10 or more Apartments | 109,134 | 20.1% |
| Mobile Home / Other | 8,280 | 1.5% |
| Total | 542,817 | 100.0% |
Housing Structures by Occupancy in San Antonio
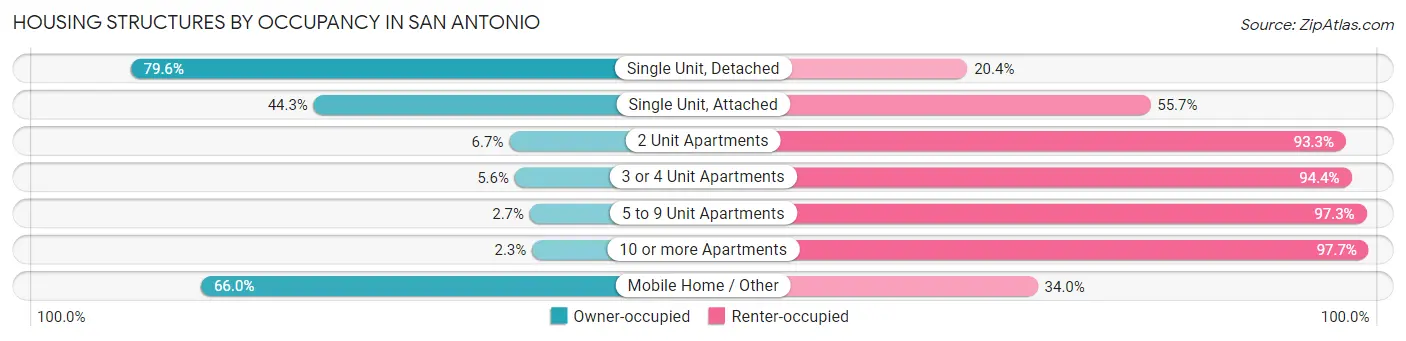
| Structure Type | Owner-occupied | Renter-occupied |
| Single Unit, Detached | 264,626 (79.6%) | 67,906 (20.4%) |
| Single Unit, Attached | 5,890 (44.3%) | 7,394 (55.7%) |
| 2 Unit Apartments | 683 (6.7%) | 9,522 (93.3%) |
| 3 or 4 Unit Apartments | 1,704 (5.6%) | 28,619 (94.4%) |
| 5 to 9 Unit Apartments | 1,062 (2.7%) | 37,997 (97.3%) |
| 10 or more Apartments | 2,498 (2.3%) | 106,636 (97.7%) |
| Mobile Home / Other | 5,467 (66.0%) | 2,813 (34.0%) |
| Total | 281,930 (51.9%) | 260,887 (48.1%) |
Housing Structures by Number of Rooms in San Antonio
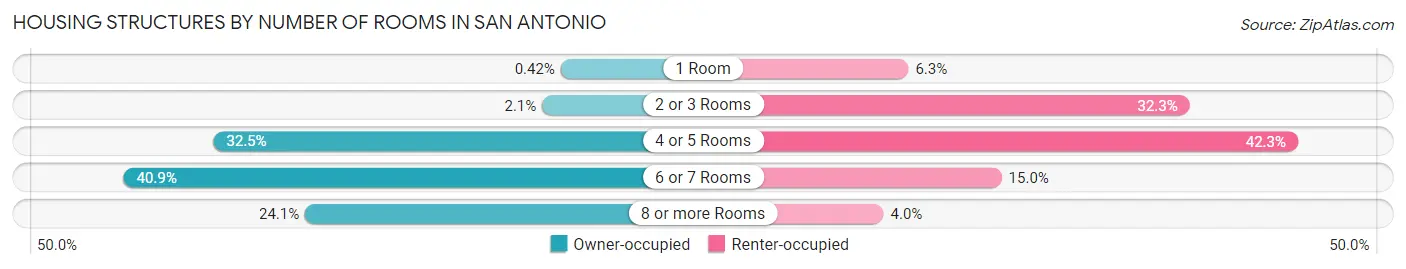
| Number of Rooms | Owner-occupied | Renter-occupied |
| 1 Room | 1,177 (0.4%) | 16,540 (6.3%) |
| 2 or 3 Rooms | 6,023 (2.1%) | 84,340 (32.3%) |
| 4 or 5 Rooms | 91,735 (32.5%) | 110,452 (42.3%) |
| 6 or 7 Rooms | 115,167 (40.8%) | 39,022 (15.0%) |
| 8 or more Rooms | 67,828 (24.1%) | 10,533 (4.0%) |
| Total | 281,930 (100.0%) | 260,887 (100.0%) |
Housing Structure by Heating Type in San Antonio
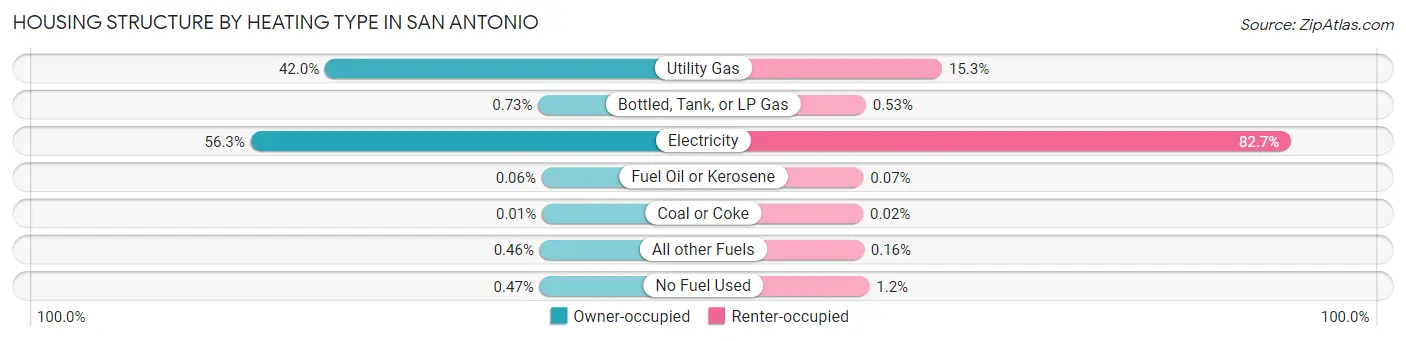
| Heating Type | Owner-occupied | Renter-occupied |
| Utility Gas | 118,257 (41.9%) | 39,836 (15.3%) |
| Bottled, Tank, or LP Gas | 2,050 (0.7%) | 1,394 (0.5%) |
| Electricity | 158,815 (56.3%) | 215,813 (82.7%) |
| Fuel Oil or Kerosene | 172 (0.1%) | 192 (0.1%) |
| Coal or Coke | 19 (0.0%) | 54 (0.0%) |
| All other Fuels | 1,305 (0.5%) | 412 (0.2%) |
| No Fuel Used | 1,312 (0.5%) | 3,186 (1.2%) |
| Total | 281,930 (100.0%) | 260,887 (100.0%) |
Household Vehicle Usage in San Antonio
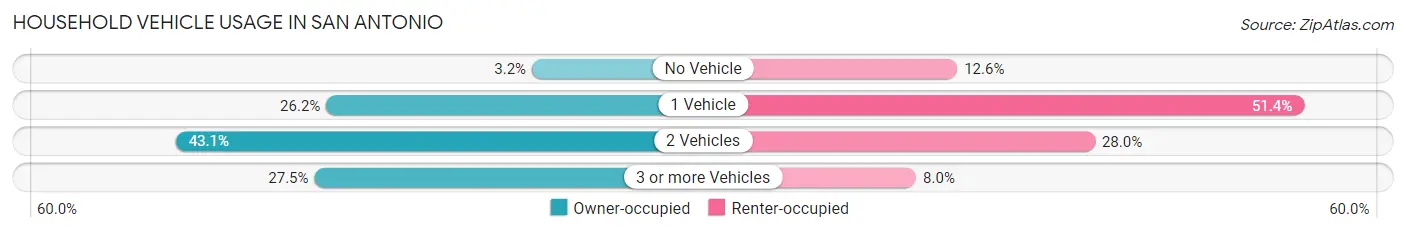
| Vehicles per Household | Owner-occupied | Renter-occupied |
| No Vehicle | 8,933 (3.2%) | 32,825 (12.6%) |
| 1 Vehicle | 73,927 (26.2%) | 134,171 (51.4%) |
| 2 Vehicles | 121,435 (43.1%) | 73,072 (28.0%) |
| 3 or more Vehicles | 77,635 (27.5%) | 20,819 (8.0%) |
| Total | 281,930 (100.0%) | 260,887 (100.0%) |
Real Estate & Mortgages in San Antonio
Real Estate and Mortgage Overview in San Antonio
| Characteristic | Without Mortgage | With Mortgage |
| Housing Units | 123,111 | 158,819 |
| Median Property Value | $163,900 | $221,400 |
| Median Household Income | $61,418 | $36,234 |
| Monthly Housing Costs | $564 | $14,250 |
| Real Estate Taxes | $2,448 | $7,909 |
Property Value by Mortgage Status in San Antonio
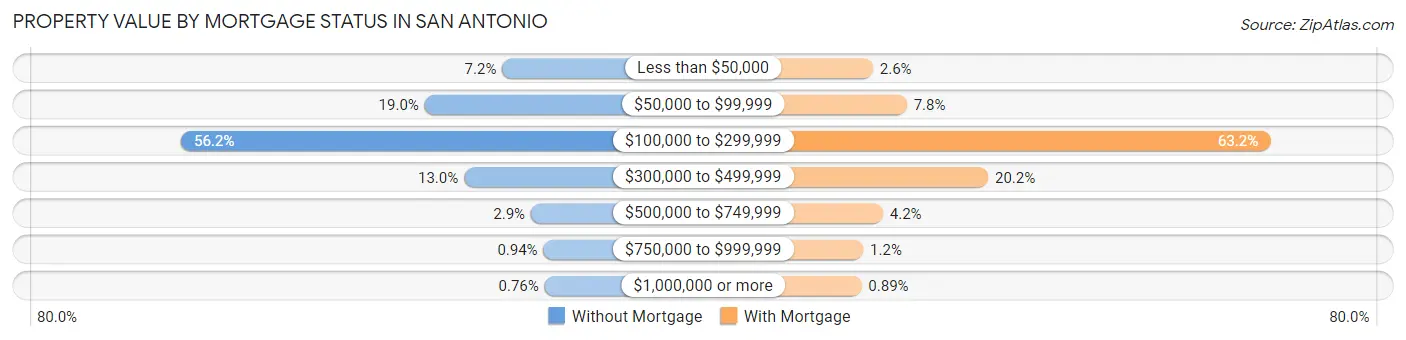
| Property Value | Without Mortgage | With Mortgage |
| Less than $50,000 | 8,889 (7.2%) | 4,191 (2.6%) |
| $50,000 to $99,999 | 23,446 (19.0%) | 12,391 (7.8%) |
| $100,000 to $299,999 | 69,139 (56.2%) | 100,315 (63.2%) |
| $300,000 to $499,999 | 16,040 (13.0%) | 32,059 (20.2%) |
| $500,000 to $749,999 | 3,505 (2.9%) | 6,613 (4.2%) |
| $750,000 to $999,999 | 1,153 (0.9%) | 1,836 (1.2%) |
| $1,000,000 or more | 939 (0.8%) | 1,414 (0.9%) |
| Total | 123,111 (100.0%) | 158,819 (100.0%) |
Household Income by Mortgage Status in San Antonio
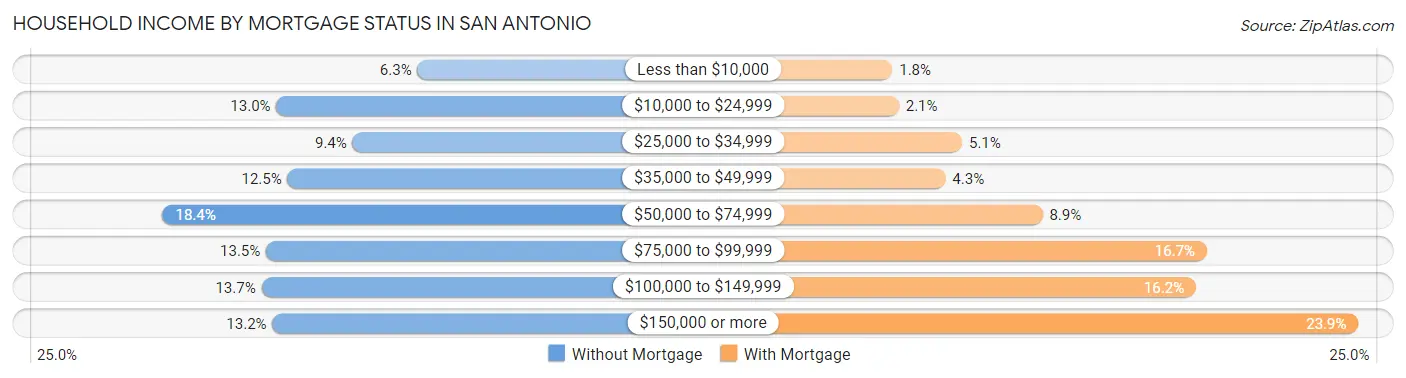
| Household Income | Without Mortgage | With Mortgage |
| Less than $10,000 | 7,743 (6.3%) | 2,783 (1.8%) |
| $10,000 to $24,999 | 16,017 (13.0%) | 3,279 (2.1%) |
| $25,000 to $34,999 | 11,547 (9.4%) | 8,048 (5.1%) |
| $35,000 to $49,999 | 15,364 (12.5%) | 6,799 (4.3%) |
| $50,000 to $74,999 | 22,684 (18.4%) | 14,128 (8.9%) |
| $75,000 to $99,999 | 16,616 (13.5%) | 26,572 (16.7%) |
| $100,000 to $149,999 | 16,885 (13.7%) | 25,744 (16.2%) |
| $150,000 or more | 16,255 (13.2%) | 38,015 (23.9%) |
| Total | 123,111 (100.0%) | 158,819 (100.0%) |
Property Value to Household Income Ratio in San Antonio
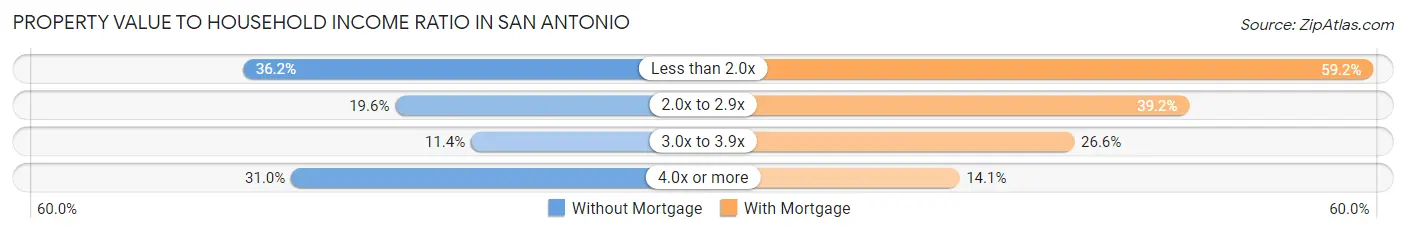
| Value-to-Income Ratio | Without Mortgage | With Mortgage |
| Less than 2.0x | 44,590 (36.2%) | 94,037 (59.2%) |
| 2.0x to 2.9x | 24,137 (19.6%) | 62,188 (39.2%) |
| 3.0x to 3.9x | 13,981 (11.4%) | 42,256 (26.6%) |
| 4.0x or more | 38,119 (31.0%) | 22,380 (14.1%) |
| Total | 123,111 (100.0%) | 158,819 (100.0%) |
Real Estate Taxes by Mortgage Status in San Antonio
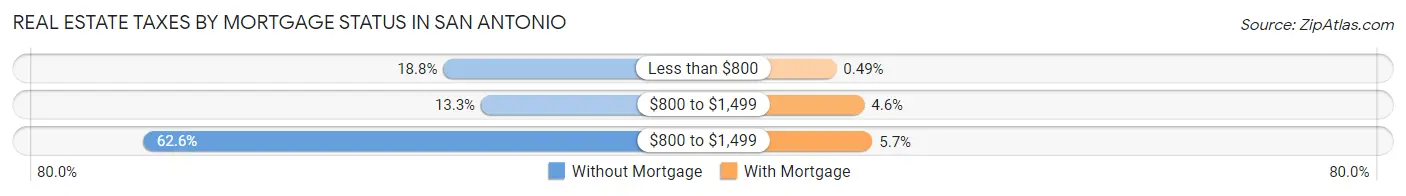
| Property Taxes | Without Mortgage | With Mortgage |
| Less than $800 | 23,176 (18.8%) | 779 (0.5%) |
| $800 to $1,499 | 16,404 (13.3%) | 7,259 (4.6%) |
| $800 to $1,499 | 77,015 (62.6%) | 9,124 (5.7%) |
| Total | 123,111 (100.0%) | 158,819 (100.0%) |
Health & Disability in San Antonio
Health Insurance Coverage by Age in San Antonio
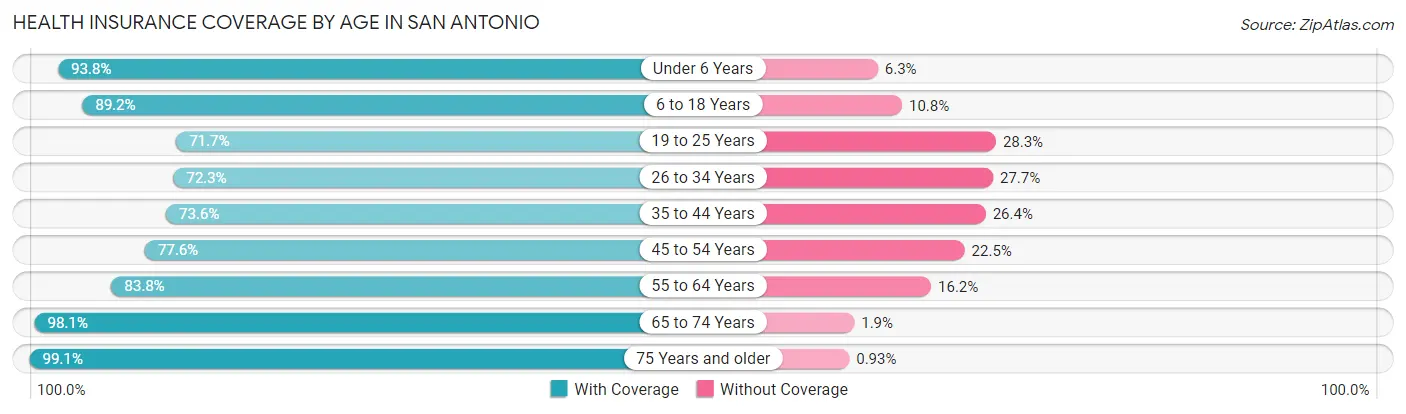
| Age Bracket | With Coverage | Without Coverage |
| Under 6 Years | 104,908 (93.8%) | 6,994 (6.2%) |
| 6 to 18 Years | 230,082 (89.2%) | 27,778 (10.8%) |
| 19 to 25 Years | 112,522 (71.7%) | 44,376 (28.3%) |
| 26 to 34 Years | 147,947 (72.3%) | 56,792 (27.7%) |
| 35 to 44 Years | 142,114 (73.6%) | 50,935 (26.4%) |
| 45 to 54 Years | 130,016 (77.5%) | 37,636 (22.5%) |
| 55 to 64 Years | 127,145 (83.8%) | 24,558 (16.2%) |
| 65 to 74 Years | 107,007 (98.1%) | 2,024 (1.9%) |
| 75 Years and older | 71,242 (99.1%) | 666 (0.9%) |
| Total | 1,172,983 (82.3%) | 251,759 (17.7%) |
Health Insurance Coverage by Citizenship Status in San Antonio
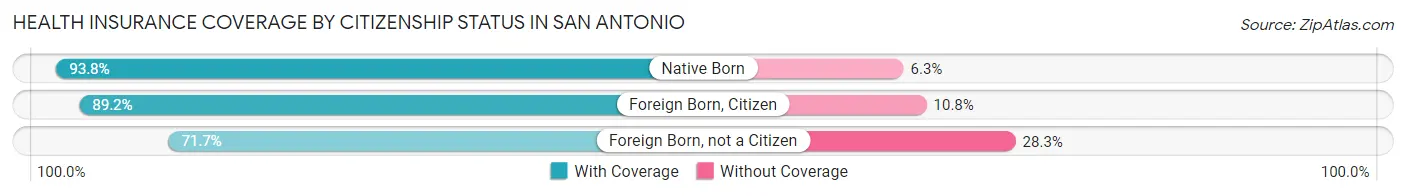
| Citizenship Status | With Coverage | Without Coverage |
| Native Born | 104,908 (93.8%) | 6,994 (6.2%) |
| Foreign Born, Citizen | 230,082 (89.2%) | 27,778 (10.8%) |
| Foreign Born, not a Citizen | 112,522 (71.7%) | 44,376 (28.3%) |
Health Insurance Coverage by Household Income in San Antonio
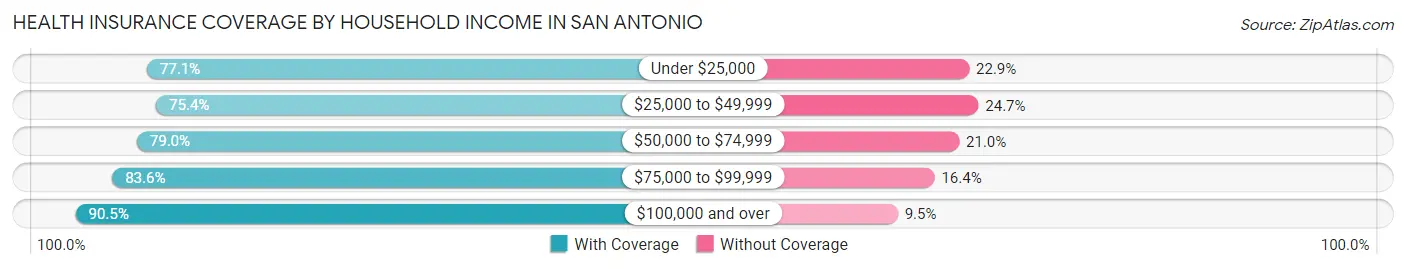
| Household Income | With Coverage | Without Coverage |
| Under $25,000 | 161,369 (77.1%) | 47,977 (22.9%) |
| $25,000 to $49,999 | 214,561 (75.3%) | 70,193 (24.6%) |
| $50,000 to $74,999 | 204,608 (79.0%) | 54,512 (21.0%) |
| $75,000 to $99,999 | 171,689 (83.6%) | 33,754 (16.4%) |
| $100,000 and over | 410,375 (90.5%) | 43,297 (9.5%) |
Public vs Private Health Insurance Coverage by Age in San Antonio
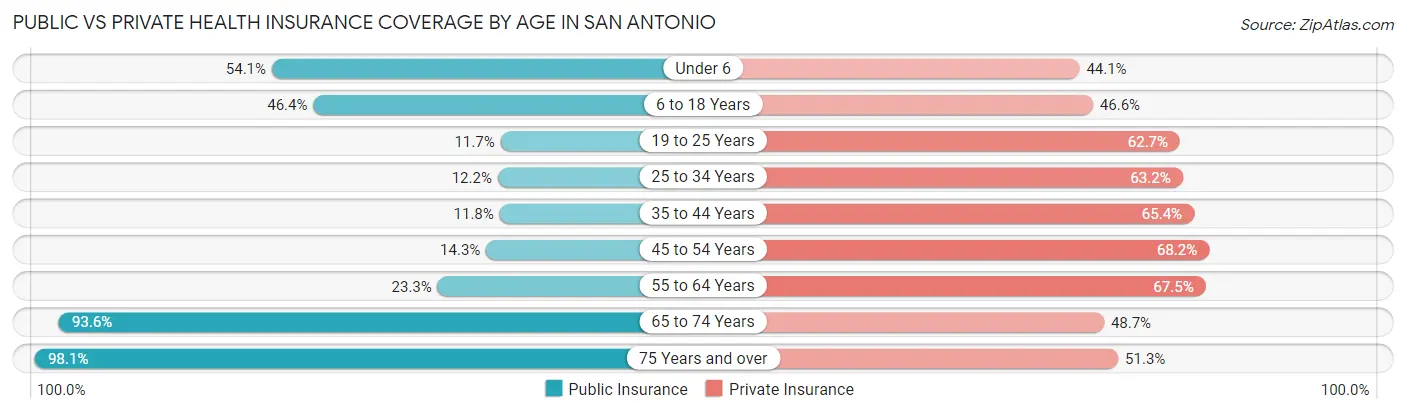
| Age Bracket | Public Insurance | Private Insurance |
| Under 6 | 60,555 (54.1%) | 49,359 (44.1%) |
| 6 to 18 Years | 119,698 (46.4%) | 120,200 (46.6%) |
| 19 to 25 Years | 18,309 (11.7%) | 98,437 (62.7%) |
| 25 to 34 Years | 24,932 (12.2%) | 129,461 (63.2%) |
| 35 to 44 Years | 22,836 (11.8%) | 126,149 (65.3%) |
| 45 to 54 Years | 24,030 (14.3%) | 114,266 (68.2%) |
| 55 to 64 Years | 35,404 (23.3%) | 102,405 (67.5%) |
| 65 to 74 Years | 102,090 (93.6%) | 53,054 (48.7%) |
| 75 Years and over | 70,522 (98.1%) | 36,886 (51.3%) |
| Total | 478,376 (33.6%) | 830,217 (58.3%) |
Disability Status by Sex by Age in San Antonio
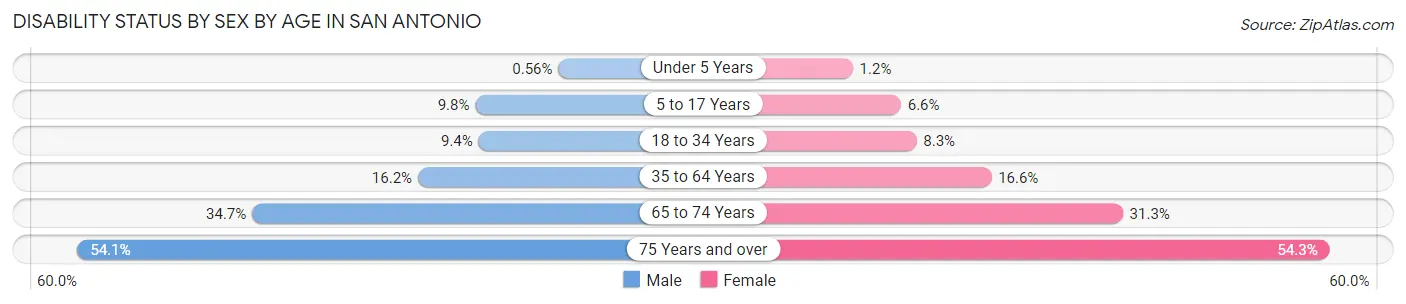
| Age Bracket | Male | Female |
| Under 5 Years | 262 (0.6%) | 556 (1.2%) |
| 5 to 17 Years | 12,841 (9.8%) | 8,149 (6.6%) |
| 18 to 34 Years | 18,391 (9.4%) | 15,654 (8.3%) |
| 35 to 64 Years | 41,105 (16.2%) | 43,031 (16.6%) |
| 65 to 74 Years | 16,976 (34.7%) | 18,782 (31.3%) |
| 75 Years and over | 15,285 (54.1%) | 23,723 (54.3%) |
Disability Class by Sex by Age in San Antonio
Disability Class: Hearing Difficulty
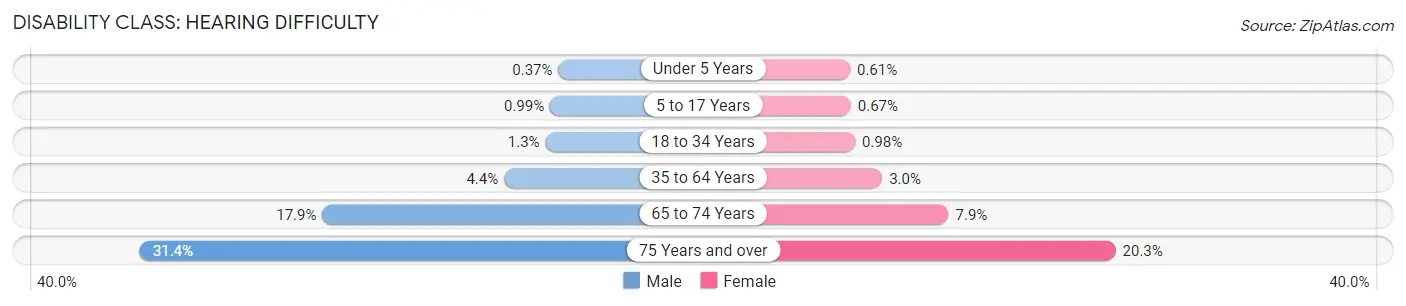
| Age Bracket | Male | Female |
| Under 5 Years | 174 (0.4%) | 282 (0.6%) |
| 5 to 17 Years | 1,292 (1.0%) | 834 (0.7%) |
| 18 to 34 Years | 2,585 (1.3%) | 1,852 (1.0%) |
| 35 to 64 Years | 11,169 (4.4%) | 7,751 (3.0%) |
| 65 to 74 Years | 8,767 (17.9%) | 4,761 (7.9%) |
| 75 Years and over | 8,879 (31.4%) | 8,877 (20.3%) |
Disability Class: Vision Difficulty
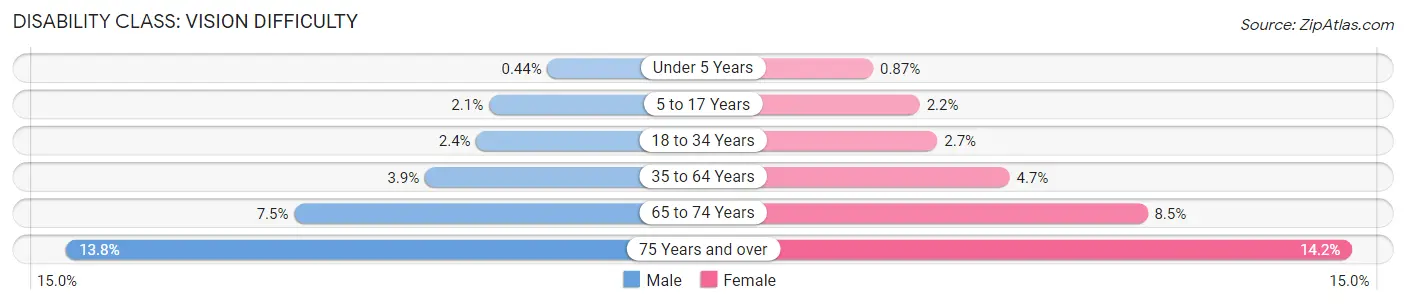
| Age Bracket | Male | Female |
| Under 5 Years | 207 (0.4%) | 398 (0.9%) |
| 5 to 17 Years | 2,715 (2.1%) | 2,694 (2.2%) |
| 18 to 34 Years | 4,709 (2.4%) | 5,012 (2.7%) |
| 35 to 64 Years | 9,761 (3.8%) | 12,081 (4.7%) |
| 65 to 74 Years | 3,668 (7.5%) | 5,107 (8.5%) |
| 75 Years and over | 3,908 (13.8%) | 6,206 (14.2%) |
Disability Class: Cognitive Difficulty

| Age Bracket | Male | Female |
| 5 to 17 Years | 9,960 (7.6%) | 5,195 (4.2%) |
| 18 to 34 Years | 11,450 (5.9%) | 7,939 (4.2%) |
| 35 to 64 Years | 16,425 (6.5%) | 15,951 (6.2%) |
| 65 to 74 Years | 4,540 (9.3%) | 4,236 (7.0%) |
| 75 Years and over | 4,380 (15.5%) | 7,245 (16.6%) |
Disability Class: Ambulatory Difficulty
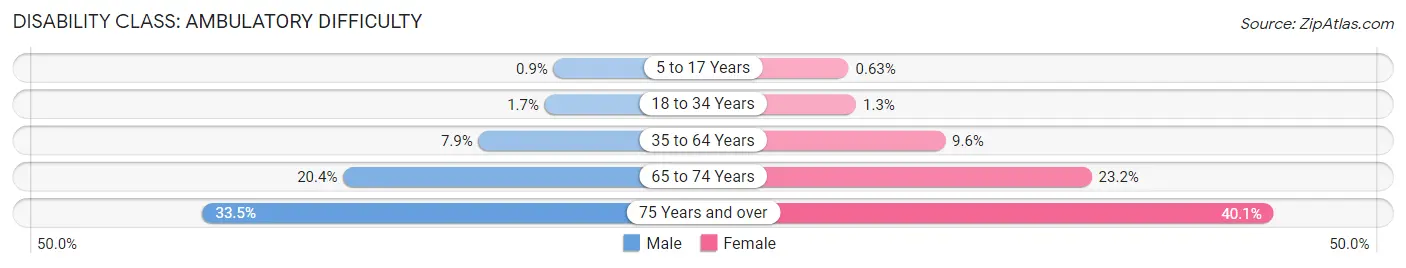
| Age Bracket | Male | Female |
| 5 to 17 Years | 1,180 (0.9%) | 781 (0.6%) |
| 18 to 34 Years | 3,355 (1.7%) | 2,510 (1.3%) |
| 35 to 64 Years | 19,962 (7.9%) | 24,792 (9.6%) |
| 65 to 74 Years | 10,009 (20.4%) | 13,926 (23.2%) |
| 75 Years and over | 9,453 (33.5%) | 17,496 (40.1%) |
Disability Class: Self-Care Difficulty
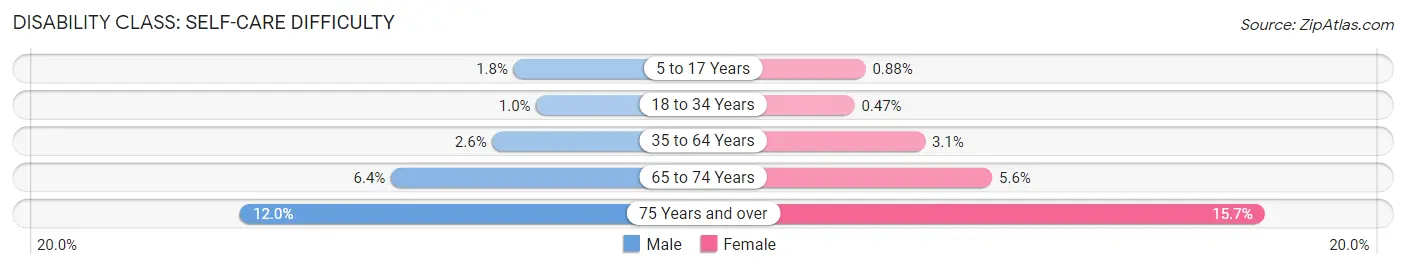
| Age Bracket | Male | Female |
| 5 to 17 Years | 2,404 (1.8%) | 1,086 (0.9%) |
| 18 to 34 Years | 1,951 (1.0%) | 890 (0.5%) |
| 35 to 64 Years | 6,683 (2.6%) | 7,988 (3.1%) |
| 65 to 74 Years | 3,132 (6.4%) | 3,353 (5.6%) |
| 75 Years and over | 3,388 (12.0%) | 6,853 (15.7%) |
Technology Access in San Antonio
Computing Device Access in San Antonio
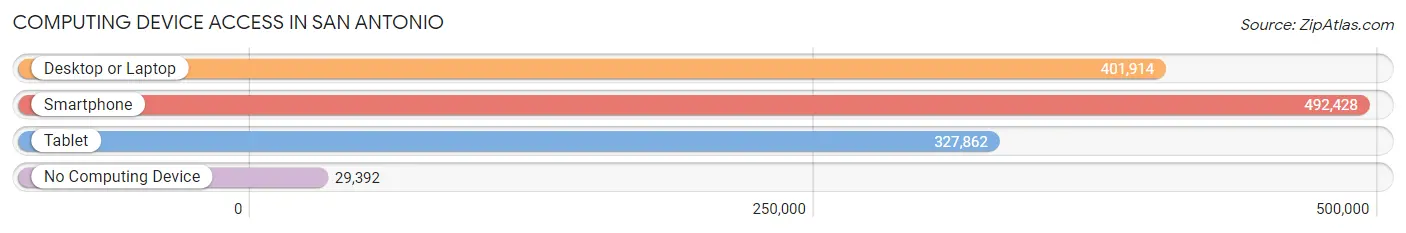
| Device Type | # Households | % Households |
| Desktop or Laptop | 401,914 | 74.0% |
| Smartphone | 492,428 | 90.7% |
| Tablet | 327,862 | 60.4% |
| No Computing Device | 29,392 | 5.4% |
| Total | 542,817 | 100.0% |
Internet Access in San Antonio
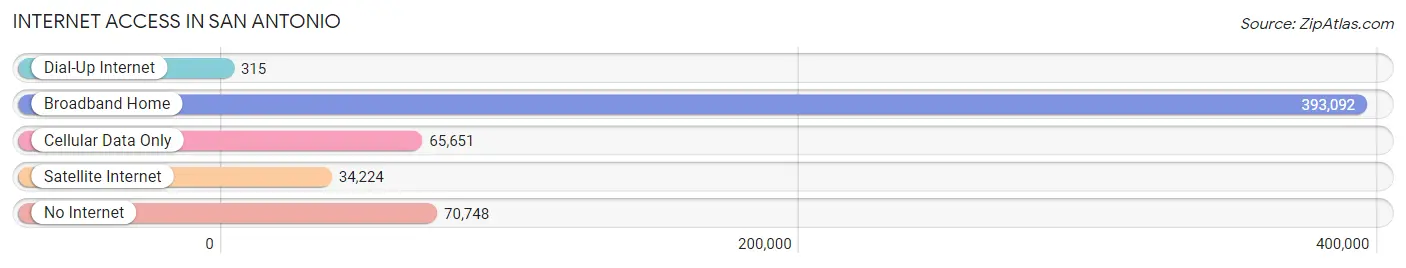
| Internet Type | # Households | % Households |
| Dial-Up Internet | 315 | 0.1% |
| Broadband Home | 393,092 | 72.4% |
| Cellular Data Only | 65,651 | 12.1% |
| Satellite Internet | 34,224 | 6.3% |
| No Internet | 70,748 | 13.0% |
| Total | 542,817 | 100.0% |
San Antonio Summary
San Antonio, Texas is a vibrant city located in the south-central region of the United States. It is the second-largest city in the state of Texas and the seventh-largest city in the United States. San Antonio is known for its rich history, diverse culture, and vibrant economy.
History
San Antonio has a long and rich history that dates back to the early 1700s. The area was originally inhabited by the Coahuiltecan Indians, who were later displaced by Spanish settlers in the late 1700s. The Spanish established a mission in the area in 1718, which eventually became the city of San Antonio. The city was named after Saint Anthony of Padua, and it quickly became a major trading post for the Spanish.
In 1821, Mexico declared its independence from Spain, and San Antonio became part of the newly formed Mexican state of Coahuila y Tejas. The city continued to grow and prosper, and in 1836, it became the site of the famous Battle of the Alamo. The battle was a pivotal moment in the Texas Revolution, and it helped to secure Texas’ independence from Mexico.
In 1845, Texas was annexed by the United States, and San Antonio became part of the state of Texas. The city continued to grow and develop, and by the early 1900s, it had become a major industrial center. The city was also home to a large military presence, and it was the site of several major military bases.
Geography
San Antonio is located in south-central Texas, about 80 miles southwest of Austin. The city is situated on the Balcones Escarpment, a geological formation that runs through the region. The city is bordered by the San Antonio River to the south and the Edwards Plateau to the north.
The city has a total area of 465 square miles, and it is divided into several distinct neighborhoods. The downtown area is the city’s main business district, and it is home to many of the city’s major attractions, including the Alamo and the River Walk. Other neighborhoods include the South Side, the West Side, and the North Side.
Economy
San Antonio has a strong and diverse economy that is driven by several major industries. The city is home to a large military presence, and it is the site of several major military bases, including Lackland Air Force Base and Fort Sam Houston. The city is also home to a large number of technology companies, including Rackspace, USAA, and Valero Energy.
The city is also a major tourist destination, and it is home to several popular attractions, including the Alamo, the River Walk, and SeaWorld San Antonio. The city is also home to several major sports teams, including the San Antonio Spurs of the NBA and the San Antonio Missions of the minor leagues.
Demographics
As of the 2010 census, San Antonio had a population of 1,327,407. The city is racially and ethnically diverse, and it is home to a large Hispanic population. The city’s population is also diverse in terms of age, with a median age of 33.7 years.
The city’s economy is also diverse, with a mix of industries that include military, technology, tourism, and sports. The city’s unemployment rate is 4.2%, which is lower than the national average. The city’s median household income is $45,722, which is slightly lower than the national average.
San Antonio is a vibrant and diverse city with a rich history, diverse culture, and vibrant economy. The city is home to a large military presence, a thriving technology sector, and a booming tourism industry. The city is also home to a diverse population that is racially and ethnically diverse. San Antonio is a great place to live, work, and visit.
Common Questions
What is Per Capita Income in San Antonio?
Per Capita income in San Antonio is $31,148.
What is the Median Family Income in San Antonio?
Median Family Income in San Antonio is $72,452.
What is the Median Household income in San Antonio?
Median Household Income in San Antonio is $59,593.
What is Income or Wage Gap in San Antonio?
Income or Wage Gap in San Antonio is 19.9%.
Women in San Antonio earn 80.1 cents for every dollar earned by a man.
What is Family Income Deficit in San Antonio?
Family Income Deficit in San Antonio is $11,584.
Families that are below poverty line in San Antonio earn $11,584 less on average than the poverty threshold level.
What is Inequality or Gini Index in San Antonio?
Inequality or Gini Index in San Antonio is 0.46.
What is the Total Population of San Antonio?
Total Population of San Antonio is 1,445,662.
What is the Total Male Population of San Antonio?
Total Male Population of San Antonio is 717,891.
What is the Total Female Population of San Antonio?
Total Female Population of San Antonio is 727,771.
What is the Ratio of Males per 100 Females in San Antonio?
There are 98.64 Males per 100 Females in San Antonio.
What is the Ratio of Females per 100 Males in San Antonio?
There are 101.38 Females per 100 Males in San Antonio.
What is the Median Population Age in San Antonio?
Median Population Age in San Antonio is 34.1 Years.
What is the Average Family Size in San Antonio
Average Family Size in San Antonio is 3.4 People.
What is the Average Household Size in San Antonio
Average Household Size in San Antonio is 2.6 People.
How Large is the Labor Force in San Antonio?
There are 748,736 People in the Labor Forcein in San Antonio.
What is the Percentage of People in the Labor Force in San Antonio?
65.8% of People are in the Labor Force in San Antonio.
What is the Unemployment Rate in San Antonio?
Unemployment Rate in San Antonio is 5.9%.