Austin, TX Map & Demographics
Austin Map
Austin Overview
$54,673
PER CAPITA INCOME
$115,154
AVG FAMILY INCOME
$86,556
AVG HOUSEHOLD INCOME
19.1%
WAGE / INCOME GAP [ % ]
80.9¢/ $1
WAGE / INCOME GAP [ $ ]
$10,878
FAMILY INCOME DEFICIT
0.48
INEQUALITY / GINI INDEX
958,202
TOTAL POPULATION
491,099
MALE POPULATION
467,103
FEMALE POPULATION
105.14
MALES / 100 FEMALES
95.11
FEMALES / 100 MALES
34.2
MEDIAN AGE
3.0
AVG FAMILY SIZE
2.2
AVG HOUSEHOLD SIZE
597,529
LABOR FORCE [ PEOPLE ]
74.9%
PERCENT IN LABOR FORCE
4.4%
UNEMPLOYMENT RATE
Austin Zip Codes
Income in Austin
Income Overview in Austin
Per Capita Income in Austin is $54,673, while median incomes of families and households are $115,154 and $86,556 respectively.
| Characteristic | Number | Measure |
| Per Capita Income | 958,202 | $54,673 |
| Median Family Income | 211,380 | $115,154 |
| Mean Family Income | 211,380 | $153,457 |
| Median Household Income | 423,079 | $86,556 |
| Mean Household Income | 423,079 | $122,474 |
| Income Deficit | 211,380 | $10,878 |
| Wage / Income Gap (%) | 958,202 | 19.13% |
| Wage / Income Gap ($) | 958,202 | 80.87¢ per $1 |
| Gini / Inequality Index | 958,202 | 0.48 |
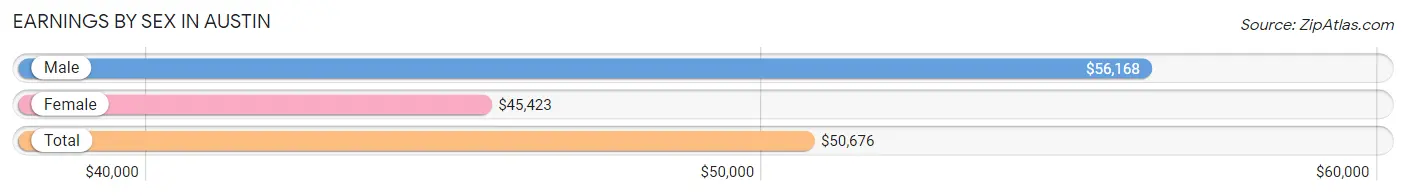
Earnings by Sex in Austin
Average Earnings in Austin are $50,676, $56,168 for men and $45,423 for women, a difference of 19.1%.
| Sex | Number | Average Earnings |
| Male | 337,147 (54.4%) | $56,168 |
| Female | 282,788 (45.6%) | $45,423 |
| Total | 619,935 (100.0%) | $50,676 |
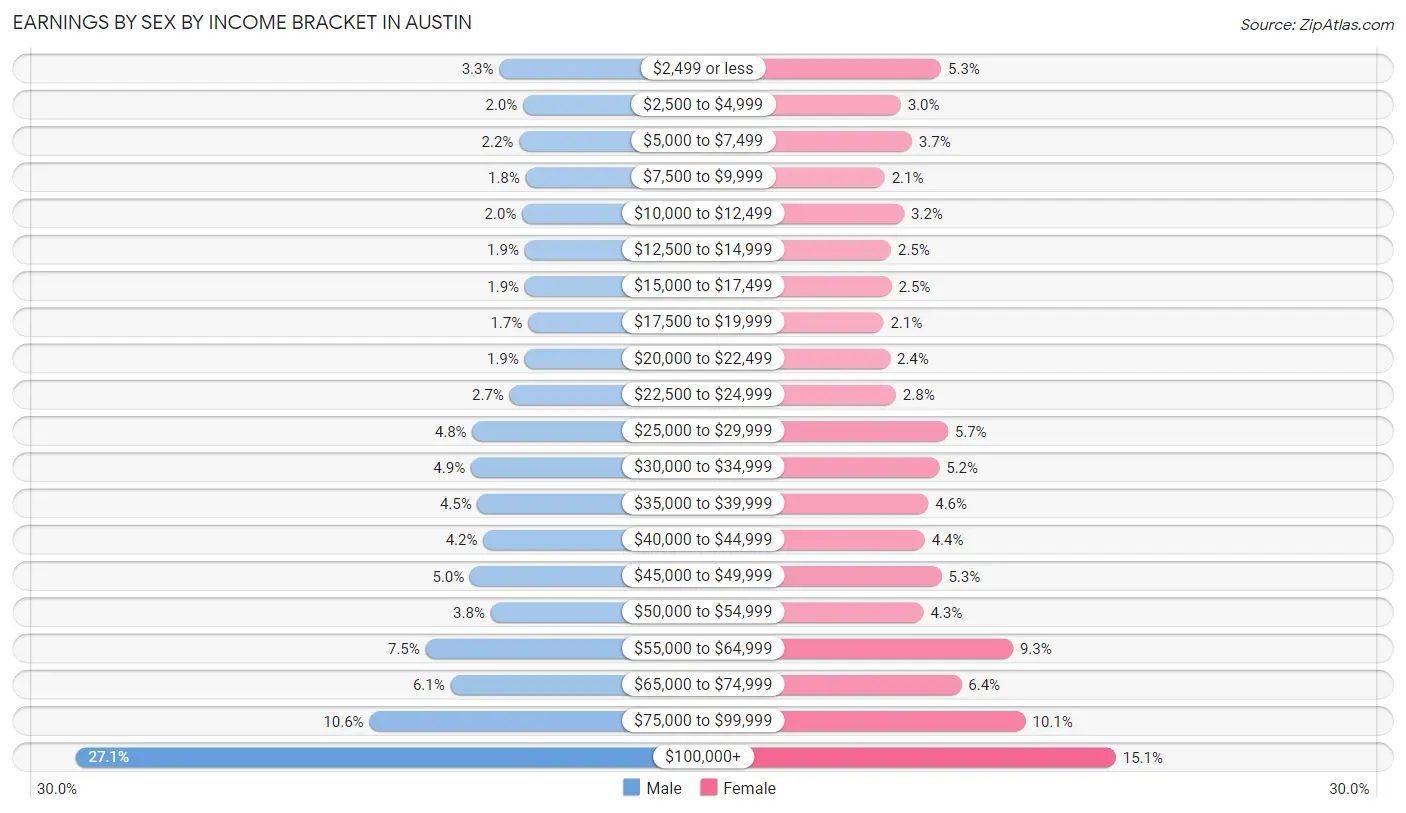
Earnings by Sex by Income Bracket in Austin
The most common earnings brackets in Austin are $100,000+ for men (91,462 | 27.1%) and $100,000+ for women (42,762 | 15.1%).
| Income | Male | Female |
| $2,499 or less | 11,177 (3.3%) | 15,001 (5.3%) |
| $2,500 to $4,999 | 6,665 (2.0%) | 8,563 (3.0%) |
| $5,000 to $7,499 | 7,421 (2.2%) | 10,341 (3.7%) |
| $7,500 to $9,999 | 6,211 (1.8%) | 6,023 (2.1%) |
| $10,000 to $12,499 | 6,851 (2.0%) | 9,093 (3.2%) |
| $12,500 to $14,999 | 6,387 (1.9%) | 7,017 (2.5%) |
| $15,000 to $17,499 | 6,349 (1.9%) | 7,127 (2.5%) |
| $17,500 to $19,999 | 5,721 (1.7%) | 5,814 (2.1%) |
| $20,000 to $22,499 | 6,409 (1.9%) | 6,863 (2.4%) |
| $22,500 to $24,999 | 9,223 (2.7%) | 7,791 (2.8%) |
| $25,000 to $29,999 | 16,273 (4.8%) | 16,050 (5.7%) |
| $30,000 to $34,999 | 16,563 (4.9%) | 14,713 (5.2%) |
| $35,000 to $39,999 | 15,308 (4.5%) | 12,945 (4.6%) |
| $40,000 to $44,999 | 14,215 (4.2%) | 12,394 (4.4%) |
| $45,000 to $49,999 | 16,709 (5.0%) | 15,052 (5.3%) |
| $50,000 to $54,999 | 12,813 (3.8%) | 12,187 (4.3%) |
| $55,000 to $64,999 | 25,164 (7.5%) | 26,425 (9.3%) |
| $65,000 to $74,999 | 20,424 (6.1%) | 18,216 (6.4%) |
| $75,000 to $99,999 | 35,802 (10.6%) | 28,411 (10.1%) |
| $100,000+ | 91,462 (27.1%) | 42,762 (15.1%) |
| Total | 337,147 (100.0%) | 282,788 (100.0%) |
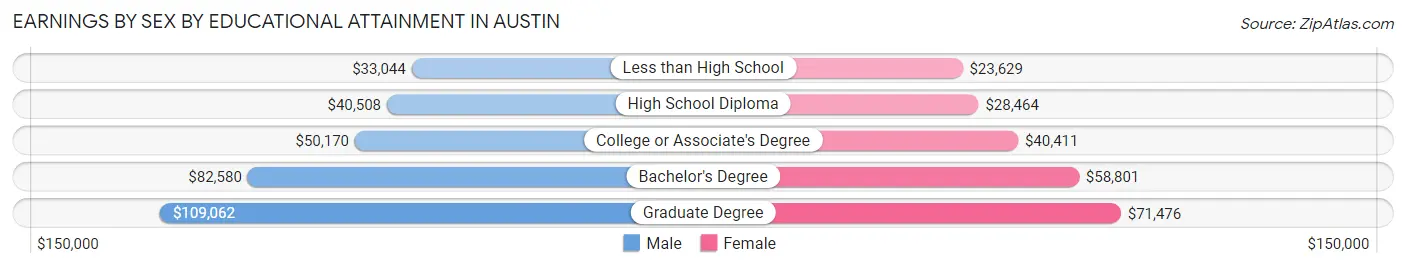
Earnings by Sex by Educational Attainment in Austin
Average earnings in Austin are $63,361 for men and $51,370 for women, a difference of 18.9%. Men with an educational attainment of graduate degree enjoy the highest average annual earnings of $109,062, while those with less than high school education earn the least with $33,044. Women with an educational attainment of graduate degree earn the most with the average annual earnings of $71,476, while those with less than high school education have the smallest earnings of $23,629.
| Educational Attainment | Male Income | Female Income |
| Less than High School | $33,044 | $23,629 |
| High School Diploma | $40,508 | $28,464 |
| College or Associate's Degree | $50,170 | $40,411 |
| Bachelor's Degree | $82,580 | $58,801 |
| Graduate Degree | $109,062 | $71,476 |
| Total | $63,361 | $51,370 |
Family Income in Austin
Family Income Brackets in Austin
According to the Austin family income data, there are 49,674 families falling into the $200,000+ income range, which is the most common income bracket and makes up 23.5% of all families. Conversely, the $10,000 to $14,999 income bracket is the least frequent group with only 3,593 families (1.7%) belonging to this category.
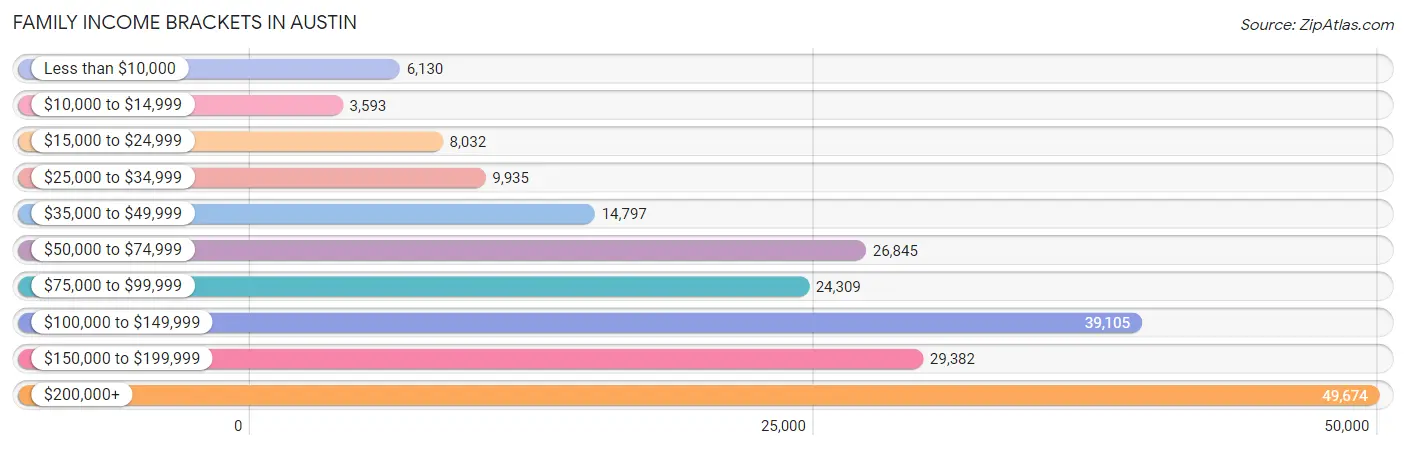
| Income Bracket | # Families | % Families |
| Less than $10,000 | 6,130 | 2.9% |
| $10,000 to $14,999 | 3,593 | 1.7% |
| $15,000 to $24,999 | 8,032 | 3.8% |
| $25,000 to $34,999 | 9,935 | 4.7% |
| $35,000 to $49,999 | 14,797 | 7.0% |
| $50,000 to $74,999 | 26,845 | 12.7% |
| $75,000 to $99,999 | 24,309 | 11.5% |
| $100,000 to $149,999 | 39,105 | 18.5% |
| $150,000 to $199,999 | 29,382 | 13.9% |
| $200,000+ | 49,674 | 23.5% |
Family Income by Famaliy Size in Austin
4-person families (37,877 | 17.9%) account for the highest median family income in Austin with $141,947 per family, while 2-person families (99,239 | 46.9%) have the highest median income of $51,168 per family member.
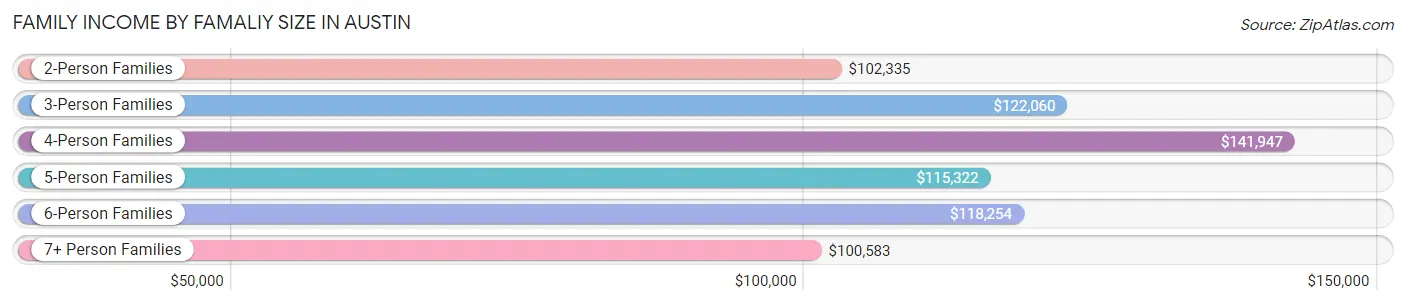
| Income Bracket | # Families | Median Income |
| 2-Person Families | 99,239 (46.9%) | $102,335 |
| 3-Person Families | 50,578 (23.9%) | $122,060 |
| 4-Person Families | 37,877 (17.9%) | $141,947 |
| 5-Person Families | 15,381 (7.3%) | $115,322 |
| 6-Person Families | 5,212 (2.5%) | $118,254 |
| 7+ Person Families | 3,093 (1.5%) | $100,583 |
| Total | 211,380 (100.0%) | $115,154 |
Family Income by Number of Earners in Austin
The median family income in Austin is $115,154, with families comprising 2 earners (110,184) having the highest median family income of $145,383, while families with no earners (17,000) have the lowest median family income of $49,095, accounting for 52.1% and 8.0% of families, respectively.
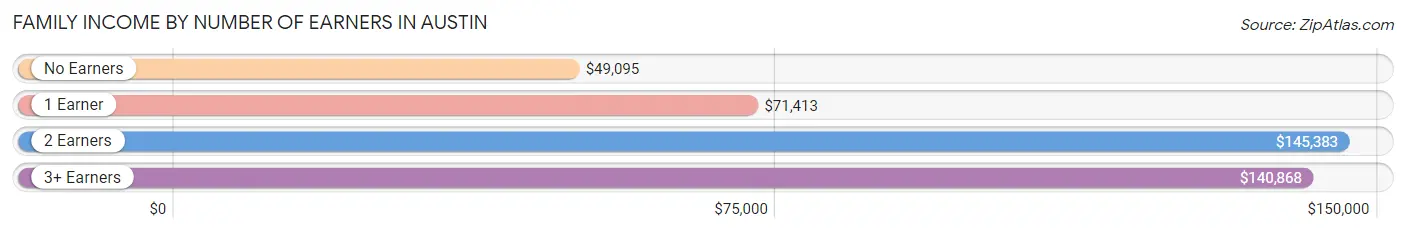
| Number of Earners | # Families | Median Income |
| No Earners | 17,000 (8.0%) | $49,095 |
| 1 Earner | 64,293 (30.4%) | $71,413 |
| 2 Earners | 110,184 (52.1%) | $145,383 |
| 3+ Earners | 19,903 (9.4%) | $140,868 |
| Total | 211,380 (100.0%) | $115,154 |
Household Income in Austin
Household Income Brackets in Austin
With 73,193 households falling in the category, the $100,000 to $149,999 income range is the most frequent in Austin, accounting for 17.3% of all households. In contrast, only 11,846 households (2.8%) fall into the $10,000 to $14,999 income bracket, making it the least populous group.
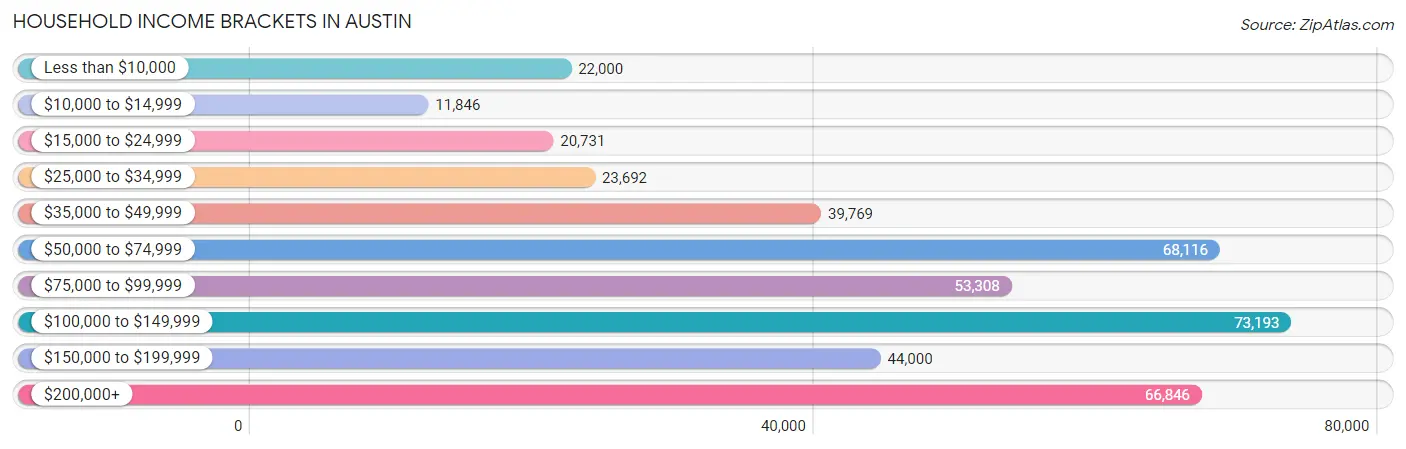
| Income Bracket | # Households | % Households |
| Less than $10,000 | 22,000 | 5.2% |
| $10,000 to $14,999 | 11,846 | 2.8% |
| $15,000 to $24,999 | 20,731 | 4.9% |
| $25,000 to $34,999 | 23,692 | 5.6% |
| $35,000 to $49,999 | 39,769 | 9.4% |
| $50,000 to $74,999 | 68,116 | 16.1% |
| $75,000 to $99,999 | 53,308 | 12.6% |
| $100,000 to $149,999 | 73,193 | 17.3% |
| $150,000 to $199,999 | 44,000 | 10.4% |
| $200,000+ | 66,846 | 15.8% |
Household Income by Householder Age in Austin
The median household income in Austin is $86,556, with the highest median household income of $98,021 found in the 45 to 64 years age bracket for the primary householder. A total of 123,425 households (29.2%) fall into this category. Meanwhile, the 15 to 24 years age bracket for the primary householder has the lowest median household income of $38,954, with 29,990 households (7.1%) in this group.
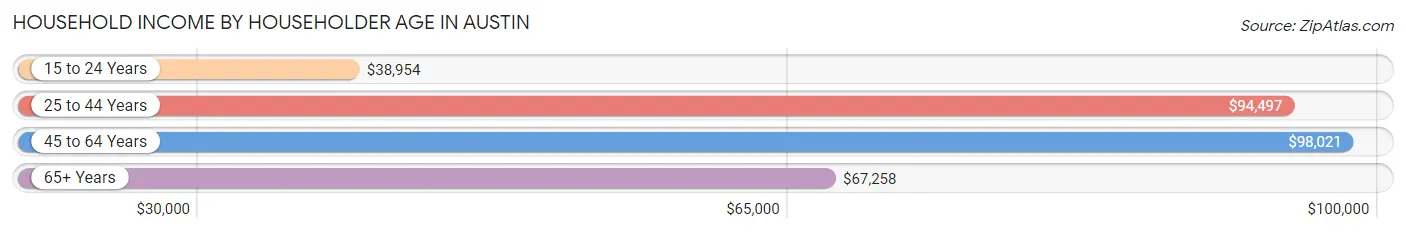
| Income Bracket | # Households | Median Income |
| 15 to 24 Years | 29,990 (7.1%) | $38,954 |
| 25 to 44 Years | 210,187 (49.7%) | $94,497 |
| 45 to 64 Years | 123,425 (29.2%) | $98,021 |
| 65+ Years | 59,477 (14.1%) | $67,258 |
| Total | 423,079 (100.0%) | $86,556 |
Poverty in Austin
Income Below Poverty by Sex and Age in Austin
With 11.4% poverty level for males and 13.5% for females among the residents of Austin, 18 to 24 year old males and 18 to 24 year old females are the most vulnerable to poverty, with 11,315 males (25.3%) and 14,793 females (36.1%) in their respective age groups living below the poverty level.
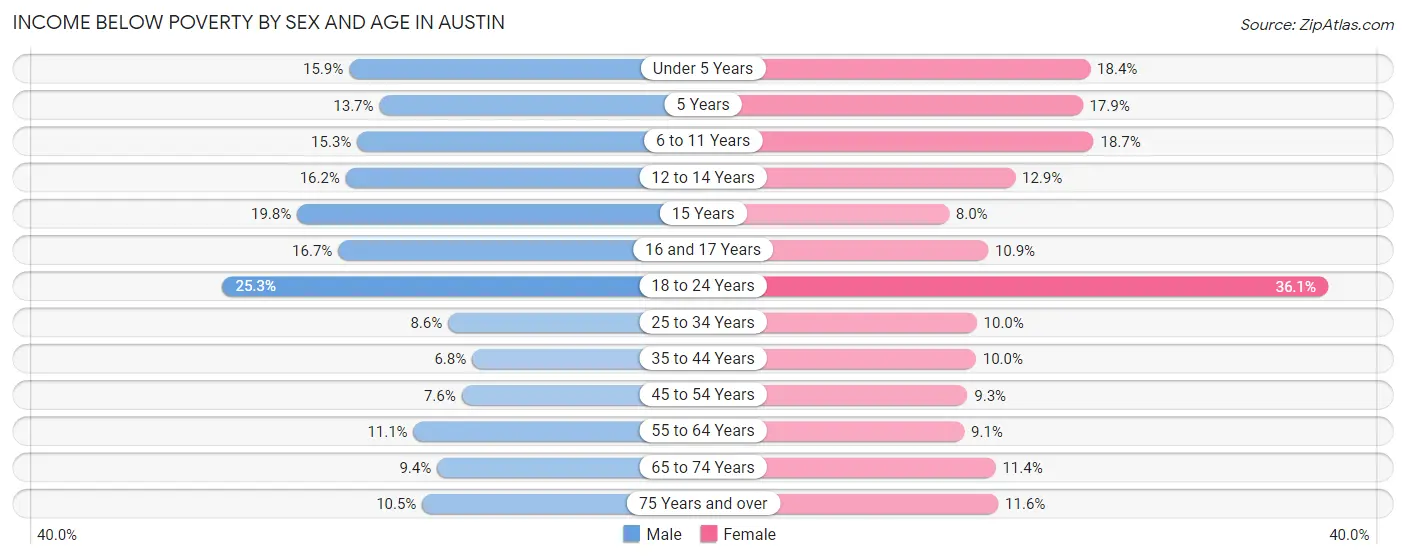
| Age Bracket | Male | Female |
| Under 5 Years | 4,243 (15.9%) | 4,789 (18.4%) |
| 5 Years | 729 (13.7%) | 832 (17.9%) |
| 6 to 11 Years | 4,793 (15.3%) | 5,418 (18.7%) |
| 12 to 14 Years | 2,163 (16.2%) | 1,672 (12.9%) |
| 15 Years | 799 (19.8%) | 408 (8.0%) |
| 16 and 17 Years | 1,560 (16.7%) | 961 (10.8%) |
| 18 to 24 Years | 11,315 (25.3%) | 14,793 (36.1%) |
| 25 to 34 Years | 9,642 (8.6%) | 10,118 (10.0%) |
| 35 to 44 Years | 5,851 (6.8%) | 7,485 (10.0%) |
| 45 to 54 Years | 4,559 (7.6%) | 5,052 (9.3%) |
| 55 to 64 Years | 5,120 (11.1%) | 4,195 (9.1%) |
| 65 to 74 Years | 2,608 (9.4%) | 3,513 (11.4%) |
| 75 Years and over | 1,383 (10.5%) | 2,284 (11.6%) |
| Total | 54,765 (11.4%) | 61,520 (13.5%) |
Income Above Poverty by Sex and Age in Austin
According to the poverty statistics in Austin, males aged 35 to 44 years and females aged 15 years are the age groups that are most secure financially, with 93.2% of males and 92.0% of females in these age groups living above the poverty line.
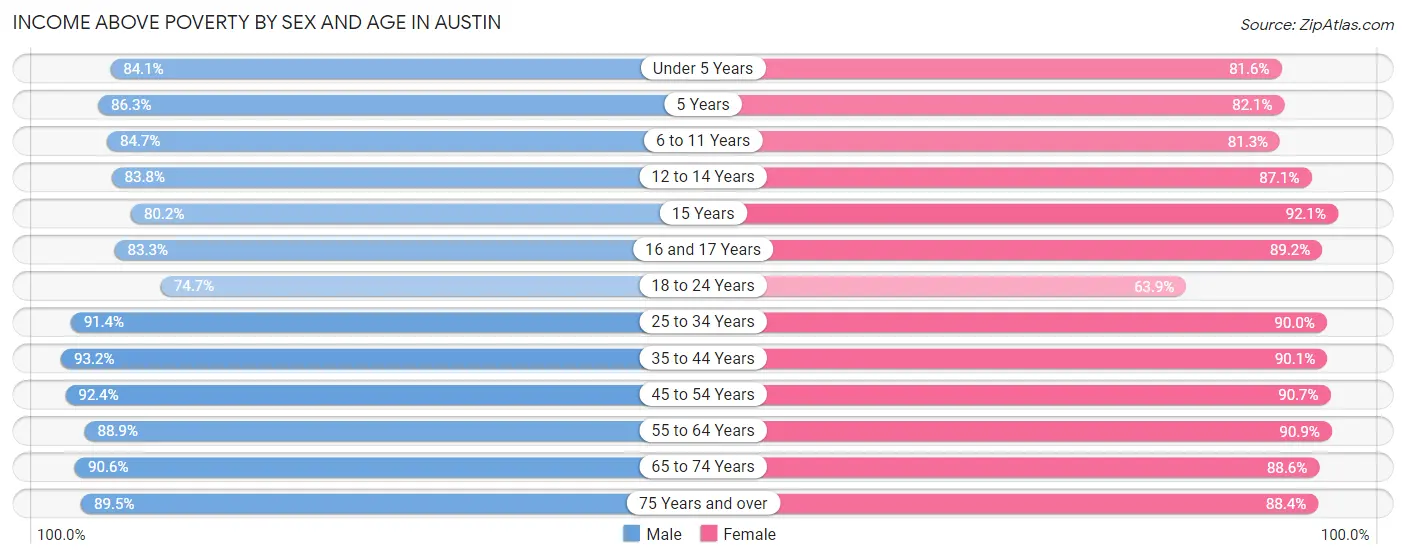
| Age Bracket | Male | Female |
| Under 5 Years | 22,418 (84.1%) | 21,184 (81.6%) |
| 5 Years | 4,609 (86.3%) | 3,824 (82.1%) |
| 6 to 11 Years | 26,522 (84.7%) | 23,570 (81.3%) |
| 12 to 14 Years | 11,220 (83.8%) | 11,329 (87.1%) |
| 15 Years | 3,242 (80.2%) | 4,727 (92.0%) |
| 16 and 17 Years | 7,772 (83.3%) | 7,899 (89.1%) |
| 18 to 24 Years | 33,406 (74.7%) | 26,202 (63.9%) |
| 25 to 34 Years | 102,969 (91.4%) | 90,985 (90.0%) |
| 35 to 44 Years | 80,400 (93.2%) | 67,709 (90.0%) |
| 45 to 54 Years | 55,757 (92.4%) | 49,129 (90.7%) |
| 55 to 64 Years | 40,891 (88.9%) | 42,023 (90.9%) |
| 65 to 74 Years | 25,210 (90.6%) | 27,277 (88.6%) |
| 75 Years and over | 11,808 (89.5%) | 17,385 (88.4%) |
| Total | 426,224 (88.6%) | 393,243 (86.5%) |
Income Below Poverty Among Married-Couple Families in Austin
The poverty statistics for married-couple families in Austin show that 4.4% or 6,837 of the total 156,824 families live below the poverty line. Families with 5 or more children have the highest poverty rate of 29.1%, comprising of 187 families. On the other hand, families with no children have the lowest poverty rate of 3.1%, which includes 2,646 families.
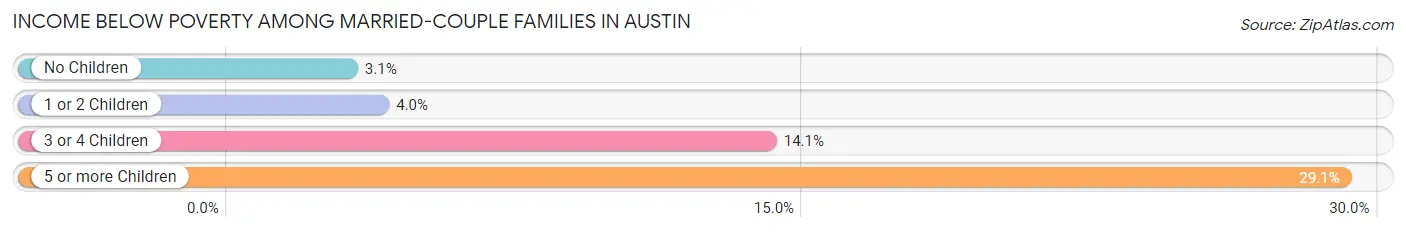
| Children | Above Poverty | Below Poverty |
| No Children | 81,872 (96.9%) | 2,646 (3.1%) |
| 1 or 2 Children | 57,693 (96.1%) | 2,372 (4.0%) |
| 3 or 4 Children | 9,966 (85.9%) | 1,632 (14.1%) |
| 5 or more Children | 456 (70.9%) | 187 (29.1%) |
| Total | 149,987 (95.6%) | 6,837 (4.4%) |
Income Below Poverty Among Single-Parent Households in Austin
According to the poverty data in Austin, 10.6% or 1,712 single-father households and 23.1% or 8,870 single-mother households are living below the poverty line. Among single-father households, those with 5 or more children have the highest poverty rate, with 38 households (23.3%) experiencing poverty. Likewise, among single-mother households, those with 5 or more children have the highest poverty rate, with 208 households (60.5%) falling below the poverty line.
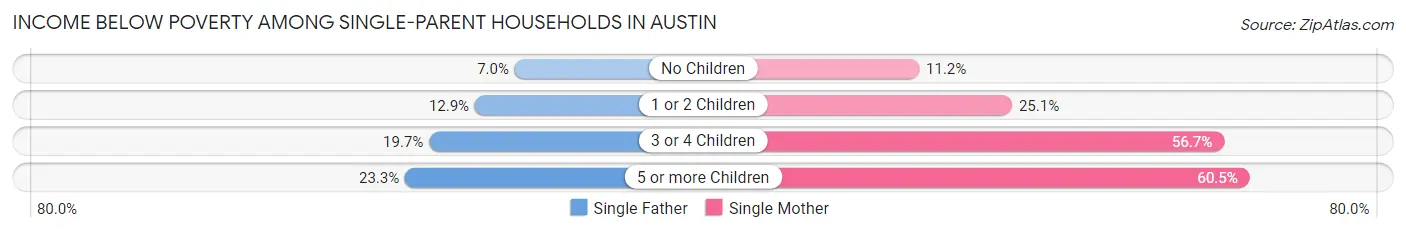
| Children | Single Father | Single Mother |
| No Children | 532 (7.0%) | 1,654 (11.2%) |
| 1 or 2 Children | 947 (12.9%) | 4,949 (25.1%) |
| 3 or 4 Children | 195 (19.7%) | 2,059 (56.7%) |
| 5 or more Children | 38 (23.3%) | 208 (60.5%) |
| Total | 1,712 (10.6%) | 8,870 (23.1%) |
Income Below Poverty Among Married-Couple vs Single-Parent Households in Austin
The poverty data for Austin shows that 6,837 of the married-couple family households (4.4%) and 10,582 of the single-parent households (19.4%) are living below the poverty level. Within the married-couple family households, those with 5 or more children have the highest poverty rate, with 187 households (29.1%) falling below the poverty line. Among the single-parent households, those with 3 or 4 children have the highest poverty rate, with 2,254 household (48.8%) living below poverty.
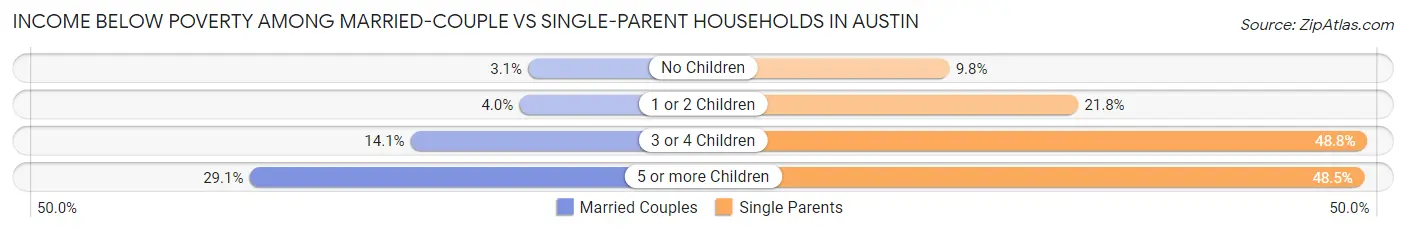
| Children | Married-Couple Families | Single-Parent Households |
| No Children | 2,646 (3.1%) | 2,186 (9.8%) |
| 1 or 2 Children | 2,372 (4.0%) | 5,896 (21.8%) |
| 3 or 4 Children | 1,632 (14.1%) | 2,254 (48.8%) |
| 5 or more Children | 187 (29.1%) | 246 (48.5%) |
| Total | 6,837 (4.4%) | 10,582 (19.4%) |
Race in Austin
The most populous races in Austin are White / Caucasian (605,822 | 63.2%), Hispanic or Latino (311,884 | 32.6%), and Two or more Races (109,898 | 11.5%).
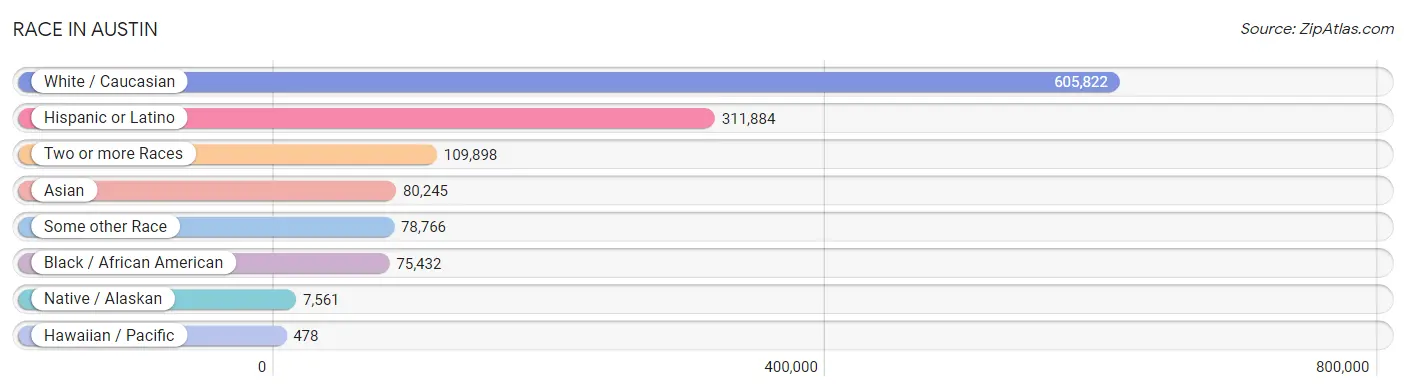
| Race | # Population | % Population |
| Asian | 80,245 | 8.4% |
| Black / African American | 75,432 | 7.9% |
| Hawaiian / Pacific | 478 | 0.1% |
| Hispanic or Latino | 311,884 | 32.6% |
| Native / Alaskan | 7,561 | 0.8% |
| White / Caucasian | 605,822 | 63.2% |
| Two or more Races | 109,898 | 11.5% |
| Some other Race | 78,766 | 8.2% |
| Total | 958,202 | 100.0% |
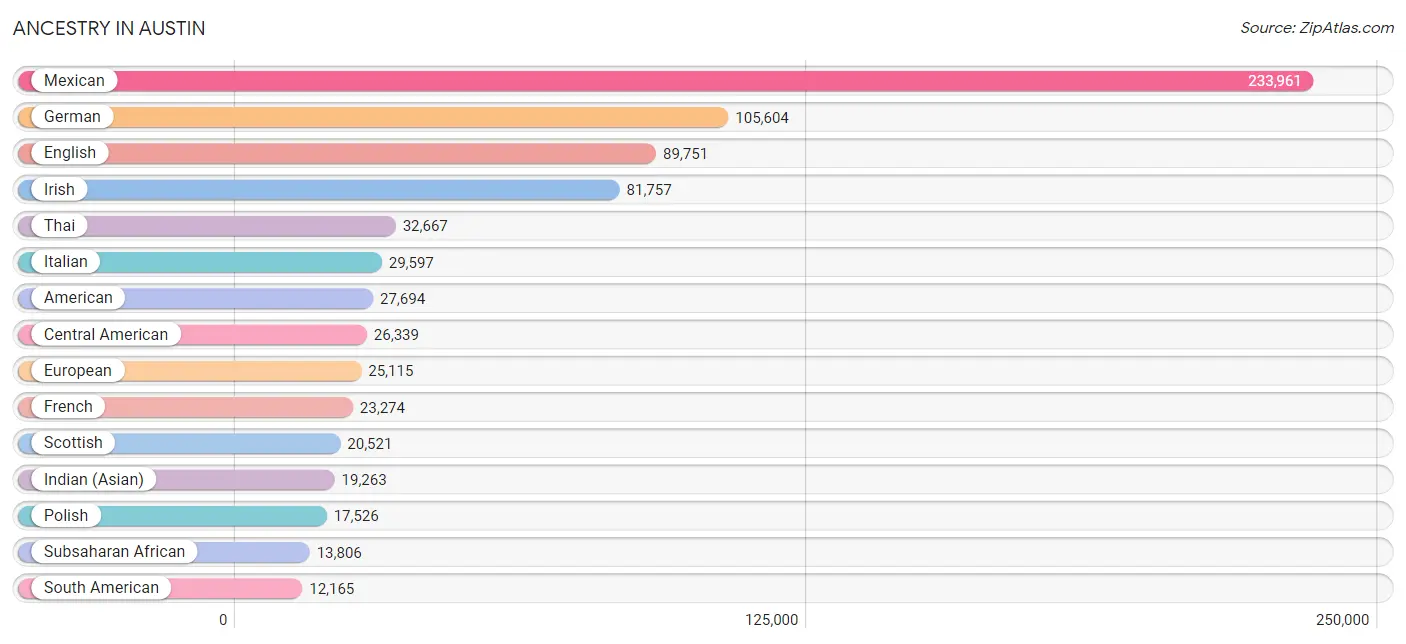
Ancestry in Austin
The most populous ancestries reported in Austin are Mexican (233,961 | 24.4%), German (105,604 | 11.0%), English (89,751 | 9.4%), Irish (81,757 | 8.5%), and Thai (32,667 | 3.4%), together accounting for 56.8% of all Austin residents.
| Ancestry | # Population | % Population |
| Afghan | 1,552 | 0.2% |
| African | 6,869 | 0.7% |
| Alaskan Athabascan | 5 | 0.0% |
| Albanian | 298 | 0.0% |
| Aleut | 16 | 0.0% |
| Alsatian | 354 | 0.0% |
| American | 27,694 | 2.9% |
| Apache | 860 | 0.1% |
| Arab | 10,136 | 1.1% |
| Argentinean | 874 | 0.1% |
| Armenian | 635 | 0.1% |
| Assyrian / Chaldean / Syriac | 32 | 0.0% |
| Australian | 499 | 0.1% |
| Austrian | 2,125 | 0.2% |
| Bahamian | 41 | 0.0% |
| Bangladeshi | 284 | 0.0% |
| Barbadian | 123 | 0.0% |
| Basque | 204 | 0.0% |
| Belgian | 1,279 | 0.1% |
| Belizean | 305 | 0.0% |
| Bhutanese | 5,502 | 0.6% |
| Blackfeet | 429 | 0.0% |
| Bolivian | 623 | 0.1% |
| Brazilian | 1,248 | 0.1% |
| British | 9,271 | 1.0% |
| British West Indian | 31 | 0.0% |
| Bulgarian | 87 | 0.0% |
| Burmese | 8,587 | 0.9% |
| Cajun | 526 | 0.1% |
| Cambodian | 197 | 0.0% |
| Canadian | 1,314 | 0.1% |
| Cape Verdean | 17 | 0.0% |
| Celtic | 220 | 0.0% |
| Central American | 26,339 | 2.8% |
| Central American Indian | 2,110 | 0.2% |
| Cherokee | 2,850 | 0.3% |
| Cheyenne | 68 | 0.0% |
| Chickasaw | 236 | 0.0% |
| Chilean | 811 | 0.1% |
| Chinese | 24 | 0.0% |
| Chippewa | 90 | 0.0% |
| Choctaw | 942 | 0.1% |
| Colombian | 3,664 | 0.4% |
| Comanche | 265 | 0.0% |
| Costa Rican | 836 | 0.1% |
| Cree | 44 | 0.0% |
| Creek | 148 | 0.0% |
| Croatian | 678 | 0.1% |
| Crow | 60 | 0.0% |
| Cuban | 7,097 | 0.7% |
| Cypriot | 50 | 0.0% |
| Czech | 7,850 | 0.8% |
| Czechoslovakian | 925 | 0.1% |
| Danish | 2,602 | 0.3% |
| Delaware | 37 | 0.0% |
| Dominican | 1,138 | 0.1% |
| Dutch | 6,331 | 0.7% |
| Dutch West Indian | 70 | 0.0% |
| Eastern European | 3,656 | 0.4% |
| Ecuadorian | 1,117 | 0.1% |
| Egyptian | 511 | 0.1% |
| English | 89,751 | 9.4% |
| Estonian | 111 | 0.0% |
| Ethiopian | 1,229 | 0.1% |
| European | 25,115 | 2.6% |
| Filipino | 2,077 | 0.2% |
| Finnish | 1,169 | 0.1% |
| French | 23,274 | 2.4% |
| French American Indian | 108 | 0.0% |
| French Canadian | 2,588 | 0.3% |
| German | 105,604 | 11.0% |
| German Russian | 81 | 0.0% |
| Ghanaian | 324 | 0.0% |
| Greek | 3,157 | 0.3% |
| Guamanian / Chamorro | 847 | 0.1% |
| Guatemalan | 6,750 | 0.7% |
| Guyanese | 87 | 0.0% |
| Haitian | 307 | 0.0% |
| Honduran | 9,578 | 1.0% |
| Hopi | 28 | 0.0% |
| Hungarian | 2,999 | 0.3% |
| Icelander | 96 | 0.0% |
| Indian (Asian) | 19,263 | 2.0% |
| Indonesian | 684 | 0.1% |
| Inupiat | 55 | 0.0% |
| Iranian | 1,962 | 0.2% |
| Iraqi | 910 | 0.1% |
| Irish | 81,757 | 8.5% |
| Iroquois | 139 | 0.0% |
| Israeli | 430 | 0.0% |
| Italian | 29,597 | 3.1% |
| Jamaican | 1,155 | 0.1% |
| Japanese | 362 | 0.0% |
| Jordanian | 478 | 0.1% |
| Kenyan | 189 | 0.0% |
| Kiowa | 38 | 0.0% |
| Korean | 8,860 | 0.9% |
| Laotian | 495 | 0.1% |
| Latvian | 310 | 0.0% |
| Lebanese | 3,096 | 0.3% |
| Liberian | 82 | 0.0% |
| Lithuanian | 1,309 | 0.1% |
| Lumbee | 51 | 0.0% |
| Luxembourger | 89 | 0.0% |
| Macedonian | 44 | 0.0% |
| Malaysian | 142 | 0.0% |
| Maltese | 15 | 0.0% |
| Menominee | 17 | 0.0% |
| Mexican | 233,961 | 24.4% |
| Mexican American Indian | 2,523 | 0.3% |
| Mongolian | 246 | 0.0% |
| Moroccan | 143 | 0.0% |
| Native Hawaiian | 910 | 0.1% |
| Navajo | 149 | 0.0% |
| New Zealander | 139 | 0.0% |
| Nicaraguan | 1,308 | 0.1% |
| Nigerian | 3,233 | 0.3% |
| Northern European | 2,462 | 0.3% |
| Norwegian | 7,726 | 0.8% |
| Okinawan | 95 | 0.0% |
| Osage | 21 | 0.0% |
| Paiute | 10 | 0.0% |
| Pakistani | 1,584 | 0.2% |
| Palestinian | 260 | 0.0% |
| Panamanian | 978 | 0.1% |
| Paraguayan | 158 | 0.0% |
| Pennsylvania German | 188 | 0.0% |
| Peruvian | 1,546 | 0.2% |
| Polish | 17,526 | 1.8% |
| Portuguese | 1,970 | 0.2% |
| Potawatomi | 34 | 0.0% |
| Pueblo | 111 | 0.0% |
| Puerto Rican | 10,042 | 1.1% |
| Romanian | 1,468 | 0.2% |
| Russian | 6,821 | 0.7% |
| Salvadoran | 6,782 | 0.7% |
| Samoan | 364 | 0.0% |
| Scandinavian | 2,741 | 0.3% |
| Scotch-Irish | 11,929 | 1.2% |
| Scottish | 20,521 | 2.1% |
| Seminole | 90 | 0.0% |
| Senegalese | 1 | 0.0% |
| Serbian | 581 | 0.1% |
| Sioux | 539 | 0.1% |
| Slavic | 296 | 0.0% |
| Slovak | 756 | 0.1% |
| Slovene | 467 | 0.1% |
| Somali | 76 | 0.0% |
| South African | 293 | 0.0% |
| South American | 12,165 | 1.3% |
| South American Indian | 108 | 0.0% |
| Soviet Union | 5 | 0.0% |
| Spaniard | 5,545 | 0.6% |
| Spanish | 4,048 | 0.4% |
| Spanish American | 82 | 0.0% |
| Spanish American Indian | 61 | 0.0% |
| Sri Lankan | 11,193 | 1.2% |
| Subsaharan African | 13,806 | 1.4% |
| Sudanese | 94 | 0.0% |
| Swedish | 10,444 | 1.1% |
| Swiss | 2,340 | 0.2% |
| Syrian | 1,211 | 0.1% |
| Thai | 32,667 | 3.4% |
| Tlingit-Haida | 27 | 0.0% |
| Tongan | 34 | 0.0% |
| Trinidadian and Tobagonian | 280 | 0.0% |
| Turkish | 1,321 | 0.1% |
| U.S. Virgin Islander | 25 | 0.0% |
| Ugandan | 49 | 0.0% |
| Ukrainian | 2,499 | 0.3% |
| Uruguayan | 86 | 0.0% |
| Ute | 15 | 0.0% |
| Venezuelan | 3,217 | 0.3% |
| Vietnamese | 405 | 0.0% |
| Welsh | 5,651 | 0.6% |
| West Indian | 447 | 0.1% |
| Yaqui | 48 | 0.0% |
| Yugoslavian | 402 | 0.0% |
| Yuman | 19 | 0.0% | View All 179 Rows |
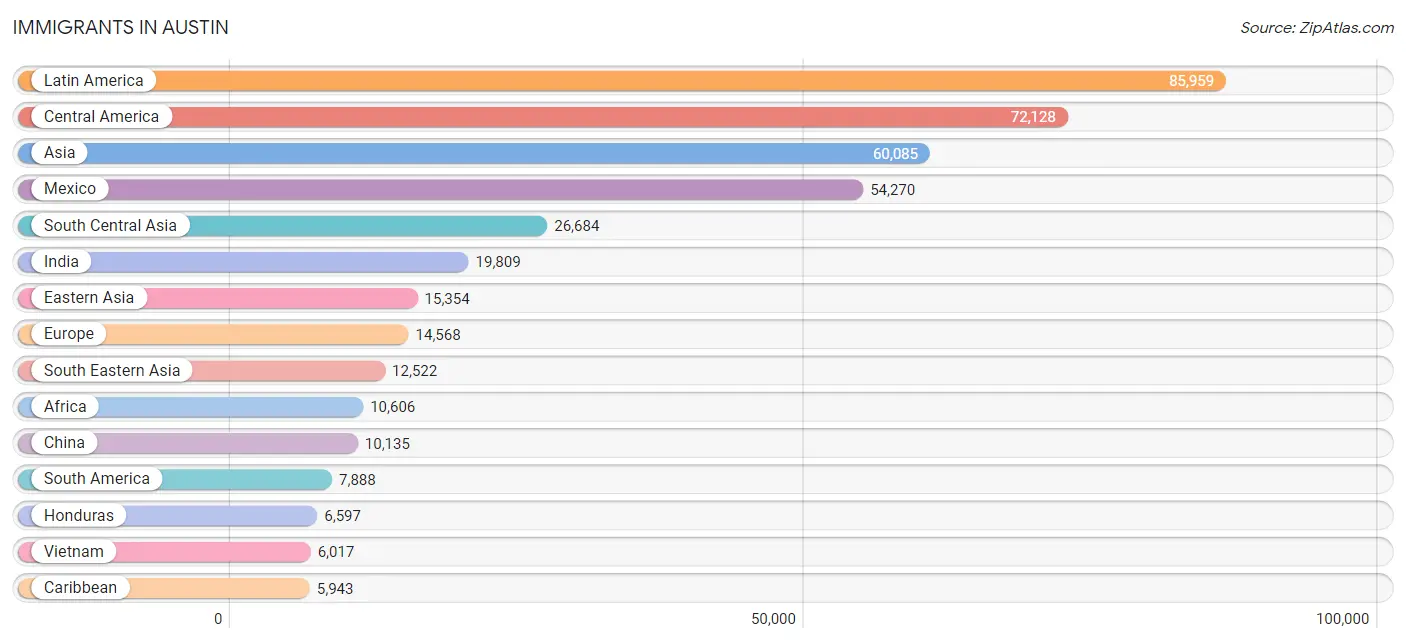
Immigrants in Austin
The most numerous immigrant groups reported in Austin came from Latin America (85,959 | 9.0%), Central America (72,128 | 7.5%), Asia (60,085 | 6.3%), Mexico (54,270 | 5.7%), and South Central Asia (26,684 | 2.8%), together accounting for 31.2% of all Austin residents.
| Immigration Origin | # Population | % Population |
| Afghanistan | 1,623 | 0.2% |
| Africa | 10,606 | 1.1% |
| Albania | 75 | 0.0% |
| Argentina | 317 | 0.0% |
| Asia | 60,085 | 6.3% |
| Australia | 650 | 0.1% |
| Austria | 87 | 0.0% |
| Bahamas | 19 | 0.0% |
| Bangladesh | 439 | 0.1% |
| Barbados | 24 | 0.0% |
| Belarus | 108 | 0.0% |
| Belgium | 153 | 0.0% |
| Belize | 279 | 0.0% |
| Bolivia | 166 | 0.0% |
| Bosnia and Herzegovina | 193 | 0.0% |
| Brazil | 1,422 | 0.2% |
| Bulgaria | 76 | 0.0% |
| Cambodia | 349 | 0.0% |
| Cameroon | 157 | 0.0% |
| Canada | 3,247 | 0.3% |
| Caribbean | 5,943 | 0.6% |
| Central America | 72,128 | 7.5% |
| Chile | 503 | 0.1% |
| China | 10,135 | 1.1% |
| Colombia | 1,607 | 0.2% |
| Congo | 113 | 0.0% |
| Costa Rica | 430 | 0.0% |
| Croatia | 89 | 0.0% |
| Cuba | 4,599 | 0.5% |
| Czechoslovakia | 248 | 0.0% |
| Denmark | 22 | 0.0% |
| Dominica | 64 | 0.0% |
| Dominican Republic | 388 | 0.0% |
| Eastern Africa | 2,856 | 0.3% |
| Eastern Asia | 15,354 | 1.6% |
| Eastern Europe | 4,813 | 0.5% |
| Ecuador | 420 | 0.0% |
| Egypt | 210 | 0.0% |
| El Salvador | 4,019 | 0.4% |
| England | 1,064 | 0.1% |
| Eritrea | 193 | 0.0% |
| Ethiopia | 1,126 | 0.1% |
| Europe | 14,568 | 1.5% |
| France | 1,207 | 0.1% |
| Germany | 1,808 | 0.2% |
| Ghana | 604 | 0.1% |
| Greece | 324 | 0.0% |
| Guatemala | 5,125 | 0.5% |
| Haiti | 136 | 0.0% |
| Honduras | 6,597 | 0.7% |
| Hong Kong | 744 | 0.1% |
| Hungary | 438 | 0.1% |
| India | 19,809 | 2.1% |
| Indonesia | 392 | 0.0% |
| Iran | 1,216 | 0.1% |
| Iraq | 1,379 | 0.1% |
| Ireland | 402 | 0.0% |
| Israel | 315 | 0.0% |
| Italy | 329 | 0.0% |
| Jamaica | 222 | 0.0% |
| Japan | 958 | 0.1% |
| Jordan | 316 | 0.0% |
| Kazakhstan | 330 | 0.0% |
| Kenya | 619 | 0.1% |
| Korea | 4,193 | 0.4% |
| Kuwait | 156 | 0.0% |
| Laos | 58 | 0.0% |
| Latin America | 85,959 | 9.0% |
| Latvia | 17 | 0.0% |
| Lebanon | 714 | 0.1% |
| Liberia | 121 | 0.0% |
| Lithuania | 182 | 0.0% |
| Malaysia | 655 | 0.1% |
| Mexico | 54,270 | 5.7% |
| Micronesia | 8 | 0.0% |
| Middle Africa | 477 | 0.1% |
| Moldova | 73 | 0.0% |
| Morocco | 432 | 0.1% |
| Nepal | 1,363 | 0.1% |
| Netherlands | 266 | 0.0% |
| Nicaragua | 860 | 0.1% |
| Nigeria | 2,242 | 0.2% |
| North Macedonia | 18 | 0.0% |
| Northern Africa | 2,077 | 0.2% |
| Northern Europe | 4,308 | 0.4% |
| Norway | 84 | 0.0% |
| Oceania | 875 | 0.1% |
| Pakistan | 1,405 | 0.2% |
| Panama | 302 | 0.0% |
| Peru | 773 | 0.1% |
| Philippines | 3,205 | 0.3% |
| Poland | 411 | 0.0% |
| Romania | 548 | 0.1% |
| Russia | 1,056 | 0.1% |
| Saudi Arabia | 445 | 0.1% |
| Scotland | 207 | 0.0% |
| Senegal | 156 | 0.0% |
| Serbia | 283 | 0.0% |
| Sierra Leone | 86 | 0.0% |
| Singapore | 288 | 0.0% |
| South Africa | 292 | 0.0% |
| South America | 7,888 | 0.8% |
| South Central Asia | 26,684 | 2.8% |
| South Eastern Asia | 12,522 | 1.3% |
| Southern Europe | 1,602 | 0.2% |
| Spain | 949 | 0.1% |
| Sri Lanka | 310 | 0.0% |
| Sudan | 294 | 0.0% |
| Sweden | 180 | 0.0% |
| Switzerland | 301 | 0.0% |
| Syria | 746 | 0.1% |
| Taiwan | 2,241 | 0.2% |
| Thailand | 996 | 0.1% |
| Trinidad and Tobago | 440 | 0.1% |
| Turkey | 937 | 0.1% |
| Uganda | 265 | 0.0% |
| Ukraine | 845 | 0.1% |
| Uruguay | 91 | 0.0% |
| Uzbekistan | 50 | 0.0% |
| Venezuela | 2,549 | 0.3% |
| Vietnam | 6,017 | 0.6% |
| West Indies | 24 | 0.0% |
| Western Africa | 4,161 | 0.4% |
| Western Asia | 5,472 | 0.6% |
| Western Europe | 3,834 | 0.4% |
| Yemen | 93 | 0.0% |
| Zaire | 159 | 0.0% |
| Zimbabwe | 41 | 0.0% | View All 128 Rows |
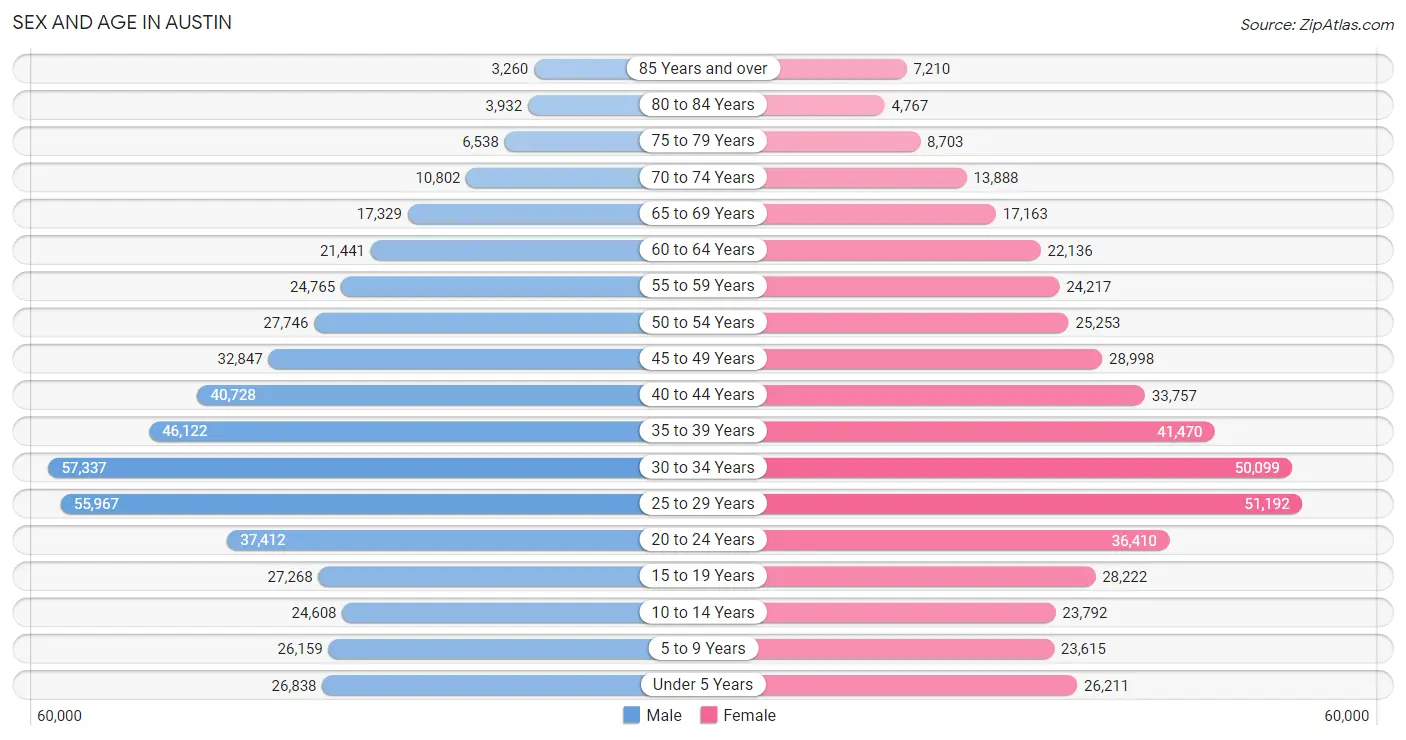
Sex and Age in Austin
Sex and Age in Austin
The most populous age groups in Austin are 30 to 34 Years (57,337 | 11.7%) for men and 25 to 29 Years (51,192 | 11.0%) for women.
| Age Bracket | Male | Female |
| Under 5 Years | 26,838 (5.5%) | 26,211 (5.6%) |
| 5 to 9 Years | 26,159 (5.3%) | 23,615 (5.1%) |
| 10 to 14 Years | 24,608 (5.0%) | 23,792 (5.1%) |
| 15 to 19 Years | 27,268 (5.6%) | 28,222 (6.0%) |
| 20 to 24 Years | 37,412 (7.6%) | 36,410 (7.8%) |
| 25 to 29 Years | 55,967 (11.4%) | 51,192 (11.0%) |
| 30 to 34 Years | 57,337 (11.7%) | 50,099 (10.7%) |
| 35 to 39 Years | 46,122 (9.4%) | 41,470 (8.9%) |
| 40 to 44 Years | 40,728 (8.3%) | 33,757 (7.2%) |
| 45 to 49 Years | 32,847 (6.7%) | 28,998 (6.2%) |
| 50 to 54 Years | 27,746 (5.7%) | 25,253 (5.4%) |
| 55 to 59 Years | 24,765 (5.0%) | 24,217 (5.2%) |
| 60 to 64 Years | 21,441 (4.4%) | 22,136 (4.7%) |
| 65 to 69 Years | 17,329 (3.5%) | 17,163 (3.7%) |
| 70 to 74 Years | 10,802 (2.2%) | 13,888 (3.0%) |
| 75 to 79 Years | 6,538 (1.3%) | 8,703 (1.9%) |
| 80 to 84 Years | 3,932 (0.8%) | 4,767 (1.0%) |
| 85 Years and over | 3,260 (0.7%) | 7,210 (1.5%) |
| Total | 491,099 (100.0%) | 467,103 (100.0%) |
Families and Households in Austin
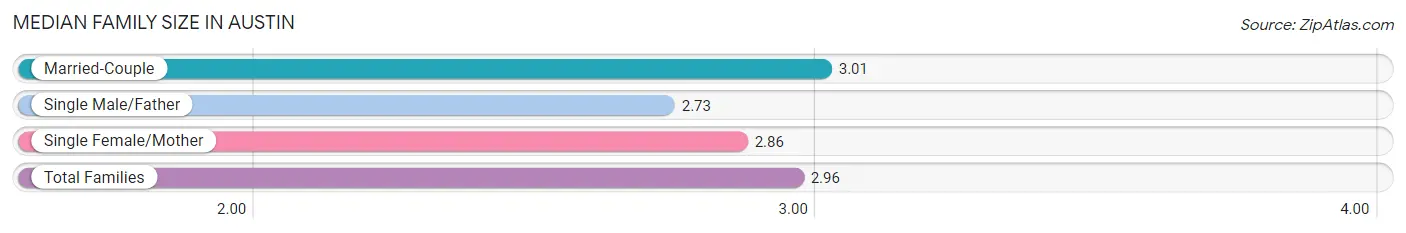
Median Family Size in Austin
The median family size in Austin is 2.96 persons per family, with married-couple families (156,824 | 74.2%) accounting for the largest median family size of 3.01 persons per family. On the other hand, single male/father families (16,140 | 7.6%) represent the smallest median family size with 2.73 persons per family.
| Family Type | # Families | Family Size |
| Married-Couple | 156,824 (74.2%) | 3.01 |
| Single Male/Father | 16,140 (7.6%) | 2.73 |
| Single Female/Mother | 38,416 (18.2%) | 2.86 |
| Total Families | 211,380 (100.0%) | 2.96 |
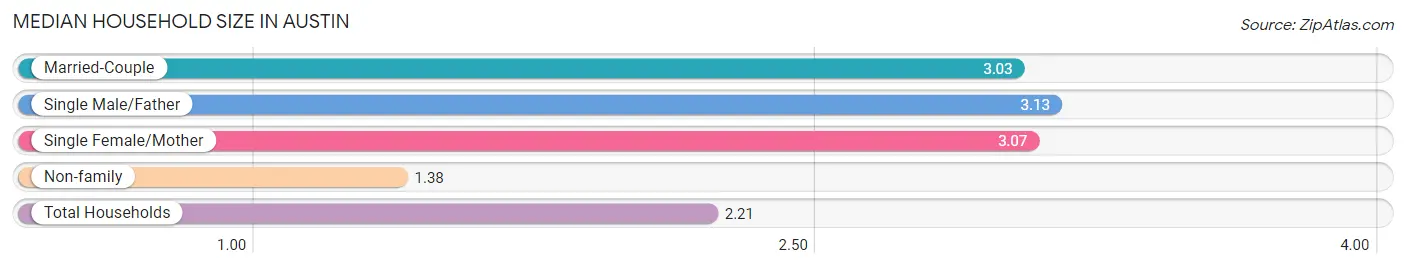
Median Household Size in Austin
The median household size in Austin is 2.21 persons per household, with single male/father households (16,140 | 3.8%) accounting for the largest median household size of 3.13 persons per household. non-family households (211,699 | 50.0%) represent the smallest median household size with 1.38 persons per household.
| Household Type | # Households | Household Size |
| Married-Couple | 156,824 (37.1%) | 3.03 |
| Single Male/Father | 16,140 (3.8%) | 3.13 |
| Single Female/Mother | 38,416 (9.1%) | 3.07 |
| Non-family | 211,699 (50.0%) | 1.38 |
| Total Households | 423,079 (100.0%) | 2.21 |
Household Size by Marriage Status in Austin
Out of a total of 423,079 households in Austin, 211,380 (50.0%) are family households, while 211,699 (50.0%) are nonfamily households. The most numerous type of family households are 2-person households, comprising 92,292, and the most common type of nonfamily households are 1-person households, comprising 149,889.
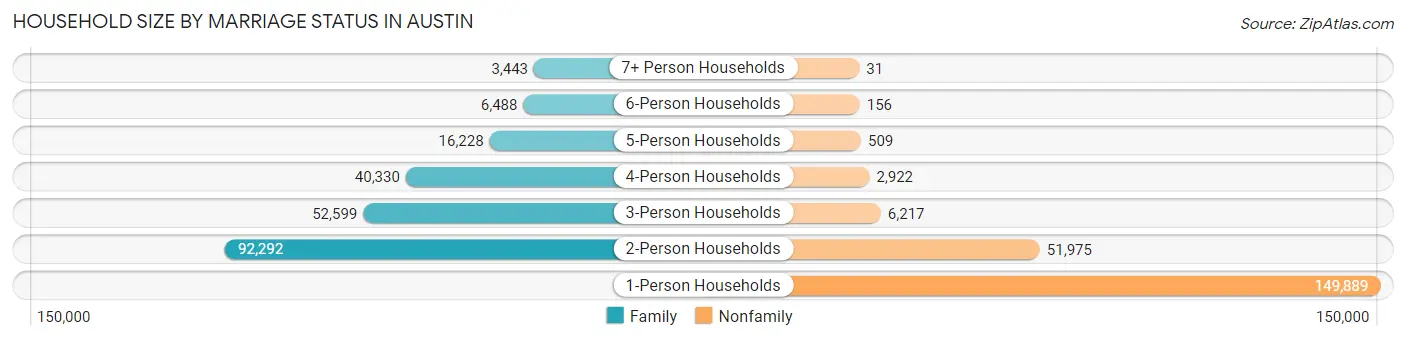
| Household Size | Family Households | Nonfamily Households |
| 1-Person Households | - | 149,889 (35.4%) |
| 2-Person Households | 92,292 (21.8%) | 51,975 (12.3%) |
| 3-Person Households | 52,599 (12.4%) | 6,217 (1.5%) |
| 4-Person Households | 40,330 (9.5%) | 2,922 (0.7%) |
| 5-Person Households | 16,228 (3.8%) | 509 (0.1%) |
| 6-Person Households | 6,488 (1.5%) | 156 (0.0%) |
| 7+ Person Households | 3,443 (0.8%) | 31 (0.0%) |
| Total | 211,380 (50.0%) | 211,699 (50.0%) |
Female Fertility in Austin
Fertility by Age in Austin
Average fertility rate in Austin is 42.0 births per 1,000 women. Women in the age bracket of 20 to 34 years have the highest fertility rate with 59.0 births per 1,000 women. Women in the age bracket of 20 to 34 years acount for 69.4% of all women with births.
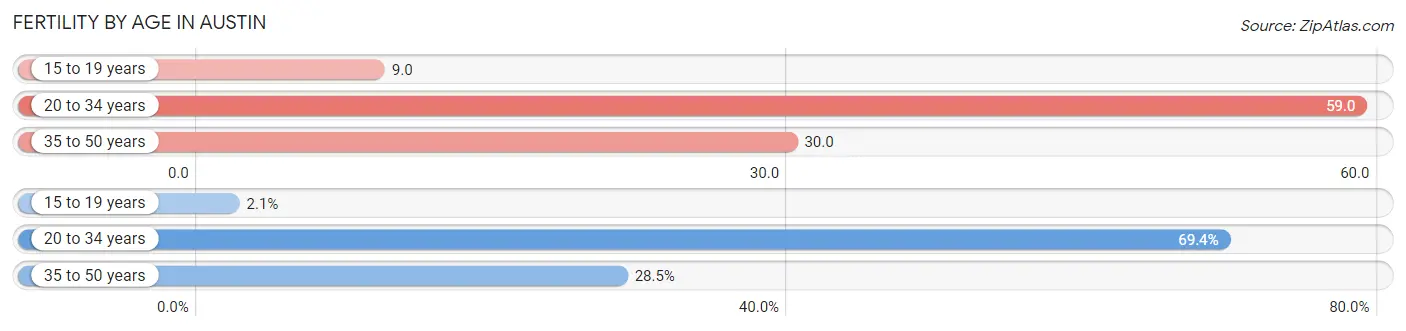
| Age Bracket | Women with Births | Births / 1,000 Women |
| 15 to 19 years | 249 (2.1%) | 9.0 |
| 20 to 34 years | 8,065 (69.4%) | 59.0 |
| 35 to 50 years | 3,310 (28.5%) | 30.0 |
| Total | 11,624 (100.0%) | 42.0 |
Fertility by Age by Marriage Status in Austin
76.8% of women with births (11,624) in Austin are married. The highest percentage of unmarried women with births falls into 15 to 19 years age bracket with 82.7% of them unmarried at the time of birth, while the lowest percentage of unmarried women with births belong to 35 to 50 years age bracket with 15.1% of them unmarried.

| Age Bracket | Married | Unmarried |
| 15 to 19 years | 43 (17.3%) | 206 (82.7%) |
| 20 to 34 years | 6,081 (75.4%) | 1,984 (24.6%) |
| 35 to 50 years | 2,810 (84.9%) | 500 (15.1%) |
| Total | 8,927 (76.8%) | 2,697 (23.2%) |
Fertility by Education in Austin
Average fertility rate in Austin is 42.0 births per 1,000 women. Women with the education attainment of graduate degree have the highest fertility rate of 54.0 births per 1,000 women, while women with the education attainment of college or associate's degree have the lowest fertility at 34.0 births per 1,000 women. Women with the education attainment of bachelor's degree represent 33.2% of all women with births.
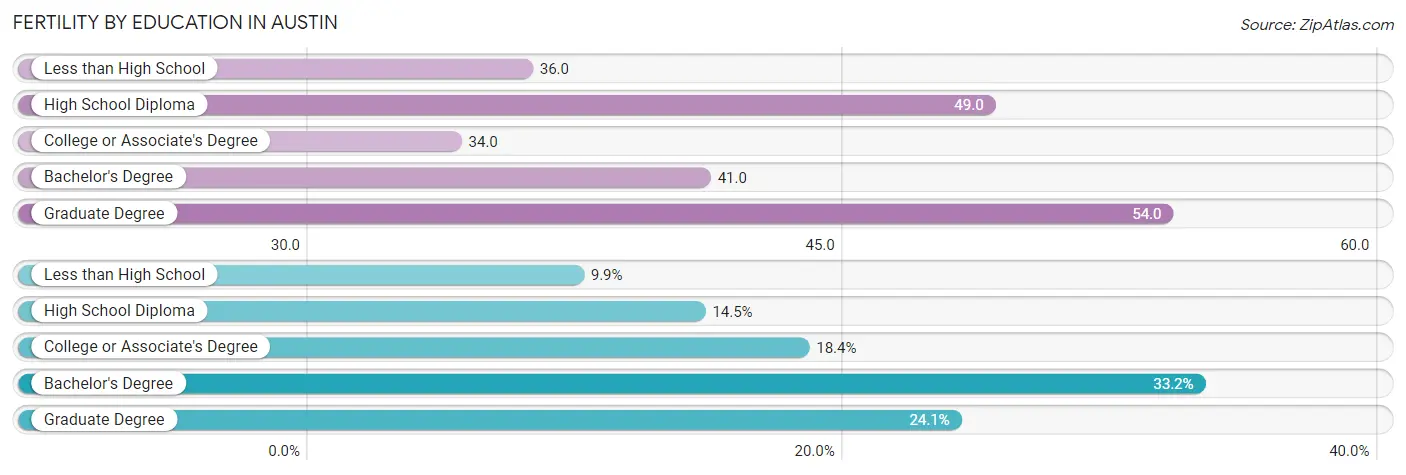
| Educational Attainment | Women with Births | Births / 1,000 Women |
| Less than High School | 1,152 (9.9%) | 36.0 |
| High School Diploma | 1,682 (14.5%) | 49.0 |
| College or Associate's Degree | 2,134 (18.4%) | 34.0 |
| Bachelor's Degree | 3,859 (33.2%) | 41.0 |
| Graduate Degree | 2,797 (24.1%) | 54.0 |
| Total | 11,624 (100.0%) | 42.0 |
Fertility by Education by Marriage Status in Austin
23.2% of women with births in Austin are unmarried. Women with the educational attainment of graduate degree are most likely to be married with 94.5% of them married at childbirth, while women with the educational attainment of college or associate's degree are least likely to be married with 47.5% of them unmarried at childbirth.
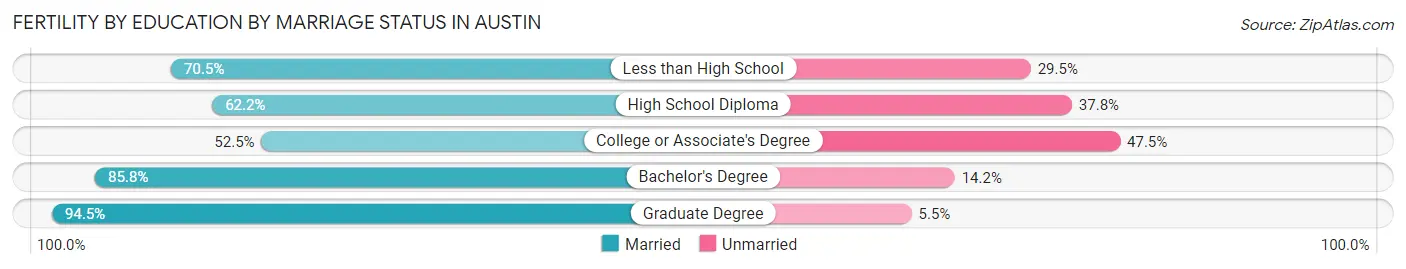
| Educational Attainment | Married | Unmarried |
| Less than High School | 812 (70.5%) | 340 (29.5%) |
| High School Diploma | 1,046 (62.2%) | 636 (37.8%) |
| College or Associate's Degree | 1,120 (52.5%) | 1,014 (47.5%) |
| Bachelor's Degree | 3,311 (85.8%) | 548 (14.2%) |
| Graduate Degree | 2,643 (94.5%) | 154 (5.5%) |
| Total | 8,927 (76.8%) | 2,697 (23.2%) |
Employment Characteristics in Austin
Employment by Class of Employer in Austin
Among the 562,009 employed individuals in Austin, private company employees (381,259 | 67.8%), state government employees (44,262 | 7.9%), and self-employed (not incorporated) (38,383 | 6.8%) make up the most common classes of employment.
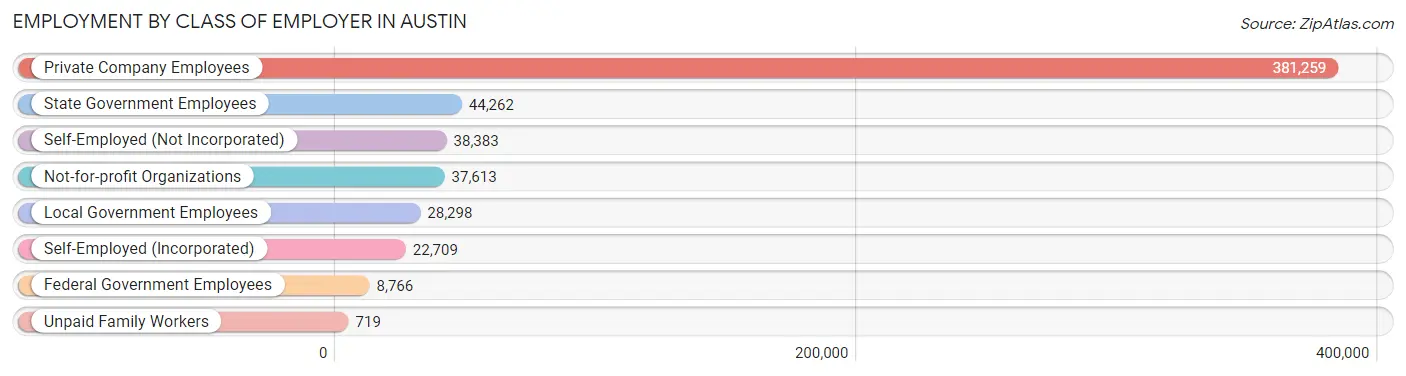
| Employer Class | # Employees | % Employees |
| Private Company Employees | 381,259 | 67.8% |
| Self-Employed (Incorporated) | 22,709 | 4.0% |
| Self-Employed (Not Incorporated) | 38,383 | 6.8% |
| Not-for-profit Organizations | 37,613 | 6.7% |
| Local Government Employees | 28,298 | 5.0% |
| State Government Employees | 44,262 | 7.9% |
| Federal Government Employees | 8,766 | 1.6% |
| Unpaid Family Workers | 719 | 0.1% |
| Total | 562,009 | 100.0% |
Employment Status by Age in Austin
According to the labor force statistics for Austin, out of the total population over 16 years of age (797,769), 74.9% or 597,529 individuals are in the labor force, with 4.4% or 26,291 of them unemployed. The age group with the highest labor force participation rate is 25 to 29 years, with 90.4% or 96,872 individuals in the labor force. Within the labor force, the 16 to 19 years age range has the highest percentage of unemployed individuals, with 16.1% or 2,735 of them being unemployed.
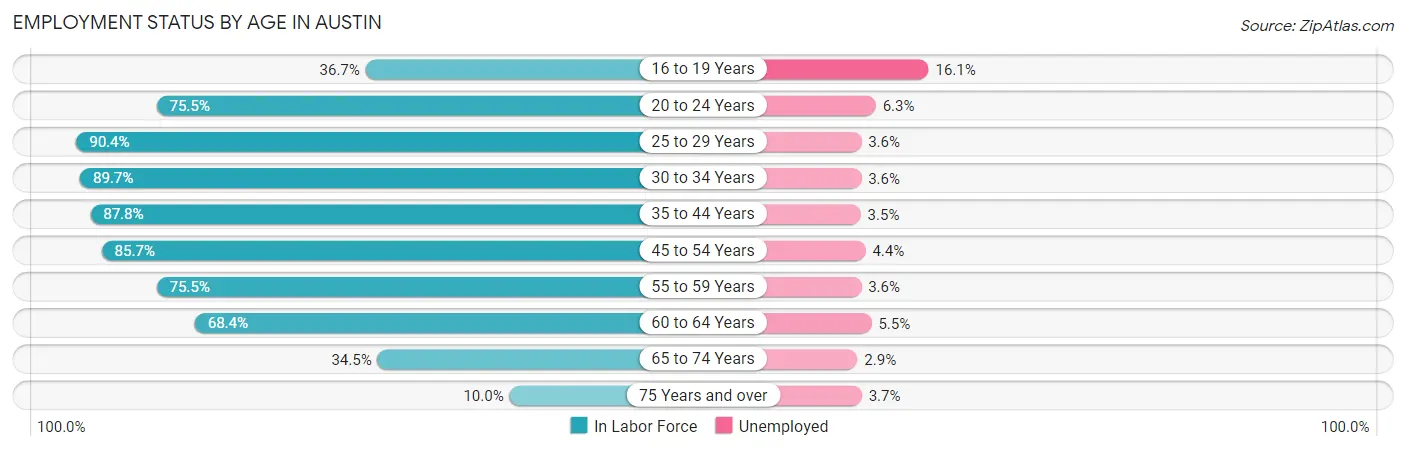
| Age Bracket | In Labor Force | Unemployed |
| 16 to 19 Years | 16,985 (36.7%) | 2,735 (16.1%) |
| 20 to 24 Years | 55,736 (75.5%) | 3,511 (6.3%) |
| 25 to 29 Years | 96,872 (90.4%) | 3,487 (3.6%) |
| 30 to 34 Years | 96,370 (89.7%) | 3,469 (3.6%) |
| 35 to 44 Years | 142,304 (87.8%) | 4,981 (3.5%) |
| 45 to 54 Years | 98,421 (85.7%) | 4,331 (4.4%) |
| 55 to 59 Years | 36,981 (75.5%) | 1,331 (3.6%) |
| 60 to 64 Years | 29,807 (68.4%) | 1,639 (5.5%) |
| 65 to 74 Years | 20,418 (34.5%) | 592 (2.9%) |
| 75 Years and over | 3,441 (10.0%) | 127 (3.7%) |
| Total | 597,529 (74.9%) | 26,291 (4.4%) |
Employment Status by Educational Attainment in Austin
According to labor force statistics for Austin, 85.7% of individuals (500,552) out of the total population between 25 and 64 years of age (584,075) are in the labor force, with 3.8% or 19,021 of them being unemployed. The group with the highest labor force participation rate are those with the educational attainment of bachelor's degree or higher, with 89.9% or 304,237 individuals in the labor force. Within the labor force, individuals with high school diploma education have the highest percentage of unemployment, with 6.9% or 4,159 of them being unemployed.
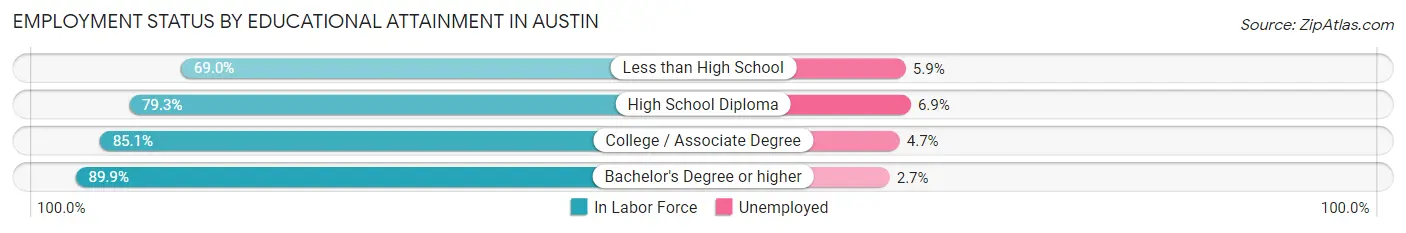
| Educational Attainment | In Labor Force | Unemployed |
| Less than High School | 34,130 (69.0%) | 2,918 (5.9%) |
| High School Diploma | 60,278 (79.3%) | 5,245 (6.9%) |
| College / Associate Degree | 102,275 (85.1%) | 5,649 (4.7%) |
| Bachelor's Degree or higher | 304,237 (89.9%) | 9,137 (2.7%) |
| Total | 500,552 (85.7%) | 22,195 (3.8%) |
Employment Occupations by Sex in Austin
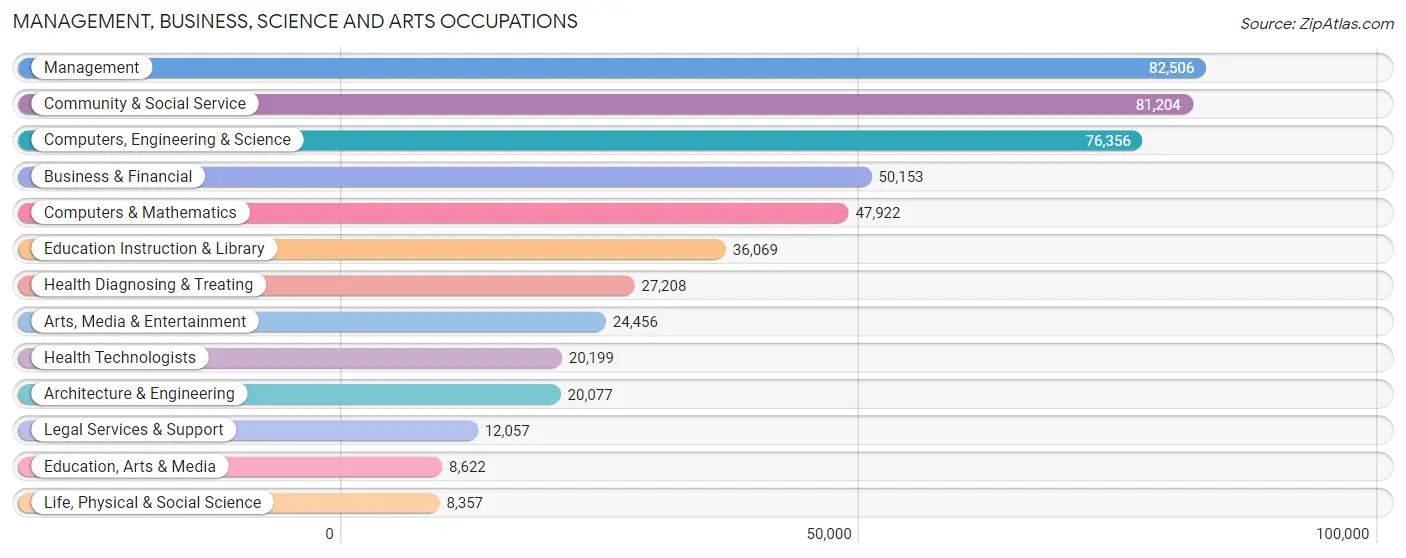
Management, Business, Science and Arts Occupations
The most common Management, Business, Science and Arts occupations in Austin are Management (82,506 | 14.5%), Community & Social Service (81,204 | 14.2%), Computers, Engineering & Science (76,356 | 13.4%), Business & Financial (50,153 | 8.8%), and Computers & Mathematics (47,922 | 8.4%).
Management, Business, Science and Arts Occupations by Sex
Within the Management, Business, Science and Arts occupations in Austin, the most male-oriented occupations are Architecture & Engineering (80.0%), Computers & Mathematics (78.3%), and Computers, Engineering & Science (75.4%), while the most female-oriented occupations are Health Technologists (74.1%), Health Diagnosing & Treating (73.8%), and Education, Arts & Media (64.3%).
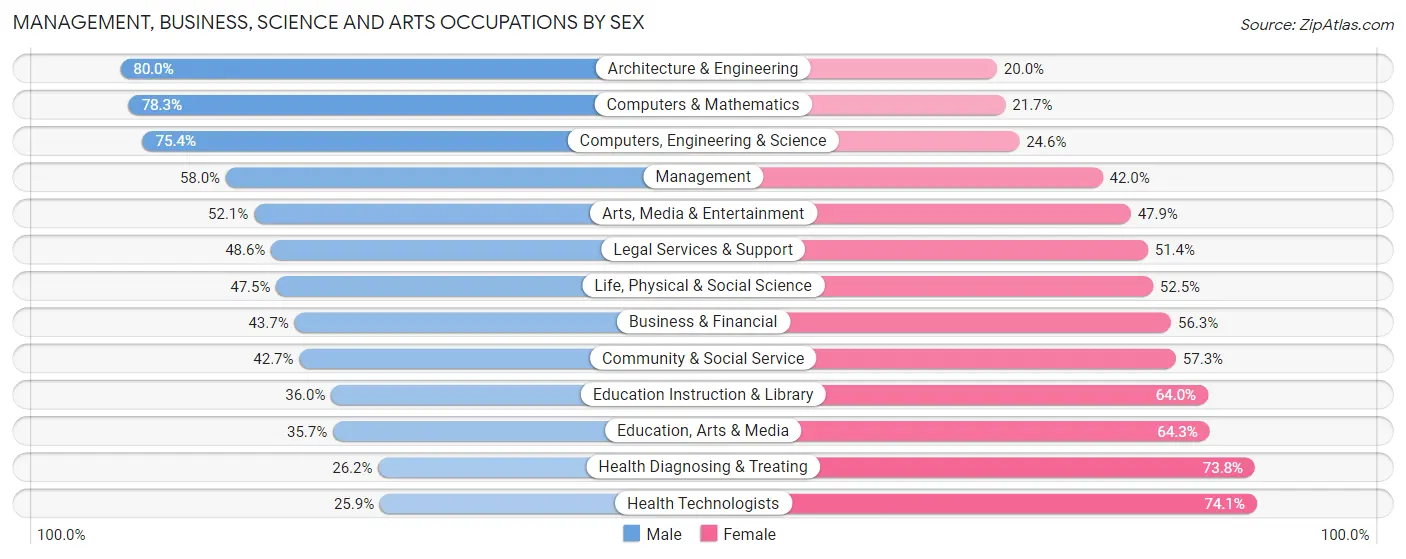
| Occupation | Male | Female |
| Management | 47,851 (58.0%) | 34,655 (42.0%) |
| Business & Financial | 21,917 (43.7%) | 28,236 (56.3%) |
| Computers, Engineering & Science | 57,546 (75.4%) | 18,810 (24.6%) |
| Computers & Mathematics | 37,509 (78.3%) | 10,413 (21.7%) |
| Architecture & Engineering | 16,068 (80.0%) | 4,009 (20.0%) |
| Life, Physical & Social Science | 3,969 (47.5%) | 4,388 (52.5%) |
| Community & Social Service | 34,668 (42.7%) | 46,536 (57.3%) |
| Education, Arts & Media | 3,075 (35.7%) | 5,547 (64.3%) |
| Legal Services & Support | 5,855 (48.6%) | 6,202 (51.4%) |
| Education Instruction & Library | 12,991 (36.0%) | 23,078 (64.0%) |
| Arts, Media & Entertainment | 12,747 (52.1%) | 11,709 (47.9%) |
| Health Diagnosing & Treating | 7,133 (26.2%) | 20,075 (73.8%) |
| Health Technologists | 5,224 (25.9%) | 14,975 (74.1%) |
| Total (Category) | 169,115 (53.3%) | 148,312 (46.7%) |
| Total (Overall) | 313,165 (54.9%) | 257,390 (45.1%) |
Services Occupations
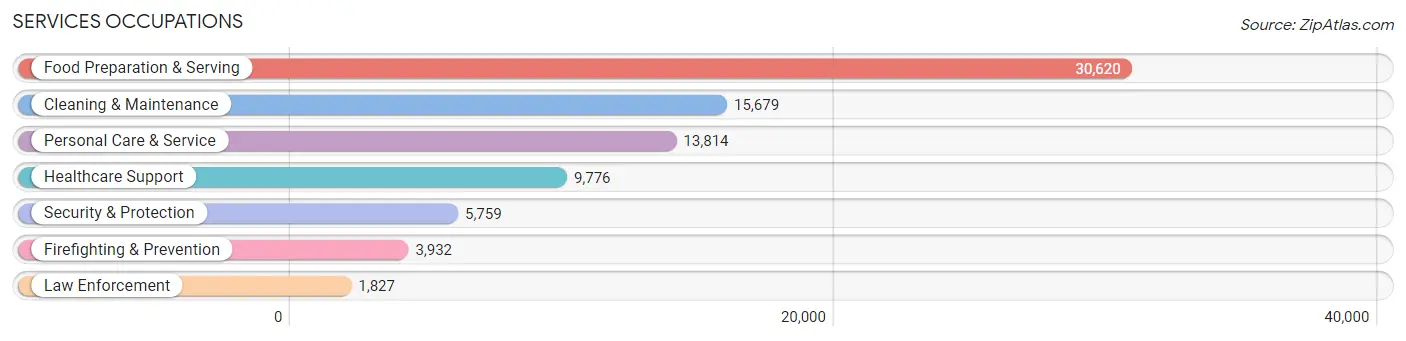
The most common Services occupations in Austin are Food Preparation & Serving (30,620 | 5.4%), Cleaning & Maintenance (15,679 | 2.8%), Personal Care & Service (13,814 | 2.4%), Healthcare Support (9,776 | 1.7%), and Security & Protection (5,759 | 1.0%).
Services Occupations by Sex
Within the Services occupations in Austin, the most male-oriented occupations are Law Enforcement (87.6%), Security & Protection (78.3%), and Firefighting & Prevention (74.0%), while the most female-oriented occupations are Healthcare Support (78.6%), Personal Care & Service (76.5%), and Cleaning & Maintenance (47.9%).
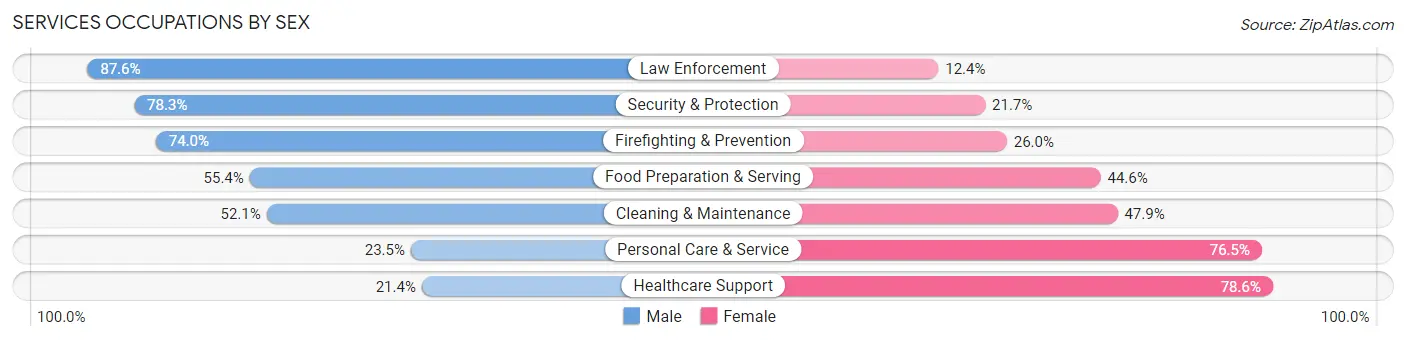
| Occupation | Male | Female |
| Healthcare Support | 2,088 (21.4%) | 7,688 (78.6%) |
| Security & Protection | 4,510 (78.3%) | 1,249 (21.7%) |
| Firefighting & Prevention | 2,910 (74.0%) | 1,022 (26.0%) |
| Law Enforcement | 1,600 (87.6%) | 227 (12.4%) |
| Food Preparation & Serving | 16,976 (55.4%) | 13,644 (44.6%) |
| Cleaning & Maintenance | 8,167 (52.1%) | 7,512 (47.9%) |
| Personal Care & Service | 3,250 (23.5%) | 10,564 (76.5%) |
| Total (Category) | 34,991 (46.3%) | 40,657 (53.7%) |
| Total (Overall) | 313,165 (54.9%) | 257,390 (45.1%) |
Sales and Office Occupations
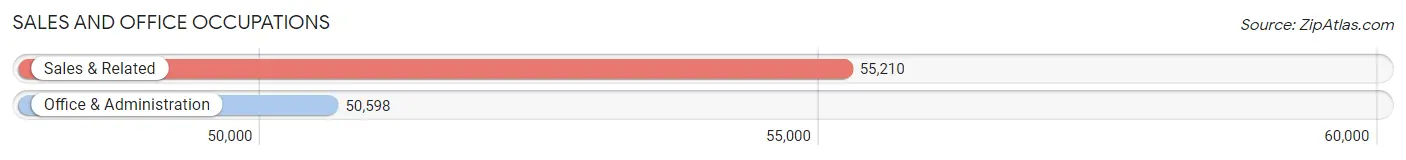
The most common Sales and Office occupations in Austin are Sales & Related (55,210 | 9.7%), and Office & Administration (50,598 | 8.9%).
Sales and Office Occupations by Sex
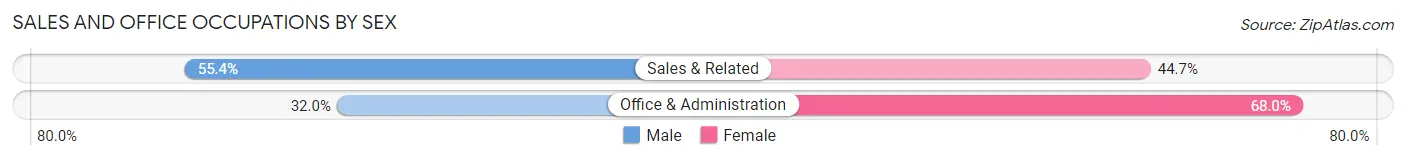
| Occupation | Male | Female |
| Sales & Related | 30,559 (55.3%) | 24,651 (44.7%) |
| Office & Administration | 16,179 (32.0%) | 34,419 (68.0%) |
| Total (Category) | 46,738 (44.2%) | 59,070 (55.8%) |
| Total (Overall) | 313,165 (54.9%) | 257,390 (45.1%) |
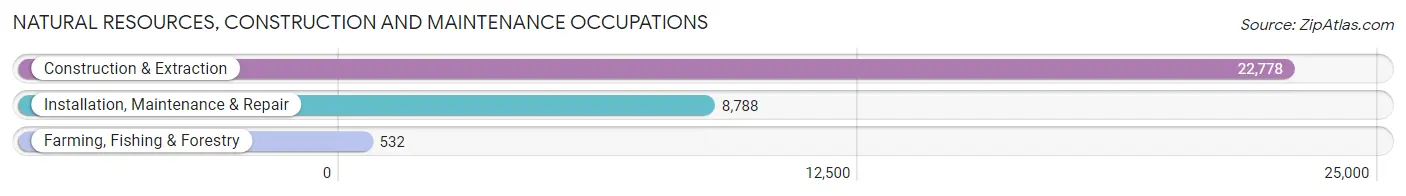
Natural Resources, Construction and Maintenance Occupations
The most common Natural Resources, Construction and Maintenance occupations in Austin are Construction & Extraction (22,778 | 4.0%), Installation, Maintenance & Repair (8,788 | 1.5%), and Farming, Fishing & Forestry (532 | 0.1%).
Natural Resources, Construction and Maintenance Occupations by Sex
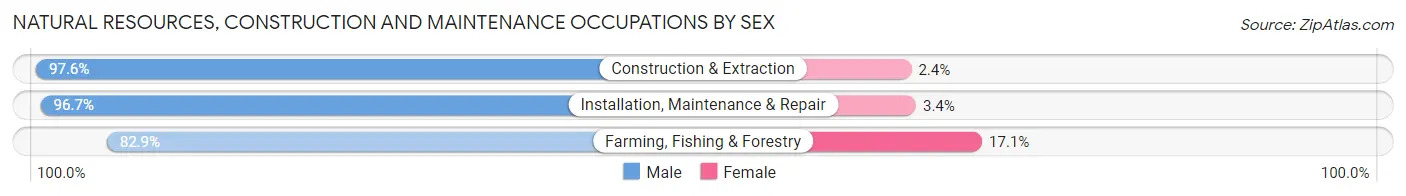
| Occupation | Male | Female |
| Farming, Fishing & Forestry | 441 (82.9%) | 91 (17.1%) |
| Construction & Extraction | 22,231 (97.6%) | 547 (2.4%) |
| Installation, Maintenance & Repair | 8,494 (96.7%) | 294 (3.4%) |
| Total (Category) | 31,166 (97.1%) | 932 (2.9%) |
| Total (Overall) | 313,165 (54.9%) | 257,390 (45.1%) |
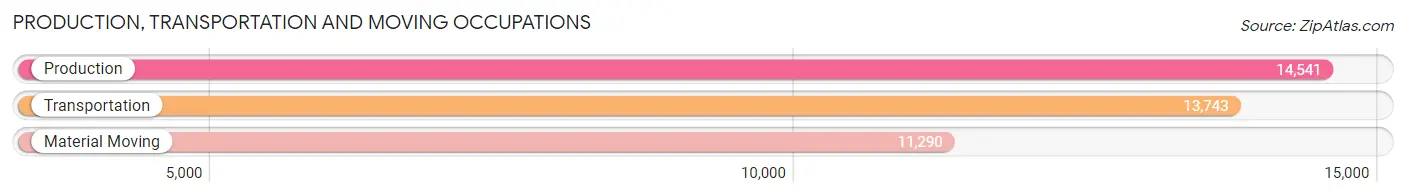
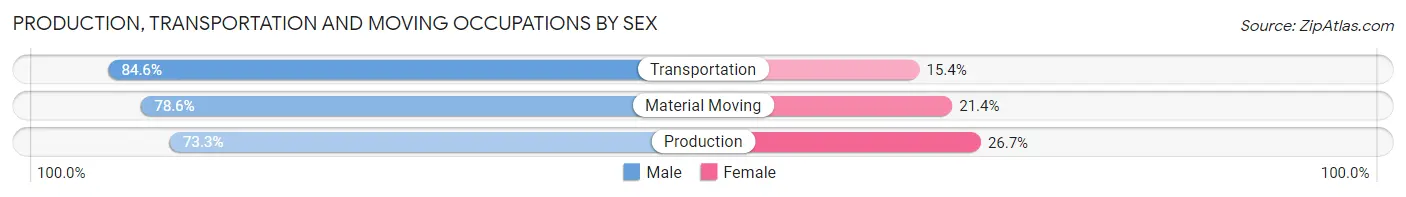
Production, Transportation and Moving Occupations
The most common Production, Transportation and Moving occupations in Austin are Production (14,541 | 2.5%), Transportation (13,743 | 2.4%), and Material Moving (11,290 | 2.0%).
Production, Transportation and Moving Occupations by Sex
| Occupation | Male | Female |
| Production | 10,661 (73.3%) | 3,880 (26.7%) |
| Transportation | 11,624 (84.6%) | 2,119 (15.4%) |
| Material Moving | 8,870 (78.6%) | 2,420 (21.4%) |
| Total (Category) | 31,155 (78.7%) | 8,419 (21.3%) |
| Total (Overall) | 313,165 (54.9%) | 257,390 (45.1%) |
Employment Industries by Sex in Austin
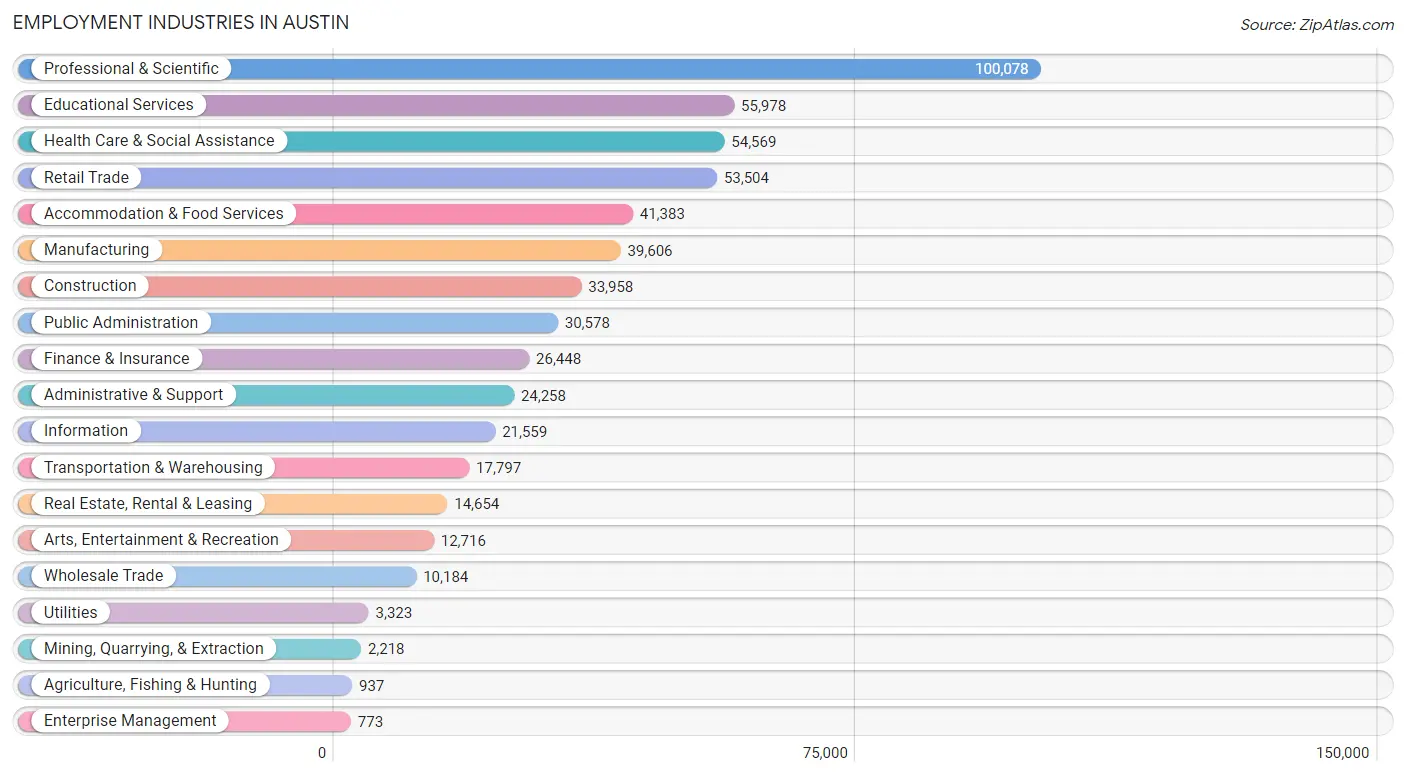
Employment Industries in Austin
The major employment industries in Austin include Professional & Scientific (100,078 | 17.5%), Educational Services (55,978 | 9.8%), Health Care & Social Assistance (54,569 | 9.6%), Retail Trade (53,504 | 9.4%), and Accommodation & Food Services (41,383 | 7.2%).
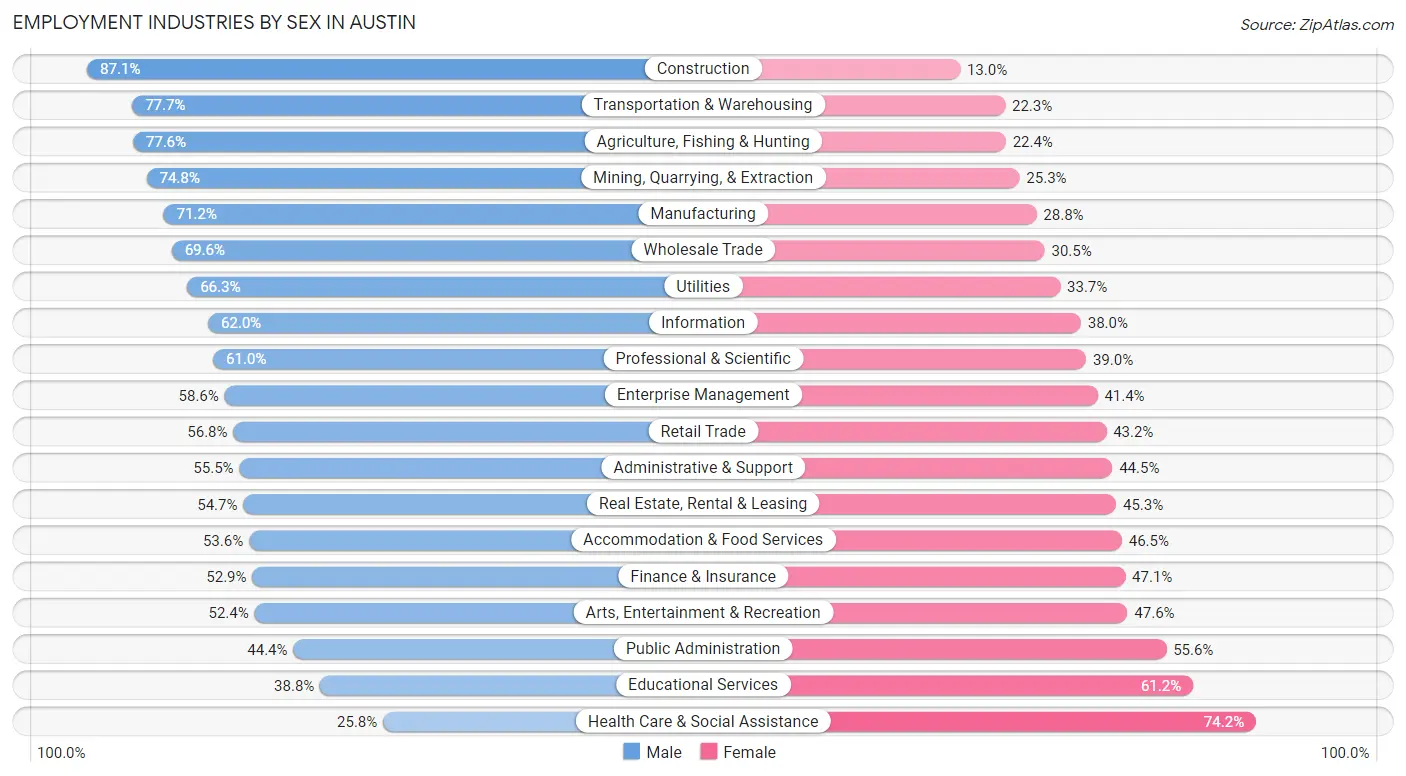
Employment Industries by Sex in Austin
The Austin industries that see more men than women are Construction (87.1%), Transportation & Warehousing (77.7%), and Agriculture, Fishing & Hunting (77.6%), whereas the industries that tend to have a higher number of women are Health Care & Social Assistance (74.2%), Educational Services (61.2%), and Public Administration (55.6%).
| Industry | Male | Female |
| Agriculture, Fishing & Hunting | 727 (77.6%) | 210 (22.4%) |
| Mining, Quarrying, & Extraction | 1,658 (74.8%) | 560 (25.3%) |
| Construction | 29,560 (87.1%) | 4,398 (13.0%) |
| Manufacturing | 28,211 (71.2%) | 11,395 (28.8%) |
| Wholesale Trade | 7,083 (69.6%) | 3,101 (30.4%) |
| Retail Trade | 30,383 (56.8%) | 23,121 (43.2%) |
| Transportation & Warehousing | 13,831 (77.7%) | 3,966 (22.3%) |
| Utilities | 2,204 (66.3%) | 1,119 (33.7%) |
| Information | 13,375 (62.0%) | 8,184 (38.0%) |
| Finance & Insurance | 13,980 (52.9%) | 12,468 (47.1%) |
| Real Estate, Rental & Leasing | 8,021 (54.7%) | 6,633 (45.3%) |
| Professional & Scientific | 61,022 (61.0%) | 39,056 (39.0%) |
| Enterprise Management | 453 (58.6%) | 320 (41.4%) |
| Administrative & Support | 13,472 (55.5%) | 10,786 (44.5%) |
| Educational Services | 21,737 (38.8%) | 34,241 (61.2%) |
| Health Care & Social Assistance | 14,073 (25.8%) | 40,496 (74.2%) |
| Arts, Entertainment & Recreation | 6,663 (52.4%) | 6,053 (47.6%) |
| Accommodation & Food Services | 22,162 (53.5%) | 19,221 (46.5%) |
| Public Administration | 13,568 (44.4%) | 17,010 (55.6%) |
| Total | 313,165 (54.9%) | 257,390 (45.1%) |
Education in Austin
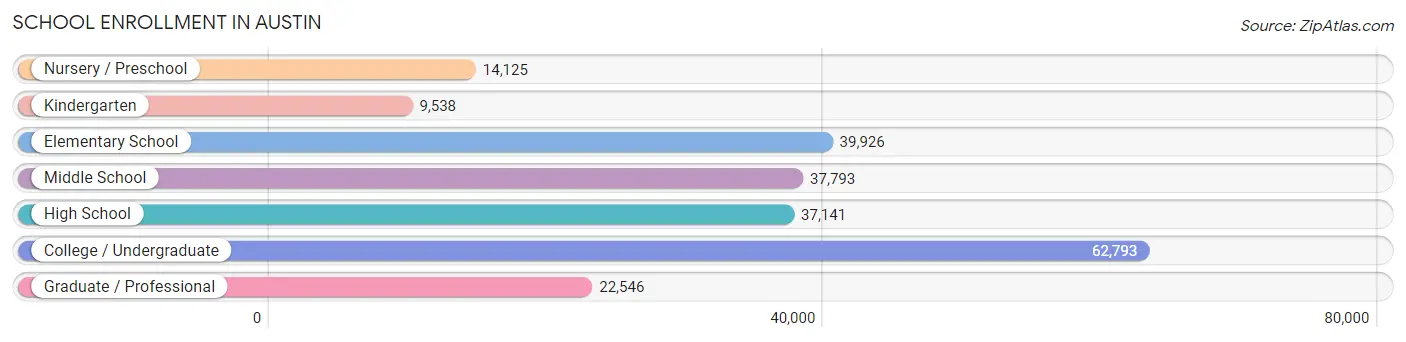
School Enrollment in Austin
The most common levels of schooling among the 223,862 students in Austin are college / undergraduate (62,793 | 28.1%), elementary school (39,926 | 17.8%), and middle school (37,793 | 16.9%).
| School Level | # Students | % Students |
| Nursery / Preschool | 14,125 | 6.3% |
| Kindergarten | 9,538 | 4.3% |
| Elementary School | 39,926 | 17.8% |
| Middle School | 37,793 | 16.9% |
| High School | 37,141 | 16.6% |
| College / Undergraduate | 62,793 | 28.1% |
| Graduate / Professional | 22,546 | 10.1% |
| Total | 223,862 | 100.0% |
School Enrollment by Age by Funding Source in Austin
Out of a total of 223,862 students who are enrolled in schools in Austin, 35,818 (16.0%) attend a private institution, while the remaining 188,044 (84.0%) are enrolled in public schools. The age group of 3 to 4 year olds has the highest likelihood of being enrolled in private schools, with 5,340 (48.5% in the age bracket) enrolled. Conversely, the age group of 15 to 17 year olds has the lowest likelihood of being enrolled in a private school, with 24,124 (90.1% in the age bracket) attending a public institution.
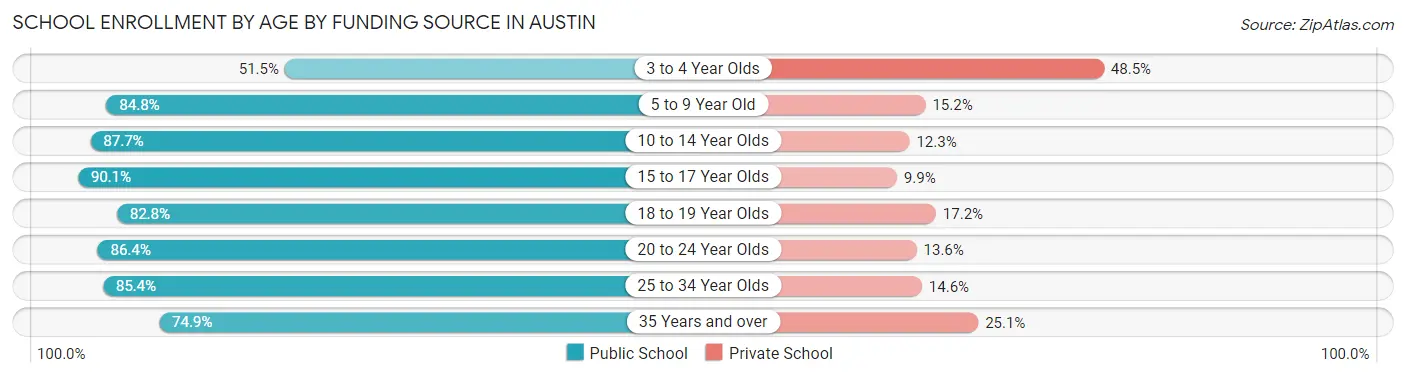
| Age Bracket | Public School | Private School |
| 3 to 4 Year Olds | 5,677 (51.5%) | 5,340 (48.5%) |
| 5 to 9 Year Old | 39,958 (84.8%) | 7,184 (15.2%) |
| 10 to 14 Year Olds | 41,369 (87.7%) | 5,783 (12.3%) |
| 15 to 17 Year Olds | 24,124 (90.1%) | 2,656 (9.9%) |
| 18 to 19 Year Olds | 19,154 (82.8%) | 3,972 (17.2%) |
| 20 to 24 Year Olds | 29,565 (86.4%) | 4,651 (13.6%) |
| 25 to 34 Year Olds | 18,881 (85.4%) | 3,221 (14.6%) |
| 35 Years and over | 9,238 (74.9%) | 3,089 (25.1%) |
| Total | 188,044 (84.0%) | 35,818 (16.0%) |
Educational Attainment by Field of Study in Austin
Business (75,032 | 17.9%), engineering (43,780 | 10.4%), social sciences (39,626 | 9.4%), communications (30,419 | 7.2%), and science & technology (28,835 | 6.9%) are the most common fields of study among 419,627 individuals in Austin who have obtained a bachelor's degree or higher.
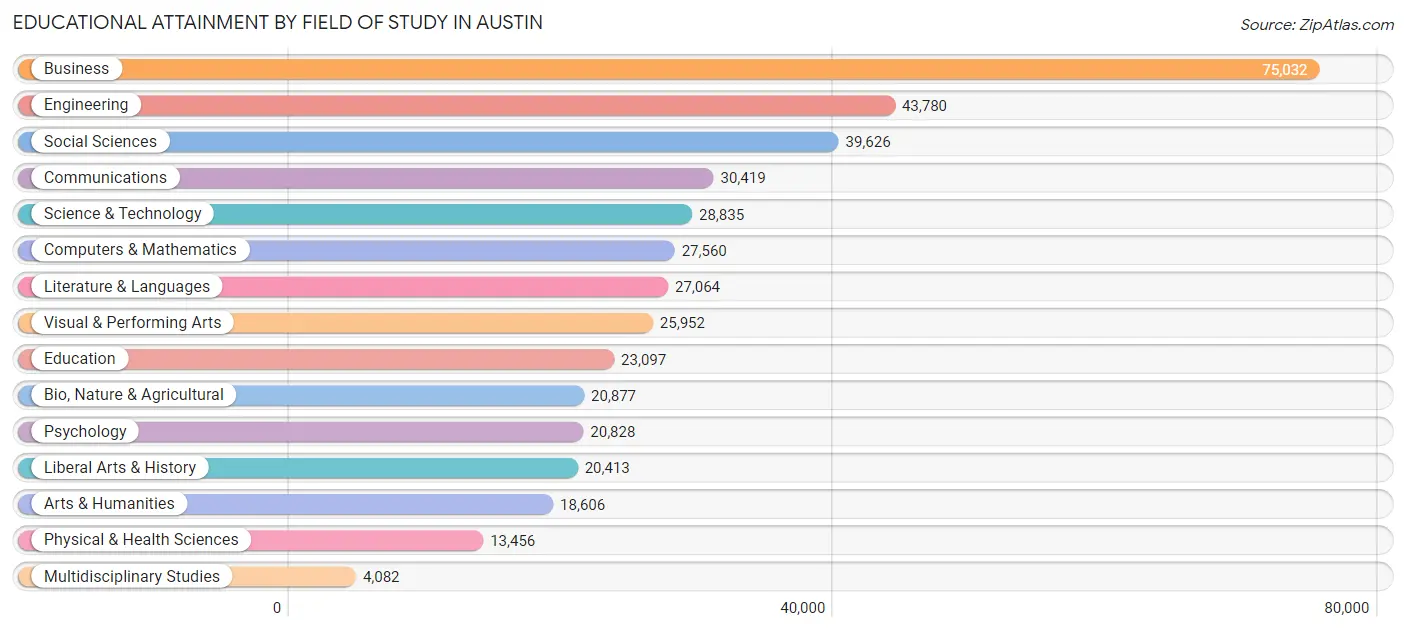
| Field of Study | # Graduates | % Graduates |
| Computers & Mathematics | 27,560 | 6.6% |
| Bio, Nature & Agricultural | 20,877 | 5.0% |
| Physical & Health Sciences | 13,456 | 3.2% |
| Psychology | 20,828 | 5.0% |
| Social Sciences | 39,626 | 9.4% |
| Engineering | 43,780 | 10.4% |
| Multidisciplinary Studies | 4,082 | 1.0% |
| Science & Technology | 28,835 | 6.9% |
| Business | 75,032 | 17.9% |
| Education | 23,097 | 5.5% |
| Literature & Languages | 27,064 | 6.5% |
| Liberal Arts & History | 20,413 | 4.9% |
| Visual & Performing Arts | 25,952 | 6.2% |
| Communications | 30,419 | 7.2% |
| Arts & Humanities | 18,606 | 4.4% |
| Total | 419,627 | 100.0% |
Transportation & Commute in Austin
Vehicle Availability by Sex in Austin
The most prevalent vehicle ownership categories in Austin are males with 2 vehicles (142,420, accounting for 46.3%) and females with 2 vehicles (113,068, making up 57.2%).
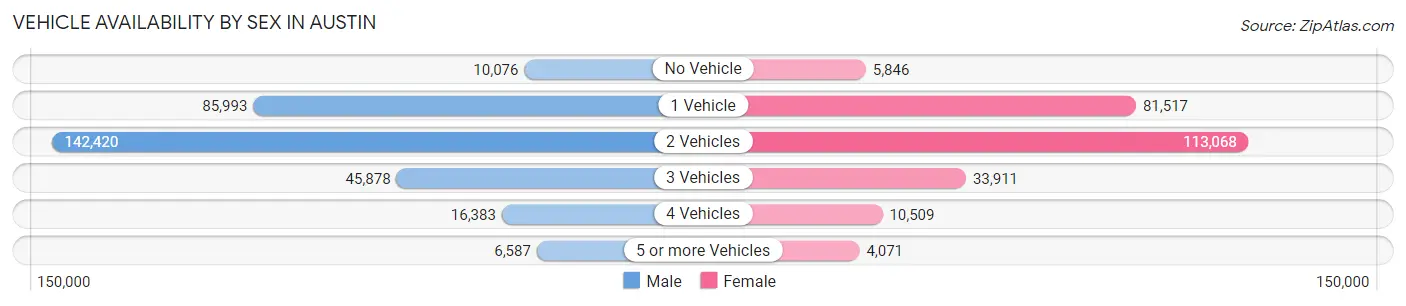
| Vehicles Available | Male | Female |
| No Vehicle | 10,076 (3.3%) | 5,846 (2.4%) |
| 1 Vehicle | 85,993 (28.0%) | 81,517 (32.8%) |
| 2 Vehicles | 142,420 (46.3%) | 113,068 (45.4%) |
| 3 Vehicles | 45,878 (14.9%) | 33,911 (13.6%) |
| 4 Vehicles | 16,383 (5.3%) | 10,509 (4.2%) |
| 5 or more Vehicles | 6,587 (2.1%) | 4,071 (1.6%) |
| Total | 307,337 (100.0%) | 248,922 (100.0%) |
Commute Time in Austin
The most frequently occuring commute durations in Austin are 15 to 19 minutes (83,397 commuters, 19.2%), 20 to 24 minutes (73,736 commuters, 17.0%), and 30 to 34 minutes (67,622 commuters, 15.6%).
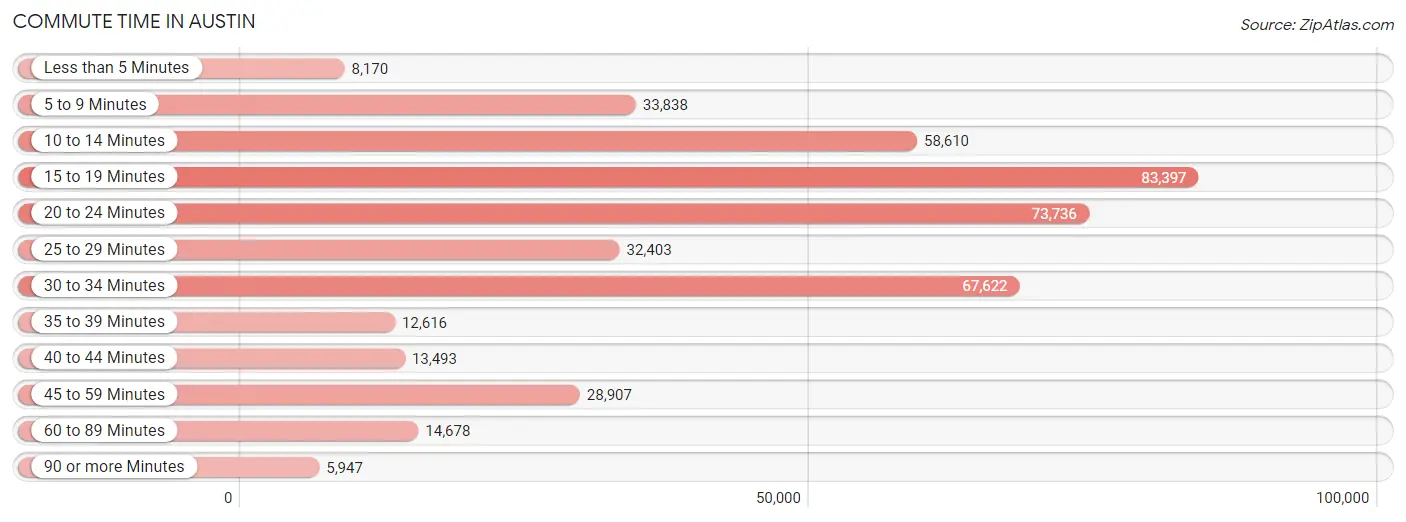
| Commute Time | # Commuters | % Commuters |
| Less than 5 Minutes | 8,170 | 1.9% |
| 5 to 9 Minutes | 33,838 | 7.8% |
| 10 to 14 Minutes | 58,610 | 13.5% |
| 15 to 19 Minutes | 83,397 | 19.2% |
| 20 to 24 Minutes | 73,736 | 17.0% |
| 25 to 29 Minutes | 32,403 | 7.5% |
| 30 to 34 Minutes | 67,622 | 15.6% |
| 35 to 39 Minutes | 12,616 | 2.9% |
| 40 to 44 Minutes | 13,493 | 3.1% |
| 45 to 59 Minutes | 28,907 | 6.7% |
| 60 to 89 Minutes | 14,678 | 3.4% |
| 90 or more Minutes | 5,947 | 1.4% |
Commute Time by Sex in Austin
The most common commute times in Austin are 15 to 19 minutes (44,523 commuters, 18.5%) for males and 15 to 19 minutes (38,874 commuters, 20.1%) for females.
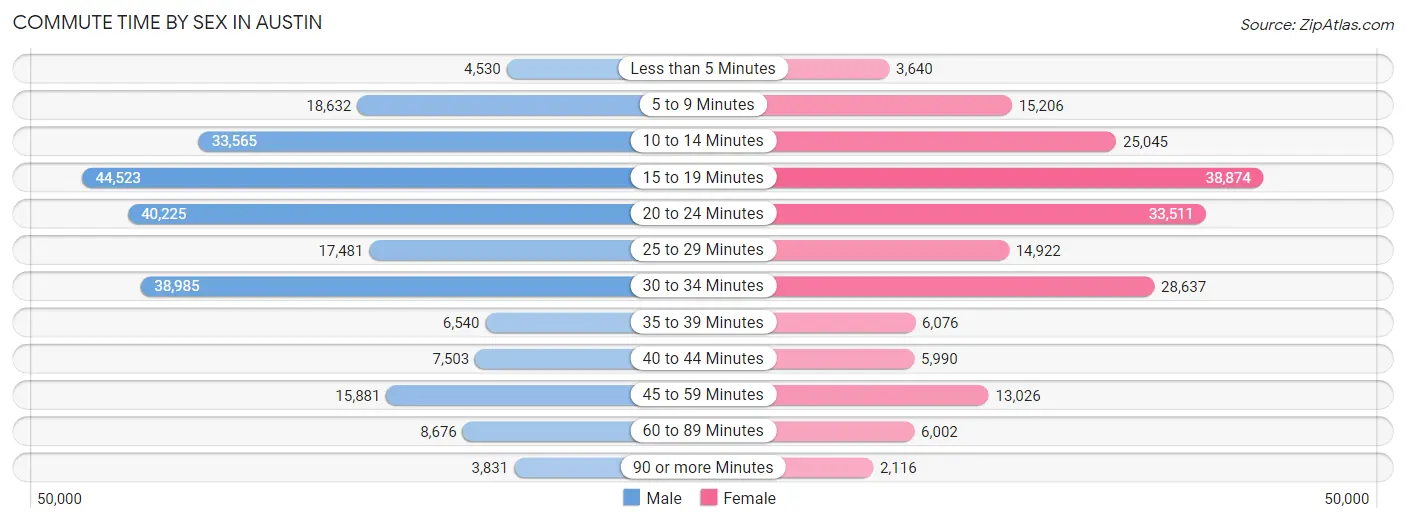
| Commute Time | Male | Female |
| Less than 5 Minutes | 4,530 (1.9%) | 3,640 (1.9%) |
| 5 to 9 Minutes | 18,632 (7.7%) | 15,206 (7.9%) |
| 10 to 14 Minutes | 33,565 (14.0%) | 25,045 (13.0%) |
| 15 to 19 Minutes | 44,523 (18.5%) | 38,874 (20.1%) |
| 20 to 24 Minutes | 40,225 (16.7%) | 33,511 (17.4%) |
| 25 to 29 Minutes | 17,481 (7.3%) | 14,922 (7.7%) |
| 30 to 34 Minutes | 38,985 (16.2%) | 28,637 (14.8%) |
| 35 to 39 Minutes | 6,540 (2.7%) | 6,076 (3.2%) |
| 40 to 44 Minutes | 7,503 (3.1%) | 5,990 (3.1%) |
| 45 to 59 Minutes | 15,881 (6.6%) | 13,026 (6.8%) |
| 60 to 89 Minutes | 8,676 (3.6%) | 6,002 (3.1%) |
| 90 or more Minutes | 3,831 (1.6%) | 2,116 (1.1%) |
Time of Departure to Work by Sex in Austin
The most frequent times of departure to work in Austin are 7:00 AM to 7:29 AM (36,086, 15.0%) for males and 7:00 AM to 7:29 AM (30,531, 15.8%) for females.

| Time of Departure | Male | Female |
| 12:00 AM to 4:59 AM | 7,332 (3.0%) | 4,858 (2.5%) |
| 5:00 AM to 5:29 AM | 5,686 (2.4%) | 2,633 (1.4%) |
| 5:30 AM to 5:59 AM | 7,223 (3.0%) | 4,357 (2.3%) |
| 6:00 AM to 6:29 AM | 16,442 (6.8%) | 8,642 (4.5%) |
| 6:30 AM to 6:59 AM | 18,026 (7.5%) | 14,663 (7.6%) |
| 7:00 AM to 7:29 AM | 36,086 (15.0%) | 30,531 (15.8%) |
| 7:30 AM to 7:59 AM | 26,436 (11.0%) | 26,991 (14.0%) |
| 8:00 AM to 8:29 AM | 32,903 (13.7%) | 26,814 (13.9%) |
| 8:30 AM to 8:59 AM | 21,103 (8.8%) | 18,025 (9.3%) |
| 9:00 AM to 9:59 AM | 27,175 (11.3%) | 20,557 (10.6%) |
| 10:00 AM to 10:59 AM | 10,014 (4.2%) | 8,299 (4.3%) |
| 11:00 AM to 11:59 AM | 4,505 (1.9%) | 3,356 (1.7%) |
| 12:00 PM to 3:59 PM | 14,489 (6.0%) | 11,986 (6.2%) |
| 4:00 PM to 11:59 PM | 12,952 (5.4%) | 11,333 (5.9%) |
| Total | 240,372 (100.0%) | 193,045 (100.0%) |
Housing Occupancy in Austin
Occupancy by Ownership in Austin
Of the total 423,079 dwellings in Austin, owner-occupied units account for 188,029 (44.4%), while renter-occupied units make up 235,050 (55.6%).
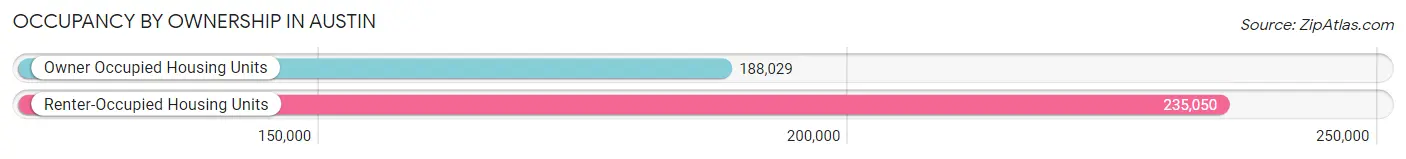
| Occupancy | # Housing Units | % Housing Units |
| Owner Occupied Housing Units | 188,029 | 44.4% |
| Renter-Occupied Housing Units | 235,050 | 55.6% |
| Total Occupied Housing Units | 423,079 | 100.0% |
Occupancy by Household Size in Austin
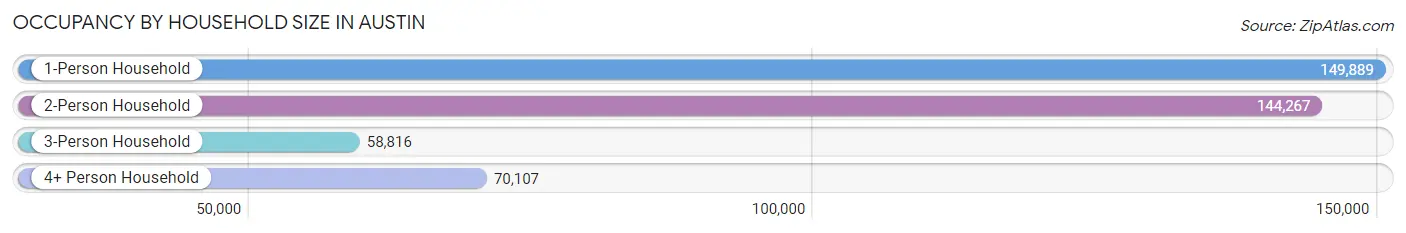
| Household Size | # Housing Units | % Housing Units |
| 1-Person Household | 149,889 | 35.4% |
| 2-Person Household | 144,267 | 34.1% |
| 3-Person Household | 58,816 | 13.9% |
| 4+ Person Household | 70,107 | 16.6% |
| Total Housing Units | 423,079 | 100.0% |
Occupancy by Ownership by Household Size in Austin
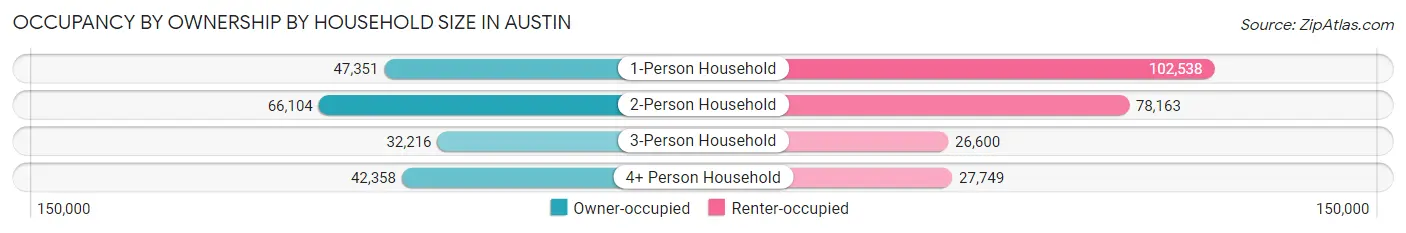
| Household Size | Owner-occupied | Renter-occupied |
| 1-Person Household | 47,351 (31.6%) | 102,538 (68.4%) |
| 2-Person Household | 66,104 (45.8%) | 78,163 (54.2%) |
| 3-Person Household | 32,216 (54.8%) | 26,600 (45.2%) |
| 4+ Person Household | 42,358 (60.4%) | 27,749 (39.6%) |
| Total Housing Units | 188,029 (44.4%) | 235,050 (55.6%) |
Occupancy by Educational Attainment in Austin
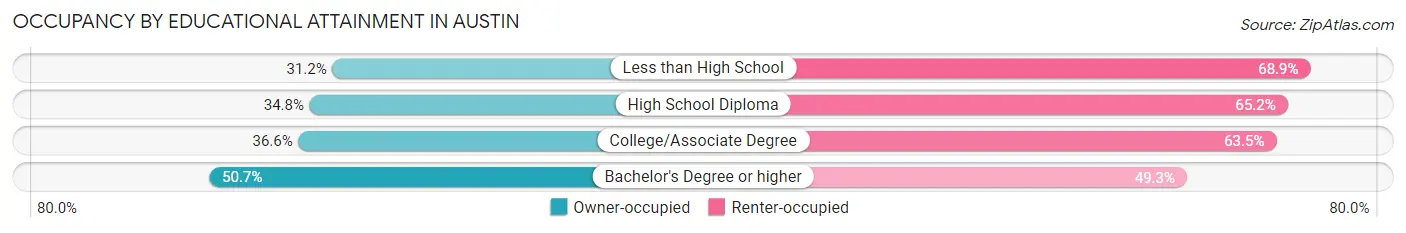
| Household Size | Owner-occupied | Renter-occupied |
| Less than High School | 8,559 (31.1%) | 18,919 (68.9%) |
| High School Diploma | 17,071 (34.8%) | 32,039 (65.2%) |
| College/Associate Degree | 34,538 (36.5%) | 59,951 (63.4%) |
| Bachelor's Degree or higher | 127,861 (50.7%) | 124,141 (49.3%) |
Occupancy by Age of Householder in Austin
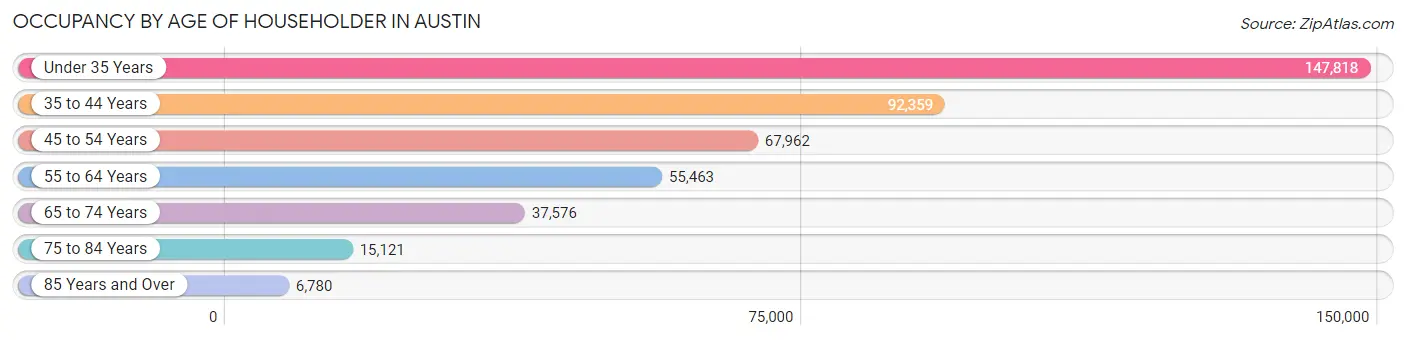
| Age Bracket | # Households | % Households |
| Under 35 Years | 147,818 | 34.9% |
| 35 to 44 Years | 92,359 | 21.8% |
| 45 to 54 Years | 67,962 | 16.1% |
| 55 to 64 Years | 55,463 | 13.1% |
| 65 to 74 Years | 37,576 | 8.9% |
| 75 to 84 Years | 15,121 | 3.6% |
| 85 Years and Over | 6,780 | 1.6% |
| Total | 423,079 | 100.0% |
Housing Finances in Austin
Median Income by Occupancy in Austin
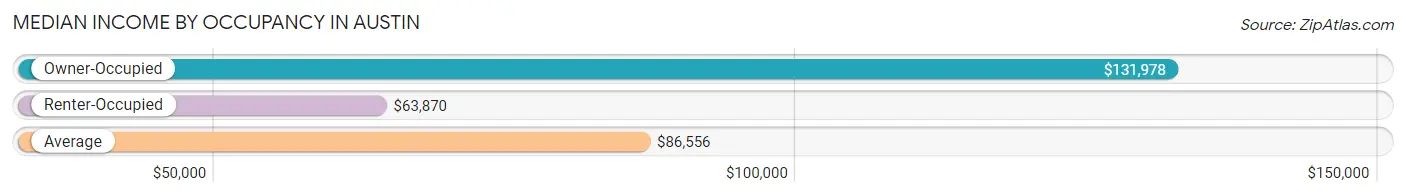
| Occupancy Type | # Households | Median Income |
| Owner-Occupied | 188,029 (44.4%) | $131,978 |
| Renter-Occupied | 235,050 (55.6%) | $63,870 |
| Average | 423,079 (100.0%) | $86,556 |
Occupancy by Householder Income Bracket in Austin
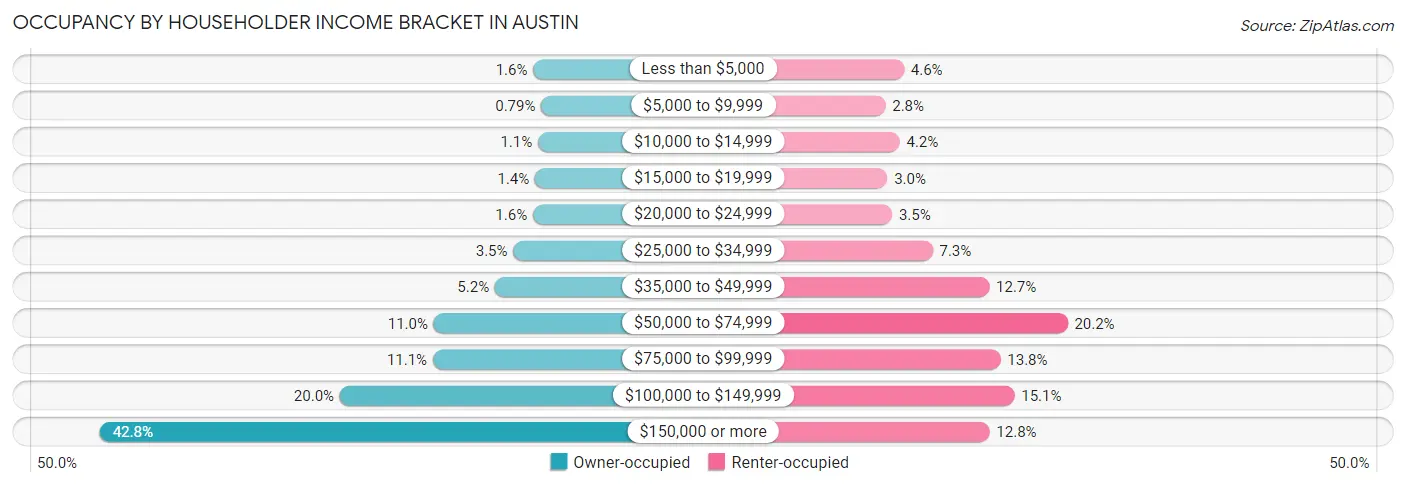
| Income Bracket | Owner-occupied | Renter-occupied |
| Less than $5,000 | 2,908 (1.5%) | 10,818 (4.6%) |
| $5,000 to $9,999 | 1,482 (0.8%) | 6,643 (2.8%) |
| $10,000 to $14,999 | 2,062 (1.1%) | 9,854 (4.2%) |
| $15,000 to $19,999 | 2,602 (1.4%) | 7,099 (3.0%) |
| $20,000 to $24,999 | 2,967 (1.6%) | 8,163 (3.5%) |
| $25,000 to $34,999 | 6,486 (3.5%) | 17,218 (7.3%) |
| $35,000 to $49,999 | 9,781 (5.2%) | 29,894 (12.7%) |
| $50,000 to $74,999 | 20,744 (11.0%) | 47,442 (20.2%) |
| $75,000 to $99,999 | 20,896 (11.1%) | 32,409 (13.8%) |
| $100,000 to $149,999 | 37,541 (20.0%) | 35,551 (15.1%) |
| $150,000 or more | 80,560 (42.8%) | 29,959 (12.8%) |
| Total | 188,029 (100.0%) | 235,050 (100.0%) |
Monthly Housing Cost Tiers in Austin
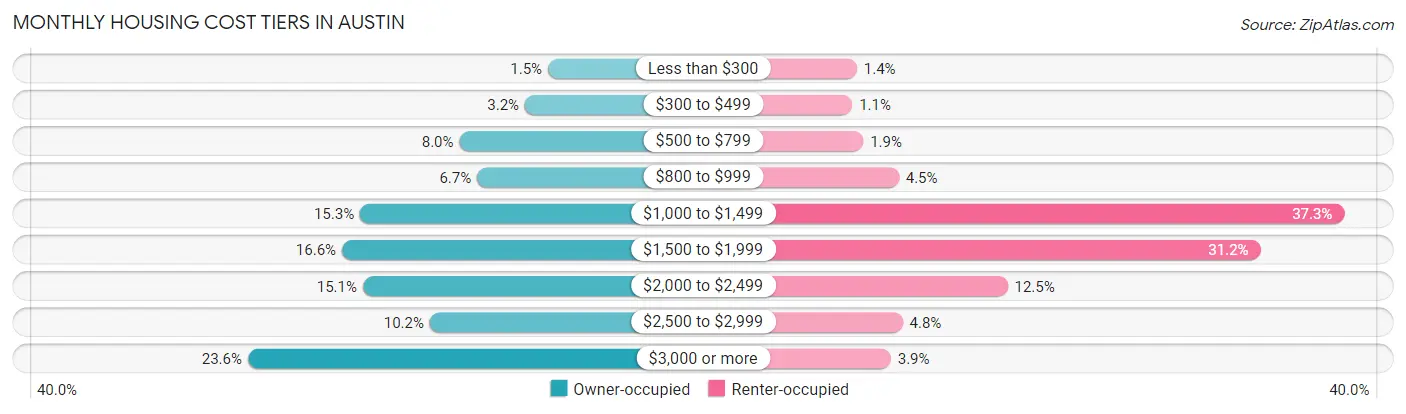
| Monthly Cost | Owner-occupied | Renter-occupied |
| Less than $300 | 2,744 (1.5%) | 3,363 (1.4%) |
| $300 to $499 | 5,917 (3.2%) | 2,563 (1.1%) |
| $500 to $799 | 15,002 (8.0%) | 4,468 (1.9%) |
| $800 to $999 | 12,566 (6.7%) | 10,629 (4.5%) |
| $1,000 to $1,499 | 28,773 (15.3%) | 87,722 (37.3%) |
| $1,500 to $1,999 | 31,273 (16.6%) | 73,211 (31.1%) |
| $2,000 to $2,499 | 28,366 (15.1%) | 29,456 (12.5%) |
| $2,500 to $2,999 | 19,096 (10.2%) | 11,274 (4.8%) |
| $3,000 or more | 44,292 (23.6%) | 9,243 (3.9%) |
| Total | 188,029 (100.0%) | 235,050 (100.0%) |
Physical Housing Characteristics in Austin
Housing Structures in Austin
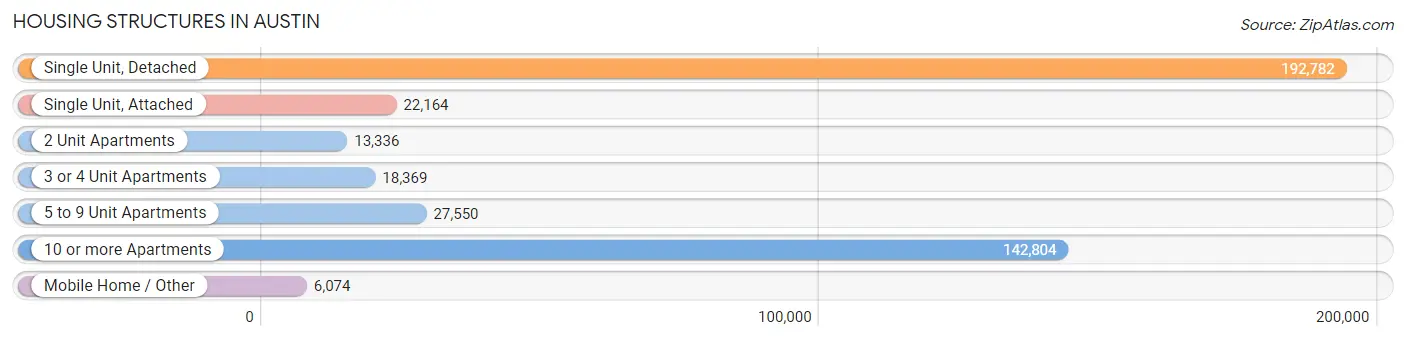
| Structure Type | # Housing Units | % Housing Units |
| Single Unit, Detached | 192,782 | 45.6% |
| Single Unit, Attached | 22,164 | 5.2% |
| 2 Unit Apartments | 13,336 | 3.2% |
| 3 or 4 Unit Apartments | 18,369 | 4.3% |
| 5 to 9 Unit Apartments | 27,550 | 6.5% |
| 10 or more Apartments | 142,804 | 33.8% |
| Mobile Home / Other | 6,074 | 1.4% |
| Total | 423,079 | 100.0% |
Housing Structures by Occupancy in Austin
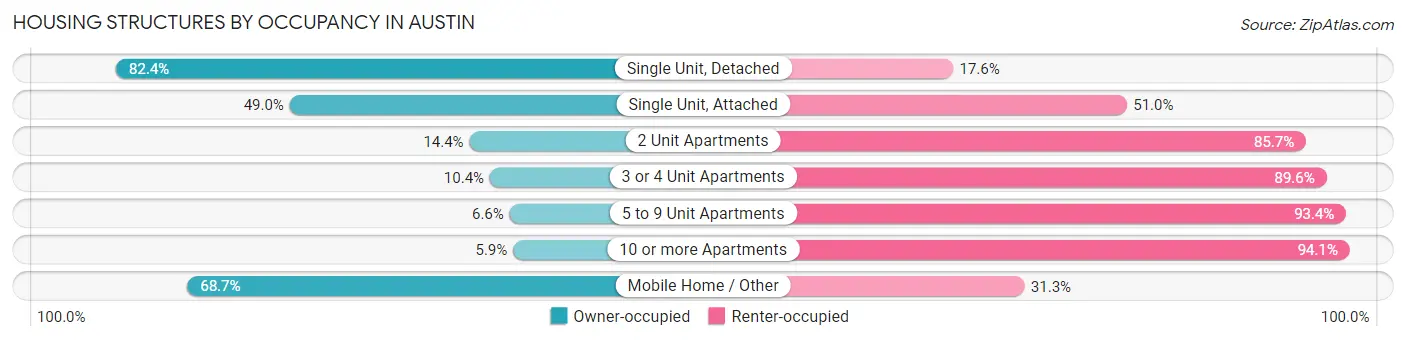
| Structure Type | Owner-occupied | Renter-occupied |
| Single Unit, Detached | 158,874 (82.4%) | 33,908 (17.6%) |
| Single Unit, Attached | 10,852 (49.0%) | 11,312 (51.0%) |
| 2 Unit Apartments | 1,914 (14.3%) | 11,422 (85.7%) |
| 3 or 4 Unit Apartments | 1,913 (10.4%) | 16,456 (89.6%) |
| 5 to 9 Unit Apartments | 1,824 (6.6%) | 25,726 (93.4%) |
| 10 or more Apartments | 8,481 (5.9%) | 134,323 (94.1%) |
| Mobile Home / Other | 4,171 (68.7%) | 1,903 (31.3%) |
| Total | 188,029 (44.4%) | 235,050 (55.6%) |
Housing Structures by Number of Rooms in Austin
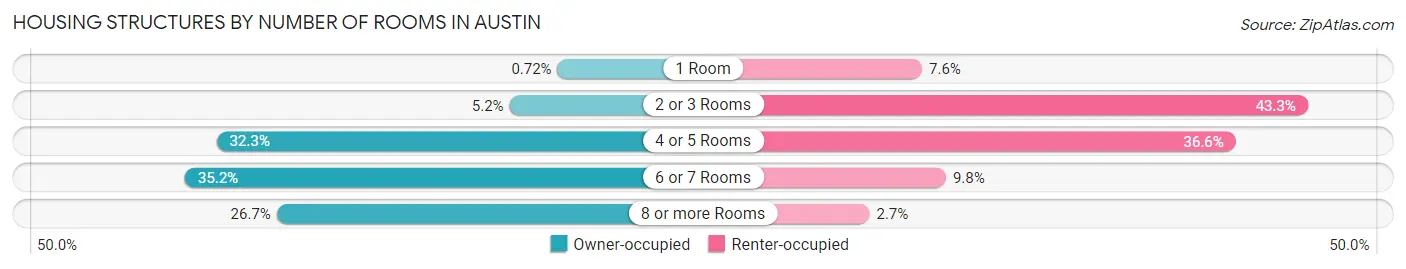
| Number of Rooms | Owner-occupied | Renter-occupied |
| 1 Room | 1,354 (0.7%) | 17,865 (7.6%) |
| 2 or 3 Rooms | 9,704 (5.2%) | 101,674 (43.3%) |
| 4 or 5 Rooms | 60,645 (32.3%) | 86,009 (36.6%) |
| 6 or 7 Rooms | 66,139 (35.2%) | 23,060 (9.8%) |
| 8 or more Rooms | 50,187 (26.7%) | 6,442 (2.7%) |
| Total | 188,029 (100.0%) | 235,050 (100.0%) |
Housing Structure by Heating Type in Austin
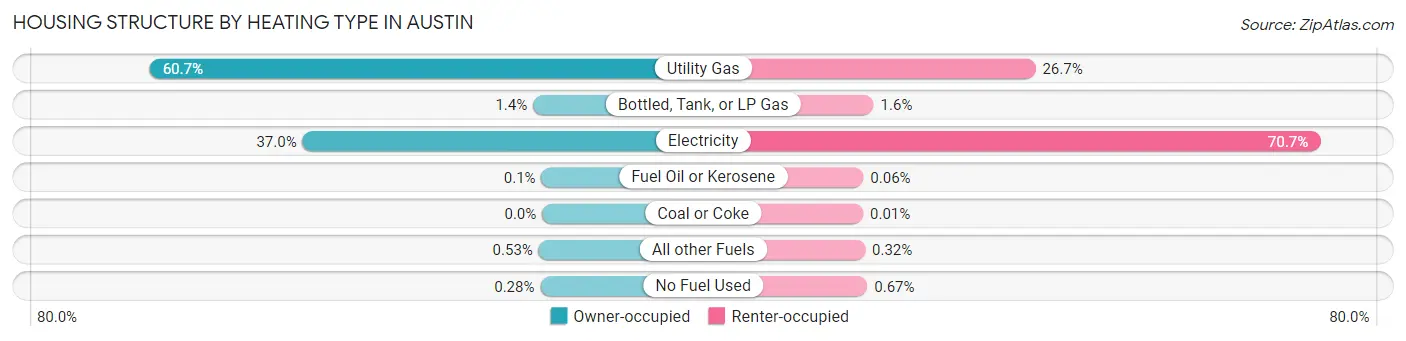
| Heating Type | Owner-occupied | Renter-occupied |
| Utility Gas | 114,043 (60.7%) | 62,653 (26.7%) |
| Bottled, Tank, or LP Gas | 2,624 (1.4%) | 3,846 (1.6%) |
| Electricity | 69,652 (37.0%) | 166,063 (70.7%) |
| Fuel Oil or Kerosene | 188 (0.1%) | 136 (0.1%) |
| Coal or Coke | 0 (0.0%) | 30 (0.0%) |
| All other Fuels | 1,000 (0.5%) | 749 (0.3%) |
| No Fuel Used | 522 (0.3%) | 1,573 (0.7%) |
| Total | 188,029 (100.0%) | 235,050 (100.0%) |
Household Vehicle Usage in Austin
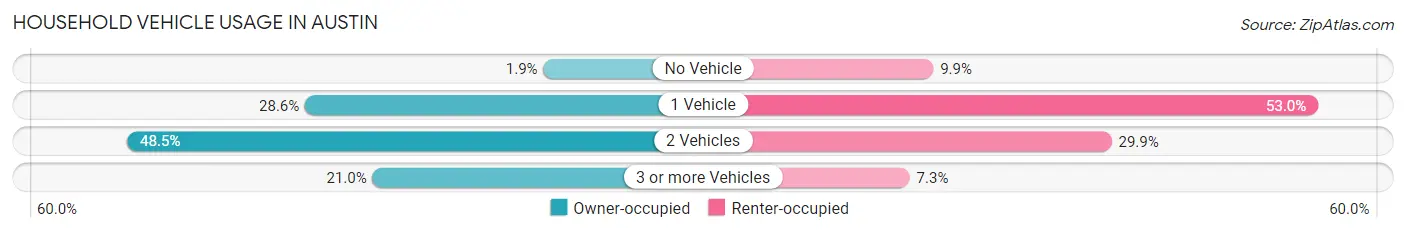
| Vehicles per Household | Owner-occupied | Renter-occupied |
| No Vehicle | 3,535 (1.9%) | 23,243 (9.9%) |
| 1 Vehicle | 53,739 (28.6%) | 124,576 (53.0%) |
| 2 Vehicles | 91,235 (48.5%) | 70,199 (29.9%) |
| 3 or more Vehicles | 39,520 (21.0%) | 17,032 (7.2%) |
| Total | 188,029 (100.0%) | 235,050 (100.0%) |
Real Estate & Mortgages in Austin
Real Estate and Mortgage Overview in Austin
| Characteristic | Without Mortgage | With Mortgage |
| Housing Units | 61,959 | 126,070 |
| Median Property Value | $441,600 | $469,700 |
| Median Household Income | $94,231 | $61,689 |
| Monthly Housing Costs | $956 | $42,253 |
| Real Estate Taxes | $6,618 | $1,645 |
Property Value by Mortgage Status in Austin
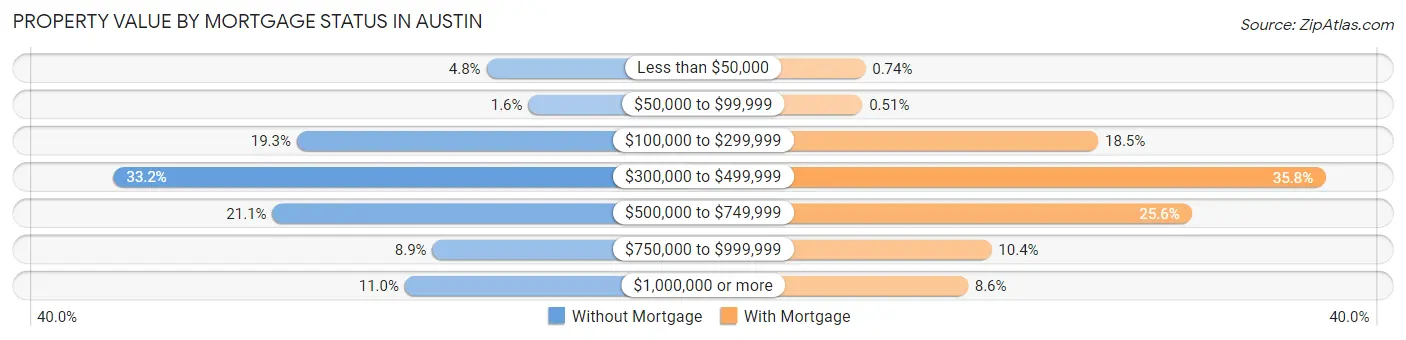
| Property Value | Without Mortgage | With Mortgage |
| Less than $50,000 | 2,980 (4.8%) | 938 (0.7%) |
| $50,000 to $99,999 | 1,003 (1.6%) | 647 (0.5%) |
| $100,000 to $299,999 | 11,932 (19.3%) | 23,292 (18.5%) |
| $300,000 to $499,999 | 20,590 (33.2%) | 45,093 (35.8%) |
| $500,000 to $749,999 | 13,085 (21.1%) | 32,272 (25.6%) |
| $750,000 to $999,999 | 5,532 (8.9%) | 13,044 (10.3%) |
| $1,000,000 or more | 6,837 (11.0%) | 10,784 (8.6%) |
| Total | 61,959 (100.0%) | 126,070 (100.0%) |
Household Income by Mortgage Status in Austin
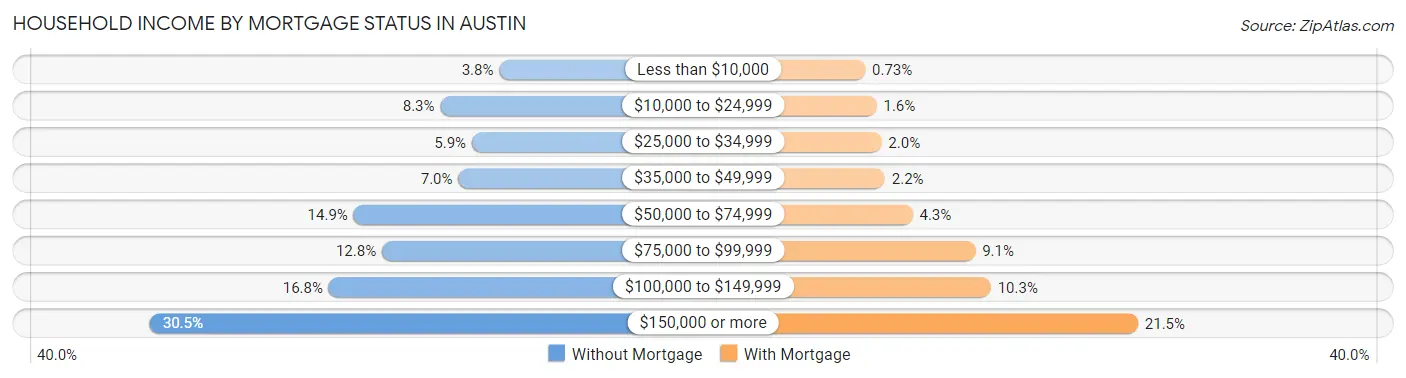
| Household Income | Without Mortgage | With Mortgage |
| Less than $10,000 | 2,373 (3.8%) | 926 (0.7%) |
| $10,000 to $24,999 | 5,153 (8.3%) | 2,017 (1.6%) |
| $25,000 to $34,999 | 3,670 (5.9%) | 2,478 (2.0%) |
| $35,000 to $49,999 | 4,307 (7.0%) | 2,816 (2.2%) |
| $50,000 to $74,999 | 9,250 (14.9%) | 5,474 (4.3%) |
| $75,000 to $99,999 | 7,913 (12.8%) | 11,494 (9.1%) |
| $100,000 to $149,999 | 10,422 (16.8%) | 12,983 (10.3%) |
| $150,000 or more | 18,871 (30.5%) | 27,119 (21.5%) |
| Total | 61,959 (100.0%) | 126,070 (100.0%) |
Property Value to Household Income Ratio in Austin
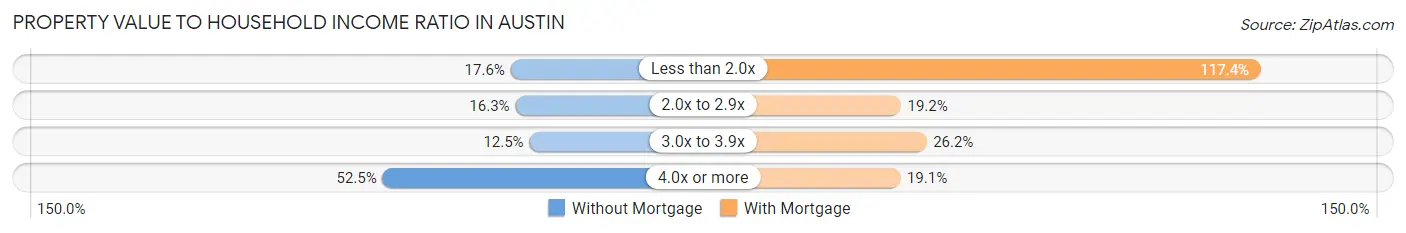
| Value-to-Income Ratio | Without Mortgage | With Mortgage |
| Less than 2.0x | 10,899 (17.6%) | 148,022 (117.4%) |
| 2.0x to 2.9x | 10,100 (16.3%) | 24,255 (19.2%) |
| 3.0x to 3.9x | 7,727 (12.5%) | 33,070 (26.2%) |
| 4.0x or more | 32,517 (52.5%) | 24,064 (19.1%) |
| Total | 61,959 (100.0%) | 126,070 (100.0%) |
Real Estate Taxes by Mortgage Status in Austin
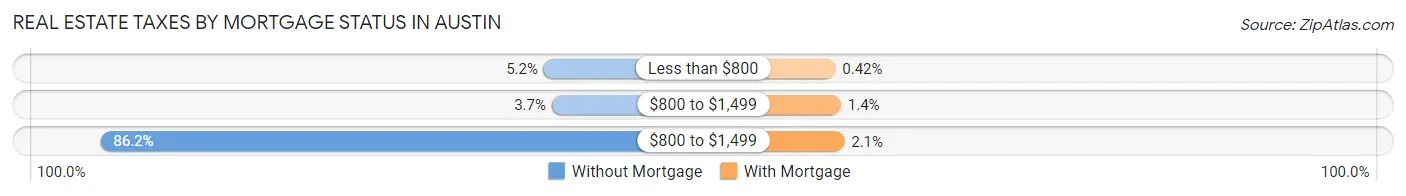
| Property Taxes | Without Mortgage | With Mortgage |
| Less than $800 | 3,203 (5.2%) | 532 (0.4%) |
| $800 to $1,499 | 2,292 (3.7%) | 1,788 (1.4%) |
| $800 to $1,499 | 53,381 (86.2%) | 2,584 (2.1%) |
| Total | 61,959 (100.0%) | 126,070 (100.0%) |
Health & Disability in Austin
Health Insurance Coverage by Age in Austin
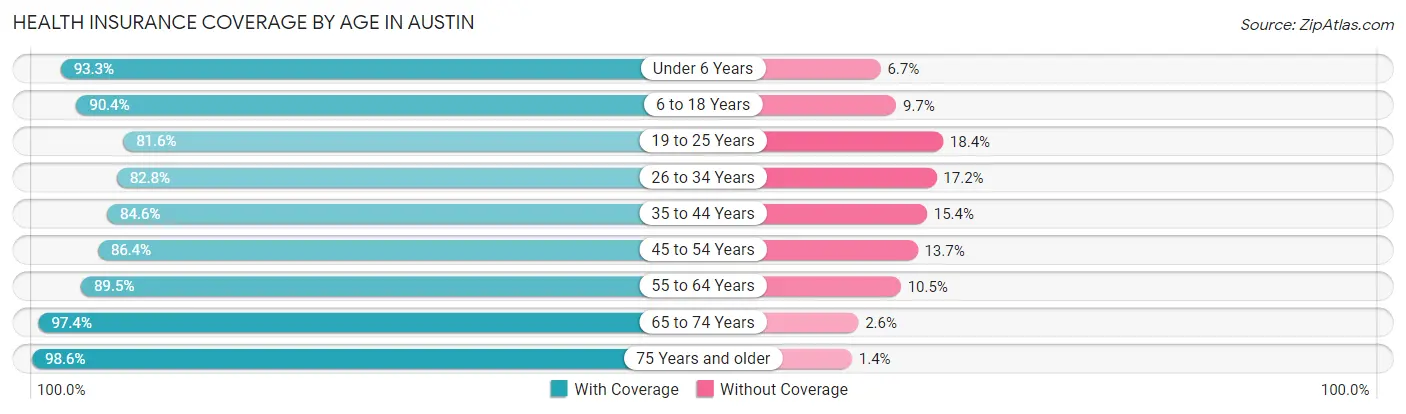
| Age Bracket | With Coverage | Without Coverage |
| Under 6 Years | 58,823 (93.3%) | 4,248 (6.7%) |
| 6 to 18 Years | 115,520 (90.3%) | 12,339 (9.7%) |
| 19 to 25 Years | 88,958 (81.6%) | 20,042 (18.4%) |
| 26 to 34 Years | 160,372 (82.8%) | 33,260 (17.2%) |
| 35 to 44 Years | 136,541 (84.6%) | 24,824 (15.4%) |
| 45 to 54 Years | 98,795 (86.4%) | 15,620 (13.7%) |
| 55 to 64 Years | 82,515 (89.5%) | 9,700 (10.5%) |
| 65 to 74 Years | 57,087 (97.4%) | 1,521 (2.6%) |
| 75 Years and older | 32,398 (98.6%) | 462 (1.4%) |
| Total | 831,009 (87.2%) | 122,016 (12.8%) |
Health Insurance Coverage by Citizenship Status in Austin
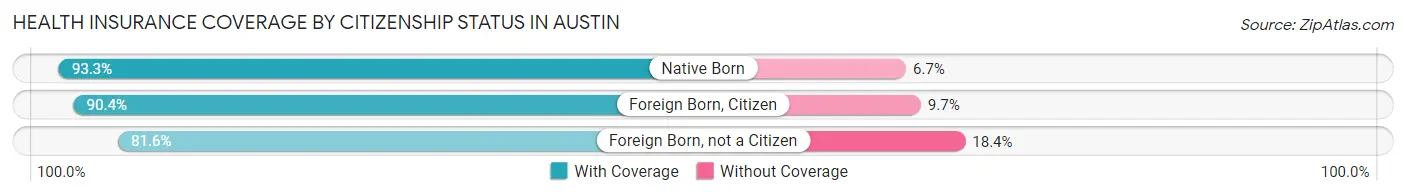
| Citizenship Status | With Coverage | Without Coverage |
| Native Born | 58,823 (93.3%) | 4,248 (6.7%) |
| Foreign Born, Citizen | 115,520 (90.3%) | 12,339 (9.7%) |
| Foreign Born, not a Citizen | 88,958 (81.6%) | 20,042 (18.4%) |
Health Insurance Coverage by Household Income in Austin
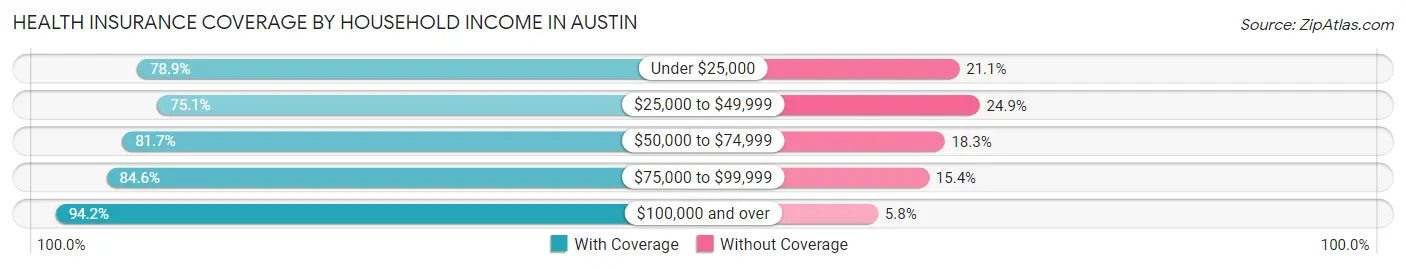
| Household Income | With Coverage | Without Coverage |
| Under $25,000 | 75,124 (78.9%) | 20,066 (21.1%) |
| $25,000 to $49,999 | 89,242 (75.1%) | 29,570 (24.9%) |
| $50,000 to $74,999 | 110,141 (81.7%) | 24,665 (18.3%) |
| $75,000 to $99,999 | 95,191 (84.6%) | 17,304 (15.4%) |
| $100,000 and over | 444,908 (94.2%) | 27,560 (5.8%) |
Public vs Private Health Insurance Coverage by Age in Austin
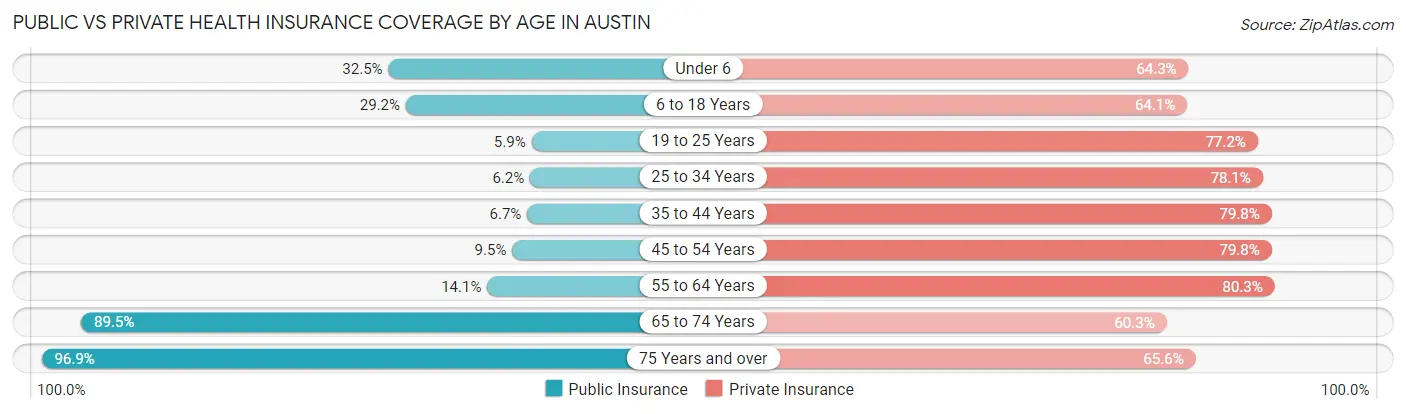
| Age Bracket | Public Insurance | Private Insurance |
| Under 6 | 20,478 (32.5%) | 40,583 (64.3%) |
| 6 to 18 Years | 37,375 (29.2%) | 81,942 (64.1%) |
| 19 to 25 Years | 6,440 (5.9%) | 84,139 (77.2%) |
| 25 to 34 Years | 11,963 (6.2%) | 151,275 (78.1%) |
| 35 to 44 Years | 10,834 (6.7%) | 128,715 (79.8%) |
| 45 to 54 Years | 10,857 (9.5%) | 91,256 (79.8%) |
| 55 to 64 Years | 13,031 (14.1%) | 74,080 (80.3%) |
| 65 to 74 Years | 52,462 (89.5%) | 35,320 (60.3%) |
| 75 Years and over | 31,832 (96.9%) | 21,570 (65.6%) |
| Total | 195,272 (20.5%) | 708,880 (74.4%) |
Disability Status by Sex by Age in Austin
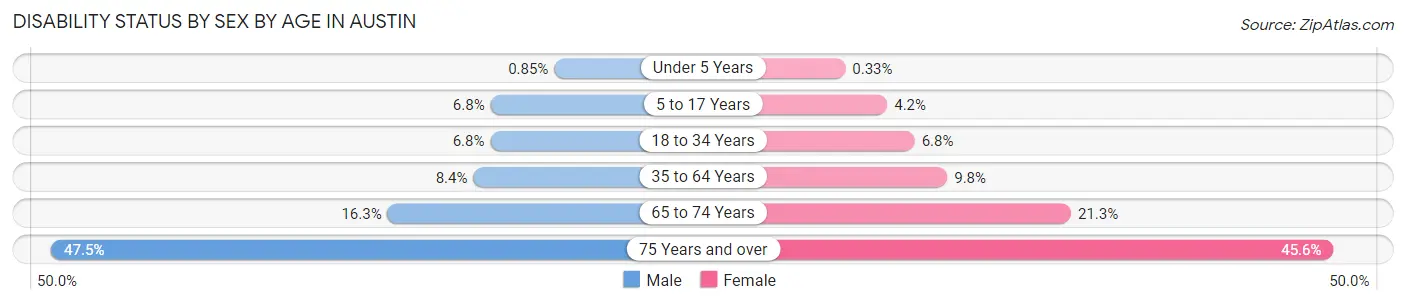
| Age Bracket | Male | Female |
| Under 5 Years | 228 (0.9%) | 87 (0.3%) |
| 5 to 17 Years | 4,335 (6.8%) | 2,594 (4.2%) |
| 18 to 34 Years | 11,072 (6.8%) | 10,257 (6.8%) |
| 35 to 64 Years | 16,090 (8.4%) | 17,184 (9.8%) |
| 65 to 74 Years | 4,540 (16.3%) | 6,552 (21.3%) |
| 75 Years and over | 6,270 (47.5%) | 8,971 (45.6%) |
Disability Class by Sex by Age in Austin
Disability Class: Hearing Difficulty
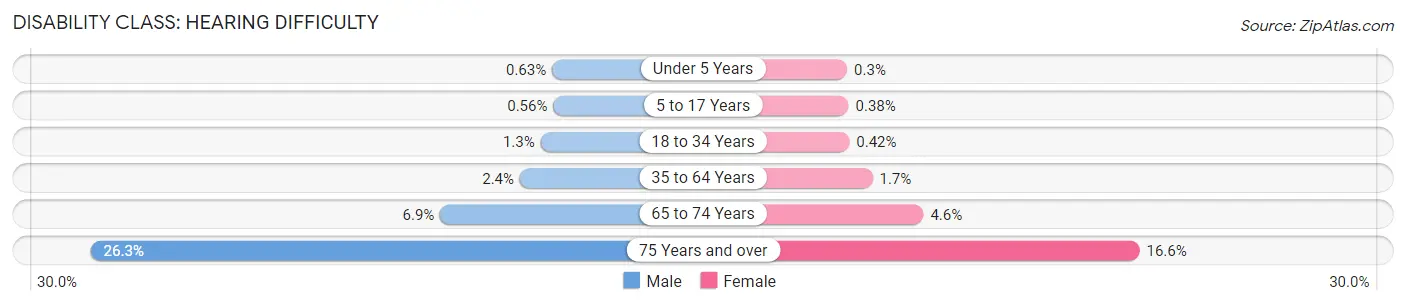
| Age Bracket | Male | Female |
| Under 5 Years | 169 (0.6%) | 78 (0.3%) |
| 5 to 17 Years | 360 (0.6%) | 232 (0.4%) |
| 18 to 34 Years | 2,074 (1.3%) | 637 (0.4%) |
| 35 to 64 Years | 4,667 (2.4%) | 3,004 (1.7%) |
| 65 to 74 Years | 1,908 (6.9%) | 1,400 (4.5%) |
| 75 Years and over | 3,472 (26.3%) | 3,261 (16.6%) |
Disability Class: Vision Difficulty
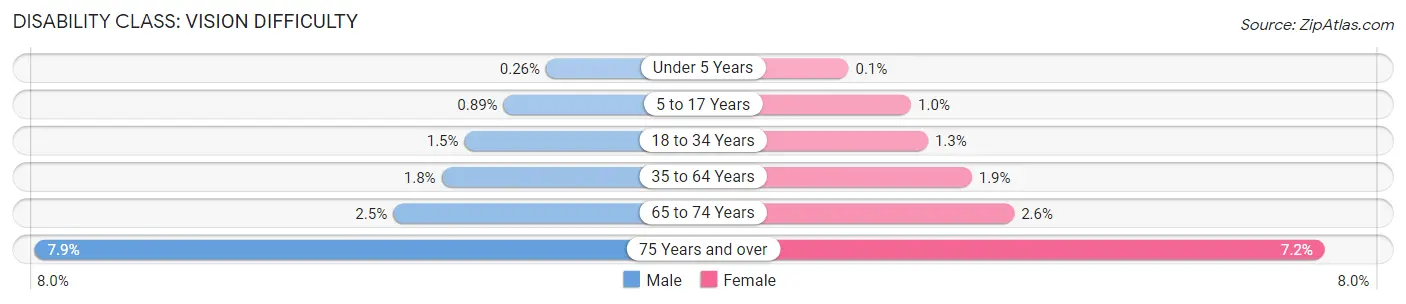
| Age Bracket | Male | Female |
| Under 5 Years | 69 (0.3%) | 26 (0.1%) |
| 5 to 17 Years | 570 (0.9%) | 634 (1.0%) |
| 18 to 34 Years | 2,400 (1.5%) | 1,940 (1.3%) |
| 35 to 64 Years | 3,483 (1.8%) | 3,387 (1.9%) |
| 65 to 74 Years | 704 (2.5%) | 789 (2.6%) |
| 75 Years and over | 1,036 (7.9%) | 1,411 (7.2%) |
Disability Class: Cognitive Difficulty
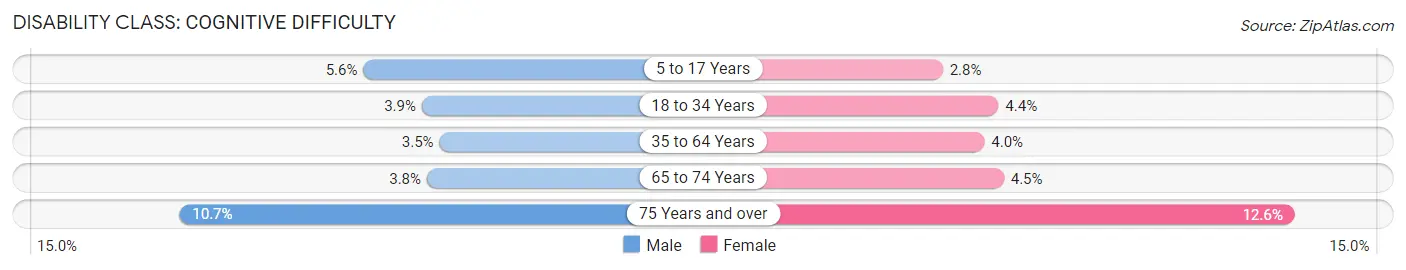
| Age Bracket | Male | Female |
| 5 to 17 Years | 3,569 (5.6%) | 1,727 (2.8%) |
| 18 to 34 Years | 6,442 (3.9%) | 6,608 (4.4%) |
| 35 to 64 Years | 6,633 (3.5%) | 6,965 (4.0%) |
| 65 to 74 Years | 1,058 (3.8%) | 1,388 (4.5%) |
| 75 Years and over | 1,410 (10.7%) | 2,480 (12.6%) |
Disability Class: Ambulatory Difficulty
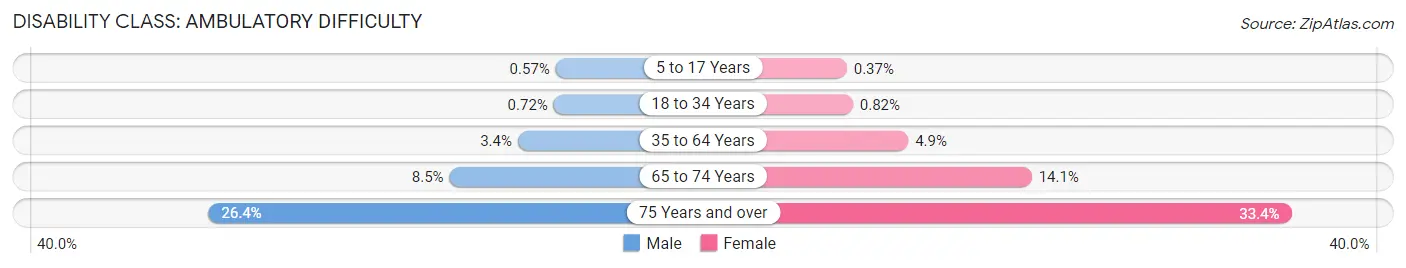
| Age Bracket | Male | Female |
| 5 to 17 Years | 363 (0.6%) | 229 (0.4%) |
| 18 to 34 Years | 1,176 (0.7%) | 1,245 (0.8%) |
| 35 to 64 Years | 6,500 (3.4%) | 8,649 (4.9%) |
| 65 to 74 Years | 2,353 (8.5%) | 4,341 (14.1%) |
| 75 Years and over | 3,476 (26.4%) | 6,565 (33.4%) |
Disability Class: Self-Care Difficulty
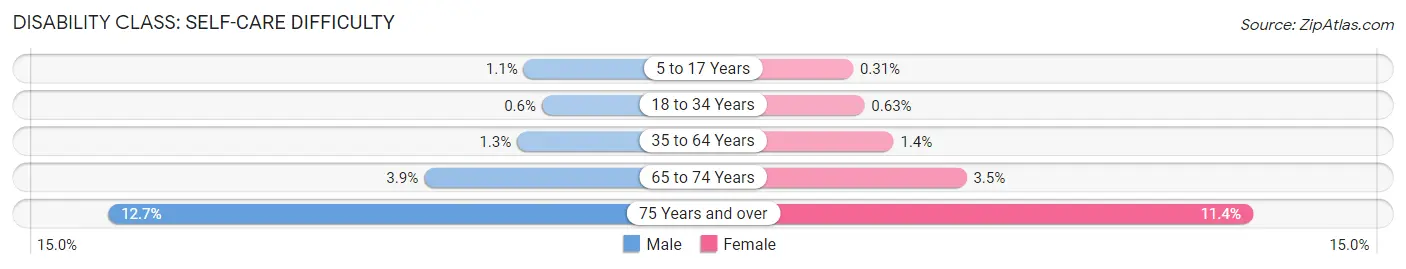
| Age Bracket | Male | Female |
| 5 to 17 Years | 711 (1.1%) | 190 (0.3%) |
| 18 to 34 Years | 978 (0.6%) | 952 (0.6%) |
| 35 to 64 Years | 2,479 (1.3%) | 2,535 (1.4%) |
| 65 to 74 Years | 1,079 (3.9%) | 1,068 (3.5%) |
| 75 Years and over | 1,671 (12.7%) | 2,251 (11.4%) |
Technology Access in Austin
Computing Device Access in Austin
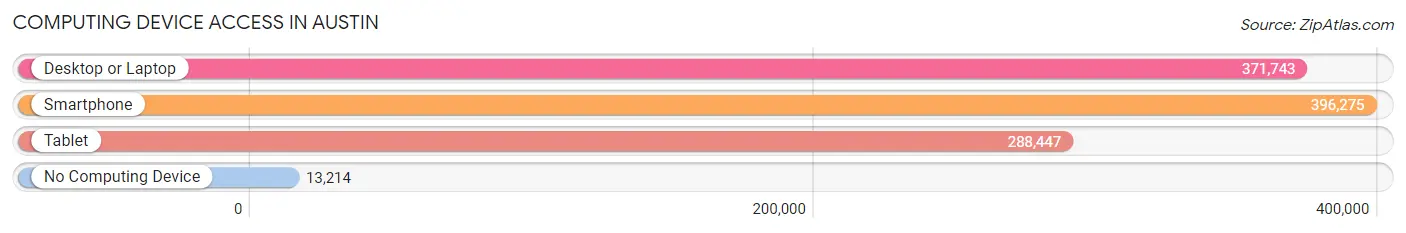
| Device Type | # Households | % Households |
| Desktop or Laptop | 371,743 | 87.9% |
| Smartphone | 396,275 | 93.7% |
| Tablet | 288,447 | 68.2% |
| No Computing Device | 13,214 | 3.1% |
| Total | 423,079 | 100.0% |
Internet Access in Austin
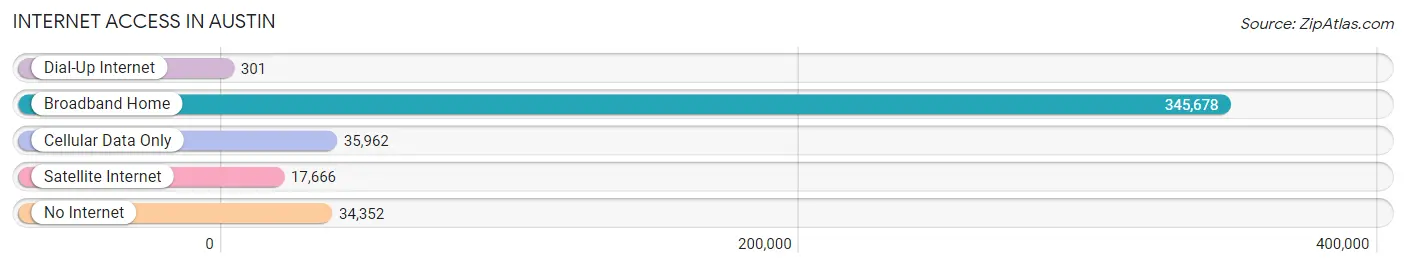
| Internet Type | # Households | % Households |
| Dial-Up Internet | 301 | 0.1% |
| Broadband Home | 345,678 | 81.7% |
| Cellular Data Only | 35,962 | 8.5% |
| Satellite Internet | 17,666 | 4.2% |
| No Internet | 34,352 | 8.1% |
| Total | 423,079 | 100.0% |
Austin Summary
Austin, Texas is the capital of the Lone Star State and the fourth-largest city in the state. Located in the heart of Central Texas, Austin is known for its vibrant music scene, outdoor activities, and unique culture. The city is home to the University of Texas at Austin, the state’s flagship university, and is a major center for technology and business.
Geography
Austin is located in the center of the Texas Hill Country, a region of rolling hills and limestone outcroppings. The city is situated on the Colorado River, which runs through the city and provides a source of recreation and natural beauty. The city is surrounded by several lakes, including Lake Travis, Lady Bird Lake, and Lake Austin. The city is also home to several parks, including Zilker Park, Barton Springs Pool, and the Lady Bird Johnson Wildflower Center.
Climate
Austin has a humid subtropical climate, with hot summers and mild winters. The average temperature in the summer is around 90°F (32°C), while the average temperature in the winter is around 50°F (10°C). The city receives an average of 34 inches (86 cm) of rain per year, with most of the rain falling in the spring and summer months.
Economy
Austin is a major center for technology and business. The city is home to several major companies, including Dell, Apple, IBM, and Oracle. The city is also home to the University of Texas at Austin, which is a major employer in the city. The city’s economy is also bolstered by its tourism industry, which is driven by its vibrant music scene and outdoor activities.
Demographics
As of the 2010 census, Austin had a population of 790,390. The city is racially and ethnically diverse, with a population that is 48.7% White, 35.1% Hispanic or Latino, 8.2% African American, and 6.3% Asian. The median household income in Austin is $58,908, and the median home value is $250,000.
Austin is a vibrant and diverse city that is known for its music, outdoor activities, and unique culture. The city is a major center for technology and business, and is home to the University of Texas at Austin. The city is racially and ethnically diverse, and has a median household income of $58,908. Austin is a great place to live, work, and play, and is sure to continue to be a major player in the Lone Star State.
Common Questions
What is Per Capita Income in Austin?
Per Capita income in Austin is $54,673.
What is the Median Family Income in Austin?
Median Family Income in Austin is $115,154.
What is the Median Household income in Austin?
Median Household Income in Austin is $86,556.
What is Income or Wage Gap in Austin?
Income or Wage Gap in Austin is 19.1%.
Women in Austin earn 80.9 cents for every dollar earned by a man.
What is Family Income Deficit in Austin?
Family Income Deficit in Austin is $10,878.
Families that are below poverty line in Austin earn $10,878 less on average than the poverty threshold level.
What is Inequality or Gini Index in Austin?
Inequality or Gini Index in Austin is 0.48.
What is the Total Population of Austin?
Total Population of Austin is 958,202.
What is the Total Male Population of Austin?
Total Male Population of Austin is 491,099.
What is the Total Female Population of Austin?
Total Female Population of Austin is 467,103.
What is the Ratio of Males per 100 Females in Austin?
There are 105.14 Males per 100 Females in Austin.
What is the Ratio of Females per 100 Males in Austin?
There are 95.11 Females per 100 Males in Austin.
What is the Median Population Age in Austin?
Median Population Age in Austin is 34.2 Years.
What is the Average Family Size in Austin
Average Family Size in Austin is 3.0 People.
What is the Average Household Size in Austin
Average Household Size in Austin is 2.2 People.
How Large is the Labor Force in Austin?
There are 597,529 People in the Labor Forcein in Austin.
What is the Percentage of People in the Labor Force in Austin?
74.9% of People are in the Labor Force in Austin.
What is the Unemployment Rate in Austin?
Unemployment Rate in Austin is 4.4%.