Georgetown, DE Map & Demographics
Georgetown Map
Georgetown Overview
$22,640
PER CAPITA INCOME
$50,417
AVG FAMILY INCOME
$47,238
AVG HOUSEHOLD INCOME
24.9%
WAGE / INCOME GAP [ % ]
75.1¢/ $1
WAGE / INCOME GAP [ $ ]
0.42
INEQUALITY / GINI INDEX
7,247
TOTAL POPULATION
3,922
MALE POPULATION
3,325
FEMALE POPULATION
117.95
MALES / 100 FEMALES
84.78
FEMALES / 100 MALES
32.3
MEDIAN AGE
3.4
AVG FAMILY SIZE
2.9
AVG HOUSEHOLD SIZE
3,168
LABOR FORCE [ PEOPLE ]
59.4%
PERCENT IN LABOR FORCE
2.0%
UNEMPLOYMENT RATE
Georgetown Zip Codes
Georgetown Area Codes
Income in Georgetown
Income Overview in Georgetown
Per Capita Income in Georgetown is $22,640, while median incomes of families and households are $50,417 and $47,238 respectively.
| Characteristic | Number | Measure |
| Per Capita Income | 7,247 | $22,640 |
| Median Family Income | 1,590 | $50,417 |
| Mean Family Income | 1,590 | $67,550 |
| Median Household Income | 2,437 | $47,238 |
| Mean Household Income | 2,437 | $63,664 |
| Income Deficit | 1,590 | $0 |
| Wage / Income Gap (%) | 7,247 | 24.90% |
| Wage / Income Gap ($) | 7,247 | 75.10¢ per $1 |
| Gini / Inequality Index | 7,247 | 0.42 |
Earnings by Sex in Georgetown
Average Earnings in Georgetown are $31,458, $34,874 for men and $26,192 for women, a difference of 24.9%.
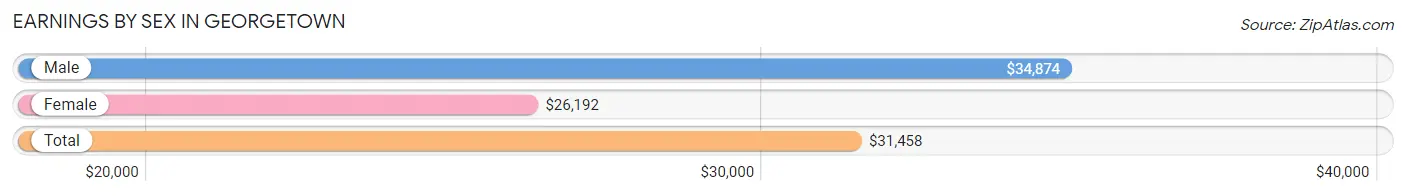
| Sex | Number | Average Earnings |
| Male | 2,193 (67.3%) | $34,874 |
| Female | 1,067 (32.7%) | $26,192 |
| Total | 3,260 (100.0%) | $31,458 |
Earnings by Sex by Income Bracket in Georgetown
The most common earnings brackets in Georgetown are $45,000 to $49,999 for men (366 | 16.7%) and $25,000 to $29,999 for women (219 | 20.5%).
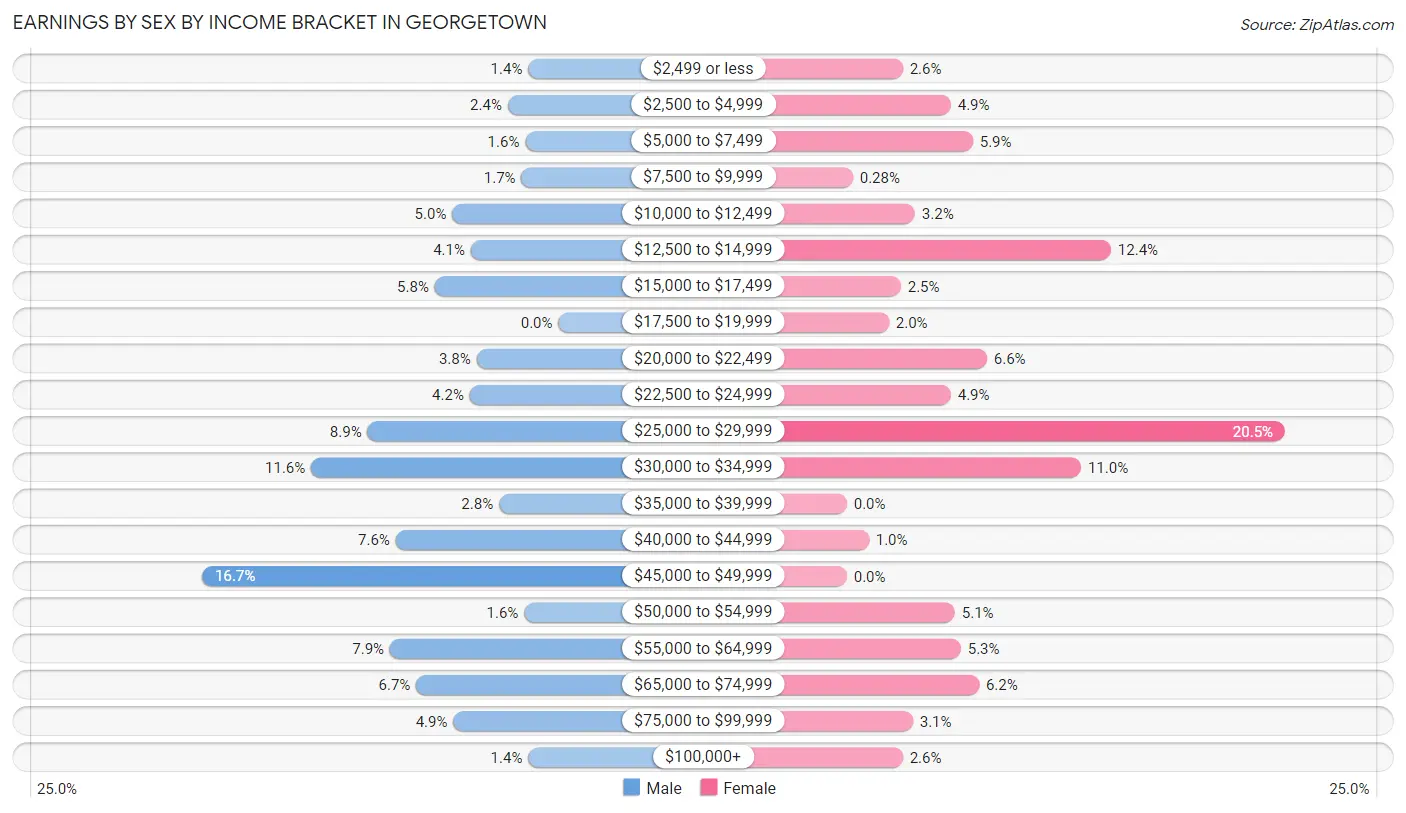
| Income | Male | Female |
| $2,499 or less | 31 (1.4%) | 28 (2.6%) |
| $2,500 to $4,999 | 52 (2.4%) | 52 (4.9%) |
| $5,000 to $7,499 | 34 (1.5%) | 63 (5.9%) |
| $7,500 to $9,999 | 38 (1.7%) | 3 (0.3%) |
| $10,000 to $12,499 | 109 (5.0%) | 34 (3.2%) |
| $12,500 to $14,999 | 90 (4.1%) | 132 (12.4%) |
| $15,000 to $17,499 | 127 (5.8%) | 27 (2.5%) |
| $17,500 to $19,999 | 0 (0.0%) | 21 (2.0%) |
| $20,000 to $22,499 | 84 (3.8%) | 70 (6.6%) |
| $22,500 to $24,999 | 91 (4.2%) | 52 (4.9%) |
| $25,000 to $29,999 | 196 (8.9%) | 219 (20.5%) |
| $30,000 to $34,999 | 254 (11.6%) | 117 (11.0%) |
| $35,000 to $39,999 | 61 (2.8%) | 0 (0.0%) |
| $40,000 to $44,999 | 167 (7.6%) | 11 (1.0%) |
| $45,000 to $49,999 | 366 (16.7%) | 0 (0.0%) |
| $50,000 to $54,999 | 35 (1.6%) | 54 (5.1%) |
| $55,000 to $64,999 | 173 (7.9%) | 57 (5.3%) |
| $65,000 to $74,999 | 146 (6.7%) | 66 (6.2%) |
| $75,000 to $99,999 | 108 (4.9%) | 33 (3.1%) |
| $100,000+ | 31 (1.4%) | 28 (2.6%) |
| Total | 2,193 (100.0%) | 1,067 (100.0%) |
Earnings by Sex by Educational Attainment in Georgetown
Average earnings in Georgetown are $44,187 for men and $27,691 for women, a difference of 37.3%. Men with an educational attainment of bachelor's degree enjoy the highest average annual earnings of $57,109, while those with less than high school education earn the least with $37,132. Women with an educational attainment of graduate degree earn the most with the average annual earnings of $67,917, while those with college or associate's degree education have the smallest earnings of $23,831.
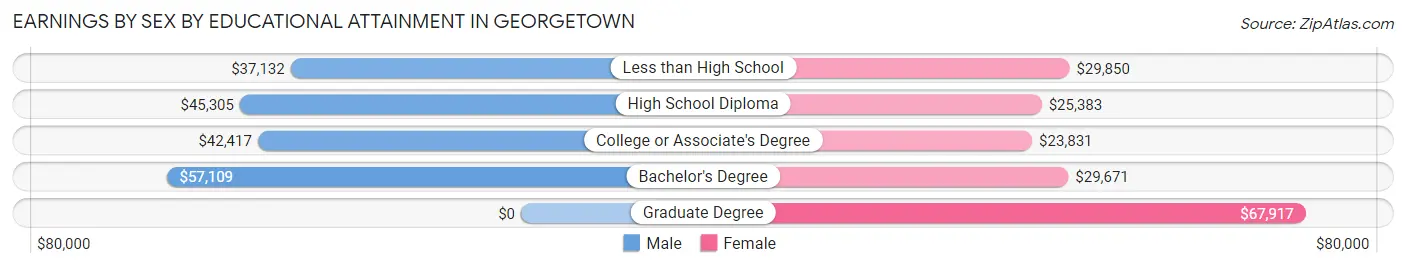
| Educational Attainment | Male Income | Female Income |
| Less than High School | $37,132 | $29,850 |
| High School Diploma | $45,305 | $25,383 |
| College or Associate's Degree | $42,417 | $23,831 |
| Bachelor's Degree | $57,109 | $29,671 |
| Graduate Degree | - | - |
| Total | $44,187 | $27,691 |
Family Income in Georgetown
Family Income Brackets in Georgetown
According to the Georgetown family income data, there are 510 families falling into the $35,000 to $49,999 income range, which is the most common income bracket and makes up 32.1% of all families.
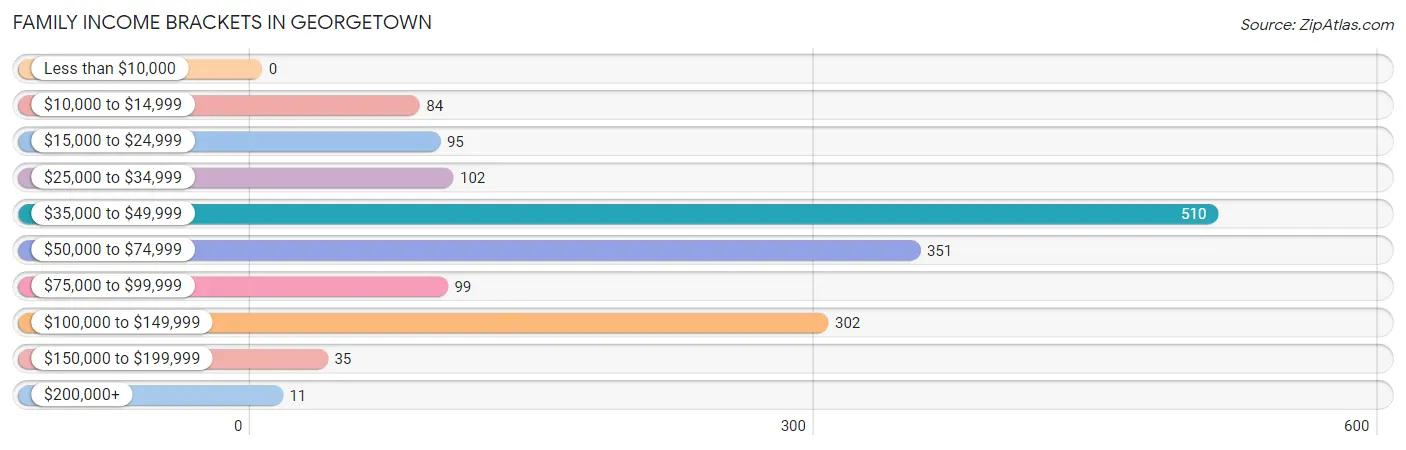
| Income Bracket | # Families | % Families |
| Less than $10,000 | 0 | 0.0% |
| $10,000 to $14,999 | 84 | 5.3% |
| $15,000 to $24,999 | 95 | 6.0% |
| $25,000 to $34,999 | 102 | 6.4% |
| $35,000 to $49,999 | 510 | 32.1% |
| $50,000 to $74,999 | 351 | 22.1% |
| $75,000 to $99,999 | 99 | 6.2% |
| $100,000 to $149,999 | 302 | 19.0% |
| $150,000 to $199,999 | 35 | 2.2% |
| $200,000+ | 11 | 0.7% |
Family Income by Famaliy Size in Georgetown
3-person families (238 | 15.0%) account for the highest median family income in Georgetown with $100,300 per family, while 3-person families (238 | 15.0%) have the highest median income of $33,433 per family member.
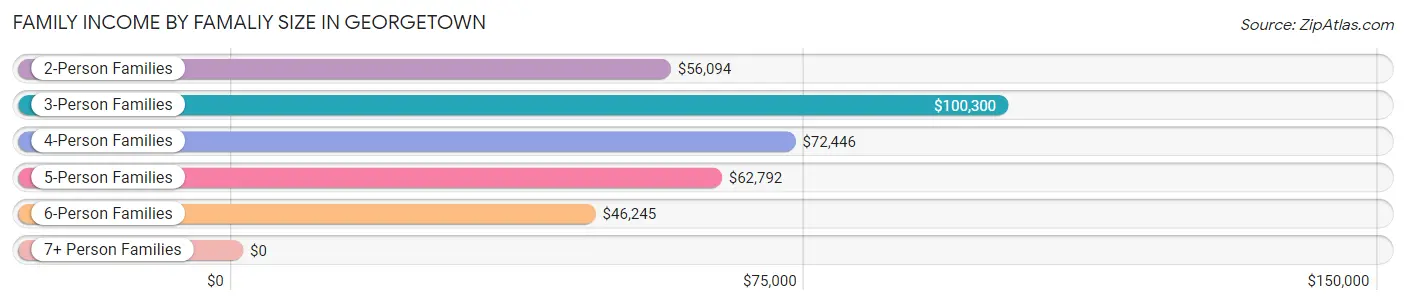
| Income Bracket | # Families | Median Income |
| 2-Person Families | 582 (36.6%) | $56,094 |
| 3-Person Families | 238 (15.0%) | $100,300 |
| 4-Person Families | 201 (12.6%) | $72,446 |
| 5-Person Families | 195 (12.3%) | $62,792 |
| 6-Person Families | 287 (18.0%) | $46,245 |
| 7+ Person Families | 87 (5.5%) | $0 |
| Total | 1,590 (100.0%) | $50,417 |
Family Income by Number of Earners in Georgetown
The median family income in Georgetown is $50,417, with families comprising 3+ earners (160) having the highest median family income of $120,543, while families with 1 earner (811) have the lowest median family income of $45,711, accounting for 10.1% and 51.0% of families, respectively.
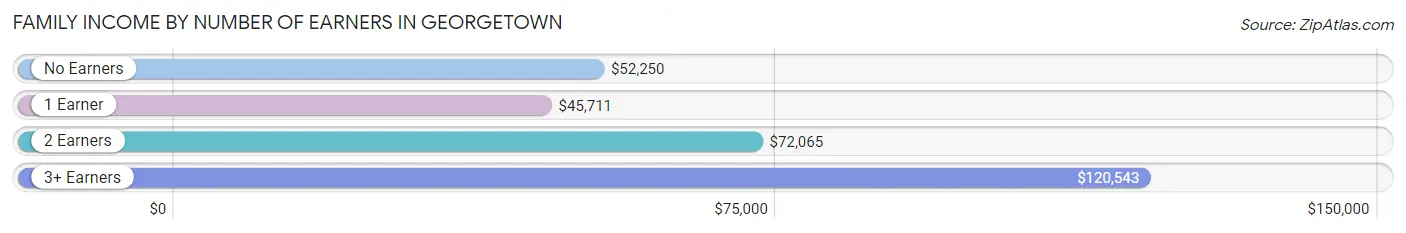
| Number of Earners | # Families | Median Income |
| No Earners | 149 (9.4%) | $52,250 |
| 1 Earner | 811 (51.0%) | $45,711 |
| 2 Earners | 470 (29.6%) | $72,065 |
| 3+ Earners | 160 (10.1%) | $120,543 |
| Total | 1,590 (100.0%) | $50,417 |
Household Income in Georgetown
Household Income Brackets in Georgetown
With 548 households falling in the category, the $35,000 to $49,999 income range is the most frequent in Georgetown, accounting for 22.5% of all households. In contrast, only 39 households (1.6%) fall into the $200,000+ income bracket, making it the least populous group.
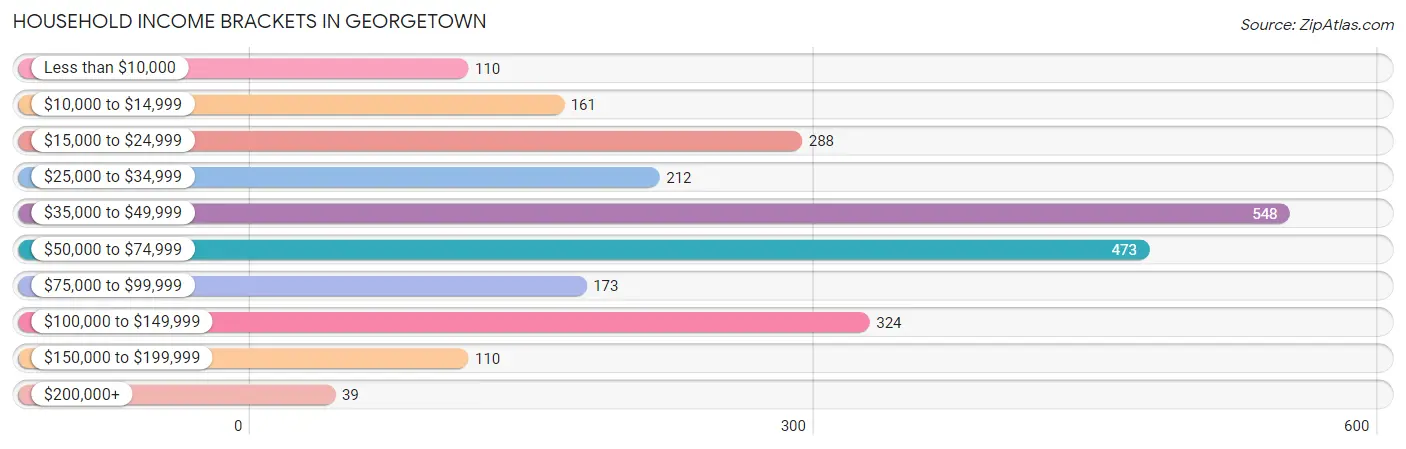
| Income Bracket | # Households | % Households |
| Less than $10,000 | 110 | 4.5% |
| $10,000 to $14,999 | 161 | 6.6% |
| $15,000 to $24,999 | 288 | 11.8% |
| $25,000 to $34,999 | 212 | 8.7% |
| $35,000 to $49,999 | 548 | 22.5% |
| $50,000 to $74,999 | 473 | 19.4% |
| $75,000 to $99,999 | 173 | 7.1% |
| $100,000 to $149,999 | 324 | 13.3% |
| $150,000 to $199,999 | 110 | 4.5% |
| $200,000+ | 39 | 1.6% |
Household Income by Householder Age in Georgetown
The median household income in Georgetown is $47,238, with the highest median household income of $47,778 found in the 25 to 44 years age bracket for the primary householder. A total of 878 households (36.0%) fall into this category. Meanwhile, the 15 to 24 years age bracket for the primary householder has the lowest median household income of $0, with 89 households (3.6%) in this group.
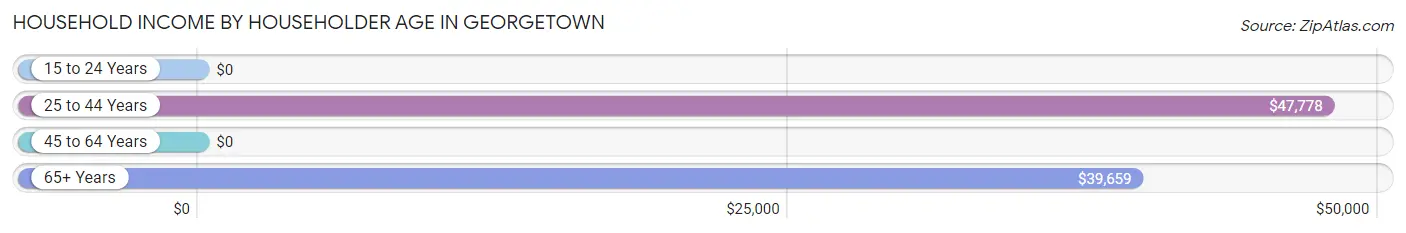
| Income Bracket | # Households | Median Income |
| 15 to 24 Years | 89 (3.6%) | $0 |
| 25 to 44 Years | 878 (36.0%) | $47,778 |
| 45 to 64 Years | 851 (34.9%) | $0 |
| 65+ Years | 619 (25.4%) | $39,659 |
| Total | 2,437 (100.0%) | $47,238 |
Poverty in Georgetown
Income Below Poverty by Sex and Age in Georgetown
With 15.0% poverty level for males and 21.3% for females among the residents of Georgetown, 45 to 54 year old males and 12 to 14 year old females are the most vulnerable to poverty, with 129 males (41.3%) and 113 females (62.8%) in their respective age groups living below the poverty level.
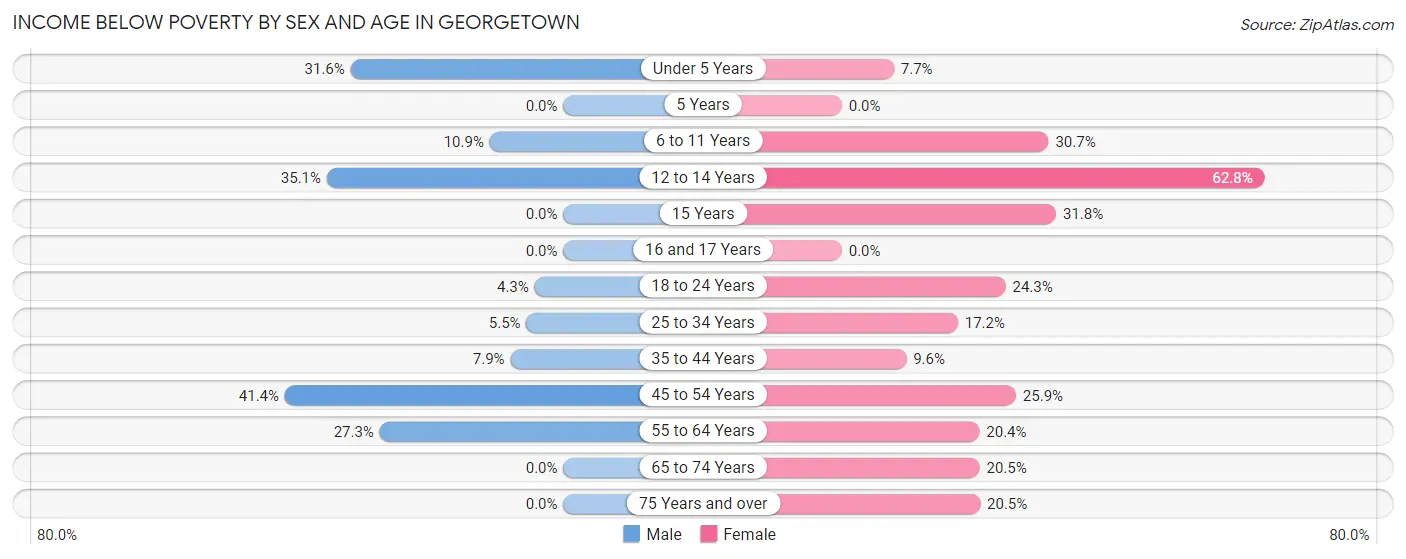
| Age Bracket | Male | Female |
| Under 5 Years | 134 (31.6%) | 16 (7.7%) |
| 5 Years | 0 (0.0%) | 0 (0.0%) |
| 6 to 11 Years | 46 (10.9%) | 31 (30.7%) |
| 12 to 14 Years | 105 (35.1%) | 113 (62.8%) |
| 15 Years | 0 (0.0%) | 7 (31.8%) |
| 16 and 17 Years | 0 (0.0%) | 0 (0.0%) |
| 18 to 24 Years | 19 (4.3%) | 80 (24.3%) |
| 25 to 34 Years | 28 (5.5%) | 67 (17.2%) |
| 35 to 44 Years | 46 (7.9%) | 42 (9.6%) |
| 45 to 54 Years | 129 (41.3%) | 99 (25.9%) |
| 55 to 64 Years | 69 (27.3%) | 86 (20.4%) |
| 65 to 74 Years | 0 (0.0%) | 62 (20.5%) |
| 75 Years and over | 0 (0.0%) | 53 (20.5%) |
| Total | 576 (15.0%) | 656 (21.3%) |
Income Above Poverty by Sex and Age in Georgetown
According to the poverty statistics in Georgetown, males aged 5 years and females aged 5 years are the age groups that are most secure financially, with 100.0% of males and 100.0% of females in these age groups living above the poverty line.
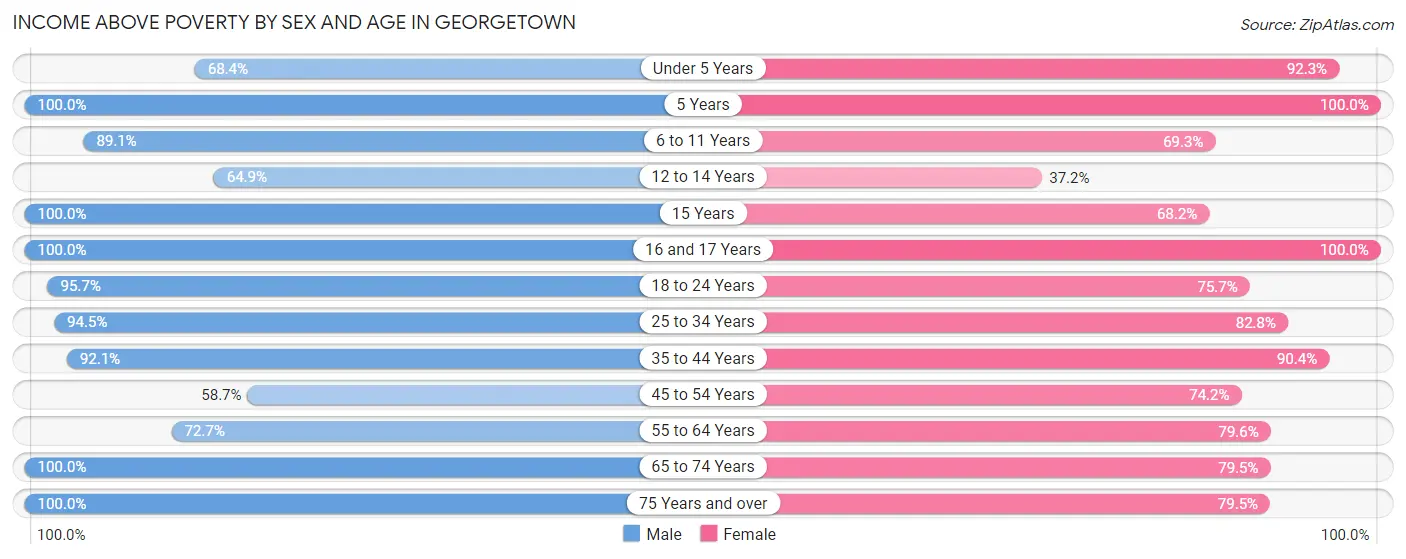
| Age Bracket | Male | Female |
| Under 5 Years | 290 (68.4%) | 191 (92.3%) |
| 5 Years | 17 (100.0%) | 23 (100.0%) |
| 6 to 11 Years | 375 (89.1%) | 70 (69.3%) |
| 12 to 14 Years | 194 (64.9%) | 67 (37.2%) |
| 15 Years | 39 (100.0%) | 15 (68.2%) |
| 16 and 17 Years | 133 (100.0%) | 27 (100.0%) |
| 18 to 24 Years | 426 (95.7%) | 249 (75.7%) |
| 25 to 34 Years | 483 (94.5%) | 322 (82.8%) |
| 35 to 44 Years | 539 (92.1%) | 397 (90.4%) |
| 45 to 54 Years | 183 (58.7%) | 284 (74.2%) |
| 55 to 64 Years | 184 (72.7%) | 335 (79.6%) |
| 65 to 74 Years | 278 (100.0%) | 241 (79.5%) |
| 75 Years and over | 118 (100.0%) | 205 (79.5%) |
| Total | 3,259 (85.0%) | 2,426 (78.7%) |
Income Below Poverty Among Married-Couple Families in Georgetown
The poverty statistics for married-couple families in Georgetown show that 9.3% or 100 of the total 1,073 families live below the poverty line. Families with 5 or more children have the highest poverty rate of 100.0%, comprising of 47 families. On the other hand, families with no children have the lowest poverty rate of 0.0%, which includes 0 families.
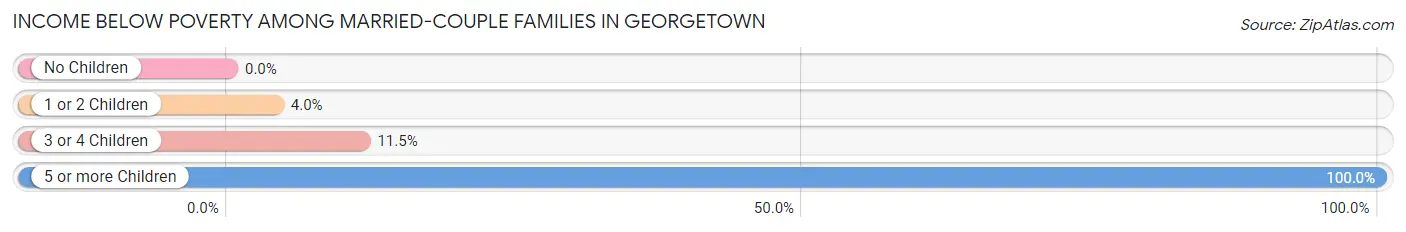
| Children | Above Poverty | Below Poverty |
| No Children | 353 (100.0%) | 0 (0.0%) |
| 1 or 2 Children | 313 (96.0%) | 13 (4.0%) |
| 3 or 4 Children | 307 (88.5%) | 40 (11.5%) |
| 5 or more Children | 0 (0.0%) | 47 (100.0%) |
| Total | 973 (90.7%) | 100 (9.3%) |
Income Below Poverty Among Single-Parent Households in Georgetown
According to the poverty data in Georgetown, 28.4% or 65 single-father households and 21.9% or 63 single-mother households are living below the poverty line. Among single-father households, those with 1 or 2 children have the highest poverty rate, with 65 households (36.3%) experiencing poverty. Likewise, among single-mother households, those with 3 or 4 children have the highest poverty rate, with 10 households (100.0%) falling below the poverty line.
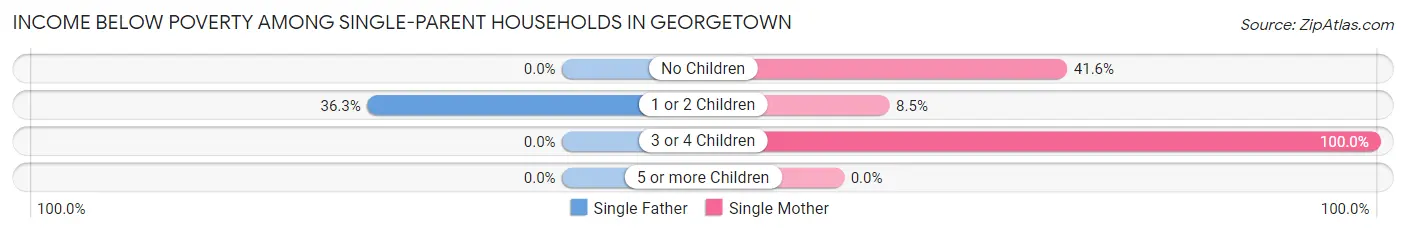
| Children | Single Father | Single Mother |
| No Children | 0 (0.0%) | 37 (41.6%) |
| 1 or 2 Children | 65 (36.3%) | 16 (8.5%) |
| 3 or 4 Children | 0 (0.0%) | 10 (100.0%) |
| 5 or more Children | 0 (0.0%) | 0 (0.0%) |
| Total | 65 (28.4%) | 63 (21.9%) |
Income Below Poverty Among Married-Couple vs Single-Parent Households in Georgetown
The poverty data for Georgetown shows that 100 of the married-couple family households (9.3%) and 128 of the single-parent households (24.8%) are living below the poverty level. Within the married-couple family households, those with 5 or more children have the highest poverty rate, with 47 households (100.0%) falling below the poverty line. Among the single-parent households, those with 3 or 4 children have the highest poverty rate, with 10 household (100.0%) living below poverty.
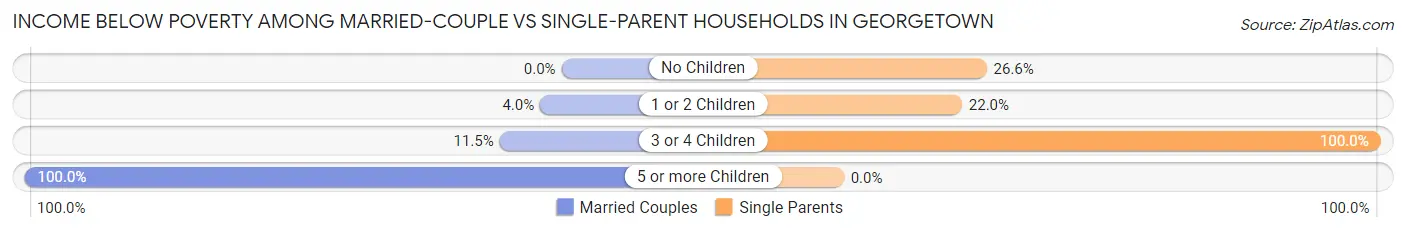
| Children | Married-Couple Families | Single-Parent Households |
| No Children | 0 (0.0%) | 37 (26.6%) |
| 1 or 2 Children | 13 (4.0%) | 81 (22.0%) |
| 3 or 4 Children | 40 (11.5%) | 10 (100.0%) |
| 5 or more Children | 47 (100.0%) | 0 (0.0%) |
| Total | 100 (9.3%) | 128 (24.8%) |
Race in Georgetown
The most populous races in Georgetown are White / Caucasian (4,483 | 61.9%), Hispanic or Latino (3,307 | 45.6%), and Two or more Races (952 | 13.1%).
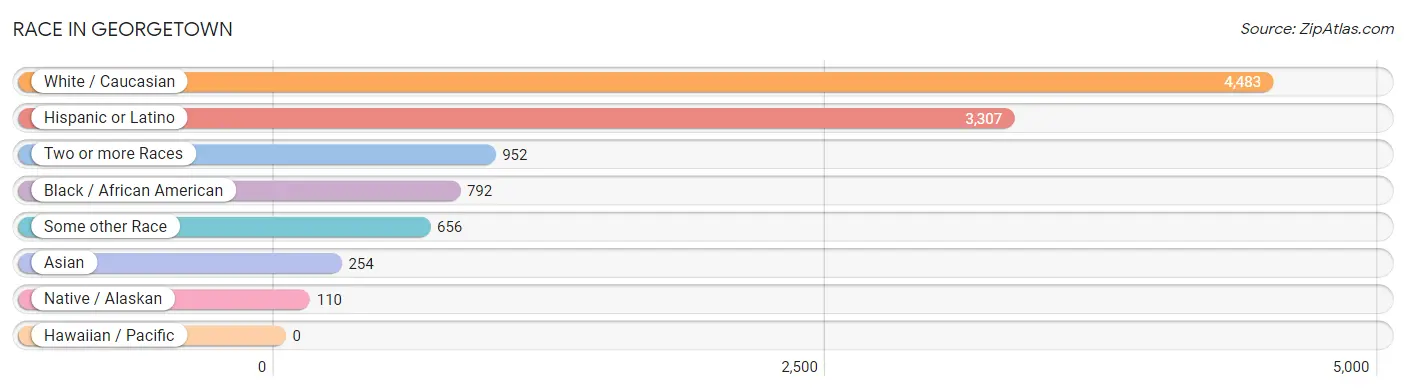
| Race | # Population | % Population |
| Asian | 254 | 3.5% |
| Black / African American | 792 | 10.9% |
| Hawaiian / Pacific | 0 | 0.0% |
| Hispanic or Latino | 3,307 | 45.6% |
| Native / Alaskan | 110 | 1.5% |
| White / Caucasian | 4,483 | 61.9% |
| Two or more Races | 952 | 13.1% |
| Some other Race | 656 | 9.0% |
| Total | 7,247 | 100.0% |
Ancestry in Georgetown
The most populous ancestries reported in Georgetown are Central American (2,521 | 34.8%), Guatemalan (2,518 | 34.7%), Irish (632 | 8.7%), English (555 | 7.7%), and American (404 | 5.6%), together accounting for 91.5% of all Georgetown residents.
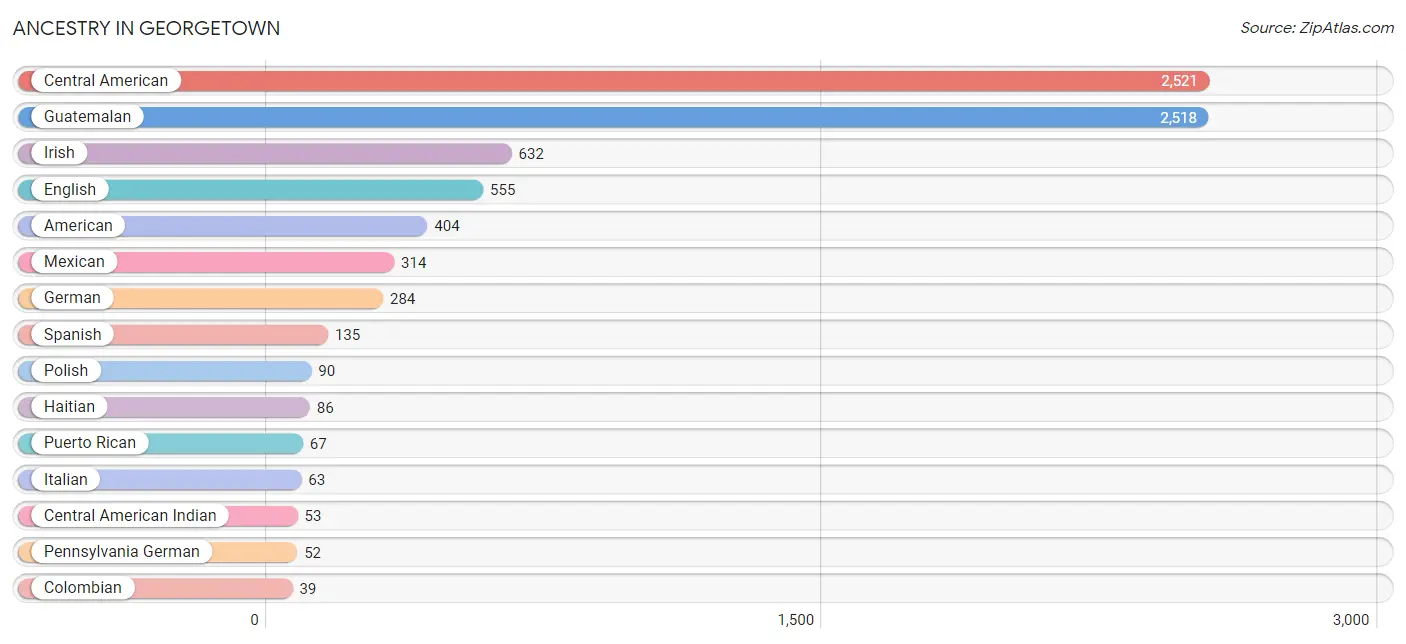
| Ancestry | # Population | % Population |
| African | 15 | 0.2% |
| American | 404 | 5.6% |
| Apache | 23 | 0.3% |
| Bhutanese | 3 | 0.0% |
| British | 9 | 0.1% |
| Central American | 2,521 | 34.8% |
| Central American Indian | 53 | 0.7% |
| Cherokee | 25 | 0.3% |
| Colombian | 39 | 0.5% |
| Dominican | 32 | 0.4% |
| Dutch | 36 | 0.5% |
| English | 555 | 7.7% |
| European | 21 | 0.3% |
| French | 36 | 0.5% |
| German | 284 | 3.9% |
| Greek | 2 | 0.0% |
| Guatemalan | 2,518 | 34.7% |
| Haitian | 86 | 1.2% |
| Hungarian | 8 | 0.1% |
| Irish | 632 | 8.7% |
| Italian | 63 | 0.9% |
| Korean | 22 | 0.3% |
| Lithuanian | 8 | 0.1% |
| Mexican | 314 | 4.3% |
| Norwegian | 9 | 0.1% |
| Panamanian | 3 | 0.0% |
| Pennsylvania German | 52 | 0.7% |
| Polish | 90 | 1.2% |
| Puerto Rican | 67 | 0.9% |
| Russian | 8 | 0.1% |
| Scottish | 2 | 0.0% |
| Slovak | 8 | 0.1% |
| South American | 39 | 0.5% |
| Spanish | 135 | 1.9% |
| Subsaharan African | 15 | 0.2% |
| Swedish | 10 | 0.1% |
| Ukrainian | 15 | 0.2% | View All 37 Rows |
Immigrants in Georgetown
The most numerous immigrant groups reported in Georgetown came from Latin America (1,995 | 27.5%), Central America (1,734 | 23.9%), Guatemala (1,516 | 20.9%), Caribbean (222 | 3.1%), and Haiti (207 | 2.9%), together accounting for 78.3% of all Georgetown residents.
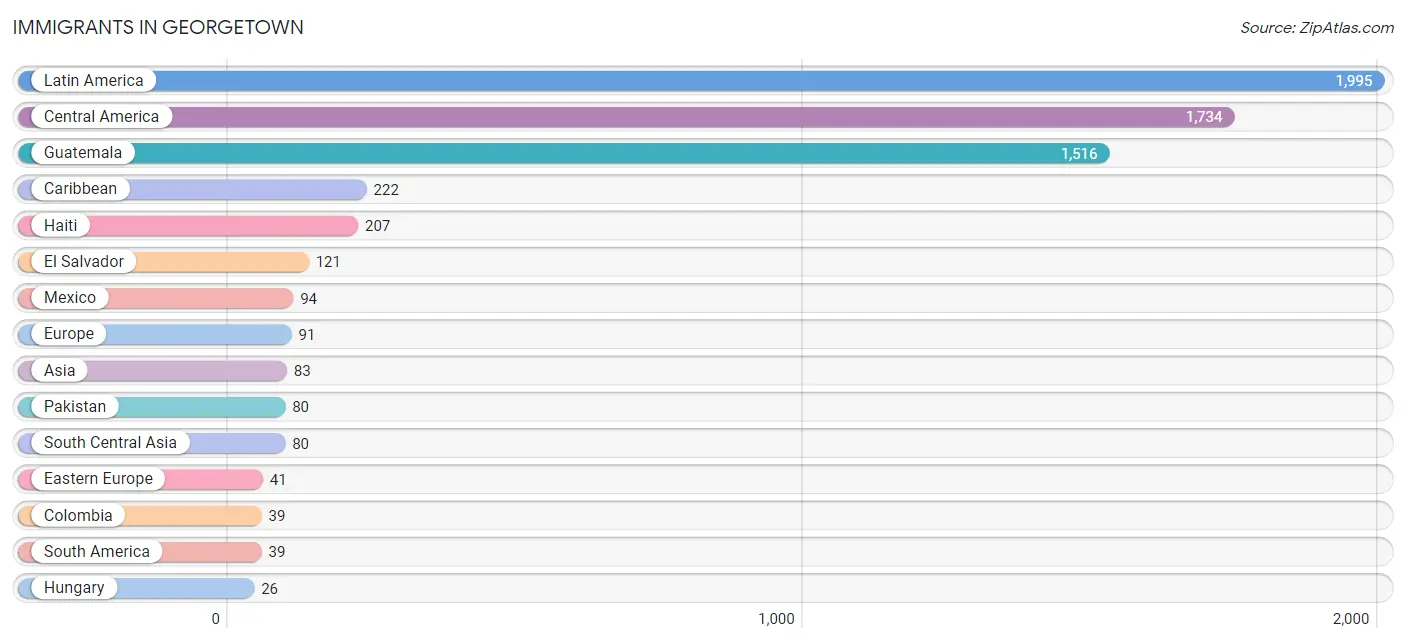
| Immigration Origin | # Population | % Population |
| Asia | 83 | 1.1% |
| Caribbean | 222 | 3.1% |
| Central America | 1,734 | 23.9% |
| Colombia | 39 | 0.5% |
| Dominican Republic | 15 | 0.2% |
| Eastern Europe | 41 | 0.6% |
| El Salvador | 121 | 1.7% |
| Europe | 91 | 1.3% |
| Germany | 23 | 0.3% |
| Greece | 2 | 0.0% |
| Guatemala | 1,516 | 20.9% |
| Haiti | 207 | 2.9% |
| Hungary | 26 | 0.4% |
| Latin America | 1,995 | 27.5% |
| Mexico | 94 | 1.3% |
| Northern Europe | 25 | 0.3% |
| Pakistan | 80 | 1.1% |
| Panama | 3 | 0.0% |
| Philippines | 3 | 0.0% |
| Scotland | 9 | 0.1% |
| South America | 39 | 0.5% |
| South Central Asia | 80 | 1.1% |
| South Eastern Asia | 3 | 0.0% |
| Southern Europe | 2 | 0.0% |
| Ukraine | 15 | 0.2% |
| Western Europe | 23 | 0.3% | View All 26 Rows |
Sex and Age in Georgetown
Sex and Age in Georgetown
The most populous age groups in Georgetown are 10 to 14 Years (494 | 12.6%) for men and 35 to 39 Years (319 | 9.6%) for women.
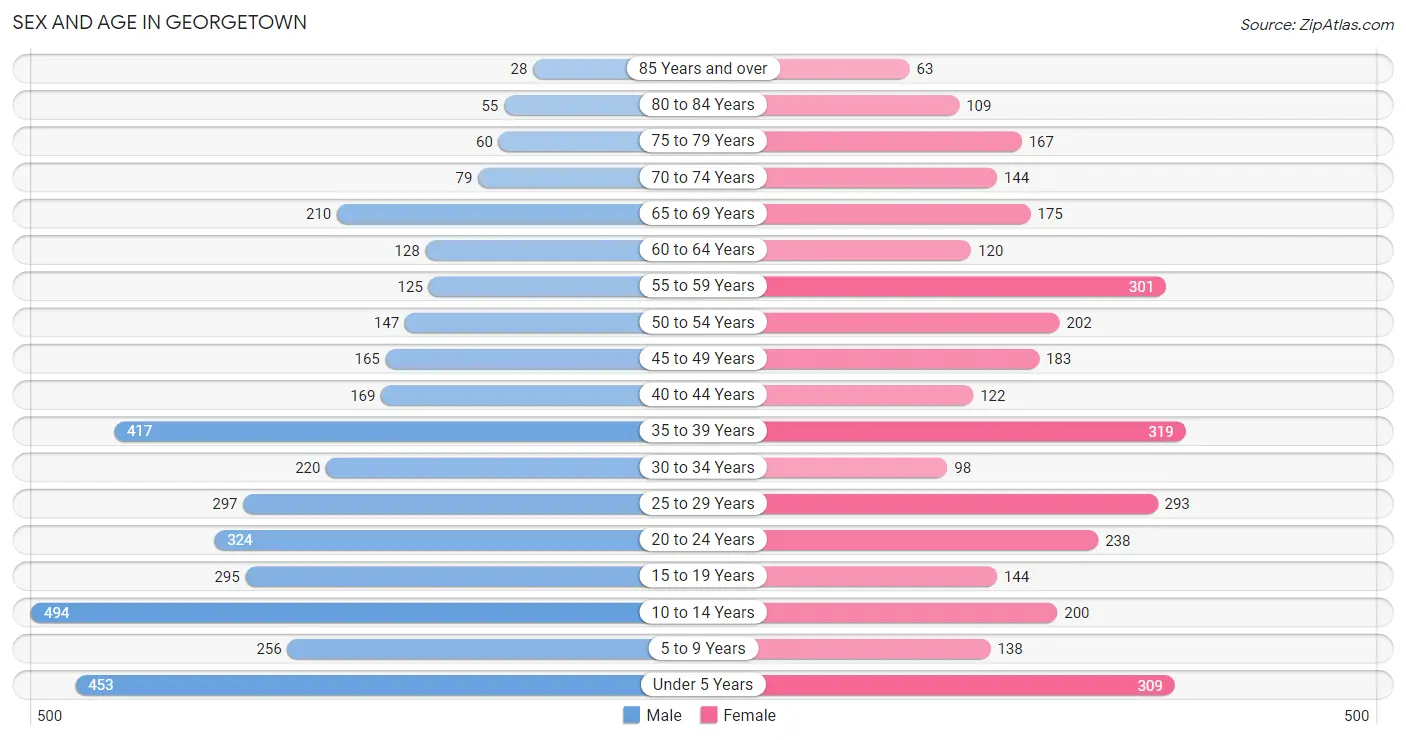
| Age Bracket | Male | Female |
| Under 5 Years | 453 (11.6%) | 309 (9.3%) |
| 5 to 9 Years | 256 (6.5%) | 138 (4.2%) |
| 10 to 14 Years | 494 (12.6%) | 200 (6.0%) |
| 15 to 19 Years | 295 (7.5%) | 144 (4.3%) |
| 20 to 24 Years | 324 (8.3%) | 238 (7.2%) |
| 25 to 29 Years | 297 (7.6%) | 293 (8.8%) |
| 30 to 34 Years | 220 (5.6%) | 98 (2.9%) |
| 35 to 39 Years | 417 (10.6%) | 319 (9.6%) |
| 40 to 44 Years | 169 (4.3%) | 122 (3.7%) |
| 45 to 49 Years | 165 (4.2%) | 183 (5.5%) |
| 50 to 54 Years | 147 (3.7%) | 202 (6.1%) |
| 55 to 59 Years | 125 (3.2%) | 301 (9.0%) |
| 60 to 64 Years | 128 (3.3%) | 120 (3.6%) |
| 65 to 69 Years | 210 (5.3%) | 175 (5.3%) |
| 70 to 74 Years | 79 (2.0%) | 144 (4.3%) |
| 75 to 79 Years | 60 (1.5%) | 167 (5.0%) |
| 80 to 84 Years | 55 (1.4%) | 109 (3.3%) |
| 85 Years and over | 28 (0.7%) | 63 (1.9%) |
| Total | 3,922 (100.0%) | 3,325 (100.0%) |
Families and Households in Georgetown
Median Family Size in Georgetown
The median family size in Georgetown is 3.43 persons per family, with married-couple families (1,073 | 67.5%) accounting for the largest median family size of 3.63 persons per family. On the other hand, single male/father families (229 | 14.4%) represent the smallest median family size with 2.49 persons per family.
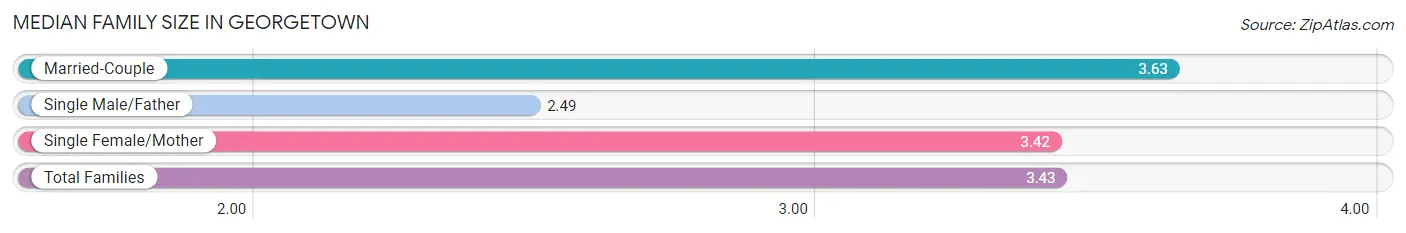
| Family Type | # Families | Family Size |
| Married-Couple | 1,073 (67.5%) | 3.63 |
| Single Male/Father | 229 (14.4%) | 2.49 |
| Single Female/Mother | 288 (18.1%) | 3.42 |
| Total Families | 1,590 (100.0%) | 3.43 |
Median Household Size in Georgetown
The median household size in Georgetown is 2.88 persons per household, with single female/mother households (288 | 11.8%) accounting for the largest median household size of 4.86 persons per household. non-family households (847 | 34.8%) represent the smallest median household size with 1.13 persons per household.
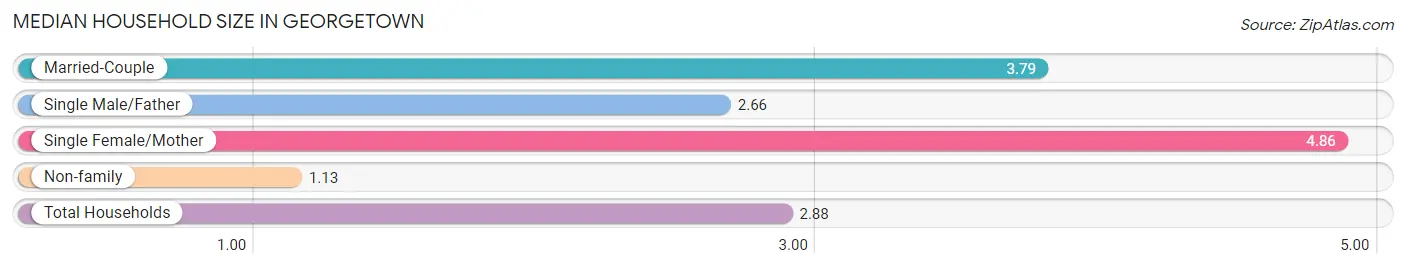
| Household Type | # Households | Household Size |
| Married-Couple | 1,073 (44.0%) | 3.79 |
| Single Male/Father | 229 (9.4%) | 2.66 |
| Single Female/Mother | 288 (11.8%) | 4.86 |
| Non-family | 847 (34.8%) | 1.13 |
| Total Households | 2,437 (100.0%) | 2.88 |
Household Size by Marriage Status in Georgetown
Out of a total of 2,437 households in Georgetown, 1,590 (65.2%) are family households, while 847 (34.8%) are nonfamily households. The most numerous type of family households are 2-person households, comprising 493, and the most common type of nonfamily households are 1-person households, comprising 755.
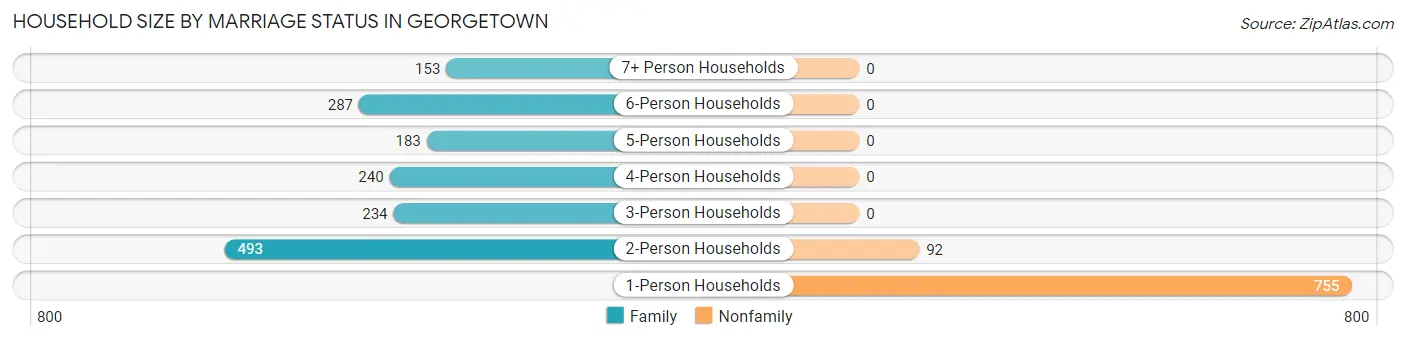
| Household Size | Family Households | Nonfamily Households |
| 1-Person Households | - | 755 (31.0%) |
| 2-Person Households | 493 (20.2%) | 92 (3.8%) |
| 3-Person Households | 234 (9.6%) | 0 (0.0%) |
| 4-Person Households | 240 (9.9%) | 0 (0.0%) |
| 5-Person Households | 183 (7.5%) | 0 (0.0%) |
| 6-Person Households | 287 (11.8%) | 0 (0.0%) |
| 7+ Person Households | 153 (6.3%) | 0 (0.0%) |
| Total | 1,590 (65.2%) | 847 (34.8%) |
Female Fertility in Georgetown
Fertility by Age in Georgetown
Average fertility rate in Georgetown is 153.0 births per 1,000 women. Women in the age bracket of 35 to 50 years have the highest fertility rate with 208.0 births per 1,000 women. Women in the age bracket of 35 to 50 years acount for 65.2% of all women with births.
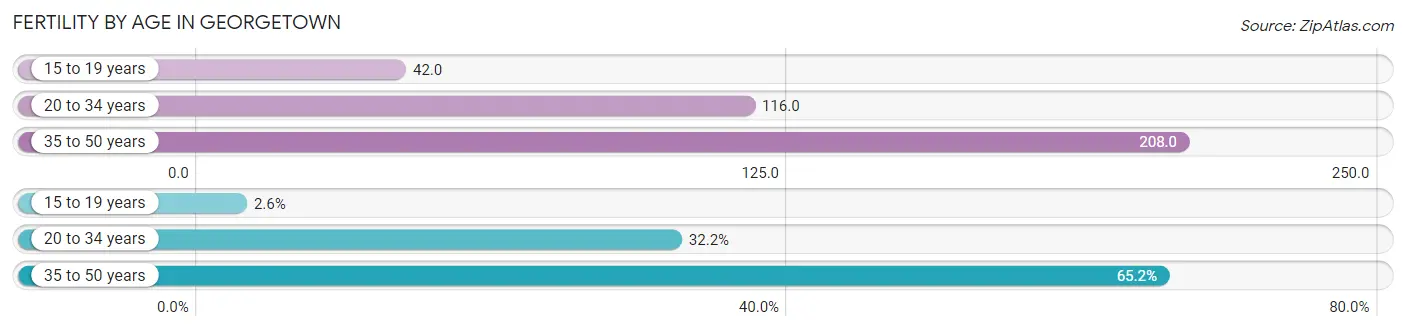
| Age Bracket | Women with Births | Births / 1,000 Women |
| 15 to 19 years | 6 (2.6%) | 42.0 |
| 20 to 34 years | 73 (32.2%) | 116.0 |
| 35 to 50 years | 148 (65.2%) | 208.0 |
| Total | 227 (100.0%) | 153.0 |
Fertility by Age by Marriage Status in Georgetown
89.4% of women with births (227) in Georgetown are married. The highest percentage of unmarried women with births falls into 15 to 19 years age bracket with 100.0% of them unmarried at the time of birth, while the lowest percentage of unmarried women with births belong to 35 to 50 years age bracket with 0.0% of them unmarried.
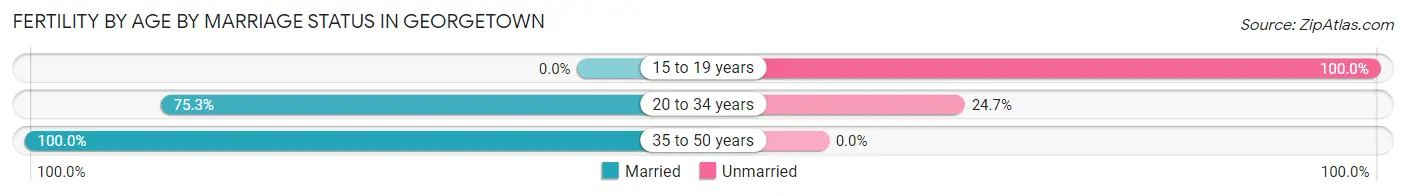
| Age Bracket | Married | Unmarried |
| 15 to 19 years | 0 (0.0%) | 6 (100.0%) |
| 20 to 34 years | 55 (75.3%) | 18 (24.7%) |
| 35 to 50 years | 148 (100.0%) | 0 (0.0%) |
| Total | 203 (89.4%) | 24 (10.6%) |
Fertility by Education in Georgetown

| Educational Attainment | Women with Births | Births / 1,000 Women |
| Less than High School | 174 (76.6%) | 264.0 |
| High School Diploma | 18 (7.9%) | 52.0 |
| College or Associate's Degree | 16 (7.0%) | 49.0 |
| Bachelor's Degree | 0 (0.0%) | 0.0 |
| Graduate Degree | 19 (8.4%) | 226.0 |
| Total | 227 (100.0%) | 153.0 |
Fertility by Education by Marriage Status in Georgetown
10.6% of women with births in Georgetown are unmarried. Women with the educational attainment of college or associate's degree are most likely to be married with 100.0% of them married at childbirth, while women with the educational attainment of high school diploma are least likely to be married with 100.0% of them unmarried at childbirth.
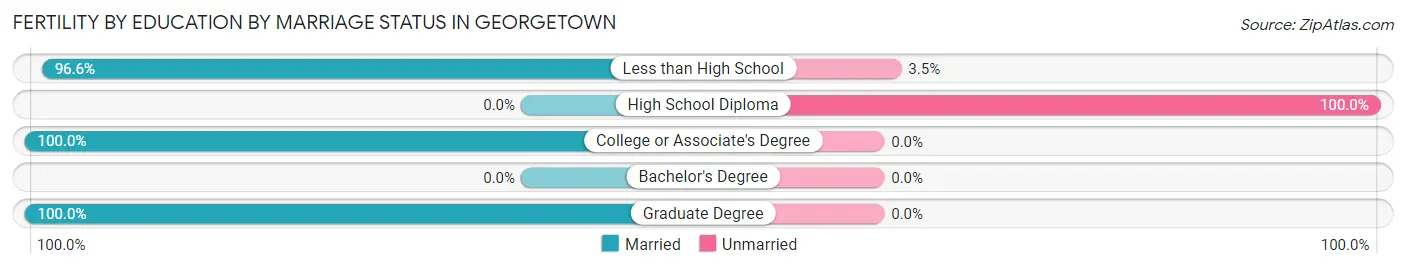
| Educational Attainment | Married | Unmarried |
| Less than High School | 168 (96.6%) | 6 (3.5%) |
| High School Diploma | 0 (0.0%) | 18 (100.0%) |
| College or Associate's Degree | 16 (100.0%) | 0 (0.0%) |
| Bachelor's Degree | 0 (0.0%) | 0 (0.0%) |
| Graduate Degree | 19 (100.0%) | 0 (0.0%) |
| Total | 203 (89.4%) | 24 (10.6%) |
Employment Characteristics in Georgetown
Employment by Class of Employer in Georgetown
Among the 3,085 employed individuals in Georgetown, private company employees (2,362 | 76.6%), self-employed (incorporated) (214 | 6.9%), and not-for-profit organizations (131 | 4.3%) make up the most common classes of employment.
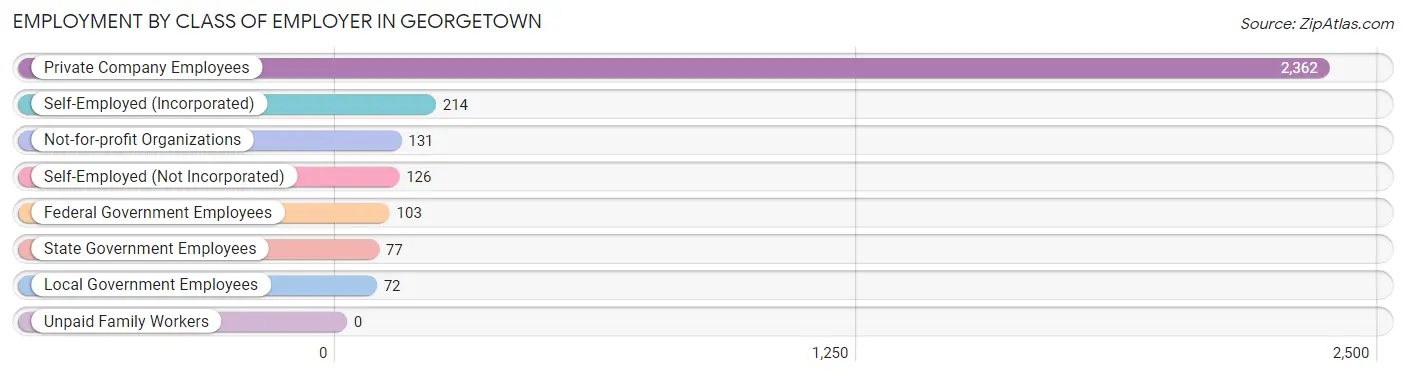
| Employer Class | # Employees | % Employees |
| Private Company Employees | 2,362 | 76.6% |
| Self-Employed (Incorporated) | 214 | 6.9% |
| Self-Employed (Not Incorporated) | 126 | 4.1% |
| Not-for-profit Organizations | 131 | 4.3% |
| Local Government Employees | 72 | 2.3% |
| State Government Employees | 77 | 2.5% |
| Federal Government Employees | 103 | 3.3% |
| Unpaid Family Workers | 0 | 0.0% |
| Total | 3,085 | 100.0% |
Employment Status by Age in Georgetown
According to the labor force statistics for Georgetown, out of the total population over 16 years of age (5,334), 59.4% or 3,168 individuals are in the labor force, with 2.0% or 63 of them unemployed. The age group with the highest labor force participation rate is 30 to 34 years, with 85.5% or 272 individuals in the labor force. Within the labor force, the 55 to 59 years age range has the highest percentage of unemployed individuals, with 12.0% or 23 of them being unemployed.
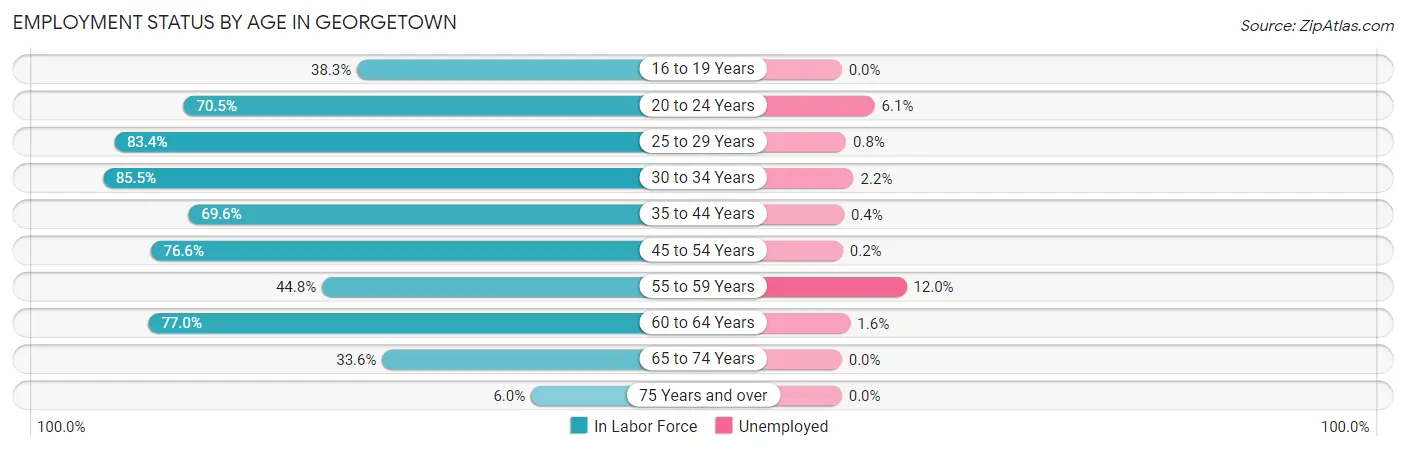
| Age Bracket | In Labor Force | Unemployed |
| 16 to 19 Years | 144 (38.3%) | 0 (0.0%) |
| 20 to 24 Years | 396 (70.5%) | 24 (6.1%) |
| 25 to 29 Years | 492 (83.4%) | 4 (0.8%) |
| 30 to 34 Years | 272 (85.5%) | 6 (2.2%) |
| 35 to 44 Years | 715 (69.6%) | 3 (0.4%) |
| 45 to 54 Years | 534 (76.6%) | 1 (0.2%) |
| 55 to 59 Years | 191 (44.8%) | 23 (12.0%) |
| 60 to 64 Years | 191 (77.0%) | 3 (1.6%) |
| 65 to 74 Years | 204 (33.6%) | 0 (0.0%) |
| 75 Years and over | 29 (6.0%) | 0 (0.0%) |
| Total | 3,168 (59.4%) | 63 (2.0%) |
Employment Status by Educational Attainment in Georgetown
According to labor force statistics for Georgetown, 72.4% of individuals (2,394) out of the total population between 25 and 64 years of age (3,306) are in the labor force, with 1.7% or 41 of them being unemployed. The group with the highest labor force participation rate are those with the educational attainment of high school diploma, with 87.3% or 904 individuals in the labor force. Within the labor force, individuals with high school diploma education have the highest percentage of unemployment, with 3.7% or 33 of them being unemployed.
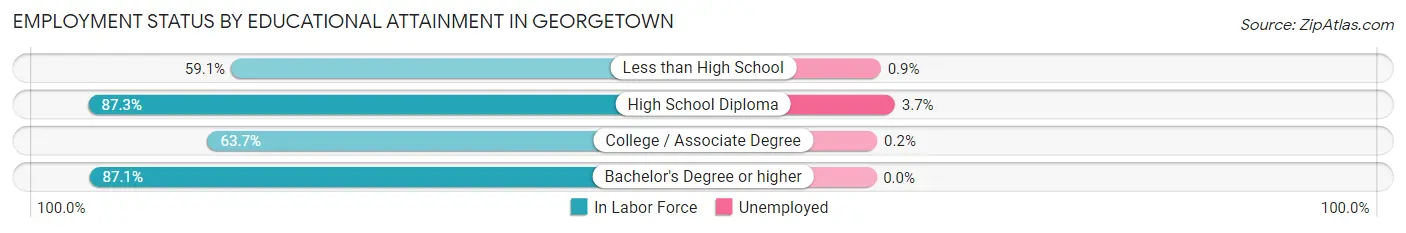
| Educational Attainment | In Labor Force | Unemployed |
| Less than High School | 666 (59.1%) | 10 (0.9%) |
| High School Diploma | 904 (87.3%) | 38 (3.7%) |
| College / Associate Degree | 466 (63.7%) | 1 (0.2%) |
| Bachelor's Degree or higher | 359 (87.1%) | 0 (0.0%) |
| Total | 2,394 (72.4%) | 56 (1.7%) |
Employment Occupations by Sex in Georgetown
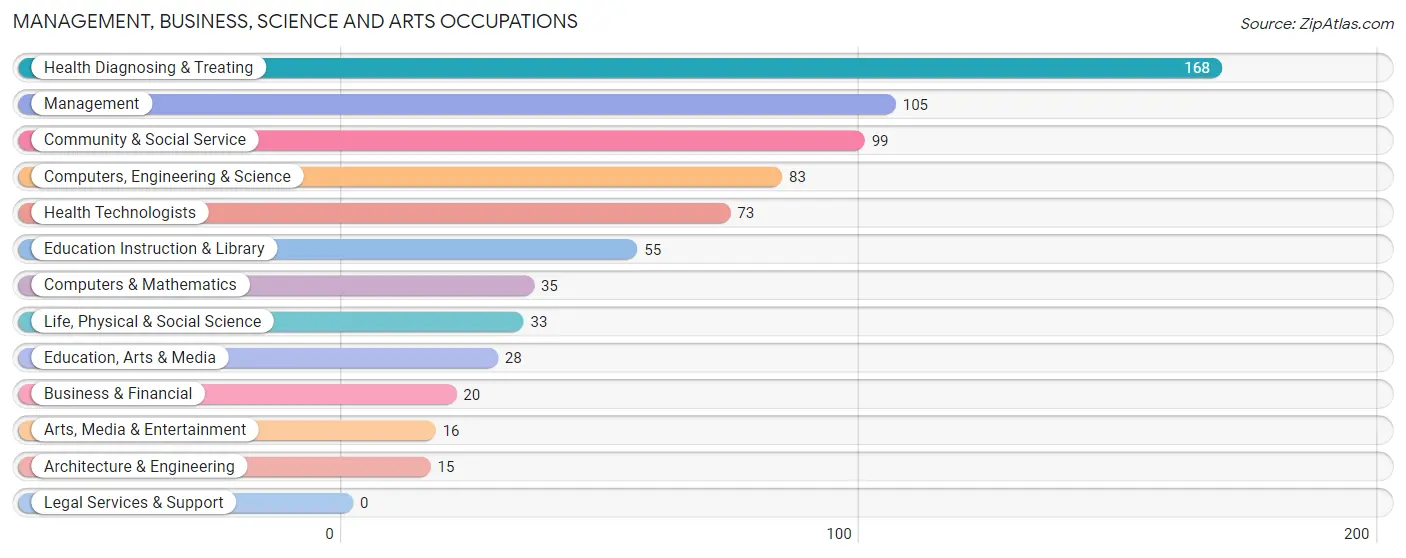
Management, Business, Science and Arts Occupations
The most common Management, Business, Science and Arts occupations in Georgetown are Health Diagnosing & Treating (168 | 5.4%), Management (105 | 3.4%), Community & Social Service (99 | 3.2%), Computers, Engineering & Science (83 | 2.7%), and Health Technologists (73 | 2.4%).
Management, Business, Science and Arts Occupations by Sex
Within the Management, Business, Science and Arts occupations in Georgetown, the most male-oriented occupations are Computers & Mathematics (100.0%), Architecture & Engineering (100.0%), and Management (85.7%), while the most female-oriented occupations are Education, Arts & Media (100.0%), Arts, Media & Entertainment (100.0%), and Community & Social Service (95.0%).
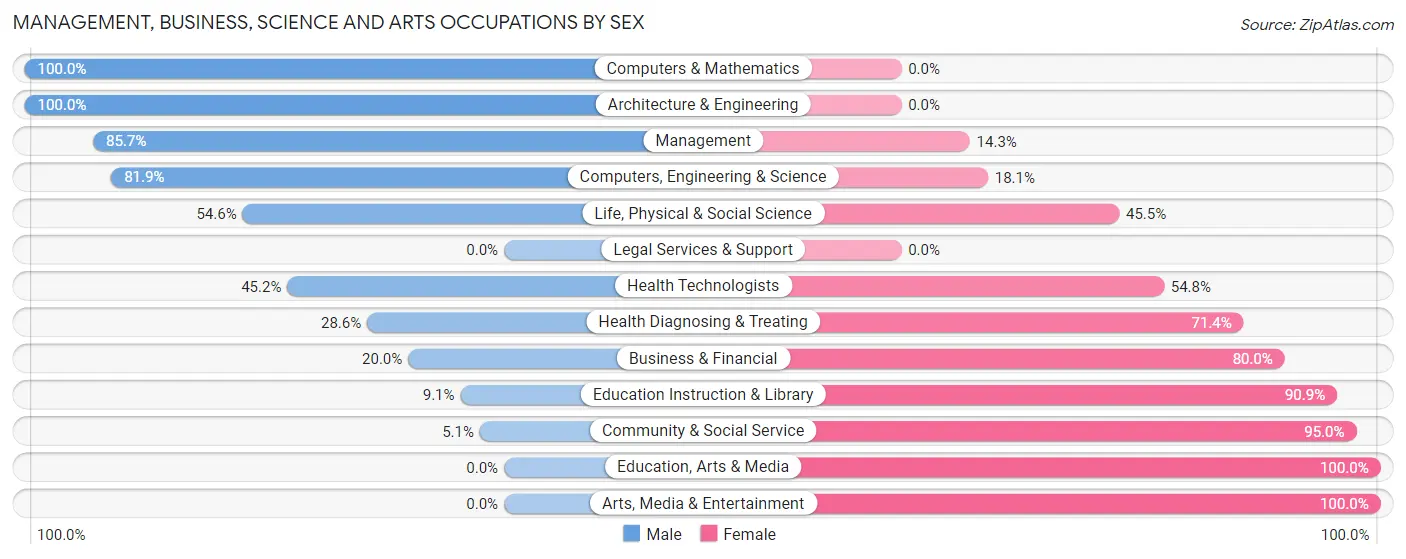
| Occupation | Male | Female |
| Management | 90 (85.7%) | 15 (14.3%) |
| Business & Financial | 4 (20.0%) | 16 (80.0%) |
| Computers, Engineering & Science | 68 (81.9%) | 15 (18.1%) |
| Computers & Mathematics | 35 (100.0%) | 0 (0.0%) |
| Architecture & Engineering | 15 (100.0%) | 0 (0.0%) |
| Life, Physical & Social Science | 18 (54.5%) | 15 (45.5%) |
| Community & Social Service | 5 (5.1%) | 94 (95.0%) |
| Education, Arts & Media | 0 (0.0%) | 28 (100.0%) |
| Legal Services & Support | 0 (0.0%) | 0 (0.0%) |
| Education Instruction & Library | 5 (9.1%) | 50 (90.9%) |
| Arts, Media & Entertainment | 0 (0.0%) | 16 (100.0%) |
| Health Diagnosing & Treating | 48 (28.6%) | 120 (71.4%) |
| Health Technologists | 33 (45.2%) | 40 (54.8%) |
| Total (Category) | 215 (45.3%) | 260 (54.7%) |
| Total (Overall) | 2,091 (67.4%) | 1,013 (32.6%) |
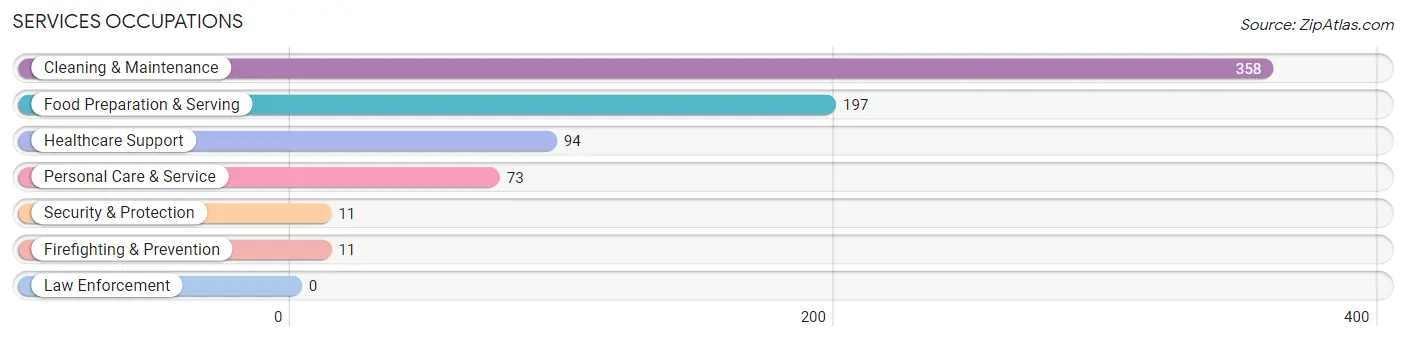
Services Occupations
The most common Services occupations in Georgetown are Cleaning & Maintenance (358 | 11.5%), Food Preparation & Serving (197 | 6.4%), Healthcare Support (94 | 3.0%), Personal Care & Service (73 | 2.4%), and Security & Protection (11 | 0.4%).
Services Occupations by Sex
Within the Services occupations in Georgetown, the most male-oriented occupations are Security & Protection (100.0%), Firefighting & Prevention (100.0%), and Cleaning & Maintenance (70.1%), while the most female-oriented occupations are Healthcare Support (100.0%), Personal Care & Service (69.9%), and Food Preparation & Serving (29.9%).
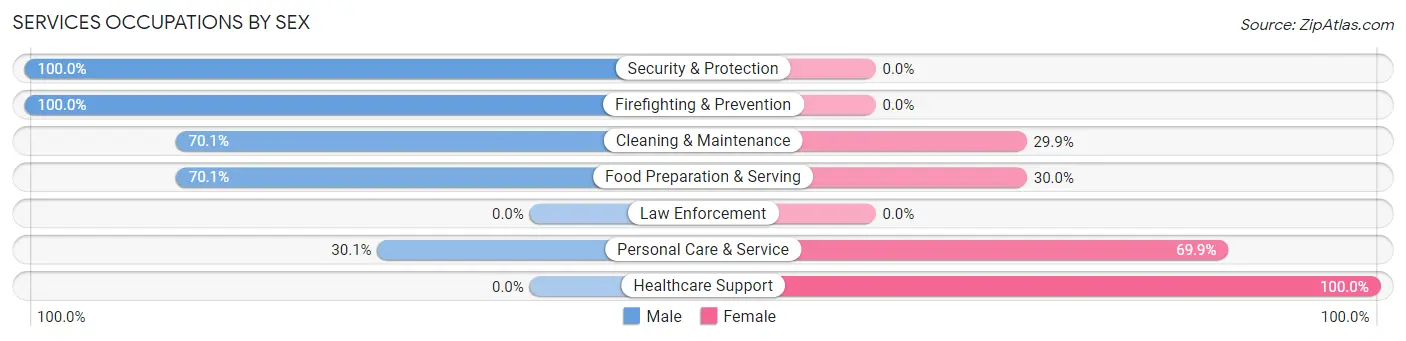
| Occupation | Male | Female |
| Healthcare Support | 0 (0.0%) | 94 (100.0%) |
| Security & Protection | 11 (100.0%) | 0 (0.0%) |
| Firefighting & Prevention | 11 (100.0%) | 0 (0.0%) |
| Law Enforcement | 0 (0.0%) | 0 (0.0%) |
| Food Preparation & Serving | 138 (70.1%) | 59 (29.9%) |
| Cleaning & Maintenance | 251 (70.1%) | 107 (29.9%) |
| Personal Care & Service | 22 (30.1%) | 51 (69.9%) |
| Total (Category) | 422 (57.6%) | 311 (42.4%) |
| Total (Overall) | 2,091 (67.4%) | 1,013 (32.6%) |
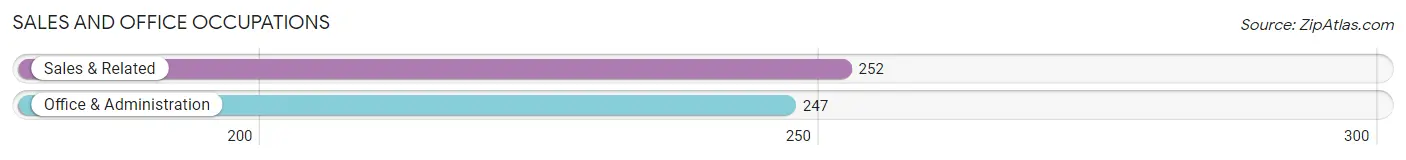
Sales and Office Occupations
The most common Sales and Office occupations in Georgetown are Sales & Related (252 | 8.1%), and Office & Administration (247 | 8.0%).
Sales and Office Occupations by Sex
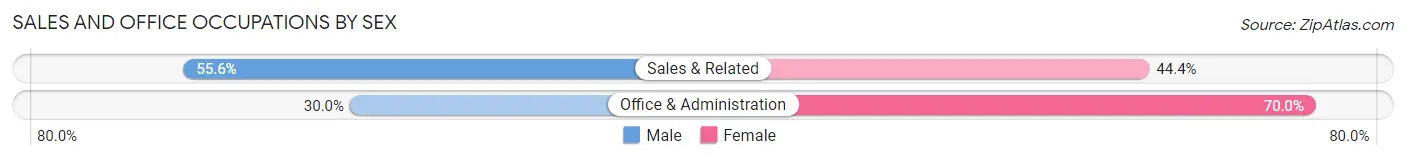
| Occupation | Male | Female |
| Sales & Related | 140 (55.6%) | 112 (44.4%) |
| Office & Administration | 74 (30.0%) | 173 (70.0%) |
| Total (Category) | 214 (42.9%) | 285 (57.1%) |
| Total (Overall) | 2,091 (67.4%) | 1,013 (32.6%) |
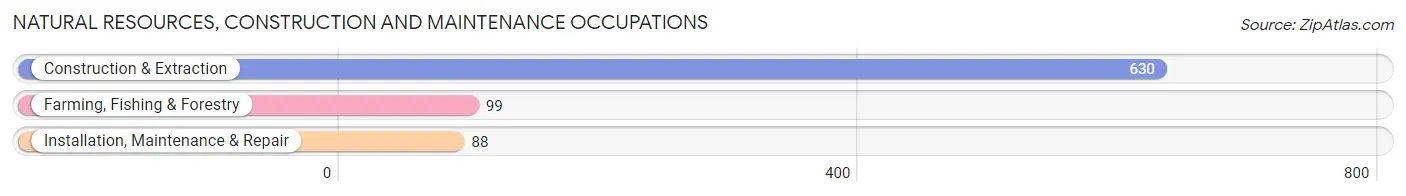
Natural Resources, Construction and Maintenance Occupations
The most common Natural Resources, Construction and Maintenance occupations in Georgetown are Construction & Extraction (630 | 20.3%), Farming, Fishing & Forestry (99 | 3.2%), and Installation, Maintenance & Repair (88 | 2.8%).
Natural Resources, Construction and Maintenance Occupations by Sex
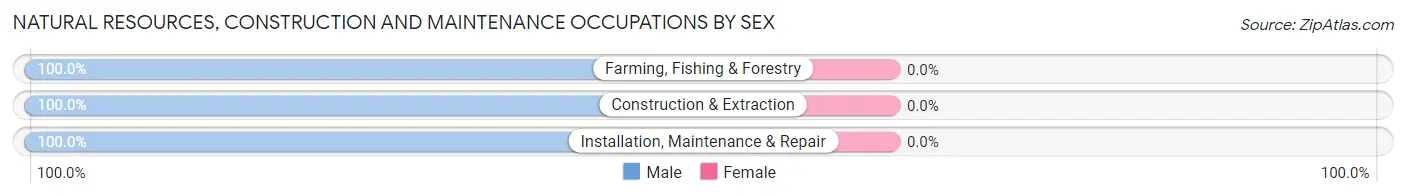
| Occupation | Male | Female |
| Farming, Fishing & Forestry | 99 (100.0%) | 0 (0.0%) |
| Construction & Extraction | 630 (100.0%) | 0 (0.0%) |
| Installation, Maintenance & Repair | 88 (100.0%) | 0 (0.0%) |
| Total (Category) | 817 (100.0%) | 0 (0.0%) |
| Total (Overall) | 2,091 (67.4%) | 1,013 (32.6%) |
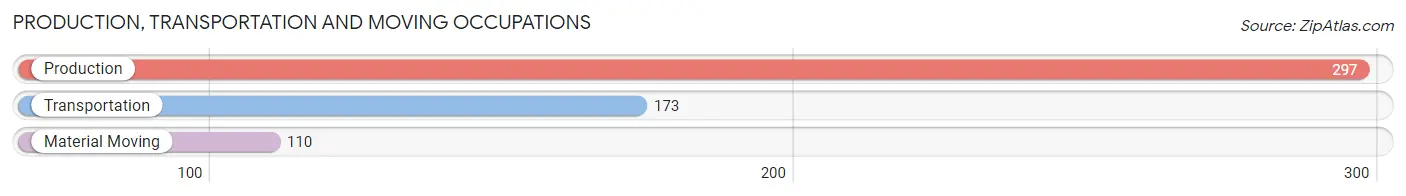
Production, Transportation and Moving Occupations
The most common Production, Transportation and Moving occupations in Georgetown are Production (297 | 9.6%), Transportation (173 | 5.6%), and Material Moving (110 | 3.5%).
Production, Transportation and Moving Occupations by Sex
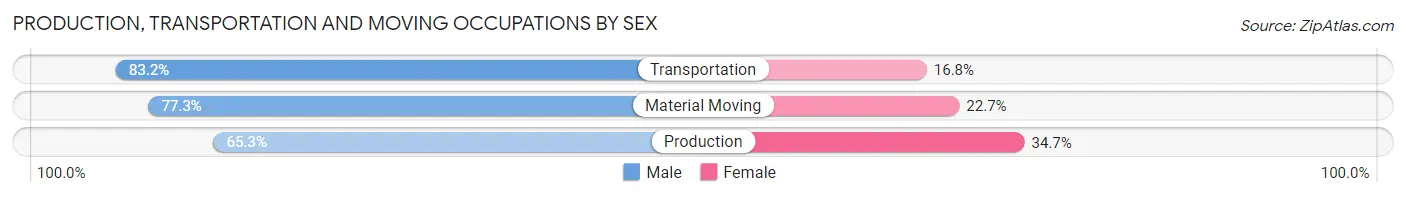
| Occupation | Male | Female |
| Production | 194 (65.3%) | 103 (34.7%) |
| Transportation | 144 (83.2%) | 29 (16.8%) |
| Material Moving | 85 (77.3%) | 25 (22.7%) |
| Total (Category) | 423 (72.9%) | 157 (27.1%) |
| Total (Overall) | 2,091 (67.4%) | 1,013 (32.6%) |
Employment Industries by Sex in Georgetown
Employment Industries in Georgetown
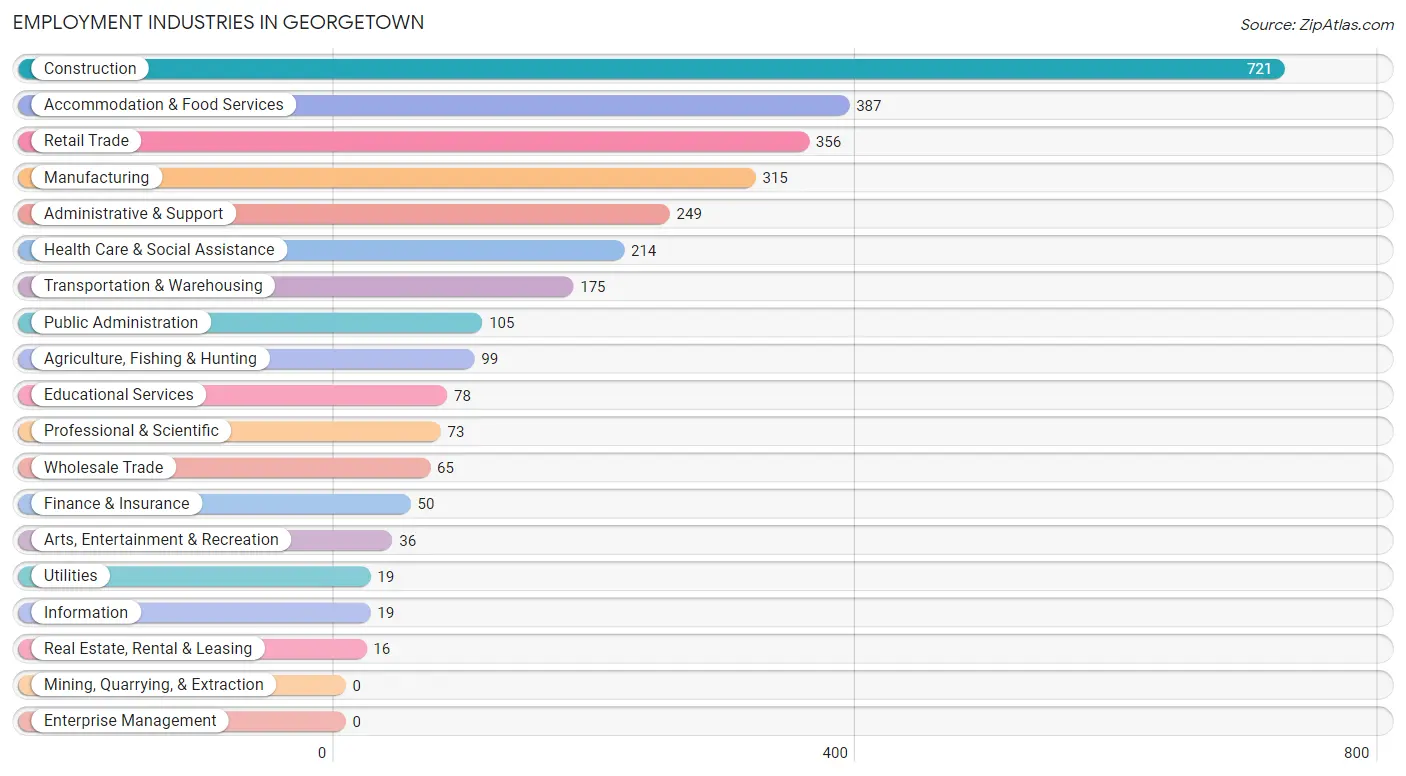
The major employment industries in Georgetown include Construction (721 | 23.2%), Accommodation & Food Services (387 | 12.5%), Retail Trade (356 | 11.5%), Manufacturing (315 | 10.2%), and Administrative & Support (249 | 8.0%).
Employment Industries by Sex in Georgetown
The Georgetown industries that see more men than women are Agriculture, Fishing & Hunting (100.0%), Wholesale Trade (100.0%), and Utilities (100.0%), whereas the industries that tend to have a higher number of women are Real Estate, Rental & Leasing (100.0%), Finance & Insurance (94.0%), and Educational Services (83.3%).
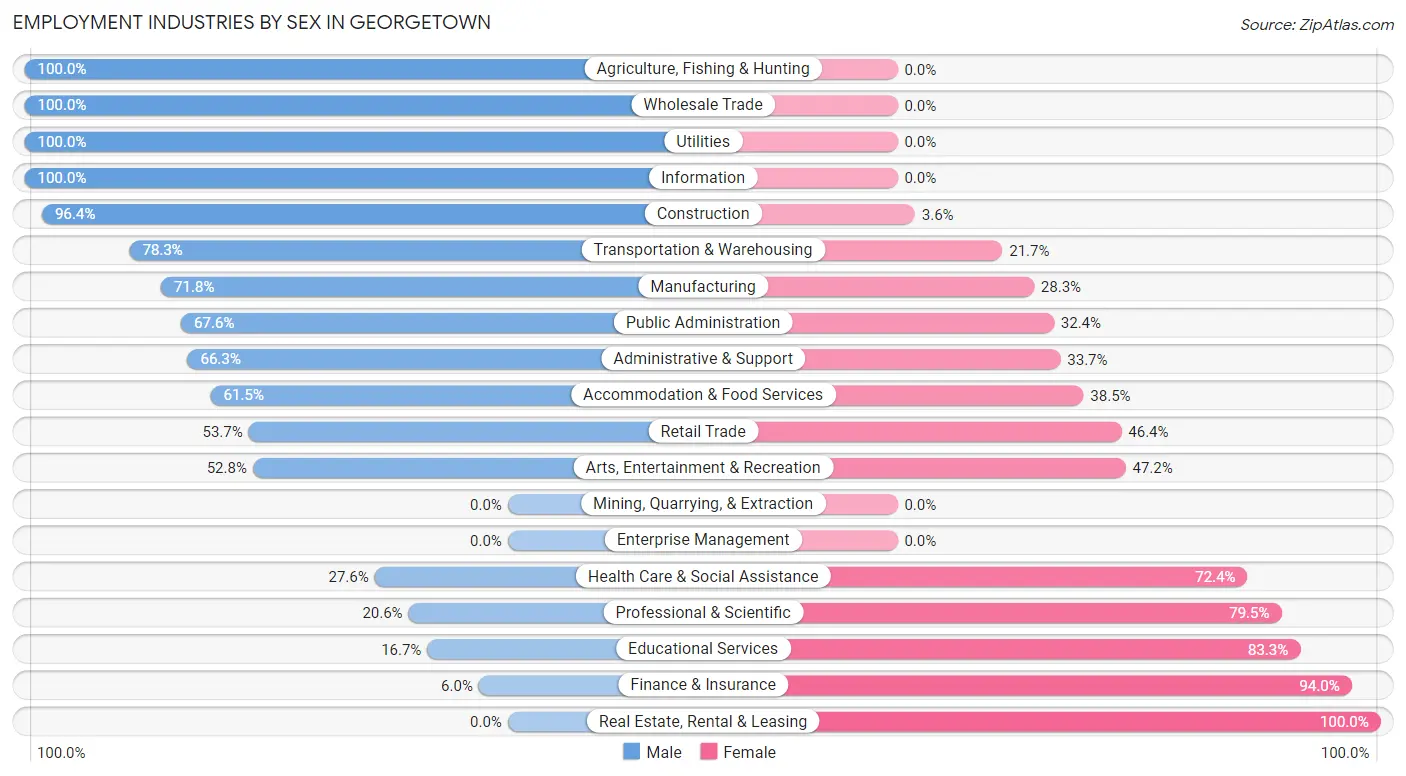
| Industry | Male | Female |
| Agriculture, Fishing & Hunting | 99 (100.0%) | 0 (0.0%) |
| Mining, Quarrying, & Extraction | 0 (0.0%) | 0 (0.0%) |
| Construction | 695 (96.4%) | 26 (3.6%) |
| Manufacturing | 226 (71.8%) | 89 (28.2%) |
| Wholesale Trade | 65 (100.0%) | 0 (0.0%) |
| Retail Trade | 191 (53.6%) | 165 (46.4%) |
| Transportation & Warehousing | 137 (78.3%) | 38 (21.7%) |
| Utilities | 19 (100.0%) | 0 (0.0%) |
| Information | 19 (100.0%) | 0 (0.0%) |
| Finance & Insurance | 3 (6.0%) | 47 (94.0%) |
| Real Estate, Rental & Leasing | 0 (0.0%) | 16 (100.0%) |
| Professional & Scientific | 15 (20.5%) | 58 (79.4%) |
| Enterprise Management | 0 (0.0%) | 0 (0.0%) |
| Administrative & Support | 165 (66.3%) | 84 (33.7%) |
| Educational Services | 13 (16.7%) | 65 (83.3%) |
| Health Care & Social Assistance | 59 (27.6%) | 155 (72.4%) |
| Arts, Entertainment & Recreation | 19 (52.8%) | 17 (47.2%) |
| Accommodation & Food Services | 238 (61.5%) | 149 (38.5%) |
| Public Administration | 71 (67.6%) | 34 (32.4%) |
| Total | 2,091 (67.4%) | 1,013 (32.6%) |
Education in Georgetown
School Enrollment in Georgetown
The most common levels of schooling among the 1,324 students in Georgetown are middle school (482 | 36.4%), high school (290 | 21.9%), and college / undergraduate (252 | 19.0%).
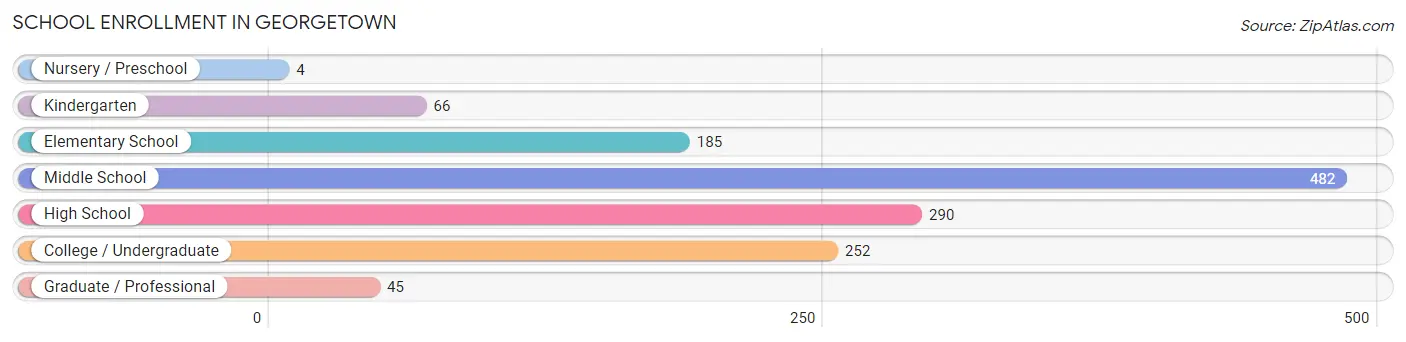
| School Level | # Students | % Students |
| Nursery / Preschool | 4 | 0.3% |
| Kindergarten | 66 | 5.0% |
| Elementary School | 185 | 14.0% |
| Middle School | 482 | 36.4% |
| High School | 290 | 21.9% |
| College / Undergraduate | 252 | 19.0% |
| Graduate / Professional | 45 | 3.4% |
| Total | 1,324 | 100.0% |
School Enrollment by Age by Funding Source in Georgetown
Out of a total of 1,324 students who are enrolled in schools in Georgetown, 28 (2.1%) attend a private institution, while the remaining 1,296 (97.9%) are enrolled in public schools. The age group of 25 to 34 year olds has the highest likelihood of being enrolled in private schools, with 21 (30.0% in the age bracket) enrolled. Conversely, the age group of 5 to 9 year old has the lowest likelihood of being enrolled in a private school, with 216 (100.0% in the age bracket) attending a public institution.
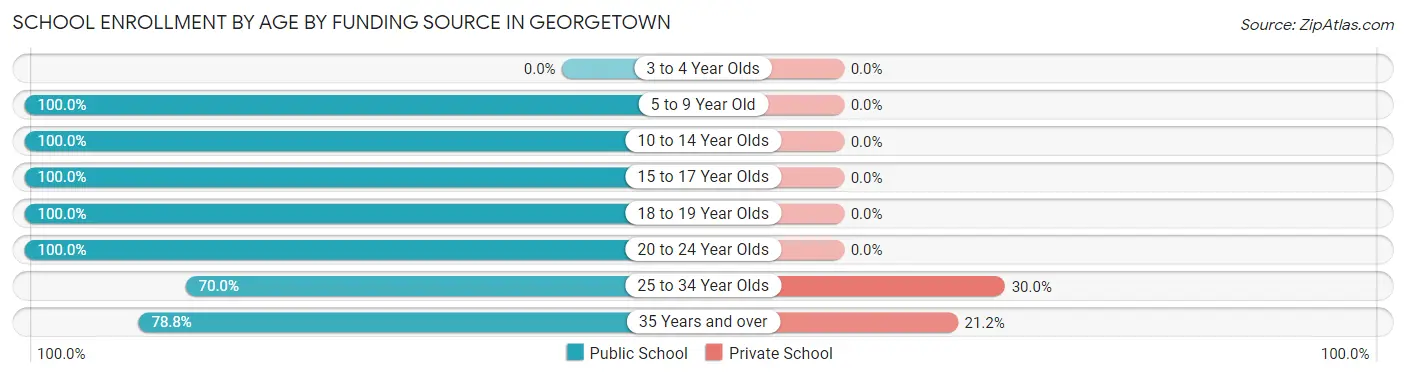
| Age Bracket | Public School | Private School |
| 3 to 4 Year Olds | 0 (0.0%) | 0 (0.0%) |
| 5 to 9 Year Old | 216 (100.0%) | 0 (0.0%) |
| 10 to 14 Year Olds | 527 (100.0%) | 0 (0.0%) |
| 15 to 17 Year Olds | 223 (100.0%) | 0 (0.0%) |
| 18 to 19 Year Olds | 115 (100.0%) | 0 (0.0%) |
| 20 to 24 Year Olds | 140 (100.0%) | 0 (0.0%) |
| 25 to 34 Year Olds | 49 (70.0%) | 21 (30.0%) |
| 35 Years and over | 26 (78.8%) | 7 (21.2%) |
| Total | 1,296 (97.9%) | 28 (2.1%) |
Educational Attainment by Field of Study in Georgetown
Business (215 | 29.3%), education (106 | 14.5%), arts & humanities (88 | 12.0%), bio, nature & agricultural (62 | 8.5%), and social sciences (54 | 7.4%) are the most common fields of study among 733 individuals in Georgetown who have obtained a bachelor's degree or higher.
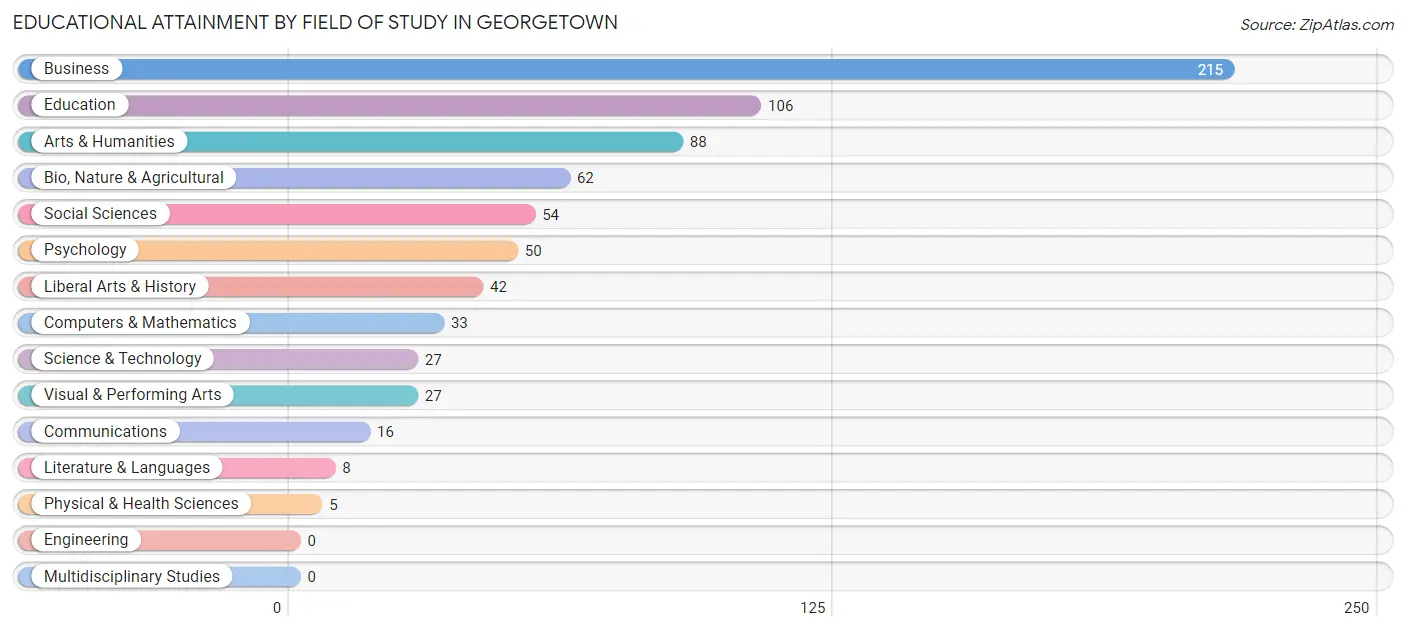
| Field of Study | # Graduates | % Graduates |
| Computers & Mathematics | 33 | 4.5% |
| Bio, Nature & Agricultural | 62 | 8.5% |
| Physical & Health Sciences | 5 | 0.7% |
| Psychology | 50 | 6.8% |
| Social Sciences | 54 | 7.4% |
| Engineering | 0 | 0.0% |
| Multidisciplinary Studies | 0 | 0.0% |
| Science & Technology | 27 | 3.7% |
| Business | 215 | 29.3% |
| Education | 106 | 14.5% |
| Literature & Languages | 8 | 1.1% |
| Liberal Arts & History | 42 | 5.7% |
| Visual & Performing Arts | 27 | 3.7% |
| Communications | 16 | 2.2% |
| Arts & Humanities | 88 | 12.0% |
| Total | 733 | 100.0% |
Transportation & Commute in Georgetown
Vehicle Availability by Sex in Georgetown
The most prevalent vehicle ownership categories in Georgetown are males with 2 vehicles (699, accounting for 33.7%) and females with 2 vehicles (376, making up 70.9%).
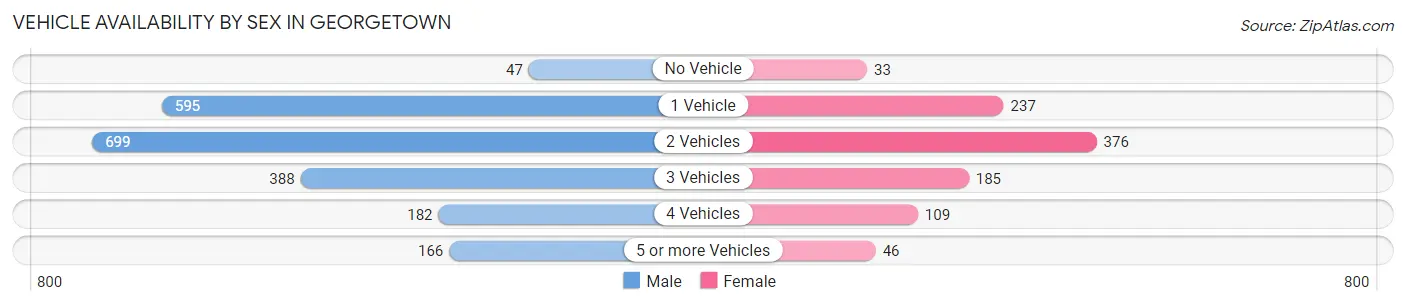
| Vehicles Available | Male | Female |
| No Vehicle | 47 (2.3%) | 33 (3.4%) |
| 1 Vehicle | 595 (28.6%) | 237 (24.0%) |
| 2 Vehicles | 699 (33.7%) | 376 (38.1%) |
| 3 Vehicles | 388 (18.7%) | 185 (18.8%) |
| 4 Vehicles | 182 (8.8%) | 109 (11.1%) |
| 5 or more Vehicles | 166 (8.0%) | 46 (4.7%) |
| Total | 2,077 (100.0%) | 986 (100.0%) |
Commute Time in Georgetown
The most frequently occuring commute durations in Georgetown are 45 to 59 minutes (548 commuters, 18.2%), 30 to 34 minutes (415 commuters, 13.8%), and 15 to 19 minutes (410 commuters, 13.6%).
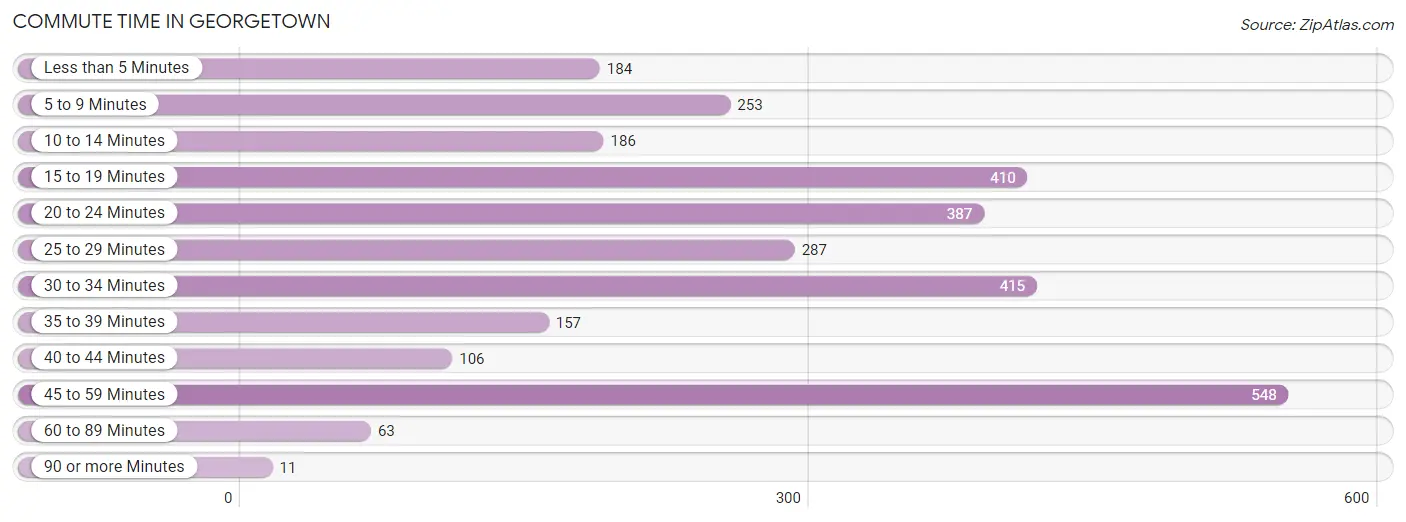
| Commute Time | # Commuters | % Commuters |
| Less than 5 Minutes | 184 | 6.1% |
| 5 to 9 Minutes | 253 | 8.4% |
| 10 to 14 Minutes | 186 | 6.2% |
| 15 to 19 Minutes | 410 | 13.6% |
| 20 to 24 Minutes | 387 | 12.9% |
| 25 to 29 Minutes | 287 | 9.5% |
| 30 to 34 Minutes | 415 | 13.8% |
| 35 to 39 Minutes | 157 | 5.2% |
| 40 to 44 Minutes | 106 | 3.5% |
| 45 to 59 Minutes | 548 | 18.2% |
| 60 to 89 Minutes | 63 | 2.1% |
| 90 or more Minutes | 11 | 0.4% |
Commute Time by Sex in Georgetown
The most common commute times in Georgetown are 45 to 59 minutes (470 commuters, 22.8%) for males and 15 to 19 minutes (135 commuters, 14.3%) for females.
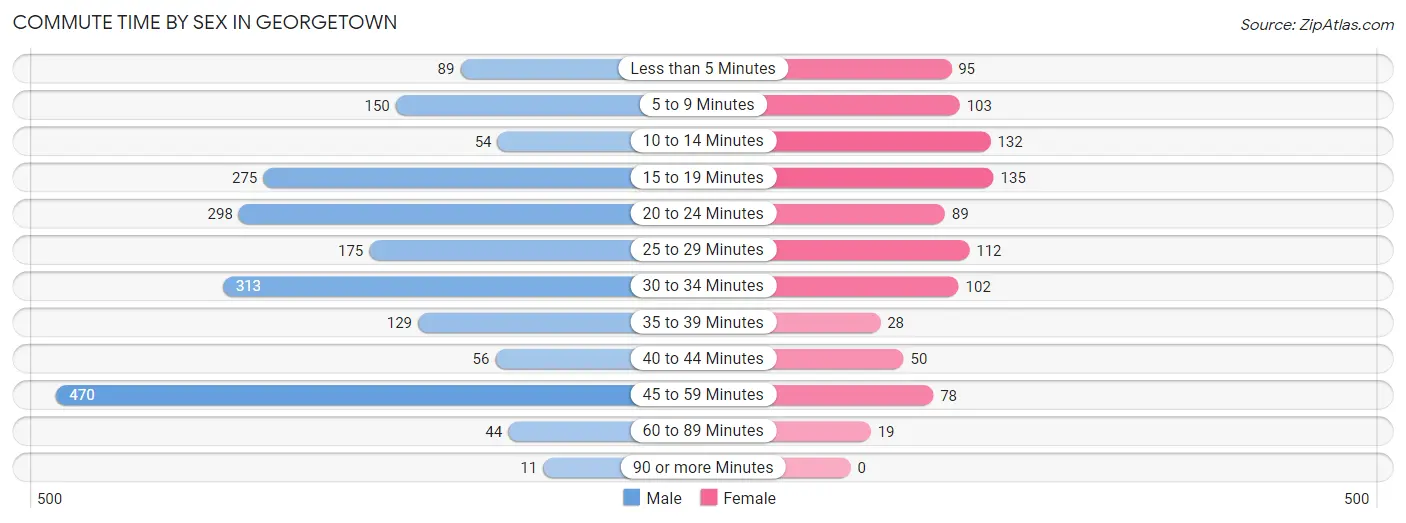
| Commute Time | Male | Female |
| Less than 5 Minutes | 89 (4.3%) | 95 (10.1%) |
| 5 to 9 Minutes | 150 (7.3%) | 103 (10.9%) |
| 10 to 14 Minutes | 54 (2.6%) | 132 (14.0%) |
| 15 to 19 Minutes | 275 (13.3%) | 135 (14.3%) |
| 20 to 24 Minutes | 298 (14.4%) | 89 (9.4%) |
| 25 to 29 Minutes | 175 (8.5%) | 112 (11.9%) |
| 30 to 34 Minutes | 313 (15.2%) | 102 (10.8%) |
| 35 to 39 Minutes | 129 (6.2%) | 28 (3.0%) |
| 40 to 44 Minutes | 56 (2.7%) | 50 (5.3%) |
| 45 to 59 Minutes | 470 (22.8%) | 78 (8.3%) |
| 60 to 89 Minutes | 44 (2.1%) | 19 (2.0%) |
| 90 or more Minutes | 11 (0.5%) | 0 (0.0%) |
Time of Departure to Work by Sex in Georgetown
The most frequent times of departure to work in Georgetown are 6:30 AM to 6:59 AM (472, 22.9%) for males and 8:00 AM to 8:29 AM (191, 20.3%) for females.
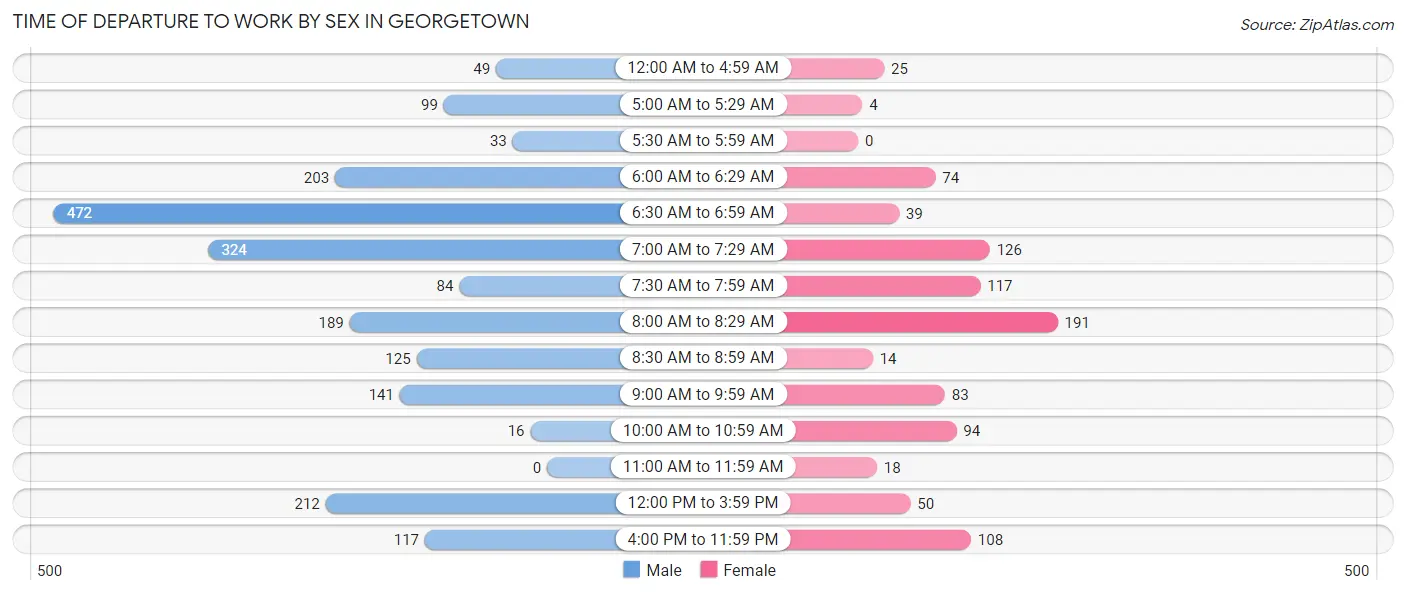
| Time of Departure | Male | Female |
| 12:00 AM to 4:59 AM | 49 (2.4%) | 25 (2.6%) |
| 5:00 AM to 5:29 AM | 99 (4.8%) | 4 (0.4%) |
| 5:30 AM to 5:59 AM | 33 (1.6%) | 0 (0.0%) |
| 6:00 AM to 6:29 AM | 203 (9.8%) | 74 (7.9%) |
| 6:30 AM to 6:59 AM | 472 (22.9%) | 39 (4.1%) |
| 7:00 AM to 7:29 AM | 324 (15.7%) | 126 (13.4%) |
| 7:30 AM to 7:59 AM | 84 (4.1%) | 117 (12.4%) |
| 8:00 AM to 8:29 AM | 189 (9.2%) | 191 (20.3%) |
| 8:30 AM to 8:59 AM | 125 (6.1%) | 14 (1.5%) |
| 9:00 AM to 9:59 AM | 141 (6.8%) | 83 (8.8%) |
| 10:00 AM to 10:59 AM | 16 (0.8%) | 94 (10.0%) |
| 11:00 AM to 11:59 AM | 0 (0.0%) | 18 (1.9%) |
| 12:00 PM to 3:59 PM | 212 (10.3%) | 50 (5.3%) |
| 4:00 PM to 11:59 PM | 117 (5.7%) | 108 (11.5%) |
| Total | 2,064 (100.0%) | 943 (100.0%) |
Housing Occupancy in Georgetown
Occupancy by Ownership in Georgetown
Of the total 2,437 dwellings in Georgetown, owner-occupied units account for 1,058 (43.4%), while renter-occupied units make up 1,379 (56.6%).
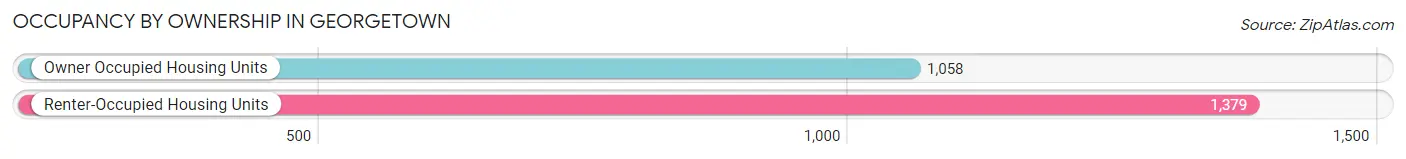
| Occupancy | # Housing Units | % Housing Units |
| Owner Occupied Housing Units | 1,058 | 43.4% |
| Renter-Occupied Housing Units | 1,379 | 56.6% |
| Total Occupied Housing Units | 2,437 | 100.0% |
Occupancy by Household Size in Georgetown
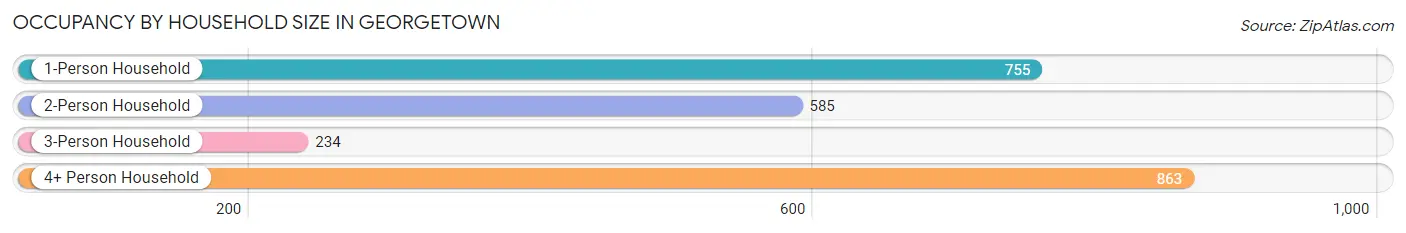
| Household Size | # Housing Units | % Housing Units |
| 1-Person Household | 755 | 31.0% |
| 2-Person Household | 585 | 24.0% |
| 3-Person Household | 234 | 9.6% |
| 4+ Person Household | 863 | 35.4% |
| Total Housing Units | 2,437 | 100.0% |
Occupancy by Ownership by Household Size in Georgetown
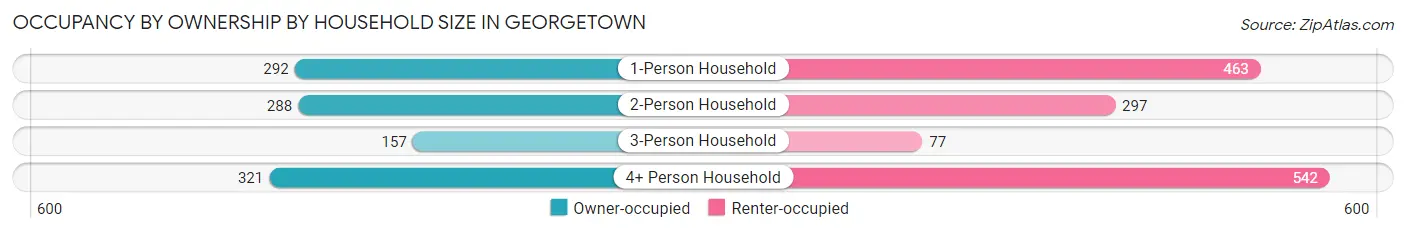
| Household Size | Owner-occupied | Renter-occupied |
| 1-Person Household | 292 (38.7%) | 463 (61.3%) |
| 2-Person Household | 288 (49.2%) | 297 (50.8%) |
| 3-Person Household | 157 (67.1%) | 77 (32.9%) |
| 4+ Person Household | 321 (37.2%) | 542 (62.8%) |
| Total Housing Units | 1,058 (43.4%) | 1,379 (56.6%) |
Occupancy by Educational Attainment in Georgetown
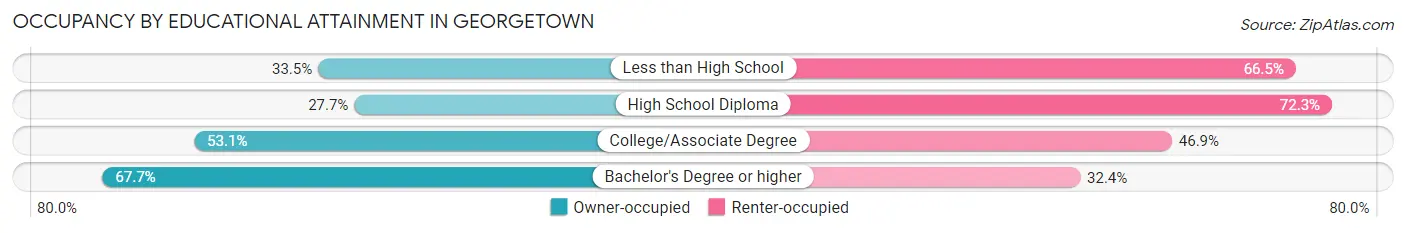
| Household Size | Owner-occupied | Renter-occupied |
| Less than High School | 173 (33.5%) | 344 (66.5%) |
| High School Diploma | 222 (27.7%) | 579 (72.3%) |
| College/Associate Degree | 343 (53.1%) | 303 (46.9%) |
| Bachelor's Degree or higher | 320 (67.6%) | 153 (32.4%) |
Occupancy by Age of Householder in Georgetown
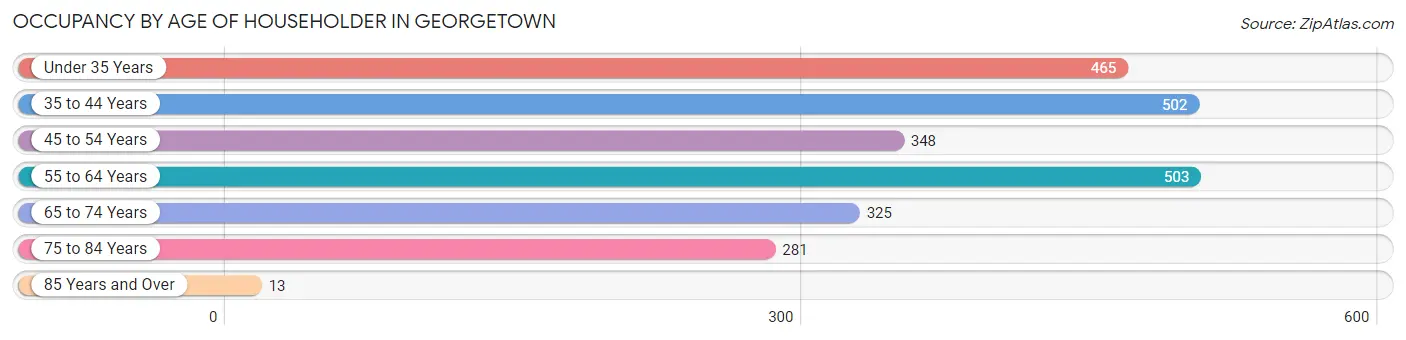
| Age Bracket | # Households | % Households |
| Under 35 Years | 465 | 19.1% |
| 35 to 44 Years | 502 | 20.6% |
| 45 to 54 Years | 348 | 14.3% |
| 55 to 64 Years | 503 | 20.6% |
| 65 to 74 Years | 325 | 13.3% |
| 75 to 84 Years | 281 | 11.5% |
| 85 Years and Over | 13 | 0.5% |
| Total | 2,437 | 100.0% |
Housing Finances in Georgetown
Median Income by Occupancy in Georgetown
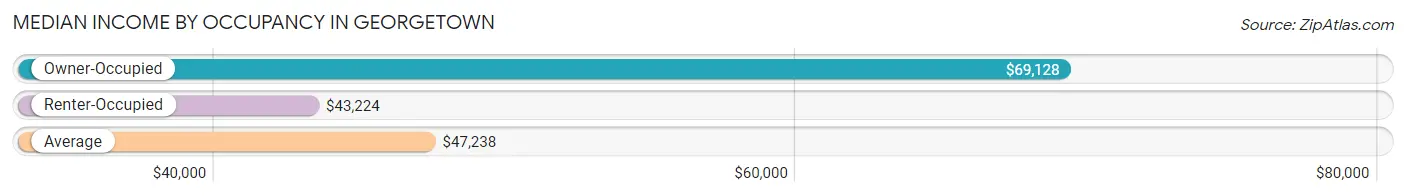
| Occupancy Type | # Households | Median Income |
| Owner-Occupied | 1,058 (43.4%) | $69,128 |
| Renter-Occupied | 1,379 (56.6%) | $43,224 |
| Average | 2,437 (100.0%) | $47,238 |
Occupancy by Householder Income Bracket in Georgetown
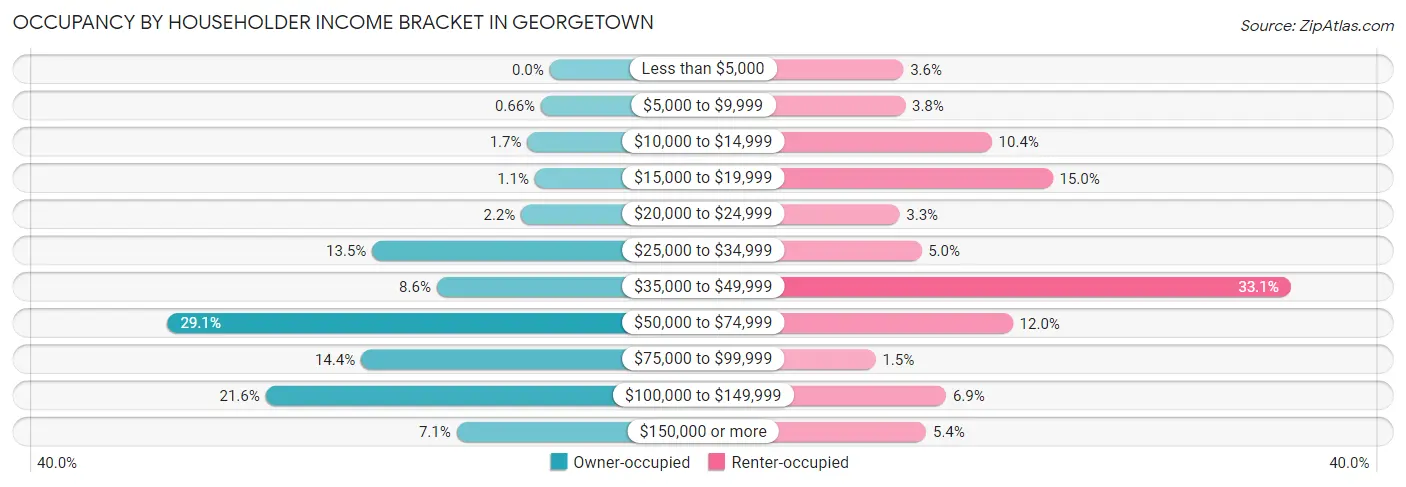
| Income Bracket | Owner-occupied | Renter-occupied |
| Less than $5,000 | 0 (0.0%) | 50 (3.6%) |
| $5,000 to $9,999 | 7 (0.7%) | 52 (3.8%) |
| $10,000 to $14,999 | 18 (1.7%) | 143 (10.4%) |
| $15,000 to $19,999 | 12 (1.1%) | 207 (15.0%) |
| $20,000 to $24,999 | 23 (2.2%) | 46 (3.3%) |
| $25,000 to $34,999 | 143 (13.5%) | 69 (5.0%) |
| $35,000 to $49,999 | 91 (8.6%) | 457 (33.1%) |
| $50,000 to $74,999 | 308 (29.1%) | 165 (12.0%) |
| $75,000 to $99,999 | 152 (14.4%) | 21 (1.5%) |
| $100,000 to $149,999 | 229 (21.6%) | 95 (6.9%) |
| $150,000 or more | 75 (7.1%) | 74 (5.4%) |
| Total | 1,058 (100.0%) | 1,379 (100.0%) |
Monthly Housing Cost Tiers in Georgetown
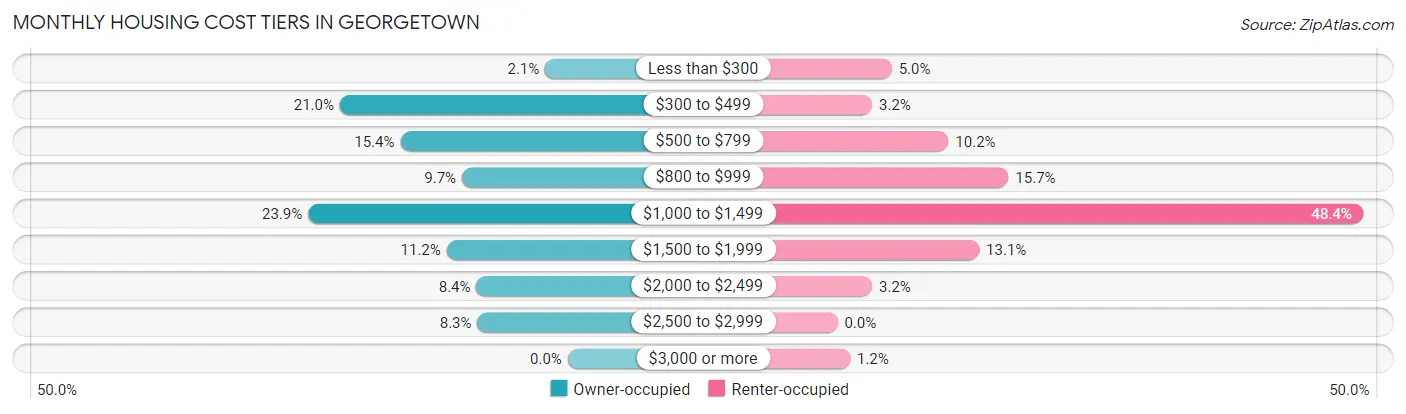
| Monthly Cost | Owner-occupied | Renter-occupied |
| Less than $300 | 22 (2.1%) | 69 (5.0%) |
| $300 to $499 | 222 (21.0%) | 44 (3.2%) |
| $500 to $799 | 163 (15.4%) | 141 (10.2%) |
| $800 to $999 | 103 (9.7%) | 217 (15.7%) |
| $1,000 to $1,499 | 253 (23.9%) | 668 (48.4%) |
| $1,500 to $1,999 | 118 (11.2%) | 180 (13.1%) |
| $2,000 to $2,499 | 89 (8.4%) | 44 (3.2%) |
| $2,500 to $2,999 | 88 (8.3%) | 0 (0.0%) |
| $3,000 or more | 0 (0.0%) | 16 (1.2%) |
| Total | 1,058 (100.0%) | 1,379 (100.0%) |
Physical Housing Characteristics in Georgetown
Housing Structures in Georgetown
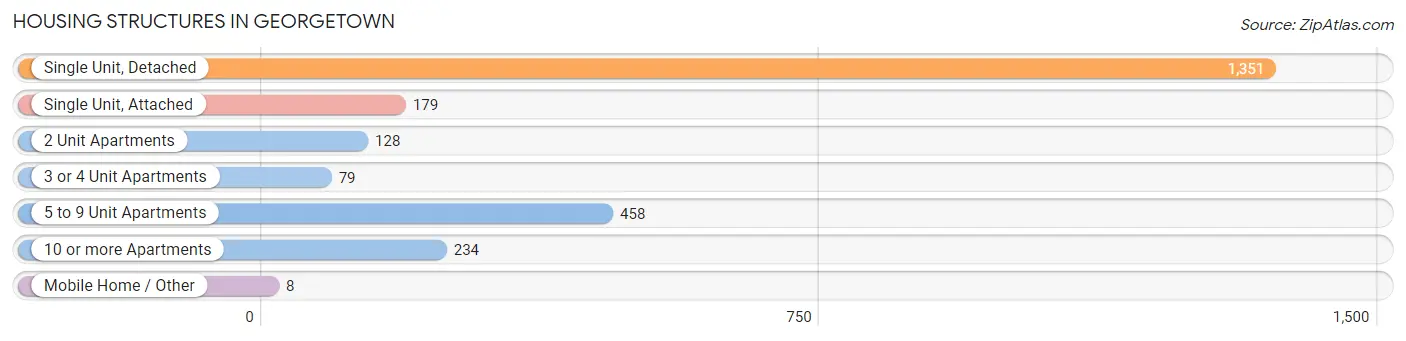
| Structure Type | # Housing Units | % Housing Units |
| Single Unit, Detached | 1,351 | 55.4% |
| Single Unit, Attached | 179 | 7.3% |
| 2 Unit Apartments | 128 | 5.2% |
| 3 or 4 Unit Apartments | 79 | 3.2% |
| 5 to 9 Unit Apartments | 458 | 18.8% |
| 10 or more Apartments | 234 | 9.6% |
| Mobile Home / Other | 8 | 0.3% |
| Total | 2,437 | 100.0% |
Housing Structures by Occupancy in Georgetown
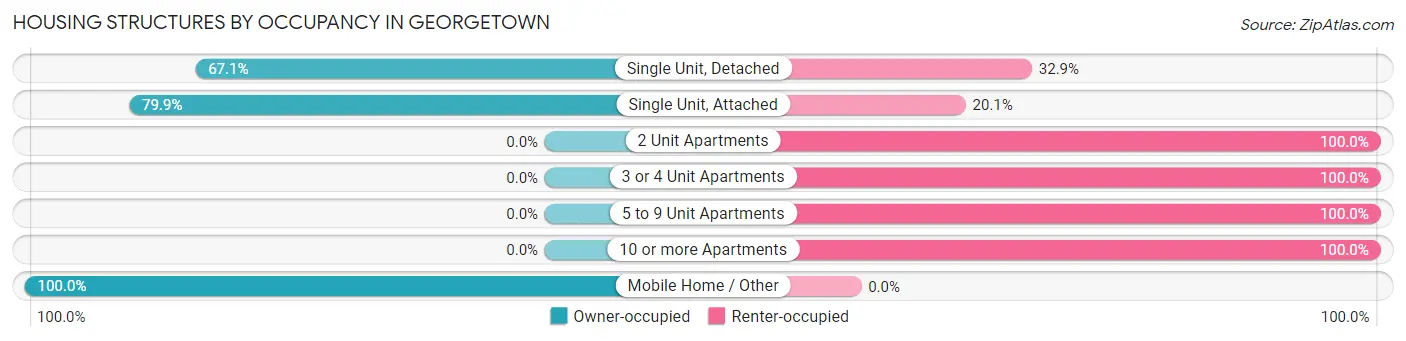
| Structure Type | Owner-occupied | Renter-occupied |
| Single Unit, Detached | 907 (67.1%) | 444 (32.9%) |
| Single Unit, Attached | 143 (79.9%) | 36 (20.1%) |
| 2 Unit Apartments | 0 (0.0%) | 128 (100.0%) |
| 3 or 4 Unit Apartments | 0 (0.0%) | 79 (100.0%) |
| 5 to 9 Unit Apartments | 0 (0.0%) | 458 (100.0%) |
| 10 or more Apartments | 0 (0.0%) | 234 (100.0%) |
| Mobile Home / Other | 8 (100.0%) | 0 (0.0%) |
| Total | 1,058 (43.4%) | 1,379 (56.6%) |
Housing Structures by Number of Rooms in Georgetown
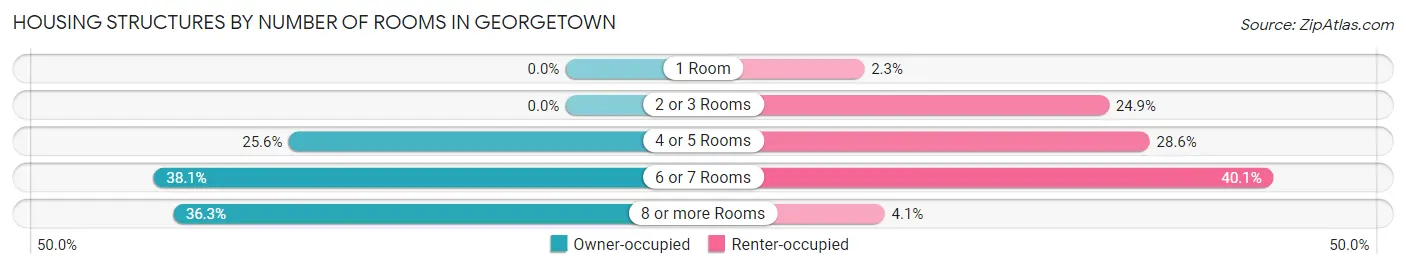
| Number of Rooms | Owner-occupied | Renter-occupied |
| 1 Room | 0 (0.0%) | 31 (2.2%) |
| 2 or 3 Rooms | 0 (0.0%) | 343 (24.9%) |
| 4 or 5 Rooms | 271 (25.6%) | 395 (28.6%) |
| 6 or 7 Rooms | 403 (38.1%) | 553 (40.1%) |
| 8 or more Rooms | 384 (36.3%) | 57 (4.1%) |
| Total | 1,058 (100.0%) | 1,379 (100.0%) |
Housing Structure by Heating Type in Georgetown
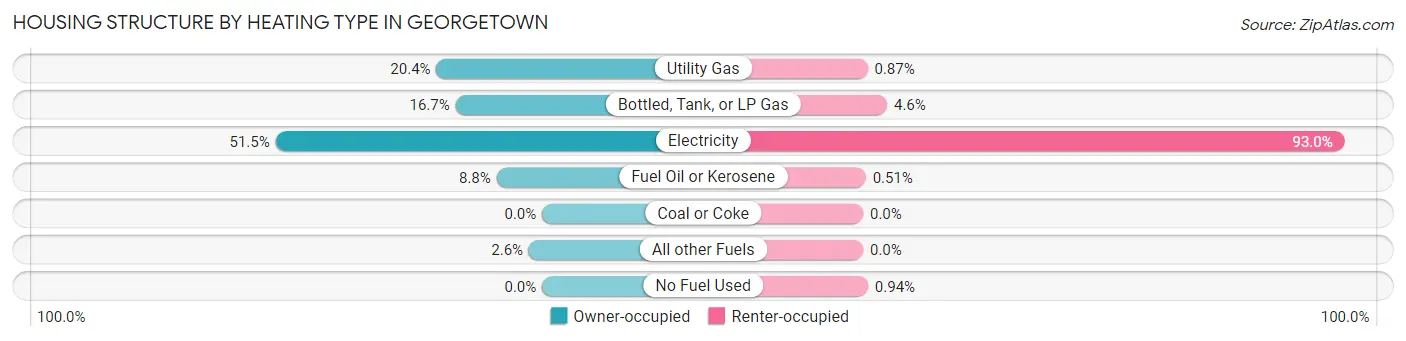
| Heating Type | Owner-occupied | Renter-occupied |
| Utility Gas | 216 (20.4%) | 12 (0.9%) |
| Bottled, Tank, or LP Gas | 177 (16.7%) | 64 (4.6%) |
| Electricity | 545 (51.5%) | 1,283 (93.0%) |
| Fuel Oil or Kerosene | 93 (8.8%) | 7 (0.5%) |
| Coal or Coke | 0 (0.0%) | 0 (0.0%) |
| All other Fuels | 27 (2.5%) | 0 (0.0%) |
| No Fuel Used | 0 (0.0%) | 13 (0.9%) |
| Total | 1,058 (100.0%) | 1,379 (100.0%) |
Household Vehicle Usage in Georgetown
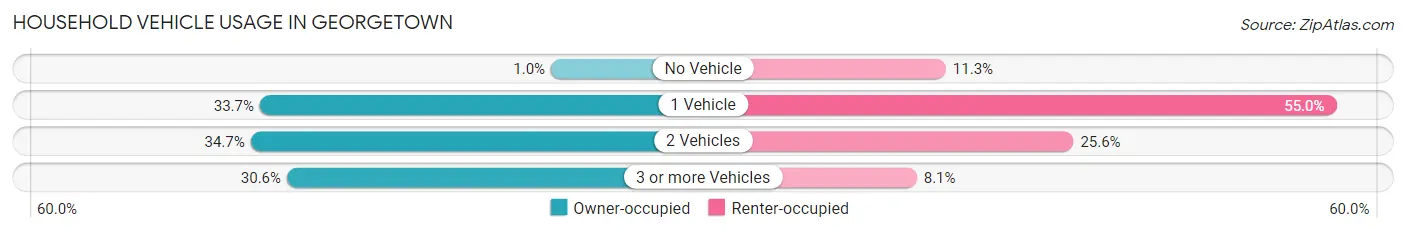
| Vehicles per Household | Owner-occupied | Renter-occupied |
| No Vehicle | 11 (1.0%) | 156 (11.3%) |
| 1 Vehicle | 356 (33.7%) | 759 (55.0%) |
| 2 Vehicles | 367 (34.7%) | 353 (25.6%) |
| 3 or more Vehicles | 324 (30.6%) | 111 (8.1%) |
| Total | 1,058 (100.0%) | 1,379 (100.0%) |
Real Estate & Mortgages in Georgetown
Real Estate and Mortgage Overview in Georgetown
| Characteristic | Without Mortgage | With Mortgage |
| Housing Units | 476 | 582 |
| Median Property Value | $257,600 | $256,800 |
| Median Household Income | $52,031 | $17 |
| Monthly Housing Costs | $496 | $0 |
| Real Estate Taxes | $1,161 | $10 |
Property Value by Mortgage Status in Georgetown
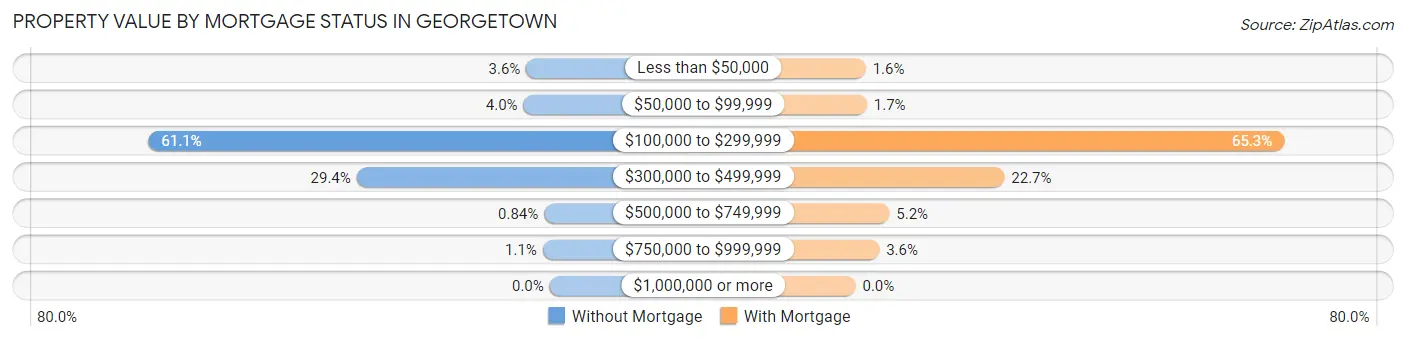
| Property Value | Without Mortgage | With Mortgage |
| Less than $50,000 | 17 (3.6%) | 9 (1.5%) |
| $50,000 to $99,999 | 19 (4.0%) | 10 (1.7%) |
| $100,000 to $299,999 | 291 (61.1%) | 380 (65.3%) |
| $300,000 to $499,999 | 140 (29.4%) | 132 (22.7%) |
| $500,000 to $749,999 | 4 (0.8%) | 30 (5.1%) |
| $750,000 to $999,999 | 5 (1.1%) | 21 (3.6%) |
| $1,000,000 or more | 0 (0.0%) | 0 (0.0%) |
| Total | 476 (100.0%) | 582 (100.0%) |
Household Income by Mortgage Status in Georgetown
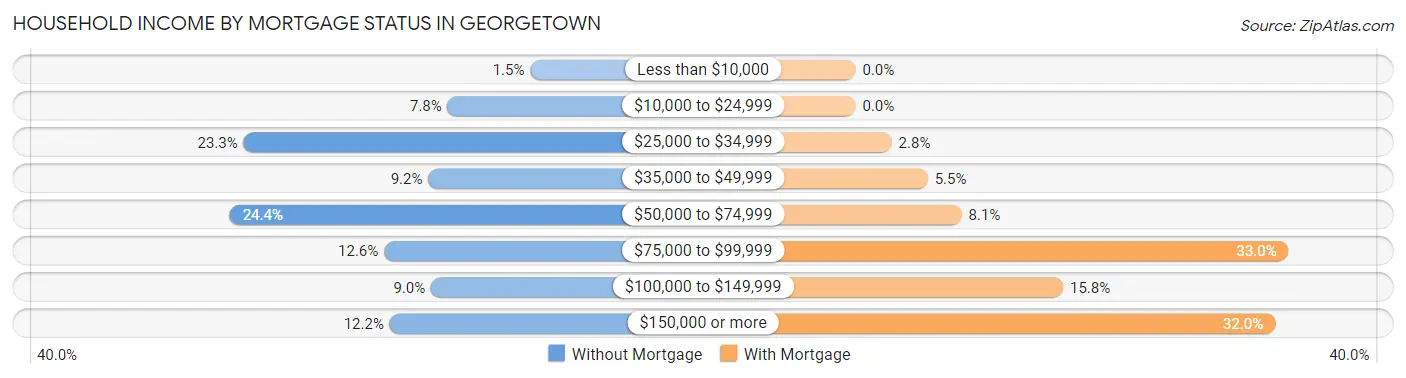
| Household Income | Without Mortgage | With Mortgage |
| Less than $10,000 | 7 (1.5%) | 0 (0.0%) |
| $10,000 to $24,999 | 37 (7.8%) | 0 (0.0%) |
| $25,000 to $34,999 | 111 (23.3%) | 16 (2.8%) |
| $35,000 to $49,999 | 44 (9.2%) | 32 (5.5%) |
| $50,000 to $74,999 | 116 (24.4%) | 47 (8.1%) |
| $75,000 to $99,999 | 60 (12.6%) | 192 (33.0%) |
| $100,000 to $149,999 | 43 (9.0%) | 92 (15.8%) |
| $150,000 or more | 58 (12.2%) | 186 (32.0%) |
| Total | 476 (100.0%) | 582 (100.0%) |
Property Value to Household Income Ratio in Georgetown
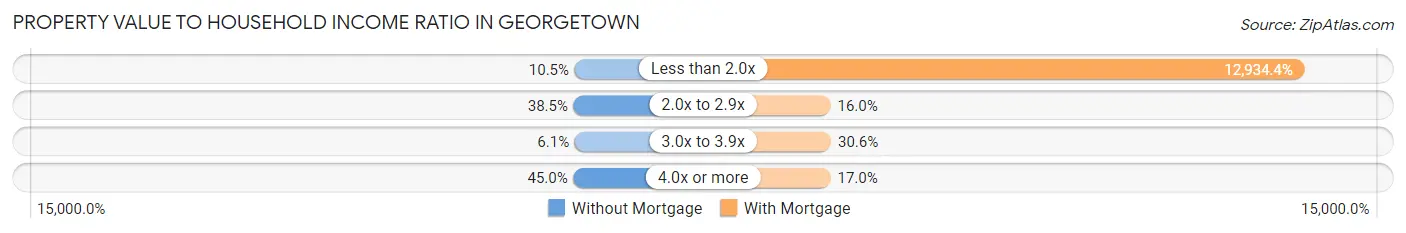
| Value-to-Income Ratio | Without Mortgage | With Mortgage |
| Less than 2.0x | 50 (10.5%) | 75,278 (12,934.4%) |
| 2.0x to 2.9x | 183 (38.5%) | 93 (16.0%) |
| 3.0x to 3.9x | 29 (6.1%) | 178 (30.6%) |
| 4.0x or more | 214 (45.0%) | 99 (17.0%) |
| Total | 476 (100.0%) | 582 (100.0%) |
Real Estate Taxes by Mortgage Status in Georgetown
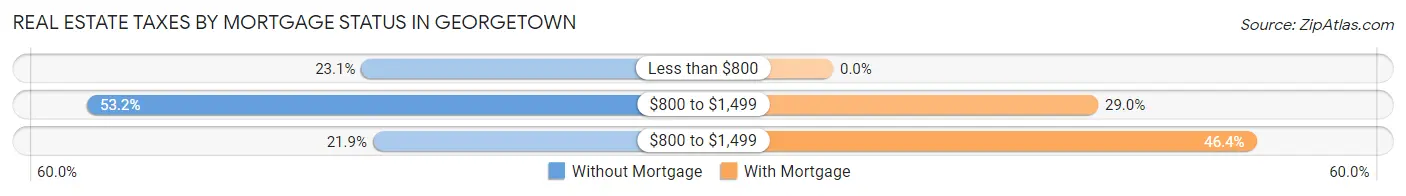
| Property Taxes | Without Mortgage | With Mortgage |
| Less than $800 | 110 (23.1%) | 0 (0.0%) |
| $800 to $1,499 | 253 (53.1%) | 169 (29.0%) |
| $800 to $1,499 | 104 (21.8%) | 270 (46.4%) |
| Total | 476 (100.0%) | 582 (100.0%) |
Health & Disability in Georgetown
Health Insurance Coverage by Age in Georgetown
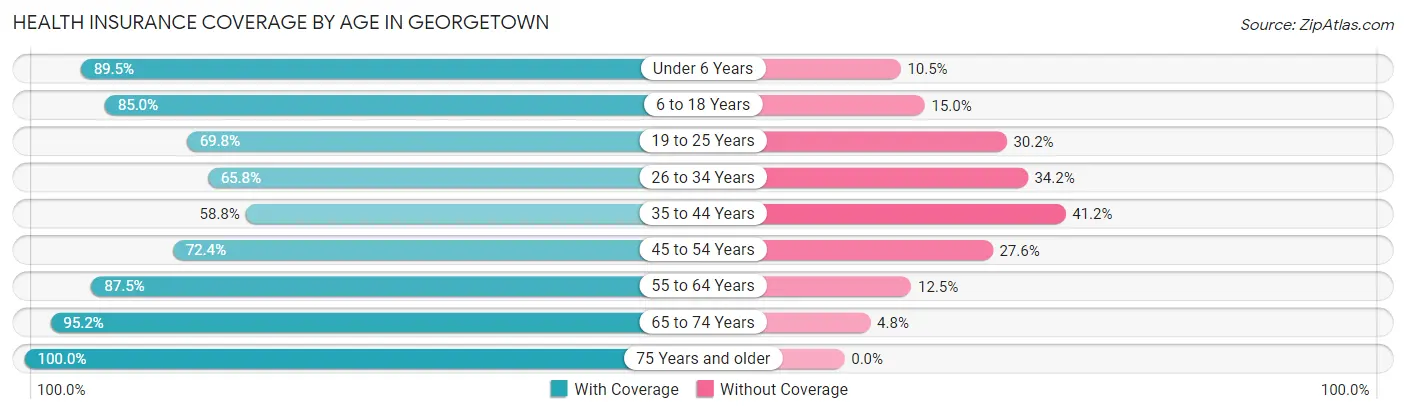
| Age Bracket | With Coverage | Without Coverage |
| Under 6 Years | 718 (89.5%) | 84 (10.5%) |
| 6 to 18 Years | 1,233 (85.0%) | 217 (15.0%) |
| 19 to 25 Years | 533 (69.8%) | 231 (30.2%) |
| 26 to 34 Years | 480 (65.8%) | 249 (34.2%) |
| 35 to 44 Years | 602 (58.8%) | 422 (41.2%) |
| 45 to 54 Years | 503 (72.4%) | 192 (27.6%) |
| 55 to 64 Years | 590 (87.5%) | 84 (12.5%) |
| 65 to 74 Years | 553 (95.2%) | 28 (4.8%) |
| 75 Years and older | 376 (100.0%) | 0 (0.0%) |
| Total | 5,588 (78.8%) | 1,507 (21.2%) |
Health Insurance Coverage by Citizenship Status in Georgetown
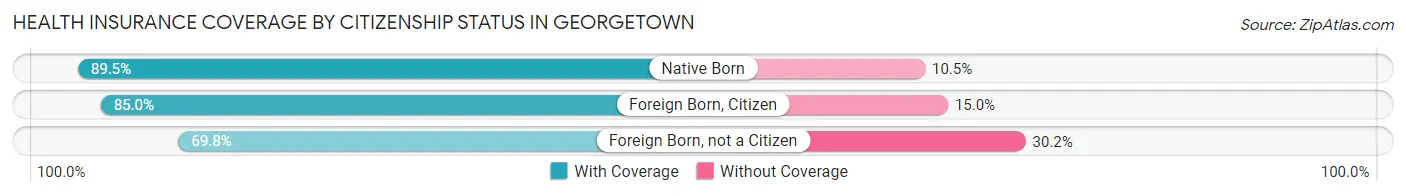
| Citizenship Status | With Coverage | Without Coverage |
| Native Born | 718 (89.5%) | 84 (10.5%) |
| Foreign Born, Citizen | 1,233 (85.0%) | 217 (15.0%) |
| Foreign Born, not a Citizen | 533 (69.8%) | 231 (30.2%) |
Health Insurance Coverage by Household Income in Georgetown
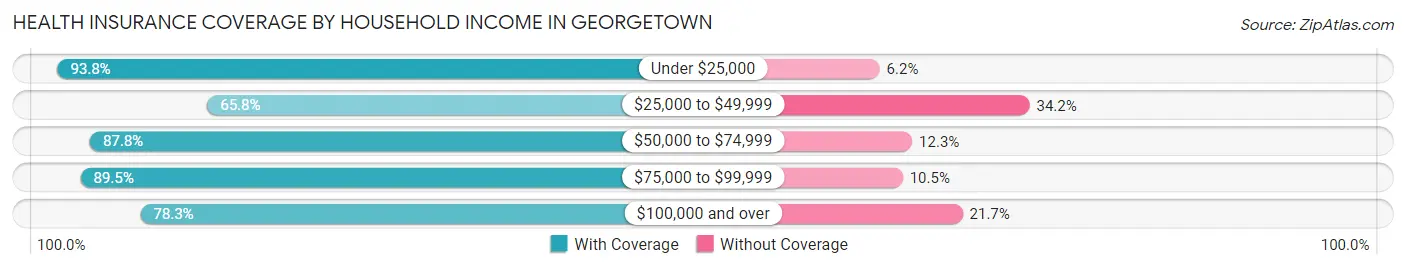
| Household Income | With Coverage | Without Coverage |
| Under $25,000 | 777 (93.8%) | 51 (6.2%) |
| $25,000 to $49,999 | 1,456 (65.8%) | 758 (34.2%) |
| $50,000 to $74,999 | 1,046 (87.7%) | 146 (12.2%) |
| $75,000 to $99,999 | 487 (89.5%) | 57 (10.5%) |
| $100,000 and over | 1,761 (78.3%) | 488 (21.7%) |
Public vs Private Health Insurance Coverage by Age in Georgetown
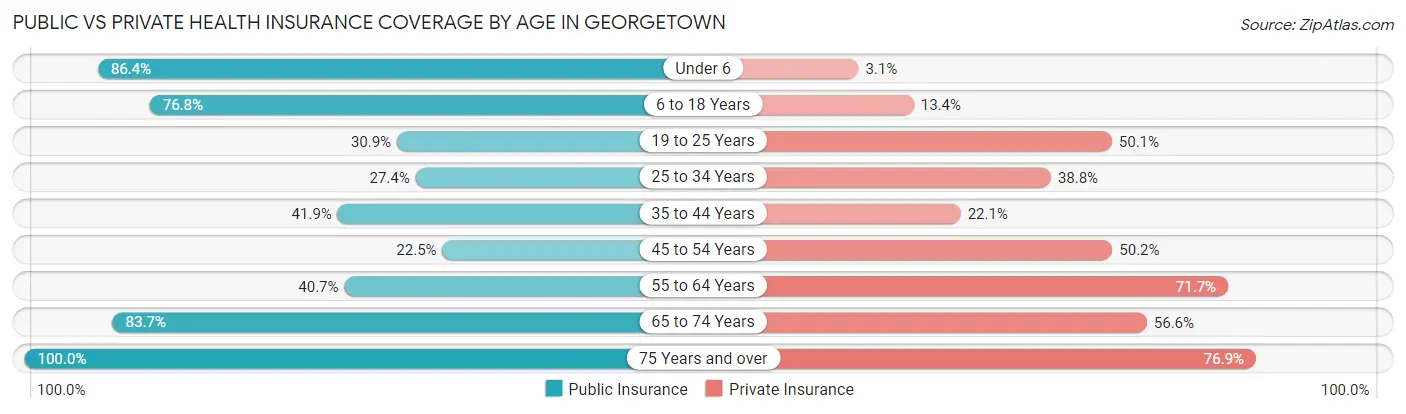
| Age Bracket | Public Insurance | Private Insurance |
| Under 6 | 693 (86.4%) | 25 (3.1%) |
| 6 to 18 Years | 1,113 (76.8%) | 194 (13.4%) |
| 19 to 25 Years | 236 (30.9%) | 383 (50.1%) |
| 25 to 34 Years | 200 (27.4%) | 283 (38.8%) |
| 35 to 44 Years | 429 (41.9%) | 226 (22.1%) |
| 45 to 54 Years | 156 (22.5%) | 349 (50.2%) |
| 55 to 64 Years | 274 (40.6%) | 483 (71.7%) |
| 65 to 74 Years | 486 (83.7%) | 329 (56.6%) |
| 75 Years and over | 376 (100.0%) | 289 (76.9%) |
| Total | 3,963 (55.9%) | 2,561 (36.1%) |
Disability Status by Sex by Age in Georgetown
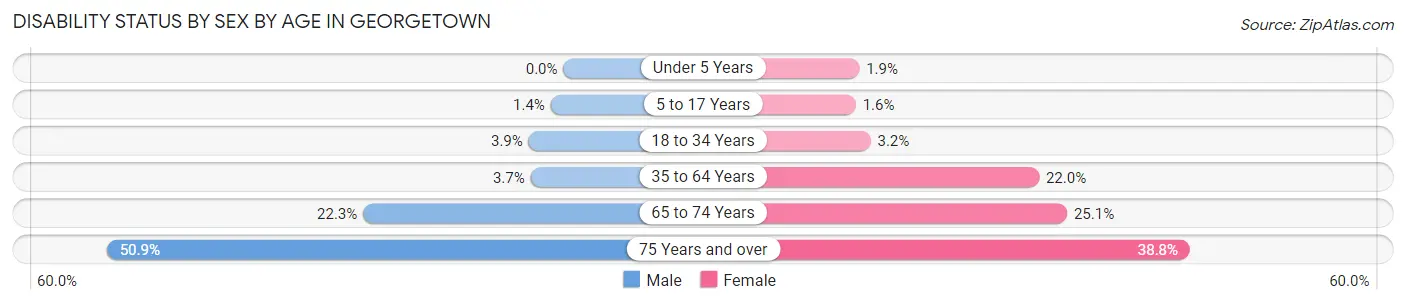
| Age Bracket | Male | Female |
| Under 5 Years | 0 (0.0%) | 6 (1.9%) |
| 5 to 17 Years | 13 (1.4%) | 6 (1.5%) |
| 18 to 34 Years | 37 (3.9%) | 23 (3.2%) |
| 35 to 64 Years | 42 (3.6%) | 273 (22.0%) |
| 65 to 74 Years | 62 (22.3%) | 76 (25.1%) |
| 75 Years and over | 60 (50.8%) | 100 (38.8%) |
Disability Class by Sex by Age in Georgetown
Disability Class: Hearing Difficulty
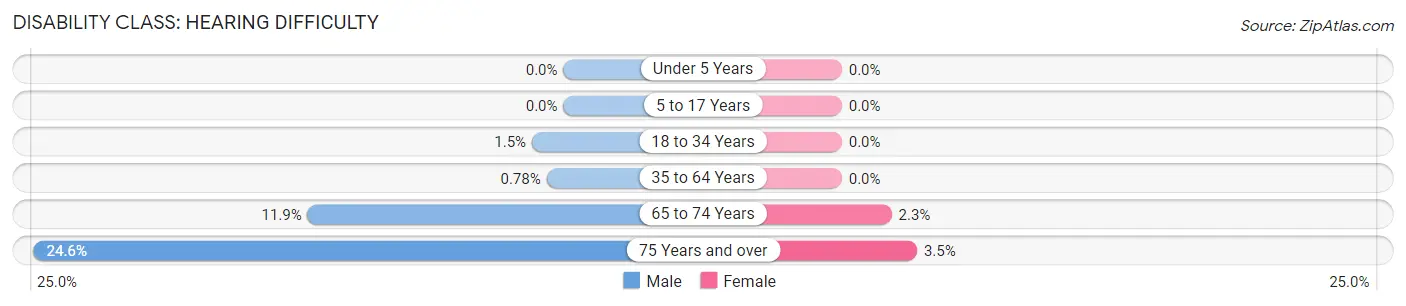
| Age Bracket | Male | Female |
| Under 5 Years | 0 (0.0%) | 0 (0.0%) |
| 5 to 17 Years | 0 (0.0%) | 0 (0.0%) |
| 18 to 34 Years | 14 (1.5%) | 0 (0.0%) |
| 35 to 64 Years | 9 (0.8%) | 0 (0.0%) |
| 65 to 74 Years | 33 (11.9%) | 7 (2.3%) |
| 75 Years and over | 29 (24.6%) | 9 (3.5%) |
Disability Class: Vision Difficulty
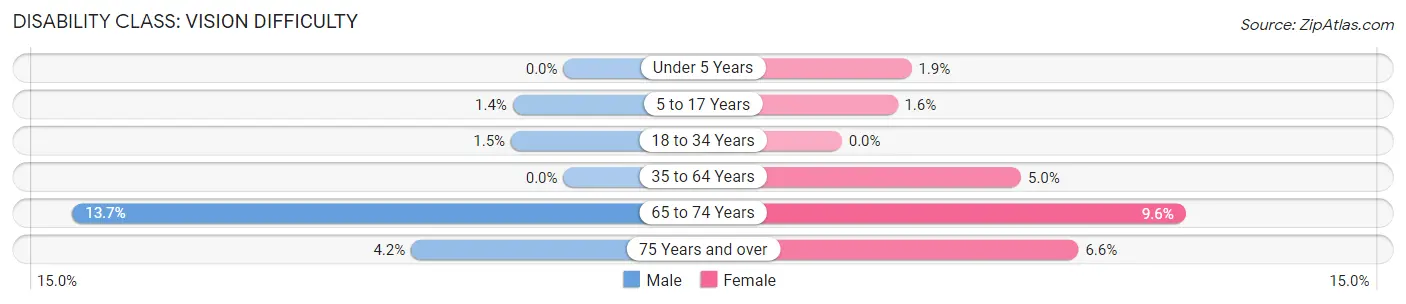
| Age Bracket | Male | Female |
| Under 5 Years | 0 (0.0%) | 6 (1.9%) |
| 5 to 17 Years | 13 (1.4%) | 6 (1.5%) |
| 18 to 34 Years | 14 (1.5%) | 0 (0.0%) |
| 35 to 64 Years | 0 (0.0%) | 62 (5.0%) |
| 65 to 74 Years | 38 (13.7%) | 29 (9.6%) |
| 75 Years and over | 5 (4.2%) | 17 (6.6%) |
Disability Class: Cognitive Difficulty
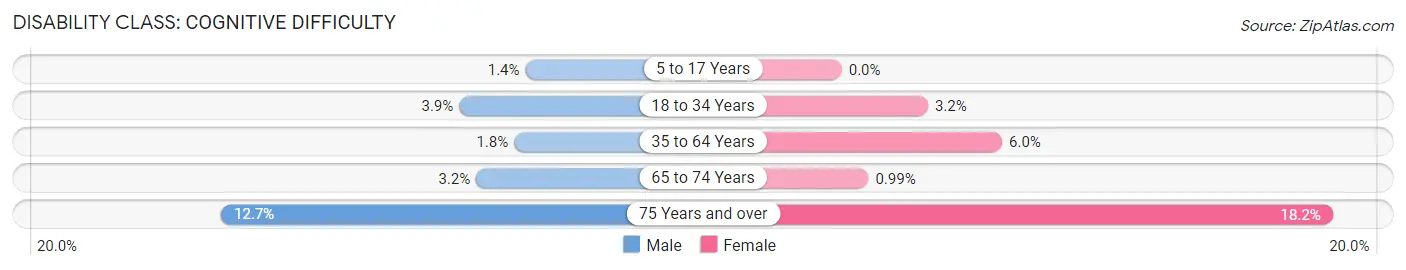
| Age Bracket | Male | Female |
| 5 to 17 Years | 13 (1.4%) | 0 (0.0%) |
| 18 to 34 Years | 37 (3.9%) | 23 (3.2%) |
| 35 to 64 Years | 21 (1.8%) | 74 (5.9%) |
| 65 to 74 Years | 9 (3.2%) | 3 (1.0%) |
| 75 Years and over | 15 (12.7%) | 47 (18.2%) |
Disability Class: Ambulatory Difficulty
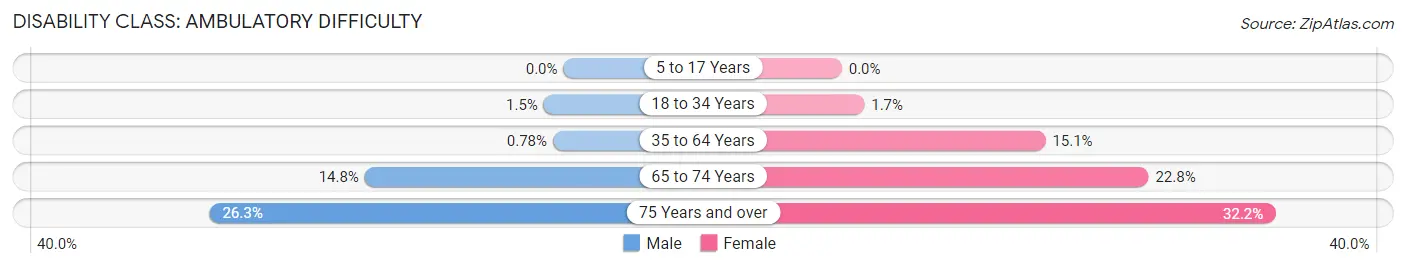
| Age Bracket | Male | Female |
| 5 to 17 Years | 0 (0.0%) | 0 (0.0%) |
| 18 to 34 Years | 14 (1.5%) | 12 (1.7%) |
| 35 to 64 Years | 9 (0.8%) | 188 (15.1%) |
| 65 to 74 Years | 41 (14.7%) | 69 (22.8%) |
| 75 Years and over | 31 (26.3%) | 83 (32.2%) |
Disability Class: Self-Care Difficulty
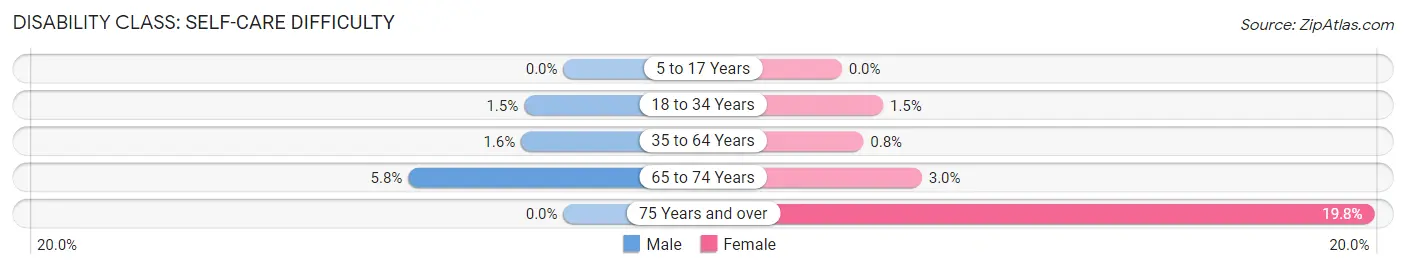
| Age Bracket | Male | Female |
| 5 to 17 Years | 0 (0.0%) | 0 (0.0%) |
| 18 to 34 Years | 14 (1.5%) | 11 (1.5%) |
| 35 to 64 Years | 18 (1.6%) | 10 (0.8%) |
| 65 to 74 Years | 16 (5.8%) | 9 (3.0%) |
| 75 Years and over | 0 (0.0%) | 51 (19.8%) |
Technology Access in Georgetown
Computing Device Access in Georgetown
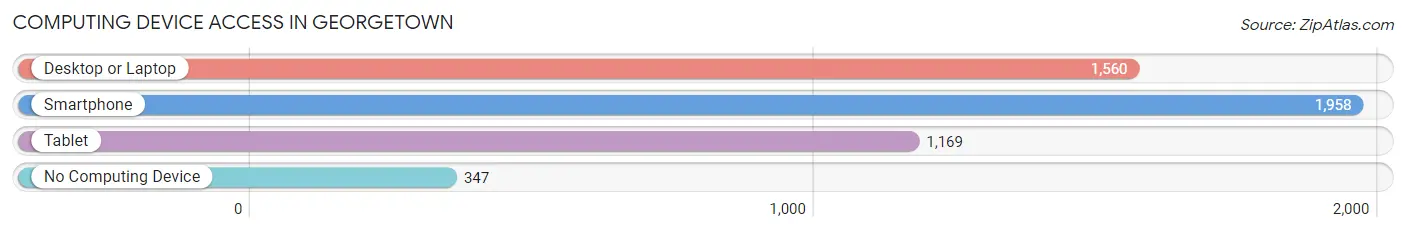
| Device Type | # Households | % Households |
| Desktop or Laptop | 1,560 | 64.0% |
| Smartphone | 1,958 | 80.3% |
| Tablet | 1,169 | 48.0% |
| No Computing Device | 347 | 14.2% |
| Total | 2,437 | 100.0% |
Internet Access in Georgetown
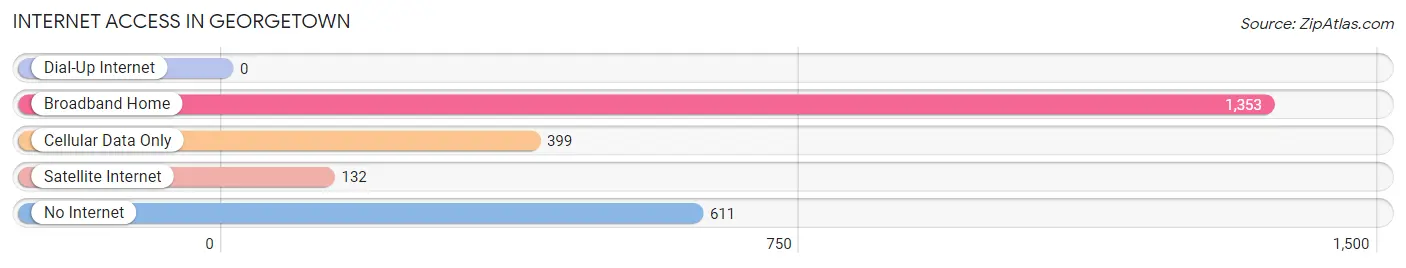
| Internet Type | # Households | % Households |
| Dial-Up Internet | 0 | 0.0% |
| Broadband Home | 1,353 | 55.5% |
| Cellular Data Only | 399 | 16.4% |
| Satellite Internet | 132 | 5.4% |
| No Internet | 611 | 25.1% |
| Total | 2,437 | 100.0% |
Georgetown Summary
Georgetown is a town located in Sussex County, Delaware, United States. It is the county seat of Sussex County and the largest town in the state. The population was 6,422 at the 2010 census, an increase of 38.3% over the previous decade. Georgetown is part of the Salisbury, Maryland-Delaware Metropolitan Statistical Area.
Geography
Georgetown is located at 38°41'N 75°38'W (38.68, -75.63). According to the United States Census Bureau, the town has a total area of 4.2 square miles (10.8 km2), of which 4.2 square miles (10.8 km2) is land and 0.04 square miles (0.1 km2) (0.48%) is water.
Georgetown is located in the Atlantic Coastal Plain region of Delaware. The town is situated on the Nanticoke River, which flows southward to the Chesapeake Bay. The town is located on the Delmarva Peninsula, which is bordered by the Atlantic Ocean to the east and the Chesapeake Bay to the west.
History
Georgetown was founded in 1791 by an act of the Delaware General Assembly. The town was named after George Washington, the first President of the United States. Georgetown was incorporated as a town in 1802.
Georgetown was an important port in the 19th century, and was the site of the first steamboat to travel the Nanticoke River. The town was also the site of the first railroad in Delaware, the Delaware Railroad, which was completed in 1856.
Economy
Georgetown is the county seat of Sussex County, and is home to many government offices and services. The town is also home to several large employers, including Perdue Farms, Mountaire Farms, and Allen Harim Foods.
Georgetown is also home to several small businesses, including restaurants, retail stores, and professional services. The town is also home to several large retail stores, including Walmart, Lowe's, and Home Depot.
Demographics
As of the 2010 census, there were 6,422 people, 2,541 households, and 1,619 families residing in the town. The population density was 1,521.3 people per square mile (586.2/km2). There were 2,817 housing units at an average density of 672.3 per square mile (259.7/km2). The racial makeup of the town was 73.2% White, 19.3% African American, 0.4% Native American, 1.2% Asian, 0.1% Pacific Islander, 3.2% from other races, and 2.7% from two or more races. Hispanic or Latino of any race were 6.7% of the population.
There were 2,541 households, out of which 28.2% had children under the age of 18 living with them, 43.2% were married couples living together, 15.3% had a female householder with no husband present, and 36.7% were non-families. 30.3% of all households were made up of individuals, and 12.7% had someone living alone who was 65 years of age or older. The average household size was 2.45 and the average family size was 3.04.
In the town, the population was spread out, with 24.2% under the age of 18, 8.2% from 18 to 24, 27.2% from 25 to 44, 24.3% from 45 to 64, and 16.1% who were 65 years of age or older. The median age was 38 years. For every 100 females, there were 91.3 males. For every 100 females age 18 and over, there were 87.3 males.
The median income for a household in the town was $37,917, and the median income for a family was $45,938. Males had a median income of $31,917 versus $25,938 for females. The per capita income for the town was $19,945. About 10.2% of families and 13.2% of the population were below the poverty line, including 17.2% of those under age 18 and 11.2% of those age 65 or over.
Common Questions
What is Per Capita Income in Georgetown?
Per Capita income in Georgetown is $22,640.
What is the Median Family Income in Georgetown?
Median Family Income in Georgetown is $50,417.
What is the Median Household income in Georgetown?
Median Household Income in Georgetown is $47,238.
What is Income or Wage Gap in Georgetown?
Income or Wage Gap in Georgetown is 24.9%.
Women in Georgetown earn 75.1 cents for every dollar earned by a man.
What is Inequality or Gini Index in Georgetown?
Inequality or Gini Index in Georgetown is 0.42.
What is the Total Population of Georgetown?
Total Population of Georgetown is 7,247.
What is the Total Male Population of Georgetown?
Total Male Population of Georgetown is 3,922.
What is the Total Female Population of Georgetown?
Total Female Population of Georgetown is 3,325.
What is the Ratio of Males per 100 Females in Georgetown?
There are 117.95 Males per 100 Females in Georgetown.
What is the Ratio of Females per 100 Males in Georgetown?
There are 84.78 Females per 100 Males in Georgetown.
What is the Median Population Age in Georgetown?
Median Population Age in Georgetown is 32.3 Years.
What is the Average Family Size in Georgetown
Average Family Size in Georgetown is 3.4 People.
What is the Average Household Size in Georgetown
Average Household Size in Georgetown is 2.9 People.
How Large is the Labor Force in Georgetown?
There are 3,168 People in the Labor Forcein in Georgetown.
What is the Percentage of People in the Labor Force in Georgetown?
59.4% of People are in the Labor Force in Georgetown.
What is the Unemployment Rate in Georgetown?
Unemployment Rate in Georgetown is 2.0%.