Fort Worth, TX Map & Demographics
Fort Worth Map
Fort Worth Overview
$35,428
PER CAPITA INCOME
$87,622
AVG FAMILY INCOME
$72,726
AVG HOUSEHOLD INCOME
27.2%
WAGE / INCOME GAP [ % ]
72.8¢/ $1
WAGE / INCOME GAP [ $ ]
$11,485
FAMILY INCOME DEFICIT
0.45
INEQUALITY / GINI INDEX
924,663
TOTAL POPULATION
454,566
MALE POPULATION
470,097
FEMALE POPULATION
96.70
MALES / 100 FEMALES
103.42
FEMALES / 100 MALES
33.2
MEDIAN AGE
3.4
AVG FAMILY SIZE
2.8
AVG HOUSEHOLD SIZE
481,974
LABOR FORCE [ PEOPLE ]
68.4%
PERCENT IN LABOR FORCE
5.3%
UNEMPLOYMENT RATE
Fort Worth Zip Codes
Income in Fort Worth
Income Overview in Fort Worth
Per Capita Income in Fort Worth is $35,428, while median incomes of families and households are $87,622 and $72,726 respectively.
| Characteristic | Number | Measure |
| Per Capita Income | 924,663 | $35,428 |
| Median Family Income | 216,036 | $87,622 |
| Mean Family Income | 216,036 | $111,872 |
| Median Household Income | 326,648 | $72,726 |
| Mean Household Income | 326,648 | $97,226 |
| Income Deficit | 216,036 | $11,485 |
| Wage / Income Gap (%) | 924,663 | 27.25% |
| Wage / Income Gap ($) | 924,663 | 72.75¢ per $1 |
| Gini / Inequality Index | 924,663 | 0.45 |
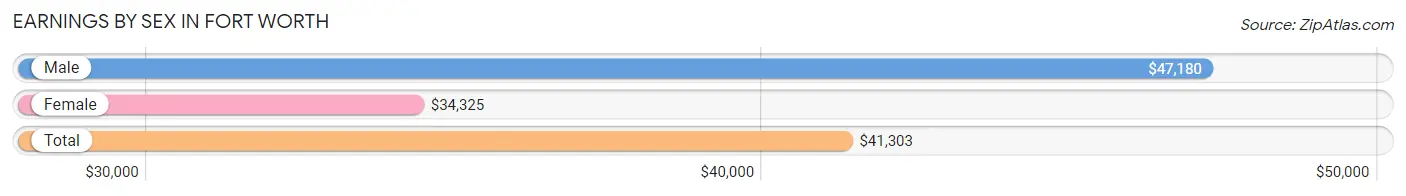
Earnings by Sex in Fort Worth
Average Earnings in Fort Worth are $41,303, $47,180 for men and $34,325 for women, a difference of 27.3%.
| Sex | Number | Average Earnings |
| Male | 267,154 (53.5%) | $47,180 |
| Female | 231,742 (46.5%) | $34,325 |
| Total | 498,896 (100.0%) | $41,303 |
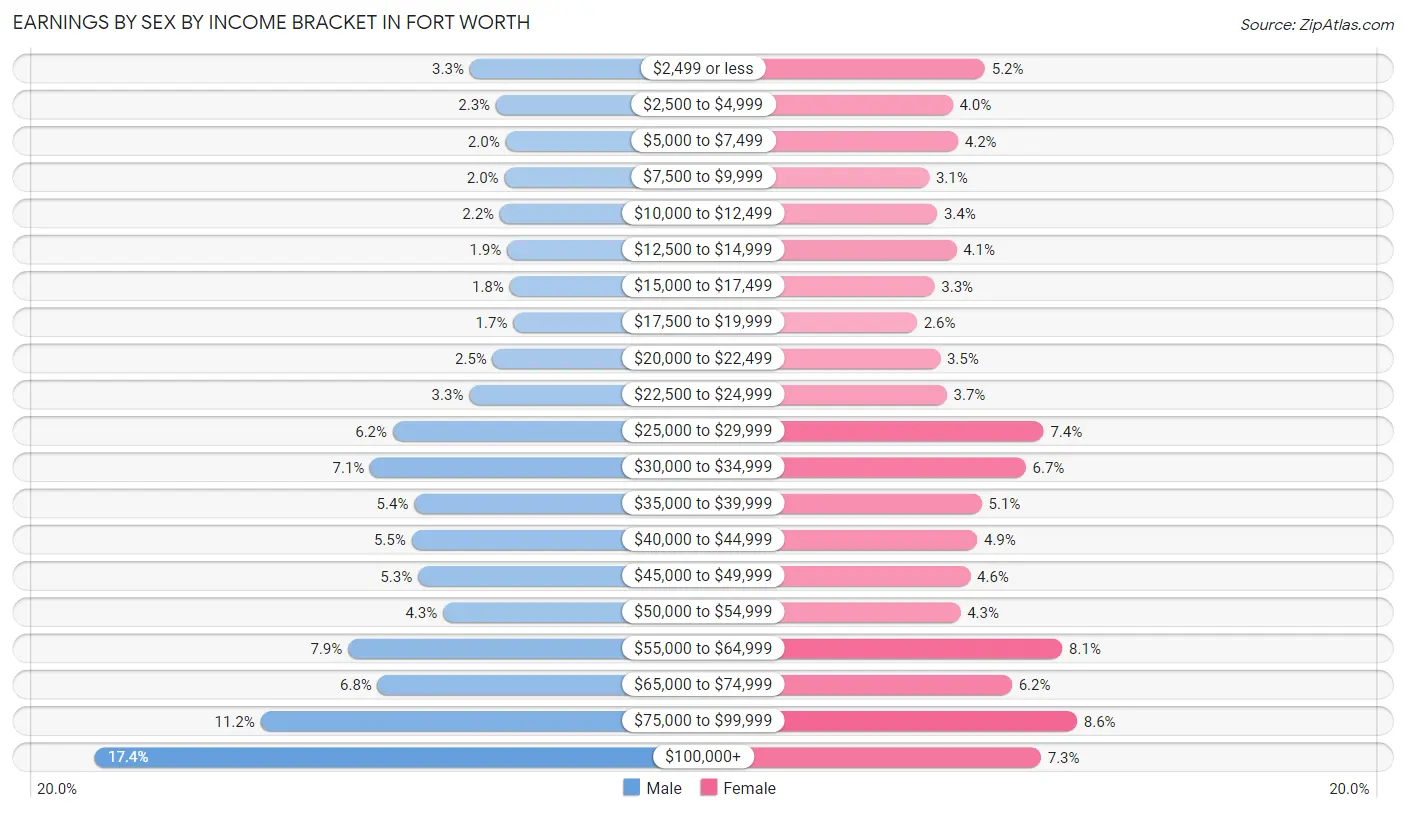
Earnings by Sex by Income Bracket in Fort Worth
The most common earnings brackets in Fort Worth are $100,000+ for men (46,382 | 17.4%) and $75,000 to $99,999 for women (19,985 | 8.6%).
| Income | Male | Female |
| $2,499 or less | 8,866 (3.3%) | 11,989 (5.2%) |
| $2,500 to $4,999 | 6,255 (2.3%) | 9,176 (4.0%) |
| $5,000 to $7,499 | 5,291 (2.0%) | 9,640 (4.2%) |
| $7,500 to $9,999 | 5,396 (2.0%) | 7,128 (3.1%) |
| $10,000 to $12,499 | 5,840 (2.2%) | 7,830 (3.4%) |
| $12,500 to $14,999 | 5,137 (1.9%) | 9,496 (4.1%) |
| $15,000 to $17,499 | 4,896 (1.8%) | 7,612 (3.3%) |
| $17,500 to $19,999 | 4,507 (1.7%) | 6,076 (2.6%) |
| $20,000 to $22,499 | 6,584 (2.5%) | 8,097 (3.5%) |
| $22,500 to $24,999 | 8,935 (3.3%) | 8,672 (3.7%) |
| $25,000 to $29,999 | 16,558 (6.2%) | 17,071 (7.4%) |
| $30,000 to $34,999 | 18,835 (7.0%) | 15,521 (6.7%) |
| $35,000 to $39,999 | 14,424 (5.4%) | 11,694 (5.1%) |
| $40,000 to $44,999 | 14,702 (5.5%) | 11,319 (4.9%) |
| $45,000 to $49,999 | 14,051 (5.3%) | 10,713 (4.6%) |
| $50,000 to $54,999 | 11,540 (4.3%) | 9,860 (4.3%) |
| $55,000 to $64,999 | 21,048 (7.9%) | 18,694 (8.1%) |
| $65,000 to $74,999 | 18,080 (6.8%) | 14,315 (6.2%) |
| $75,000 to $99,999 | 29,827 (11.2%) | 19,985 (8.6%) |
| $100,000+ | 46,382 (17.4%) | 16,854 (7.3%) |
| Total | 267,154 (100.0%) | 231,742 (100.0%) |
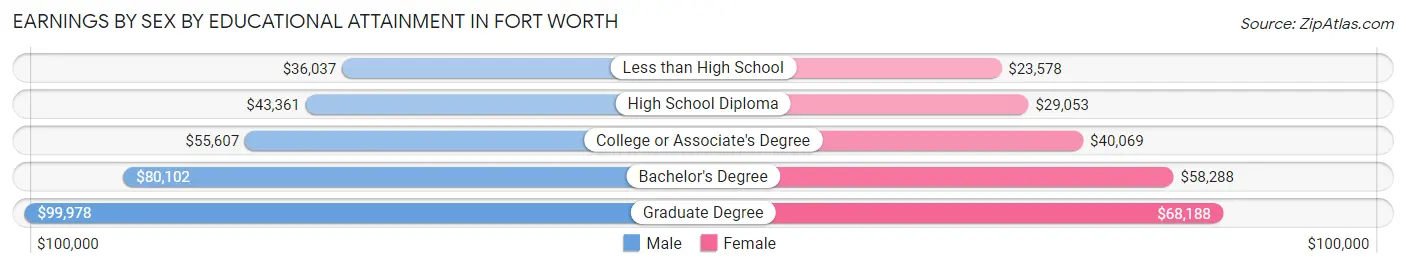
Earnings by Sex by Educational Attainment in Fort Worth
Average earnings in Fort Worth are $54,123 for men and $40,317 for women, a difference of 25.5%. Men with an educational attainment of graduate degree enjoy the highest average annual earnings of $99,978, while those with less than high school education earn the least with $36,037. Women with an educational attainment of graduate degree earn the most with the average annual earnings of $68,188, while those with less than high school education have the smallest earnings of $23,578.
| Educational Attainment | Male Income | Female Income |
| Less than High School | $36,037 | $23,578 |
| High School Diploma | $43,361 | $29,053 |
| College or Associate's Degree | $55,607 | $40,069 |
| Bachelor's Degree | $80,102 | $58,288 |
| Graduate Degree | $99,978 | $68,188 |
| Total | $54,123 | $40,317 |
Family Income in Fort Worth
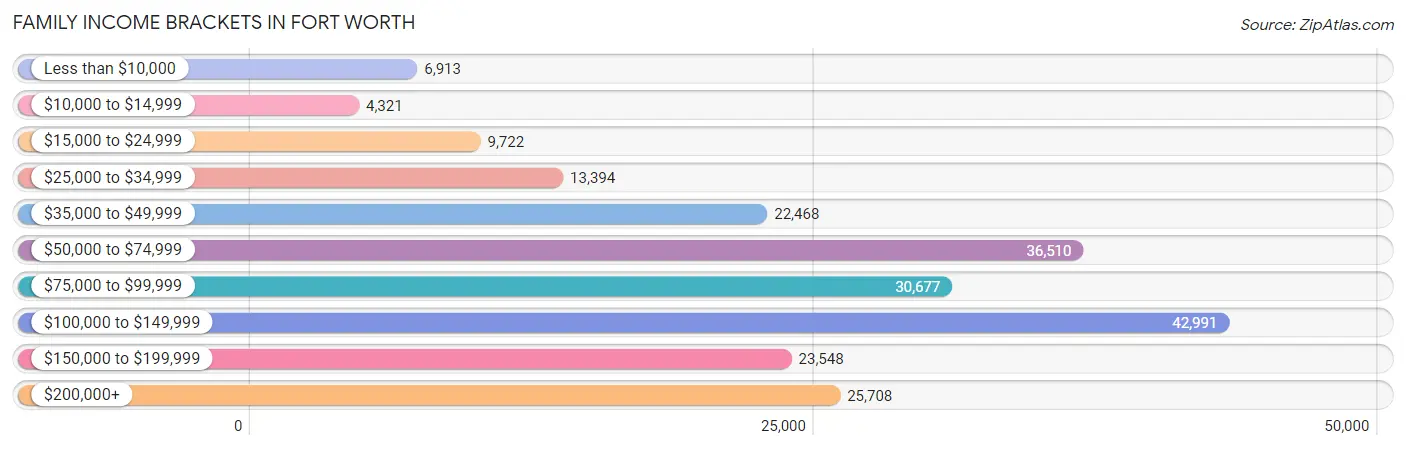
Family Income Brackets in Fort Worth
According to the Fort Worth family income data, there are 42,991 families falling into the $100,000 to $149,999 income range, which is the most common income bracket and makes up 19.9% of all families. Conversely, the $10,000 to $14,999 income bracket is the least frequent group with only 4,321 families (2.0%) belonging to this category.
| Income Bracket | # Families | % Families |
| Less than $10,000 | 6,913 | 3.2% |
| $10,000 to $14,999 | 4,321 | 2.0% |
| $15,000 to $24,999 | 9,722 | 4.5% |
| $25,000 to $34,999 | 13,394 | 6.2% |
| $35,000 to $49,999 | 22,468 | 10.4% |
| $50,000 to $74,999 | 36,510 | 16.9% |
| $75,000 to $99,999 | 30,677 | 14.2% |
| $100,000 to $149,999 | 42,991 | 19.9% |
| $150,000 to $199,999 | 23,548 | 10.9% |
| $200,000+ | 25,708 | 11.9% |
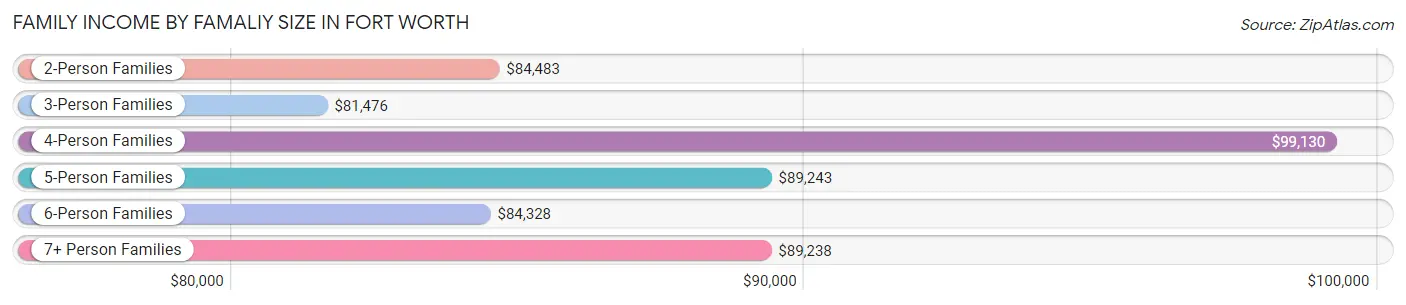
Family Income by Famaliy Size in Fort Worth
4-person families (43,075 | 19.9%) account for the highest median family income in Fort Worth with $99,130 per family, while 2-person families (85,799 | 39.7%) have the highest median income of $42,242 per family member.
| Income Bracket | # Families | Median Income |
| 2-Person Families | 85,799 (39.7%) | $84,483 |
| 3-Person Families | 49,923 (23.1%) | $81,476 |
| 4-Person Families | 43,075 (19.9%) | $99,130 |
| 5-Person Families | 22,077 (10.2%) | $89,243 |
| 6-Person Families | 9,611 (4.4%) | $84,328 |
| 7+ Person Families | 5,551 (2.6%) | $89,238 |
| Total | 216,036 (100.0%) | $87,622 |
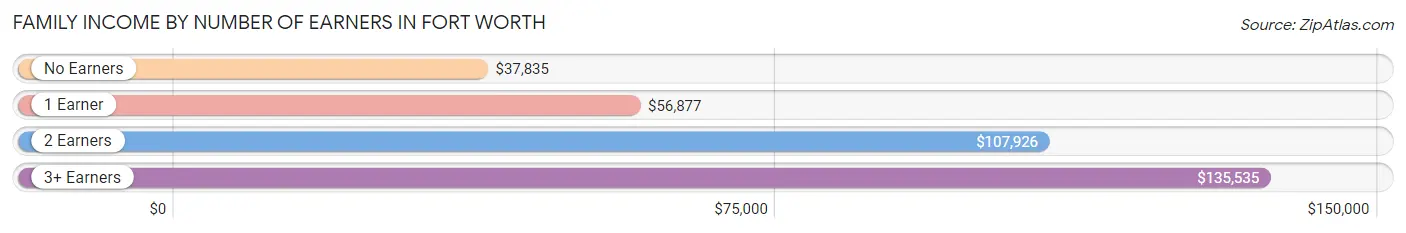
Family Income by Number of Earners in Fort Worth
The median family income in Fort Worth is $87,622, with families comprising 3+ earners (27,398) having the highest median family income of $135,535, while families with no earners (19,750) have the lowest median family income of $37,835, accounting for 12.7% and 9.1% of families, respectively.
| Number of Earners | # Families | Median Income |
| No Earners | 19,750 (9.1%) | $37,835 |
| 1 Earner | 72,769 (33.7%) | $56,877 |
| 2 Earners | 96,119 (44.5%) | $107,926 |
| 3+ Earners | 27,398 (12.7%) | $135,535 |
| Total | 216,036 (100.0%) | $87,622 |
Household Income in Fort Worth
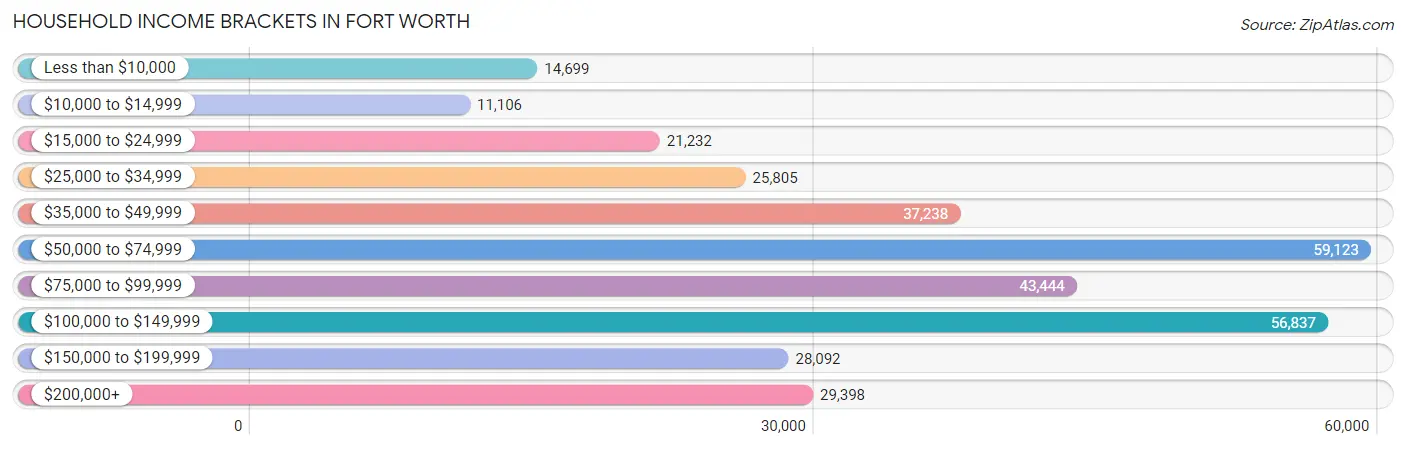
Household Income Brackets in Fort Worth
With 59,123 households falling in the category, the $50,000 to $74,999 income range is the most frequent in Fort Worth, accounting for 18.1% of all households. In contrast, only 11,106 households (3.4%) fall into the $10,000 to $14,999 income bracket, making it the least populous group.
| Income Bracket | # Households | % Households |
| Less than $10,000 | 14,699 | 4.5% |
| $10,000 to $14,999 | 11,106 | 3.4% |
| $15,000 to $24,999 | 21,232 | 6.5% |
| $25,000 to $34,999 | 25,805 | 7.9% |
| $35,000 to $49,999 | 37,238 | 11.4% |
| $50,000 to $74,999 | 59,123 | 18.1% |
| $75,000 to $99,999 | 43,444 | 13.3% |
| $100,000 to $149,999 | 56,837 | 17.4% |
| $150,000 to $199,999 | 28,092 | 8.6% |
| $200,000+ | 29,398 | 9.0% |
Household Income by Householder Age in Fort Worth
The median household income in Fort Worth is $72,726, with the highest median household income of $85,127 found in the 45 to 64 years age bracket for the primary householder. A total of 116,051 households (35.5%) fall into this category. Meanwhile, the 15 to 24 years age bracket for the primary householder has the lowest median household income of $46,292, with 16,194 households (5.0%) in this group.
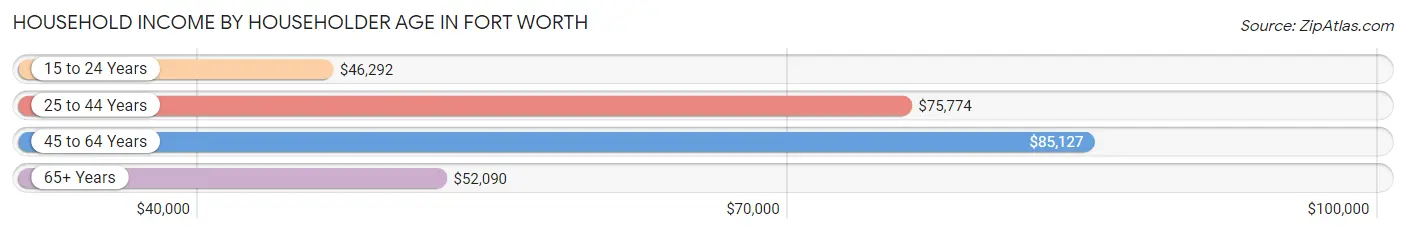
| Income Bracket | # Households | Median Income |
| 15 to 24 Years | 16,194 (5.0%) | $46,292 |
| 25 to 44 Years | 136,471 (41.8%) | $75,774 |
| 45 to 64 Years | 116,051 (35.5%) | $85,127 |
| 65+ Years | 57,932 (17.7%) | $52,090 |
| Total | 326,648 (100.0%) | $72,726 |
Poverty in Fort Worth
Income Below Poverty by Sex and Age in Fort Worth
With 11.8% poverty level for males and 14.9% for females among the residents of Fort Worth, 5 year old males and 6 to 11 year old females are the most vulnerable to poverty, with 1,386 males (21.4%) and 8,912 females (21.1%) in their respective age groups living below the poverty level.
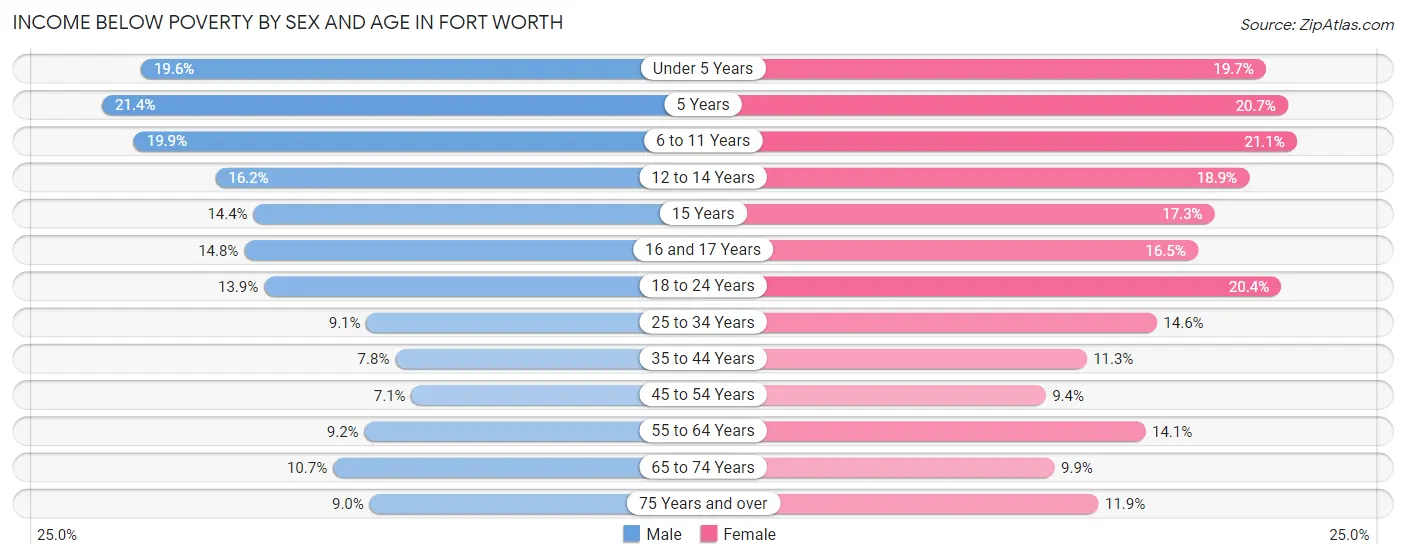
| Age Bracket | Male | Female |
| Under 5 Years | 6,815 (19.6%) | 6,227 (19.7%) |
| 5 Years | 1,386 (21.4%) | 1,395 (20.7%) |
| 6 to 11 Years | 8,199 (19.9%) | 8,912 (21.1%) |
| 12 to 14 Years | 3,406 (16.2%) | 3,806 (18.9%) |
| 15 Years | 856 (14.4%) | 1,225 (17.3%) |
| 16 and 17 Years | 2,130 (14.8%) | 2,190 (16.5%) |
| 18 to 24 Years | 5,868 (13.9%) | 9,019 (20.4%) |
| 25 to 34 Years | 6,499 (9.1%) | 11,145 (14.6%) |
| 35 to 44 Years | 5,135 (7.8%) | 7,391 (11.3%) |
| 45 to 54 Years | 3,910 (7.0%) | 5,142 (9.4%) |
| 55 to 64 Years | 4,356 (9.2%) | 6,789 (14.1%) |
| 65 to 74 Years | 2,755 (10.7%) | 3,086 (9.9%) |
| 75 Years and over | 1,232 (9.0%) | 2,449 (11.9%) |
| Total | 52,547 (11.8%) | 68,776 (14.9%) |
Income Above Poverty by Sex and Age in Fort Worth
According to the poverty statistics in Fort Worth, males aged 45 to 54 years and females aged 45 to 54 years are the age groups that are most secure financially, with 92.9% of males and 90.6% of females in these age groups living above the poverty line.
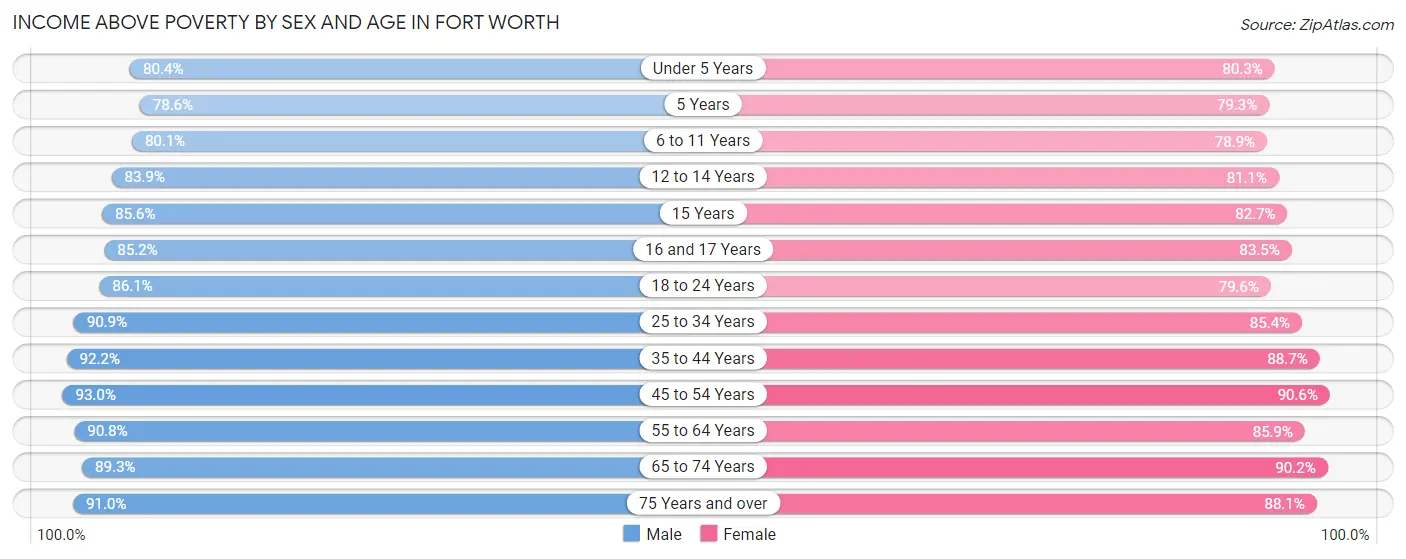
| Age Bracket | Male | Female |
| Under 5 Years | 27,951 (80.4%) | 25,442 (80.3%) |
| 5 Years | 5,090 (78.6%) | 5,347 (79.3%) |
| 6 to 11 Years | 32,939 (80.1%) | 33,333 (78.9%) |
| 12 to 14 Years | 17,687 (83.9%) | 16,346 (81.1%) |
| 15 Years | 5,097 (85.6%) | 5,858 (82.7%) |
| 16 and 17 Years | 12,252 (85.2%) | 11,076 (83.5%) |
| 18 to 24 Years | 36,383 (86.1%) | 35,235 (79.6%) |
| 25 to 34 Years | 64,584 (90.9%) | 65,203 (85.4%) |
| 35 to 44 Years | 60,722 (92.2%) | 57,768 (88.7%) |
| 45 to 54 Years | 51,522 (92.9%) | 49,321 (90.6%) |
| 55 to 64 Years | 42,841 (90.8%) | 41,475 (85.9%) |
| 65 to 74 Years | 23,016 (89.3%) | 28,236 (90.1%) |
| 75 Years and over | 12,471 (91.0%) | 18,153 (88.1%) |
| Total | 392,555 (88.2%) | 392,793 (85.1%) |
Income Below Poverty Among Married-Couple Families in Fort Worth
The poverty statistics for married-couple families in Fort Worth show that 5.0% or 7,543 of the total 150,757 families live below the poverty line. Families with 5 or more children have the highest poverty rate of 21.9%, comprising of 350 families. On the other hand, families with no children have the lowest poverty rate of 2.9%, which includes 2,148 families.
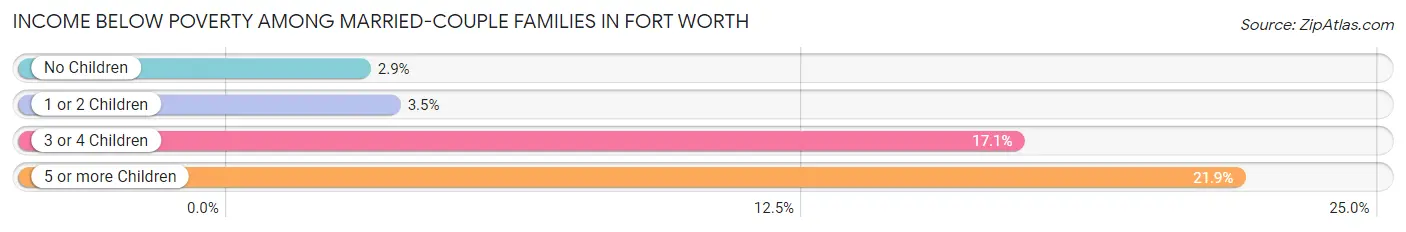
| Children | Above Poverty | Below Poverty |
| No Children | 72,050 (97.1%) | 2,148 (2.9%) |
| 1 or 2 Children | 55,311 (96.5%) | 2,030 (3.5%) |
| 3 or 4 Children | 14,606 (82.9%) | 3,015 (17.1%) |
| 5 or more Children | 1,247 (78.1%) | 350 (21.9%) |
| Total | 143,214 (95.0%) | 7,543 (5.0%) |
Income Below Poverty Among Single-Parent Households in Fort Worth
According to the poverty data in Fort Worth, 10.2% or 1,829 single-father households and 25.7% or 12,157 single-mother households are living below the poverty line. Among single-father households, those with 5 or more children have the highest poverty rate, with 257 households (62.2%) experiencing poverty. Likewise, among single-mother households, those with 5 or more children have the highest poverty rate, with 515 households (50.4%) falling below the poverty line.
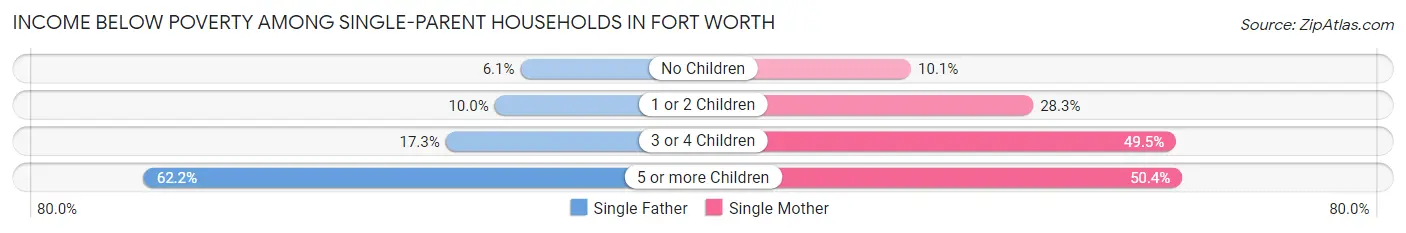
| Children | Single Father | Single Mother |
| No Children | 484 (6.1%) | 1,552 (10.1%) |
| 1 or 2 Children | 793 (10.0%) | 6,896 (28.2%) |
| 3 or 4 Children | 295 (17.3%) | 3,194 (49.5%) |
| 5 or more Children | 257 (62.2%) | 515 (50.4%) |
| Total | 1,829 (10.2%) | 12,157 (25.7%) |
Income Below Poverty Among Married-Couple vs Single-Parent Households in Fort Worth
The poverty data for Fort Worth shows that 7,543 of the married-couple family households (5.0%) and 13,986 of the single-parent households (21.4%) are living below the poverty level. Within the married-couple family households, those with 5 or more children have the highest poverty rate, with 350 households (21.9%) falling below the poverty line. Among the single-parent households, those with 5 or more children have the highest poverty rate, with 772 household (53.8%) living below poverty.
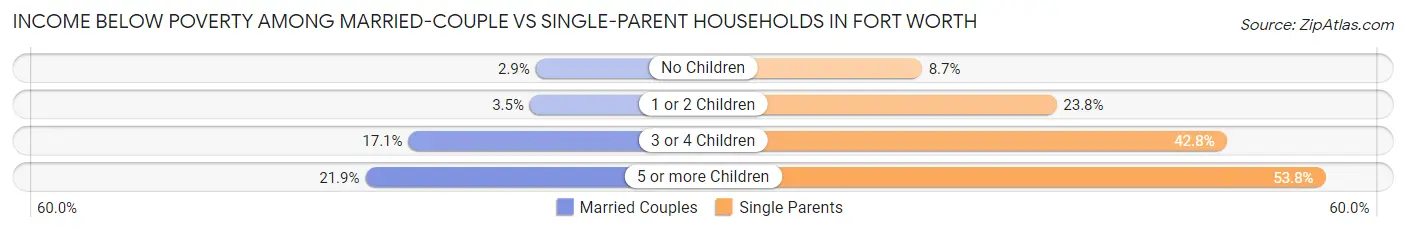
| Children | Married-Couple Families | Single-Parent Households |
| No Children | 2,148 (2.9%) | 2,036 (8.7%) |
| 1 or 2 Children | 2,030 (3.5%) | 7,689 (23.8%) |
| 3 or 4 Children | 3,015 (17.1%) | 3,489 (42.8%) |
| 5 or more Children | 350 (21.9%) | 772 (53.8%) |
| Total | 7,543 (5.0%) | 13,986 (21.4%) |
Race in Fort Worth
The most populous races in Fort Worth are White / Caucasian (479,402 | 51.8%), Hispanic or Latino (325,185 | 35.2%), and Black / African American (177,635 | 19.2%).
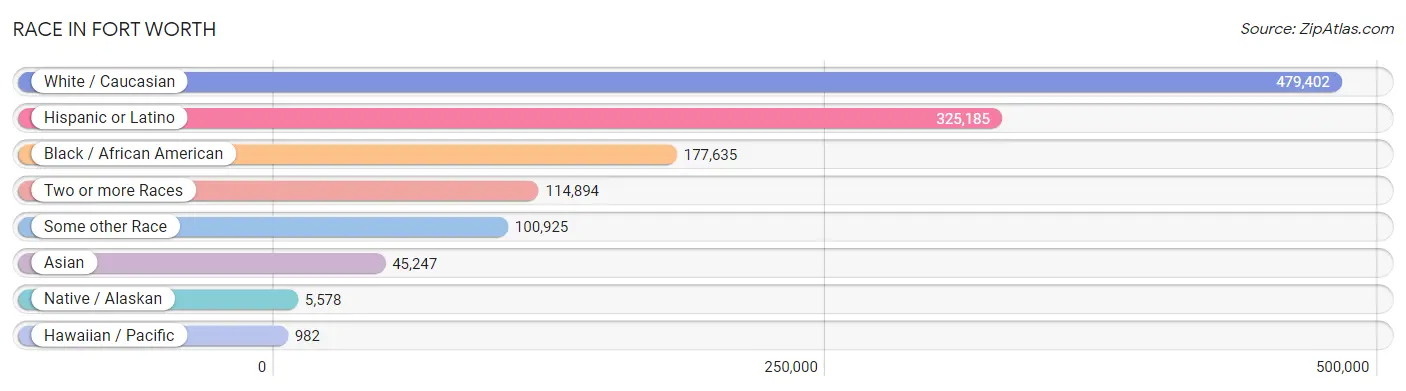
| Race | # Population | % Population |
| Asian | 45,247 | 4.9% |
| Black / African American | 177,635 | 19.2% |
| Hawaiian / Pacific | 982 | 0.1% |
| Hispanic or Latino | 325,185 | 35.2% |
| Native / Alaskan | 5,578 | 0.6% |
| White / Caucasian | 479,402 | 51.8% |
| Two or more Races | 114,894 | 12.4% |
| Some other Race | 100,925 | 10.9% |
| Total | 924,663 | 100.0% |
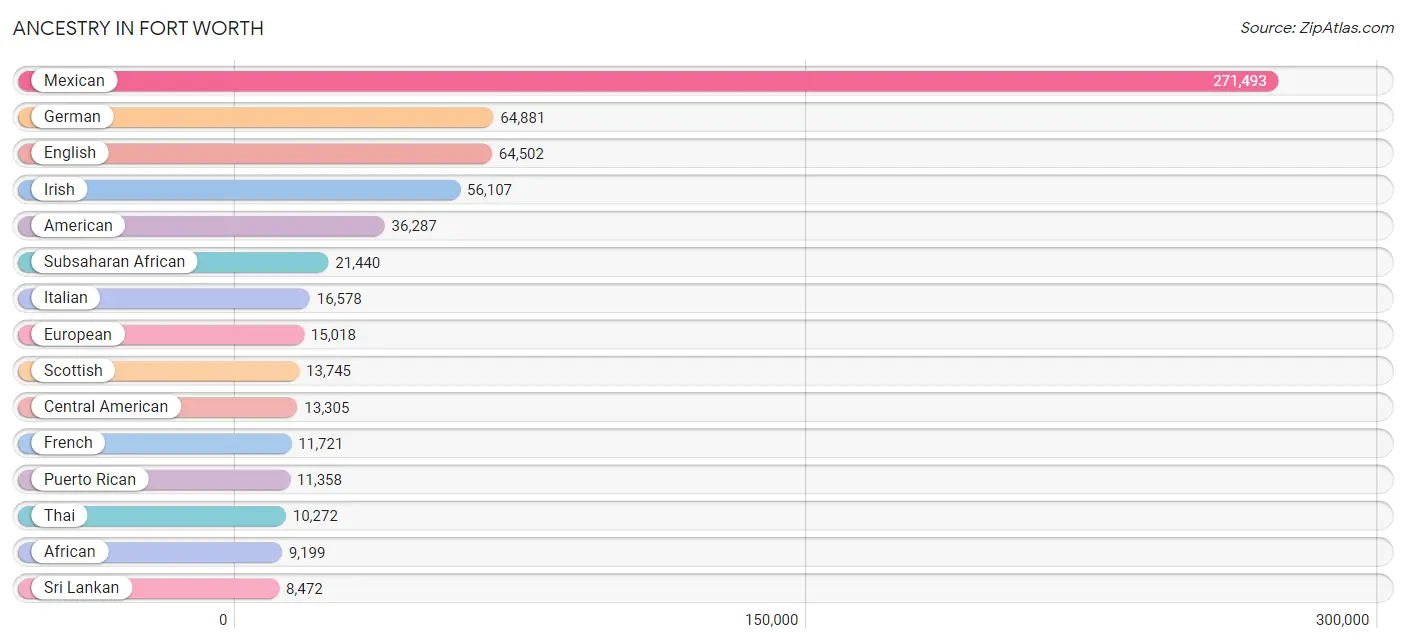
Ancestry in Fort Worth
The most populous ancestries reported in Fort Worth are Mexican (271,493 | 29.4%), German (64,881 | 7.0%), English (64,502 | 7.0%), Irish (56,107 | 6.1%), and American (36,287 | 3.9%), together accounting for 53.3% of all Fort Worth residents.
| Ancestry | # Population | % Population |
| Afghan | 1,294 | 0.1% |
| African | 9,199 | 1.0% |
| Alaska Native | 23 | 0.0% |
| Albanian | 467 | 0.1% |
| Aleut | 93 | 0.0% |
| Alsatian | 18 | 0.0% |
| American | 36,287 | 3.9% |
| Apache | 444 | 0.1% |
| Arab | 7,338 | 0.8% |
| Argentinean | 512 | 0.1% |
| Armenian | 311 | 0.0% |
| Assyrian / Chaldean / Syriac | 16 | 0.0% |
| Australian | 209 | 0.0% |
| Austrian | 856 | 0.1% |
| Bahamian | 52 | 0.0% |
| Bangladeshi | 619 | 0.1% |
| Barbadian | 104 | 0.0% |
| Basque | 115 | 0.0% |
| Belgian | 391 | 0.0% |
| Belizean | 76 | 0.0% |
| Bhutanese | 2,764 | 0.3% |
| Blackfeet | 695 | 0.1% |
| Bolivian | 32 | 0.0% |
| Brazilian | 722 | 0.1% |
| British | 5,247 | 0.6% |
| British West Indian | 239 | 0.0% |
| Bulgarian | 84 | 0.0% |
| Burmese | 4,201 | 0.4% |
| Cajun | 39 | 0.0% |
| Cambodian | 48 | 0.0% |
| Canadian | 729 | 0.1% |
| Celtic | 60 | 0.0% |
| Central American | 13,305 | 1.4% |
| Central American Indian | 961 | 0.1% |
| Cherokee | 3,177 | 0.3% |
| Cheyenne | 70 | 0.0% |
| Chickasaw | 356 | 0.0% |
| Chilean | 382 | 0.0% |
| Chippewa | 46 | 0.0% |
| Choctaw | 959 | 0.1% |
| Colombian | 2,505 | 0.3% |
| Comanche | 177 | 0.0% |
| Costa Rican | 400 | 0.0% |
| Cree | 29 | 0.0% |
| Creek | 269 | 0.0% |
| Croatian | 616 | 0.1% |
| Crow | 53 | 0.0% |
| Cuban | 3,995 | 0.4% |
| Cypriot | 19 | 0.0% |
| Czech | 4,155 | 0.4% |
| Czechoslovakian | 390 | 0.0% |
| Danish | 1,032 | 0.1% |
| Delaware | 11 | 0.0% |
| Dominican | 842 | 0.1% |
| Dutch | 5,677 | 0.6% |
| Dutch West Indian | 223 | 0.0% |
| Eastern European | 985 | 0.1% |
| Ecuadorian | 723 | 0.1% |
| Egyptian | 1,630 | 0.2% |
| English | 64,502 | 7.0% |
| Estonian | 10 | 0.0% |
| Ethiopian | 1,041 | 0.1% |
| European | 15,018 | 1.6% |
| Filipino | 355 | 0.0% |
| Finnish | 696 | 0.1% |
| French | 11,721 | 1.3% |
| French American Indian | 43 | 0.0% |
| French Canadian | 2,091 | 0.2% |
| German | 64,881 | 7.0% |
| German Russian | 67 | 0.0% |
| Ghanaian | 380 | 0.0% |
| Greek | 2,750 | 0.3% |
| Guamanian / Chamorro | 318 | 0.0% |
| Guatemalan | 2,398 | 0.3% |
| Guyanese | 115 | 0.0% |
| Haitian | 640 | 0.1% |
| Honduran | 4,365 | 0.5% |
| Hopi | 34 | 0.0% |
| Houma | 11 | 0.0% |
| Hungarian | 995 | 0.1% |
| Icelander | 57 | 0.0% |
| Indian (Asian) | 5,683 | 0.6% |
| Indonesian | 1,427 | 0.2% |
| Inupiat | 120 | 0.0% |
| Iranian | 450 | 0.1% |
| Iraqi | 996 | 0.1% |
| Irish | 56,107 | 6.1% |
| Iroquois | 34 | 0.0% |
| Israeli | 759 | 0.1% |
| Italian | 16,578 | 1.8% |
| Jamaican | 1,269 | 0.1% |
| Japanese | 590 | 0.1% |
| Jordanian | 190 | 0.0% |
| Kenyan | 1,419 | 0.2% |
| Kiowa | 29 | 0.0% |
| Korean | 7,399 | 0.8% |
| Laotian | 192 | 0.0% |
| Latvian | 118 | 0.0% |
| Lebanese | 1,442 | 0.2% |
| Liberian | 739 | 0.1% |
| Lithuanian | 472 | 0.1% |
| Lumbee | 10 | 0.0% |
| Luxembourger | 13 | 0.0% |
| Macedonian | 36 | 0.0% |
| Malaysian | 3,043 | 0.3% |
| Maltese | 13 | 0.0% |
| Mexican | 271,493 | 29.4% |
| Mexican American Indian | 1,918 | 0.2% |
| Mongolian | 218 | 0.0% |
| Moroccan | 115 | 0.0% |
| Native Hawaiian | 802 | 0.1% |
| Navajo | 299 | 0.0% |
| New Zealander | 28 | 0.0% |
| Nicaraguan | 733 | 0.1% |
| Nigerian | 3,169 | 0.3% |
| Northern European | 468 | 0.1% |
| Norwegian | 5,015 | 0.5% |
| Osage | 113 | 0.0% |
| Ottawa | 10 | 0.0% |
| Pakistani | 875 | 0.1% |
| Palestinian | 88 | 0.0% |
| Panamanian | 322 | 0.0% |
| Pennsylvania German | 91 | 0.0% |
| Peruvian | 1,174 | 0.1% |
| Pima | 2 | 0.0% |
| Polish | 7,969 | 0.9% |
| Portuguese | 1,589 | 0.2% |
| Potawatomi | 60 | 0.0% |
| Pueblo | 226 | 0.0% |
| Puerto Rican | 11,358 | 1.2% |
| Puget Sound Salish | 30 | 0.0% |
| Romanian | 286 | 0.0% |
| Russian | 1,911 | 0.2% |
| Salvadoran | 5,087 | 0.5% |
| Samoan | 717 | 0.1% |
| Scandinavian | 1,701 | 0.2% |
| Scotch-Irish | 6,356 | 0.7% |
| Scottish | 13,745 | 1.5% |
| Seminole | 38 | 0.0% |
| Senegalese | 96 | 0.0% |
| Serbian | 181 | 0.0% |
| Shoshone | 10 | 0.0% |
| Sioux | 330 | 0.0% |
| Slavic | 226 | 0.0% |
| Slovak | 415 | 0.0% |
| Slovene | 150 | 0.0% |
| Somali | 546 | 0.1% |
| South African | 475 | 0.1% |
| South American | 7,375 | 0.8% |
| South American Indian | 54 | 0.0% |
| Spaniard | 3,938 | 0.4% |
| Spanish | 2,249 | 0.2% |
| Spanish American | 7 | 0.0% |
| Spanish American Indian | 36 | 0.0% |
| Sri Lankan | 8,472 | 0.9% |
| Subsaharan African | 21,440 | 2.3% |
| Sudanese | 840 | 0.1% |
| Swedish | 4,004 | 0.4% |
| Swiss | 971 | 0.1% |
| Syrian | 168 | 0.0% |
| Thai | 10,272 | 1.1% |
| Tlingit-Haida | 49 | 0.0% |
| Tongan | 173 | 0.0% |
| Trinidadian and Tobagonian | 979 | 0.1% |
| Turkish | 257 | 0.0% |
| Ugandan | 53 | 0.0% |
| Ukrainian | 823 | 0.1% |
| Uruguayan | 67 | 0.0% |
| Ute | 6 | 0.0% |
| Venezuelan | 1,965 | 0.2% |
| Vietnamese | 208 | 0.0% |
| Welsh | 3,496 | 0.4% |
| West Indian | 215 | 0.0% |
| Yakama | 7 | 0.0% |
| Yaqui | 275 | 0.0% |
| Yugoslavian | 590 | 0.1% |
| Yup'ik | 13 | 0.0% |
| Zimbabwean | 452 | 0.1% | View All 178 Rows |
Immigrants in Fort Worth
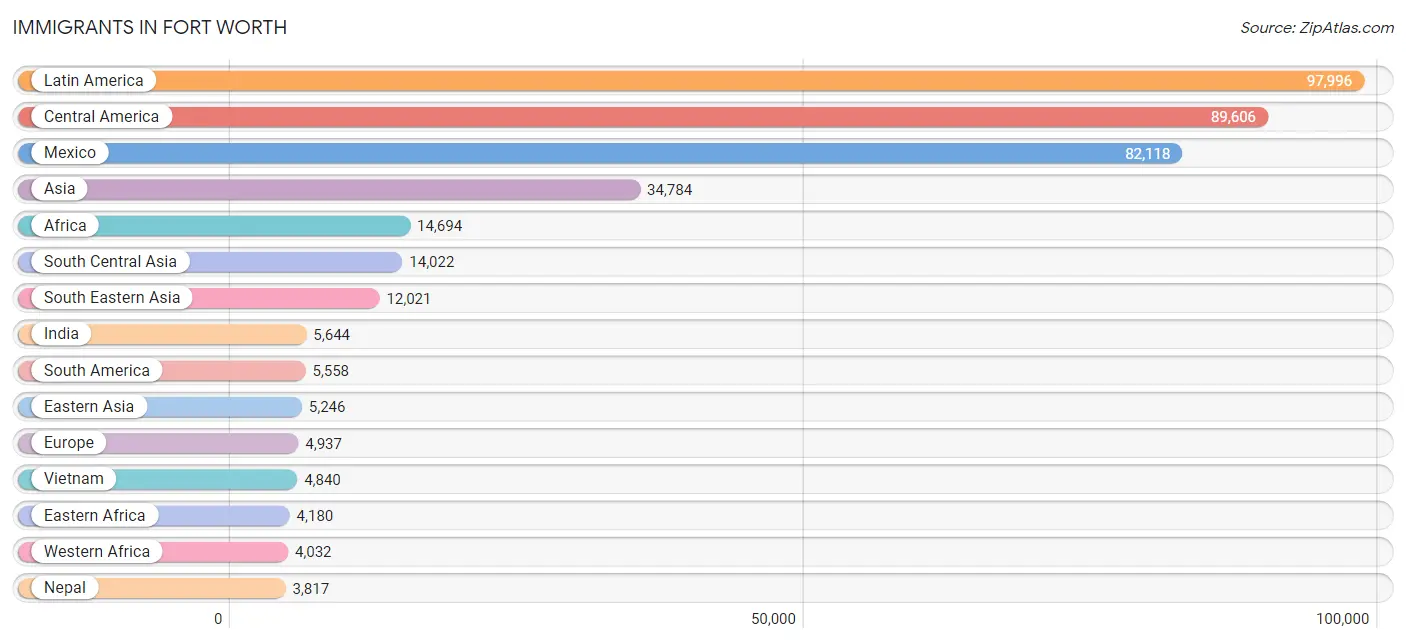
The most numerous immigrant groups reported in Fort Worth came from Latin America (97,996 | 10.6%), Central America (89,606 | 9.7%), Mexico (82,118 | 8.9%), Asia (34,784 | 3.8%), and Africa (14,694 | 1.6%), together accounting for 34.5% of all Fort Worth residents.
| Immigration Origin | # Population | % Population |
| Afghanistan | 1,252 | 0.1% |
| Africa | 14,694 | 1.6% |
| Albania | 171 | 0.0% |
| Argentina | 470 | 0.1% |
| Armenia | 8 | 0.0% |
| Asia | 34,784 | 3.8% |
| Australia | 142 | 0.0% |
| Austria | 89 | 0.0% |
| Bahamas | 25 | 0.0% |
| Bangladesh | 497 | 0.1% |
| Barbados | 70 | 0.0% |
| Belarus | 10 | 0.0% |
| Belize | 59 | 0.0% |
| Bolivia | 24 | 0.0% |
| Bosnia and Herzegovina | 464 | 0.1% |
| Brazil | 729 | 0.1% |
| Bulgaria | 10 | 0.0% |
| Cambodia | 230 | 0.0% |
| Cameroon | 258 | 0.0% |
| Canada | 1,134 | 0.1% |
| Caribbean | 2,832 | 0.3% |
| Central America | 89,606 | 9.7% |
| Chile | 191 | 0.0% |
| China | 2,111 | 0.2% |
| Colombia | 1,579 | 0.2% |
| Congo | 1,477 | 0.2% |
| Costa Rica | 228 | 0.0% |
| Croatia | 111 | 0.0% |
| Cuba | 1,536 | 0.2% |
| Czechoslovakia | 53 | 0.0% |
| Dominica | 18 | 0.0% |
| Dominican Republic | 270 | 0.0% |
| Eastern Africa | 4,180 | 0.4% |
| Eastern Asia | 5,246 | 0.6% |
| Eastern Europe | 1,597 | 0.2% |
| Ecuador | 291 | 0.0% |
| Egypt | 1,402 | 0.2% |
| El Salvador | 2,116 | 0.2% |
| England | 541 | 0.1% |
| Eritrea | 120 | 0.0% |
| Ethiopia | 779 | 0.1% |
| Europe | 4,937 | 0.5% |
| France | 469 | 0.1% |
| Germany | 440 | 0.1% |
| Ghana | 482 | 0.1% |
| Greece | 124 | 0.0% |
| Grenada | 50 | 0.0% |
| Guatemala | 1,423 | 0.2% |
| Guyana | 46 | 0.0% |
| Haiti | 185 | 0.0% |
| Honduras | 3,390 | 0.4% |
| Hong Kong | 180 | 0.0% |
| Hungary | 17 | 0.0% |
| India | 5,644 | 0.6% |
| Indonesia | 124 | 0.0% |
| Iran | 236 | 0.0% |
| Iraq | 1,325 | 0.1% |
| Ireland | 47 | 0.0% |
| Israel | 72 | 0.0% |
| Italy | 157 | 0.0% |
| Jamaica | 428 | 0.1% |
| Japan | 540 | 0.1% |
| Jordan | 489 | 0.1% |
| Kenya | 1,429 | 0.2% |
| Korea | 2,595 | 0.3% |
| Kuwait | 202 | 0.0% |
| Laos | 1,901 | 0.2% |
| Latin America | 97,996 | 10.6% |
| Latvia | 45 | 0.0% |
| Lebanon | 304 | 0.0% |
| Liberia | 645 | 0.1% |
| Lithuania | 19 | 0.0% |
| Malaysia | 325 | 0.0% |
| Mexico | 82,118 | 8.9% |
| Micronesia | 85 | 0.0% |
| Middle Africa | 2,699 | 0.3% |
| Moldova | 10 | 0.0% |
| Morocco | 81 | 0.0% |
| Nepal | 3,817 | 0.4% |
| Netherlands | 46 | 0.0% |
| Nicaragua | 156 | 0.0% |
| Nigeria | 2,721 | 0.3% |
| North Macedonia | 12 | 0.0% |
| Northern Africa | 2,402 | 0.3% |
| Northern Europe | 1,319 | 0.1% |
| Oceania | 366 | 0.0% |
| Pakistan | 1,629 | 0.2% |
| Panama | 116 | 0.0% |
| Peru | 604 | 0.1% |
| Philippines | 3,040 | 0.3% |
| Poland | 102 | 0.0% |
| Portugal | 144 | 0.0% |
| Romania | 55 | 0.0% |
| Russia | 190 | 0.0% |
| Saudi Arabia | 186 | 0.0% |
| Scotland | 183 | 0.0% |
| Senegal | 27 | 0.0% |
| Serbia | 69 | 0.0% |
| Sierra Leone | 12 | 0.0% |
| Singapore | 45 | 0.0% |
| Somalia | 229 | 0.0% |
| South Africa | 539 | 0.1% |
| South America | 5,558 | 0.6% |
| South Central Asia | 14,022 | 1.5% |
| South Eastern Asia | 12,021 | 1.3% |
| Southern Europe | 849 | 0.1% |
| Spain | 424 | 0.1% |
| Sri Lanka | 341 | 0.0% |
| Sudan | 521 | 0.1% |
| Sweden | 75 | 0.0% |
| Switzerland | 68 | 0.0% |
| Syria | 355 | 0.0% |
| Taiwan | 304 | 0.0% |
| Thailand | 567 | 0.1% |
| Trinidad and Tobago | 141 | 0.0% |
| Turkey | 193 | 0.0% |
| Uganda | 79 | 0.0% |
| Ukraine | 115 | 0.0% |
| Uruguay | 75 | 0.0% |
| Venezuela | 1,549 | 0.2% |
| Vietnam | 4,840 | 0.5% |
| Western Africa | 4,032 | 0.4% |
| Western Asia | 3,305 | 0.4% |
| Western Europe | 1,131 | 0.1% |
| Yemen | 13 | 0.0% |
| Zaire | 964 | 0.1% |
| Zimbabwe | 146 | 0.0% | View All 127 Rows |
Sex and Age in Fort Worth
Sex and Age in Fort Worth
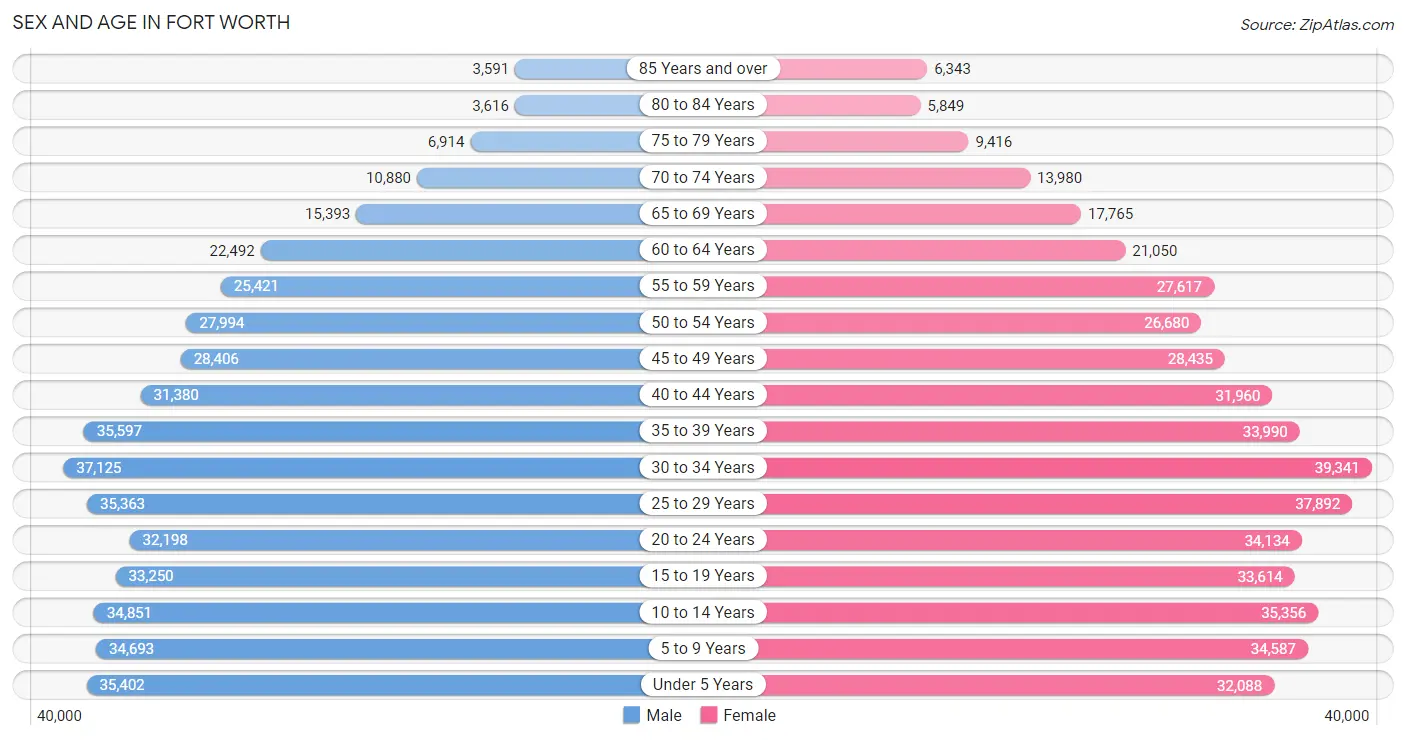
The most populous age groups in Fort Worth are 30 to 34 Years (37,125 | 8.2%) for men and 30 to 34 Years (39,341 | 8.4%) for women.
| Age Bracket | Male | Female |
| Under 5 Years | 35,402 (7.8%) | 32,088 (6.8%) |
| 5 to 9 Years | 34,693 (7.6%) | 34,587 (7.4%) |
| 10 to 14 Years | 34,851 (7.7%) | 35,356 (7.5%) |
| 15 to 19 Years | 33,250 (7.3%) | 33,614 (7.1%) |
| 20 to 24 Years | 32,198 (7.1%) | 34,134 (7.3%) |
| 25 to 29 Years | 35,363 (7.8%) | 37,892 (8.1%) |
| 30 to 34 Years | 37,125 (8.2%) | 39,341 (8.4%) |
| 35 to 39 Years | 35,597 (7.8%) | 33,990 (7.2%) |
| 40 to 44 Years | 31,380 (6.9%) | 31,960 (6.8%) |
| 45 to 49 Years | 28,406 (6.2%) | 28,435 (6.0%) |
| 50 to 54 Years | 27,994 (6.2%) | 26,680 (5.7%) |
| 55 to 59 Years | 25,421 (5.6%) | 27,617 (5.9%) |
| 60 to 64 Years | 22,492 (5.0%) | 21,050 (4.5%) |
| 65 to 69 Years | 15,393 (3.4%) | 17,765 (3.8%) |
| 70 to 74 Years | 10,880 (2.4%) | 13,980 (3.0%) |
| 75 to 79 Years | 6,914 (1.5%) | 9,416 (2.0%) |
| 80 to 84 Years | 3,616 (0.8%) | 5,849 (1.2%) |
| 85 Years and over | 3,591 (0.8%) | 6,343 (1.3%) |
| Total | 454,566 (100.0%) | 470,097 (100.0%) |
Families and Households in Fort Worth
Median Family Size in Fort Worth
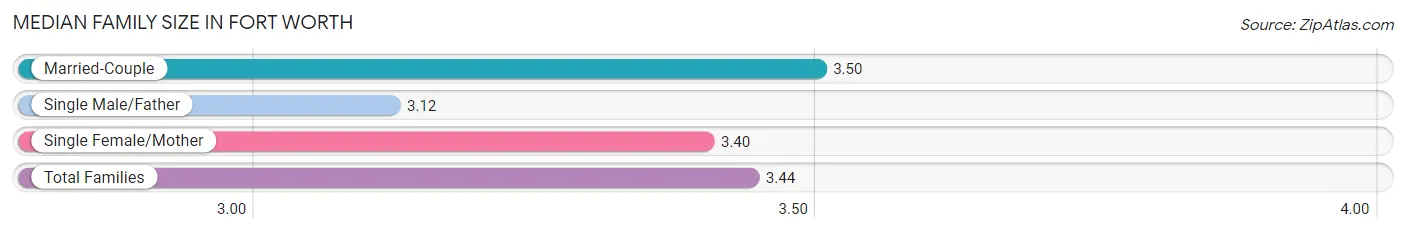
The median family size in Fort Worth is 3.44 persons per family, with married-couple families (150,757 | 69.8%) accounting for the largest median family size of 3.5 persons per family. On the other hand, single male/father families (17,958 | 8.3%) represent the smallest median family size with 3.12 persons per family.
| Family Type | # Families | Family Size |
| Married-Couple | 150,757 (69.8%) | 3.50 |
| Single Male/Father | 17,958 (8.3%) | 3.12 |
| Single Female/Mother | 47,321 (21.9%) | 3.40 |
| Total Families | 216,036 (100.0%) | 3.44 |
Median Household Size in Fort Worth
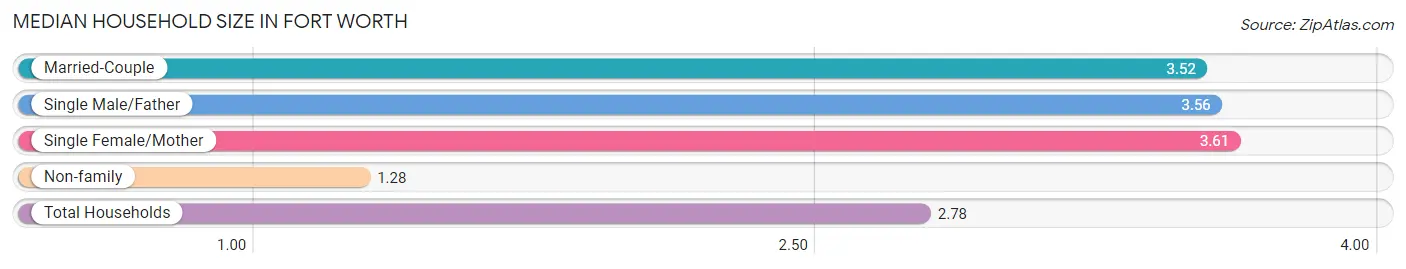
The median household size in Fort Worth is 2.78 persons per household, with single female/mother households (47,321 | 14.5%) accounting for the largest median household size of 3.61 persons per household. non-family households (110,612 | 33.9%) represent the smallest median household size with 1.28 persons per household.
| Household Type | # Households | Household Size |
| Married-Couple | 150,757 (46.2%) | 3.52 |
| Single Male/Father | 17,958 (5.5%) | 3.56 |
| Single Female/Mother | 47,321 (14.5%) | 3.61 |
| Non-family | 110,612 (33.9%) | 1.28 |
| Total Households | 326,648 (100.0%) | 2.78 |
Household Size by Marriage Status in Fort Worth
Out of a total of 326,648 households in Fort Worth, 216,036 (66.1%) are family households, while 110,612 (33.9%) are nonfamily households. The most numerous type of family households are 2-person households, comprising 78,504, and the most common type of nonfamily households are 1-person households, comprising 88,828.
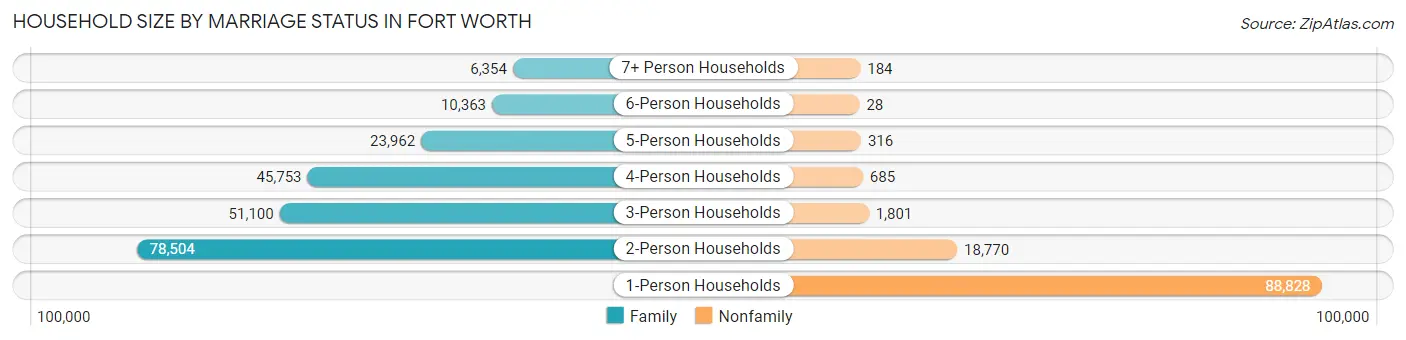
| Household Size | Family Households | Nonfamily Households |
| 1-Person Households | - | 88,828 (27.2%) |
| 2-Person Households | 78,504 (24.0%) | 18,770 (5.8%) |
| 3-Person Households | 51,100 (15.6%) | 1,801 (0.5%) |
| 4-Person Households | 45,753 (14.0%) | 685 (0.2%) |
| 5-Person Households | 23,962 (7.3%) | 316 (0.1%) |
| 6-Person Households | 10,363 (3.2%) | 28 (0.0%) |
| 7+ Person Households | 6,354 (1.9%) | 184 (0.1%) |
| Total | 216,036 (66.1%) | 110,612 (33.9%) |
Female Fertility in Fort Worth
Fertility by Age in Fort Worth
Average fertility rate in Fort Worth is 58.0 births per 1,000 women. Women in the age bracket of 20 to 34 years have the highest fertility rate with 92.0 births per 1,000 women. Women in the age bracket of 20 to 34 years acount for 72.5% of all women with births.
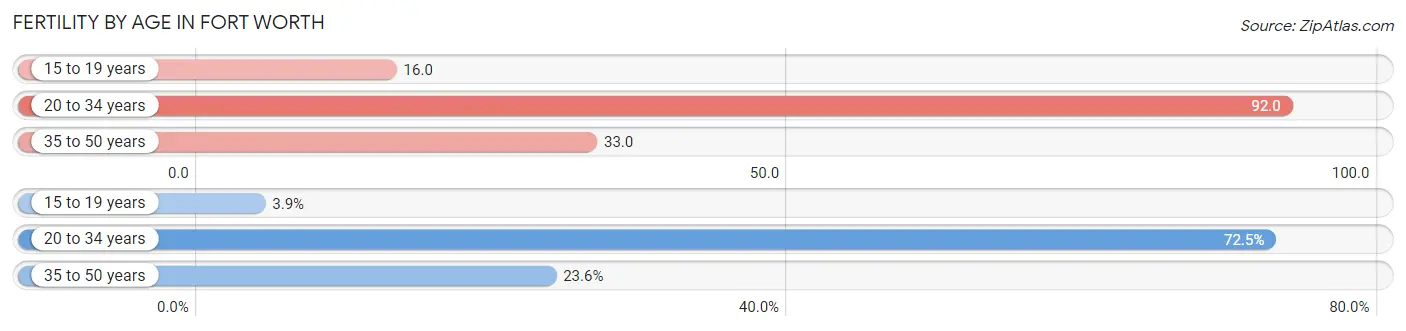
| Age Bracket | Women with Births | Births / 1,000 Women |
| 15 to 19 years | 551 (3.9%) | 16.0 |
| 20 to 34 years | 10,257 (72.5%) | 92.0 |
| 35 to 50 years | 3,344 (23.6%) | 33.0 |
| Total | 14,152 (100.0%) | 58.0 |
Fertility by Age by Marriage Status in Fort Worth
69.1% of women with births (14,152) in Fort Worth are married. The highest percentage of unmarried women with births falls into 15 to 19 years age bracket with 90.6% of them unmarried at the time of birth, while the lowest percentage of unmarried women with births belong to 35 to 50 years age bracket with 23.1% of them unmarried.
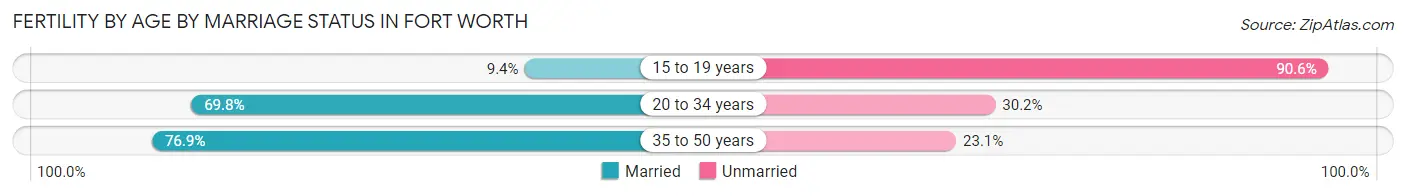
| Age Bracket | Married | Unmarried |
| 15 to 19 years | 52 (9.4%) | 499 (90.6%) |
| 20 to 34 years | 7,159 (69.8%) | 3,098 (30.2%) |
| 35 to 50 years | 2,572 (76.9%) | 772 (23.1%) |
| Total | 9,779 (69.1%) | 4,373 (30.9%) |
Fertility by Education in Fort Worth
Average fertility rate in Fort Worth is 58.0 births per 1,000 women. Women with the education attainment of graduate degree have the highest fertility rate of 67.0 births per 1,000 women, while women with the education attainment of less than high school have the lowest fertility at 43.0 births per 1,000 women. Women with the education attainment of college or associate's degree represent 26.5% of all women with births.
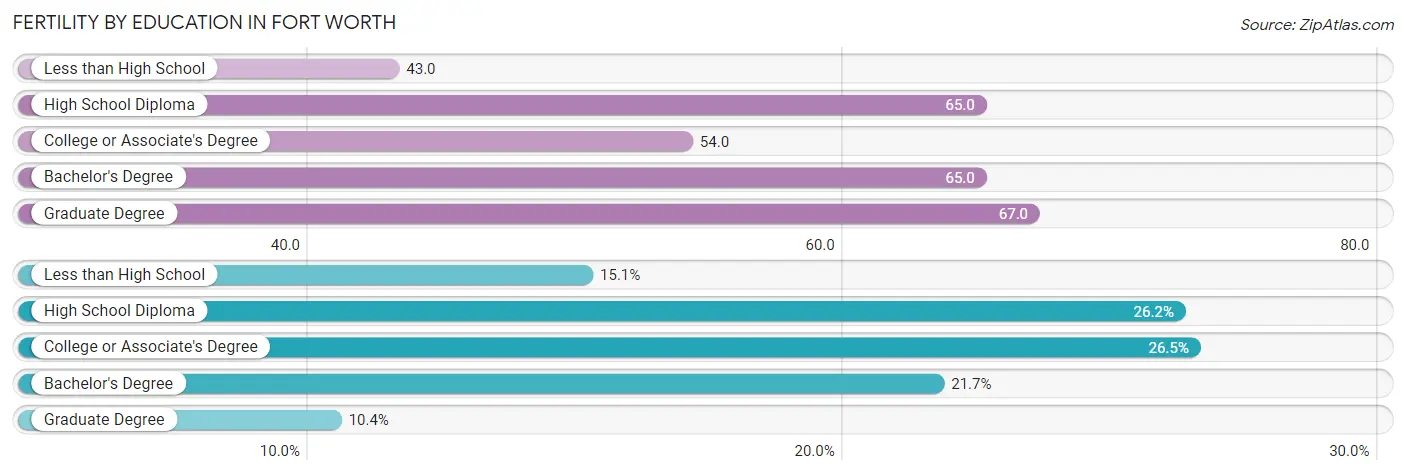
| Educational Attainment | Women with Births | Births / 1,000 Women |
| Less than High School | 2,141 (15.1%) | 43.0 |
| High School Diploma | 3,712 (26.2%) | 65.0 |
| College or Associate's Degree | 3,752 (26.5%) | 54.0 |
| Bachelor's Degree | 3,073 (21.7%) | 65.0 |
| Graduate Degree | 1,474 (10.4%) | 67.0 |
| Total | 14,152 (100.0%) | 58.0 |
Fertility by Education by Marriage Status in Fort Worth
30.9% of women with births in Fort Worth are unmarried. Women with the educational attainment of graduate degree are most likely to be married with 96.5% of them married at childbirth, while women with the educational attainment of high school diploma are least likely to be married with 42.5% of them unmarried at childbirth.
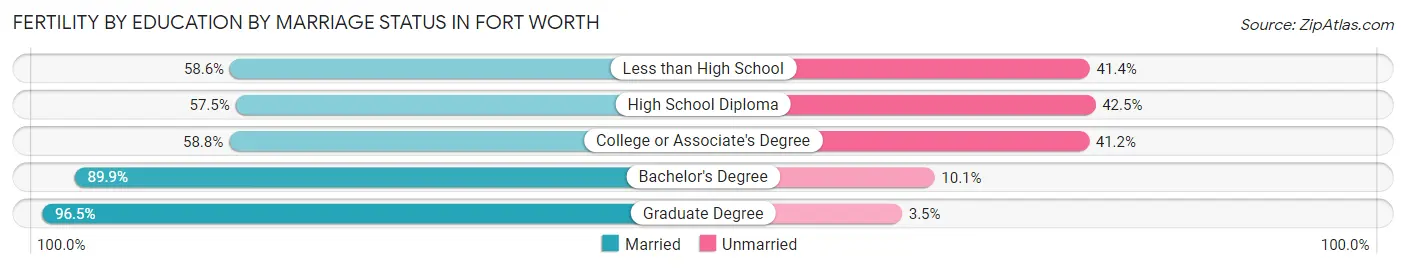
| Educational Attainment | Married | Unmarried |
| Less than High School | 1,255 (58.6%) | 886 (41.4%) |
| High School Diploma | 2,134 (57.5%) | 1,578 (42.5%) |
| College or Associate's Degree | 2,206 (58.8%) | 1,546 (41.2%) |
| Bachelor's Degree | 2,763 (89.9%) | 310 (10.1%) |
| Graduate Degree | 1,422 (96.5%) | 52 (3.5%) |
| Total | 9,779 (69.1%) | 4,373 (30.9%) |
Employment Characteristics in Fort Worth
Employment by Class of Employer in Fort Worth
Among the 448,123 employed individuals in Fort Worth, private company employees (326,176 | 72.8%), not-for-profit organizations (30,173 | 6.7%), and local government employees (29,901 | 6.7%) make up the most common classes of employment.
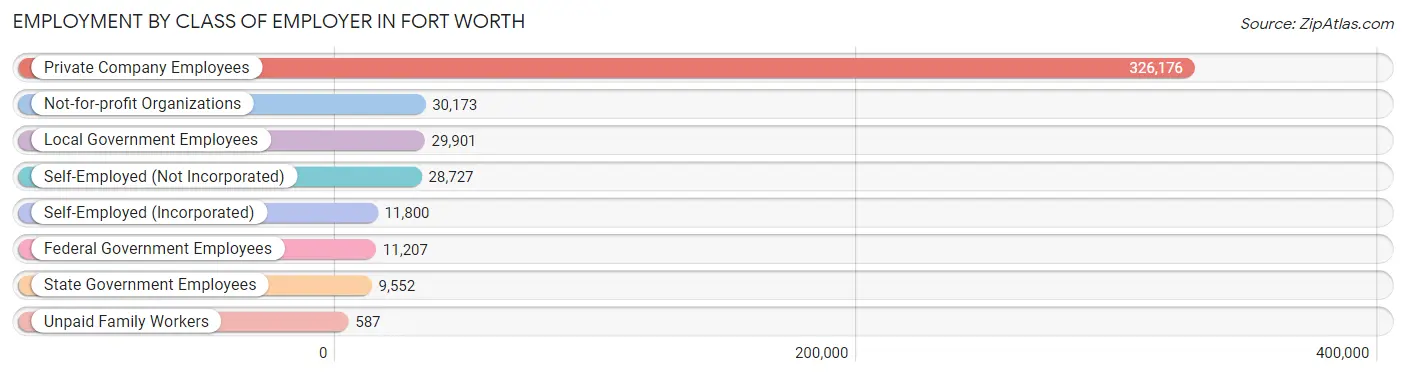
| Employer Class | # Employees | % Employees |
| Private Company Employees | 326,176 | 72.8% |
| Self-Employed (Incorporated) | 11,800 | 2.6% |
| Self-Employed (Not Incorporated) | 28,727 | 6.4% |
| Not-for-profit Organizations | 30,173 | 6.7% |
| Local Government Employees | 29,901 | 6.7% |
| State Government Employees | 9,552 | 2.1% |
| Federal Government Employees | 11,207 | 2.5% |
| Unpaid Family Workers | 587 | 0.1% |
| Total | 448,123 | 100.0% |
Employment Status by Age in Fort Worth
According to the labor force statistics for Fort Worth, out of the total population over 16 years of age (704,641), 68.4% or 481,974 individuals are in the labor force, with 5.3% or 25,545 of them unemployed. The age group with the highest labor force participation rate is 30 to 34 years, with 83.6% or 63,926 individuals in the labor force. Within the labor force, the 16 to 19 years age range has the highest percentage of unemployed individuals, with 14.8% or 2,979 of them being unemployed.
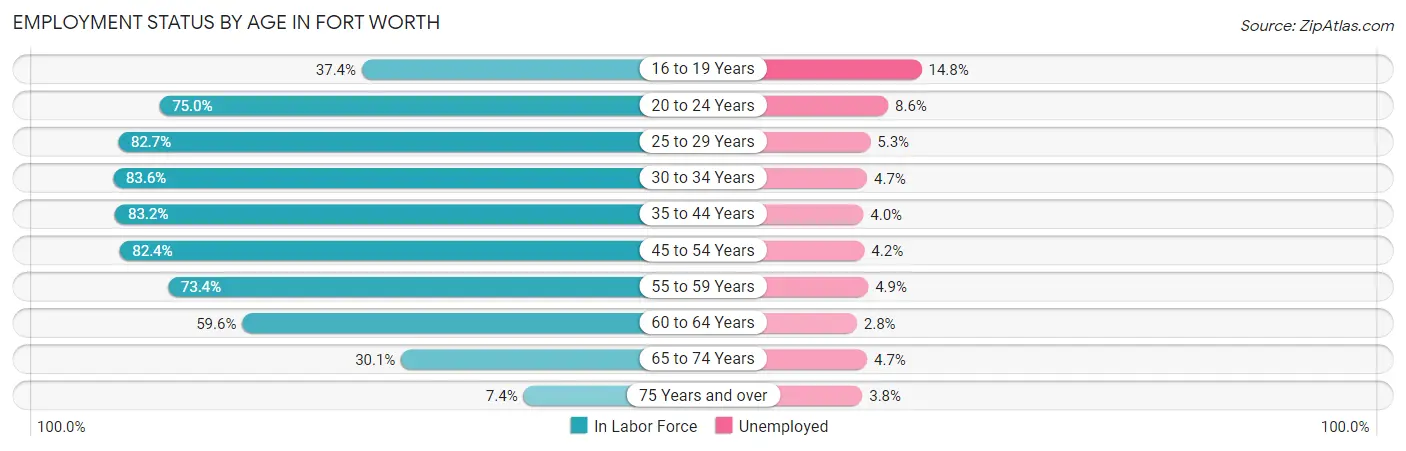
| Age Bracket | In Labor Force | Unemployed |
| 16 to 19 Years | 20,128 (37.4%) | 2,979 (14.8%) |
| 20 to 24 Years | 49,749 (75.0%) | 4,278 (8.6%) |
| 25 to 29 Years | 60,582 (82.7%) | 3,211 (5.3%) |
| 30 to 34 Years | 63,926 (83.6%) | 3,005 (4.7%) |
| 35 to 44 Years | 110,595 (83.2%) | 4,424 (4.0%) |
| 45 to 54 Years | 91,888 (82.4%) | 3,859 (4.2%) |
| 55 to 59 Years | 38,930 (73.4%) | 1,908 (4.9%) |
| 60 to 64 Years | 25,951 (59.6%) | 727 (2.8%) |
| 65 to 74 Years | 17,463 (30.1%) | 821 (4.7%) |
| 75 Years and over | 2,644 (7.4%) | 100 (3.8%) |
| Total | 481,974 (68.4%) | 25,545 (5.3%) |
Employment Status by Educational Attainment in Fort Worth
According to labor force statistics for Fort Worth, 79.8% of individuals (391,613) out of the total population between 25 and 64 years of age (490,743) are in the labor force, with 4.4% or 17,231 of them being unemployed. The group with the highest labor force participation rate are those with the educational attainment of bachelor's degree or higher, with 87.3% or 135,071 individuals in the labor force. Within the labor force, individuals with high school diploma education have the highest percentage of unemployment, with 6.1% or 5,655 of them being unemployed.
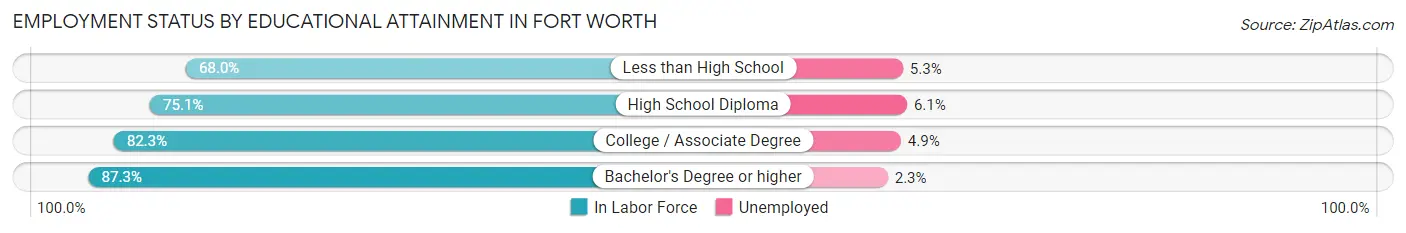
| Educational Attainment | In Labor Force | Unemployed |
| Less than High School | 51,497 (68.0%) | 4,014 (5.3%) |
| High School Diploma | 92,697 (75.1%) | 7,529 (6.1%) |
| College / Associate Degree | 112,637 (82.3%) | 6,706 (4.9%) |
| Bachelor's Degree or higher | 135,071 (87.3%) | 3,559 (2.3%) |
| Total | 391,613 (79.8%) | 21,593 (4.4%) |
Employment Occupations by Sex in Fort Worth
Management, Business, Science and Arts Occupations
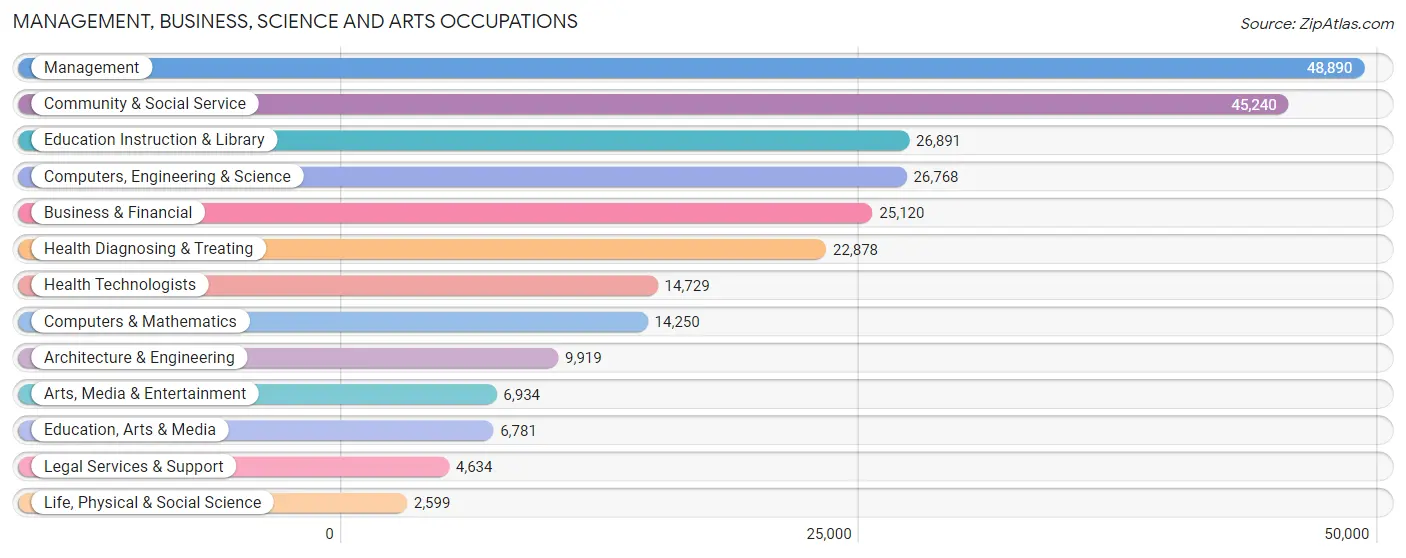
The most common Management, Business, Science and Arts occupations in Fort Worth are Management (48,890 | 10.7%), Community & Social Service (45,240 | 9.9%), Education Instruction & Library (26,891 | 5.9%), Computers, Engineering & Science (26,768 | 5.9%), and Business & Financial (25,120 | 5.5%).
Management, Business, Science and Arts Occupations by Sex
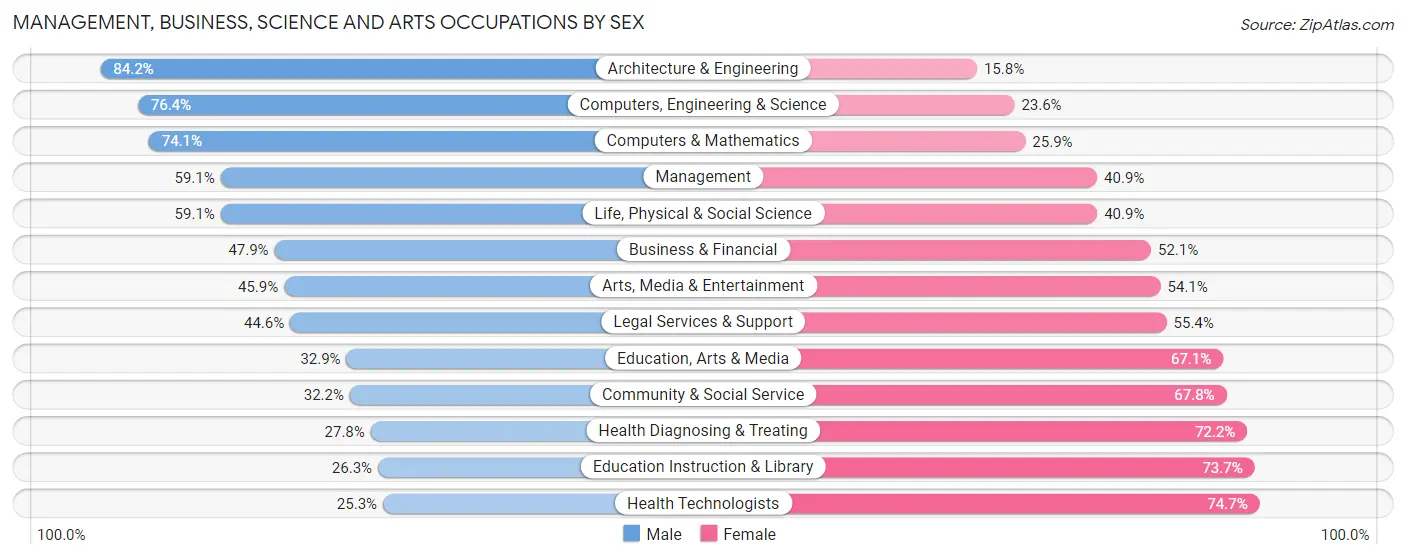
Within the Management, Business, Science and Arts occupations in Fort Worth, the most male-oriented occupations are Architecture & Engineering (84.2%), Computers, Engineering & Science (76.4%), and Computers & Mathematics (74.1%), while the most female-oriented occupations are Health Technologists (74.7%), Education Instruction & Library (73.7%), and Health Diagnosing & Treating (72.2%).
| Occupation | Male | Female |
| Management | 28,903 (59.1%) | 19,987 (40.9%) |
| Business & Financial | 12,028 (47.9%) | 13,092 (52.1%) |
| Computers, Engineering & Science | 20,443 (76.4%) | 6,325 (23.6%) |
| Computers & Mathematics | 10,557 (74.1%) | 3,693 (25.9%) |
| Architecture & Engineering | 8,350 (84.2%) | 1,569 (15.8%) |
| Life, Physical & Social Science | 1,536 (59.1%) | 1,063 (40.9%) |
| Community & Social Service | 14,549 (32.2%) | 30,691 (67.8%) |
| Education, Arts & Media | 2,228 (32.9%) | 4,553 (67.1%) |
| Legal Services & Support | 2,068 (44.6%) | 2,566 (55.4%) |
| Education Instruction & Library | 7,072 (26.3%) | 19,819 (73.7%) |
| Arts, Media & Entertainment | 3,181 (45.9%) | 3,753 (54.1%) |
| Health Diagnosing & Treating | 6,365 (27.8%) | 16,513 (72.2%) |
| Health Technologists | 3,720 (25.3%) | 11,009 (74.7%) |
| Total (Category) | 82,288 (48.7%) | 86,608 (51.3%) |
| Total (Overall) | 247,384 (54.3%) | 207,798 (45.7%) |
Services Occupations
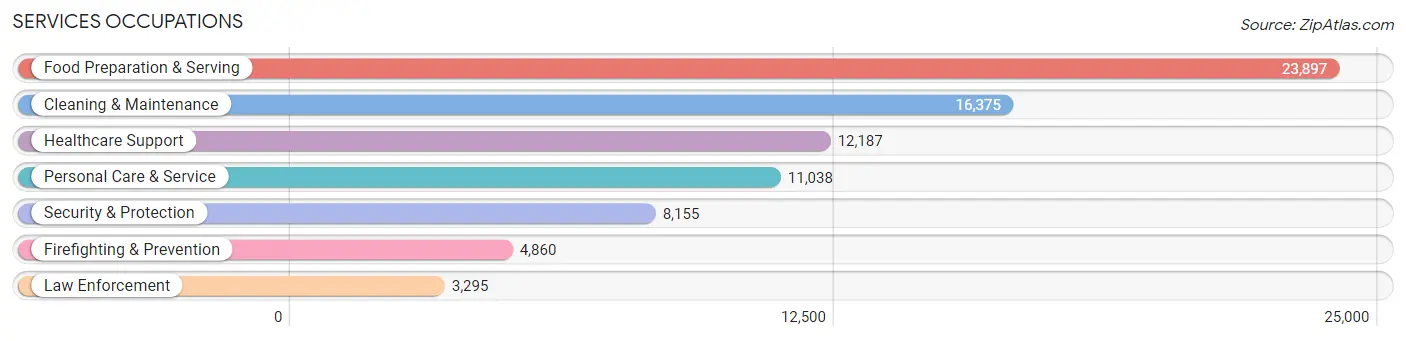
The most common Services occupations in Fort Worth are Food Preparation & Serving (23,897 | 5.2%), Cleaning & Maintenance (16,375 | 3.6%), Healthcare Support (12,187 | 2.7%), Personal Care & Service (11,038 | 2.4%), and Security & Protection (8,155 | 1.8%).
Services Occupations by Sex
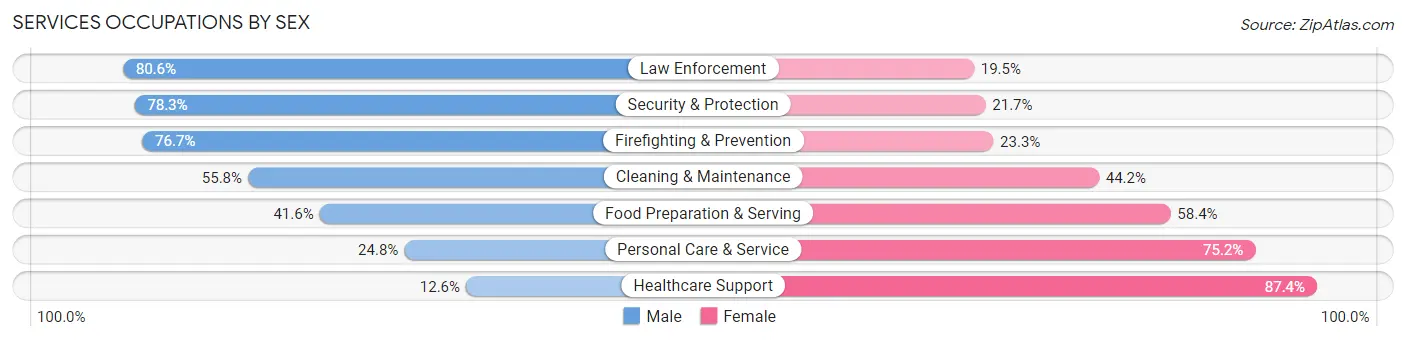
Within the Services occupations in Fort Worth, the most male-oriented occupations are Law Enforcement (80.5%), Security & Protection (78.3%), and Firefighting & Prevention (76.7%), while the most female-oriented occupations are Healthcare Support (87.4%), Personal Care & Service (75.2%), and Food Preparation & Serving (58.4%).
| Occupation | Male | Female |
| Healthcare Support | 1,538 (12.6%) | 10,649 (87.4%) |
| Security & Protection | 6,382 (78.3%) | 1,773 (21.7%) |
| Firefighting & Prevention | 3,728 (76.7%) | 1,132 (23.3%) |
| Law Enforcement | 2,654 (80.5%) | 641 (19.5%) |
| Food Preparation & Serving | 9,944 (41.6%) | 13,953 (58.4%) |
| Cleaning & Maintenance | 9,136 (55.8%) | 7,239 (44.2%) |
| Personal Care & Service | 2,742 (24.8%) | 8,296 (75.2%) |
| Total (Category) | 29,742 (41.5%) | 41,910 (58.5%) |
| Total (Overall) | 247,384 (54.3%) | 207,798 (45.7%) |
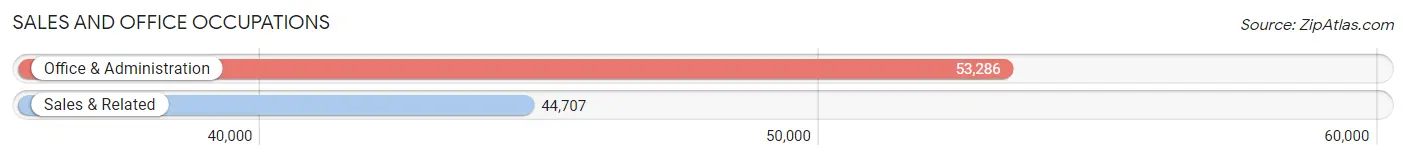
Sales and Office Occupations
The most common Sales and Office occupations in Fort Worth are Office & Administration (53,286 | 11.7%), and Sales & Related (44,707 | 9.8%).
Sales and Office Occupations by Sex
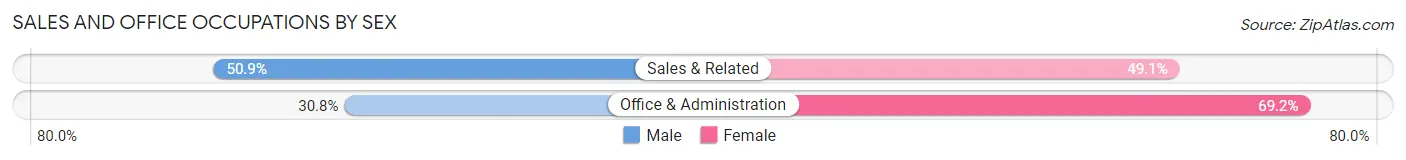
| Occupation | Male | Female |
| Sales & Related | 22,768 (50.9%) | 21,939 (49.1%) |
| Office & Administration | 16,424 (30.8%) | 36,862 (69.2%) |
| Total (Category) | 39,192 (40.0%) | 58,801 (60.0%) |
| Total (Overall) | 247,384 (54.3%) | 207,798 (45.7%) |
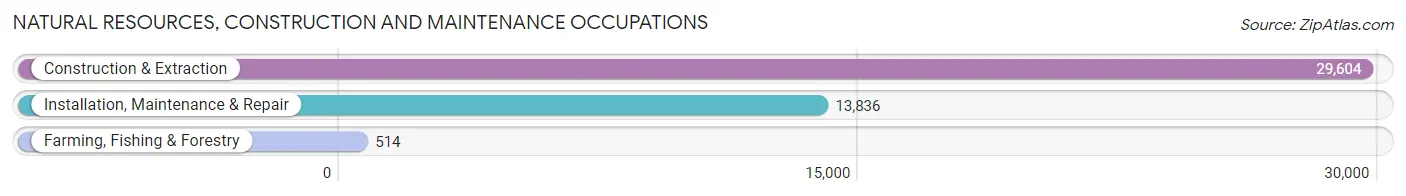
Natural Resources, Construction and Maintenance Occupations
The most common Natural Resources, Construction and Maintenance occupations in Fort Worth are Construction & Extraction (29,604 | 6.5%), Installation, Maintenance & Repair (13,836 | 3.0%), and Farming, Fishing & Forestry (514 | 0.1%).
Natural Resources, Construction and Maintenance Occupations by Sex
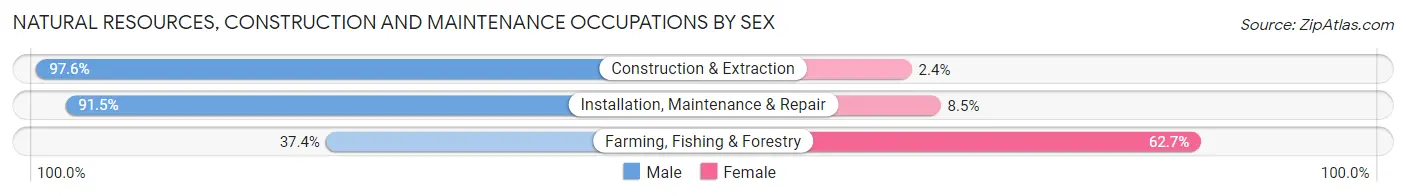
| Occupation | Male | Female |
| Farming, Fishing & Forestry | 192 (37.3%) | 322 (62.6%) |
| Construction & Extraction | 28,881 (97.6%) | 723 (2.4%) |
| Installation, Maintenance & Repair | 12,663 (91.5%) | 1,173 (8.5%) |
| Total (Category) | 41,736 (95.0%) | 2,218 (5.1%) |
| Total (Overall) | 247,384 (54.3%) | 207,798 (45.7%) |
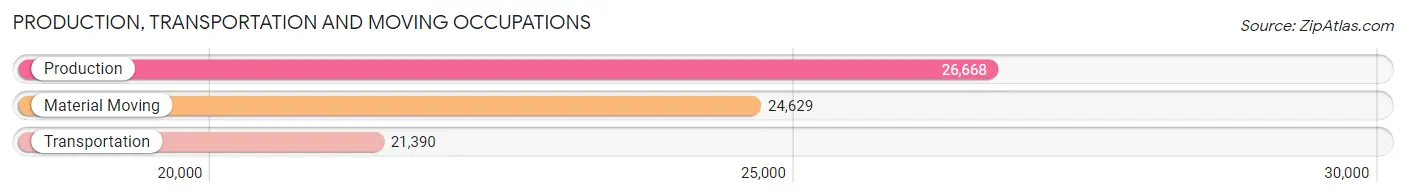
Production, Transportation and Moving Occupations
The most common Production, Transportation and Moving occupations in Fort Worth are Production (26,668 | 5.9%), Material Moving (24,629 | 5.4%), and Transportation (21,390 | 4.7%).
Production, Transportation and Moving Occupations by Sex
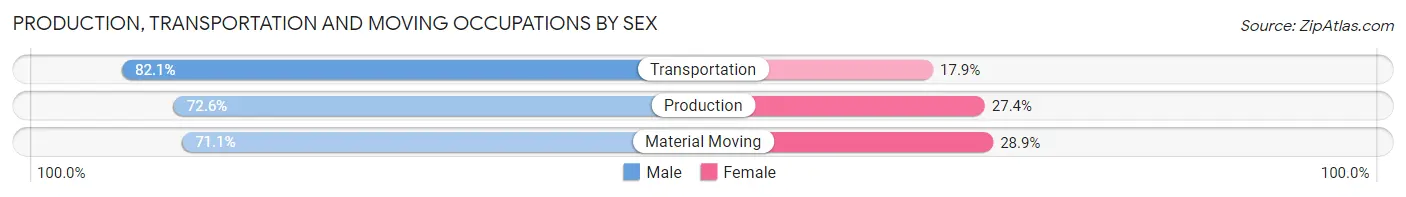
| Occupation | Male | Female |
| Production | 19,360 (72.6%) | 7,308 (27.4%) |
| Transportation | 17,562 (82.1%) | 3,828 (17.9%) |
| Material Moving | 17,504 (71.1%) | 7,125 (28.9%) |
| Total (Category) | 54,426 (74.9%) | 18,261 (25.1%) |
| Total (Overall) | 247,384 (54.3%) | 207,798 (45.7%) |
Employment Industries by Sex in Fort Worth
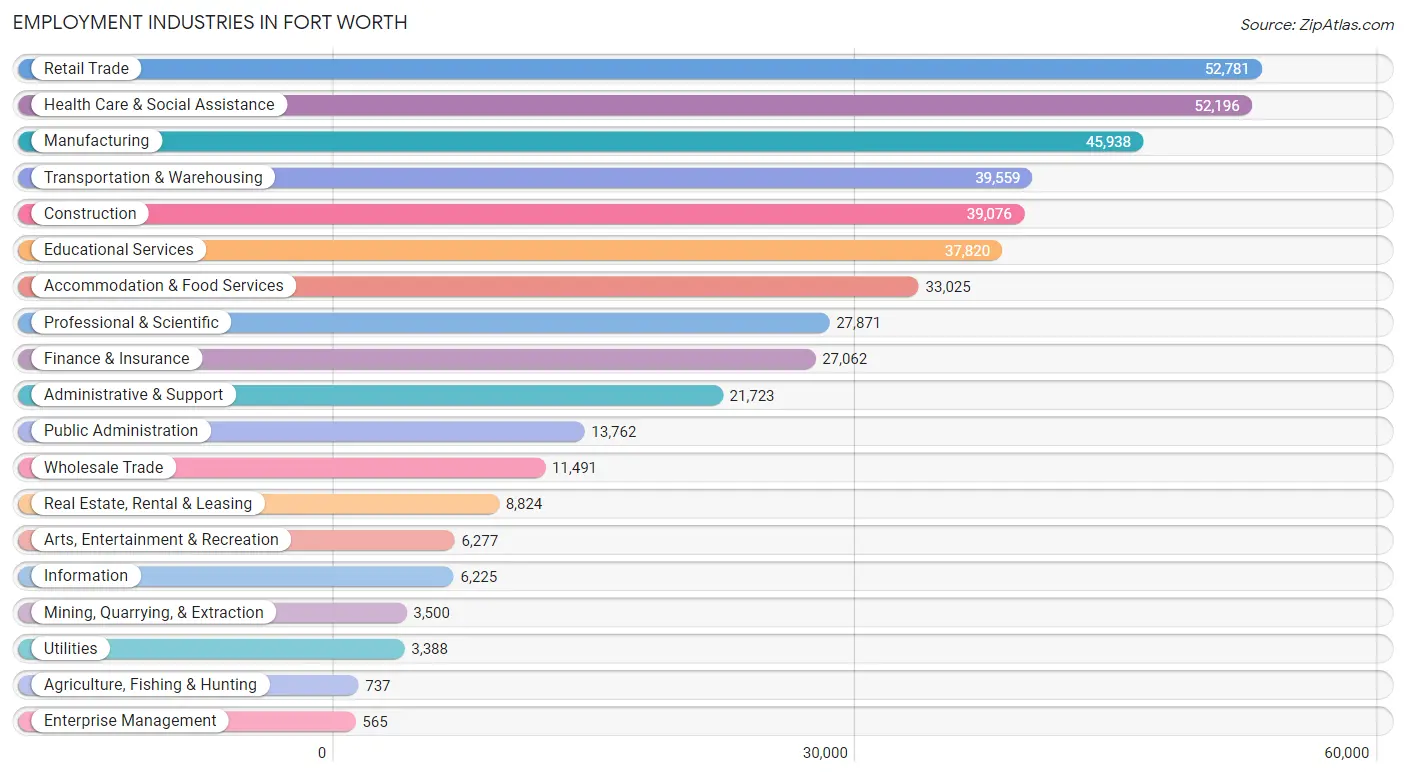
Employment Industries in Fort Worth
The major employment industries in Fort Worth include Retail Trade (52,781 | 11.6%), Health Care & Social Assistance (52,196 | 11.5%), Manufacturing (45,938 | 10.1%), Transportation & Warehousing (39,559 | 8.7%), and Construction (39,076 | 8.6%).
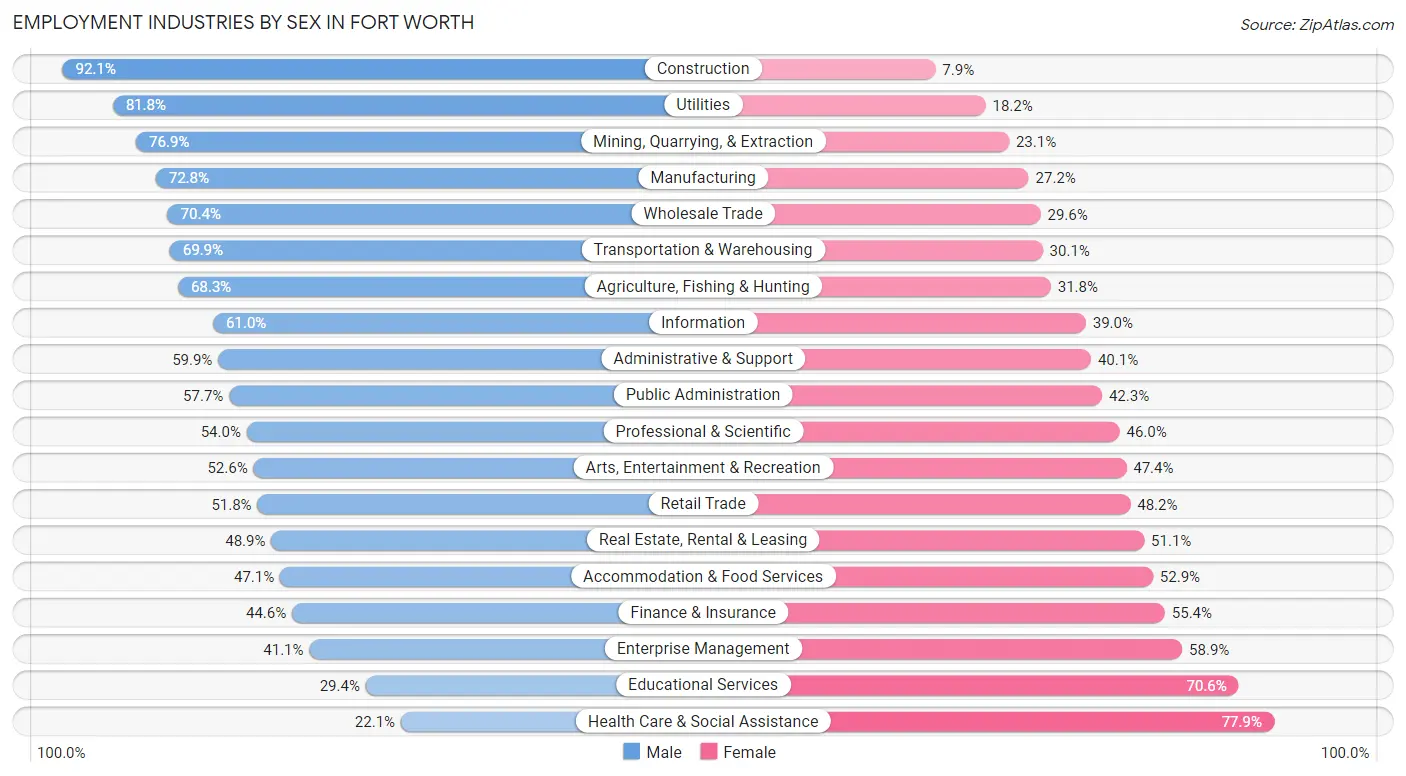
Employment Industries by Sex in Fort Worth
The Fort Worth industries that see more men than women are Construction (92.1%), Utilities (81.8%), and Mining, Quarrying, & Extraction (76.9%), whereas the industries that tend to have a higher number of women are Health Care & Social Assistance (77.9%), Educational Services (70.6%), and Enterprise Management (58.9%).
| Industry | Male | Female |
| Agriculture, Fishing & Hunting | 503 (68.2%) | 234 (31.8%) |
| Mining, Quarrying, & Extraction | 2,692 (76.9%) | 808 (23.1%) |
| Construction | 36,005 (92.1%) | 3,071 (7.9%) |
| Manufacturing | 33,463 (72.8%) | 12,475 (27.2%) |
| Wholesale Trade | 8,087 (70.4%) | 3,404 (29.6%) |
| Retail Trade | 27,338 (51.8%) | 25,443 (48.2%) |
| Transportation & Warehousing | 27,667 (69.9%) | 11,892 (30.1%) |
| Utilities | 2,770 (81.8%) | 618 (18.2%) |
| Information | 3,798 (61.0%) | 2,427 (39.0%) |
| Finance & Insurance | 12,080 (44.6%) | 14,982 (55.4%) |
| Real Estate, Rental & Leasing | 4,318 (48.9%) | 4,506 (51.1%) |
| Professional & Scientific | 15,056 (54.0%) | 12,815 (46.0%) |
| Enterprise Management | 232 (41.1%) | 333 (58.9%) |
| Administrative & Support | 13,019 (59.9%) | 8,704 (40.1%) |
| Educational Services | 11,115 (29.4%) | 26,705 (70.6%) |
| Health Care & Social Assistance | 11,541 (22.1%) | 40,655 (77.9%) |
| Arts, Entertainment & Recreation | 3,303 (52.6%) | 2,974 (47.4%) |
| Accommodation & Food Services | 15,562 (47.1%) | 17,463 (52.9%) |
| Public Administration | 7,935 (57.7%) | 5,827 (42.3%) |
| Total | 247,384 (54.3%) | 207,798 (45.7%) |
Education in Fort Worth
School Enrollment in Fort Worth
The most common levels of schooling among the 254,976 students in Fort Worth are middle school (56,079 | 22.0%), high school (54,421 | 21.3%), and elementary school (53,998 | 21.2%).
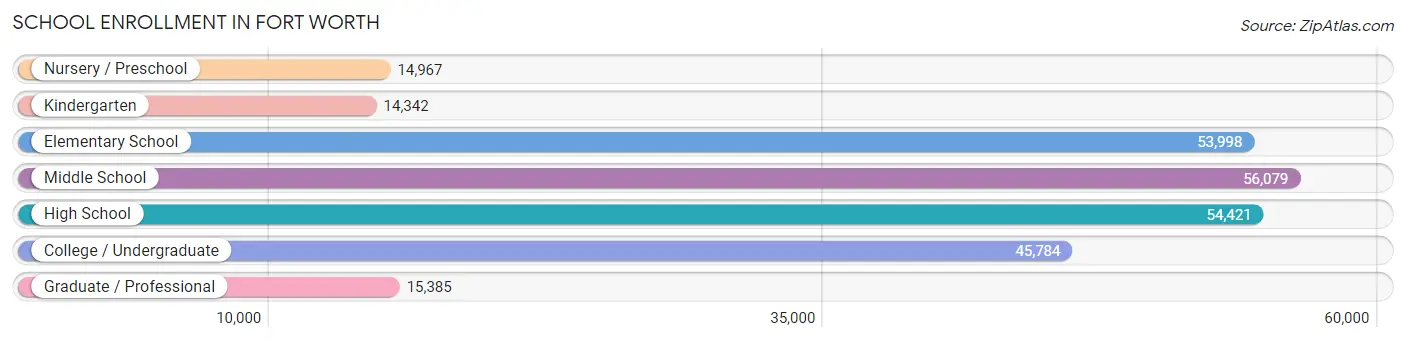
| School Level | # Students | % Students |
| Nursery / Preschool | 14,967 | 5.9% |
| Kindergarten | 14,342 | 5.6% |
| Elementary School | 53,998 | 21.2% |
| Middle School | 56,079 | 22.0% |
| High School | 54,421 | 21.3% |
| College / Undergraduate | 45,784 | 18.0% |
| Graduate / Professional | 15,385 | 6.0% |
| Total | 254,976 | 100.0% |
School Enrollment by Age by Funding Source in Fort Worth
Out of a total of 254,976 students who are enrolled in schools in Fort Worth, 39,011 (15.3%) attend a private institution, while the remaining 215,965 (84.7%) are enrolled in public schools. The age group of 3 to 4 year olds has the highest likelihood of being enrolled in private schools, with 4,895 (42.4% in the age bracket) enrolled. Conversely, the age group of 15 to 17 year olds has the lowest likelihood of being enrolled in a private school, with 36,417 (92.4% in the age bracket) attending a public institution.
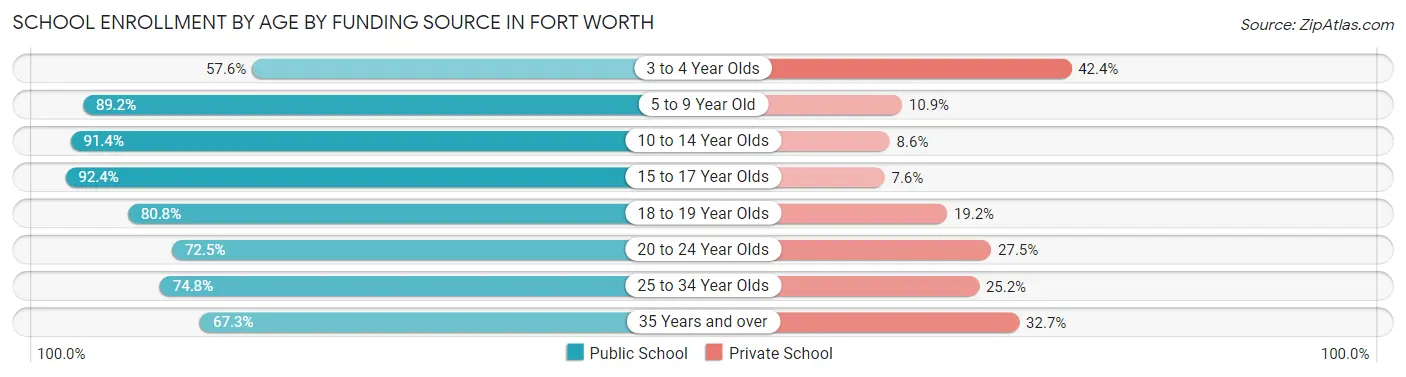
| Age Bracket | Public School | Private School |
| 3 to 4 Year Olds | 6,656 (57.6%) | 4,895 (42.4%) |
| 5 to 9 Year Old | 58,505 (89.1%) | 7,123 (10.8%) |
| 10 to 14 Year Olds | 62,735 (91.4%) | 5,881 (8.6%) |
| 15 to 17 Year Olds | 36,417 (92.4%) | 2,998 (7.6%) |
| 18 to 19 Year Olds | 14,534 (80.8%) | 3,463 (19.2%) |
| 20 to 24 Year Olds | 16,451 (72.5%) | 6,226 (27.5%) |
| 25 to 34 Year Olds | 11,976 (74.8%) | 4,034 (25.2%) |
| 35 Years and over | 8,805 (67.3%) | 4,277 (32.7%) |
| Total | 215,965 (84.7%) | 39,011 (15.3%) |
Educational Attainment by Field of Study in Fort Worth
Business (46,861 | 24.1%), education (19,433 | 10.0%), science & technology (19,178 | 9.9%), engineering (15,052 | 7.7%), and arts & humanities (13,353 | 6.9%) are the most common fields of study among 194,597 individuals in Fort Worth who have obtained a bachelor's degree or higher.
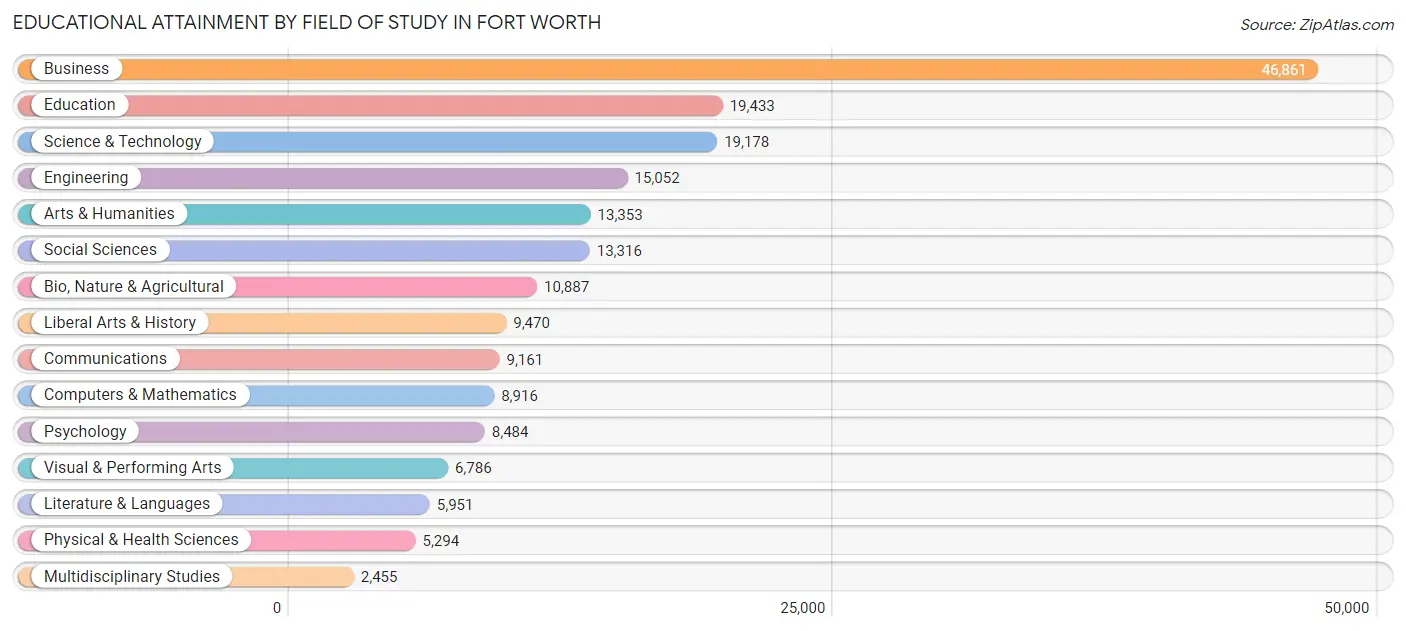
| Field of Study | # Graduates | % Graduates |
| Computers & Mathematics | 8,916 | 4.6% |
| Bio, Nature & Agricultural | 10,887 | 5.6% |
| Physical & Health Sciences | 5,294 | 2.7% |
| Psychology | 8,484 | 4.4% |
| Social Sciences | 13,316 | 6.8% |
| Engineering | 15,052 | 7.7% |
| Multidisciplinary Studies | 2,455 | 1.3% |
| Science & Technology | 19,178 | 9.9% |
| Business | 46,861 | 24.1% |
| Education | 19,433 | 10.0% |
| Literature & Languages | 5,951 | 3.1% |
| Liberal Arts & History | 9,470 | 4.9% |
| Visual & Performing Arts | 6,786 | 3.5% |
| Communications | 9,161 | 4.7% |
| Arts & Humanities | 13,353 | 6.9% |
| Total | 194,597 | 100.0% |
Transportation & Commute in Fort Worth
Vehicle Availability by Sex in Fort Worth
The most prevalent vehicle ownership categories in Fort Worth are males with 2 vehicles (113,506, accounting for 46.6%) and females with 2 vehicles (88,427, making up 56.2%).
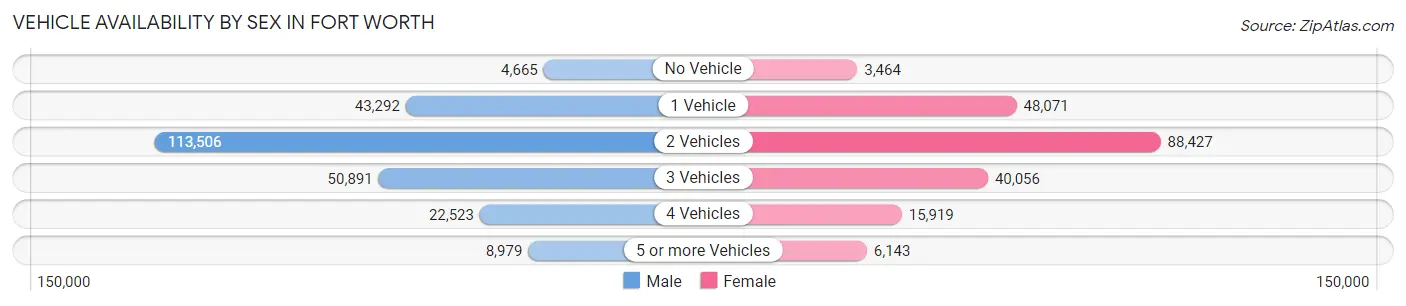
| Vehicles Available | Male | Female |
| No Vehicle | 4,665 (1.9%) | 3,464 (1.7%) |
| 1 Vehicle | 43,292 (17.7%) | 48,071 (23.8%) |
| 2 Vehicles | 113,506 (46.6%) | 88,427 (43.8%) |
| 3 Vehicles | 50,891 (20.9%) | 40,056 (19.8%) |
| 4 Vehicles | 22,523 (9.2%) | 15,919 (7.9%) |
| 5 or more Vehicles | 8,979 (3.7%) | 6,143 (3.0%) |
| Total | 243,856 (100.0%) | 202,080 (100.0%) |
Commute Time in Fort Worth
The most frequently occuring commute durations in Fort Worth are 20 to 24 minutes (66,086 commuters, 16.5%), 30 to 34 minutes (63,589 commuters, 15.9%), and 15 to 19 minutes (63,392 commuters, 15.9%).
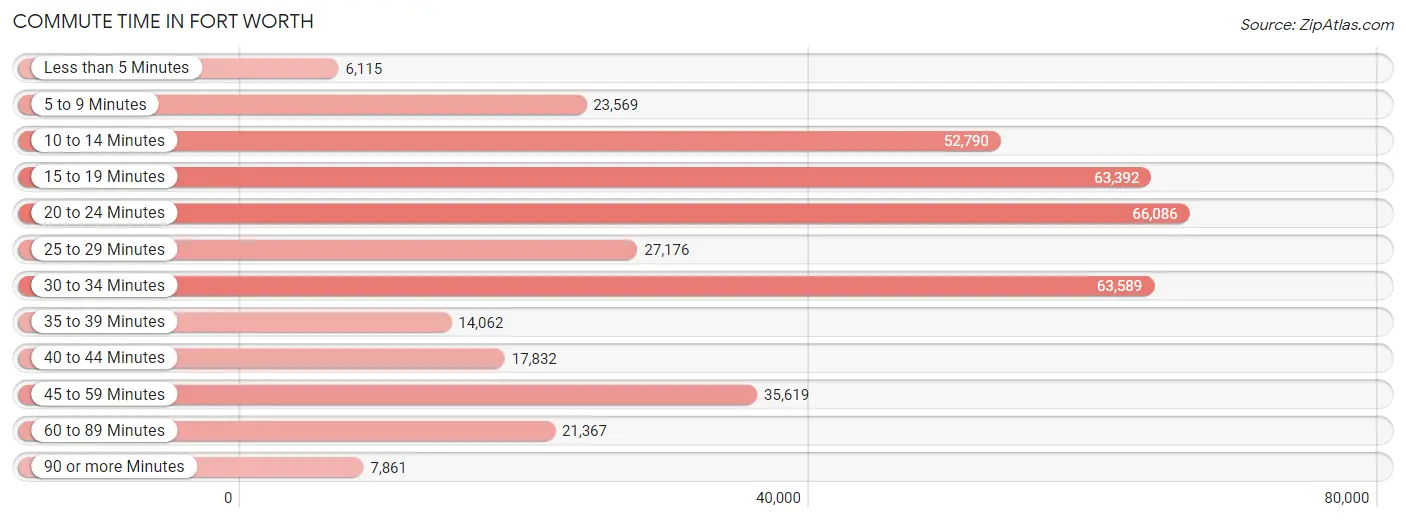
| Commute Time | # Commuters | % Commuters |
| Less than 5 Minutes | 6,115 | 1.5% |
| 5 to 9 Minutes | 23,569 | 5.9% |
| 10 to 14 Minutes | 52,790 | 13.2% |
| 15 to 19 Minutes | 63,392 | 15.9% |
| 20 to 24 Minutes | 66,086 | 16.5% |
| 25 to 29 Minutes | 27,176 | 6.8% |
| 30 to 34 Minutes | 63,589 | 15.9% |
| 35 to 39 Minutes | 14,062 | 3.5% |
| 40 to 44 Minutes | 17,832 | 4.5% |
| 45 to 59 Minutes | 35,619 | 8.9% |
| 60 to 89 Minutes | 21,367 | 5.3% |
| 90 or more Minutes | 7,861 | 2.0% |
Commute Time by Sex in Fort Worth
The most common commute times in Fort Worth are 30 to 34 minutes (38,260 commuters, 17.2%) for males and 15 to 19 minutes (31,236 commuters, 17.6%) for females.
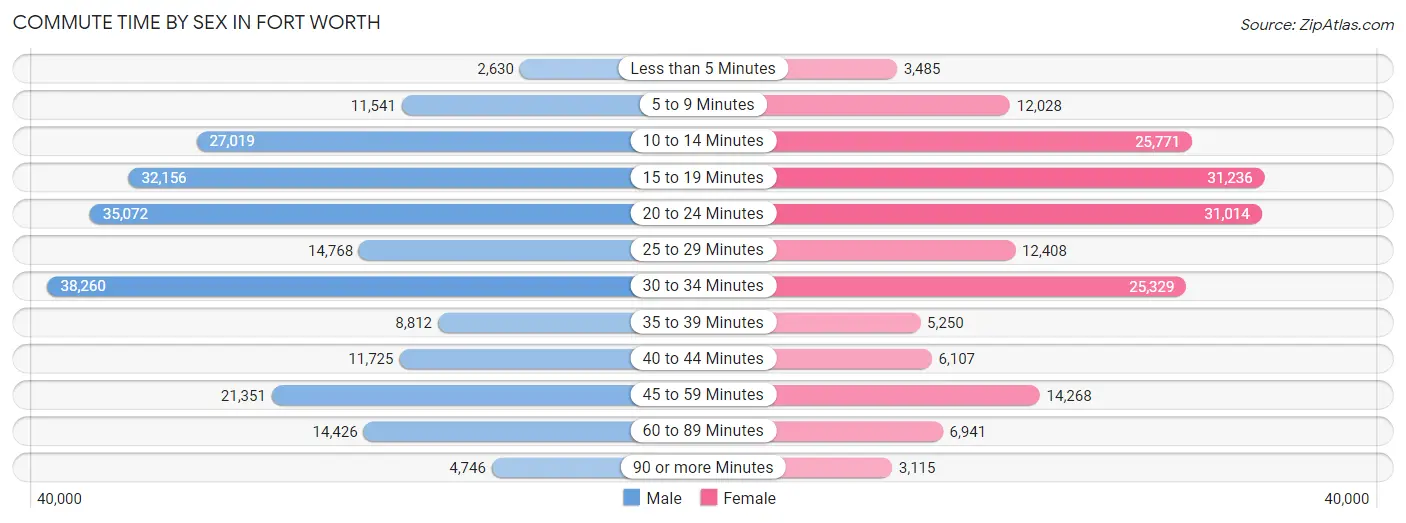
| Commute Time | Male | Female |
| Less than 5 Minutes | 2,630 (1.2%) | 3,485 (2.0%) |
| 5 to 9 Minutes | 11,541 (5.2%) | 12,028 (6.8%) |
| 10 to 14 Minutes | 27,019 (12.1%) | 25,771 (14.6%) |
| 15 to 19 Minutes | 32,156 (14.4%) | 31,236 (17.6%) |
| 20 to 24 Minutes | 35,072 (15.8%) | 31,014 (17.5%) |
| 25 to 29 Minutes | 14,768 (6.6%) | 12,408 (7.0%) |
| 30 to 34 Minutes | 38,260 (17.2%) | 25,329 (14.3%) |
| 35 to 39 Minutes | 8,812 (4.0%) | 5,250 (3.0%) |
| 40 to 44 Minutes | 11,725 (5.3%) | 6,107 (3.5%) |
| 45 to 59 Minutes | 21,351 (9.6%) | 14,268 (8.1%) |
| 60 to 89 Minutes | 14,426 (6.5%) | 6,941 (3.9%) |
| 90 or more Minutes | 4,746 (2.1%) | 3,115 (1.8%) |
Time of Departure to Work by Sex in Fort Worth
The most frequent times of departure to work in Fort Worth are 7:00 AM to 7:29 AM (29,988, 13.5%) for males and 7:00 AM to 7:29 AM (28,063, 15.9%) for females.
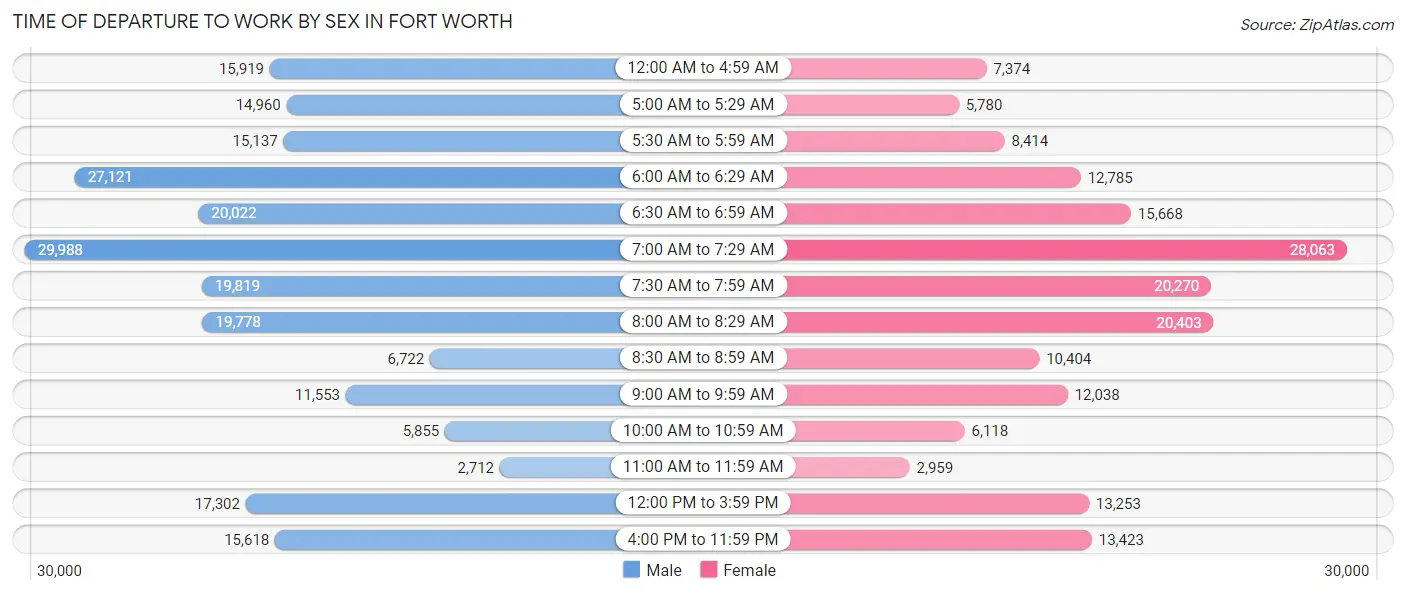
| Time of Departure | Male | Female |
| 12:00 AM to 4:59 AM | 15,919 (7.1%) | 7,374 (4.2%) |
| 5:00 AM to 5:29 AM | 14,960 (6.7%) | 5,780 (3.3%) |
| 5:30 AM to 5:59 AM | 15,137 (6.8%) | 8,414 (4.8%) |
| 6:00 AM to 6:29 AM | 27,121 (12.2%) | 12,785 (7.2%) |
| 6:30 AM to 6:59 AM | 20,022 (9.0%) | 15,668 (8.8%) |
| 7:00 AM to 7:29 AM | 29,988 (13.5%) | 28,063 (15.9%) |
| 7:30 AM to 7:59 AM | 19,819 (8.9%) | 20,270 (11.5%) |
| 8:00 AM to 8:29 AM | 19,778 (8.9%) | 20,403 (11.5%) |
| 8:30 AM to 8:59 AM | 6,722 (3.0%) | 10,404 (5.9%) |
| 9:00 AM to 9:59 AM | 11,553 (5.2%) | 12,038 (6.8%) |
| 10:00 AM to 10:59 AM | 5,855 (2.6%) | 6,118 (3.5%) |
| 11:00 AM to 11:59 AM | 2,712 (1.2%) | 2,959 (1.7%) |
| 12:00 PM to 3:59 PM | 17,302 (7.8%) | 13,253 (7.5%) |
| 4:00 PM to 11:59 PM | 15,618 (7.0%) | 13,423 (7.6%) |
| Total | 222,506 (100.0%) | 176,952 (100.0%) |
Housing Occupancy in Fort Worth
Occupancy by Ownership in Fort Worth
Of the total 326,648 dwellings in Fort Worth, owner-occupied units account for 185,371 (56.8%), while renter-occupied units make up 141,277 (43.2%).
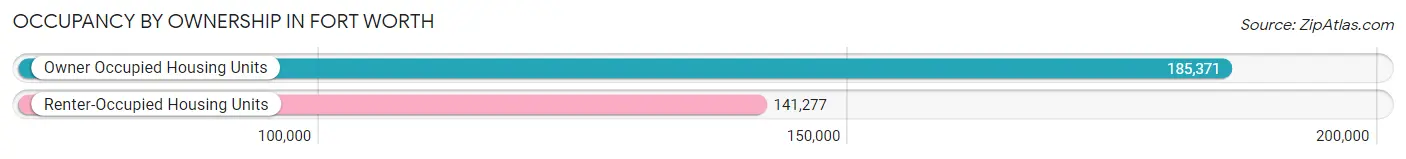
| Occupancy | # Housing Units | % Housing Units |
| Owner Occupied Housing Units | 185,371 | 56.8% |
| Renter-Occupied Housing Units | 141,277 | 43.2% |
| Total Occupied Housing Units | 326,648 | 100.0% |
Occupancy by Household Size in Fort Worth
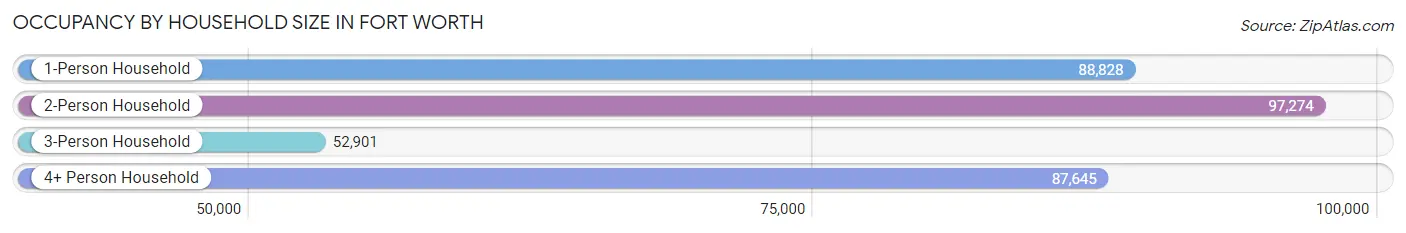
| Household Size | # Housing Units | % Housing Units |
| 1-Person Household | 88,828 | 27.2% |
| 2-Person Household | 97,274 | 29.8% |
| 3-Person Household | 52,901 | 16.2% |
| 4+ Person Household | 87,645 | 26.8% |
| Total Housing Units | 326,648 | 100.0% |
Occupancy by Ownership by Household Size in Fort Worth
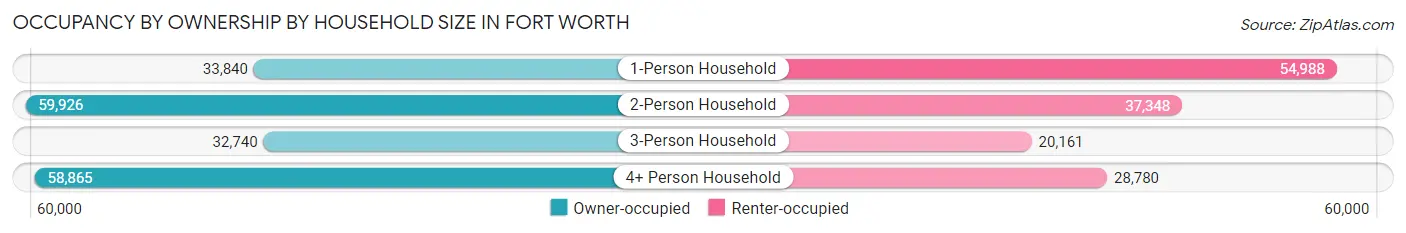
| Household Size | Owner-occupied | Renter-occupied |
| 1-Person Household | 33,840 (38.1%) | 54,988 (61.9%) |
| 2-Person Household | 59,926 (61.6%) | 37,348 (38.4%) |
| 3-Person Household | 32,740 (61.9%) | 20,161 (38.1%) |
| 4+ Person Household | 58,865 (67.2%) | 28,780 (32.8%) |
| Total Housing Units | 185,371 (56.8%) | 141,277 (43.2%) |
Occupancy by Educational Attainment in Fort Worth
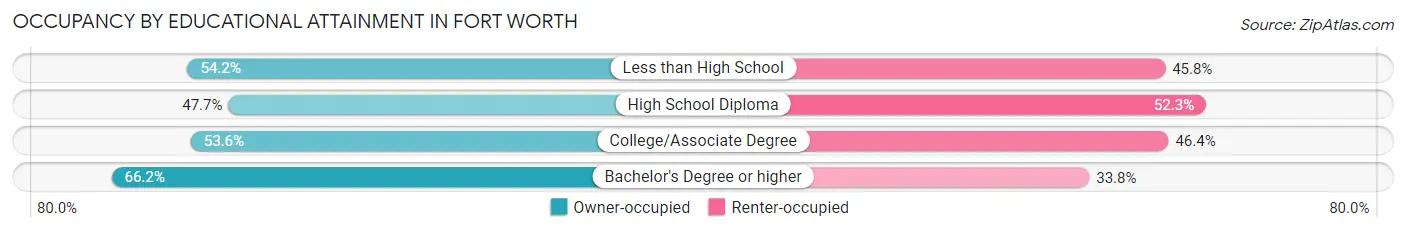
| Household Size | Owner-occupied | Renter-occupied |
| Less than High School | 22,952 (54.2%) | 19,423 (45.8%) |
| High School Diploma | 34,702 (47.7%) | 38,062 (52.3%) |
| College/Associate Degree | 52,542 (53.6%) | 45,412 (46.4%) |
| Bachelor's Degree or higher | 75,175 (66.2%) | 38,380 (33.8%) |
Occupancy by Age of Householder in Fort Worth
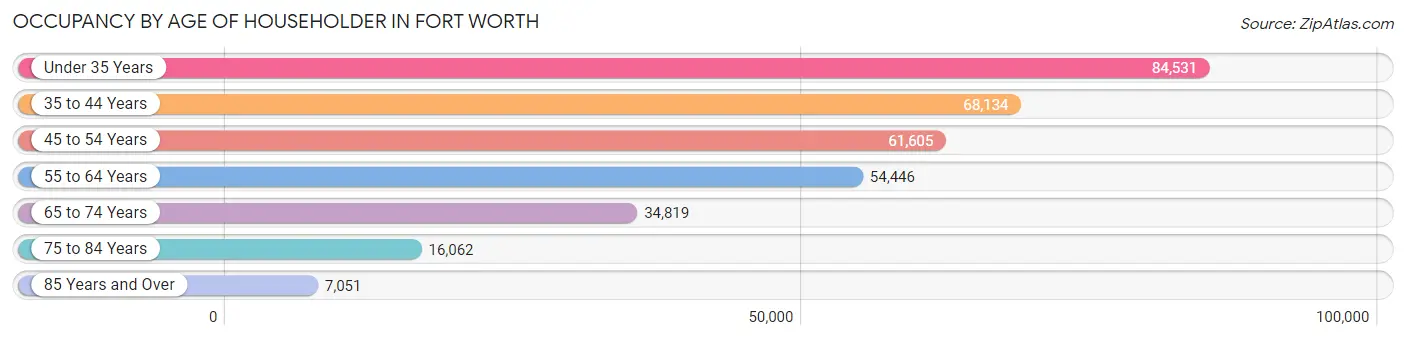
| Age Bracket | # Households | % Households |
| Under 35 Years | 84,531 | 25.9% |
| 35 to 44 Years | 68,134 | 20.9% |
| 45 to 54 Years | 61,605 | 18.9% |
| 55 to 64 Years | 54,446 | 16.7% |
| 65 to 74 Years | 34,819 | 10.7% |
| 75 to 84 Years | 16,062 | 4.9% |
| 85 Years and Over | 7,051 | 2.2% |
| Total | 326,648 | 100.0% |
Housing Finances in Fort Worth
Median Income by Occupancy in Fort Worth
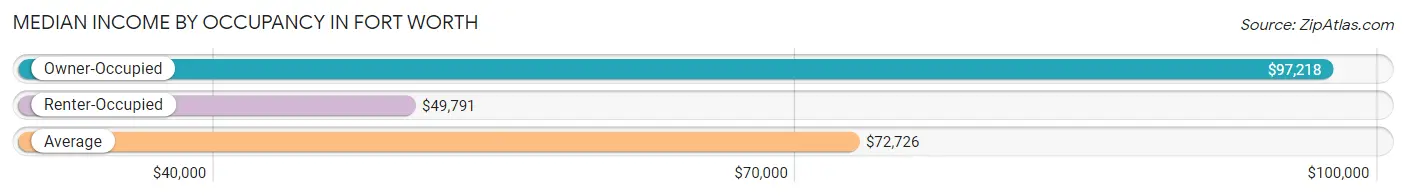
| Occupancy Type | # Households | Median Income |
| Owner-Occupied | 185,371 (56.8%) | $97,218 |
| Renter-Occupied | 141,277 (43.2%) | $49,791 |
| Average | 326,648 (100.0%) | $72,726 |
Occupancy by Householder Income Bracket in Fort Worth
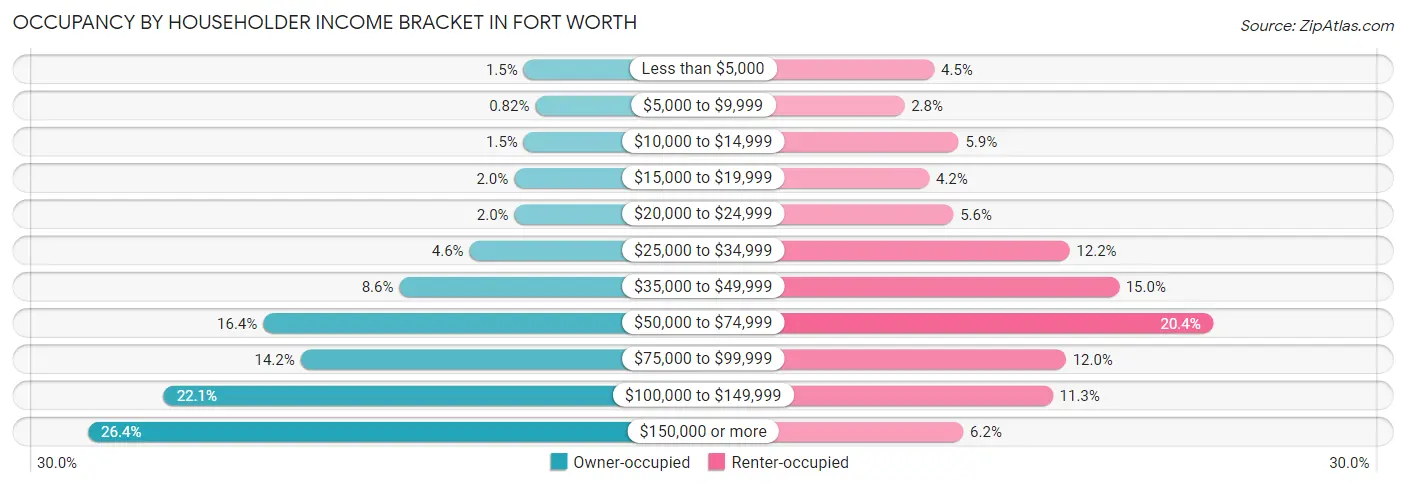
| Income Bracket | Owner-occupied | Renter-occupied |
| Less than $5,000 | 2,755 (1.5%) | 6,348 (4.5%) |
| $5,000 to $9,999 | 1,517 (0.8%) | 3,932 (2.8%) |
| $10,000 to $14,999 | 2,741 (1.5%) | 8,306 (5.9%) |
| $15,000 to $19,999 | 3,765 (2.0%) | 5,933 (4.2%) |
| $20,000 to $24,999 | 3,727 (2.0%) | 7,879 (5.6%) |
| $25,000 to $34,999 | 8,489 (4.6%) | 17,257 (12.2%) |
| $35,000 to $49,999 | 15,920 (8.6%) | 21,241 (15.0%) |
| $50,000 to $74,999 | 30,343 (16.4%) | 28,819 (20.4%) |
| $75,000 to $99,999 | 26,370 (14.2%) | 16,964 (12.0%) |
| $100,000 to $149,999 | 40,868 (22.1%) | 15,914 (11.3%) |
| $150,000 or more | 48,876 (26.4%) | 8,684 (6.1%) |
| Total | 185,371 (100.0%) | 141,277 (100.0%) |
Monthly Housing Cost Tiers in Fort Worth
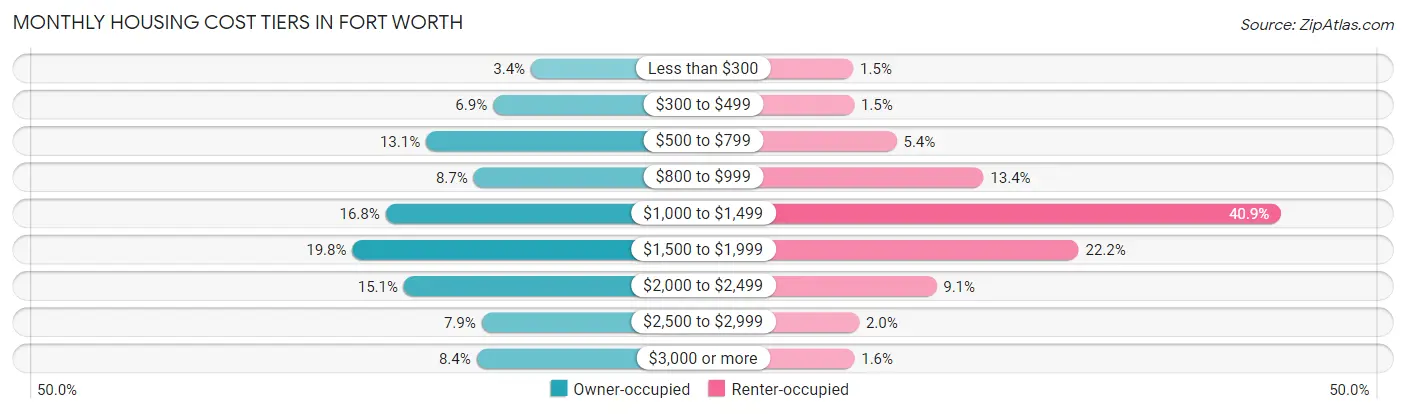
| Monthly Cost | Owner-occupied | Renter-occupied |
| Less than $300 | 6,293 (3.4%) | 2,047 (1.5%) |
| $300 to $499 | 12,748 (6.9%) | 2,141 (1.5%) |
| $500 to $799 | 24,192 (13.1%) | 7,687 (5.4%) |
| $800 to $999 | 16,073 (8.7%) | 18,985 (13.4%) |
| $1,000 to $1,499 | 31,083 (16.8%) | 57,709 (40.8%) |
| $1,500 to $1,999 | 36,758 (19.8%) | 31,362 (22.2%) |
| $2,000 to $2,499 | 27,966 (15.1%) | 12,852 (9.1%) |
| $2,500 to $2,999 | 14,709 (7.9%) | 2,792 (2.0%) |
| $3,000 or more | 15,549 (8.4%) | 2,195 (1.5%) |
| Total | 185,371 (100.0%) | 141,277 (100.0%) |
Physical Housing Characteristics in Fort Worth
Housing Structures in Fort Worth
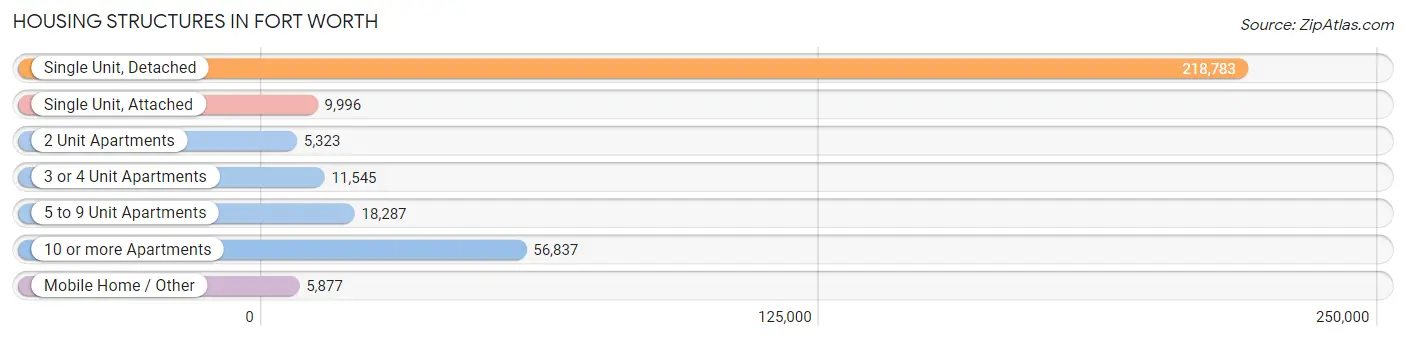
| Structure Type | # Housing Units | % Housing Units |
| Single Unit, Detached | 218,783 | 67.0% |
| Single Unit, Attached | 9,996 | 3.1% |
| 2 Unit Apartments | 5,323 | 1.6% |
| 3 or 4 Unit Apartments | 11,545 | 3.5% |
| 5 to 9 Unit Apartments | 18,287 | 5.6% |
| 10 or more Apartments | 56,837 | 17.4% |
| Mobile Home / Other | 5,877 | 1.8% |
| Total | 326,648 | 100.0% |
Housing Structures by Occupancy in Fort Worth
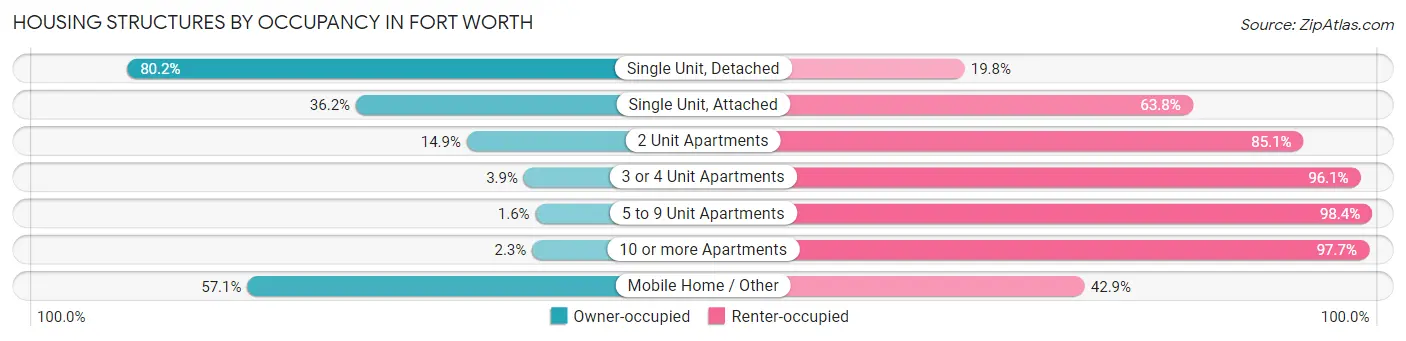
| Structure Type | Owner-occupied | Renter-occupied |
| Single Unit, Detached | 175,562 (80.2%) | 43,221 (19.8%) |
| Single Unit, Attached | 3,620 (36.2%) | 6,376 (63.8%) |
| 2 Unit Apartments | 791 (14.9%) | 4,532 (85.1%) |
| 3 or 4 Unit Apartments | 448 (3.9%) | 11,097 (96.1%) |
| 5 to 9 Unit Apartments | 299 (1.6%) | 17,988 (98.4%) |
| 10 or more Apartments | 1,294 (2.3%) | 55,543 (97.7%) |
| Mobile Home / Other | 3,357 (57.1%) | 2,520 (42.9%) |
| Total | 185,371 (56.8%) | 141,277 (43.2%) |
Housing Structures by Number of Rooms in Fort Worth
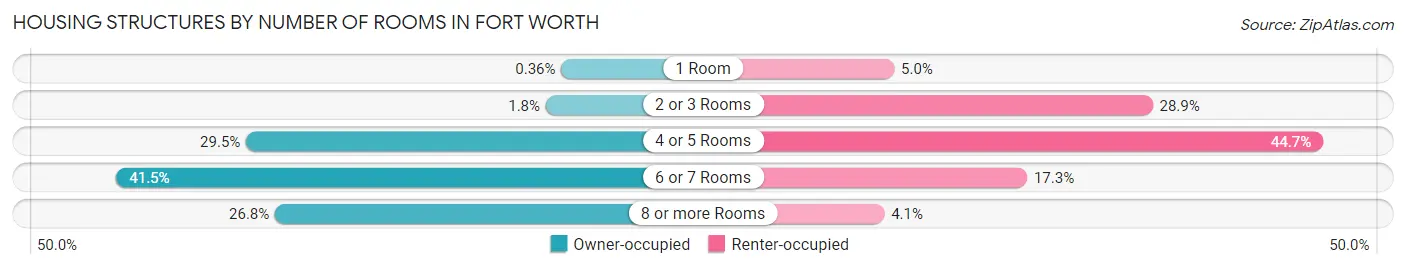
| Number of Rooms | Owner-occupied | Renter-occupied |
| 1 Room | 668 (0.4%) | 7,080 (5.0%) |
| 2 or 3 Rooms | 3,326 (1.8%) | 40,844 (28.9%) |
| 4 or 5 Rooms | 54,705 (29.5%) | 63,118 (44.7%) |
| 6 or 7 Rooms | 76,939 (41.5%) | 24,437 (17.3%) |
| 8 or more Rooms | 49,733 (26.8%) | 5,798 (4.1%) |
| Total | 185,371 (100.0%) | 141,277 (100.0%) |
Housing Structure by Heating Type in Fort Worth
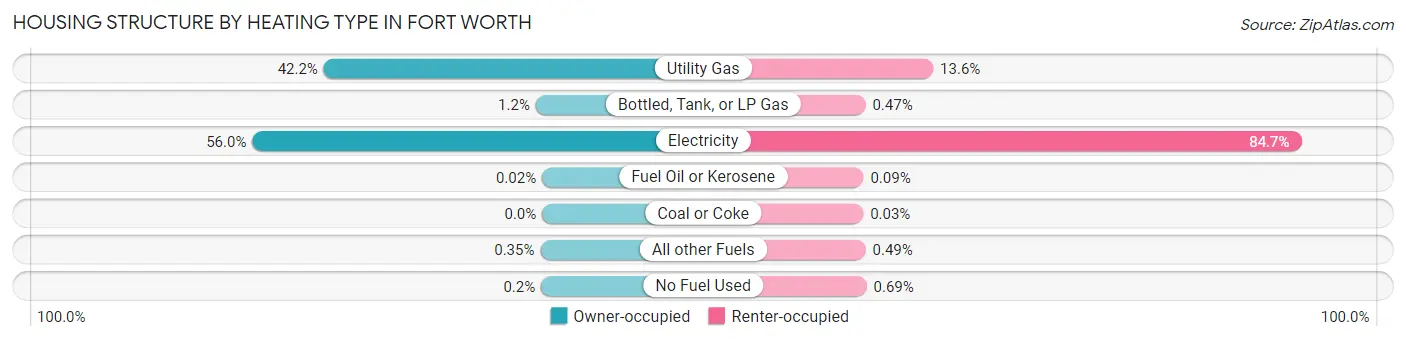
| Heating Type | Owner-occupied | Renter-occupied |
| Utility Gas | 78,221 (42.2%) | 19,150 (13.6%) |
| Bottled, Tank, or LP Gas | 2,281 (1.2%) | 658 (0.5%) |
| Electricity | 103,818 (56.0%) | 119,629 (84.7%) |
| Fuel Oil or Kerosene | 40 (0.0%) | 131 (0.1%) |
| Coal or Coke | 0 (0.0%) | 38 (0.0%) |
| All other Fuels | 642 (0.4%) | 690 (0.5%) |
| No Fuel Used | 369 (0.2%) | 981 (0.7%) |
| Total | 185,371 (100.0%) | 141,277 (100.0%) |
Household Vehicle Usage in Fort Worth
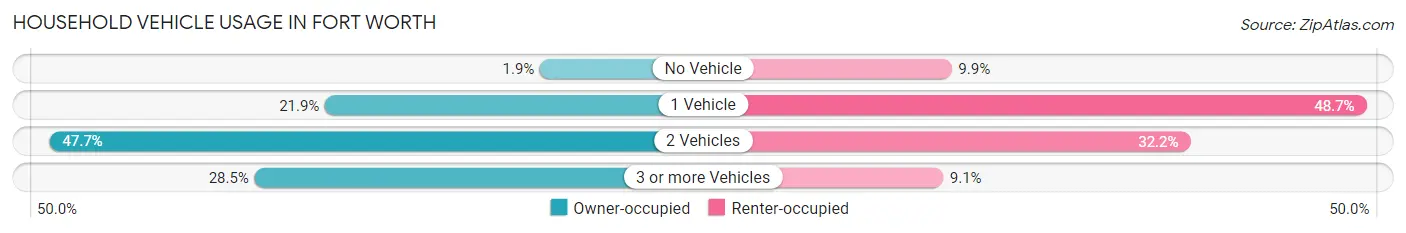
| Vehicles per Household | Owner-occupied | Renter-occupied |
| No Vehicle | 3,468 (1.9%) | 14,043 (9.9%) |
| 1 Vehicle | 40,662 (21.9%) | 68,769 (48.7%) |
| 2 Vehicles | 88,376 (47.7%) | 45,546 (32.2%) |
| 3 or more Vehicles | 52,865 (28.5%) | 12,919 (9.1%) |
| Total | 185,371 (100.0%) | 141,277 (100.0%) |
Real Estate & Mortgages in Fort Worth
Real Estate and Mortgage Overview in Fort Worth
| Characteristic | Without Mortgage | With Mortgage |
| Housing Units | 66,157 | 119,214 |
| Median Property Value | $200,600 | $271,600 |
| Median Household Income | $71,544 | $37,422 |
| Monthly Housing Costs | $695 | $14,712 |
| Real Estate Taxes | $3,069 | $3,497 |
Property Value by Mortgage Status in Fort Worth
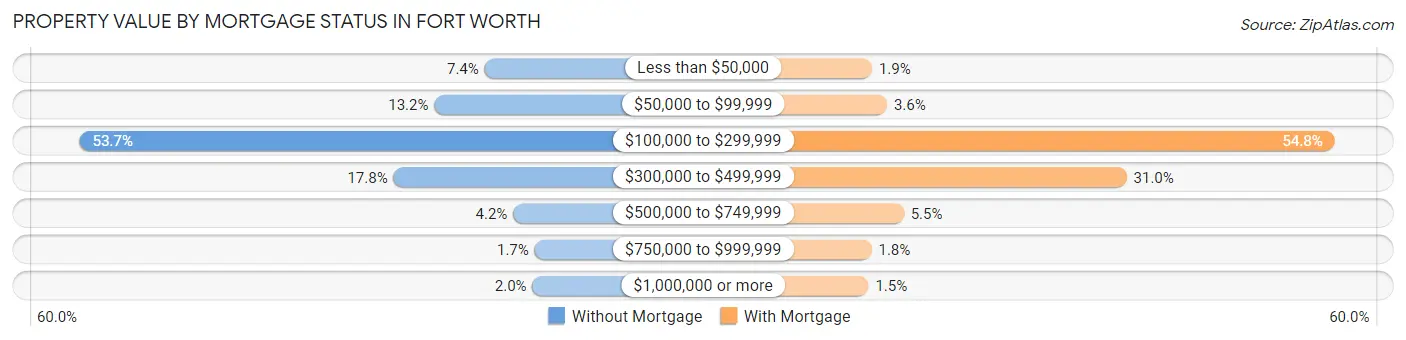
| Property Value | Without Mortgage | With Mortgage |
| Less than $50,000 | 4,915 (7.4%) | 2,243 (1.9%) |
| $50,000 to $99,999 | 8,719 (13.2%) | 4,280 (3.6%) |
| $100,000 to $299,999 | 35,537 (53.7%) | 65,267 (54.7%) |
| $300,000 to $499,999 | 11,805 (17.8%) | 36,930 (31.0%) |
| $500,000 to $749,999 | 2,754 (4.2%) | 6,554 (5.5%) |
| $750,000 to $999,999 | 1,131 (1.7%) | 2,181 (1.8%) |
| $1,000,000 or more | 1,296 (2.0%) | 1,759 (1.5%) |
| Total | 66,157 (100.0%) | 119,214 (100.0%) |
Household Income by Mortgage Status in Fort Worth
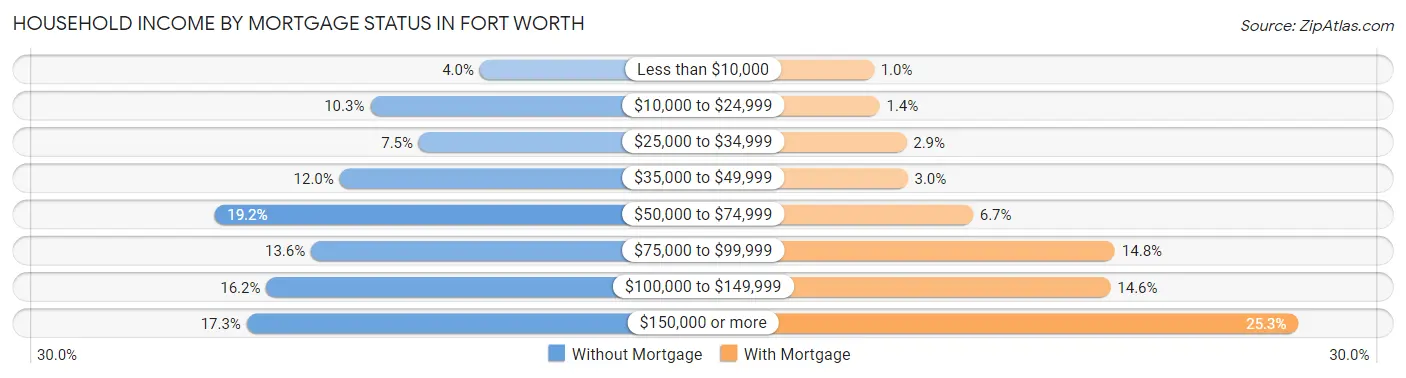
| Household Income | Without Mortgage | With Mortgage |
| Less than $10,000 | 2,639 (4.0%) | 1,237 (1.0%) |
| $10,000 to $24,999 | 6,779 (10.2%) | 1,633 (1.4%) |
| $25,000 to $34,999 | 4,945 (7.5%) | 3,454 (2.9%) |
| $35,000 to $49,999 | 7,936 (12.0%) | 3,544 (3.0%) |
| $50,000 to $74,999 | 12,676 (19.2%) | 7,984 (6.7%) |
| $75,000 to $99,999 | 9,018 (13.6%) | 17,667 (14.8%) |
| $100,000 to $149,999 | 10,710 (16.2%) | 17,352 (14.6%) |
| $150,000 or more | 11,454 (17.3%) | 30,158 (25.3%) |
| Total | 66,157 (100.0%) | 119,214 (100.0%) |
Property Value to Household Income Ratio in Fort Worth
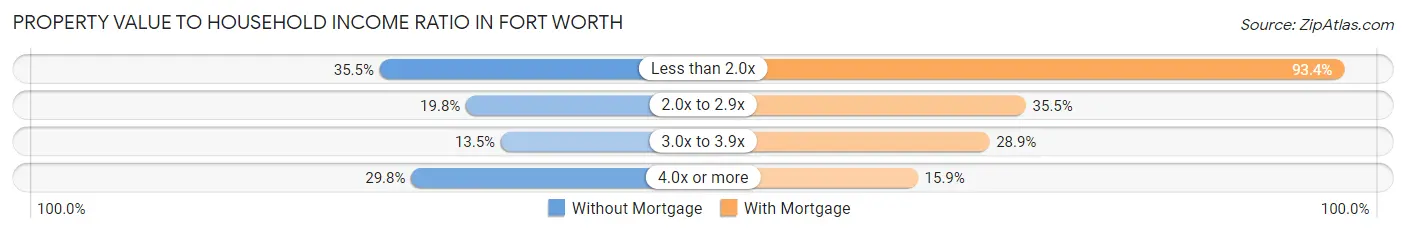
| Value-to-Income Ratio | Without Mortgage | With Mortgage |
| Less than 2.0x | 23,477 (35.5%) | 111,331 (93.4%) |
| 2.0x to 2.9x | 13,107 (19.8%) | 42,371 (35.5%) |
| 3.0x to 3.9x | 8,925 (13.5%) | 34,485 (28.9%) |
| 4.0x or more | 19,694 (29.8%) | 18,996 (15.9%) |
| Total | 66,157 (100.0%) | 119,214 (100.0%) |
Real Estate Taxes by Mortgage Status in Fort Worth
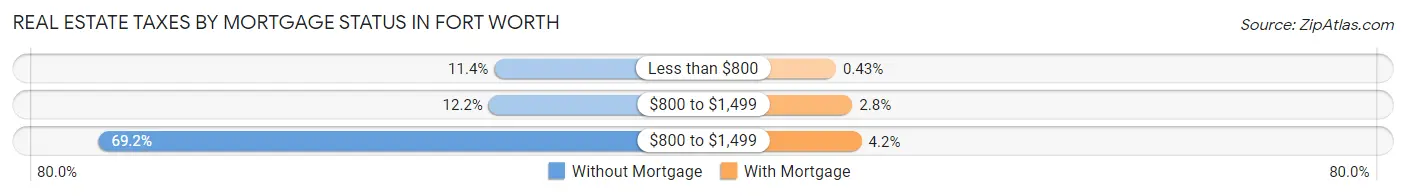
| Property Taxes | Without Mortgage | With Mortgage |
| Less than $800 | 7,537 (11.4%) | 514 (0.4%) |
| $800 to $1,499 | 8,066 (12.2%) | 3,377 (2.8%) |
| $800 to $1,499 | 45,774 (69.2%) | 4,983 (4.2%) |
| Total | 66,157 (100.0%) | 119,214 (100.0%) |
Health & Disability in Fort Worth
Health Insurance Coverage by Age in Fort Worth
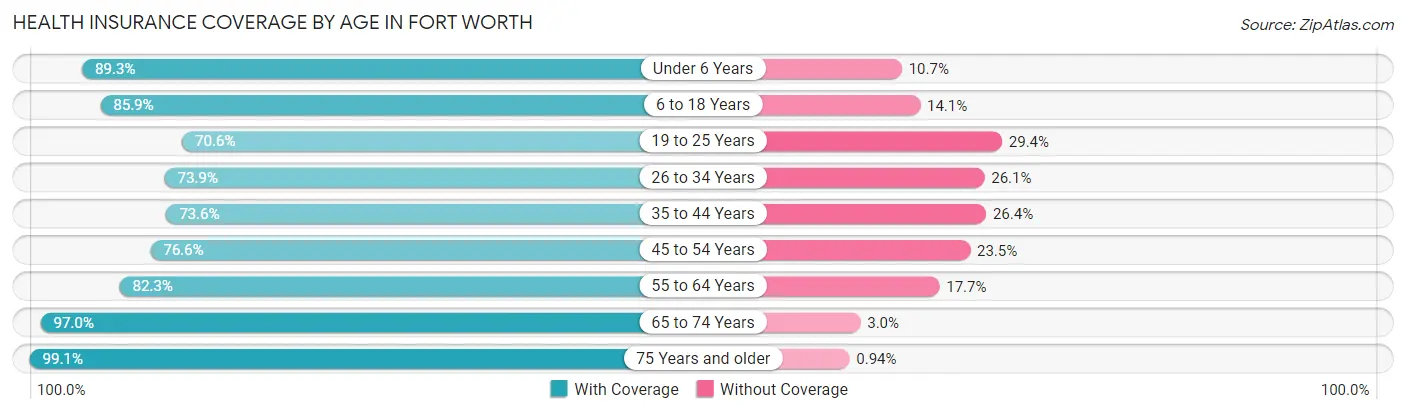
| Age Bracket | With Coverage | Without Coverage |
| Under 6 Years | 72,252 (89.3%) | 8,662 (10.7%) |
| 6 to 18 Years | 154,906 (85.9%) | 25,483 (14.1%) |
| 19 to 25 Years | 65,623 (70.6%) | 27,303 (29.4%) |
| 26 to 34 Years | 97,286 (73.9%) | 34,354 (26.1%) |
| 35 to 44 Years | 96,019 (73.6%) | 34,478 (26.4%) |
| 45 to 54 Years | 84,072 (76.5%) | 25,761 (23.4%) |
| 55 to 64 Years | 78,551 (82.3%) | 16,910 (17.7%) |
| 65 to 74 Years | 55,394 (97.0%) | 1,699 (3.0%) |
| 75 Years and older | 33,984 (99.1%) | 321 (0.9%) |
| Total | 738,087 (80.8%) | 174,971 (19.2%) |
Health Insurance Coverage by Citizenship Status in Fort Worth
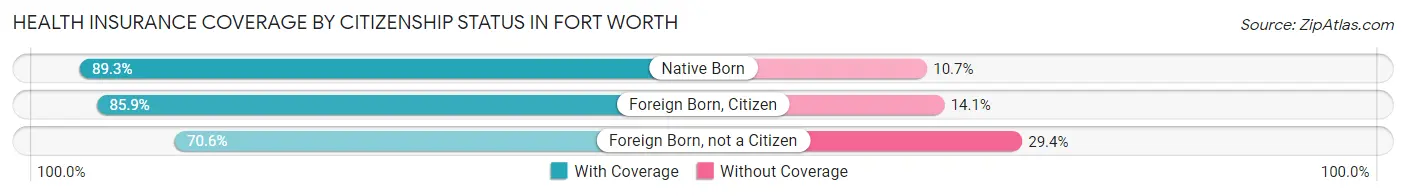
| Citizenship Status | With Coverage | Without Coverage |
| Native Born | 72,252 (89.3%) | 8,662 (10.7%) |
| Foreign Born, Citizen | 154,906 (85.9%) | 25,483 (14.1%) |
| Foreign Born, not a Citizen | 65,623 (70.6%) | 27,303 (29.4%) |
Health Insurance Coverage by Household Income in Fort Worth
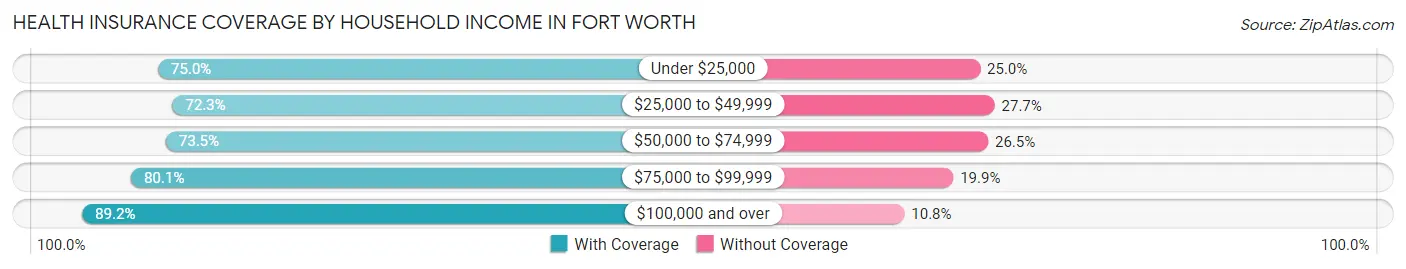
| Household Income | With Coverage | Without Coverage |
| Under $25,000 | 69,907 (75.0%) | 23,277 (25.0%) |
| $25,000 to $49,999 | 111,791 (72.3%) | 42,817 (27.7%) |
| $50,000 to $74,999 | 118,635 (73.5%) | 42,705 (26.5%) |
| $75,000 to $99,999 | 98,662 (80.1%) | 24,568 (19.9%) |
| $100,000 and over | 333,297 (89.2%) | 40,303 (10.8%) |
Public vs Private Health Insurance Coverage by Age in Fort Worth
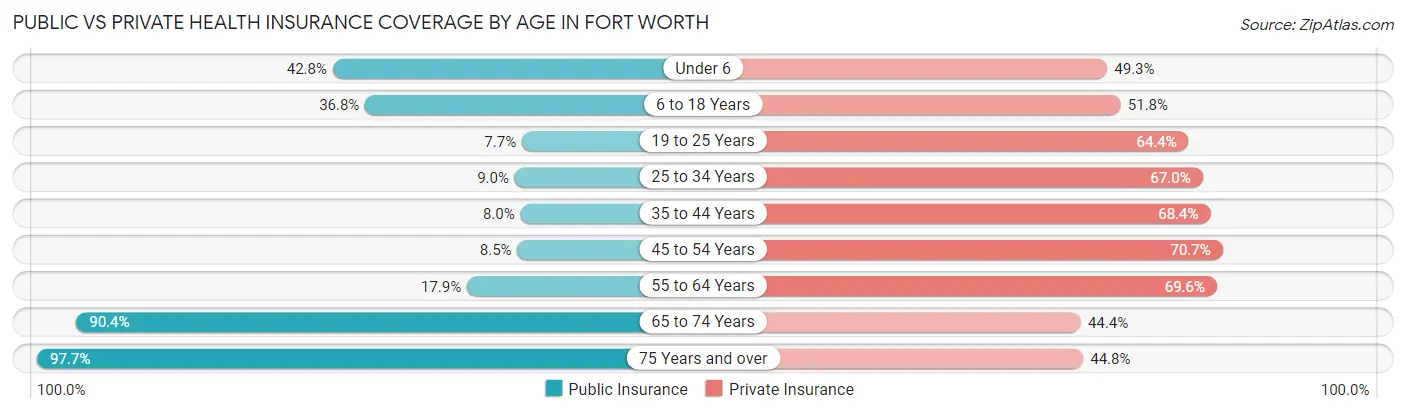
| Age Bracket | Public Insurance | Private Insurance |
| Under 6 | 34,625 (42.8%) | 39,882 (49.3%) |
| 6 to 18 Years | 66,351 (36.8%) | 93,445 (51.8%) |
| 19 to 25 Years | 7,141 (7.7%) | 59,821 (64.4%) |
| 25 to 34 Years | 11,862 (9.0%) | 88,147 (67.0%) |
| 35 to 44 Years | 10,370 (8.0%) | 89,242 (68.4%) |
| 45 to 54 Years | 9,353 (8.5%) | 77,620 (70.7%) |
| 55 to 64 Years | 17,059 (17.9%) | 66,441 (69.6%) |
| 65 to 74 Years | 51,604 (90.4%) | 25,351 (44.4%) |
| 75 Years and over | 33,511 (97.7%) | 15,378 (44.8%) |
| Total | 241,876 (26.5%) | 555,327 (60.8%) |
Disability Status by Sex by Age in Fort Worth
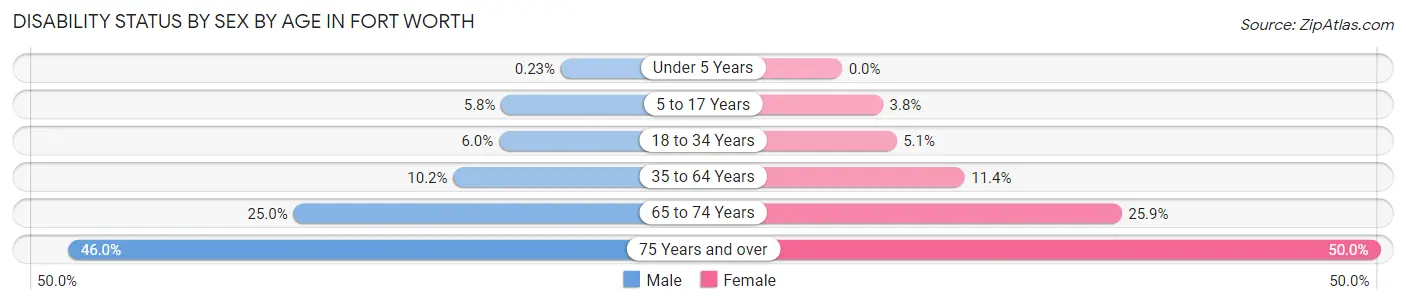
| Age Bracket | Male | Female |
| Under 5 Years | 80 (0.2%) | 0 (0.0%) |
| 5 to 17 Years | 5,170 (5.8%) | 3,423 (3.8%) |
| 18 to 34 Years | 6,849 (6.0%) | 6,233 (5.1%) |
| 35 to 64 Years | 17,152 (10.2%) | 19,077 (11.4%) |
| 65 to 74 Years | 6,454 (25.0%) | 8,124 (25.9%) |
| 75 Years and over | 6,300 (46.0%) | 10,294 (50.0%) |
Disability Class by Sex by Age in Fort Worth
Disability Class: Hearing Difficulty
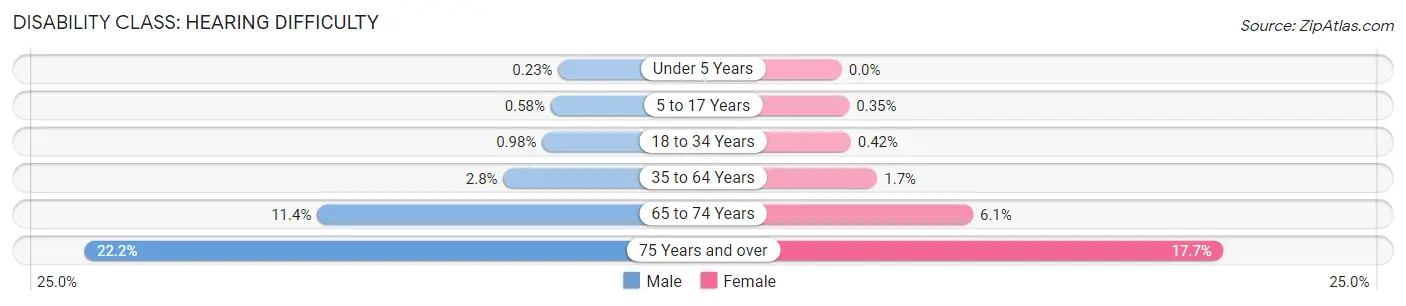
| Age Bracket | Male | Female |
| Under 5 Years | 80 (0.2%) | 0 (0.0%) |
| 5 to 17 Years | 521 (0.6%) | 317 (0.4%) |
| 18 to 34 Years | 1,127 (1.0%) | 517 (0.4%) |
| 35 to 64 Years | 4,676 (2.8%) | 2,775 (1.7%) |
| 65 to 74 Years | 2,942 (11.4%) | 1,907 (6.1%) |
| 75 Years and over | 3,048 (22.2%) | 3,650 (17.7%) |
Disability Class: Vision Difficulty
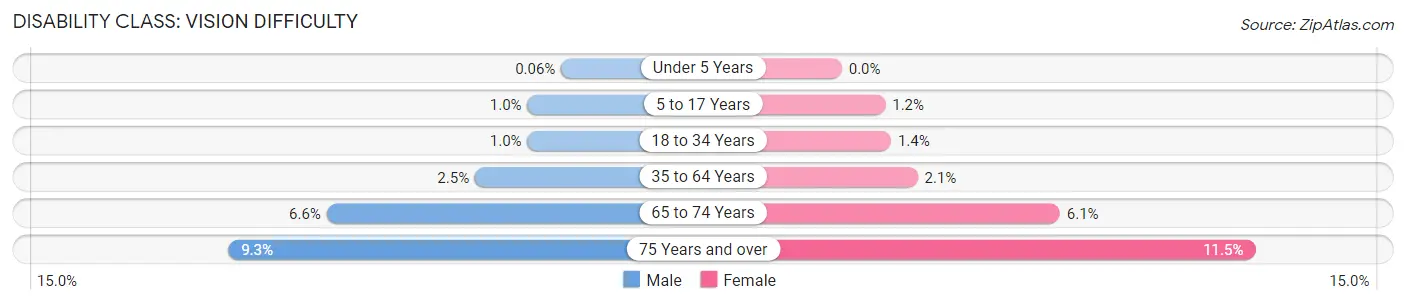
| Age Bracket | Male | Female |
| Under 5 Years | 21 (0.1%) | 0 (0.0%) |
| 5 to 17 Years | 902 (1.0%) | 1,093 (1.2%) |
| 18 to 34 Years | 1,148 (1.0%) | 1,693 (1.4%) |
| 35 to 64 Years | 4,130 (2.5%) | 3,545 (2.1%) |
| 65 to 74 Years | 1,699 (6.6%) | 1,902 (6.1%) |
| 75 Years and over | 1,279 (9.3%) | 2,371 (11.5%) |
Disability Class: Cognitive Difficulty
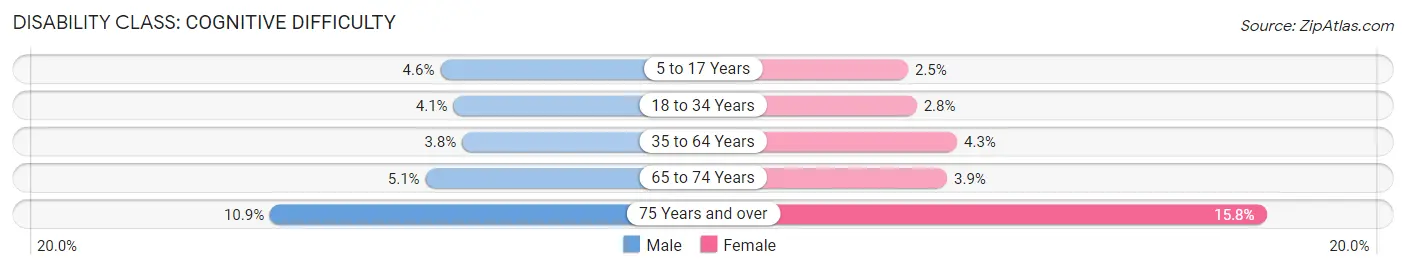
| Age Bracket | Male | Female |
| 5 to 17 Years | 4,104 (4.6%) | 2,225 (2.5%) |
| 18 to 34 Years | 4,676 (4.1%) | 3,431 (2.8%) |
| 35 to 64 Years | 6,313 (3.8%) | 7,180 (4.3%) |
| 65 to 74 Years | 1,319 (5.1%) | 1,224 (3.9%) |
| 75 Years and over | 1,492 (10.9%) | 3,247 (15.8%) |
Disability Class: Ambulatory Difficulty
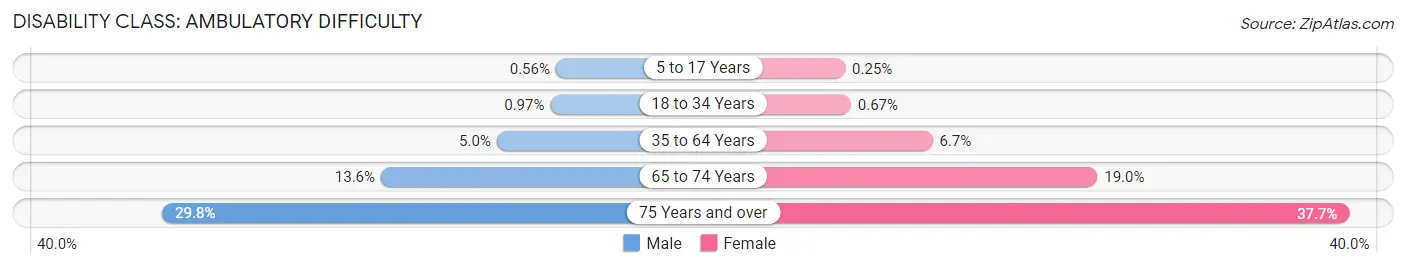
| Age Bracket | Male | Female |
| 5 to 17 Years | 500 (0.6%) | 222 (0.3%) |
| 18 to 34 Years | 1,113 (1.0%) | 823 (0.7%) |
| 35 to 64 Years | 8,315 (5.0%) | 11,297 (6.7%) |
| 65 to 74 Years | 3,493 (13.6%) | 5,943 (19.0%) |
| 75 Years and over | 4,082 (29.8%) | 7,761 (37.7%) |
Disability Class: Self-Care Difficulty
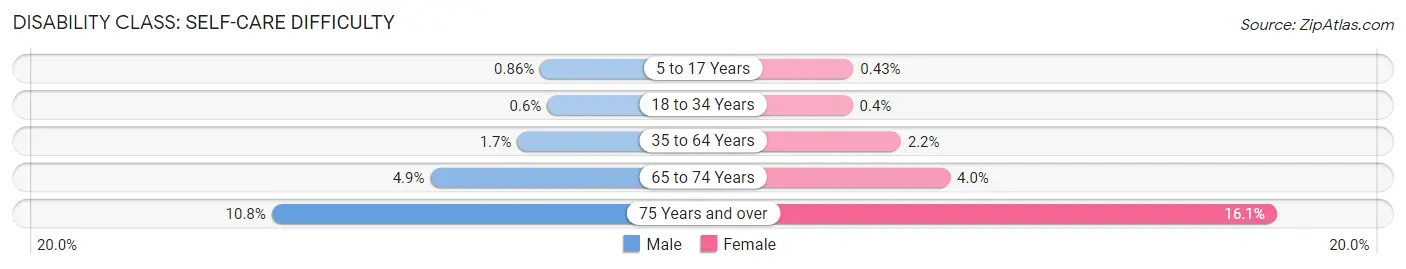
| Age Bracket | Male | Female |
| 5 to 17 Years | 777 (0.9%) | 387 (0.4%) |
| 18 to 34 Years | 690 (0.6%) | 490 (0.4%) |
| 35 to 64 Years | 2,869 (1.7%) | 3,675 (2.2%) |
| 65 to 74 Years | 1,274 (4.9%) | 1,258 (4.0%) |
| 75 Years and over | 1,484 (10.8%) | 3,326 (16.1%) |
Technology Access in Fort Worth
Computing Device Access in Fort Worth
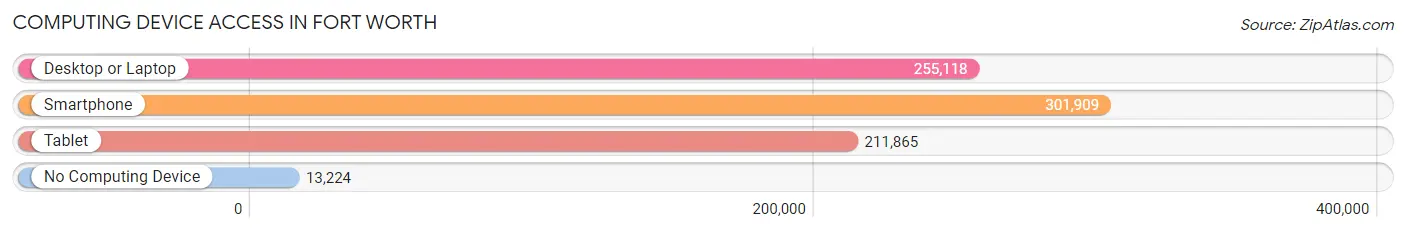
| Device Type | # Households | % Households |
| Desktop or Laptop | 255,118 | 78.1% |
| Smartphone | 301,909 | 92.4% |
| Tablet | 211,865 | 64.9% |
| No Computing Device | 13,224 | 4.1% |
| Total | 326,648 | 100.0% |
Internet Access in Fort Worth
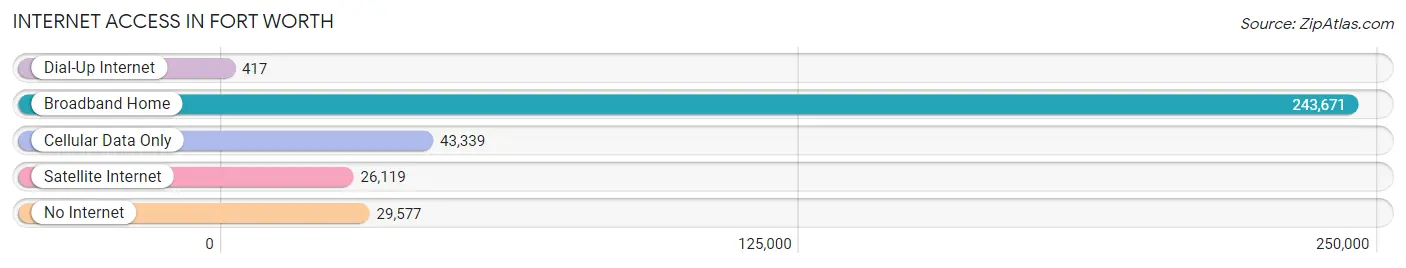
| Internet Type | # Households | % Households |
| Dial-Up Internet | 417 | 0.1% |
| Broadband Home | 243,671 | 74.6% |
| Cellular Data Only | 43,339 | 13.3% |
| Satellite Internet | 26,119 | 8.0% |
| No Internet | 29,577 | 9.0% |
| Total | 326,648 | 100.0% |
Fort Worth Summary
Fort Worth, Texas is a city located in the north-central part of the state, in Tarrant County. It is the fifth-largest city in Texas and the 17th-largest in the United States, with a population of 833,319 as of the 2010 census. Fort Worth is the second-largest city in the Dallas–Fort Worth–Arlington metropolitan area, which is the fourth-largest metropolitan area in the United States.
History
Fort Worth was founded in 1849 as an Army outpost on a bluff overlooking the Trinity River. The outpost was established to protect settlers from Native American raids. The city was named after General William Jenkins Worth, who had served in the Mexican–American War. The city grew rapidly after the arrival of the Texas and Pacific Railway in 1876, and it became an important trading post for cattle drives traveling north from Texas to Kansas.
Fort Worth became a major center for the oil and gas industry in the early 20th century, and it was the site of the first oil well in Texas. The city also became a major center for the aerospace industry in the 1950s, and it is now home to several major defense contractors.
Geography
Fort Worth is located in north-central Texas, in Tarrant County. It is situated on the Trinity River, about 30 miles west of Dallas. The city covers an area of 339 square miles, with an elevation of 650 feet above sea level.
The city is divided into several distinct neighborhoods, including Downtown, the Cultural District, the Stockyards, and the Near Southside. The city is also home to several parks, including Trinity Park, the Fort Worth Botanic Garden, and the Fort Worth Zoo.
Economy
Fort Worth is a major economic center in Texas. The city is home to several Fortune 500 companies, including American Airlines, BNSF Railway, and Lockheed Martin. The city is also a major center for the oil and gas industry, with several major oil and gas companies based in the city.
The city is also home to several major universities, including Texas Christian University, the University of North Texas Health Science Center, and Texas Wesleyan University. The city is also home to several major museums, including the Kimbell Art Museum, the Amon Carter Museum of American Art, and the Modern Art Museum of Fort Worth.
Demographics
As of the 2010 census, Fort Worth had a population of 833,319. The racial makeup of the city was 57.2% White, 25.2% Hispanic or Latino, 15.3% African American, and 2.3% Asian. The median household income was $45,945, and the median family income was $54,817.
Fort Worth is a diverse city, with a variety of cultures and religions represented. The city is home to several major religious institutions, including the Cathedral of Our Lady of Guadalupe, the Islamic Association of North Texas, and the Congregation Beth-El.
Conclusion
Fort Worth, Texas is a vibrant and diverse city located in the north-central part of the state. It is the fifth-largest city in Texas and the 17th-largest in the United States, with a population of 833,319 as of the 2010 census. The city is a major economic center in Texas, with several Fortune 500 companies based in the city. It is also home to several major universities and museums, and it is a diverse city with a variety of cultures and religions represented.
Common Questions
What is Per Capita Income in Fort Worth?
Per Capita income in Fort Worth is $35,428.
What is the Median Family Income in Fort Worth?
Median Family Income in Fort Worth is $87,622.
What is the Median Household income in Fort Worth?
Median Household Income in Fort Worth is $72,726.
What is Income or Wage Gap in Fort Worth?
Income or Wage Gap in Fort Worth is 27.2%.
Women in Fort Worth earn 72.8 cents for every dollar earned by a man.
What is Family Income Deficit in Fort Worth?
Family Income Deficit in Fort Worth is $11,485.
Families that are below poverty line in Fort Worth earn $11,485 less on average than the poverty threshold level.
What is Inequality or Gini Index in Fort Worth?
Inequality or Gini Index in Fort Worth is 0.45.
What is the Total Population of Fort Worth?
Total Population of Fort Worth is 924,663.
What is the Total Male Population of Fort Worth?
Total Male Population of Fort Worth is 454,566.
What is the Total Female Population of Fort Worth?
Total Female Population of Fort Worth is 470,097.
What is the Ratio of Males per 100 Females in Fort Worth?
There are 96.70 Males per 100 Females in Fort Worth.
What is the Ratio of Females per 100 Males in Fort Worth?
There are 103.42 Females per 100 Males in Fort Worth.
What is the Median Population Age in Fort Worth?
Median Population Age in Fort Worth is 33.2 Years.
What is the Average Family Size in Fort Worth
Average Family Size in Fort Worth is 3.4 People.
What is the Average Household Size in Fort Worth
Average Household Size in Fort Worth is 2.8 People.
How Large is the Labor Force in Fort Worth?
There are 481,974 People in the Labor Forcein in Fort Worth.
What is the Percentage of People in the Labor Force in Fort Worth?
68.4% of People are in the Labor Force in Fort Worth.
What is the Unemployment Rate in Fort Worth?
Unemployment Rate in Fort Worth is 5.3%.