Phoenix, AZ Map & Demographics
Phoenix Map
Phoenix Overview
$37,499
PER CAPITA INCOME
$84,018
AVG FAMILY INCOME
$72,092
AVG HOUSEHOLD INCOME
16.7%
WAGE / INCOME GAP [ % ]
83.3¢/ $1
WAGE / INCOME GAP [ $ ]
$11,830
FAMILY INCOME DEFICIT
0.47
INEQUALITY / GINI INDEX
1,609,456
TOTAL POPULATION
810,974
MALE POPULATION
798,482
FEMALE POPULATION
101.56
MALES / 100 FEMALES
98.46
FEMALES / 100 MALES
34.4
MEDIAN AGE
3.3
AVG FAMILY SIZE
2.7
AVG HOUSEHOLD SIZE
858,275
LABOR FORCE [ PEOPLE ]
68.1%
PERCENT IN LABOR FORCE
5.2%
UNEMPLOYMENT RATE
Phoenix Zip Codes
Income in Phoenix
Income Overview in Phoenix
Per Capita Income in Phoenix is $37,499, while median incomes of families and households are $84,018 and $72,092 respectively.
| Characteristic | Number | Measure |
| Per Capita Income | 1,609,456 | $37,499 |
| Median Family Income | 374,341 | $84,018 |
| Mean Family Income | 374,341 | $112,760 |
| Median Household Income | 591,169 | $72,092 |
| Mean Household Income | 591,169 | $99,862 |
| Income Deficit | 374,341 | $11,830 |
| Wage / Income Gap (%) | 1,609,456 | 16.66% |
| Wage / Income Gap ($) | 1,609,456 | 83.34¢ per $1 |
| Gini / Inequality Index | 1,609,456 | 0.47 |
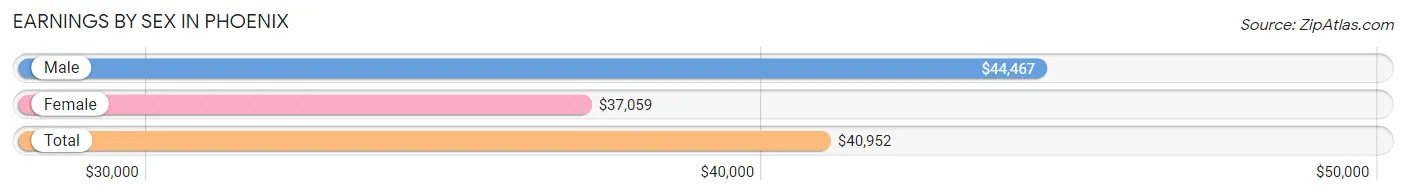
Earnings by Sex in Phoenix
Average Earnings in Phoenix are $40,952, $44,467 for men and $37,059 for women, a difference of 16.7%.
| Sex | Number | Average Earnings |
| Male | 475,450 (54.0%) | $44,467 |
| Female | 404,334 (46.0%) | $37,059 |
| Total | 879,784 (100.0%) | $40,952 |
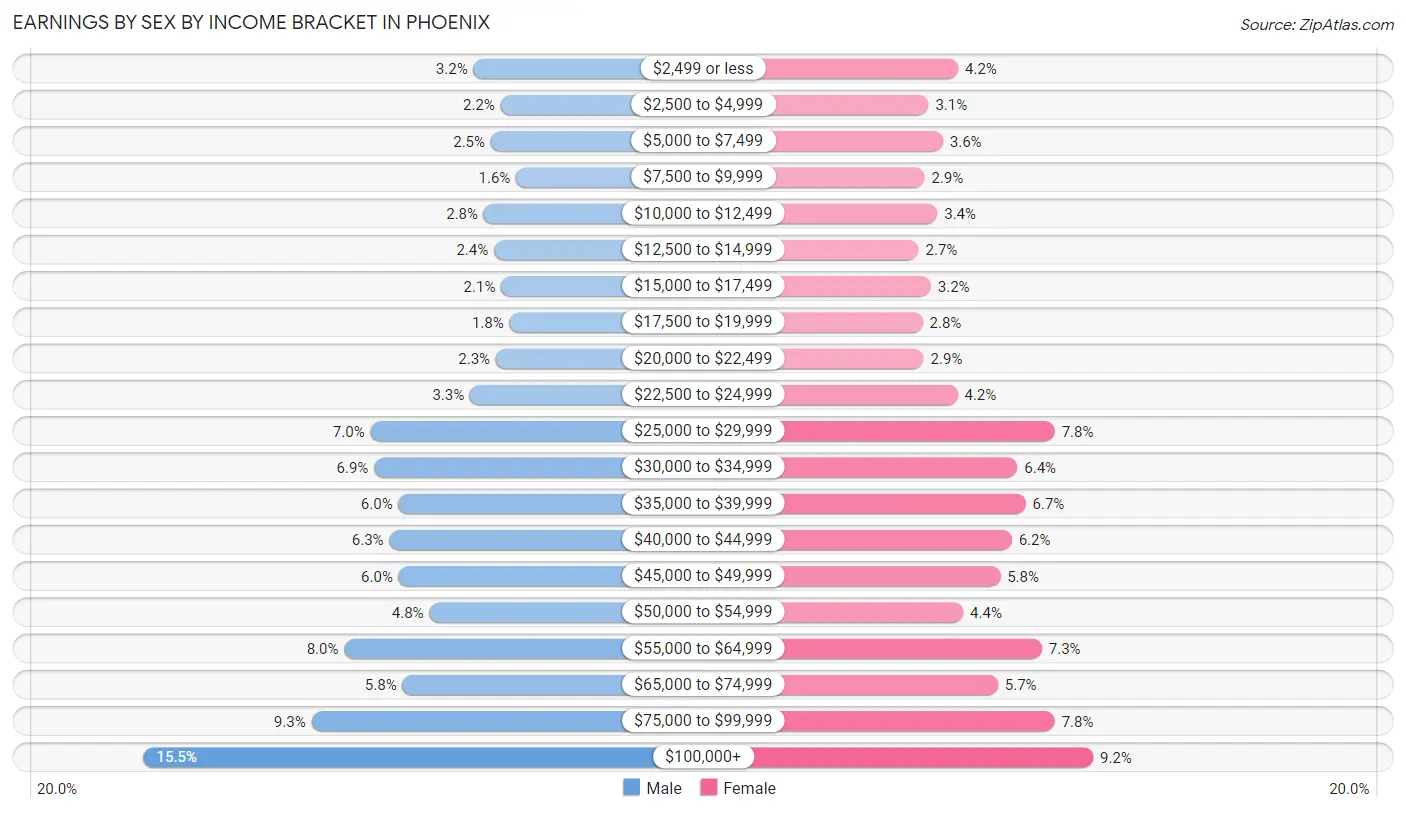
Earnings by Sex by Income Bracket in Phoenix
The most common earnings brackets in Phoenix are $100,000+ for men (73,899 | 15.5%) and $100,000+ for women (37,302 | 9.2%).
| Income | Male | Female |
| $2,499 or less | 15,142 (3.2%) | 16,865 (4.2%) |
| $2,500 to $4,999 | 10,292 (2.2%) | 12,383 (3.1%) |
| $5,000 to $7,499 | 12,032 (2.5%) | 14,546 (3.6%) |
| $7,500 to $9,999 | 7,514 (1.6%) | 11,768 (2.9%) |
| $10,000 to $12,499 | 13,257 (2.8%) | 13,707 (3.4%) |
| $12,500 to $14,999 | 11,443 (2.4%) | 10,868 (2.7%) |
| $15,000 to $17,499 | 10,157 (2.1%) | 12,721 (3.2%) |
| $17,500 to $19,999 | 8,706 (1.8%) | 11,496 (2.8%) |
| $20,000 to $22,499 | 11,141 (2.3%) | 11,639 (2.9%) |
| $22,500 to $24,999 | 15,738 (3.3%) | 16,766 (4.2%) |
| $25,000 to $29,999 | 33,474 (7.0%) | 31,517 (7.8%) |
| $30,000 to $34,999 | 32,820 (6.9%) | 25,835 (6.4%) |
| $35,000 to $39,999 | 28,469 (6.0%) | 27,086 (6.7%) |
| $40,000 to $44,999 | 30,113 (6.3%) | 24,998 (6.2%) |
| $45,000 to $49,999 | 28,429 (6.0%) | 23,266 (5.8%) |
| $50,000 to $54,999 | 22,944 (4.8%) | 17,612 (4.4%) |
| $55,000 to $64,999 | 38,111 (8.0%) | 29,567 (7.3%) |
| $65,000 to $74,999 | 27,782 (5.8%) | 22,883 (5.7%) |
| $75,000 to $99,999 | 43,987 (9.2%) | 31,509 (7.8%) |
| $100,000+ | 73,899 (15.5%) | 37,302 (9.2%) |
| Total | 475,450 (100.0%) | 404,334 (100.0%) |
Earnings by Sex by Educational Attainment in Phoenix
Average earnings in Phoenix are $49,775 for men and $41,820 for women, a difference of 16.0%. Men with an educational attainment of graduate degree enjoy the highest average annual earnings of $97,655, while those with less than high school education earn the least with $34,508. Women with an educational attainment of graduate degree earn the most with the average annual earnings of $71,163, while those with less than high school education have the smallest earnings of $25,575.

| Educational Attainment | Male Income | Female Income |
| Less than High School | $34,508 | $25,575 |
| High School Diploma | $40,492 | $31,749 |
| College or Associate's Degree | $48,084 | $39,886 |
| Bachelor's Degree | $75,137 | $55,362 |
| Graduate Degree | $97,655 | $71,163 |
| Total | $49,775 | $41,820 |
Family Income in Phoenix
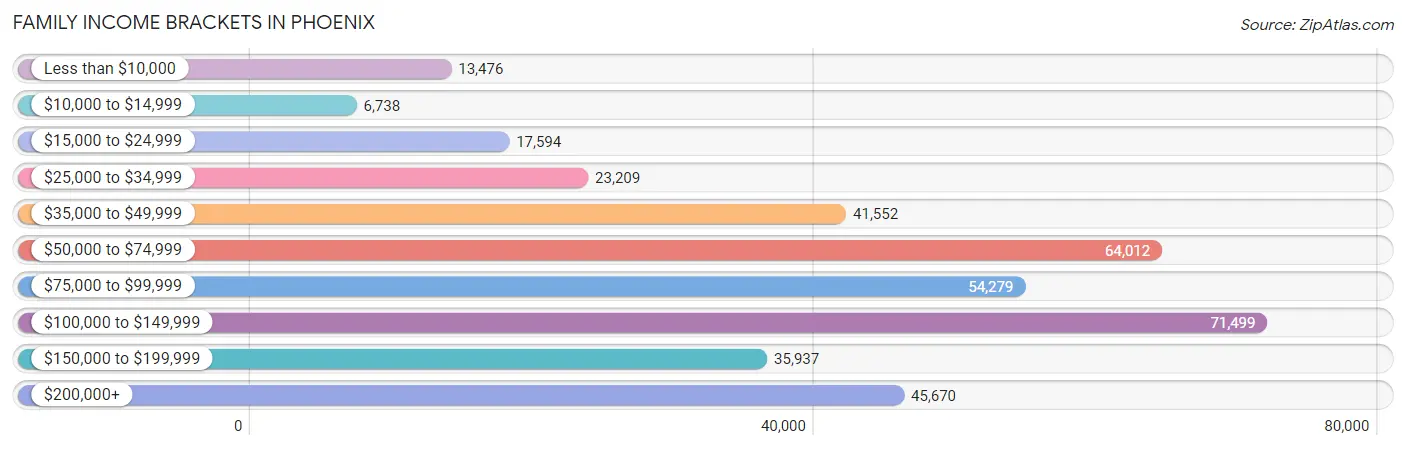
Family Income Brackets in Phoenix
According to the Phoenix family income data, there are 71,499 families falling into the $100,000 to $149,999 income range, which is the most common income bracket and makes up 19.1% of all families. Conversely, the $10,000 to $14,999 income bracket is the least frequent group with only 6,738 families (1.8%) belonging to this category.
| Income Bracket | # Families | % Families |
| Less than $10,000 | 13,476 | 3.6% |
| $10,000 to $14,999 | 6,738 | 1.8% |
| $15,000 to $24,999 | 17,594 | 4.7% |
| $25,000 to $34,999 | 23,209 | 6.2% |
| $35,000 to $49,999 | 41,552 | 11.1% |
| $50,000 to $74,999 | 64,012 | 17.1% |
| $75,000 to $99,999 | 54,279 | 14.5% |
| $100,000 to $149,999 | 71,499 | 19.1% |
| $150,000 to $199,999 | 35,937 | 9.6% |
| $200,000+ | 45,670 | 12.2% |
Family Income by Famaliy Size in Phoenix
4-person families (69,811 | 18.6%) account for the highest median family income in Phoenix with $91,496 per family, while 2-person families (151,730 | 40.5%) have the highest median income of $39,593 per family member.
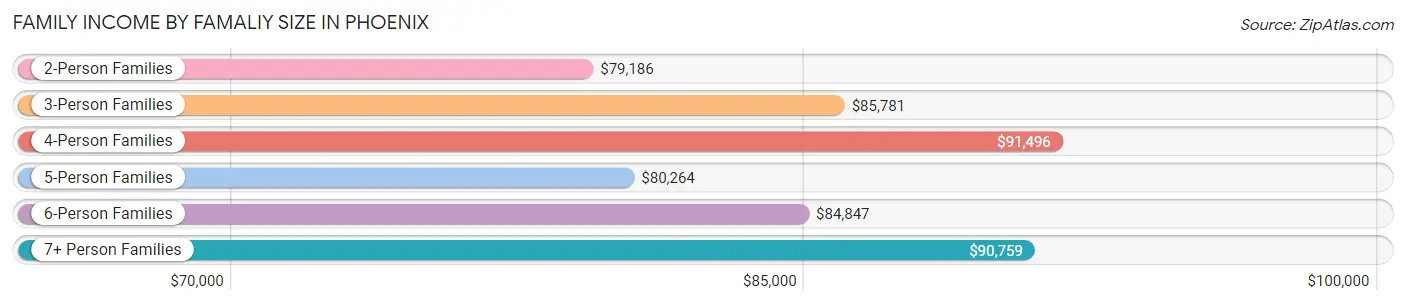
| Income Bracket | # Families | Median Income |
| 2-Person Families | 151,730 (40.5%) | $79,186 |
| 3-Person Families | 83,692 (22.4%) | $85,781 |
| 4-Person Families | 69,811 (18.6%) | $91,496 |
| 5-Person Families | 38,558 (10.3%) | $80,264 |
| 6-Person Families | 17,943 (4.8%) | $84,847 |
| 7+ Person Families | 12,607 (3.4%) | $90,759 |
| Total | 374,341 (100.0%) | $84,018 |
Family Income by Number of Earners in Phoenix
The median family income in Phoenix is $84,018, with families comprising 3+ earners (48,988) having the highest median family income of $127,026, while families with no earners (40,449) have the lowest median family income of $40,151, accounting for 13.1% and 10.8% of families, respectively.
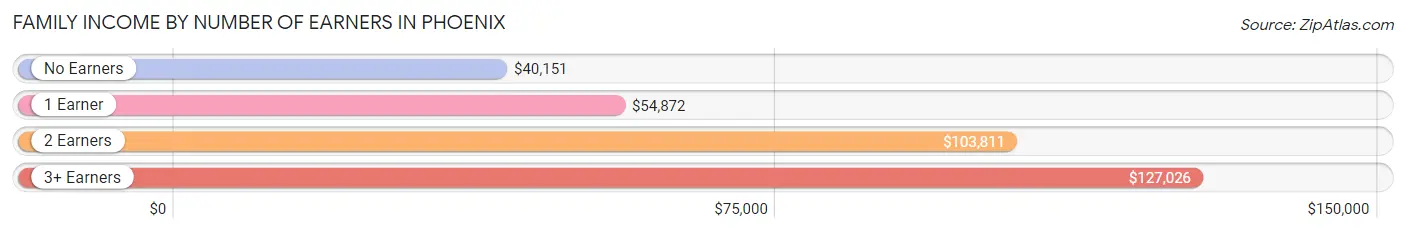
| Number of Earners | # Families | Median Income |
| No Earners | 40,449 (10.8%) | $40,151 |
| 1 Earner | 125,767 (33.6%) | $54,872 |
| 2 Earners | 159,137 (42.5%) | $103,811 |
| 3+ Earners | 48,988 (13.1%) | $127,026 |
| Total | 374,341 (100.0%) | $84,018 |
Household Income in Phoenix
Household Income Brackets in Phoenix
With 105,228 households falling in the category, the $50,000 to $74,999 income range is the most frequent in Phoenix, accounting for 17.8% of all households. In contrast, only 18,917 households (3.2%) fall into the $10,000 to $14,999 income bracket, making it the least populous group.
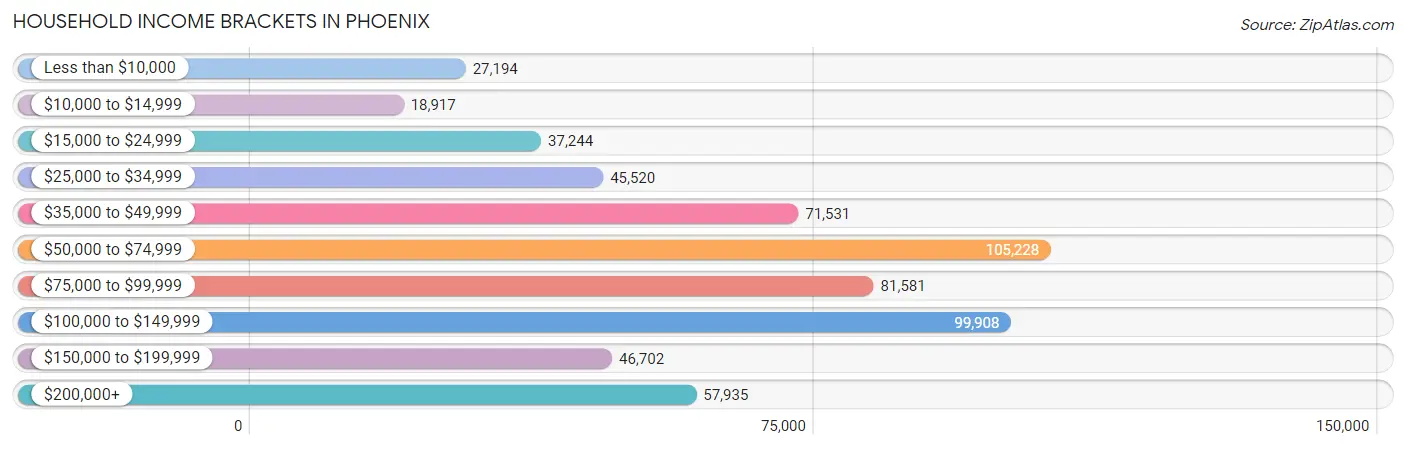
| Income Bracket | # Households | % Households |
| Less than $10,000 | 27,194 | 4.6% |
| $10,000 to $14,999 | 18,917 | 3.2% |
| $15,000 to $24,999 | 37,244 | 6.3% |
| $25,000 to $34,999 | 45,520 | 7.7% |
| $35,000 to $49,999 | 71,531 | 12.1% |
| $50,000 to $74,999 | 105,228 | 17.8% |
| $75,000 to $99,999 | 81,581 | 13.8% |
| $100,000 to $149,999 | 99,908 | 16.9% |
| $150,000 to $199,999 | 46,702 | 7.9% |
| $200,000+ | 57,935 | 9.8% |
Household Income by Householder Age in Phoenix
The median household income in Phoenix is $72,092, with the highest median household income of $83,620 found in the 45 to 64 years age bracket for the primary householder. A total of 214,231 households (36.2%) fall into this category. Meanwhile, the 15 to 24 years age bracket for the primary householder has the lowest median household income of $49,881, with 28,997 households (4.9%) in this group.
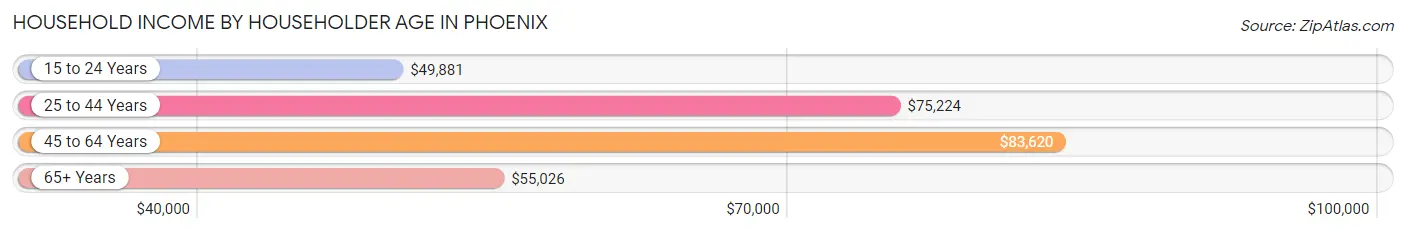
| Income Bracket | # Households | Median Income |
| 15 to 24 Years | 28,997 (4.9%) | $49,881 |
| 25 to 44 Years | 234,929 (39.7%) | $75,224 |
| 45 to 64 Years | 214,231 (36.2%) | $83,620 |
| 65+ Years | 113,012 (19.1%) | $55,026 |
| Total | 591,169 (100.0%) | $72,092 |
Poverty in Phoenix
Income Below Poverty by Sex and Age in Phoenix
With 13.5% poverty level for males and 15.8% for females among the residents of Phoenix, 5 year old males and 12 to 14 year old females are the most vulnerable to poverty, with 2,338 males (21.8%) and 7,518 females (23.3%) in their respective age groups living below the poverty level.
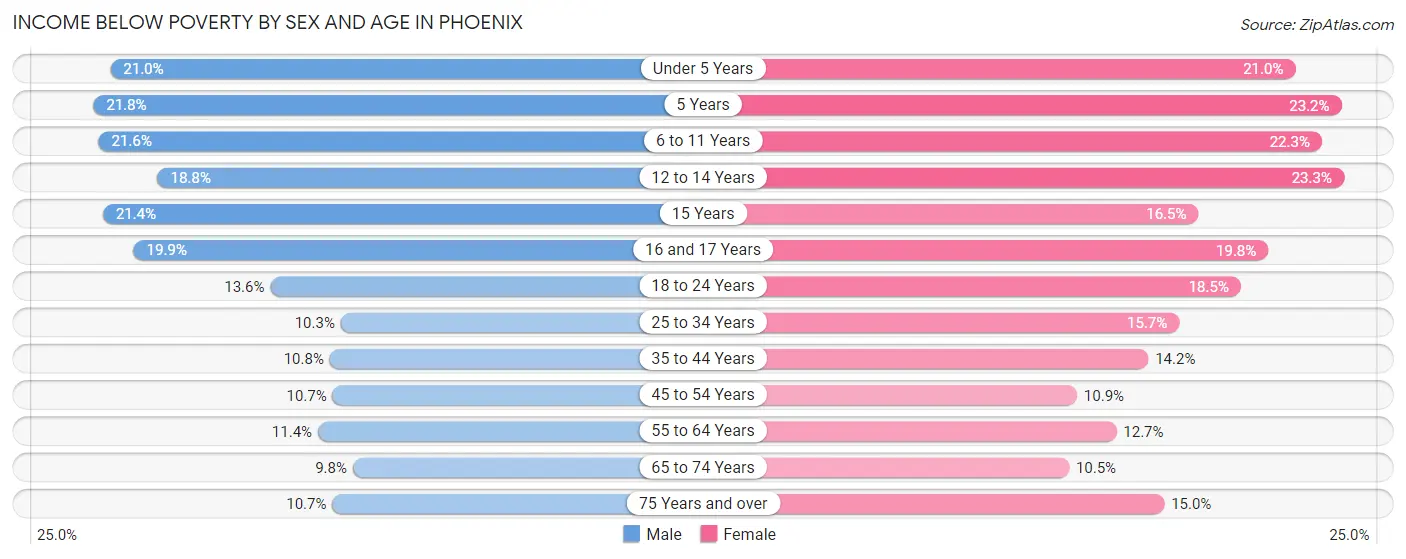
| Age Bracket | Male | Female |
| Under 5 Years | 10,864 (21.0%) | 10,591 (21.0%) |
| 5 Years | 2,338 (21.8%) | 2,373 (23.2%) |
| 6 to 11 Years | 14,504 (21.6%) | 13,849 (22.3%) |
| 12 to 14 Years | 6,734 (18.8%) | 7,518 (23.3%) |
| 15 Years | 2,613 (21.4%) | 1,805 (16.5%) |
| 16 and 17 Years | 4,441 (19.9%) | 4,411 (19.8%) |
| 18 to 24 Years | 10,949 (13.6%) | 14,297 (18.5%) |
| 25 to 34 Years | 13,494 (10.3%) | 20,256 (15.7%) |
| 35 to 44 Years | 12,399 (10.8%) | 15,426 (14.2%) |
| 45 to 54 Years | 10,865 (10.7%) | 10,838 (10.9%) |
| 55 to 64 Years | 10,012 (11.4%) | 11,178 (12.7%) |
| 65 to 74 Years | 5,197 (9.8%) | 6,374 (10.5%) |
| 75 Years and over | 3,187 (10.7%) | 5,875 (15.0%) |
| Total | 107,597 (13.5%) | 124,791 (15.8%) |
Income Above Poverty by Sex and Age in Phoenix
According to the poverty statistics in Phoenix, males aged 65 to 74 years and females aged 65 to 74 years are the age groups that are most secure financially, with 90.2% of males and 89.5% of females in these age groups living above the poverty line.
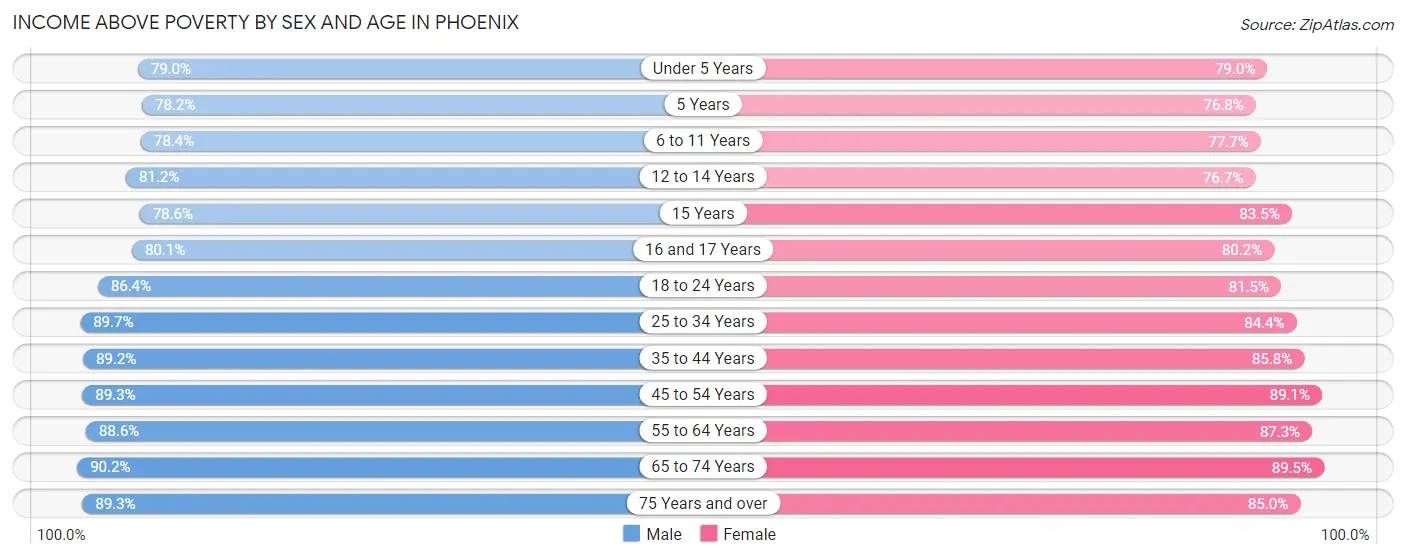
| Age Bracket | Male | Female |
| Under 5 Years | 40,821 (79.0%) | 39,749 (79.0%) |
| 5 Years | 8,383 (78.2%) | 7,864 (76.8%) |
| 6 to 11 Years | 52,749 (78.4%) | 48,331 (77.7%) |
| 12 to 14 Years | 29,019 (81.2%) | 24,762 (76.7%) |
| 15 Years | 9,617 (78.6%) | 9,108 (83.5%) |
| 16 and 17 Years | 17,830 (80.1%) | 17,892 (80.2%) |
| 18 to 24 Years | 69,571 (86.4%) | 62,932 (81.5%) |
| 25 to 34 Years | 117,125 (89.7%) | 109,165 (84.4%) |
| 35 to 44 Years | 102,018 (89.2%) | 93,081 (85.8%) |
| 45 to 54 Years | 90,608 (89.3%) | 88,526 (89.1%) |
| 55 to 64 Years | 77,867 (88.6%) | 76,589 (87.3%) |
| 65 to 74 Years | 48,010 (90.2%) | 54,112 (89.5%) |
| 75 Years and over | 26,535 (89.3%) | 33,402 (85.0%) |
| Total | 690,153 (86.5%) | 665,513 (84.2%) |
Income Below Poverty Among Married-Couple Families in Phoenix
The poverty statistics for married-couple families in Phoenix show that 6.2% or 15,120 of the total 243,135 families live below the poverty line. Families with 5 or more children have the highest poverty rate of 27.4%, comprising of 823 families. On the other hand, families with no children have the lowest poverty rate of 3.7%, which includes 4,638 families.
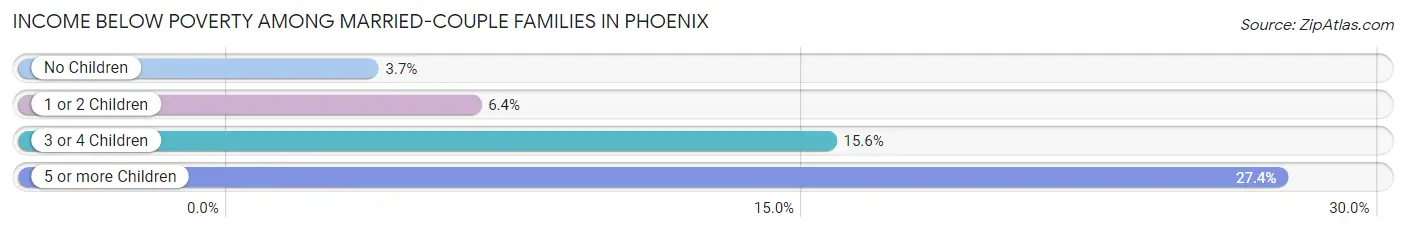
| Children | Above Poverty | Below Poverty |
| No Children | 121,693 (96.3%) | 4,638 (3.7%) |
| 1 or 2 Children | 82,015 (93.6%) | 5,561 (6.4%) |
| 3 or 4 Children | 22,128 (84.4%) | 4,098 (15.6%) |
| 5 or more Children | 2,179 (72.6%) | 823 (27.4%) |
| Total | 228,015 (93.8%) | 15,120 (6.2%) |
Income Below Poverty Among Single-Parent Households in Phoenix
According to the poverty data in Phoenix, 12.5% or 5,444 single-father households and 23.0% or 20,137 single-mother households are living below the poverty line. Among single-father households, those with 5 or more children have the highest poverty rate, with 224 households (41.0%) experiencing poverty. Likewise, among single-mother households, those with 5 or more children have the highest poverty rate, with 1,178 households (66.1%) falling below the poverty line.
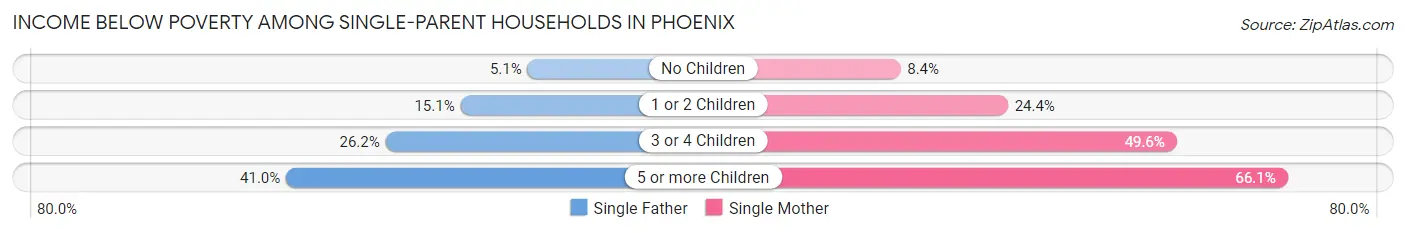
| Children | Single Father | Single Mother |
| No Children | 896 (5.1%) | 2,556 (8.4%) |
| 1 or 2 Children | 3,067 (15.0%) | 10,900 (24.4%) |
| 3 or 4 Children | 1,257 (26.2%) | 5,503 (49.6%) |
| 5 or more Children | 224 (41.0%) | 1,178 (66.1%) |
| Total | 5,444 (12.5%) | 20,137 (23.0%) |
Income Below Poverty Among Married-Couple vs Single-Parent Households in Phoenix
The poverty data for Phoenix shows that 15,120 of the married-couple family households (6.2%) and 25,581 of the single-parent households (19.5%) are living below the poverty level. Within the married-couple family households, those with 5 or more children have the highest poverty rate, with 823 households (27.4%) falling below the poverty line. Among the single-parent households, those with 5 or more children have the highest poverty rate, with 1,402 household (60.3%) living below poverty.
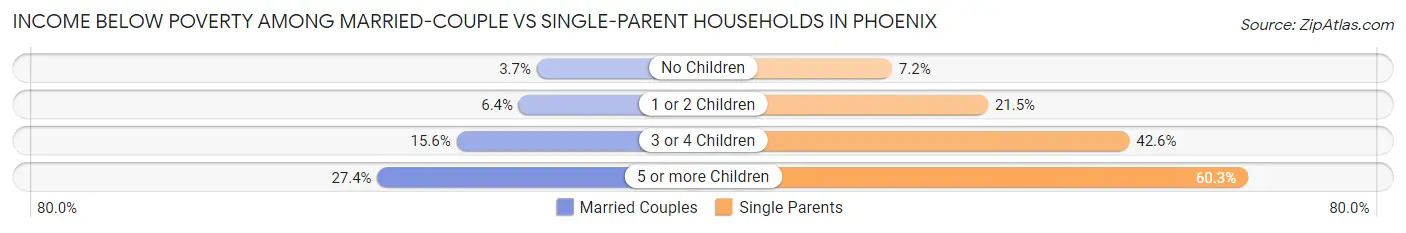
| Children | Married-Couple Families | Single-Parent Households |
| No Children | 4,638 (3.7%) | 3,452 (7.2%) |
| 1 or 2 Children | 5,561 (6.4%) | 13,967 (21.5%) |
| 3 or 4 Children | 4,098 (15.6%) | 6,760 (42.6%) |
| 5 or more Children | 823 (27.4%) | 1,402 (60.3%) |
| Total | 15,120 (6.2%) | 25,581 (19.5%) |
Race in Phoenix
The most populous races in Phoenix are White / Caucasian (956,717 | 59.4%), Hispanic or Latino (691,205 | 42.9%), and Two or more Races (271,244 | 16.9%).
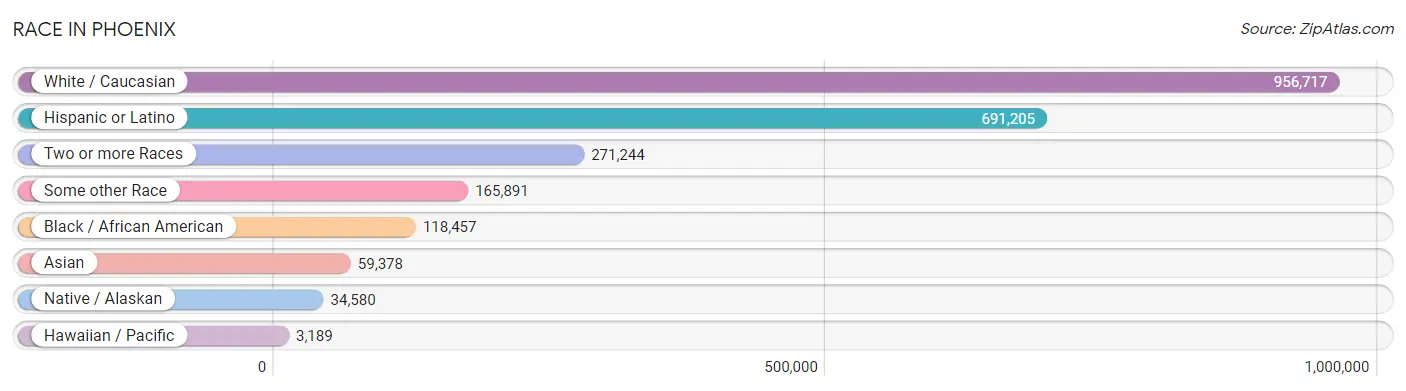
| Race | # Population | % Population |
| Asian | 59,378 | 3.7% |
| Black / African American | 118,457 | 7.4% |
| Hawaiian / Pacific | 3,189 | 0.2% |
| Hispanic or Latino | 691,205 | 42.9% |
| Native / Alaskan | 34,580 | 2.1% |
| White / Caucasian | 956,717 | 59.4% |
| Two or more Races | 271,244 | 16.9% |
| Some other Race | 165,891 | 10.3% |
| Total | 1,609,456 | 100.0% |
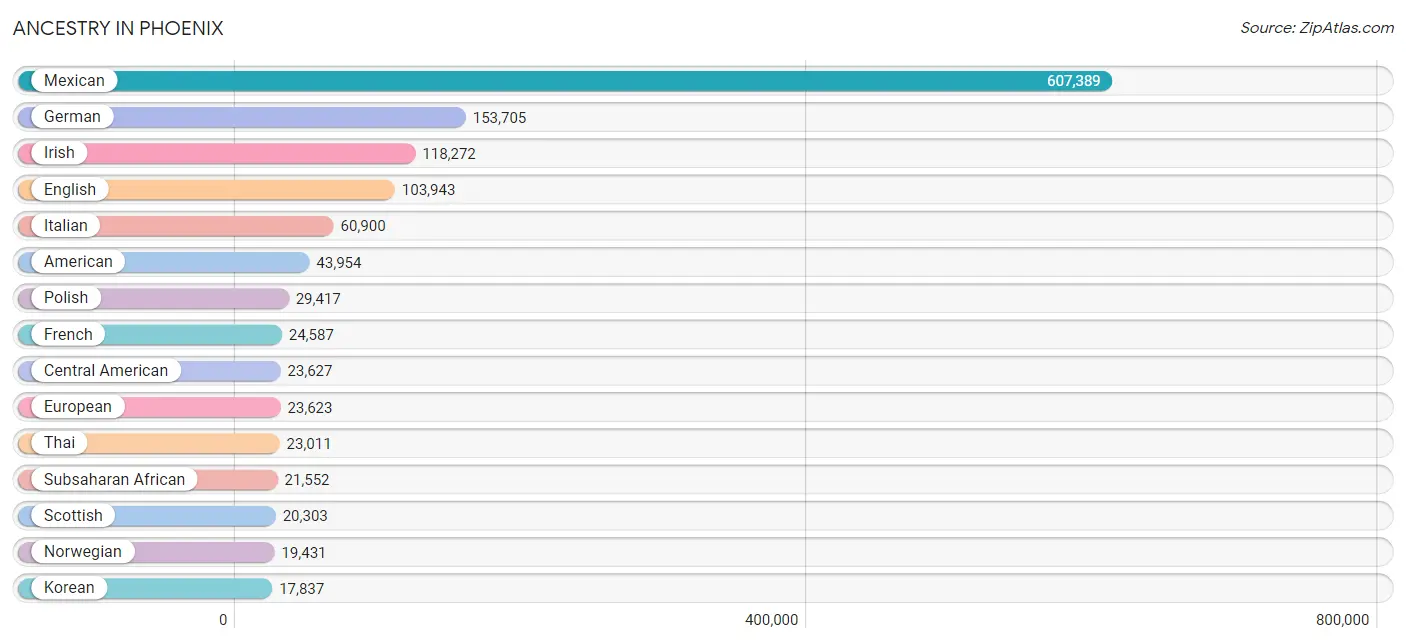
Ancestry in Phoenix
The most populous ancestries reported in Phoenix are Mexican (607,389 | 37.7%), German (153,705 | 9.6%), Irish (118,272 | 7.3%), English (103,943 | 6.5%), and Italian (60,900 | 3.8%), together accounting for 64.9% of all Phoenix residents.
| Ancestry | # Population | % Population |
| Afghan | 1,529 | 0.1% |
| African | 9,764 | 0.6% |
| Alaska Native | 144 | 0.0% |
| Alaskan Athabascan | 112 | 0.0% |
| Albanian | 1,079 | 0.1% |
| Alsatian | 8 | 0.0% |
| American | 43,954 | 2.7% |
| Apache | 2,270 | 0.1% |
| Arab | 10,442 | 0.6% |
| Argentinean | 788 | 0.1% |
| Armenian | 1,574 | 0.1% |
| Assyrian / Chaldean / Syriac | 1,481 | 0.1% |
| Australian | 464 | 0.0% |
| Austrian | 2,500 | 0.2% |
| Bahamian | 35 | 0.0% |
| Bangladeshi | 46 | 0.0% |
| Barbadian | 96 | 0.0% |
| Basque | 315 | 0.0% |
| Belgian | 806 | 0.1% |
| Belizean | 357 | 0.0% |
| Bhutanese | 4,713 | 0.3% |
| Blackfeet | 633 | 0.0% |
| Bolivian | 386 | 0.0% |
| Brazilian | 1,580 | 0.1% |
| British | 8,261 | 0.5% |
| British West Indian | 139 | 0.0% |
| Bulgarian | 935 | 0.1% |
| Burmese | 4,860 | 0.3% |
| Cajun | 174 | 0.0% |
| Cambodian | 206 | 0.0% |
| Canadian | 3,792 | 0.2% |
| Cape Verdean | 69 | 0.0% |
| Carpatho Rusyn | 21 | 0.0% |
| Celtic | 200 | 0.0% |
| Central American | 23,627 | 1.5% |
| Central American Indian | 2,169 | 0.1% |
| Cherokee | 4,115 | 0.3% |
| Cheyenne | 45 | 0.0% |
| Chickasaw | 381 | 0.0% |
| Chilean | 418 | 0.0% |
| Chippewa | 661 | 0.0% |
| Choctaw | 1,139 | 0.1% |
| Colombian | 3,485 | 0.2% |
| Colville | 153 | 0.0% |
| Comanche | 99 | 0.0% |
| Costa Rican | 537 | 0.0% |
| Cree | 118 | 0.0% |
| Creek | 281 | 0.0% |
| Croatian | 2,334 | 0.2% |
| Crow | 9 | 0.0% |
| Cuban | 6,015 | 0.4% |
| Cypriot | 113 | 0.0% |
| Czech | 5,061 | 0.3% |
| Czechoslovakian | 1,752 | 0.1% |
| Danish | 6,336 | 0.4% |
| Delaware | 233 | 0.0% |
| Dominican | 1,960 | 0.1% |
| Dutch | 11,548 | 0.7% |
| Dutch West Indian | 22 | 0.0% |
| Eastern European | 4,574 | 0.3% |
| Ecuadorian | 1,167 | 0.1% |
| Egyptian | 725 | 0.1% |
| English | 103,943 | 6.5% |
| Estonian | 115 | 0.0% |
| Ethiopian | 2,718 | 0.2% |
| European | 23,623 | 1.5% |
| Fijian | 671 | 0.0% |
| Filipino | 563 | 0.0% |
| Finnish | 2,377 | 0.2% |
| French | 24,587 | 1.5% |
| French American Indian | 227 | 0.0% |
| French Canadian | 4,130 | 0.3% |
| German | 153,705 | 9.6% |
| German Russian | 63 | 0.0% |
| Ghanaian | 295 | 0.0% |
| Greek | 4,884 | 0.3% |
| Guamanian / Chamorro | 1,050 | 0.1% |
| Guatemalan | 12,447 | 0.8% |
| Guyanese | 256 | 0.0% |
| Haitian | 665 | 0.0% |
| Honduran | 1,960 | 0.1% |
| Hopi | 1,675 | 0.1% |
| Houma | 192 | 0.0% |
| Hungarian | 5,084 | 0.3% |
| Icelander | 145 | 0.0% |
| Indian (Asian) | 12,250 | 0.8% |
| Indonesian | 2,555 | 0.2% |
| Inupiat | 77 | 0.0% |
| Iranian | 1,895 | 0.1% |
| Iraqi | 2,893 | 0.2% |
| Irish | 118,272 | 7.3% |
| Iroquois | 373 | 0.0% |
| Israeli | 461 | 0.0% |
| Italian | 60,900 | 3.8% |
| Jamaican | 1,801 | 0.1% |
| Japanese | 631 | 0.0% |
| Jordanian | 297 | 0.0% |
| Kenyan | 690 | 0.0% |
| Kiowa | 16 | 0.0% |
| Korean | 17,837 | 1.1% |
| Laotian | 371 | 0.0% |
| Latvian | 317 | 0.0% |
| Lebanese | 2,741 | 0.2% |
| Liberian | 843 | 0.1% |
| Lithuanian | 2,765 | 0.2% |
| Lumbee | 43 | 0.0% |
| Luxembourger | 209 | 0.0% |
| Macedonian | 113 | 0.0% |
| Malaysian | 1,299 | 0.1% |
| Maltese | 35 | 0.0% |
| Menominee | 25 | 0.0% |
| Mexican | 607,389 | 37.7% |
| Mexican American Indian | 4,766 | 0.3% |
| Mongolian | 60 | 0.0% |
| Moroccan | 307 | 0.0% |
| Native Hawaiian | 2,004 | 0.1% |
| Navajo | 17,384 | 1.1% |
| New Zealander | 143 | 0.0% |
| Nicaraguan | 1,227 | 0.1% |
| Nigerian | 1,767 | 0.1% |
| Northern European | 2,220 | 0.1% |
| Norwegian | 19,431 | 1.2% |
| Okinawan | 24 | 0.0% |
| Osage | 43 | 0.0% |
| Paiute | 133 | 0.0% |
| Pakistani | 964 | 0.1% |
| Palestinian | 345 | 0.0% |
| Panamanian | 944 | 0.1% |
| Paraguayan | 23 | 0.0% |
| Pennsylvania German | 270 | 0.0% |
| Peruvian | 1,534 | 0.1% |
| Pima | 3,063 | 0.2% |
| Polish | 29,417 | 1.8% |
| Portuguese | 3,144 | 0.2% |
| Potawatomi | 52 | 0.0% |
| Pueblo | 785 | 0.1% |
| Puerto Rican | 12,504 | 0.8% |
| Puget Sound Salish | 14 | 0.0% |
| Romanian | 4,563 | 0.3% |
| Russian | 10,082 | 0.6% |
| Salvadoran | 6,379 | 0.4% |
| Samoan | 1,012 | 0.1% |
| Scandinavian | 4,820 | 0.3% |
| Scotch-Irish | 8,410 | 0.5% |
| Scottish | 20,303 | 1.3% |
| Seminole | 20 | 0.0% |
| Senegalese | 170 | 0.0% |
| Serbian | 3,143 | 0.2% |
| Shoshone | 202 | 0.0% |
| Sierra Leonean | 101 | 0.0% |
| Sioux | 836 | 0.1% |
| Slavic | 546 | 0.0% |
| Slovak | 2,017 | 0.1% |
| Slovene | 565 | 0.0% |
| Somali | 1,369 | 0.1% |
| South African | 508 | 0.0% |
| South American | 8,826 | 0.5% |
| South American Indian | 263 | 0.0% |
| Soviet Union | 33 | 0.0% |
| Spaniard | 8,104 | 0.5% |
| Spanish | 5,478 | 0.3% |
| Spanish American | 68 | 0.0% |
| Spanish American Indian | 42 | 0.0% |
| Sri Lankan | 7,743 | 0.5% |
| Subsaharan African | 21,552 | 1.3% |
| Sudanese | 623 | 0.0% |
| Swedish | 16,011 | 1.0% |
| Swiss | 2,415 | 0.2% |
| Syrian | 562 | 0.0% |
| Thai | 23,011 | 1.4% |
| Tlingit-Haida | 92 | 0.0% |
| Tohono O'Odham | 3,078 | 0.2% |
| Tongan | 502 | 0.0% |
| Trinidadian and Tobagonian | 156 | 0.0% |
| Tsimshian | 10 | 0.0% |
| Turkish | 537 | 0.0% |
| U.S. Virgin Islander | 32 | 0.0% |
| Ugandan | 186 | 0.0% |
| Ukrainian | 3,271 | 0.2% |
| Uruguayan | 29 | 0.0% |
| Ute | 27 | 0.0% |
| Venezuelan | 919 | 0.1% |
| Vietnamese | 506 | 0.0% |
| Welsh | 6,683 | 0.4% |
| West Indian | 840 | 0.1% |
| Yakama | 21 | 0.0% |
| Yaqui | 2,927 | 0.2% |
| Yugoslavian | 2,206 | 0.1% |
| Yuman | 428 | 0.0% |
| Yup'ik | 46 | 0.0% |
| Zimbabwean | 37 | 0.0% | View All 191 Rows |
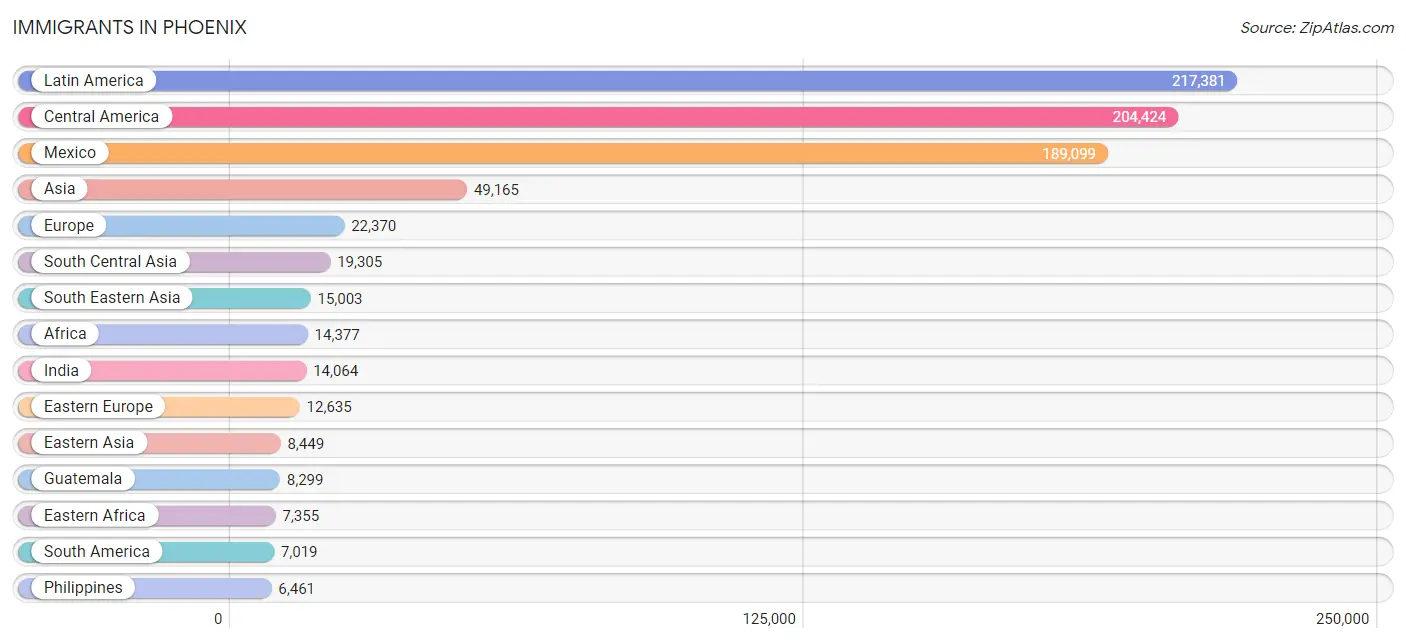
Immigrants in Phoenix
The most numerous immigrant groups reported in Phoenix came from Latin America (217,381 | 13.5%), Central America (204,424 | 12.7%), Mexico (189,099 | 11.7%), Asia (49,165 | 3.0%), and Europe (22,370 | 1.4%), together accounting for 42.4% of all Phoenix residents.
| Immigration Origin | # Population | % Population |
| Afghanistan | 1,398 | 0.1% |
| Africa | 14,377 | 0.9% |
| Albania | 1,101 | 0.1% |
| Argentina | 525 | 0.0% |
| Armenia | 295 | 0.0% |
| Asia | 49,165 | 3.0% |
| Australia | 238 | 0.0% |
| Austria | 123 | 0.0% |
| Azores | 8 | 0.0% |
| Bahamas | 40 | 0.0% |
| Bangladesh | 578 | 0.0% |
| Barbados | 235 | 0.0% |
| Belarus | 153 | 0.0% |
| Belgium | 57 | 0.0% |
| Belize | 110 | 0.0% |
| Bolivia | 120 | 0.0% |
| Bosnia and Herzegovina | 2,328 | 0.1% |
| Brazil | 879 | 0.1% |
| Bulgaria | 747 | 0.1% |
| Cambodia | 333 | 0.0% |
| Cameroon | 113 | 0.0% |
| Canada | 5,694 | 0.4% |
| Caribbean | 5,938 | 0.4% |
| Central America | 204,424 | 12.7% |
| Chile | 243 | 0.0% |
| China | 5,122 | 0.3% |
| Colombia | 1,858 | 0.1% |
| Congo | 459 | 0.0% |
| Costa Rica | 307 | 0.0% |
| Croatia | 605 | 0.0% |
| Cuba | 3,627 | 0.2% |
| Czechoslovakia | 345 | 0.0% |
| Denmark | 118 | 0.0% |
| Dominica | 20 | 0.0% |
| Dominican Republic | 403 | 0.0% |
| Eastern Africa | 7,355 | 0.5% |
| Eastern Asia | 8,449 | 0.5% |
| Eastern Europe | 12,635 | 0.8% |
| Ecuador | 682 | 0.0% |
| Egypt | 414 | 0.0% |
| El Salvador | 3,875 | 0.2% |
| England | 1,543 | 0.1% |
| Eritrea | 1,056 | 0.1% |
| Ethiopia | 2,146 | 0.1% |
| Europe | 22,370 | 1.4% |
| Fiji | 70 | 0.0% |
| France | 930 | 0.1% |
| Germany | 2,403 | 0.2% |
| Ghana | 108 | 0.0% |
| Greece | 196 | 0.0% |
| Grenada | 13 | 0.0% |
| Guatemala | 8,299 | 0.5% |
| Guyana | 304 | 0.0% |
| Haiti | 541 | 0.0% |
| Honduras | 1,433 | 0.1% |
| Hong Kong | 595 | 0.0% |
| Hungary | 514 | 0.0% |
| India | 14,064 | 0.9% |
| Indonesia | 269 | 0.0% |
| Iran | 1,266 | 0.1% |
| Iraq | 3,521 | 0.2% |
| Ireland | 245 | 0.0% |
| Israel | 254 | 0.0% |
| Italy | 1,205 | 0.1% |
| Jamaica | 736 | 0.1% |
| Japan | 971 | 0.1% |
| Jordan | 271 | 0.0% |
| Kazakhstan | 86 | 0.0% |
| Kenya | 1,090 | 0.1% |
| Korea | 2,292 | 0.1% |
| Kuwait | 119 | 0.0% |
| Laos | 426 | 0.0% |
| Latin America | 217,381 | 13.5% |
| Latvia | 9 | 0.0% |
| Lebanon | 409 | 0.0% |
| Liberia | 588 | 0.0% |
| Lithuania | 188 | 0.0% |
| Malaysia | 530 | 0.0% |
| Mexico | 189,099 | 11.7% |
| Micronesia | 218 | 0.0% |
| Middle Africa | 1,728 | 0.1% |
| Moldova | 71 | 0.0% |
| Morocco | 203 | 0.0% |
| Nepal | 441 | 0.0% |
| Netherlands | 526 | 0.0% |
| Nicaragua | 833 | 0.1% |
| Nigeria | 1,088 | 0.1% |
| Northern Africa | 1,409 | 0.1% |
| Northern Europe | 3,716 | 0.2% |
| Norway | 42 | 0.0% |
| Oceania | 1,381 | 0.1% |
| Pakistan | 556 | 0.0% |
| Panama | 468 | 0.0% |
| Peru | 1,189 | 0.1% |
| Philippines | 6,461 | 0.4% |
| Poland | 1,247 | 0.1% |
| Portugal | 113 | 0.0% |
| Romania | 2,254 | 0.1% |
| Russia | 900 | 0.1% |
| Saudi Arabia | 250 | 0.0% |
| Scotland | 144 | 0.0% |
| Senegal | 72 | 0.0% |
| Serbia | 428 | 0.0% |
| Sierra Leone | 72 | 0.0% |
| Singapore | 108 | 0.0% |
| Somalia | 596 | 0.0% |
| South Africa | 568 | 0.0% |
| South America | 7,019 | 0.4% |
| South Central Asia | 19,305 | 1.2% |
| South Eastern Asia | 15,003 | 0.9% |
| Southern Europe | 1,821 | 0.1% |
| Spain | 307 | 0.0% |
| Sri Lanka | 155 | 0.0% |
| Sudan | 687 | 0.0% |
| Sweden | 302 | 0.0% |
| Switzerland | 108 | 0.0% |
| Syria | 557 | 0.0% |
| Taiwan | 1,124 | 0.1% |
| Thailand | 776 | 0.1% |
| Trinidad and Tobago | 253 | 0.0% |
| Turkey | 254 | 0.0% |
| Uganda | 330 | 0.0% |
| Ukraine | 721 | 0.0% |
| Uruguay | 64 | 0.0% |
| Uzbekistan | 403 | 0.0% |
| Venezuela | 1,065 | 0.1% |
| Vietnam | 4,273 | 0.3% |
| Western Africa | 2,481 | 0.2% |
| Western Asia | 6,234 | 0.4% |
| Western Europe | 4,173 | 0.3% |
| Yemen | 54 | 0.0% |
| Zaire | 1,115 | 0.1% |
| Zimbabwe | 85 | 0.0% | View All 133 Rows |
Sex and Age in Phoenix
Sex and Age in Phoenix
The most populous age groups in Phoenix are 30 to 34 Years (67,824 | 8.4%) for men and 25 to 29 Years (66,698 | 8.4%) for women.
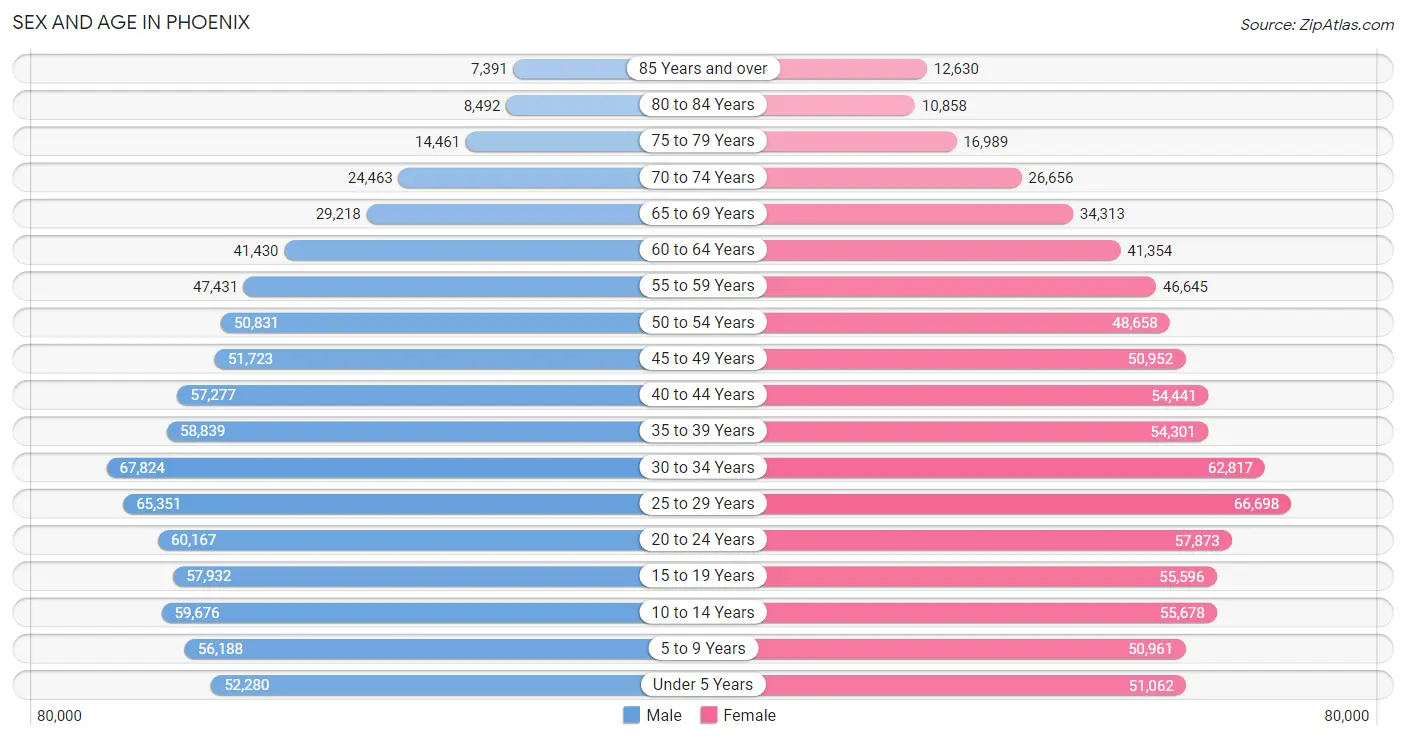
| Age Bracket | Male | Female |
| Under 5 Years | 52,280 (6.5%) | 51,062 (6.4%) |
| 5 to 9 Years | 56,188 (6.9%) | 50,961 (6.4%) |
| 10 to 14 Years | 59,676 (7.4%) | 55,678 (7.0%) |
| 15 to 19 Years | 57,932 (7.1%) | 55,596 (7.0%) |
| 20 to 24 Years | 60,167 (7.4%) | 57,873 (7.2%) |
| 25 to 29 Years | 65,351 (8.1%) | 66,698 (8.4%) |
| 30 to 34 Years | 67,824 (8.4%) | 62,817 (7.9%) |
| 35 to 39 Years | 58,839 (7.3%) | 54,301 (6.8%) |
| 40 to 44 Years | 57,277 (7.1%) | 54,441 (6.8%) |
| 45 to 49 Years | 51,723 (6.4%) | 50,952 (6.4%) |
| 50 to 54 Years | 50,831 (6.3%) | 48,658 (6.1%) |
| 55 to 59 Years | 47,431 (5.9%) | 46,645 (5.8%) |
| 60 to 64 Years | 41,430 (5.1%) | 41,354 (5.2%) |
| 65 to 69 Years | 29,218 (3.6%) | 34,313 (4.3%) |
| 70 to 74 Years | 24,463 (3.0%) | 26,656 (3.3%) |
| 75 to 79 Years | 14,461 (1.8%) | 16,989 (2.1%) |
| 80 to 84 Years | 8,492 (1.1%) | 10,858 (1.4%) |
| 85 Years and over | 7,391 (0.9%) | 12,630 (1.6%) |
| Total | 810,974 (100.0%) | 798,482 (100.0%) |
Families and Households in Phoenix
Median Family Size in Phoenix
The median family size in Phoenix is 3.33 persons per family, with married-couple families (243,135 | 64.9%) accounting for the largest median family size of 3.41 persons per family. On the other hand, single male/father families (43,465 | 11.6%) represent the smallest median family size with 2.95 persons per family.
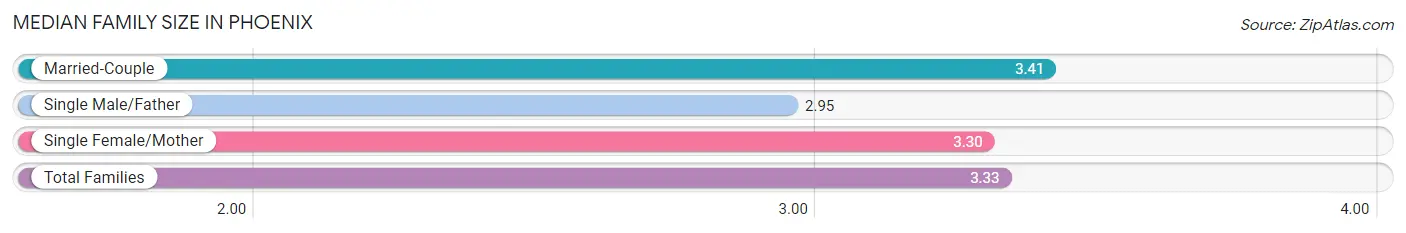
| Family Type | # Families | Family Size |
| Married-Couple | 243,135 (64.9%) | 3.41 |
| Single Male/Father | 43,465 (11.6%) | 2.95 |
| Single Female/Mother | 87,741 (23.4%) | 3.30 |
| Total Families | 374,341 (100.0%) | 3.33 |
Median Household Size in Phoenix
The median household size in Phoenix is 2.68 persons per household, with single female/mother households (87,741 | 14.8%) accounting for the largest median household size of 3.58 persons per household. non-family households (216,828 | 36.7%) represent the smallest median household size with 1.32 persons per household.
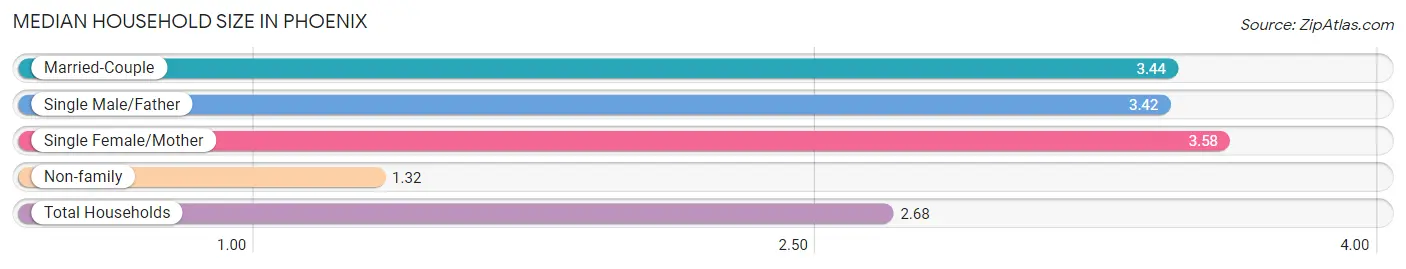
| Household Type | # Households | Household Size |
| Married-Couple | 243,135 (41.1%) | 3.44 |
| Single Male/Father | 43,465 (7.3%) | 3.42 |
| Single Female/Mother | 87,741 (14.8%) | 3.58 |
| Non-family | 216,828 (36.7%) | 1.32 |
| Total Households | 591,169 (100.0%) | 2.68 |
Household Size by Marriage Status in Phoenix
Out of a total of 591,169 households in Phoenix, 374,341 (63.3%) are family households, while 216,828 (36.7%) are nonfamily households. The most numerous type of family households are 2-person households, comprising 135,314, and the most common type of nonfamily households are 1-person households, comprising 164,711.
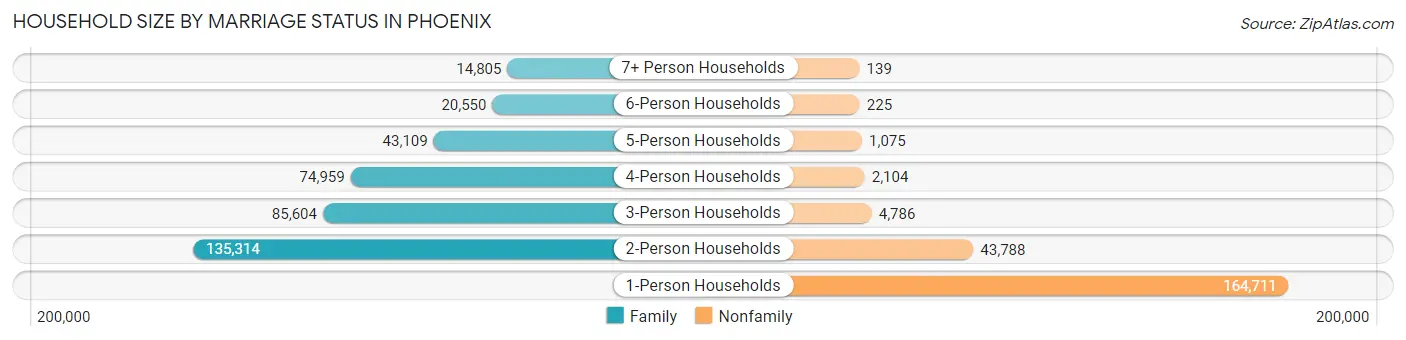
| Household Size | Family Households | Nonfamily Households |
| 1-Person Households | - | 164,711 (27.9%) |
| 2-Person Households | 135,314 (22.9%) | 43,788 (7.4%) |
| 3-Person Households | 85,604 (14.5%) | 4,786 (0.8%) |
| 4-Person Households | 74,959 (12.7%) | 2,104 (0.4%) |
| 5-Person Households | 43,109 (7.3%) | 1,075 (0.2%) |
| 6-Person Households | 20,550 (3.5%) | 225 (0.0%) |
| 7+ Person Households | 14,805 (2.5%) | 139 (0.0%) |
| Total | 374,341 (63.3%) | 216,828 (36.7%) |
Female Fertility in Phoenix
Fertility by Age in Phoenix
Average fertility rate in Phoenix is 55.0 births per 1,000 women. Women in the age bracket of 20 to 34 years have the highest fertility rate with 86.0 births per 1,000 women. Women in the age bracket of 20 to 34 years acount for 70.2% of all women with births.
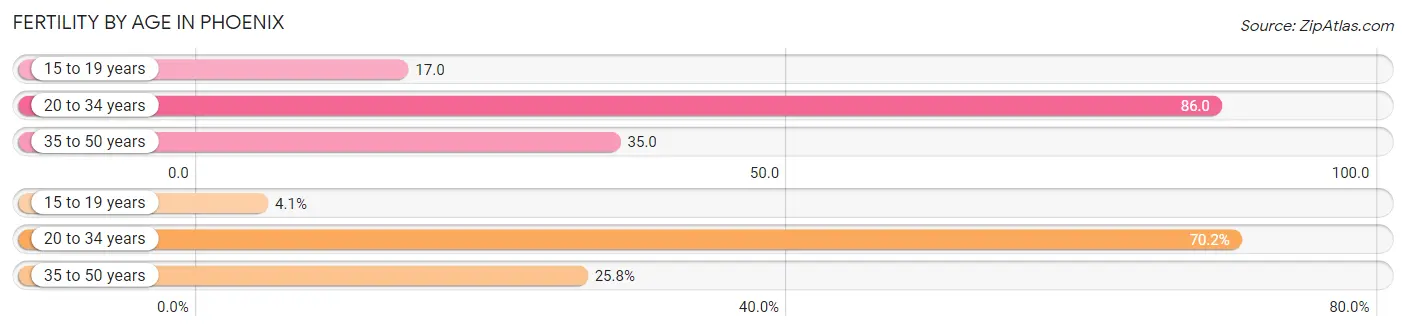
| Age Bracket | Women with Births | Births / 1,000 Women |
| 15 to 19 years | 935 (4.1%) | 17.0 |
| 20 to 34 years | 16,073 (70.2%) | 86.0 |
| 35 to 50 years | 5,904 (25.8%) | 35.0 |
| Total | 22,912 (100.0%) | 55.0 |
Fertility by Age by Marriage Status in Phoenix
60.0% of women with births (22,912) in Phoenix are married. The highest percentage of unmarried women with births falls into 15 to 19 years age bracket with 93.5% of them unmarried at the time of birth, while the lowest percentage of unmarried women with births belong to 35 to 50 years age bracket with 28.4% of them unmarried.
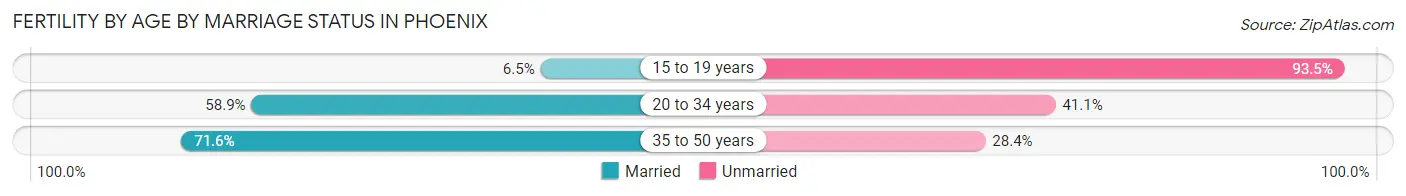
| Age Bracket | Married | Unmarried |
| 15 to 19 years | 61 (6.5%) | 874 (93.5%) |
| 20 to 34 years | 9,467 (58.9%) | 6,606 (41.1%) |
| 35 to 50 years | 4,227 (71.6%) | 1,677 (28.4%) |
| Total | 13,747 (60.0%) | 9,165 (40.0%) |
Fertility by Education in Phoenix
Average fertility rate in Phoenix is 55.0 births per 1,000 women. Women with the education attainment of high school diploma have the highest fertility rate of 72.0 births per 1,000 women, while women with the education attainment of less than high school have the lowest fertility at 42.0 births per 1,000 women. Women with the education attainment of high school diploma represent 29.4% of all women with births.
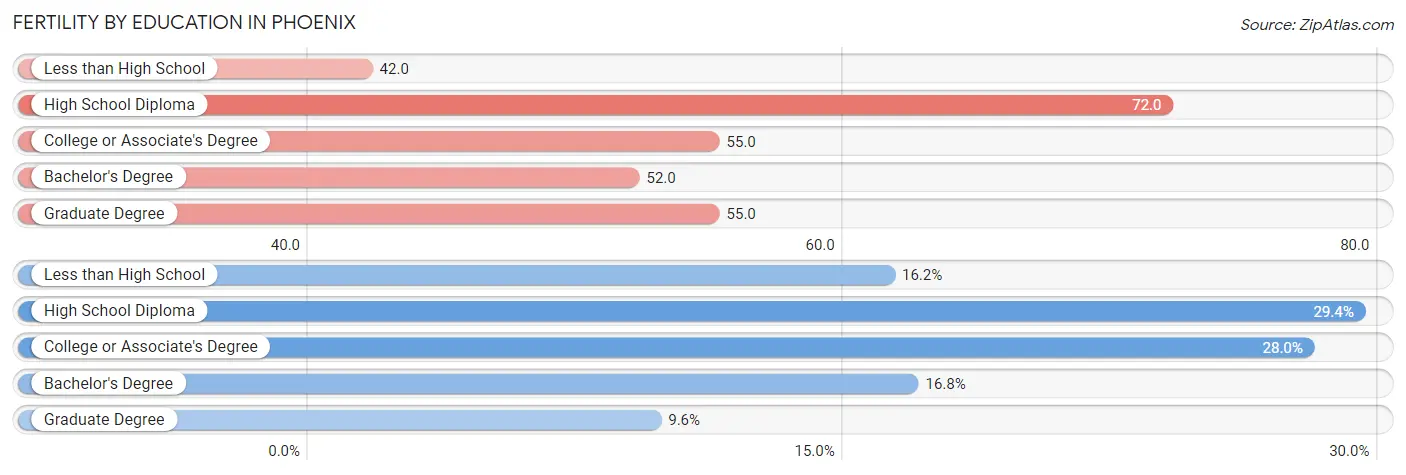
| Educational Attainment | Women with Births | Births / 1,000 Women |
| Less than High School | 3,708 (16.2%) | 42.0 |
| High School Diploma | 6,736 (29.4%) | 72.0 |
| College or Associate's Degree | 6,408 (28.0%) | 55.0 |
| Bachelor's Degree | 3,858 (16.8%) | 52.0 |
| Graduate Degree | 2,202 (9.6%) | 55.0 |
| Total | 22,912 (100.0%) | 55.0 |
Fertility by Education by Marriage Status in Phoenix
40.0% of women with births in Phoenix are unmarried. Women with the educational attainment of graduate degree are most likely to be married with 91.8% of them married at childbirth, while women with the educational attainment of less than high school are least likely to be married with 51.4% of them unmarried at childbirth.
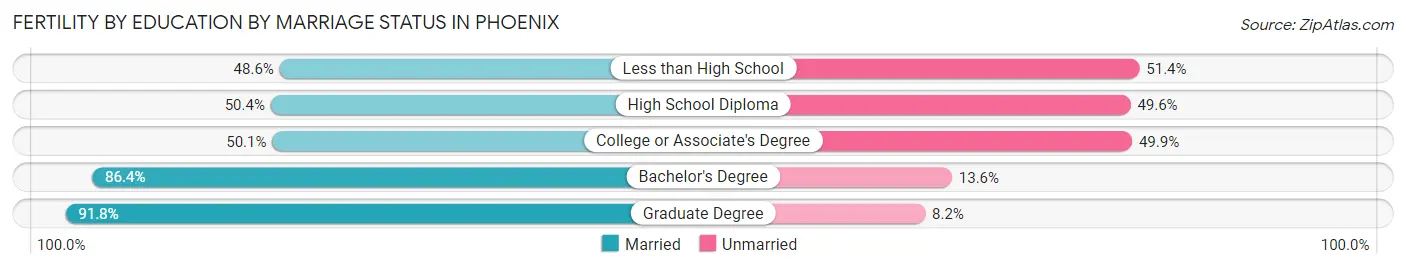
| Educational Attainment | Married | Unmarried |
| Less than High School | 1,802 (48.6%) | 1,906 (51.4%) |
| High School Diploma | 3,395 (50.4%) | 3,341 (49.6%) |
| College or Associate's Degree | 3,210 (50.1%) | 3,198 (49.9%) |
| Bachelor's Degree | 3,333 (86.4%) | 525 (13.6%) |
| Graduate Degree | 2,021 (91.8%) | 181 (8.2%) |
| Total | 13,747 (60.0%) | 9,165 (40.0%) |
Employment Characteristics in Phoenix
Employment by Class of Employer in Phoenix
Among the 799,896 employed individuals in Phoenix, private company employees (583,297 | 72.9%), not-for-profit organizations (55,627 | 7.0%), and self-employed (not incorporated) (46,187 | 5.8%) make up the most common classes of employment.
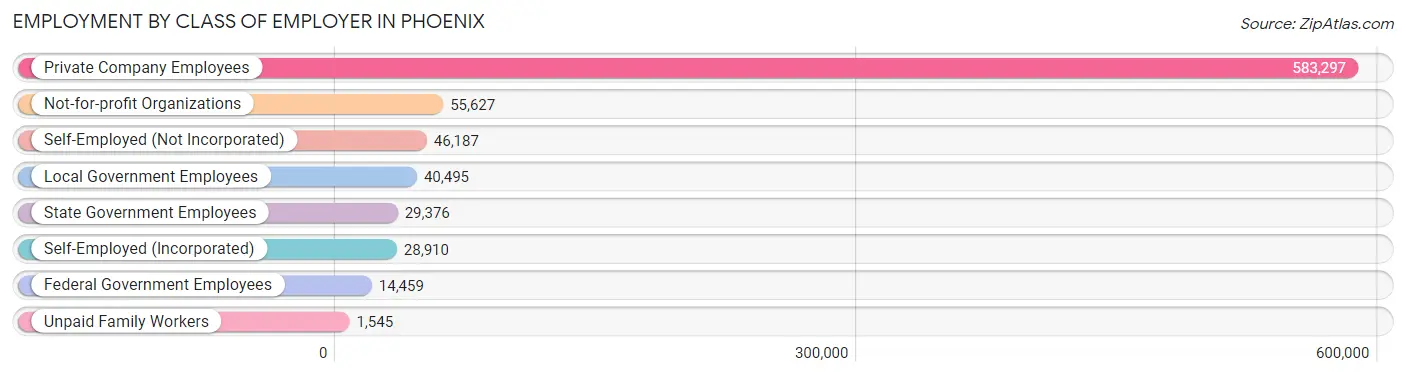
| Employer Class | # Employees | % Employees |
| Private Company Employees | 583,297 | 72.9% |
| Self-Employed (Incorporated) | 28,910 | 3.6% |
| Self-Employed (Not Incorporated) | 46,187 | 5.8% |
| Not-for-profit Organizations | 55,627 | 7.0% |
| Local Government Employees | 40,495 | 5.1% |
| State Government Employees | 29,376 | 3.7% |
| Federal Government Employees | 14,459 | 1.8% |
| Unpaid Family Workers | 1,545 | 0.2% |
| Total | 799,896 | 100.0% |
Employment Status by Age in Phoenix
According to the labor force statistics for Phoenix, out of the total population over 16 years of age (1,260,316), 68.1% or 858,275 individuals are in the labor force, with 5.2% or 44,630 of them unemployed. The age group with the highest labor force participation rate is 25 to 29 years, with 84.6% or 111,713 individuals in the labor force. Within the labor force, the 16 to 19 years age range has the highest percentage of unemployed individuals, with 16.5% or 5,807 of them being unemployed.
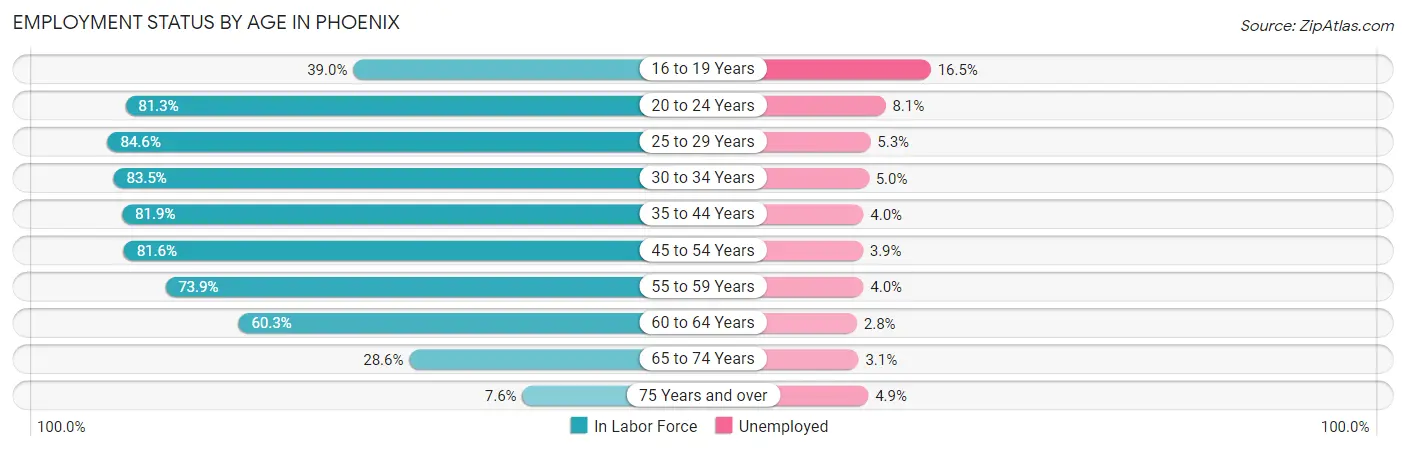
| Age Bracket | In Labor Force | Unemployed |
| 16 to 19 Years | 35,191 (39.0%) | 5,807 (16.5%) |
| 20 to 24 Years | 95,967 (81.3%) | 7,773 (8.1%) |
| 25 to 29 Years | 111,713 (84.6%) | 5,921 (5.3%) |
| 30 to 34 Years | 109,085 (83.5%) | 5,454 (5.0%) |
| 35 to 44 Years | 184,159 (81.9%) | 7,366 (4.0%) |
| 45 to 54 Years | 164,966 (81.6%) | 6,434 (3.9%) |
| 55 to 59 Years | 69,522 (73.9%) | 2,781 (4.0%) |
| 60 to 64 Years | 49,919 (60.3%) | 1,398 (2.8%) |
| 65 to 74 Years | 32,790 (28.6%) | 1,016 (3.1%) |
| 75 Years and over | 5,382 (7.6%) | 264 (4.9%) |
| Total | 858,275 (68.1%) | 44,630 (5.2%) |
Employment Status by Educational Attainment in Phoenix
According to labor force statistics for Phoenix, 79.5% of individuals (688,925) out of the total population between 25 and 64 years of age (866,572) are in the labor force, with 4.3% or 29,624 of them being unemployed. The group with the highest labor force participation rate are those with the educational attainment of bachelor's degree or higher, with 88.0% or 238,631 individuals in the labor force. Within the labor force, individuals with high school diploma education have the highest percentage of unemployment, with 5.8% or 8,781 of them being unemployed.
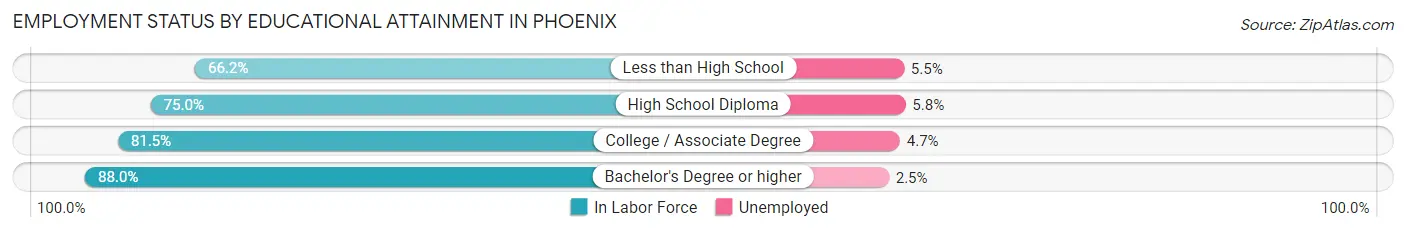
| Educational Attainment | In Labor Force | Unemployed |
| Less than High School | 92,904 (66.2%) | 7,719 (5.5%) |
| High School Diploma | 151,394 (75.0%) | 11,708 (5.8%) |
| College / Associate Degree | 206,361 (81.5%) | 11,901 (4.7%) |
| Bachelor's Degree or higher | 238,631 (88.0%) | 6,779 (2.5%) |
| Total | 688,925 (79.5%) | 37,263 (4.3%) |
Employment Occupations by Sex in Phoenix
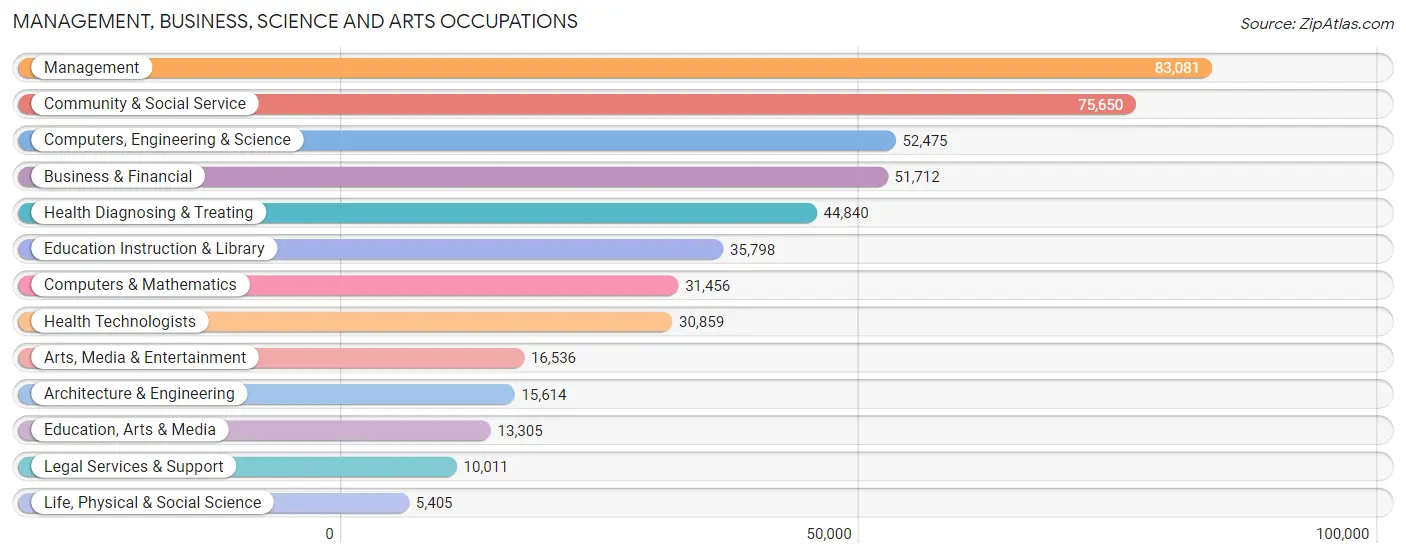
Management, Business, Science and Arts Occupations
The most common Management, Business, Science and Arts occupations in Phoenix are Management (83,081 | 10.2%), Community & Social Service (75,650 | 9.3%), Computers, Engineering & Science (52,475 | 6.5%), Business & Financial (51,712 | 6.4%), and Health Diagnosing & Treating (44,840 | 5.5%).
Management, Business, Science and Arts Occupations by Sex
Within the Management, Business, Science and Arts occupations in Phoenix, the most male-oriented occupations are Architecture & Engineering (85.1%), Computers, Engineering & Science (76.1%), and Computers & Mathematics (75.6%), while the most female-oriented occupations are Education Instruction & Library (72.1%), Health Technologists (69.5%), and Health Diagnosing & Treating (69.4%).
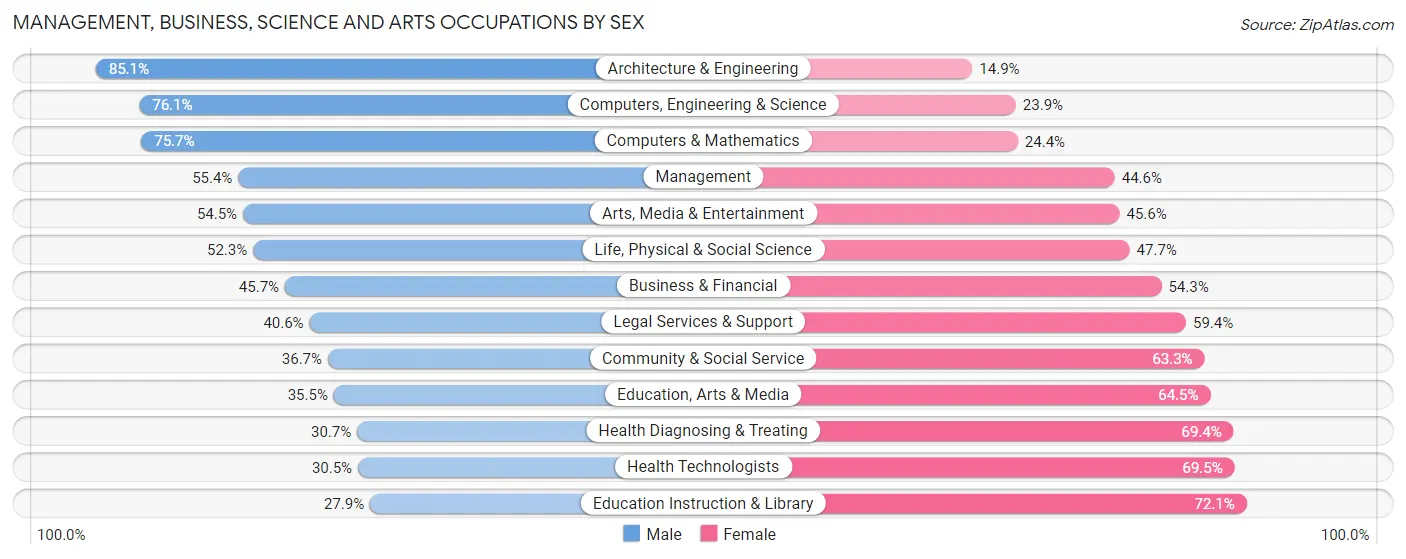
| Occupation | Male | Female |
| Management | 46,056 (55.4%) | 37,025 (44.6%) |
| Business & Financial | 23,633 (45.7%) | 28,079 (54.3%) |
| Computers, Engineering & Science | 39,918 (76.1%) | 12,557 (23.9%) |
| Computers & Mathematics | 23,796 (75.6%) | 7,660 (24.3%) |
| Architecture & Engineering | 13,293 (85.1%) | 2,321 (14.9%) |
| Life, Physical & Social Science | 2,829 (52.3%) | 2,576 (47.7%) |
| Community & Social Service | 27,793 (36.7%) | 47,857 (63.3%) |
| Education, Arts & Media | 4,725 (35.5%) | 8,580 (64.5%) |
| Legal Services & Support | 4,062 (40.6%) | 5,949 (59.4%) |
| Education Instruction & Library | 10,002 (27.9%) | 25,796 (72.1%) |
| Arts, Media & Entertainment | 9,004 (54.4%) | 7,532 (45.6%) |
| Health Diagnosing & Treating | 13,742 (30.6%) | 31,098 (69.4%) |
| Health Technologists | 9,399 (30.5%) | 21,460 (69.5%) |
| Total (Category) | 151,142 (49.1%) | 156,616 (50.9%) |
| Total (Overall) | 442,228 (54.4%) | 371,328 (45.6%) |
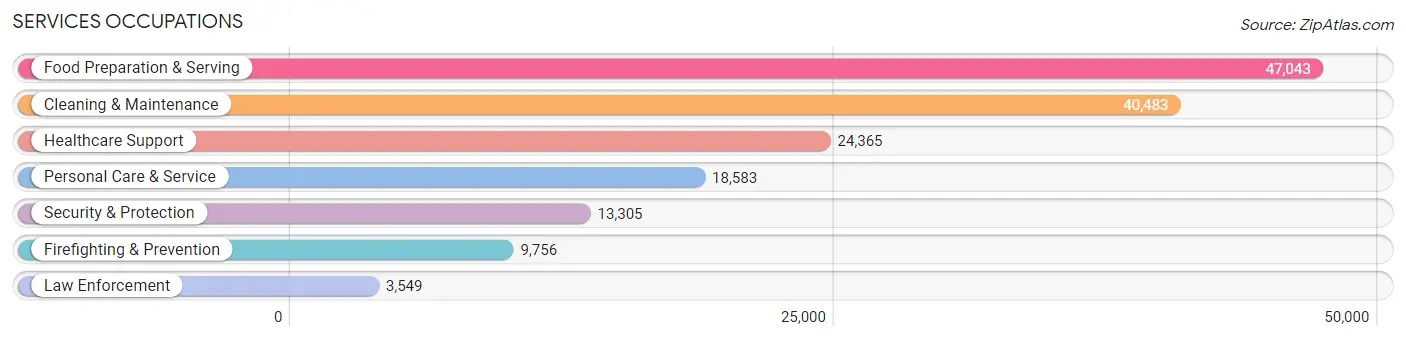
Services Occupations
The most common Services occupations in Phoenix are Food Preparation & Serving (47,043 | 5.8%), Cleaning & Maintenance (40,483 | 5.0%), Healthcare Support (24,365 | 3.0%), Personal Care & Service (18,583 | 2.3%), and Security & Protection (13,305 | 1.6%).
Services Occupations by Sex
Within the Services occupations in Phoenix, the most male-oriented occupations are Firefighting & Prevention (70.4%), Security & Protection (69.7%), and Law Enforcement (67.6%), while the most female-oriented occupations are Healthcare Support (80.8%), Personal Care & Service (74.6%), and Food Preparation & Serving (50.2%).
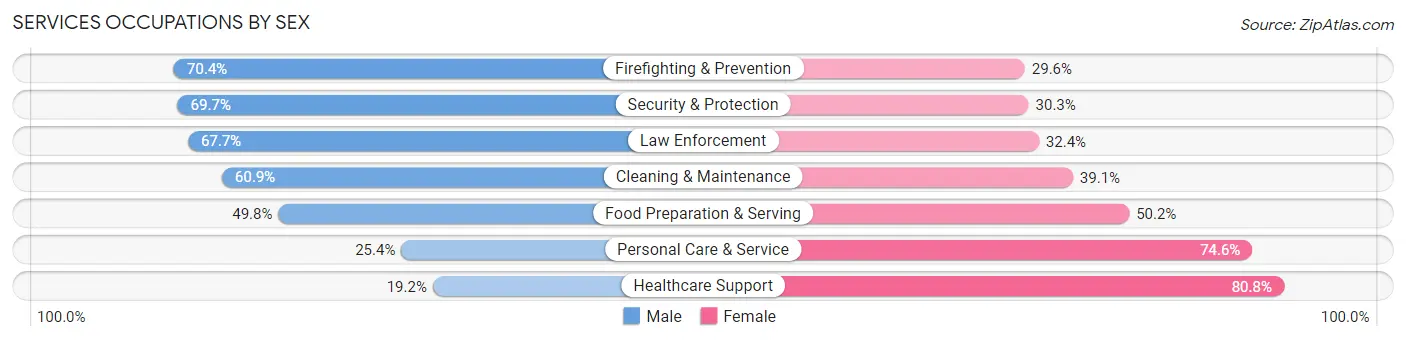
| Occupation | Male | Female |
| Healthcare Support | 4,673 (19.2%) | 19,692 (80.8%) |
| Security & Protection | 9,272 (69.7%) | 4,033 (30.3%) |
| Firefighting & Prevention | 6,871 (70.4%) | 2,885 (29.6%) |
| Law Enforcement | 2,401 (67.6%) | 1,148 (32.4%) |
| Food Preparation & Serving | 23,414 (49.8%) | 23,629 (50.2%) |
| Cleaning & Maintenance | 24,664 (60.9%) | 15,819 (39.1%) |
| Personal Care & Service | 4,723 (25.4%) | 13,860 (74.6%) |
| Total (Category) | 66,746 (46.4%) | 77,033 (53.6%) |
| Total (Overall) | 442,228 (54.4%) | 371,328 (45.6%) |
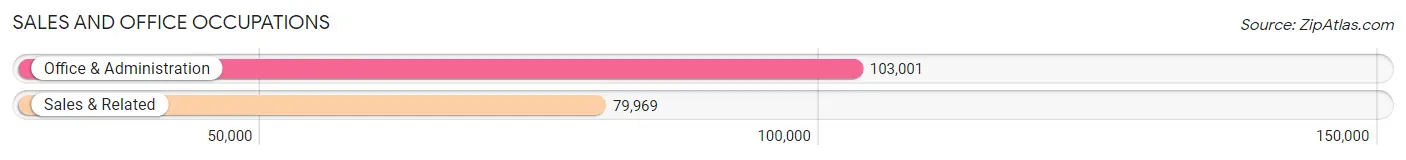
Sales and Office Occupations
The most common Sales and Office occupations in Phoenix are Office & Administration (103,001 | 12.7%), and Sales & Related (79,969 | 9.8%).
Sales and Office Occupations by Sex
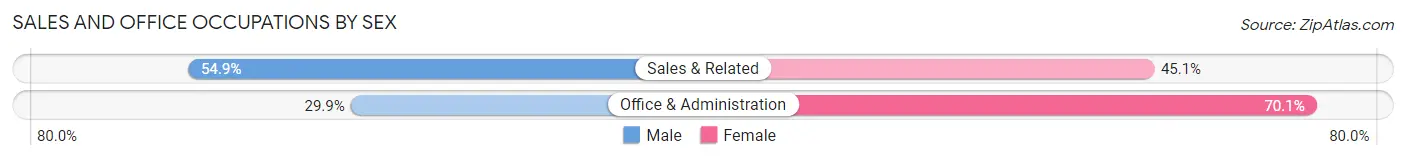
| Occupation | Male | Female |
| Sales & Related | 43,872 (54.9%) | 36,097 (45.1%) |
| Office & Administration | 30,754 (29.9%) | 72,247 (70.1%) |
| Total (Category) | 74,626 (40.8%) | 108,344 (59.2%) |
| Total (Overall) | 442,228 (54.4%) | 371,328 (45.6%) |
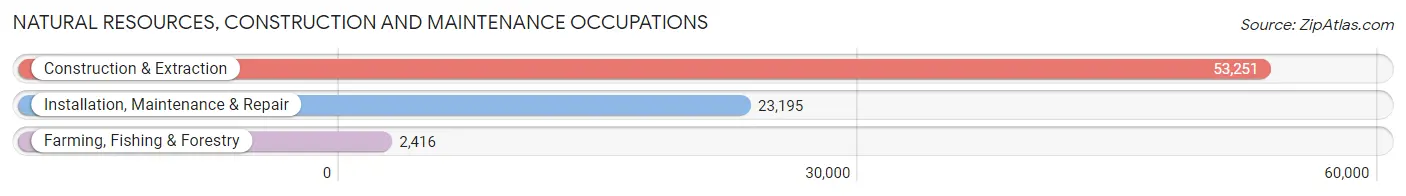
Natural Resources, Construction and Maintenance Occupations
The most common Natural Resources, Construction and Maintenance occupations in Phoenix are Construction & Extraction (53,251 | 6.6%), Installation, Maintenance & Repair (23,195 | 2.9%), and Farming, Fishing & Forestry (2,416 | 0.3%).
Natural Resources, Construction and Maintenance Occupations by Sex
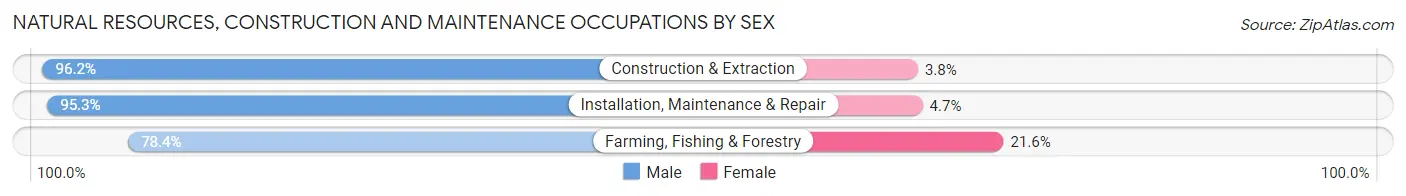
| Occupation | Male | Female |
| Farming, Fishing & Forestry | 1,895 (78.4%) | 521 (21.6%) |
| Construction & Extraction | 51,250 (96.2%) | 2,001 (3.8%) |
| Installation, Maintenance & Repair | 22,099 (95.3%) | 1,096 (4.7%) |
| Total (Category) | 75,244 (95.4%) | 3,618 (4.6%) |
| Total (Overall) | 442,228 (54.4%) | 371,328 (45.6%) |
Production, Transportation and Moving Occupations
The most common Production, Transportation and Moving occupations in Phoenix are Material Moving (36,448 | 4.5%), Production (34,918 | 4.3%), and Transportation (28,821 | 3.5%).
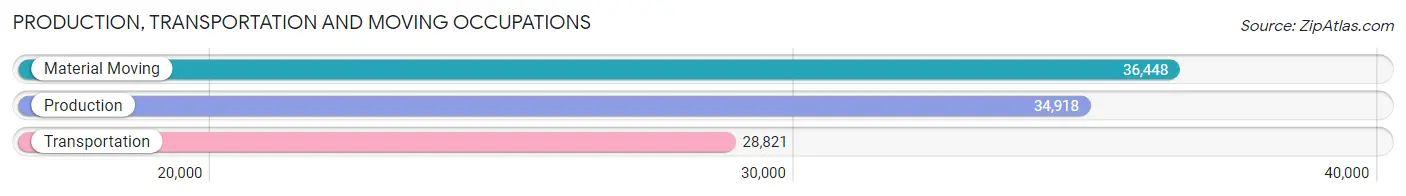
Production, Transportation and Moving Occupations by Sex
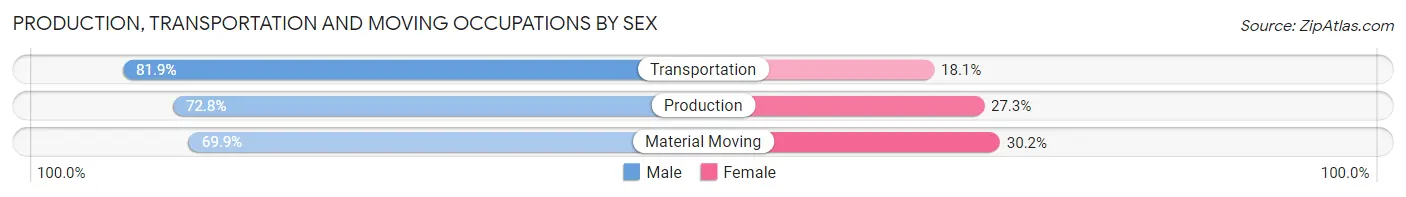
| Occupation | Male | Female |
| Production | 25,403 (72.8%) | 9,515 (27.3%) |
| Transportation | 23,609 (81.9%) | 5,212 (18.1%) |
| Material Moving | 25,458 (69.9%) | 10,990 (30.1%) |
| Total (Category) | 74,470 (74.3%) | 25,717 (25.7%) |
| Total (Overall) | 442,228 (54.4%) | 371,328 (45.6%) |
Employment Industries by Sex in Phoenix
Employment Industries in Phoenix
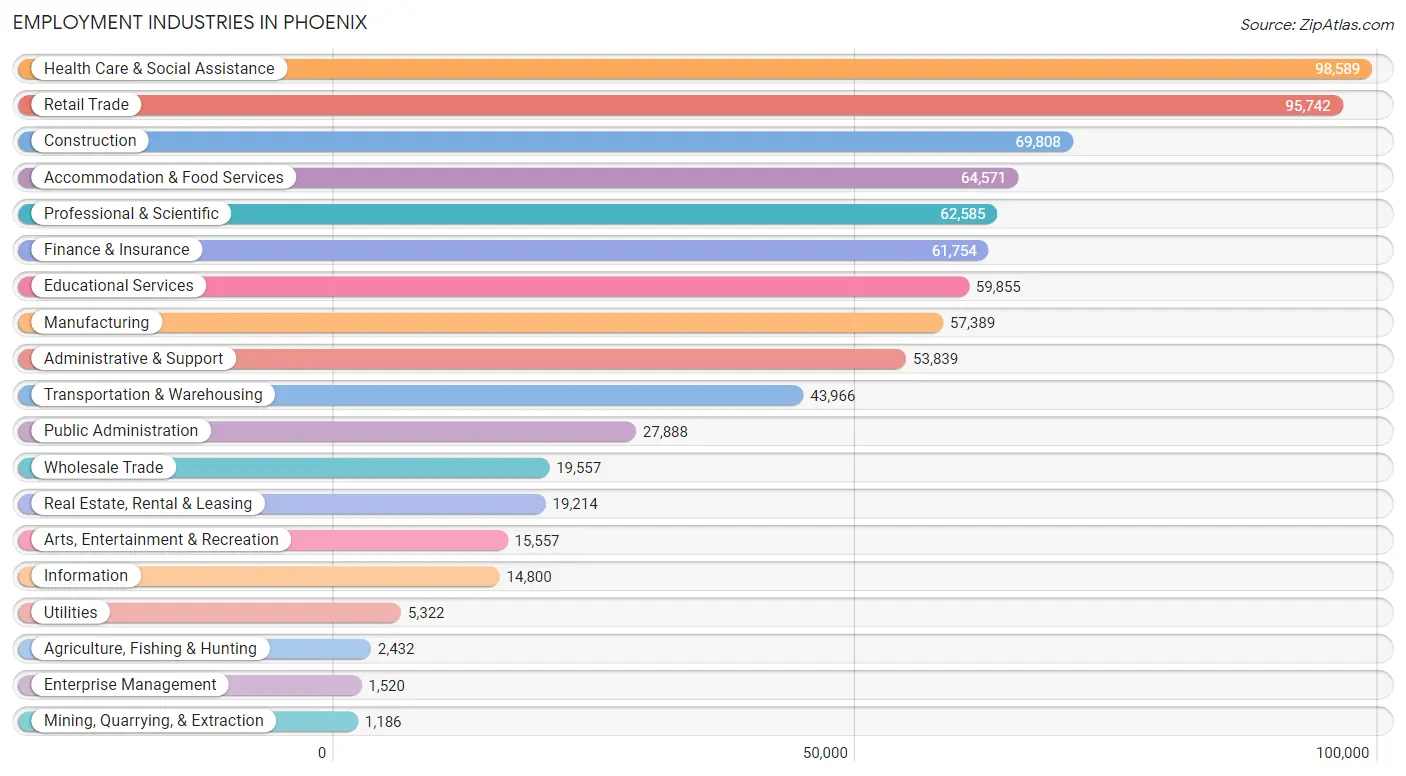
The major employment industries in Phoenix include Health Care & Social Assistance (98,589 | 12.1%), Retail Trade (95,742 | 11.8%), Construction (69,808 | 8.6%), Accommodation & Food Services (64,571 | 7.9%), and Professional & Scientific (62,585 | 7.7%).
Employment Industries by Sex in Phoenix
The Phoenix industries that see more men than women are Construction (90.3%), Mining, Quarrying, & Extraction (80.3%), and Agriculture, Fishing & Hunting (77.6%), whereas the industries that tend to have a higher number of women are Health Care & Social Assistance (73.0%), Educational Services (67.6%), and Enterprise Management (59.5%).
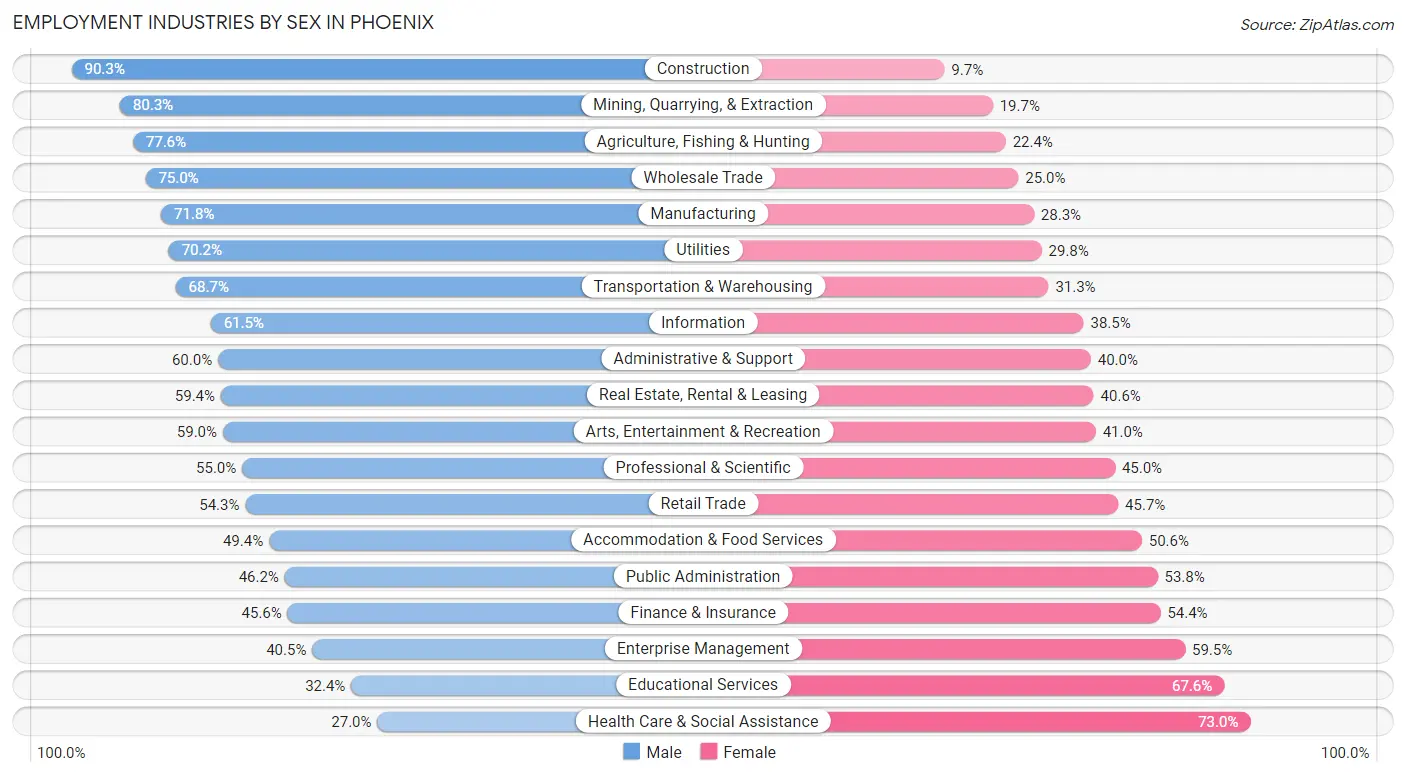
| Industry | Male | Female |
| Agriculture, Fishing & Hunting | 1,887 (77.6%) | 545 (22.4%) |
| Mining, Quarrying, & Extraction | 952 (80.3%) | 234 (19.7%) |
| Construction | 63,019 (90.3%) | 6,789 (9.7%) |
| Manufacturing | 41,174 (71.8%) | 16,215 (28.2%) |
| Wholesale Trade | 14,664 (75.0%) | 4,893 (25.0%) |
| Retail Trade | 52,000 (54.3%) | 43,742 (45.7%) |
| Transportation & Warehousing | 30,222 (68.7%) | 13,744 (31.3%) |
| Utilities | 3,734 (70.2%) | 1,588 (29.8%) |
| Information | 9,097 (61.5%) | 5,703 (38.5%) |
| Finance & Insurance | 28,135 (45.6%) | 33,619 (54.4%) |
| Real Estate, Rental & Leasing | 11,409 (59.4%) | 7,805 (40.6%) |
| Professional & Scientific | 34,411 (55.0%) | 28,174 (45.0%) |
| Enterprise Management | 615 (40.5%) | 905 (59.5%) |
| Administrative & Support | 32,285 (60.0%) | 21,554 (40.0%) |
| Educational Services | 19,392 (32.4%) | 40,463 (67.6%) |
| Health Care & Social Assistance | 26,596 (27.0%) | 71,993 (73.0%) |
| Arts, Entertainment & Recreation | 9,173 (59.0%) | 6,384 (41.0%) |
| Accommodation & Food Services | 31,912 (49.4%) | 32,659 (50.6%) |
| Public Administration | 12,872 (46.2%) | 15,016 (53.8%) |
| Total | 442,228 (54.4%) | 371,328 (45.6%) |
Education in Phoenix
School Enrollment in Phoenix
The most common levels of schooling among the 398,394 students in Phoenix are middle school (92,032 | 23.1%), high school (90,454 | 22.7%), and elementary school (83,436 | 20.9%).
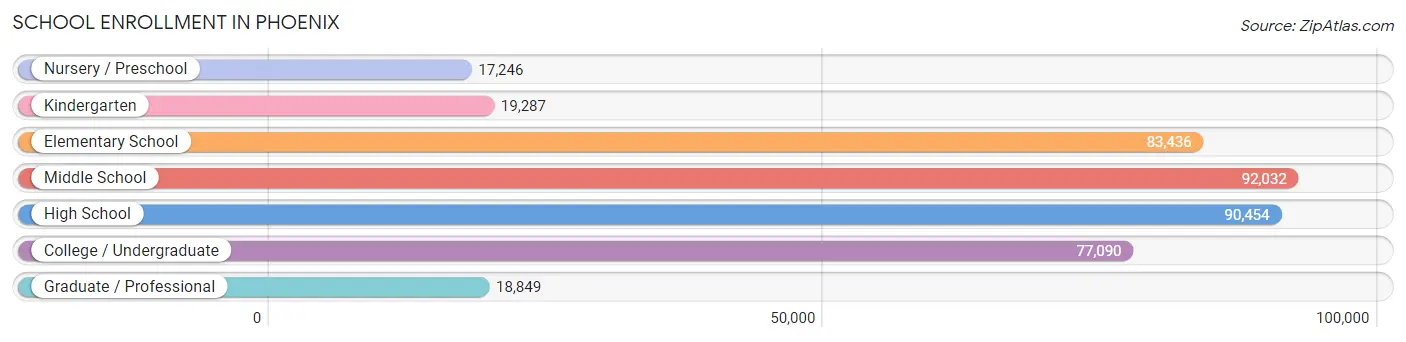
| School Level | # Students | % Students |
| Nursery / Preschool | 17,246 | 4.3% |
| Kindergarten | 19,287 | 4.8% |
| Elementary School | 83,436 | 20.9% |
| Middle School | 92,032 | 23.1% |
| High School | 90,454 | 22.7% |
| College / Undergraduate | 77,090 | 19.4% |
| Graduate / Professional | 18,849 | 4.7% |
| Total | 398,394 | 100.0% |
School Enrollment by Age by Funding Source in Phoenix
Out of a total of 398,394 students who are enrolled in schools in Phoenix, 54,978 (13.8%) attend a private institution, while the remaining 343,416 (86.2%) are enrolled in public schools. The age group of 3 to 4 year olds has the highest likelihood of being enrolled in private schools, with 5,253 (38.6% in the age bracket) enrolled. Conversely, the age group of 15 to 17 year olds has the lowest likelihood of being enrolled in a private school, with 60,057 (92.7% in the age bracket) attending a public institution.
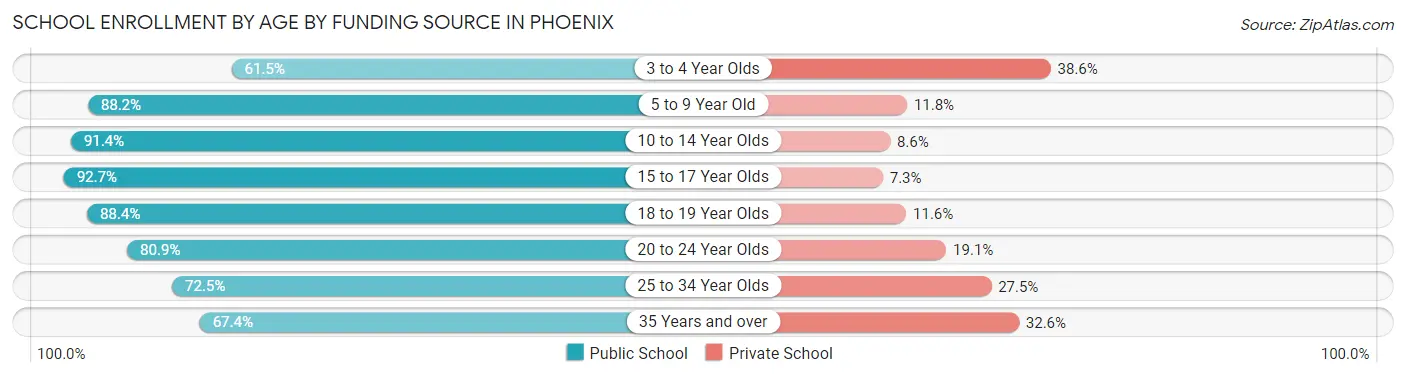
| Age Bracket | Public School | Private School |
| 3 to 4 Year Olds | 8,375 (61.5%) | 5,253 (38.6%) |
| 5 to 9 Year Old | 85,758 (88.2%) | 11,459 (11.8%) |
| 10 to 14 Year Olds | 103,381 (91.4%) | 9,747 (8.6%) |
| 15 to 17 Year Olds | 60,057 (92.7%) | 4,719 (7.3%) |
| 18 to 19 Year Olds | 25,715 (88.4%) | 3,384 (11.6%) |
| 20 to 24 Year Olds | 28,103 (80.9%) | 6,631 (19.1%) |
| 25 to 34 Year Olds | 18,112 (72.5%) | 6,864 (27.5%) |
| 35 Years and over | 14,038 (67.4%) | 6,798 (32.6%) |
| Total | 343,416 (86.2%) | 54,978 (13.8%) |
Educational Attainment by Field of Study in Phoenix
Business (79,169 | 22.4%), education (36,431 | 10.3%), science & technology (35,166 | 10.0%), social sciences (26,421 | 7.5%), and engineering (25,340 | 7.2%) are the most common fields of study among 353,334 individuals in Phoenix who have obtained a bachelor's degree or higher.
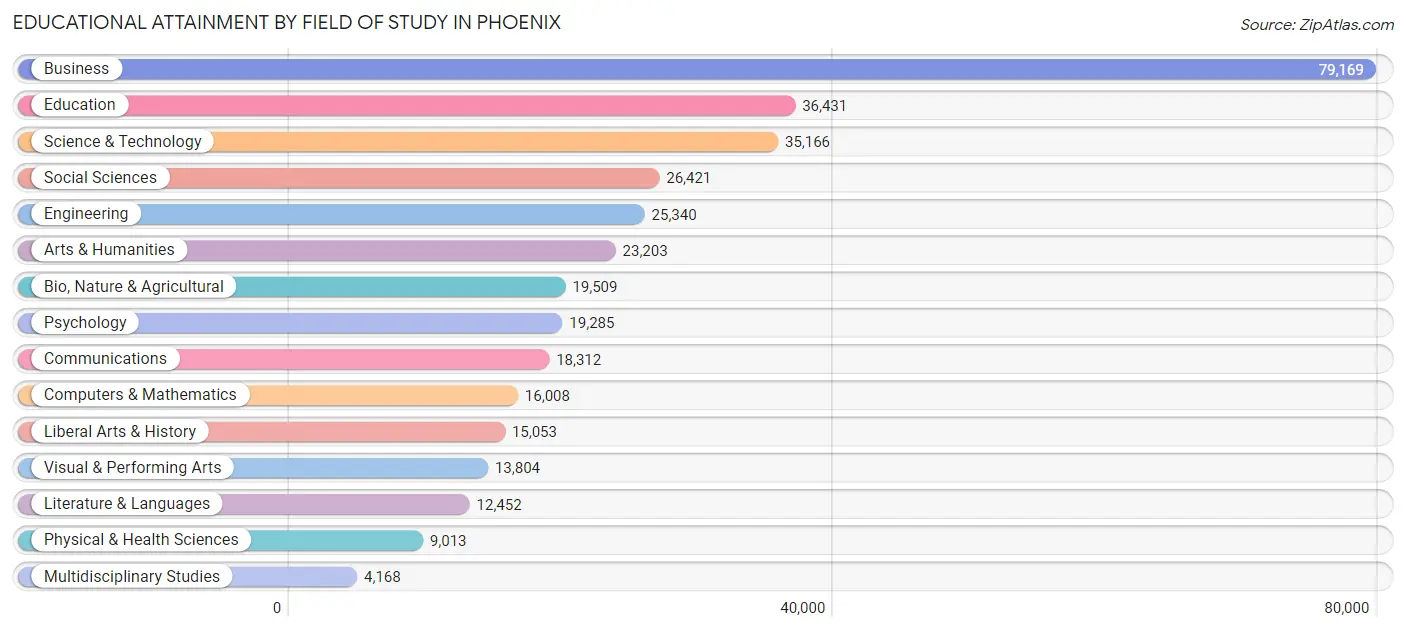
| Field of Study | # Graduates | % Graduates |
| Computers & Mathematics | 16,008 | 4.5% |
| Bio, Nature & Agricultural | 19,509 | 5.5% |
| Physical & Health Sciences | 9,013 | 2.5% |
| Psychology | 19,285 | 5.5% |
| Social Sciences | 26,421 | 7.5% |
| Engineering | 25,340 | 7.2% |
| Multidisciplinary Studies | 4,168 | 1.2% |
| Science & Technology | 35,166 | 10.0% |
| Business | 79,169 | 22.4% |
| Education | 36,431 | 10.3% |
| Literature & Languages | 12,452 | 3.5% |
| Liberal Arts & History | 15,053 | 4.3% |
| Visual & Performing Arts | 13,804 | 3.9% |
| Communications | 18,312 | 5.2% |
| Arts & Humanities | 23,203 | 6.6% |
| Total | 353,334 | 100.0% |
Transportation & Commute in Phoenix
Vehicle Availability by Sex in Phoenix
The most prevalent vehicle ownership categories in Phoenix are males with 2 vehicles (178,240, accounting for 41.0%) and females with 2 vehicles (146,048, making up 49.2%).
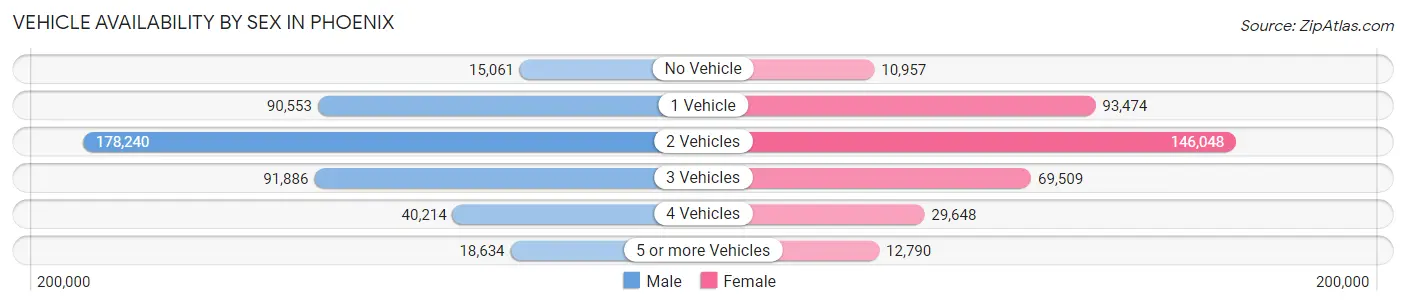
| Vehicles Available | Male | Female |
| No Vehicle | 15,061 (3.5%) | 10,957 (3.0%) |
| 1 Vehicle | 90,553 (20.8%) | 93,474 (25.8%) |
| 2 Vehicles | 178,240 (41.0%) | 146,048 (40.3%) |
| 3 Vehicles | 91,886 (21.1%) | 69,509 (19.2%) |
| 4 Vehicles | 40,214 (9.2%) | 29,648 (8.2%) |
| 5 or more Vehicles | 18,634 (4.3%) | 12,790 (3.5%) |
| Total | 434,588 (100.0%) | 362,426 (100.0%) |
Commute Time in Phoenix
The most frequently occuring commute durations in Phoenix are 20 to 24 minutes (125,383 commuters, 18.3%), 30 to 34 minutes (113,131 commuters, 16.5%), and 15 to 19 minutes (105,493 commuters, 15.4%).
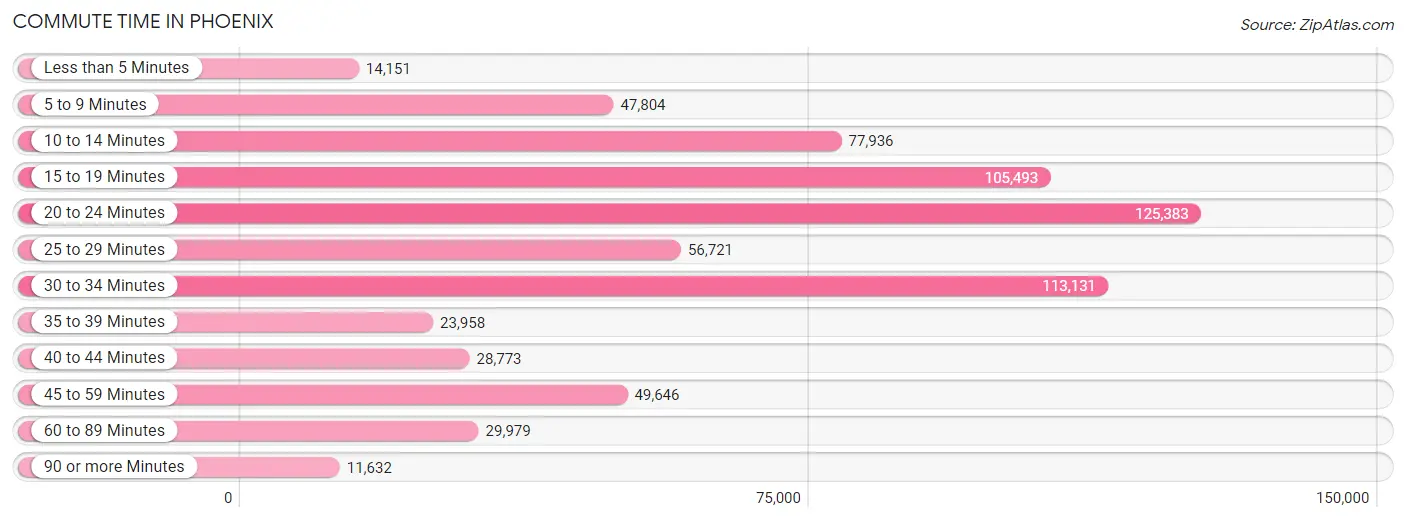
| Commute Time | # Commuters | % Commuters |
| Less than 5 Minutes | 14,151 | 2.1% |
| 5 to 9 Minutes | 47,804 | 7.0% |
| 10 to 14 Minutes | 77,936 | 11.4% |
| 15 to 19 Minutes | 105,493 | 15.4% |
| 20 to 24 Minutes | 125,383 | 18.3% |
| 25 to 29 Minutes | 56,721 | 8.3% |
| 30 to 34 Minutes | 113,131 | 16.5% |
| 35 to 39 Minutes | 23,958 | 3.5% |
| 40 to 44 Minutes | 28,773 | 4.2% |
| 45 to 59 Minutes | 49,646 | 7.2% |
| 60 to 89 Minutes | 29,979 | 4.4% |
| 90 or more Minutes | 11,632 | 1.7% |
Commute Time by Sex in Phoenix
The most common commute times in Phoenix are 20 to 24 minutes (69,356 commuters, 18.2%) for males and 20 to 24 minutes (56,027 commuters, 18.4%) for females.
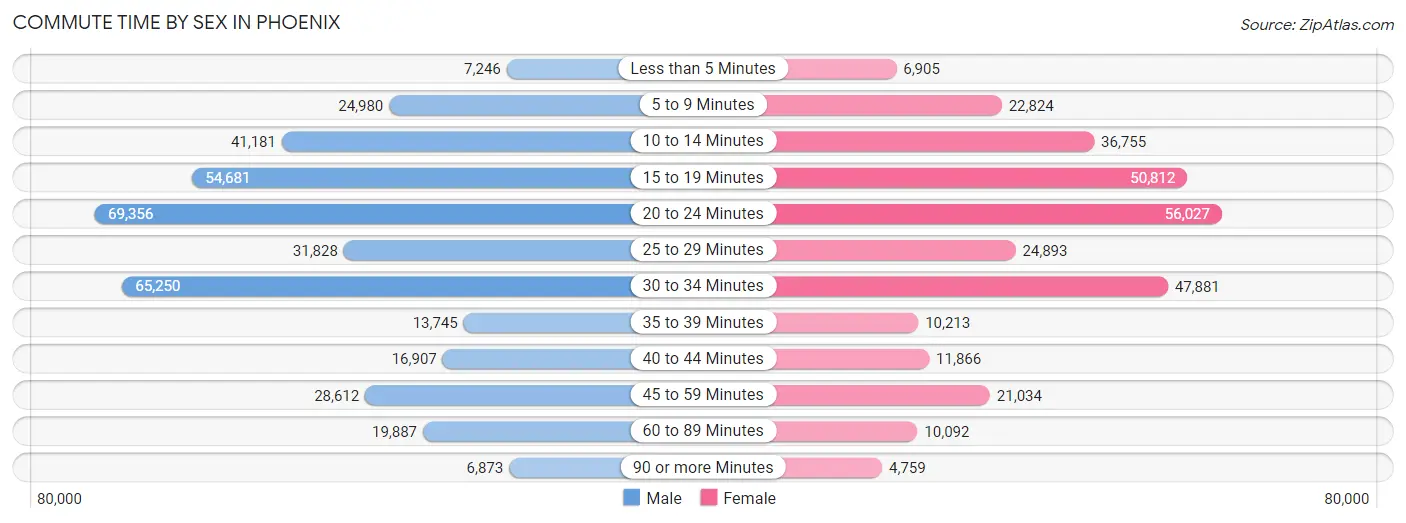
| Commute Time | Male | Female |
| Less than 5 Minutes | 7,246 (1.9%) | 6,905 (2.3%) |
| 5 to 9 Minutes | 24,980 (6.6%) | 22,824 (7.5%) |
| 10 to 14 Minutes | 41,181 (10.8%) | 36,755 (12.1%) |
| 15 to 19 Minutes | 54,681 (14.4%) | 50,812 (16.7%) |
| 20 to 24 Minutes | 69,356 (18.2%) | 56,027 (18.4%) |
| 25 to 29 Minutes | 31,828 (8.4%) | 24,893 (8.2%) |
| 30 to 34 Minutes | 65,250 (17.2%) | 47,881 (15.8%) |
| 35 to 39 Minutes | 13,745 (3.6%) | 10,213 (3.4%) |
| 40 to 44 Minutes | 16,907 (4.4%) | 11,866 (3.9%) |
| 45 to 59 Minutes | 28,612 (7.5%) | 21,034 (6.9%) |
| 60 to 89 Minutes | 19,887 (5.2%) | 10,092 (3.3%) |
| 90 or more Minutes | 6,873 (1.8%) | 4,759 (1.6%) |
Time of Departure to Work by Sex in Phoenix
The most frequent times of departure to work in Phoenix are 7:00 AM to 7:29 AM (45,067, 11.8%) for males and 7:00 AM to 7:29 AM (46,582, 15.3%) for females.
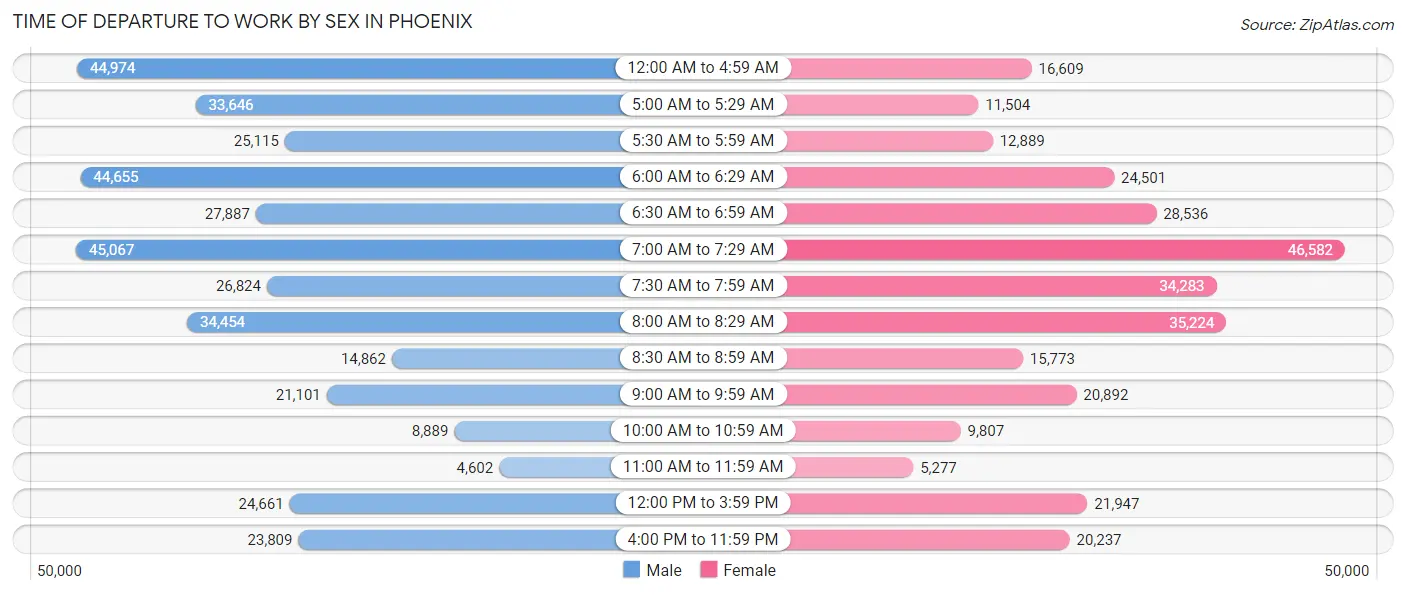
| Time of Departure | Male | Female |
| 12:00 AM to 4:59 AM | 44,974 (11.8%) | 16,609 (5.5%) |
| 5:00 AM to 5:29 AM | 33,646 (8.8%) | 11,504 (3.8%) |
| 5:30 AM to 5:59 AM | 25,115 (6.6%) | 12,889 (4.2%) |
| 6:00 AM to 6:29 AM | 44,655 (11.7%) | 24,501 (8.1%) |
| 6:30 AM to 6:59 AM | 27,887 (7.3%) | 28,536 (9.4%) |
| 7:00 AM to 7:29 AM | 45,067 (11.8%) | 46,582 (15.3%) |
| 7:30 AM to 7:59 AM | 26,824 (7.0%) | 34,283 (11.3%) |
| 8:00 AM to 8:29 AM | 34,454 (9.0%) | 35,224 (11.6%) |
| 8:30 AM to 8:59 AM | 14,862 (3.9%) | 15,773 (5.2%) |
| 9:00 AM to 9:59 AM | 21,101 (5.5%) | 20,892 (6.9%) |
| 10:00 AM to 10:59 AM | 8,889 (2.3%) | 9,807 (3.2%) |
| 11:00 AM to 11:59 AM | 4,602 (1.2%) | 5,277 (1.7%) |
| 12:00 PM to 3:59 PM | 24,661 (6.5%) | 21,947 (7.2%) |
| 4:00 PM to 11:59 PM | 23,809 (6.3%) | 20,237 (6.7%) |
| Total | 380,546 (100.0%) | 304,061 (100.0%) |
Housing Occupancy in Phoenix
Occupancy by Ownership in Phoenix
Of the total 591,169 dwellings in Phoenix, owner-occupied units account for 333,631 (56.4%), while renter-occupied units make up 257,538 (43.6%).
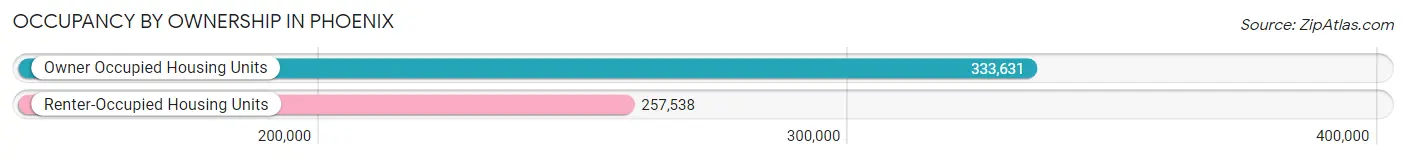
| Occupancy | # Housing Units | % Housing Units |
| Owner Occupied Housing Units | 333,631 | 56.4% |
| Renter-Occupied Housing Units | 257,538 | 43.6% |
| Total Occupied Housing Units | 591,169 | 100.0% |
Occupancy by Household Size in Phoenix
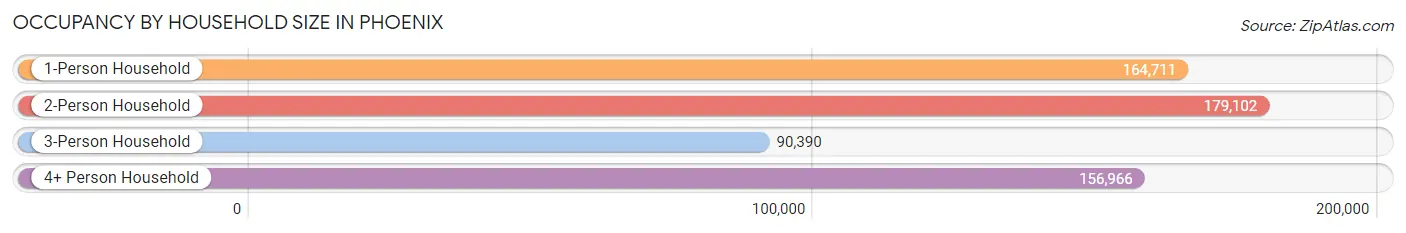
| Household Size | # Housing Units | % Housing Units |
| 1-Person Household | 164,711 | 27.9% |
| 2-Person Household | 179,102 | 30.3% |
| 3-Person Household | 90,390 | 15.3% |
| 4+ Person Household | 156,966 | 26.6% |
| Total Housing Units | 591,169 | 100.0% |
Occupancy by Ownership by Household Size in Phoenix
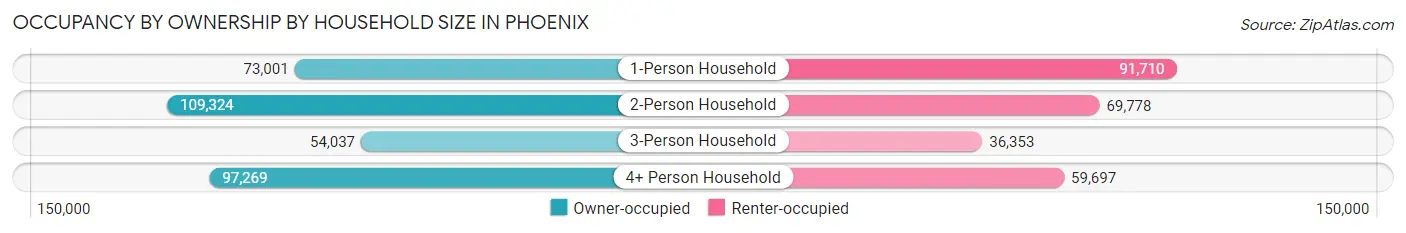
| Household Size | Owner-occupied | Renter-occupied |
| 1-Person Household | 73,001 (44.3%) | 91,710 (55.7%) |
| 2-Person Household | 109,324 (61.0%) | 69,778 (39.0%) |
| 3-Person Household | 54,037 (59.8%) | 36,353 (40.2%) |
| 4+ Person Household | 97,269 (62.0%) | 59,697 (38.0%) |
| Total Housing Units | 333,631 (56.4%) | 257,538 (43.6%) |
Occupancy by Educational Attainment in Phoenix
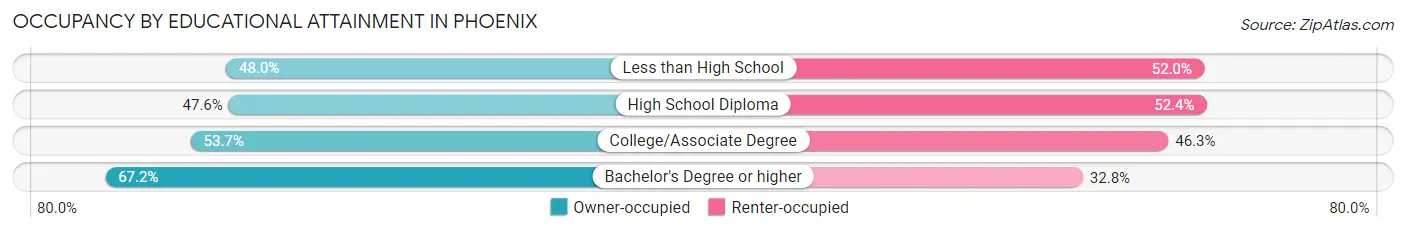
| Household Size | Owner-occupied | Renter-occupied |
| Less than High School | 37,582 (48.0%) | 40,658 (52.0%) |
| High School Diploma | 56,040 (47.6%) | 61,585 (52.4%) |
| College/Associate Degree | 101,679 (53.7%) | 87,812 (46.3%) |
| Bachelor's Degree or higher | 138,330 (67.2%) | 67,483 (32.8%) |
Occupancy by Age of Householder in Phoenix
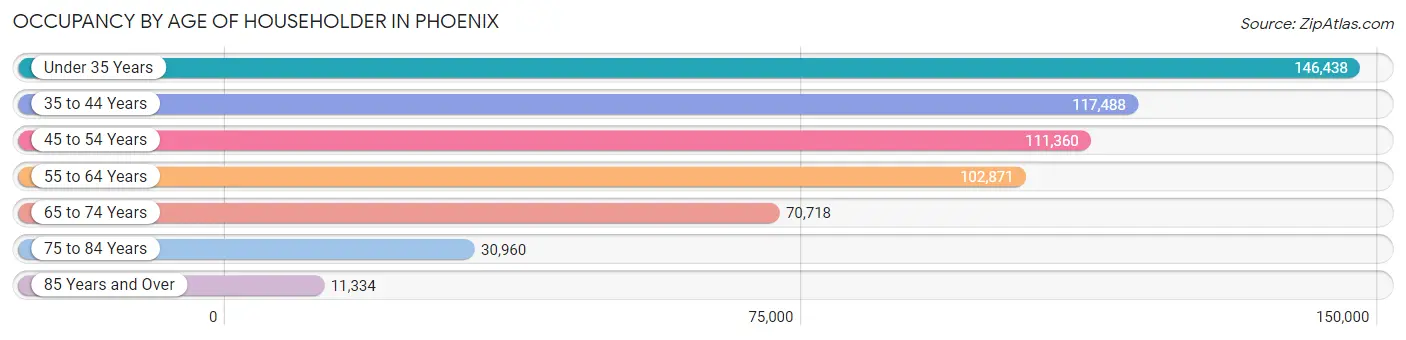
| Age Bracket | # Households | % Households |
| Under 35 Years | 146,438 | 24.8% |
| 35 to 44 Years | 117,488 | 19.9% |
| 45 to 54 Years | 111,360 | 18.8% |
| 55 to 64 Years | 102,871 | 17.4% |
| 65 to 74 Years | 70,718 | 12.0% |
| 75 to 84 Years | 30,960 | 5.2% |
| 85 Years and Over | 11,334 | 1.9% |
| Total | 591,169 | 100.0% |
Housing Finances in Phoenix
Median Income by Occupancy in Phoenix
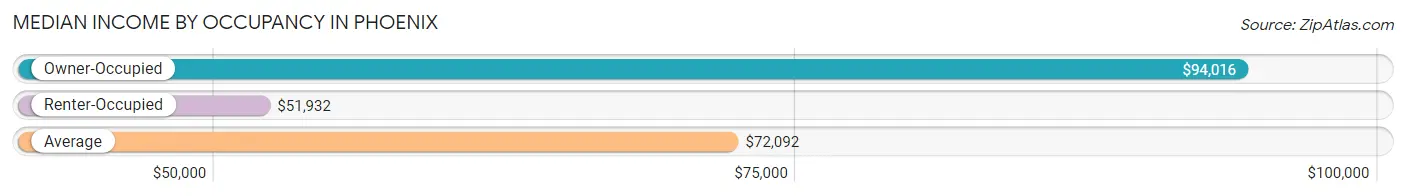
| Occupancy Type | # Households | Median Income |
| Owner-Occupied | 333,631 (56.4%) | $94,016 |
| Renter-Occupied | 257,538 (43.6%) | $51,932 |
| Average | 591,169 (100.0%) | $72,092 |
Occupancy by Householder Income Bracket in Phoenix
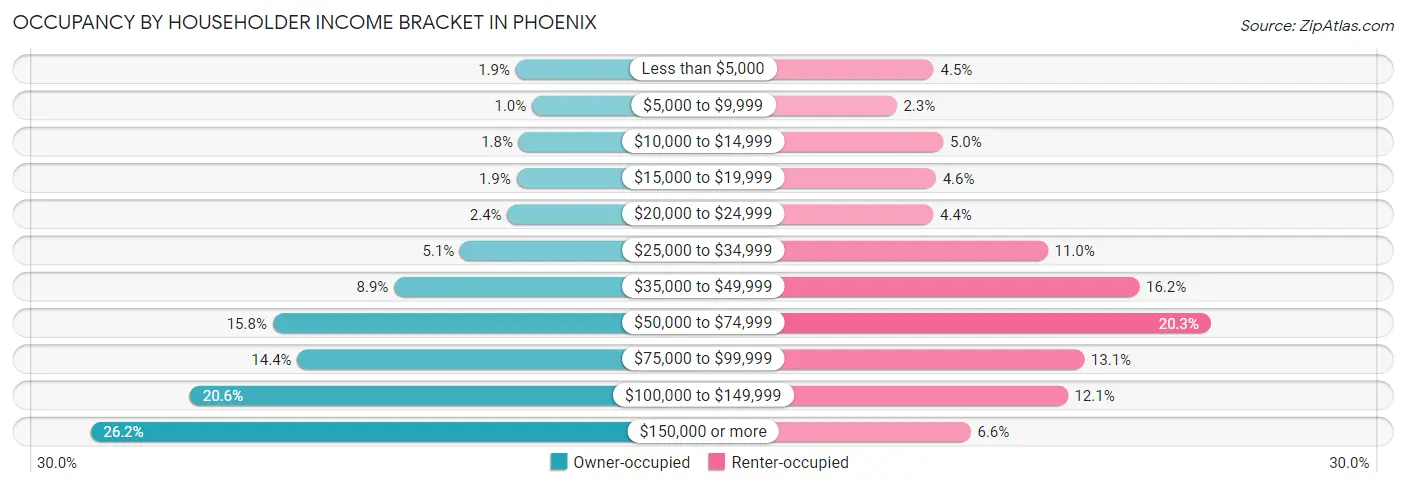
| Income Bracket | Owner-occupied | Renter-occupied |
| Less than $5,000 | 6,440 (1.9%) | 11,484 (4.5%) |
| $5,000 to $9,999 | 3,329 (1.0%) | 6,020 (2.3%) |
| $10,000 to $14,999 | 5,888 (1.8%) | 12,886 (5.0%) |
| $15,000 to $19,999 | 6,289 (1.9%) | 11,795 (4.6%) |
| $20,000 to $24,999 | 8,048 (2.4%) | 11,397 (4.4%) |
| $25,000 to $34,999 | 17,033 (5.1%) | 28,247 (11.0%) |
| $35,000 to $49,999 | 29,626 (8.9%) | 41,719 (16.2%) |
| $50,000 to $74,999 | 52,790 (15.8%) | 52,283 (20.3%) |
| $75,000 to $99,999 | 48,067 (14.4%) | 33,603 (13.1%) |
| $100,000 to $149,999 | 68,589 (20.6%) | 31,183 (12.1%) |
| $150,000 or more | 87,532 (26.2%) | 16,921 (6.6%) |
| Total | 333,631 (100.0%) | 257,538 (100.0%) |
Monthly Housing Cost Tiers in Phoenix
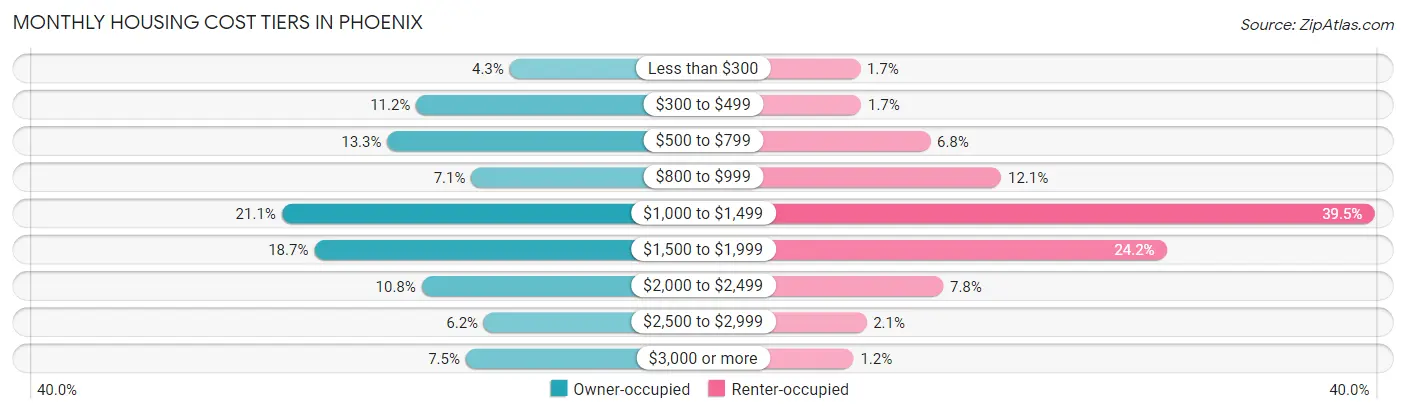
| Monthly Cost | Owner-occupied | Renter-occupied |
| Less than $300 | 14,293 (4.3%) | 4,269 (1.7%) |
| $300 to $499 | 37,230 (11.2%) | 4,475 (1.7%) |
| $500 to $799 | 44,345 (13.3%) | 17,554 (6.8%) |
| $800 to $999 | 23,675 (7.1%) | 31,036 (12.0%) |
| $1,000 to $1,499 | 70,284 (21.1%) | 101,792 (39.5%) |
| $1,500 to $1,999 | 62,273 (18.7%) | 62,403 (24.2%) |
| $2,000 to $2,499 | 35,889 (10.8%) | 20,043 (7.8%) |
| $2,500 to $2,999 | 20,597 (6.2%) | 5,468 (2.1%) |
| $3,000 or more | 25,045 (7.5%) | 3,043 (1.2%) |
| Total | 333,631 (100.0%) | 257,538 (100.0%) |
Physical Housing Characteristics in Phoenix
Housing Structures in Phoenix
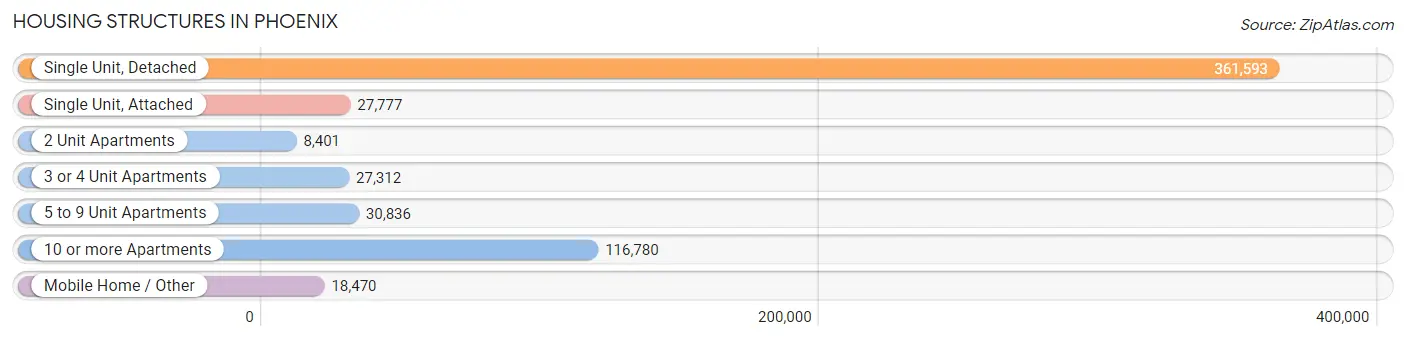
| Structure Type | # Housing Units | % Housing Units |
| Single Unit, Detached | 361,593 | 61.2% |
| Single Unit, Attached | 27,777 | 4.7% |
| 2 Unit Apartments | 8,401 | 1.4% |
| 3 or 4 Unit Apartments | 27,312 | 4.6% |
| 5 to 9 Unit Apartments | 30,836 | 5.2% |
| 10 or more Apartments | 116,780 | 19.8% |
| Mobile Home / Other | 18,470 | 3.1% |
| Total | 591,169 | 100.0% |
Housing Structures by Occupancy in Phoenix
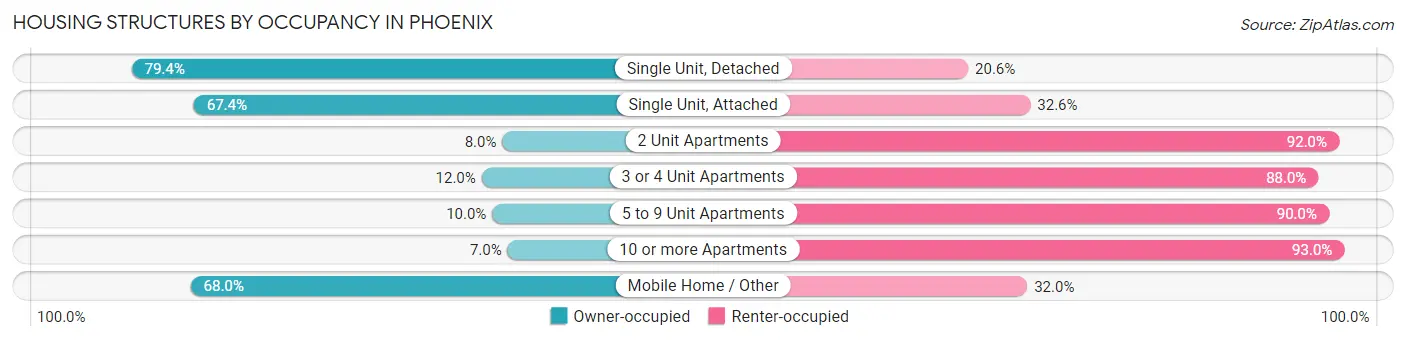
| Structure Type | Owner-occupied | Renter-occupied |
| Single Unit, Detached | 287,130 (79.4%) | 74,463 (20.6%) |
| Single Unit, Attached | 18,726 (67.4%) | 9,051 (32.6%) |
| 2 Unit Apartments | 675 (8.0%) | 7,726 (92.0%) |
| 3 or 4 Unit Apartments | 3,279 (12.0%) | 24,033 (88.0%) |
| 5 to 9 Unit Apartments | 3,073 (10.0%) | 27,763 (90.0%) |
| 10 or more Apartments | 8,183 (7.0%) | 108,597 (93.0%) |
| Mobile Home / Other | 12,565 (68.0%) | 5,905 (32.0%) |
| Total | 333,631 (56.4%) | 257,538 (43.6%) |
Housing Structures by Number of Rooms in Phoenix
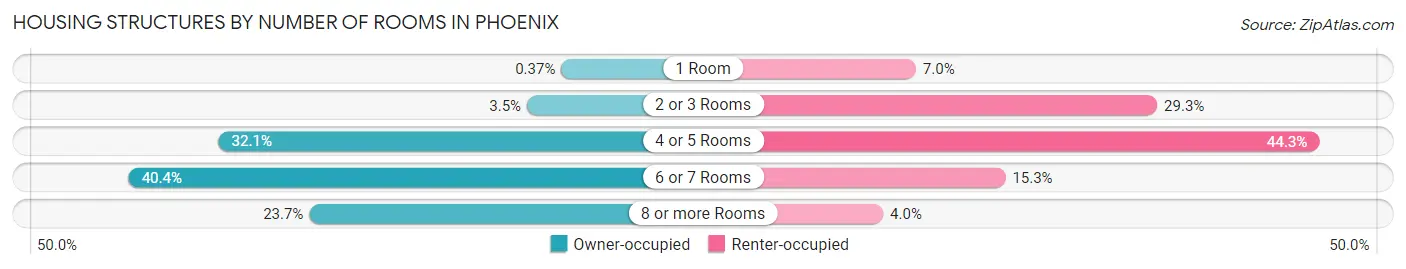
| Number of Rooms | Owner-occupied | Renter-occupied |
| 1 Room | 1,225 (0.4%) | 18,102 (7.0%) |
| 2 or 3 Rooms | 11,803 (3.5%) | 75,573 (29.3%) |
| 4 or 5 Rooms | 106,913 (32.1%) | 114,128 (44.3%) |
| 6 or 7 Rooms | 134,699 (40.4%) | 39,439 (15.3%) |
| 8 or more Rooms | 78,991 (23.7%) | 10,296 (4.0%) |
| Total | 333,631 (100.0%) | 257,538 (100.0%) |
Housing Structure by Heating Type in Phoenix
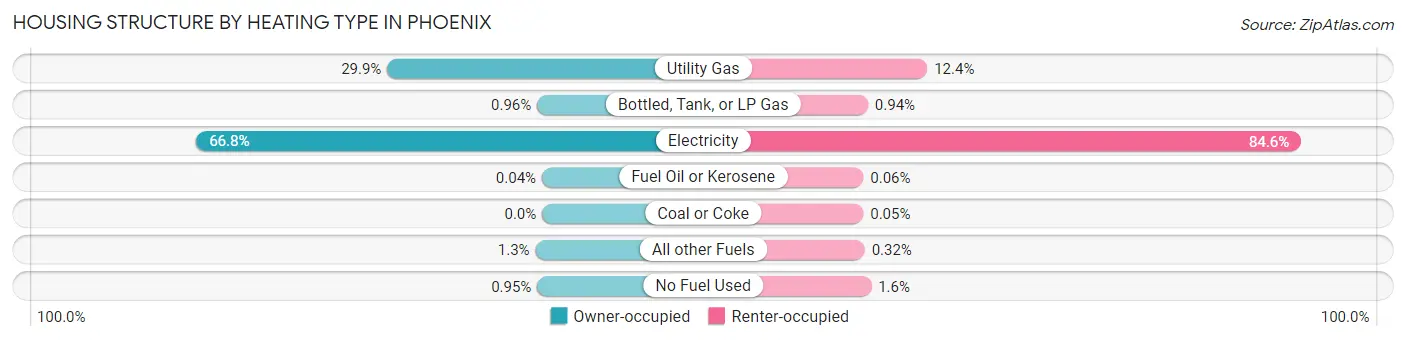
| Heating Type | Owner-occupied | Renter-occupied |
| Utility Gas | 99,872 (29.9%) | 31,945 (12.4%) |
| Bottled, Tank, or LP Gas | 3,201 (1.0%) | 2,421 (0.9%) |
| Electricity | 222,959 (66.8%) | 217,980 (84.6%) |
| Fuel Oil or Kerosene | 126 (0.0%) | 154 (0.1%) |
| Coal or Coke | 0 (0.0%) | 136 (0.1%) |
| All other Fuels | 4,305 (1.3%) | 829 (0.3%) |
| No Fuel Used | 3,168 (0.9%) | 4,073 (1.6%) |
| Total | 333,631 (100.0%) | 257,538 (100.0%) |
Household Vehicle Usage in Phoenix
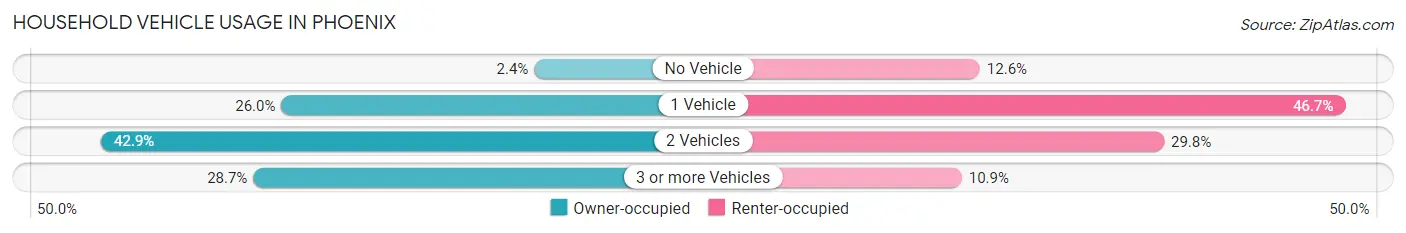
| Vehicles per Household | Owner-occupied | Renter-occupied |
| No Vehicle | 8,119 (2.4%) | 32,458 (12.6%) |
| 1 Vehicle | 86,891 (26.0%) | 120,267 (46.7%) |
| 2 Vehicles | 143,013 (42.9%) | 76,714 (29.8%) |
| 3 or more Vehicles | 95,608 (28.7%) | 28,099 (10.9%) |
| Total | 333,631 (100.0%) | 257,538 (100.0%) |
Real Estate & Mortgages in Phoenix
Real Estate and Mortgage Overview in Phoenix
| Characteristic | Without Mortgage | With Mortgage |
| Housing Units | 104,057 | 229,574 |
| Median Property Value | $302,100 | $354,900 |
| Median Household Income | $69,986 | $69,013 |
| Monthly Housing Costs | $514 | $24,692 |
| Real Estate Taxes | $1,515 | $6,213 |
Property Value by Mortgage Status in Phoenix
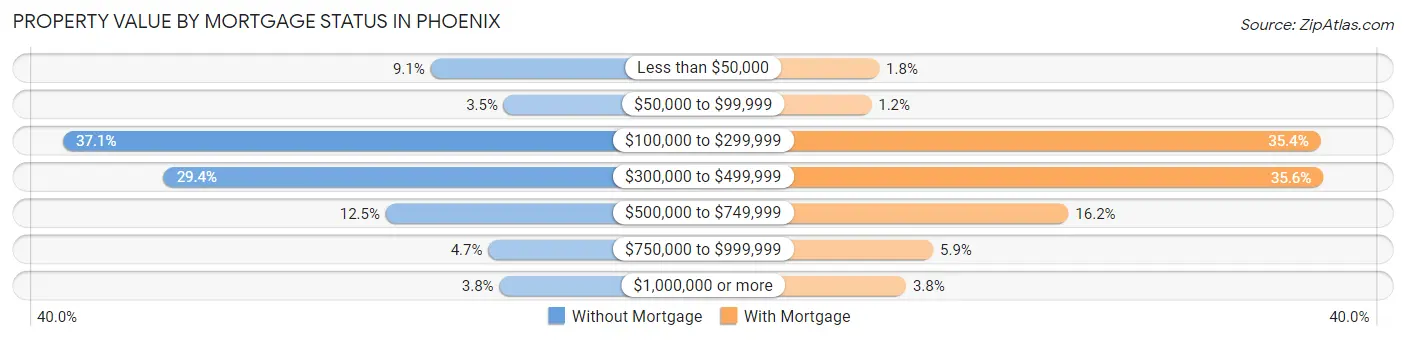
| Property Value | Without Mortgage | With Mortgage |
| Less than $50,000 | 9,434 (9.1%) | 4,132 (1.8%) |
| $50,000 to $99,999 | 3,629 (3.5%) | 2,747 (1.2%) |
| $100,000 to $299,999 | 38,569 (37.1%) | 81,312 (35.4%) |
| $300,000 to $499,999 | 30,597 (29.4%) | 81,768 (35.6%) |
| $500,000 to $749,999 | 12,988 (12.5%) | 37,227 (16.2%) |
| $750,000 to $999,999 | 4,863 (4.7%) | 13,566 (5.9%) |
| $1,000,000 or more | 3,977 (3.8%) | 8,822 (3.8%) |
| Total | 104,057 (100.0%) | 229,574 (100.0%) |
Household Income by Mortgage Status in Phoenix
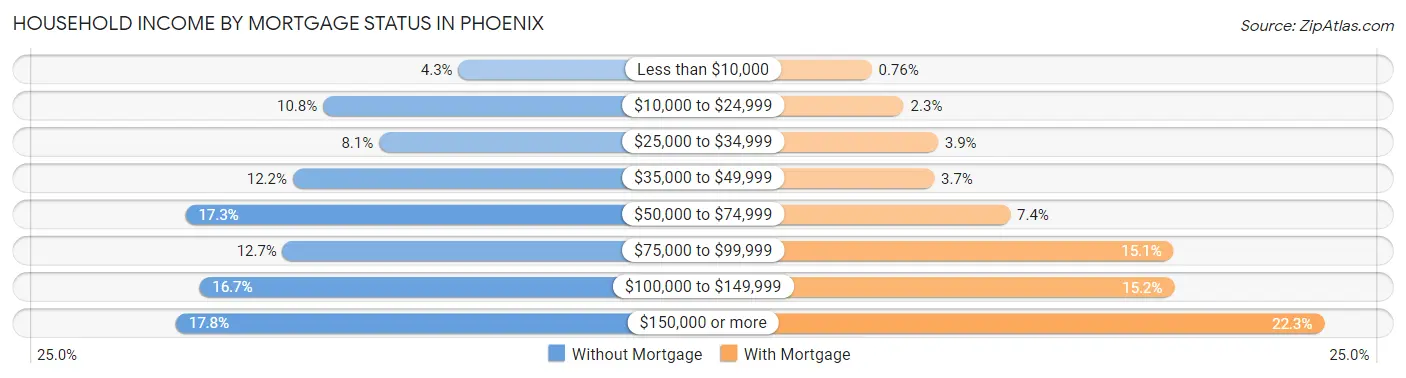
| Household Income | Without Mortgage | With Mortgage |
| Less than $10,000 | 4,519 (4.3%) | 1,752 (0.8%) |
| $10,000 to $24,999 | 11,226 (10.8%) | 5,250 (2.3%) |
| $25,000 to $34,999 | 8,449 (8.1%) | 8,999 (3.9%) |
| $35,000 to $49,999 | 12,721 (12.2%) | 8,584 (3.7%) |
| $50,000 to $74,999 | 18,042 (17.3%) | 16,905 (7.4%) |
| $75,000 to $99,999 | 13,225 (12.7%) | 34,748 (15.1%) |
| $100,000 to $149,999 | 17,356 (16.7%) | 34,842 (15.2%) |
| $150,000 or more | 18,519 (17.8%) | 51,233 (22.3%) |
| Total | 104,057 (100.0%) | 229,574 (100.0%) |
Property Value to Household Income Ratio in Phoenix
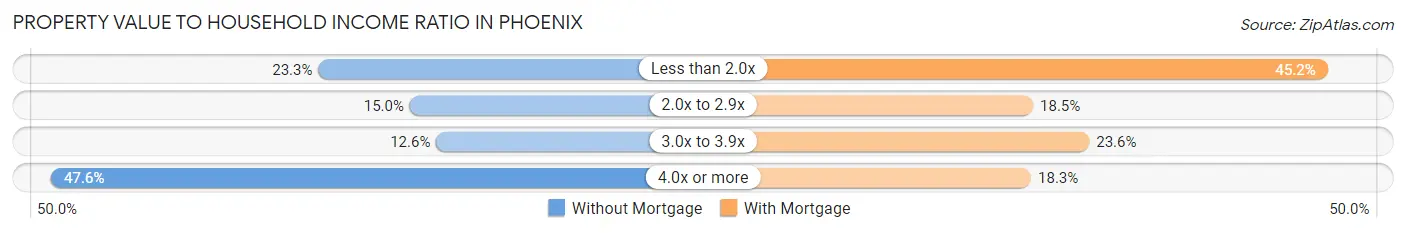
| Value-to-Income Ratio | Without Mortgage | With Mortgage |
| Less than 2.0x | 24,275 (23.3%) | 103,737 (45.2%) |
| 2.0x to 2.9x | 15,633 (15.0%) | 42,357 (18.4%) |
| 3.0x to 3.9x | 13,129 (12.6%) | 54,067 (23.5%) |
| 4.0x or more | 49,529 (47.6%) | 41,932 (18.3%) |
| Total | 104,057 (100.0%) | 229,574 (100.0%) |
Real Estate Taxes by Mortgage Status in Phoenix
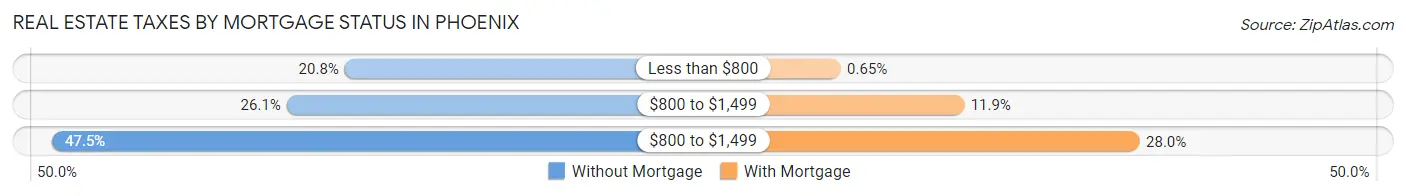
| Property Taxes | Without Mortgage | With Mortgage |
| Less than $800 | 21,614 (20.8%) | 1,497 (0.6%) |
| $800 to $1,499 | 27,123 (26.1%) | 27,381 (11.9%) |
| $800 to $1,499 | 49,428 (47.5%) | 64,174 (28.0%) |
| Total | 104,057 (100.0%) | 229,574 (100.0%) |
Health & Disability in Phoenix
Health Insurance Coverage by Age in Phoenix
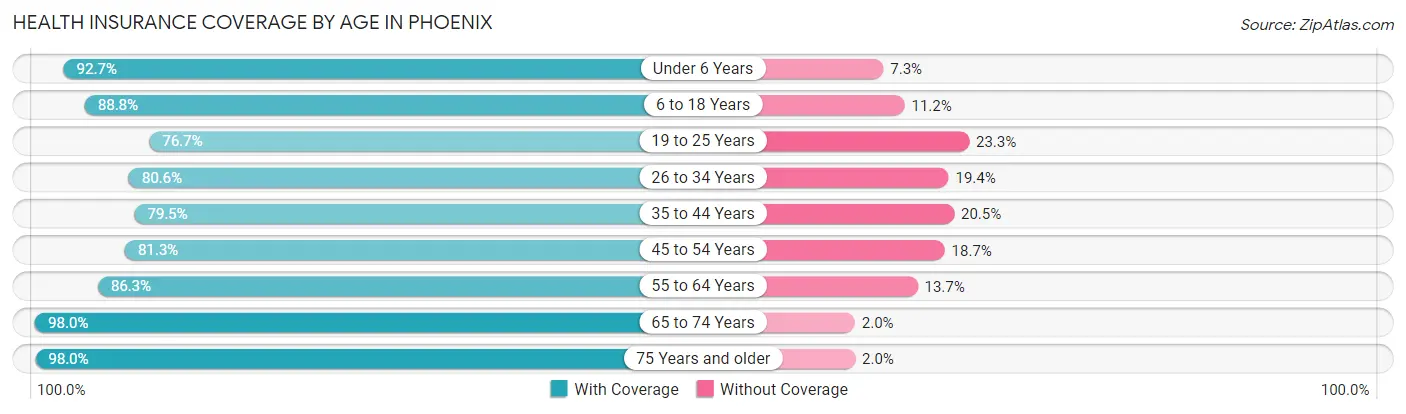
| Age Bracket | With Coverage | Without Coverage |
| Under 6 Years | 115,603 (92.7%) | 9,082 (7.3%) |
| 6 to 18 Years | 259,791 (88.8%) | 32,900 (11.2%) |
| 19 to 25 Years | 127,943 (76.7%) | 38,773 (23.3%) |
| 26 to 34 Years | 186,471 (80.6%) | 45,011 (19.4%) |
| 35 to 44 Years | 177,155 (79.5%) | 45,610 (20.5%) |
| 45 to 54 Years | 163,149 (81.3%) | 37,567 (18.7%) |
| 55 to 64 Years | 151,659 (86.3%) | 23,987 (13.7%) |
| 65 to 74 Years | 111,456 (98.0%) | 2,237 (2.0%) |
| 75 Years and older | 67,614 (98.0%) | 1,385 (2.0%) |
| Total | 1,360,841 (85.2%) | 236,552 (14.8%) |
Health Insurance Coverage by Citizenship Status in Phoenix
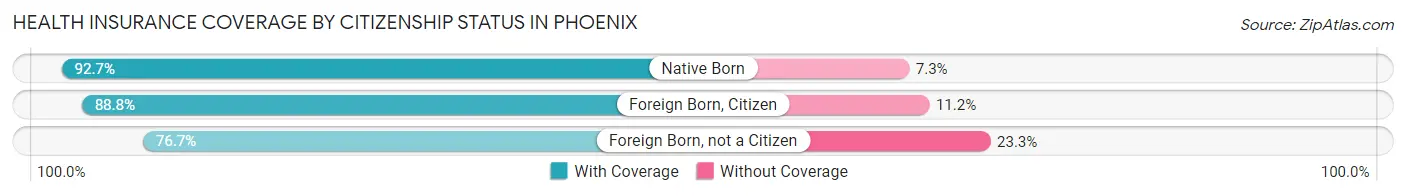
| Citizenship Status | With Coverage | Without Coverage |
| Native Born | 115,603 (92.7%) | 9,082 (7.3%) |
| Foreign Born, Citizen | 259,791 (88.8%) | 32,900 (11.2%) |
| Foreign Born, not a Citizen | 127,943 (76.7%) | 38,773 (23.3%) |
Health Insurance Coverage by Household Income in Phoenix
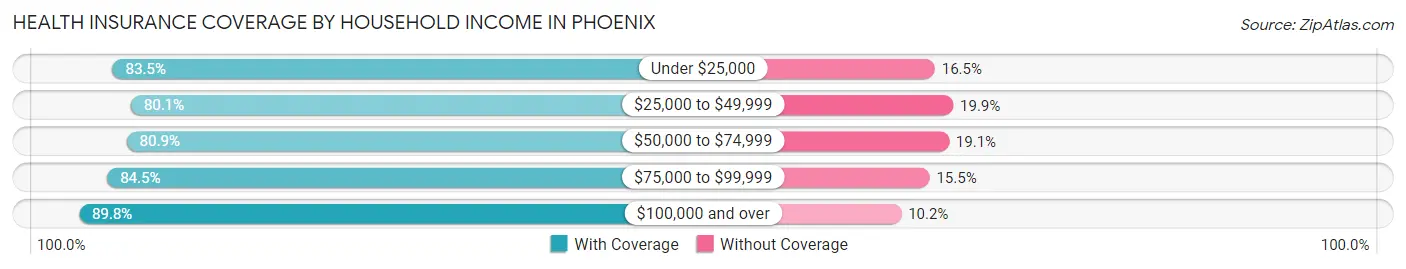
| Household Income | With Coverage | Without Coverage |
| Under $25,000 | 134,927 (83.5%) | 26,638 (16.5%) |
| $25,000 to $49,999 | 219,218 (80.1%) | 54,534 (19.9%) |
| $50,000 to $74,999 | 221,336 (80.9%) | 52,366 (19.1%) |
| $75,000 to $99,999 | 196,572 (84.5%) | 36,031 (15.5%) |
| $100,000 and over | 578,433 (89.8%) | 65,642 (10.2%) |
Public vs Private Health Insurance Coverage by Age in Phoenix
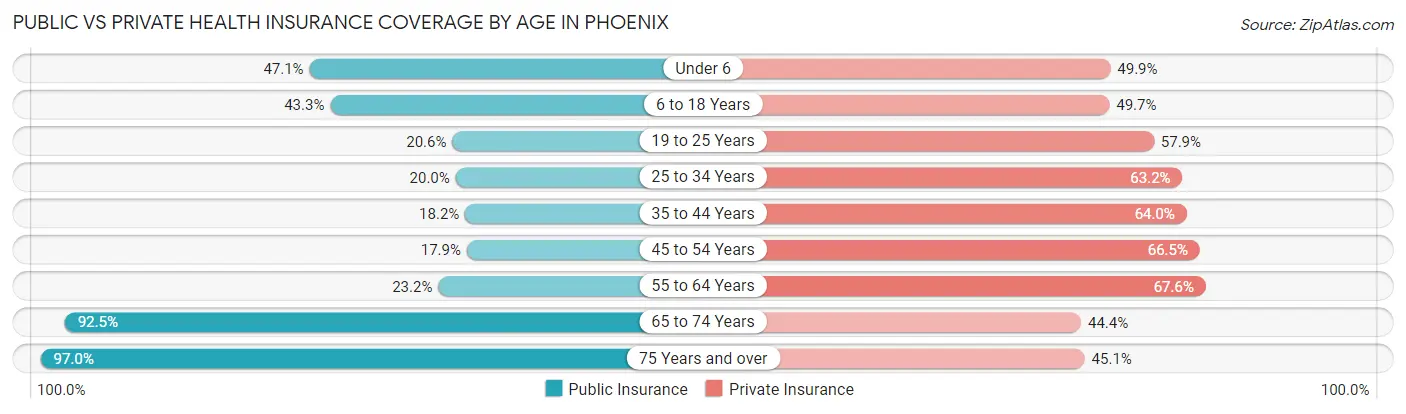
| Age Bracket | Public Insurance | Private Insurance |
| Under 6 | 58,761 (47.1%) | 62,155 (49.8%) |
| 6 to 18 Years | 126,650 (43.3%) | 145,312 (49.6%) |
| 19 to 25 Years | 34,382 (20.6%) | 96,563 (57.9%) |
| 25 to 34 Years | 46,285 (20.0%) | 146,343 (63.2%) |
| 35 to 44 Years | 40,612 (18.2%) | 142,596 (64.0%) |
| 45 to 54 Years | 35,984 (17.9%) | 133,377 (66.4%) |
| 55 to 64 Years | 40,793 (23.2%) | 118,650 (67.5%) |
| 65 to 74 Years | 105,216 (92.5%) | 50,488 (44.4%) |
| 75 Years and over | 66,950 (97.0%) | 31,102 (45.1%) |
| Total | 555,633 (34.8%) | 926,586 (58.0%) |
Disability Status by Sex by Age in Phoenix
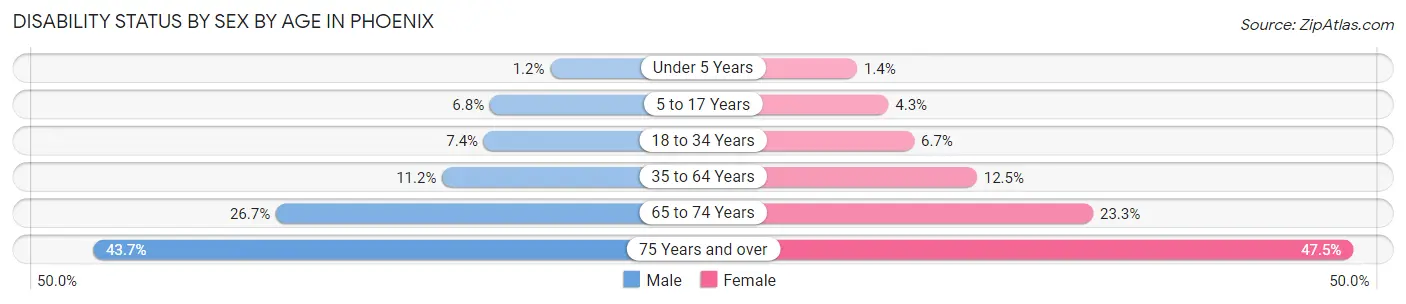
| Age Bracket | Male | Female |
| Under 5 Years | 631 (1.2%) | 721 (1.4%) |
| 5 to 17 Years | 10,234 (6.8%) | 6,040 (4.3%) |
| 18 to 34 Years | 15,666 (7.4%) | 14,059 (6.7%) |
| 35 to 64 Years | 34,106 (11.2%) | 37,034 (12.5%) |
| 65 to 74 Years | 14,191 (26.7%) | 14,105 (23.3%) |
| 75 Years and over | 12,974 (43.6%) | 18,640 (47.5%) |
Disability Class by Sex by Age in Phoenix
Disability Class: Hearing Difficulty
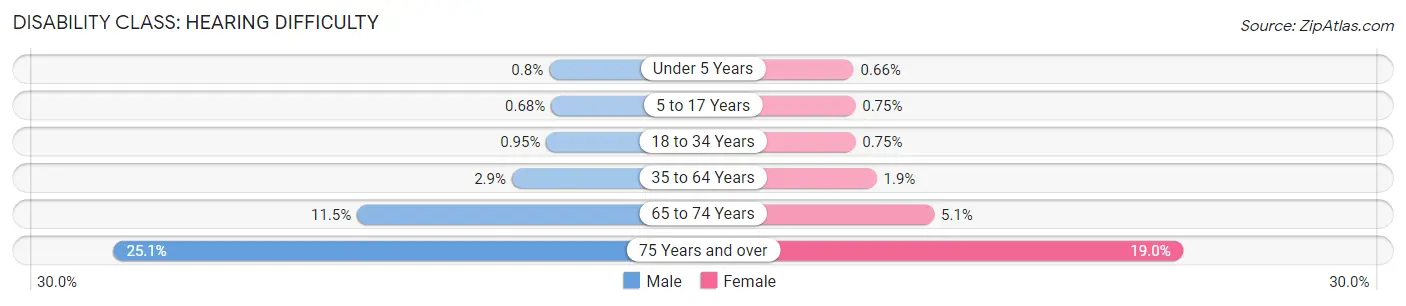
| Age Bracket | Male | Female |
| Under 5 Years | 416 (0.8%) | 336 (0.7%) |
| 5 to 17 Years | 1,029 (0.7%) | 1,051 (0.7%) |
| 18 to 34 Years | 2,017 (0.9%) | 1,570 (0.7%) |
| 35 to 64 Years | 8,696 (2.9%) | 5,743 (1.9%) |
| 65 to 74 Years | 6,116 (11.5%) | 3,111 (5.1%) |
| 75 Years and over | 7,444 (25.1%) | 7,450 (19.0%) |
Disability Class: Vision Difficulty
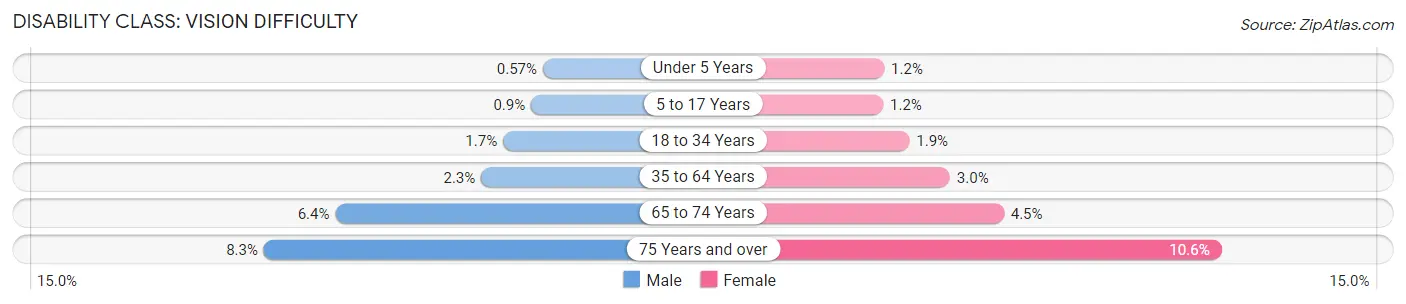
| Age Bracket | Male | Female |
| Under 5 Years | 297 (0.6%) | 600 (1.2%) |
| 5 to 17 Years | 1,347 (0.9%) | 1,615 (1.1%) |
| 18 to 34 Years | 3,578 (1.7%) | 3,941 (1.9%) |
| 35 to 64 Years | 6,955 (2.3%) | 8,899 (3.0%) |
| 65 to 74 Years | 3,380 (6.4%) | 2,725 (4.5%) |
| 75 Years and over | 2,480 (8.3%) | 4,153 (10.6%) |
Disability Class: Cognitive Difficulty
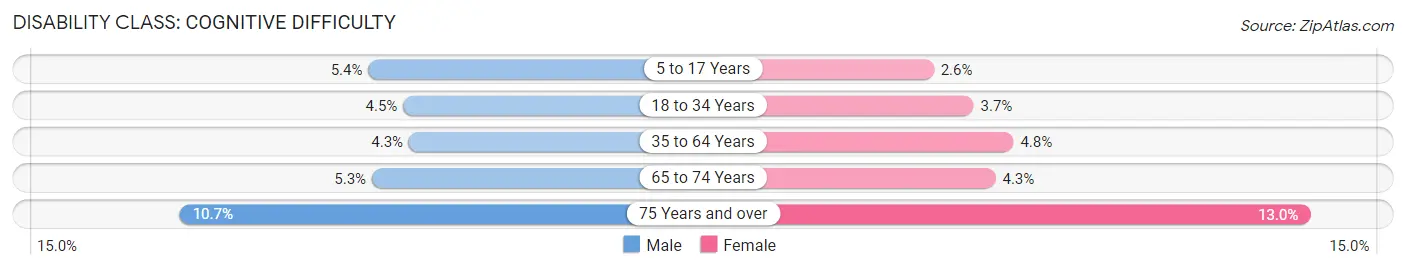
| Age Bracket | Male | Female |
| 5 to 17 Years | 8,166 (5.4%) | 3,581 (2.6%) |
| 18 to 34 Years | 9,491 (4.5%) | 7,688 (3.7%) |
| 35 to 64 Years | 13,059 (4.3%) | 14,132 (4.8%) |
| 65 to 74 Years | 2,837 (5.3%) | 2,586 (4.3%) |
| 75 Years and over | 3,173 (10.7%) | 5,123 (13.0%) |
Disability Class: Ambulatory Difficulty
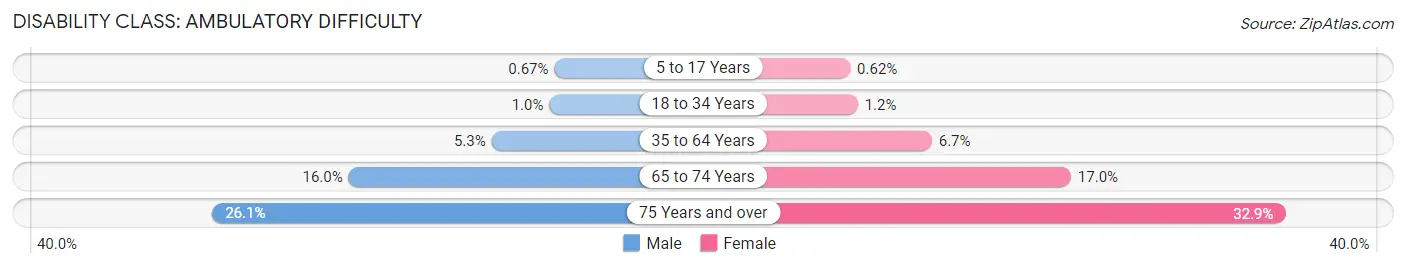
| Age Bracket | Male | Female |
| 5 to 17 Years | 1,014 (0.7%) | 866 (0.6%) |
| 18 to 34 Years | 2,202 (1.0%) | 2,476 (1.2%) |
| 35 to 64 Years | 16,172 (5.3%) | 19,739 (6.7%) |
| 65 to 74 Years | 8,488 (16.0%) | 10,288 (17.0%) |
| 75 Years and over | 7,749 (26.1%) | 12,932 (32.9%) |
Disability Class: Self-Care Difficulty

| Age Bracket | Male | Female |
| 5 to 17 Years | 2,208 (1.5%) | 1,278 (0.9%) |
| 18 to 34 Years | 2,006 (0.9%) | 1,599 (0.8%) |
| 35 to 64 Years | 5,765 (1.9%) | 4,945 (1.7%) |
| 65 to 74 Years | 2,244 (4.2%) | 2,458 (4.1%) |
| 75 Years and over | 3,127 (10.5%) | 4,700 (12.0%) |
Technology Access in Phoenix
Computing Device Access in Phoenix
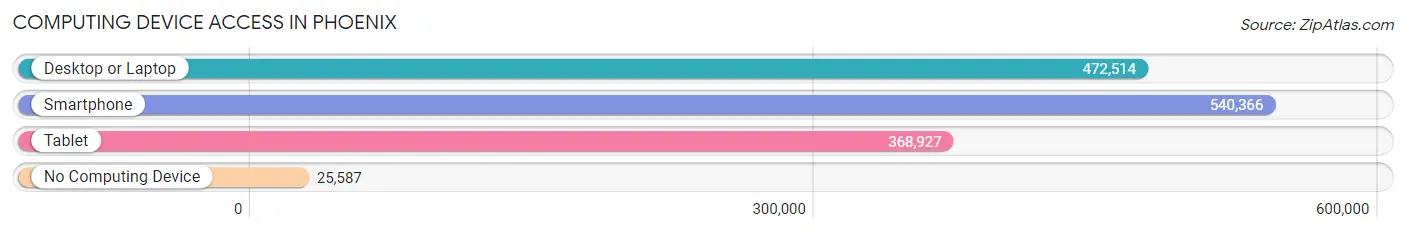
| Device Type | # Households | % Households |
| Desktop or Laptop | 472,514 | 79.9% |
| Smartphone | 540,366 | 91.4% |
| Tablet | 368,927 | 62.4% |
| No Computing Device | 25,587 | 4.3% |
| Total | 591,169 | 100.0% |
Internet Access in Phoenix
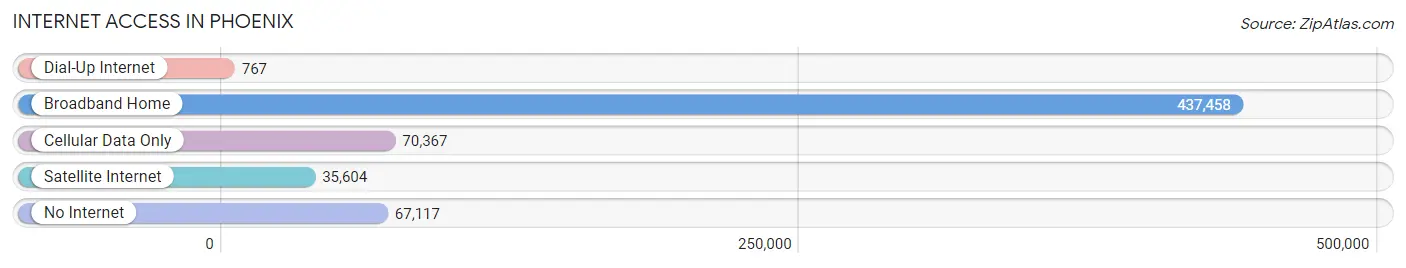
| Internet Type | # Households | % Households |
| Dial-Up Internet | 767 | 0.1% |
| Broadband Home | 437,458 | 74.0% |
| Cellular Data Only | 70,367 | 11.9% |
| Satellite Internet | 35,604 | 6.0% |
| No Internet | 67,117 | 11.4% |
| Total | 591,169 | 100.0% |
Phoenix Summary
Phoenix, Arizona is the capital and most populous city in the state of Arizona. Located in the southwestern United States, Phoenix is the sixth-largest city in the United States and the largest city in the state of Arizona. Phoenix is the anchor of the Phoenix metropolitan area, also known as the Valley of the Sun, which is the 12th-largest metropolitan area by population in the United States.
History
The area that is now Phoenix was originally inhabited by the Hohokam people, who built canals to support their agriculture. The canals were the largest and most sophisticated in the prehistoric New World. Some of the canals are still in use today.
The city of Phoenix was founded in 1867 by Jack Swilling, a Confederate veteran who had moved to the area from Wickenburg, Arizona. Swilling had heard of the Hohokam canals and believed that they could be used to irrigate the area. He formed the Swilling Irrigation Canal Company and began to build canals to bring water to the area.
The city was officially incorporated in 1881 and was named after the mythical bird, the Phoenix, which is said to have risen from its own ashes. The city quickly grew and by the early 1900s, it was the largest city in Arizona.
Geography
Phoenix is located in the Sonoran Desert in the southwestern United States. The city is situated in the Salt River Valley, which is surrounded by mountains on all sides. The city is located at an elevation of 1,117 feet (340 m) above sea level.
The city covers an area of 517.9 square miles (1,341 km2), making it the sixth-largest city in the United States by land area. The city is divided into 15 urban villages, each with its own unique character and amenities.
Economy
Phoenix is a major economic center in the southwestern United States. The city is home to several Fortune 500 companies, including Avnet, PetSmart, and Apollo Group. The city is also home to several major universities, including Arizona State University, University of Phoenix, and Grand Canyon University.
The city’s economy is largely based on tourism, manufacturing, and technology. The city is home to several major tourist attractions, including the Phoenix Zoo, the Desert Botanical Garden, and the Heard Museum. The city is also home to several major manufacturing companies, including Intel, Honeywell, and Boeing.
Demographics
As of the 2010 census, Phoenix had a population of 1,445,632, making it the sixth-largest city in the United States. The city is racially and ethnically diverse, with a population that is 44.3% White, 4.3% African American, 3.4% Asian, and 2.7% Native American. The city is also home to a large Hispanic population, with 40.8% of the population identifying as Hispanic or Latino.
The median household income in Phoenix is $50,867, and the median home value is $213,400. The city has a poverty rate of 17.2%, which is higher than the national average.
Conclusion
Phoenix, Arizona is the capital and most populous city in the state of Arizona. Located in the southwestern United States, Phoenix is the sixth-largest city in the United States and the largest city in the state of Arizona. Phoenix is the anchor of the Phoenix metropolitan area, also known as the Valley of the Sun, which is the 12th-largest metropolitan area by population in the United States. The city was founded in 1867 and has since grown to become a major economic center in the southwestern United States. The city is racially and ethnically diverse, with a population that is 44.3% White, 4.3% African American, 3.4% Asian, and 2.7% Native American. The city’s economy is largely based on tourism, manufacturing, and technology. Phoenix is a major economic center in the southwestern United States and is home to several Fortune 500 companies, universities, and tourist attractions.
Common Questions
What is Per Capita Income in Phoenix?
Per Capita income in Phoenix is $37,499.
What is the Median Family Income in Phoenix?
Median Family Income in Phoenix is $84,018.
What is the Median Household income in Phoenix?
Median Household Income in Phoenix is $72,092.
What is Income or Wage Gap in Phoenix?
Income or Wage Gap in Phoenix is 16.7%.
Women in Phoenix earn 83.3 cents for every dollar earned by a man.
What is Family Income Deficit in Phoenix?
Family Income Deficit in Phoenix is $11,830.
Families that are below poverty line in Phoenix earn $11,830 less on average than the poverty threshold level.
What is Inequality or Gini Index in Phoenix?
Inequality or Gini Index in Phoenix is 0.47.
What is the Total Population of Phoenix?
Total Population of Phoenix is 1,609,456.
What is the Total Male Population of Phoenix?
Total Male Population of Phoenix is 810,974.
What is the Total Female Population of Phoenix?
Total Female Population of Phoenix is 798,482.
What is the Ratio of Males per 100 Females in Phoenix?
There are 101.56 Males per 100 Females in Phoenix.
What is the Ratio of Females per 100 Males in Phoenix?
There are 98.46 Females per 100 Males in Phoenix.
What is the Median Population Age in Phoenix?
Median Population Age in Phoenix is 34.4 Years.
What is the Average Family Size in Phoenix
Average Family Size in Phoenix is 3.3 People.
What is the Average Household Size in Phoenix
Average Household Size in Phoenix is 2.7 People.
How Large is the Labor Force in Phoenix?
There are 858,275 People in the Labor Forcein in Phoenix.
What is the Percentage of People in the Labor Force in Phoenix?
68.1% of People are in the Labor Force in Phoenix.
What is the Unemployment Rate in Phoenix?
Unemployment Rate in Phoenix is 5.2%.