Nashville, TN Map & Demographics
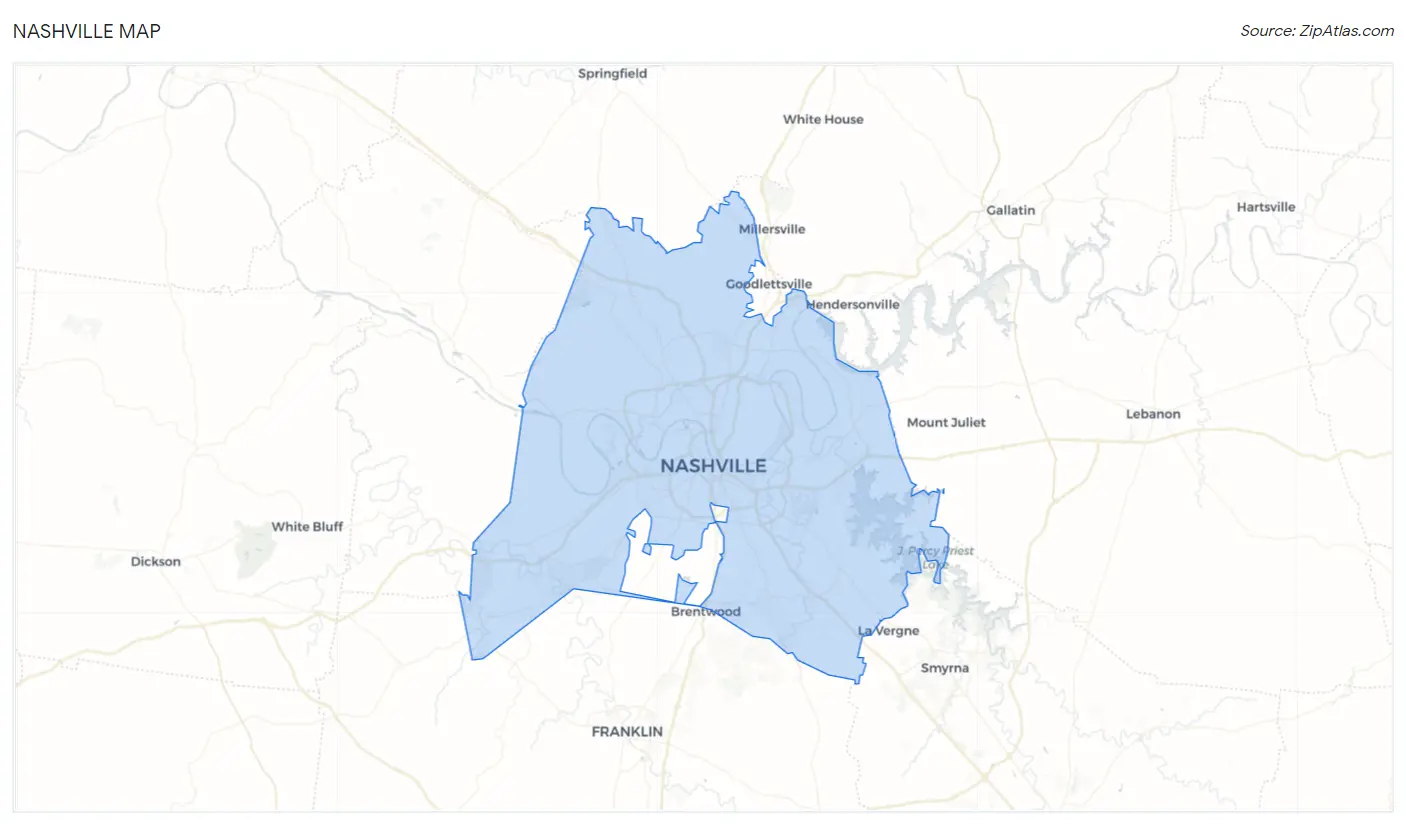
Nashville Map
Nashville Overview
$44,433
PER CAPITA INCOME
$90,214
AVG FAMILY INCOME
$71,328
AVG HOUSEHOLD INCOME
14.4%
WAGE / INCOME GAP [ % ]
85.6¢/ $1
WAGE / INCOME GAP [ $ ]
$11,783
FAMILY INCOME DEFICIT
0.48
INEQUALITY / GINI INDEX
684,103
TOTAL POPULATION
331,753
MALE POPULATION
352,350
FEMALE POPULATION
94.15
MALES / 100 FEMALES
106.21
FEMALES / 100 MALES
34.6
MEDIAN AGE
3.0
AVG FAMILY SIZE
2.3
AVG HOUSEHOLD SIZE
401,949
LABOR FORCE [ PEOPLE ]
71.9%
PERCENT IN LABOR FORCE
4.6%
UNEMPLOYMENT RATE
Nashville Zip Codes
Nashville Area Codes
Income in Nashville
Income Overview in Nashville
Per Capita Income in Nashville is $44,433, while median incomes of families and households are $90,214 and $71,328 respectively.
| Characteristic | Number | Measure |
| Per Capita Income | 684,103 | $44,433 |
| Median Family Income | 151,991 | $90,214 |
| Mean Family Income | 151,991 | $122,797 |
| Median Household Income | 291,884 | $71,328 |
| Mean Household Income | 291,884 | $102,258 |
| Income Deficit | 151,991 | $11,783 |
| Wage / Income Gap (%) | 684,103 | 14.38% |
| Wage / Income Gap ($) | 684,103 | 85.62¢ per $1 |
| Gini / Inequality Index | 684,103 | 0.48 |
Earnings by Sex in Nashville
Average Earnings in Nashville are $42,866, $46,404 for men and $39,731 for women, a difference of 14.4%.
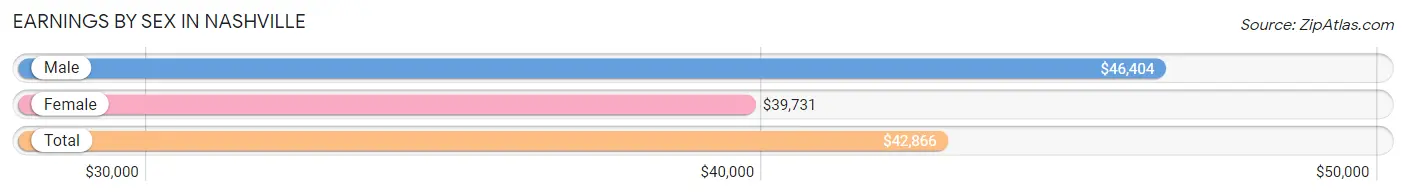
| Sex | Number | Average Earnings |
| Male | 214,639 (51.0%) | $46,404 |
| Female | 205,941 (49.0%) | $39,731 |
| Total | 420,580 (100.0%) | $42,866 |
Earnings by Sex by Income Bracket in Nashville
The most common earnings brackets in Nashville are $100,000+ for men (37,099 | 17.3%) and $100,000+ for women (19,811 | 9.6%).
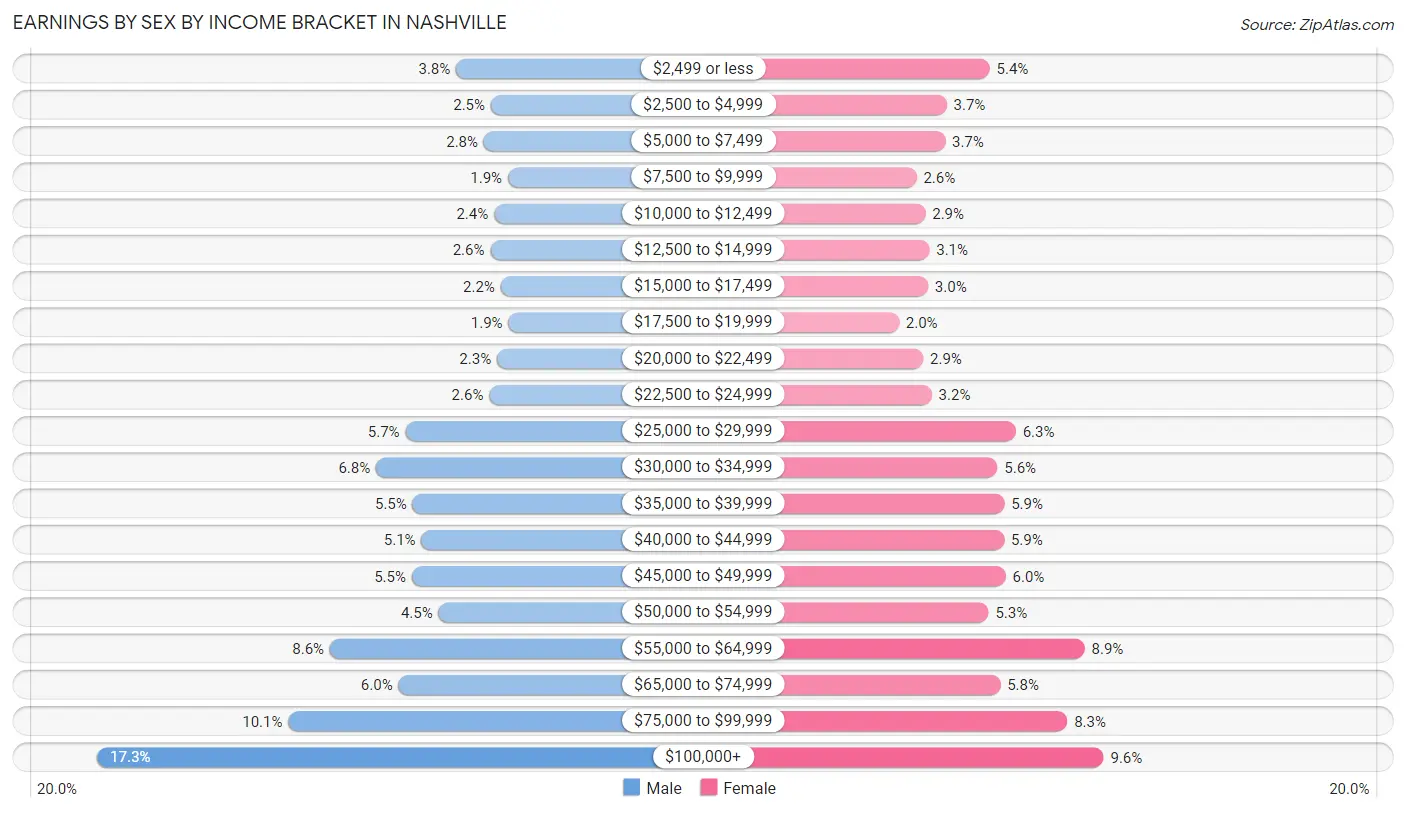
| Income | Male | Female |
| $2,499 or less | 8,216 (3.8%) | 11,015 (5.3%) |
| $2,500 to $4,999 | 5,434 (2.5%) | 7,701 (3.7%) |
| $5,000 to $7,499 | 5,997 (2.8%) | 7,579 (3.7%) |
| $7,500 to $9,999 | 4,052 (1.9%) | 5,373 (2.6%) |
| $10,000 to $12,499 | 5,183 (2.4%) | 6,054 (2.9%) |
| $12,500 to $14,999 | 5,472 (2.5%) | 6,369 (3.1%) |
| $15,000 to $17,499 | 4,631 (2.2%) | 6,258 (3.0%) |
| $17,500 to $19,999 | 4,008 (1.9%) | 4,021 (1.9%) |
| $20,000 to $22,499 | 4,934 (2.3%) | 5,881 (2.9%) |
| $22,500 to $24,999 | 5,563 (2.6%) | 6,546 (3.2%) |
| $25,000 to $29,999 | 12,307 (5.7%) | 13,039 (6.3%) |
| $30,000 to $34,999 | 14,665 (6.8%) | 11,617 (5.6%) |
| $35,000 to $39,999 | 11,714 (5.5%) | 12,146 (5.9%) |
| $40,000 to $44,999 | 11,019 (5.1%) | 12,138 (5.9%) |
| $45,000 to $49,999 | 11,774 (5.5%) | 12,259 (5.9%) |
| $50,000 to $54,999 | 9,627 (4.5%) | 10,940 (5.3%) |
| $55,000 to $64,999 | 18,368 (8.6%) | 18,341 (8.9%) |
| $65,000 to $74,999 | 12,858 (6.0%) | 11,847 (5.8%) |
| $75,000 to $99,999 | 21,718 (10.1%) | 17,006 (8.3%) |
| $100,000+ | 37,099 (17.3%) | 19,811 (9.6%) |
| Total | 214,639 (100.0%) | 205,941 (100.0%) |
Earnings by Sex by Educational Attainment in Nashville
Average earnings in Nashville are $52,434 for men and $45,380 for women, a difference of 13.5%. Men with an educational attainment of graduate degree enjoy the highest average annual earnings of $85,695, while those with less than high school education earn the least with $33,909. Women with an educational attainment of graduate degree earn the most with the average annual earnings of $64,861, while those with less than high school education have the smallest earnings of $24,685.
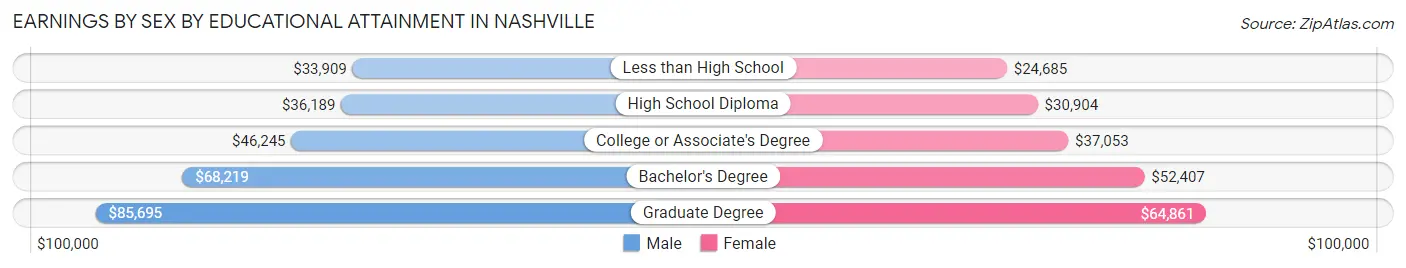
| Educational Attainment | Male Income | Female Income |
| Less than High School | $33,909 | $24,685 |
| High School Diploma | $36,189 | $30,904 |
| College or Associate's Degree | $46,245 | $37,053 |
| Bachelor's Degree | $68,219 | $52,407 |
| Graduate Degree | $85,695 | $64,861 |
| Total | $52,434 | $45,380 |
Family Income in Nashville
Family Income Brackets in Nashville
According to the Nashville family income data, there are 30,094 families falling into the $100,000 to $149,999 income range, which is the most common income bracket and makes up 19.8% of all families. Conversely, the $10,000 to $14,999 income bracket is the least frequent group with only 2,432 families (1.6%) belonging to this category.
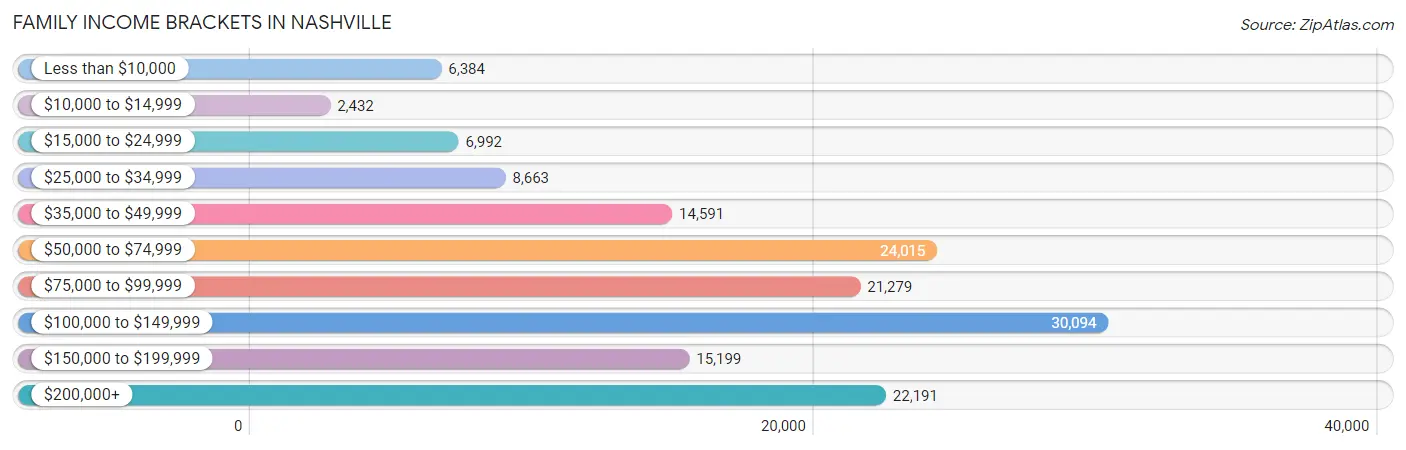
| Income Bracket | # Families | % Families |
| Less than $10,000 | 6,384 | 4.2% |
| $10,000 to $14,999 | 2,432 | 1.6% |
| $15,000 to $24,999 | 6,992 | 4.6% |
| $25,000 to $34,999 | 8,663 | 5.7% |
| $35,000 to $49,999 | 14,591 | 9.6% |
| $50,000 to $74,999 | 24,015 | 15.8% |
| $75,000 to $99,999 | 21,279 | 14.0% |
| $100,000 to $149,999 | 30,094 | 19.8% |
| $150,000 to $199,999 | 15,199 | 10.0% |
| $200,000+ | 22,191 | 14.6% |
Family Income by Famaliy Size in Nashville
4-person families (24,660 | 16.2%) account for the highest median family income in Nashville with $96,912 per family, while 2-person families (75,401 | 49.6%) have the highest median income of $43,912 per family member.
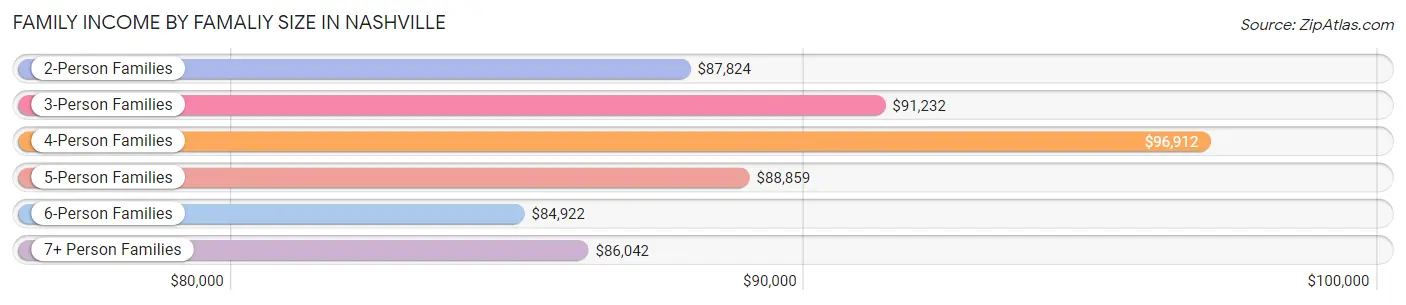
| Income Bracket | # Families | Median Income |
| 2-Person Families | 75,401 (49.6%) | $87,824 |
| 3-Person Families | 34,644 (22.8%) | $91,232 |
| 4-Person Families | 24,660 (16.2%) | $96,912 |
| 5-Person Families | 11,567 (7.6%) | $88,859 |
| 6-Person Families | 3,331 (2.2%) | $84,922 |
| 7+ Person Families | 2,388 (1.6%) | $86,042 |
| Total | 151,991 (100.0%) | $90,214 |
Family Income by Number of Earners in Nashville
The median family income in Nashville is $90,214, with families comprising 3+ earners (16,163) having the highest median family income of $124,757, while families with no earners (15,738) have the lowest median family income of $46,257, accounting for 10.6% and 10.3% of families, respectively.
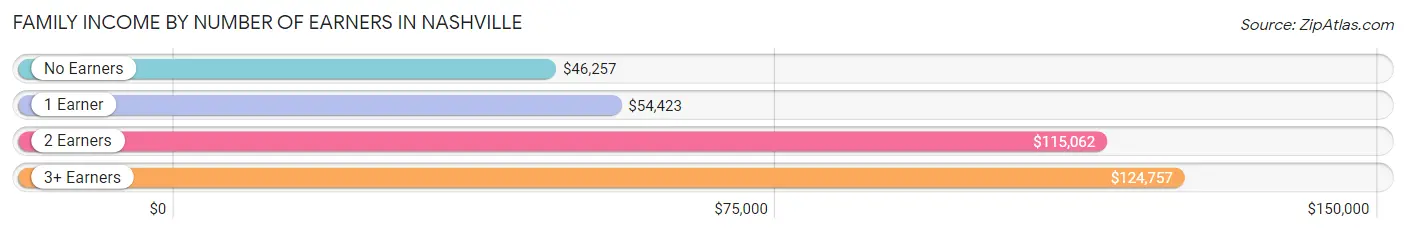
| Number of Earners | # Families | Median Income |
| No Earners | 15,738 (10.3%) | $46,257 |
| 1 Earner | 47,921 (31.5%) | $54,423 |
| 2 Earners | 72,169 (47.5%) | $115,062 |
| 3+ Earners | 16,163 (10.6%) | $124,757 |
| Total | 151,991 (100.0%) | $90,214 |
Household Income in Nashville
Household Income Brackets in Nashville
With 52,539 households falling in the category, the $50,000 to $74,999 income range is the most frequent in Nashville, accounting for 18.0% of all households. In contrast, only 9,340 households (3.2%) fall into the $10,000 to $14,999 income bracket, making it the least populous group.
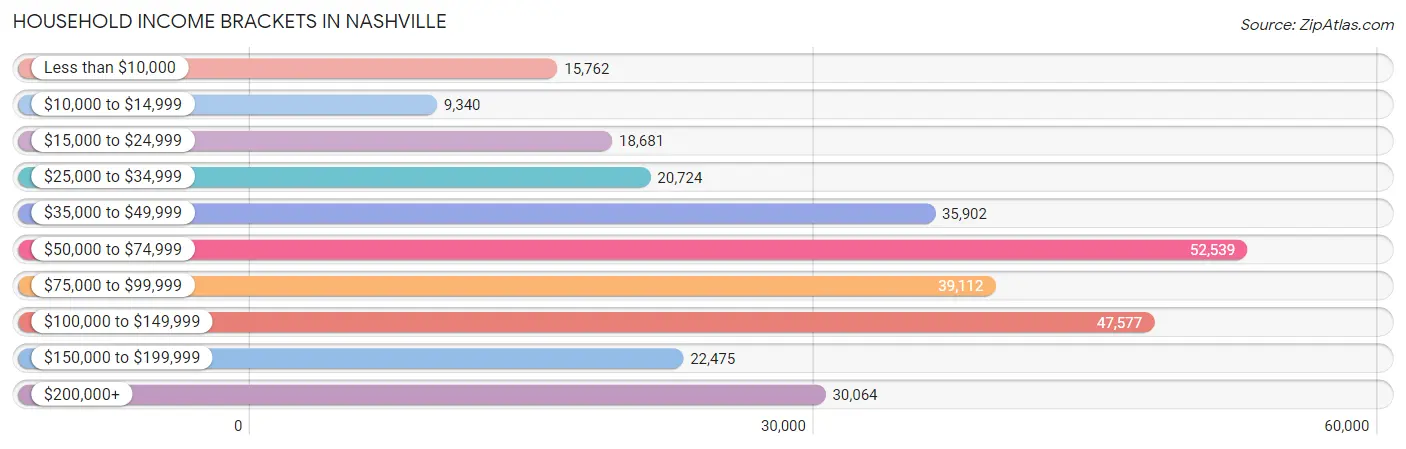
| Income Bracket | # Households | % Households |
| Less than $10,000 | 15,762 | 5.4% |
| $10,000 to $14,999 | 9,340 | 3.2% |
| $15,000 to $24,999 | 18,681 | 6.4% |
| $25,000 to $34,999 | 20,724 | 7.1% |
| $35,000 to $49,999 | 35,902 | 12.3% |
| $50,000 to $74,999 | 52,539 | 18.0% |
| $75,000 to $99,999 | 39,112 | 13.4% |
| $100,000 to $149,999 | 47,577 | 16.3% |
| $150,000 to $199,999 | 22,475 | 7.7% |
| $200,000+ | 30,064 | 10.3% |
Household Income by Householder Age in Nashville
The median household income in Nashville is $71,328, with the highest median household income of $81,205 found in the 45 to 64 years age bracket for the primary householder. A total of 90,981 households (31.2%) fall into this category. Meanwhile, the 15 to 24 years age bracket for the primary householder has the lowest median household income of $42,607, with 15,129 households (5.2%) in this group.
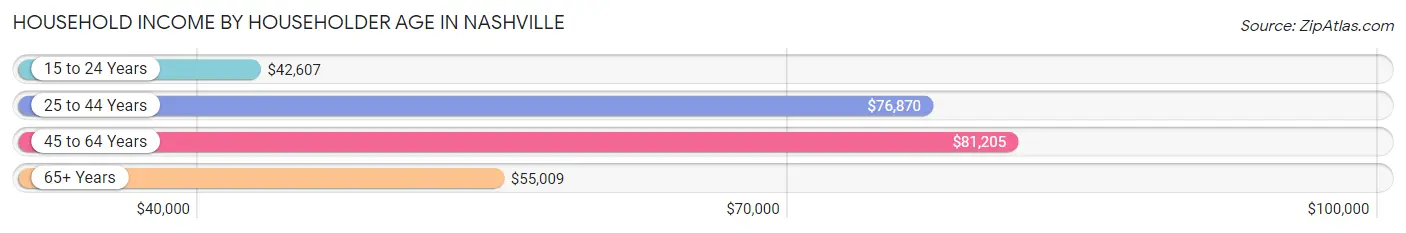
| Income Bracket | # Households | Median Income |
| 15 to 24 Years | 15,129 (5.2%) | $42,607 |
| 25 to 44 Years | 128,512 (44.0%) | $76,870 |
| 45 to 64 Years | 90,981 (31.2%) | $81,205 |
| 65+ Years | 57,262 (19.6%) | $55,009 |
| Total | 291,884 (100.0%) | $71,328 |
Poverty in Nashville
Income Below Poverty by Sex and Age in Nashville
With 12.5% poverty level for males and 16.4% for females among the residents of Nashville, 5 year old males and 5 year old females are the most vulnerable to poverty, with 988 males (27.4%) and 1,616 females (33.6%) in their respective age groups living below the poverty level.
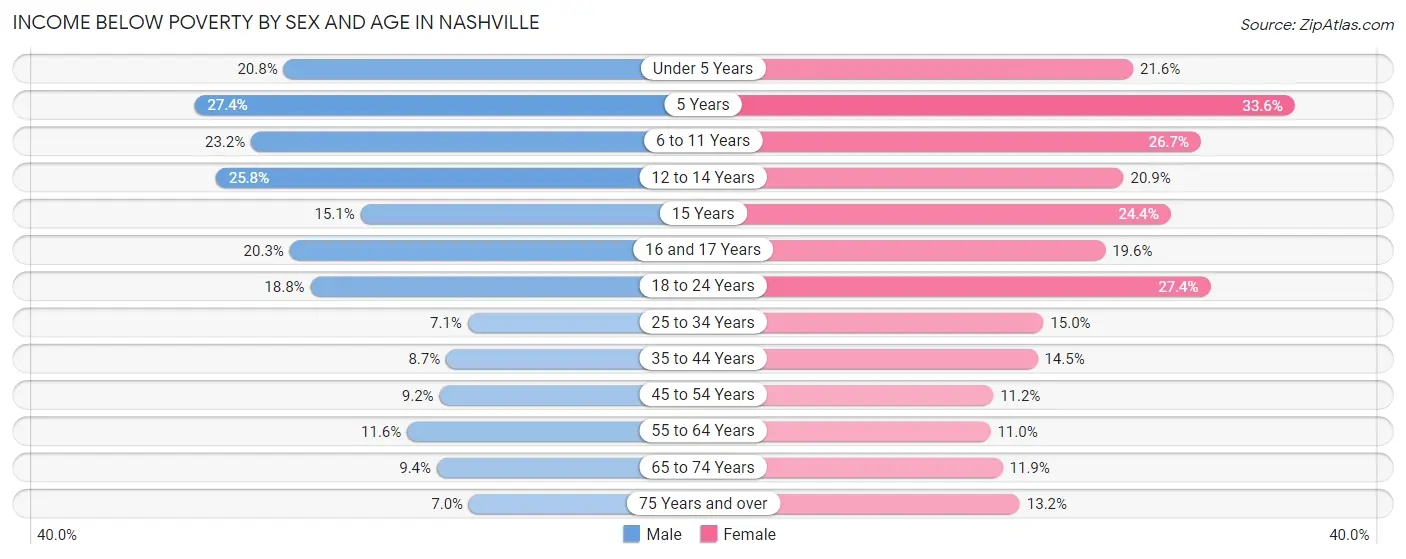
| Age Bracket | Male | Female |
| Under 5 Years | 4,544 (20.8%) | 4,554 (21.6%) |
| 5 Years | 988 (27.4%) | 1,616 (33.6%) |
| 6 to 11 Years | 5,160 (23.2%) | 5,678 (26.7%) |
| 12 to 14 Years | 2,750 (25.8%) | 2,069 (20.9%) |
| 15 Years | 462 (15.1%) | 922 (24.4%) |
| 16 and 17 Years | 1,474 (20.3%) | 1,226 (19.6%) |
| 18 to 24 Years | 5,018 (18.8%) | 7,553 (27.4%) |
| 25 to 34 Years | 4,770 (7.1%) | 10,727 (15.0%) |
| 35 to 44 Years | 4,220 (8.7%) | 6,955 (14.5%) |
| 45 to 54 Years | 3,522 (9.2%) | 4,326 (11.2%) |
| 55 to 64 Years | 4,183 (11.6%) | 4,407 (11.0%) |
| 65 to 74 Years | 2,268 (9.4%) | 3,463 (11.9%) |
| 75 Years and over | 855 (7.0%) | 2,601 (13.2%) |
| Total | 40,214 (12.5%) | 56,097 (16.4%) |
Income Above Poverty by Sex and Age in Nashville
According to the poverty statistics in Nashville, males aged 75 years and over and females aged 55 to 64 years are the age groups that are most secure financially, with 93.0% of males and 89.0% of females in these age groups living above the poverty line.
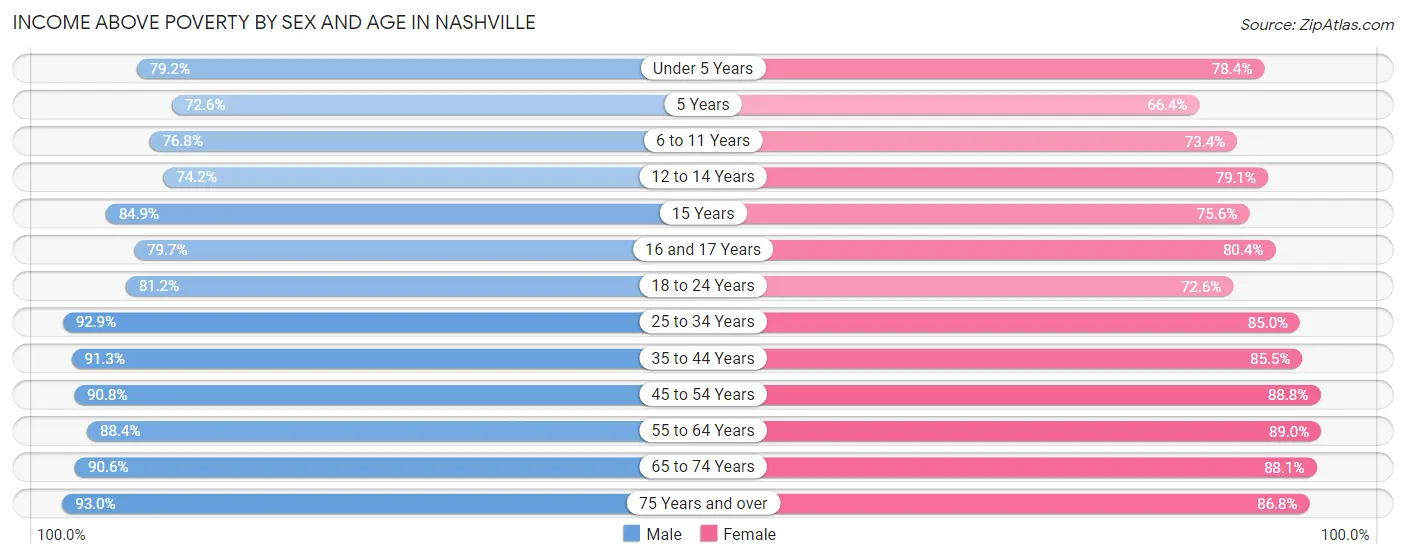
| Age Bracket | Male | Female |
| Under 5 Years | 17,323 (79.2%) | 16,500 (78.4%) |
| 5 Years | 2,619 (72.6%) | 3,191 (66.4%) |
| 6 to 11 Years | 17,091 (76.8%) | 15,625 (73.4%) |
| 12 to 14 Years | 7,910 (74.2%) | 7,819 (79.1%) |
| 15 Years | 2,605 (84.9%) | 2,855 (75.6%) |
| 16 and 17 Years | 5,779 (79.7%) | 5,043 (80.4%) |
| 18 to 24 Years | 21,708 (81.2%) | 20,054 (72.6%) |
| 25 to 34 Years | 62,376 (92.9%) | 60,948 (85.0%) |
| 35 to 44 Years | 44,229 (91.3%) | 40,903 (85.5%) |
| 45 to 54 Years | 34,746 (90.8%) | 34,167 (88.8%) |
| 55 to 64 Years | 31,878 (88.4%) | 35,504 (89.0%) |
| 65 to 74 Years | 21,896 (90.6%) | 25,536 (88.1%) |
| 75 Years and over | 11,348 (93.0%) | 17,074 (86.8%) |
| Total | 281,508 (87.5%) | 285,219 (83.6%) |
Income Below Poverty Among Married-Couple Families in Nashville
The poverty statistics for married-couple families in Nashville show that 4.6% or 4,818 of the total 104,192 families live below the poverty line. Families with 5 or more children have the highest poverty rate of 24.7%, comprising of 192 families. On the other hand, families with no children have the lowest poverty rate of 2.4%, which includes 1,452 families.
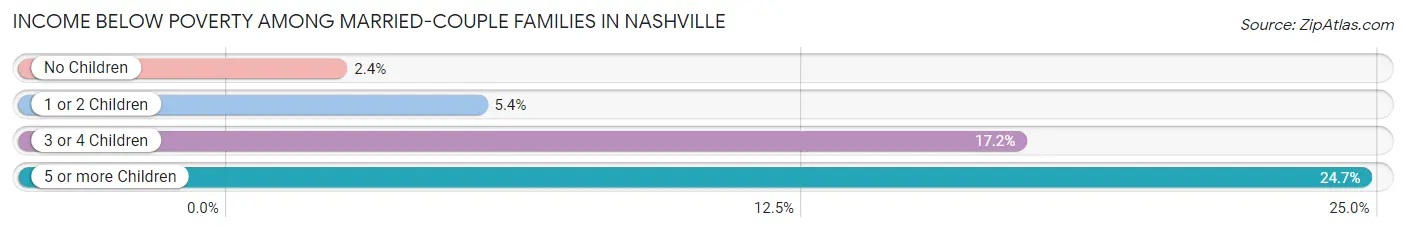
| Children | Above Poverty | Below Poverty |
| No Children | 59,566 (97.6%) | 1,452 (2.4%) |
| 1 or 2 Children | 33,079 (94.6%) | 1,901 (5.4%) |
| 3 or 4 Children | 6,143 (82.8%) | 1,273 (17.2%) |
| 5 or more Children | 586 (75.3%) | 192 (24.7%) |
| Total | 99,374 (95.4%) | 4,818 (4.6%) |
Income Below Poverty Among Single-Parent Households in Nashville
According to the poverty data in Nashville, 10.9% or 1,293 single-father households and 28.3% or 10,146 single-mother households are living below the poverty line. Among single-father households, those with 3 or 4 children have the highest poverty rate, with 292 households (33.0%) experiencing poverty. Likewise, among single-mother households, those with 5 or more children have the highest poverty rate, with 254 households (84.7%) falling below the poverty line.
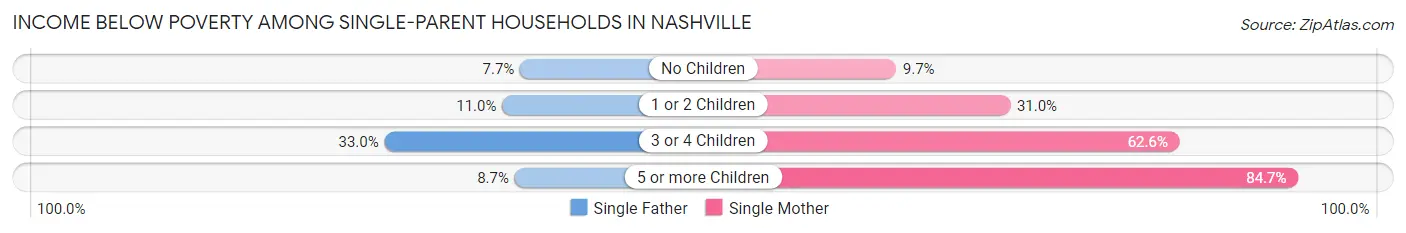
| Children | Single Father | Single Mother |
| No Children | 484 (7.7%) | 1,192 (9.7%) |
| 1 or 2 Children | 509 (11.0%) | 5,787 (31.0%) |
| 3 or 4 Children | 292 (33.0%) | 2,913 (62.6%) |
| 5 or more Children | 8 (8.7%) | 254 (84.7%) |
| Total | 1,293 (10.9%) | 10,146 (28.3%) |
Income Below Poverty Among Married-Couple vs Single-Parent Households in Nashville
The poverty data for Nashville shows that 4,818 of the married-couple family households (4.6%) and 11,439 of the single-parent households (23.9%) are living below the poverty level. Within the married-couple family households, those with 5 or more children have the highest poverty rate, with 192 households (24.7%) falling below the poverty line. Among the single-parent households, those with 5 or more children have the highest poverty rate, with 262 household (66.8%) living below poverty.
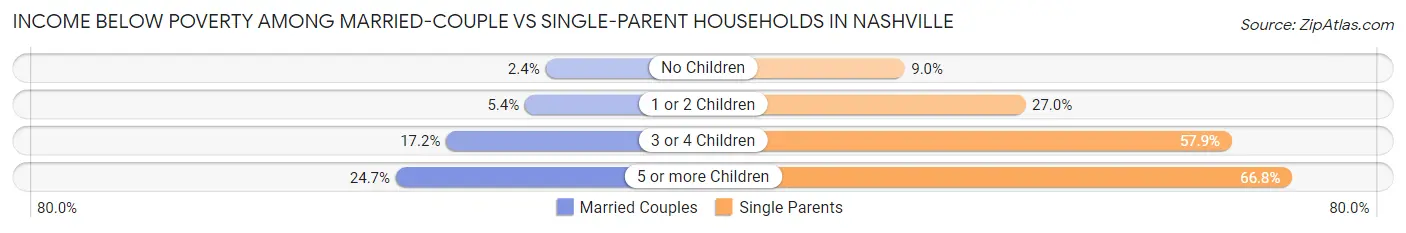
| Children | Married-Couple Families | Single-Parent Households |
| No Children | 1,452 (2.4%) | 1,676 (9.0%) |
| 1 or 2 Children | 1,901 (5.4%) | 6,296 (27.0%) |
| 3 or 4 Children | 1,273 (17.2%) | 3,205 (57.9%) |
| 5 or more Children | 192 (24.7%) | 262 (66.8%) |
| Total | 4,818 (4.6%) | 11,439 (23.9%) |
Race in Nashville
The most populous races in Nashville are White / Caucasian (404,538 | 59.1%), Black / African American (183,398 | 26.8%), and Hispanic or Latino (73,600 | 10.8%).
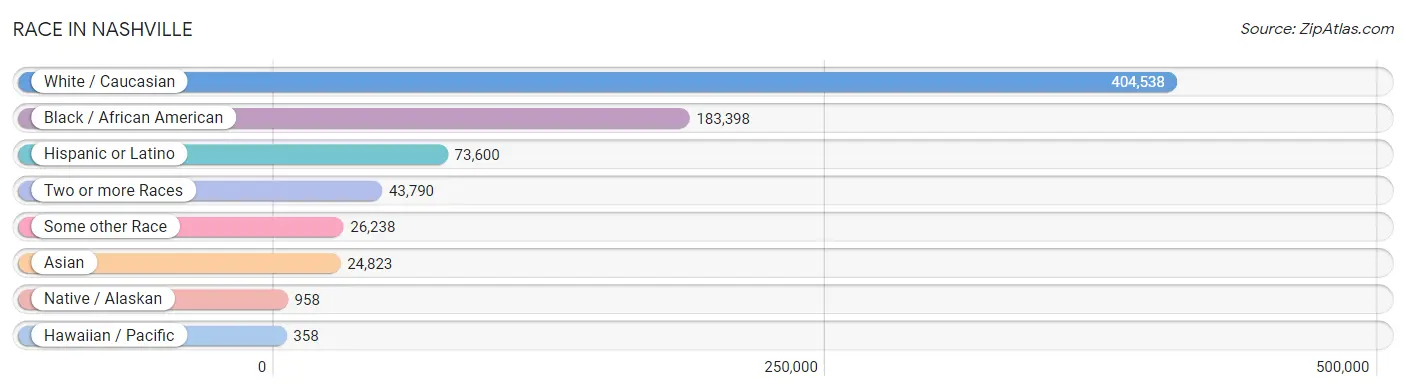
| Race | # Population | % Population |
| Asian | 24,823 | 3.6% |
| Black / African American | 183,398 | 26.8% |
| Hawaiian / Pacific | 358 | 0.1% |
| Hispanic or Latino | 73,600 | 10.8% |
| Native / Alaskan | 958 | 0.1% |
| White / Caucasian | 404,538 | 59.1% |
| Two or more Races | 43,790 | 6.4% |
| Some other Race | 26,238 | 3.8% |
| Total | 684,103 | 100.0% |
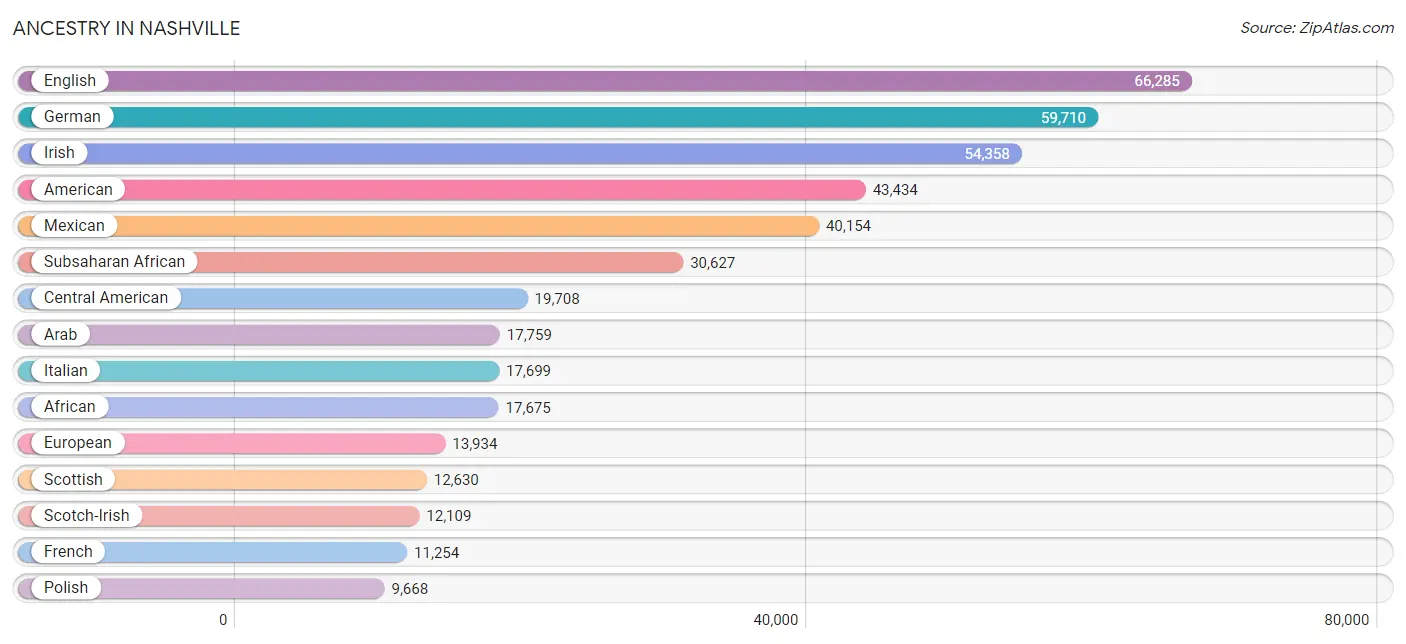
Ancestry in Nashville
The most populous ancestries reported in Nashville are English (66,285 | 9.7%), German (59,710 | 8.7%), Irish (54,358 | 8.0%), American (43,434 | 6.4%), and Mexican (40,154 | 5.9%), together accounting for 38.6% of all Nashville residents.
| Ancestry | # Population | % Population |
| Afghan | 1,238 | 0.2% |
| African | 17,675 | 2.6% |
| Alaska Native | 93 | 0.0% |
| Albanian | 947 | 0.1% |
| American | 43,434 | 6.4% |
| Apache | 202 | 0.0% |
| Arab | 17,759 | 2.6% |
| Argentinean | 284 | 0.0% |
| Armenian | 449 | 0.1% |
| Australian | 292 | 0.0% |
| Austrian | 1,441 | 0.2% |
| Bahamian | 86 | 0.0% |
| Barbadian | 10 | 0.0% |
| Basque | 45 | 0.0% |
| Belgian | 328 | 0.1% |
| Belizean | 235 | 0.0% |
| Bhutanese | 1,133 | 0.2% |
| Blackfeet | 319 | 0.1% |
| Bolivian | 114 | 0.0% |
| Brazilian | 849 | 0.1% |
| British | 4,951 | 0.7% |
| British West Indian | 335 | 0.1% |
| Bulgarian | 240 | 0.0% |
| Burmese | 3,226 | 0.5% |
| Cajun | 187 | 0.0% |
| Cambodian | 11 | 0.0% |
| Canadian | 936 | 0.1% |
| Cape Verdean | 24 | 0.0% |
| Carpatho Rusyn | 26 | 0.0% |
| Celtic | 63 | 0.0% |
| Central American | 19,708 | 2.9% |
| Central American Indian | 282 | 0.0% |
| Cherokee | 2,101 | 0.3% |
| Chickasaw | 50 | 0.0% |
| Chilean | 321 | 0.1% |
| Chippewa | 168 | 0.0% |
| Choctaw | 170 | 0.0% |
| Colombian | 1,015 | 0.2% |
| Comanche | 73 | 0.0% |
| Costa Rican | 336 | 0.1% |
| Creek | 87 | 0.0% |
| Croatian | 661 | 0.1% |
| Cuban | 3,038 | 0.4% |
| Czech | 963 | 0.1% |
| Czechoslovakian | 243 | 0.0% |
| Danish | 974 | 0.1% |
| Delaware | 19 | 0.0% |
| Dominican | 270 | 0.0% |
| Dutch | 4,241 | 0.6% |
| Eastern European | 2,066 | 0.3% |
| Ecuadorian | 519 | 0.1% |
| Egyptian | 7,153 | 1.1% |
| English | 66,285 | 9.7% |
| Ethiopian | 2,698 | 0.4% |
| European | 13,934 | 2.0% |
| Fijian | 41 | 0.0% |
| Filipino | 97 | 0.0% |
| Finnish | 541 | 0.1% |
| French | 11,254 | 1.7% |
| French Canadian | 1,557 | 0.2% |
| German | 59,710 | 8.7% |
| German Russian | 35 | 0.0% |
| Ghanaian | 673 | 0.1% |
| Greek | 1,764 | 0.3% |
| Guamanian / Chamorro | 65 | 0.0% |
| Guatemalan | 5,319 | 0.8% |
| Guyanese | 128 | 0.0% |
| Haitian | 1,029 | 0.2% |
| Honduran | 7,935 | 1.2% |
| Hungarian | 1,038 | 0.2% |
| Icelander | 51 | 0.0% |
| Indian (Asian) | 4,925 | 0.7% |
| Indonesian | 2,166 | 0.3% |
| Inupiat | 87 | 0.0% |
| Iranian | 1,055 | 0.2% |
| Iraqi | 2,025 | 0.3% |
| Irish | 54,358 | 8.0% |
| Iroquois | 121 | 0.0% |
| Israeli | 86 | 0.0% |
| Italian | 17,699 | 2.6% |
| Jamaican | 1,458 | 0.2% |
| Japanese | 942 | 0.1% |
| Jordanian | 115 | 0.0% |
| Kenyan | 292 | 0.0% |
| Korean | 3,167 | 0.5% |
| Laotian | 190 | 0.0% |
| Latvian | 178 | 0.0% |
| Lebanese | 868 | 0.1% |
| Liberian | 228 | 0.0% |
| Lithuanian | 683 | 0.1% |
| Lumbee | 18 | 0.0% |
| Luxembourger | 38 | 0.0% |
| Macedonian | 32 | 0.0% |
| Malaysian | 1,305 | 0.2% |
| Mexican | 40,154 | 5.9% |
| Mexican American Indian | 305 | 0.0% |
| Mongolian | 274 | 0.0% |
| Moroccan | 200 | 0.0% |
| Native Hawaiian | 394 | 0.1% |
| Navajo | 168 | 0.0% |
| New Zealander | 39 | 0.0% |
| Nicaraguan | 304 | 0.0% |
| Nigerian | 2,896 | 0.4% |
| Northern European | 704 | 0.1% |
| Norwegian | 3,984 | 0.6% |
| Osage | 19 | 0.0% |
| Ottawa | 3 | 0.0% |
| Pakistani | 821 | 0.1% |
| Palestinian | 379 | 0.1% |
| Panamanian | 424 | 0.1% |
| Paraguayan | 7 | 0.0% |
| Pennsylvania German | 14 | 0.0% |
| Peruvian | 629 | 0.1% |
| Polish | 9,668 | 1.4% |
| Portuguese | 655 | 0.1% |
| Potawatomi | 75 | 0.0% |
| Pueblo | 10 | 0.0% |
| Puerto Rican | 3,459 | 0.5% |
| Romanian | 626 | 0.1% |
| Russian | 3,357 | 0.5% |
| Salvadoran | 5,335 | 0.8% |
| Samoan | 435 | 0.1% |
| Scandinavian | 2,257 | 0.3% |
| Scotch-Irish | 12,109 | 1.8% |
| Scottish | 12,630 | 1.8% |
| Seminole | 28 | 0.0% |
| Senegalese | 155 | 0.0% |
| Serbian | 369 | 0.1% |
| Shoshone | 16 | 0.0% |
| Sierra Leonean | 11 | 0.0% |
| Sioux | 73 | 0.0% |
| Slavic | 103 | 0.0% |
| Slovak | 348 | 0.1% |
| Slovene | 191 | 0.0% |
| Somali | 1,127 | 0.2% |
| South African | 221 | 0.0% |
| South American | 3,461 | 0.5% |
| South American Indian | 60 | 0.0% |
| Spaniard | 527 | 0.1% |
| Spanish | 808 | 0.1% |
| Spanish American | 24 | 0.0% |
| Sri Lankan | 2,749 | 0.4% |
| Subsaharan African | 30,627 | 4.5% |
| Sudanese | 2,316 | 0.3% |
| Swedish | 3,825 | 0.6% |
| Swiss | 1,515 | 0.2% |
| Syrian | 212 | 0.0% |
| Thai | 5,328 | 0.8% |
| Tongan | 39 | 0.0% |
| Trinidadian and Tobagonian | 232 | 0.0% |
| Turkish | 463 | 0.1% |
| U.S. Virgin Islander | 75 | 0.0% |
| Ugandan | 107 | 0.0% |
| Ukrainian | 1,212 | 0.2% |
| Uruguayan | 104 | 0.0% |
| Venezuelan | 456 | 0.1% |
| Vietnamese | 301 | 0.0% |
| Welsh | 3,526 | 0.5% |
| West Indian | 473 | 0.1% |
| Yaqui | 101 | 0.0% |
| Yugoslavian | 296 | 0.0% |
| Zimbabwean | 29 | 0.0% | View All 162 Rows |
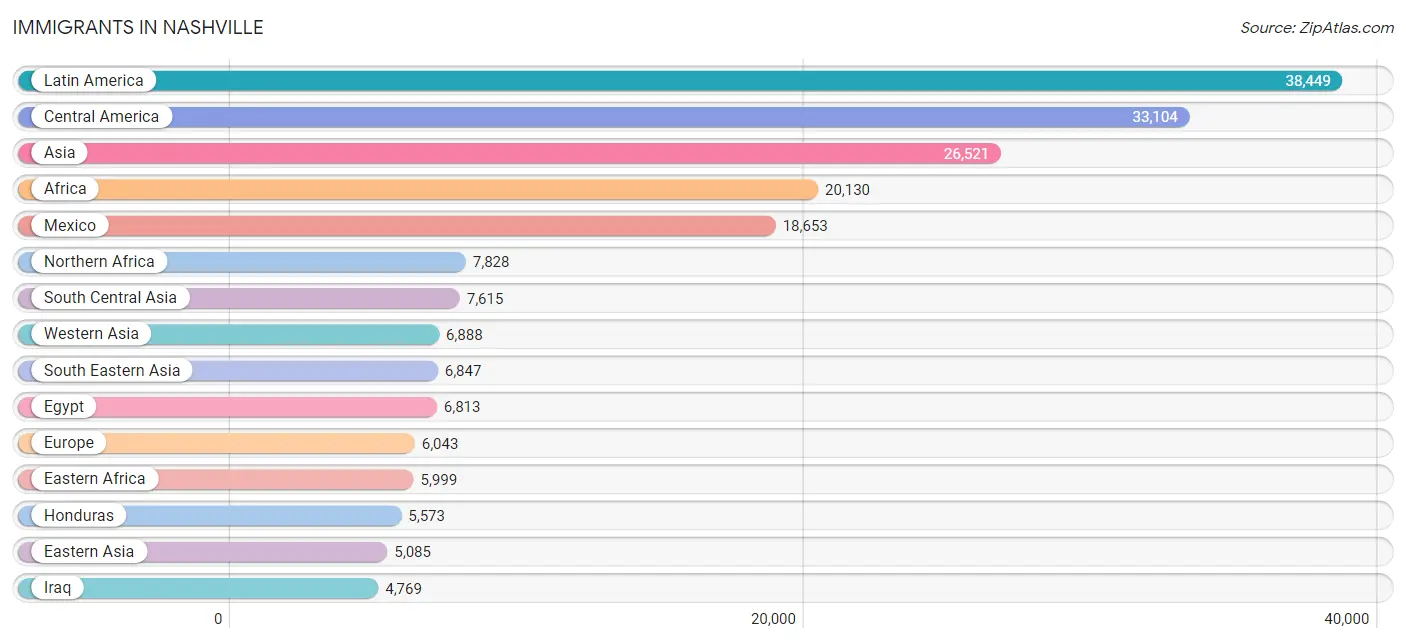
Immigrants in Nashville
The most numerous immigrant groups reported in Nashville came from Latin America (38,449 | 5.6%), Central America (33,104 | 4.8%), Asia (26,521 | 3.9%), Africa (20,130 | 2.9%), and Mexico (18,653 | 2.7%), together accounting for 20.0% of all Nashville residents.
| Immigration Origin | # Population | % Population |
| Afghanistan | 1,091 | 0.2% |
| Africa | 20,130 | 2.9% |
| Albania | 308 | 0.1% |
| Argentina | 55 | 0.0% |
| Armenia | 1 | 0.0% |
| Asia | 26,521 | 3.9% |
| Australia | 253 | 0.0% |
| Austria | 33 | 0.0% |
| Bahamas | 44 | 0.0% |
| Bangladesh | 393 | 0.1% |
| Belarus | 63 | 0.0% |
| Belgium | 27 | 0.0% |
| Belize | 144 | 0.0% |
| Bolivia | 71 | 0.0% |
| Bosnia and Herzegovina | 192 | 0.0% |
| Brazil | 242 | 0.0% |
| Bulgaria | 114 | 0.0% |
| Cambodia | 264 | 0.0% |
| Cameroon | 156 | 0.0% |
| Canada | 2,099 | 0.3% |
| Caribbean | 3,125 | 0.5% |
| Central America | 33,104 | 4.8% |
| Chile | 181 | 0.0% |
| China | 2,822 | 0.4% |
| Colombia | 606 | 0.1% |
| Congo | 529 | 0.1% |
| Costa Rica | 192 | 0.0% |
| Croatia | 96 | 0.0% |
| Cuba | 1,615 | 0.2% |
| Czechoslovakia | 37 | 0.0% |
| Denmark | 30 | 0.0% |
| Dominica | 29 | 0.0% |
| Dominican Republic | 153 | 0.0% |
| Eastern Africa | 5,999 | 0.9% |
| Eastern Asia | 5,085 | 0.7% |
| Eastern Europe | 2,438 | 0.4% |
| Ecuador | 132 | 0.0% |
| Egypt | 6,813 | 1.0% |
| El Salvador | 3,695 | 0.5% |
| England | 470 | 0.1% |
| Eritrea | 255 | 0.0% |
| Ethiopia | 2,882 | 0.4% |
| Europe | 6,043 | 0.9% |
| Fiji | 15 | 0.0% |
| France | 273 | 0.0% |
| Germany | 818 | 0.1% |
| Ghana | 727 | 0.1% |
| Greece | 137 | 0.0% |
| Grenada | 56 | 0.0% |
| Guatemala | 4,644 | 0.7% |
| Guyana | 168 | 0.0% |
| Haiti | 317 | 0.1% |
| Honduras | 5,573 | 0.8% |
| Hong Kong | 15 | 0.0% |
| Hungary | 14 | 0.0% |
| India | 2,801 | 0.4% |
| Indonesia | 100 | 0.0% |
| Iran | 793 | 0.1% |
| Iraq | 4,769 | 0.7% |
| Ireland | 201 | 0.0% |
| Israel | 226 | 0.0% |
| Italy | 293 | 0.0% |
| Jamaica | 475 | 0.1% |
| Japan | 406 | 0.1% |
| Jordan | 271 | 0.0% |
| Kazakhstan | 63 | 0.0% |
| Kenya | 302 | 0.0% |
| Korea | 1,846 | 0.3% |
| Kuwait | 317 | 0.1% |
| Laos | 762 | 0.1% |
| Latin America | 38,449 | 5.6% |
| Lebanon | 89 | 0.0% |
| Liberia | 232 | 0.0% |
| Malaysia | 467 | 0.1% |
| Mexico | 18,653 | 2.7% |
| Middle Africa | 2,063 | 0.3% |
| Moldova | 26 | 0.0% |
| Morocco | 171 | 0.0% |
| Nepal | 722 | 0.1% |
| Netherlands | 37 | 0.0% |
| Nicaragua | 150 | 0.0% |
| Nigeria | 1,400 | 0.2% |
| North Macedonia | 8 | 0.0% |
| Northern Africa | 7,828 | 1.1% |
| Northern Europe | 1,790 | 0.3% |
| Oceania | 409 | 0.1% |
| Pakistan | 279 | 0.0% |
| Panama | 53 | 0.0% |
| Peru | 330 | 0.1% |
| Philippines | 1,447 | 0.2% |
| Poland | 300 | 0.0% |
| Romania | 146 | 0.0% |
| Russia | 319 | 0.1% |
| Saudi Arabia | 50 | 0.0% |
| Scotland | 145 | 0.0% |
| Senegal | 111 | 0.0% |
| Serbia | 43 | 0.0% |
| Sierra Leone | 45 | 0.0% |
| Singapore | 37 | 0.0% |
| Somalia | 1,277 | 0.2% |
| South Africa | 494 | 0.1% |
| South America | 2,220 | 0.3% |
| South Central Asia | 7,615 | 1.1% |
| South Eastern Asia | 6,847 | 1.0% |
| Southern Europe | 584 | 0.1% |
| Spain | 154 | 0.0% |
| Sri Lanka | 48 | 0.0% |
| Sudan | 745 | 0.1% |
| Sweden | 80 | 0.0% |
| Switzerland | 35 | 0.0% |
| Syria | 156 | 0.0% |
| Taiwan | 53 | 0.0% |
| Thailand | 792 | 0.1% |
| Trinidad and Tobago | 323 | 0.1% |
| Turkey | 416 | 0.1% |
| Uganda | 96 | 0.0% |
| Ukraine | 270 | 0.0% |
| Uruguay | 66 | 0.0% |
| Uzbekistan | 600 | 0.1% |
| Venezuela | 362 | 0.1% |
| Vietnam | 1,429 | 0.2% |
| West Indies | 11 | 0.0% |
| Western Africa | 2,704 | 0.4% |
| Western Asia | 6,888 | 1.0% |
| Western Europe | 1,223 | 0.2% |
| Yemen | 401 | 0.1% |
| Zaire | 1,315 | 0.2% |
| Zimbabwe | 35 | 0.0% | View All 128 Rows |
Sex and Age in Nashville
Sex and Age in Nashville
The most populous age groups in Nashville are 25 to 29 Years (34,143 | 10.3%) for men and 25 to 29 Years (37,421 | 10.6%) for women.
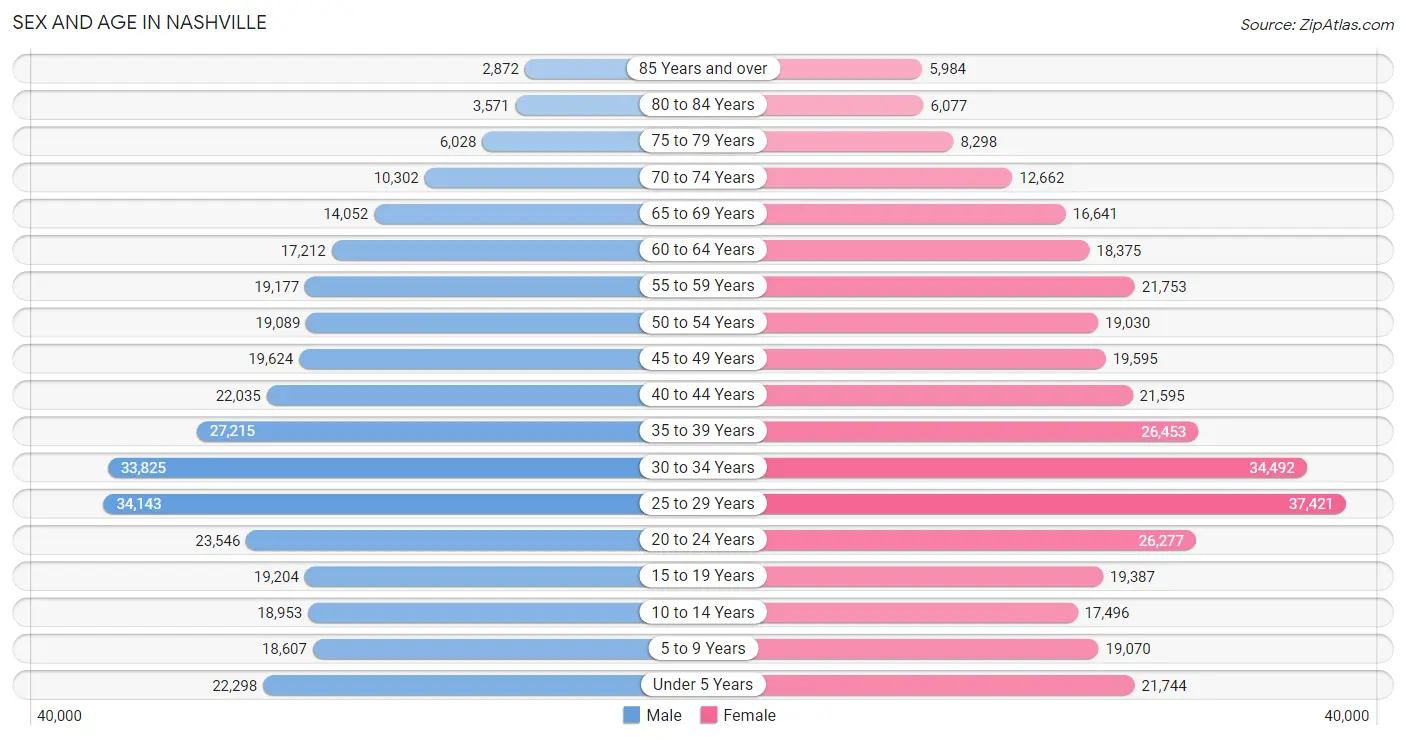
| Age Bracket | Male | Female |
| Under 5 Years | 22,298 (6.7%) | 21,744 (6.2%) |
| 5 to 9 Years | 18,607 (5.6%) | 19,070 (5.4%) |
| 10 to 14 Years | 18,953 (5.7%) | 17,496 (5.0%) |
| 15 to 19 Years | 19,204 (5.8%) | 19,387 (5.5%) |
| 20 to 24 Years | 23,546 (7.1%) | 26,277 (7.5%) |
| 25 to 29 Years | 34,143 (10.3%) | 37,421 (10.6%) |
| 30 to 34 Years | 33,825 (10.2%) | 34,492 (9.8%) |
| 35 to 39 Years | 27,215 (8.2%) | 26,453 (7.5%) |
| 40 to 44 Years | 22,035 (6.6%) | 21,595 (6.1%) |
| 45 to 49 Years | 19,624 (5.9%) | 19,595 (5.6%) |
| 50 to 54 Years | 19,089 (5.8%) | 19,030 (5.4%) |
| 55 to 59 Years | 19,177 (5.8%) | 21,753 (6.2%) |
| 60 to 64 Years | 17,212 (5.2%) | 18,375 (5.2%) |
| 65 to 69 Years | 14,052 (4.2%) | 16,641 (4.7%) |
| 70 to 74 Years | 10,302 (3.1%) | 12,662 (3.6%) |
| 75 to 79 Years | 6,028 (1.8%) | 8,298 (2.4%) |
| 80 to 84 Years | 3,571 (1.1%) | 6,077 (1.7%) |
| 85 Years and over | 2,872 (0.9%) | 5,984 (1.7%) |
| Total | 331,753 (100.0%) | 352,350 (100.0%) |
Families and Households in Nashville
Median Family Size in Nashville
The median family size in Nashville is 3.04 persons per family, with single female/mother families (35,904 | 23.6%) accounting for the largest median family size of 3.06 persons per family. On the other hand, single male/father families (11,895 | 7.8%) represent the smallest median family size with 2.90 persons per family.
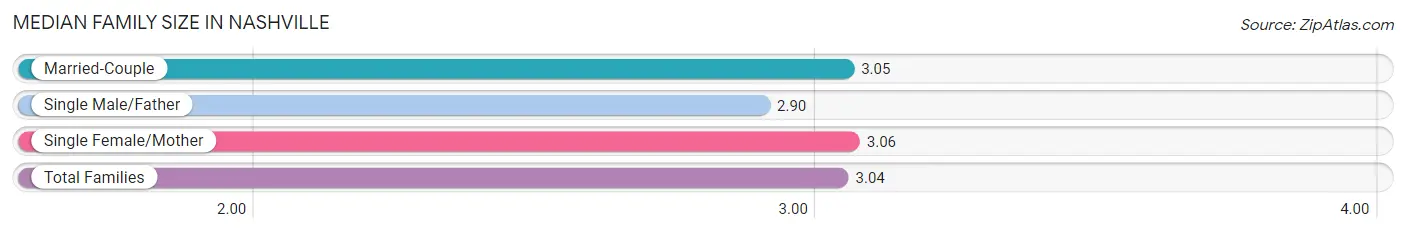
| Family Type | # Families | Family Size |
| Married-Couple | 104,192 (68.5%) | 3.05 |
| Single Male/Father | 11,895 (7.8%) | 2.90 |
| Single Female/Mother | 35,904 (23.6%) | 3.06 |
| Total Families | 151,991 (100.0%) | 3.04 |
Median Household Size in Nashville
The median household size in Nashville is 2.27 persons per household, with single male/father households (11,895 | 4.1%) accounting for the largest median household size of 3.26 persons per household. non-family households (139,893 | 47.9%) represent the smallest median household size with 1.34 persons per household.
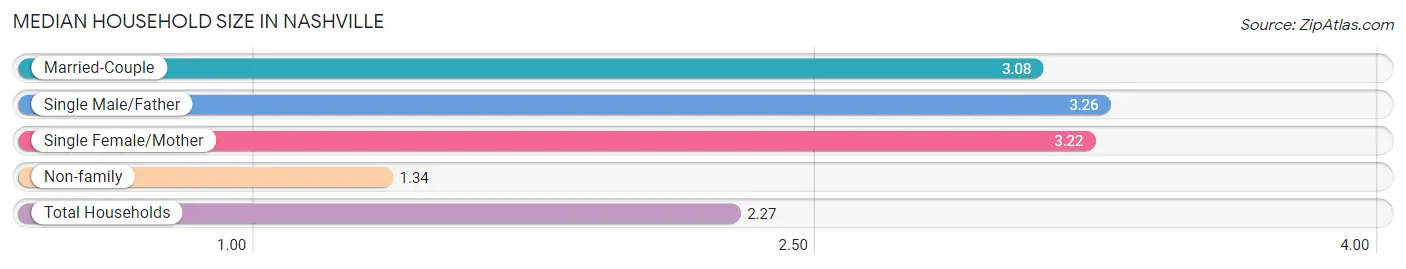
| Household Type | # Households | Household Size |
| Married-Couple | 104,192 (35.7%) | 3.08 |
| Single Male/Father | 11,895 (4.1%) | 3.26 |
| Single Female/Mother | 35,904 (12.3%) | 3.22 |
| Non-family | 139,893 (47.9%) | 1.34 |
| Total Households | 291,884 (100.0%) | 2.27 |
Household Size by Marriage Status in Nashville
Out of a total of 291,884 households in Nashville, 151,991 (52.1%) are family households, while 139,893 (47.9%) are nonfamily households. The most numerous type of family households are 2-person households, comprising 70,609, and the most common type of nonfamily households are 1-person households, comprising 106,010.
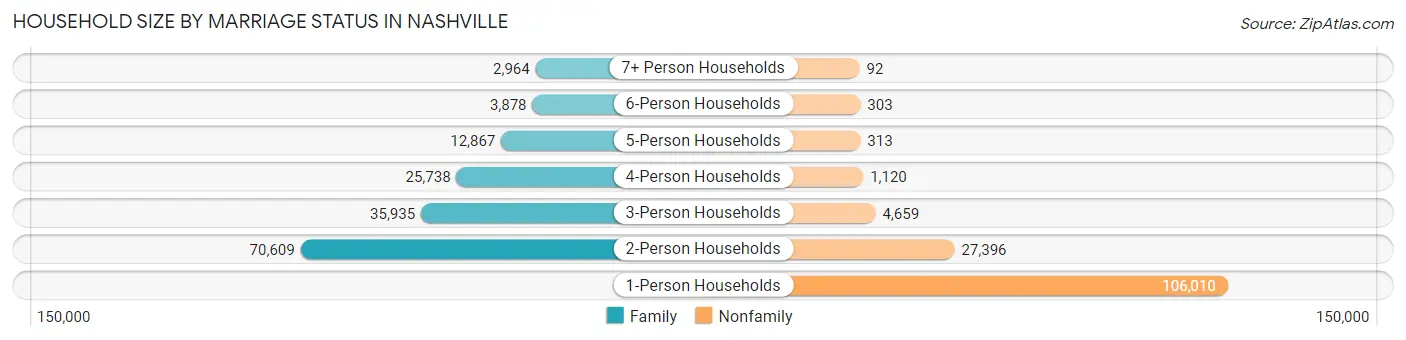
| Household Size | Family Households | Nonfamily Households |
| 1-Person Households | - | 106,010 (36.3%) |
| 2-Person Households | 70,609 (24.2%) | 27,396 (9.4%) |
| 3-Person Households | 35,935 (12.3%) | 4,659 (1.6%) |
| 4-Person Households | 25,738 (8.8%) | 1,120 (0.4%) |
| 5-Person Households | 12,867 (4.4%) | 313 (0.1%) |
| 6-Person Households | 3,878 (1.3%) | 303 (0.1%) |
| 7+ Person Households | 2,964 (1.0%) | 92 (0.0%) |
| Total | 151,991 (52.1%) | 139,893 (47.9%) |
Female Fertility in Nashville
Fertility by Age in Nashville
Average fertility rate in Nashville is 56.0 births per 1,000 women. Women in the age bracket of 20 to 34 years have the highest fertility rate with 77.0 births per 1,000 women. Women in the age bracket of 20 to 34 years acount for 71.9% of all women with births.
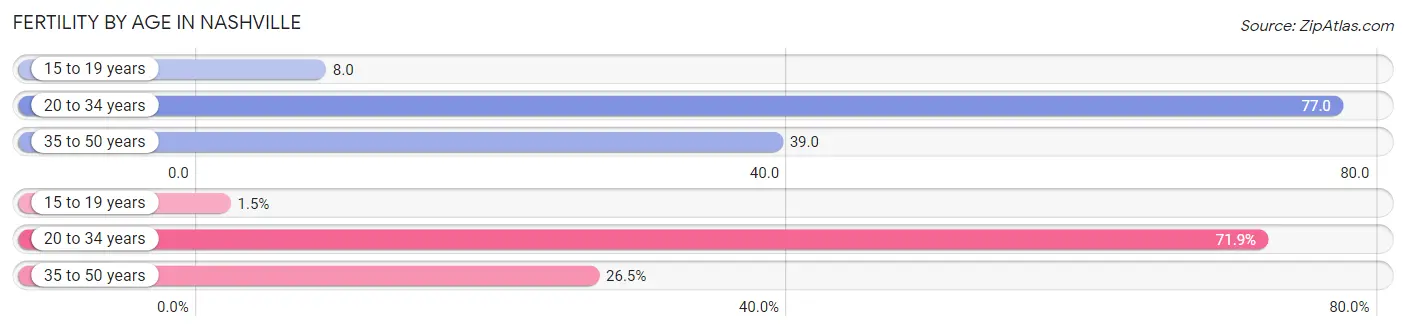
| Age Bracket | Women with Births | Births / 1,000 Women |
| 15 to 19 years | 161 (1.5%) | 8.0 |
| 20 to 34 years | 7,565 (71.9%) | 77.0 |
| 35 to 50 years | 2,791 (26.5%) | 39.0 |
| Total | 10,517 (100.0%) | 56.0 |
Fertility by Age by Marriage Status in Nashville
67.3% of women with births (10,517) in Nashville are married. The highest percentage of unmarried women with births falls into 15 to 19 years age bracket with 100.0% of them unmarried at the time of birth, while the lowest percentage of unmarried women with births belong to 35 to 50 years age bracket with 27.0% of them unmarried.
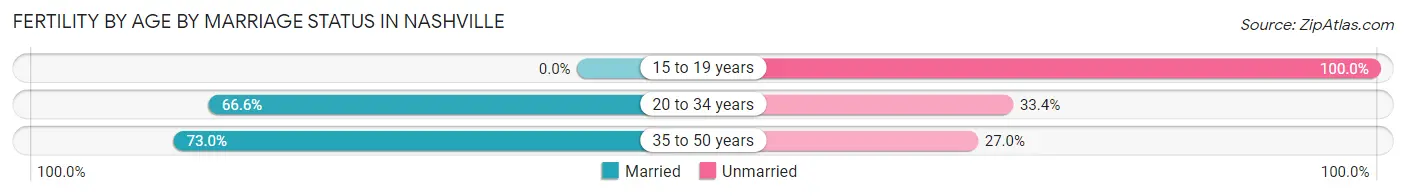
| Age Bracket | Married | Unmarried |
| 15 to 19 years | 0 (0.0%) | 161 (100.0%) |
| 20 to 34 years | 5,038 (66.6%) | 2,527 (33.4%) |
| 35 to 50 years | 2,037 (73.0%) | 754 (27.0%) |
| Total | 7,078 (67.3%) | 3,439 (32.7%) |
Fertility by Education in Nashville
Average fertility rate in Nashville is 56.0 births per 1,000 women. Women with the education attainment of graduate degree have the highest fertility rate of 69.0 births per 1,000 women, while women with the education attainment of less than high school have the lowest fertility at 45.0 births per 1,000 women. Women with the education attainment of bachelor's degree represent 26.1% of all women with births.
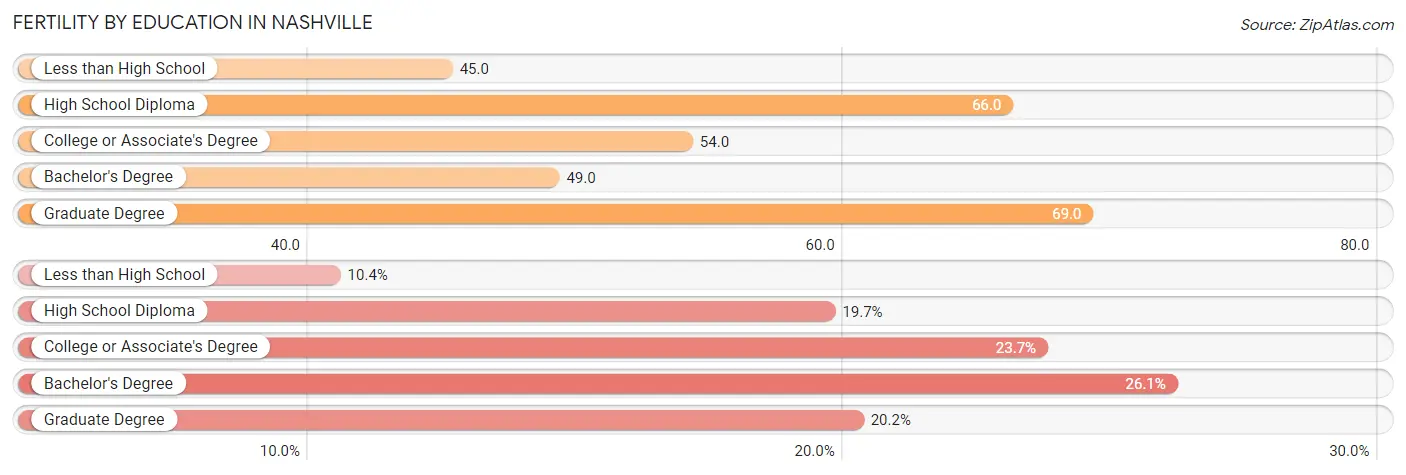
| Educational Attainment | Women with Births | Births / 1,000 Women |
| Less than High School | 1,094 (10.4%) | 45.0 |
| High School Diploma | 2,069 (19.7%) | 66.0 |
| College or Associate's Degree | 2,487 (23.6%) | 54.0 |
| Bachelor's Degree | 2,743 (26.1%) | 49.0 |
| Graduate Degree | 2,124 (20.2%) | 69.0 |
| Total | 10,517 (100.0%) | 56.0 |
Fertility by Education by Marriage Status in Nashville
32.7% of women with births in Nashville are unmarried. Women with the educational attainment of graduate degree are most likely to be married with 92.9% of them married at childbirth, while women with the educational attainment of high school diploma are least likely to be married with 55.8% of them unmarried at childbirth.
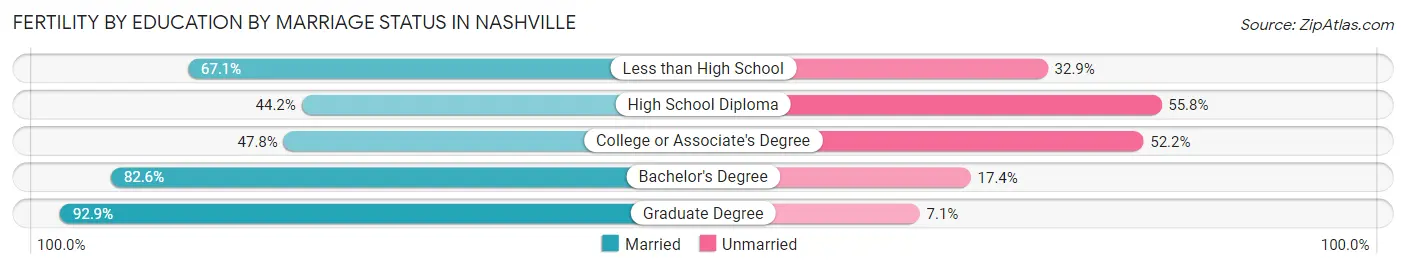
| Educational Attainment | Married | Unmarried |
| Less than High School | 734 (67.1%) | 360 (32.9%) |
| High School Diploma | 914 (44.2%) | 1,155 (55.8%) |
| College or Associate's Degree | 1,189 (47.8%) | 1,298 (52.2%) |
| Bachelor's Degree | 2,266 (82.6%) | 477 (17.4%) |
| Graduate Degree | 1,973 (92.9%) | 151 (7.1%) |
| Total | 7,078 (67.3%) | 3,439 (32.7%) |
Employment Characteristics in Nashville
Employment by Class of Employer in Nashville
Among the 377,380 employed individuals in Nashville, private company employees (257,756 | 68.3%), not-for-profit organizations (39,398 | 10.4%), and self-employed (not incorporated) (27,826 | 7.4%) make up the most common classes of employment.
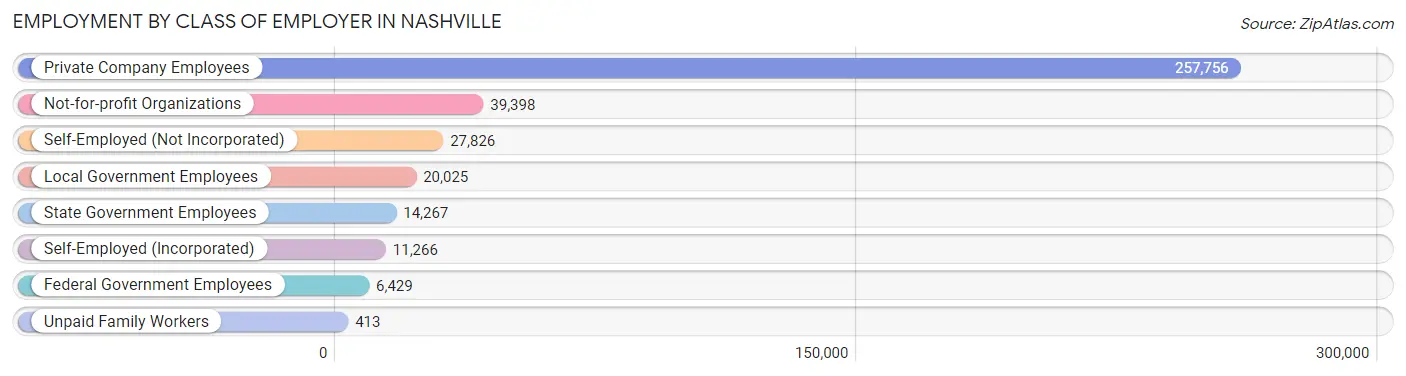
| Employer Class | # Employees | % Employees |
| Private Company Employees | 257,756 | 68.3% |
| Self-Employed (Incorporated) | 11,266 | 3.0% |
| Self-Employed (Not Incorporated) | 27,826 | 7.4% |
| Not-for-profit Organizations | 39,398 | 10.4% |
| Local Government Employees | 20,025 | 5.3% |
| State Government Employees | 14,267 | 3.8% |
| Federal Government Employees | 6,429 | 1.7% |
| Unpaid Family Workers | 413 | 0.1% |
| Total | 377,380 | 100.0% |
Employment Status by Age in Nashville
According to the labor force statistics for Nashville, out of the total population over 16 years of age (559,039), 71.9% or 401,949 individuals are in the labor force, with 4.6% or 18,490 of them unemployed. The age group with the highest labor force participation rate is 30 to 34 years, with 89.2% or 60,939 individuals in the labor force. Within the labor force, the 16 to 19 years age range has the highest percentage of unemployed individuals, with 14.9% or 2,139 of them being unemployed.
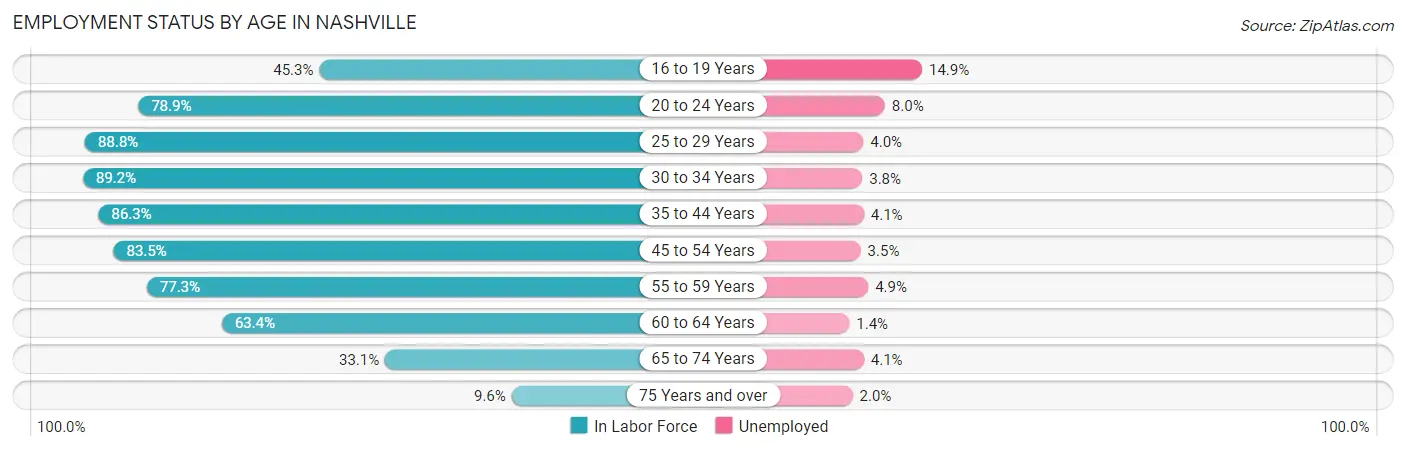
| Age Bracket | In Labor Force | Unemployed |
| 16 to 19 Years | 14,358 (45.3%) | 2,139 (14.9%) |
| 20 to 24 Years | 39,310 (78.9%) | 3,145 (8.0%) |
| 25 to 29 Years | 63,549 (88.8%) | 2,542 (4.0%) |
| 30 to 34 Years | 60,939 (89.2%) | 2,316 (3.8%) |
| 35 to 44 Years | 83,968 (86.3%) | 3,443 (4.1%) |
| 45 to 54 Years | 64,577 (83.5%) | 2,260 (3.5%) |
| 55 to 59 Years | 31,639 (77.3%) | 1,550 (4.9%) |
| 60 to 64 Years | 22,562 (63.4%) | 316 (1.4%) |
| 65 to 74 Years | 17,760 (33.1%) | 728 (4.1%) |
| 75 Years and over | 3,152 (9.6%) | 63 (2.0%) |
| Total | 401,949 (71.9%) | 18,490 (4.6%) |
Employment Status by Educational Attainment in Nashville
According to labor force statistics for Nashville, 83.7% of individuals (327,295) out of the total population between 25 and 64 years of age (391,034) are in the labor force, with 3.8% or 12,437 of them being unemployed. The group with the highest labor force participation rate are those with the educational attainment of bachelor's degree or higher, with 90.8% or 169,345 individuals in the labor force. Within the labor force, individuals with less than high school education have the highest percentage of unemployment, with 7.3% or 1,719 of them being unemployed.
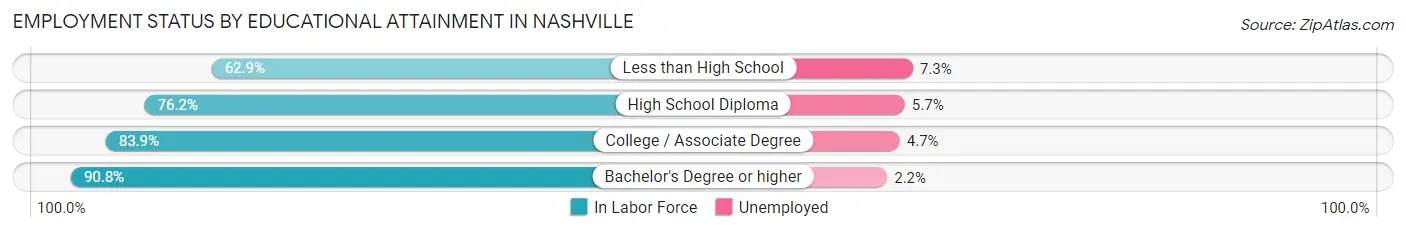
| Educational Attainment | In Labor Force | Unemployed |
| Less than High School | 23,542 (62.9%) | 2,732 (7.3%) |
| High School Diploma | 58,407 (76.2%) | 4,369 (5.7%) |
| College / Associate Degree | 75,890 (83.9%) | 4,251 (4.7%) |
| Bachelor's Degree or higher | 169,345 (90.8%) | 4,103 (2.2%) |
| Total | 327,295 (83.7%) | 14,859 (3.8%) |
Employment Occupations by Sex in Nashville
Management, Business, Science and Arts Occupations
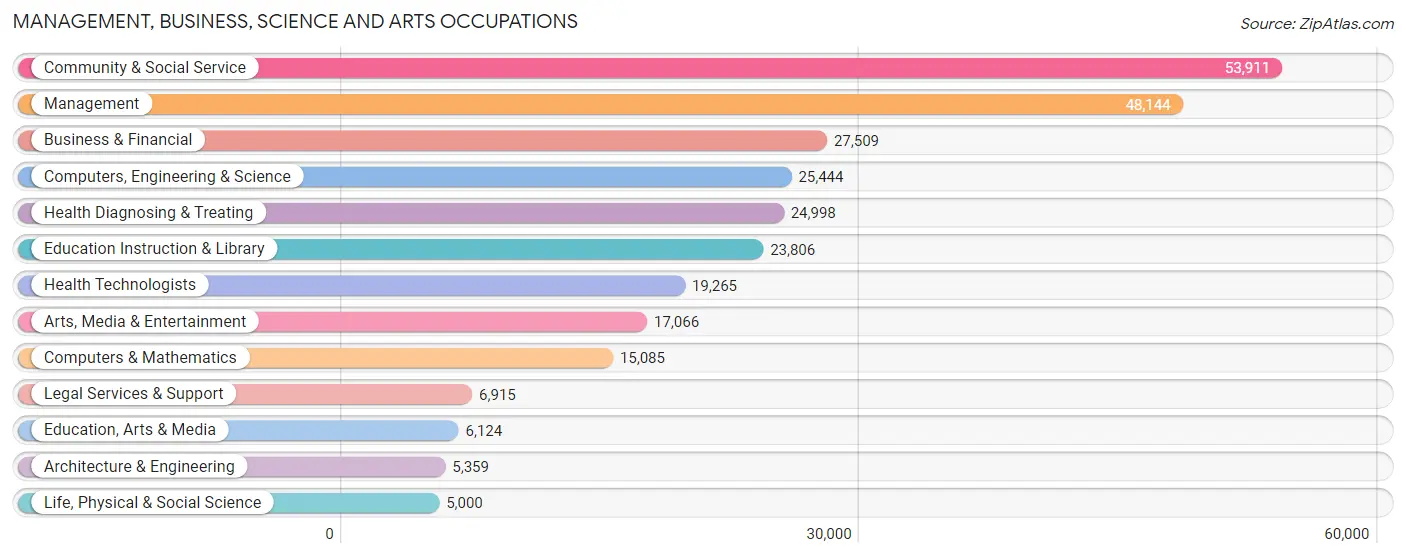
The most common Management, Business, Science and Arts occupations in Nashville are Community & Social Service (53,911 | 14.1%), Management (48,144 | 12.6%), Business & Financial (27,509 | 7.2%), Computers, Engineering & Science (25,444 | 6.7%), and Health Diagnosing & Treating (24,998 | 6.5%).
Management, Business, Science and Arts Occupations by Sex
Within the Management, Business, Science and Arts occupations in Nashville, the most male-oriented occupations are Architecture & Engineering (83.0%), Computers & Mathematics (74.5%), and Computers, Engineering & Science (69.8%), while the most female-oriented occupations are Health Technologists (72.7%), Health Diagnosing & Treating (72.1%), and Education Instruction & Library (69.4%).
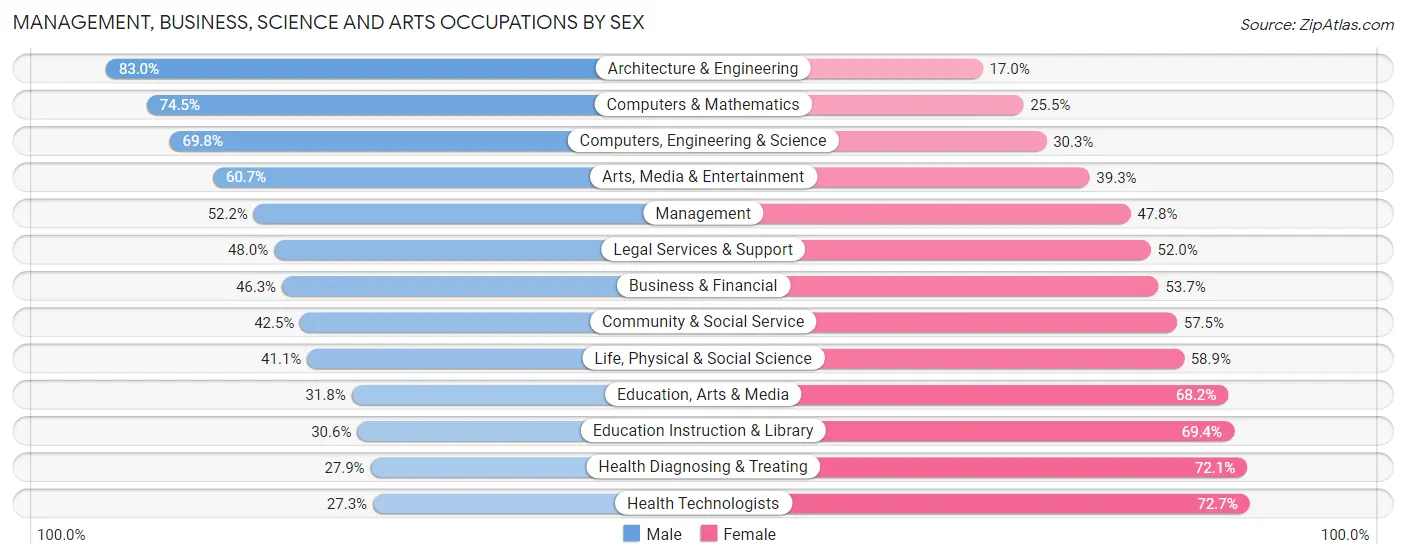
| Occupation | Male | Female |
| Management | 25,138 (52.2%) | 23,006 (47.8%) |
| Business & Financial | 12,743 (46.3%) | 14,766 (53.7%) |
| Computers, Engineering & Science | 17,747 (69.8%) | 7,697 (30.2%) |
| Computers & Mathematics | 11,244 (74.5%) | 3,841 (25.5%) |
| Architecture & Engineering | 4,450 (83.0%) | 909 (17.0%) |
| Life, Physical & Social Science | 2,053 (41.1%) | 2,947 (58.9%) |
| Community & Social Service | 22,916 (42.5%) | 30,995 (57.5%) |
| Education, Arts & Media | 1,948 (31.8%) | 4,176 (68.2%) |
| Legal Services & Support | 3,318 (48.0%) | 3,597 (52.0%) |
| Education Instruction & Library | 7,286 (30.6%) | 16,520 (69.4%) |
| Arts, Media & Entertainment | 10,364 (60.7%) | 6,702 (39.3%) |
| Health Diagnosing & Treating | 6,965 (27.9%) | 18,033 (72.1%) |
| Health Technologists | 5,268 (27.3%) | 13,997 (72.7%) |
| Total (Category) | 85,509 (47.5%) | 94,497 (52.5%) |
| Total (Overall) | 197,258 (51.5%) | 185,533 (48.5%) |
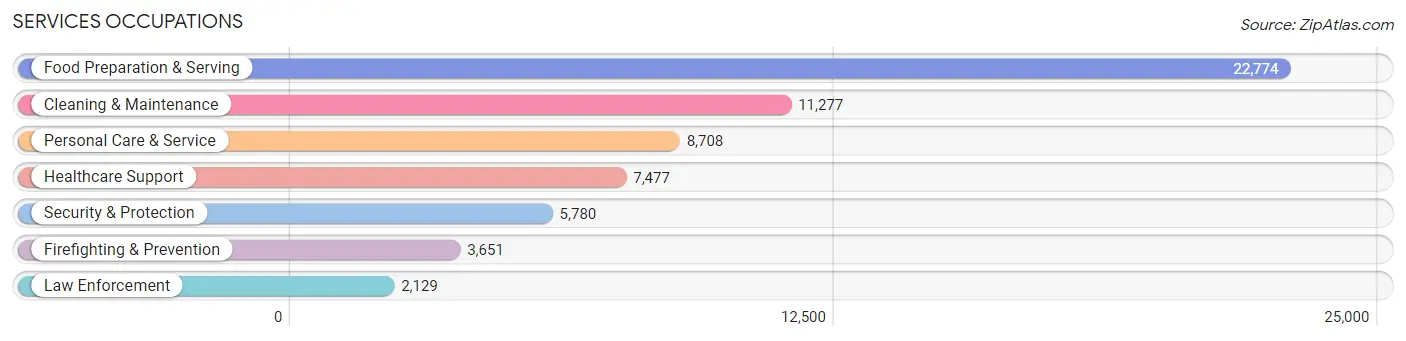
Services Occupations
The most common Services occupations in Nashville are Food Preparation & Serving (22,774 | 5.9%), Cleaning & Maintenance (11,277 | 2.9%), Personal Care & Service (8,708 | 2.3%), Healthcare Support (7,477 | 1.9%), and Security & Protection (5,780 | 1.5%).
Services Occupations by Sex
Within the Services occupations in Nashville, the most male-oriented occupations are Law Enforcement (79.0%), Security & Protection (72.2%), and Firefighting & Prevention (68.2%), while the most female-oriented occupations are Healthcare Support (78.1%), Personal Care & Service (75.5%), and Food Preparation & Serving (50.0%).
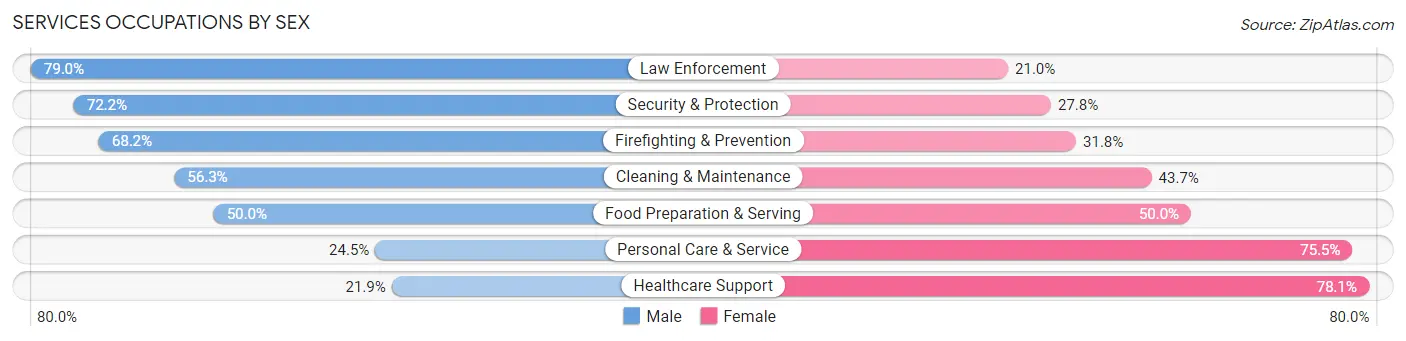
| Occupation | Male | Female |
| Healthcare Support | 1,635 (21.9%) | 5,842 (78.1%) |
| Security & Protection | 4,173 (72.2%) | 1,607 (27.8%) |
| Firefighting & Prevention | 2,491 (68.2%) | 1,160 (31.8%) |
| Law Enforcement | 1,682 (79.0%) | 447 (21.0%) |
| Food Preparation & Serving | 11,395 (50.0%) | 11,379 (50.0%) |
| Cleaning & Maintenance | 6,344 (56.3%) | 4,933 (43.7%) |
| Personal Care & Service | 2,131 (24.5%) | 6,577 (75.5%) |
| Total (Category) | 25,678 (45.8%) | 30,338 (54.2%) |
| Total (Overall) | 197,258 (51.5%) | 185,533 (48.5%) |
Sales and Office Occupations
The most common Sales and Office occupations in Nashville are Office & Administration (41,068 | 10.7%), and Sales & Related (37,320 | 9.8%).

Sales and Office Occupations by Sex
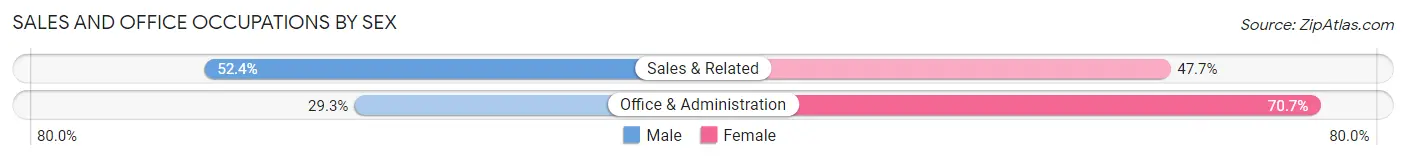
| Occupation | Male | Female |
| Sales & Related | 19,536 (52.3%) | 17,784 (47.6%) |
| Office & Administration | 12,031 (29.3%) | 29,037 (70.7%) |
| Total (Category) | 31,567 (40.3%) | 46,821 (59.7%) |
| Total (Overall) | 197,258 (51.5%) | 185,533 (48.5%) |
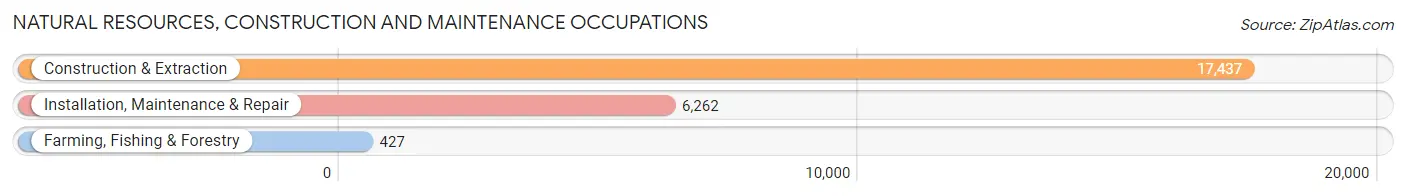
Natural Resources, Construction and Maintenance Occupations
The most common Natural Resources, Construction and Maintenance occupations in Nashville are Construction & Extraction (17,437 | 4.6%), Installation, Maintenance & Repair (6,262 | 1.6%), and Farming, Fishing & Forestry (427 | 0.1%).
Natural Resources, Construction and Maintenance Occupations by Sex
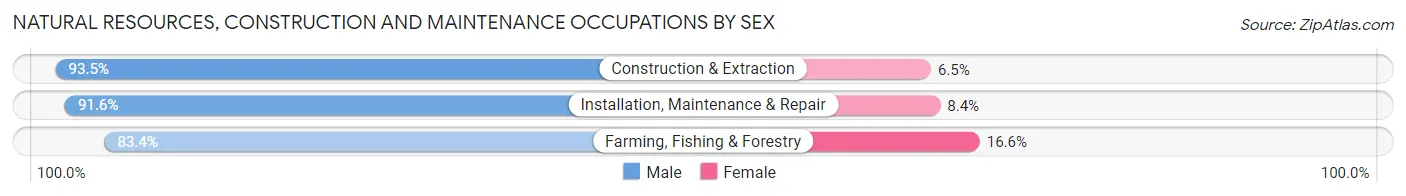
| Occupation | Male | Female |
| Farming, Fishing & Forestry | 356 (83.4%) | 71 (16.6%) |
| Construction & Extraction | 16,308 (93.5%) | 1,129 (6.5%) |
| Installation, Maintenance & Repair | 5,735 (91.6%) | 527 (8.4%) |
| Total (Category) | 22,399 (92.8%) | 1,727 (7.2%) |
| Total (Overall) | 197,258 (51.5%) | 185,533 (48.5%) |
Production, Transportation and Moving Occupations
The most common Production, Transportation and Moving occupations in Nashville are Production (16,721 | 4.4%), Material Moving (14,039 | 3.7%), and Transportation (13,495 | 3.5%).
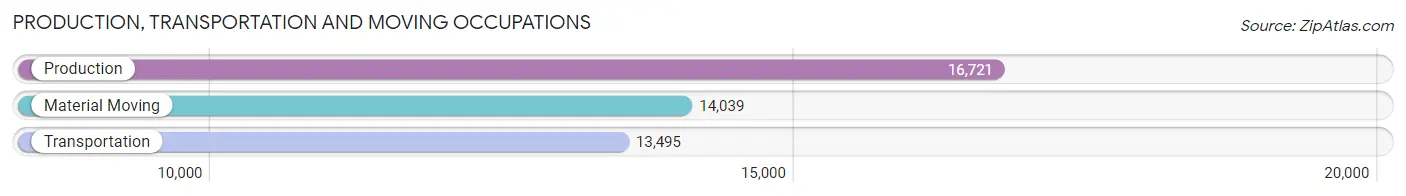
Production, Transportation and Moving Occupations by Sex
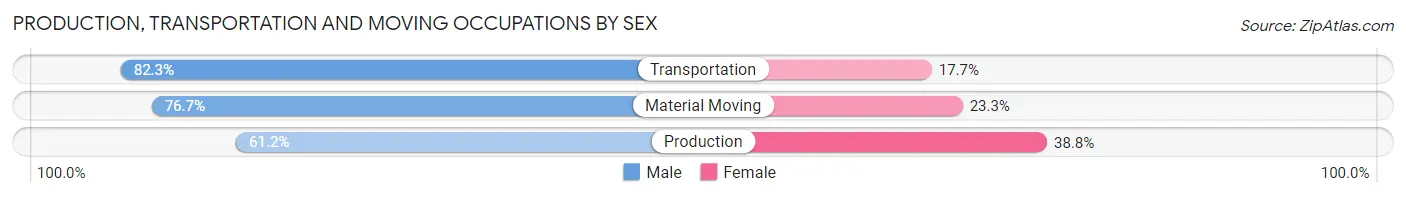
| Occupation | Male | Female |
| Production | 10,230 (61.2%) | 6,491 (38.8%) |
| Transportation | 11,112 (82.3%) | 2,383 (17.7%) |
| Material Moving | 10,763 (76.7%) | 3,276 (23.3%) |
| Total (Category) | 32,105 (72.6%) | 12,150 (27.5%) |
| Total (Overall) | 197,258 (51.5%) | 185,533 (48.5%) |
Employment Industries by Sex in Nashville
Employment Industries in Nashville
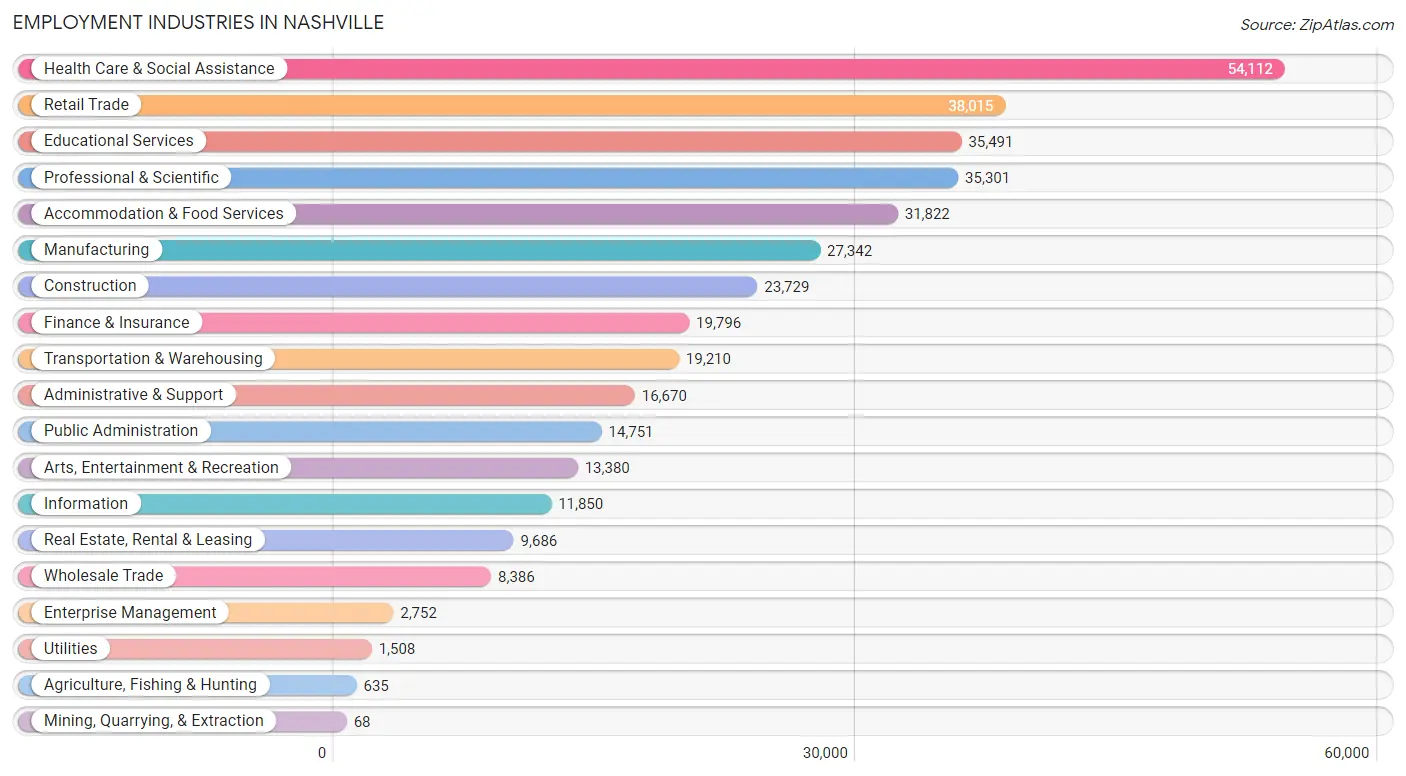
The major employment industries in Nashville include Health Care & Social Assistance (54,112 | 14.1%), Retail Trade (38,015 | 9.9%), Educational Services (35,491 | 9.3%), Professional & Scientific (35,301 | 9.2%), and Accommodation & Food Services (31,822 | 8.3%).
Employment Industries by Sex in Nashville
The Nashville industries that see more men than women are Construction (88.8%), Agriculture, Fishing & Hunting (83.6%), and Transportation & Warehousing (73.2%), whereas the industries that tend to have a higher number of women are Mining, Quarrying, & Extraction (77.9%), Health Care & Social Assistance (70.1%), and Educational Services (65.3%).
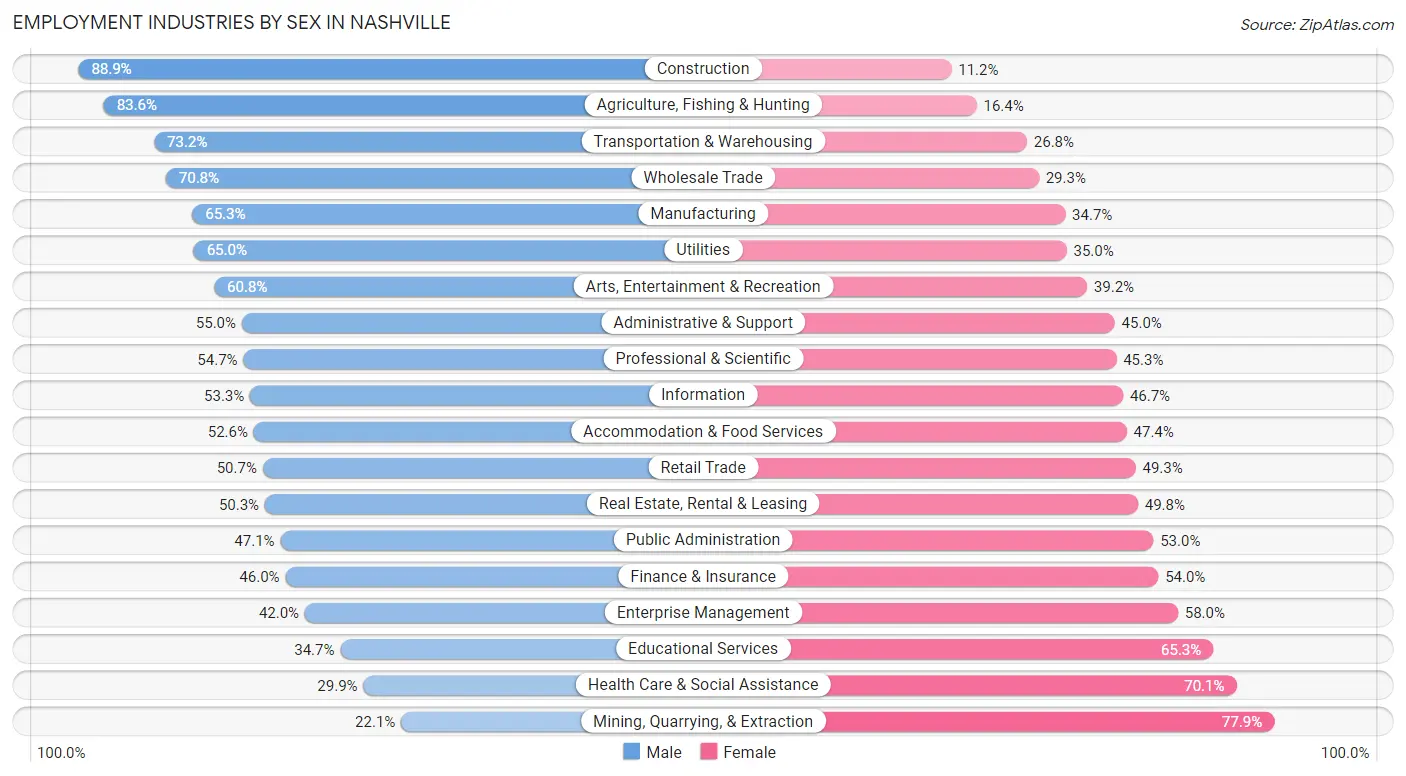
| Industry | Male | Female |
| Agriculture, Fishing & Hunting | 531 (83.6%) | 104 (16.4%) |
| Mining, Quarrying, & Extraction | 15 (22.1%) | 53 (77.9%) |
| Construction | 21,083 (88.8%) | 2,646 (11.2%) |
| Manufacturing | 17,850 (65.3%) | 9,492 (34.7%) |
| Wholesale Trade | 5,933 (70.8%) | 2,453 (29.2%) |
| Retail Trade | 19,279 (50.7%) | 18,736 (49.3%) |
| Transportation & Warehousing | 14,063 (73.2%) | 5,147 (26.8%) |
| Utilities | 980 (65.0%) | 528 (35.0%) |
| Information | 6,318 (53.3%) | 5,532 (46.7%) |
| Finance & Insurance | 9,110 (46.0%) | 10,686 (54.0%) |
| Real Estate, Rental & Leasing | 4,867 (50.2%) | 4,819 (49.7%) |
| Professional & Scientific | 19,312 (54.7%) | 15,989 (45.3%) |
| Enterprise Management | 1,155 (42.0%) | 1,597 (58.0%) |
| Administrative & Support | 9,173 (55.0%) | 7,497 (45.0%) |
| Educational Services | 12,300 (34.7%) | 23,191 (65.3%) |
| Health Care & Social Assistance | 16,164 (29.9%) | 37,948 (70.1%) |
| Arts, Entertainment & Recreation | 8,133 (60.8%) | 5,247 (39.2%) |
| Accommodation & Food Services | 16,727 (52.6%) | 15,095 (47.4%) |
| Public Administration | 6,940 (47.0%) | 7,811 (52.9%) |
| Total | 197,258 (51.5%) | 185,533 (48.5%) |
Education in Nashville
School Enrollment in Nashville
The most common levels of schooling among the 153,052 students in Nashville are college / undergraduate (36,575 | 23.9%), middle school (28,533 | 18.6%), and elementary school (28,210 | 18.4%).
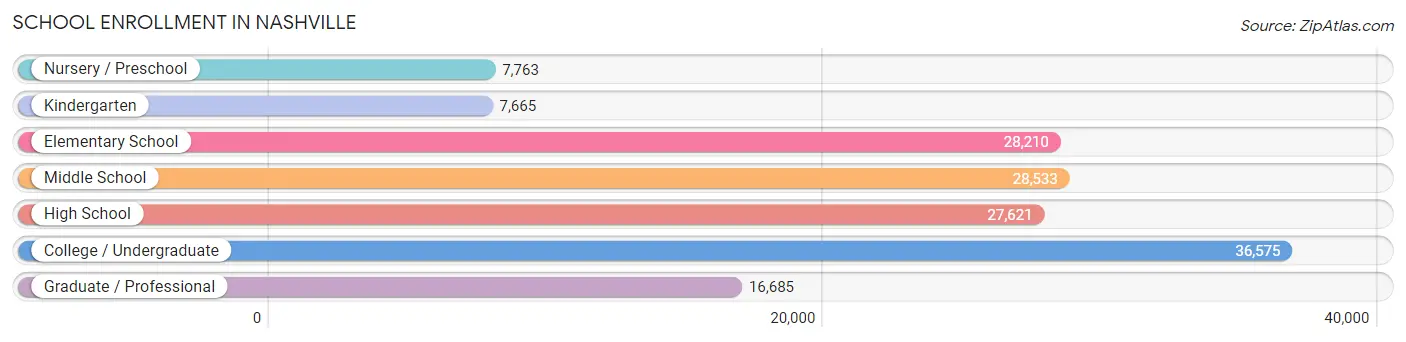
| School Level | # Students | % Students |
| Nursery / Preschool | 7,763 | 5.1% |
| Kindergarten | 7,665 | 5.0% |
| Elementary School | 28,210 | 18.4% |
| Middle School | 28,533 | 18.6% |
| High School | 27,621 | 18.0% |
| College / Undergraduate | 36,575 | 23.9% |
| Graduate / Professional | 16,685 | 10.9% |
| Total | 153,052 | 100.0% |
School Enrollment by Age by Funding Source in Nashville
Out of a total of 153,052 students who are enrolled in schools in Nashville, 50,201 (32.8%) attend a private institution, while the remaining 102,851 (67.2%) are enrolled in public schools. The age group of 20 to 24 year olds has the highest likelihood of being enrolled in private schools, with 11,504 (58.2% in the age bracket) enrolled. Conversely, the age group of 5 to 9 year old has the lowest likelihood of being enrolled in a private school, with 28,329 (81.5% in the age bracket) attending a public institution.
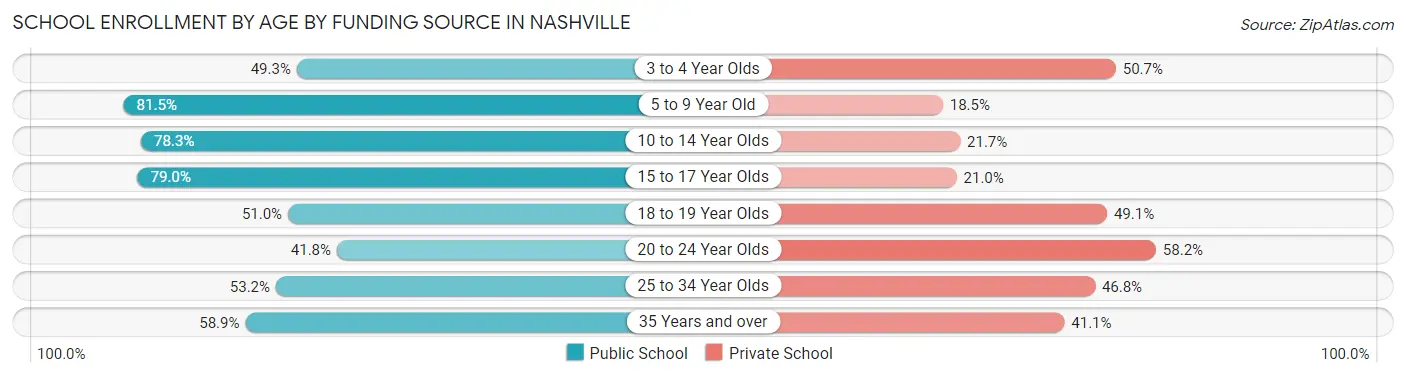
| Age Bracket | Public School | Private School |
| 3 to 4 Year Olds | 2,879 (49.3%) | 2,960 (50.7%) |
| 5 to 9 Year Old | 28,329 (81.5%) | 6,413 (18.5%) |
| 10 to 14 Year Olds | 27,423 (78.3%) | 7,595 (21.7%) |
| 15 to 17 Year Olds | 15,572 (79.0%) | 4,150 (21.0%) |
| 18 to 19 Year Olds | 7,040 (50.9%) | 6,777 (49.0%) |
| 20 to 24 Year Olds | 8,277 (41.8%) | 11,504 (58.2%) |
| 25 to 34 Year Olds | 7,763 (53.2%) | 6,829 (46.8%) |
| 35 Years and over | 5,619 (58.9%) | 3,922 (41.1%) |
| Total | 102,851 (67.2%) | 50,201 (32.8%) |
Educational Attainment by Field of Study in Nashville
Business (50,722 | 21.3%), science & technology (21,999 | 9.2%), education (18,887 | 7.9%), social sciences (17,186 | 7.2%), and visual & performing arts (16,940 | 7.1%) are the most common fields of study among 238,143 individuals in Nashville who have obtained a bachelor's degree or higher.
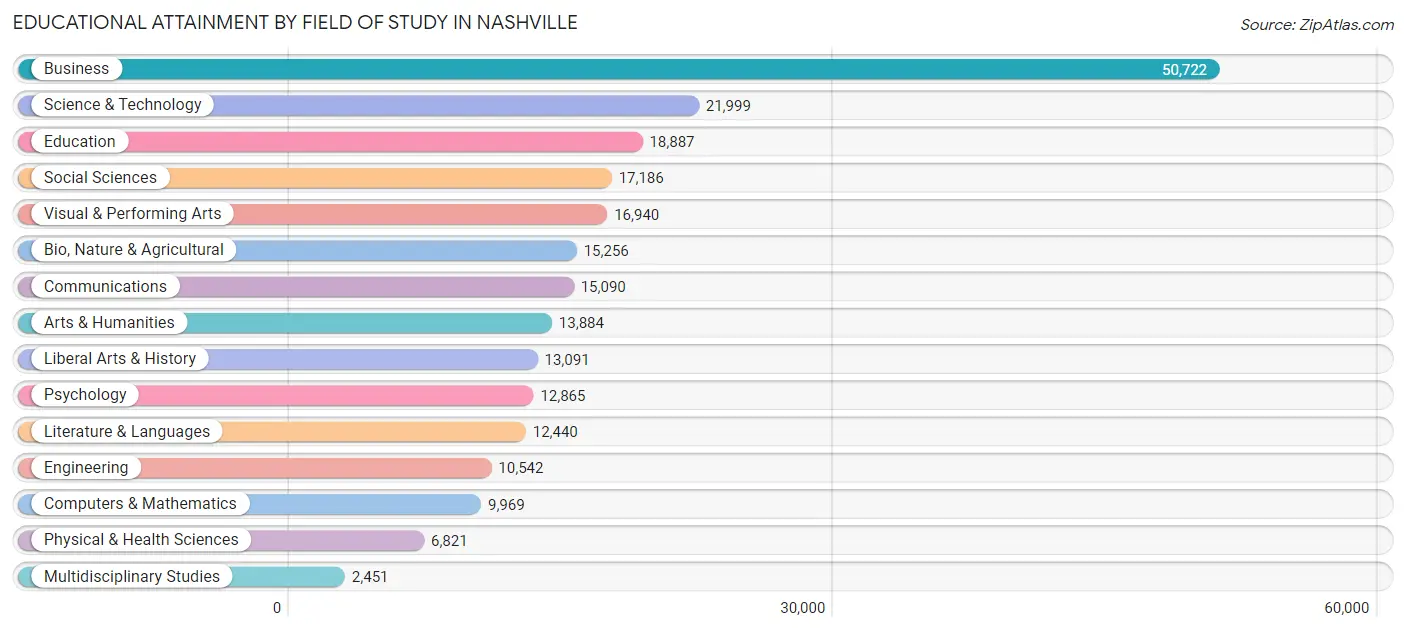
| Field of Study | # Graduates | % Graduates |
| Computers & Mathematics | 9,969 | 4.2% |
| Bio, Nature & Agricultural | 15,256 | 6.4% |
| Physical & Health Sciences | 6,821 | 2.9% |
| Psychology | 12,865 | 5.4% |
| Social Sciences | 17,186 | 7.2% |
| Engineering | 10,542 | 4.4% |
| Multidisciplinary Studies | 2,451 | 1.0% |
| Science & Technology | 21,999 | 9.2% |
| Business | 50,722 | 21.3% |
| Education | 18,887 | 7.9% |
| Literature & Languages | 12,440 | 5.2% |
| Liberal Arts & History | 13,091 | 5.5% |
| Visual & Performing Arts | 16,940 | 7.1% |
| Communications | 15,090 | 6.3% |
| Arts & Humanities | 13,884 | 5.8% |
| Total | 238,143 | 100.0% |
Transportation & Commute in Nashville
Vehicle Availability by Sex in Nashville
The most prevalent vehicle ownership categories in Nashville are males with 2 vehicles (85,724, accounting for 44.3%) and females with 2 vehicles (74,659, making up 48.1%).
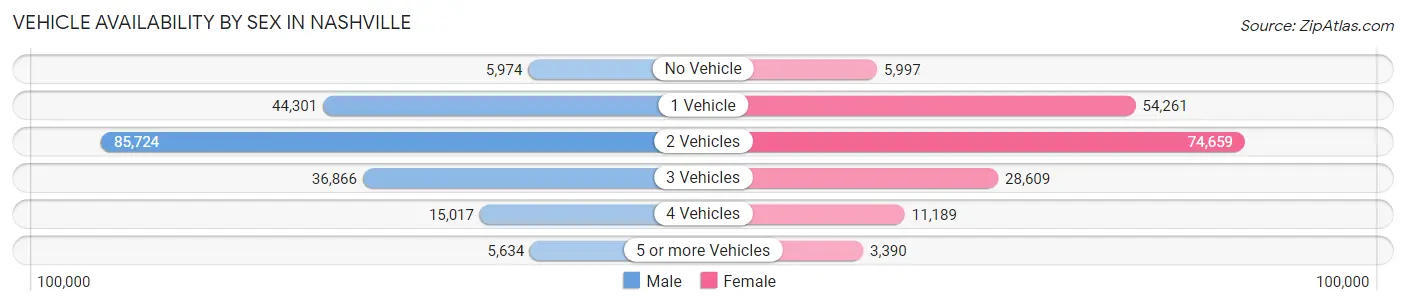
| Vehicles Available | Male | Female |
| No Vehicle | 5,974 (3.1%) | 5,997 (3.4%) |
| 1 Vehicle | 44,301 (22.9%) | 54,261 (30.5%) |
| 2 Vehicles | 85,724 (44.3%) | 74,659 (41.9%) |
| 3 Vehicles | 36,866 (19.1%) | 28,609 (16.1%) |
| 4 Vehicles | 15,017 (7.8%) | 11,189 (6.3%) |
| 5 or more Vehicles | 5,634 (2.9%) | 3,390 (1.9%) |
| Total | 193,516 (100.0%) | 178,105 (100.0%) |
Commute Time in Nashville
The most frequently occuring commute durations in Nashville are 20 to 24 minutes (57,732 commuters, 18.1%), 15 to 19 minutes (54,130 commuters, 17.0%), and 30 to 34 minutes (51,398 commuters, 16.1%).
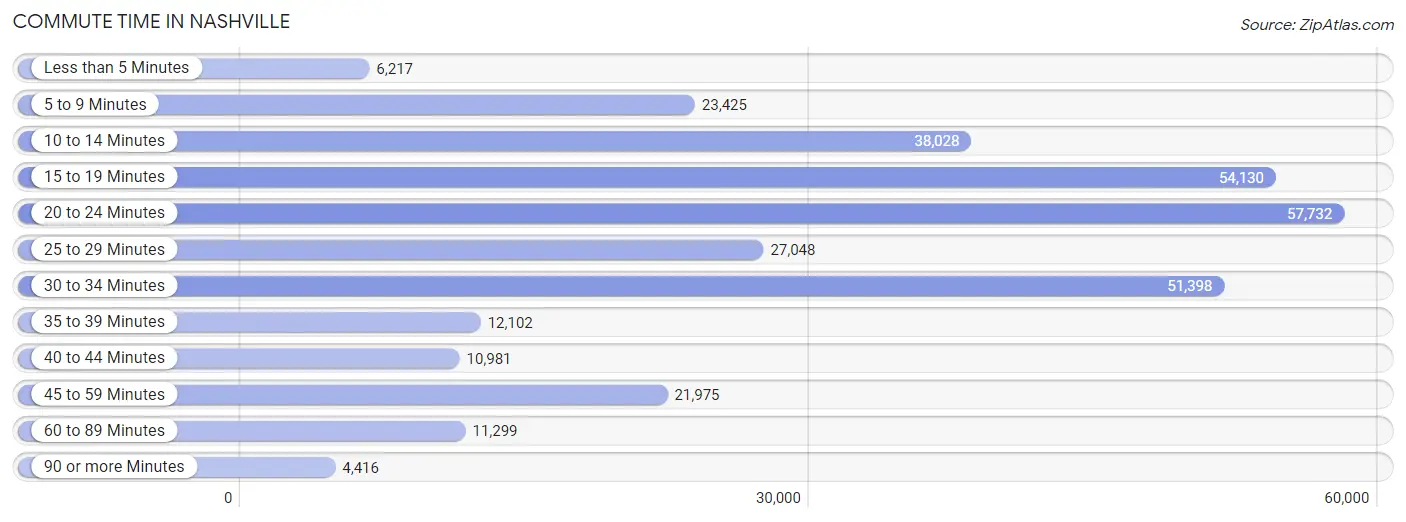
| Commute Time | # Commuters | % Commuters |
| Less than 5 Minutes | 6,217 | 1.9% |
| 5 to 9 Minutes | 23,425 | 7.3% |
| 10 to 14 Minutes | 38,028 | 11.9% |
| 15 to 19 Minutes | 54,130 | 17.0% |
| 20 to 24 Minutes | 57,732 | 18.1% |
| 25 to 29 Minutes | 27,048 | 8.5% |
| 30 to 34 Minutes | 51,398 | 16.1% |
| 35 to 39 Minutes | 12,102 | 3.8% |
| 40 to 44 Minutes | 10,981 | 3.5% |
| 45 to 59 Minutes | 21,975 | 6.9% |
| 60 to 89 Minutes | 11,299 | 3.5% |
| 90 or more Minutes | 4,416 | 1.4% |
Commute Time by Sex in Nashville
The most common commute times in Nashville are 20 to 24 minutes (32,016 commuters, 19.1%) for males and 15 to 19 minutes (25,760 commuters, 17.0%) for females.
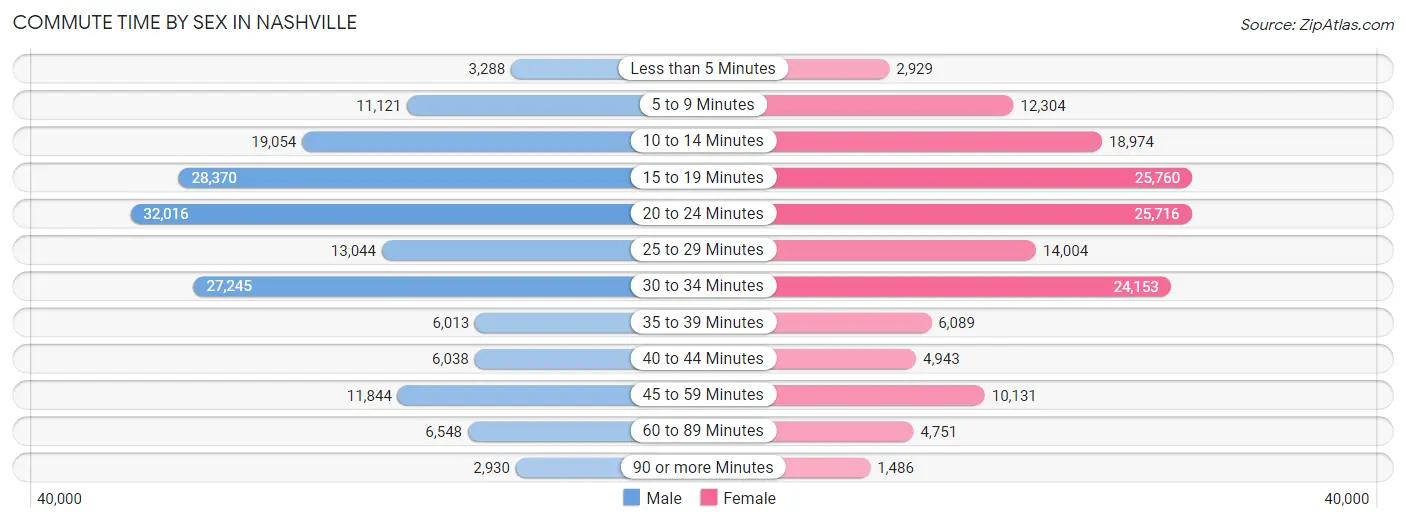
| Commute Time | Male | Female |
| Less than 5 Minutes | 3,288 (2.0%) | 2,929 (1.9%) |
| 5 to 9 Minutes | 11,121 (6.6%) | 12,304 (8.1%) |
| 10 to 14 Minutes | 19,054 (11.4%) | 18,974 (12.6%) |
| 15 to 19 Minutes | 28,370 (16.9%) | 25,760 (17.0%) |
| 20 to 24 Minutes | 32,016 (19.1%) | 25,716 (17.0%) |
| 25 to 29 Minutes | 13,044 (7.8%) | 14,004 (9.3%) |
| 30 to 34 Minutes | 27,245 (16.3%) | 24,153 (16.0%) |
| 35 to 39 Minutes | 6,013 (3.6%) | 6,089 (4.0%) |
| 40 to 44 Minutes | 6,038 (3.6%) | 4,943 (3.3%) |
| 45 to 59 Minutes | 11,844 (7.1%) | 10,131 (6.7%) |
| 60 to 89 Minutes | 6,548 (3.9%) | 4,751 (3.1%) |
| 90 or more Minutes | 2,930 (1.8%) | 1,486 (1.0%) |
Time of Departure to Work by Sex in Nashville
The most frequent times of departure to work in Nashville are 7:00 AM to 7:29 AM (23,400, 14.0%) for males and 7:00 AM to 7:29 AM (22,027, 14.6%) for females.
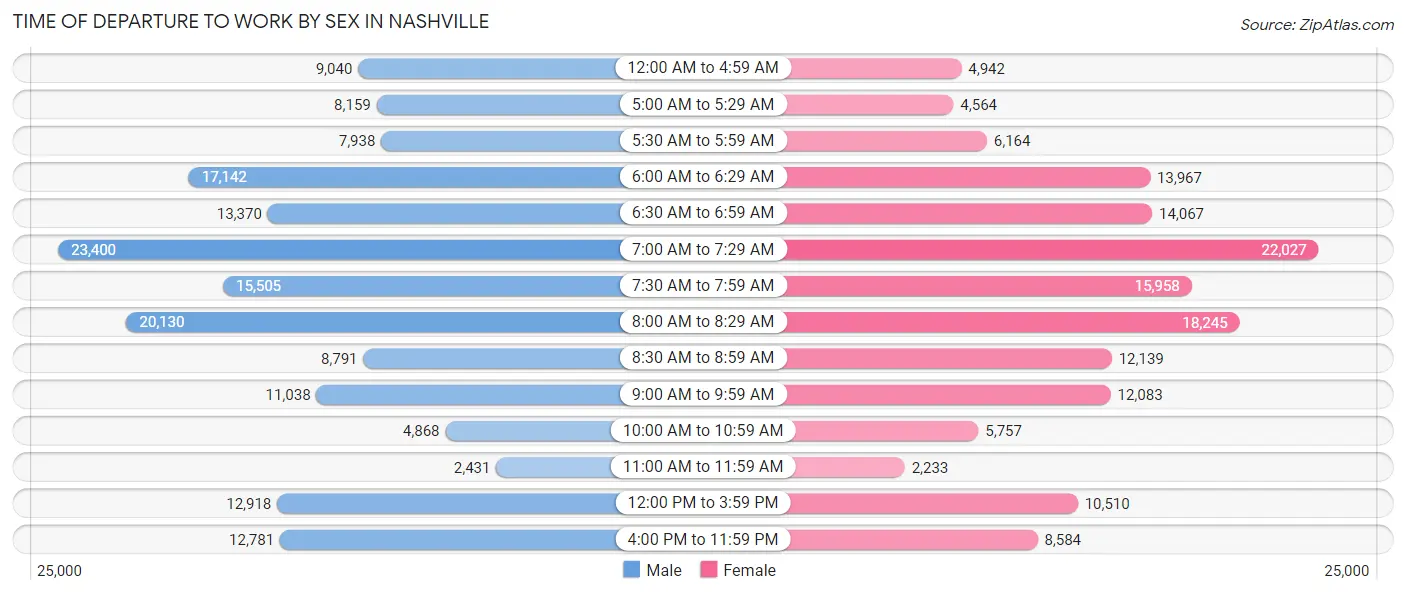
| Time of Departure | Male | Female |
| 12:00 AM to 4:59 AM | 9,040 (5.4%) | 4,942 (3.3%) |
| 5:00 AM to 5:29 AM | 8,159 (4.9%) | 4,564 (3.0%) |
| 5:30 AM to 5:59 AM | 7,938 (4.7%) | 6,164 (4.1%) |
| 6:00 AM to 6:29 AM | 17,142 (10.2%) | 13,967 (9.2%) |
| 6:30 AM to 6:59 AM | 13,370 (8.0%) | 14,067 (9.3%) |
| 7:00 AM to 7:29 AM | 23,400 (14.0%) | 22,027 (14.6%) |
| 7:30 AM to 7:59 AM | 15,505 (9.3%) | 15,958 (10.5%) |
| 8:00 AM to 8:29 AM | 20,130 (12.0%) | 18,245 (12.1%) |
| 8:30 AM to 8:59 AM | 8,791 (5.2%) | 12,139 (8.0%) |
| 9:00 AM to 9:59 AM | 11,038 (6.6%) | 12,083 (8.0%) |
| 10:00 AM to 10:59 AM | 4,868 (2.9%) | 5,757 (3.8%) |
| 11:00 AM to 11:59 AM | 2,431 (1.5%) | 2,233 (1.5%) |
| 12:00 PM to 3:59 PM | 12,918 (7.7%) | 10,510 (7.0%) |
| 4:00 PM to 11:59 PM | 12,781 (7.6%) | 8,584 (5.7%) |
| Total | 167,511 (100.0%) | 151,240 (100.0%) |
Housing Occupancy in Nashville
Occupancy by Ownership in Nashville
Of the total 291,884 dwellings in Nashville, owner-occupied units account for 156,934 (53.8%), while renter-occupied units make up 134,950 (46.2%).
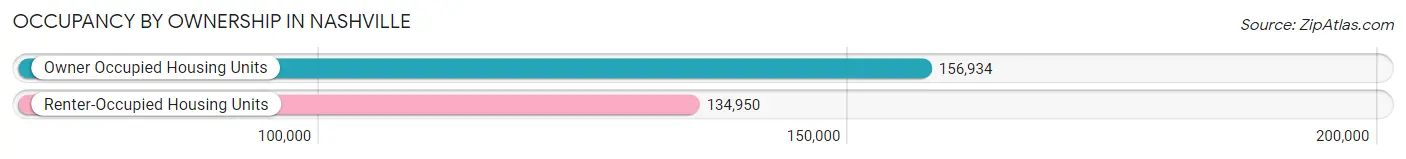
| Occupancy | # Housing Units | % Housing Units |
| Owner Occupied Housing Units | 156,934 | 53.8% |
| Renter-Occupied Housing Units | 134,950 | 46.2% |
| Total Occupied Housing Units | 291,884 | 100.0% |
Occupancy by Household Size in Nashville
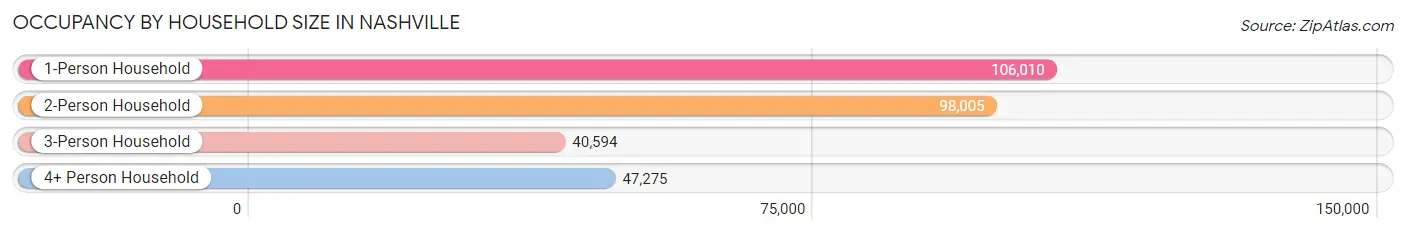
| Household Size | # Housing Units | % Housing Units |
| 1-Person Household | 106,010 | 36.3% |
| 2-Person Household | 98,005 | 33.6% |
| 3-Person Household | 40,594 | 13.9% |
| 4+ Person Household | 47,275 | 16.2% |
| Total Housing Units | 291,884 | 100.0% |
Occupancy by Ownership by Household Size in Nashville
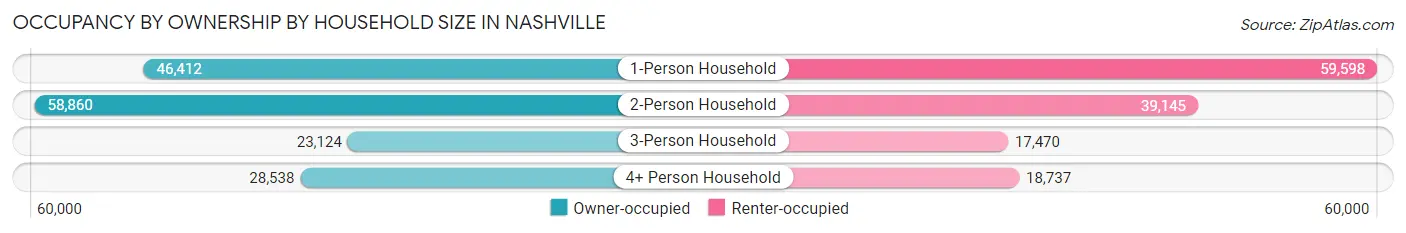
| Household Size | Owner-occupied | Renter-occupied |
| 1-Person Household | 46,412 (43.8%) | 59,598 (56.2%) |
| 2-Person Household | 58,860 (60.1%) | 39,145 (39.9%) |
| 3-Person Household | 23,124 (57.0%) | 17,470 (43.0%) |
| 4+ Person Household | 28,538 (60.4%) | 18,737 (39.6%) |
| Total Housing Units | 156,934 (53.8%) | 134,950 (46.2%) |
Occupancy by Educational Attainment in Nashville
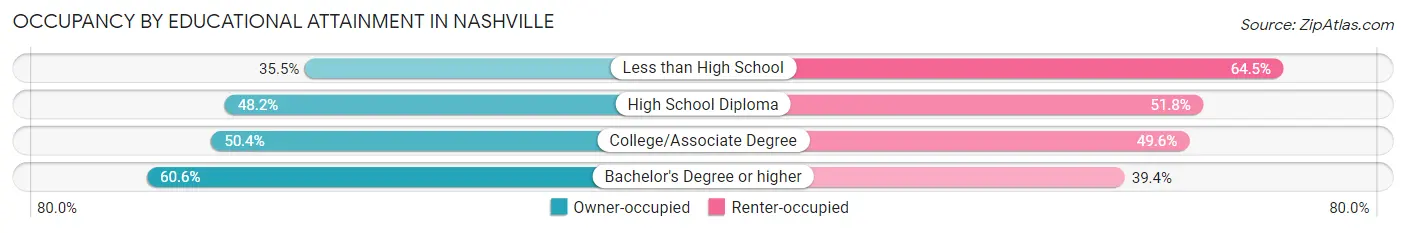
| Household Size | Owner-occupied | Renter-occupied |
| Less than High School | 7,953 (35.5%) | 14,449 (64.5%) |
| High School Diploma | 25,909 (48.2%) | 27,818 (51.8%) |
| College/Associate Degree | 37,554 (50.4%) | 36,992 (49.6%) |
| Bachelor's Degree or higher | 85,518 (60.6%) | 55,691 (39.4%) |
Occupancy by Age of Householder in Nashville
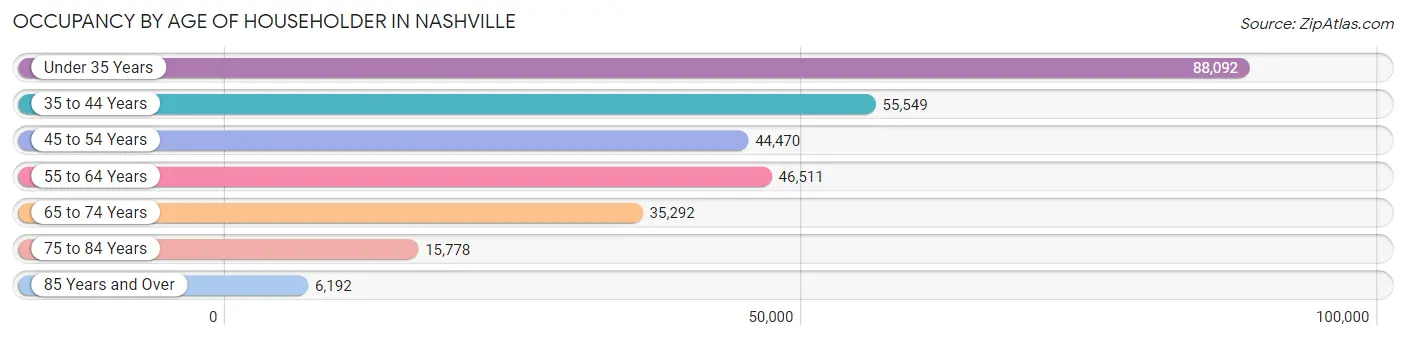
| Age Bracket | # Households | % Households |
| Under 35 Years | 88,092 | 30.2% |
| 35 to 44 Years | 55,549 | 19.0% |
| 45 to 54 Years | 44,470 | 15.2% |
| 55 to 64 Years | 46,511 | 15.9% |
| 65 to 74 Years | 35,292 | 12.1% |
| 75 to 84 Years | 15,778 | 5.4% |
| 85 Years and Over | 6,192 | 2.1% |
| Total | 291,884 | 100.0% |
Housing Finances in Nashville
Median Income by Occupancy in Nashville
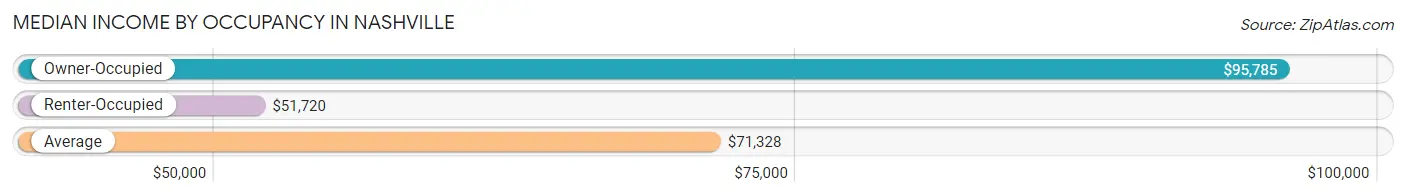
| Occupancy Type | # Households | Median Income |
| Owner-Occupied | 156,934 (53.8%) | $95,785 |
| Renter-Occupied | 134,950 (46.2%) | $51,720 |
| Average | 291,884 (100.0%) | $71,328 |
Occupancy by Householder Income Bracket in Nashville
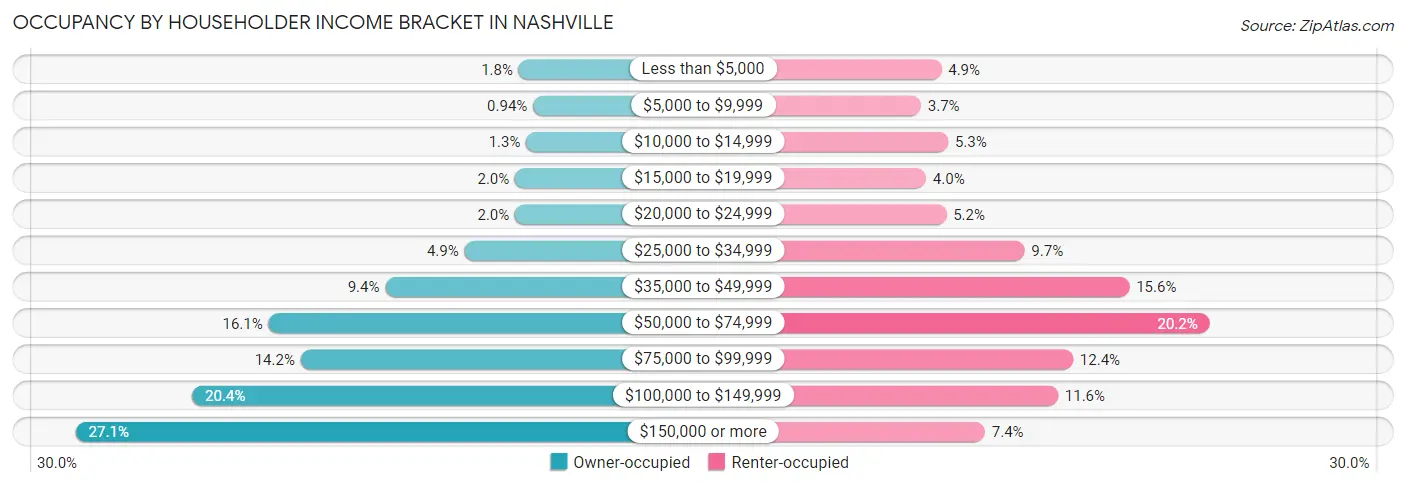
| Income Bracket | Owner-occupied | Renter-occupied |
| Less than $5,000 | 2,755 (1.8%) | 6,618 (4.9%) |
| $5,000 to $9,999 | 1,482 (0.9%) | 5,029 (3.7%) |
| $10,000 to $14,999 | 2,084 (1.3%) | 7,121 (5.3%) |
| $15,000 to $19,999 | 3,086 (2.0%) | 5,427 (4.0%) |
| $20,000 to $24,999 | 3,084 (2.0%) | 6,992 (5.2%) |
| $25,000 to $34,999 | 7,632 (4.9%) | 13,016 (9.7%) |
| $35,000 to $49,999 | 14,733 (9.4%) | 21,106 (15.6%) |
| $50,000 to $74,999 | 25,207 (16.1%) | 27,302 (20.2%) |
| $75,000 to $99,999 | 22,312 (14.2%) | 16,764 (12.4%) |
| $100,000 to $149,999 | 32,069 (20.4%) | 15,603 (11.6%) |
| $150,000 or more | 42,490 (27.1%) | 9,972 (7.4%) |
| Total | 156,934 (100.0%) | 134,950 (100.0%) |
Monthly Housing Cost Tiers in Nashville
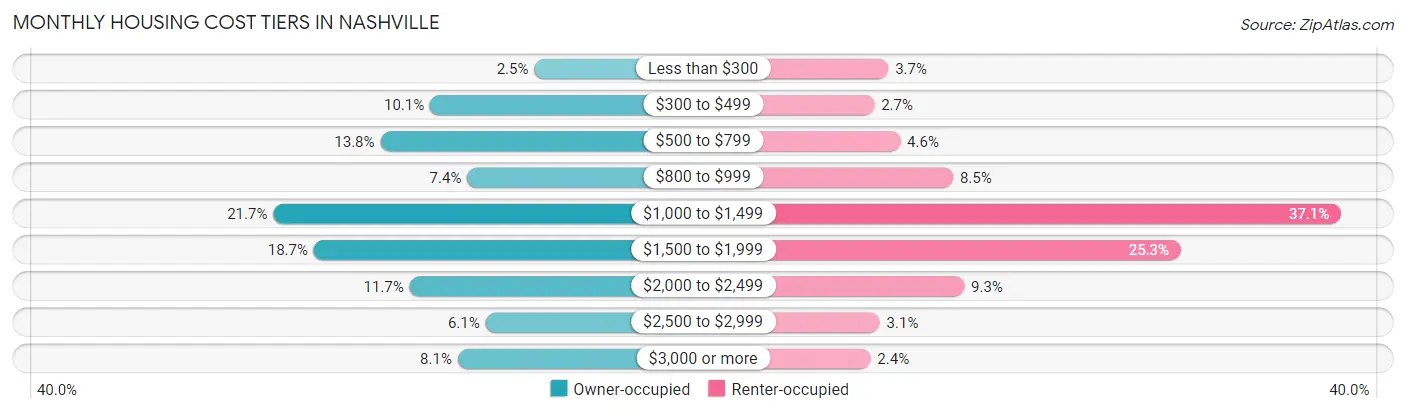
| Monthly Cost | Owner-occupied | Renter-occupied |
| Less than $300 | 3,867 (2.5%) | 5,051 (3.7%) |
| $300 to $499 | 15,907 (10.1%) | 3,661 (2.7%) |
| $500 to $799 | 21,660 (13.8%) | 6,236 (4.6%) |
| $800 to $999 | 11,619 (7.4%) | 11,479 (8.5%) |
| $1,000 to $1,499 | 34,045 (21.7%) | 50,059 (37.1%) |
| $1,500 to $1,999 | 29,344 (18.7%) | 34,124 (25.3%) |
| $2,000 to $2,499 | 18,275 (11.7%) | 12,591 (9.3%) |
| $2,500 to $2,999 | 9,500 (6.0%) | 4,191 (3.1%) |
| $3,000 or more | 12,717 (8.1%) | 3,285 (2.4%) |
| Total | 156,934 (100.0%) | 134,950 (100.0%) |
Physical Housing Characteristics in Nashville
Housing Structures in Nashville
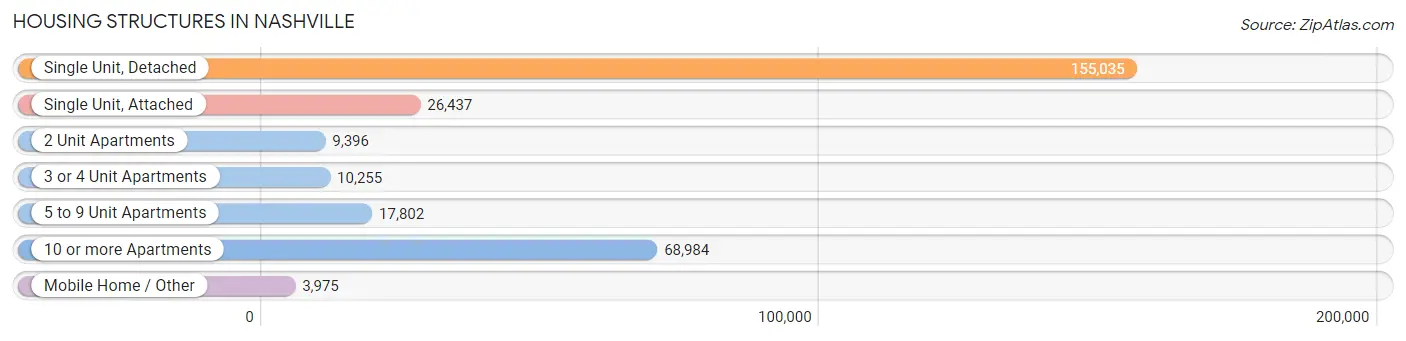
| Structure Type | # Housing Units | % Housing Units |
| Single Unit, Detached | 155,035 | 53.1% |
| Single Unit, Attached | 26,437 | 9.1% |
| 2 Unit Apartments | 9,396 | 3.2% |
| 3 or 4 Unit Apartments | 10,255 | 3.5% |
| 5 to 9 Unit Apartments | 17,802 | 6.1% |
| 10 or more Apartments | 68,984 | 23.6% |
| Mobile Home / Other | 3,975 | 1.4% |
| Total | 291,884 | 100.0% |
Housing Structures by Occupancy in Nashville
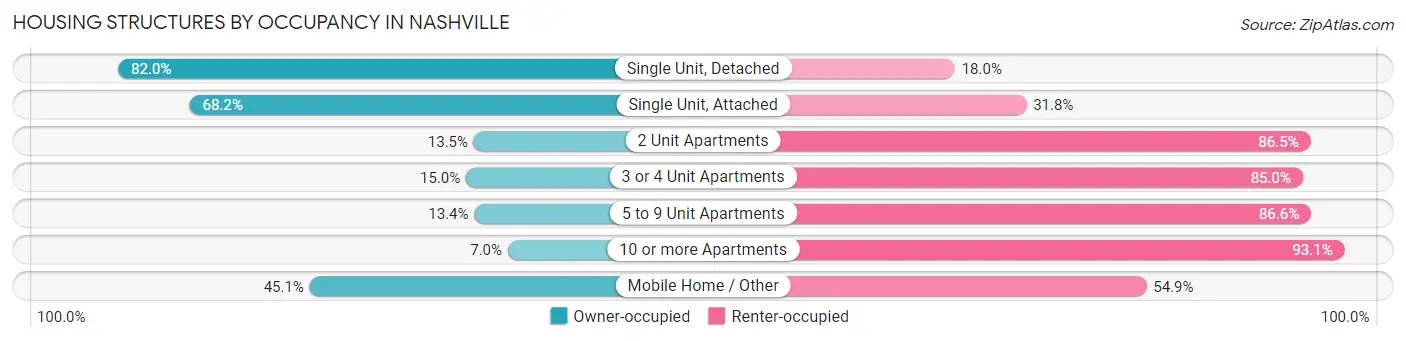
| Structure Type | Owner-occupied | Renter-occupied |
| Single Unit, Detached | 127,117 (82.0%) | 27,918 (18.0%) |
| Single Unit, Attached | 18,037 (68.2%) | 8,400 (31.8%) |
| 2 Unit Apartments | 1,268 (13.5%) | 8,128 (86.5%) |
| 3 or 4 Unit Apartments | 1,537 (15.0%) | 8,718 (85.0%) |
| 5 to 9 Unit Apartments | 2,386 (13.4%) | 15,416 (86.6%) |
| 10 or more Apartments | 4,796 (7.0%) | 64,188 (93.0%) |
| Mobile Home / Other | 1,793 (45.1%) | 2,182 (54.9%) |
| Total | 156,934 (53.8%) | 134,950 (46.2%) |
Housing Structures by Number of Rooms in Nashville
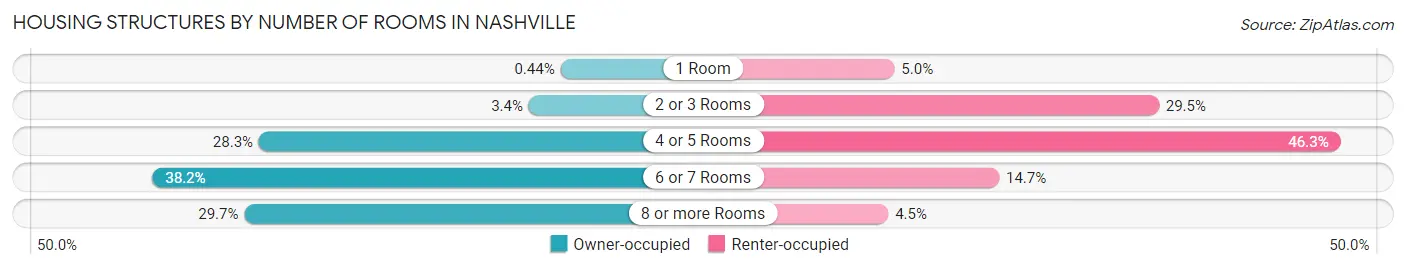
| Number of Rooms | Owner-occupied | Renter-occupied |
| 1 Room | 692 (0.4%) | 6,798 (5.0%) |
| 2 or 3 Rooms | 5,293 (3.4%) | 39,791 (29.5%) |
| 4 or 5 Rooms | 44,457 (28.3%) | 62,472 (46.3%) |
| 6 or 7 Rooms | 59,913 (38.2%) | 19,862 (14.7%) |
| 8 or more Rooms | 46,579 (29.7%) | 6,027 (4.5%) |
| Total | 156,934 (100.0%) | 134,950 (100.0%) |
Housing Structure by Heating Type in Nashville
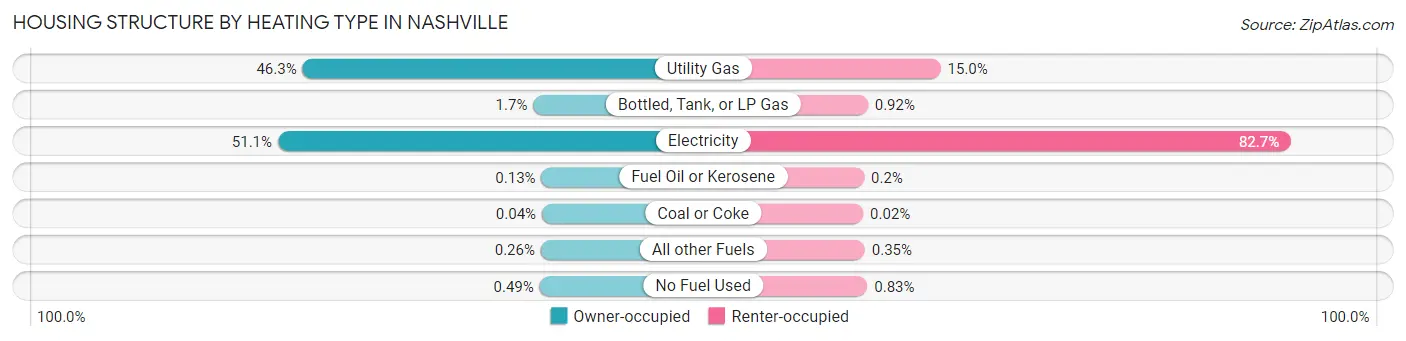
| Heating Type | Owner-occupied | Renter-occupied |
| Utility Gas | 72,655 (46.3%) | 20,229 (15.0%) |
| Bottled, Tank, or LP Gas | 2,687 (1.7%) | 1,248 (0.9%) |
| Electricity | 80,137 (51.1%) | 111,585 (82.7%) |
| Fuel Oil or Kerosene | 204 (0.1%) | 267 (0.2%) |
| Coal or Coke | 66 (0.0%) | 32 (0.0%) |
| All other Fuels | 412 (0.3%) | 468 (0.4%) |
| No Fuel Used | 773 (0.5%) | 1,121 (0.8%) |
| Total | 156,934 (100.0%) | 134,950 (100.0%) |
Household Vehicle Usage in Nashville
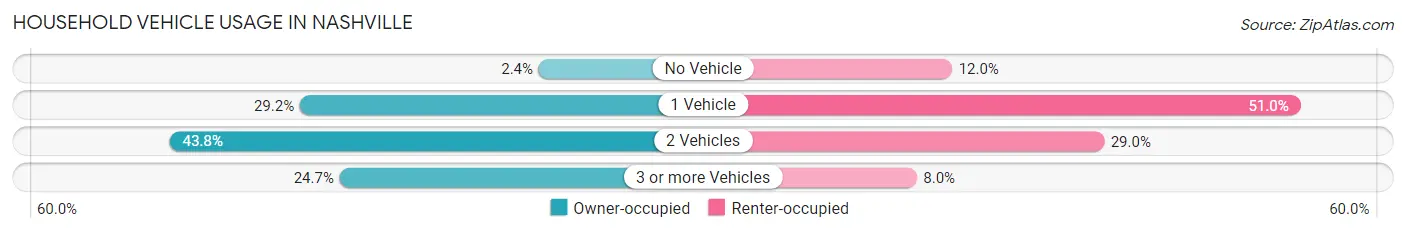
| Vehicles per Household | Owner-occupied | Renter-occupied |
| No Vehicle | 3,744 (2.4%) | 16,145 (12.0%) |
| 1 Vehicle | 45,751 (29.1%) | 68,880 (51.0%) |
| 2 Vehicles | 68,680 (43.8%) | 39,125 (29.0%) |
| 3 or more Vehicles | 38,759 (24.7%) | 10,800 (8.0%) |
| Total | 156,934 (100.0%) | 134,950 (100.0%) |
Real Estate & Mortgages in Nashville
Real Estate and Mortgage Overview in Nashville
| Characteristic | Without Mortgage | With Mortgage |
| Housing Units | 48,841 | 108,093 |
| Median Property Value | $340,400 | $356,000 |
| Median Household Income | $75,180 | $32,416 |
| Monthly Housing Costs | $575 | $12,557 |
| Real Estate Taxes | $2,197 | $3,448 |
Property Value by Mortgage Status in Nashville
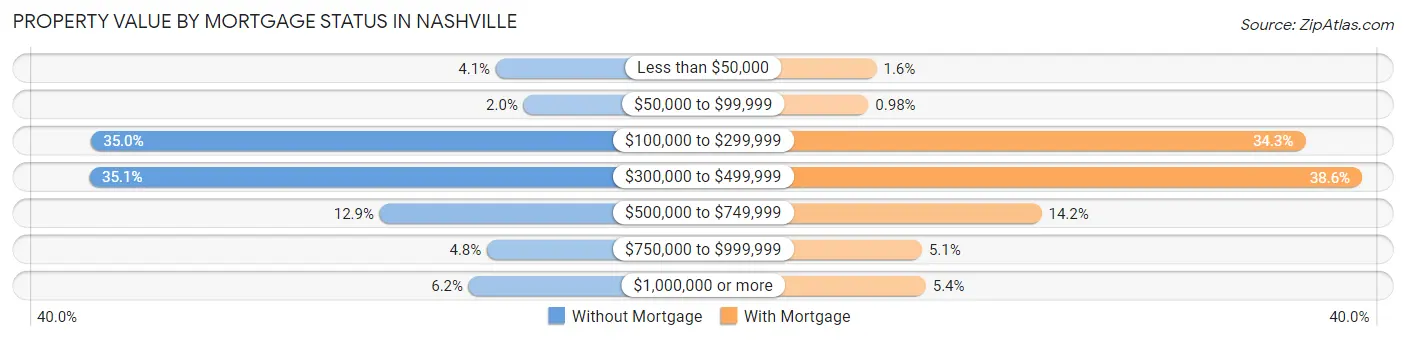
| Property Value | Without Mortgage | With Mortgage |
| Less than $50,000 | 1,999 (4.1%) | 1,730 (1.6%) |
| $50,000 to $99,999 | 961 (2.0%) | 1,057 (1.0%) |
| $100,000 to $299,999 | 17,089 (35.0%) | 37,029 (34.3%) |
| $300,000 to $499,999 | 17,140 (35.1%) | 41,701 (38.6%) |
| $500,000 to $749,999 | 6,322 (12.9%) | 15,320 (14.2%) |
| $750,000 to $999,999 | 2,325 (4.8%) | 5,473 (5.1%) |
| $1,000,000 or more | 3,005 (6.1%) | 5,783 (5.3%) |
| Total | 48,841 (100.0%) | 108,093 (100.0%) |
Household Income by Mortgage Status in Nashville
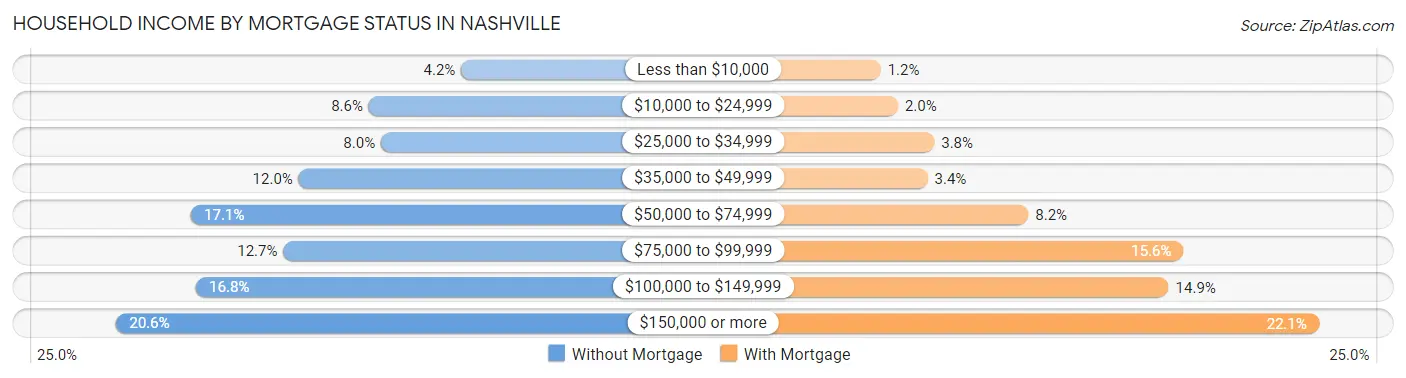
| Household Income | Without Mortgage | With Mortgage |
| Less than $10,000 | 2,056 (4.2%) | 1,297 (1.2%) |
| $10,000 to $24,999 | 4,204 (8.6%) | 2,181 (2.0%) |
| $25,000 to $34,999 | 3,922 (8.0%) | 4,050 (3.7%) |
| $35,000 to $49,999 | 5,836 (11.9%) | 3,710 (3.4%) |
| $50,000 to $74,999 | 8,335 (17.1%) | 8,897 (8.2%) |
| $75,000 to $99,999 | 6,192 (12.7%) | 16,872 (15.6%) |
| $100,000 to $149,999 | 8,222 (16.8%) | 16,120 (14.9%) |
| $150,000 or more | 10,074 (20.6%) | 23,847 (22.1%) |
| Total | 48,841 (100.0%) | 108,093 (100.0%) |
Property Value to Household Income Ratio in Nashville
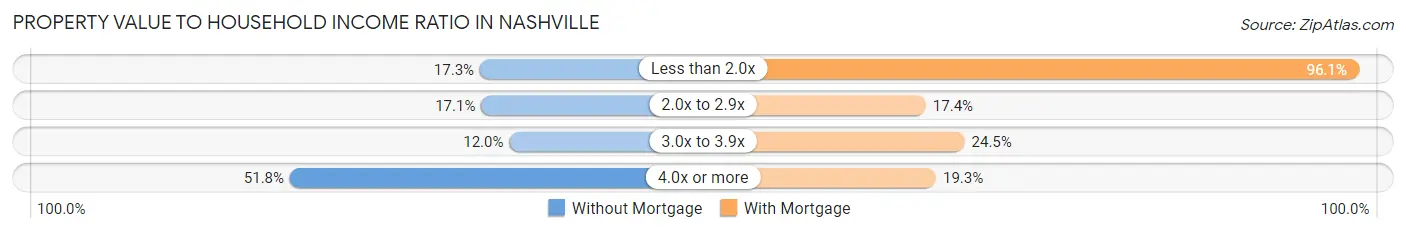
| Value-to-Income Ratio | Without Mortgage | With Mortgage |
| Less than 2.0x | 8,452 (17.3%) | 103,822 (96.1%) |
| 2.0x to 2.9x | 8,339 (17.1%) | 18,841 (17.4%) |
| 3.0x to 3.9x | 5,851 (12.0%) | 26,440 (24.5%) |
| 4.0x or more | 25,309 (51.8%) | 20,836 (19.3%) |
| Total | 48,841 (100.0%) | 108,093 (100.0%) |
Real Estate Taxes by Mortgage Status in Nashville
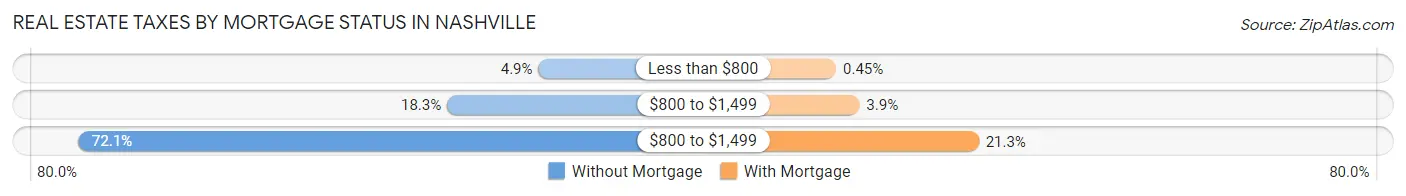
| Property Taxes | Without Mortgage | With Mortgage |
| Less than $800 | 2,409 (4.9%) | 484 (0.4%) |
| $800 to $1,499 | 8,921 (18.3%) | 4,166 (3.8%) |
| $800 to $1,499 | 35,194 (72.1%) | 23,006 (21.3%) |
| Total | 48,841 (100.0%) | 108,093 (100.0%) |
Health & Disability in Nashville
Health Insurance Coverage by Age in Nashville
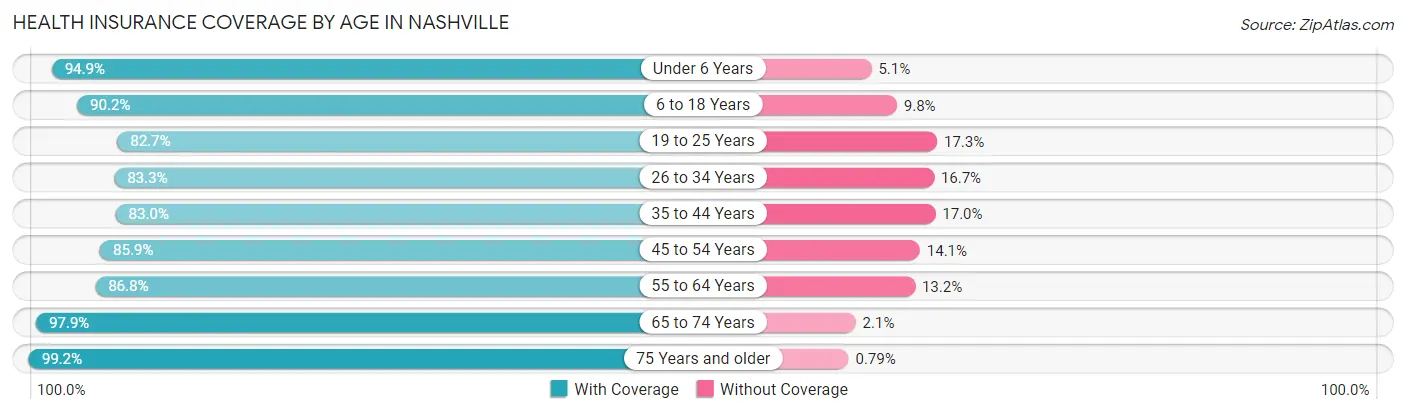
| Age Bracket | With Coverage | Without Coverage |
| Under 6 Years | 49,837 (94.9%) | 2,655 (5.1%) |
| 6 to 18 Years | 85,688 (90.2%) | 9,307 (9.8%) |
| 19 to 25 Years | 60,615 (82.7%) | 12,675 (17.3%) |
| 26 to 34 Years | 102,692 (83.3%) | 20,617 (16.7%) |
| 35 to 44 Years | 79,903 (83.0%) | 16,341 (17.0%) |
| 45 to 54 Years | 65,879 (85.9%) | 10,809 (14.1%) |
| 55 to 64 Years | 65,954 (86.8%) | 10,010 (13.2%) |
| 65 to 74 Years | 52,036 (97.9%) | 1,127 (2.1%) |
| 75 Years and older | 31,627 (99.2%) | 251 (0.8%) |
| Total | 594,231 (87.6%) | 83,792 (12.4%) |
Health Insurance Coverage by Citizenship Status in Nashville
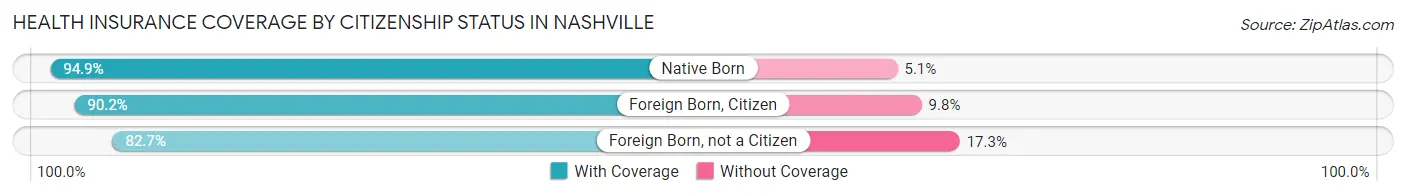
| Citizenship Status | With Coverage | Without Coverage |
| Native Born | 49,837 (94.9%) | 2,655 (5.1%) |
| Foreign Born, Citizen | 85,688 (90.2%) | 9,307 (9.8%) |
| Foreign Born, not a Citizen | 60,615 (82.7%) | 12,675 (17.3%) |
Health Insurance Coverage by Household Income in Nashville
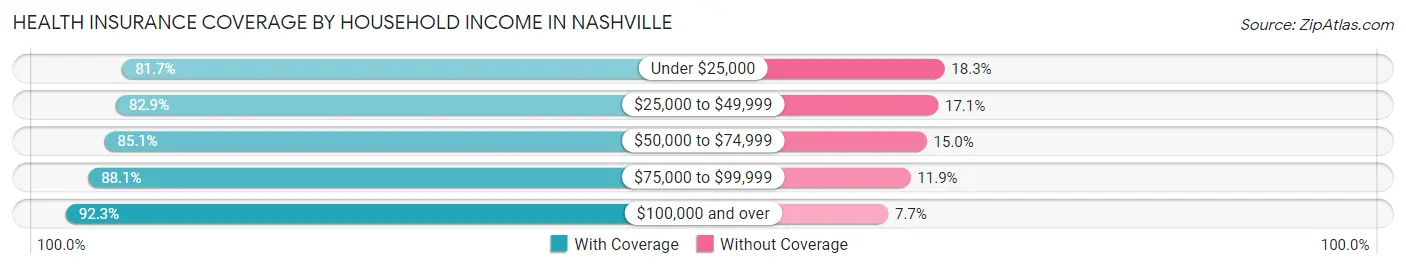
| Household Income | With Coverage | Without Coverage |
| Under $25,000 | 65,626 (81.7%) | 14,693 (18.3%) |
| $25,000 to $49,999 | 90,703 (82.9%) | 18,699 (17.1%) |
| $50,000 to $74,999 | 93,842 (85.1%) | 16,498 (14.9%) |
| $75,000 to $99,999 | 82,385 (88.1%) | 11,152 (11.9%) |
| $100,000 and over | 248,232 (92.3%) | 20,834 (7.7%) |
Public vs Private Health Insurance Coverage by Age in Nashville
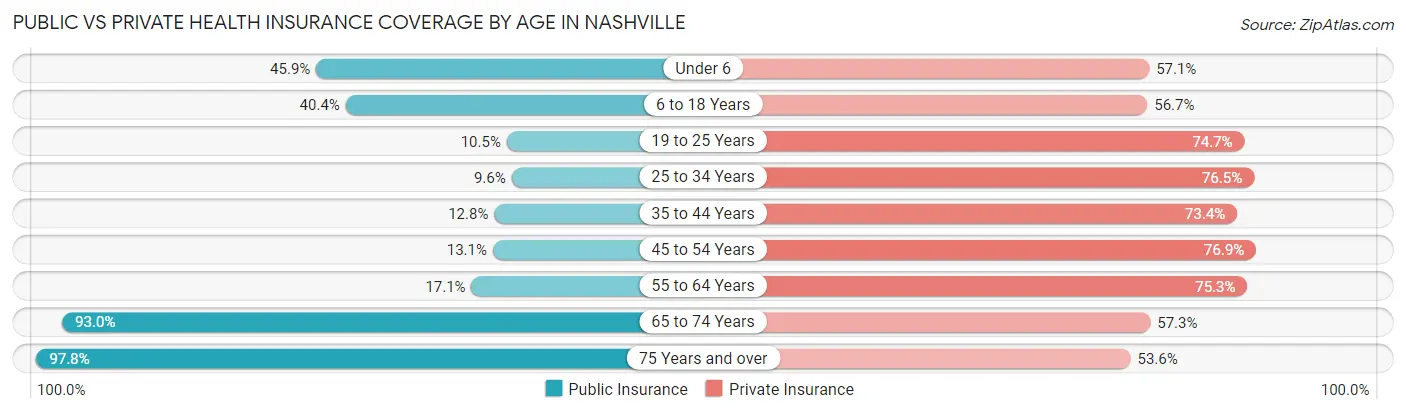
| Age Bracket | Public Insurance | Private Insurance |
| Under 6 | 24,085 (45.9%) | 29,952 (57.1%) |
| 6 to 18 Years | 38,392 (40.4%) | 53,862 (56.7%) |
| 19 to 25 Years | 7,703 (10.5%) | 54,766 (74.7%) |
| 25 to 34 Years | 11,851 (9.6%) | 94,341 (76.5%) |
| 35 to 44 Years | 12,352 (12.8%) | 70,627 (73.4%) |
| 45 to 54 Years | 10,045 (13.1%) | 58,971 (76.9%) |
| 55 to 64 Years | 12,963 (17.1%) | 57,172 (75.3%) |
| 65 to 74 Years | 49,461 (93.0%) | 30,439 (57.3%) |
| 75 Years and over | 31,179 (97.8%) | 17,088 (53.6%) |
| Total | 198,031 (29.2%) | 467,218 (68.9%) |
Disability Status by Sex by Age in Nashville
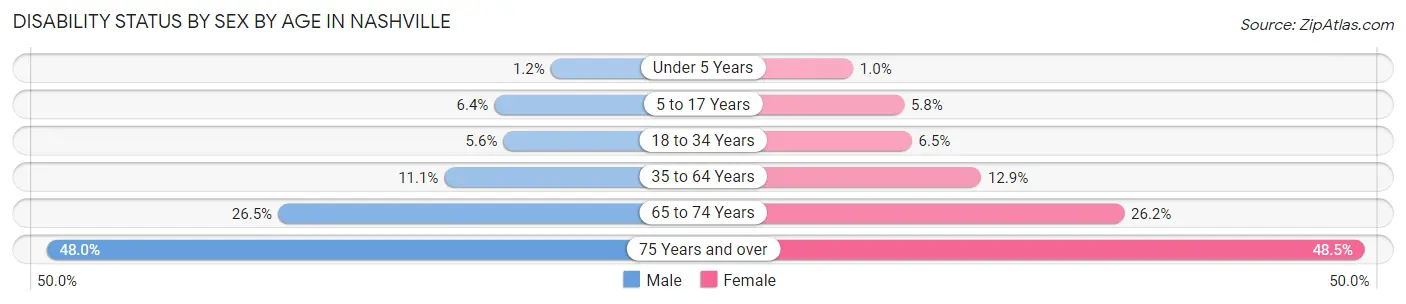
| Age Bracket | Male | Female |
| Under 5 Years | 265 (1.2%) | 225 (1.0%) |
| 5 to 17 Years | 3,074 (6.4%) | 2,694 (5.8%) |
| 18 to 34 Years | 5,511 (5.6%) | 6,915 (6.5%) |
| 35 to 64 Years | 13,567 (11.1%) | 16,316 (12.9%) |
| 65 to 74 Years | 6,402 (26.5%) | 7,599 (26.2%) |
| 75 Years and over | 5,853 (48.0%) | 9,549 (48.5%) |
Disability Class by Sex by Age in Nashville
Disability Class: Hearing Difficulty
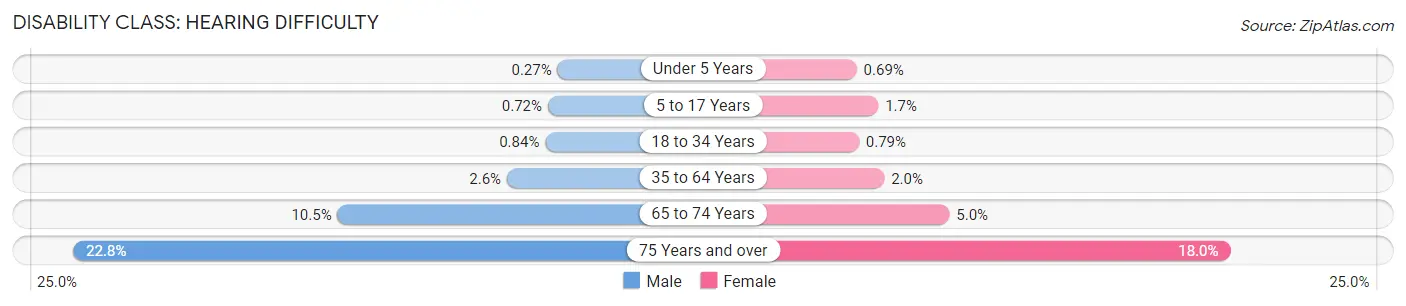
| Age Bracket | Male | Female |
| Under 5 Years | 61 (0.3%) | 149 (0.7%) |
| 5 to 17 Years | 347 (0.7%) | 788 (1.7%) |
| 18 to 34 Years | 826 (0.8%) | 844 (0.8%) |
| 35 to 64 Years | 3,208 (2.6%) | 2,493 (2.0%) |
| 65 to 74 Years | 2,532 (10.5%) | 1,446 (5.0%) |
| 75 Years and over | 2,776 (22.8%) | 3,548 (18.0%) |
Disability Class: Vision Difficulty
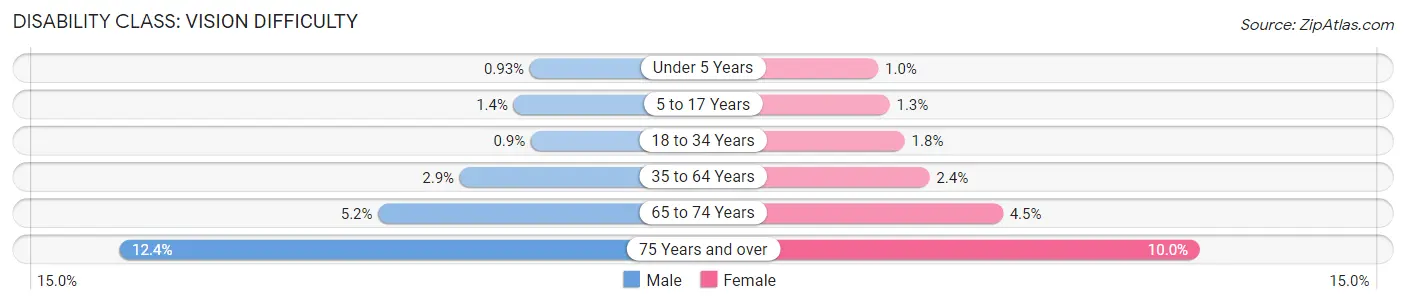
| Age Bracket | Male | Female |
| Under 5 Years | 207 (0.9%) | 219 (1.0%) |
| 5 to 17 Years | 663 (1.4%) | 621 (1.3%) |
| 18 to 34 Years | 893 (0.9%) | 1,866 (1.8%) |
| 35 to 64 Years | 3,531 (2.9%) | 3,077 (2.4%) |
| 65 to 74 Years | 1,244 (5.1%) | 1,300 (4.5%) |
| 75 Years and over | 1,510 (12.4%) | 1,961 (10.0%) |
Disability Class: Cognitive Difficulty
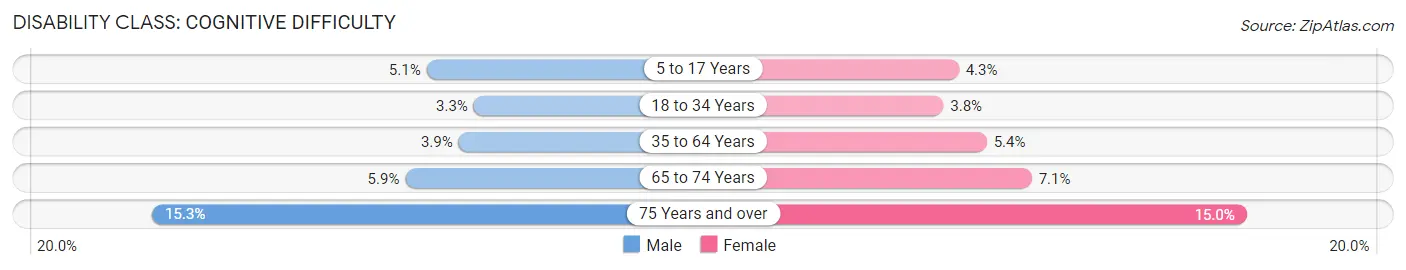
| Age Bracket | Male | Female |
| 5 to 17 Years | 2,432 (5.1%) | 2,028 (4.3%) |
| 18 to 34 Years | 3,291 (3.3%) | 4,029 (3.8%) |
| 35 to 64 Years | 4,777 (3.9%) | 6,787 (5.4%) |
| 65 to 74 Years | 1,419 (5.9%) | 2,043 (7.0%) |
| 75 Years and over | 1,864 (15.3%) | 2,958 (15.0%) |
Disability Class: Ambulatory Difficulty
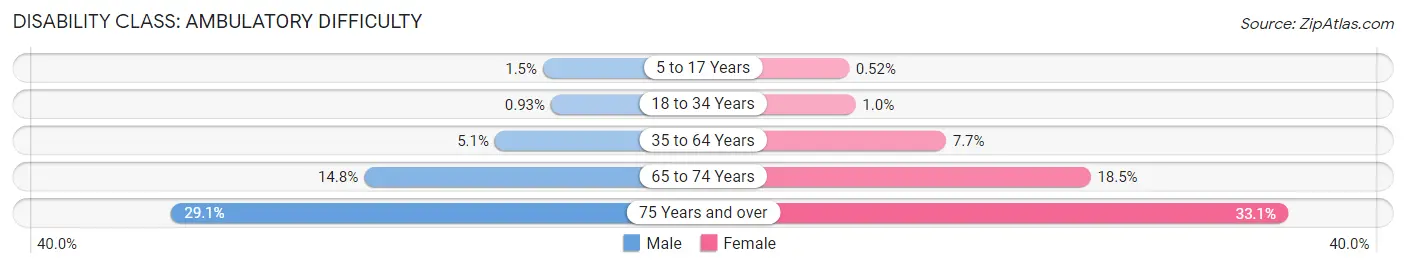
| Age Bracket | Male | Female |
| 5 to 17 Years | 726 (1.5%) | 243 (0.5%) |
| 18 to 34 Years | 913 (0.9%) | 1,075 (1.0%) |
| 35 to 64 Years | 6,240 (5.1%) | 9,746 (7.7%) |
| 65 to 74 Years | 3,576 (14.8%) | 5,353 (18.5%) |
| 75 Years and over | 3,551 (29.1%) | 6,514 (33.1%) |
Disability Class: Self-Care Difficulty
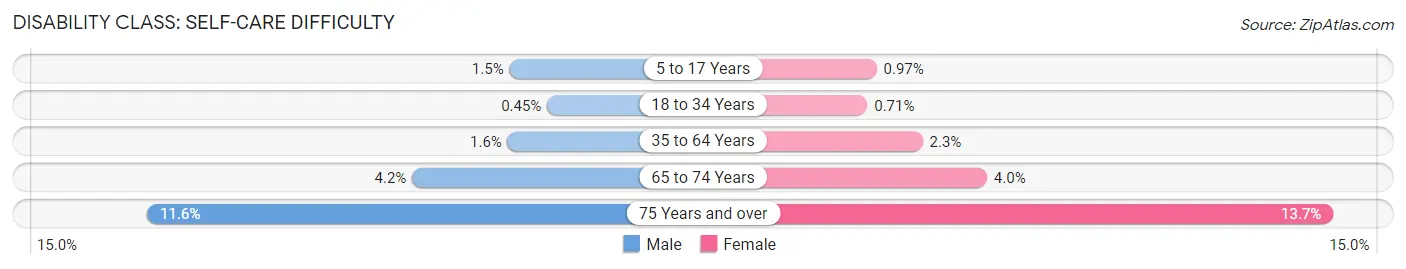
| Age Bracket | Male | Female |
| 5 to 17 Years | 717 (1.5%) | 454 (1.0%) |
| 18 to 34 Years | 447 (0.4%) | 758 (0.7%) |
| 35 to 64 Years | 1,906 (1.5%) | 2,844 (2.2%) |
| 65 to 74 Years | 1,017 (4.2%) | 1,172 (4.0%) |
| 75 Years and over | 1,414 (11.6%) | 2,691 (13.7%) |
Technology Access in Nashville
Computing Device Access in Nashville
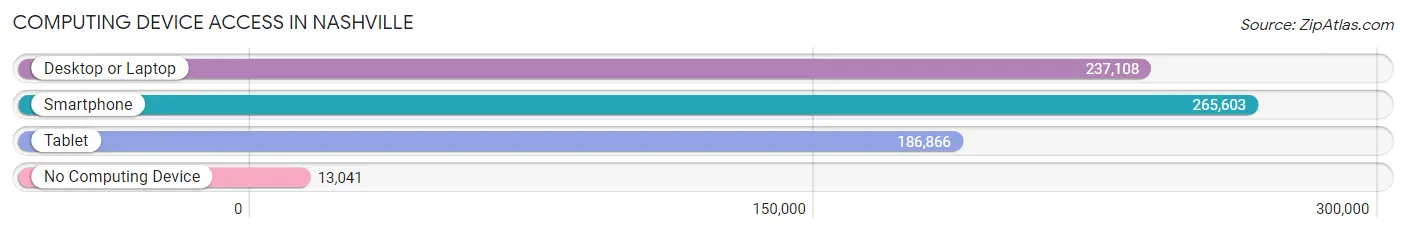
| Device Type | # Households | % Households |
| Desktop or Laptop | 237,108 | 81.2% |
| Smartphone | 265,603 | 91.0% |
| Tablet | 186,866 | 64.0% |
| No Computing Device | 13,041 | 4.5% |
| Total | 291,884 | 100.0% |
Internet Access in Nashville
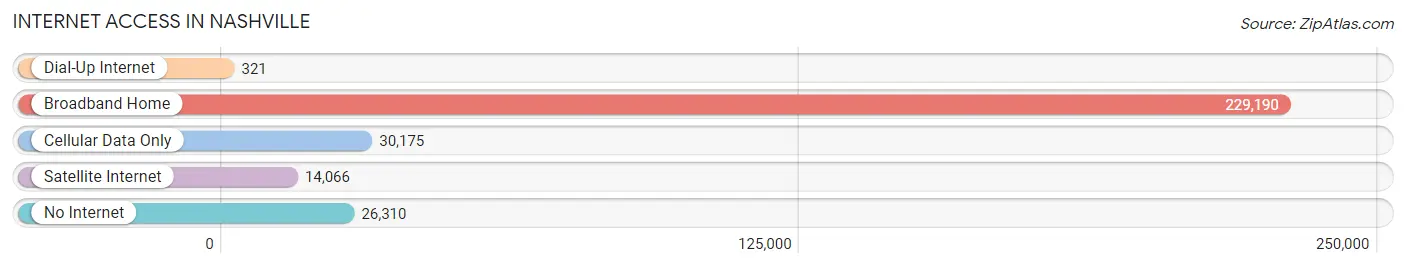
| Internet Type | # Households | % Households |
| Dial-Up Internet | 321 | 0.1% |
| Broadband Home | 229,190 | 78.5% |
| Cellular Data Only | 30,175 | 10.3% |
| Satellite Internet | 14,066 | 4.8% |
| No Internet | 26,310 | 9.0% |
| Total | 291,884 | 100.0% |
Nashville Summary
Nashville, Tennessee is the capital of the state and the second largest city in the state. It is located in the north-central part of the state, along the Cumberland River. The city is known for its music, culture, and history, and is home to many major corporations, universities, and tourist attractions.
History
Nashville was founded in 1779 by James Robertson and John Donelson, two settlers from North Carolina. The city was named after Francis Nash, a Revolutionary War hero. In 1806, Nashville was incorporated as a city and became the state capital in 1843.
During the Civil War, Nashville was the first state capital to fall to Union forces. After the war, the city experienced a period of growth and prosperity, becoming a major center for music, publishing, and banking. In the late 19th century, Nashville was known as the “Athens of the South” due to its many educational institutions.
In the 20th century, Nashville experienced a period of decline, but in the late 1970s and early 1980s, the city experienced a resurgence. This was due in part to the city’s growing music industry, which included the rise of country music. Today, Nashville is a major tourist destination and is home to many major corporations, universities, and tourist attractions.
Geography
Nashville is located in the north-central part of Tennessee, along the Cumberland River. The city is situated in a valley between the Highland Rim and the Cumberland Plateau. The city has a humid subtropical climate, with hot summers and mild winters.
The city covers an area of 526 square miles, with a population of 667,560 as of 2019. The city is divided into four distinct geographic regions: Downtown, Midtown, East Nashville, and West Nashville.
Economy
Nashville’s economy is largely based on healthcare, tourism, and music. The city is home to many major corporations, including Bridgestone, Dell, and Nissan North America. The city is also home to several universities, including Vanderbilt University, Belmont University, and Tennessee State University.
Tourism is a major industry in Nashville, with the city attracting over 14 million visitors each year. The city is home to many tourist attractions, including the Grand Ole Opry, the Country Music Hall of Fame, and the Parthenon.
Demographics
As of 2019, the population of Nashville was 667,560, with a median age of 34.8 years. The city is majority white (60.2%), followed by African American (30.2%), Hispanic (4.7%), and Asian (3.7%). The city’s population is also diverse in terms of religion, with the largest religious groups being Christian (63.2%), followed by Jewish (2.2%), Muslim (1.2%), and Buddhist (0.7%).
Nashville is a major center for education, with over 50 colleges and universities located in the city. The city is also home to many cultural institutions, including the Country Music Hall of Fame, the Frist Center for the Visual Arts, and the Tennessee Performing Arts Center.
Common Questions
What is Per Capita Income in Nashville?
Per Capita income in Nashville is $44,433.
What is the Median Family Income in Nashville?
Median Family Income in Nashville is $90,214.
What is the Median Household income in Nashville?
Median Household Income in Nashville is $71,328.
What is Income or Wage Gap in Nashville?
Income or Wage Gap in Nashville is 14.4%.
Women in Nashville earn 85.6 cents for every dollar earned by a man.
What is Family Income Deficit in Nashville?
Family Income Deficit in Nashville is $11,783.
Families that are below poverty line in Nashville earn $11,783 less on average than the poverty threshold level.
What is Inequality or Gini Index in Nashville?
Inequality or Gini Index in Nashville is 0.48.
What is the Total Population of Nashville?
Total Population of Nashville is 684,103.
What is the Total Male Population of Nashville?
Total Male Population of Nashville is 331,753.
What is the Total Female Population of Nashville?
Total Female Population of Nashville is 352,350.
What is the Ratio of Males per 100 Females in Nashville?
There are 94.15 Males per 100 Females in Nashville.
What is the Ratio of Females per 100 Males in Nashville?
There are 106.21 Females per 100 Males in Nashville.
What is the Median Population Age in Nashville?
Median Population Age in Nashville is 34.6 Years.
What is the Average Family Size in Nashville
Average Family Size in Nashville is 3.0 People.
What is the Average Household Size in Nashville
Average Household Size in Nashville is 2.3 People.
How Large is the Labor Force in Nashville?
There are 401,949 People in the Labor Forcein in Nashville.
What is the Percentage of People in the Labor Force in Nashville?
71.9% of People are in the Labor Force in Nashville.
What is the Unemployment Rate in Nashville?
Unemployment Rate in Nashville is 4.6%.