Chattanooga, TN Map & Demographics
Chattanooga Map
Chattanooga Overview
$37,983
PER CAPITA INCOME
$78,965
AVG FAMILY INCOME
$57,703
AVG HOUSEHOLD INCOME
22.6%
WAGE / INCOME GAP [ % ]
77.4¢/ $1
WAGE / INCOME GAP [ $ ]
$12,067
FAMILY INCOME DEFICIT
0.50
INEQUALITY / GINI INDEX
181,288
TOTAL POPULATION
86,410
MALE POPULATION
94,878
FEMALE POPULATION
91.07
MALES / 100 FEMALES
109.80
FEMALES / 100 MALES
37.0
MEDIAN AGE
3.0
AVG FAMILY SIZE
2.2
AVG HOUSEHOLD SIZE
95,149
LABOR FORCE [ PEOPLE ]
64.0%
PERCENT IN LABOR FORCE
5.1%
UNEMPLOYMENT RATE
Chattanooga Zip Codes
Chattanooga Area Codes
Income in Chattanooga
Income Overview in Chattanooga
Per Capita Income in Chattanooga is $37,983, while median incomes of families and households are $78,965 and $57,703 respectively.
| Characteristic | Number | Measure |
| Per Capita Income | 181,288 | $37,983 |
| Median Family Income | 41,509 | $78,965 |
| Mean Family Income | 41,509 | $110,578 |
| Median Household Income | 77,016 | $57,703 |
| Mean Household Income | 77,016 | $86,620 |
| Income Deficit | 41,509 | $12,067 |
| Wage / Income Gap (%) | 181,288 | 22.63% |
| Wage / Income Gap ($) | 181,288 | 77.37¢ per $1 |
| Gini / Inequality Index | 181,288 | 0.50 |
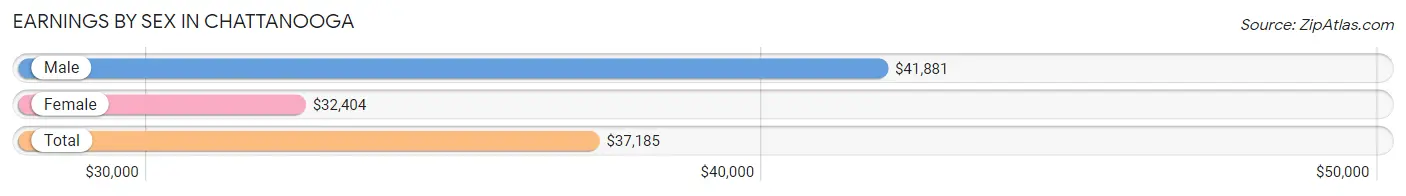
Earnings by Sex in Chattanooga
Average Earnings in Chattanooga are $37,185, $41,881 for men and $32,404 for women, a difference of 22.6%.
| Sex | Number | Average Earnings |
| Male | 51,251 (50.9%) | $41,881 |
| Female | 49,370 (49.1%) | $32,404 |
| Total | 100,621 (100.0%) | $37,185 |
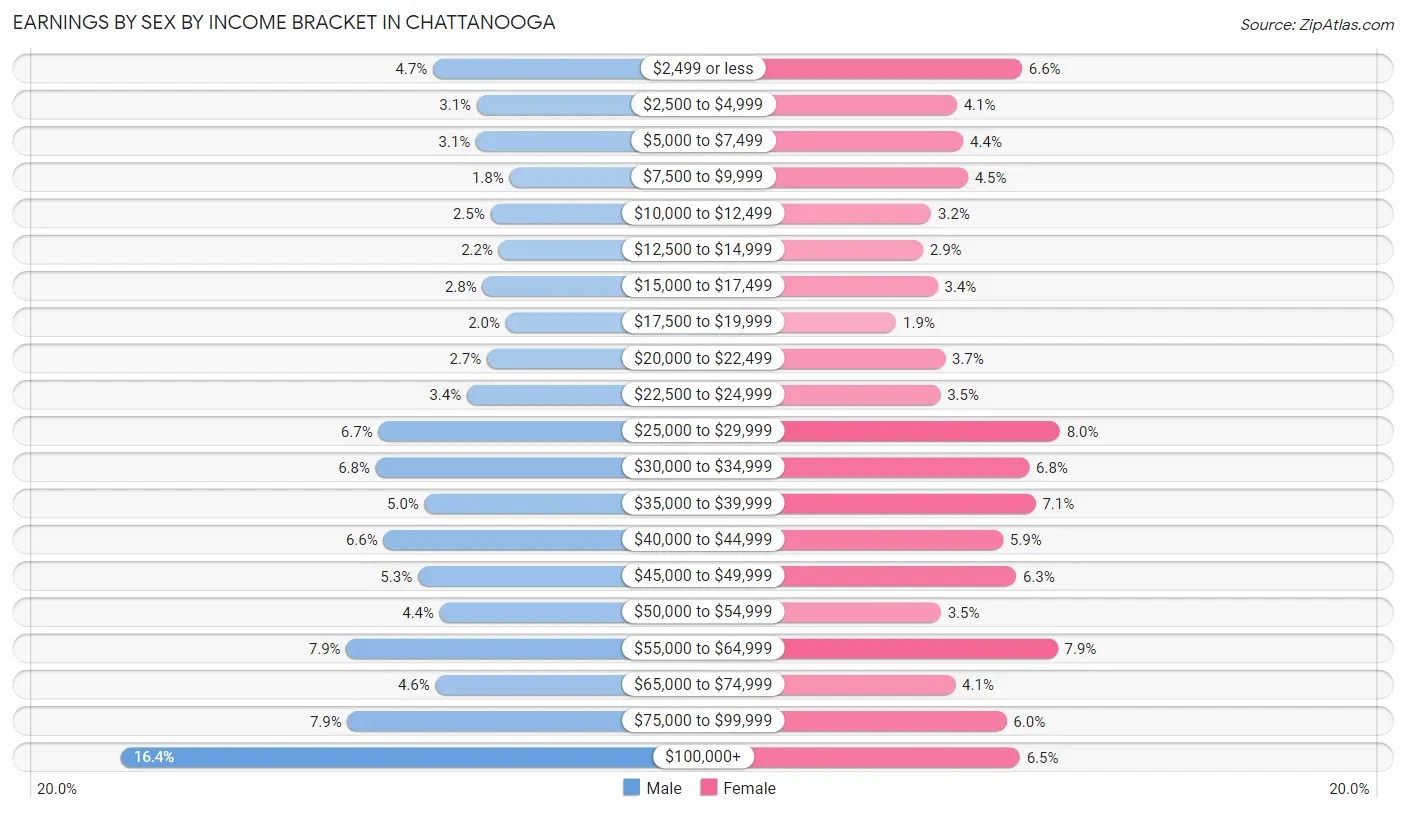
Earnings by Sex by Income Bracket in Chattanooga
The most common earnings brackets in Chattanooga are $100,000+ for men (8,399 | 16.4%) and $25,000 to $29,999 for women (3,938 | 8.0%).
| Income | Male | Female |
| $2,499 or less | 2,405 (4.7%) | 3,237 (6.6%) |
| $2,500 to $4,999 | 1,561 (3.0%) | 2,032 (4.1%) |
| $5,000 to $7,499 | 1,578 (3.1%) | 2,151 (4.4%) |
| $7,500 to $9,999 | 940 (1.8%) | 2,235 (4.5%) |
| $10,000 to $12,499 | 1,304 (2.5%) | 1,562 (3.2%) |
| $12,500 to $14,999 | 1,143 (2.2%) | 1,407 (2.9%) |
| $15,000 to $17,499 | 1,455 (2.8%) | 1,680 (3.4%) |
| $17,500 to $19,999 | 1,009 (2.0%) | 914 (1.8%) |
| $20,000 to $22,499 | 1,367 (2.7%) | 1,816 (3.7%) |
| $22,500 to $24,999 | 1,754 (3.4%) | 1,727 (3.5%) |
| $25,000 to $29,999 | 3,456 (6.7%) | 3,938 (8.0%) |
| $30,000 to $34,999 | 3,508 (6.8%) | 3,373 (6.8%) |
| $35,000 to $39,999 | 2,568 (5.0%) | 3,490 (7.1%) |
| $40,000 to $44,999 | 3,356 (6.6%) | 2,886 (5.9%) |
| $45,000 to $49,999 | 2,695 (5.3%) | 3,130 (6.3%) |
| $50,000 to $54,999 | 2,276 (4.4%) | 1,739 (3.5%) |
| $55,000 to $64,999 | 4,070 (7.9%) | 3,898 (7.9%) |
| $65,000 to $74,999 | 2,360 (4.6%) | 2,005 (4.1%) |
| $75,000 to $99,999 | 4,047 (7.9%) | 2,951 (6.0%) |
| $100,000+ | 8,399 (16.4%) | 3,199 (6.5%) |
| Total | 51,251 (100.0%) | 49,370 (100.0%) |
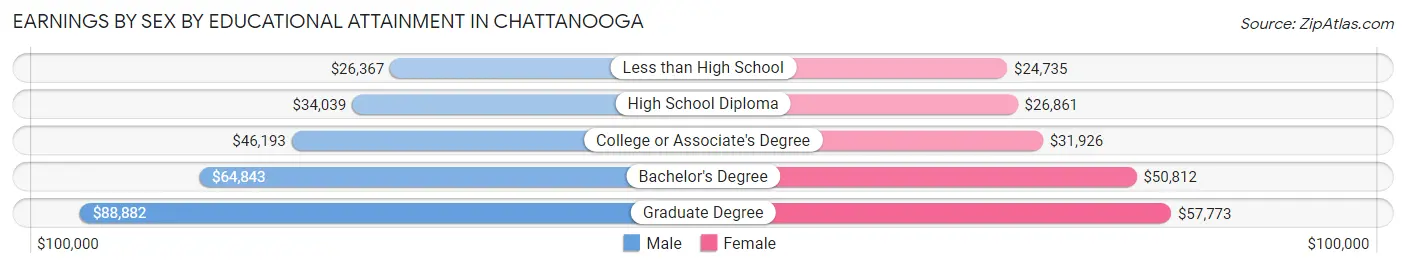
Earnings by Sex by Educational Attainment in Chattanooga
Average earnings in Chattanooga are $47,153 for men and $38,714 for women, a difference of 17.9%. Men with an educational attainment of graduate degree enjoy the highest average annual earnings of $88,882, while those with less than high school education earn the least with $26,367. Women with an educational attainment of graduate degree earn the most with the average annual earnings of $57,773, while those with less than high school education have the smallest earnings of $24,735.
| Educational Attainment | Male Income | Female Income |
| Less than High School | $26,367 | $24,735 |
| High School Diploma | $34,039 | $26,861 |
| College or Associate's Degree | $46,193 | $31,926 |
| Bachelor's Degree | $64,843 | $50,812 |
| Graduate Degree | $88,882 | $57,773 |
| Total | $47,153 | $38,714 |
Family Income in Chattanooga
Family Income Brackets in Chattanooga
According to the Chattanooga family income data, there are 7,928 families falling into the $100,000 to $149,999 income range, which is the most common income bracket and makes up 19.1% of all families. Conversely, the $10,000 to $14,999 income bracket is the least frequent group with only 1,121 families (2.7%) belonging to this category.
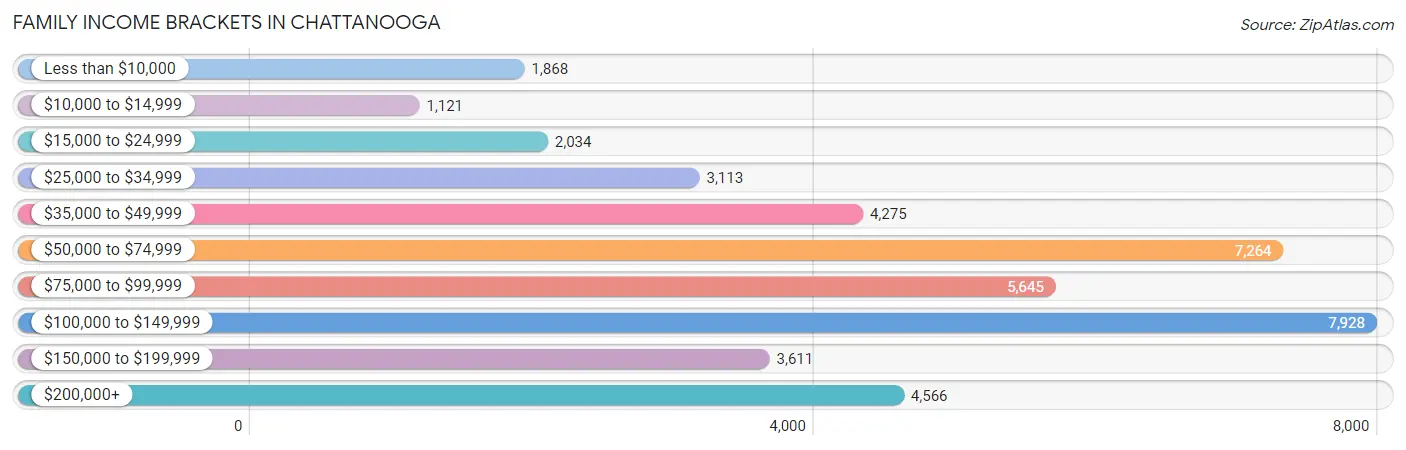
| Income Bracket | # Families | % Families |
| Less than $10,000 | 1,868 | 4.5% |
| $10,000 to $14,999 | 1,121 | 2.7% |
| $15,000 to $24,999 | 2,034 | 4.9% |
| $25,000 to $34,999 | 3,113 | 7.5% |
| $35,000 to $49,999 | 4,275 | 10.3% |
| $50,000 to $74,999 | 7,264 | 17.5% |
| $75,000 to $99,999 | 5,645 | 13.6% |
| $100,000 to $149,999 | 7,928 | 19.1% |
| $150,000 to $199,999 | 3,611 | 8.7% |
| $200,000+ | 4,566 | 11.0% |
Family Income by Famaliy Size in Chattanooga
4-person families (6,104 | 14.7%) account for the highest median family income in Chattanooga with $101,536 per family, while 2-person families (21,830 | 52.6%) have the highest median income of $36,886 per family member.
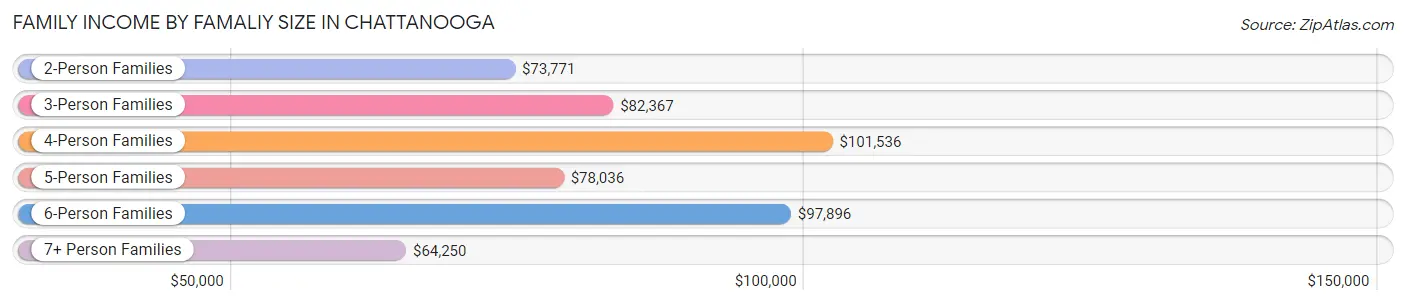
| Income Bracket | # Families | Median Income |
| 2-Person Families | 21,830 (52.6%) | $73,771 |
| 3-Person Families | 9,716 (23.4%) | $82,367 |
| 4-Person Families | 6,104 (14.7%) | $101,536 |
| 5-Person Families | 2,543 (6.1%) | $78,036 |
| 6-Person Families | 725 (1.8%) | $97,896 |
| 7+ Person Families | 591 (1.4%) | $64,250 |
| Total | 41,509 (100.0%) | $78,965 |
Family Income by Number of Earners in Chattanooga
The median family income in Chattanooga is $78,965, with families comprising 3+ earners (3,723) having the highest median family income of $133,156, while families with no earners (6,040) have the lowest median family income of $41,124, accounting for 9.0% and 14.5% of families, respectively.
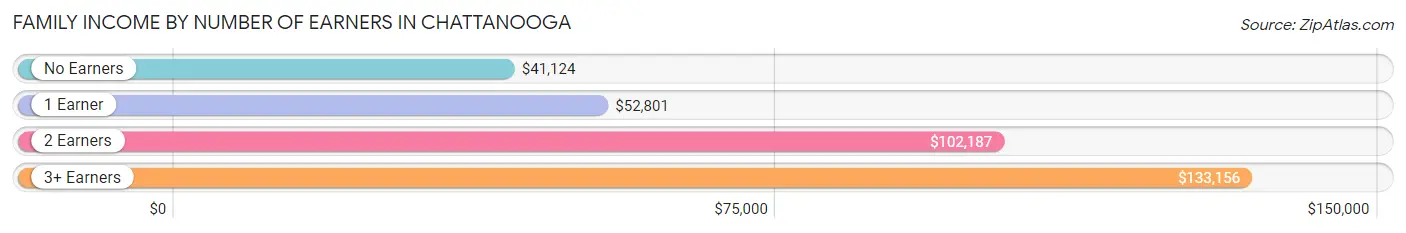
| Number of Earners | # Families | Median Income |
| No Earners | 6,040 (14.5%) | $41,124 |
| 1 Earner | 14,218 (34.3%) | $52,801 |
| 2 Earners | 17,528 (42.2%) | $102,187 |
| 3+ Earners | 3,723 (9.0%) | $133,156 |
| Total | 41,509 (100.0%) | $78,965 |
Household Income in Chattanooga
Household Income Brackets in Chattanooga
With 13,016 households falling in the category, the $50,000 to $74,999 income range is the most frequent in Chattanooga, accounting for 16.9% of all households. In contrast, only 4,236 households (5.5%) fall into the less than $10,000 income bracket, making it the least populous group.
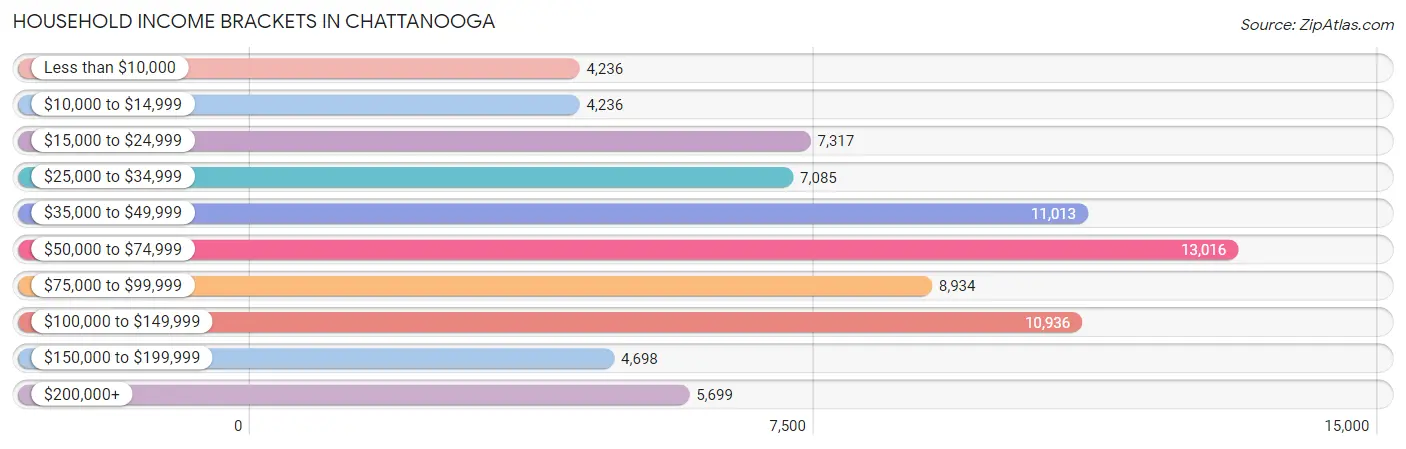
| Income Bracket | # Households | % Households |
| Less than $10,000 | 4,236 | 5.5% |
| $10,000 to $14,999 | 4,236 | 5.5% |
| $15,000 to $24,999 | 7,317 | 9.5% |
| $25,000 to $34,999 | 7,085 | 9.2% |
| $35,000 to $49,999 | 11,013 | 14.3% |
| $50,000 to $74,999 | 13,016 | 16.9% |
| $75,000 to $99,999 | 8,934 | 11.6% |
| $100,000 to $149,999 | 10,936 | 14.2% |
| $150,000 to $199,999 | 4,698 | 6.1% |
| $200,000+ | 5,699 | 7.4% |
Household Income by Householder Age in Chattanooga
The median household income in Chattanooga is $57,703, with the highest median household income of $66,362 found in the 25 to 44 years age bracket for the primary householder. A total of 27,829 households (36.1%) fall into this category. Meanwhile, the 15 to 24 years age bracket for the primary householder has the lowest median household income of $37,905, with 4,210 households (5.5%) in this group.
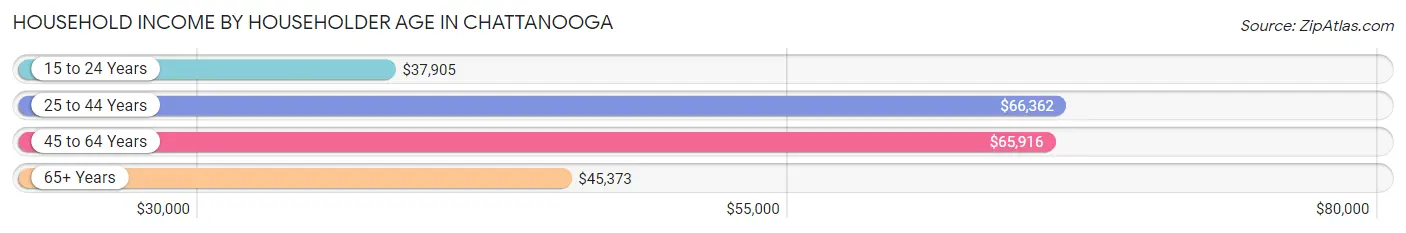
| Income Bracket | # Households | Median Income |
| 15 to 24 Years | 4,210 (5.5%) | $37,905 |
| 25 to 44 Years | 27,829 (36.1%) | $66,362 |
| 45 to 64 Years | 24,101 (31.3%) | $65,916 |
| 65+ Years | 20,876 (27.1%) | $45,373 |
| Total | 77,016 (100.0%) | $57,703 |
Poverty in Chattanooga
Income Below Poverty by Sex and Age in Chattanooga
With 16.1% poverty level for males and 17.7% for females among the residents of Chattanooga, 5 year old males and 15 year old females are the most vulnerable to poverty, with 313 males (38.9%) and 459 females (55.8%) in their respective age groups living below the poverty level.
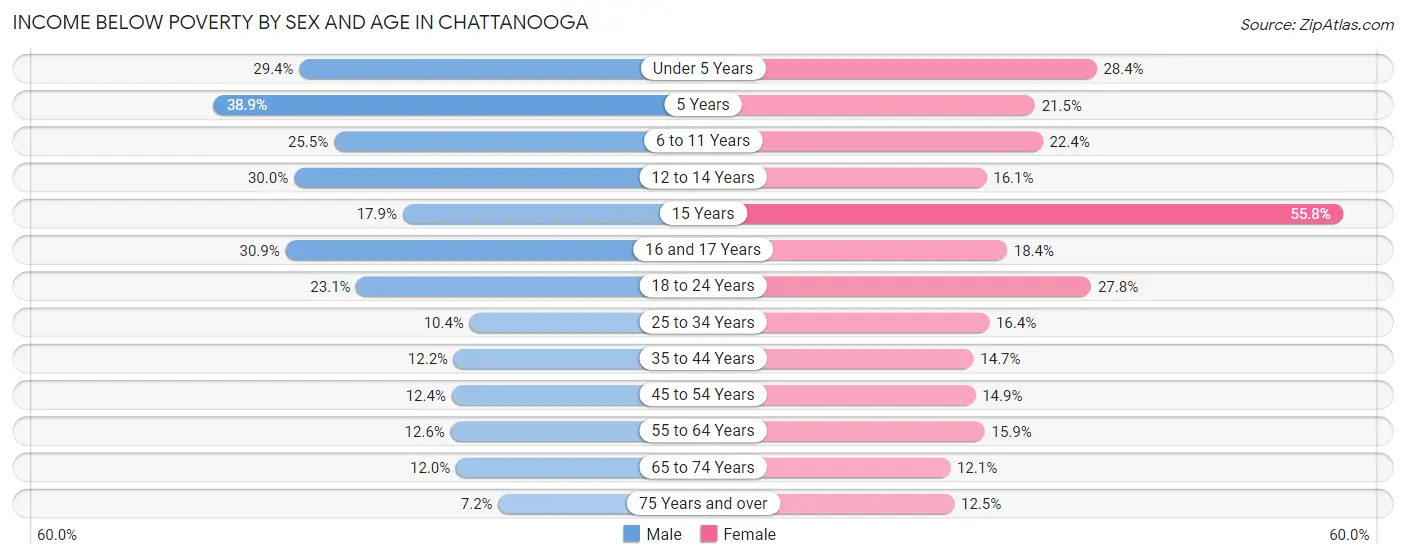
| Age Bracket | Male | Female |
| Under 5 Years | 1,612 (29.4%) | 1,579 (28.4%) |
| 5 Years | 313 (38.9%) | 147 (21.5%) |
| 6 to 11 Years | 1,645 (25.5%) | 1,194 (22.4%) |
| 12 to 14 Years | 775 (30.0%) | 531 (16.1%) |
| 15 Years | 193 (17.9%) | 459 (55.8%) |
| 16 and 17 Years | 595 (30.9%) | 309 (18.4%) |
| 18 to 24 Years | 1,648 (23.1%) | 2,258 (27.8%) |
| 25 to 34 Years | 1,528 (10.4%) | 2,504 (16.4%) |
| 35 to 44 Years | 1,346 (12.2%) | 1,604 (14.6%) |
| 45 to 54 Years | 1,191 (12.4%) | 1,393 (14.9%) |
| 55 to 64 Years | 1,306 (12.6%) | 1,945 (15.9%) |
| 65 to 74 Years | 960 (11.9%) | 1,209 (12.0%) |
| 75 Years and over | 292 (7.2%) | 982 (12.5%) |
| Total | 13,404 (16.1%) | 16,114 (17.7%) |
Income Above Poverty by Sex and Age in Chattanooga
According to the poverty statistics in Chattanooga, males aged 75 years and over and females aged 65 to 74 years are the age groups that are most secure financially, with 92.8% of males and 87.9% of females in these age groups living above the poverty line.
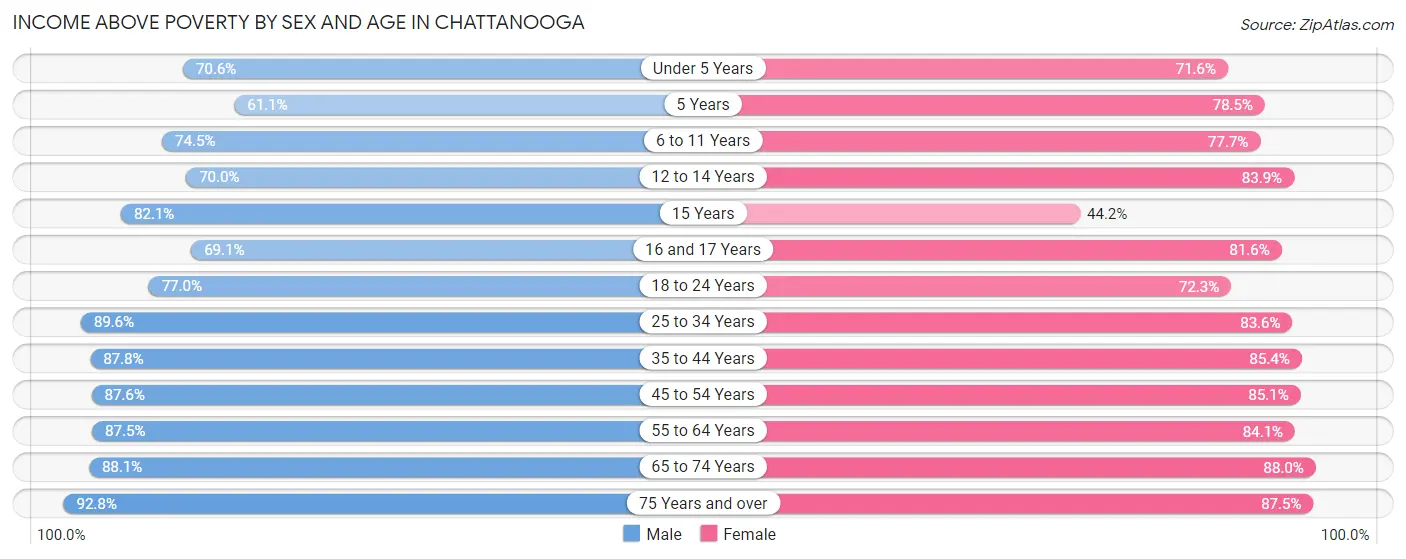
| Age Bracket | Male | Female |
| Under 5 Years | 3,871 (70.6%) | 3,989 (71.6%) |
| 5 Years | 491 (61.1%) | 537 (78.5%) |
| 6 to 11 Years | 4,797 (74.5%) | 4,148 (77.6%) |
| 12 to 14 Years | 1,808 (70.0%) | 2,770 (83.9%) |
| 15 Years | 886 (82.1%) | 364 (44.2%) |
| 16 and 17 Years | 1,328 (69.1%) | 1,372 (81.6%) |
| 18 to 24 Years | 5,502 (76.9%) | 5,879 (72.3%) |
| 25 to 34 Years | 13,121 (89.6%) | 12,774 (83.6%) |
| 35 to 44 Years | 9,696 (87.8%) | 9,347 (85.4%) |
| 45 to 54 Years | 8,388 (87.6%) | 7,980 (85.1%) |
| 55 to 64 Years | 9,104 (87.5%) | 10,289 (84.1%) |
| 65 to 74 Years | 7,075 (88.0%) | 8,822 (87.9%) |
| 75 Years and over | 3,747 (92.8%) | 6,872 (87.5%) |
| Total | 69,814 (83.9%) | 75,143 (82.3%) |
Income Below Poverty Among Married-Couple Families in Chattanooga
The poverty statistics for married-couple families in Chattanooga show that 4.7% or 1,251 of the total 26,578 families live below the poverty line. Families with 5 or more children have the highest poverty rate of 41.1%, comprising of 106 families. On the other hand, families with 1 or 2 children have the lowest poverty rate of 3.4%, which includes 262 families.
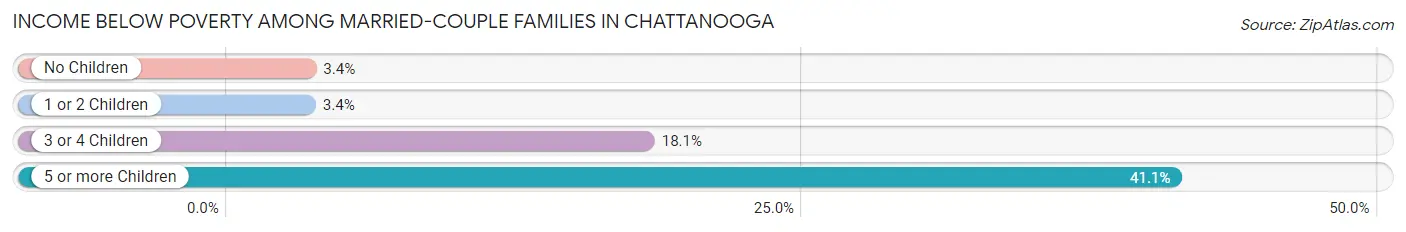
| Children | Above Poverty | Below Poverty |
| No Children | 16,322 (96.6%) | 577 (3.4%) |
| 1 or 2 Children | 7,472 (96.6%) | 262 (3.4%) |
| 3 or 4 Children | 1,381 (81.9%) | 306 (18.1%) |
| 5 or more Children | 152 (58.9%) | 106 (41.1%) |
| Total | 25,327 (95.3%) | 1,251 (4.7%) |
Income Below Poverty Among Single-Parent Households in Chattanooga
According to the poverty data in Chattanooga, 13.7% or 543 single-father households and 26.5% or 2,908 single-mother households are living below the poverty line. Among single-father households, those with 5 or more children have the highest poverty rate, with 11 households (52.4%) experiencing poverty. Likewise, among single-mother households, those with 5 or more children have the highest poverty rate, with 105 households (93.8%) falling below the poverty line.
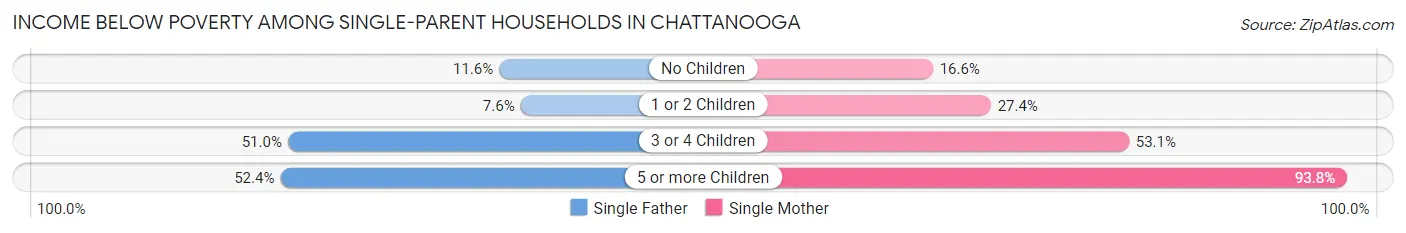
| Children | Single Father | Single Mother |
| No Children | 223 (11.6%) | 733 (16.6%) |
| 1 or 2 Children | 128 (7.6%) | 1,430 (27.4%) |
| 3 or 4 Children | 181 (51.0%) | 640 (53.1%) |
| 5 or more Children | 11 (52.4%) | 105 (93.8%) |
| Total | 543 (13.7%) | 2,908 (26.5%) |
Income Below Poverty Among Married-Couple vs Single-Parent Households in Chattanooga
The poverty data for Chattanooga shows that 1,251 of the married-couple family households (4.7%) and 3,451 of the single-parent households (23.1%) are living below the poverty level. Within the married-couple family households, those with 5 or more children have the highest poverty rate, with 106 households (41.1%) falling below the poverty line. Among the single-parent households, those with 5 or more children have the highest poverty rate, with 116 household (87.2%) living below poverty.
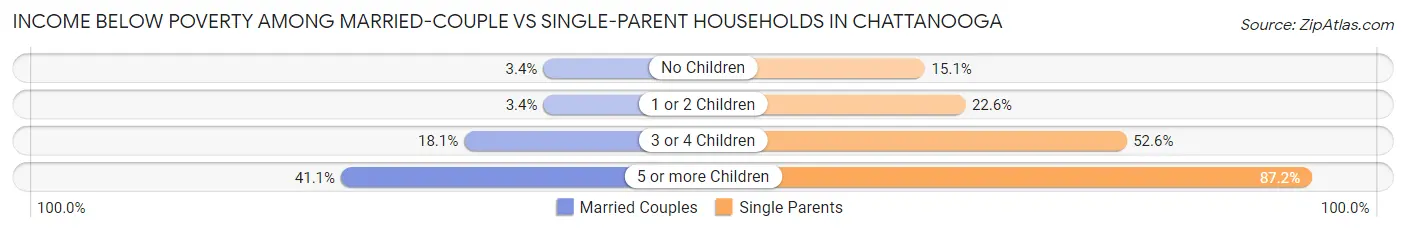
| Children | Married-Couple Families | Single-Parent Households |
| No Children | 577 (3.4%) | 956 (15.1%) |
| 1 or 2 Children | 262 (3.4%) | 1,558 (22.6%) |
| 3 or 4 Children | 306 (18.1%) | 821 (52.6%) |
| 5 or more Children | 106 (41.1%) | 116 (87.2%) |
| Total | 1,251 (4.7%) | 3,451 (23.1%) |
Race in Chattanooga
The most populous races in Chattanooga are White / Caucasian (107,415 | 59.3%), Black / African American (53,428 | 29.5%), and Hispanic or Latino (13,718 | 7.6%).
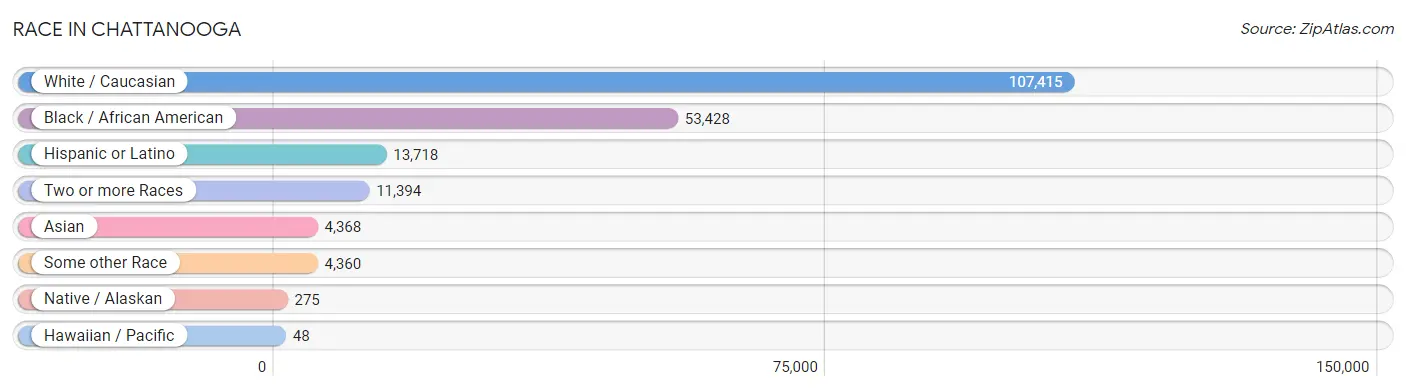
| Race | # Population | % Population |
| Asian | 4,368 | 2.4% |
| Black / African American | 53,428 | 29.5% |
| Hawaiian / Pacific | 48 | 0.0% |
| Hispanic or Latino | 13,718 | 7.6% |
| Native / Alaskan | 275 | 0.2% |
| White / Caucasian | 107,415 | 59.3% |
| Two or more Races | 11,394 | 6.3% |
| Some other Race | 4,360 | 2.4% |
| Total | 181,288 | 100.0% |
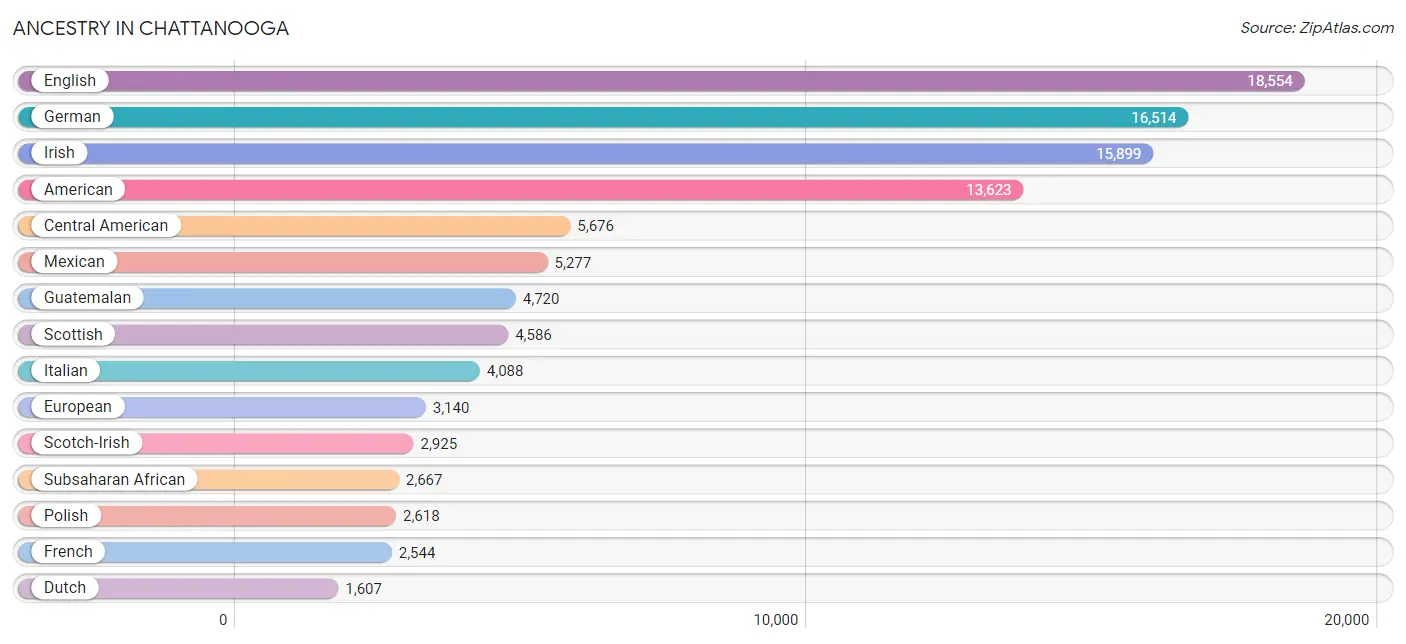
Ancestry in Chattanooga
The most populous ancestries reported in Chattanooga are English (18,554 | 10.2%), German (16,514 | 9.1%), Irish (15,899 | 8.8%), American (13,623 | 7.5%), and Central American (5,676 | 3.1%), together accounting for 38.8% of all Chattanooga residents.
| Ancestry | # Population | % Population |
| African | 1,571 | 0.9% |
| Alaska Native | 5 | 0.0% |
| American | 13,623 | 7.5% |
| Arab | 596 | 0.3% |
| Argentinean | 135 | 0.1% |
| Armenian | 94 | 0.1% |
| Assyrian / Chaldean / Syriac | 5 | 0.0% |
| Australian | 47 | 0.0% |
| Austrian | 42 | 0.0% |
| Bahamian | 57 | 0.0% |
| Belgian | 54 | 0.0% |
| Bhutanese | 235 | 0.1% |
| Blackfeet | 77 | 0.0% |
| Brazilian | 435 | 0.2% |
| British | 1,396 | 0.8% |
| Bulgarian | 31 | 0.0% |
| Burmese | 445 | 0.3% |
| Cajun | 26 | 0.0% |
| Canadian | 216 | 0.1% |
| Celtic | 40 | 0.0% |
| Central American | 5,676 | 3.1% |
| Central American Indian | 8 | 0.0% |
| Cherokee | 902 | 0.5% |
| Chilean | 41 | 0.0% |
| Chippewa | 1 | 0.0% |
| Choctaw | 186 | 0.1% |
| Colombian | 285 | 0.2% |
| Cree | 6 | 0.0% |
| Creek | 374 | 0.2% |
| Croatian | 35 | 0.0% |
| Cuban | 127 | 0.1% |
| Czech | 297 | 0.2% |
| Czechoslovakian | 53 | 0.0% |
| Danish | 218 | 0.1% |
| Dominican | 258 | 0.1% |
| Dutch | 1,607 | 0.9% |
| Dutch West Indian | 38 | 0.0% |
| Eastern European | 231 | 0.1% |
| Ecuadorian | 149 | 0.1% |
| Egyptian | 117 | 0.1% |
| English | 18,554 | 10.2% |
| Ethiopian | 345 | 0.2% |
| European | 3,140 | 1.7% |
| Filipino | 39 | 0.0% |
| Finnish | 71 | 0.0% |
| French | 2,544 | 1.4% |
| French Canadian | 387 | 0.2% |
| German | 16,514 | 9.1% |
| German Russian | 4 | 0.0% |
| Greek | 241 | 0.1% |
| Guamanian / Chamorro | 87 | 0.1% |
| Guatemalan | 4,720 | 2.6% |
| Guyanese | 21 | 0.0% |
| Haitian | 918 | 0.5% |
| Honduran | 412 | 0.2% |
| Hungarian | 226 | 0.1% |
| Icelander | 28 | 0.0% |
| Indian (Asian) | 617 | 0.3% |
| Iranian | 186 | 0.1% |
| Irish | 15,899 | 8.8% |
| Iroquois | 4 | 0.0% |
| Israeli | 45 | 0.0% |
| Italian | 4,088 | 2.2% |
| Jamaican | 206 | 0.1% |
| Japanese | 167 | 0.1% |
| Jordanian | 8 | 0.0% |
| Kenyan | 17 | 0.0% |
| Korean | 882 | 0.5% |
| Laotian | 88 | 0.1% |
| Lebanese | 150 | 0.1% |
| Liberian | 29 | 0.0% |
| Lithuanian | 257 | 0.1% |
| Lumbee | 11 | 0.0% |
| Malaysian | 11 | 0.0% |
| Maltese | 29 | 0.0% |
| Mexican | 5,277 | 2.9% |
| Mexican American Indian | 165 | 0.1% |
| Mongolian | 7 | 0.0% |
| Moroccan | 12 | 0.0% |
| Native Hawaiian | 131 | 0.1% |
| Navajo | 2 | 0.0% |
| New Zealander | 6 | 0.0% |
| Nicaraguan | 4 | 0.0% |
| Nigerian | 101 | 0.1% |
| Northern European | 231 | 0.1% |
| Norwegian | 839 | 0.5% |
| Okinawan | 5 | 0.0% |
| Osage | 4 | 0.0% |
| Pakistani | 14 | 0.0% |
| Palestinian | 22 | 0.0% |
| Panamanian | 44 | 0.0% |
| Pennsylvania German | 43 | 0.0% |
| Peruvian | 143 | 0.1% |
| Polish | 2,618 | 1.4% |
| Portuguese | 127 | 0.1% |
| Puerto Rican | 860 | 0.5% |
| Romanian | 101 | 0.1% |
| Russian | 358 | 0.2% |
| Salvadoran | 496 | 0.3% |
| Samoan | 7 | 0.0% |
| Scandinavian | 447 | 0.3% |
| Scotch-Irish | 2,925 | 1.6% |
| Scottish | 4,586 | 2.5% |
| Serbian | 77 | 0.0% |
| Sierra Leonean | 12 | 0.0% |
| Sioux | 23 | 0.0% |
| Slovak | 146 | 0.1% |
| Slovene | 49 | 0.0% |
| Somali | 5 | 0.0% |
| South African | 58 | 0.0% |
| South American | 1,094 | 0.6% |
| Spaniard | 62 | 0.0% |
| Spanish | 144 | 0.1% |
| Sri Lankan | 725 | 0.4% |
| Subsaharan African | 2,667 | 1.5% |
| Sudanese | 289 | 0.2% |
| Swedish | 794 | 0.4% |
| Swiss | 507 | 0.3% |
| Syrian | 129 | 0.1% |
| Thai | 1,408 | 0.8% |
| Turkish | 20 | 0.0% |
| Ukrainian | 355 | 0.2% |
| Uruguayan | 30 | 0.0% |
| Ute | 30 | 0.0% |
| Venezuelan | 311 | 0.2% |
| Welsh | 1,123 | 0.6% |
| West Indian | 26 | 0.0% |
| Yugoslavian | 58 | 0.0% | View All 128 Rows |
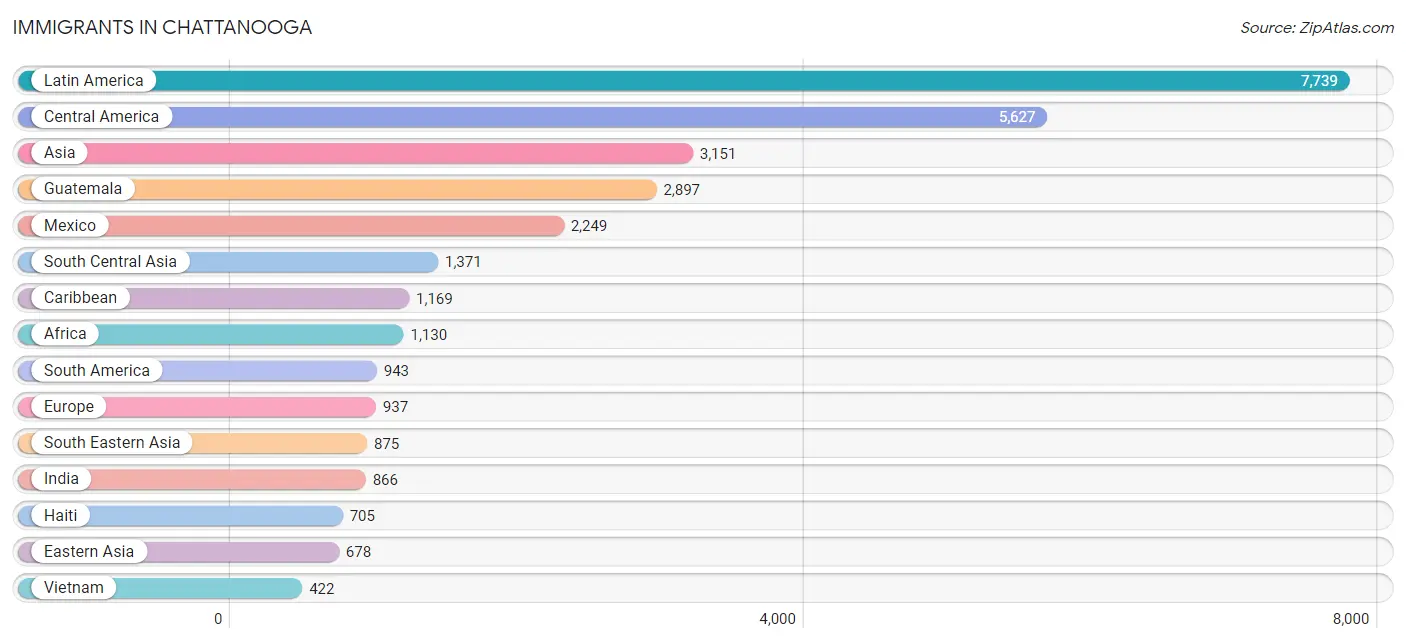
Immigrants in Chattanooga
The most numerous immigrant groups reported in Chattanooga came from Latin America (7,739 | 4.3%), Central America (5,627 | 3.1%), Asia (3,151 | 1.7%), Guatemala (2,897 | 1.6%), and Mexico (2,249 | 1.2%), together accounting for 11.9% of all Chattanooga residents.
| Immigration Origin | # Population | % Population |
| Africa | 1,130 | 0.6% |
| Argentina | 12 | 0.0% |
| Asia | 3,151 | 1.7% |
| Australia | 5 | 0.0% |
| Bahamas | 25 | 0.0% |
| Barbados | 16 | 0.0% |
| Bosnia and Herzegovina | 43 | 0.0% |
| Brazil | 323 | 0.2% |
| Bulgaria | 31 | 0.0% |
| Cambodia | 82 | 0.1% |
| Canada | 272 | 0.2% |
| Caribbean | 1,169 | 0.6% |
| Central America | 5,627 | 3.1% |
| Chile | 83 | 0.1% |
| China | 262 | 0.1% |
| Colombia | 74 | 0.0% |
| Croatia | 11 | 0.0% |
| Cuba | 124 | 0.1% |
| Czechoslovakia | 21 | 0.0% |
| Dominica | 10 | 0.0% |
| Dominican Republic | 68 | 0.0% |
| Eastern Africa | 232 | 0.1% |
| Eastern Asia | 678 | 0.4% |
| Eastern Europe | 282 | 0.2% |
| Ecuador | 148 | 0.1% |
| Egypt | 89 | 0.1% |
| El Salvador | 218 | 0.1% |
| England | 100 | 0.1% |
| Ethiopia | 91 | 0.1% |
| Europe | 937 | 0.5% |
| France | 65 | 0.0% |
| Germany | 299 | 0.2% |
| Greece | 10 | 0.0% |
| Guatemala | 2,897 | 1.6% |
| Guyana | 25 | 0.0% |
| Haiti | 705 | 0.4% |
| Honduras | 263 | 0.2% |
| India | 866 | 0.5% |
| Indonesia | 13 | 0.0% |
| Iran | 101 | 0.1% |
| Iraq | 104 | 0.1% |
| Ireland | 3 | 0.0% |
| Italy | 54 | 0.0% |
| Jamaica | 166 | 0.1% |
| Japan | 111 | 0.1% |
| Jordan | 8 | 0.0% |
| Kenya | 76 | 0.0% |
| Korea | 305 | 0.2% |
| Latin America | 7,739 | 4.3% |
| Malaysia | 13 | 0.0% |
| Mexico | 2,249 | 1.2% |
| Nepal | 12 | 0.0% |
| Netherlands | 4 | 0.0% |
| Northern Africa | 240 | 0.1% |
| Northern Europe | 194 | 0.1% |
| Oceania | 18 | 0.0% |
| Pakistan | 392 | 0.2% |
| Peru | 7 | 0.0% |
| Philippines | 314 | 0.2% |
| Poland | 24 | 0.0% |
| Romania | 60 | 0.0% |
| Russia | 25 | 0.0% |
| South Africa | 98 | 0.1% |
| South America | 943 | 0.5% |
| South Central Asia | 1,371 | 0.8% |
| South Eastern Asia | 875 | 0.5% |
| Southern Europe | 93 | 0.1% |
| Sudan | 151 | 0.1% |
| Syria | 95 | 0.1% |
| Taiwan | 51 | 0.0% |
| Thailand | 25 | 0.0% |
| Turkey | 11 | 0.0% |
| Ukraine | 67 | 0.0% |
| Uruguay | 3 | 0.0% |
| Venezuela | 268 | 0.2% |
| Vietnam | 422 | 0.2% |
| Western Africa | 150 | 0.1% |
| Western Asia | 218 | 0.1% |
| Western Europe | 368 | 0.2% |
| Zimbabwe | 12 | 0.0% | View All 80 Rows |
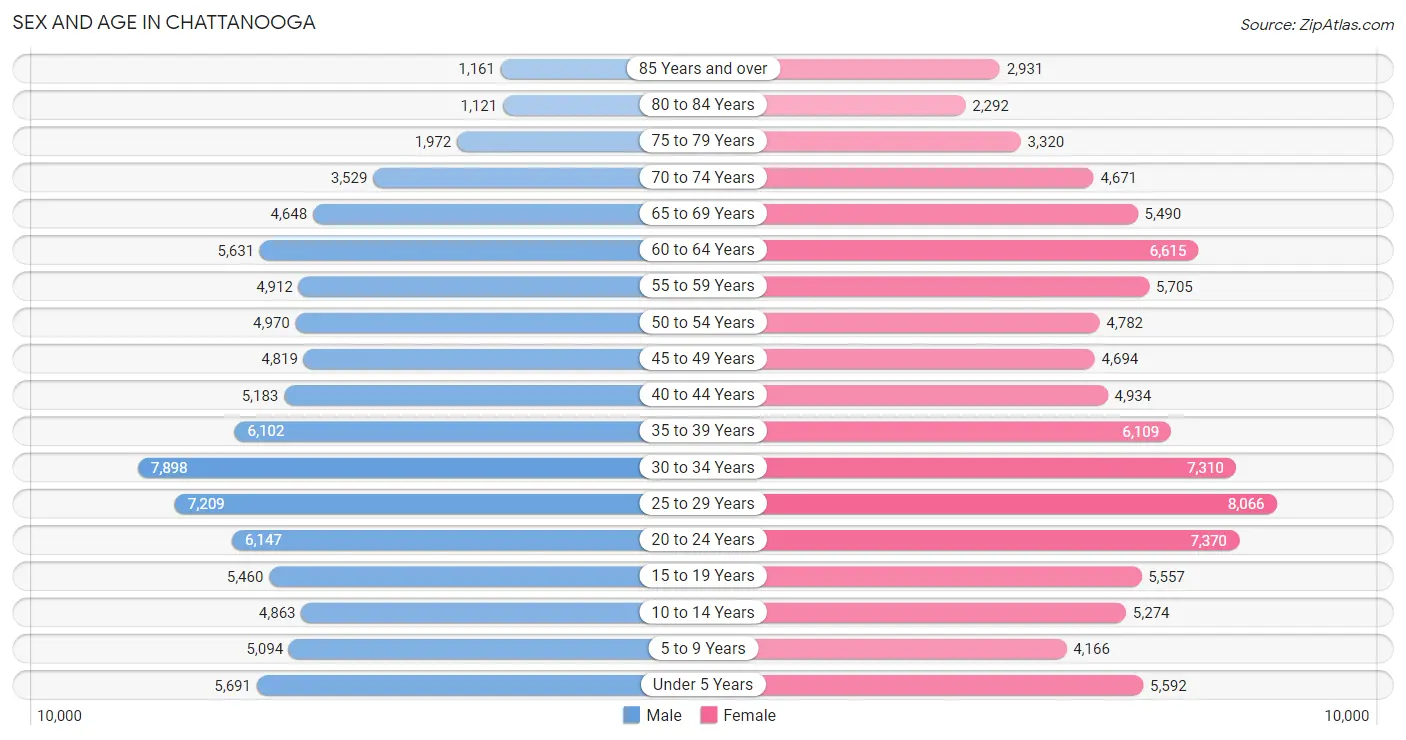
Sex and Age in Chattanooga
Sex and Age in Chattanooga
The most populous age groups in Chattanooga are 30 to 34 Years (7,898 | 9.1%) for men and 25 to 29 Years (8,066 | 8.5%) for women.
| Age Bracket | Male | Female |
| Under 5 Years | 5,691 (6.6%) | 5,592 (5.9%) |
| 5 to 9 Years | 5,094 (5.9%) | 4,166 (4.4%) |
| 10 to 14 Years | 4,863 (5.6%) | 5,274 (5.6%) |
| 15 to 19 Years | 5,460 (6.3%) | 5,557 (5.9%) |
| 20 to 24 Years | 6,147 (7.1%) | 7,370 (7.8%) |
| 25 to 29 Years | 7,209 (8.3%) | 8,066 (8.5%) |
| 30 to 34 Years | 7,898 (9.1%) | 7,310 (7.7%) |
| 35 to 39 Years | 6,102 (7.1%) | 6,109 (6.4%) |
| 40 to 44 Years | 5,183 (6.0%) | 4,934 (5.2%) |
| 45 to 49 Years | 4,819 (5.6%) | 4,694 (5.0%) |
| 50 to 54 Years | 4,970 (5.8%) | 4,782 (5.0%) |
| 55 to 59 Years | 4,912 (5.7%) | 5,705 (6.0%) |
| 60 to 64 Years | 5,631 (6.5%) | 6,615 (7.0%) |
| 65 to 69 Years | 4,648 (5.4%) | 5,490 (5.8%) |
| 70 to 74 Years | 3,529 (4.1%) | 4,671 (4.9%) |
| 75 to 79 Years | 1,972 (2.3%) | 3,320 (3.5%) |
| 80 to 84 Years | 1,121 (1.3%) | 2,292 (2.4%) |
| 85 Years and over | 1,161 (1.3%) | 2,931 (3.1%) |
| Total | 86,410 (100.0%) | 94,878 (100.0%) |
Families and Households in Chattanooga
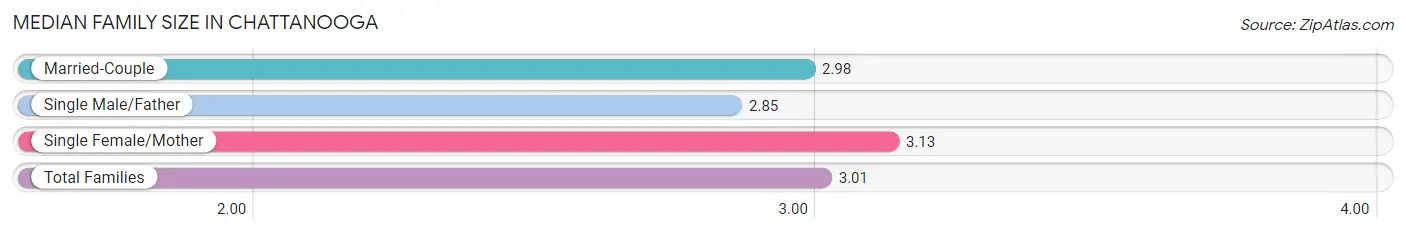
Median Family Size in Chattanooga
The median family size in Chattanooga is 3.01 persons per family, with single female/mother families (10,959 | 26.4%) accounting for the largest median family size of 3.13 persons per family. On the other hand, single male/father families (3,972 | 9.6%) represent the smallest median family size with 2.85 persons per family.
| Family Type | # Families | Family Size |
| Married-Couple | 26,578 (64.0%) | 2.98 |
| Single Male/Father | 3,972 (9.6%) | 2.85 |
| Single Female/Mother | 10,959 (26.4%) | 3.13 |
| Total Families | 41,509 (100.0%) | 3.01 |
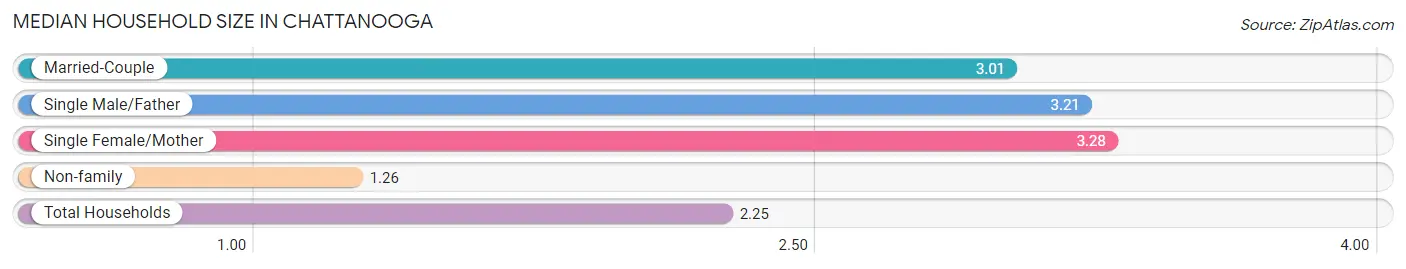
Median Household Size in Chattanooga
The median household size in Chattanooga is 2.25 persons per household, with single female/mother households (10,959 | 14.2%) accounting for the largest median household size of 3.28 persons per household. non-family households (35,507 | 46.1%) represent the smallest median household size with 1.26 persons per household.
| Household Type | # Households | Household Size |
| Married-Couple | 26,578 (34.5%) | 3.01 |
| Single Male/Father | 3,972 (5.2%) | 3.21 |
| Single Female/Mother | 10,959 (14.2%) | 3.28 |
| Non-family | 35,507 (46.1%) | 1.26 |
| Total Households | 77,016 (100.0%) | 2.25 |
Household Size by Marriage Status in Chattanooga
Out of a total of 77,016 households in Chattanooga, 41,509 (53.9%) are family households, while 35,507 (46.1%) are nonfamily households. The most numerous type of family households are 2-person households, comprising 20,791, and the most common type of nonfamily households are 1-person households, comprising 28,734.
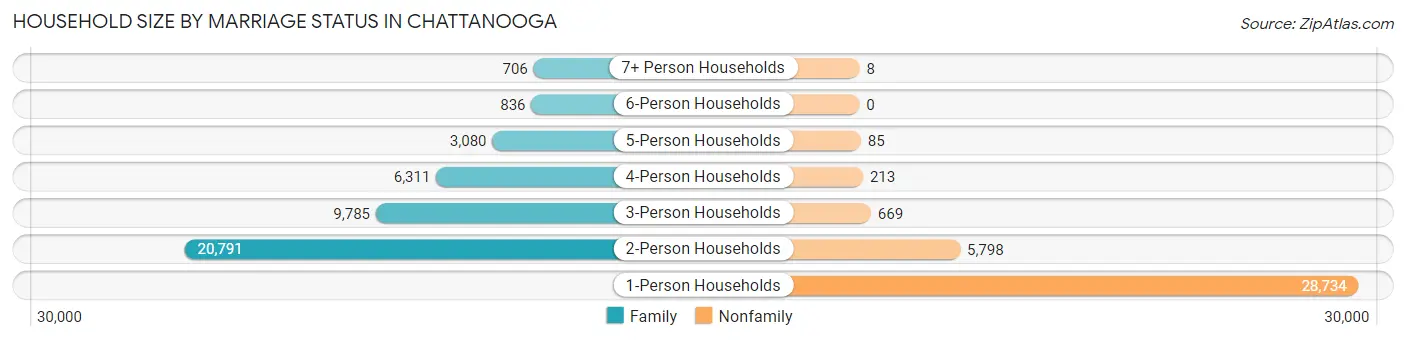
| Household Size | Family Households | Nonfamily Households |
| 1-Person Households | - | 28,734 (37.3%) |
| 2-Person Households | 20,791 (27.0%) | 5,798 (7.5%) |
| 3-Person Households | 9,785 (12.7%) | 669 (0.9%) |
| 4-Person Households | 6,311 (8.2%) | 213 (0.3%) |
| 5-Person Households | 3,080 (4.0%) | 85 (0.1%) |
| 6-Person Households | 836 (1.1%) | 0 (0.0%) |
| 7+ Person Households | 706 (0.9%) | 8 (0.0%) |
| Total | 41,509 (53.9%) | 35,507 (46.1%) |
Female Fertility in Chattanooga
Fertility by Age in Chattanooga
Average fertility rate in Chattanooga is 60.0 births per 1,000 women. Women in the age bracket of 20 to 34 years have the highest fertility rate with 91.0 births per 1,000 women. Women in the age bracket of 20 to 34 years acount for 76.7% of all women with births.
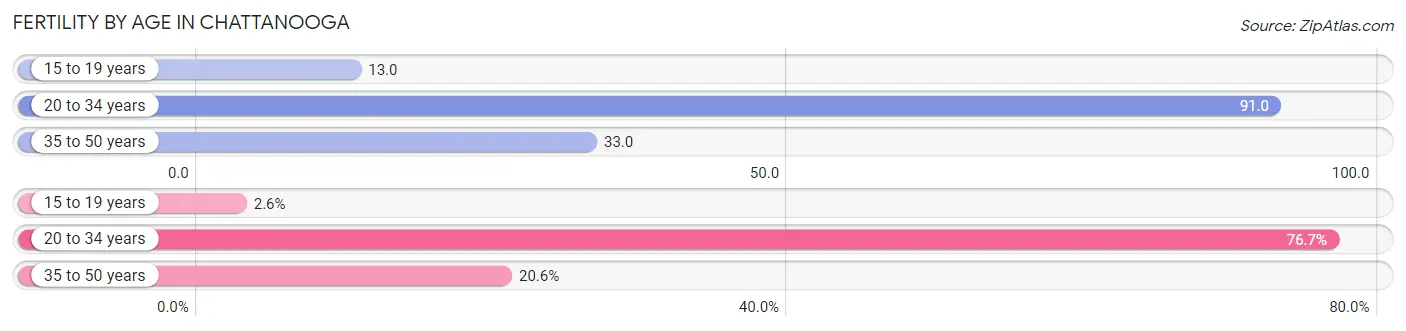
| Age Bracket | Women with Births | Births / 1,000 Women |
| 15 to 19 years | 71 (2.6%) | 13.0 |
| 20 to 34 years | 2,072 (76.7%) | 91.0 |
| 35 to 50 years | 557 (20.6%) | 33.0 |
| Total | 2,700 (100.0%) | 60.0 |
Fertility by Age by Marriage Status in Chattanooga
59.4% of women with births (2,700) in Chattanooga are married. The highest percentage of unmarried women with births falls into 15 to 19 years age bracket with 70.4% of them unmarried at the time of birth, while the lowest percentage of unmarried women with births belong to 35 to 50 years age bracket with 23.0% of them unmarried.
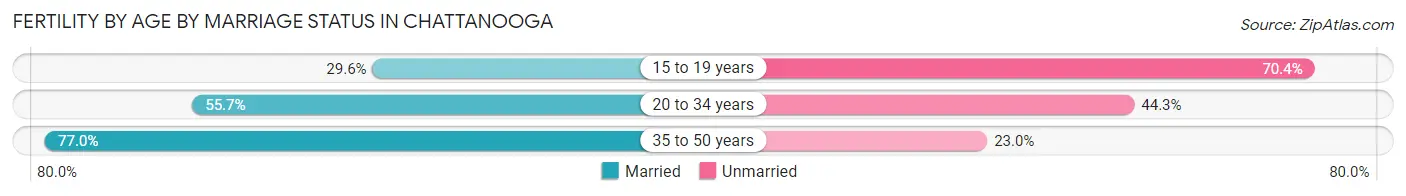
| Age Bracket | Married | Unmarried |
| 15 to 19 years | 21 (29.6%) | 50 (70.4%) |
| 20 to 34 years | 1,154 (55.7%) | 918 (44.3%) |
| 35 to 50 years | 429 (77.0%) | 128 (23.0%) |
| Total | 1,604 (59.4%) | 1,096 (40.6%) |
Fertility by Education in Chattanooga
Average fertility rate in Chattanooga is 60.0 births per 1,000 women. Women with the education attainment of graduate degree have the highest fertility rate of 88.0 births per 1,000 women, while women with the education attainment of less than high school have the lowest fertility at 28.0 births per 1,000 women. Women with the education attainment of college or associate's degree represent 29.0% of all women with births.
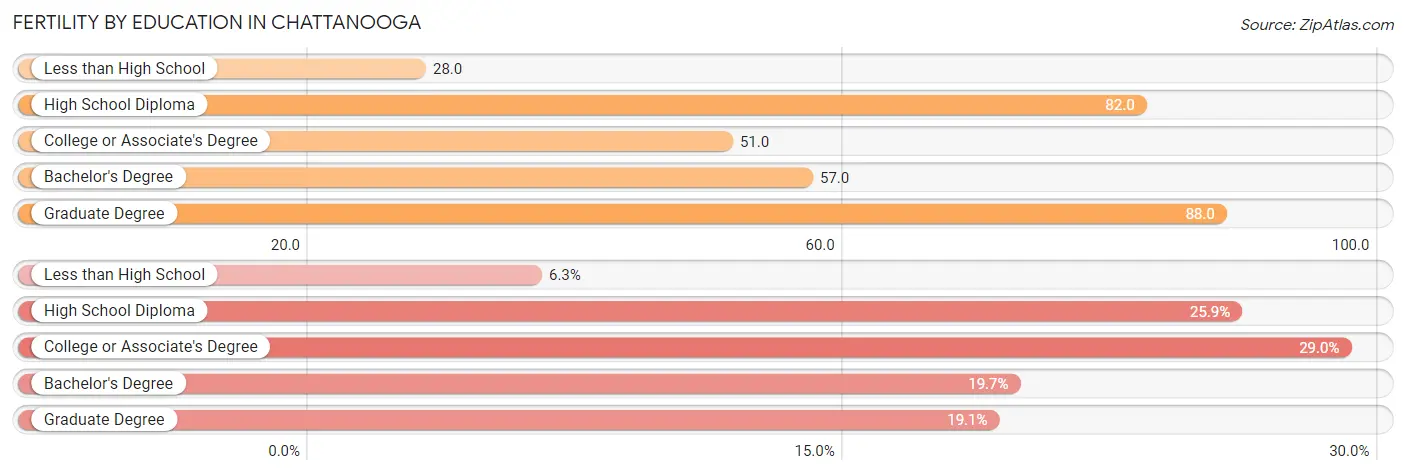
| Educational Attainment | Women with Births | Births / 1,000 Women |
| Less than High School | 169 (6.3%) | 28.0 |
| High School Diploma | 700 (25.9%) | 82.0 |
| College or Associate's Degree | 783 (29.0%) | 51.0 |
| Bachelor's Degree | 532 (19.7%) | 57.0 |
| Graduate Degree | 516 (19.1%) | 88.0 |
| Total | 2,700 (100.0%) | 60.0 |
Fertility by Education by Marriage Status in Chattanooga
40.6% of women with births in Chattanooga are unmarried. Women with the educational attainment of bachelor's degree are most likely to be married with 94.7% of them married at childbirth, while women with the educational attainment of high school diploma are least likely to be married with 69.7% of them unmarried at childbirth.
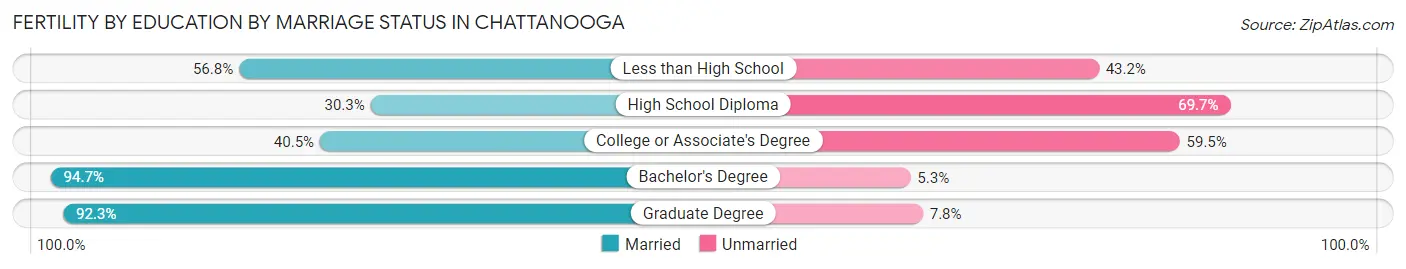
| Educational Attainment | Married | Unmarried |
| Less than High School | 96 (56.8%) | 73 (43.2%) |
| High School Diploma | 212 (30.3%) | 488 (69.7%) |
| College or Associate's Degree | 317 (40.5%) | 466 (59.5%) |
| Bachelor's Degree | 504 (94.7%) | 28 (5.3%) |
| Graduate Degree | 476 (92.2%) | 40 (7.7%) |
| Total | 1,604 (59.4%) | 1,096 (40.6%) |
Employment Characteristics in Chattanooga
Employment by Class of Employer in Chattanooga
Among the 88,422 employed individuals in Chattanooga, private company employees (62,574 | 70.8%), not-for-profit organizations (8,471 | 9.6%), and local government employees (4,857 | 5.5%) make up the most common classes of employment.
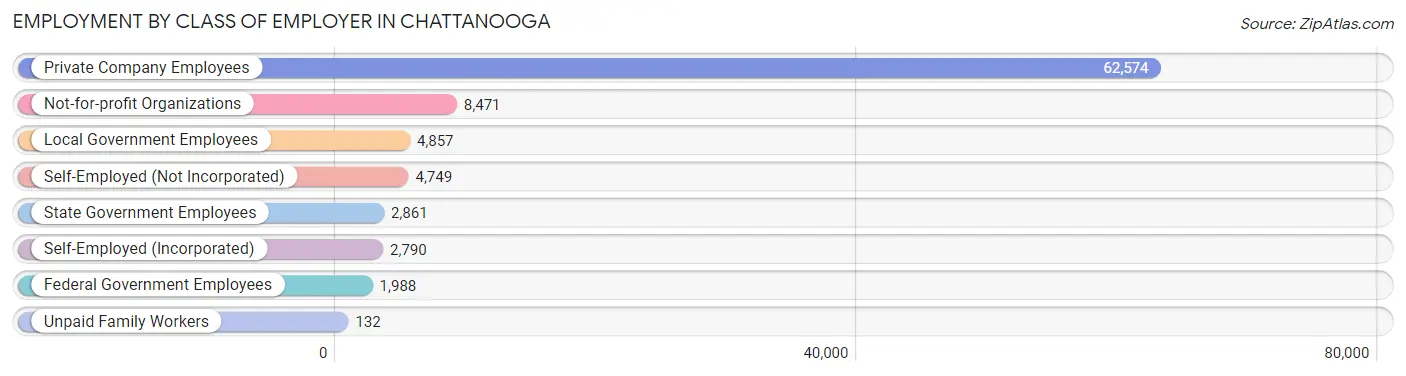
| Employer Class | # Employees | % Employees |
| Private Company Employees | 62,574 | 70.8% |
| Self-Employed (Incorporated) | 2,790 | 3.2% |
| Self-Employed (Not Incorporated) | 4,749 | 5.4% |
| Not-for-profit Organizations | 8,471 | 9.6% |
| Local Government Employees | 4,857 | 5.5% |
| State Government Employees | 2,861 | 3.2% |
| Federal Government Employees | 1,988 | 2.2% |
| Unpaid Family Workers | 132 | 0.2% |
| Total | 88,422 | 100.0% |
Employment Status by Age in Chattanooga
According to the labor force statistics for Chattanooga, out of the total population over 16 years of age (148,670), 64.0% or 95,149 individuals are in the labor force, with 5.1% or 4,853 of them unemployed. The age group with the highest labor force participation rate is 30 to 34 years, with 87.1% or 13,246 individuals in the labor force. Within the labor force, the 16 to 19 years age range has the highest percentage of unemployed individuals, with 14.7% or 570 of them being unemployed.
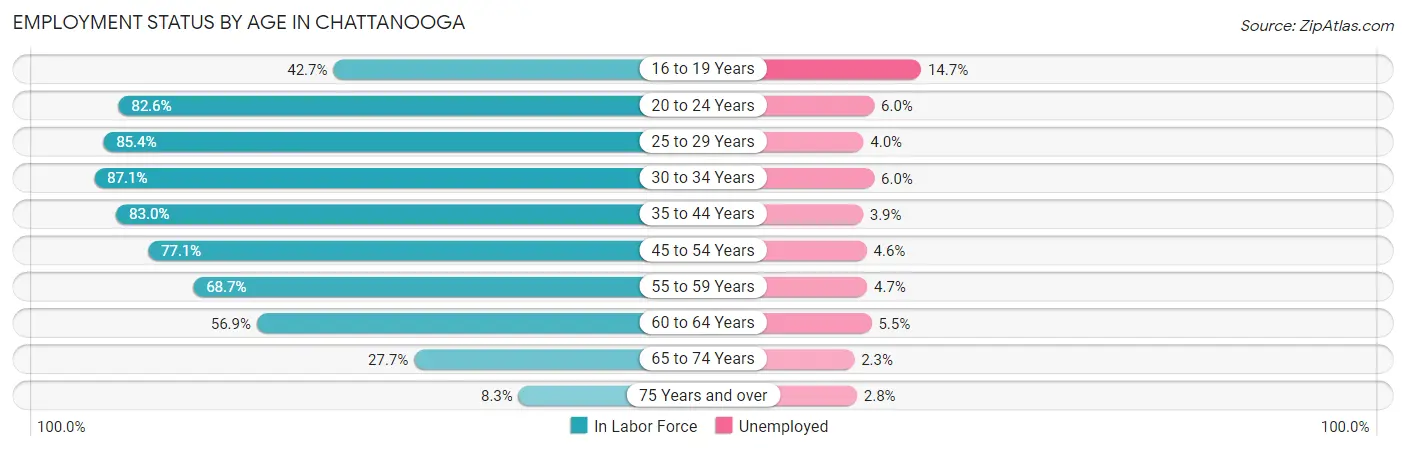
| Age Bracket | In Labor Force | Unemployed |
| 16 to 19 Years | 3,877 (42.7%) | 570 (14.7%) |
| 20 to 24 Years | 11,165 (82.6%) | 670 (6.0%) |
| 25 to 29 Years | 13,045 (85.4%) | 522 (4.0%) |
| 30 to 34 Years | 13,246 (87.1%) | 795 (6.0%) |
| 35 to 44 Years | 18,532 (83.0%) | 723 (3.9%) |
| 45 to 54 Years | 14,853 (77.1%) | 683 (4.6%) |
| 55 to 59 Years | 7,294 (68.7%) | 343 (4.7%) |
| 60 to 64 Years | 6,968 (56.9%) | 383 (5.5%) |
| 65 to 74 Years | 5,080 (27.7%) | 117 (2.3%) |
| 75 Years and over | 1,062 (8.3%) | 30 (2.8%) |
| Total | 95,149 (64.0%) | 4,853 (5.1%) |
Employment Status by Educational Attainment in Chattanooga
According to labor force statistics for Chattanooga, 77.9% of individuals (73,957) out of the total population between 25 and 64 years of age (94,939) are in the labor force, with 4.7% or 3,476 of them being unemployed. The group with the highest labor force participation rate are those with the educational attainment of bachelor's degree or higher, with 89.1% or 30,233 individuals in the labor force. Within the labor force, individuals with less than high school education have the highest percentage of unemployment, with 9.2% or 461 of them being unemployed.
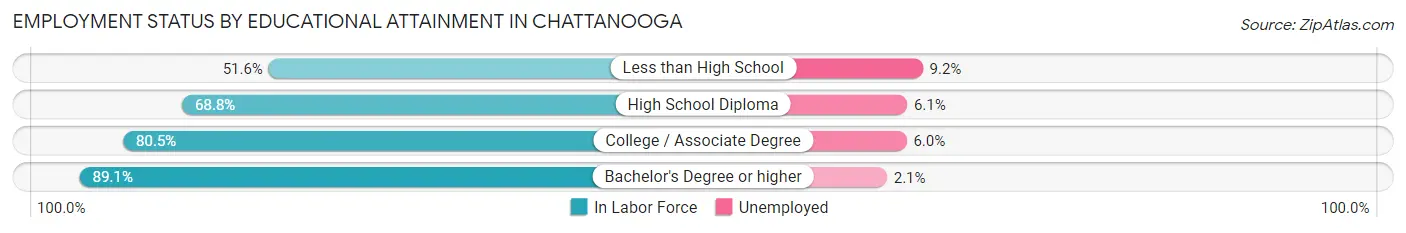
| Educational Attainment | In Labor Force | Unemployed |
| Less than High School | 5,008 (51.6%) | 893 (9.2%) |
| High School Diploma | 15,290 (68.8%) | 1,356 (6.1%) |
| College / Associate Degree | 23,408 (80.5%) | 1,745 (6.0%) |
| Bachelor's Degree or higher | 30,233 (89.1%) | 713 (2.1%) |
| Total | 73,957 (77.9%) | 4,462 (4.7%) |
Employment Occupations by Sex in Chattanooga
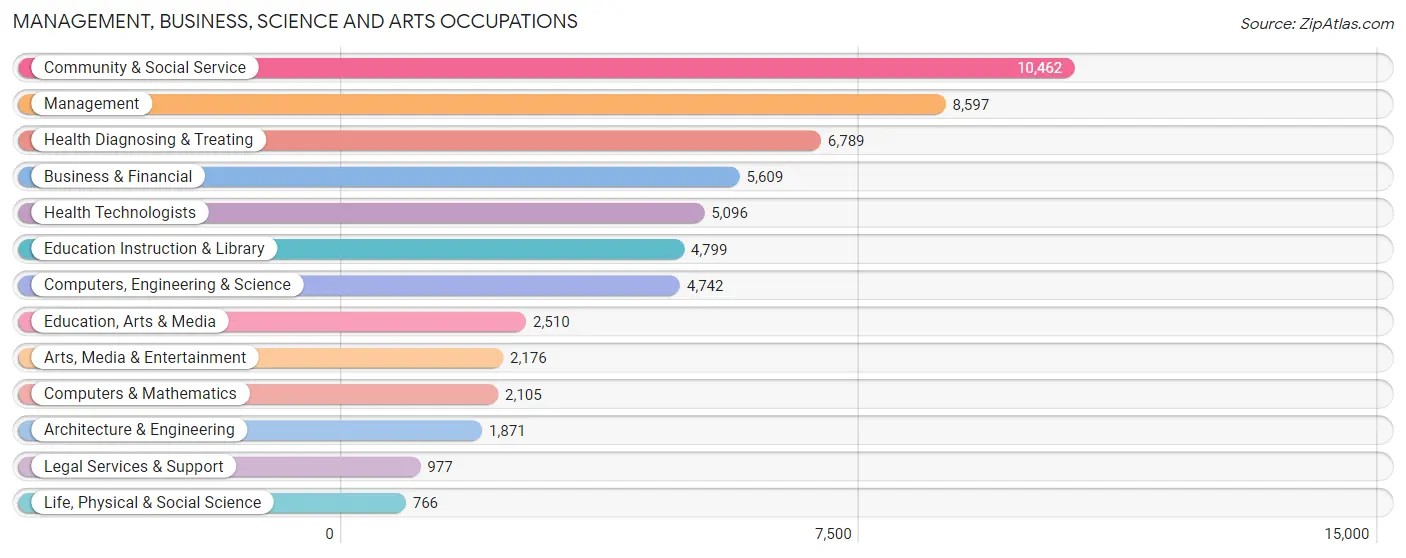
Management, Business, Science and Arts Occupations
The most common Management, Business, Science and Arts occupations in Chattanooga are Community & Social Service (10,462 | 11.6%), Management (8,597 | 9.5%), Health Diagnosing & Treating (6,789 | 7.5%), Business & Financial (5,609 | 6.2%), and Health Technologists (5,096 | 5.7%).
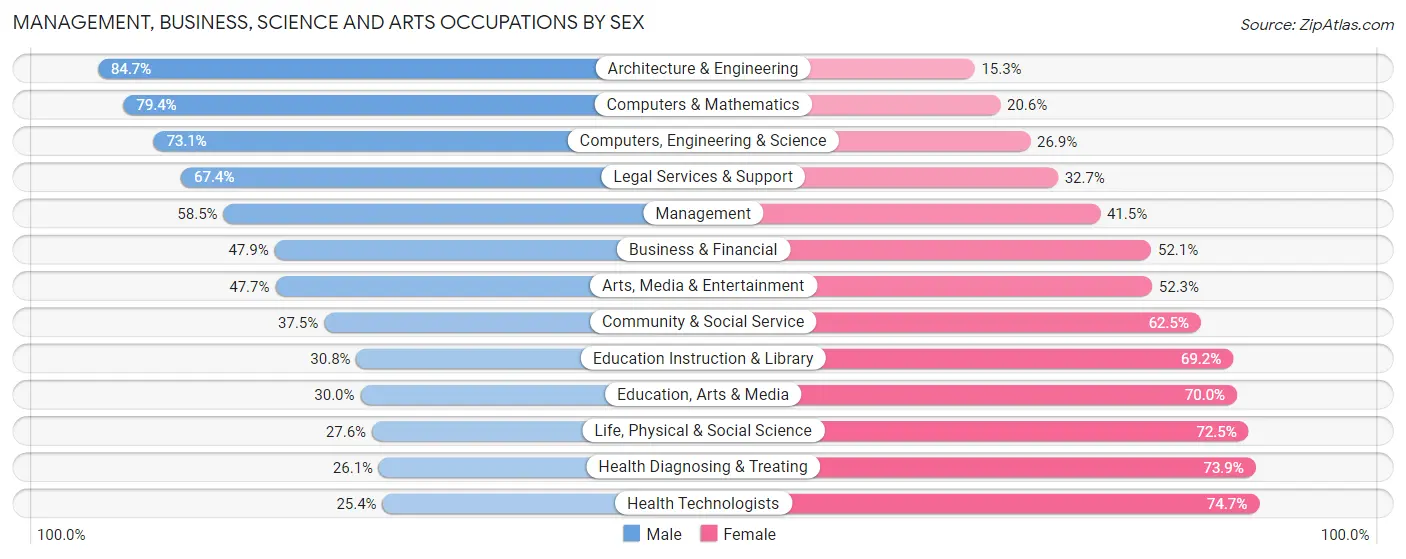
Management, Business, Science and Arts Occupations by Sex
Within the Management, Business, Science and Arts occupations in Chattanooga, the most male-oriented occupations are Architecture & Engineering (84.7%), Computers & Mathematics (79.4%), and Computers, Engineering & Science (73.1%), while the most female-oriented occupations are Health Technologists (74.7%), Health Diagnosing & Treating (73.9%), and Life, Physical & Social Science (72.5%).
| Occupation | Male | Female |
| Management | 5,032 (58.5%) | 3,565 (41.5%) |
| Business & Financial | 2,685 (47.9%) | 2,924 (52.1%) |
| Computers, Engineering & Science | 3,467 (73.1%) | 1,275 (26.9%) |
| Computers & Mathematics | 1,671 (79.4%) | 434 (20.6%) |
| Architecture & Engineering | 1,585 (84.7%) | 286 (15.3%) |
| Life, Physical & Social Science | 211 (27.6%) | 555 (72.5%) |
| Community & Social Service | 3,925 (37.5%) | 6,537 (62.5%) |
| Education, Arts & Media | 752 (30.0%) | 1,758 (70.0%) |
| Legal Services & Support | 658 (67.3%) | 319 (32.7%) |
| Education Instruction & Library | 1,477 (30.8%) | 3,322 (69.2%) |
| Arts, Media & Entertainment | 1,038 (47.7%) | 1,138 (52.3%) |
| Health Diagnosing & Treating | 1,771 (26.1%) | 5,018 (73.9%) |
| Health Technologists | 1,292 (25.4%) | 3,804 (74.7%) |
| Total (Category) | 16,880 (46.6%) | 19,319 (53.4%) |
| Total (Overall) | 46,274 (51.3%) | 43,892 (48.7%) |
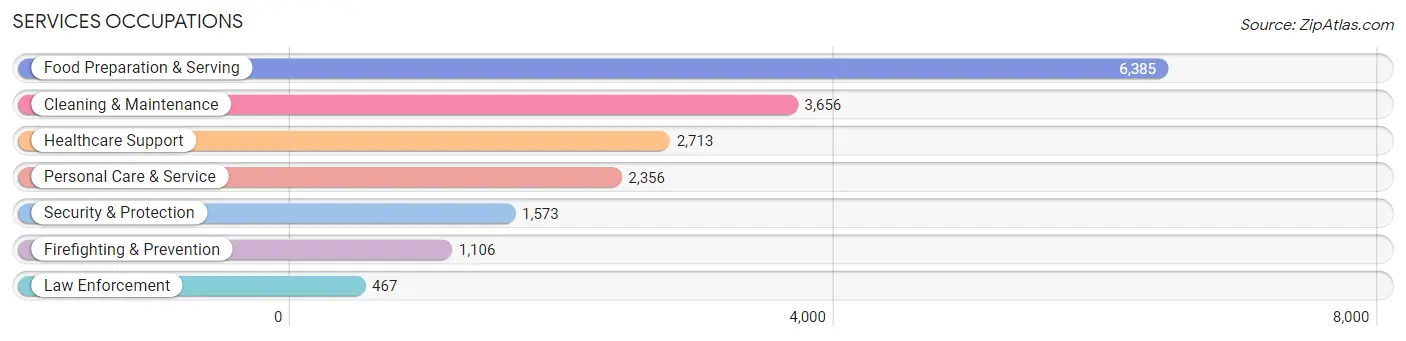
Services Occupations
The most common Services occupations in Chattanooga are Food Preparation & Serving (6,385 | 7.1%), Cleaning & Maintenance (3,656 | 4.1%), Healthcare Support (2,713 | 3.0%), Personal Care & Service (2,356 | 2.6%), and Security & Protection (1,573 | 1.7%).
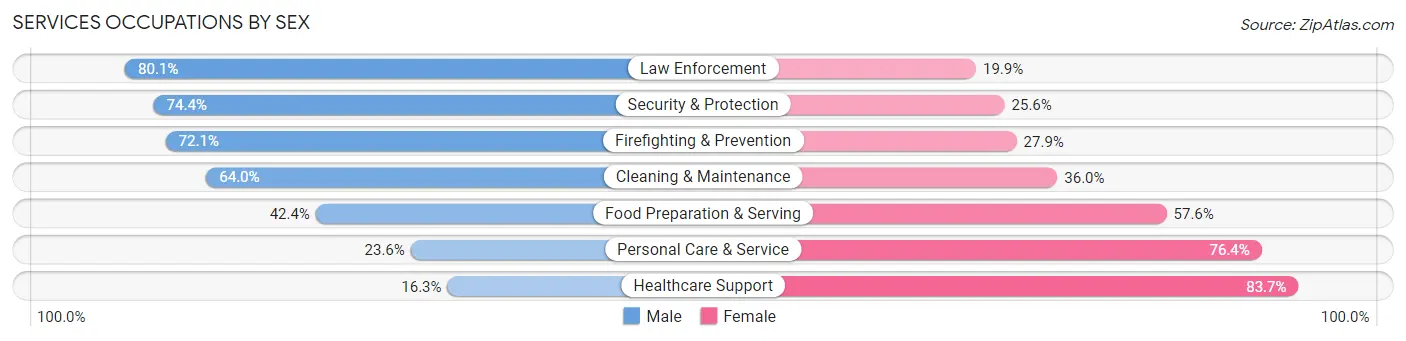
Services Occupations by Sex
Within the Services occupations in Chattanooga, the most male-oriented occupations are Law Enforcement (80.1%), Security & Protection (74.4%), and Firefighting & Prevention (72.1%), while the most female-oriented occupations are Healthcare Support (83.7%), Personal Care & Service (76.4%), and Food Preparation & Serving (57.6%).
| Occupation | Male | Female |
| Healthcare Support | 442 (16.3%) | 2,271 (83.7%) |
| Security & Protection | 1,171 (74.4%) | 402 (25.6%) |
| Firefighting & Prevention | 797 (72.1%) | 309 (27.9%) |
| Law Enforcement | 374 (80.1%) | 93 (19.9%) |
| Food Preparation & Serving | 2,705 (42.4%) | 3,680 (57.6%) |
| Cleaning & Maintenance | 2,340 (64.0%) | 1,316 (36.0%) |
| Personal Care & Service | 555 (23.6%) | 1,801 (76.4%) |
| Total (Category) | 7,213 (43.2%) | 9,470 (56.8%) |
| Total (Overall) | 46,274 (51.3%) | 43,892 (48.7%) |
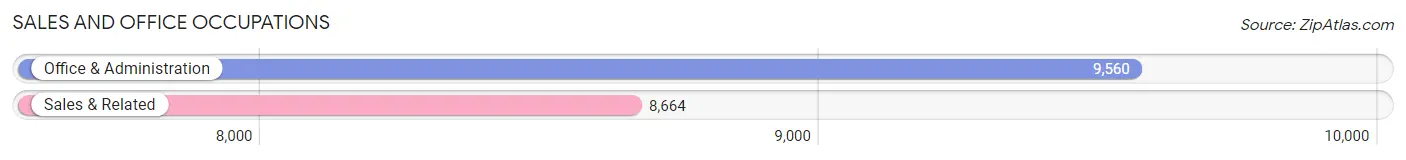
Sales and Office Occupations
The most common Sales and Office occupations in Chattanooga are Office & Administration (9,560 | 10.6%), and Sales & Related (8,664 | 9.6%).
Sales and Office Occupations by Sex
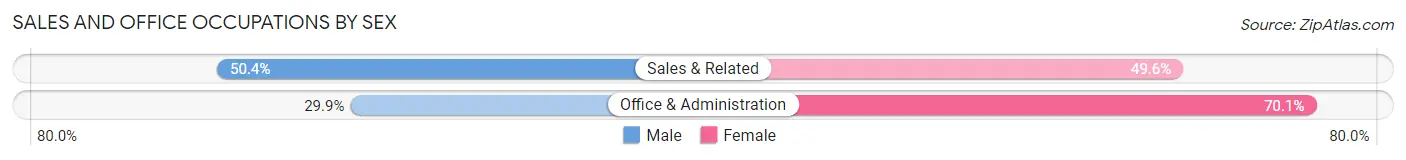
| Occupation | Male | Female |
| Sales & Related | 4,366 (50.4%) | 4,298 (49.6%) |
| Office & Administration | 2,858 (29.9%) | 6,702 (70.1%) |
| Total (Category) | 7,224 (39.6%) | 11,000 (60.4%) |
| Total (Overall) | 46,274 (51.3%) | 43,892 (48.7%) |
Natural Resources, Construction and Maintenance Occupations
The most common Natural Resources, Construction and Maintenance occupations in Chattanooga are Construction & Extraction (3,370 | 3.7%), Installation, Maintenance & Repair (1,544 | 1.7%), and Farming, Fishing & Forestry (201 | 0.2%).

Natural Resources, Construction and Maintenance Occupations by Sex
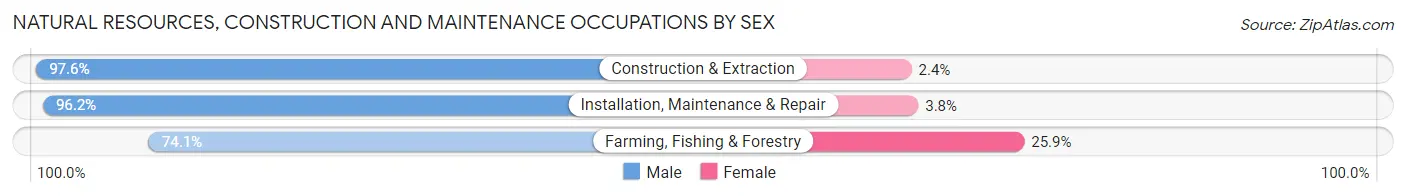
| Occupation | Male | Female |
| Farming, Fishing & Forestry | 149 (74.1%) | 52 (25.9%) |
| Construction & Extraction | 3,288 (97.6%) | 82 (2.4%) |
| Installation, Maintenance & Repair | 1,485 (96.2%) | 59 (3.8%) |
| Total (Category) | 4,922 (96.2%) | 193 (3.8%) |
| Total (Overall) | 46,274 (51.3%) | 43,892 (48.7%) |
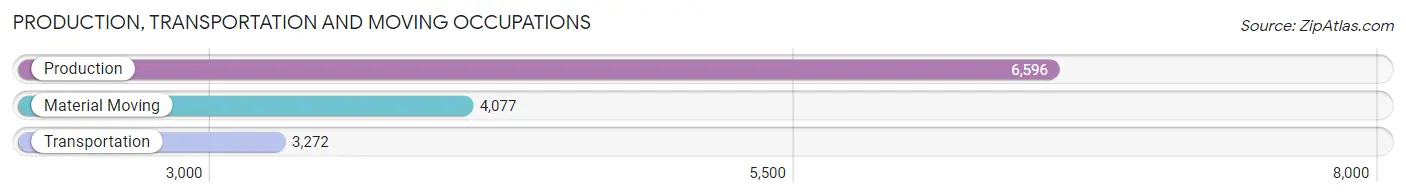
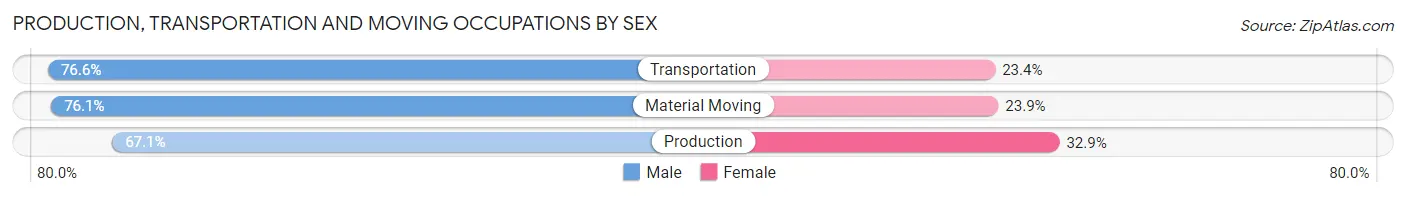
Production, Transportation and Moving Occupations
The most common Production, Transportation and Moving occupations in Chattanooga are Production (6,596 | 7.3%), Material Moving (4,077 | 4.5%), and Transportation (3,272 | 3.6%).
Production, Transportation and Moving Occupations by Sex
| Occupation | Male | Female |
| Production | 4,428 (67.1%) | 2,168 (32.9%) |
| Transportation | 2,505 (76.6%) | 767 (23.4%) |
| Material Moving | 3,102 (76.1%) | 975 (23.9%) |
| Total (Category) | 10,035 (72.0%) | 3,910 (28.0%) |
| Total (Overall) | 46,274 (51.3%) | 43,892 (48.7%) |
Employment Industries by Sex in Chattanooga
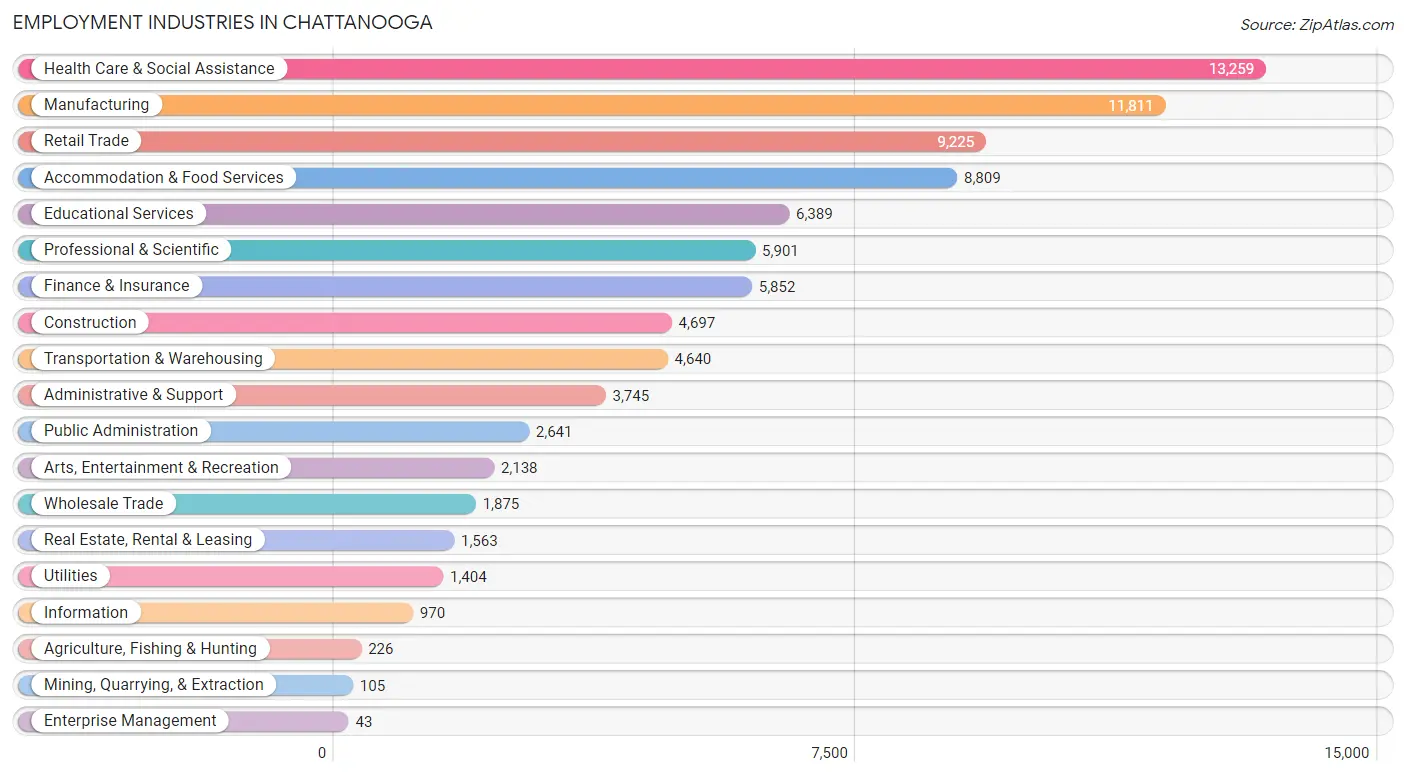
Employment Industries in Chattanooga
The major employment industries in Chattanooga include Health Care & Social Assistance (13,259 | 14.7%), Manufacturing (11,811 | 13.1%), Retail Trade (9,225 | 10.2%), Accommodation & Food Services (8,809 | 9.8%), and Educational Services (6,389 | 7.1%).
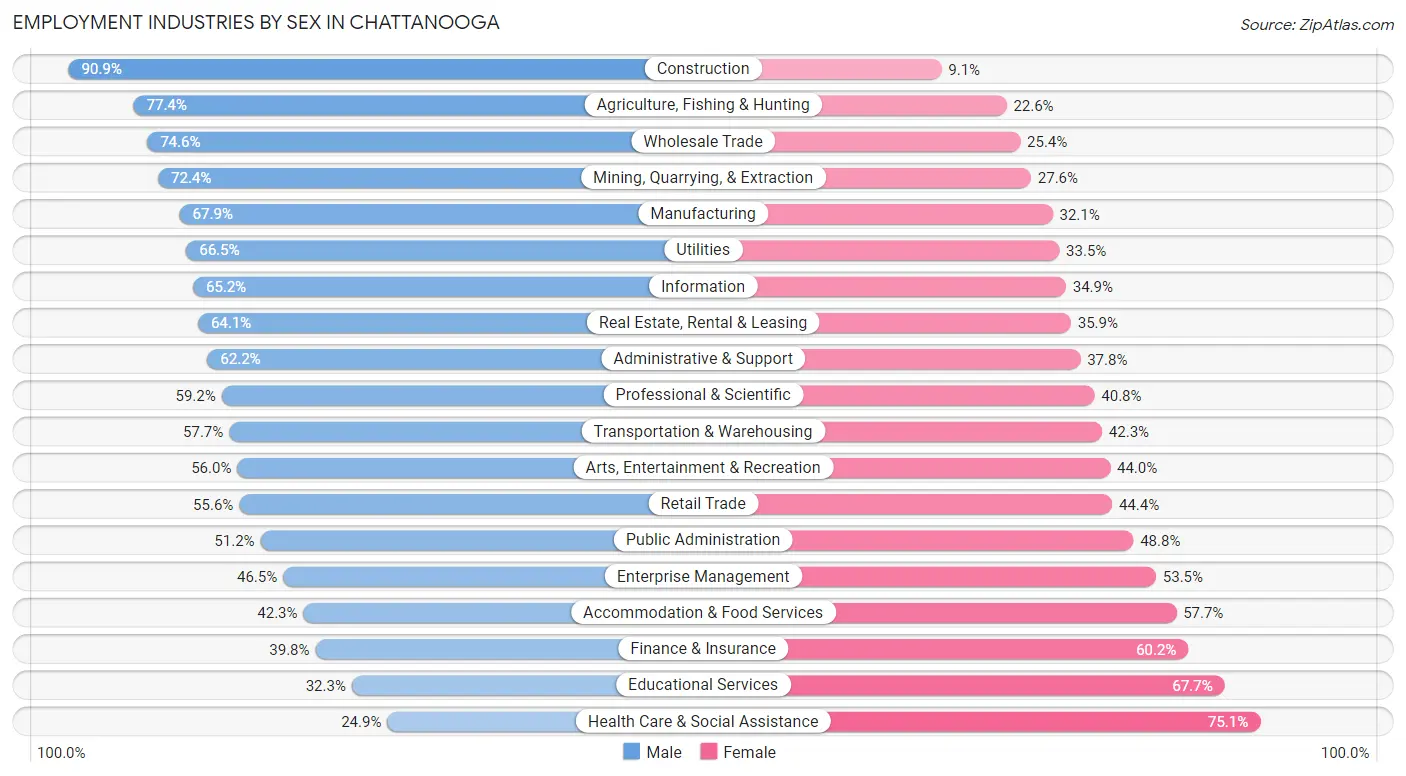
Employment Industries by Sex in Chattanooga
The Chattanooga industries that see more men than women are Construction (90.9%), Agriculture, Fishing & Hunting (77.4%), and Wholesale Trade (74.6%), whereas the industries that tend to have a higher number of women are Health Care & Social Assistance (75.1%), Educational Services (67.7%), and Finance & Insurance (60.2%).
| Industry | Male | Female |
| Agriculture, Fishing & Hunting | 175 (77.4%) | 51 (22.6%) |
| Mining, Quarrying, & Extraction | 76 (72.4%) | 29 (27.6%) |
| Construction | 4,270 (90.9%) | 427 (9.1%) |
| Manufacturing | 8,020 (67.9%) | 3,791 (32.1%) |
| Wholesale Trade | 1,399 (74.6%) | 476 (25.4%) |
| Retail Trade | 5,128 (55.6%) | 4,097 (44.4%) |
| Transportation & Warehousing | 2,676 (57.7%) | 1,964 (42.3%) |
| Utilities | 934 (66.5%) | 470 (33.5%) |
| Information | 632 (65.1%) | 338 (34.8%) |
| Finance & Insurance | 2,330 (39.8%) | 3,522 (60.2%) |
| Real Estate, Rental & Leasing | 1,002 (64.1%) | 561 (35.9%) |
| Professional & Scientific | 3,496 (59.2%) | 2,405 (40.8%) |
| Enterprise Management | 20 (46.5%) | 23 (53.5%) |
| Administrative & Support | 2,328 (62.2%) | 1,417 (37.8%) |
| Educational Services | 2,063 (32.3%) | 4,326 (67.7%) |
| Health Care & Social Assistance | 3,307 (24.9%) | 9,952 (75.1%) |
| Arts, Entertainment & Recreation | 1,197 (56.0%) | 941 (44.0%) |
| Accommodation & Food Services | 3,726 (42.3%) | 5,083 (57.7%) |
| Public Administration | 1,352 (51.2%) | 1,289 (48.8%) |
| Total | 46,274 (51.3%) | 43,892 (48.7%) |
Education in Chattanooga
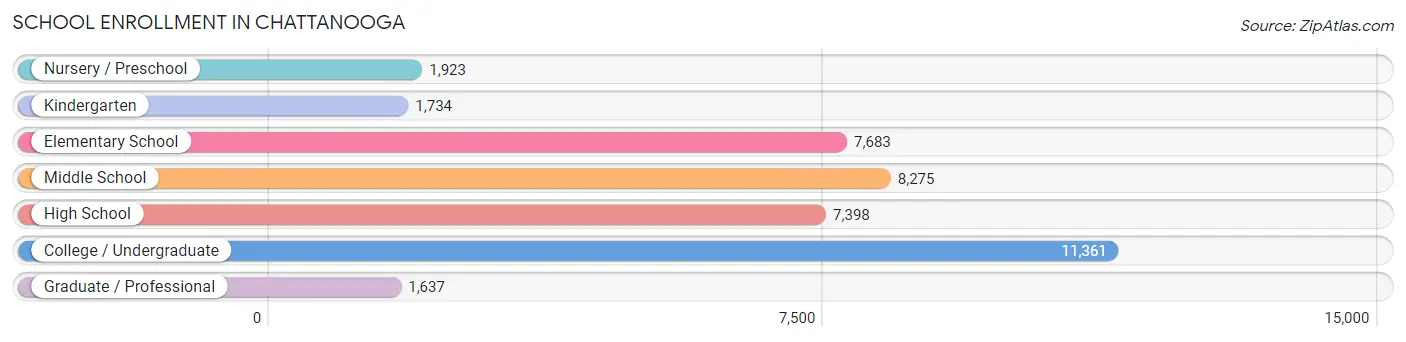
School Enrollment in Chattanooga
The most common levels of schooling among the 40,011 students in Chattanooga are college / undergraduate (11,361 | 28.4%), middle school (8,275 | 20.7%), and elementary school (7,683 | 19.2%).
| School Level | # Students | % Students |
| Nursery / Preschool | 1,923 | 4.8% |
| Kindergarten | 1,734 | 4.3% |
| Elementary School | 7,683 | 19.2% |
| Middle School | 8,275 | 20.7% |
| High School | 7,398 | 18.5% |
| College / Undergraduate | 11,361 | 28.4% |
| Graduate / Professional | 1,637 | 4.1% |
| Total | 40,011 | 100.0% |
School Enrollment by Age by Funding Source in Chattanooga
Out of a total of 40,011 students who are enrolled in schools in Chattanooga, 8,402 (21.0%) attend a private institution, while the remaining 31,609 (79.0%) are enrolled in public schools. The age group of 3 to 4 year olds has the highest likelihood of being enrolled in private schools, with 802 (54.2% in the age bracket) enrolled. Conversely, the age group of 20 to 24 year olds has the lowest likelihood of being enrolled in a private school, with 4,825 (90.9% in the age bracket) attending a public institution.
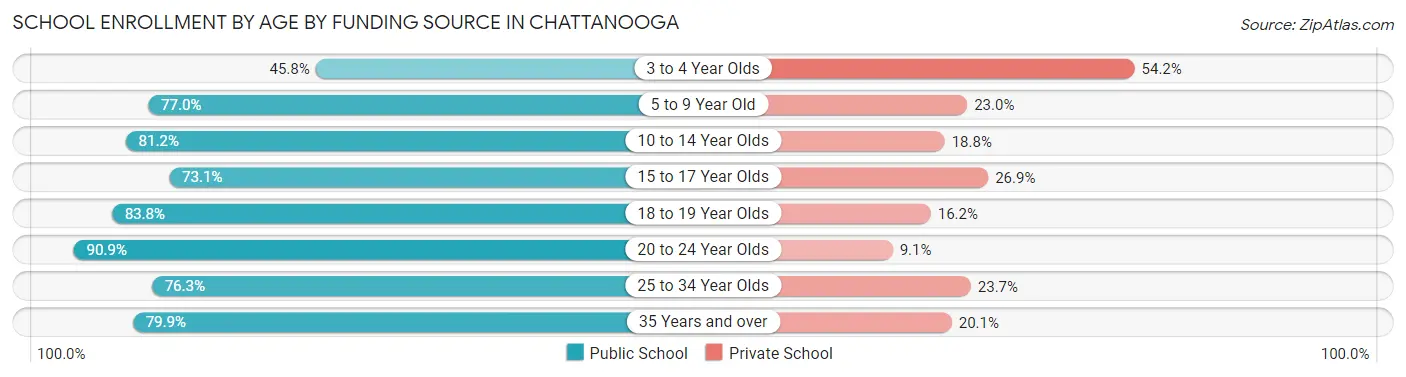
| Age Bracket | Public School | Private School |
| 3 to 4 Year Olds | 678 (45.8%) | 802 (54.2%) |
| 5 to 9 Year Old | 6,790 (77.0%) | 2,030 (23.0%) |
| 10 to 14 Year Olds | 8,116 (81.2%) | 1,882 (18.8%) |
| 15 to 17 Year Olds | 3,923 (73.1%) | 1,446 (26.9%) |
| 18 to 19 Year Olds | 3,545 (83.8%) | 687 (16.2%) |
| 20 to 24 Year Olds | 4,825 (90.9%) | 485 (9.1%) |
| 25 to 34 Year Olds | 2,293 (76.3%) | 712 (23.7%) |
| 35 Years and over | 1,435 (79.9%) | 362 (20.1%) |
| Total | 31,609 (79.0%) | 8,402 (21.0%) |
Educational Attainment by Field of Study in Chattanooga
Business (9,253 | 20.1%), education (5,061 | 11.0%), science & technology (4,819 | 10.5%), engineering (3,607 | 7.8%), and arts & humanities (3,415 | 7.4%) are the most common fields of study among 46,027 individuals in Chattanooga who have obtained a bachelor's degree or higher.
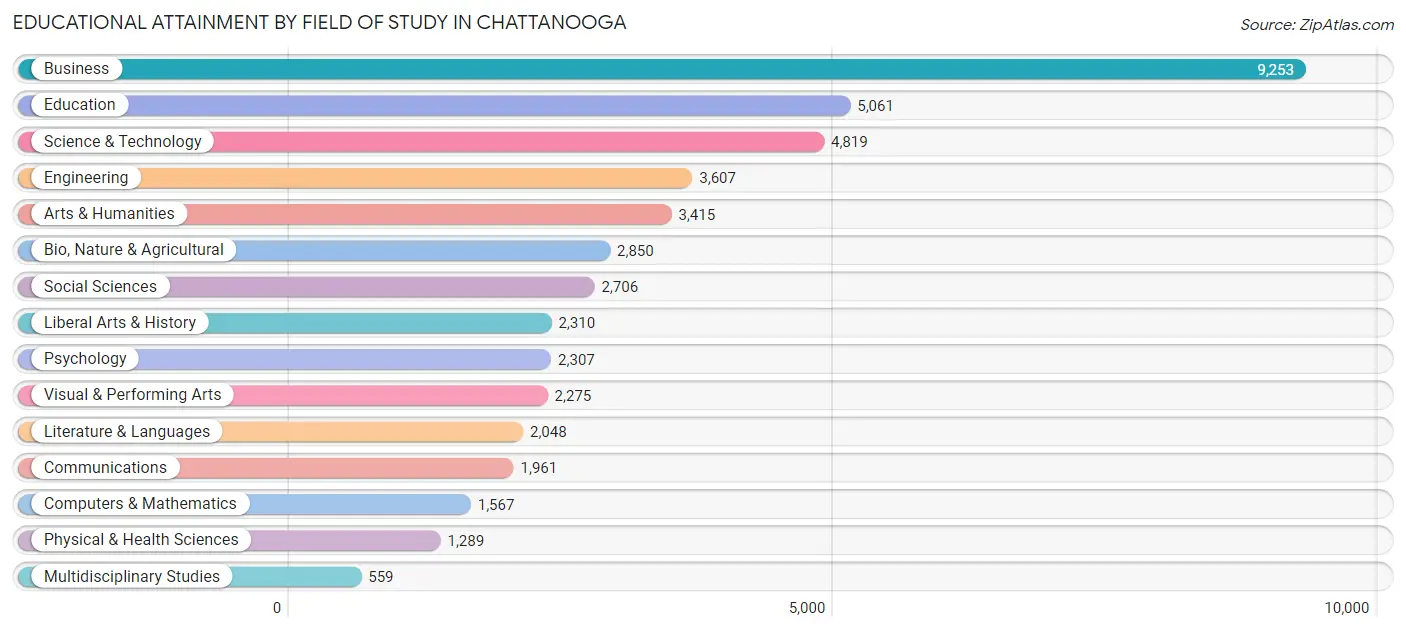
| Field of Study | # Graduates | % Graduates |
| Computers & Mathematics | 1,567 | 3.4% |
| Bio, Nature & Agricultural | 2,850 | 6.2% |
| Physical & Health Sciences | 1,289 | 2.8% |
| Psychology | 2,307 | 5.0% |
| Social Sciences | 2,706 | 5.9% |
| Engineering | 3,607 | 7.8% |
| Multidisciplinary Studies | 559 | 1.2% |
| Science & Technology | 4,819 | 10.5% |
| Business | 9,253 | 20.1% |
| Education | 5,061 | 11.0% |
| Literature & Languages | 2,048 | 4.4% |
| Liberal Arts & History | 2,310 | 5.0% |
| Visual & Performing Arts | 2,275 | 4.9% |
| Communications | 1,961 | 4.3% |
| Arts & Humanities | 3,415 | 7.4% |
| Total | 46,027 | 100.0% |
Transportation & Commute in Chattanooga
Vehicle Availability by Sex in Chattanooga
The most prevalent vehicle ownership categories in Chattanooga are males with 2 vehicles (19,776, accounting for 43.9%) and females with 2 vehicles (16,892, making up 47.6%).
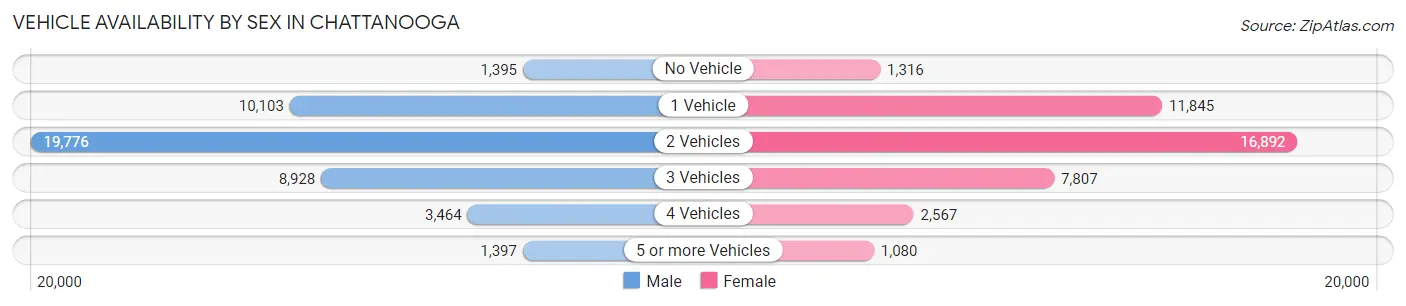
| Vehicles Available | Male | Female |
| No Vehicle | 1,395 (3.1%) | 1,316 (3.2%) |
| 1 Vehicle | 10,103 (22.4%) | 11,845 (28.5%) |
| 2 Vehicles | 19,776 (43.9%) | 16,892 (40.7%) |
| 3 Vehicles | 8,928 (19.8%) | 7,807 (18.8%) |
| 4 Vehicles | 3,464 (7.7%) | 2,567 (6.2%) |
| 5 or more Vehicles | 1,397 (3.1%) | 1,080 (2.6%) |
| Total | 45,063 (100.0%) | 41,507 (100.0%) |
Commute Time in Chattanooga
The most frequently occuring commute durations in Chattanooga are 15 to 19 minutes (19,070 commuters, 24.1%), 10 to 14 minutes (14,904 commuters, 18.8%), and 20 to 24 minutes (14,781 commuters, 18.7%).
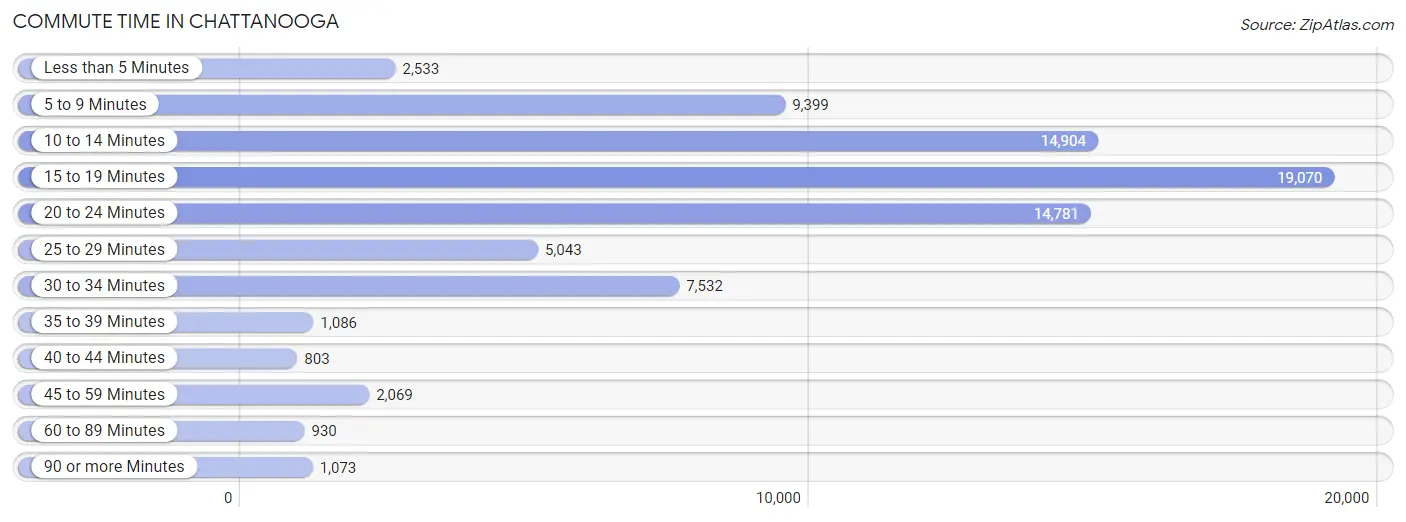
| Commute Time | # Commuters | % Commuters |
| Less than 5 Minutes | 2,533 | 3.2% |
| 5 to 9 Minutes | 9,399 | 11.9% |
| 10 to 14 Minutes | 14,904 | 18.8% |
| 15 to 19 Minutes | 19,070 | 24.1% |
| 20 to 24 Minutes | 14,781 | 18.7% |
| 25 to 29 Minutes | 5,043 | 6.4% |
| 30 to 34 Minutes | 7,532 | 9.5% |
| 35 to 39 Minutes | 1,086 | 1.4% |
| 40 to 44 Minutes | 803 | 1.0% |
| 45 to 59 Minutes | 2,069 | 2.6% |
| 60 to 89 Minutes | 930 | 1.2% |
| 90 or more Minutes | 1,073 | 1.3% |
Commute Time by Sex in Chattanooga
The most common commute times in Chattanooga are 15 to 19 minutes (9,743 commuters, 23.3%) for males and 15 to 19 minutes (9,327 commuters, 24.9%) for females.
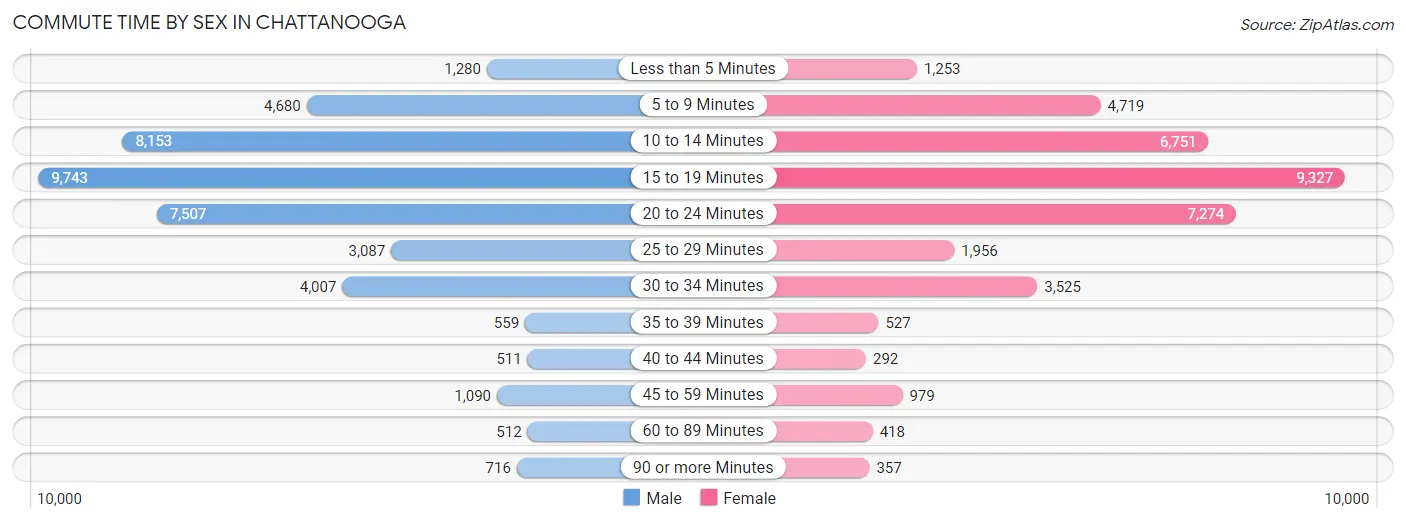
| Commute Time | Male | Female |
| Less than 5 Minutes | 1,280 (3.1%) | 1,253 (3.4%) |
| 5 to 9 Minutes | 4,680 (11.2%) | 4,719 (12.6%) |
| 10 to 14 Minutes | 8,153 (19.5%) | 6,751 (18.1%) |
| 15 to 19 Minutes | 9,743 (23.3%) | 9,327 (24.9%) |
| 20 to 24 Minutes | 7,507 (17.9%) | 7,274 (19.5%) |
| 25 to 29 Minutes | 3,087 (7.4%) | 1,956 (5.2%) |
| 30 to 34 Minutes | 4,007 (9.6%) | 3,525 (9.4%) |
| 35 to 39 Minutes | 559 (1.3%) | 527 (1.4%) |
| 40 to 44 Minutes | 511 (1.2%) | 292 (0.8%) |
| 45 to 59 Minutes | 1,090 (2.6%) | 979 (2.6%) |
| 60 to 89 Minutes | 512 (1.2%) | 418 (1.1%) |
| 90 or more Minutes | 716 (1.7%) | 357 (1.0%) |
Time of Departure to Work by Sex in Chattanooga
The most frequent times of departure to work in Chattanooga are 7:30 AM to 7:59 AM (5,982, 14.3%) for males and 7:30 AM to 7:59 AM (5,169, 13.8%) for females.
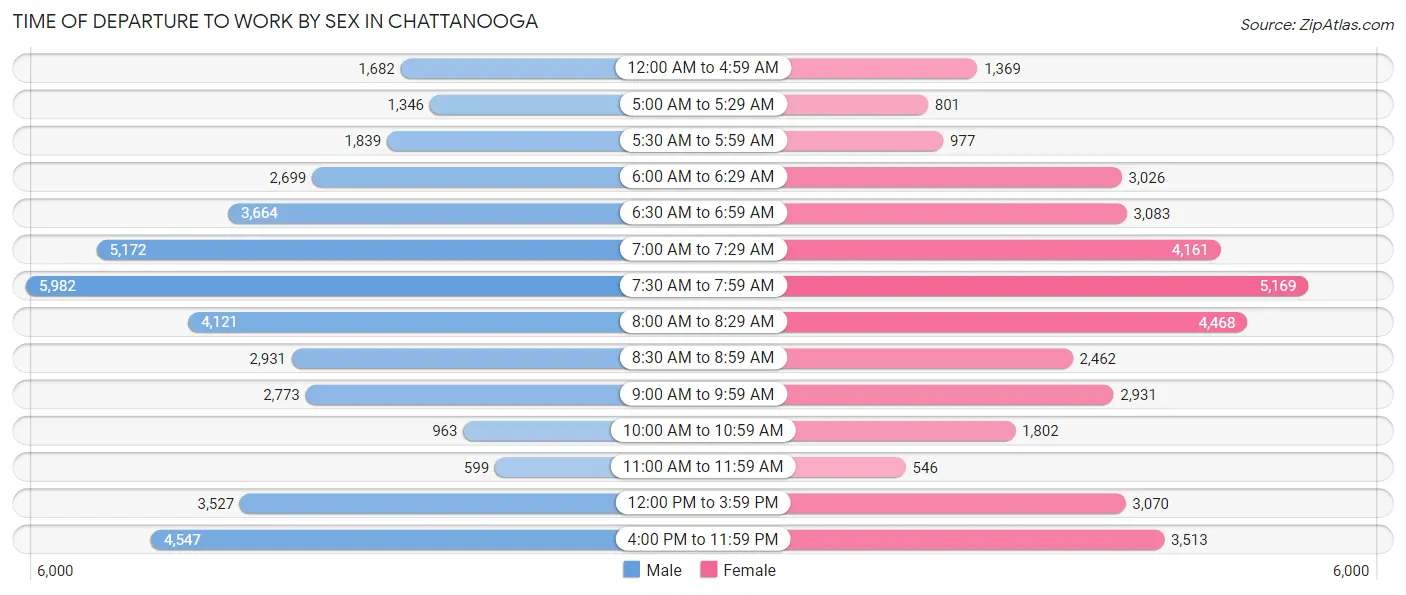
| Time of Departure | Male | Female |
| 12:00 AM to 4:59 AM | 1,682 (4.0%) | 1,369 (3.7%) |
| 5:00 AM to 5:29 AM | 1,346 (3.2%) | 801 (2.1%) |
| 5:30 AM to 5:59 AM | 1,839 (4.4%) | 977 (2.6%) |
| 6:00 AM to 6:29 AM | 2,699 (6.5%) | 3,026 (8.1%) |
| 6:30 AM to 6:59 AM | 3,664 (8.8%) | 3,083 (8.3%) |
| 7:00 AM to 7:29 AM | 5,172 (12.4%) | 4,161 (11.1%) |
| 7:30 AM to 7:59 AM | 5,982 (14.3%) | 5,169 (13.8%) |
| 8:00 AM to 8:29 AM | 4,121 (9.9%) | 4,468 (11.9%) |
| 8:30 AM to 8:59 AM | 2,931 (7.0%) | 2,462 (6.6%) |
| 9:00 AM to 9:59 AM | 2,773 (6.6%) | 2,931 (7.8%) |
| 10:00 AM to 10:59 AM | 963 (2.3%) | 1,802 (4.8%) |
| 11:00 AM to 11:59 AM | 599 (1.4%) | 546 (1.5%) |
| 12:00 PM to 3:59 PM | 3,527 (8.4%) | 3,070 (8.2%) |
| 4:00 PM to 11:59 PM | 4,547 (10.9%) | 3,513 (9.4%) |
| Total | 41,845 (100.0%) | 37,378 (100.0%) |
Housing Occupancy in Chattanooga
Occupancy by Ownership in Chattanooga
Of the total 77,016 dwellings in Chattanooga, owner-occupied units account for 41,137 (53.4%), while renter-occupied units make up 35,879 (46.6%).
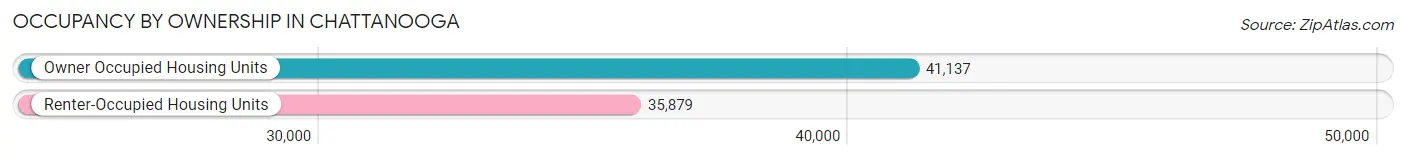
| Occupancy | # Housing Units | % Housing Units |
| Owner Occupied Housing Units | 41,137 | 53.4% |
| Renter-Occupied Housing Units | 35,879 | 46.6% |
| Total Occupied Housing Units | 77,016 | 100.0% |
Occupancy by Household Size in Chattanooga
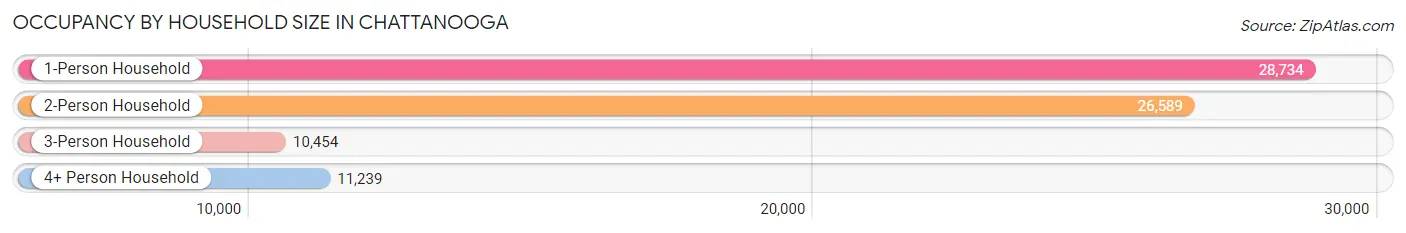
| Household Size | # Housing Units | % Housing Units |
| 1-Person Household | 28,734 | 37.3% |
| 2-Person Household | 26,589 | 34.5% |
| 3-Person Household | 10,454 | 13.6% |
| 4+ Person Household | 11,239 | 14.6% |
| Total Housing Units | 77,016 | 100.0% |
Occupancy by Ownership by Household Size in Chattanooga
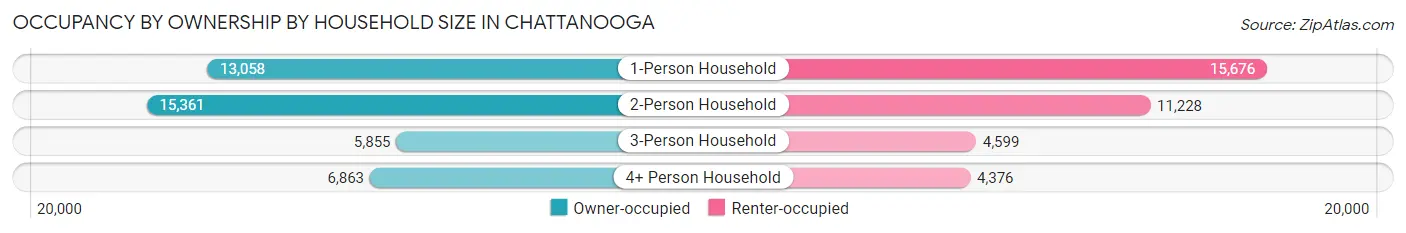
| Household Size | Owner-occupied | Renter-occupied |
| 1-Person Household | 13,058 (45.4%) | 15,676 (54.6%) |
| 2-Person Household | 15,361 (57.8%) | 11,228 (42.2%) |
| 3-Person Household | 5,855 (56.0%) | 4,599 (44.0%) |
| 4+ Person Household | 6,863 (61.1%) | 4,376 (38.9%) |
| Total Housing Units | 41,137 (53.4%) | 35,879 (46.6%) |
Occupancy by Educational Attainment in Chattanooga
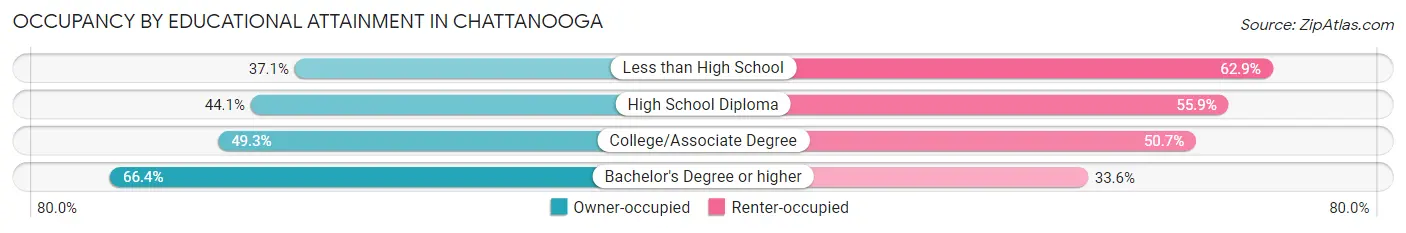
| Household Size | Owner-occupied | Renter-occupied |
| Less than High School | 2,372 (37.1%) | 4,015 (62.9%) |
| High School Diploma | 7,170 (44.1%) | 9,081 (55.9%) |
| College/Associate Degree | 13,020 (49.3%) | 13,401 (50.7%) |
| Bachelor's Degree or higher | 18,575 (66.4%) | 9,382 (33.6%) |
Occupancy by Age of Householder in Chattanooga
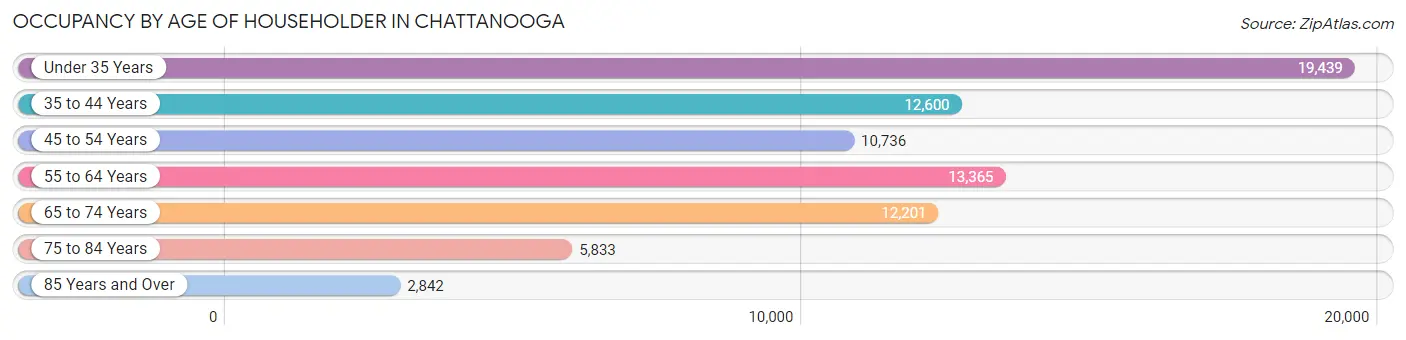
| Age Bracket | # Households | % Households |
| Under 35 Years | 19,439 | 25.2% |
| 35 to 44 Years | 12,600 | 16.4% |
| 45 to 54 Years | 10,736 | 13.9% |
| 55 to 64 Years | 13,365 | 17.3% |
| 65 to 74 Years | 12,201 | 15.8% |
| 75 to 84 Years | 5,833 | 7.6% |
| 85 Years and Over | 2,842 | 3.7% |
| Total | 77,016 | 100.0% |
Housing Finances in Chattanooga
Median Income by Occupancy in Chattanooga
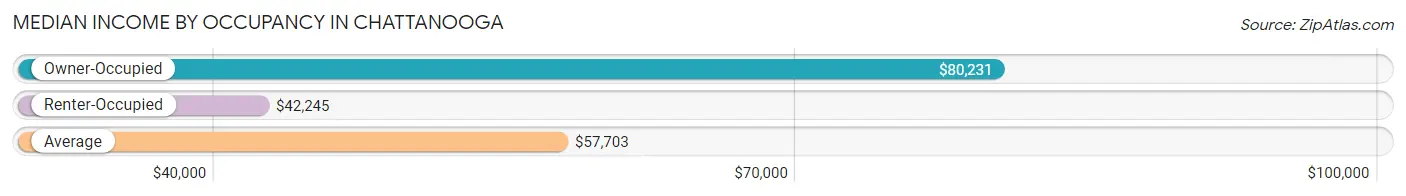
| Occupancy Type | # Households | Median Income |
| Owner-Occupied | 41,137 (53.4%) | $80,231 |
| Renter-Occupied | 35,879 (46.6%) | $42,245 |
| Average | 77,016 (100.0%) | $57,703 |
Occupancy by Householder Income Bracket in Chattanooga
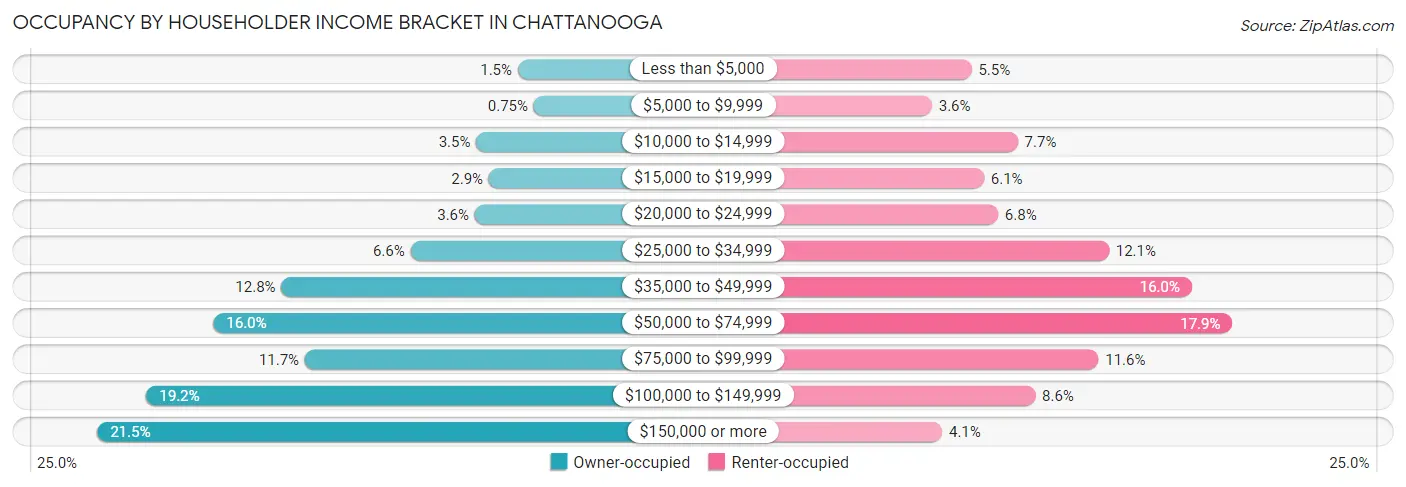
| Income Bracket | Owner-occupied | Renter-occupied |
| Less than $5,000 | 620 (1.5%) | 1,982 (5.5%) |
| $5,000 to $9,999 | 309 (0.7%) | 1,304 (3.6%) |
| $10,000 to $14,999 | 1,436 (3.5%) | 2,769 (7.7%) |
| $15,000 to $19,999 | 1,188 (2.9%) | 2,193 (6.1%) |
| $20,000 to $24,999 | 1,466 (3.6%) | 2,432 (6.8%) |
| $25,000 to $34,999 | 2,724 (6.6%) | 4,328 (12.1%) |
| $35,000 to $49,999 | 5,255 (12.8%) | 5,744 (16.0%) |
| $50,000 to $74,999 | 6,585 (16.0%) | 6,435 (17.9%) |
| $75,000 to $99,999 | 4,793 (11.7%) | 4,146 (11.6%) |
| $100,000 to $149,999 | 7,900 (19.2%) | 3,068 (8.6%) |
| $150,000 or more | 8,861 (21.5%) | 1,478 (4.1%) |
| Total | 41,137 (100.0%) | 35,879 (100.0%) |
Monthly Housing Cost Tiers in Chattanooga
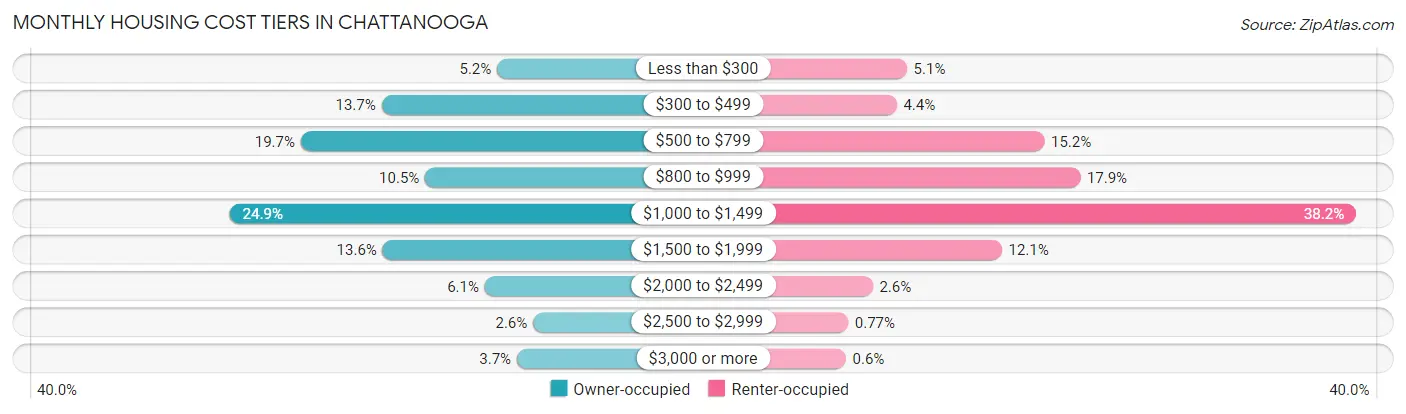
| Monthly Cost | Owner-occupied | Renter-occupied |
| Less than $300 | 2,140 (5.2%) | 1,830 (5.1%) |
| $300 to $499 | 5,640 (13.7%) | 1,559 (4.3%) |
| $500 to $799 | 8,087 (19.7%) | 5,461 (15.2%) |
| $800 to $999 | 4,321 (10.5%) | 6,409 (17.9%) |
| $1,000 to $1,499 | 10,242 (24.9%) | 13,703 (38.2%) |
| $1,500 to $1,999 | 5,606 (13.6%) | 4,339 (12.1%) |
| $2,000 to $2,499 | 2,513 (6.1%) | 926 (2.6%) |
| $2,500 to $2,999 | 1,051 (2.5%) | 278 (0.8%) |
| $3,000 or more | 1,537 (3.7%) | 217 (0.6%) |
| Total | 41,137 (100.0%) | 35,879 (100.0%) |
Physical Housing Characteristics in Chattanooga
Housing Structures in Chattanooga
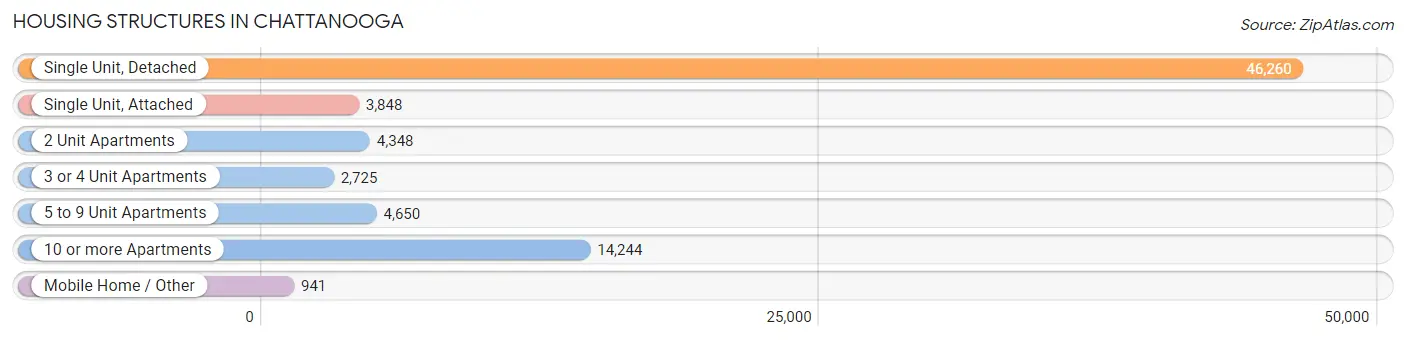
| Structure Type | # Housing Units | % Housing Units |
| Single Unit, Detached | 46,260 | 60.1% |
| Single Unit, Attached | 3,848 | 5.0% |
| 2 Unit Apartments | 4,348 | 5.7% |
| 3 or 4 Unit Apartments | 2,725 | 3.5% |
| 5 to 9 Unit Apartments | 4,650 | 6.0% |
| 10 or more Apartments | 14,244 | 18.5% |
| Mobile Home / Other | 941 | 1.2% |
| Total | 77,016 | 100.0% |
Housing Structures by Occupancy in Chattanooga
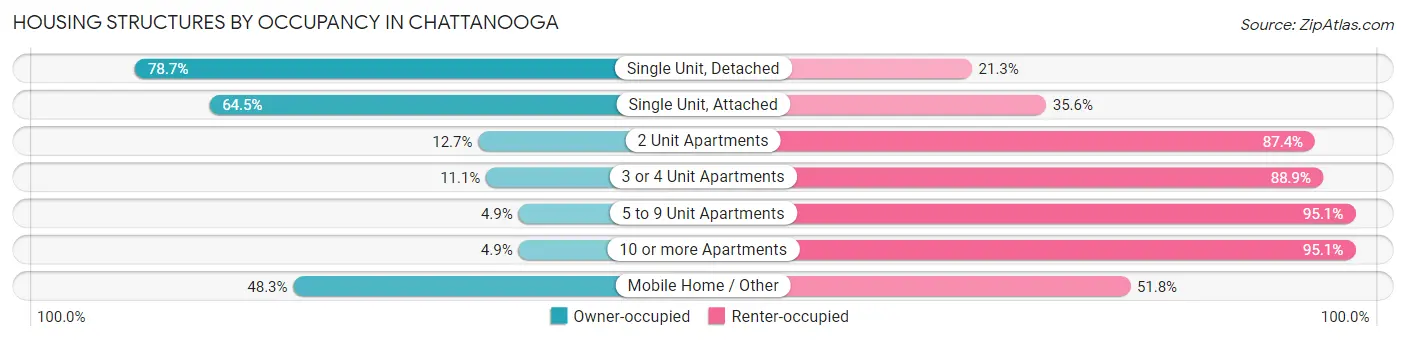
| Structure Type | Owner-occupied | Renter-occupied |
| Single Unit, Detached | 36,423 (78.7%) | 9,837 (21.3%) |
| Single Unit, Attached | 2,480 (64.4%) | 1,368 (35.5%) |
| 2 Unit Apartments | 550 (12.7%) | 3,798 (87.4%) |
| 3 or 4 Unit Apartments | 303 (11.1%) | 2,422 (88.9%) |
| 5 to 9 Unit Apartments | 228 (4.9%) | 4,422 (95.1%) |
| 10 or more Apartments | 699 (4.9%) | 13,545 (95.1%) |
| Mobile Home / Other | 454 (48.2%) | 487 (51.7%) |
| Total | 41,137 (53.4%) | 35,879 (46.6%) |
Housing Structures by Number of Rooms in Chattanooga
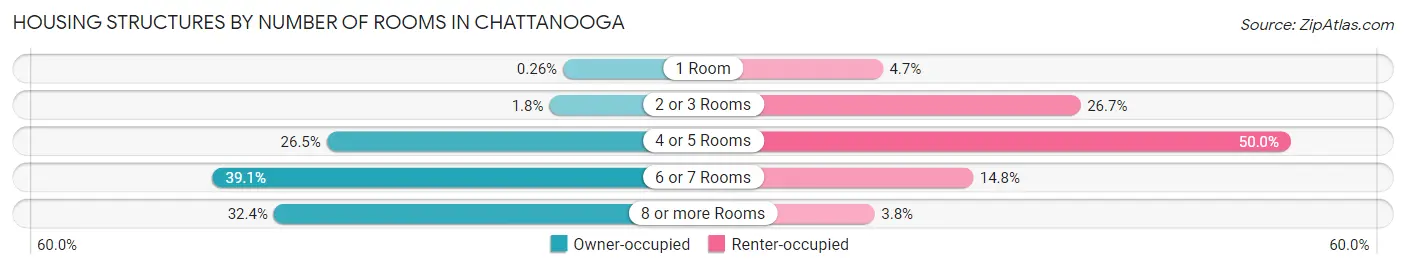
| Number of Rooms | Owner-occupied | Renter-occupied |
| 1 Room | 108 (0.3%) | 1,692 (4.7%) |
| 2 or 3 Rooms | 727 (1.8%) | 9,569 (26.7%) |
| 4 or 5 Rooms | 10,893 (26.5%) | 17,953 (50.0%) |
| 6 or 7 Rooms | 16,103 (39.1%) | 5,293 (14.7%) |
| 8 or more Rooms | 13,306 (32.4%) | 1,372 (3.8%) |
| Total | 41,137 (100.0%) | 35,879 (100.0%) |
Housing Structure by Heating Type in Chattanooga
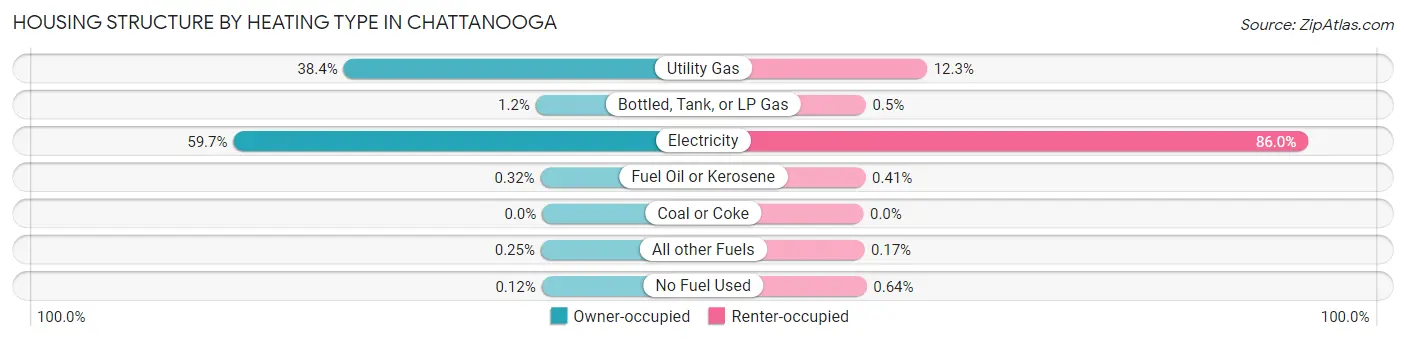
| Heating Type | Owner-occupied | Renter-occupied |
| Utility Gas | 15,790 (38.4%) | 4,416 (12.3%) |
| Bottled, Tank, or LP Gas | 509 (1.2%) | 179 (0.5%) |
| Electricity | 24,552 (59.7%) | 30,847 (86.0%) |
| Fuel Oil or Kerosene | 133 (0.3%) | 147 (0.4%) |
| Coal or Coke | 0 (0.0%) | 0 (0.0%) |
| All other Fuels | 104 (0.3%) | 60 (0.2%) |
| No Fuel Used | 49 (0.1%) | 230 (0.6%) |
| Total | 41,137 (100.0%) | 35,879 (100.0%) |
Household Vehicle Usage in Chattanooga
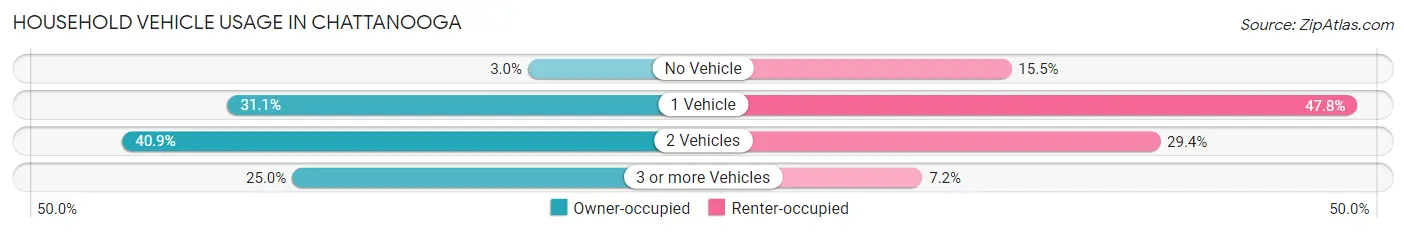
| Vehicles per Household | Owner-occupied | Renter-occupied |
| No Vehicle | 1,247 (3.0%) | 5,574 (15.5%) |
| 1 Vehicle | 12,777 (31.1%) | 17,157 (47.8%) |
| 2 Vehicles | 16,817 (40.9%) | 10,557 (29.4%) |
| 3 or more Vehicles | 10,296 (25.0%) | 2,591 (7.2%) |
| Total | 41,137 (100.0%) | 35,879 (100.0%) |
Real Estate & Mortgages in Chattanooga
Real Estate and Mortgage Overview in Chattanooga
| Characteristic | Without Mortgage | With Mortgage |
| Housing Units | 16,307 | 24,830 |
| Median Property Value | $220,400 | $234,600 |
| Median Household Income | $57,870 | $6,212 |
| Monthly Housing Costs | $524 | $1,476 |
| Real Estate Taxes | $2,088 | $529 |
Property Value by Mortgage Status in Chattanooga
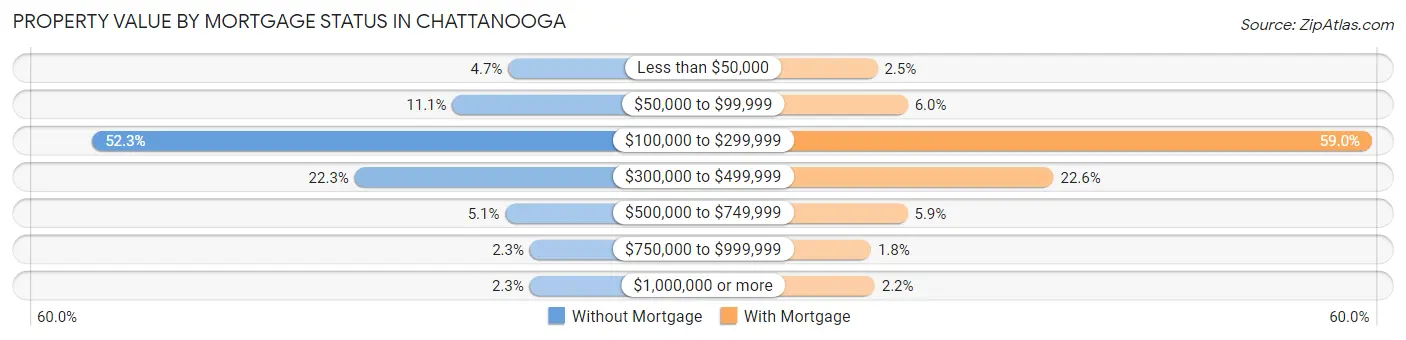
| Property Value | Without Mortgage | With Mortgage |
| Less than $50,000 | 772 (4.7%) | 621 (2.5%) |
| $50,000 to $99,999 | 1,812 (11.1%) | 1,479 (6.0%) |
| $100,000 to $299,999 | 8,523 (52.3%) | 14,651 (59.0%) |
| $300,000 to $499,999 | 3,633 (22.3%) | 5,620 (22.6%) |
| $500,000 to $749,999 | 825 (5.1%) | 1,475 (5.9%) |
| $750,000 to $999,999 | 369 (2.3%) | 438 (1.8%) |
| $1,000,000 or more | 373 (2.3%) | 546 (2.2%) |
| Total | 16,307 (100.0%) | 24,830 (100.0%) |
Household Income by Mortgage Status in Chattanooga
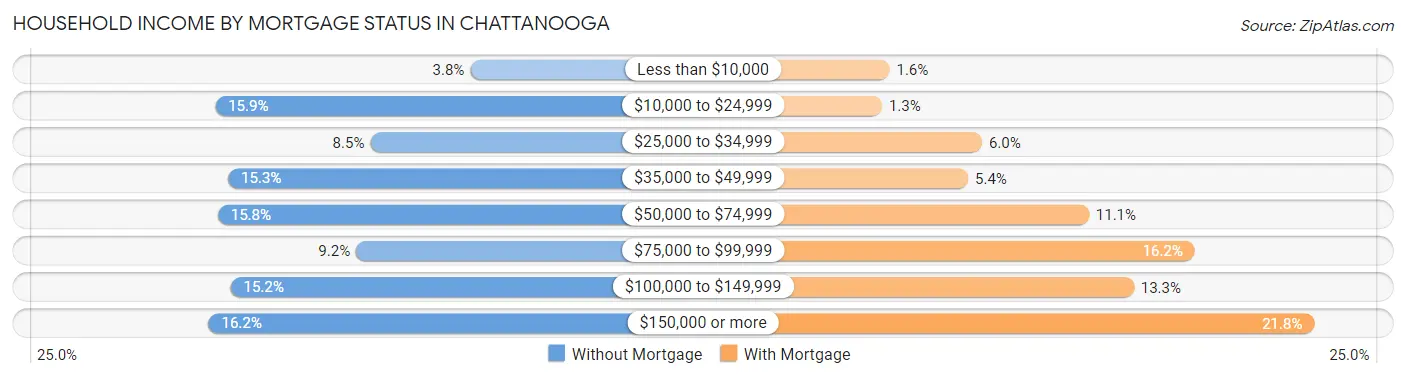
| Household Income | Without Mortgage | With Mortgage |
| Less than $10,000 | 617 (3.8%) | 403 (1.6%) |
| $10,000 to $24,999 | 2,596 (15.9%) | 312 (1.3%) |
| $25,000 to $34,999 | 1,392 (8.5%) | 1,494 (6.0%) |
| $35,000 to $49,999 | 2,496 (15.3%) | 1,332 (5.4%) |
| $50,000 to $74,999 | 2,576 (15.8%) | 2,759 (11.1%) |
| $75,000 to $99,999 | 1,504 (9.2%) | 4,009 (16.2%) |
| $100,000 to $149,999 | 2,477 (15.2%) | 3,289 (13.3%) |
| $150,000 or more | 2,649 (16.2%) | 5,423 (21.8%) |
| Total | 16,307 (100.0%) | 24,830 (100.0%) |
Property Value to Household Income Ratio in Chattanooga
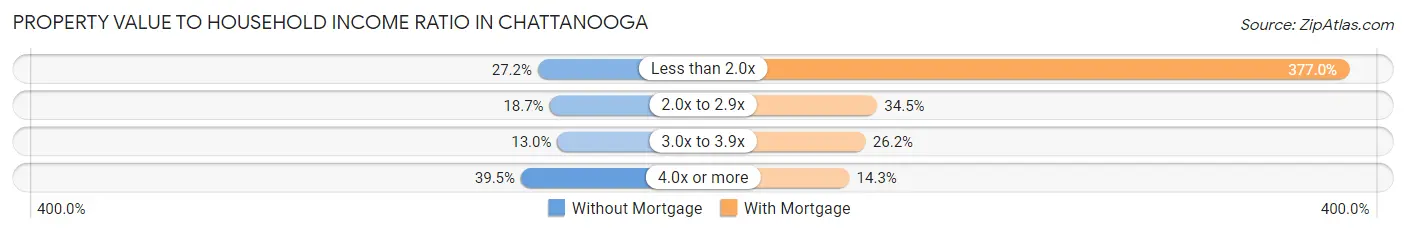
| Value-to-Income Ratio | Without Mortgage | With Mortgage |
| Less than 2.0x | 4,434 (27.2%) | 93,603 (377.0%) |
| 2.0x to 2.9x | 3,055 (18.7%) | 8,567 (34.5%) |
| 3.0x to 3.9x | 2,124 (13.0%) | 6,495 (26.2%) |
| 4.0x or more | 6,441 (39.5%) | 3,561 (14.3%) |
| Total | 16,307 (100.0%) | 24,830 (100.0%) |
Real Estate Taxes by Mortgage Status in Chattanooga
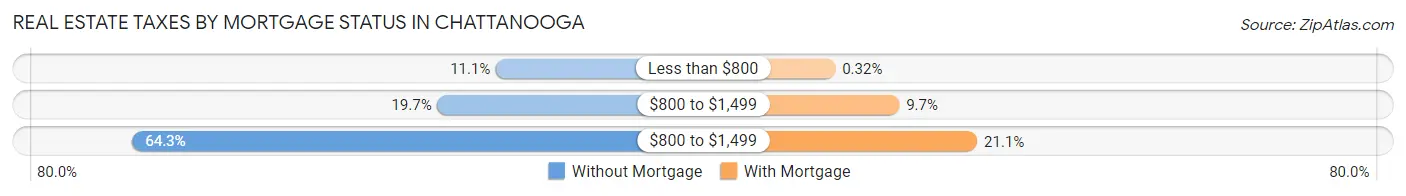
| Property Taxes | Without Mortgage | With Mortgage |
| Less than $800 | 1,809 (11.1%) | 80 (0.3%) |
| $800 to $1,499 | 3,208 (19.7%) | 2,402 (9.7%) |
| $800 to $1,499 | 10,478 (64.2%) | 5,228 (21.1%) |
| Total | 16,307 (100.0%) | 24,830 (100.0%) |
Health & Disability in Chattanooga
Health Insurance Coverage by Age in Chattanooga
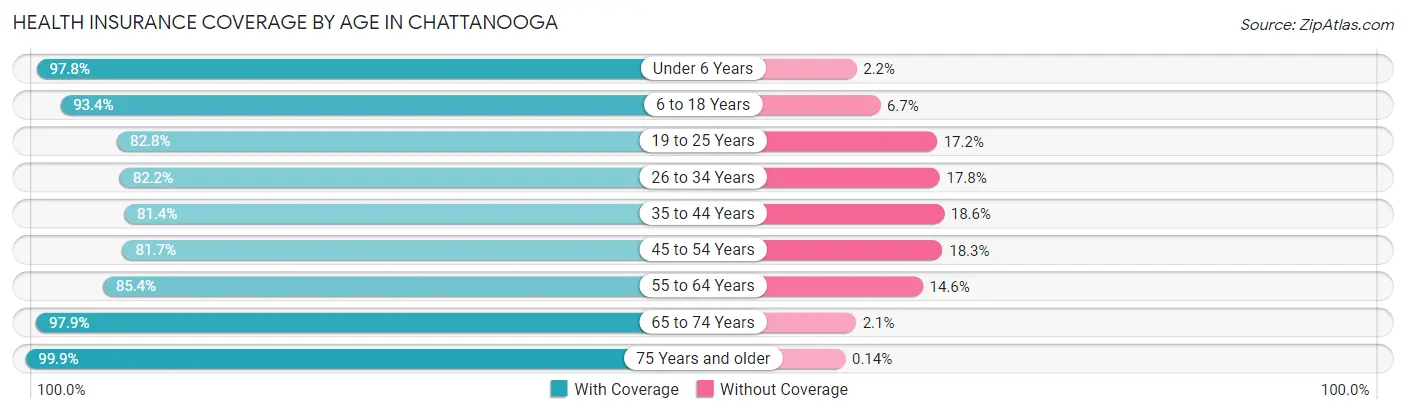
| Age Bracket | With Coverage | Without Coverage |
| Under 6 Years | 12,486 (97.8%) | 285 (2.2%) |
| 6 to 18 Years | 24,254 (93.3%) | 1,729 (6.7%) |
| 19 to 25 Years | 16,610 (82.8%) | 3,461 (17.2%) |
| 26 to 34 Years | 21,313 (82.2%) | 4,605 (17.8%) |
| 35 to 44 Years | 17,906 (81.4%) | 4,081 (18.6%) |
| 45 to 54 Years | 15,491 (81.7%) | 3,463 (18.3%) |
| 55 to 64 Years | 19,339 (85.4%) | 3,305 (14.6%) |
| 65 to 74 Years | 17,682 (97.9%) | 384 (2.1%) |
| 75 Years and older | 11,876 (99.9%) | 17 (0.1%) |
| Total | 156,957 (88.0%) | 21,330 (12.0%) |
Health Insurance Coverage by Citizenship Status in Chattanooga
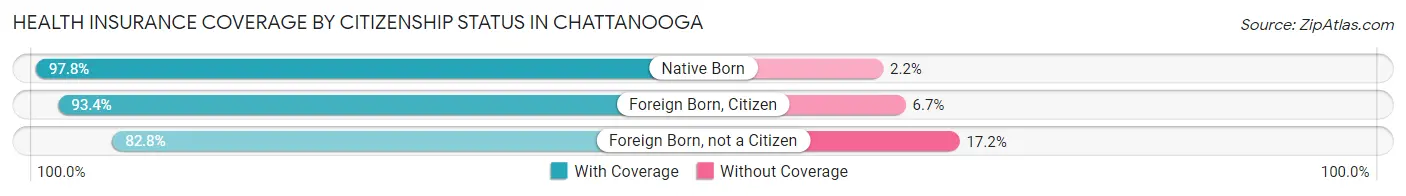
| Citizenship Status | With Coverage | Without Coverage |
| Native Born | 12,486 (97.8%) | 285 (2.2%) |
| Foreign Born, Citizen | 24,254 (93.3%) | 1,729 (6.7%) |
| Foreign Born, not a Citizen | 16,610 (82.8%) | 3,461 (17.2%) |
Health Insurance Coverage by Household Income in Chattanooga
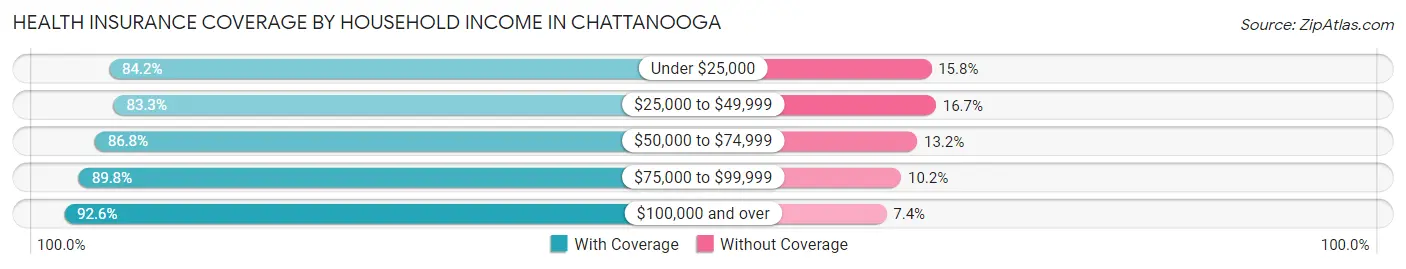
| Household Income | With Coverage | Without Coverage |
| Under $25,000 | 22,938 (84.2%) | 4,310 (15.8%) |
| $25,000 to $49,999 | 29,036 (83.3%) | 5,813 (16.7%) |
| $50,000 to $74,999 | 25,360 (86.8%) | 3,844 (13.2%) |
| $75,000 to $99,999 | 20,740 (89.8%) | 2,349 (10.2%) |
| $100,000 and over | 54,565 (92.6%) | 4,369 (7.4%) |
Public vs Private Health Insurance Coverage by Age in Chattanooga
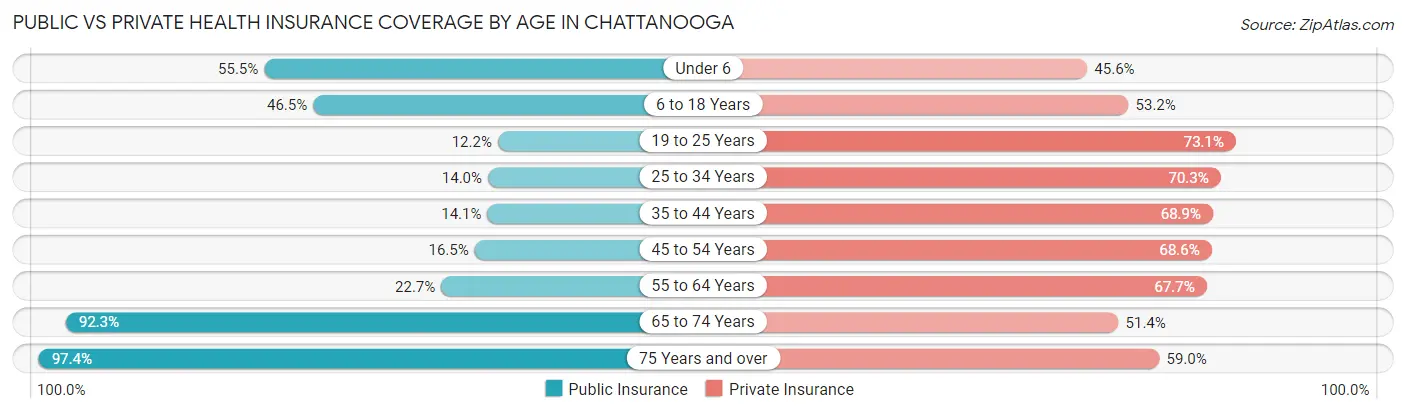
| Age Bracket | Public Insurance | Private Insurance |
| Under 6 | 7,093 (55.5%) | 5,822 (45.6%) |
| 6 to 18 Years | 12,071 (46.5%) | 13,833 (53.2%) |
| 19 to 25 Years | 2,445 (12.2%) | 14,676 (73.1%) |
| 25 to 34 Years | 3,631 (14.0%) | 18,219 (70.3%) |
| 35 to 44 Years | 3,105 (14.1%) | 15,138 (68.9%) |
| 45 to 54 Years | 3,124 (16.5%) | 13,009 (68.6%) |
| 55 to 64 Years | 5,137 (22.7%) | 15,328 (67.7%) |
| 65 to 74 Years | 16,683 (92.3%) | 9,282 (51.4%) |
| 75 Years and over | 11,580 (97.4%) | 7,014 (59.0%) |
| Total | 64,869 (36.4%) | 112,321 (63.0%) |
Disability Status by Sex by Age in Chattanooga
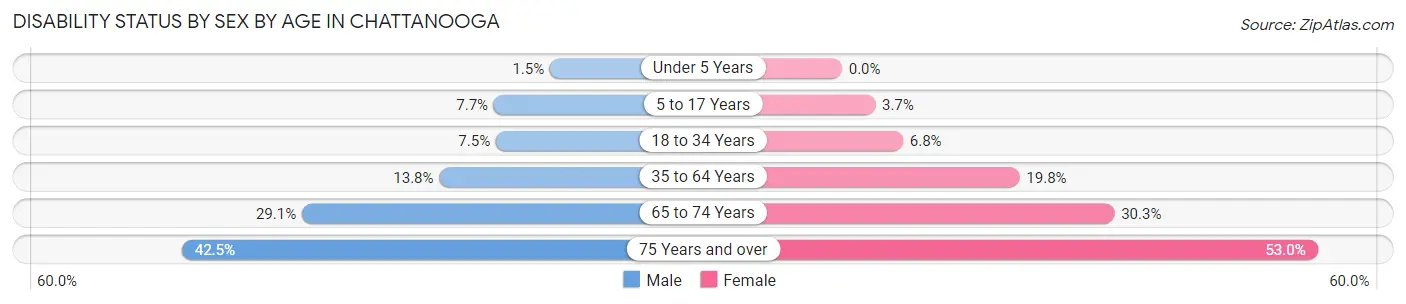
| Age Bracket | Male | Female |
| Under 5 Years | 84 (1.5%) | 0 (0.0%) |
| 5 to 17 Years | 1,000 (7.7%) | 442 (3.7%) |
| 18 to 34 Years | 1,724 (7.5%) | 1,740 (6.8%) |
| 35 to 64 Years | 4,286 (13.8%) | 6,439 (19.8%) |
| 65 to 74 Years | 2,339 (29.1%) | 3,043 (30.3%) |
| 75 Years and over | 1,716 (42.5%) | 4,160 (53.0%) |
Disability Class by Sex by Age in Chattanooga
Disability Class: Hearing Difficulty
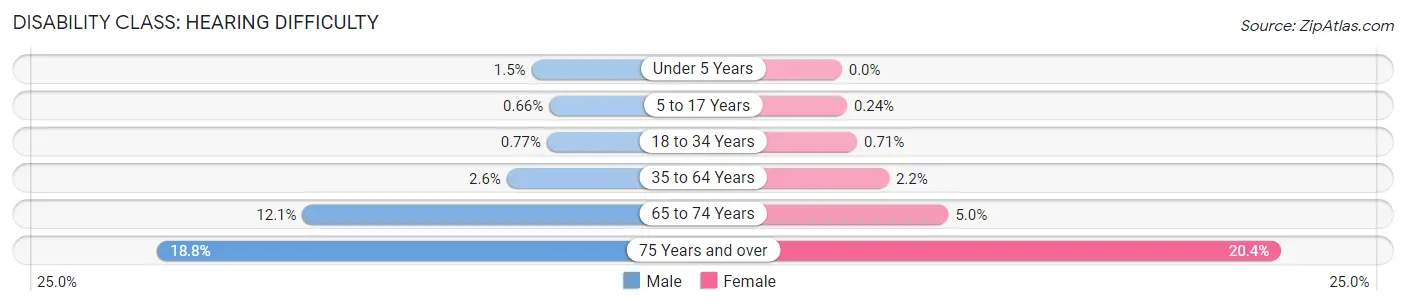
| Age Bracket | Male | Female |
| Under 5 Years | 84 (1.5%) | 0 (0.0%) |
| 5 to 17 Years | 85 (0.7%) | 29 (0.2%) |
| 18 to 34 Years | 177 (0.8%) | 181 (0.7%) |
| 35 to 64 Years | 817 (2.6%) | 714 (2.2%) |
| 65 to 74 Years | 973 (12.1%) | 497 (5.0%) |
| 75 Years and over | 761 (18.8%) | 1,601 (20.4%) |
Disability Class: Vision Difficulty
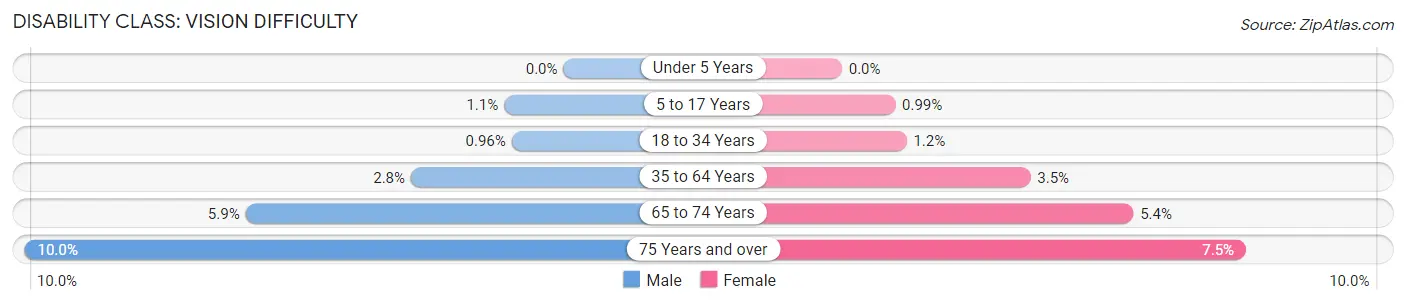
| Age Bracket | Male | Female |
| Under 5 Years | 0 (0.0%) | 0 (0.0%) |
| 5 to 17 Years | 142 (1.1%) | 118 (1.0%) |
| 18 to 34 Years | 221 (1.0%) | 306 (1.2%) |
| 35 to 64 Years | 879 (2.8%) | 1,139 (3.5%) |
| 65 to 74 Years | 474 (5.9%) | 543 (5.4%) |
| 75 Years and over | 404 (10.0%) | 589 (7.5%) |
Disability Class: Cognitive Difficulty
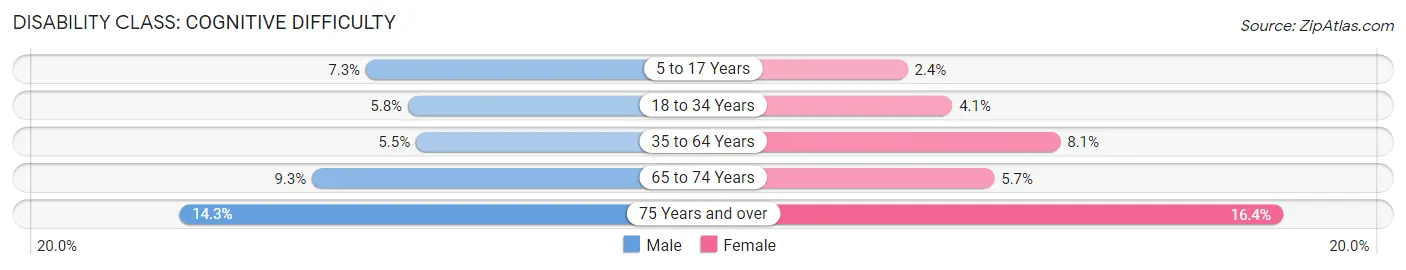
| Age Bracket | Male | Female |
| 5 to 17 Years | 949 (7.3%) | 291 (2.4%) |
| 18 to 34 Years | 1,328 (5.8%) | 1,048 (4.1%) |
| 35 to 64 Years | 1,698 (5.5%) | 2,639 (8.1%) |
| 65 to 74 Years | 750 (9.3%) | 568 (5.7%) |
| 75 Years and over | 576 (14.3%) | 1,286 (16.4%) |
Disability Class: Ambulatory Difficulty
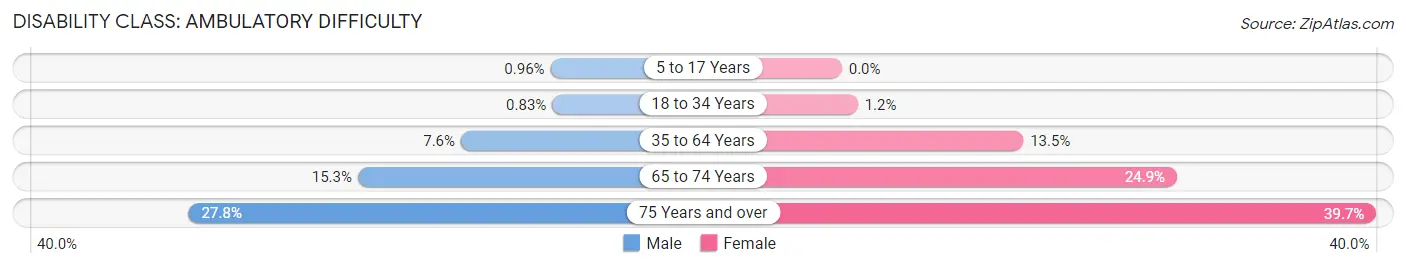
| Age Bracket | Male | Female |
| 5 to 17 Years | 124 (1.0%) | 0 (0.0%) |
| 18 to 34 Years | 191 (0.8%) | 301 (1.2%) |
| 35 to 64 Years | 2,361 (7.6%) | 4,384 (13.5%) |
| 65 to 74 Years | 1,226 (15.3%) | 2,496 (24.9%) |
| 75 Years and over | 1,124 (27.8%) | 3,116 (39.7%) |
Disability Class: Self-Care Difficulty
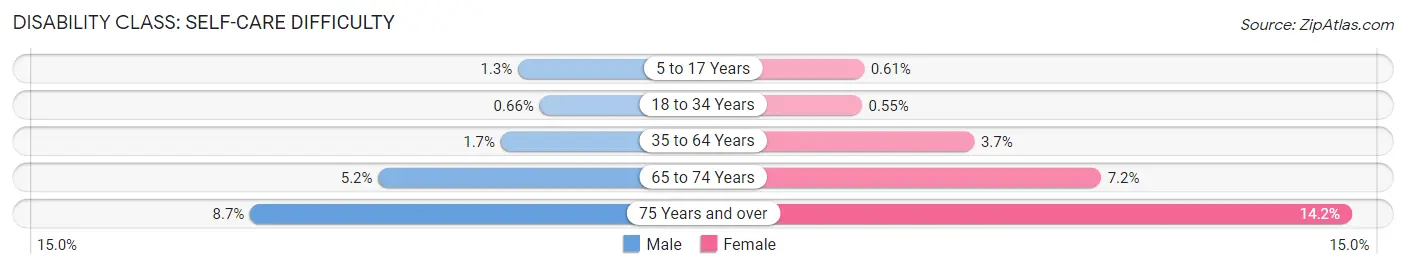
| Age Bracket | Male | Female |
| 5 to 17 Years | 163 (1.3%) | 73 (0.6%) |
| 18 to 34 Years | 152 (0.7%) | 141 (0.5%) |
| 35 to 64 Years | 539 (1.7%) | 1,197 (3.7%) |
| 65 to 74 Years | 414 (5.1%) | 723 (7.2%) |
| 75 Years and over | 352 (8.7%) | 1,115 (14.2%) |
Technology Access in Chattanooga
Computing Device Access in Chattanooga
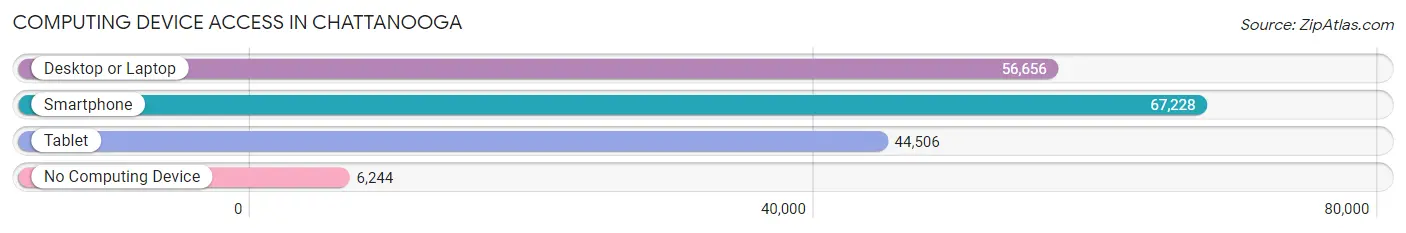
| Device Type | # Households | % Households |
| Desktop or Laptop | 56,656 | 73.6% |
| Smartphone | 67,228 | 87.3% |
| Tablet | 44,506 | 57.8% |
| No Computing Device | 6,244 | 8.1% |
| Total | 77,016 | 100.0% |
Internet Access in Chattanooga
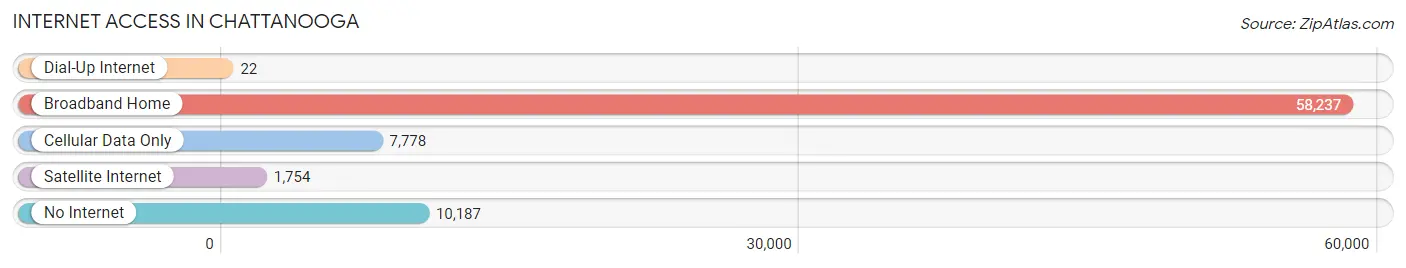
| Internet Type | # Households | % Households |
| Dial-Up Internet | 22 | 0.0% |
| Broadband Home | 58,237 | 75.6% |
| Cellular Data Only | 7,778 | 10.1% |
| Satellite Internet | 1,754 | 2.3% |
| No Internet | 10,187 | 13.2% |
| Total | 77,016 | 100.0% |
Chattanooga Summary
Chattanooga, Tennessee is a city located in the southeastern United States, in the state of Tennessee. It is the fourth-largest city in the state, with a population of approximately 170,000 people. The city is situated along the Tennessee River, and is surrounded by the Appalachian Mountains. It is a major transportation hub, with several major highways and railroads running through the city.
History
The area that is now Chattanooga was first inhabited by Native American tribes, including the Cherokee, Creek, and Chickasaw. The first European settlers arrived in the area in the late 1700s, and the city was officially founded in 1838. It was named after the Cherokee village of Chatanoog, which was located nearby.
In the early 1800s, Chattanooga became an important transportation hub, as it was located at the intersection of several major railroads. This allowed the city to become a major industrial center, and it quickly grew in size and population. During the Civil War, Chattanooga was the site of several major battles, including the Battle of Lookout Mountain and the Battle of Missionary Ridge.
In the late 1800s, Chattanooga became a major tourist destination, as it was home to several natural attractions, such as Lookout Mountain and Ruby Falls. The city also became a major center for manufacturing, and it was home to several major companies, such as the Chattanooga Choo Choo and the Chattanooga Brewing Company.
Geography
Chattanooga is located in the southeastern United States, in the state of Tennessee. It is situated along the Tennessee River, and is surrounded by the Appalachian Mountains. The city is located at the junction of several major highways, including Interstate 75, Interstate 24, and U.S. Route 11.
The city has a total area of 144.3 square miles, of which 142.2 square miles is land and 2.1 square miles is water. The city is located at an elevation of 676 feet above sea level.
Economy
Chattanooga has a diverse economy, with a variety of industries. The city is home to several major companies, such as the Chattanooga Choo Choo, the Chattanooga Brewing Company, and the Tennessee Valley Authority. The city is also home to several major universities, including the University of Tennessee at Chattanooga, Chattanooga State Community College, and Southern Adventist University.
The city is also a major tourist destination, with several attractions, such as Lookout Mountain, Ruby Falls, and the Tennessee Aquarium. The city is also home to several major events, such as the Riverbend Festival and the Chattanooga Film Festival.
Demographics
As of the 2010 census, the population of Chattanooga was 167,674. The racial makeup of the city was 63.2% White, 30.2% African American, 0.4% Native American, 1.7% Asian, 0.1% Pacific Islander, 2.2% from other races, and 2.2% from two or more races. Hispanic or Latino of any race were 5.2% of the population.
The median household income in Chattanooga was $37,837, and the median family income was $45,945. The per capita income in the city was $21,945. About 17.2% of the population was below the poverty line.
Common Questions
What is Per Capita Income in Chattanooga?
Per Capita income in Chattanooga is $37,983.
What is the Median Family Income in Chattanooga?
Median Family Income in Chattanooga is $78,965.
What is the Median Household income in Chattanooga?
Median Household Income in Chattanooga is $57,703.
What is Income or Wage Gap in Chattanooga?
Income or Wage Gap in Chattanooga is 22.6%.
Women in Chattanooga earn 77.4 cents for every dollar earned by a man.
What is Family Income Deficit in Chattanooga?
Family Income Deficit in Chattanooga is $12,067.
Families that are below poverty line in Chattanooga earn $12,067 less on average than the poverty threshold level.
What is Inequality or Gini Index in Chattanooga?
Inequality or Gini Index in Chattanooga is 0.50.
What is the Total Population of Chattanooga?
Total Population of Chattanooga is 181,288.
What is the Total Male Population of Chattanooga?
Total Male Population of Chattanooga is 86,410.
What is the Total Female Population of Chattanooga?
Total Female Population of Chattanooga is 94,878.
What is the Ratio of Males per 100 Females in Chattanooga?
There are 91.07 Males per 100 Females in Chattanooga.
What is the Ratio of Females per 100 Males in Chattanooga?
There are 109.80 Females per 100 Males in Chattanooga.
What is the Median Population Age in Chattanooga?
Median Population Age in Chattanooga is 37.0 Years.
What is the Average Family Size in Chattanooga
Average Family Size in Chattanooga is 3.0 People.
What is the Average Household Size in Chattanooga
Average Household Size in Chattanooga is 2.2 People.
How Large is the Labor Force in Chattanooga?
There are 95,149 People in the Labor Forcein in Chattanooga.
What is the Percentage of People in the Labor Force in Chattanooga?
64.0% of People are in the Labor Force in Chattanooga.
What is the Unemployment Rate in Chattanooga?
Unemployment Rate in Chattanooga is 5.1%.