Mesa, AZ Map & Demographics
Mesa Map
Mesa Overview
$37,197
PER CAPITA INCOME
$87,185
AVG FAMILY INCOME
$73,766
AVG HOUSEHOLD INCOME
20.8%
WAGE / INCOME GAP [ % ]
79.2¢/ $1
WAGE / INCOME GAP [ $ ]
$11,015
FAMILY INCOME DEFICIT
0.43
INEQUALITY / GINI INDEX
503,390
TOTAL POPULATION
251,051
MALE POPULATION
252,339
FEMALE POPULATION
99.49
MALES / 100 FEMALES
100.51
FEMALES / 100 MALES
36.8
MEDIAN AGE
3.1
AVG FAMILY SIZE
2.6
AVG HOUSEHOLD SIZE
261,416
LABOR FORCE [ PEOPLE ]
65.4%
PERCENT IN LABOR FORCE
4.7%
UNEMPLOYMENT RATE
Mesa Zip Codes
Income in Mesa
Income Overview in Mesa
Per Capita Income in Mesa is $37,197, while median incomes of families and households are $87,185 and $73,766 respectively.
| Characteristic | Number | Measure |
| Per Capita Income | 503,390 | $37,197 |
| Median Family Income | 126,542 | $87,185 |
| Mean Family Income | 126,542 | $108,556 |
| Median Household Income | 193,316 | $73,766 |
| Mean Household Income | 193,316 | $95,399 |
| Income Deficit | 126,542 | $11,015 |
| Wage / Income Gap (%) | 503,390 | 20.76% |
| Wage / Income Gap ($) | 503,390 | 79.24¢ per $1 |
| Gini / Inequality Index | 503,390 | 0.43 |
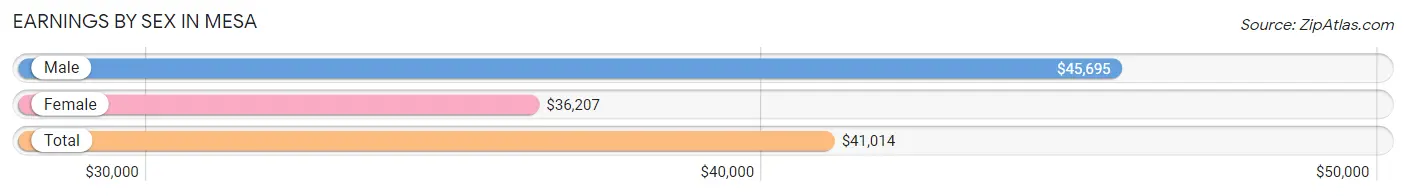
Earnings by Sex in Mesa
Average Earnings in Mesa are $41,014, $45,695 for men and $36,207 for women, a difference of 20.8%.
| Sex | Number | Average Earnings |
| Male | 146,593 (54.3%) | $45,695 |
| Female | 123,322 (45.7%) | $36,207 |
| Total | 269,915 (100.0%) | $41,014 |
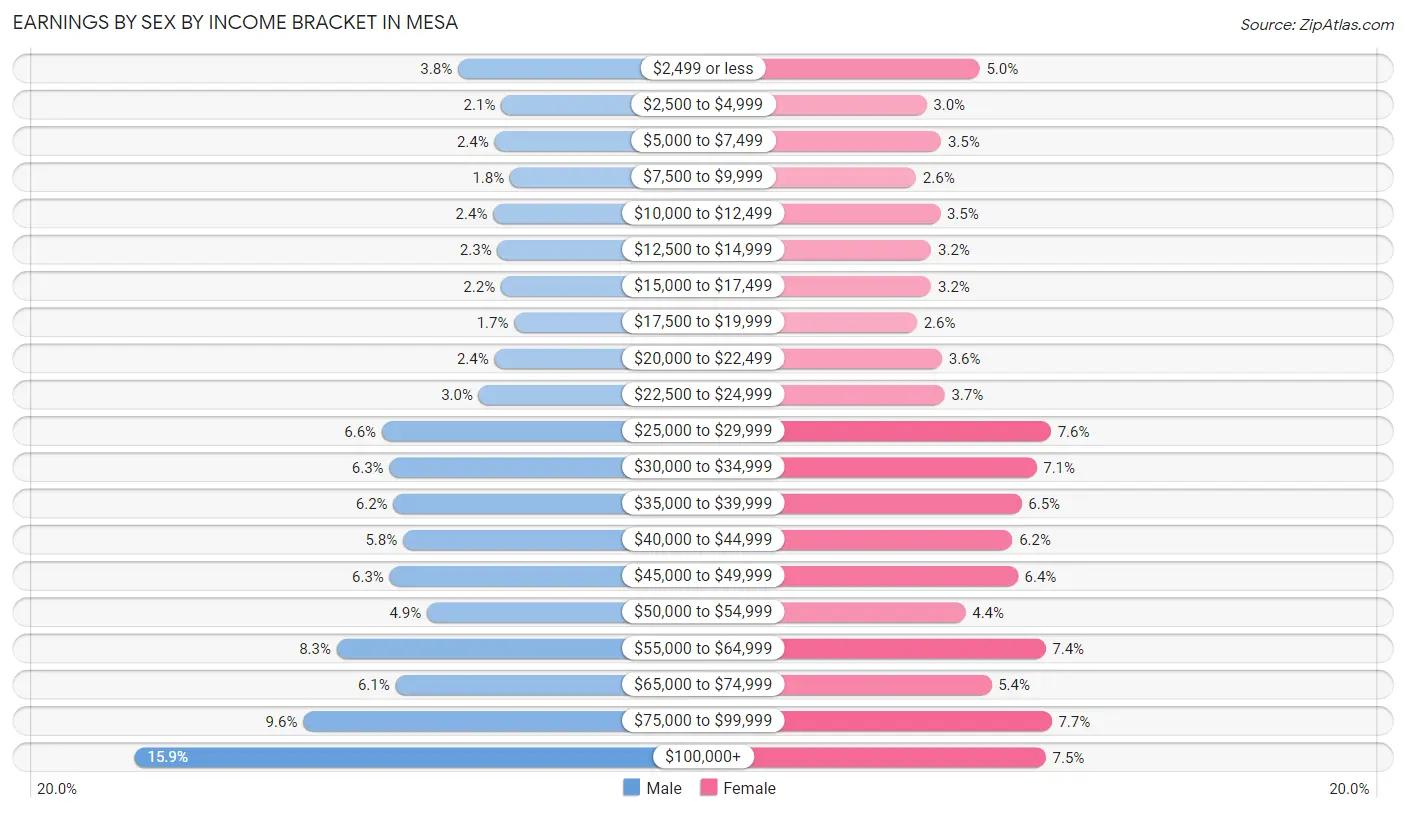
Earnings by Sex by Income Bracket in Mesa
The most common earnings brackets in Mesa are $100,000+ for men (23,283 | 15.9%) and $75,000 to $99,999 for women (9,456 | 7.7%).
| Income | Male | Female |
| $2,499 or less | 5,511 (3.8%) | 6,129 (5.0%) |
| $2,500 to $4,999 | 3,133 (2.1%) | 3,677 (3.0%) |
| $5,000 to $7,499 | 3,507 (2.4%) | 4,354 (3.5%) |
| $7,500 to $9,999 | 2,651 (1.8%) | 3,200 (2.6%) |
| $10,000 to $12,499 | 3,577 (2.4%) | 4,299 (3.5%) |
| $12,500 to $14,999 | 3,336 (2.3%) | 3,894 (3.2%) |
| $15,000 to $17,499 | 3,151 (2.1%) | 3,903 (3.2%) |
| $17,500 to $19,999 | 2,426 (1.7%) | 3,234 (2.6%) |
| $20,000 to $22,499 | 3,502 (2.4%) | 4,390 (3.6%) |
| $22,500 to $24,999 | 4,363 (3.0%) | 4,511 (3.7%) |
| $25,000 to $29,999 | 9,690 (6.6%) | 9,426 (7.6%) |
| $30,000 to $34,999 | 9,282 (6.3%) | 8,756 (7.1%) |
| $35,000 to $39,999 | 9,055 (6.2%) | 8,060 (6.5%) |
| $40,000 to $44,999 | 8,530 (5.8%) | 7,641 (6.2%) |
| $45,000 to $49,999 | 9,258 (6.3%) | 7,889 (6.4%) |
| $50,000 to $54,999 | 7,216 (4.9%) | 5,476 (4.4%) |
| $55,000 to $64,999 | 12,160 (8.3%) | 9,173 (7.4%) |
| $65,000 to $74,999 | 8,948 (6.1%) | 6,670 (5.4%) |
| $75,000 to $99,999 | 14,014 (9.6%) | 9,456 (7.7%) |
| $100,000+ | 23,283 (15.9%) | 9,184 (7.4%) |
| Total | 146,593 (100.0%) | 123,322 (100.0%) |
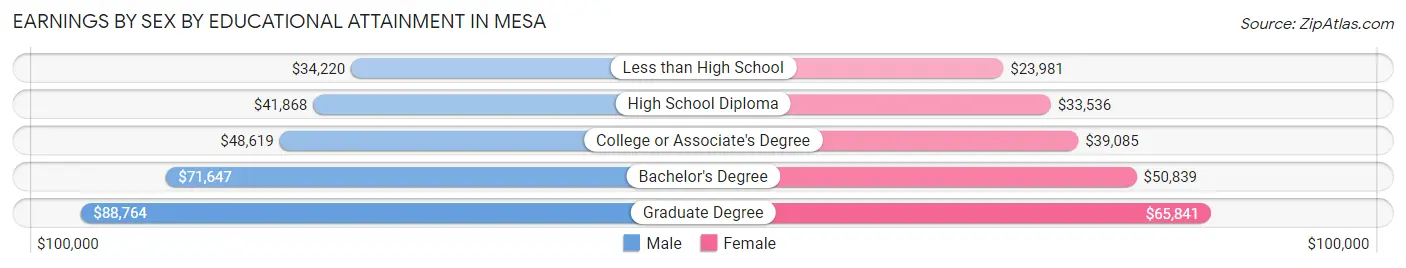
Earnings by Sex by Educational Attainment in Mesa
Average earnings in Mesa are $51,261 for men and $40,823 for women, a difference of 20.4%. Men with an educational attainment of graduate degree enjoy the highest average annual earnings of $88,764, while those with less than high school education earn the least with $34,220. Women with an educational attainment of graduate degree earn the most with the average annual earnings of $65,841, while those with less than high school education have the smallest earnings of $23,981.
| Educational Attainment | Male Income | Female Income |
| Less than High School | $34,220 | $23,981 |
| High School Diploma | $41,868 | $33,536 |
| College or Associate's Degree | $48,619 | $39,085 |
| Bachelor's Degree | $71,647 | $50,839 |
| Graduate Degree | $88,764 | $65,841 |
| Total | $51,261 | $40,823 |
Family Income in Mesa
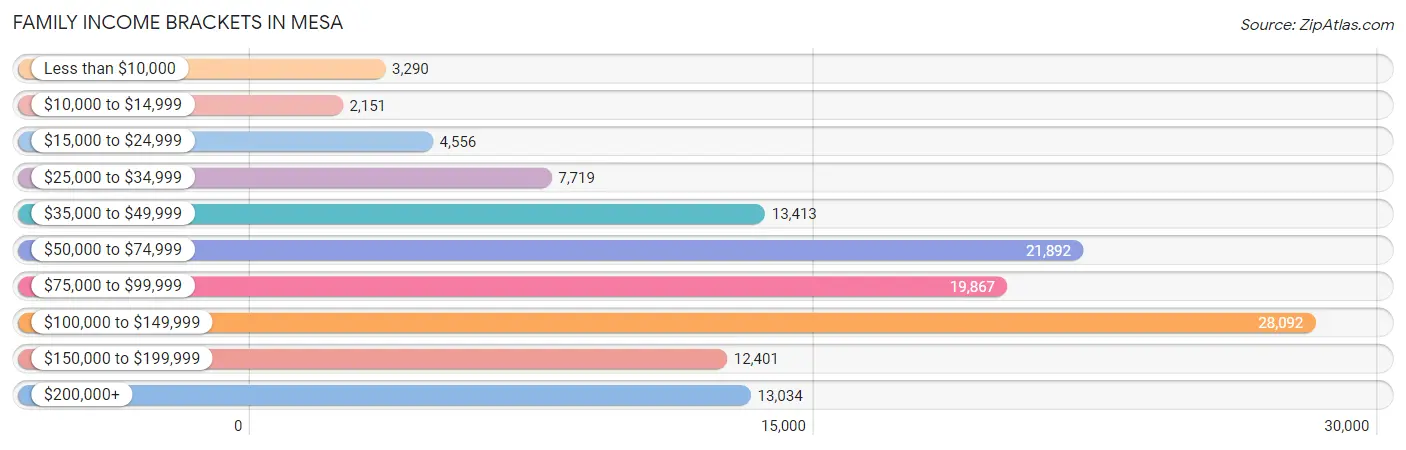
Family Income Brackets in Mesa
According to the Mesa family income data, there are 28,092 families falling into the $100,000 to $149,999 income range, which is the most common income bracket and makes up 22.2% of all families. Conversely, the $10,000 to $14,999 income bracket is the least frequent group with only 2,151 families (1.7%) belonging to this category.
| Income Bracket | # Families | % Families |
| Less than $10,000 | 3,290 | 2.6% |
| $10,000 to $14,999 | 2,151 | 1.7% |
| $15,000 to $24,999 | 4,556 | 3.6% |
| $25,000 to $34,999 | 7,719 | 6.1% |
| $35,000 to $49,999 | 13,413 | 10.6% |
| $50,000 to $74,999 | 21,892 | 17.3% |
| $75,000 to $99,999 | 19,867 | 15.7% |
| $100,000 to $149,999 | 28,092 | 22.2% |
| $150,000 to $199,999 | 12,401 | 9.8% |
| $200,000+ | 13,034 | 10.3% |
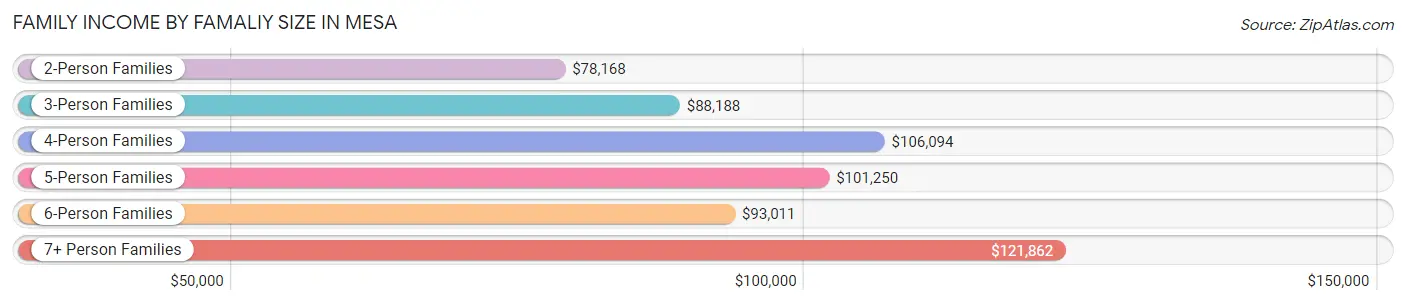
Family Income by Famaliy Size in Mesa
7+ person families (3,646 | 2.9%) account for the highest median family income in Mesa with $121,862 per family, while 2-person families (62,170 | 49.1%) have the highest median income of $39,084 per family member.
| Income Bracket | # Families | Median Income |
| 2-Person Families | 62,170 (49.1%) | $78,168 |
| 3-Person Families | 25,130 (19.9%) | $88,188 |
| 4-Person Families | 19,819 (15.7%) | $106,094 |
| 5-Person Families | 10,978 (8.7%) | $101,250 |
| 6-Person Families | 4,799 (3.8%) | $93,011 |
| 7+ Person Families | 3,646 (2.9%) | $121,862 |
| Total | 126,542 (100.0%) | $87,185 |
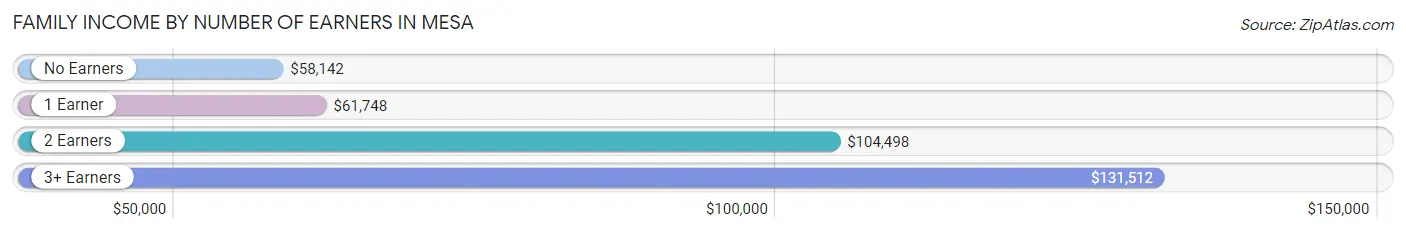
Family Income by Number of Earners in Mesa
The median family income in Mesa is $87,185, with families comprising 3+ earners (16,124) having the highest median family income of $131,512, while families with no earners (20,200) have the lowest median family income of $58,142, accounting for 12.7% and 16.0% of families, respectively.
| Number of Earners | # Families | Median Income |
| No Earners | 20,200 (16.0%) | $58,142 |
| 1 Earner | 40,934 (32.4%) | $61,748 |
| 2 Earners | 49,284 (39.0%) | $104,498 |
| 3+ Earners | 16,124 (12.7%) | $131,512 |
| Total | 126,542 (100.0%) | $87,185 |
Household Income in Mesa
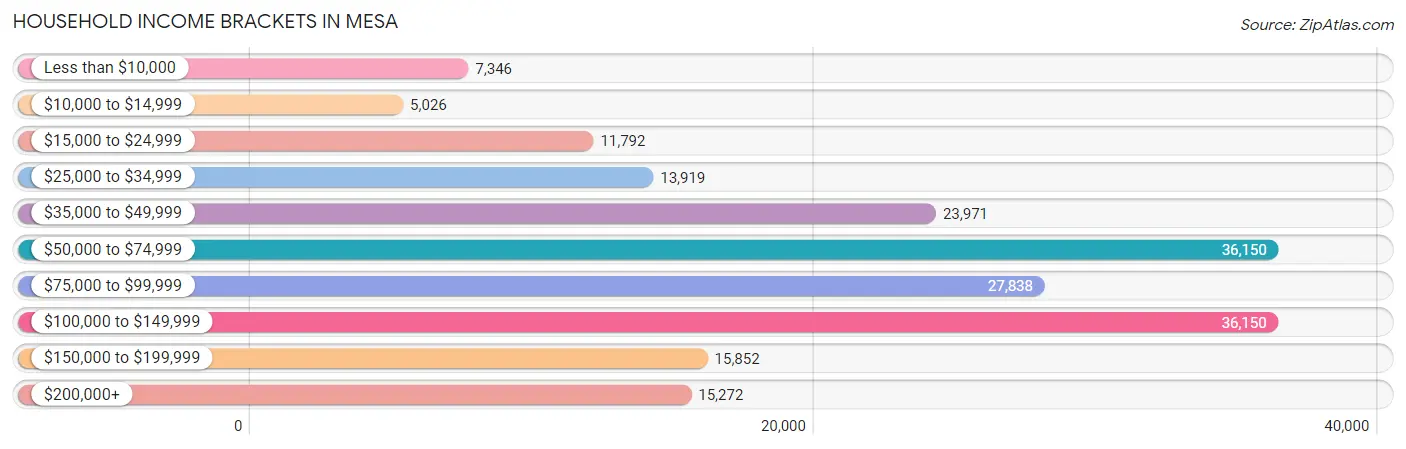
Household Income Brackets in Mesa
With 36,150 households falling in the category, the $50,000 to $74,999 income range is the most frequent in Mesa, accounting for 18.7% of all households. In contrast, only 5,026 households (2.6%) fall into the $10,000 to $14,999 income bracket, making it the least populous group.
| Income Bracket | # Households | % Households |
| Less than $10,000 | 7,346 | 3.8% |
| $10,000 to $14,999 | 5,026 | 2.6% |
| $15,000 to $24,999 | 11,792 | 6.1% |
| $25,000 to $34,999 | 13,919 | 7.2% |
| $35,000 to $49,999 | 23,971 | 12.4% |
| $50,000 to $74,999 | 36,150 | 18.7% |
| $75,000 to $99,999 | 27,838 | 14.4% |
| $100,000 to $149,999 | 36,150 | 18.7% |
| $150,000 to $199,999 | 15,852 | 8.2% |
| $200,000+ | 15,272 | 7.9% |
Household Income by Householder Age in Mesa
The median household income in Mesa is $73,766, with the highest median household income of $88,999 found in the 45 to 64 years age bracket for the primary householder. A total of 65,294 households (33.8%) fall into this category. Meanwhile, the 15 to 24 years age bracket for the primary householder has the lowest median household income of $49,813, with 9,760 households (5.1%) in this group.
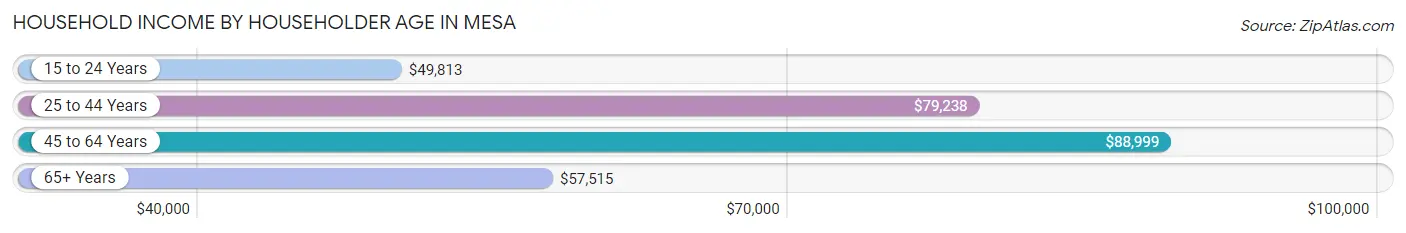
| Income Bracket | # Households | Median Income |
| 15 to 24 Years | 9,760 (5.1%) | $49,813 |
| 25 to 44 Years | 66,628 (34.5%) | $79,238 |
| 45 to 64 Years | 65,294 (33.8%) | $88,999 |
| 65+ Years | 51,634 (26.7%) | $57,515 |
| Total | 193,316 (100.0%) | $73,766 |
Poverty in Mesa
Income Below Poverty by Sex and Age in Mesa
With 10.4% poverty level for males and 12.0% for females among the residents of Mesa, 5 year old males and 5 year old females are the most vulnerable to poverty, with 660 males (20.9%) and 526 females (18.5%) in their respective age groups living below the poverty level.
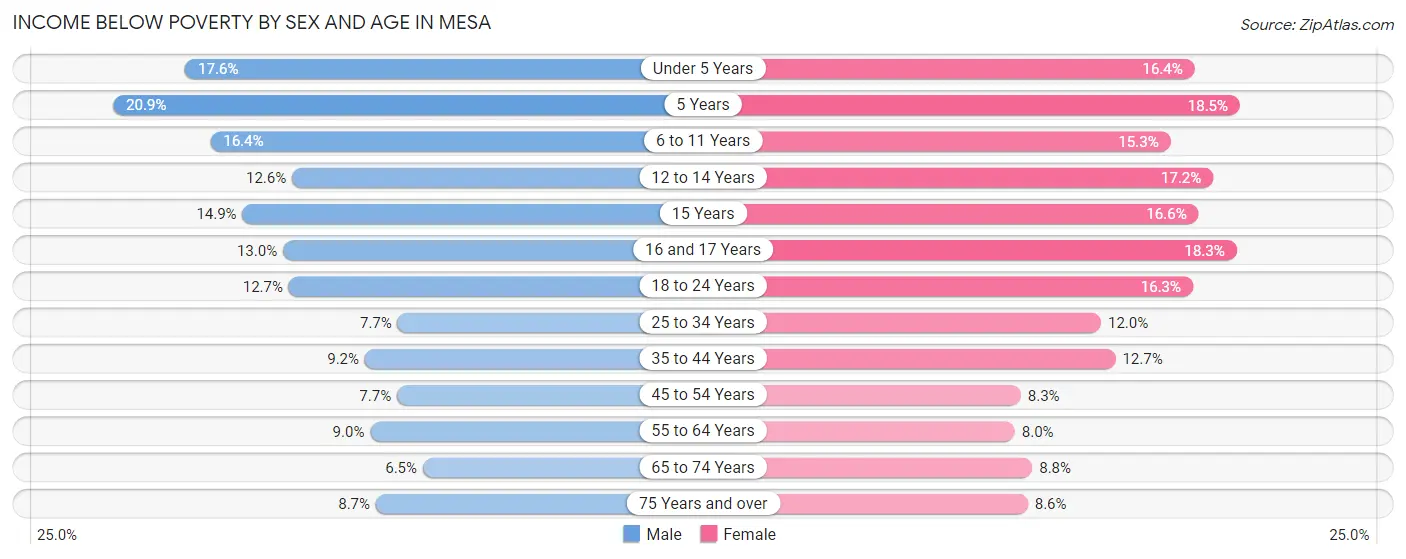
| Age Bracket | Male | Female |
| Under 5 Years | 2,835 (17.5%) | 2,328 (16.4%) |
| 5 Years | 660 (20.9%) | 526 (18.5%) |
| 6 to 11 Years | 3,125 (16.4%) | 2,860 (15.2%) |
| 12 to 14 Years | 1,270 (12.6%) | 1,815 (17.2%) |
| 15 Years | 570 (14.9%) | 468 (16.6%) |
| 16 and 17 Years | 759 (13.0%) | 1,078 (18.3%) |
| 18 to 24 Years | 3,107 (12.7%) | 3,688 (16.3%) |
| 25 to 34 Years | 3,071 (7.7%) | 4,437 (12.0%) |
| 35 to 44 Years | 2,866 (9.2%) | 3,880 (12.7%) |
| 45 to 54 Years | 2,258 (7.7%) | 2,436 (8.3%) |
| 55 to 64 Years | 2,478 (9.0%) | 2,426 (8.0%) |
| 65 to 74 Years | 1,473 (6.5%) | 2,215 (8.8%) |
| 75 Years and over | 1,332 (8.7%) | 1,761 (8.6%) |
| Total | 25,804 (10.4%) | 29,918 (12.0%) |
Income Above Poverty by Sex and Age in Mesa
According to the poverty statistics in Mesa, males aged 65 to 74 years and females aged 55 to 64 years are the age groups that are most secure financially, with 93.5% of males and 92.0% of females in these age groups living above the poverty line.
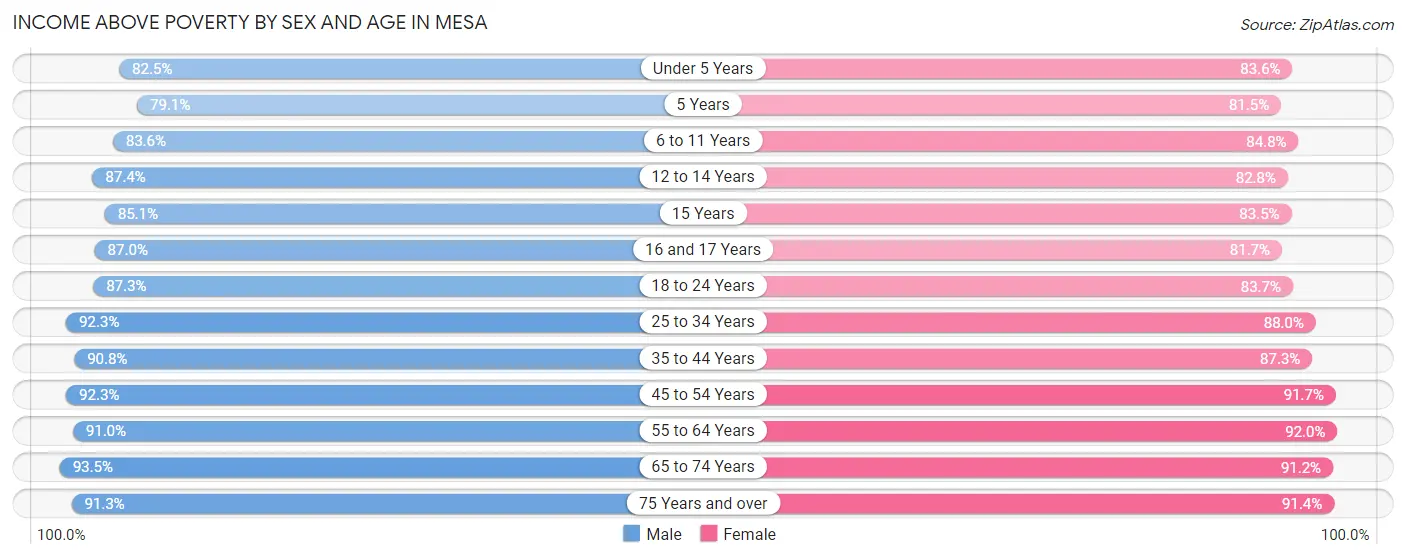
| Age Bracket | Male | Female |
| Under 5 Years | 13,322 (82.5%) | 11,897 (83.6%) |
| 5 Years | 2,499 (79.1%) | 2,322 (81.5%) |
| 6 to 11 Years | 15,955 (83.6%) | 15,890 (84.8%) |
| 12 to 14 Years | 8,819 (87.4%) | 8,721 (82.8%) |
| 15 Years | 3,259 (85.1%) | 2,360 (83.5%) |
| 16 and 17 Years | 5,073 (87.0%) | 4,805 (81.7%) |
| 18 to 24 Years | 21,272 (87.3%) | 18,949 (83.7%) |
| 25 to 34 Years | 36,880 (92.3%) | 32,447 (88.0%) |
| 35 to 44 Years | 28,268 (90.8%) | 26,675 (87.3%) |
| 45 to 54 Years | 27,003 (92.3%) | 26,873 (91.7%) |
| 55 to 64 Years | 25,173 (91.0%) | 27,790 (92.0%) |
| 65 to 74 Years | 21,130 (93.5%) | 22,848 (91.2%) |
| 75 Years and over | 13,981 (91.3%) | 18,643 (91.4%) |
| Total | 222,634 (89.6%) | 220,220 (88.0%) |
Income Below Poverty Among Married-Couple Families in Mesa
The poverty statistics for married-couple families in Mesa show that 4.9% or 4,493 of the total 90,873 families live below the poverty line. Families with 5 or more children have the highest poverty rate of 15.3%, comprising of 177 families. On the other hand, families with no children have the lowest poverty rate of 3.8%, which includes 2,072 families.
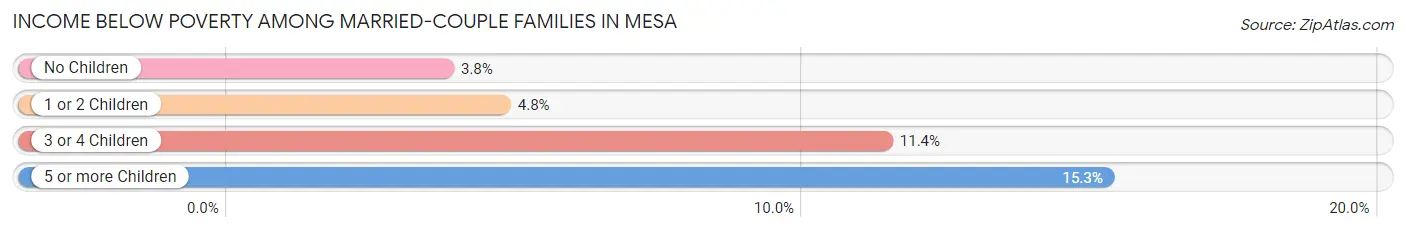
| Children | Above Poverty | Below Poverty |
| No Children | 53,045 (96.2%) | 2,072 (3.8%) |
| 1 or 2 Children | 24,336 (95.3%) | 1,213 (4.8%) |
| 3 or 4 Children | 8,016 (88.6%) | 1,031 (11.4%) |
| 5 or more Children | 983 (84.7%) | 177 (15.3%) |
| Total | 86,380 (95.1%) | 4,493 (4.9%) |
Income Below Poverty Among Single-Parent Households in Mesa
According to the poverty data in Mesa, 9.0% or 995 single-father households and 18.7% or 4,606 single-mother households are living below the poverty line. Among single-father households, those with 3 or 4 children have the highest poverty rate, with 161 households (16.4%) experiencing poverty. Likewise, among single-mother households, those with 5 or more children have the highest poverty rate, with 324 households (87.3%) falling below the poverty line.
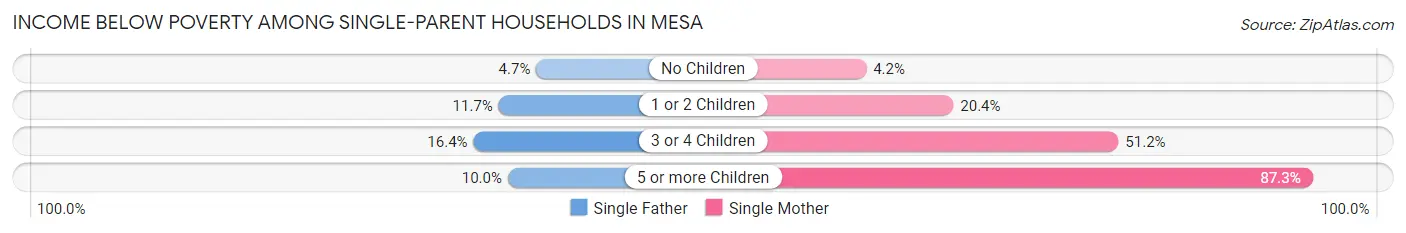
| Children | Single Father | Single Mother |
| No Children | 227 (4.7%) | 379 (4.2%) |
| 1 or 2 Children | 581 (11.7%) | 2,588 (20.4%) |
| 3 or 4 Children | 161 (16.4%) | 1,315 (51.2%) |
| 5 or more Children | 26 (10.0%) | 324 (87.3%) |
| Total | 995 (9.0%) | 4,606 (18.7%) |
Income Below Poverty Among Married-Couple vs Single-Parent Households in Mesa
The poverty data for Mesa shows that 4,493 of the married-couple family households (4.9%) and 5,601 of the single-parent households (15.7%) are living below the poverty level. Within the married-couple family households, those with 5 or more children have the highest poverty rate, with 177 households (15.3%) falling below the poverty line. Among the single-parent households, those with 5 or more children have the highest poverty rate, with 350 household (55.5%) living below poverty.
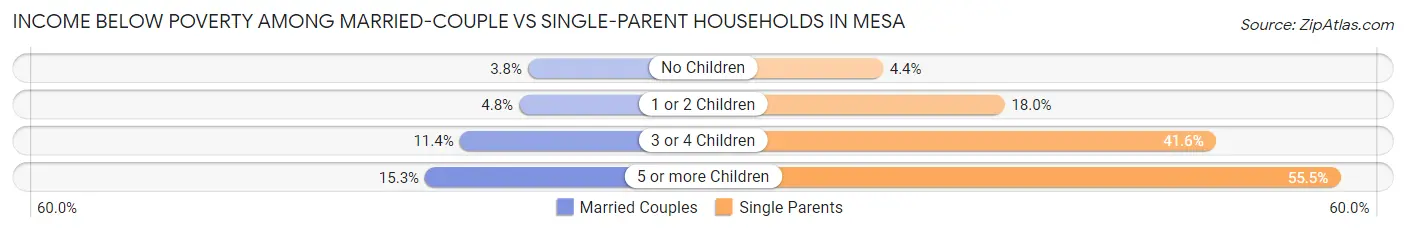
| Children | Married-Couple Families | Single-Parent Households |
| No Children | 2,072 (3.8%) | 606 (4.4%) |
| 1 or 2 Children | 1,213 (4.8%) | 3,169 (18.0%) |
| 3 or 4 Children | 1,031 (11.4%) | 1,476 (41.5%) |
| 5 or more Children | 177 (15.3%) | 350 (55.5%) |
| Total | 4,493 (4.9%) | 5,601 (15.7%) |
Race in Mesa
The most populous races in Mesa are White / Caucasian (363,151 | 72.1%), Hispanic or Latino (137,665 | 27.4%), and Two or more Races (59,150 | 11.7%).
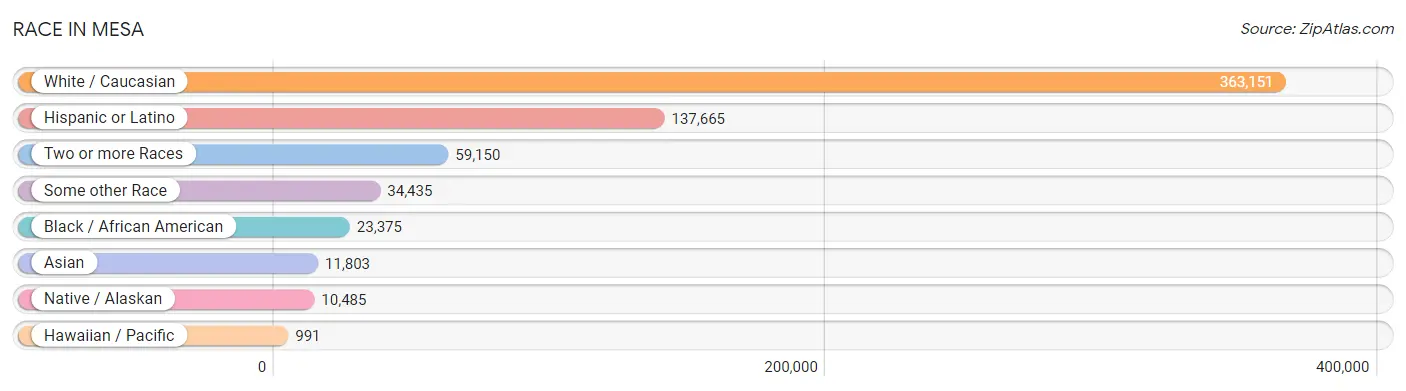
| Race | # Population | % Population |
| Asian | 11,803 | 2.3% |
| Black / African American | 23,375 | 4.6% |
| Hawaiian / Pacific | 991 | 0.2% |
| Hispanic or Latino | 137,665 | 27.4% |
| Native / Alaskan | 10,485 | 2.1% |
| White / Caucasian | 363,151 | 72.1% |
| Two or more Races | 59,150 | 11.7% |
| Some other Race | 34,435 | 6.8% |
| Total | 503,390 | 100.0% |
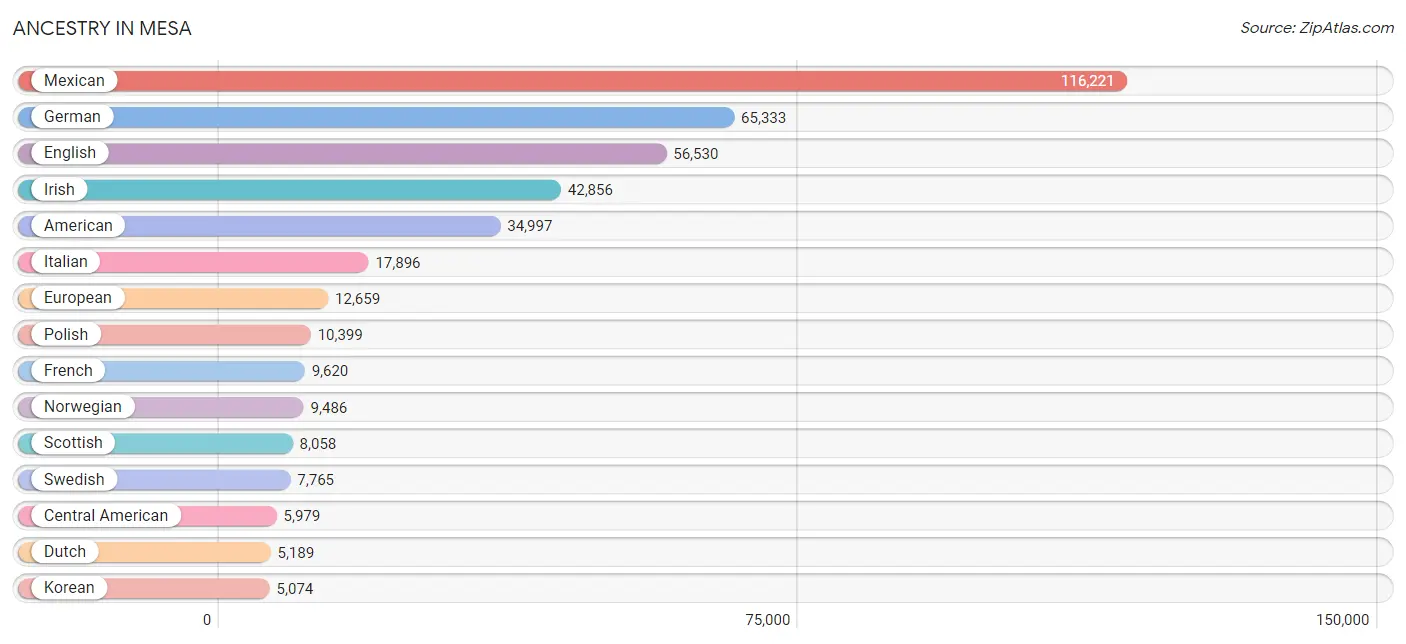
Ancestry in Mesa
The most populous ancestries reported in Mesa are Mexican (116,221 | 23.1%), German (65,333 | 13.0%), English (56,530 | 11.2%), Irish (42,856 | 8.5%), and American (34,997 | 7.0%), together accounting for 62.8% of all Mesa residents.
| Ancestry | # Population | % Population |
| Afghan | 38 | 0.0% |
| African | 735 | 0.2% |
| Alaska Native | 12 | 0.0% |
| Alaskan Athabascan | 21 | 0.0% |
| Albanian | 128 | 0.0% |
| Aleut | 28 | 0.0% |
| Alsatian | 25 | 0.0% |
| American | 34,997 | 7.0% |
| Apache | 976 | 0.2% |
| Arab | 2,197 | 0.4% |
| Arapaho | 69 | 0.0% |
| Argentinean | 441 | 0.1% |
| Armenian | 155 | 0.0% |
| Assyrian / Chaldean / Syriac | 108 | 0.0% |
| Australian | 237 | 0.1% |
| Austrian | 701 | 0.1% |
| Bahamian | 25 | 0.0% |
| Bangladeshi | 18 | 0.0% |
| Barbadian | 7 | 0.0% |
| Basque | 96 | 0.0% |
| Belgian | 498 | 0.1% |
| Belizean | 114 | 0.0% |
| Bhutanese | 2,555 | 0.5% |
| Blackfeet | 336 | 0.1% |
| Brazilian | 543 | 0.1% |
| British | 3,535 | 0.7% |
| British West Indian | 16 | 0.0% |
| Bulgarian | 24 | 0.0% |
| Burmese | 1,891 | 0.4% |
| Cajun | 91 | 0.0% |
| Canadian | 2,252 | 0.4% |
| Celtic | 49 | 0.0% |
| Central American | 5,979 | 1.2% |
| Central American Indian | 418 | 0.1% |
| Cherokee | 745 | 0.2% |
| Cheyenne | 1 | 0.0% |
| Chickasaw | 247 | 0.1% |
| Chilean | 202 | 0.0% |
| Chinese | 23 | 0.0% |
| Chippewa | 280 | 0.1% |
| Choctaw | 444 | 0.1% |
| Colombian | 737 | 0.2% |
| Comanche | 13 | 0.0% |
| Costa Rican | 252 | 0.1% |
| Cree | 27 | 0.0% |
| Creek | 58 | 0.0% |
| Croatian | 858 | 0.2% |
| Cuban | 1,056 | 0.2% |
| Czech | 1,521 | 0.3% |
| Czechoslovakian | 358 | 0.1% |
| Danish | 3,827 | 0.8% |
| Delaware | 18 | 0.0% |
| Dominican | 501 | 0.1% |
| Dutch | 5,189 | 1.0% |
| Dutch West Indian | 10 | 0.0% |
| Eastern European | 1,127 | 0.2% |
| Ecuadorian | 330 | 0.1% |
| Egyptian | 75 | 0.0% |
| English | 56,530 | 11.2% |
| Estonian | 25 | 0.0% |
| Ethiopian | 108 | 0.0% |
| European | 12,659 | 2.5% |
| Fijian | 73 | 0.0% |
| Filipino | 211 | 0.0% |
| Finnish | 980 | 0.2% |
| French | 9,620 | 1.9% |
| French American Indian | 96 | 0.0% |
| French Canadian | 2,217 | 0.4% |
| German | 65,333 | 13.0% |
| German Russian | 26 | 0.0% |
| Ghanaian | 11 | 0.0% |
| Greek | 1,172 | 0.2% |
| Guamanian / Chamorro | 243 | 0.1% |
| Guatemalan | 2,299 | 0.5% |
| Guyanese | 29 | 0.0% |
| Haitian | 83 | 0.0% |
| Honduran | 443 | 0.1% |
| Hopi | 505 | 0.1% |
| Houma | 3 | 0.0% |
| Hungarian | 1,690 | 0.3% |
| Icelander | 81 | 0.0% |
| Indian (Asian) | 4,065 | 0.8% |
| Indonesian | 45 | 0.0% |
| Inupiat | 122 | 0.0% |
| Iranian | 249 | 0.1% |
| Iraqi | 387 | 0.1% |
| Irish | 42,856 | 8.5% |
| Iroquois | 71 | 0.0% |
| Israeli | 105 | 0.0% |
| Italian | 17,896 | 3.6% |
| Jamaican | 900 | 0.2% |
| Japanese | 92 | 0.0% |
| Jordanian | 32 | 0.0% |
| Kenyan | 58 | 0.0% |
| Kiowa | 34 | 0.0% |
| Korean | 5,074 | 1.0% |
| Laotian | 304 | 0.1% |
| Latvian | 34 | 0.0% |
| Lebanese | 847 | 0.2% |
| Liberian | 53 | 0.0% |
| Lithuanian | 677 | 0.1% |
| Luxembourger | 148 | 0.0% |
| Macedonian | 36 | 0.0% |
| Malaysian | 186 | 0.0% |
| Maltese | 82 | 0.0% |
| Marshallese | 109 | 0.0% |
| Mexican | 116,221 | 23.1% |
| Mexican American Indian | 654 | 0.1% |
| Mongolian | 20 | 0.0% |
| Moroccan | 118 | 0.0% |
| Native Hawaiian | 984 | 0.2% |
| Navajo | 5,019 | 1.0% |
| New Zealander | 7 | 0.0% |
| Nicaraguan | 325 | 0.1% |
| Nigerian | 250 | 0.1% |
| Northern European | 875 | 0.2% |
| Norwegian | 9,486 | 1.9% |
| Pakistani | 681 | 0.1% |
| Palestinian | 50 | 0.0% |
| Panamanian | 352 | 0.1% |
| Paraguayan | 11 | 0.0% |
| Pennsylvania German | 108 | 0.0% |
| Peruvian | 814 | 0.2% |
| Pima | 1,924 | 0.4% |
| Polish | 10,399 | 2.1% |
| Portuguese | 1,289 | 0.3% |
| Potawatomi | 39 | 0.0% |
| Pueblo | 199 | 0.0% |
| Puerto Rican | 3,941 | 0.8% |
| Puget Sound Salish | 12 | 0.0% |
| Romanian | 511 | 0.1% |
| Russian | 1,853 | 0.4% |
| Salvadoran | 2,308 | 0.5% |
| Samoan | 408 | 0.1% |
| Scandinavian | 2,200 | 0.4% |
| Scotch-Irish | 3,204 | 0.6% |
| Scottish | 8,058 | 1.6% |
| Seminole | 33 | 0.0% |
| Senegalese | 21 | 0.0% |
| Serbian | 395 | 0.1% |
| Shoshone | 64 | 0.0% |
| Sierra Leonean | 14 | 0.0% |
| Sioux | 477 | 0.1% |
| Slavic | 128 | 0.0% |
| Slovak | 619 | 0.1% |
| Slovene | 220 | 0.0% |
| Somali | 170 | 0.0% |
| South African | 150 | 0.0% |
| South American | 3,043 | 0.6% |
| South American Indian | 107 | 0.0% |
| Spaniard | 2,284 | 0.4% |
| Spanish | 1,407 | 0.3% |
| Spanish American | 53 | 0.0% |
| Sri Lankan | 2,541 | 0.5% |
| Subsaharan African | 1,718 | 0.3% |
| Sudanese | 65 | 0.0% |
| Swedish | 7,765 | 1.5% |
| Swiss | 1,476 | 0.3% |
| Syrian | 43 | 0.0% |
| Thai | 1,321 | 0.3% |
| Tlingit-Haida | 41 | 0.0% |
| Tohono O'Odham | 543 | 0.1% |
| Tongan | 225 | 0.0% |
| Trinidadian and Tobagonian | 114 | 0.0% |
| Turkish | 117 | 0.0% |
| U.S. Virgin Islander | 9 | 0.0% |
| Ukrainian | 732 | 0.2% |
| Uruguayan | 10 | 0.0% |
| Ute | 108 | 0.0% |
| Venezuelan | 385 | 0.1% |
| Vietnamese | 78 | 0.0% |
| Welsh | 3,844 | 0.8% |
| West Indian | 53 | 0.0% |
| Yaqui | 341 | 0.1% |
| Yugoslavian | 164 | 0.0% |
| Yuman | 357 | 0.1% | View All 176 Rows |
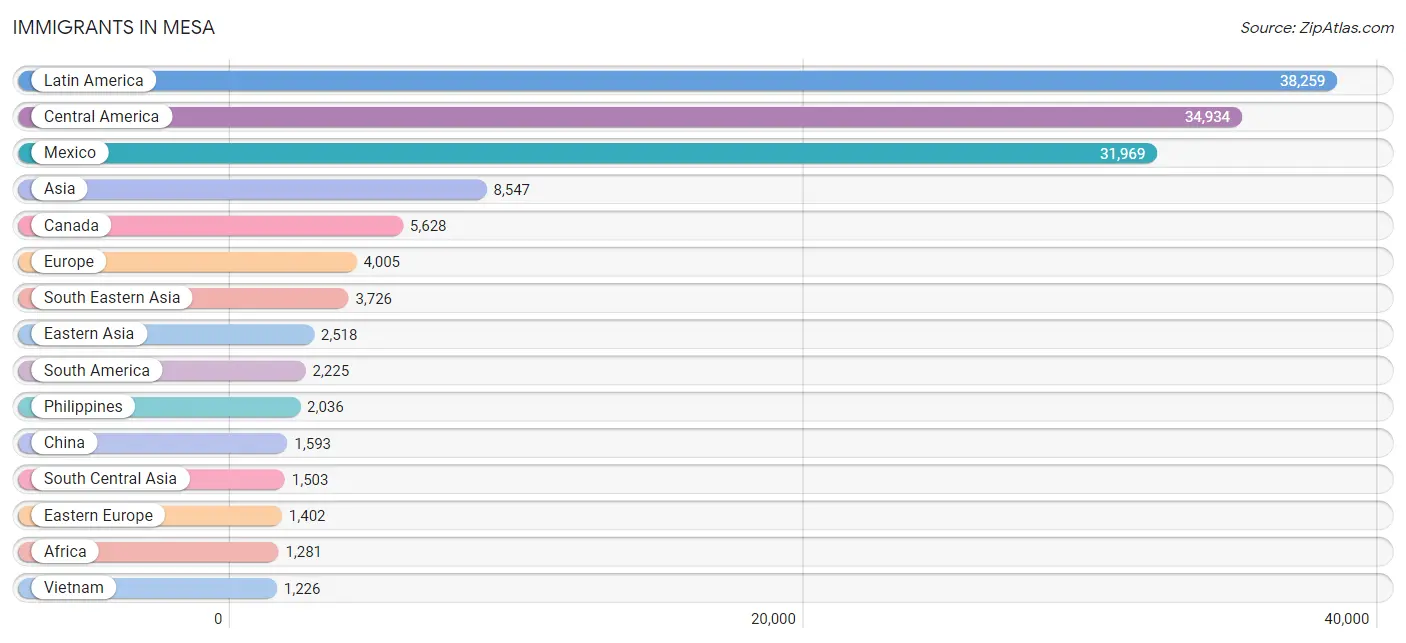
Immigrants in Mesa
The most numerous immigrant groups reported in Mesa came from Latin America (38,259 | 7.6%), Central America (34,934 | 6.9%), Mexico (31,969 | 6.4%), Asia (8,547 | 1.7%), and Canada (5,628 | 1.1%), together accounting for 23.7% of all Mesa residents.
| Immigration Origin | # Population | % Population |
| Afghanistan | 48 | 0.0% |
| Africa | 1,281 | 0.3% |
| Albania | 95 | 0.0% |
| Argentina | 204 | 0.0% |
| Asia | 8,547 | 1.7% |
| Australia | 214 | 0.0% |
| Austria | 57 | 0.0% |
| Bangladesh | 170 | 0.0% |
| Barbados | 60 | 0.0% |
| Belarus | 102 | 0.0% |
| Belgium | 62 | 0.0% |
| Belize | 112 | 0.0% |
| Bosnia and Herzegovina | 101 | 0.0% |
| Brazil | 252 | 0.1% |
| Bulgaria | 10 | 0.0% |
| Cambodia | 10 | 0.0% |
| Cameroon | 100 | 0.0% |
| Canada | 5,628 | 1.1% |
| Caribbean | 1,100 | 0.2% |
| Central America | 34,934 | 6.9% |
| Chile | 341 | 0.1% |
| China | 1,593 | 0.3% |
| Colombia | 395 | 0.1% |
| Congo | 47 | 0.0% |
| Costa Rica | 81 | 0.0% |
| Croatia | 45 | 0.0% |
| Cuba | 241 | 0.1% |
| Czechoslovakia | 122 | 0.0% |
| Denmark | 11 | 0.0% |
| Dominican Republic | 324 | 0.1% |
| Eastern Africa | 387 | 0.1% |
| Eastern Asia | 2,518 | 0.5% |
| Eastern Europe | 1,402 | 0.3% |
| Ecuador | 139 | 0.0% |
| Egypt | 22 | 0.0% |
| El Salvador | 1,110 | 0.2% |
| England | 399 | 0.1% |
| Eritrea | 34 | 0.0% |
| Ethiopia | 26 | 0.0% |
| Europe | 4,005 | 0.8% |
| Fiji | 94 | 0.0% |
| France | 163 | 0.0% |
| Germany | 703 | 0.1% |
| Ghana | 32 | 0.0% |
| Greece | 25 | 0.0% |
| Guatemala | 982 | 0.2% |
| Guyana | 79 | 0.0% |
| Haiti | 13 | 0.0% |
| Honduras | 377 | 0.1% |
| Hong Kong | 86 | 0.0% |
| Hungary | 54 | 0.0% |
| India | 641 | 0.1% |
| Indonesia | 160 | 0.0% |
| Iran | 209 | 0.0% |
| Iraq | 507 | 0.1% |
| Ireland | 43 | 0.0% |
| Israel | 32 | 0.0% |
| Italy | 310 | 0.1% |
| Jamaica | 356 | 0.1% |
| Japan | 391 | 0.1% |
| Jordan | 39 | 0.0% |
| Kazakhstan | 34 | 0.0% |
| Kenya | 264 | 0.1% |
| Korea | 527 | 0.1% |
| Kuwait | 18 | 0.0% |
| Laos | 64 | 0.0% |
| Latin America | 38,259 | 7.6% |
| Lebanon | 75 | 0.0% |
| Liberia | 53 | 0.0% |
| Lithuania | 7 | 0.0% |
| Malaysia | 17 | 0.0% |
| Mexico | 31,969 | 6.4% |
| Micronesia | 27 | 0.0% |
| Middle Africa | 195 | 0.0% |
| Morocco | 116 | 0.0% |
| Nepal | 9 | 0.0% |
| Netherlands | 63 | 0.0% |
| Nicaragua | 90 | 0.0% |
| Nigeria | 181 | 0.0% |
| North Macedonia | 36 | 0.0% |
| Northern Africa | 224 | 0.0% |
| Northern Europe | 1,094 | 0.2% |
| Norway | 38 | 0.0% |
| Oceania | 560 | 0.1% |
| Pakistan | 380 | 0.1% |
| Panama | 213 | 0.0% |
| Peru | 515 | 0.1% |
| Philippines | 2,036 | 0.4% |
| Poland | 223 | 0.0% |
| Portugal | 9 | 0.0% |
| Romania | 221 | 0.0% |
| Russia | 148 | 0.0% |
| Saudi Arabia | 14 | 0.0% |
| Scotland | 172 | 0.0% |
| Senegal | 12 | 0.0% |
| Serbia | 133 | 0.0% |
| Sierra Leone | 41 | 0.0% |
| Singapore | 12 | 0.0% |
| Somalia | 39 | 0.0% |
| South Africa | 115 | 0.0% |
| South America | 2,225 | 0.4% |
| South Central Asia | 1,503 | 0.3% |
| South Eastern Asia | 3,726 | 0.7% |
| Southern Europe | 370 | 0.1% |
| Spain | 26 | 0.0% |
| Sudan | 19 | 0.0% |
| Sweden | 54 | 0.0% |
| Switzerland | 13 | 0.0% |
| Syria | 10 | 0.0% |
| Taiwan | 197 | 0.0% |
| Thailand | 182 | 0.0% |
| Trinidad and Tobago | 97 | 0.0% |
| Turkey | 80 | 0.0% |
| Ukraine | 56 | 0.0% |
| Uruguay | 10 | 0.0% |
| Uzbekistan | 6 | 0.0% |
| Venezuela | 263 | 0.1% |
| Vietnam | 1,226 | 0.2% |
| Western Africa | 340 | 0.1% |
| Western Asia | 789 | 0.2% |
| Western Europe | 1,101 | 0.2% |
| Zimbabwe | 8 | 0.0% | View All 122 Rows |
Sex and Age in Mesa
Sex and Age in Mesa
The most populous age groups in Mesa are 25 to 29 Years (21,244 | 8.5%) for men and 25 to 29 Years (19,171 | 7.6%) for women.

| Age Bracket | Male | Female |
| Under 5 Years | 16,573 (6.6%) | 14,361 (5.7%) |
| 5 to 9 Years | 15,757 (6.3%) | 15,959 (6.3%) |
| 10 to 14 Years | 17,266 (6.9%) | 17,063 (6.8%) |
| 15 to 19 Years | 16,647 (6.6%) | 14,578 (5.8%) |
| 20 to 24 Years | 17,813 (7.1%) | 16,954 (6.7%) |
| 25 to 29 Years | 21,244 (8.5%) | 19,171 (7.6%) |
| 30 to 34 Years | 18,746 (7.5%) | 17,723 (7.0%) |
| 35 to 39 Years | 15,655 (6.2%) | 15,351 (6.1%) |
| 40 to 44 Years | 15,509 (6.2%) | 15,221 (6.0%) |
| 45 to 49 Years | 15,206 (6.1%) | 13,669 (5.4%) |
| 50 to 54 Years | 14,114 (5.6%) | 15,689 (6.2%) |
| 55 to 59 Years | 14,002 (5.6%) | 14,711 (5.8%) |
| 60 to 64 Years | 13,798 (5.5%) | 15,586 (6.2%) |
| 65 to 69 Years | 12,078 (4.8%) | 13,638 (5.4%) |
| 70 to 74 Years | 10,945 (4.4%) | 11,777 (4.7%) |
| 75 to 79 Years | 7,553 (3.0%) | 8,864 (3.5%) |
| 80 to 84 Years | 4,252 (1.7%) | 5,755 (2.3%) |
| 85 Years and over | 3,893 (1.5%) | 6,269 (2.5%) |
| Total | 251,051 (100.0%) | 252,339 (100.0%) |
Families and Households in Mesa
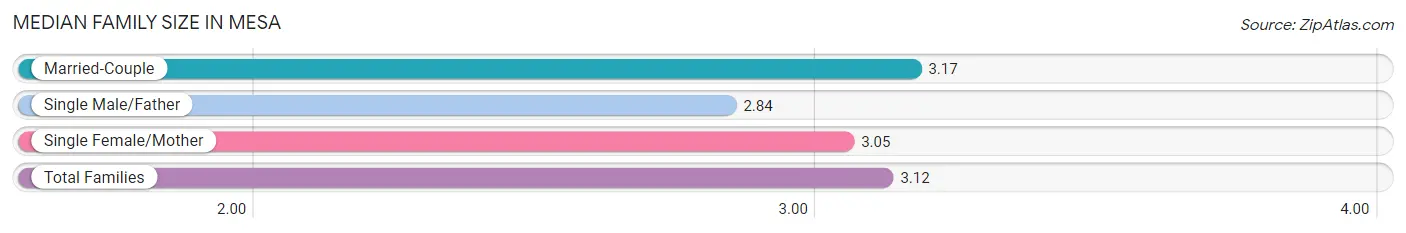
Median Family Size in Mesa
The median family size in Mesa is 3.12 persons per family, with married-couple families (90,873 | 71.8%) accounting for the largest median family size of 3.17 persons per family. On the other hand, single male/father families (11,041 | 8.7%) represent the smallest median family size with 2.84 persons per family.
| Family Type | # Families | Family Size |
| Married-Couple | 90,873 (71.8%) | 3.17 |
| Single Male/Father | 11,041 (8.7%) | 2.84 |
| Single Female/Mother | 24,628 (19.5%) | 3.05 |
| Total Families | 126,542 (100.0%) | 3.12 |
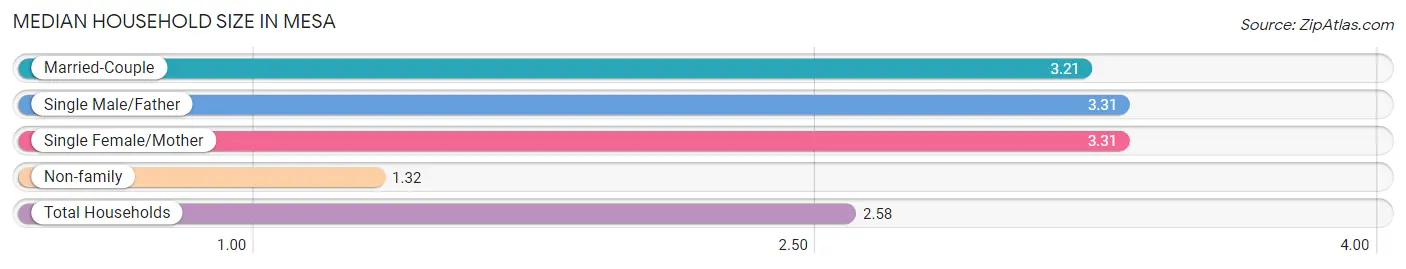
Median Household Size in Mesa
The median household size in Mesa is 2.58 persons per household, with single male/father households (11,041 | 5.7%) accounting for the largest median household size of 3.31 persons per household. non-family households (66,774 | 34.5%) represent the smallest median household size with 1.32 persons per household.
| Household Type | # Households | Household Size |
| Married-Couple | 90,873 (47.0%) | 3.21 |
| Single Male/Father | 11,041 (5.7%) | 3.31 |
| Single Female/Mother | 24,628 (12.7%) | 3.31 |
| Non-family | 66,774 (34.5%) | 1.32 |
| Total Households | 193,316 (100.0%) | 2.58 |
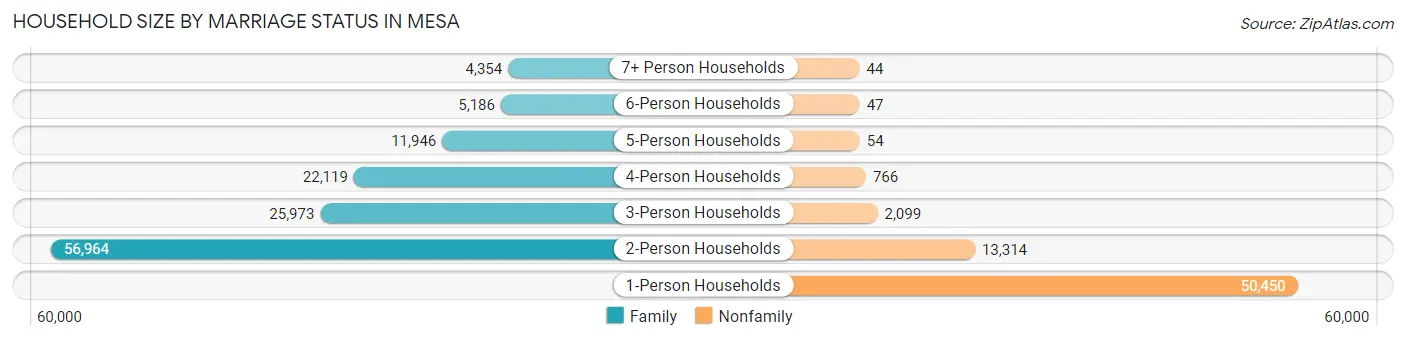
Household Size by Marriage Status in Mesa
Out of a total of 193,316 households in Mesa, 126,542 (65.5%) are family households, while 66,774 (34.5%) are nonfamily households. The most numerous type of family households are 2-person households, comprising 56,964, and the most common type of nonfamily households are 1-person households, comprising 50,450.
| Household Size | Family Households | Nonfamily Households |
| 1-Person Households | - | 50,450 (26.1%) |
| 2-Person Households | 56,964 (29.5%) | 13,314 (6.9%) |
| 3-Person Households | 25,973 (13.4%) | 2,099 (1.1%) |
| 4-Person Households | 22,119 (11.4%) | 766 (0.4%) |
| 5-Person Households | 11,946 (6.2%) | 54 (0.0%) |
| 6-Person Households | 5,186 (2.7%) | 47 (0.0%) |
| 7+ Person Households | 4,354 (2.2%) | 44 (0.0%) |
| Total | 126,542 (65.5%) | 66,774 (34.5%) |
Female Fertility in Mesa
Fertility by Age in Mesa
Average fertility rate in Mesa is 60.0 births per 1,000 women. Women in the age bracket of 20 to 34 years have the highest fertility rate with 96.0 births per 1,000 women. Women in the age bracket of 20 to 34 years acount for 75.1% of all women with births.
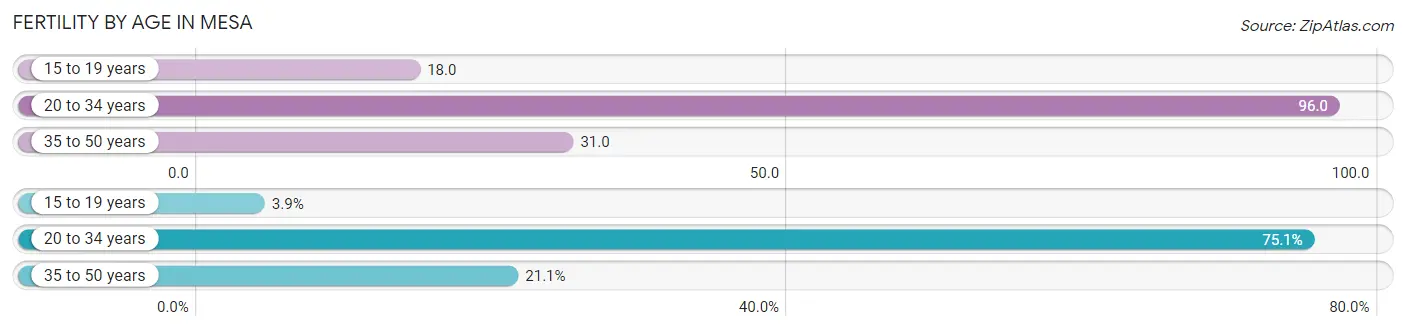
| Age Bracket | Women with Births | Births / 1,000 Women |
| 15 to 19 years | 266 (3.9%) | 18.0 |
| 20 to 34 years | 5,169 (75.1%) | 96.0 |
| 35 to 50 years | 1,450 (21.1%) | 31.0 |
| Total | 6,885 (100.0%) | 60.0 |
Fertility by Age by Marriage Status in Mesa
65.4% of women with births (6,885) in Mesa are married. The highest percentage of unmarried women with births falls into 15 to 19 years age bracket with 100.0% of them unmarried at the time of birth, while the lowest percentage of unmarried women with births belong to 35 to 50 years age bracket with 18.6% of them unmarried.
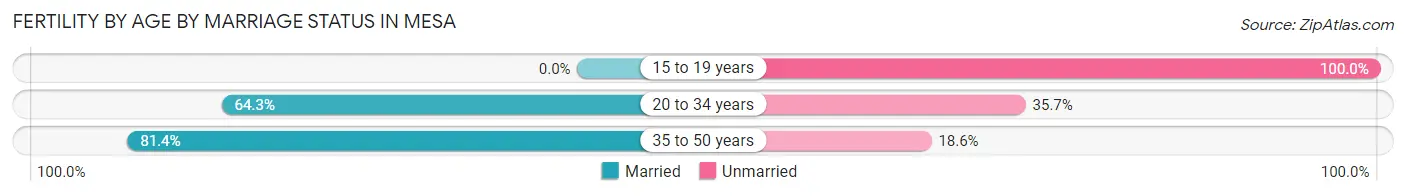
| Age Bracket | Married | Unmarried |
| 15 to 19 years | 0 (0.0%) | 266 (100.0%) |
| 20 to 34 years | 3,324 (64.3%) | 1,845 (35.7%) |
| 35 to 50 years | 1,180 (81.4%) | 270 (18.6%) |
| Total | 4,503 (65.4%) | 2,382 (34.6%) |
Fertility by Education in Mesa
Average fertility rate in Mesa is 60.0 births per 1,000 women. Women with the education attainment of graduate degree have the highest fertility rate of 72.0 births per 1,000 women, while women with the education attainment of less than high school have the lowest fertility at 48.0 births per 1,000 women. Women with the education attainment of college or associate's degree represent 36.9% of all women with births.
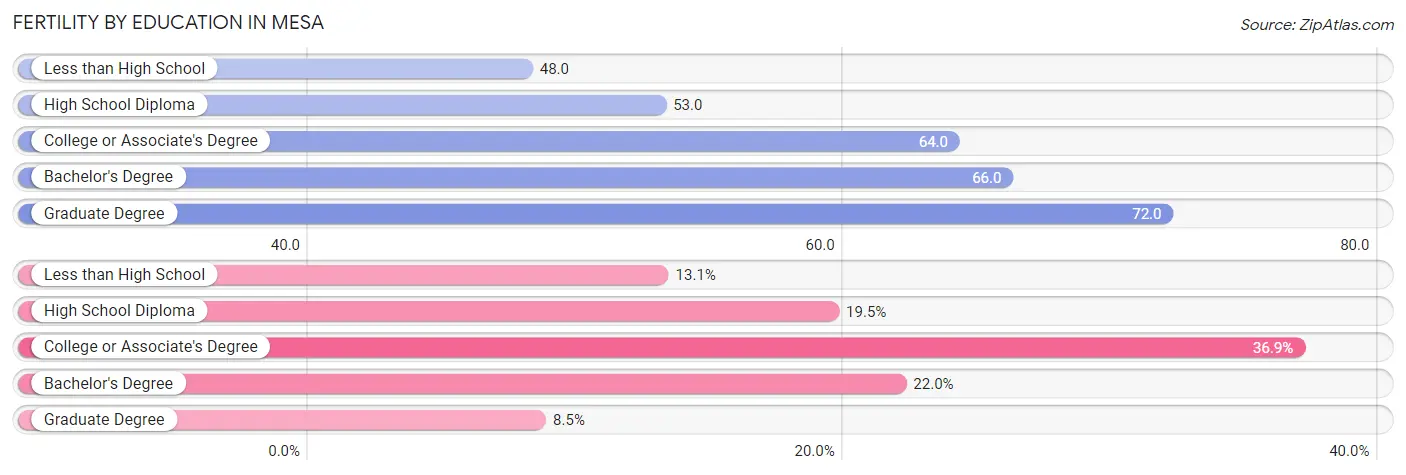
| Educational Attainment | Women with Births | Births / 1,000 Women |
| Less than High School | 901 (13.1%) | 48.0 |
| High School Diploma | 1,341 (19.5%) | 53.0 |
| College or Associate's Degree | 2,543 (36.9%) | 64.0 |
| Bachelor's Degree | 1,515 (22.0%) | 66.0 |
| Graduate Degree | 585 (8.5%) | 72.0 |
| Total | 6,885 (100.0%) | 60.0 |
Fertility by Education by Marriage Status in Mesa
34.6% of women with births in Mesa are unmarried. Women with the educational attainment of graduate degree are most likely to be married with 94.7% of them married at childbirth, while women with the educational attainment of high school diploma are least likely to be married with 54.4% of them unmarried at childbirth.
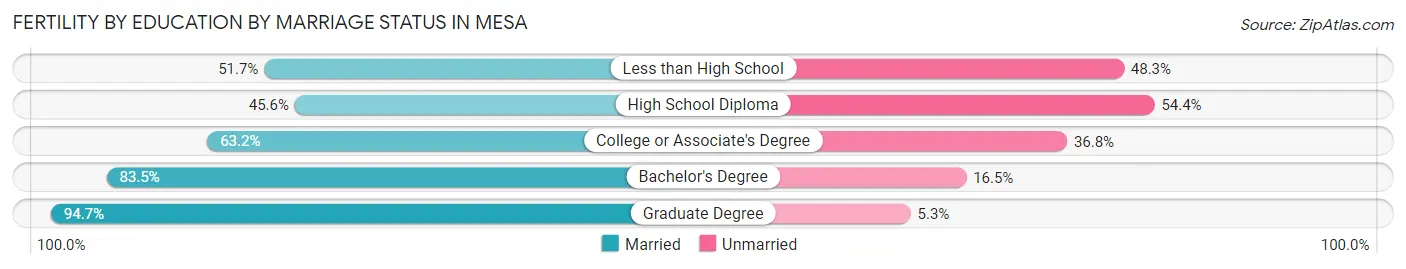
| Educational Attainment | Married | Unmarried |
| Less than High School | 466 (51.7%) | 435 (48.3%) |
| High School Diploma | 611 (45.6%) | 730 (54.4%) |
| College or Associate's Degree | 1,607 (63.2%) | 936 (36.8%) |
| Bachelor's Degree | 1,265 (83.5%) | 250 (16.5%) |
| Graduate Degree | 554 (94.7%) | 31 (5.3%) |
| Total | 4,503 (65.4%) | 2,382 (34.6%) |
Employment Characteristics in Mesa
Employment by Class of Employer in Mesa
Among the 245,454 employed individuals in Mesa, private company employees (179,947 | 73.3%), local government employees (15,791 | 6.4%), and self-employed (not incorporated) (14,997 | 6.1%) make up the most common classes of employment.
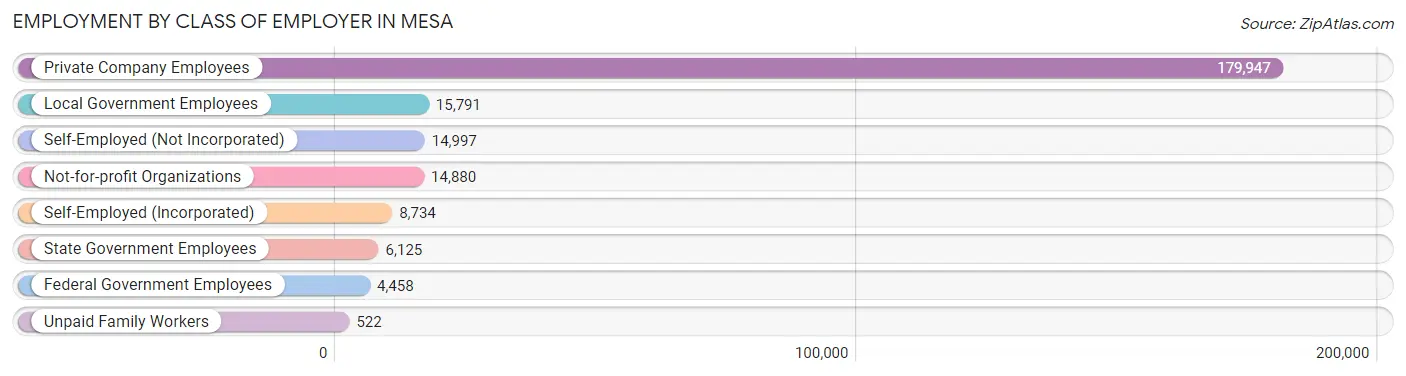
| Employer Class | # Employees | % Employees |
| Private Company Employees | 179,947 | 73.3% |
| Self-Employed (Incorporated) | 8,734 | 3.6% |
| Self-Employed (Not Incorporated) | 14,997 | 6.1% |
| Not-for-profit Organizations | 14,880 | 6.1% |
| Local Government Employees | 15,791 | 6.4% |
| State Government Employees | 6,125 | 2.5% |
| Federal Government Employees | 4,458 | 1.8% |
| Unpaid Family Workers | 522 | 0.2% |
| Total | 245,454 | 100.0% |
Employment Status by Age in Mesa
According to the labor force statistics for Mesa, out of the total population over 16 years of age (399,719), 65.4% or 261,416 individuals are in the labor force, with 4.7% or 12,287 of them unemployed. The age group with the highest labor force participation rate is 25 to 29 years, with 86.7% or 35,040 individuals in the labor force. Within the labor force, the 16 to 19 years age range has the highest percentage of unemployed individuals, with 14.0% or 1,614 of them being unemployed.
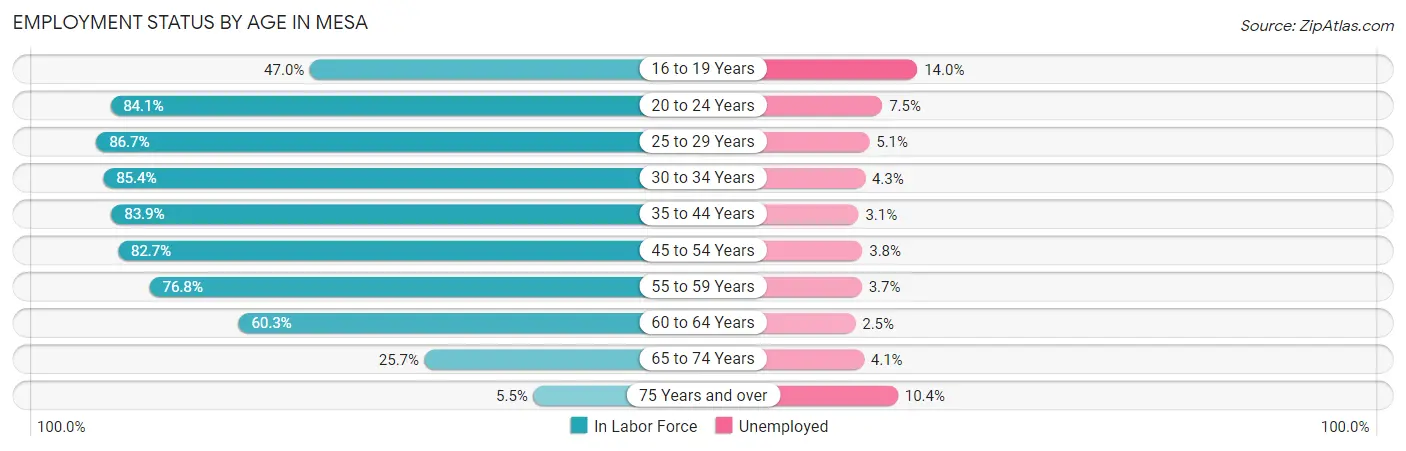
| Age Bracket | In Labor Force | Unemployed |
| 16 to 19 Years | 11,531 (47.0%) | 1,614 (14.0%) |
| 20 to 24 Years | 29,239 (84.1%) | 2,193 (7.5%) |
| 25 to 29 Years | 35,040 (86.7%) | 1,787 (5.1%) |
| 30 to 34 Years | 31,145 (85.4%) | 1,339 (4.3%) |
| 35 to 44 Years | 51,797 (83.9%) | 1,606 (3.1%) |
| 45 to 54 Years | 48,527 (82.7%) | 1,844 (3.8%) |
| 55 to 59 Years | 22,052 (76.8%) | 816 (3.7%) |
| 60 to 64 Years | 17,719 (60.3%) | 443 (2.5%) |
| 65 to 74 Years | 12,449 (25.7%) | 510 (4.1%) |
| 75 Years and over | 2,012 (5.5%) | 209 (10.4%) |
| Total | 261,416 (65.4%) | 12,287 (4.7%) |
Employment Status by Educational Attainment in Mesa
According to labor force statistics for Mesa, 80.8% of individuals (206,359) out of the total population between 25 and 64 years of age (255,395) are in the labor force, with 3.8% or 7,842 of them being unemployed. The group with the highest labor force participation rate are those with the educational attainment of bachelor's degree or higher, with 86.1% or 66,772 individuals in the labor force. Within the labor force, individuals with high school diploma education have the highest percentage of unemployment, with 5.2% or 2,382 of them being unemployed.
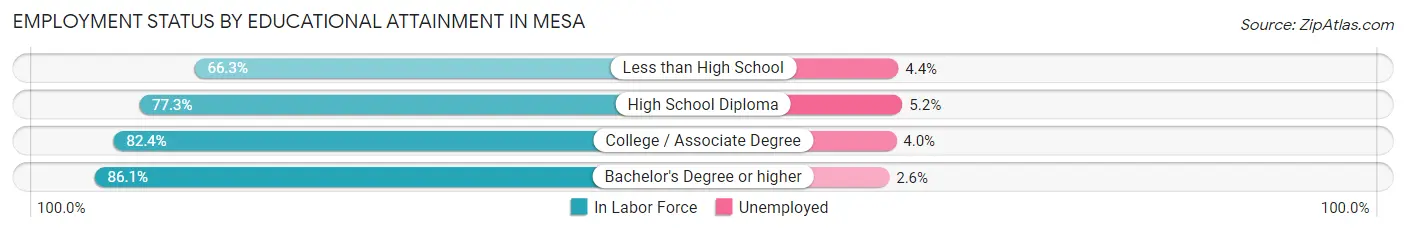
| Educational Attainment | In Labor Force | Unemployed |
| Less than High School | 16,684 (66.3%) | 1,107 (4.4%) |
| High School Diploma | 45,810 (77.3%) | 3,082 (5.2%) |
| College / Associate Degree | 76,974 (82.4%) | 3,737 (4.0%) |
| Bachelor's Degree or higher | 66,772 (86.1%) | 2,016 (2.6%) |
| Total | 206,359 (80.8%) | 9,705 (3.8%) |
Employment Occupations by Sex in Mesa
Management, Business, Science and Arts Occupations
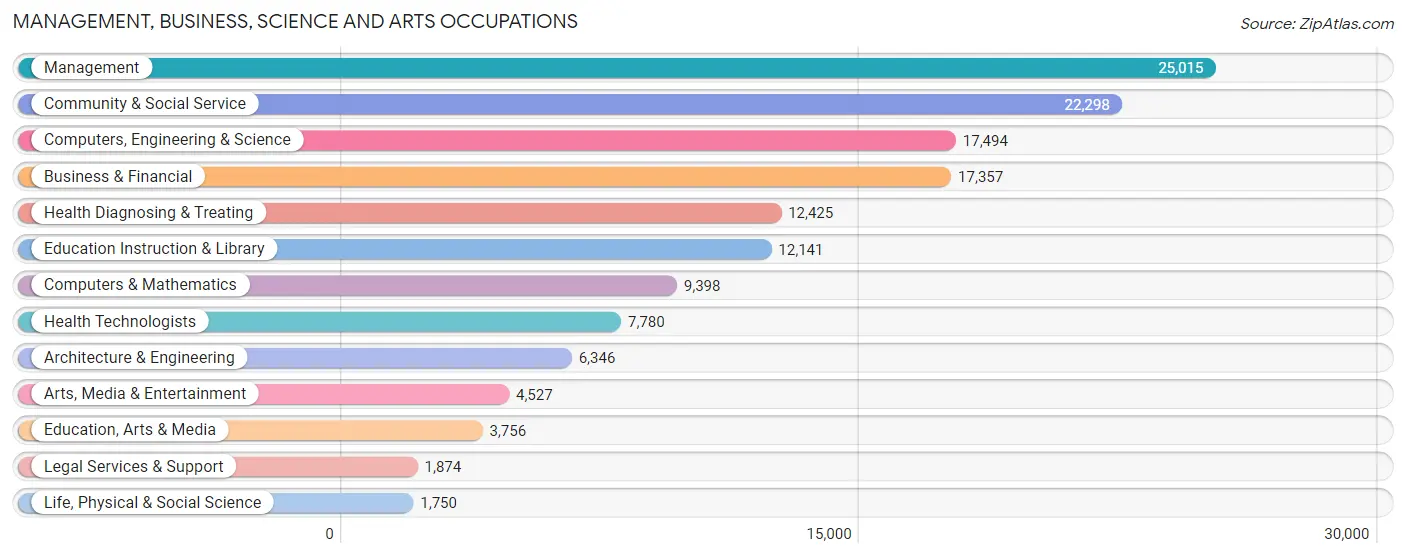
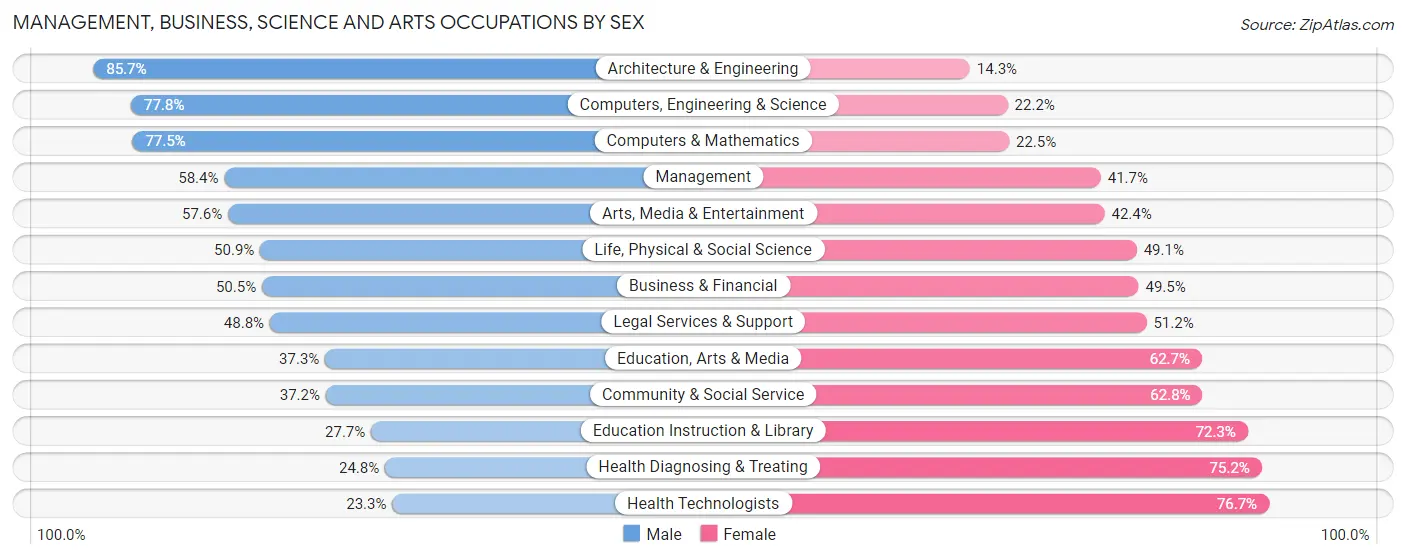
The most common Management, Business, Science and Arts occupations in Mesa are Management (25,015 | 10.1%), Community & Social Service (22,298 | 9.0%), Computers, Engineering & Science (17,494 | 7.0%), Business & Financial (17,357 | 7.0%), and Health Diagnosing & Treating (12,425 | 5.0%).
Management, Business, Science and Arts Occupations by Sex
Within the Management, Business, Science and Arts occupations in Mesa, the most male-oriented occupations are Architecture & Engineering (85.7%), Computers, Engineering & Science (77.8%), and Computers & Mathematics (77.5%), while the most female-oriented occupations are Health Technologists (76.7%), Health Diagnosing & Treating (75.2%), and Education Instruction & Library (72.3%).
| Occupation | Male | Female |
| Management | 14,596 (58.4%) | 10,419 (41.6%) |
| Business & Financial | 8,762 (50.5%) | 8,595 (49.5%) |
| Computers, Engineering & Science | 13,609 (77.8%) | 3,885 (22.2%) |
| Computers & Mathematics | 7,283 (77.5%) | 2,115 (22.5%) |
| Architecture & Engineering | 5,436 (85.7%) | 910 (14.3%) |
| Life, Physical & Social Science | 890 (50.9%) | 860 (49.1%) |
| Community & Social Service | 8,288 (37.2%) | 14,010 (62.8%) |
| Education, Arts & Media | 1,401 (37.3%) | 2,355 (62.7%) |
| Legal Services & Support | 915 (48.8%) | 959 (51.2%) |
| Education Instruction & Library | 3,366 (27.7%) | 8,775 (72.3%) |
| Arts, Media & Entertainment | 2,606 (57.6%) | 1,921 (42.4%) |
| Health Diagnosing & Treating | 3,083 (24.8%) | 9,342 (75.2%) |
| Health Technologists | 1,812 (23.3%) | 5,968 (76.7%) |
| Total (Category) | 48,338 (51.1%) | 46,251 (48.9%) |
| Total (Overall) | 136,315 (54.8%) | 112,446 (45.2%) |
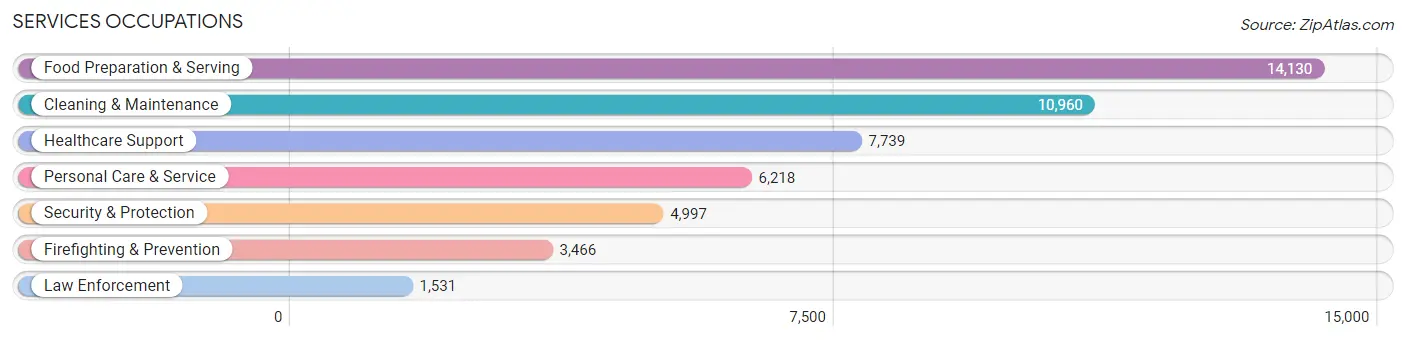
Services Occupations
The most common Services occupations in Mesa are Food Preparation & Serving (14,130 | 5.7%), Cleaning & Maintenance (10,960 | 4.4%), Healthcare Support (7,739 | 3.1%), Personal Care & Service (6,218 | 2.5%), and Security & Protection (4,997 | 2.0%).
Services Occupations by Sex
Within the Services occupations in Mesa, the most male-oriented occupations are Law Enforcement (89.1%), Security & Protection (78.7%), and Firefighting & Prevention (74.2%), while the most female-oriented occupations are Healthcare Support (83.6%), Personal Care & Service (72.3%), and Food Preparation & Serving (46.8%).
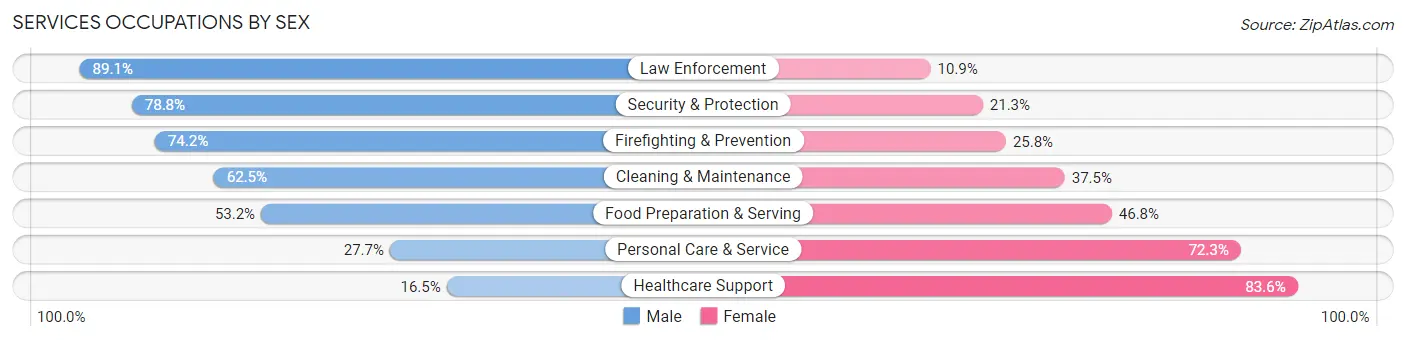
| Occupation | Male | Female |
| Healthcare Support | 1,273 (16.5%) | 6,466 (83.6%) |
| Security & Protection | 3,935 (78.7%) | 1,062 (21.2%) |
| Firefighting & Prevention | 2,571 (74.2%) | 895 (25.8%) |
| Law Enforcement | 1,364 (89.1%) | 167 (10.9%) |
| Food Preparation & Serving | 7,517 (53.2%) | 6,613 (46.8%) |
| Cleaning & Maintenance | 6,853 (62.5%) | 4,107 (37.5%) |
| Personal Care & Service | 1,722 (27.7%) | 4,496 (72.3%) |
| Total (Category) | 21,300 (48.4%) | 22,744 (51.6%) |
| Total (Overall) | 136,315 (54.8%) | 112,446 (45.2%) |
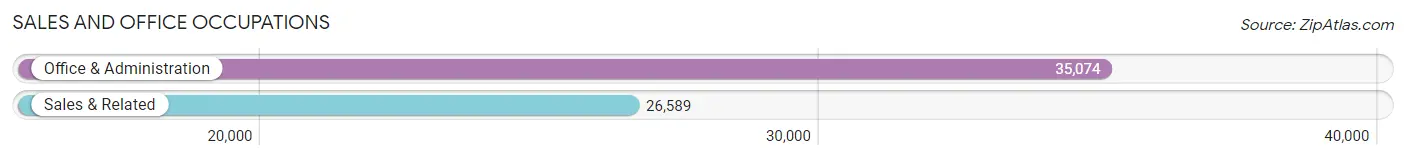
Sales and Office Occupations
The most common Sales and Office occupations in Mesa are Office & Administration (35,074 | 14.1%), and Sales & Related (26,589 | 10.7%).
Sales and Office Occupations by Sex
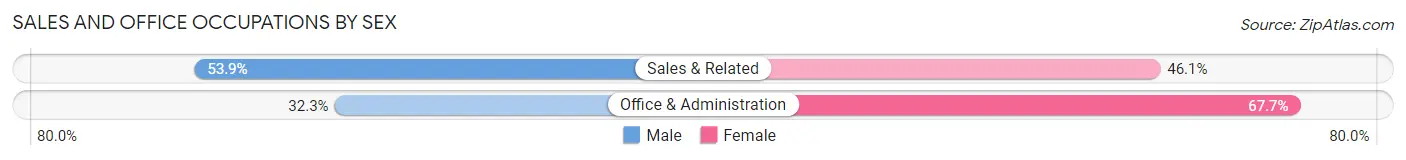
| Occupation | Male | Female |
| Sales & Related | 14,325 (53.9%) | 12,264 (46.1%) |
| Office & Administration | 11,342 (32.3%) | 23,732 (67.7%) |
| Total (Category) | 25,667 (41.6%) | 35,996 (58.4%) |
| Total (Overall) | 136,315 (54.8%) | 112,446 (45.2%) |
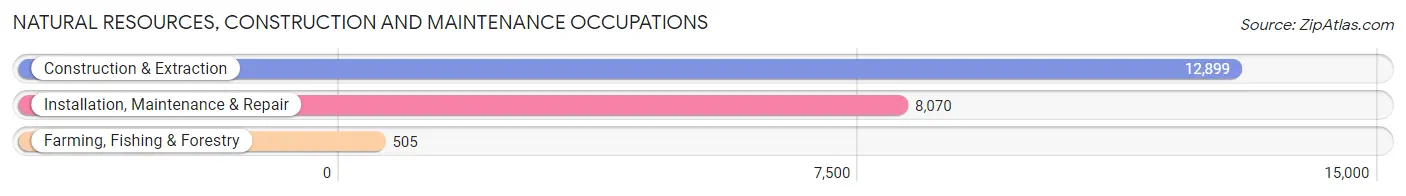
Natural Resources, Construction and Maintenance Occupations
The most common Natural Resources, Construction and Maintenance occupations in Mesa are Construction & Extraction (12,899 | 5.2%), Installation, Maintenance & Repair (8,070 | 3.2%), and Farming, Fishing & Forestry (505 | 0.2%).
Natural Resources, Construction and Maintenance Occupations by Sex
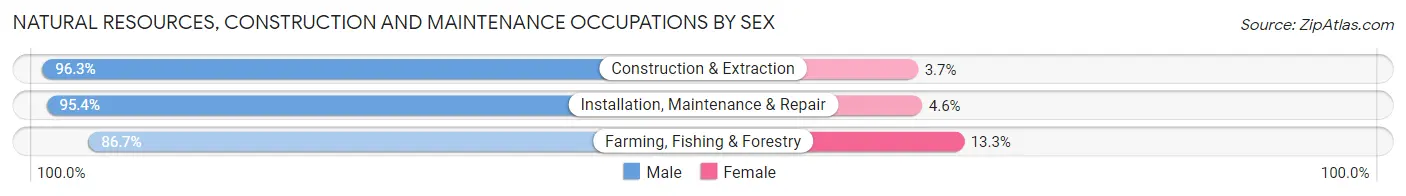
| Occupation | Male | Female |
| Farming, Fishing & Forestry | 438 (86.7%) | 67 (13.3%) |
| Construction & Extraction | 12,422 (96.3%) | 477 (3.7%) |
| Installation, Maintenance & Repair | 7,701 (95.4%) | 369 (4.6%) |
| Total (Category) | 20,561 (95.8%) | 913 (4.3%) |
| Total (Overall) | 136,315 (54.8%) | 112,446 (45.2%) |
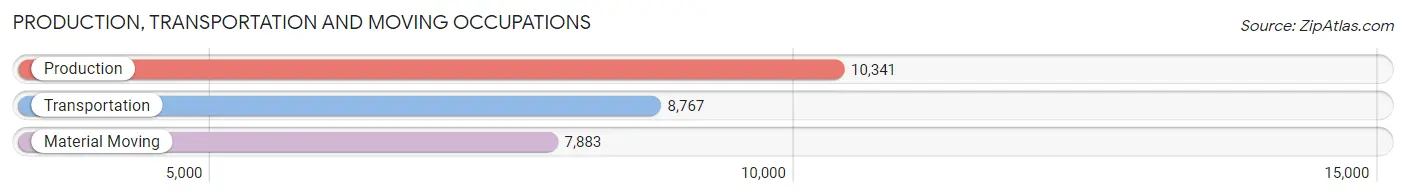
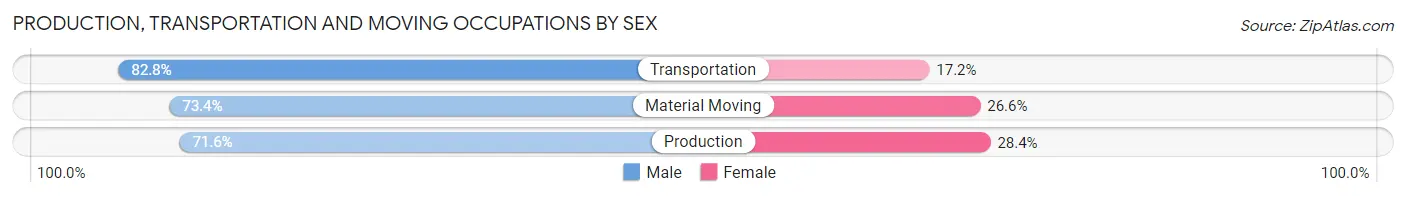
Production, Transportation and Moving Occupations
The most common Production, Transportation and Moving occupations in Mesa are Production (10,341 | 4.2%), Transportation (8,767 | 3.5%), and Material Moving (7,883 | 3.2%).
Production, Transportation and Moving Occupations by Sex
| Occupation | Male | Female |
| Production | 7,402 (71.6%) | 2,939 (28.4%) |
| Transportation | 7,258 (82.8%) | 1,509 (17.2%) |
| Material Moving | 5,789 (73.4%) | 2,094 (26.6%) |
| Total (Category) | 20,449 (75.8%) | 6,542 (24.2%) |
| Total (Overall) | 136,315 (54.8%) | 112,446 (45.2%) |
Employment Industries by Sex in Mesa
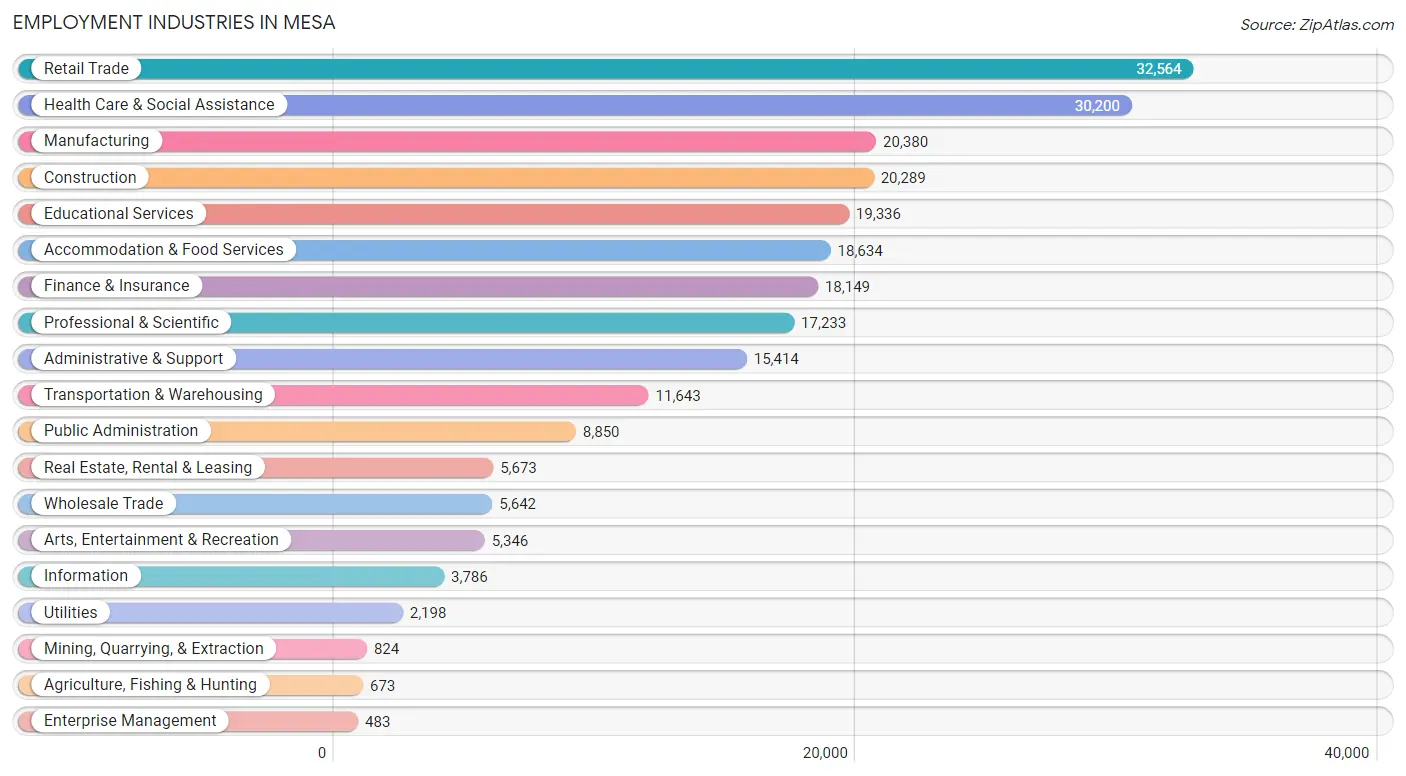
Employment Industries in Mesa
The major employment industries in Mesa include Retail Trade (32,564 | 13.1%), Health Care & Social Assistance (30,200 | 12.1%), Manufacturing (20,380 | 8.2%), Construction (20,289 | 8.2%), and Educational Services (19,336 | 7.8%).
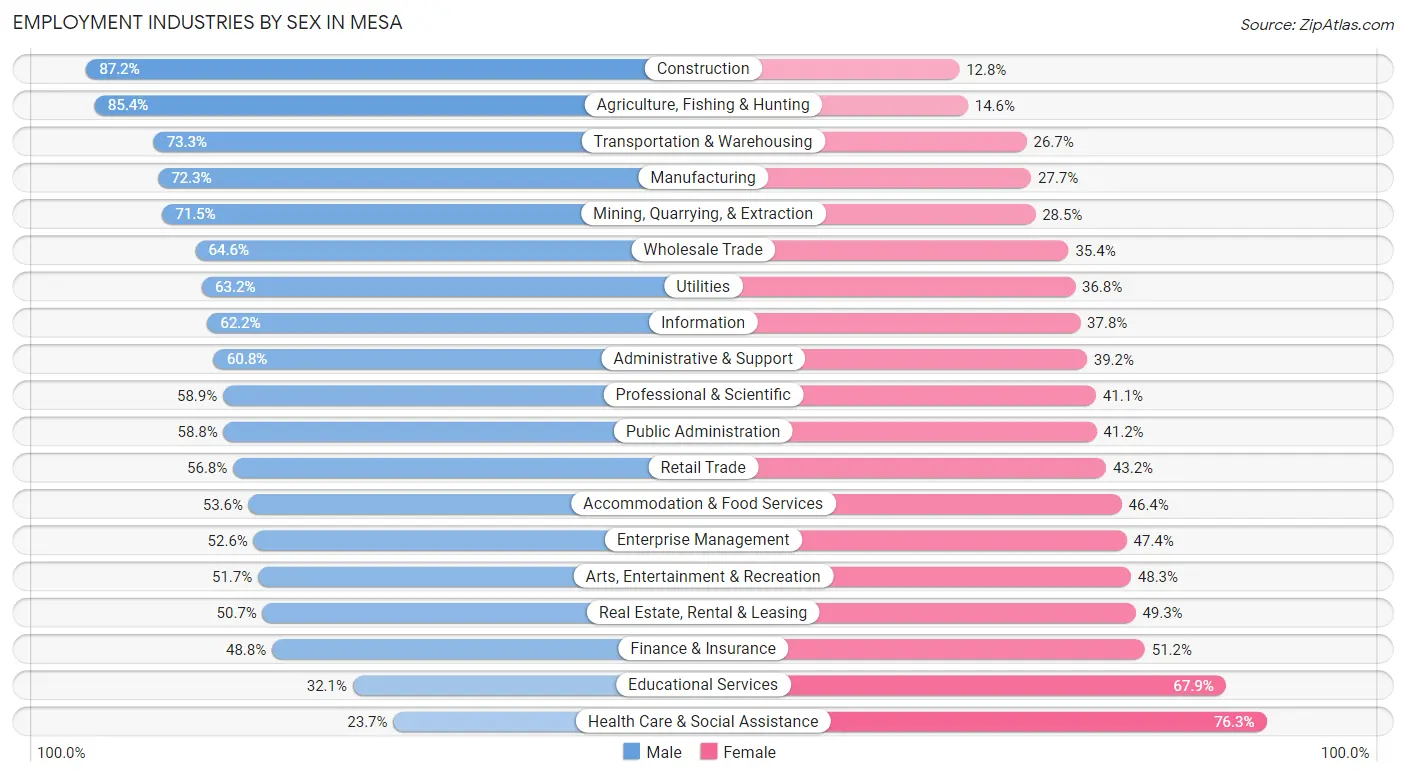
Employment Industries by Sex in Mesa
The Mesa industries that see more men than women are Construction (87.2%), Agriculture, Fishing & Hunting (85.4%), and Transportation & Warehousing (73.3%), whereas the industries that tend to have a higher number of women are Health Care & Social Assistance (76.3%), Educational Services (67.9%), and Finance & Insurance (51.2%).
| Industry | Male | Female |
| Agriculture, Fishing & Hunting | 575 (85.4%) | 98 (14.6%) |
| Mining, Quarrying, & Extraction | 589 (71.5%) | 235 (28.5%) |
| Construction | 17,694 (87.2%) | 2,595 (12.8%) |
| Manufacturing | 14,740 (72.3%) | 5,640 (27.7%) |
| Wholesale Trade | 3,644 (64.6%) | 1,998 (35.4%) |
| Retail Trade | 18,511 (56.8%) | 14,053 (43.2%) |
| Transportation & Warehousing | 8,531 (73.3%) | 3,112 (26.7%) |
| Utilities | 1,390 (63.2%) | 808 (36.8%) |
| Information | 2,354 (62.2%) | 1,432 (37.8%) |
| Finance & Insurance | 8,855 (48.8%) | 9,294 (51.2%) |
| Real Estate, Rental & Leasing | 2,878 (50.7%) | 2,795 (49.3%) |
| Professional & Scientific | 10,154 (58.9%) | 7,079 (41.1%) |
| Enterprise Management | 254 (52.6%) | 229 (47.4%) |
| Administrative & Support | 9,373 (60.8%) | 6,041 (39.2%) |
| Educational Services | 6,201 (32.1%) | 13,135 (67.9%) |
| Health Care & Social Assistance | 7,147 (23.7%) | 23,053 (76.3%) |
| Arts, Entertainment & Recreation | 2,763 (51.7%) | 2,583 (48.3%) |
| Accommodation & Food Services | 9,986 (53.6%) | 8,648 (46.4%) |
| Public Administration | 5,205 (58.8%) | 3,645 (41.2%) |
| Total | 136,315 (54.8%) | 112,446 (45.2%) |
Education in Mesa
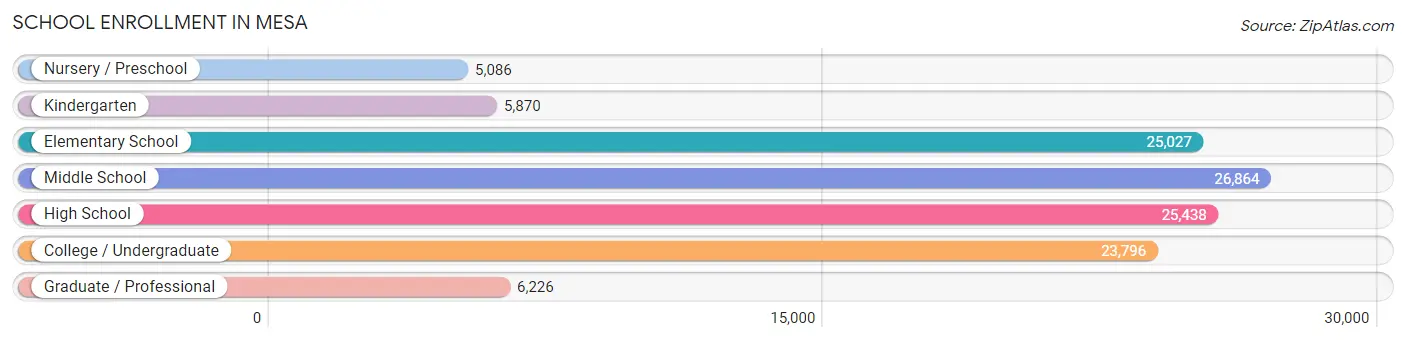
School Enrollment in Mesa
The most common levels of schooling among the 118,307 students in Mesa are middle school (26,864 | 22.7%), high school (25,438 | 21.5%), and elementary school (25,027 | 21.1%).
| School Level | # Students | % Students |
| Nursery / Preschool | 5,086 | 4.3% |
| Kindergarten | 5,870 | 5.0% |
| Elementary School | 25,027 | 21.1% |
| Middle School | 26,864 | 22.7% |
| High School | 25,438 | 21.5% |
| College / Undergraduate | 23,796 | 20.1% |
| Graduate / Professional | 6,226 | 5.3% |
| Total | 118,307 | 100.0% |
School Enrollment by Age by Funding Source in Mesa
Out of a total of 118,307 students who are enrolled in schools in Mesa, 14,315 (12.1%) attend a private institution, while the remaining 103,992 (87.9%) are enrolled in public schools. The age group of 3 to 4 year olds has the highest likelihood of being enrolled in private schools, with 1,758 (42.3% in the age bracket) enrolled. Conversely, the age group of 15 to 17 year olds has the lowest likelihood of being enrolled in a private school, with 17,056 (96.0% in the age bracket) attending a public institution.
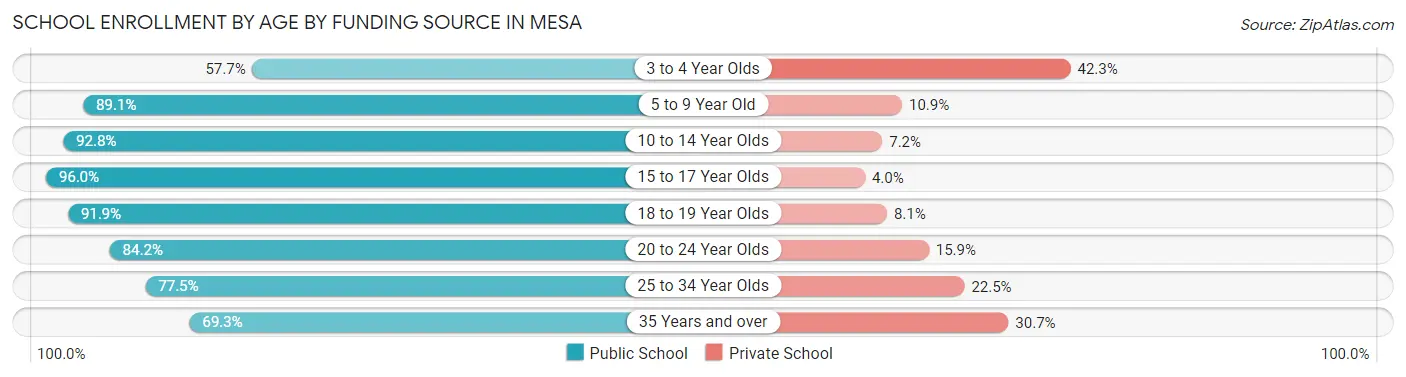
| Age Bracket | Public School | Private School |
| 3 to 4 Year Olds | 2,402 (57.7%) | 1,758 (42.3%) |
| 5 to 9 Year Old | 25,998 (89.1%) | 3,175 (10.9%) |
| 10 to 14 Year Olds | 30,653 (92.8%) | 2,375 (7.2%) |
| 15 to 17 Year Olds | 17,056 (96.0%) | 706 (4.0%) |
| 18 to 19 Year Olds | 6,931 (91.9%) | 608 (8.1%) |
| 20 to 24 Year Olds | 10,384 (84.2%) | 1,956 (15.9%) |
| 25 to 34 Year Olds | 6,681 (77.5%) | 1,940 (22.5%) |
| 35 Years and over | 3,940 (69.3%) | 1,744 (30.7%) |
| Total | 103,992 (87.9%) | 14,315 (12.1%) |
Educational Attainment by Field of Study in Mesa
Business (22,646 | 20.8%), education (15,123 | 13.9%), science & technology (11,136 | 10.2%), engineering (8,237 | 7.6%), and arts & humanities (7,673 | 7.1%) are the most common fields of study among 108,698 individuals in Mesa who have obtained a bachelor's degree or higher.
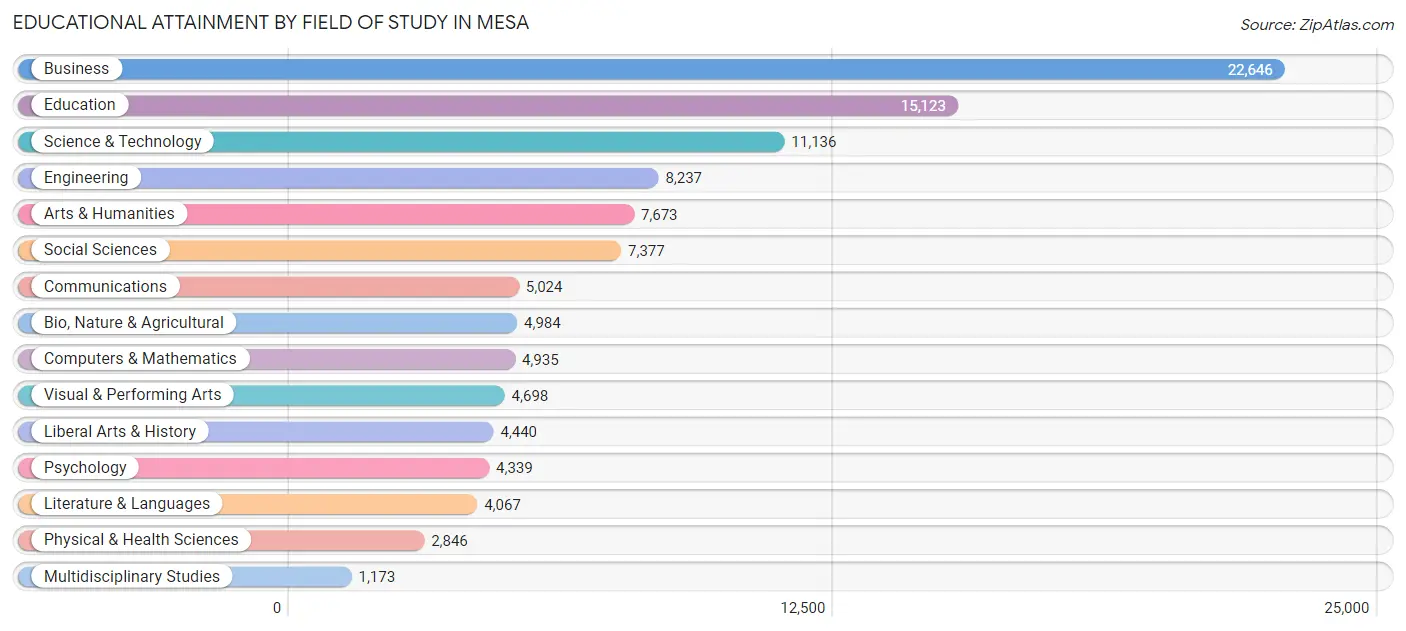
| Field of Study | # Graduates | % Graduates |
| Computers & Mathematics | 4,935 | 4.5% |
| Bio, Nature & Agricultural | 4,984 | 4.6% |
| Physical & Health Sciences | 2,846 | 2.6% |
| Psychology | 4,339 | 4.0% |
| Social Sciences | 7,377 | 6.8% |
| Engineering | 8,237 | 7.6% |
| Multidisciplinary Studies | 1,173 | 1.1% |
| Science & Technology | 11,136 | 10.2% |
| Business | 22,646 | 20.8% |
| Education | 15,123 | 13.9% |
| Literature & Languages | 4,067 | 3.7% |
| Liberal Arts & History | 4,440 | 4.1% |
| Visual & Performing Arts | 4,698 | 4.3% |
| Communications | 5,024 | 4.6% |
| Arts & Humanities | 7,673 | 7.1% |
| Total | 108,698 | 100.0% |
Transportation & Commute in Mesa
Vehicle Availability by Sex in Mesa
The most prevalent vehicle ownership categories in Mesa are males with 2 vehicles (57,471, accounting for 42.7%) and females with 2 vehicles (46,263, making up 52.1%).
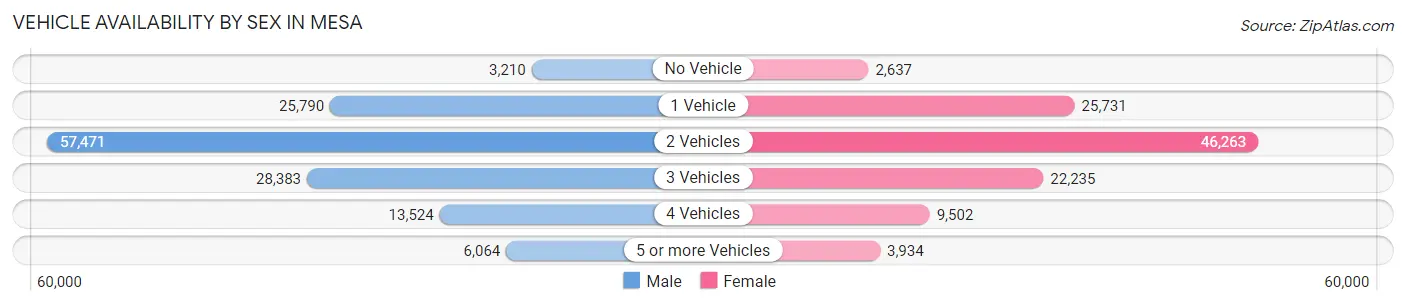
| Vehicles Available | Male | Female |
| No Vehicle | 3,210 (2.4%) | 2,637 (2.4%) |
| 1 Vehicle | 25,790 (19.2%) | 25,731 (23.3%) |
| 2 Vehicles | 57,471 (42.7%) | 46,263 (41.9%) |
| 3 Vehicles | 28,383 (21.1%) | 22,235 (20.2%) |
| 4 Vehicles | 13,524 (10.1%) | 9,502 (8.6%) |
| 5 or more Vehicles | 6,064 (4.5%) | 3,934 (3.6%) |
| Total | 134,442 (100.0%) | 110,302 (100.0%) |
Commute Time in Mesa
The most frequently occuring commute durations in Mesa are 20 to 24 minutes (36,756 commuters, 17.5%), 15 to 19 minutes (33,828 commuters, 16.1%), and 30 to 34 minutes (33,036 commuters, 15.8%).
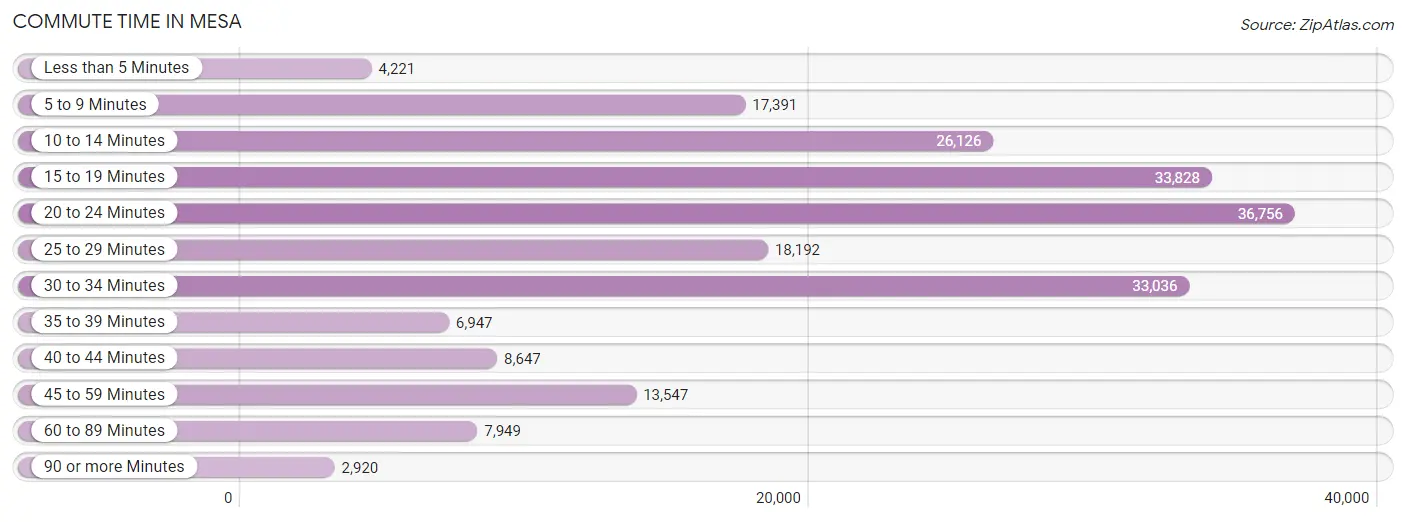
| Commute Time | # Commuters | % Commuters |
| Less than 5 Minutes | 4,221 | 2.0% |
| 5 to 9 Minutes | 17,391 | 8.3% |
| 10 to 14 Minutes | 26,126 | 12.5% |
| 15 to 19 Minutes | 33,828 | 16.1% |
| 20 to 24 Minutes | 36,756 | 17.5% |
| 25 to 29 Minutes | 18,192 | 8.7% |
| 30 to 34 Minutes | 33,036 | 15.8% |
| 35 to 39 Minutes | 6,947 | 3.3% |
| 40 to 44 Minutes | 8,647 | 4.1% |
| 45 to 59 Minutes | 13,547 | 6.5% |
| 60 to 89 Minutes | 7,949 | 3.8% |
| 90 or more Minutes | 2,920 | 1.4% |
Commute Time by Sex in Mesa
The most common commute times in Mesa are 20 to 24 minutes (19,818 commuters, 16.9%) for males and 20 to 24 minutes (16,938 commuters, 18.4%) for females.
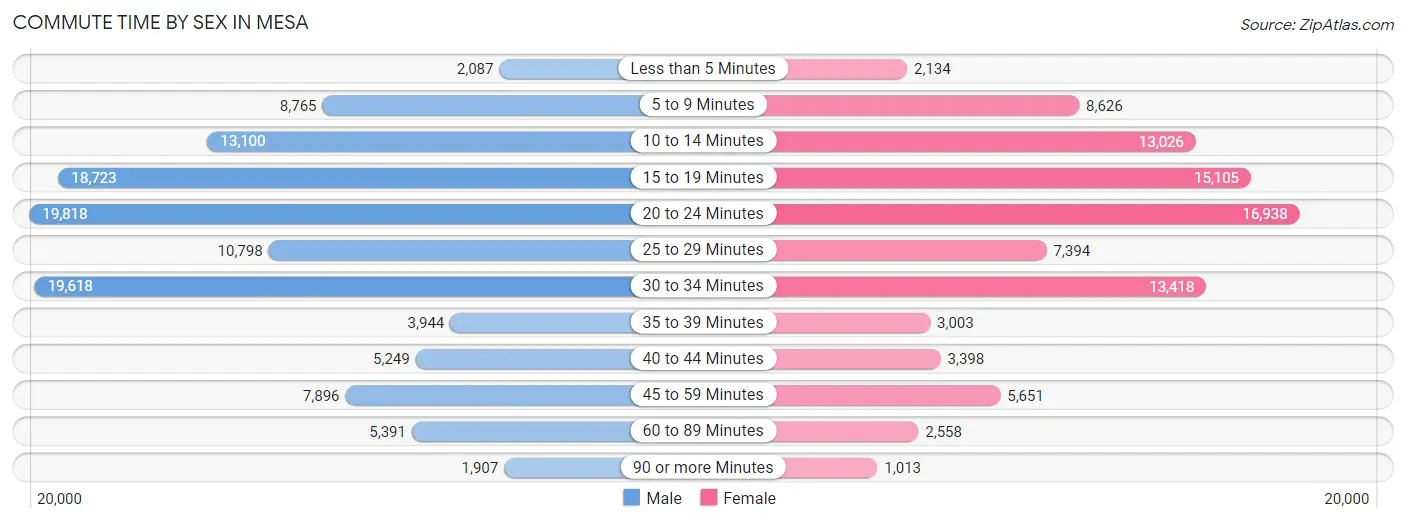
| Commute Time | Male | Female |
| Less than 5 Minutes | 2,087 (1.8%) | 2,134 (2.3%) |
| 5 to 9 Minutes | 8,765 (7.5%) | 8,626 (9.3%) |
| 10 to 14 Minutes | 13,100 (11.2%) | 13,026 (14.1%) |
| 15 to 19 Minutes | 18,723 (16.0%) | 15,105 (16.4%) |
| 20 to 24 Minutes | 19,818 (16.9%) | 16,938 (18.4%) |
| 25 to 29 Minutes | 10,798 (9.2%) | 7,394 (8.0%) |
| 30 to 34 Minutes | 19,618 (16.7%) | 13,418 (14.5%) |
| 35 to 39 Minutes | 3,944 (3.4%) | 3,003 (3.3%) |
| 40 to 44 Minutes | 5,249 (4.5%) | 3,398 (3.7%) |
| 45 to 59 Minutes | 7,896 (6.7%) | 5,651 (6.1%) |
| 60 to 89 Minutes | 5,391 (4.6%) | 2,558 (2.8%) |
| 90 or more Minutes | 1,907 (1.6%) | 1,013 (1.1%) |
Time of Departure to Work by Sex in Mesa
The most frequent times of departure to work in Mesa are 12:00 AM to 4:59 AM (13,954, 11.9%) for males and 7:00 AM to 7:29 AM (14,140, 15.3%) for females.
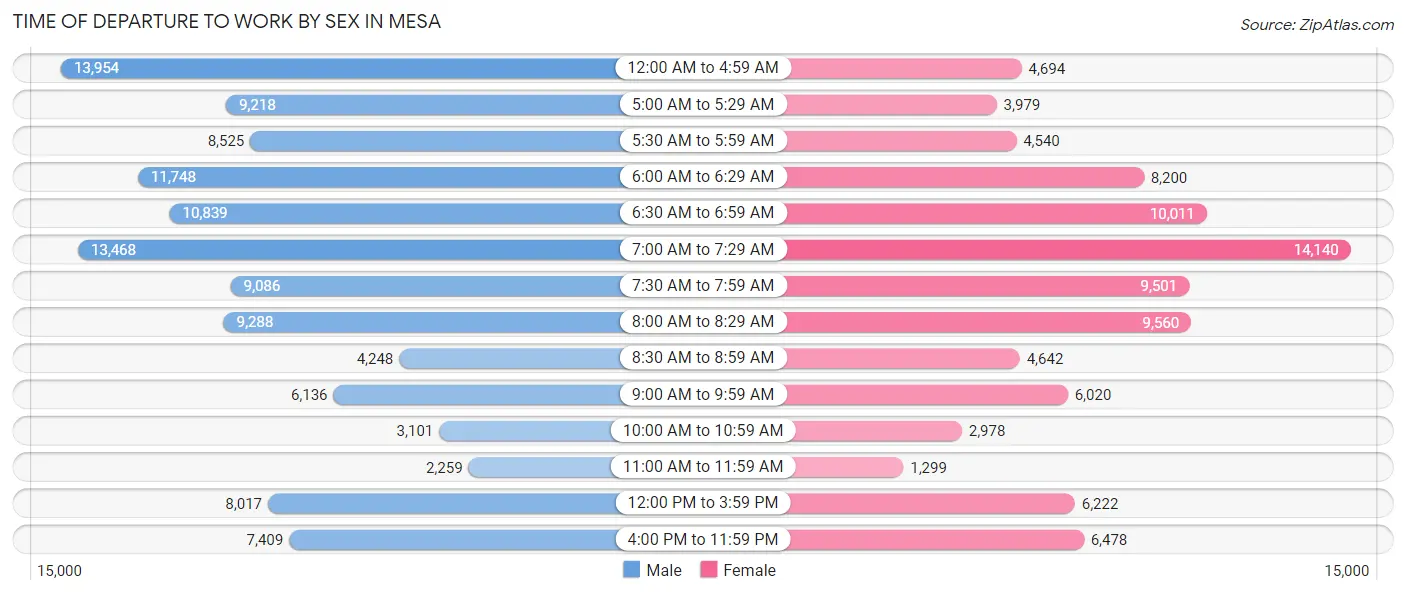
| Time of Departure | Male | Female |
| 12:00 AM to 4:59 AM | 13,954 (11.9%) | 4,694 (5.1%) |
| 5:00 AM to 5:29 AM | 9,218 (7.9%) | 3,979 (4.3%) |
| 5:30 AM to 5:59 AM | 8,525 (7.3%) | 4,540 (4.9%) |
| 6:00 AM to 6:29 AM | 11,748 (10.0%) | 8,200 (8.9%) |
| 6:30 AM to 6:59 AM | 10,839 (9.2%) | 10,011 (10.8%) |
| 7:00 AM to 7:29 AM | 13,468 (11.5%) | 14,140 (15.3%) |
| 7:30 AM to 7:59 AM | 9,086 (7.7%) | 9,501 (10.3%) |
| 8:00 AM to 8:29 AM | 9,288 (7.9%) | 9,560 (10.4%) |
| 8:30 AM to 8:59 AM | 4,248 (3.6%) | 4,642 (5.0%) |
| 9:00 AM to 9:59 AM | 6,136 (5.2%) | 6,020 (6.5%) |
| 10:00 AM to 10:59 AM | 3,101 (2.6%) | 2,978 (3.2%) |
| 11:00 AM to 11:59 AM | 2,259 (1.9%) | 1,299 (1.4%) |
| 12:00 PM to 3:59 PM | 8,017 (6.8%) | 6,222 (6.7%) |
| 4:00 PM to 11:59 PM | 7,409 (6.3%) | 6,478 (7.0%) |
| Total | 117,296 (100.0%) | 92,264 (100.0%) |
Housing Occupancy in Mesa
Occupancy by Ownership in Mesa
Of the total 193,316 dwellings in Mesa, owner-occupied units account for 122,099 (63.2%), while renter-occupied units make up 71,217 (36.8%).
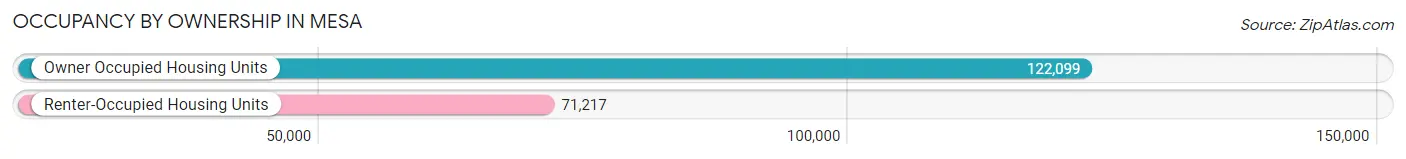
| Occupancy | # Housing Units | % Housing Units |
| Owner Occupied Housing Units | 122,099 | 63.2% |
| Renter-Occupied Housing Units | 71,217 | 36.8% |
| Total Occupied Housing Units | 193,316 | 100.0% |
Occupancy by Household Size in Mesa
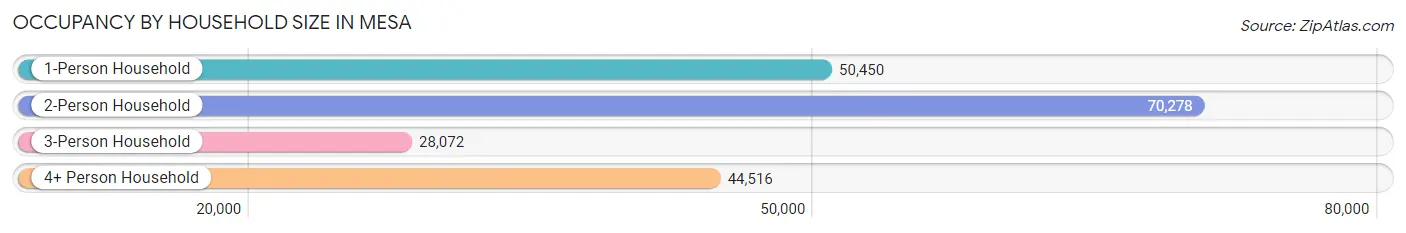
| Household Size | # Housing Units | % Housing Units |
| 1-Person Household | 50,450 | 26.1% |
| 2-Person Household | 70,278 | 36.3% |
| 3-Person Household | 28,072 | 14.5% |
| 4+ Person Household | 44,516 | 23.0% |
| Total Housing Units | 193,316 | 100.0% |
Occupancy by Ownership by Household Size in Mesa
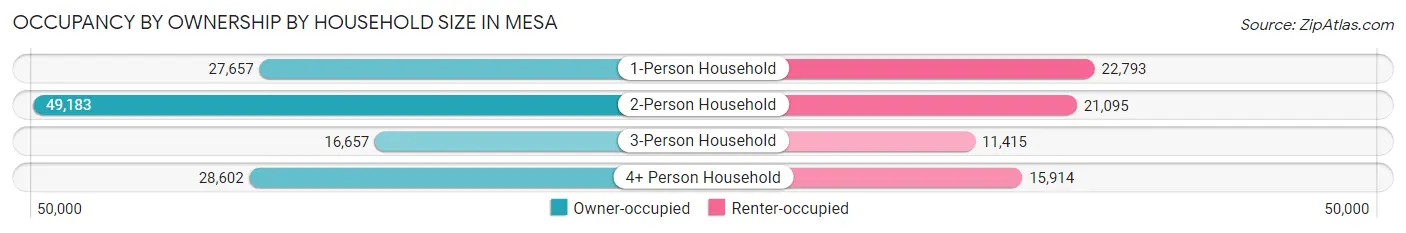
| Household Size | Owner-occupied | Renter-occupied |
| 1-Person Household | 27,657 (54.8%) | 22,793 (45.2%) |
| 2-Person Household | 49,183 (70.0%) | 21,095 (30.0%) |
| 3-Person Household | 16,657 (59.3%) | 11,415 (40.7%) |
| 4+ Person Household | 28,602 (64.2%) | 15,914 (35.7%) |
| Total Housing Units | 122,099 (63.2%) | 71,217 (36.8%) |
Occupancy by Educational Attainment in Mesa
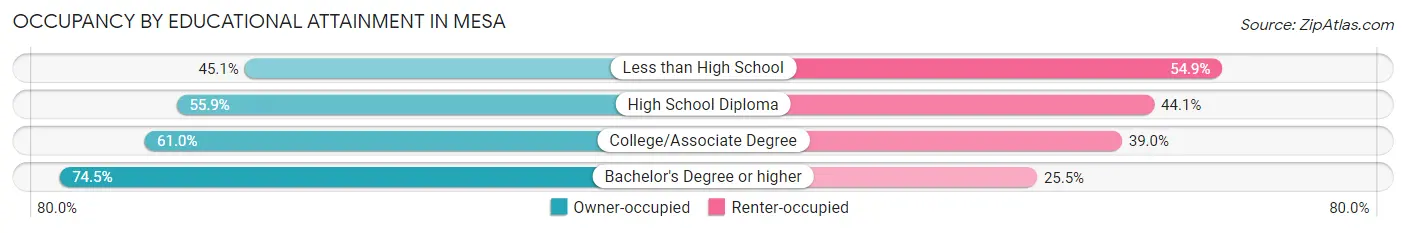
| Household Size | Owner-occupied | Renter-occupied |
| Less than High School | 6,407 (45.1%) | 7,797 (54.9%) |
| High School Diploma | 22,258 (55.9%) | 17,549 (44.1%) |
| College/Associate Degree | 46,948 (61.0%) | 29,962 (39.0%) |
| Bachelor's Degree or higher | 46,486 (74.5%) | 15,909 (25.5%) |
Occupancy by Age of Householder in Mesa
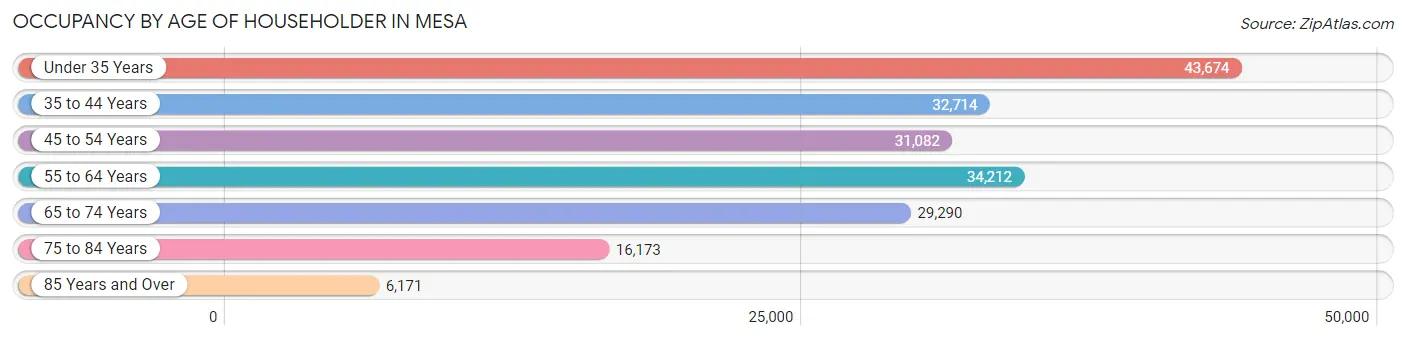
| Age Bracket | # Households | % Households |
| Under 35 Years | 43,674 | 22.6% |
| 35 to 44 Years | 32,714 | 16.9% |
| 45 to 54 Years | 31,082 | 16.1% |
| 55 to 64 Years | 34,212 | 17.7% |
| 65 to 74 Years | 29,290 | 15.1% |
| 75 to 84 Years | 16,173 | 8.4% |
| 85 Years and Over | 6,171 | 3.2% |
| Total | 193,316 | 100.0% |
Housing Finances in Mesa
Median Income by Occupancy in Mesa
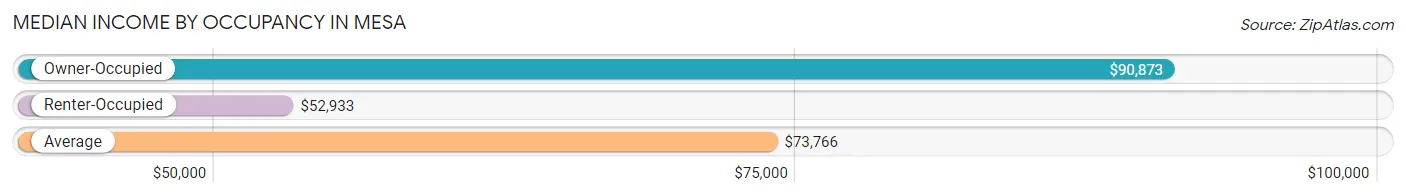
| Occupancy Type | # Households | Median Income |
| Owner-Occupied | 122,099 (63.2%) | $90,873 |
| Renter-Occupied | 71,217 (36.8%) | $52,933 |
| Average | 193,316 (100.0%) | $73,766 |
Occupancy by Householder Income Bracket in Mesa
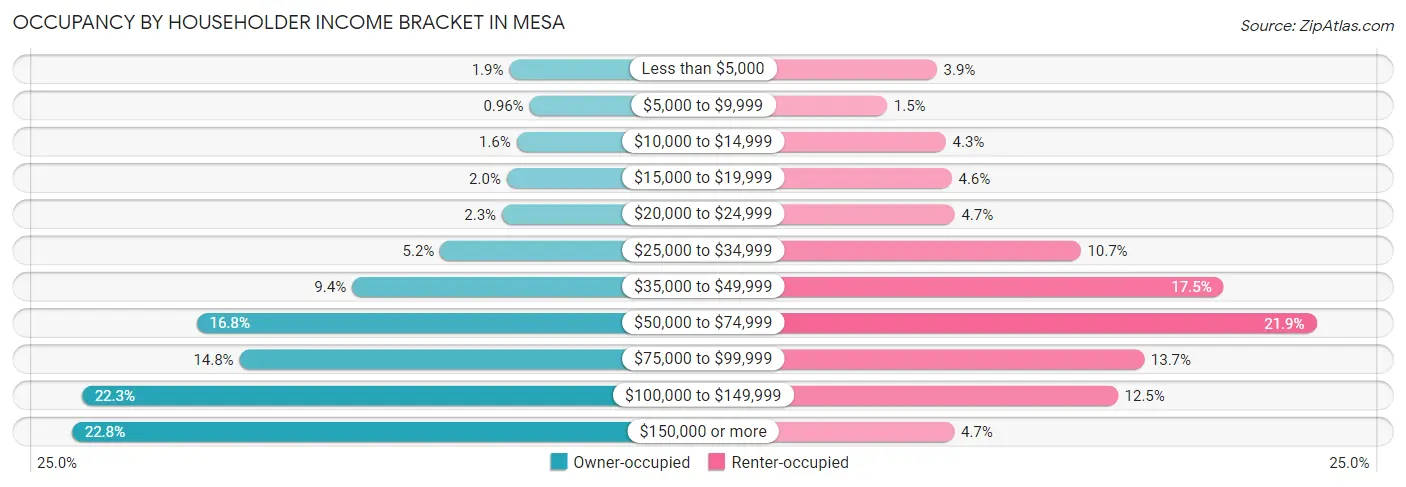
| Income Bracket | Owner-occupied | Renter-occupied |
| Less than $5,000 | 2,346 (1.9%) | 2,752 (3.9%) |
| $5,000 to $9,999 | 1,171 (1.0%) | 1,064 (1.5%) |
| $10,000 to $14,999 | 1,922 (1.6%) | 3,055 (4.3%) |
| $15,000 to $19,999 | 2,493 (2.0%) | 3,257 (4.6%) |
| $20,000 to $24,999 | 2,776 (2.3%) | 3,356 (4.7%) |
| $25,000 to $34,999 | 6,359 (5.2%) | 7,630 (10.7%) |
| $35,000 to $49,999 | 11,492 (9.4%) | 12,474 (17.5%) |
| $50,000 to $74,999 | 20,527 (16.8%) | 15,625 (21.9%) |
| $75,000 to $99,999 | 18,029 (14.8%) | 9,778 (13.7%) |
| $100,000 to $149,999 | 27,204 (22.3%) | 8,887 (12.5%) |
| $150,000 or more | 27,780 (22.8%) | 3,339 (4.7%) |
| Total | 122,099 (100.0%) | 71,217 (100.0%) |
Monthly Housing Cost Tiers in Mesa
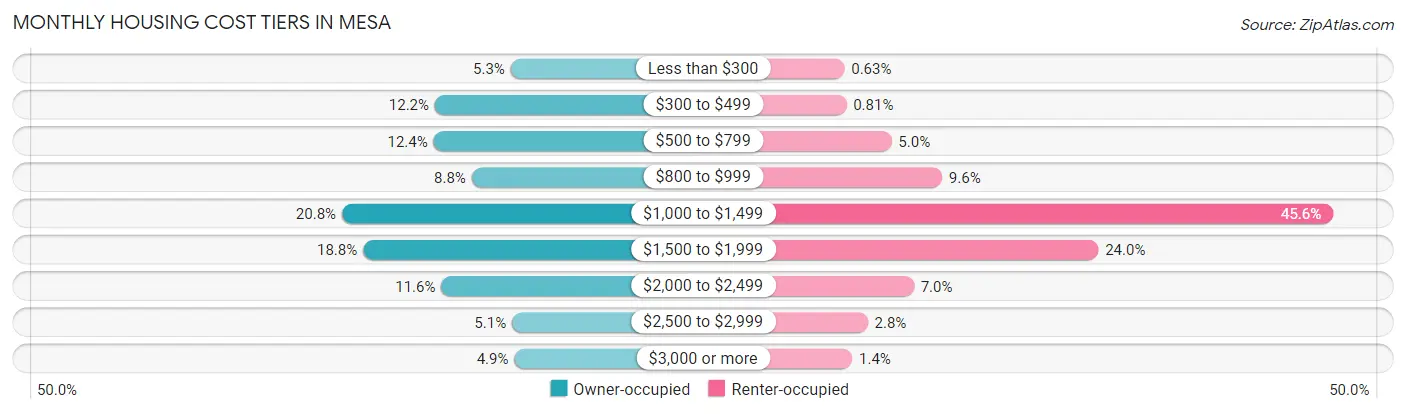
| Monthly Cost | Owner-occupied | Renter-occupied |
| Less than $300 | 6,415 (5.2%) | 452 (0.6%) |
| $300 to $499 | 14,937 (12.2%) | 577 (0.8%) |
| $500 to $799 | 15,077 (12.3%) | 3,537 (5.0%) |
| $800 to $999 | 10,793 (8.8%) | 6,851 (9.6%) |
| $1,000 to $1,499 | 25,379 (20.8%) | 32,489 (45.6%) |
| $1,500 to $1,999 | 23,009 (18.8%) | 17,097 (24.0%) |
| $2,000 to $2,499 | 14,216 (11.6%) | 4,996 (7.0%) |
| $2,500 to $2,999 | 6,263 (5.1%) | 1,977 (2.8%) |
| $3,000 or more | 6,010 (4.9%) | 961 (1.3%) |
| Total | 122,099 (100.0%) | 71,217 (100.0%) |
Physical Housing Characteristics in Mesa
Housing Structures in Mesa
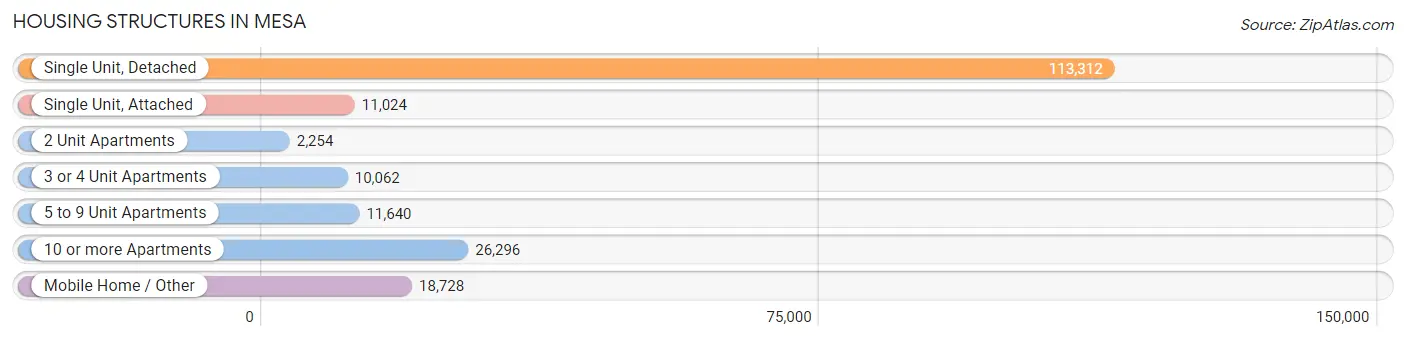
| Structure Type | # Housing Units | % Housing Units |
| Single Unit, Detached | 113,312 | 58.6% |
| Single Unit, Attached | 11,024 | 5.7% |
| 2 Unit Apartments | 2,254 | 1.2% |
| 3 or 4 Unit Apartments | 10,062 | 5.2% |
| 5 to 9 Unit Apartments | 11,640 | 6.0% |
| 10 or more Apartments | 26,296 | 13.6% |
| Mobile Home / Other | 18,728 | 9.7% |
| Total | 193,316 | 100.0% |
Housing Structures by Occupancy in Mesa
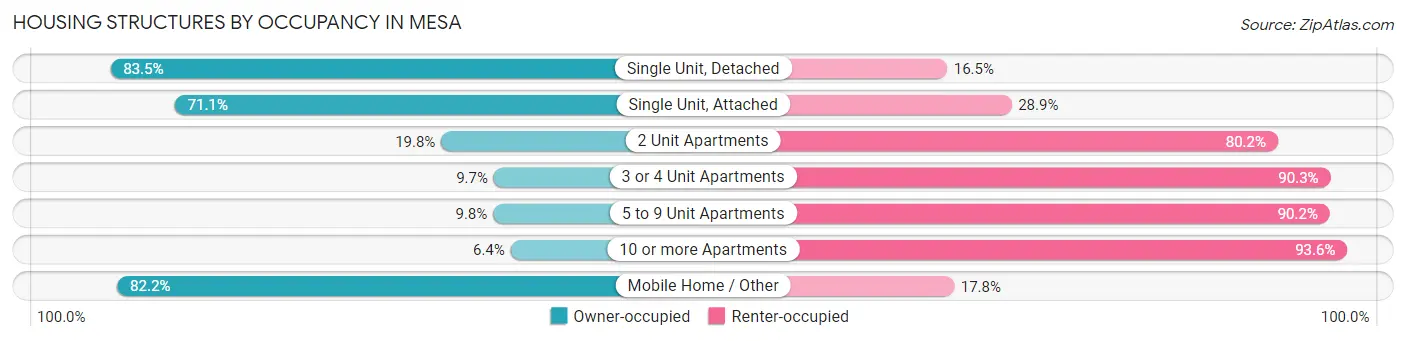
| Structure Type | Owner-occupied | Renter-occupied |
| Single Unit, Detached | 94,624 (83.5%) | 18,688 (16.5%) |
| Single Unit, Attached | 7,839 (71.1%) | 3,185 (28.9%) |
| 2 Unit Apartments | 446 (19.8%) | 1,808 (80.2%) |
| 3 or 4 Unit Apartments | 972 (9.7%) | 9,090 (90.3%) |
| 5 to 9 Unit Apartments | 1,140 (9.8%) | 10,500 (90.2%) |
| 10 or more Apartments | 1,689 (6.4%) | 24,607 (93.6%) |
| Mobile Home / Other | 15,389 (82.2%) | 3,339 (17.8%) |
| Total | 122,099 (63.2%) | 71,217 (36.8%) |
Housing Structures by Number of Rooms in Mesa
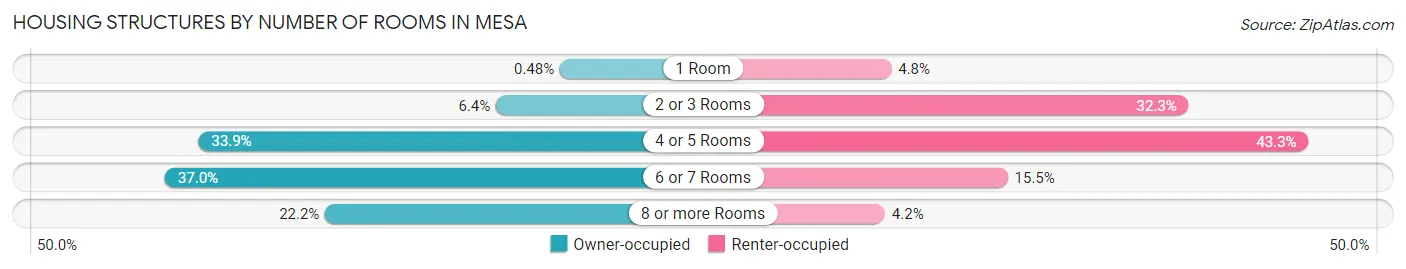
| Number of Rooms | Owner-occupied | Renter-occupied |
| 1 Room | 580 (0.5%) | 3,381 (4.8%) |
| 2 or 3 Rooms | 7,805 (6.4%) | 22,967 (32.3%) |
| 4 or 5 Rooms | 41,417 (33.9%) | 30,861 (43.3%) |
| 6 or 7 Rooms | 45,197 (37.0%) | 11,048 (15.5%) |
| 8 or more Rooms | 27,100 (22.2%) | 2,960 (4.2%) |
| Total | 122,099 (100.0%) | 71,217 (100.0%) |
Housing Structure by Heating Type in Mesa
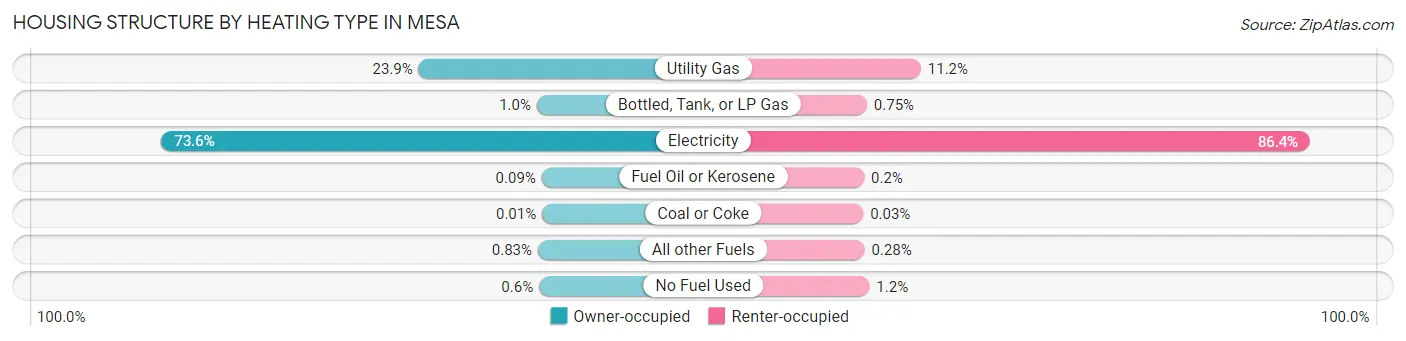
| Heating Type | Owner-occupied | Renter-occupied |
| Utility Gas | 29,157 (23.9%) | 7,954 (11.2%) |
| Bottled, Tank, or LP Gas | 1,240 (1.0%) | 535 (0.7%) |
| Electricity | 89,846 (73.6%) | 61,494 (86.4%) |
| Fuel Oil or Kerosene | 110 (0.1%) | 143 (0.2%) |
| Coal or Coke | 7 (0.0%) | 21 (0.0%) |
| All other Fuels | 1,011 (0.8%) | 197 (0.3%) |
| No Fuel Used | 728 (0.6%) | 873 (1.2%) |
| Total | 122,099 (100.0%) | 71,217 (100.0%) |
Household Vehicle Usage in Mesa
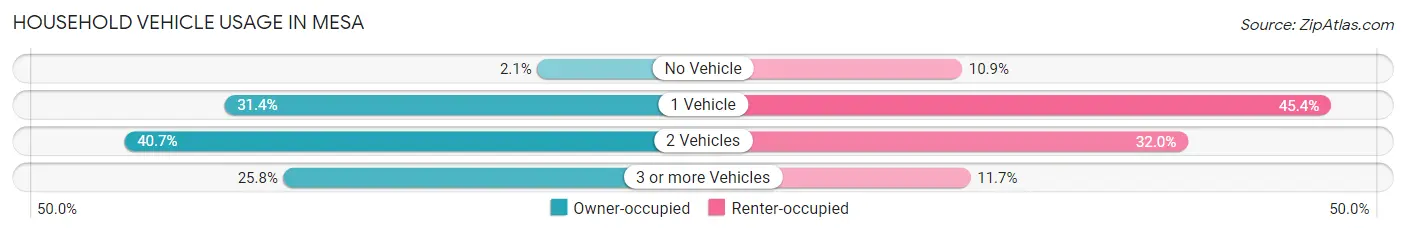
| Vehicles per Household | Owner-occupied | Renter-occupied |
| No Vehicle | 2,593 (2.1%) | 7,769 (10.9%) |
| 1 Vehicle | 38,291 (31.4%) | 32,312 (45.4%) |
| 2 Vehicles | 49,699 (40.7%) | 22,805 (32.0%) |
| 3 or more Vehicles | 31,516 (25.8%) | 8,331 (11.7%) |
| Total | 122,099 (100.0%) | 71,217 (100.0%) |
Real Estate & Mortgages in Mesa
Real Estate and Mortgage Overview in Mesa
| Characteristic | Without Mortgage | With Mortgage |
| Housing Units | 43,056 | 79,043 |
| Median Property Value | $255,400 | $356,000 |
| Median Household Income | $64,512 | $21,760 |
| Monthly Housing Costs | $517 | $5,899 |
| Real Estate Taxes | $1,264 | $2,288 |
Property Value by Mortgage Status in Mesa
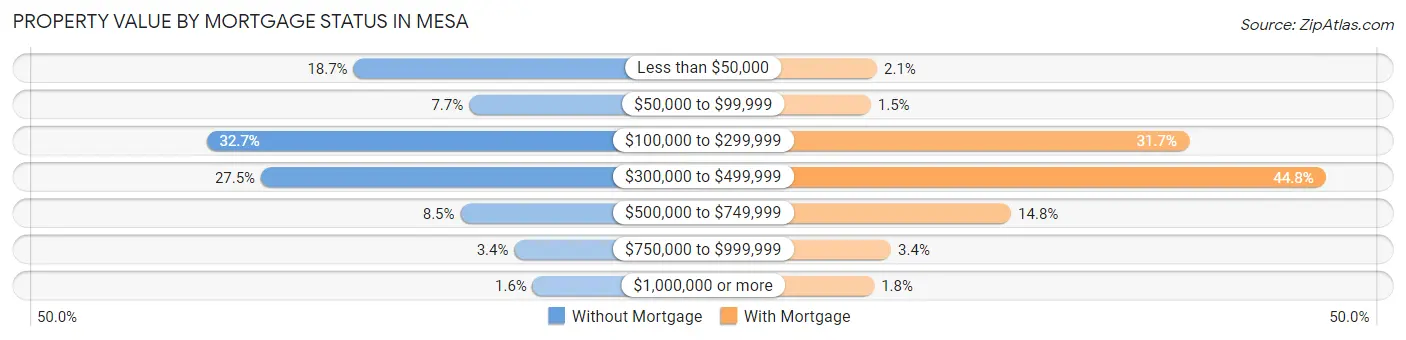
| Property Value | Without Mortgage | With Mortgage |
| Less than $50,000 | 8,045 (18.7%) | 1,624 (2.1%) |
| $50,000 to $99,999 | 3,303 (7.7%) | 1,154 (1.5%) |
| $100,000 to $299,999 | 14,071 (32.7%) | 25,079 (31.7%) |
| $300,000 to $499,999 | 11,836 (27.5%) | 35,385 (44.8%) |
| $500,000 to $749,999 | 3,660 (8.5%) | 11,713 (14.8%) |
| $750,000 to $999,999 | 1,446 (3.4%) | 2,680 (3.4%) |
| $1,000,000 or more | 695 (1.6%) | 1,408 (1.8%) |
| Total | 43,056 (100.0%) | 79,043 (100.0%) |
Household Income by Mortgage Status in Mesa
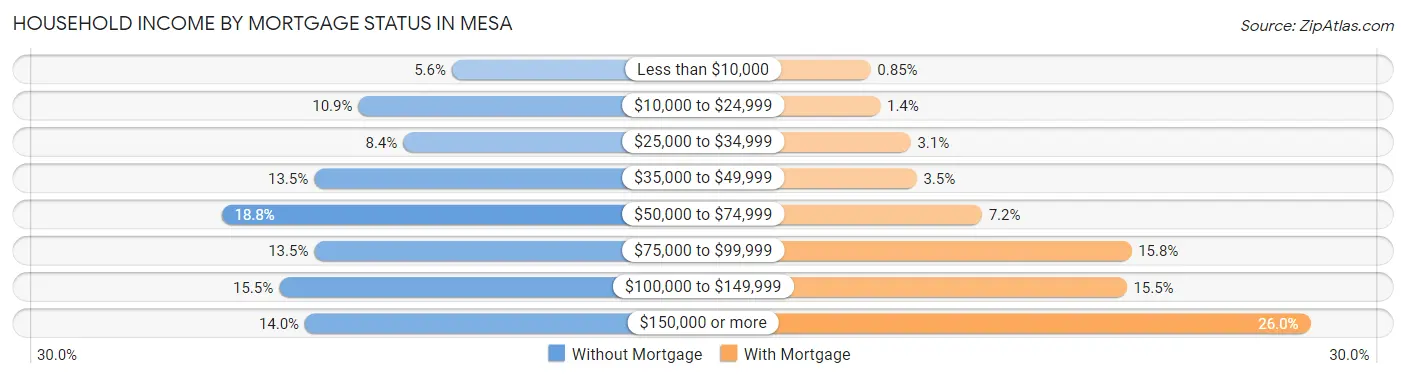
| Household Income | Without Mortgage | With Mortgage |
| Less than $10,000 | 2,407 (5.6%) | 669 (0.9%) |
| $10,000 to $24,999 | 4,706 (10.9%) | 1,110 (1.4%) |
| $25,000 to $34,999 | 3,605 (8.4%) | 2,485 (3.1%) |
| $35,000 to $49,999 | 5,795 (13.5%) | 2,754 (3.5%) |
| $50,000 to $74,999 | 8,075 (18.8%) | 5,697 (7.2%) |
| $75,000 to $99,999 | 5,791 (13.5%) | 12,452 (15.8%) |
| $100,000 to $149,999 | 6,657 (15.5%) | 12,238 (15.5%) |
| $150,000 or more | 6,020 (14.0%) | 20,547 (26.0%) |
| Total | 43,056 (100.0%) | 79,043 (100.0%) |
Property Value to Household Income Ratio in Mesa
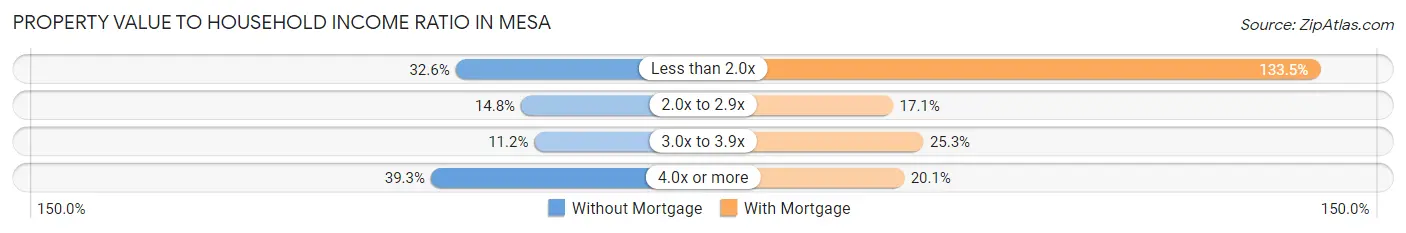
| Value-to-Income Ratio | Without Mortgage | With Mortgage |
| Less than 2.0x | 14,045 (32.6%) | 105,518 (133.5%) |
| 2.0x to 2.9x | 6,367 (14.8%) | 13,490 (17.1%) |
| 3.0x to 3.9x | 4,808 (11.2%) | 20,029 (25.3%) |
| 4.0x or more | 16,940 (39.3%) | 15,884 (20.1%) |
| Total | 43,056 (100.0%) | 79,043 (100.0%) |
Real Estate Taxes by Mortgage Status in Mesa
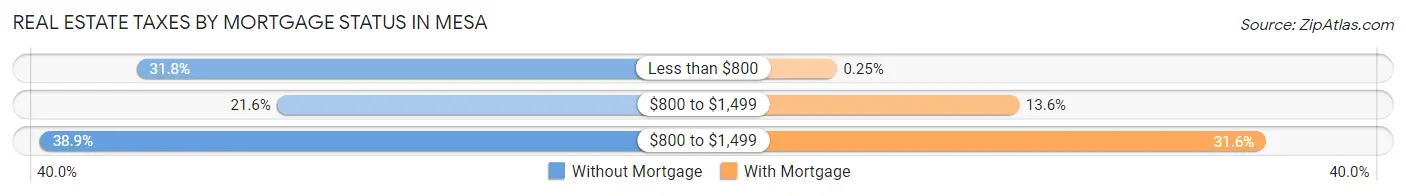
| Property Taxes | Without Mortgage | With Mortgage |
| Less than $800 | 13,698 (31.8%) | 194 (0.3%) |
| $800 to $1,499 | 9,296 (21.6%) | 10,731 (13.6%) |
| $800 to $1,499 | 16,743 (38.9%) | 25,012 (31.6%) |
| Total | 43,056 (100.0%) | 79,043 (100.0%) |
Health & Disability in Mesa
Health Insurance Coverage by Age in Mesa
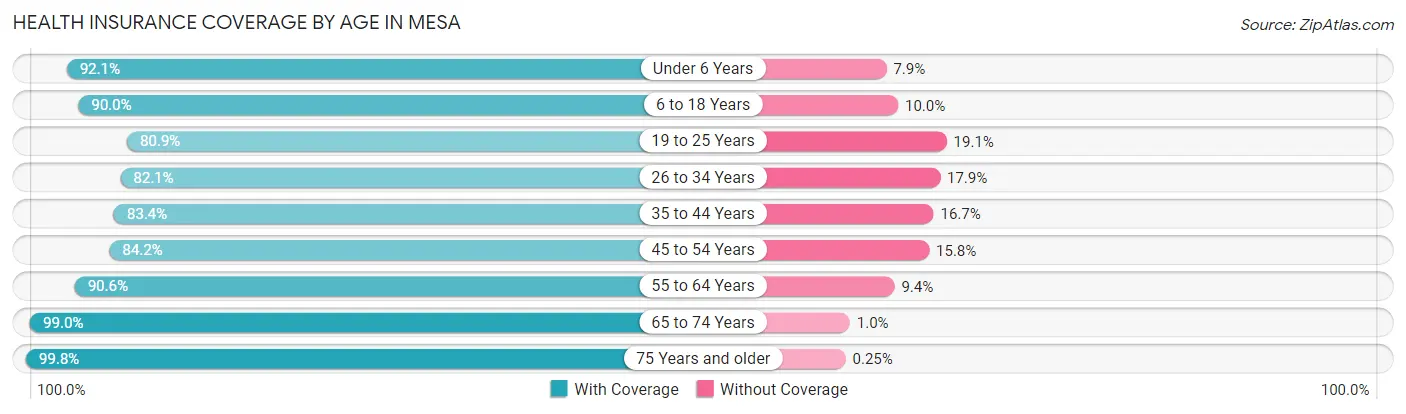
| Age Bracket | With Coverage | Without Coverage |
| Under 6 Years | 34,117 (92.1%) | 2,909 (7.9%) |
| 6 to 18 Years | 76,122 (90.0%) | 8,473 (10.0%) |
| 19 to 25 Years | 39,567 (80.9%) | 9,338 (19.1%) |
| 26 to 34 Years | 56,424 (82.1%) | 12,267 (17.9%) |
| 35 to 44 Years | 51,377 (83.4%) | 10,263 (16.7%) |
| 45 to 54 Years | 49,301 (84.2%) | 9,263 (15.8%) |
| 55 to 64 Years | 52,449 (90.6%) | 5,418 (9.4%) |
| 65 to 74 Years | 47,170 (99.0%) | 496 (1.0%) |
| 75 Years and older | 35,628 (99.8%) | 89 (0.3%) |
| Total | 442,155 (88.3%) | 58,516 (11.7%) |
Health Insurance Coverage by Citizenship Status in Mesa
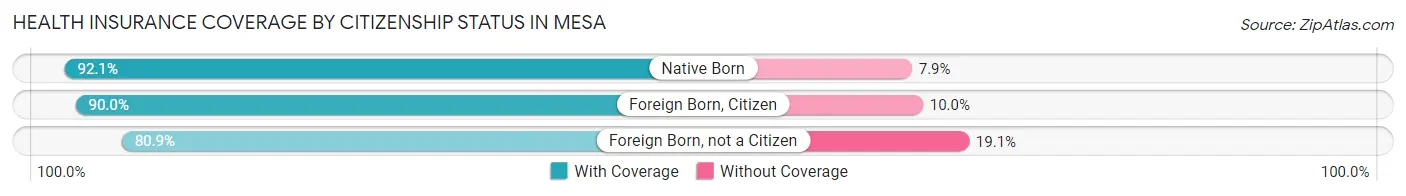
| Citizenship Status | With Coverage | Without Coverage |
| Native Born | 34,117 (92.1%) | 2,909 (7.9%) |
| Foreign Born, Citizen | 76,122 (90.0%) | 8,473 (10.0%) |
| Foreign Born, not a Citizen | 39,567 (80.9%) | 9,338 (19.1%) |
Health Insurance Coverage by Household Income in Mesa
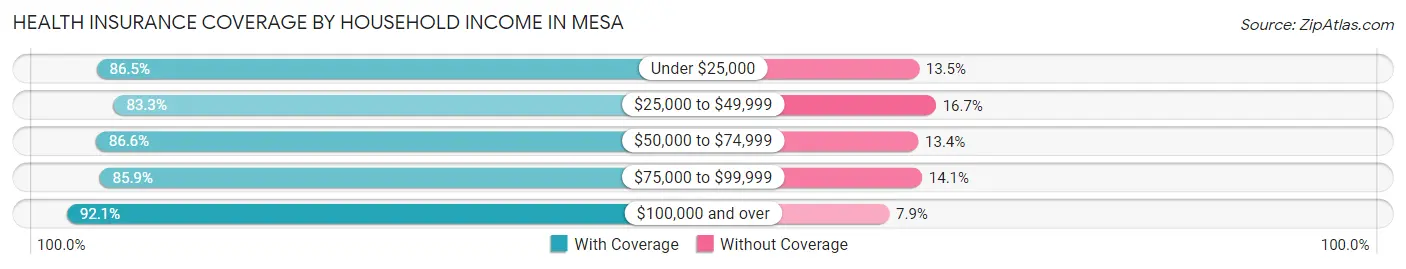
| Household Income | With Coverage | Without Coverage |
| Under $25,000 | 36,735 (86.5%) | 5,729 (13.5%) |
| $25,000 to $49,999 | 67,098 (83.3%) | 13,409 (16.7%) |
| $50,000 to $74,999 | 74,999 (86.6%) | 11,561 (13.4%) |
| $75,000 to $99,999 | 65,128 (85.9%) | 10,654 (14.1%) |
| $100,000 and over | 195,618 (92.1%) | 16,836 (7.9%) |
Public vs Private Health Insurance Coverage by Age in Mesa
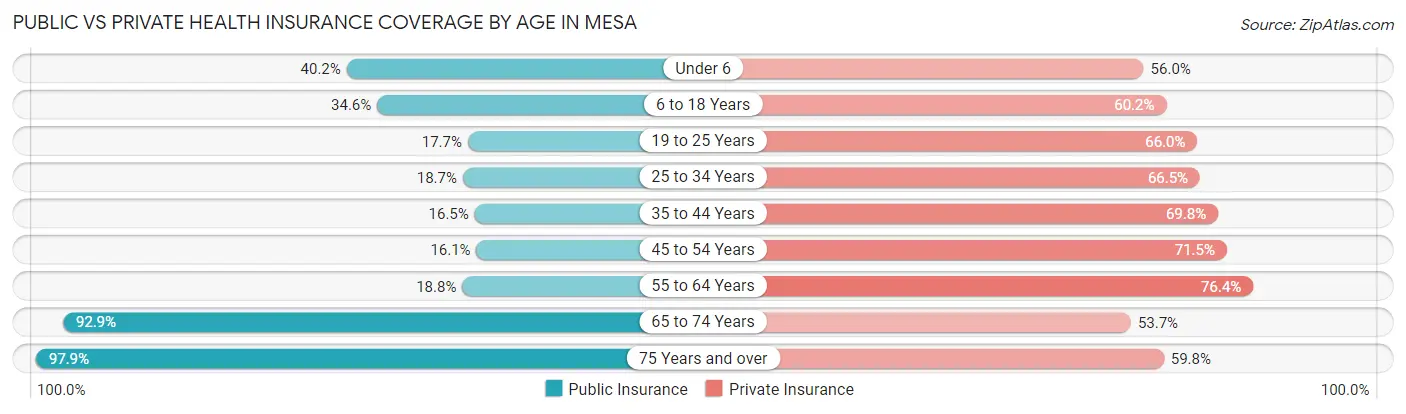
| Age Bracket | Public Insurance | Private Insurance |
| Under 6 | 14,897 (40.2%) | 20,744 (56.0%) |
| 6 to 18 Years | 29,241 (34.6%) | 50,944 (60.2%) |
| 19 to 25 Years | 8,670 (17.7%) | 32,274 (66.0%) |
| 25 to 34 Years | 12,825 (18.7%) | 45,661 (66.5%) |
| 35 to 44 Years | 10,155 (16.5%) | 43,040 (69.8%) |
| 45 to 54 Years | 9,444 (16.1%) | 41,842 (71.5%) |
| 55 to 64 Years | 10,863 (18.8%) | 44,181 (76.3%) |
| 65 to 74 Years | 44,279 (92.9%) | 25,580 (53.7%) |
| 75 Years and over | 34,969 (97.9%) | 21,348 (59.8%) |
| Total | 175,343 (35.0%) | 325,614 (65.0%) |
Disability Status by Sex by Age in Mesa
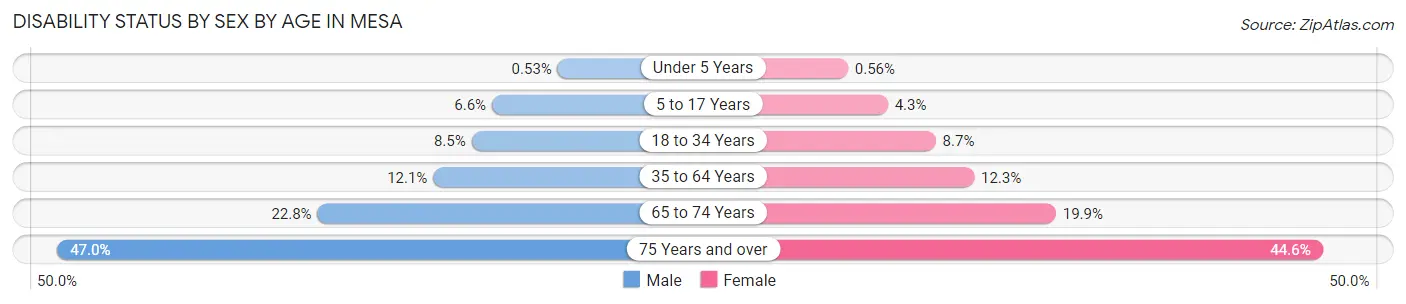
| Age Bracket | Male | Female |
| Under 5 Years | 88 (0.5%) | 80 (0.6%) |
| 5 to 17 Years | 2,827 (6.6%) | 1,779 (4.3%) |
| 18 to 34 Years | 5,481 (8.5%) | 5,193 (8.7%) |
| 35 to 64 Years | 10,626 (12.1%) | 11,055 (12.3%) |
| 65 to 74 Years | 5,159 (22.8%) | 4,977 (19.9%) |
| 75 Years and over | 7,192 (47.0%) | 9,102 (44.6%) |
Disability Class by Sex by Age in Mesa
Disability Class: Hearing Difficulty
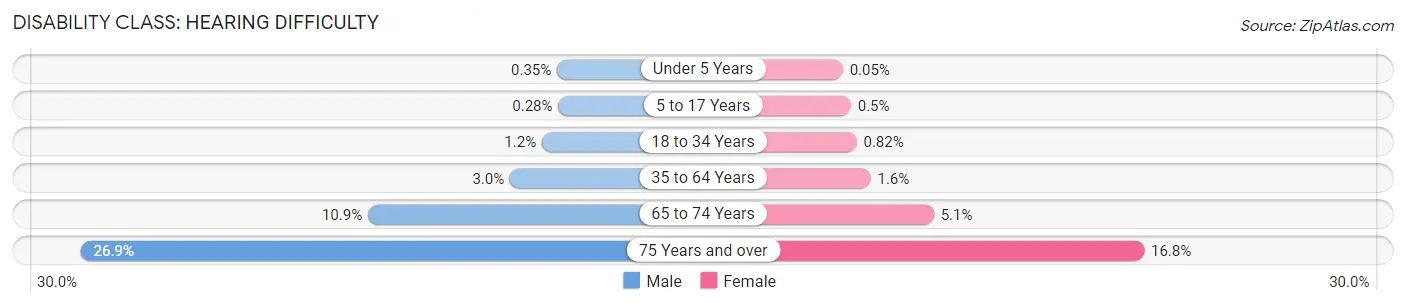
| Age Bracket | Male | Female |
| Under 5 Years | 58 (0.4%) | 7 (0.1%) |
| 5 to 17 Years | 120 (0.3%) | 208 (0.5%) |
| 18 to 34 Years | 769 (1.2%) | 491 (0.8%) |
| 35 to 64 Years | 2,610 (3.0%) | 1,443 (1.6%) |
| 65 to 74 Years | 2,460 (10.9%) | 1,283 (5.1%) |
| 75 Years and over | 4,116 (26.9%) | 3,435 (16.8%) |
Disability Class: Vision Difficulty
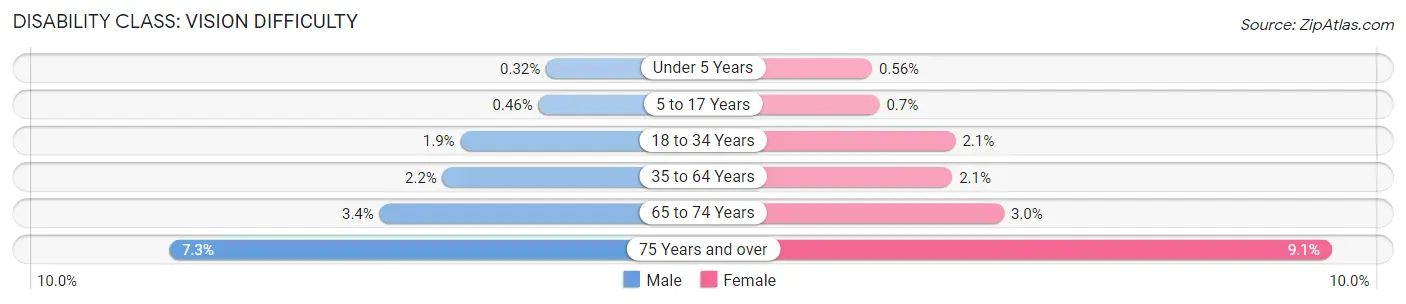
| Age Bracket | Male | Female |
| Under 5 Years | 53 (0.3%) | 80 (0.6%) |
| 5 to 17 Years | 195 (0.5%) | 292 (0.7%) |
| 18 to 34 Years | 1,229 (1.9%) | 1,258 (2.1%) |
| 35 to 64 Years | 1,970 (2.2%) | 1,851 (2.1%) |
| 65 to 74 Years | 771 (3.4%) | 754 (3.0%) |
| 75 Years and over | 1,121 (7.3%) | 1,854 (9.1%) |
Disability Class: Cognitive Difficulty
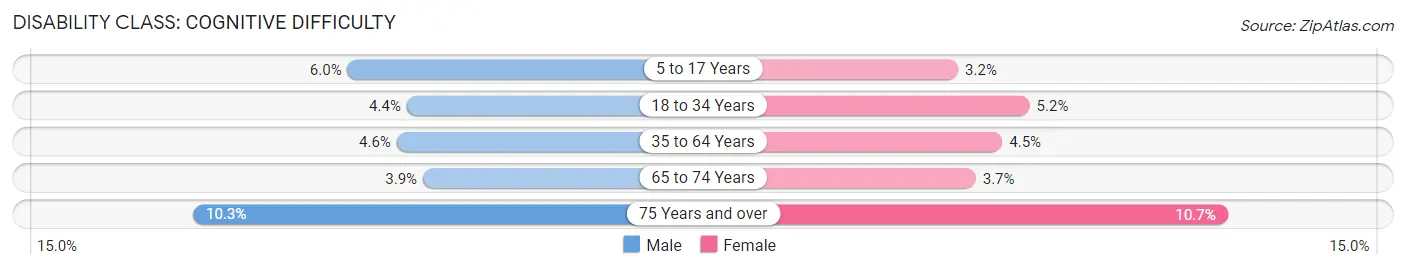
| Age Bracket | Male | Female |
| 5 to 17 Years | 2,564 (6.0%) | 1,350 (3.2%) |
| 18 to 34 Years | 2,803 (4.4%) | 3,117 (5.2%) |
| 35 to 64 Years | 4,081 (4.6%) | 4,030 (4.5%) |
| 65 to 74 Years | 883 (3.9%) | 936 (3.7%) |
| 75 Years and over | 1,579 (10.3%) | 2,191 (10.7%) |
Disability Class: Ambulatory Difficulty
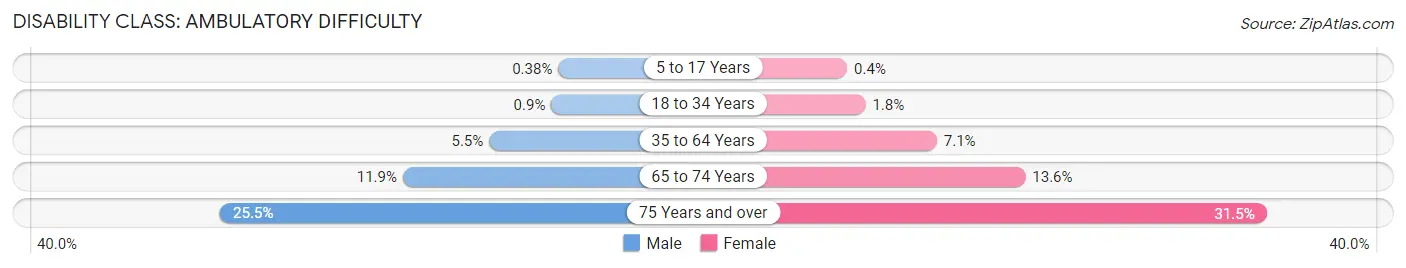
| Age Bracket | Male | Female |
| 5 to 17 Years | 163 (0.4%) | 168 (0.4%) |
| 18 to 34 Years | 580 (0.9%) | 1,049 (1.8%) |
| 35 to 64 Years | 4,848 (5.5%) | 6,357 (7.1%) |
| 65 to 74 Years | 2,694 (11.9%) | 3,417 (13.6%) |
| 75 Years and over | 3,902 (25.5%) | 6,434 (31.5%) |
Disability Class: Self-Care Difficulty
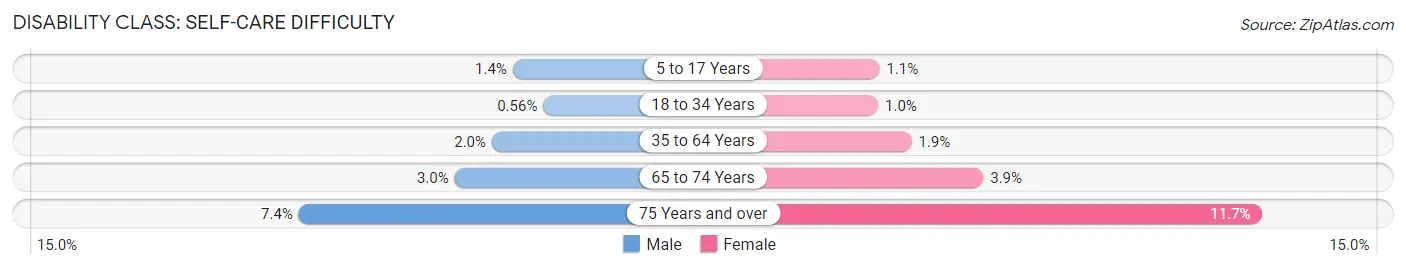
| Age Bracket | Male | Female |
| 5 to 17 Years | 602 (1.4%) | 439 (1.1%) |
| 18 to 34 Years | 362 (0.6%) | 599 (1.0%) |
| 35 to 64 Years | 1,753 (2.0%) | 1,748 (1.9%) |
| 65 to 74 Years | 684 (3.0%) | 987 (3.9%) |
| 75 Years and over | 1,129 (7.4%) | 2,389 (11.7%) |
Technology Access in Mesa
Computing Device Access in Mesa
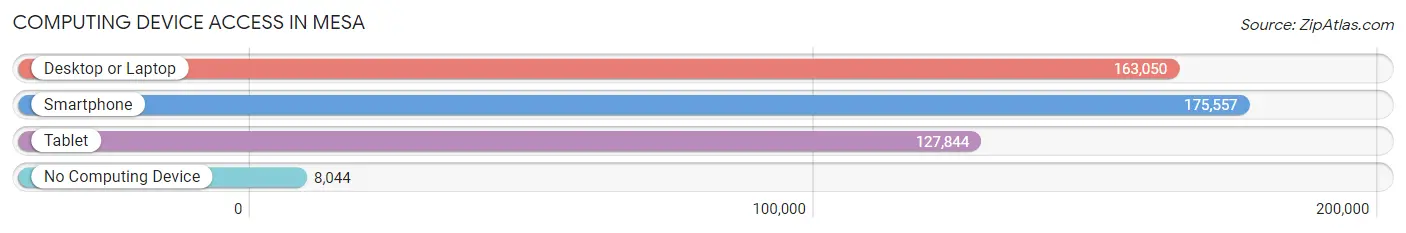
| Device Type | # Households | % Households |
| Desktop or Laptop | 163,050 | 84.3% |
| Smartphone | 175,557 | 90.8% |
| Tablet | 127,844 | 66.1% |
| No Computing Device | 8,044 | 4.2% |
| Total | 193,316 | 100.0% |
Internet Access in Mesa
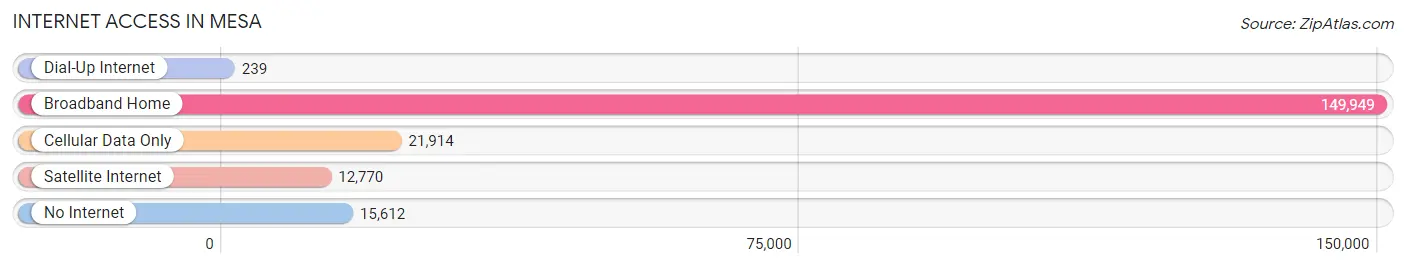
| Internet Type | # Households | % Households |
| Dial-Up Internet | 239 | 0.1% |
| Broadband Home | 149,949 | 77.6% |
| Cellular Data Only | 21,914 | 11.3% |
| Satellite Internet | 12,770 | 6.6% |
| No Internet | 15,612 | 8.1% |
| Total | 193,316 | 100.0% |
Mesa Summary
Mesa, Arizona is a city located in Maricopa County, Arizona, United States. It is the third-largest city in Arizona, after Phoenix and Tucson, and is the 38th-largest city in the United States. Mesa is located about 20 miles east of Phoenix and is part of the Phoenix metropolitan area. The city is home to a population of over 500,000 people, making it one of the largest cities in the state.
Geography
Mesa is located in the Sonoran Desert, at an elevation of 1,167 feet. The city is bordered by Tempe to the west, Gilbert to the east, Apache Junction to the northeast, and Chandler to the south. The city is located in the Salt River Valley, which is part of the larger Phoenix metropolitan area. The city is located in the Salt River Valley, which is part of the larger Phoenix metropolitan area. The city is located in the Salt River Valley, which is part of the larger Phoenix metropolitan area.
The city is divided into several distinct neighborhoods, including Downtown Mesa, East Mesa, West Mesa, and South Mesa. The city is also home to several parks, including Usery Mountain Regional Park, Red Mountain Park, and the Mesa Riverview Park.
Economy
Mesa is home to a diverse economy, with a variety of industries represented. The city is home to several major employers, including Boeing, Intel, and Banner Health. The city is also home to several major universities, including Arizona State University, University of Phoenix, and Grand Canyon University.
The city is also home to several major shopping centers, including Mesa Mall, Fiesta Mall, and Superstition Springs Center. The city is also home to several major attractions, including the Mesa Arts Center, the Arizona Museum of Natural History, and the Mesa Amphitheater.
Demographics
As of the 2010 census, the population of Mesa was 439,041, making it the third-largest city in Arizona. The population is composed of a diverse mix of ethnicities, with the largest groups being White (63.2%), Hispanic or Latino (25.2%), and Native American (3.2%). The median age of the population is 33.7 years, and the median household income is $50,945.
The city is home to a variety of religions, with the largest being Christianity (63.2%), followed by Judaism (2.2%), Islam (1.2%), and Buddhism (0.7%). The city is also home to a variety of languages, with the most common being English (83.2%), Spanish (9.2%), and Navajo (2.2%).
Conclusion
Mesa, Arizona is a vibrant city located in Maricopa County, Arizona. The city is home to a population of over 500,000 people, making it one of the largest cities in the state. The city is home to a diverse economy, with a variety of industries represented. The population is composed of a diverse mix of ethnicities, with the largest groups being White, Hispanic or Latino, and Native American. The city is home to a variety of religions, with the largest being Christianity, followed by Judaism, Islam, and Buddhism. The city is also home to a variety of languages, with the most common being English, Spanish, and Navajo.
Common Questions
What is Per Capita Income in Mesa?
Per Capita income in Mesa is $37,197.
What is the Median Family Income in Mesa?
Median Family Income in Mesa is $87,185.
What is the Median Household income in Mesa?
Median Household Income in Mesa is $73,766.
What is Income or Wage Gap in Mesa?
Income or Wage Gap in Mesa is 20.8%.
Women in Mesa earn 79.2 cents for every dollar earned by a man.
What is Family Income Deficit in Mesa?
Family Income Deficit in Mesa is $11,015.
Families that are below poverty line in Mesa earn $11,015 less on average than the poverty threshold level.
What is Inequality or Gini Index in Mesa?
Inequality or Gini Index in Mesa is 0.43.
What is the Total Population of Mesa?
Total Population of Mesa is 503,390.
What is the Total Male Population of Mesa?
Total Male Population of Mesa is 251,051.
What is the Total Female Population of Mesa?
Total Female Population of Mesa is 252,339.
What is the Ratio of Males per 100 Females in Mesa?
There are 99.49 Males per 100 Females in Mesa.
What is the Ratio of Females per 100 Males in Mesa?
There are 100.51 Females per 100 Males in Mesa.
What is the Median Population Age in Mesa?
Median Population Age in Mesa is 36.8 Years.
What is the Average Family Size in Mesa
Average Family Size in Mesa is 3.1 People.
What is the Average Household Size in Mesa
Average Household Size in Mesa is 2.6 People.
How Large is the Labor Force in Mesa?
There are 261,416 People in the Labor Forcein in Mesa.
What is the Percentage of People in the Labor Force in Mesa?
65.4% of People are in the Labor Force in Mesa.
What is the Unemployment Rate in Mesa?
Unemployment Rate in Mesa is 4.7%.