Homestead, FL Map & Demographics
Homestead Map
Homestead Overview
$22,293
PER CAPITA INCOME
$58,721
AVG FAMILY INCOME
$57,739
AVG HOUSEHOLD INCOME
18.7%
WAGE / INCOME GAP [ % ]
81.3¢/ $1
WAGE / INCOME GAP [ $ ]
$11,461
FAMILY INCOME DEFICIT
0.42
INEQUALITY / GINI INDEX
79,996
TOTAL POPULATION
39,121
MALE POPULATION
40,875
FEMALE POPULATION
95.71
MALES / 100 FEMALES
104.48
FEMALES / 100 MALES
31.5
MEDIAN AGE
3.6
AVG FAMILY SIZE
3.2
AVG HOUSEHOLD SIZE
37,304
LABOR FORCE [ PEOPLE ]
65.2%
PERCENT IN LABOR FORCE
4.8%
UNEMPLOYMENT RATE
Income in Homestead
Income Overview in Homestead
Per Capita Income in Homestead is $22,293, while median incomes of families and households are $58,721 and $57,739 respectively.
| Characteristic | Number | Measure |
| Per Capita Income | 79,996 | $22,293 |
| Median Family Income | 19,111 | $58,721 |
| Mean Family Income | 19,111 | $72,808 |
| Median Household Income | 24,626 | $57,739 |
| Mean Household Income | 24,626 | $69,386 |
| Income Deficit | 19,111 | $11,461 |
| Wage / Income Gap (%) | 79,996 | 18.74% |
| Wage / Income Gap ($) | 79,996 | 81.26¢ per $1 |
| Gini / Inequality Index | 79,996 | 0.42 |
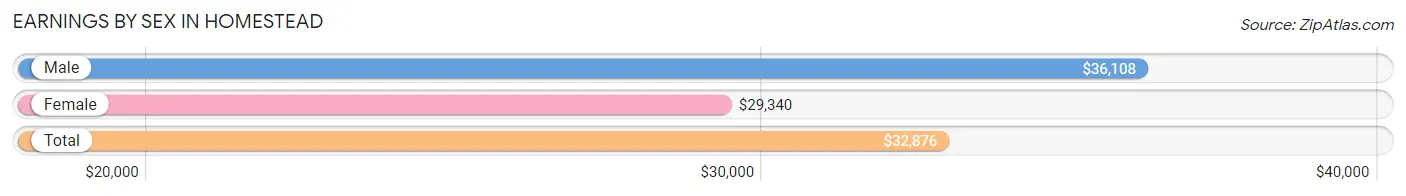
Earnings by Sex in Homestead
Average Earnings in Homestead are $32,876, $36,108 for men and $29,340 for women, a difference of 18.7%.
| Sex | Number | Average Earnings |
| Male | 20,206 (53.0%) | $36,108 |
| Female | 17,927 (47.0%) | $29,340 |
| Total | 38,133 (100.0%) | $32,876 |
Earnings by Sex by Income Bracket in Homestead
The most common earnings brackets in Homestead are $100,000+ for men (1,798 | 8.9%) and $25,000 to $29,999 for women (2,284 | 12.7%).
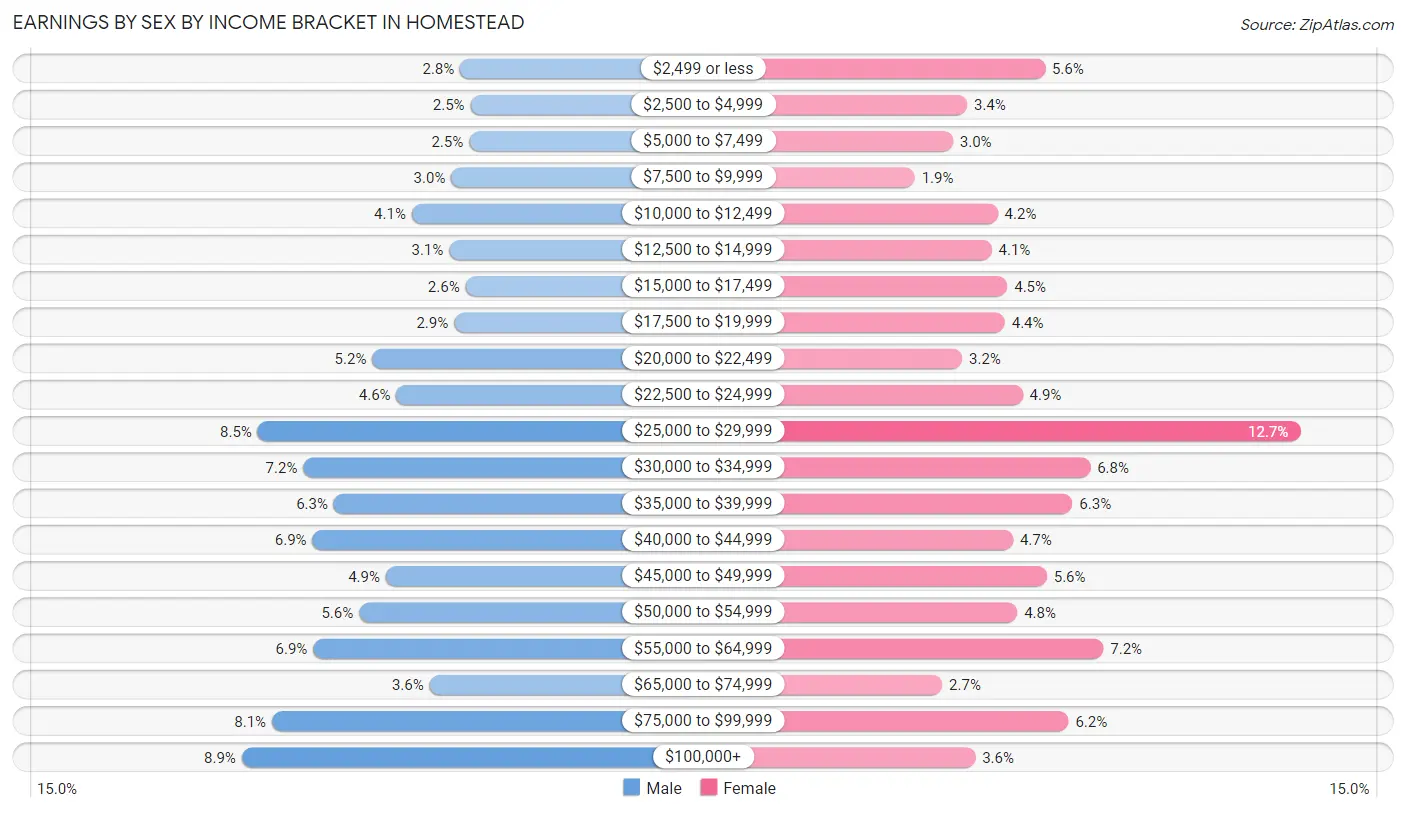
| Income | Male | Female |
| $2,499 or less | 557 (2.8%) | 999 (5.6%) |
| $2,500 to $4,999 | 499 (2.5%) | 606 (3.4%) |
| $5,000 to $7,499 | 508 (2.5%) | 534 (3.0%) |
| $7,500 to $9,999 | 609 (3.0%) | 343 (1.9%) |
| $10,000 to $12,499 | 833 (4.1%) | 760 (4.2%) |
| $12,500 to $14,999 | 620 (3.1%) | 730 (4.1%) |
| $15,000 to $17,499 | 527 (2.6%) | 808 (4.5%) |
| $17,500 to $19,999 | 592 (2.9%) | 796 (4.4%) |
| $20,000 to $22,499 | 1,056 (5.2%) | 580 (3.2%) |
| $22,500 to $24,999 | 919 (4.5%) | 886 (4.9%) |
| $25,000 to $29,999 | 1,707 (8.5%) | 2,284 (12.7%) |
| $30,000 to $34,999 | 1,449 (7.2%) | 1,227 (6.8%) |
| $35,000 to $39,999 | 1,275 (6.3%) | 1,136 (6.3%) |
| $40,000 to $44,999 | 1,397 (6.9%) | 837 (4.7%) |
| $45,000 to $49,999 | 979 (4.9%) | 1,008 (5.6%) |
| $50,000 to $54,999 | 1,131 (5.6%) | 858 (4.8%) |
| $55,000 to $64,999 | 1,392 (6.9%) | 1,292 (7.2%) |
| $65,000 to $74,999 | 732 (3.6%) | 480 (2.7%) |
| $75,000 to $99,999 | 1,626 (8.1%) | 1,116 (6.2%) |
| $100,000+ | 1,798 (8.9%) | 647 (3.6%) |
| Total | 20,206 (100.0%) | 17,927 (100.0%) |
Earnings by Sex by Educational Attainment in Homestead
Average earnings in Homestead are $40,310 for men and $32,355 for women, a difference of 19.7%. Men with an educational attainment of graduate degree enjoy the highest average annual earnings of $60,234, while those with less than high school education earn the least with $25,089. Women with an educational attainment of graduate degree earn the most with the average annual earnings of $52,401, while those with less than high school education have the smallest earnings of $16,819.
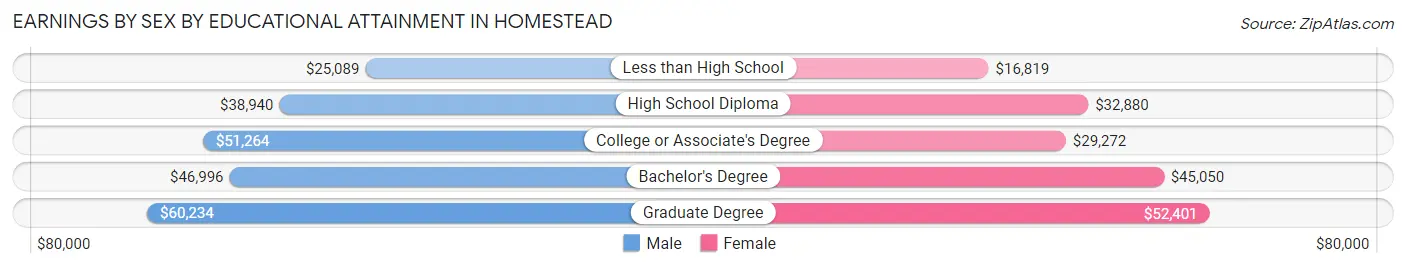
| Educational Attainment | Male Income | Female Income |
| Less than High School | $25,089 | $16,819 |
| High School Diploma | $38,940 | $32,880 |
| College or Associate's Degree | $51,264 | $29,272 |
| Bachelor's Degree | $46,996 | $45,050 |
| Graduate Degree | $60,234 | $52,401 |
| Total | $40,310 | $32,355 |
Family Income in Homestead
Family Income Brackets in Homestead
According to the Homestead family income data, there are 3,727 families falling into the $50,000 to $74,999 income range, which is the most common income bracket and makes up 19.5% of all families. Conversely, the $200,000+ income bracket is the least frequent group with only 516 families (2.7%) belonging to this category.
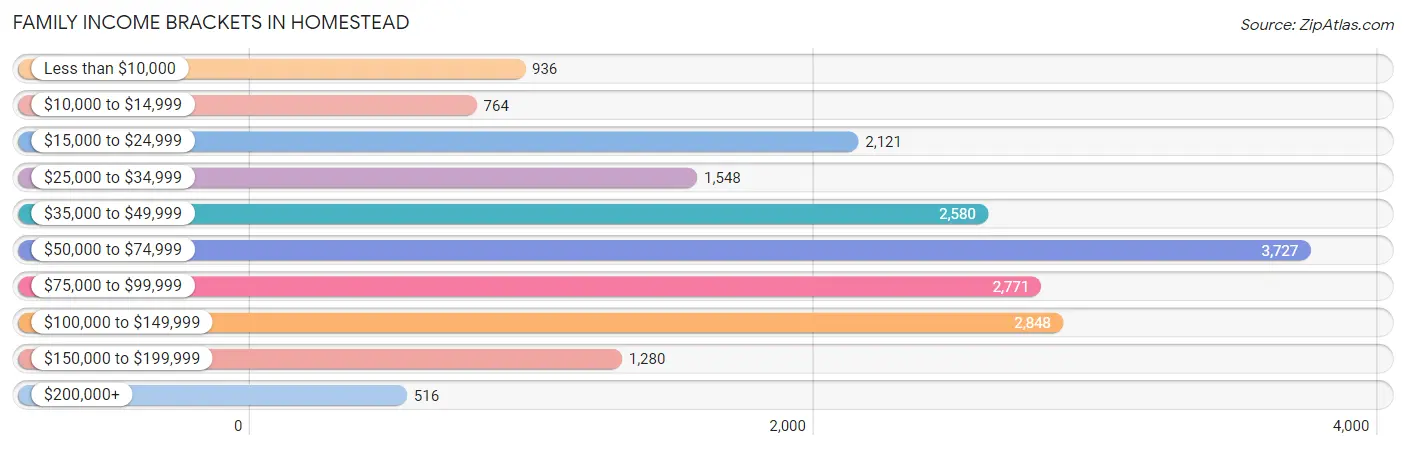
| Income Bracket | # Families | % Families |
| Less than $10,000 | 936 | 4.9% |
| $10,000 to $14,999 | 764 | 4.0% |
| $15,000 to $24,999 | 2,121 | 11.1% |
| $25,000 to $34,999 | 1,548 | 8.1% |
| $35,000 to $49,999 | 2,580 | 13.5% |
| $50,000 to $74,999 | 3,727 | 19.5% |
| $75,000 to $99,999 | 2,771 | 14.5% |
| $100,000 to $149,999 | 2,848 | 14.9% |
| $150,000 to $199,999 | 1,280 | 6.7% |
| $200,000+ | 516 | 2.7% |
Family Income by Famaliy Size in Homestead
7+ person families (598 | 3.1%) account for the highest median family income in Homestead with $111,689 per family, while 2-person families (6,080 | 31.8%) have the highest median income of $24,889 per family member.
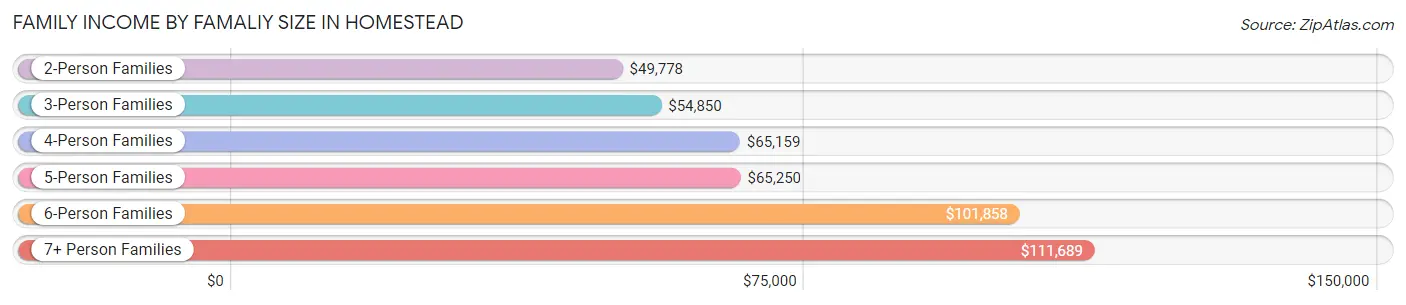
| Income Bracket | # Families | Median Income |
| 2-Person Families | 6,080 (31.8%) | $49,778 |
| 3-Person Families | 5,207 (27.3%) | $54,850 |
| 4-Person Families | 4,086 (21.4%) | $65,159 |
| 5-Person Families | 2,236 (11.7%) | $65,250 |
| 6-Person Families | 904 (4.7%) | $101,858 |
| 7+ Person Families | 598 (3.1%) | $111,689 |
| Total | 19,111 (100.0%) | $58,721 |
Family Income by Number of Earners in Homestead
The median family income in Homestead is $58,721, with families comprising 3+ earners (2,455) having the highest median family income of $110,454, while families with no earners (1,856) have the lowest median family income of $14,368, accounting for 12.9% and 9.7% of families, respectively.
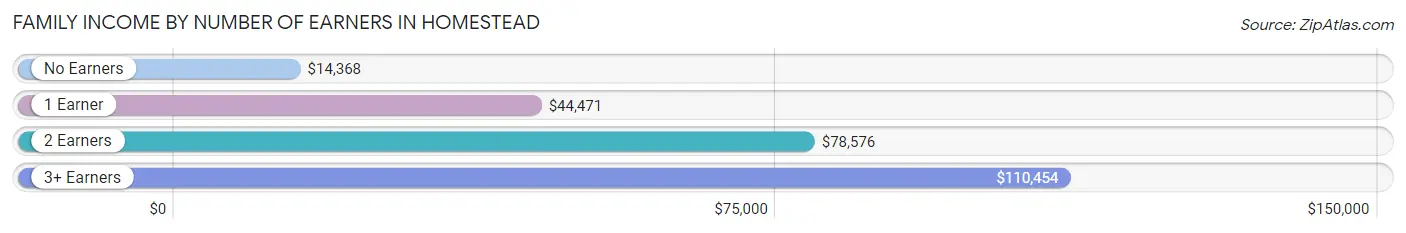
| Number of Earners | # Families | Median Income |
| No Earners | 1,856 (9.7%) | $14,368 |
| 1 Earner | 7,406 (38.8%) | $44,471 |
| 2 Earners | 7,394 (38.7%) | $78,576 |
| 3+ Earners | 2,455 (12.9%) | $110,454 |
| Total | 19,111 (100.0%) | $58,721 |
Household Income in Homestead
Household Income Brackets in Homestead
With 4,630 households falling in the category, the $50,000 to $74,999 income range is the most frequent in Homestead, accounting for 18.8% of all households. In contrast, only 616 households (2.5%) fall into the $200,000+ income bracket, making it the least populous group.
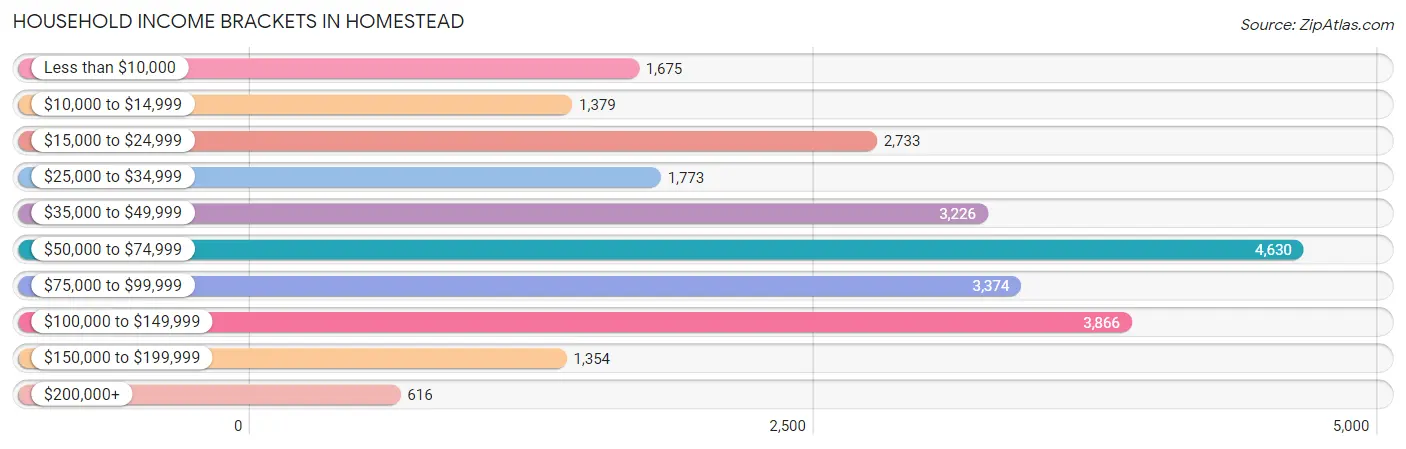
| Income Bracket | # Households | % Households |
| Less than $10,000 | 1,675 | 6.8% |
| $10,000 to $14,999 | 1,379 | 5.6% |
| $15,000 to $24,999 | 2,733 | 11.1% |
| $25,000 to $34,999 | 1,773 | 7.2% |
| $35,000 to $49,999 | 3,226 | 13.1% |
| $50,000 to $74,999 | 4,630 | 18.8% |
| $75,000 to $99,999 | 3,374 | 13.7% |
| $100,000 to $149,999 | 3,866 | 15.7% |
| $150,000 to $199,999 | 1,354 | 5.5% |
| $200,000+ | 616 | 2.5% |
Household Income by Householder Age in Homestead
The median household income in Homestead is $57,739, with the highest median household income of $64,143 found in the 45 to 64 years age bracket for the primary householder. A total of 9,298 households (37.8%) fall into this category. Meanwhile, the 15 to 24 years age bracket for the primary householder has the lowest median household income of $26,642, with 568 households (2.3%) in this group.
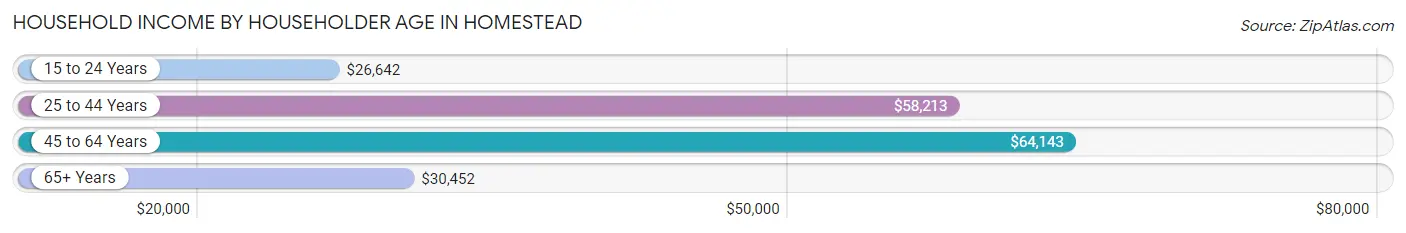
| Income Bracket | # Households | Median Income |
| 15 to 24 Years | 568 (2.3%) | $26,642 |
| 25 to 44 Years | 11,728 (47.6%) | $58,213 |
| 45 to 64 Years | 9,298 (37.8%) | $64,143 |
| 65+ Years | 3,032 (12.3%) | $30,452 |
| Total | 24,626 (100.0%) | $57,739 |
Poverty in Homestead
Income Below Poverty by Sex and Age in Homestead
With 18.3% poverty level for males and 22.4% for females among the residents of Homestead, 6 to 11 year old males and under 5 year old females are the most vulnerable to poverty, with 1,082 males (28.6%) and 1,917 females (48.6%) in their respective age groups living below the poverty level.
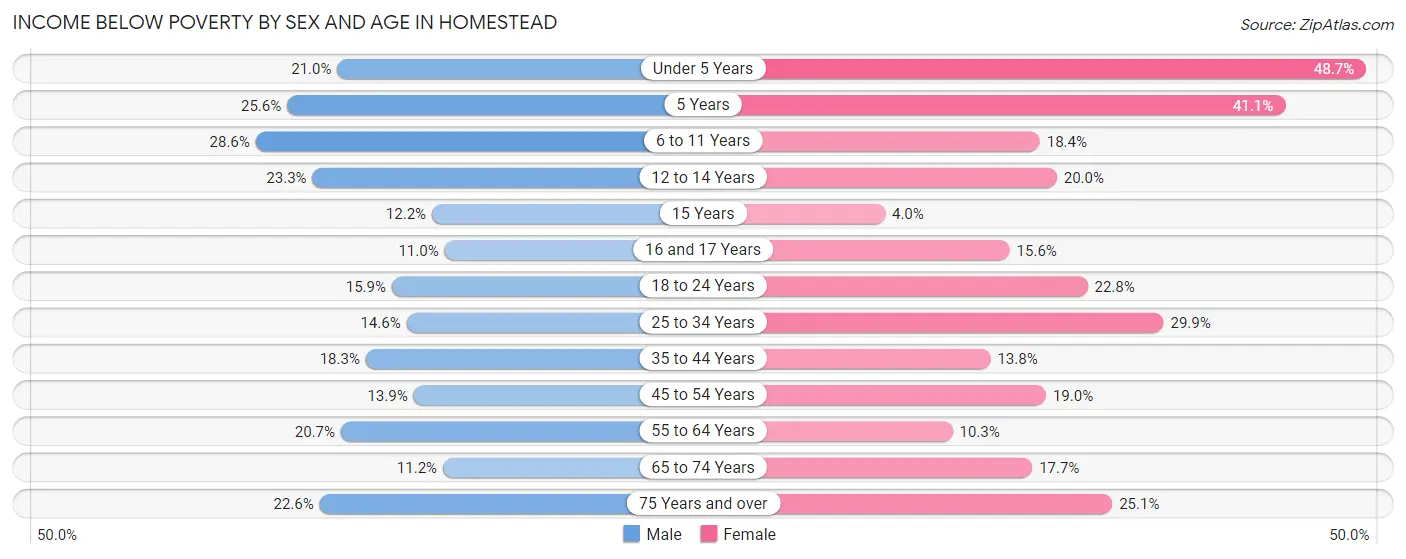
| Age Bracket | Male | Female |
| Under 5 Years | 803 (21.0%) | 1,917 (48.6%) |
| 5 Years | 151 (25.6%) | 181 (41.1%) |
| 6 to 11 Years | 1,082 (28.6%) | 816 (18.4%) |
| 12 to 14 Years | 584 (23.3%) | 384 (20.0%) |
| 15 Years | 72 (12.2%) | 20 (4.0%) |
| 16 and 17 Years | 130 (11.0%) | 218 (15.6%) |
| 18 to 24 Years | 530 (15.9%) | 668 (22.8%) |
| 25 to 34 Years | 1,012 (14.6%) | 1,934 (29.9%) |
| 35 to 44 Years | 1,222 (18.3%) | 863 (13.8%) |
| 45 to 54 Years | 590 (13.9%) | 979 (19.0%) |
| 55 to 64 Years | 607 (20.6%) | 346 (10.3%) |
| 65 to 74 Years | 185 (11.2%) | 377 (17.7%) |
| 75 Years and over | 162 (22.6%) | 380 (25.1%) |
| Total | 7,130 (18.3%) | 9,083 (22.4%) |
Income Above Poverty by Sex and Age in Homestead
According to the poverty statistics in Homestead, males aged 16 and 17 years and females aged 15 years are the age groups that are most secure financially, with 89.0% of males and 96.0% of females in these age groups living above the poverty line.
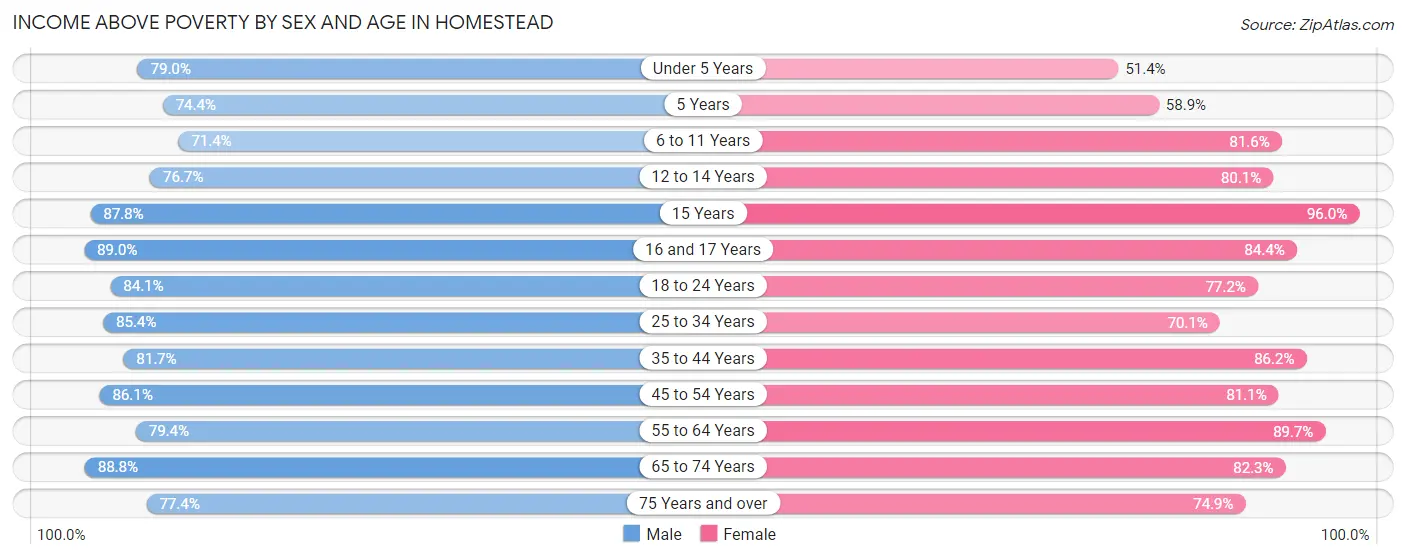
| Age Bracket | Male | Female |
| Under 5 Years | 3,025 (79.0%) | 2,023 (51.3%) |
| 5 Years | 438 (74.4%) | 259 (58.9%) |
| 6 to 11 Years | 2,706 (71.4%) | 3,623 (81.6%) |
| 12 to 14 Years | 1,923 (76.7%) | 1,541 (80.0%) |
| 15 Years | 518 (87.8%) | 479 (96.0%) |
| 16 and 17 Years | 1,049 (89.0%) | 1,181 (84.4%) |
| 18 to 24 Years | 2,800 (84.1%) | 2,260 (77.2%) |
| 25 to 34 Years | 5,940 (85.4%) | 4,542 (70.1%) |
| 35 to 44 Years | 5,442 (81.7%) | 5,390 (86.2%) |
| 45 to 54 Years | 3,653 (86.1%) | 4,186 (81.0%) |
| 55 to 64 Years | 2,332 (79.3%) | 3,020 (89.7%) |
| 65 to 74 Years | 1,470 (88.8%) | 1,756 (82.3%) |
| 75 Years and over | 554 (77.4%) | 1,134 (74.9%) |
| Total | 31,850 (81.7%) | 31,394 (77.6%) |
Income Below Poverty Among Married-Couple Families in Homestead
The poverty statistics for married-couple families in Homestead show that 11.7% or 1,257 of the total 10,706 families live below the poverty line. Families with 3 or 4 children have the highest poverty rate of 34.4%, comprising of 517 families. On the other hand, families with 5 or more children have the lowest poverty rate of 0.0%, which includes 0 families.
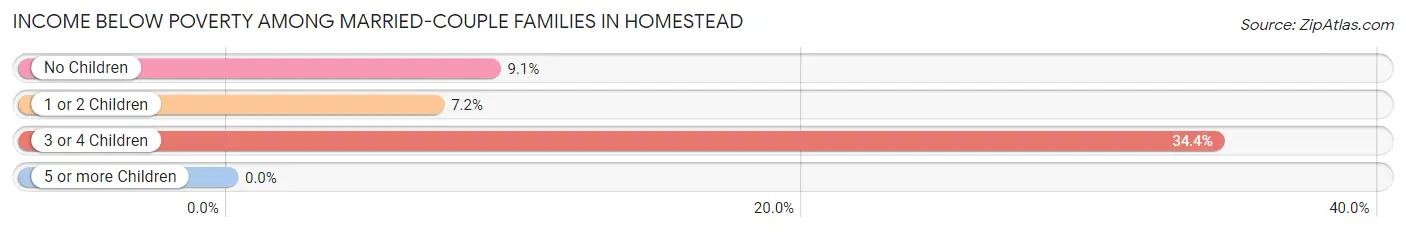
| Children | Above Poverty | Below Poverty |
| No Children | 4,017 (90.9%) | 404 (9.1%) |
| 1 or 2 Children | 4,346 (92.8%) | 336 (7.2%) |
| 3 or 4 Children | 988 (65.6%) | 517 (34.4%) |
| 5 or more Children | 98 (100.0%) | 0 (0.0%) |
| Total | 9,449 (88.3%) | 1,257 (11.7%) |
Income Below Poverty Among Single-Parent Households in Homestead
According to the poverty data in Homestead, 22.7% or 639 single-father households and 26.1% or 1,457 single-mother households are living below the poverty line. Among single-father households, those with 1 or 2 children have the highest poverty rate, with 496 households (31.8%) experiencing poverty. Likewise, among single-mother households, those with 5 or more children have the highest poverty rate, with 65 households (100.0%) falling below the poverty line.
| Children | Single Father | Single Mother |
| No Children | 143 (14.2%) | 106 (6.6%) |
| 1 or 2 Children | 496 (31.8%) | 871 (30.0%) |
| 3 or 4 Children | 0 (0.0%) | 415 (40.6%) |
| 5 or more Children | 0 (0.0%) | 65 (100.0%) |
| Total | 639 (22.7%) | 1,457 (26.1%) |
Income Below Poverty Among Married-Couple vs Single-Parent Households in Homestead
The poverty data for Homestead shows that 1,257 of the married-couple family households (11.7%) and 2,096 of the single-parent households (24.9%) are living below the poverty level. Within the married-couple family households, those with 3 or 4 children have the highest poverty rate, with 517 households (34.4%) falling below the poverty line. Among the single-parent households, those with 5 or more children have the highest poverty rate, with 65 household (100.0%) living below poverty.
| Children | Married-Couple Families | Single-Parent Households |
| No Children | 404 (9.1%) | 249 (9.6%) |
| 1 or 2 Children | 336 (7.2%) | 1,367 (30.6%) |
| 3 or 4 Children | 517 (34.4%) | 415 (32.7%) |
| 5 or more Children | 0 (0.0%) | 65 (100.0%) |
| Total | 1,257 (11.7%) | 2,096 (24.9%) |
Race in Homestead
The most populous races in Homestead are Hispanic or Latino (52,624 | 65.8%), White / Caucasian (37,185 | 46.5%), and Two or more Races (17,892 | 22.4%).
| Race | # Population | % Population |
| Asian | 477 | 0.6% |
| Black / African American | 17,091 | 21.4% |
| Hawaiian / Pacific | 56 | 0.1% |
| Hispanic or Latino | 52,624 | 65.8% |
| Native / Alaskan | 1,345 | 1.7% |
| White / Caucasian | 37,185 | 46.5% |
| Two or more Races | 17,892 | 22.4% |
| Some other Race | 5,950 | 7.4% |
| Total | 79,996 | 100.0% |
Ancestry in Homestead
The most populous ancestries reported in Homestead are Cuban (16,219 | 20.3%), Central American (13,300 | 16.6%), Guatemalan (8,299 | 10.4%), Mexican (8,056 | 10.1%), and Puerto Rican (6,095 | 7.6%), together accounting for 65.0% of all Homestead residents.
| Ancestry | # Population | % Population |
| African | 209 | 0.3% |
| American | 3,252 | 4.1% |
| Arab | 599 | 0.7% |
| Argentinean | 220 | 0.3% |
| Austrian | 16 | 0.0% |
| Bahamian | 553 | 0.7% |
| Basque | 16 | 0.0% |
| Belizean | 146 | 0.2% |
| Bhutanese | 8 | 0.0% |
| Blackfeet | 42 | 0.1% |
| Brazilian | 48 | 0.1% |
| British | 159 | 0.2% |
| British West Indian | 32 | 0.0% |
| Bulgarian | 21 | 0.0% |
| Burmese | 15 | 0.0% |
| Canadian | 43 | 0.1% |
| Central American | 13,300 | 16.6% |
| Central American Indian | 1,208 | 1.5% |
| Cherokee | 152 | 0.2% |
| Chilean | 183 | 0.2% |
| Colombian | 2,726 | 3.4% |
| Costa Rican | 116 | 0.2% |
| Croatian | 9 | 0.0% |
| Cuban | 16,219 | 20.3% |
| Dominican | 1,897 | 2.4% |
| Dutch | 94 | 0.1% |
| Eastern European | 40 | 0.1% |
| Ecuadorian | 581 | 0.7% |
| English | 875 | 1.1% |
| European | 88 | 0.1% |
| French | 1,417 | 1.8% |
| French Canadian | 59 | 0.1% |
| German | 1,369 | 1.7% |
| Greek | 317 | 0.4% |
| Guatemalan | 8,299 | 10.4% |
| Guyanese | 63 | 0.1% |
| Haitian | 4,173 | 5.2% |
| Honduran | 949 | 1.2% |
| Hungarian | 34 | 0.0% |
| Indian (Asian) | 188 | 0.2% |
| Irish | 1,133 | 1.4% |
| Italian | 1,322 | 1.7% |
| Jamaican | 3,054 | 3.8% |
| Korean | 207 | 0.3% |
| Lebanese | 363 | 0.4% |
| Mexican | 8,056 | 10.1% |
| Mexican American Indian | 136 | 0.2% |
| Nicaraguan | 2,518 | 3.2% |
| Nigerian | 82 | 0.1% |
| Northern European | 16 | 0.0% |
| Norwegian | 31 | 0.0% |
| Panamanian | 134 | 0.2% |
| Paraguayan | 12 | 0.0% |
| Peruvian | 1,169 | 1.5% |
| Polish | 114 | 0.1% |
| Portuguese | 400 | 0.5% |
| Puerto Rican | 6,095 | 7.6% |
| Russian | 63 | 0.1% |
| Salvadoran | 1,284 | 1.6% |
| Samoan | 98 | 0.1% |
| Scandinavian | 47 | 0.1% |
| Scotch-Irish | 9 | 0.0% |
| Scottish | 197 | 0.3% |
| Slavic | 21 | 0.0% |
| South American | 5,993 | 7.5% |
| South American Indian | 24 | 0.0% |
| Spaniard | 213 | 0.3% |
| Spanish | 52 | 0.1% |
| Sri Lankan | 19 | 0.0% |
| Subsaharan African | 305 | 0.4% |
| Swedish | 116 | 0.2% |
| Syrian | 58 | 0.1% |
| Thai | 338 | 0.4% |
| Tongan | 98 | 0.1% |
| Trinidadian and Tobagonian | 244 | 0.3% |
| Ukrainian | 6 | 0.0% |
| Venezuelan | 1,102 | 1.4% |
| Vietnamese | 125 | 0.2% |
| West Indian | 174 | 0.2% |
| Yugoslavian | 98 | 0.1% | View All 80 Rows |
Immigrants in Homestead
The most numerous immigrant groups reported in Homestead came from Latin America (29,205 | 36.5%), Caribbean (13,893 | 17.4%), Central America (11,061 | 13.8%), Cuba (9,105 | 11.4%), and Guatemala (5,488 | 6.9%), together accounting for 85.9% of all Homestead residents.
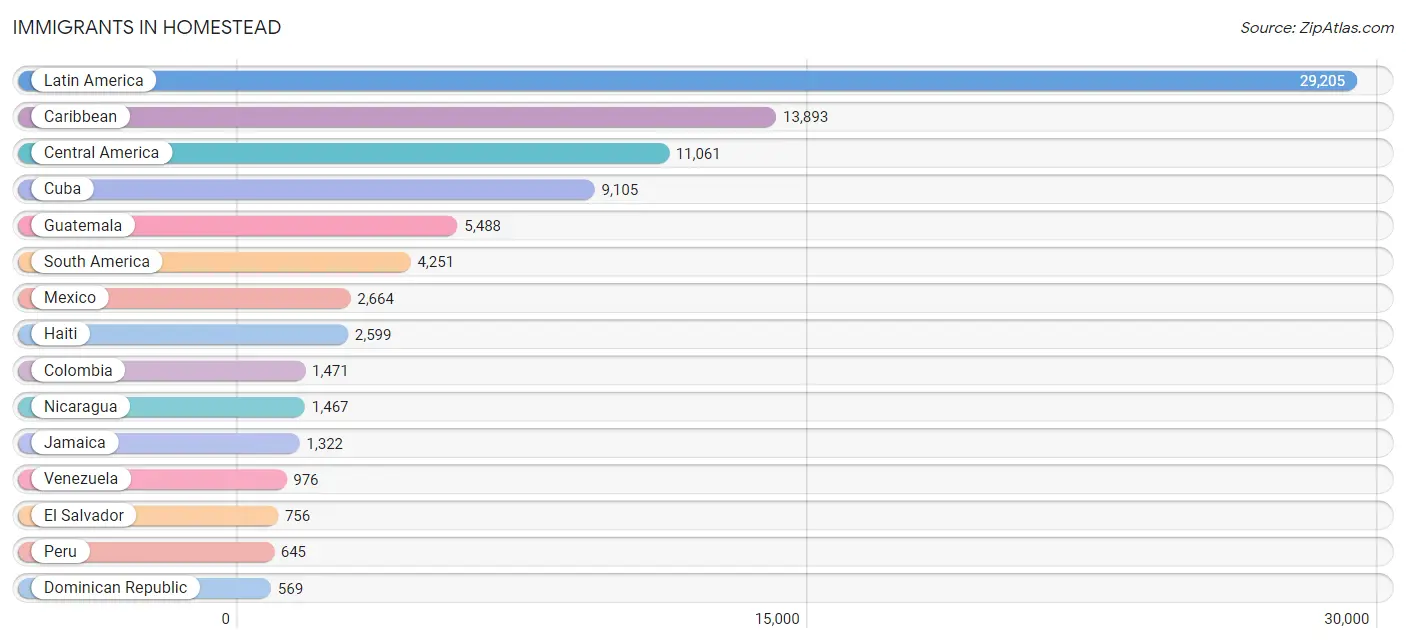
| Immigration Origin | # Population | % Population |
| Africa | 155 | 0.2% |
| Argentina | 243 | 0.3% |
| Asia | 356 | 0.4% |
| Bahamas | 114 | 0.1% |
| Bangladesh | 105 | 0.1% |
| Belize | 12 | 0.0% |
| Bosnia and Herzegovina | 35 | 0.0% |
| Brazil | 202 | 0.3% |
| Canada | 58 | 0.1% |
| Caribbean | 13,893 | 17.4% |
| Central America | 11,061 | 13.8% |
| Chile | 127 | 0.2% |
| China | 69 | 0.1% |
| Colombia | 1,471 | 1.8% |
| Costa Rica | 70 | 0.1% |
| Cuba | 9,105 | 11.4% |
| Dominican Republic | 569 | 0.7% |
| Eastern Africa | 34 | 0.0% |
| Eastern Asia | 69 | 0.1% |
| Eastern Europe | 48 | 0.1% |
| Ecuador | 411 | 0.5% |
| El Salvador | 756 | 0.9% |
| England | 94 | 0.1% |
| Europe | 482 | 0.6% |
| Fiji | 13 | 0.0% |
| Germany | 68 | 0.1% |
| Greece | 75 | 0.1% |
| Guatemala | 5,488 | 6.9% |
| Guyana | 164 | 0.2% |
| Haiti | 2,599 | 3.3% |
| Honduras | 544 | 0.7% |
| India | 51 | 0.1% |
| Italy | 33 | 0.0% |
| Jamaica | 1,322 | 1.7% |
| Latin America | 29,205 | 36.5% |
| Mexico | 2,664 | 3.3% |
| Netherlands | 14 | 0.0% |
| Nicaragua | 1,467 | 1.8% |
| Nigeria | 121 | 0.2% |
| Northern Europe | 156 | 0.2% |
| Oceania | 13 | 0.0% |
| Pakistan | 18 | 0.0% |
| Panama | 60 | 0.1% |
| Peru | 645 | 0.8% |
| Philippines | 63 | 0.1% |
| Poland | 1 | 0.0% |
| Portugal | 48 | 0.1% |
| Russia | 6 | 0.0% |
| South America | 4,251 | 5.3% |
| South Central Asia | 174 | 0.2% |
| South Eastern Asia | 63 | 0.1% |
| Southern Europe | 196 | 0.3% |
| Spain | 40 | 0.1% |
| Trinidad and Tobago | 184 | 0.2% |
| Ukraine | 6 | 0.0% |
| Venezuela | 976 | 1.2% |
| Western Africa | 121 | 0.2% |
| Western Europe | 82 | 0.1% | View All 58 Rows |
Sex and Age in Homestead
Sex and Age in Homestead
The most populous age groups in Homestead are Under 5 Years (3,864 | 9.9%) for men and Under 5 Years (3,940 | 9.6%) for women.
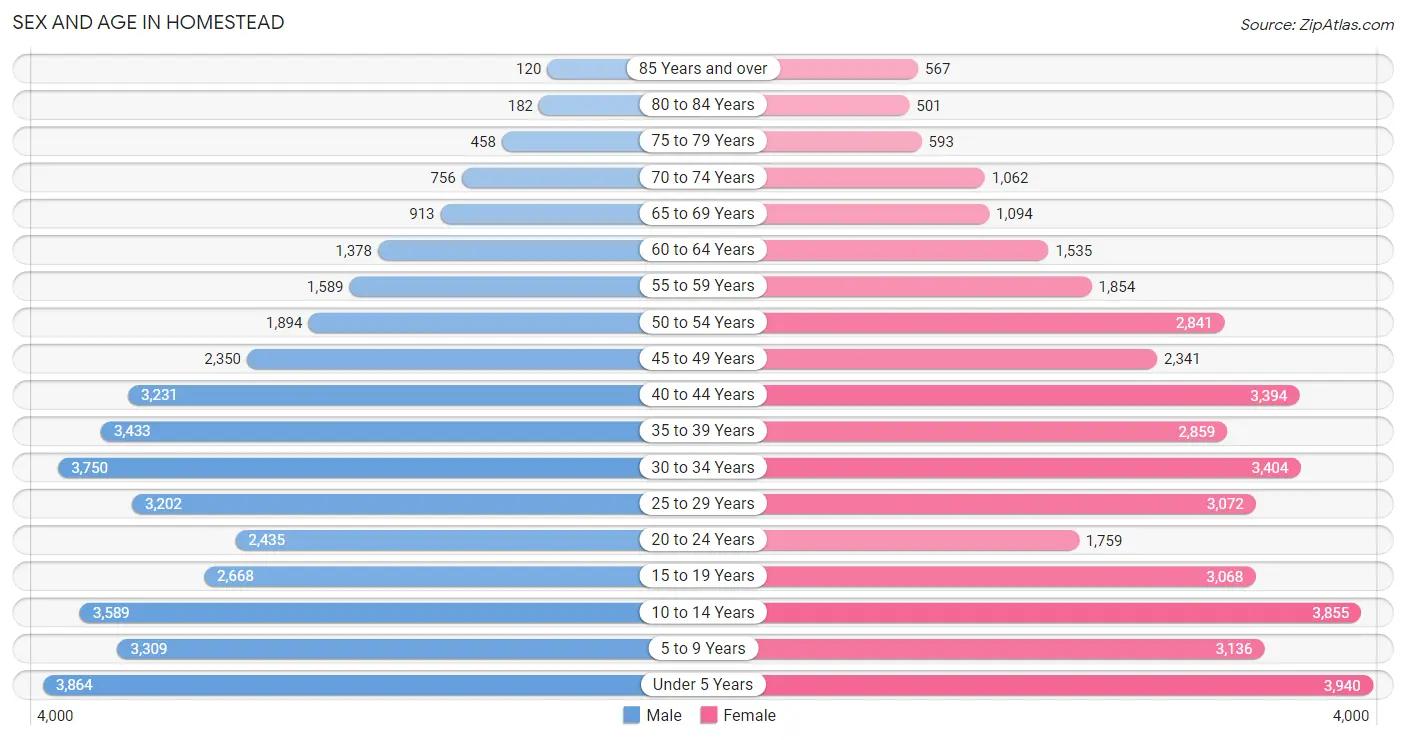
| Age Bracket | Male | Female |
| Under 5 Years | 3,864 (9.9%) | 3,940 (9.6%) |
| 5 to 9 Years | 3,309 (8.5%) | 3,136 (7.7%) |
| 10 to 14 Years | 3,589 (9.2%) | 3,855 (9.4%) |
| 15 to 19 Years | 2,668 (6.8%) | 3,068 (7.5%) |
| 20 to 24 Years | 2,435 (6.2%) | 1,759 (4.3%) |
| 25 to 29 Years | 3,202 (8.2%) | 3,072 (7.5%) |
| 30 to 34 Years | 3,750 (9.6%) | 3,404 (8.3%) |
| 35 to 39 Years | 3,433 (8.8%) | 2,859 (7.0%) |
| 40 to 44 Years | 3,231 (8.3%) | 3,394 (8.3%) |
| 45 to 49 Years | 2,350 (6.0%) | 2,341 (5.7%) |
| 50 to 54 Years | 1,894 (4.8%) | 2,841 (7.0%) |
| 55 to 59 Years | 1,589 (4.1%) | 1,854 (4.5%) |
| 60 to 64 Years | 1,378 (3.5%) | 1,535 (3.8%) |
| 65 to 69 Years | 913 (2.3%) | 1,094 (2.7%) |
| 70 to 74 Years | 756 (1.9%) | 1,062 (2.6%) |
| 75 to 79 Years | 458 (1.2%) | 593 (1.5%) |
| 80 to 84 Years | 182 (0.5%) | 501 (1.2%) |
| 85 Years and over | 120 (0.3%) | 567 (1.4%) |
| Total | 39,121 (100.0%) | 40,875 (100.0%) |
Families and Households in Homestead
Median Family Size in Homestead
The median family size in Homestead is 3.63 persons per family, with married-couple families (10,706 | 56.0%) accounting for the largest median family size of 3.71 persons per family. On the other hand, single male/father families (2,815 | 14.7%) represent the smallest median family size with 3.12 persons per family.
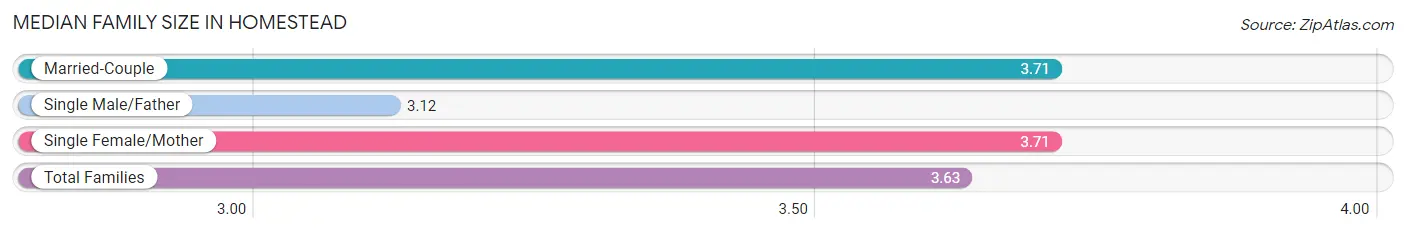
| Family Type | # Families | Family Size |
| Married-Couple | 10,706 (56.0%) | 3.71 |
| Single Male/Father | 2,815 (14.7%) | 3.12 |
| Single Female/Mother | 5,590 (29.2%) | 3.71 |
| Total Families | 19,111 (100.0%) | 3.63 |
Median Household Size in Homestead
The median household size in Homestead is 3.22 persons per household, with single female/mother households (5,590 | 22.7%) accounting for the largest median household size of 3.99 persons per household. non-family households (5,515 | 22.4%) represent the smallest median household size with 1.25 persons per household.
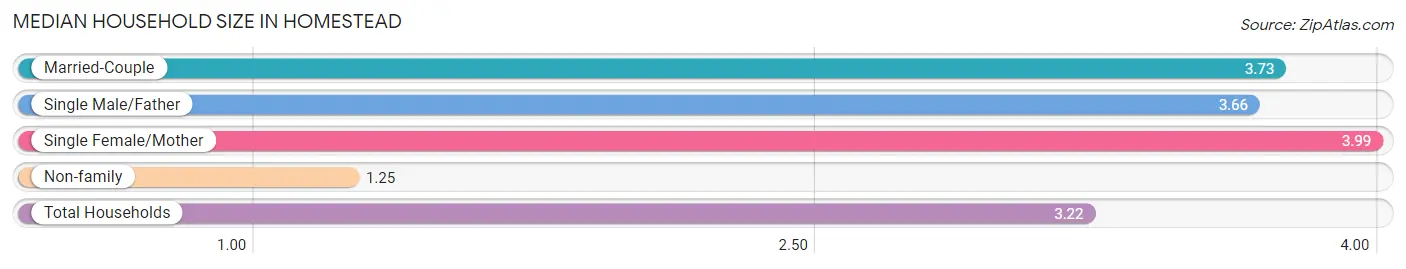
| Household Type | # Households | Household Size |
| Married-Couple | 10,706 (43.5%) | 3.73 |
| Single Male/Father | 2,815 (11.4%) | 3.66 |
| Single Female/Mother | 5,590 (22.7%) | 3.99 |
| Non-family | 5,515 (22.4%) | 1.25 |
| Total Households | 24,626 (100.0%) | 3.22 |
Household Size by Marriage Status in Homestead
Out of a total of 24,626 households in Homestead, 19,111 (77.6%) are family households, while 5,515 (22.4%) are nonfamily households. The most numerous type of family households are 3-person households, comprising 5,494, and the most common type of nonfamily households are 1-person households, comprising 4,703.
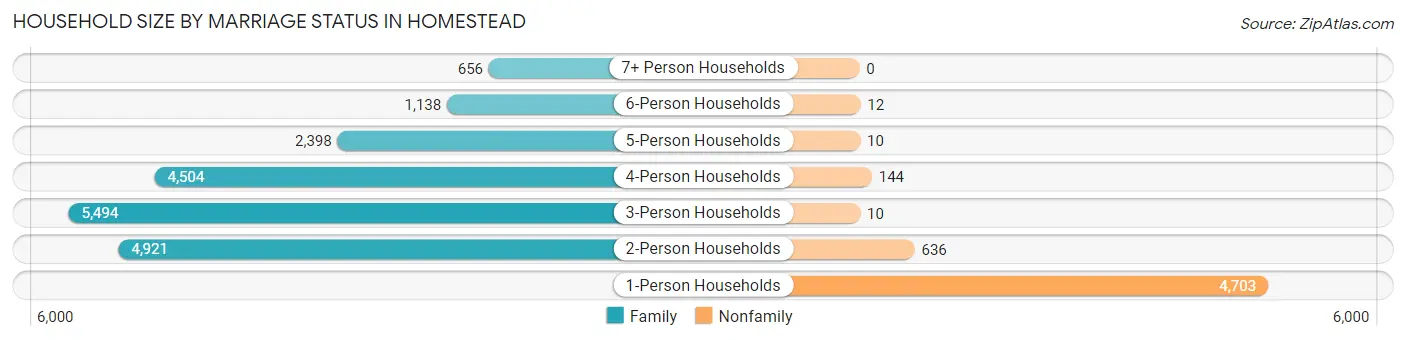
| Household Size | Family Households | Nonfamily Households |
| 1-Person Households | - | 4,703 (19.1%) |
| 2-Person Households | 4,921 (20.0%) | 636 (2.6%) |
| 3-Person Households | 5,494 (22.3%) | 10 (0.0%) |
| 4-Person Households | 4,504 (18.3%) | 144 (0.6%) |
| 5-Person Households | 2,398 (9.7%) | 10 (0.0%) |
| 6-Person Households | 1,138 (4.6%) | 12 (0.1%) |
| 7+ Person Households | 656 (2.7%) | 0 (0.0%) |
| Total | 19,111 (77.6%) | 5,515 (22.4%) |
Female Fertility in Homestead
Fertility by Age in Homestead
Average fertility rate in Homestead is 76.0 births per 1,000 women. Women in the age bracket of 20 to 34 years have the highest fertility rate with 138.0 births per 1,000 women. Women in the age bracket of 20 to 34 years acount for 72.7% of all women with births.
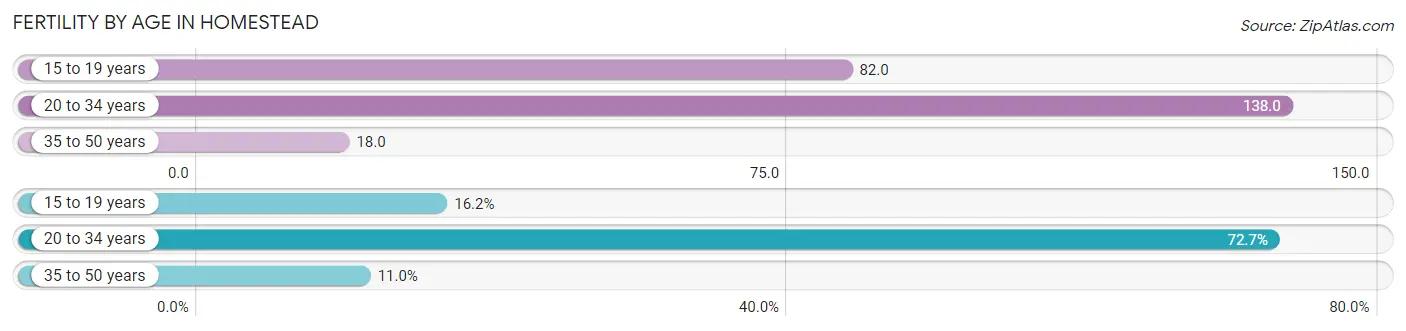
| Age Bracket | Women with Births | Births / 1,000 Women |
| 15 to 19 years | 253 (16.2%) | 82.0 |
| 20 to 34 years | 1,133 (72.7%) | 138.0 |
| 35 to 50 years | 172 (11.0%) | 18.0 |
| Total | 1,558 (100.0%) | 76.0 |
Fertility by Age by Marriage Status in Homestead
53.0% of women with births (1,558) in Homestead are married. The highest percentage of unmarried women with births falls into 15 to 19 years age bracket with 100.0% of them unmarried at the time of birth, while the lowest percentage of unmarried women with births belong to 20 to 34 years age bracket with 33.0% of them unmarried.
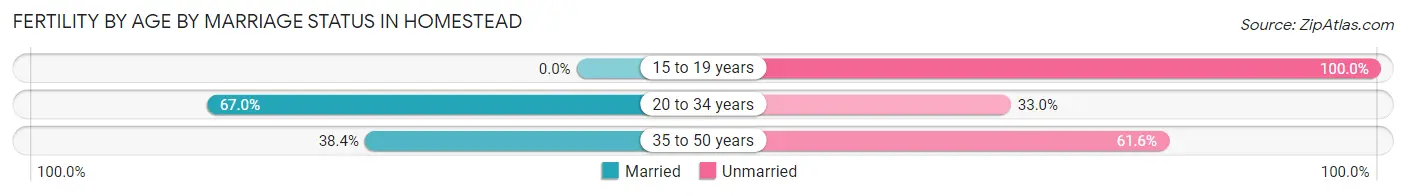
| Age Bracket | Married | Unmarried |
| 15 to 19 years | 0 (0.0%) | 253 (100.0%) |
| 20 to 34 years | 759 (67.0%) | 374 (33.0%) |
| 35 to 50 years | 66 (38.4%) | 106 (61.6%) |
| Total | 826 (53.0%) | 732 (47.0%) |
Fertility by Education in Homestead
Average fertility rate in Homestead is 76.0 births per 1,000 women. Women with the education attainment of less than high school have the highest fertility rate of 107.0 births per 1,000 women, while women with the education attainment of graduate degree have the lowest fertility at 26.0 births per 1,000 women. Women with the education attainment of less than high school represent 41.3% of all women with births.
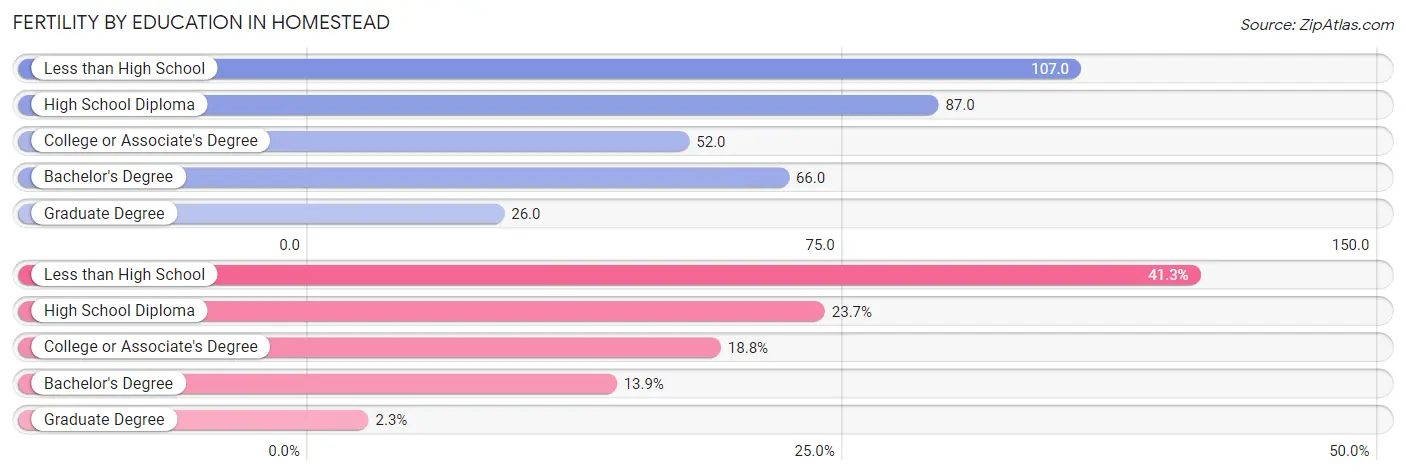
| Educational Attainment | Women with Births | Births / 1,000 Women |
| Less than High School | 643 (41.3%) | 107.0 |
| High School Diploma | 369 (23.7%) | 87.0 |
| College or Associate's Degree | 293 (18.8%) | 52.0 |
| Bachelor's Degree | 217 (13.9%) | 66.0 |
| Graduate Degree | 36 (2.3%) | 26.0 |
| Total | 1,558 (100.0%) | 76.0 |
Fertility by Education by Marriage Status in Homestead
47.0% of women with births in Homestead are unmarried. Women with the educational attainment of graduate degree are most likely to be married with 86.1% of them married at childbirth, while women with the educational attainment of bachelor's degree are least likely to be married with 59.5% of them unmarried at childbirth.
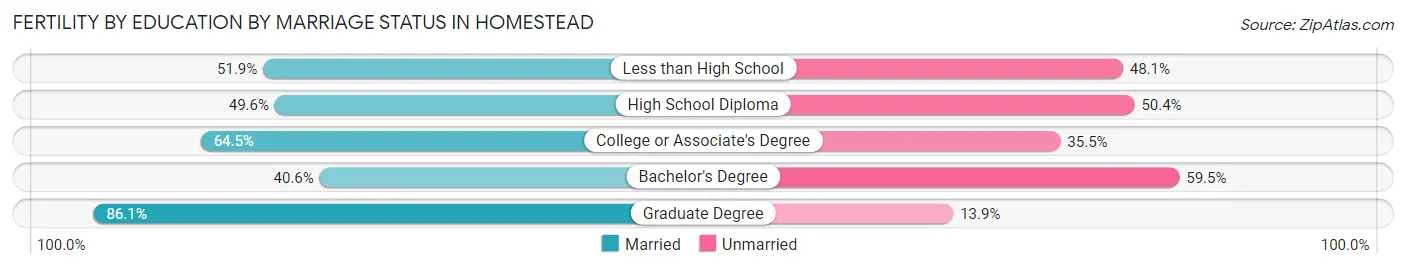
| Educational Attainment | Married | Unmarried |
| Less than High School | 334 (51.9%) | 309 (48.1%) |
| High School Diploma | 183 (49.6%) | 186 (50.4%) |
| College or Associate's Degree | 189 (64.5%) | 104 (35.5%) |
| Bachelor's Degree | 88 (40.6%) | 129 (59.5%) |
| Graduate Degree | 31 (86.1%) | 5 (13.9%) |
| Total | 826 (53.0%) | 732 (47.0%) |
Employment Characteristics in Homestead
Employment by Class of Employer in Homestead
Among the 34,723 employed individuals in Homestead, private company employees (23,830 | 68.6%), not-for-profit organizations (2,860 | 8.2%), and local government employees (2,059 | 5.9%) make up the most common classes of employment.
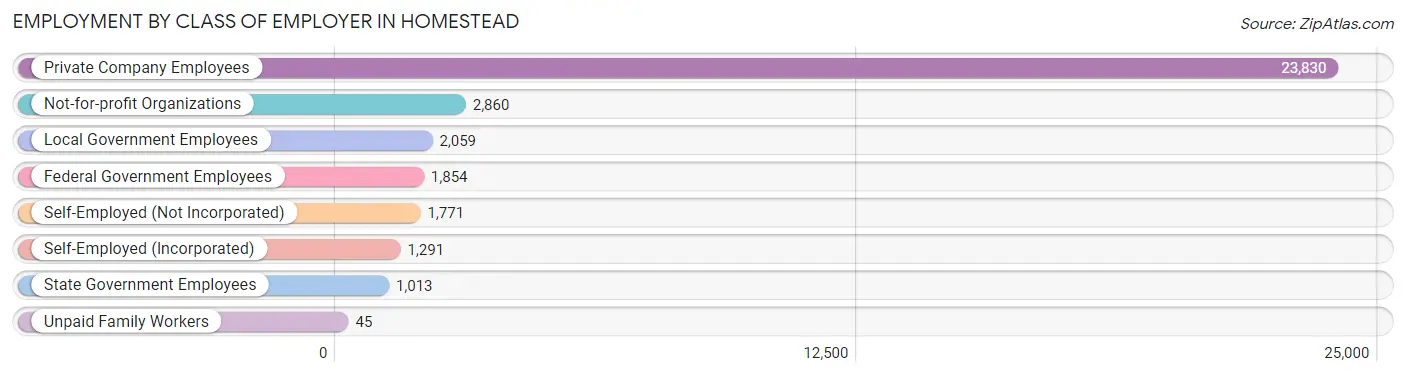
| Employer Class | # Employees | % Employees |
| Private Company Employees | 23,830 | 68.6% |
| Self-Employed (Incorporated) | 1,291 | 3.7% |
| Self-Employed (Not Incorporated) | 1,771 | 5.1% |
| Not-for-profit Organizations | 2,860 | 8.2% |
| Local Government Employees | 2,059 | 5.9% |
| State Government Employees | 1,013 | 2.9% |
| Federal Government Employees | 1,854 | 5.3% |
| Unpaid Family Workers | 45 | 0.1% |
| Total | 34,723 | 100.0% |
Employment Status by Age in Homestead
According to the labor force statistics for Homestead, out of the total population over 16 years of age (57,214), 65.2% or 37,304 individuals are in the labor force, with 4.8% or 1,791 of them unemployed. The age group with the highest labor force participation rate is 35 to 44 years, with 85.4% or 11,031 individuals in the labor force. Within the labor force, the 20 to 24 years age range has the highest percentage of unemployed individuals, with 10.0% or 298 of them being unemployed.
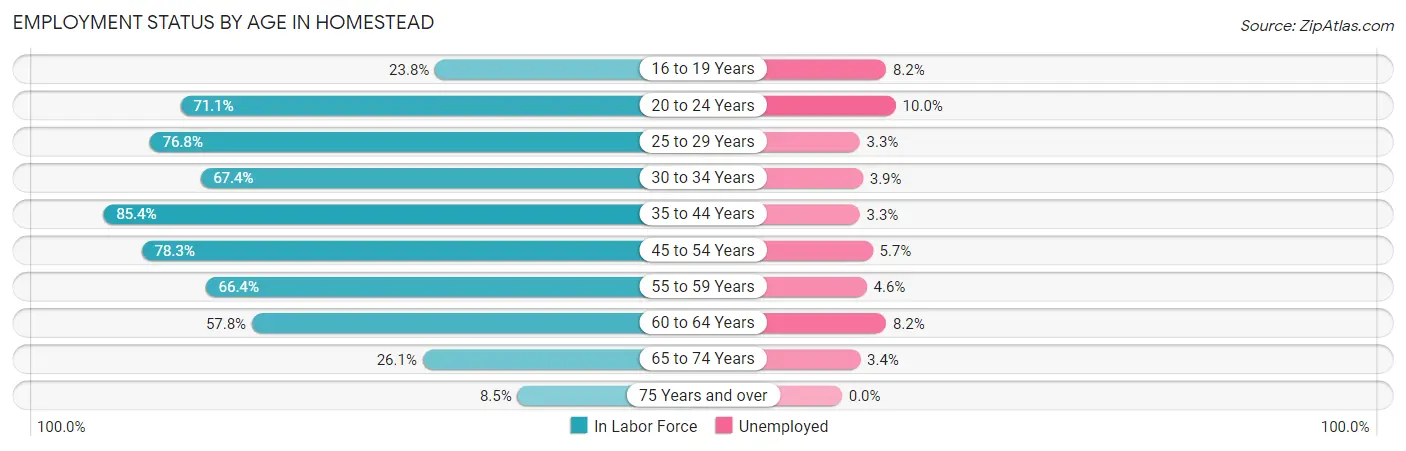
| Age Bracket | In Labor Force | Unemployed |
| 16 to 19 Years | 1,106 (23.8%) | 91 (8.2%) |
| 20 to 24 Years | 2,982 (71.1%) | 298 (10.0%) |
| 25 to 29 Years | 4,818 (76.8%) | 159 (3.3%) |
| 30 to 34 Years | 4,822 (67.4%) | 188 (3.9%) |
| 35 to 44 Years | 11,031 (85.4%) | 364 (3.3%) |
| 45 to 54 Years | 7,381 (78.3%) | 421 (5.7%) |
| 55 to 59 Years | 2,286 (66.4%) | 105 (4.6%) |
| 60 to 64 Years | 1,684 (57.8%) | 138 (8.2%) |
| 65 to 74 Years | 998 (26.1%) | 34 (3.4%) |
| 75 Years and over | 206 (8.5%) | 0 (0.0%) |
| Total | 37,304 (65.2%) | 1,791 (4.8%) |
Employment Status by Educational Attainment in Homestead
According to labor force statistics for Homestead, 76.0% of individuals (32,017) out of the total population between 25 and 64 years of age (42,127) are in the labor force, with 4.3% or 1,377 of them being unemployed. The group with the highest labor force participation rate are those with the educational attainment of bachelor's degree or higher, with 88.4% or 9,081 individuals in the labor force. Within the labor force, individuals with college / associate degree education have the highest percentage of unemployment, with 5.6% or 556 of them being unemployed.
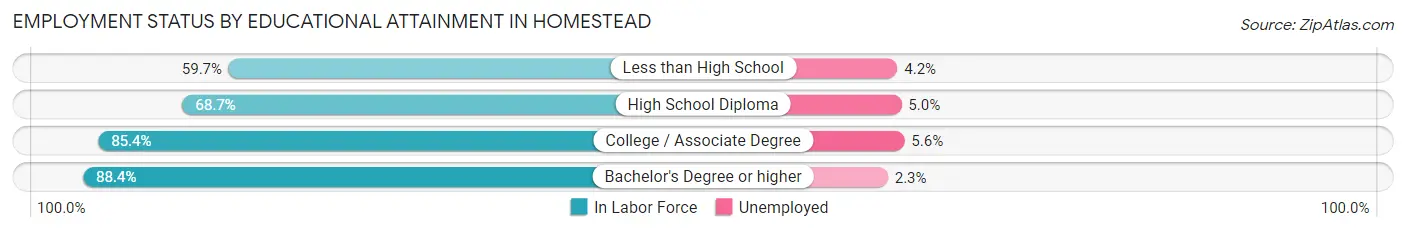
| Educational Attainment | In Labor Force | Unemployed |
| Less than High School | 5,865 (59.7%) | 413 (4.2%) |
| High School Diploma | 7,153 (68.7%) | 521 (5.0%) |
| College / Associate Degree | 9,922 (85.4%) | 651 (5.6%) |
| Bachelor's Degree or higher | 9,081 (88.4%) | 236 (2.3%) |
| Total | 32,017 (76.0%) | 1,811 (4.3%) |
Employment Occupations by Sex in Homestead
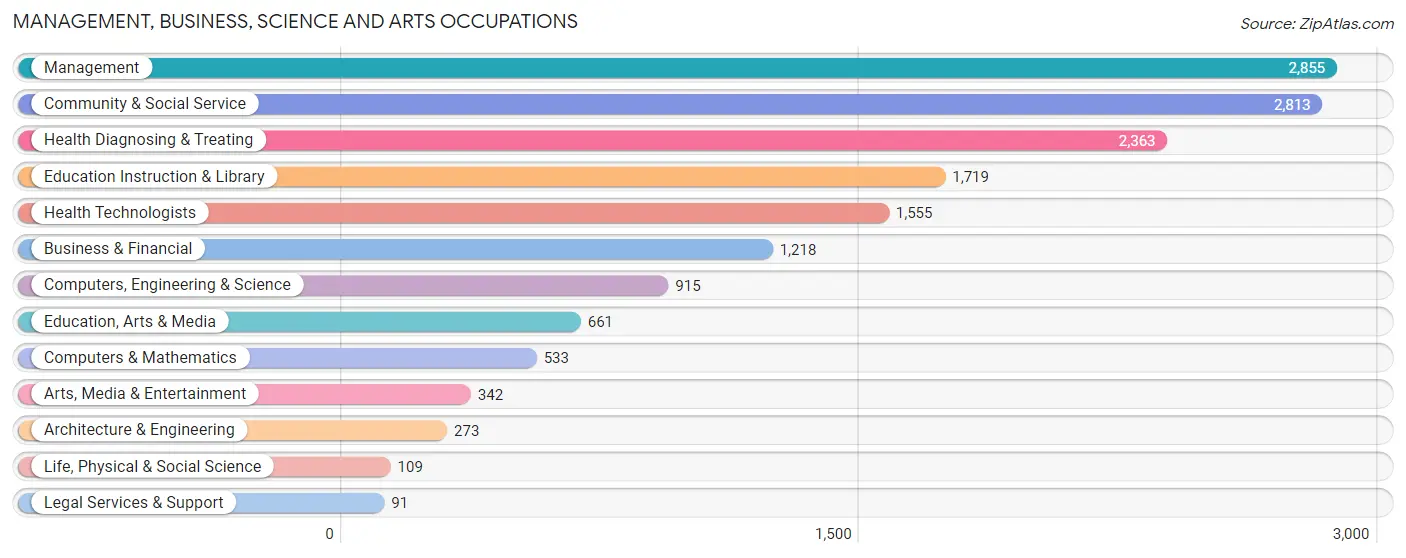
Management, Business, Science and Arts Occupations
The most common Management, Business, Science and Arts occupations in Homestead are Management (2,855 | 8.1%), Community & Social Service (2,813 | 8.0%), Health Diagnosing & Treating (2,363 | 6.7%), Education Instruction & Library (1,719 | 4.9%), and Health Technologists (1,555 | 4.4%).
Management, Business, Science and Arts Occupations by Sex
Within the Management, Business, Science and Arts occupations in Homestead, the most male-oriented occupations are Architecture & Engineering (98.9%), Computers & Mathematics (97.0%), and Computers, Engineering & Science (86.8%), while the most female-oriented occupations are Life, Physical & Social Science (93.6%), Education, Arts & Media (84.7%), and Legal Services & Support (83.5%).
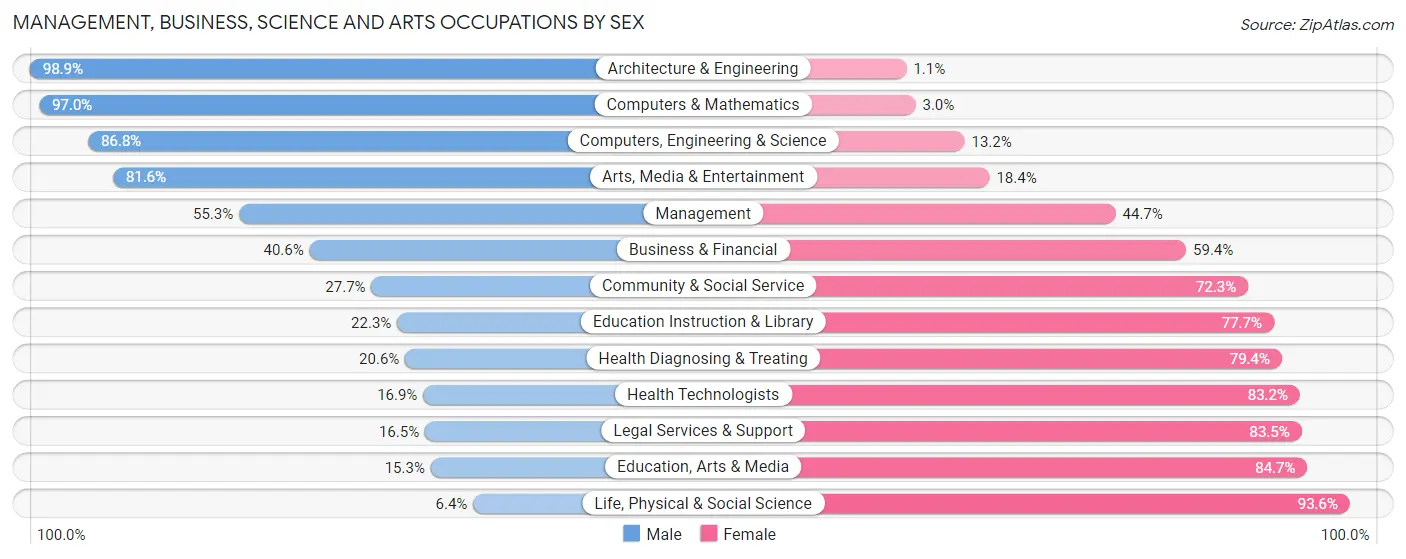
| Occupation | Male | Female |
| Management | 1,578 (55.3%) | 1,277 (44.7%) |
| Business & Financial | 494 (40.6%) | 724 (59.4%) |
| Computers, Engineering & Science | 794 (86.8%) | 121 (13.2%) |
| Computers & Mathematics | 517 (97.0%) | 16 (3.0%) |
| Architecture & Engineering | 270 (98.9%) | 3 (1.1%) |
| Life, Physical & Social Science | 7 (6.4%) | 102 (93.6%) |
| Community & Social Service | 778 (27.7%) | 2,035 (72.3%) |
| Education, Arts & Media | 101 (15.3%) | 560 (84.7%) |
| Legal Services & Support | 15 (16.5%) | 76 (83.5%) |
| Education Instruction & Library | 383 (22.3%) | 1,336 (77.7%) |
| Arts, Media & Entertainment | 279 (81.6%) | 63 (18.4%) |
| Health Diagnosing & Treating | 487 (20.6%) | 1,876 (79.4%) |
| Health Technologists | 262 (16.9%) | 1,293 (83.2%) |
| Total (Category) | 4,131 (40.6%) | 6,033 (59.4%) |
| Total (Overall) | 18,535 (52.8%) | 16,555 (47.2%) |
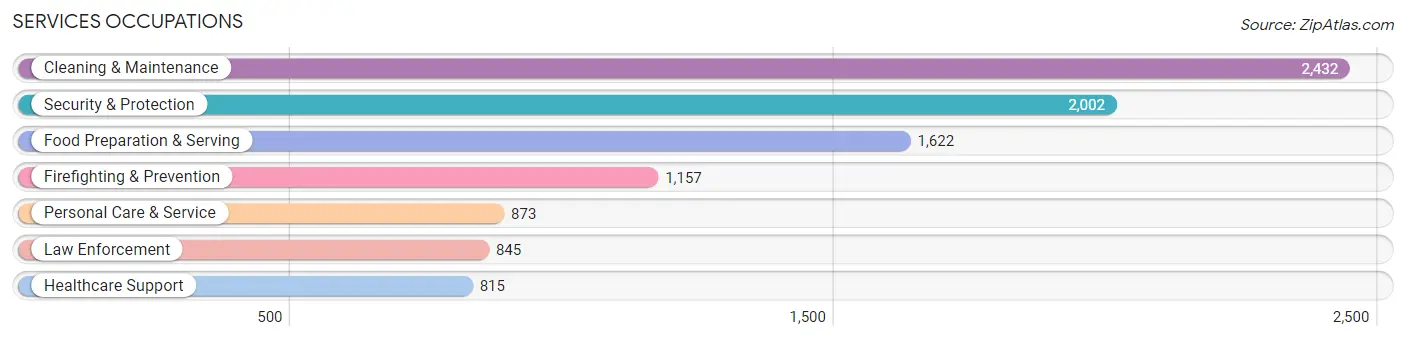
Services Occupations
The most common Services occupations in Homestead are Cleaning & Maintenance (2,432 | 6.9%), Security & Protection (2,002 | 5.7%), Food Preparation & Serving (1,622 | 4.6%), Firefighting & Prevention (1,157 | 3.3%), and Personal Care & Service (873 | 2.5%).
Services Occupations by Sex
Within the Services occupations in Homestead, the most male-oriented occupations are Law Enforcement (73.6%), Security & Protection (66.1%), and Cleaning & Maintenance (66.0%), while the most female-oriented occupations are Healthcare Support (88.7%), Personal Care & Service (77.2%), and Food Preparation & Serving (50.1%).
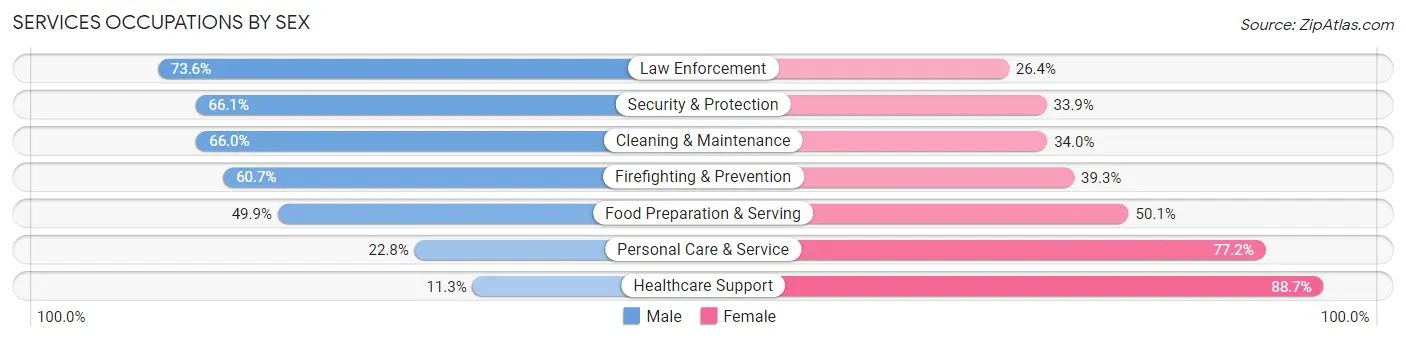
| Occupation | Male | Female |
| Healthcare Support | 92 (11.3%) | 723 (88.7%) |
| Security & Protection | 1,324 (66.1%) | 678 (33.9%) |
| Firefighting & Prevention | 702 (60.7%) | 455 (39.3%) |
| Law Enforcement | 622 (73.6%) | 223 (26.4%) |
| Food Preparation & Serving | 809 (49.9%) | 813 (50.1%) |
| Cleaning & Maintenance | 1,605 (66.0%) | 827 (34.0%) |
| Personal Care & Service | 199 (22.8%) | 674 (77.2%) |
| Total (Category) | 4,029 (52.0%) | 3,715 (48.0%) |
| Total (Overall) | 18,535 (52.8%) | 16,555 (47.2%) |
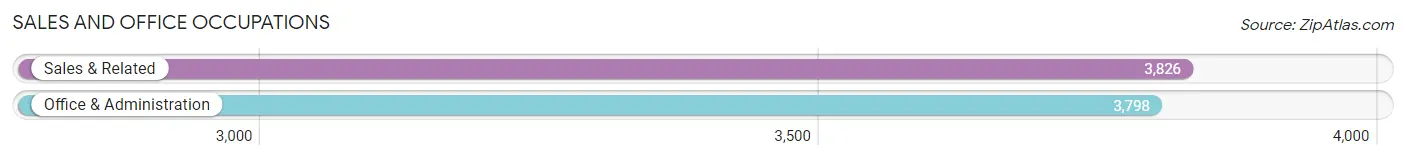
Sales and Office Occupations
The most common Sales and Office occupations in Homestead are Sales & Related (3,826 | 10.9%), and Office & Administration (3,798 | 10.8%).
Sales and Office Occupations by Sex
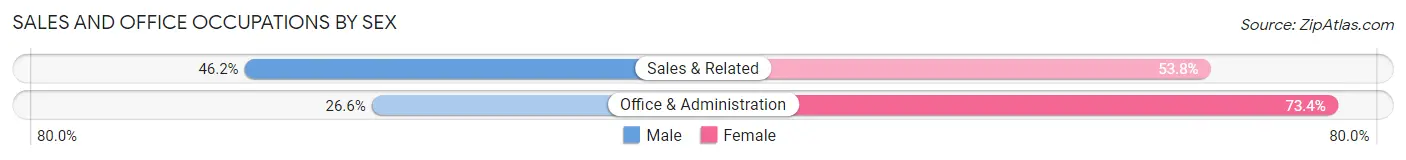
| Occupation | Male | Female |
| Sales & Related | 1,767 (46.2%) | 2,059 (53.8%) |
| Office & Administration | 1,011 (26.6%) | 2,787 (73.4%) |
| Total (Category) | 2,778 (36.4%) | 4,846 (63.6%) |
| Total (Overall) | 18,535 (52.8%) | 16,555 (47.2%) |
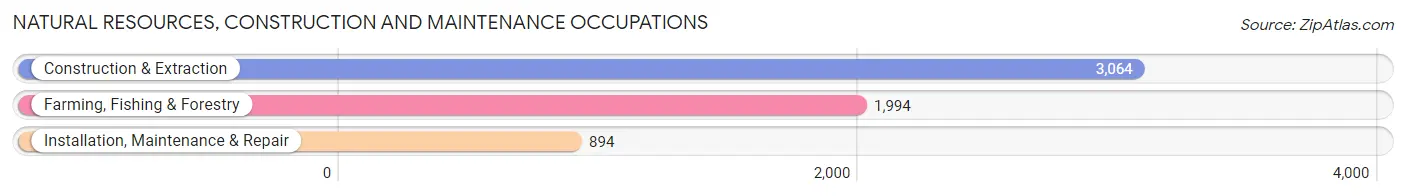
Natural Resources, Construction and Maintenance Occupations
The most common Natural Resources, Construction and Maintenance occupations in Homestead are Construction & Extraction (3,064 | 8.7%), Farming, Fishing & Forestry (1,994 | 5.7%), and Installation, Maintenance & Repair (894 | 2.5%).
Natural Resources, Construction and Maintenance Occupations by Sex
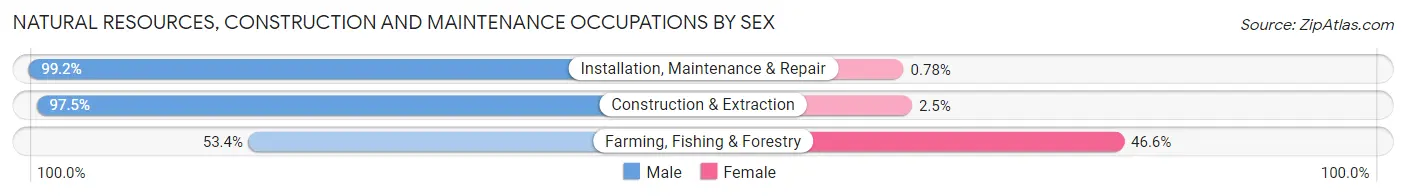
| Occupation | Male | Female |
| Farming, Fishing & Forestry | 1,064 (53.4%) | 930 (46.6%) |
| Construction & Extraction | 2,987 (97.5%) | 77 (2.5%) |
| Installation, Maintenance & Repair | 887 (99.2%) | 7 (0.8%) |
| Total (Category) | 4,938 (83.0%) | 1,014 (17.0%) |
| Total (Overall) | 18,535 (52.8%) | 16,555 (47.2%) |
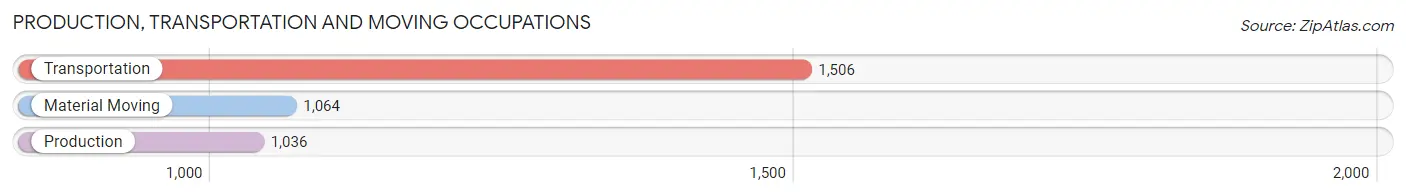
Production, Transportation and Moving Occupations
The most common Production, Transportation and Moving occupations in Homestead are Transportation (1,506 | 4.3%), Material Moving (1,064 | 3.0%), and Production (1,036 | 2.9%).
Production, Transportation and Moving Occupations by Sex
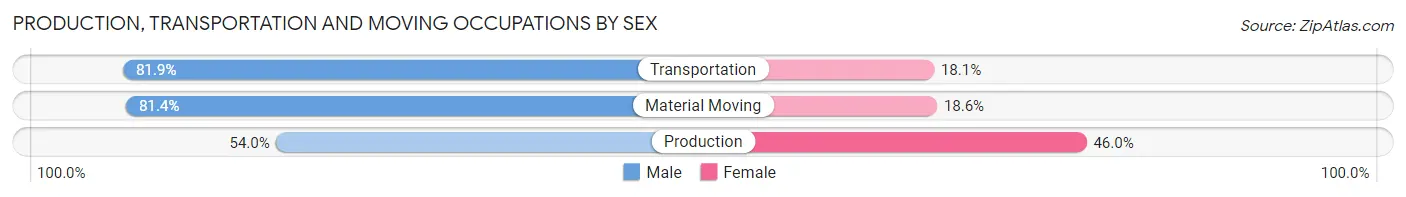
| Occupation | Male | Female |
| Production | 559 (54.0%) | 477 (46.0%) |
| Transportation | 1,234 (81.9%) | 272 (18.1%) |
| Material Moving | 866 (81.4%) | 198 (18.6%) |
| Total (Category) | 2,659 (73.7%) | 947 (26.3%) |
| Total (Overall) | 18,535 (52.8%) | 16,555 (47.2%) |
Employment Industries by Sex in Homestead
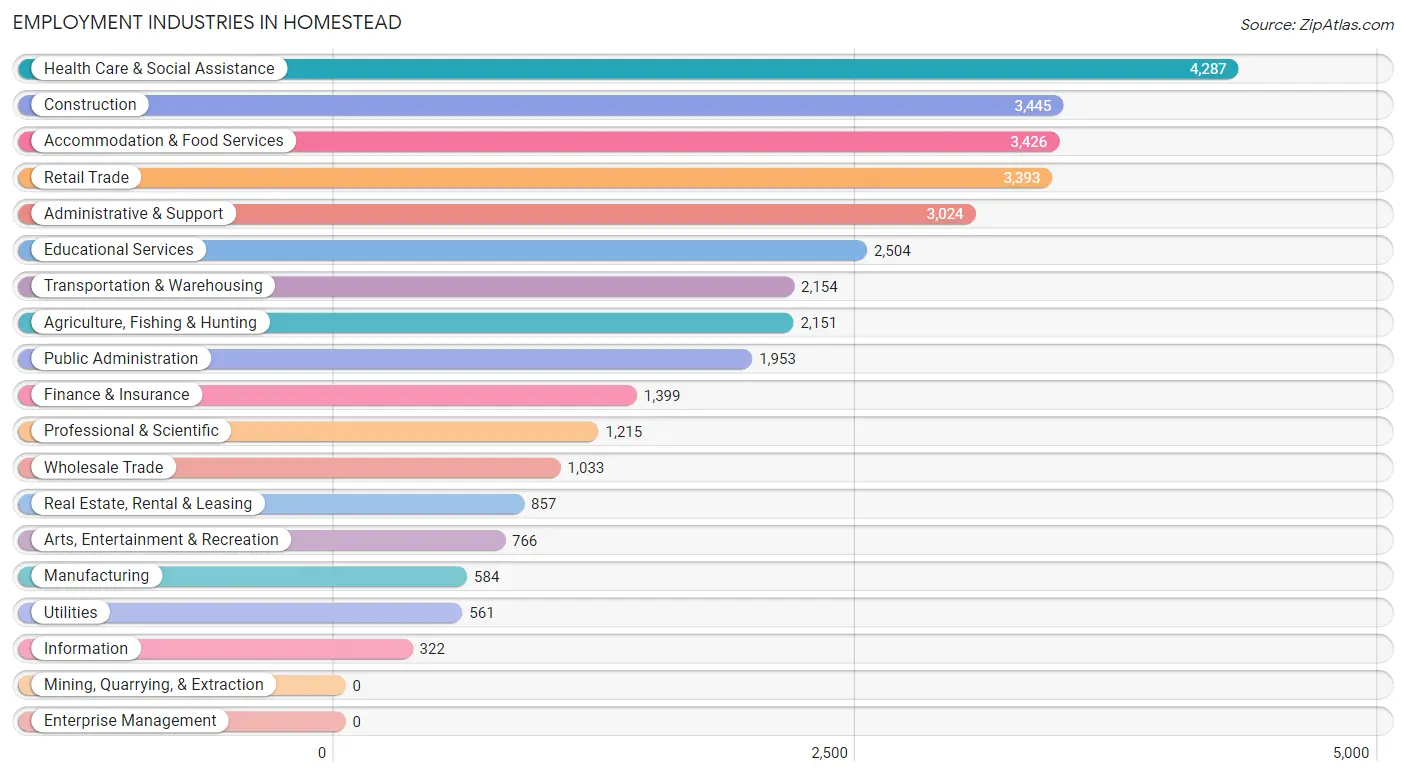
Employment Industries in Homestead
The major employment industries in Homestead include Health Care & Social Assistance (4,287 | 12.2%), Construction (3,445 | 9.8%), Accommodation & Food Services (3,426 | 9.8%), Retail Trade (3,393 | 9.7%), and Administrative & Support (3,024 | 8.6%).
Employment Industries by Sex in Homestead
The Homestead industries that see more men than women are Construction (93.9%), Utilities (73.8%), and Administrative & Support (71.4%), whereas the industries that tend to have a higher number of women are Educational Services (78.3%), Health Care & Social Assistance (77.4%), and Professional & Scientific (62.4%).
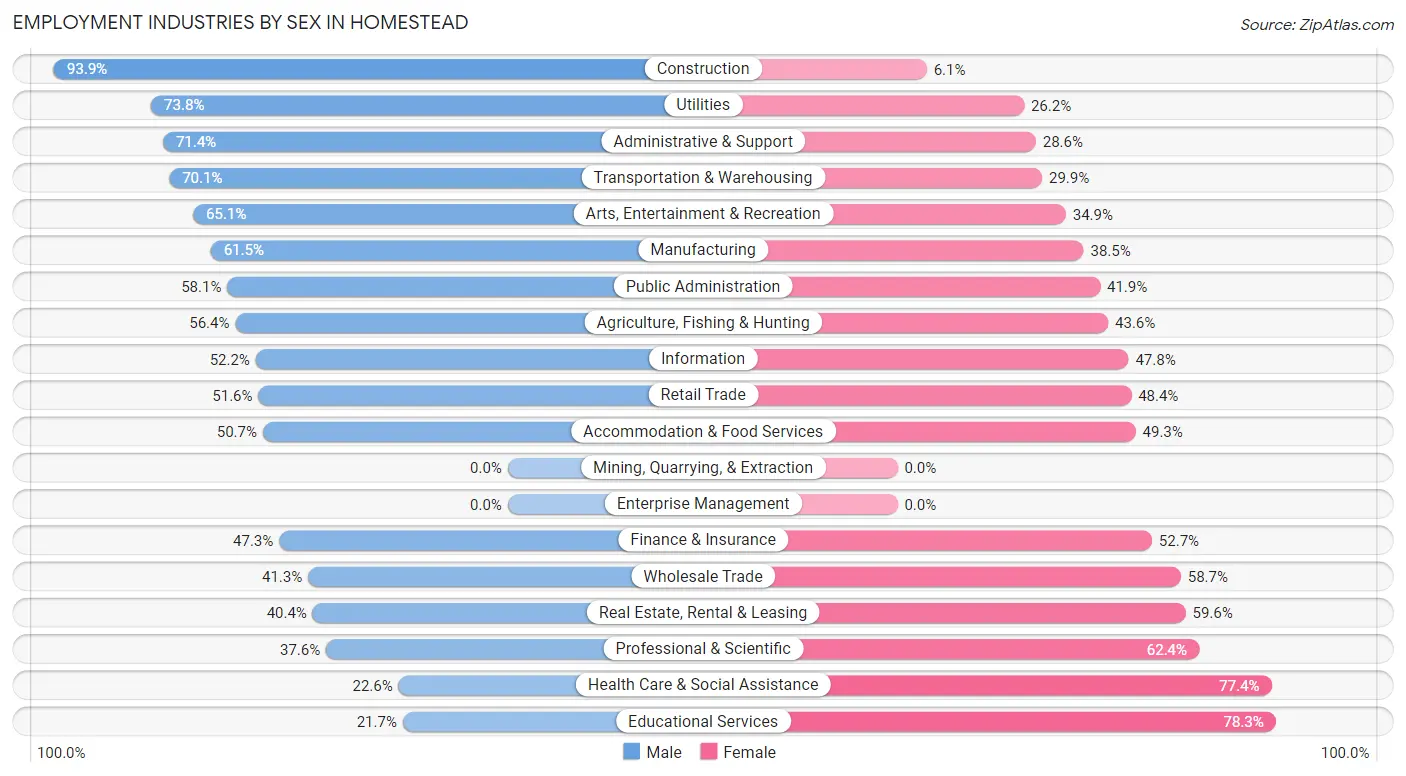
| Industry | Male | Female |
| Agriculture, Fishing & Hunting | 1,213 (56.4%) | 938 (43.6%) |
| Mining, Quarrying, & Extraction | 0 (0.0%) | 0 (0.0%) |
| Construction | 3,236 (93.9%) | 209 (6.1%) |
| Manufacturing | 359 (61.5%) | 225 (38.5%) |
| Wholesale Trade | 427 (41.3%) | 606 (58.7%) |
| Retail Trade | 1,751 (51.6%) | 1,642 (48.4%) |
| Transportation & Warehousing | 1,509 (70.1%) | 645 (29.9%) |
| Utilities | 414 (73.8%) | 147 (26.2%) |
| Information | 168 (52.2%) | 154 (47.8%) |
| Finance & Insurance | 662 (47.3%) | 737 (52.7%) |
| Real Estate, Rental & Leasing | 346 (40.4%) | 511 (59.6%) |
| Professional & Scientific | 457 (37.6%) | 758 (62.4%) |
| Enterprise Management | 0 (0.0%) | 0 (0.0%) |
| Administrative & Support | 2,158 (71.4%) | 866 (28.6%) |
| Educational Services | 544 (21.7%) | 1,960 (78.3%) |
| Health Care & Social Assistance | 969 (22.6%) | 3,318 (77.4%) |
| Arts, Entertainment & Recreation | 499 (65.1%) | 267 (34.9%) |
| Accommodation & Food Services | 1,737 (50.7%) | 1,689 (49.3%) |
| Public Administration | 1,134 (58.1%) | 819 (41.9%) |
| Total | 18,535 (52.8%) | 16,555 (47.2%) |
Education in Homestead
School Enrollment in Homestead
The most common levels of schooling among the 23,790 students in Homestead are middle school (5,423 | 22.8%), high school (5,392 | 22.7%), and elementary school (5,373 | 22.6%).
| School Level | # Students | % Students |
| Nursery / Preschool | 1,975 | 8.3% |
| Kindergarten | 1,408 | 5.9% |
| Elementary School | 5,373 | 22.6% |
| Middle School | 5,423 | 22.8% |
| High School | 5,392 | 22.7% |
| College / Undergraduate | 3,433 | 14.4% |
| Graduate / Professional | 786 | 3.3% |
| Total | 23,790 | 100.0% |
School Enrollment by Age by Funding Source in Homestead
Out of a total of 23,790 students who are enrolled in schools in Homestead, 2,783 (11.7%) attend a private institution, while the remaining 21,007 (88.3%) are enrolled in public schools. The age group of 35 years and over has the highest likelihood of being enrolled in private schools, with 354 (30.0% in the age bracket) enrolled. Conversely, the age group of 18 to 19 year olds has the lowest likelihood of being enrolled in a private school, with 1,637 (97.8% in the age bracket) attending a public institution.
| Age Bracket | Public School | Private School |
| 3 to 4 Year Olds | 1,696 (87.6%) | 241 (12.4%) |
| 5 to 9 Year Old | 5,265 (86.1%) | 847 (13.9%) |
| 10 to 14 Year Olds | 6,406 (91.2%) | 618 (8.8%) |
| 15 to 17 Year Olds | 3,133 (90.1%) | 343 (9.9%) |
| 18 to 19 Year Olds | 1,637 (97.8%) | 37 (2.2%) |
| 20 to 24 Year Olds | 1,168 (92.8%) | 91 (7.2%) |
| 25 to 34 Year Olds | 883 (78.2%) | 246 (21.8%) |
| 35 Years and over | 825 (70.0%) | 354 (30.0%) |
| Total | 21,007 (88.3%) | 2,783 (11.7%) |
Educational Attainment by Field of Study in Homestead
Business (3,031 | 25.4%), science & technology (1,854 | 15.5%), education (1,580 | 13.2%), psychology (773 | 6.5%), and arts & humanities (754 | 6.3%) are the most common fields of study among 11,943 individuals in Homestead who have obtained a bachelor's degree or higher.
| Field of Study | # Graduates | % Graduates |
| Computers & Mathematics | 556 | 4.7% |
| Bio, Nature & Agricultural | 577 | 4.8% |
| Physical & Health Sciences | 216 | 1.8% |
| Psychology | 773 | 6.5% |
| Social Sciences | 655 | 5.5% |
| Engineering | 431 | 3.6% |
| Multidisciplinary Studies | 94 | 0.8% |
| Science & Technology | 1,854 | 15.5% |
| Business | 3,031 | 25.4% |
| Education | 1,580 | 13.2% |
| Literature & Languages | 45 | 0.4% |
| Liberal Arts & History | 658 | 5.5% |
| Visual & Performing Arts | 373 | 3.1% |
| Communications | 346 | 2.9% |
| Arts & Humanities | 754 | 6.3% |
| Total | 11,943 | 100.0% |
Transportation & Commute in Homestead
Vehicle Availability by Sex in Homestead
The most prevalent vehicle ownership categories in Homestead are males with 2 vehicles (9,159, accounting for 49.8%) and females with 2 vehicles (7,973, making up 56.1%).
| Vehicles Available | Male | Female |
| No Vehicle | 1,105 (6.0%) | 529 (3.2%) |
| 1 Vehicle | 4,440 (24.1%) | 3,766 (23.1%) |
| 2 Vehicles | 9,159 (49.8%) | 7,973 (48.9%) |
| 3 Vehicles | 2,507 (13.6%) | 3,049 (18.7%) |
| 4 Vehicles | 946 (5.1%) | 869 (5.3%) |
| 5 or more Vehicles | 237 (1.3%) | 131 (0.8%) |
| Total | 18,394 (100.0%) | 16,317 (100.0%) |
Commute Time in Homestead
The most frequently occuring commute durations in Homestead are 60 to 89 minutes (5,100 commuters, 15.4%), 30 to 34 minutes (4,573 commuters, 13.8%), and 20 to 24 minutes (3,881 commuters, 11.7%).
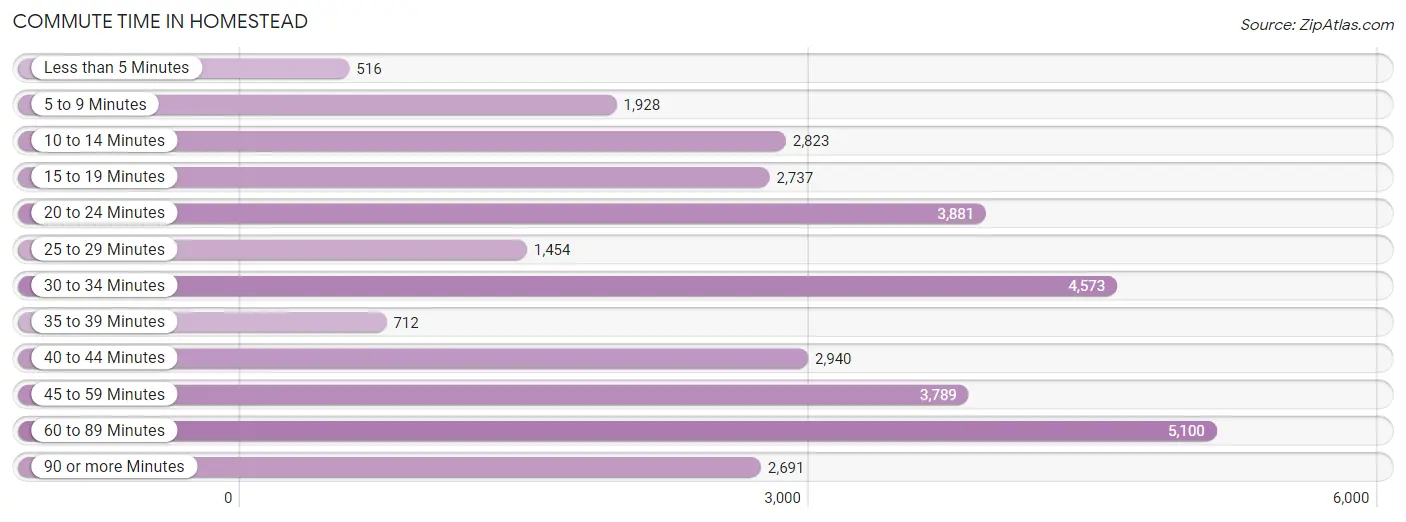
| Commute Time | # Commuters | % Commuters |
| Less than 5 Minutes | 516 | 1.6% |
| 5 to 9 Minutes | 1,928 | 5.8% |
| 10 to 14 Minutes | 2,823 | 8.5% |
| 15 to 19 Minutes | 2,737 | 8.3% |
| 20 to 24 Minutes | 3,881 | 11.7% |
| 25 to 29 Minutes | 1,454 | 4.4% |
| 30 to 34 Minutes | 4,573 | 13.8% |
| 35 to 39 Minutes | 712 | 2.1% |
| 40 to 44 Minutes | 2,940 | 8.9% |
| 45 to 59 Minutes | 3,789 | 11.4% |
| 60 to 89 Minutes | 5,100 | 15.4% |
| 90 or more Minutes | 2,691 | 8.1% |
Commute Time by Sex in Homestead
The most common commute times in Homestead are 60 to 89 minutes (3,194 commuters, 17.9%) for males and 20 to 24 minutes (2,020 commuters, 13.2%) for females.
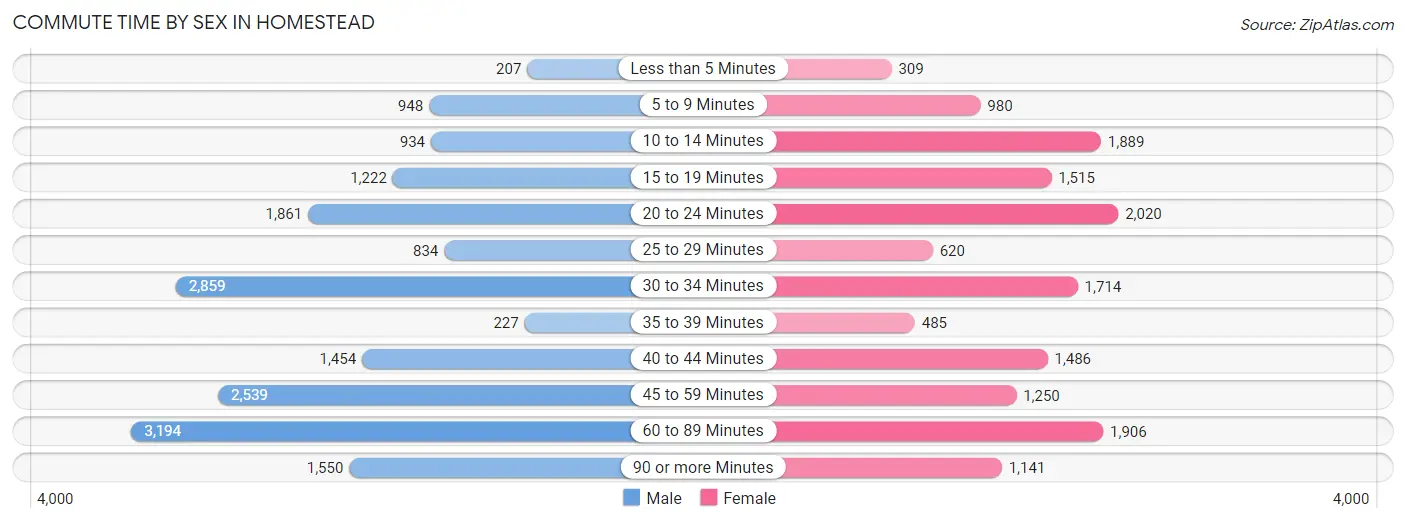
| Commute Time | Male | Female |
| Less than 5 Minutes | 207 (1.2%) | 309 (2.0%) |
| 5 to 9 Minutes | 948 (5.3%) | 980 (6.4%) |
| 10 to 14 Minutes | 934 (5.2%) | 1,889 (12.3%) |
| 15 to 19 Minutes | 1,222 (6.9%) | 1,515 (9.9%) |
| 20 to 24 Minutes | 1,861 (10.4%) | 2,020 (13.2%) |
| 25 to 29 Minutes | 834 (4.7%) | 620 (4.1%) |
| 30 to 34 Minutes | 2,859 (16.0%) | 1,714 (11.2%) |
| 35 to 39 Minutes | 227 (1.3%) | 485 (3.2%) |
| 40 to 44 Minutes | 1,454 (8.2%) | 1,486 (9.7%) |
| 45 to 59 Minutes | 2,539 (14.2%) | 1,250 (8.2%) |
| 60 to 89 Minutes | 3,194 (17.9%) | 1,906 (12.4%) |
| 90 or more Minutes | 1,550 (8.7%) | 1,141 (7.4%) |
Time of Departure to Work by Sex in Homestead
The most frequent times of departure to work in Homestead are 6:00 AM to 6:29 AM (2,663, 14.9%) for males and 7:00 AM to 7:29 AM (1,994, 13.0%) for females.
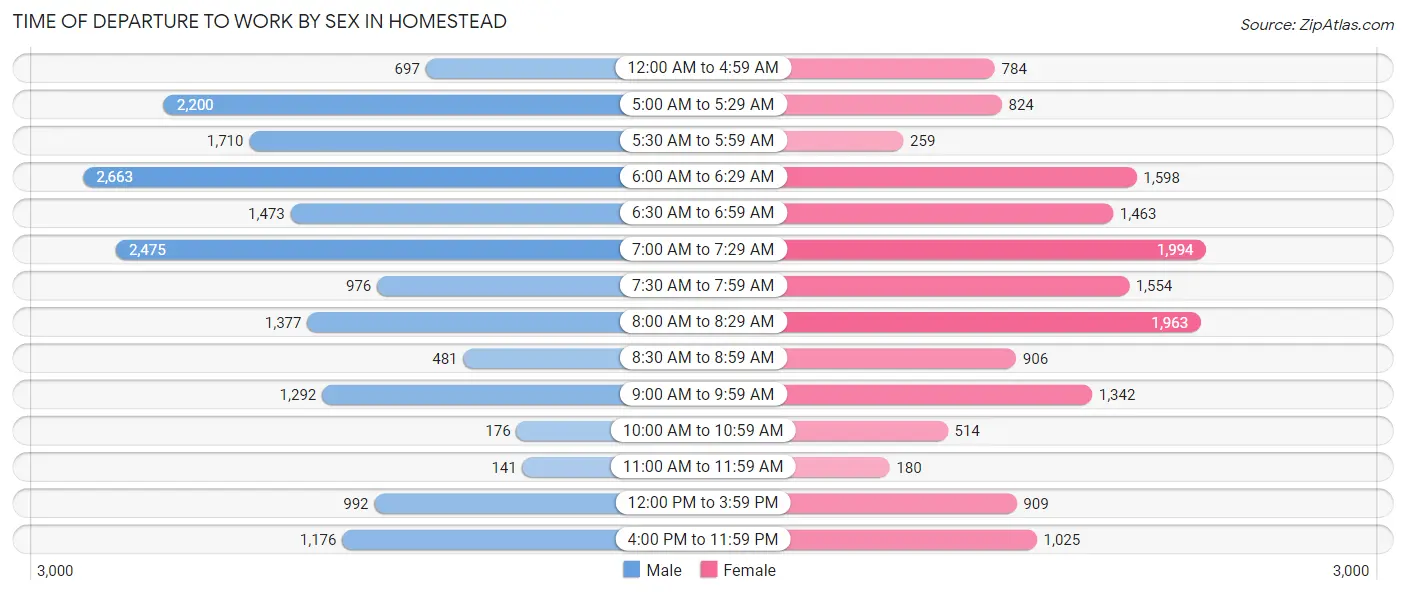
| Time of Departure | Male | Female |
| 12:00 AM to 4:59 AM | 697 (3.9%) | 784 (5.1%) |
| 5:00 AM to 5:29 AM | 2,200 (12.3%) | 824 (5.4%) |
| 5:30 AM to 5:59 AM | 1,710 (9.6%) | 259 (1.7%) |
| 6:00 AM to 6:29 AM | 2,663 (14.9%) | 1,598 (10.4%) |
| 6:30 AM to 6:59 AM | 1,473 (8.3%) | 1,463 (9.6%) |
| 7:00 AM to 7:29 AM | 2,475 (13.9%) | 1,994 (13.0%) |
| 7:30 AM to 7:59 AM | 976 (5.5%) | 1,554 (10.2%) |
| 8:00 AM to 8:29 AM | 1,377 (7.7%) | 1,963 (12.8%) |
| 8:30 AM to 8:59 AM | 481 (2.7%) | 906 (5.9%) |
| 9:00 AM to 9:59 AM | 1,292 (7.2%) | 1,342 (8.8%) |
| 10:00 AM to 10:59 AM | 176 (1.0%) | 514 (3.4%) |
| 11:00 AM to 11:59 AM | 141 (0.8%) | 180 (1.2%) |
| 12:00 PM to 3:59 PM | 992 (5.6%) | 909 (5.9%) |
| 4:00 PM to 11:59 PM | 1,176 (6.6%) | 1,025 (6.7%) |
| Total | 17,829 (100.0%) | 15,315 (100.0%) |
Housing Occupancy in Homestead
Occupancy by Ownership in Homestead
Of the total 24,626 dwellings in Homestead, owner-occupied units account for 11,046 (44.9%), while renter-occupied units make up 13,580 (55.1%).
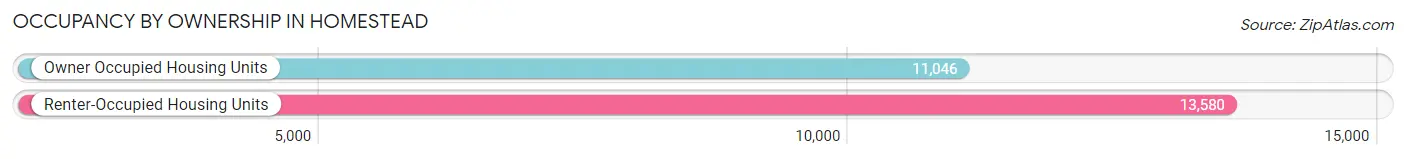
| Occupancy | # Housing Units | % Housing Units |
| Owner Occupied Housing Units | 11,046 | 44.9% |
| Renter-Occupied Housing Units | 13,580 | 55.1% |
| Total Occupied Housing Units | 24,626 | 100.0% |
Occupancy by Household Size in Homestead
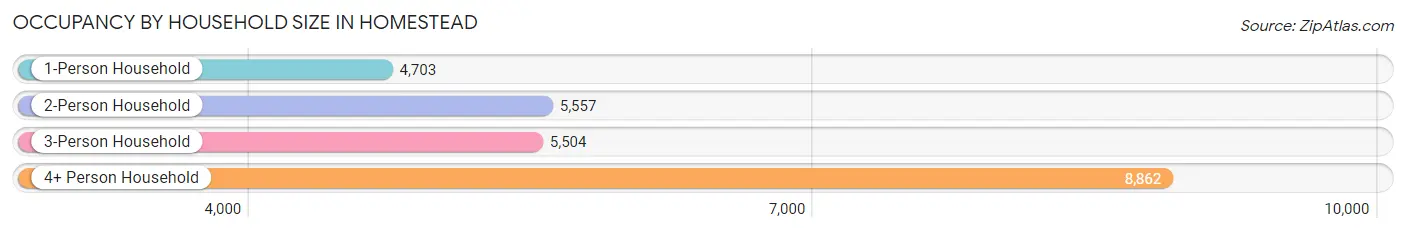
| Household Size | # Housing Units | % Housing Units |
| 1-Person Household | 4,703 | 19.1% |
| 2-Person Household | 5,557 | 22.6% |
| 3-Person Household | 5,504 | 22.4% |
| 4+ Person Household | 8,862 | 36.0% |
| Total Housing Units | 24,626 | 100.0% |
Occupancy by Ownership by Household Size in Homestead
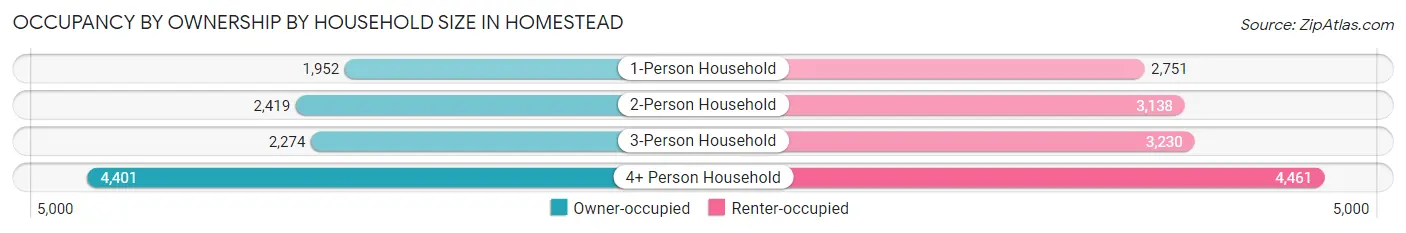
| Household Size | Owner-occupied | Renter-occupied |
| 1-Person Household | 1,952 (41.5%) | 2,751 (58.5%) |
| 2-Person Household | 2,419 (43.5%) | 3,138 (56.5%) |
| 3-Person Household | 2,274 (41.3%) | 3,230 (58.7%) |
| 4+ Person Household | 4,401 (49.7%) | 4,461 (50.3%) |
| Total Housing Units | 11,046 (44.9%) | 13,580 (55.1%) |
Occupancy by Educational Attainment in Homestead
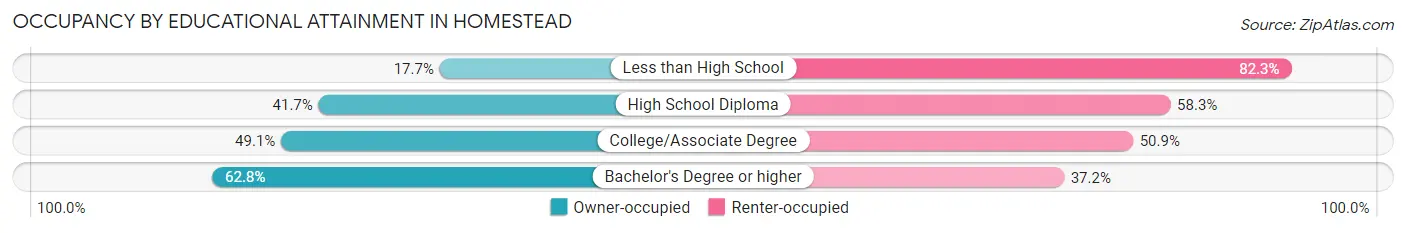
| Household Size | Owner-occupied | Renter-occupied |
| Less than High School | 925 (17.7%) | 4,304 (82.3%) |
| High School Diploma | 2,205 (41.7%) | 3,081 (58.3%) |
| College/Associate Degree | 3,400 (49.1%) | 3,521 (50.9%) |
| Bachelor's Degree or higher | 4,516 (62.8%) | 2,674 (37.2%) |
Occupancy by Age of Householder in Homestead
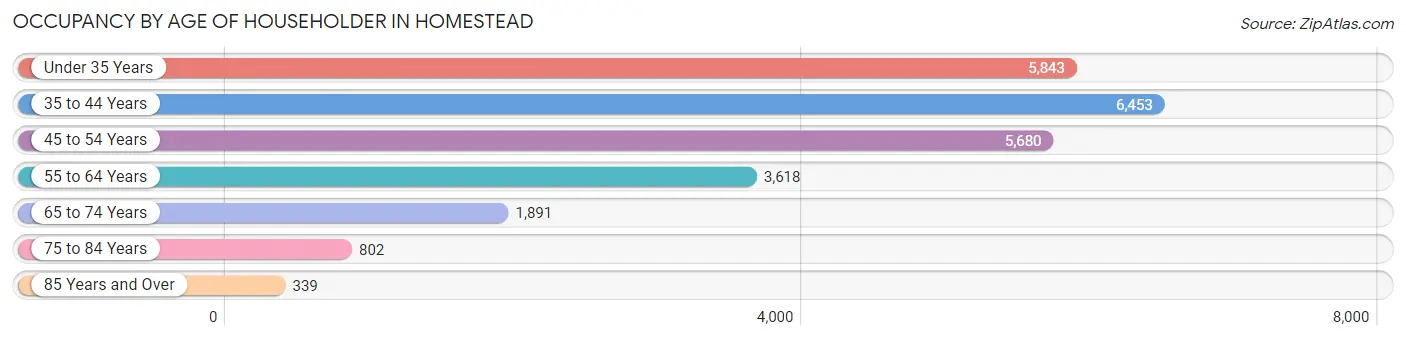
| Age Bracket | # Households | % Households |
| Under 35 Years | 5,843 | 23.7% |
| 35 to 44 Years | 6,453 | 26.2% |
| 45 to 54 Years | 5,680 | 23.1% |
| 55 to 64 Years | 3,618 | 14.7% |
| 65 to 74 Years | 1,891 | 7.7% |
| 75 to 84 Years | 802 | 3.3% |
| 85 Years and Over | 339 | 1.4% |
| Total | 24,626 | 100.0% |
Housing Finances in Homestead
Median Income by Occupancy in Homestead
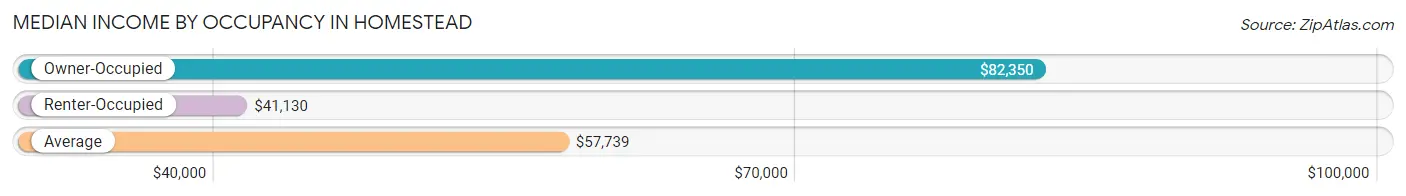
| Occupancy Type | # Households | Median Income |
| Owner-Occupied | 11,046 (44.9%) | $82,350 |
| Renter-Occupied | 13,580 (55.1%) | $41,130 |
| Average | 24,626 (100.0%) | $57,739 |
Occupancy by Householder Income Bracket in Homestead
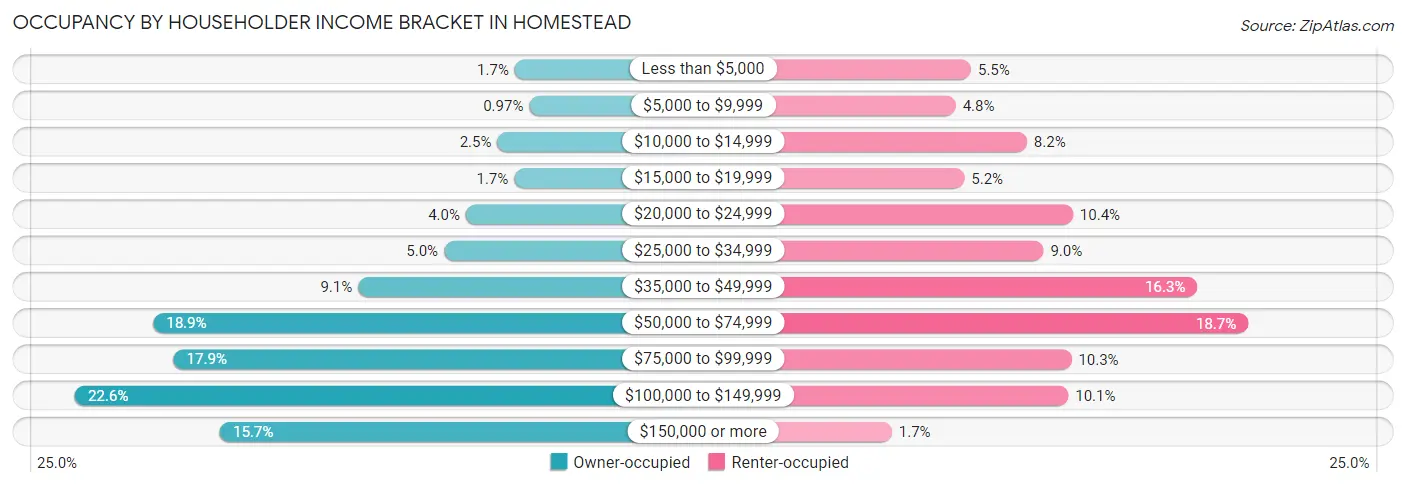
| Income Bracket | Owner-occupied | Renter-occupied |
| Less than $5,000 | 183 (1.7%) | 747 (5.5%) |
| $5,000 to $9,999 | 107 (1.0%) | 648 (4.8%) |
| $10,000 to $14,999 | 275 (2.5%) | 1,108 (8.2%) |
| $15,000 to $19,999 | 187 (1.7%) | 703 (5.2%) |
| $20,000 to $24,999 | 441 (4.0%) | 1,406 (10.3%) |
| $25,000 to $34,999 | 556 (5.0%) | 1,215 (8.9%) |
| $35,000 to $49,999 | 1,007 (9.1%) | 2,209 (16.3%) |
| $50,000 to $74,999 | 2,084 (18.9%) | 2,538 (18.7%) |
| $75,000 to $99,999 | 1,977 (17.9%) | 1,396 (10.3%) |
| $100,000 to $149,999 | 2,496 (22.6%) | 1,375 (10.1%) |
| $150,000 or more | 1,733 (15.7%) | 235 (1.7%) |
| Total | 11,046 (100.0%) | 13,580 (100.0%) |
Monthly Housing Cost Tiers in Homestead
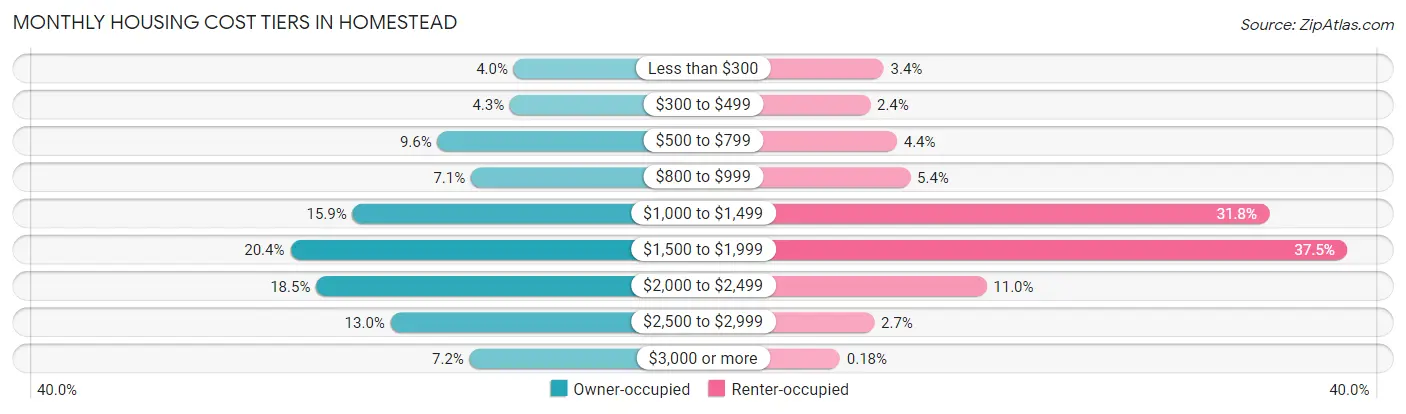
| Monthly Cost | Owner-occupied | Renter-occupied |
| Less than $300 | 439 (4.0%) | 462 (3.4%) |
| $300 to $499 | 470 (4.3%) | 326 (2.4%) |
| $500 to $799 | 1,059 (9.6%) | 593 (4.4%) |
| $800 to $999 | 787 (7.1%) | 726 (5.3%) |
| $1,000 to $1,499 | 1,751 (15.9%) | 4,315 (31.8%) |
| $1,500 to $1,999 | 2,257 (20.4%) | 5,093 (37.5%) |
| $2,000 to $2,499 | 2,046 (18.5%) | 1,490 (11.0%) |
| $2,500 to $2,999 | 1,440 (13.0%) | 366 (2.7%) |
| $3,000 or more | 797 (7.2%) | 25 (0.2%) |
| Total | 11,046 (100.0%) | 13,580 (100.0%) |
Physical Housing Characteristics in Homestead
Housing Structures in Homestead
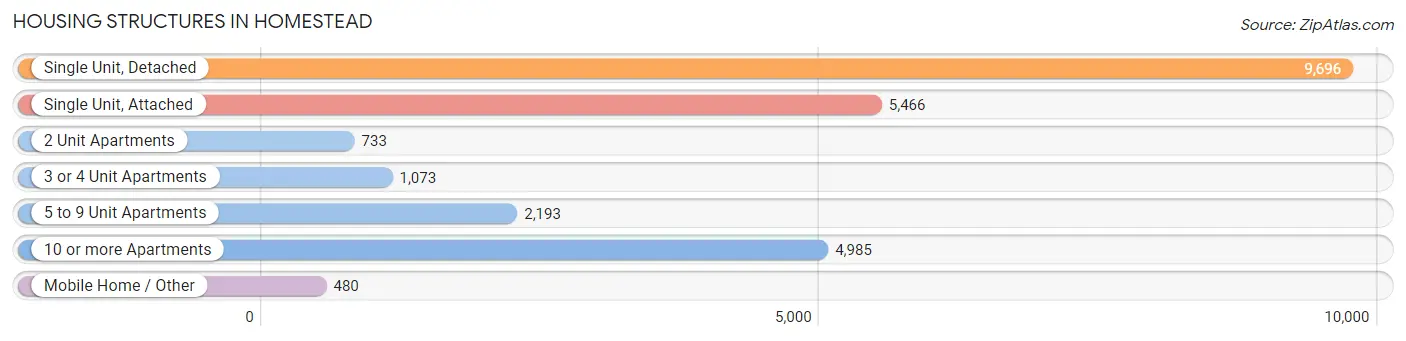
| Structure Type | # Housing Units | % Housing Units |
| Single Unit, Detached | 9,696 | 39.4% |
| Single Unit, Attached | 5,466 | 22.2% |
| 2 Unit Apartments | 733 | 3.0% |
| 3 or 4 Unit Apartments | 1,073 | 4.4% |
| 5 to 9 Unit Apartments | 2,193 | 8.9% |
| 10 or more Apartments | 4,985 | 20.2% |
| Mobile Home / Other | 480 | 1.9% |
| Total | 24,626 | 100.0% |
Housing Structures by Occupancy in Homestead
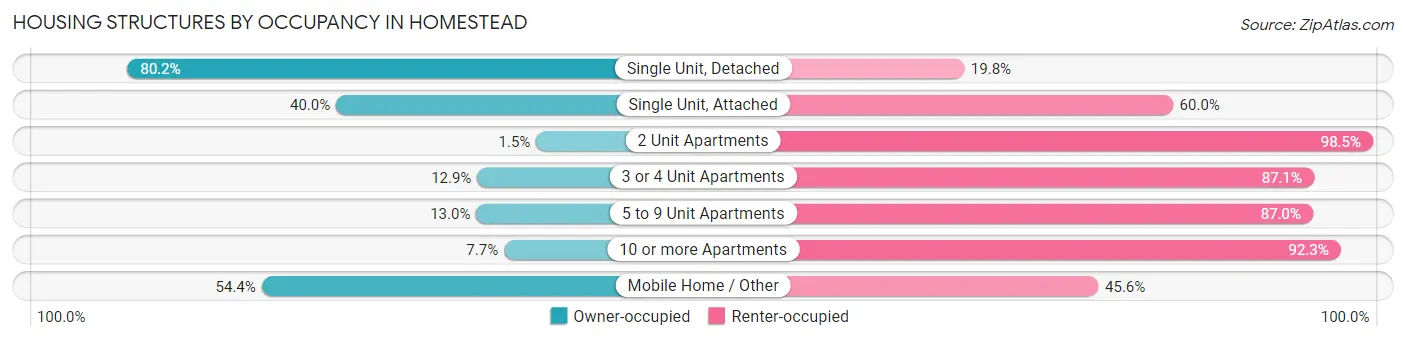
| Structure Type | Owner-occupied | Renter-occupied |
| Single Unit, Detached | 7,778 (80.2%) | 1,918 (19.8%) |
| Single Unit, Attached | 2,188 (40.0%) | 3,278 (60.0%) |
| 2 Unit Apartments | 11 (1.5%) | 722 (98.5%) |
| 3 or 4 Unit Apartments | 138 (12.9%) | 935 (87.1%) |
| 5 to 9 Unit Apartments | 286 (13.0%) | 1,907 (87.0%) |
| 10 or more Apartments | 384 (7.7%) | 4,601 (92.3%) |
| Mobile Home / Other | 261 (54.4%) | 219 (45.6%) |
| Total | 11,046 (44.9%) | 13,580 (55.1%) |
Housing Structures by Number of Rooms in Homestead
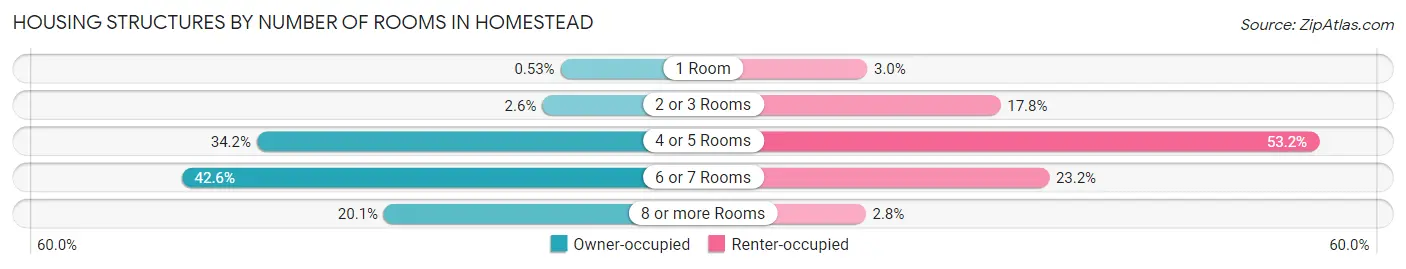
| Number of Rooms | Owner-occupied | Renter-occupied |
| 1 Room | 59 (0.5%) | 409 (3.0%) |
| 2 or 3 Rooms | 282 (2.5%) | 2,417 (17.8%) |
| 4 or 5 Rooms | 3,781 (34.2%) | 7,219 (53.2%) |
| 6 or 7 Rooms | 4,702 (42.6%) | 3,150 (23.2%) |
| 8 or more Rooms | 2,222 (20.1%) | 385 (2.8%) |
| Total | 11,046 (100.0%) | 13,580 (100.0%) |
Housing Structure by Heating Type in Homestead
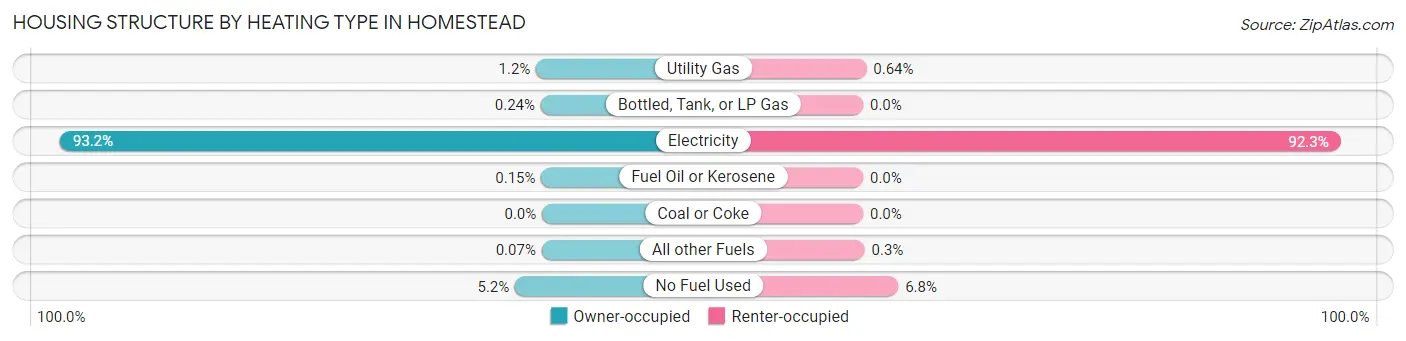
| Heating Type | Owner-occupied | Renter-occupied |
| Utility Gas | 127 (1.1%) | 87 (0.6%) |
| Bottled, Tank, or LP Gas | 26 (0.2%) | 0 (0.0%) |
| Electricity | 10,293 (93.2%) | 12,529 (92.3%) |
| Fuel Oil or Kerosene | 17 (0.2%) | 0 (0.0%) |
| Coal or Coke | 0 (0.0%) | 0 (0.0%) |
| All other Fuels | 8 (0.1%) | 41 (0.3%) |
| No Fuel Used | 575 (5.2%) | 923 (6.8%) |
| Total | 11,046 (100.0%) | 13,580 (100.0%) |
Household Vehicle Usage in Homestead
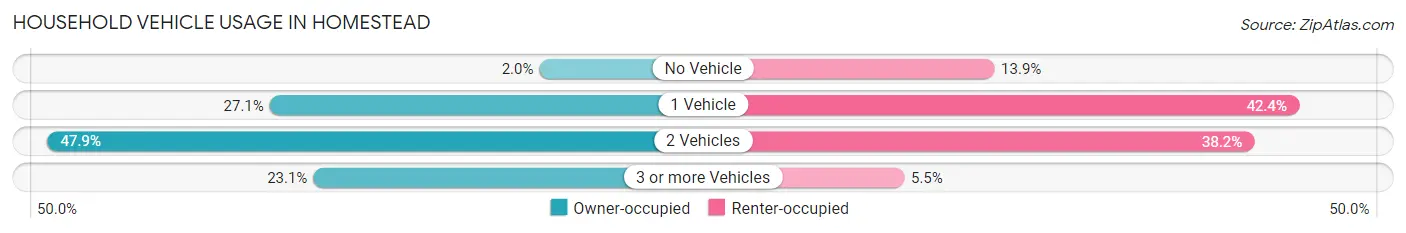
| Vehicles per Household | Owner-occupied | Renter-occupied |
| No Vehicle | 215 (1.9%) | 1,892 (13.9%) |
| 1 Vehicle | 2,997 (27.1%) | 5,753 (42.4%) |
| 2 Vehicles | 5,287 (47.9%) | 5,186 (38.2%) |
| 3 or more Vehicles | 2,547 (23.1%) | 749 (5.5%) |
| Total | 11,046 (100.0%) | 13,580 (100.0%) |
Real Estate & Mortgages in Homestead
Real Estate and Mortgage Overview in Homestead
| Characteristic | Without Mortgage | With Mortgage |
| Housing Units | 3,050 | 7,996 |
| Median Property Value | $304,100 | $320,200 |
| Median Household Income | $67,115 | $1,366 |
| Monthly Housing Costs | $729 | $791 |
| Real Estate Taxes | $2,832 | $330 |
Property Value by Mortgage Status in Homestead
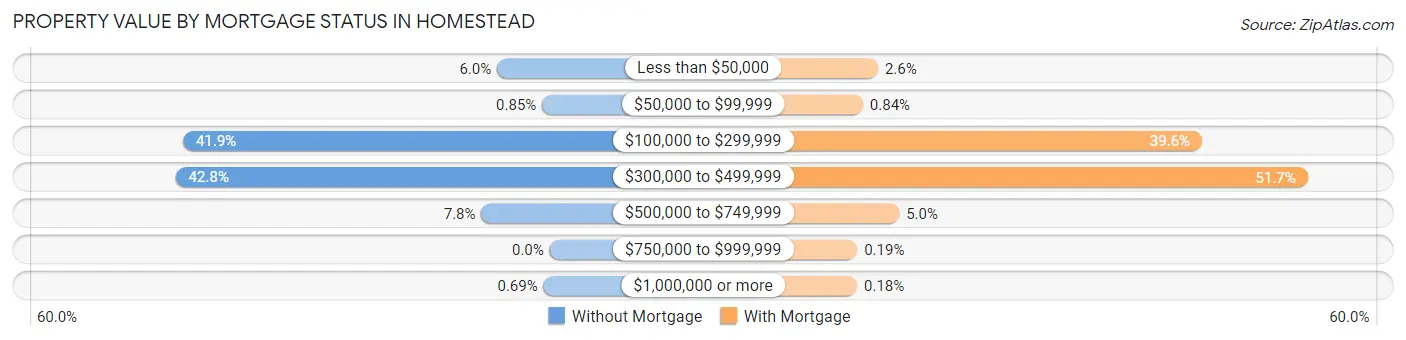
| Property Value | Without Mortgage | With Mortgage |
| Less than $50,000 | 183 (6.0%) | 205 (2.6%) |
| $50,000 to $99,999 | 26 (0.9%) | 67 (0.8%) |
| $100,000 to $299,999 | 1,278 (41.9%) | 3,165 (39.6%) |
| $300,000 to $499,999 | 1,304 (42.7%) | 4,131 (51.7%) |
| $500,000 to $749,999 | 238 (7.8%) | 399 (5.0%) |
| $750,000 to $999,999 | 0 (0.0%) | 15 (0.2%) |
| $1,000,000 or more | 21 (0.7%) | 14 (0.2%) |
| Total | 3,050 (100.0%) | 7,996 (100.0%) |
Household Income by Mortgage Status in Homestead
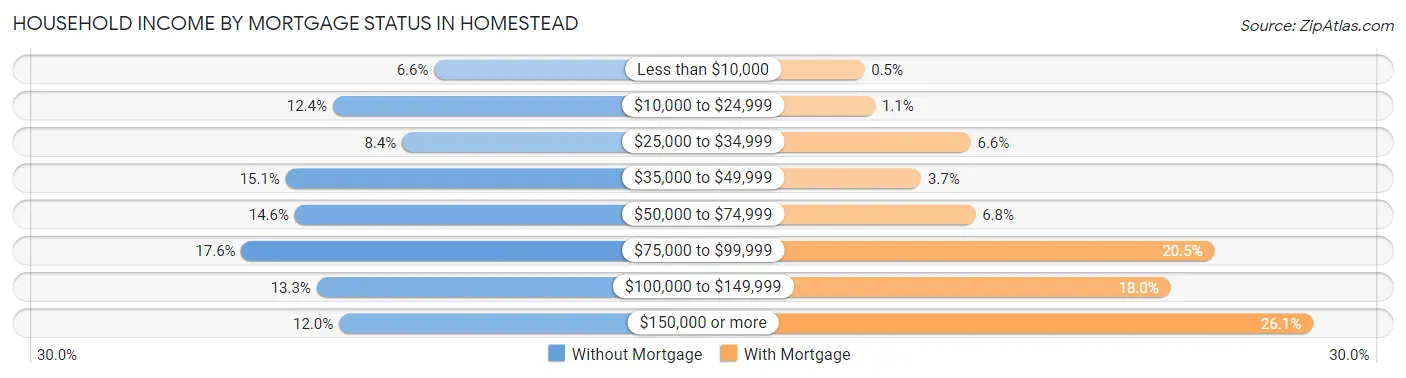
| Household Income | Without Mortgage | With Mortgage |
| Less than $10,000 | 201 (6.6%) | 40 (0.5%) |
| $10,000 to $24,999 | 378 (12.4%) | 89 (1.1%) |
| $25,000 to $34,999 | 257 (8.4%) | 525 (6.6%) |
| $35,000 to $49,999 | 460 (15.1%) | 299 (3.7%) |
| $50,000 to $74,999 | 444 (14.6%) | 547 (6.8%) |
| $75,000 to $99,999 | 537 (17.6%) | 1,640 (20.5%) |
| $100,000 to $149,999 | 406 (13.3%) | 1,440 (18.0%) |
| $150,000 or more | 367 (12.0%) | 2,090 (26.1%) |
| Total | 3,050 (100.0%) | 7,996 (100.0%) |
Property Value to Household Income Ratio in Homestead
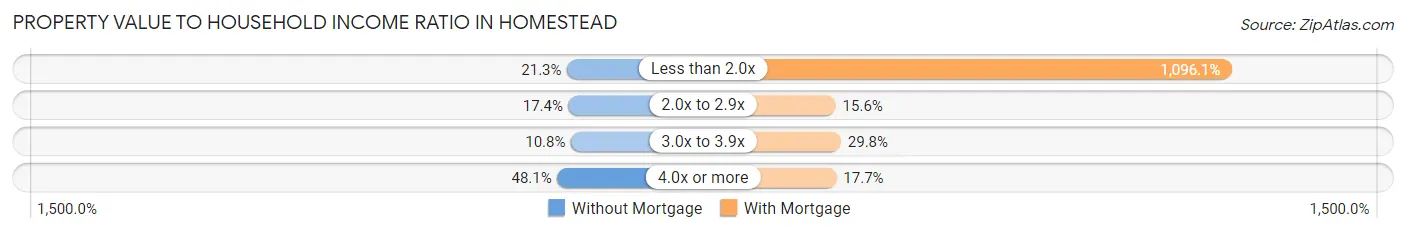
| Value-to-Income Ratio | Without Mortgage | With Mortgage |
| Less than 2.0x | 651 (21.3%) | 87,645 (1,096.1%) |
| 2.0x to 2.9x | 531 (17.4%) | 1,247 (15.6%) |
| 3.0x to 3.9x | 328 (10.7%) | 2,379 (29.7%) |
| 4.0x or more | 1,466 (48.1%) | 1,414 (17.7%) |
| Total | 3,050 (100.0%) | 7,996 (100.0%) |
Real Estate Taxes by Mortgage Status in Homestead
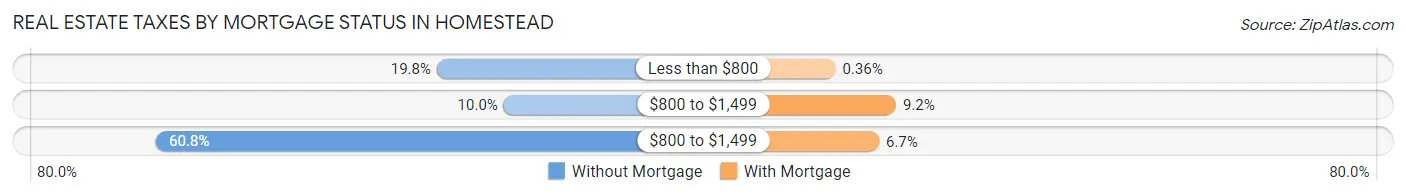
| Property Taxes | Without Mortgage | With Mortgage |
| Less than $800 | 603 (19.8%) | 29 (0.4%) |
| $800 to $1,499 | 305 (10.0%) | 736 (9.2%) |
| $800 to $1,499 | 1,854 (60.8%) | 537 (6.7%) |
| Total | 3,050 (100.0%) | 7,996 (100.0%) |
Health & Disability in Homestead
Health Insurance Coverage by Age in Homestead
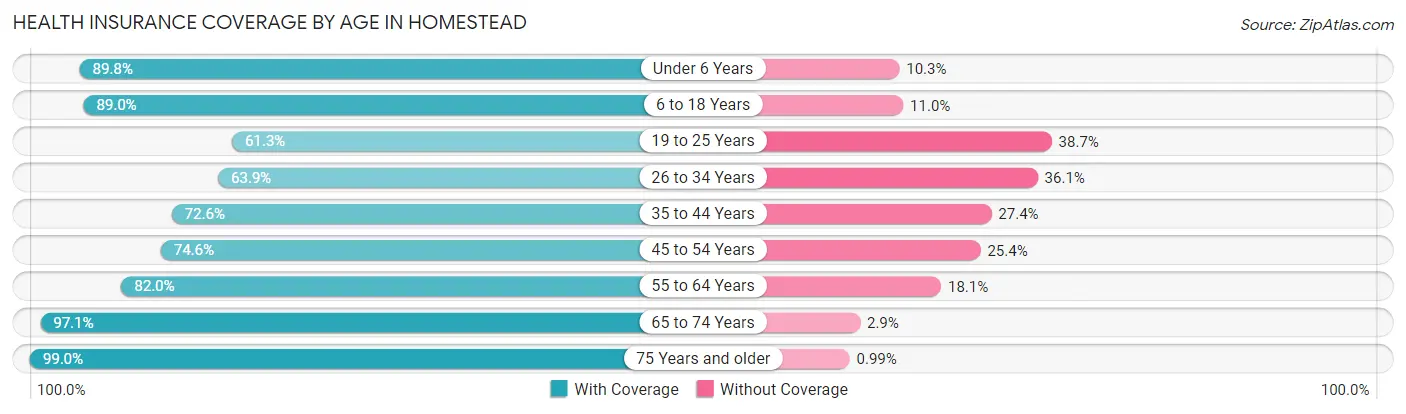
| Age Bracket | With Coverage | Without Coverage |
| Under 6 Years | 7,928 (89.7%) | 905 (10.2%) |
| 6 to 18 Years | 15,580 (89.0%) | 1,921 (11.0%) |
| 19 to 25 Years | 3,708 (61.3%) | 2,338 (38.7%) |
| 26 to 34 Years | 7,941 (63.9%) | 4,478 (36.1%) |
| 35 to 44 Years | 9,250 (72.6%) | 3,497 (27.4%) |
| 45 to 54 Years | 6,999 (74.6%) | 2,383 (25.4%) |
| 55 to 64 Years | 5,167 (82.0%) | 1,138 (18.0%) |
| 65 to 74 Years | 3,677 (97.1%) | 111 (2.9%) |
| 75 Years and older | 2,208 (99.0%) | 22 (1.0%) |
| Total | 62,458 (78.8%) | 16,793 (21.2%) |
Health Insurance Coverage by Citizenship Status in Homestead
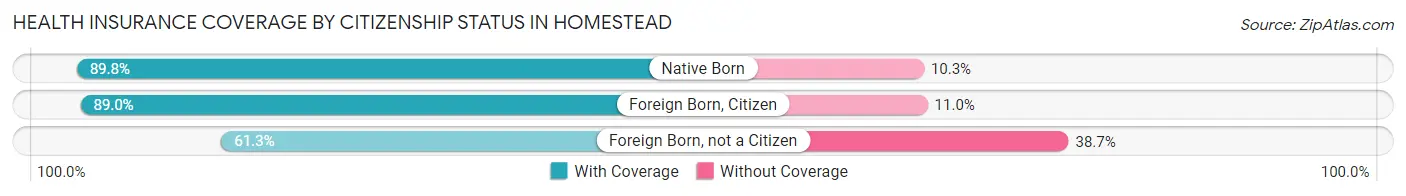
| Citizenship Status | With Coverage | Without Coverage |
| Native Born | 7,928 (89.7%) | 905 (10.2%) |
| Foreign Born, Citizen | 15,580 (89.0%) | 1,921 (11.0%) |
| Foreign Born, not a Citizen | 3,708 (61.3%) | 2,338 (38.7%) |
Health Insurance Coverage by Household Income in Homestead
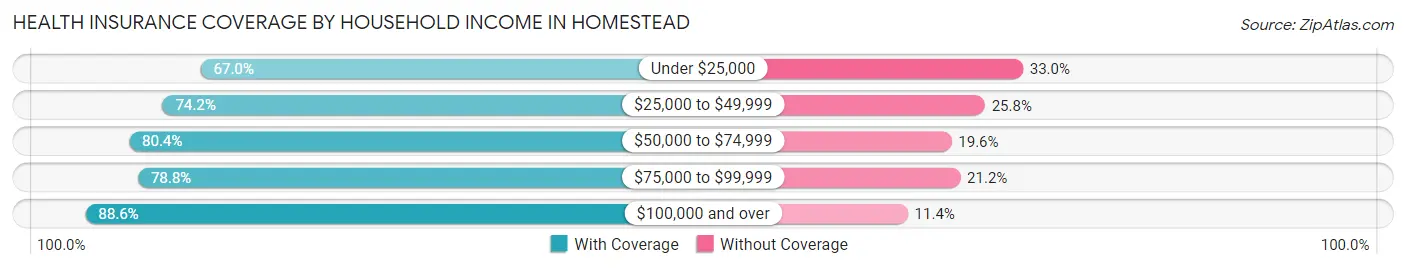
| Household Income | With Coverage | Without Coverage |
| Under $25,000 | 10,034 (67.0%) | 4,938 (33.0%) |
| $25,000 to $49,999 | 10,977 (74.2%) | 3,825 (25.8%) |
| $50,000 to $74,999 | 11,839 (80.4%) | 2,884 (19.6%) |
| $75,000 to $99,999 | 9,306 (78.8%) | 2,510 (21.2%) |
| $100,000 and over | 20,048 (88.6%) | 2,579 (11.4%) |
Public vs Private Health Insurance Coverage by Age in Homestead
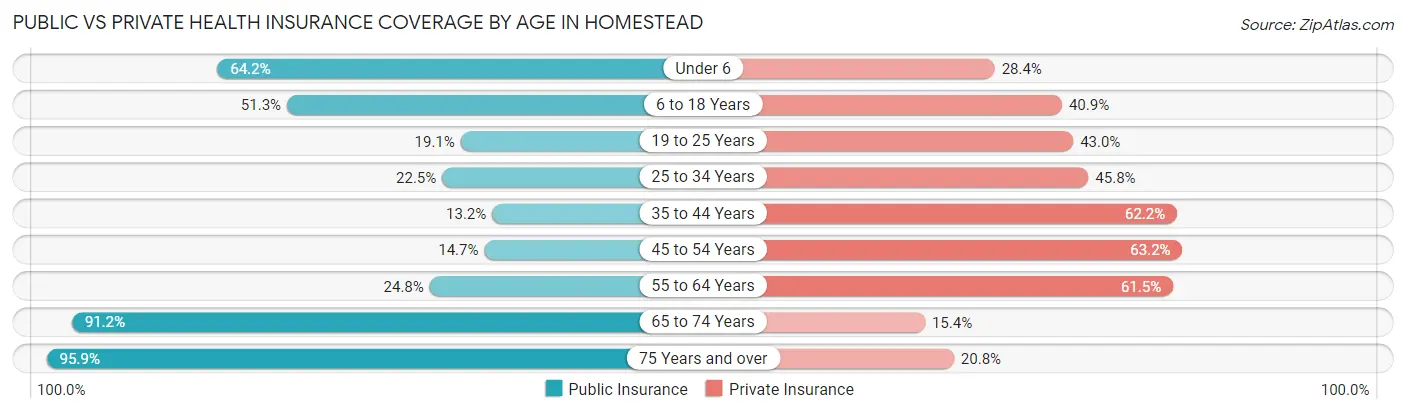
| Age Bracket | Public Insurance | Private Insurance |
| Under 6 | 5,673 (64.2%) | 2,507 (28.4%) |
| 6 to 18 Years | 8,979 (51.3%) | 7,152 (40.9%) |
| 19 to 25 Years | 1,153 (19.1%) | 2,597 (42.9%) |
| 25 to 34 Years | 2,794 (22.5%) | 5,685 (45.8%) |
| 35 to 44 Years | 1,685 (13.2%) | 7,931 (62.2%) |
| 45 to 54 Years | 1,377 (14.7%) | 5,931 (63.2%) |
| 55 to 64 Years | 1,565 (24.8%) | 3,876 (61.5%) |
| 65 to 74 Years | 3,456 (91.2%) | 585 (15.4%) |
| 75 Years and over | 2,139 (95.9%) | 464 (20.8%) |
| Total | 28,821 (36.4%) | 36,728 (46.3%) |
Disability Status by Sex by Age in Homestead
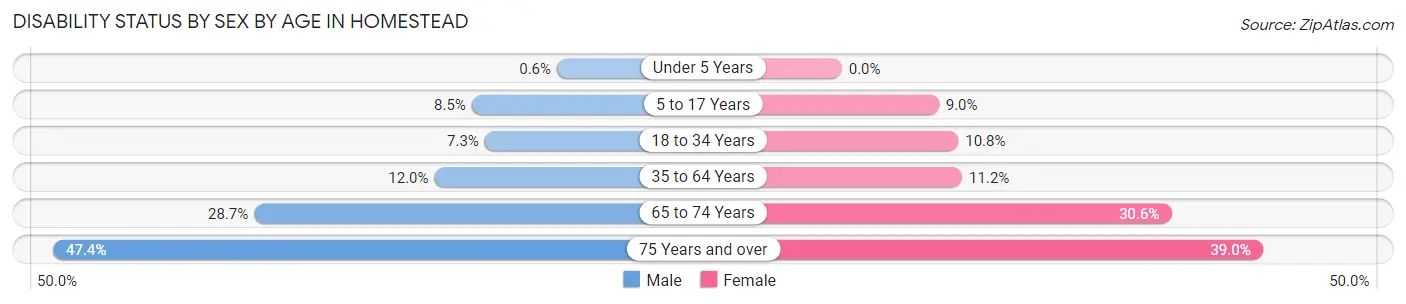
| Age Bracket | Male | Female |
| Under 5 Years | 23 (0.6%) | 0 (0.0%) |
| 5 to 17 Years | 737 (8.5%) | 800 (9.0%) |
| 18 to 34 Years | 738 (7.3%) | 1,008 (10.8%) |
| 35 to 64 Years | 1,634 (12.0%) | 1,652 (11.2%) |
| 65 to 74 Years | 475 (28.7%) | 652 (30.6%) |
| 75 Years and over | 339 (47.3%) | 591 (39.0%) |
Disability Class by Sex by Age in Homestead
Disability Class: Hearing Difficulty
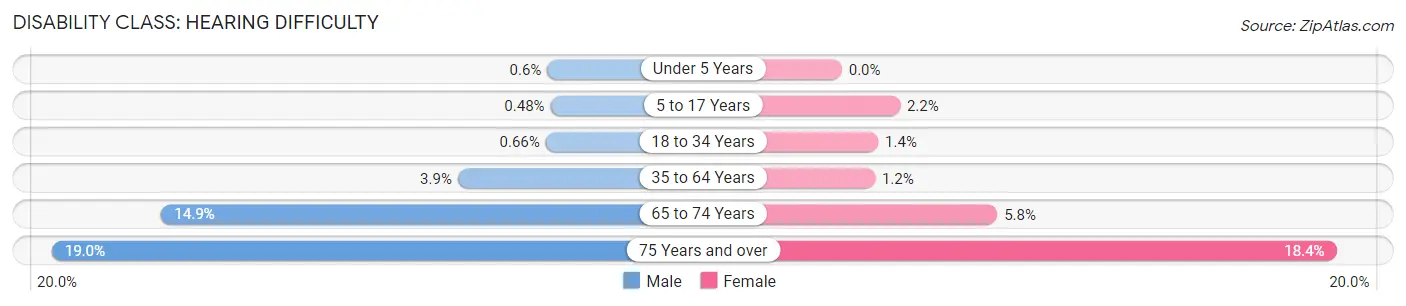
| Age Bracket | Male | Female |
| Under 5 Years | 23 (0.6%) | 0 (0.0%) |
| 5 to 17 Years | 42 (0.5%) | 192 (2.2%) |
| 18 to 34 Years | 67 (0.7%) | 126 (1.3%) |
| 35 to 64 Years | 535 (3.9%) | 182 (1.2%) |
| 65 to 74 Years | 247 (14.9%) | 123 (5.8%) |
| 75 Years and over | 136 (19.0%) | 278 (18.4%) |
Disability Class: Vision Difficulty
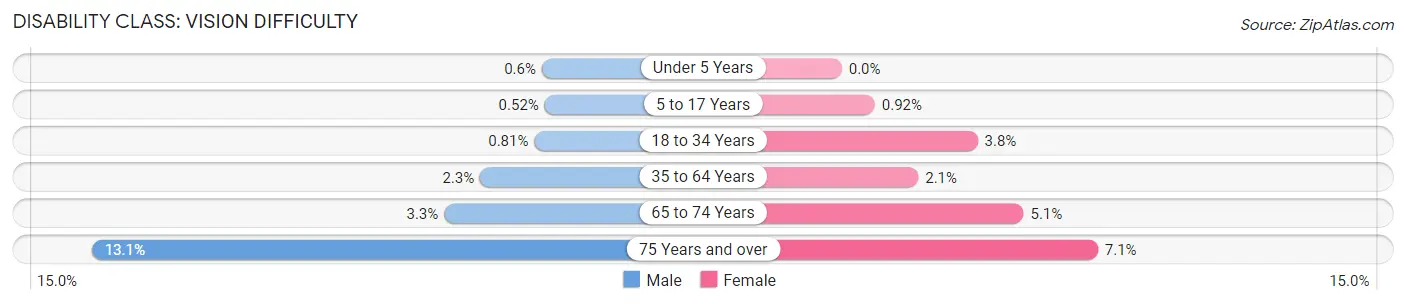
| Age Bracket | Male | Female |
| Under 5 Years | 23 (0.6%) | 0 (0.0%) |
| 5 to 17 Years | 45 (0.5%) | 82 (0.9%) |
| 18 to 34 Years | 82 (0.8%) | 353 (3.8%) |
| 35 to 64 Years | 317 (2.3%) | 315 (2.1%) |
| 65 to 74 Years | 55 (3.3%) | 108 (5.1%) |
| 75 Years and over | 94 (13.1%) | 108 (7.1%) |
Disability Class: Cognitive Difficulty
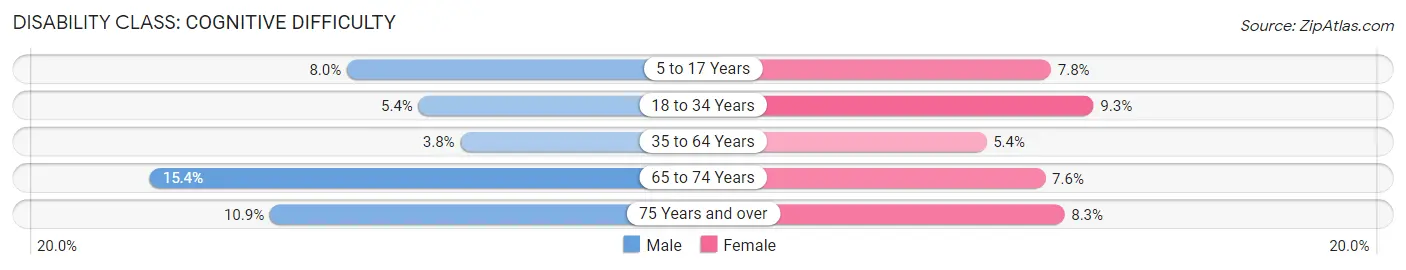
| Age Bracket | Male | Female |
| 5 to 17 Years | 696 (8.0%) | 690 (7.8%) |
| 18 to 34 Years | 543 (5.4%) | 871 (9.3%) |
| 35 to 64 Years | 522 (3.8%) | 792 (5.4%) |
| 65 to 74 Years | 254 (15.3%) | 161 (7.5%) |
| 75 Years and over | 78 (10.9%) | 125 (8.3%) |
Disability Class: Ambulatory Difficulty
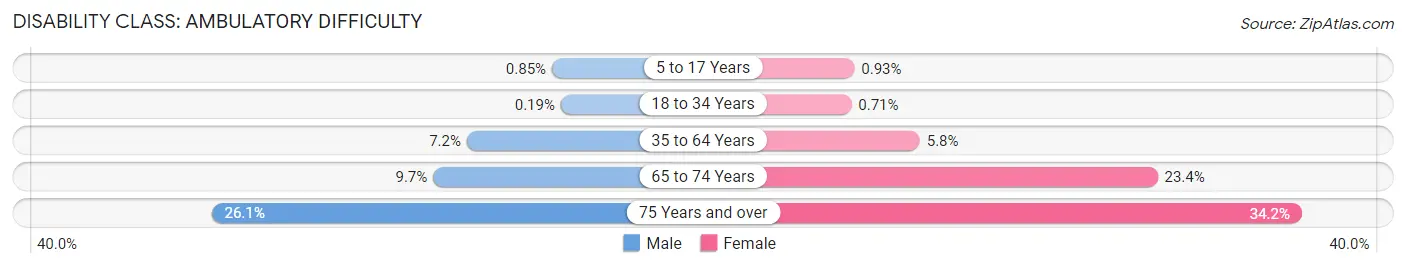
| Age Bracket | Male | Female |
| 5 to 17 Years | 74 (0.9%) | 83 (0.9%) |
| 18 to 34 Years | 19 (0.2%) | 66 (0.7%) |
| 35 to 64 Years | 979 (7.2%) | 856 (5.8%) |
| 65 to 74 Years | 160 (9.7%) | 500 (23.4%) |
| 75 Years and over | 187 (26.1%) | 517 (34.2%) |
Disability Class: Self-Care Difficulty
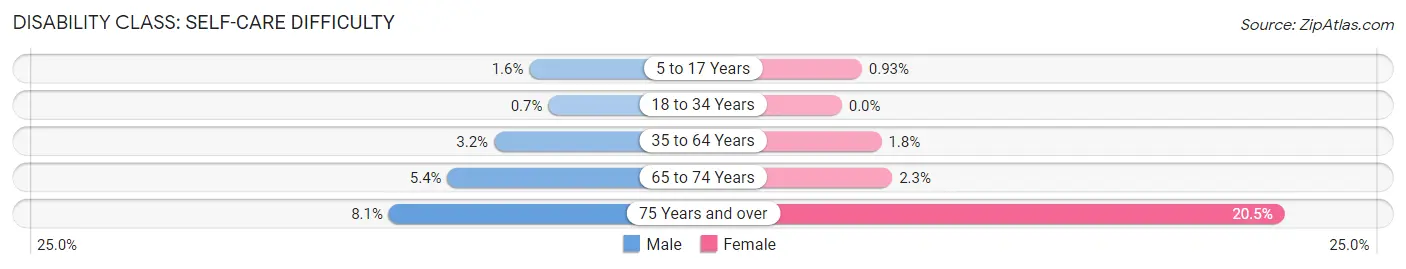
| Age Bracket | Male | Female |
| 5 to 17 Years | 137 (1.6%) | 83 (0.9%) |
| 18 to 34 Years | 71 (0.7%) | 0 (0.0%) |
| 35 to 64 Years | 440 (3.2%) | 272 (1.8%) |
| 65 to 74 Years | 89 (5.4%) | 50 (2.3%) |
| 75 Years and over | 58 (8.1%) | 311 (20.5%) |
Technology Access in Homestead
Computing Device Access in Homestead
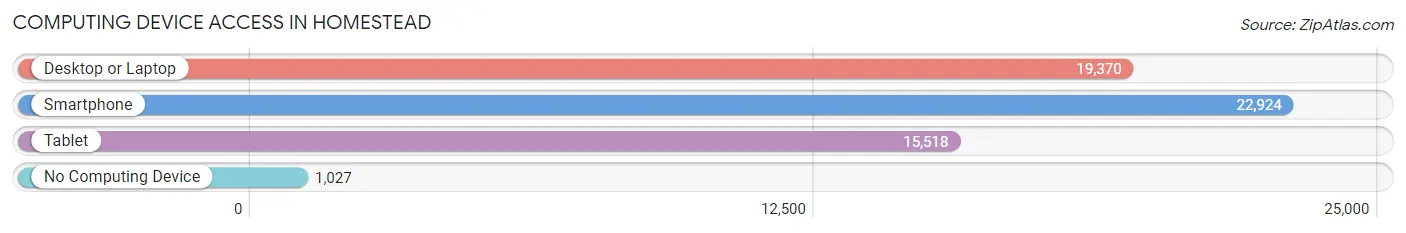
| Device Type | # Households | % Households |
| Desktop or Laptop | 19,370 | 78.7% |
| Smartphone | 22,924 | 93.1% |
| Tablet | 15,518 | 63.0% |
| No Computing Device | 1,027 | 4.2% |
| Total | 24,626 | 100.0% |
Internet Access in Homestead
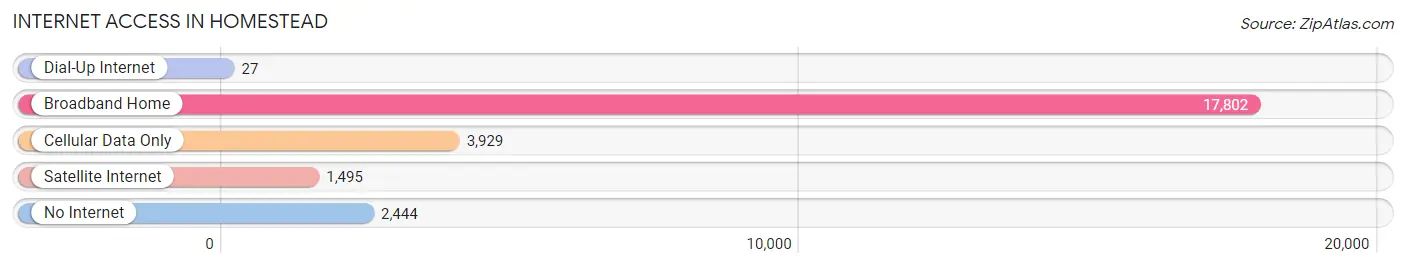
| Internet Type | # Households | % Households |
| Dial-Up Internet | 27 | 0.1% |
| Broadband Home | 17,802 | 72.3% |
| Cellular Data Only | 3,929 | 16.0% |
| Satellite Internet | 1,495 | 6.1% |
| No Internet | 2,444 | 9.9% |
| Total | 24,626 | 100.0% |
Homestead Summary
Homestead is a city located in Miami-Dade County, Florida, United States. It is located 35 miles southwest of Miami and is part of the Miami metropolitan area. As of the 2010 census, the population of Homestead was 60,512.
History
Homestead was founded in 1913 by a group of settlers from Michigan. The city was named after the homesteaders who settled in the area. The settlers were attracted to the area due to its fertile soil and mild climate. The city was incorporated in 1913 and was the first city in Miami-Dade County to be incorporated.
In 1926, the city was devastated by the Great Miami Hurricane, which destroyed much of the city and killed hundreds of people. The city was rebuilt and continued to grow throughout the 20th century.
In the 1950s, Homestead Air Force Base was established in the city. The base was a major employer in the area and provided a boost to the local economy. The base was closed in 1992 due to budget cuts.
In 1992, Homestead was hit by Hurricane Andrew, which caused extensive damage to the city. The city was rebuilt and has since become a popular destination for tourists and retirees.
Geography
Homestead is located at 25°28'N 80°28'W (25.47, -80.47). The city is located in the southern part of Miami-Dade County, near the Everglades National Park. The city covers an area of 24.2 square miles and has a population density of 2,478 people per square mile.
The city is located on the Atlantic Coastal Ridge, which is a ridge of limestone that runs along the eastern coast of Florida. The ridge provides a natural barrier to the Everglades and helps protect the city from flooding.
Economy
Homestead’s economy is largely based on agriculture and tourism. The city is home to several large farms, which produce a variety of crops, including tomatoes, peppers, squash, and melons. The city is also home to several tourist attractions, including the Homestead-Miami Speedway, Everglades National Park, and Biscayne National Park.
The city is also home to several large employers, including the Homestead Air Reserve Base, Homestead Hospital, and Homestead-Miami Speedway.
Demographics
As of the 2010 census, the population of Homestead was 60,512. The racial makeup of the city was 64.2% White, 22.3% Hispanic or Latino, 10.2% African American, and 3.3% other.
The median household income in Homestead was $37,845, and the median family income was $41,919. The per capita income in the city was $17,845.
Conclusion
Homestead is a city located in Miami-Dade County, Florida. It was founded in 1913 by a group of settlers from Michigan and was incorporated in 1913. The city was devastated by the Great Miami Hurricane in 1926 and Hurricane Andrew in 1992. The city’s economy is largely based on agriculture and tourism. As of the 2010 census, the population of Homestead was 60,512. The city is home to several large employers, including the Homestead Air Reserve Base, Homestead Hospital, and Homestead-Miami Speedway.
Common Questions
What is Per Capita Income in Homestead?
Per Capita income in Homestead is $22,293.
What is the Median Family Income in Homestead?
Median Family Income in Homestead is $58,721.
What is the Median Household income in Homestead?
Median Household Income in Homestead is $57,739.
What is Income or Wage Gap in Homestead?
Income or Wage Gap in Homestead is 18.7%.
Women in Homestead earn 81.3 cents for every dollar earned by a man.
What is Family Income Deficit in Homestead?
Family Income Deficit in Homestead is $11,461.
Families that are below poverty line in Homestead earn $11,461 less on average than the poverty threshold level.
What is Inequality or Gini Index in Homestead?
Inequality or Gini Index in Homestead is 0.42.
What is the Total Population of Homestead?
Total Population of Homestead is 79,996.
What is the Total Male Population of Homestead?
Total Male Population of Homestead is 39,121.
What is the Total Female Population of Homestead?
Total Female Population of Homestead is 40,875.
What is the Ratio of Males per 100 Females in Homestead?
There are 95.71 Males per 100 Females in Homestead.
What is the Ratio of Females per 100 Males in Homestead?
There are 104.48 Females per 100 Males in Homestead.
What is the Median Population Age in Homestead?
Median Population Age in Homestead is 31.5 Years.
What is the Average Family Size in Homestead
Average Family Size in Homestead is 3.6 People.
What is the Average Household Size in Homestead
Average Household Size in Homestead is 3.2 People.
How Large is the Labor Force in Homestead?
There are 37,304 People in the Labor Forcein in Homestead.
What is the Percentage of People in the Labor Force in Homestead?
65.2% of People are in the Labor Force in Homestead.
What is the Unemployment Rate in Homestead?
Unemployment Rate in Homestead is 4.8%.