Denver, CO Map & Demographics
Denver Map
Denver Overview
$56,381
PER CAPITA INCOME
$109,682
AVG FAMILY INCOME
$85,853
AVG HOUSEHOLD INCOME
17.7%
WAGE / INCOME GAP [ % ]
82.3¢/ $1
WAGE / INCOME GAP [ $ ]
$11,824
FAMILY INCOME DEFICIT
0.49
INEQUALITY / GINI INDEX
710,800
TOTAL POPULATION
359,302
MALE POPULATION
351,498
FEMALE POPULATION
102.22
MALES / 100 FEMALES
97.83
FEMALES / 100 MALES
34.9
MEDIAN AGE
3.0
AVG FAMILY SIZE
2.1
AVG HOUSEHOLD SIZE
437,813
LABOR FORCE [ PEOPLE ]
74.0%
PERCENT IN LABOR FORCE
4.7%
UNEMPLOYMENT RATE
Denver Zip Codes
Income in Denver
Income Overview in Denver
Per Capita Income in Denver is $56,381, while median incomes of families and households are $109,682 and $85,853 respectively.
| Characteristic | Number | Measure |
| Per Capita Income | 710,800 | $56,381 |
| Median Family Income | 150,637 | $109,682 |
| Mean Family Income | 150,637 | $154,887 |
| Median Household Income | 322,964 | $85,853 |
| Mean Household Income | 322,964 | $122,771 |
| Income Deficit | 150,637 | $11,824 |
| Wage / Income Gap (%) | 710,800 | 17.70% |
| Wage / Income Gap ($) | 710,800 | 82.30¢ per $1 |
| Gini / Inequality Index | 710,800 | 0.49 |
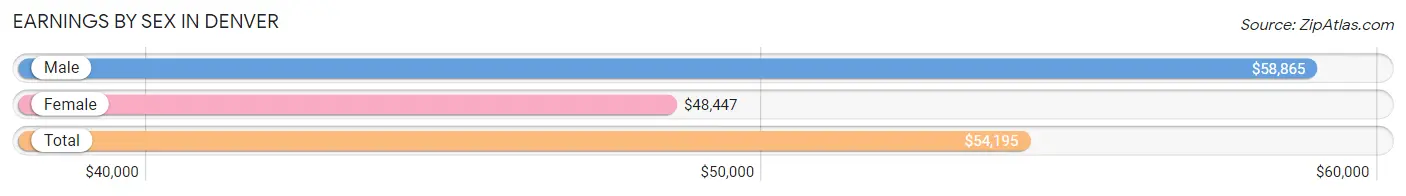
Earnings by Sex in Denver
Average Earnings in Denver are $54,195, $58,865 for men and $48,447 for women, a difference of 17.7%.
| Sex | Number | Average Earnings |
| Male | 241,500 (53.4%) | $58,865 |
| Female | 210,691 (46.6%) | $48,447 |
| Total | 452,191 (100.0%) | $54,195 |
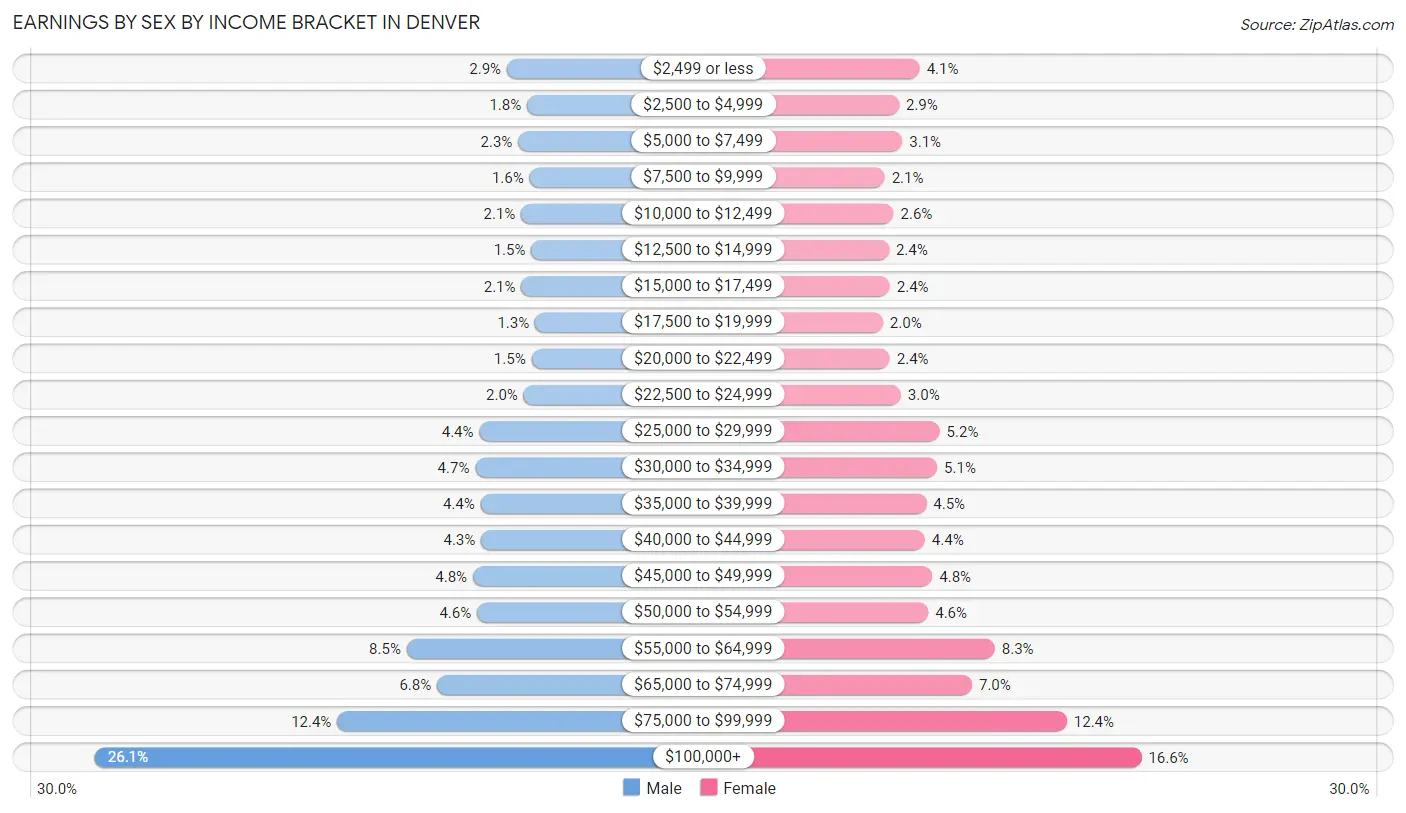
Earnings by Sex by Income Bracket in Denver
The most common earnings brackets in Denver are $100,000+ for men (62,900 | 26.1%) and $100,000+ for women (34,884 | 16.6%).
| Income | Male | Female |
| $2,499 or less | 6,986 (2.9%) | 8,634 (4.1%) |
| $2,500 to $4,999 | 4,257 (1.8%) | 6,181 (2.9%) |
| $5,000 to $7,499 | 5,459 (2.3%) | 6,564 (3.1%) |
| $7,500 to $9,999 | 3,923 (1.6%) | 4,481 (2.1%) |
| $10,000 to $12,499 | 5,036 (2.1%) | 5,531 (2.6%) |
| $12,500 to $14,999 | 3,670 (1.5%) | 4,984 (2.4%) |
| $15,000 to $17,499 | 5,023 (2.1%) | 5,103 (2.4%) |
| $17,500 to $19,999 | 3,156 (1.3%) | 4,278 (2.0%) |
| $20,000 to $22,499 | 3,648 (1.5%) | 5,100 (2.4%) |
| $22,500 to $24,999 | 4,720 (1.9%) | 6,412 (3.0%) |
| $25,000 to $29,999 | 10,713 (4.4%) | 11,003 (5.2%) |
| $30,000 to $34,999 | 11,287 (4.7%) | 10,696 (5.1%) |
| $35,000 to $39,999 | 10,547 (4.4%) | 9,409 (4.5%) |
| $40,000 to $44,999 | 10,478 (4.3%) | 9,243 (4.4%) |
| $45,000 to $49,999 | 11,601 (4.8%) | 10,136 (4.8%) |
| $50,000 to $54,999 | 11,043 (4.6%) | 9,644 (4.6%) |
| $55,000 to $64,999 | 20,571 (8.5%) | 17,519 (8.3%) |
| $65,000 to $74,999 | 16,461 (6.8%) | 14,833 (7.0%) |
| $75,000 to $99,999 | 30,021 (12.4%) | 26,056 (12.4%) |
| $100,000+ | 62,900 (26.1%) | 34,884 (16.6%) |
| Total | 241,500 (100.0%) | 210,691 (100.0%) |
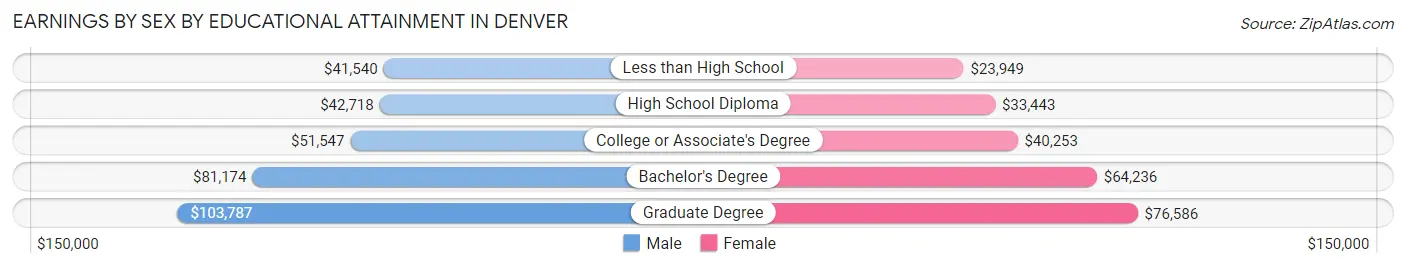
Earnings by Sex by Educational Attainment in Denver
Average earnings in Denver are $65,020 for men and $54,023 for women, a difference of 16.9%. Men with an educational attainment of graduate degree enjoy the highest average annual earnings of $103,787, while those with less than high school education earn the least with $41,540. Women with an educational attainment of graduate degree earn the most with the average annual earnings of $76,586, while those with less than high school education have the smallest earnings of $23,949.
| Educational Attainment | Male Income | Female Income |
| Less than High School | $41,540 | $23,949 |
| High School Diploma | $42,718 | $33,443 |
| College or Associate's Degree | $51,547 | $40,253 |
| Bachelor's Degree | $81,174 | $64,236 |
| Graduate Degree | $103,787 | $76,586 |
| Total | $65,020 | $54,023 |
Family Income in Denver
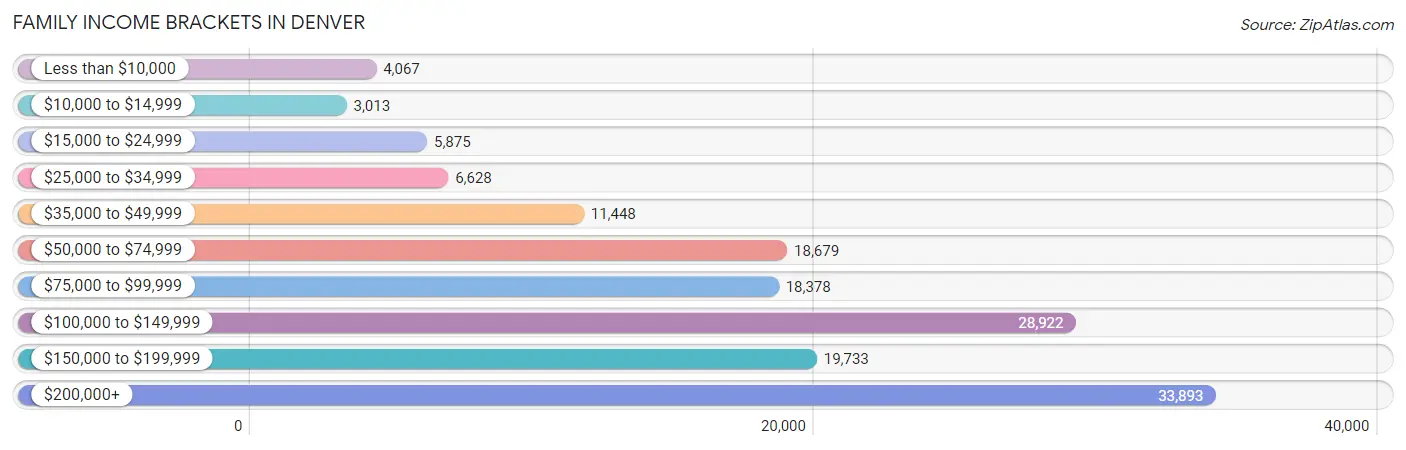
Family Income Brackets in Denver
According to the Denver family income data, there are 33,893 families falling into the $200,000+ income range, which is the most common income bracket and makes up 22.5% of all families. Conversely, the $10,000 to $14,999 income bracket is the least frequent group with only 3,013 families (2.0%) belonging to this category.
| Income Bracket | # Families | % Families |
| Less than $10,000 | 4,067 | 2.7% |
| $10,000 to $14,999 | 3,013 | 2.0% |
| $15,000 to $24,999 | 5,875 | 3.9% |
| $25,000 to $34,999 | 6,628 | 4.4% |
| $35,000 to $49,999 | 11,448 | 7.6% |
| $50,000 to $74,999 | 18,679 | 12.4% |
| $75,000 to $99,999 | 18,378 | 12.2% |
| $100,000 to $149,999 | 28,922 | 19.2% |
| $150,000 to $199,999 | 19,733 | 13.1% |
| $200,000+ | 33,893 | 22.5% |
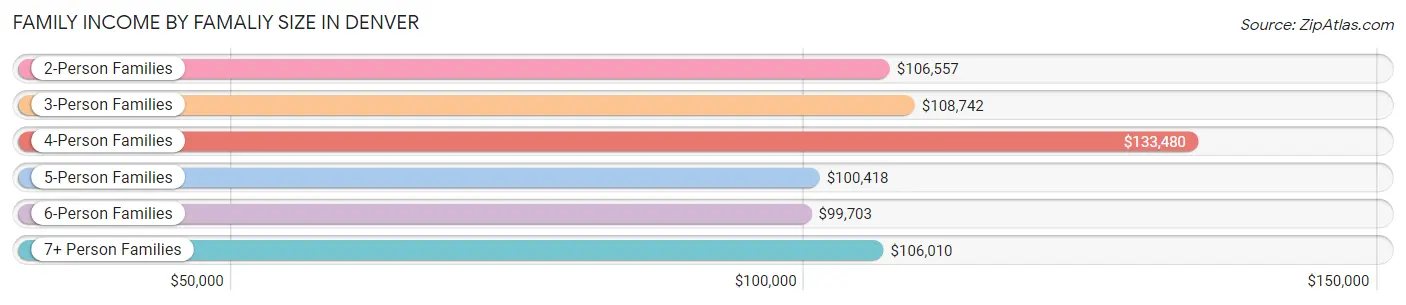
Family Income by Famaliy Size in Denver
4-person families (27,058 | 18.0%) account for the highest median family income in Denver with $133,480 per family, while 2-person families (73,622 | 48.9%) have the highest median income of $53,278 per family member.
| Income Bracket | # Families | Median Income |
| 2-Person Families | 73,622 (48.9%) | $106,557 |
| 3-Person Families | 30,871 (20.5%) | $108,742 |
| 4-Person Families | 27,058 (18.0%) | $133,480 |
| 5-Person Families | 11,494 (7.6%) | $100,418 |
| 6-Person Families | 4,510 (3.0%) | $99,703 |
| 7+ Person Families | 3,082 (2.1%) | $106,010 |
| Total | 150,637 (100.0%) | $109,682 |
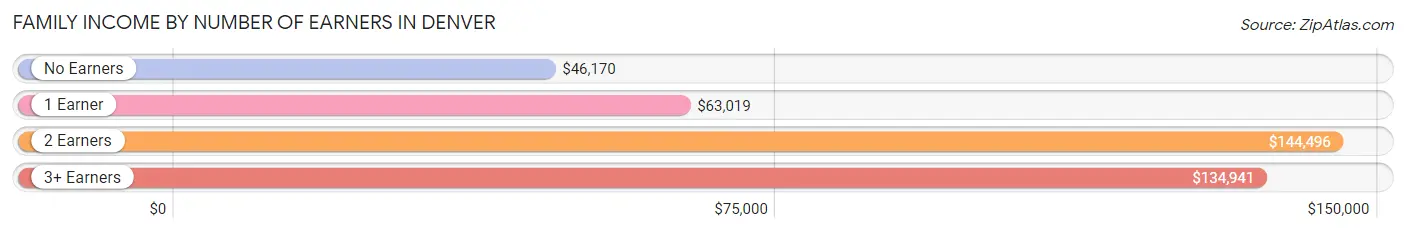
Family Income by Number of Earners in Denver
The median family income in Denver is $109,682, with families comprising 2 earners (77,830) having the highest median family income of $144,496, while families with no earners (14,924) have the lowest median family income of $46,170, accounting for 51.7% and 9.9% of families, respectively.
| Number of Earners | # Families | Median Income |
| No Earners | 14,924 (9.9%) | $46,170 |
| 1 Earner | 42,091 (27.9%) | $63,019 |
| 2 Earners | 77,830 (51.7%) | $144,496 |
| 3+ Earners | 15,792 (10.5%) | $134,941 |
| Total | 150,637 (100.0%) | $109,682 |
Household Income in Denver
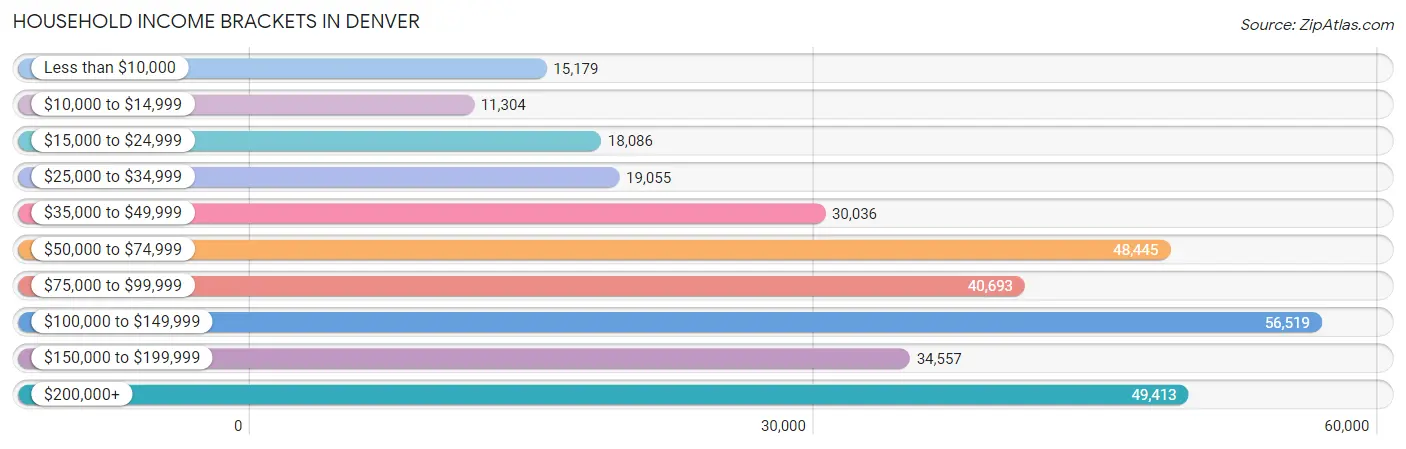
Household Income Brackets in Denver
With 56,519 households falling in the category, the $100,000 to $149,999 income range is the most frequent in Denver, accounting for 17.5% of all households. In contrast, only 11,304 households (3.5%) fall into the $10,000 to $14,999 income bracket, making it the least populous group.
| Income Bracket | # Households | % Households |
| Less than $10,000 | 15,179 | 4.7% |
| $10,000 to $14,999 | 11,304 | 3.5% |
| $15,000 to $24,999 | 18,086 | 5.6% |
| $25,000 to $34,999 | 19,055 | 5.9% |
| $35,000 to $49,999 | 30,036 | 9.3% |
| $50,000 to $74,999 | 48,445 | 15.0% |
| $75,000 to $99,999 | 40,693 | 12.6% |
| $100,000 to $149,999 | 56,519 | 17.5% |
| $150,000 to $199,999 | 34,557 | 10.7% |
| $200,000+ | 49,413 | 15.3% |
Household Income by Householder Age in Denver
The median household income in Denver is $85,853, with the highest median household income of $98,535 found in the 25 to 44 years age bracket for the primary householder. A total of 157,263 households (48.7%) fall into this category. Meanwhile, the 15 to 24 years age bracket for the primary householder has the lowest median household income of $53,032, with 15,709 households (4.9%) in this group.
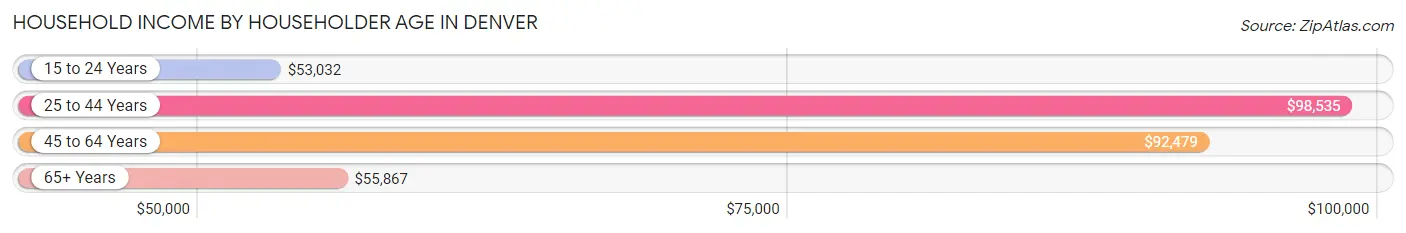
| Income Bracket | # Households | Median Income |
| 15 to 24 Years | 15,709 (4.9%) | $53,032 |
| 25 to 44 Years | 157,263 (48.7%) | $98,535 |
| 45 to 64 Years | 91,993 (28.5%) | $92,479 |
| 65+ Years | 57,999 (18.0%) | $55,867 |
| Total | 322,964 (100.0%) | $85,853 |
Poverty in Denver
Income Below Poverty by Sex and Age in Denver
With 10.7% poverty level for males and 12.7% for females among the residents of Denver, 16 and 17 year old males and 18 to 24 year old females are the most vulnerable to poverty, with 1,383 males (19.1%) and 5,614 females (20.7%) in their respective age groups living below the poverty level.
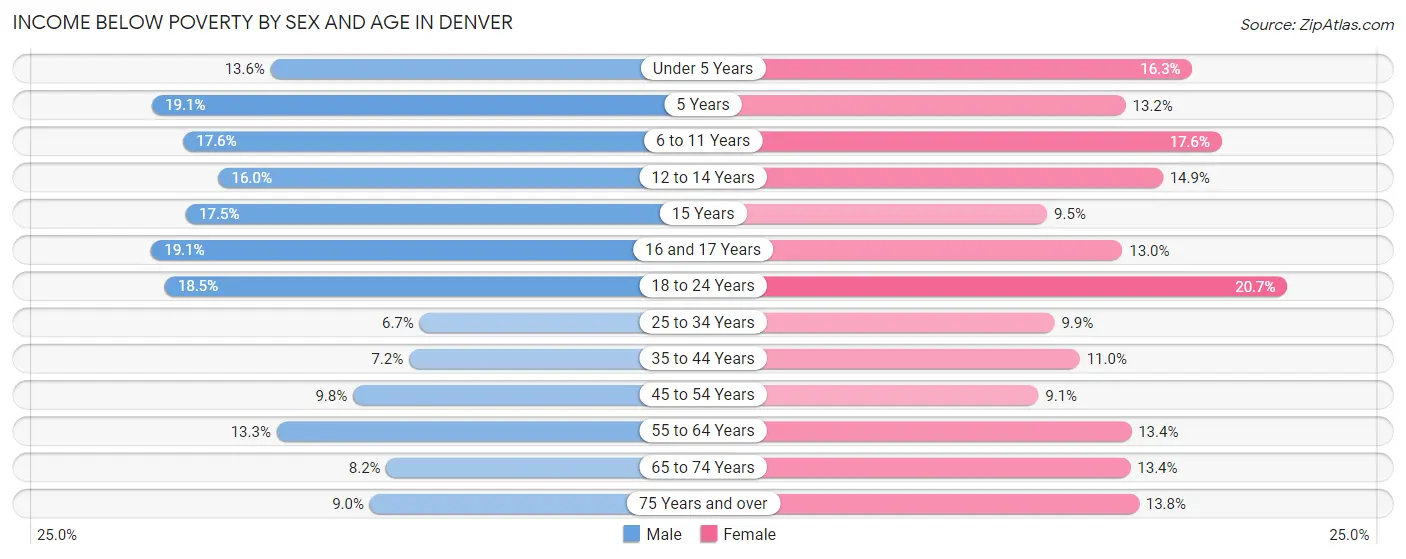
| Age Bracket | Male | Female |
| Under 5 Years | 2,693 (13.6%) | 3,141 (16.3%) |
| 5 Years | 702 (19.1%) | 525 (13.2%) |
| 6 to 11 Years | 3,805 (17.6%) | 3,699 (17.6%) |
| 12 to 14 Years | 1,768 (16.0%) | 1,583 (14.9%) |
| 15 Years | 537 (17.5%) | 336 (9.5%) |
| 16 and 17 Years | 1,383 (19.1%) | 843 (13.0%) |
| 18 to 24 Years | 4,856 (18.5%) | 5,614 (20.7%) |
| 25 to 34 Years | 5,600 (6.7%) | 7,889 (9.9%) |
| 35 to 44 Years | 4,414 (7.2%) | 6,125 (11.0%) |
| 45 to 54 Years | 4,286 (9.8%) | 3,510 (9.1%) |
| 55 to 64 Years | 4,496 (13.3%) | 4,512 (13.4%) |
| 65 to 74 Years | 1,982 (8.2%) | 3,687 (13.4%) |
| 75 Years and over | 1,131 (9.0%) | 2,586 (13.8%) |
| Total | 37,653 (10.7%) | 44,050 (12.7%) |
Income Above Poverty by Sex and Age in Denver
According to the poverty statistics in Denver, males aged 25 to 34 years and females aged 45 to 54 years are the age groups that are most secure financially, with 93.3% of males and 90.9% of females in these age groups living above the poverty line.
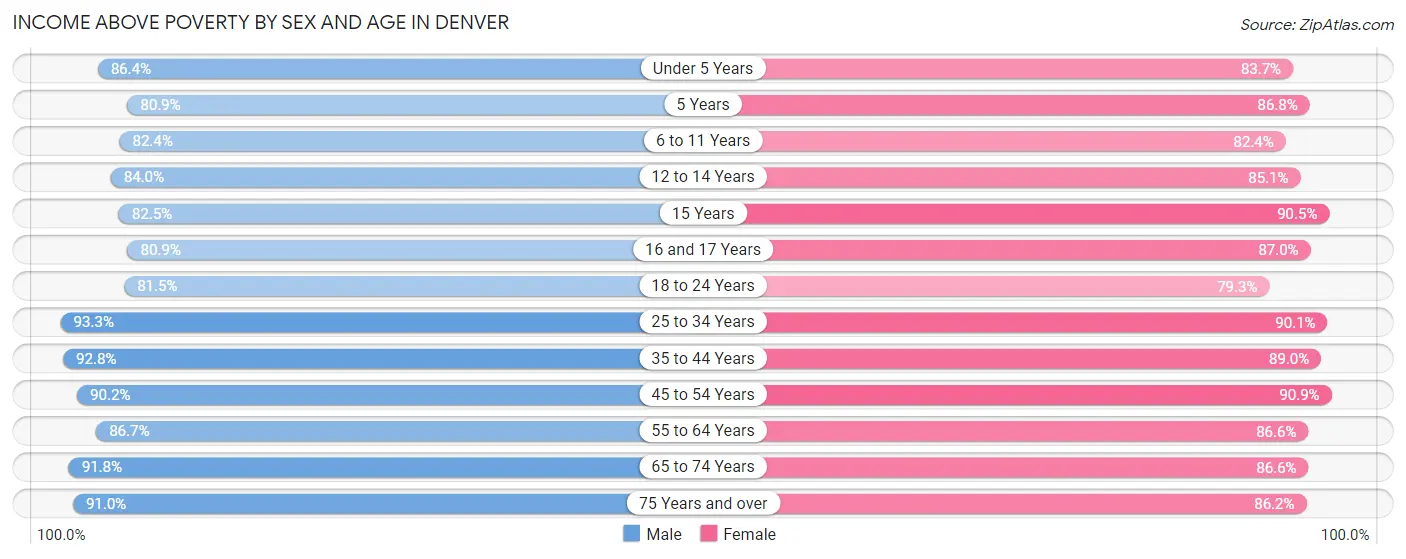
| Age Bracket | Male | Female |
| Under 5 Years | 17,137 (86.4%) | 16,165 (83.7%) |
| 5 Years | 2,978 (80.9%) | 3,462 (86.8%) |
| 6 to 11 Years | 17,781 (82.4%) | 17,278 (82.4%) |
| 12 to 14 Years | 9,282 (84.0%) | 9,045 (85.1%) |
| 15 Years | 2,529 (82.5%) | 3,191 (90.5%) |
| 16 and 17 Years | 5,850 (80.9%) | 5,630 (87.0%) |
| 18 to 24 Years | 21,408 (81.5%) | 21,545 (79.3%) |
| 25 to 34 Years | 78,391 (93.3%) | 72,022 (90.1%) |
| 35 to 44 Years | 57,194 (92.8%) | 49,352 (89.0%) |
| 45 to 54 Years | 39,628 (90.2%) | 34,962 (90.9%) |
| 55 to 64 Years | 29,300 (86.7%) | 29,083 (86.6%) |
| 65 to 74 Years | 22,157 (91.8%) | 23,850 (86.6%) |
| 75 Years and over | 11,458 (91.0%) | 16,182 (86.2%) |
| Total | 315,093 (89.3%) | 301,767 (87.3%) |
Income Below Poverty Among Married-Couple Families in Denver
The poverty statistics for married-couple families in Denver show that 4.7% or 5,170 of the total 109,481 families live below the poverty line. Families with 5 or more children have the highest poverty rate of 27.2%, comprising of 211 families. On the other hand, families with no children have the lowest poverty rate of 2.6%, which includes 1,550 families.
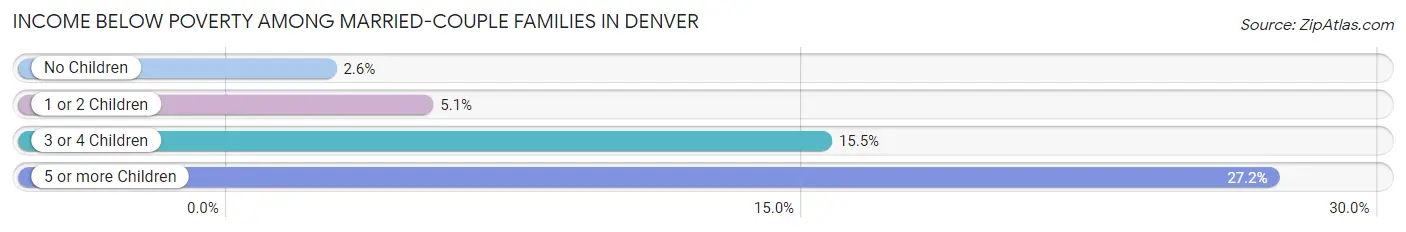
| Children | Above Poverty | Below Poverty |
| No Children | 58,818 (97.4%) | 1,550 (2.6%) |
| 1 or 2 Children | 37,277 (94.9%) | 2,005 (5.1%) |
| 3 or 4 Children | 7,651 (84.5%) | 1,404 (15.5%) |
| 5 or more Children | 565 (72.8%) | 211 (27.2%) |
| Total | 104,311 (95.3%) | 5,170 (4.7%) |
Income Below Poverty Among Single-Parent Households in Denver
According to the poverty data in Denver, 11.3% or 1,448 single-father households and 20.2% or 5,736 single-mother households are living below the poverty line. Among single-father households, those with 3 or 4 children have the highest poverty rate, with 148 households (20.3%) experiencing poverty. Likewise, among single-mother households, those with 5 or more children have the highest poverty rate, with 59 households (52.2%) falling below the poverty line.
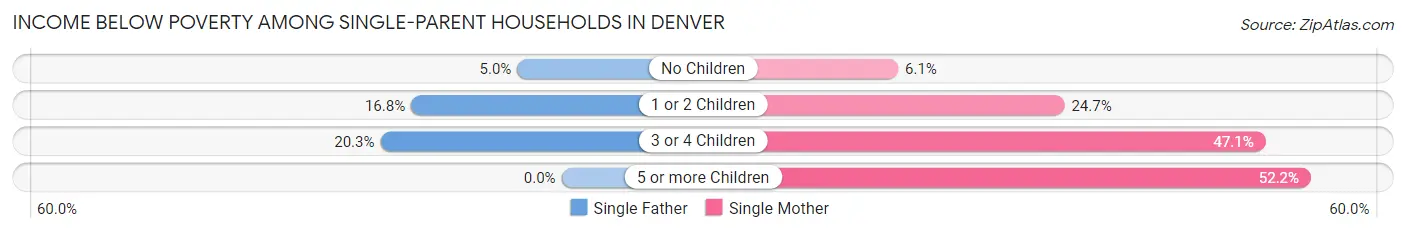
| Children | Single Father | Single Mother |
| No Children | 302 (5.0%) | 635 (6.1%) |
| 1 or 2 Children | 998 (16.8%) | 3,688 (24.7%) |
| 3 or 4 Children | 148 (20.3%) | 1,354 (47.1%) |
| 5 or more Children | 0 (0.0%) | 59 (52.2%) |
| Total | 1,448 (11.3%) | 5,736 (20.2%) |
Income Below Poverty Among Married-Couple vs Single-Parent Households in Denver
The poverty data for Denver shows that 5,170 of the married-couple family households (4.7%) and 7,184 of the single-parent households (17.5%) are living below the poverty level. Within the married-couple family households, those with 5 or more children have the highest poverty rate, with 211 households (27.2%) falling below the poverty line. Among the single-parent households, those with 5 or more children have the highest poverty rate, with 59 household (47.2%) living below poverty.
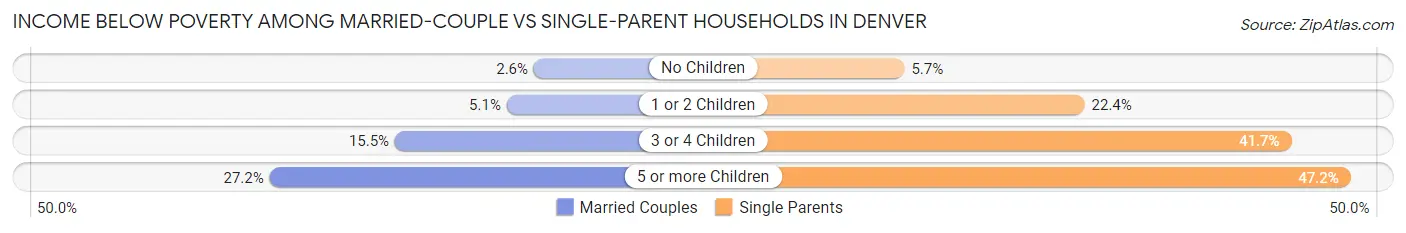
| Children | Married-Couple Families | Single-Parent Households |
| No Children | 1,550 (2.6%) | 937 (5.7%) |
| 1 or 2 Children | 2,005 (5.1%) | 4,686 (22.4%) |
| 3 or 4 Children | 1,404 (15.5%) | 1,502 (41.7%) |
| 5 or more Children | 211 (27.2%) | 59 (47.2%) |
| Total | 5,170 (4.7%) | 7,184 (17.5%) |
Race in Denver
The most populous races in Denver are White / Caucasian (467,213 | 65.7%), Hispanic or Latino (207,519 | 29.2%), and Two or more Races (90,223 | 12.7%).
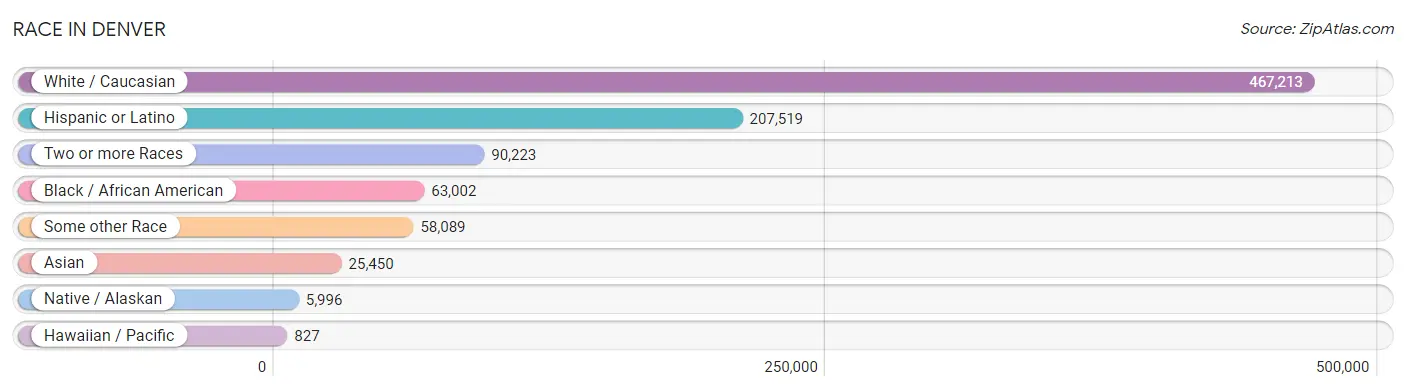
| Race | # Population | % Population |
| Asian | 25,450 | 3.6% |
| Black / African American | 63,002 | 8.9% |
| Hawaiian / Pacific | 827 | 0.1% |
| Hispanic or Latino | 207,519 | 29.2% |
| Native / Alaskan | 5,996 | 0.8% |
| White / Caucasian | 467,213 | 65.7% |
| Two or more Races | 90,223 | 12.7% |
| Some other Race | 58,089 | 8.2% |
| Total | 710,800 | 100.0% |
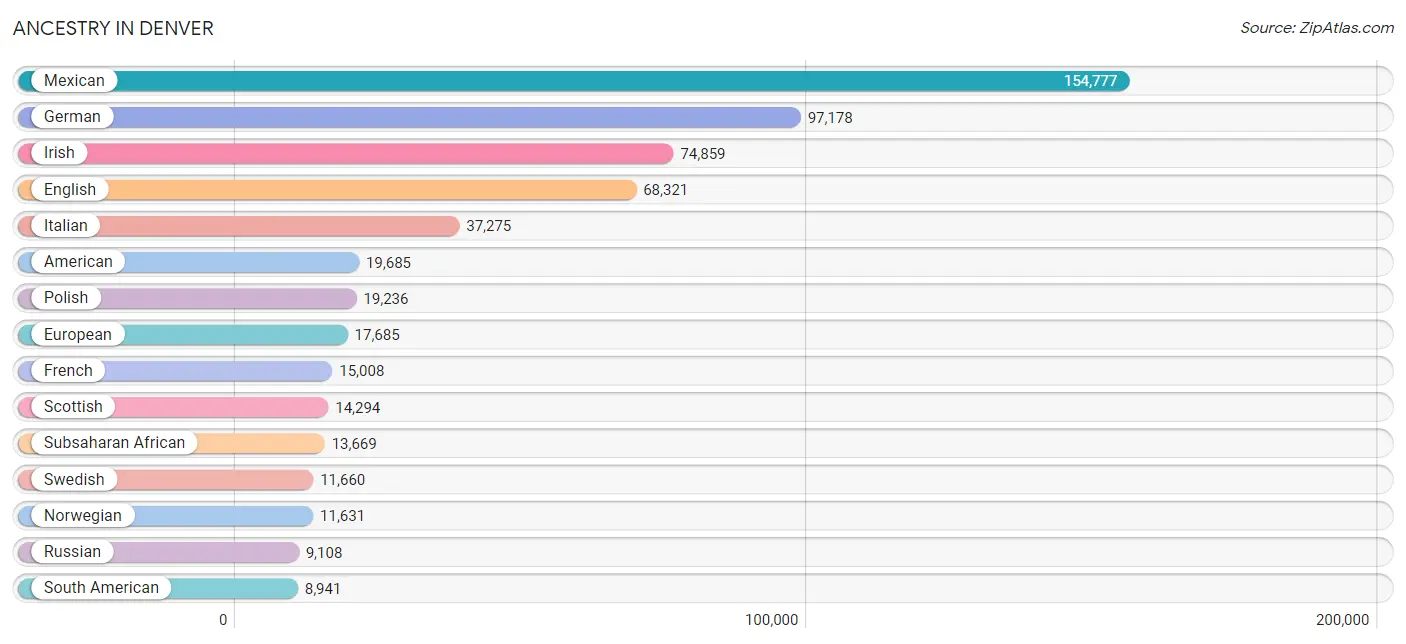
Ancestry in Denver
The most populous ancestries reported in Denver are Mexican (154,777 | 21.8%), German (97,178 | 13.7%), Irish (74,859 | 10.5%), English (68,321 | 9.6%), and Italian (37,275 | 5.2%), together accounting for 60.8% of all Denver residents.
| Ancestry | # Population | % Population |
| Afghan | 128 | 0.0% |
| African | 4,214 | 0.6% |
| Alaska Native | 104 | 0.0% |
| Alaskan Athabascan | 8 | 0.0% |
| Albanian | 101 | 0.0% |
| Alsatian | 53 | 0.0% |
| American | 19,685 | 2.8% |
| Apache | 1,421 | 0.2% |
| Arab | 6,159 | 0.9% |
| Arapaho | 116 | 0.0% |
| Argentinean | 1,177 | 0.2% |
| Armenian | 770 | 0.1% |
| Assyrian / Chaldean / Syriac | 96 | 0.0% |
| Australian | 346 | 0.1% |
| Austrian | 2,139 | 0.3% |
| Bahamian | 8 | 0.0% |
| Bangladeshi | 76 | 0.0% |
| Barbadian | 58 | 0.0% |
| Basque | 394 | 0.1% |
| Belgian | 981 | 0.1% |
| Bhutanese | 3,897 | 0.5% |
| Blackfeet | 303 | 0.0% |
| Bolivian | 107 | 0.0% |
| Brazilian | 631 | 0.1% |
| British | 4,793 | 0.7% |
| British West Indian | 132 | 0.0% |
| Bulgarian | 227 | 0.0% |
| Burmese | 3,804 | 0.5% |
| Cajun | 72 | 0.0% |
| Cambodian | 348 | 0.1% |
| Canadian | 1,294 | 0.2% |
| Cape Verdean | 91 | 0.0% |
| Celtic | 226 | 0.0% |
| Central American | 8,222 | 1.2% |
| Central American Indian | 639 | 0.1% |
| Cherokee | 3,304 | 0.5% |
| Cheyenne | 158 | 0.0% |
| Chickasaw | 306 | 0.0% |
| Chilean | 677 | 0.1% |
| Chinese | 7 | 0.0% |
| Chippewa | 235 | 0.0% |
| Choctaw | 302 | 0.0% |
| Colombian | 2,962 | 0.4% |
| Colville | 16 | 0.0% |
| Comanche | 24 | 0.0% |
| Costa Rican | 321 | 0.1% |
| Cree | 8 | 0.0% |
| Creek | 140 | 0.0% |
| Croatian | 1,281 | 0.2% |
| Crow | 125 | 0.0% |
| Cuban | 2,086 | 0.3% |
| Czech | 3,957 | 0.6% |
| Czechoslovakian | 333 | 0.1% |
| Danish | 3,241 | 0.5% |
| Delaware | 20 | 0.0% |
| Dominican | 1,134 | 0.2% |
| Dutch | 7,271 | 1.0% |
| Eastern European | 4,807 | 0.7% |
| Ecuadorian | 511 | 0.1% |
| Egyptian | 561 | 0.1% |
| English | 68,321 | 9.6% |
| Estonian | 131 | 0.0% |
| Ethiopian | 3,619 | 0.5% |
| European | 17,685 | 2.5% |
| Fijian | 183 | 0.0% |
| Filipino | 605 | 0.1% |
| Finnish | 1,165 | 0.2% |
| French | 15,008 | 2.1% |
| French American Indian | 27 | 0.0% |
| French Canadian | 3,100 | 0.4% |
| German | 97,178 | 13.7% |
| German Russian | 119 | 0.0% |
| Ghanaian | 804 | 0.1% |
| Greek | 3,074 | 0.4% |
| Guamanian / Chamorro | 477 | 0.1% |
| Guatemalan | 2,309 | 0.3% |
| Guyanese | 78 | 0.0% |
| Haitian | 493 | 0.1% |
| Honduran | 1,495 | 0.2% |
| Hopi | 41 | 0.0% |
| Hungarian | 2,635 | 0.4% |
| Icelander | 134 | 0.0% |
| Indian (Asian) | 7,826 | 1.1% |
| Indonesian | 411 | 0.1% |
| Inupiat | 28 | 0.0% |
| Iranian | 1,589 | 0.2% |
| Iraqi | 990 | 0.1% |
| Irish | 74,859 | 10.5% |
| Iroquois | 227 | 0.0% |
| Israeli | 323 | 0.1% |
| Italian | 37,275 | 5.2% |
| Jamaican | 693 | 0.1% |
| Japanese | 578 | 0.1% |
| Jordanian | 144 | 0.0% |
| Kenyan | 70 | 0.0% |
| Kiowa | 17 | 0.0% |
| Korean | 4,455 | 0.6% |
| Laotian | 531 | 0.1% |
| Latvian | 620 | 0.1% |
| Lebanese | 1,603 | 0.2% |
| Liberian | 87 | 0.0% |
| Lithuanian | 1,707 | 0.2% |
| Luxembourger | 131 | 0.0% |
| Macedonian | 67 | 0.0% |
| Malaysian | 238 | 0.0% |
| Maltese | 41 | 0.0% |
| Marshallese | 10 | 0.0% |
| Menominee | 23 | 0.0% |
| Mexican | 154,777 | 21.8% |
| Mexican American Indian | 1,822 | 0.3% |
| Mongolian | 111 | 0.0% |
| Moroccan | 557 | 0.1% |
| Native Hawaiian | 725 | 0.1% |
| Navajo | 1,985 | 0.3% |
| New Zealander | 40 | 0.0% |
| Nicaraguan | 433 | 0.1% |
| Nigerian | 1,158 | 0.2% |
| Northern European | 2,861 | 0.4% |
| Norwegian | 11,631 | 1.6% |
| Okinawan | 13 | 0.0% |
| Osage | 59 | 0.0% |
| Paiute | 8 | 0.0% |
| Pakistani | 677 | 0.1% |
| Palestinian | 231 | 0.0% |
| Panamanian | 299 | 0.0% |
| Paraguayan | 40 | 0.0% |
| Pennsylvania German | 79 | 0.0% |
| Peruvian | 1,388 | 0.2% |
| Pima | 8 | 0.0% |
| Polish | 19,236 | 2.7% |
| Portuguese | 1,723 | 0.2% |
| Potawatomi | 49 | 0.0% |
| Pueblo | 359 | 0.1% |
| Puerto Rican | 5,109 | 0.7% |
| Romanian | 776 | 0.1% |
| Russian | 9,108 | 1.3% |
| Salvadoran | 3,365 | 0.5% |
| Samoan | 164 | 0.0% |
| Scandinavian | 3,275 | 0.5% |
| Scotch-Irish | 5,920 | 0.8% |
| Scottish | 14,294 | 2.0% |
| Seminole | 117 | 0.0% |
| Senegalese | 421 | 0.1% |
| Serbian | 421 | 0.1% |
| Shoshone | 269 | 0.0% |
| Sierra Leonean | 27 | 0.0% |
| Sioux | 880 | 0.1% |
| Slavic | 589 | 0.1% |
| Slovak | 1,046 | 0.2% |
| Slovene | 831 | 0.1% |
| Somali | 668 | 0.1% |
| South African | 127 | 0.0% |
| South American | 8,941 | 1.3% |
| South American Indian | 148 | 0.0% |
| Soviet Union | 16 | 0.0% |
| Spaniard | 6,601 | 0.9% |
| Spanish | 6,911 | 1.0% |
| Spanish American | 795 | 0.1% |
| Spanish American Indian | 153 | 0.0% |
| Sri Lankan | 6,945 | 1.0% |
| Subsaharan African | 13,669 | 1.9% |
| Sudanese | 646 | 0.1% |
| Swedish | 11,660 | 1.6% |
| Swiss | 3,229 | 0.4% |
| Syrian | 603 | 0.1% |
| Thai | 3,947 | 0.6% |
| Tlingit-Haida | 14 | 0.0% |
| Tohono O'Odham | 19 | 0.0% |
| Trinidadian and Tobagonian | 231 | 0.0% |
| Turkish | 668 | 0.1% |
| U.S. Virgin Islander | 24 | 0.0% |
| Ugandan | 183 | 0.0% |
| Ukrainian | 2,551 | 0.4% |
| Uruguayan | 124 | 0.0% |
| Ute | 417 | 0.1% |
| Venezuelan | 1,879 | 0.3% |
| Vietnamese | 41 | 0.0% |
| Welsh | 4,676 | 0.7% |
| West Indian | 263 | 0.0% |
| Yaqui | 32 | 0.0% |
| Yugoslavian | 814 | 0.1% |
| Yup'ik | 163 | 0.0% | View All 182 Rows |
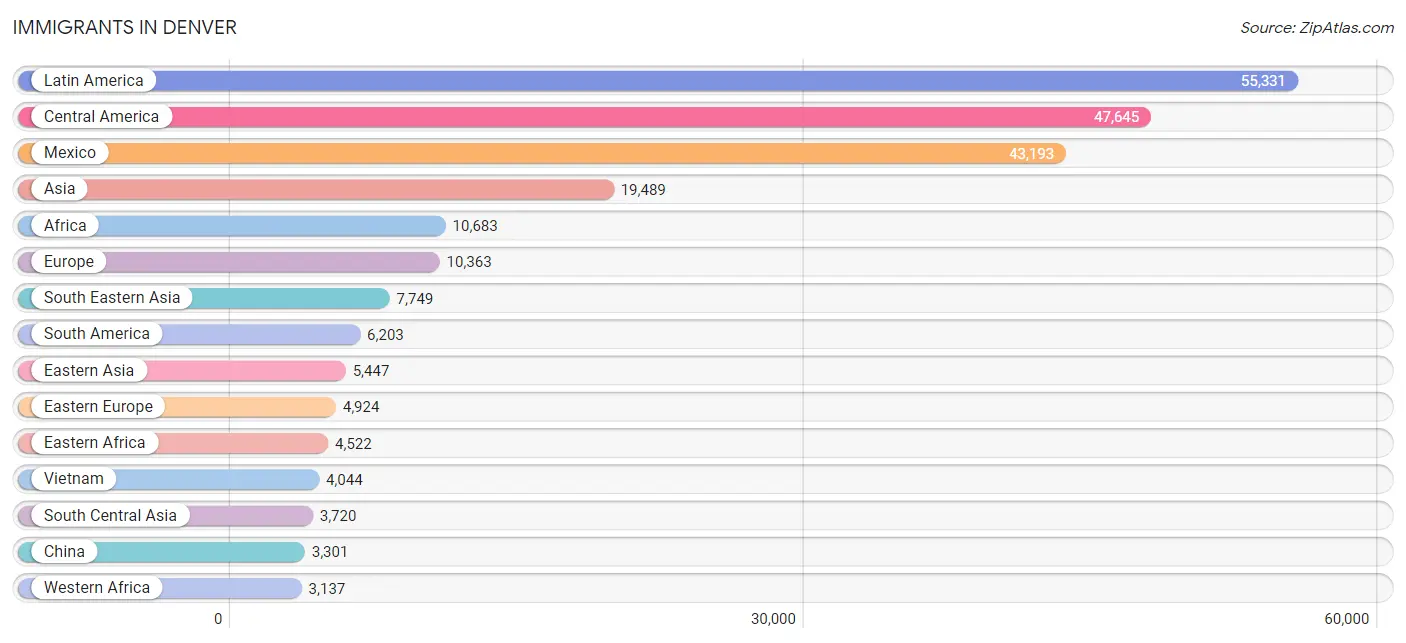
Immigrants in Denver
The most numerous immigrant groups reported in Denver came from Latin America (55,331 | 7.8%), Central America (47,645 | 6.7%), Mexico (43,193 | 6.1%), Asia (19,489 | 2.7%), and Africa (10,683 | 1.5%), together accounting for 24.8% of all Denver residents.
| Immigration Origin | # Population | % Population |
| Afghanistan | 314 | 0.0% |
| Africa | 10,683 | 1.5% |
| Albania | 21 | 0.0% |
| Argentina | 270 | 0.0% |
| Armenia | 164 | 0.0% |
| Asia | 19,489 | 2.7% |
| Australia | 486 | 0.1% |
| Austria | 126 | 0.0% |
| Bangladesh | 157 | 0.0% |
| Belarus | 213 | 0.0% |
| Belgium | 156 | 0.0% |
| Bolivia | 37 | 0.0% |
| Bosnia and Herzegovina | 433 | 0.1% |
| Brazil | 601 | 0.1% |
| Bulgaria | 168 | 0.0% |
| Cambodia | 305 | 0.0% |
| Cameroon | 247 | 0.0% |
| Canada | 2,238 | 0.3% |
| Caribbean | 1,483 | 0.2% |
| Central America | 47,645 | 6.7% |
| Chile | 380 | 0.1% |
| China | 3,301 | 0.5% |
| Colombia | 1,817 | 0.3% |
| Congo | 75 | 0.0% |
| Costa Rica | 68 | 0.0% |
| Croatia | 41 | 0.0% |
| Cuba | 140 | 0.0% |
| Czechoslovakia | 291 | 0.0% |
| Denmark | 163 | 0.0% |
| Dominican Republic | 804 | 0.1% |
| Eastern Africa | 4,522 | 0.6% |
| Eastern Asia | 5,447 | 0.8% |
| Eastern Europe | 4,924 | 0.7% |
| Ecuador | 179 | 0.0% |
| Egypt | 383 | 0.1% |
| El Salvador | 2,107 | 0.3% |
| England | 748 | 0.1% |
| Eritrea | 445 | 0.1% |
| Ethiopia | 2,761 | 0.4% |
| Europe | 10,363 | 1.5% |
| France | 302 | 0.0% |
| Germany | 1,108 | 0.2% |
| Ghana | 959 | 0.1% |
| Greece | 175 | 0.0% |
| Guatemala | 1,248 | 0.2% |
| Guyana | 60 | 0.0% |
| Haiti | 158 | 0.0% |
| Honduras | 789 | 0.1% |
| Hong Kong | 210 | 0.0% |
| Hungary | 121 | 0.0% |
| India | 1,438 | 0.2% |
| Indonesia | 573 | 0.1% |
| Iran | 544 | 0.1% |
| Iraq | 1,005 | 0.1% |
| Ireland | 163 | 0.0% |
| Israel | 224 | 0.0% |
| Italy | 496 | 0.1% |
| Jamaica | 232 | 0.0% |
| Japan | 551 | 0.1% |
| Jordan | 112 | 0.0% |
| Kazakhstan | 89 | 0.0% |
| Kenya | 170 | 0.0% |
| Korea | 1,279 | 0.2% |
| Laos | 239 | 0.0% |
| Latin America | 55,331 | 7.8% |
| Latvia | 230 | 0.0% |
| Lebanon | 126 | 0.0% |
| Liberia | 113 | 0.0% |
| Lithuania | 60 | 0.0% |
| Malaysia | 142 | 0.0% |
| Mexico | 43,193 | 6.1% |
| Micronesia | 158 | 0.0% |
| Middle Africa | 734 | 0.1% |
| Moldova | 173 | 0.0% |
| Morocco | 506 | 0.1% |
| Nepal | 527 | 0.1% |
| Netherlands | 250 | 0.0% |
| Nicaragua | 205 | 0.0% |
| Nigeria | 735 | 0.1% |
| Northern Africa | 1,801 | 0.3% |
| Northern Europe | 2,248 | 0.3% |
| Norway | 36 | 0.0% |
| Oceania | 913 | 0.1% |
| Pakistan | 301 | 0.0% |
| Panama | 32 | 0.0% |
| Peru | 816 | 0.1% |
| Philippines | 1,082 | 0.2% |
| Poland | 597 | 0.1% |
| Portugal | 59 | 0.0% |
| Romania | 265 | 0.0% |
| Russia | 1,284 | 0.2% |
| Saudi Arabia | 252 | 0.0% |
| Scotland | 101 | 0.0% |
| Senegal | 349 | 0.1% |
| Serbia | 120 | 0.0% |
| Singapore | 92 | 0.0% |
| Somalia | 340 | 0.1% |
| South Africa | 358 | 0.1% |
| South America | 6,203 | 0.9% |
| South Central Asia | 3,720 | 0.5% |
| South Eastern Asia | 7,749 | 1.1% |
| Southern Europe | 990 | 0.1% |
| Spain | 260 | 0.0% |
| Sudan | 565 | 0.1% |
| Sweden | 224 | 0.0% |
| Switzerland | 198 | 0.0% |
| Syria | 158 | 0.0% |
| Taiwan | 444 | 0.1% |
| Thailand | 705 | 0.1% |
| Trinidad and Tobago | 107 | 0.0% |
| Turkey | 340 | 0.1% |
| Uganda | 380 | 0.1% |
| Ukraine | 647 | 0.1% |
| Uruguay | 44 | 0.0% |
| Uzbekistan | 81 | 0.0% |
| Venezuela | 1,850 | 0.3% |
| Vietnam | 4,044 | 0.6% |
| West Indies | 7 | 0.0% |
| Western Africa | 3,137 | 0.4% |
| Western Asia | 2,573 | 0.4% |
| Western Europe | 2,140 | 0.3% |
| Zaire | 277 | 0.0% | View All 122 Rows |
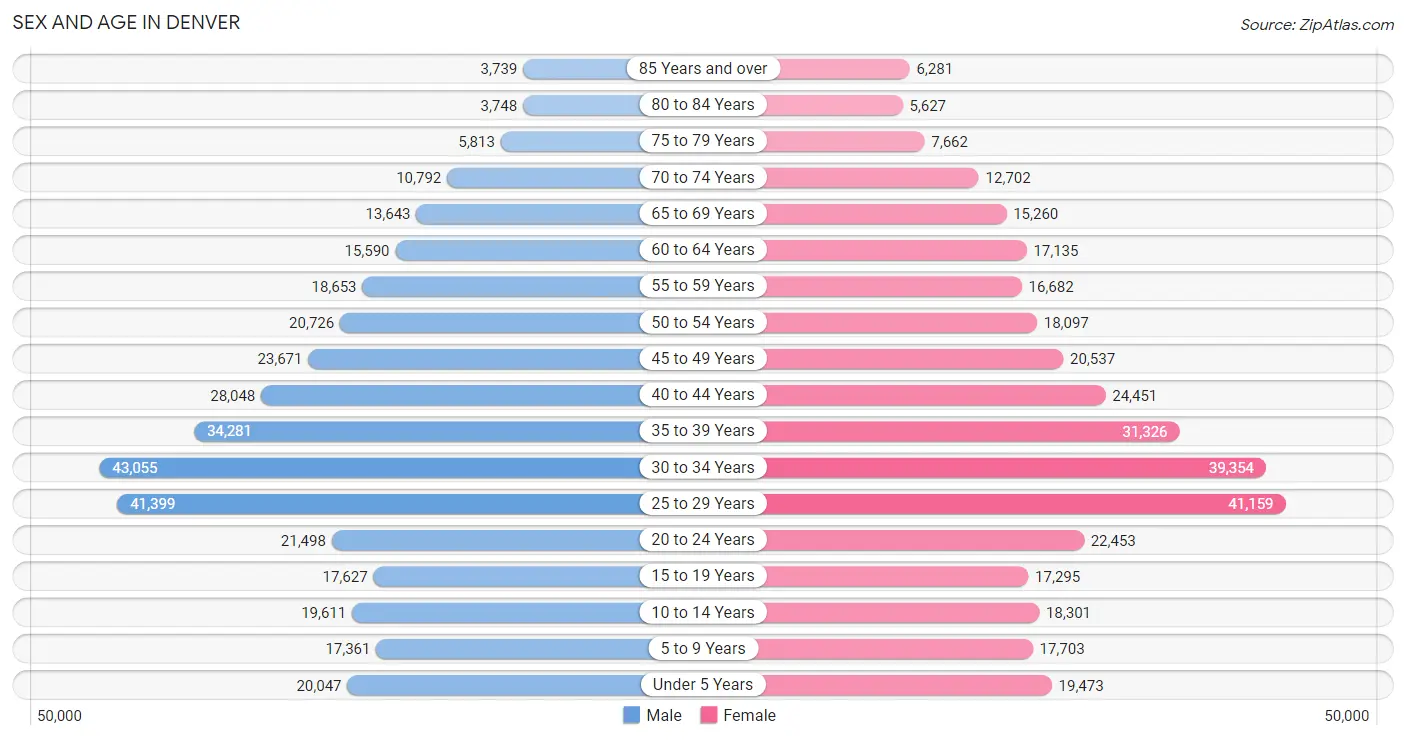
Sex and Age in Denver
Sex and Age in Denver
The most populous age groups in Denver are 30 to 34 Years (43,055 | 12.0%) for men and 25 to 29 Years (41,159 | 11.7%) for women.
| Age Bracket | Male | Female |
| Under 5 Years | 20,047 (5.6%) | 19,473 (5.5%) |
| 5 to 9 Years | 17,361 (4.8%) | 17,703 (5.0%) |
| 10 to 14 Years | 19,611 (5.5%) | 18,301 (5.2%) |
| 15 to 19 Years | 17,627 (4.9%) | 17,295 (4.9%) |
| 20 to 24 Years | 21,498 (6.0%) | 22,453 (6.4%) |
| 25 to 29 Years | 41,399 (11.5%) | 41,159 (11.7%) |
| 30 to 34 Years | 43,055 (12.0%) | 39,354 (11.2%) |
| 35 to 39 Years | 34,281 (9.5%) | 31,326 (8.9%) |
| 40 to 44 Years | 28,048 (7.8%) | 24,451 (7.0%) |
| 45 to 49 Years | 23,671 (6.6%) | 20,537 (5.8%) |
| 50 to 54 Years | 20,726 (5.8%) | 18,097 (5.1%) |
| 55 to 59 Years | 18,653 (5.2%) | 16,682 (4.8%) |
| 60 to 64 Years | 15,590 (4.3%) | 17,135 (4.9%) |
| 65 to 69 Years | 13,643 (3.8%) | 15,260 (4.3%) |
| 70 to 74 Years | 10,792 (3.0%) | 12,702 (3.6%) |
| 75 to 79 Years | 5,813 (1.6%) | 7,662 (2.2%) |
| 80 to 84 Years | 3,748 (1.0%) | 5,627 (1.6%) |
| 85 Years and over | 3,739 (1.0%) | 6,281 (1.8%) |
| Total | 359,302 (100.0%) | 351,498 (100.0%) |
Families and Households in Denver
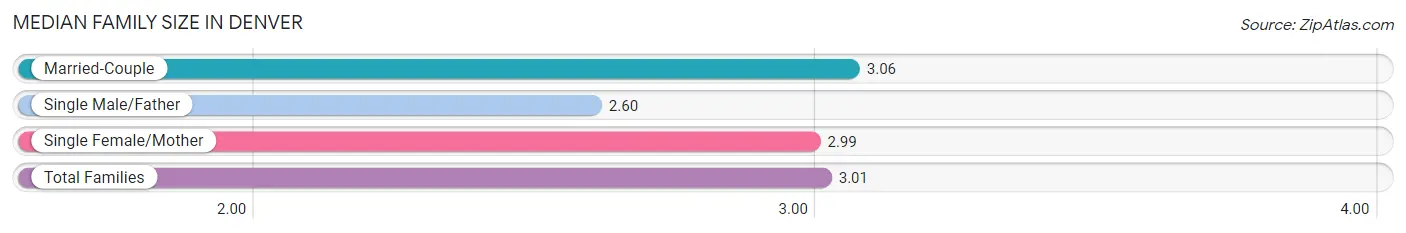
Median Family Size in Denver
The median family size in Denver is 3.01 persons per family, with married-couple families (109,481 | 72.7%) accounting for the largest median family size of 3.06 persons per family. On the other hand, single male/father families (12,785 | 8.5%) represent the smallest median family size with 2.60 persons per family.
| Family Type | # Families | Family Size |
| Married-Couple | 109,481 (72.7%) | 3.06 |
| Single Male/Father | 12,785 (8.5%) | 2.60 |
| Single Female/Mother | 28,371 (18.8%) | 2.99 |
| Total Families | 150,637 (100.0%) | 3.01 |
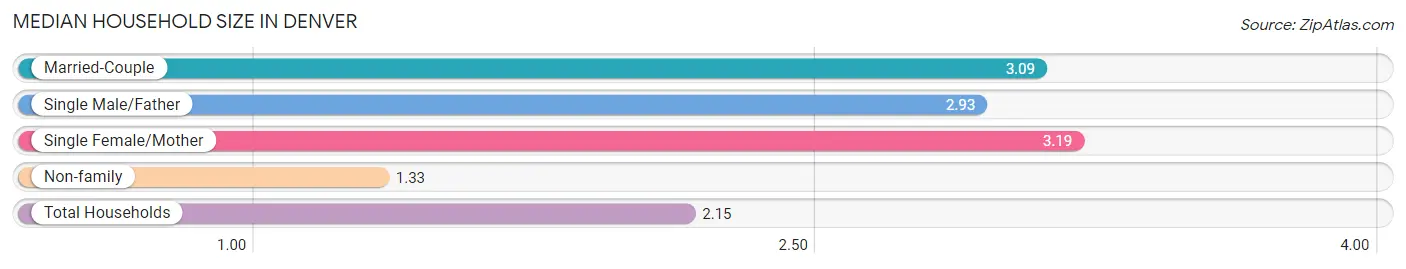
Median Household Size in Denver
The median household size in Denver is 2.15 persons per household, with single female/mother households (28,371 | 8.8%) accounting for the largest median household size of 3.19 persons per household. non-family households (172,327 | 53.4%) represent the smallest median household size with 1.33 persons per household.
| Household Type | # Households | Household Size |
| Married-Couple | 109,481 (33.9%) | 3.09 |
| Single Male/Father | 12,785 (4.0%) | 2.93 |
| Single Female/Mother | 28,371 (8.8%) | 3.19 |
| Non-family | 172,327 (53.4%) | 1.33 |
| Total Households | 322,964 (100.0%) | 2.15 |
Household Size by Marriage Status in Denver
Out of a total of 322,964 households in Denver, 150,637 (46.6%) are family households, while 172,327 (53.4%) are nonfamily households. The most numerous type of family households are 2-person households, comprising 68,612, and the most common type of nonfamily households are 1-person households, comprising 126,265.
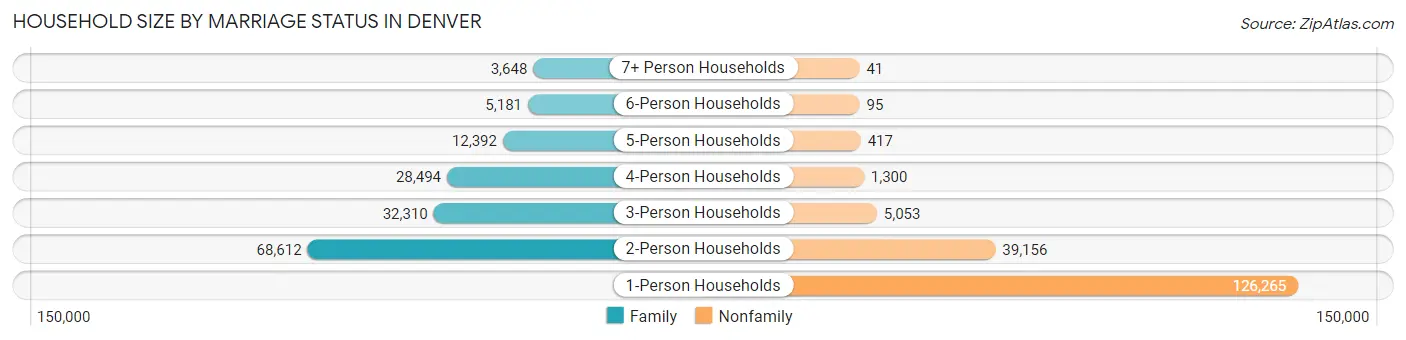
| Household Size | Family Households | Nonfamily Households |
| 1-Person Households | - | 126,265 (39.1%) |
| 2-Person Households | 68,612 (21.2%) | 39,156 (12.1%) |
| 3-Person Households | 32,310 (10.0%) | 5,053 (1.6%) |
| 4-Person Households | 28,494 (8.8%) | 1,300 (0.4%) |
| 5-Person Households | 12,392 (3.8%) | 417 (0.1%) |
| 6-Person Households | 5,181 (1.6%) | 95 (0.0%) |
| 7+ Person Households | 3,648 (1.1%) | 41 (0.0%) |
| Total | 150,637 (46.6%) | 172,327 (53.4%) |
Female Fertility in Denver
Fertility by Age in Denver
Average fertility rate in Denver is 45.0 births per 1,000 women. Women in the age bracket of 20 to 34 years have the highest fertility rate with 51.0 births per 1,000 women. Women in the age bracket of 20 to 34 years acount for 57.4% of all women with births.
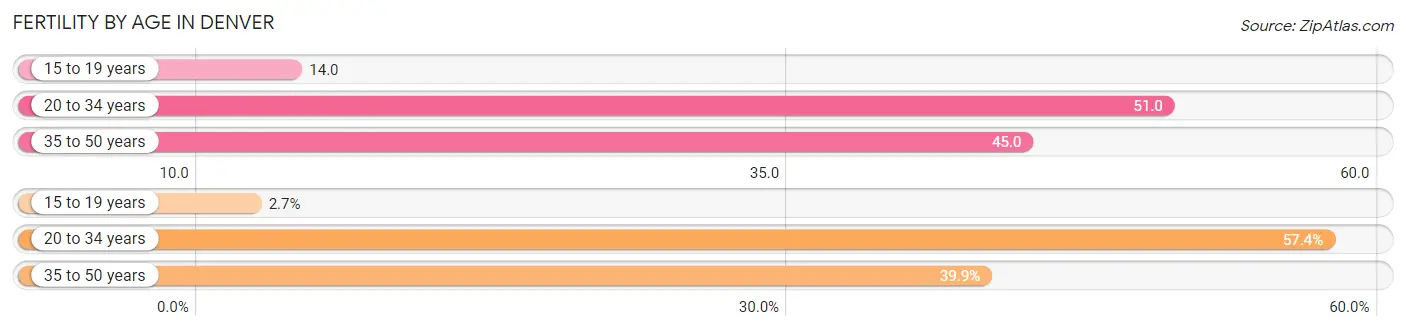
| Age Bracket | Women with Births | Births / 1,000 Women |
| 15 to 19 years | 249 (2.7%) | 14.0 |
| 20 to 34 years | 5,225 (57.4%) | 51.0 |
| 35 to 50 years | 3,635 (39.9%) | 45.0 |
| Total | 9,109 (100.0%) | 45.0 |
Fertility by Age by Marriage Status in Denver
71.8% of women with births (9,109) in Denver are married. The highest percentage of unmarried women with births falls into 15 to 19 years age bracket with 85.9% of them unmarried at the time of birth, while the lowest percentage of unmarried women with births belong to 35 to 50 years age bracket with 19.9% of them unmarried.
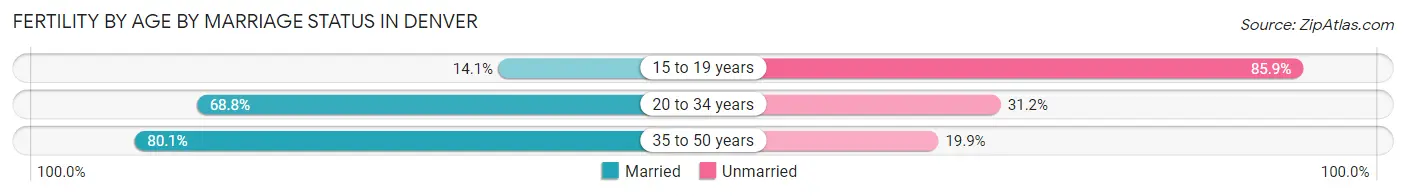
| Age Bracket | Married | Unmarried |
| 15 to 19 years | 35 (14.1%) | 214 (85.9%) |
| 20 to 34 years | 3,595 (68.8%) | 1,630 (31.2%) |
| 35 to 50 years | 2,912 (80.1%) | 723 (19.9%) |
| Total | 6,540 (71.8%) | 2,569 (28.2%) |
Fertility by Education in Denver
Average fertility rate in Denver is 45.0 births per 1,000 women. Women with the education attainment of graduate degree have the highest fertility rate of 59.0 births per 1,000 women, while women with the education attainment of bachelor's degree have the lowest fertility at 39.0 births per 1,000 women. Women with the education attainment of bachelor's degree represent 29.8% of all women with births.
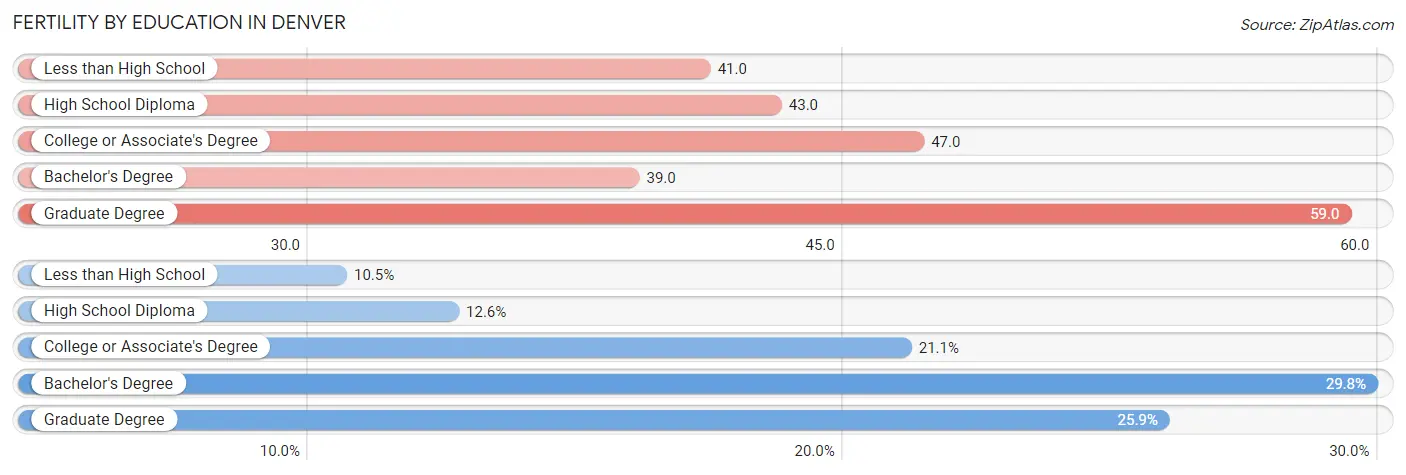
| Educational Attainment | Women with Births | Births / 1,000 Women |
| Less than High School | 958 (10.5%) | 41.0 |
| High School Diploma | 1,150 (12.6%) | 43.0 |
| College or Associate's Degree | 1,922 (21.1%) | 47.0 |
| Bachelor's Degree | 2,717 (29.8%) | 39.0 |
| Graduate Degree | 2,362 (25.9%) | 59.0 |
| Total | 9,109 (100.0%) | 45.0 |
Fertility by Education by Marriage Status in Denver
28.2% of women with births in Denver are unmarried. Women with the educational attainment of graduate degree are most likely to be married with 89.5% of them married at childbirth, while women with the educational attainment of high school diploma are least likely to be married with 61.7% of them unmarried at childbirth.
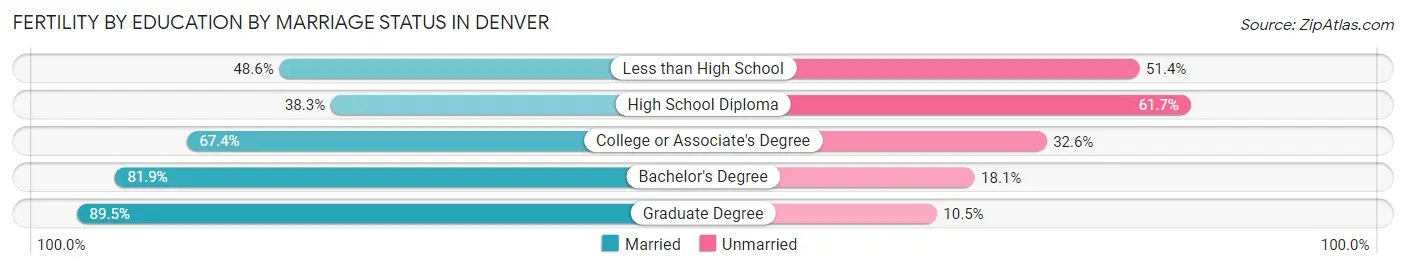
| Educational Attainment | Married | Unmarried |
| Less than High School | 466 (48.6%) | 492 (51.4%) |
| High School Diploma | 440 (38.3%) | 710 (61.7%) |
| College or Associate's Degree | 1,295 (67.4%) | 627 (32.6%) |
| Bachelor's Degree | 2,225 (81.9%) | 492 (18.1%) |
| Graduate Degree | 2,114 (89.5%) | 248 (10.5%) |
| Total | 6,540 (71.8%) | 2,569 (28.2%) |
Employment Characteristics in Denver
Employment by Class of Employer in Denver
Among the 409,324 employed individuals in Denver, private company employees (280,727 | 68.6%), not-for-profit organizations (40,191 | 9.8%), and local government employees (21,412 | 5.2%) make up the most common classes of employment.
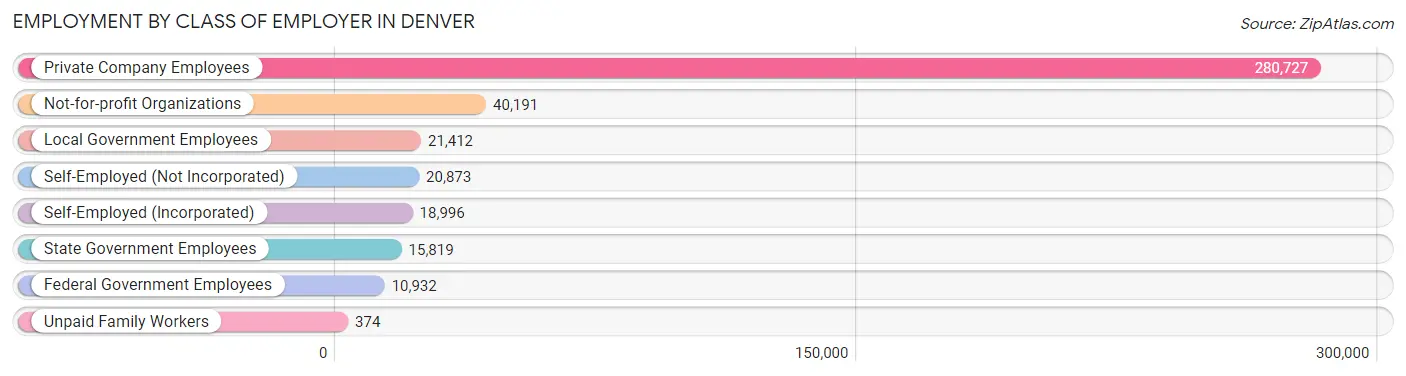
| Employer Class | # Employees | % Employees |
| Private Company Employees | 280,727 | 68.6% |
| Self-Employed (Incorporated) | 18,996 | 4.6% |
| Self-Employed (Not Incorporated) | 20,873 | 5.1% |
| Not-for-profit Organizations | 40,191 | 9.8% |
| Local Government Employees | 21,412 | 5.2% |
| State Government Employees | 15,819 | 3.9% |
| Federal Government Employees | 10,932 | 2.7% |
| Unpaid Family Workers | 374 | 0.1% |
| Total | 409,324 | 100.0% |
Employment Status by Age in Denver
According to the labor force statistics for Denver, out of the total population over 16 years of age (591,639), 74.0% or 437,813 individuals are in the labor force, with 4.7% or 20,577 of them unemployed. The age group with the highest labor force participation rate is 25 to 29 years, with 91.3% or 75,375 individuals in the labor force. Within the labor force, the 16 to 19 years age range has the highest percentage of unemployed individuals, with 14.7% or 1,819 of them being unemployed.
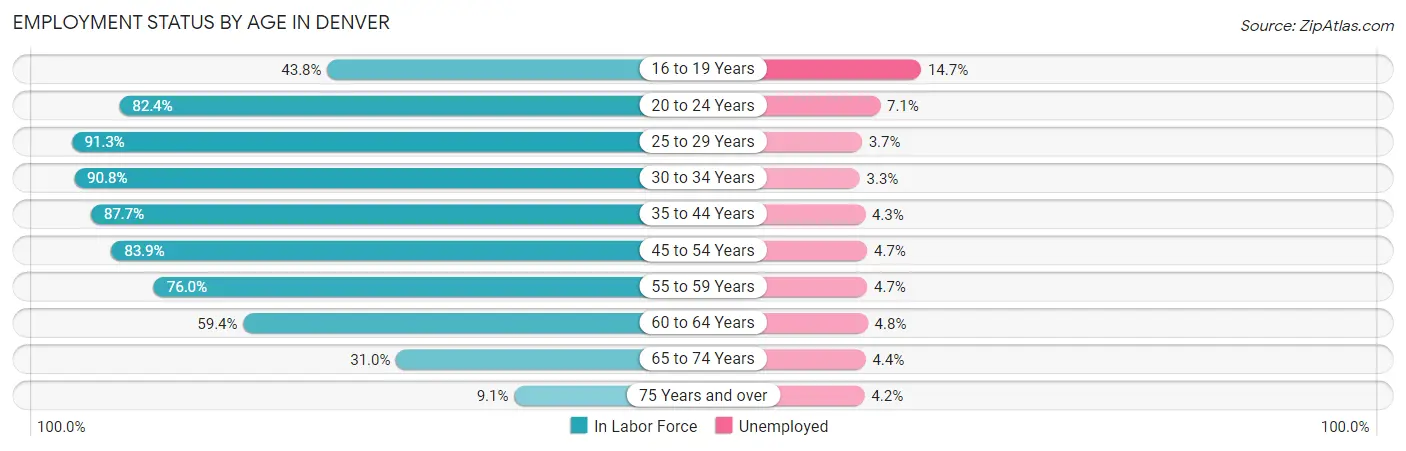
| Age Bracket | In Labor Force | Unemployed |
| 16 to 19 Years | 12,377 (43.8%) | 1,819 (14.7%) |
| 20 to 24 Years | 36,216 (82.4%) | 2,571 (7.1%) |
| 25 to 29 Years | 75,375 (91.3%) | 2,789 (3.7%) |
| 30 to 34 Years | 74,827 (90.8%) | 2,469 (3.3%) |
| 35 to 44 Years | 103,579 (87.7%) | 4,454 (4.3%) |
| 45 to 54 Years | 69,663 (83.9%) | 3,274 (4.7%) |
| 55 to 59 Years | 26,855 (76.0%) | 1,262 (4.7%) |
| 60 to 64 Years | 19,439 (59.4%) | 933 (4.8%) |
| 65 to 74 Years | 16,243 (31.0%) | 715 (4.4%) |
| 75 Years and over | 2,991 (9.1%) | 126 (4.2%) |
| Total | 437,813 (74.0%) | 20,577 (4.7%) |
Employment Status by Educational Attainment in Denver
According to labor force statistics for Denver, 85.2% of individuals (369,908) out of the total population between 25 and 64 years of age (434,164) are in the labor force, with 4.1% or 15,166 of them being unemployed. The group with the highest labor force participation rate are those with the educational attainment of bachelor's degree or higher, with 92.1% or 223,829 individuals in the labor force. Within the labor force, individuals with high school diploma education have the highest percentage of unemployment, with 7.1% or 3,334 of them being unemployed.
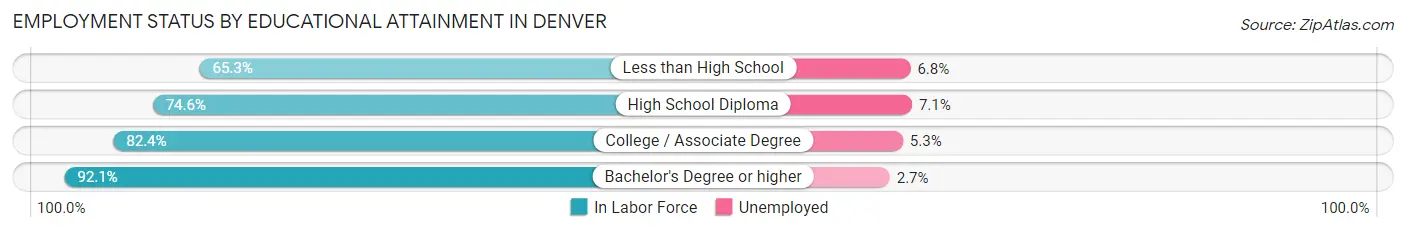
| Educational Attainment | In Labor Force | Unemployed |
| Less than High School | 25,697 (65.3%) | 2,676 (6.8%) |
| High School Diploma | 46,963 (74.6%) | 4,470 (7.1%) |
| College / Associate Degree | 73,197 (82.4%) | 4,708 (5.3%) |
| Bachelor's Degree or higher | 223,829 (92.1%) | 6,562 (2.7%) |
| Total | 369,908 (85.2%) | 17,801 (4.1%) |
Employment Occupations by Sex in Denver
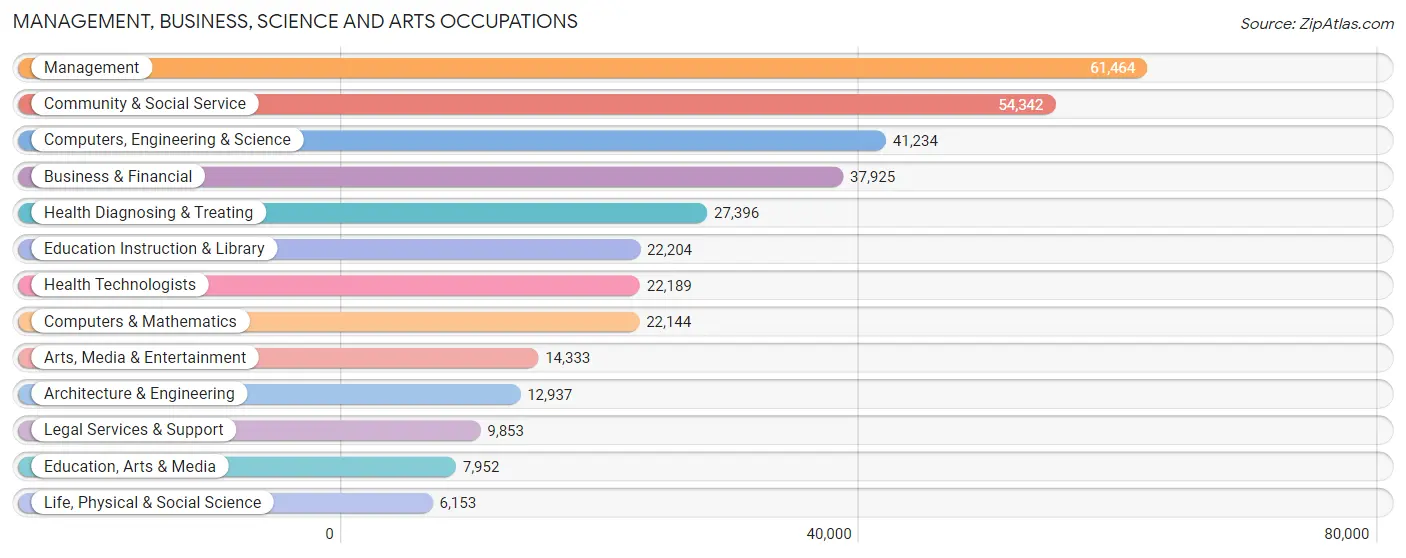
Management, Business, Science and Arts Occupations
The most common Management, Business, Science and Arts occupations in Denver are Management (61,464 | 14.8%), Community & Social Service (54,342 | 13.1%), Computers, Engineering & Science (41,234 | 9.9%), Business & Financial (37,925 | 9.1%), and Health Diagnosing & Treating (27,396 | 6.6%).
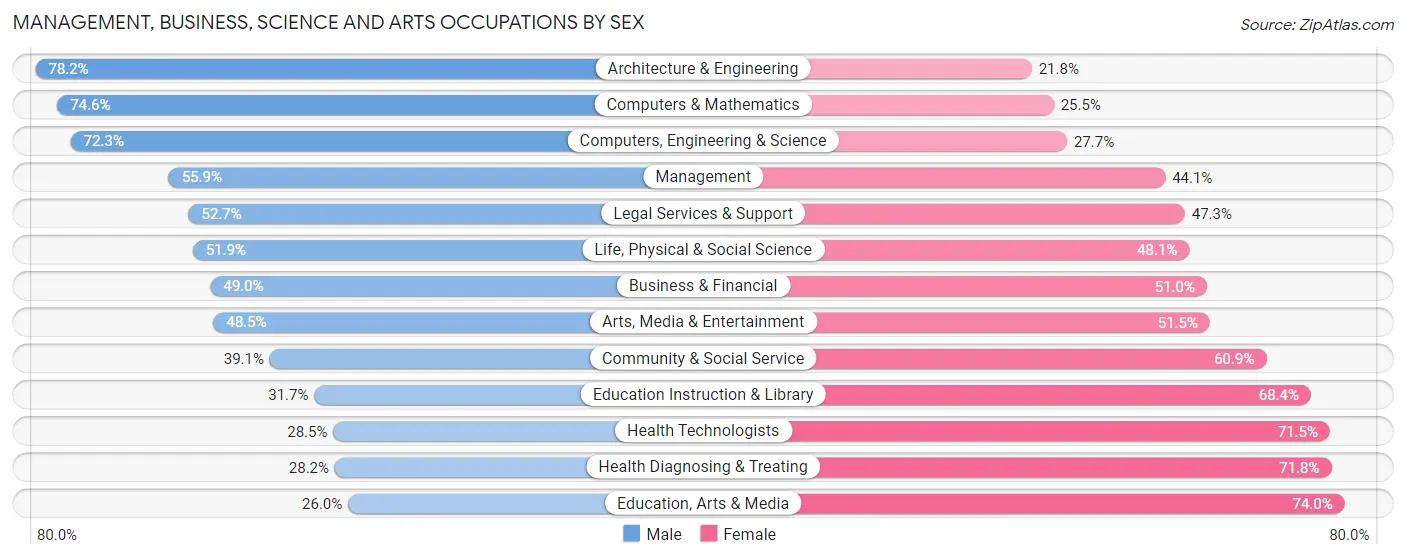
Management, Business, Science and Arts Occupations by Sex
Within the Management, Business, Science and Arts occupations in Denver, the most male-oriented occupations are Architecture & Engineering (78.2%), Computers & Mathematics (74.6%), and Computers, Engineering & Science (72.3%), while the most female-oriented occupations are Education, Arts & Media (74.0%), Health Diagnosing & Treating (71.8%), and Health Technologists (71.5%).
| Occupation | Male | Female |
| Management | 34,382 (55.9%) | 27,082 (44.1%) |
| Business & Financial | 18,582 (49.0%) | 19,343 (51.0%) |
| Computers, Engineering & Science | 29,823 (72.3%) | 11,411 (27.7%) |
| Computers & Mathematics | 16,509 (74.6%) | 5,635 (25.5%) |
| Architecture & Engineering | 10,118 (78.2%) | 2,819 (21.8%) |
| Life, Physical & Social Science | 3,196 (51.9%) | 2,957 (48.1%) |
| Community & Social Service | 21,236 (39.1%) | 33,106 (60.9%) |
| Education, Arts & Media | 2,068 (26.0%) | 5,884 (74.0%) |
| Legal Services & Support | 5,189 (52.7%) | 4,664 (47.3%) |
| Education Instruction & Library | 7,027 (31.7%) | 15,177 (68.3%) |
| Arts, Media & Entertainment | 6,952 (48.5%) | 7,381 (51.5%) |
| Health Diagnosing & Treating | 7,730 (28.2%) | 19,666 (71.8%) |
| Health Technologists | 6,319 (28.5%) | 15,870 (71.5%) |
| Total (Category) | 111,753 (50.3%) | 110,608 (49.7%) |
| Total (Overall) | 223,192 (53.6%) | 193,079 (46.4%) |
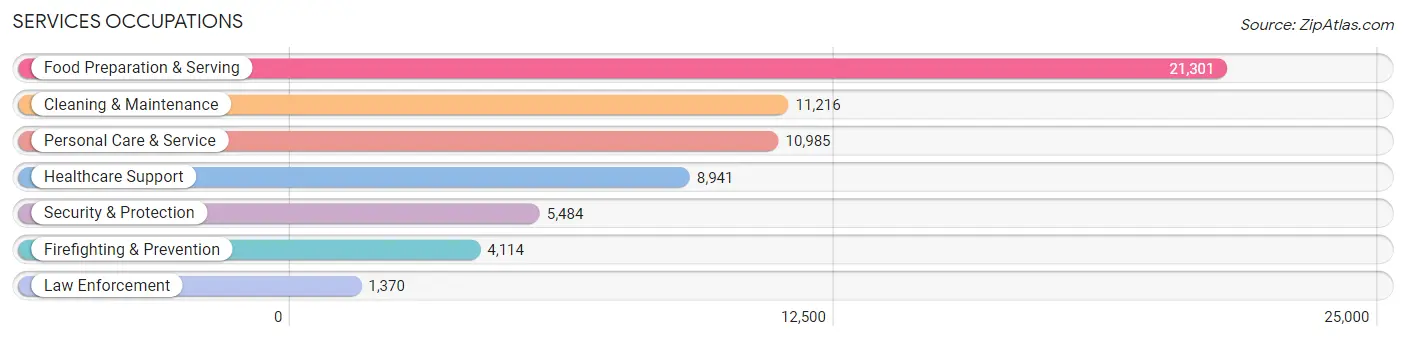
Services Occupations
The most common Services occupations in Denver are Food Preparation & Serving (21,301 | 5.1%), Cleaning & Maintenance (11,216 | 2.7%), Personal Care & Service (10,985 | 2.6%), Healthcare Support (8,941 | 2.1%), and Security & Protection (5,484 | 1.3%).
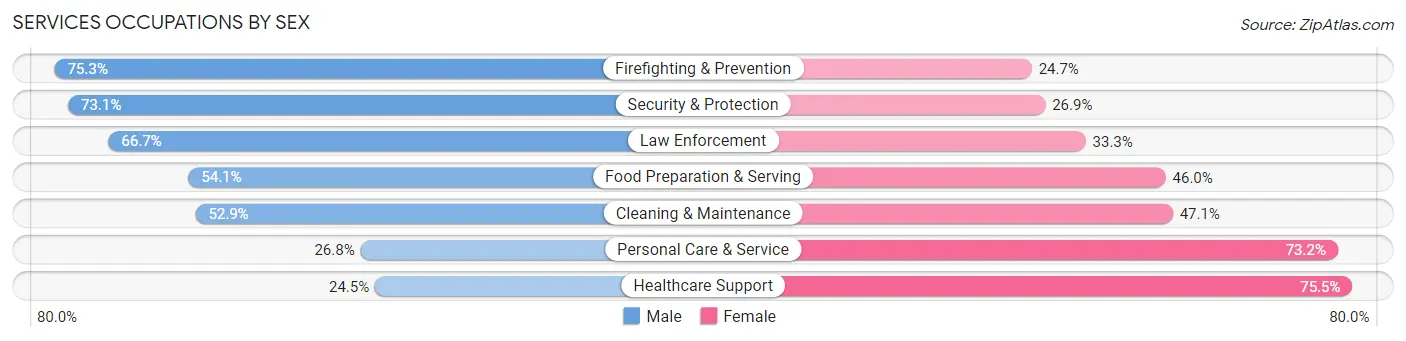
Services Occupations by Sex
Within the Services occupations in Denver, the most male-oriented occupations are Firefighting & Prevention (75.3%), Security & Protection (73.1%), and Law Enforcement (66.7%), while the most female-oriented occupations are Healthcare Support (75.5%), Personal Care & Service (73.2%), and Cleaning & Maintenance (47.1%).
| Occupation | Male | Female |
| Healthcare Support | 2,189 (24.5%) | 6,752 (75.5%) |
| Security & Protection | 4,010 (73.1%) | 1,474 (26.9%) |
| Firefighting & Prevention | 3,096 (75.3%) | 1,018 (24.7%) |
| Law Enforcement | 914 (66.7%) | 456 (33.3%) |
| Food Preparation & Serving | 11,514 (54.0%) | 9,787 (46.0%) |
| Cleaning & Maintenance | 5,937 (52.9%) | 5,279 (47.1%) |
| Personal Care & Service | 2,943 (26.8%) | 8,042 (73.2%) |
| Total (Category) | 26,593 (45.9%) | 31,334 (54.1%) |
| Total (Overall) | 223,192 (53.6%) | 193,079 (46.4%) |
Sales and Office Occupations
The most common Sales and Office occupations in Denver are Sales & Related (39,865 | 9.6%), and Office & Administration (35,919 | 8.6%).

Sales and Office Occupations by Sex
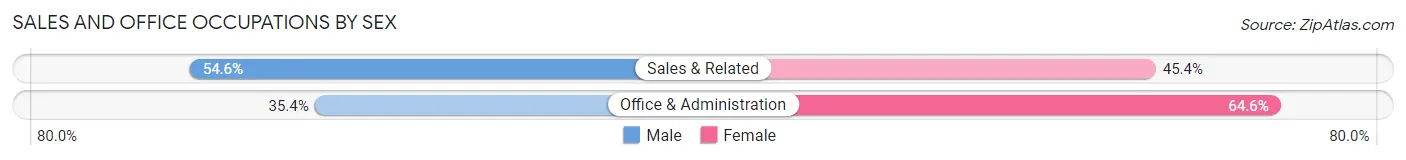
| Occupation | Male | Female |
| Sales & Related | 21,760 (54.6%) | 18,105 (45.4%) |
| Office & Administration | 12,709 (35.4%) | 23,210 (64.6%) |
| Total (Category) | 34,469 (45.5%) | 41,315 (54.5%) |
| Total (Overall) | 223,192 (53.6%) | 193,079 (46.4%) |
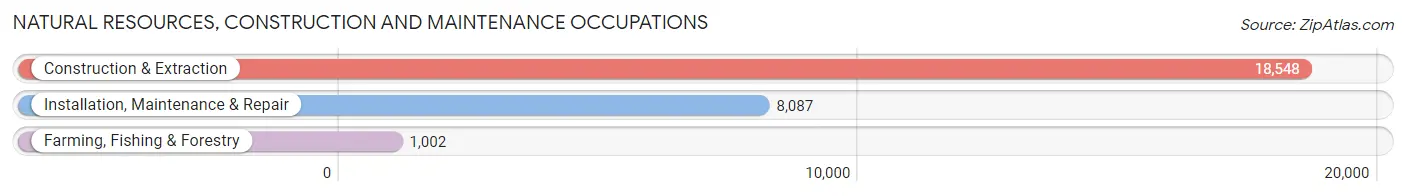
Natural Resources, Construction and Maintenance Occupations
The most common Natural Resources, Construction and Maintenance occupations in Denver are Construction & Extraction (18,548 | 4.5%), Installation, Maintenance & Repair (8,087 | 1.9%), and Farming, Fishing & Forestry (1,002 | 0.2%).
Natural Resources, Construction and Maintenance Occupations by Sex
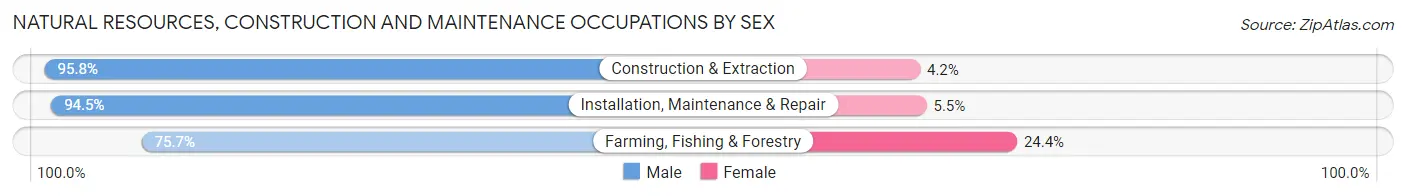
| Occupation | Male | Female |
| Farming, Fishing & Forestry | 758 (75.6%) | 244 (24.3%) |
| Construction & Extraction | 17,772 (95.8%) | 776 (4.2%) |
| Installation, Maintenance & Repair | 7,639 (94.5%) | 448 (5.5%) |
| Total (Category) | 26,169 (94.7%) | 1,468 (5.3%) |
| Total (Overall) | 223,192 (53.6%) | 193,079 (46.4%) |
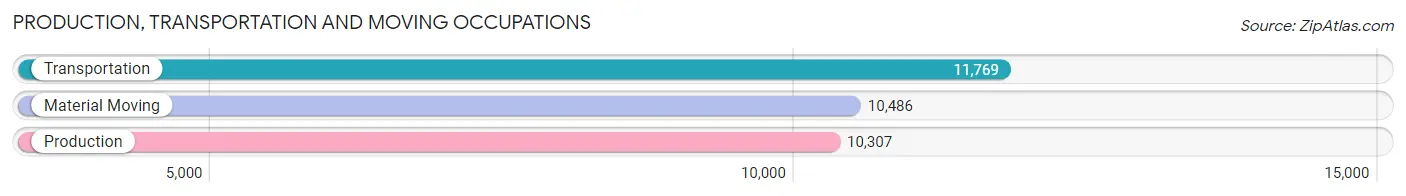
Production, Transportation and Moving Occupations
The most common Production, Transportation and Moving occupations in Denver are Transportation (11,769 | 2.8%), Material Moving (10,486 | 2.5%), and Production (10,307 | 2.5%).
Production, Transportation and Moving Occupations by Sex
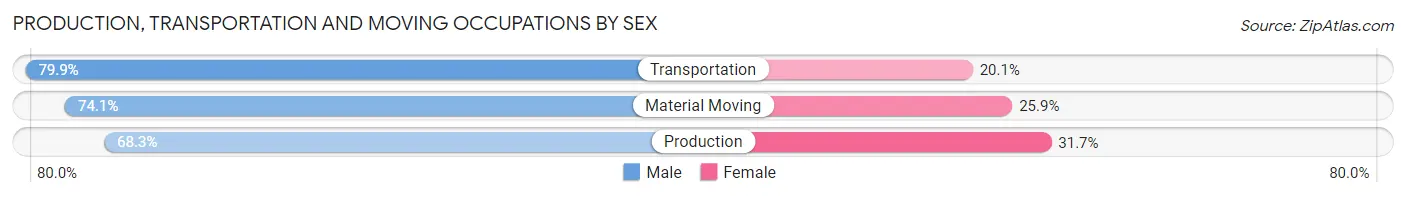
| Occupation | Male | Female |
| Production | 7,042 (68.3%) | 3,265 (31.7%) |
| Transportation | 9,400 (79.9%) | 2,369 (20.1%) |
| Material Moving | 7,766 (74.1%) | 2,720 (25.9%) |
| Total (Category) | 24,208 (74.3%) | 8,354 (25.7%) |
| Total (Overall) | 223,192 (53.6%) | 193,079 (46.4%) |
Employment Industries by Sex in Denver
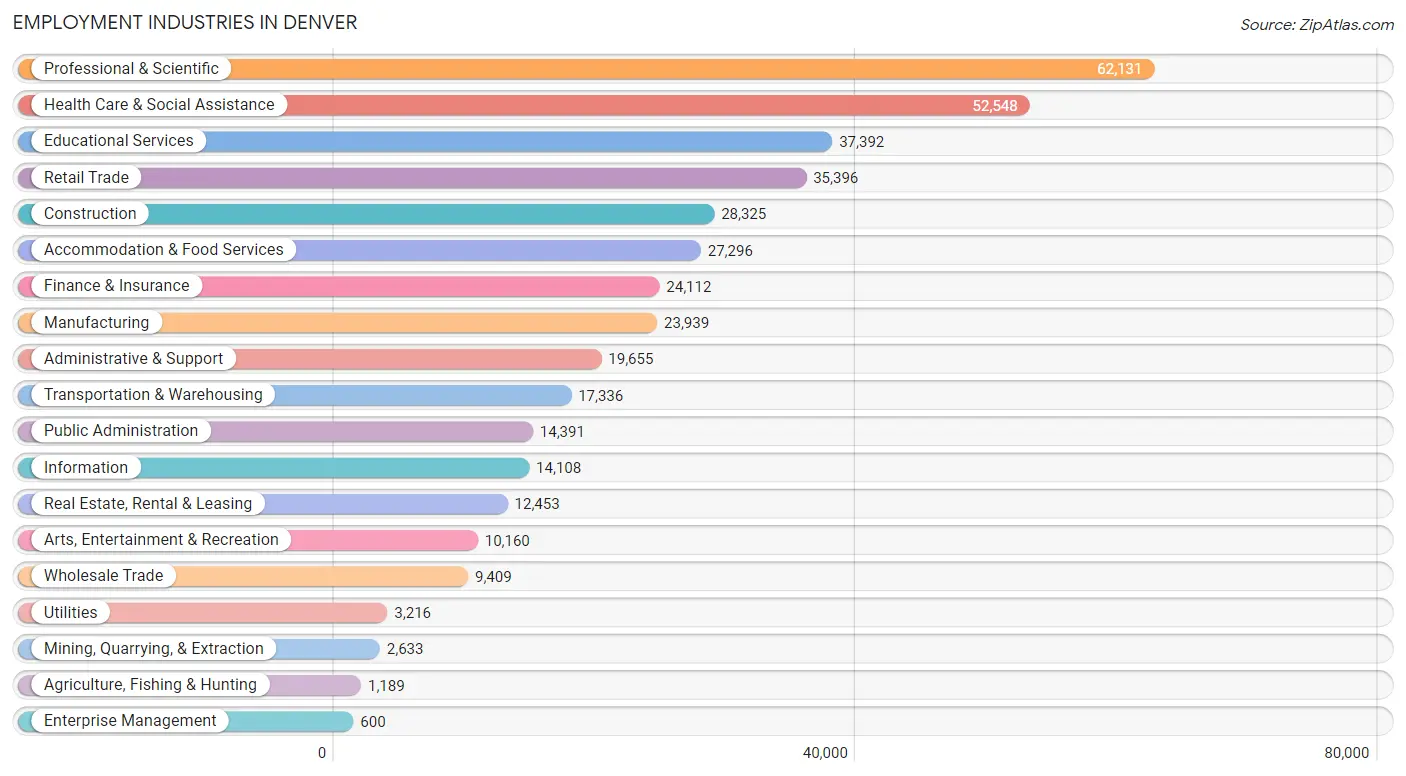
Employment Industries in Denver
The major employment industries in Denver include Professional & Scientific (62,131 | 14.9%), Health Care & Social Assistance (52,548 | 12.6%), Educational Services (37,392 | 9.0%), Retail Trade (35,396 | 8.5%), and Construction (28,325 | 6.8%).
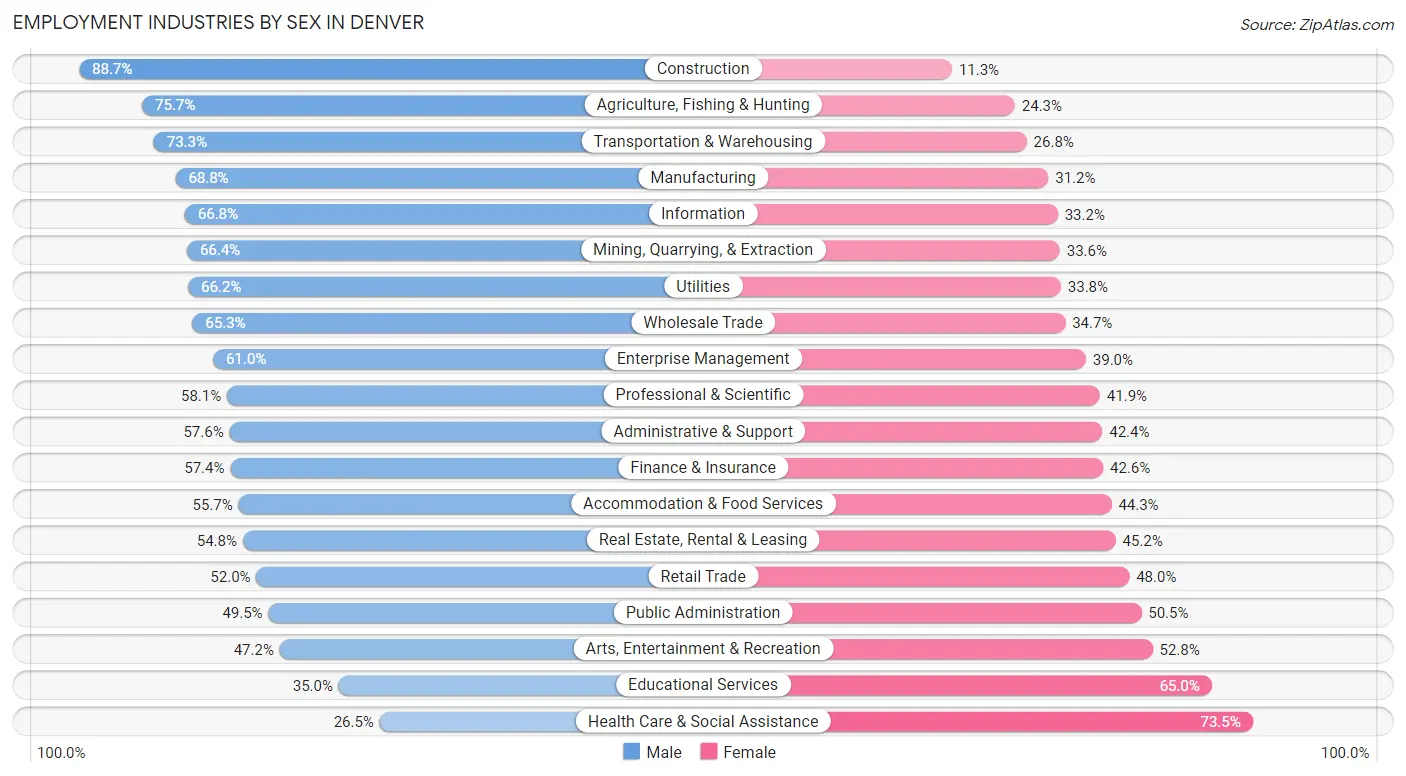
Employment Industries by Sex in Denver
The Denver industries that see more men than women are Construction (88.7%), Agriculture, Fishing & Hunting (75.7%), and Transportation & Warehousing (73.3%), whereas the industries that tend to have a higher number of women are Health Care & Social Assistance (73.5%), Educational Services (65.0%), and Arts, Entertainment & Recreation (52.8%).
| Industry | Male | Female |
| Agriculture, Fishing & Hunting | 900 (75.7%) | 289 (24.3%) |
| Mining, Quarrying, & Extraction | 1,748 (66.4%) | 885 (33.6%) |
| Construction | 25,127 (88.7%) | 3,198 (11.3%) |
| Manufacturing | 16,463 (68.8%) | 7,476 (31.2%) |
| Wholesale Trade | 6,141 (65.3%) | 3,268 (34.7%) |
| Retail Trade | 18,412 (52.0%) | 16,984 (48.0%) |
| Transportation & Warehousing | 12,699 (73.3%) | 4,637 (26.8%) |
| Utilities | 2,128 (66.2%) | 1,088 (33.8%) |
| Information | 9,427 (66.8%) | 4,681 (33.2%) |
| Finance & Insurance | 13,845 (57.4%) | 10,267 (42.6%) |
| Real Estate, Rental & Leasing | 6,829 (54.8%) | 5,624 (45.2%) |
| Professional & Scientific | 36,095 (58.1%) | 26,036 (41.9%) |
| Enterprise Management | 366 (61.0%) | 234 (39.0%) |
| Administrative & Support | 11,319 (57.6%) | 8,336 (42.4%) |
| Educational Services | 13,072 (35.0%) | 24,320 (65.0%) |
| Health Care & Social Assistance | 13,925 (26.5%) | 38,623 (73.5%) |
| Arts, Entertainment & Recreation | 4,794 (47.2%) | 5,366 (52.8%) |
| Accommodation & Food Services | 15,205 (55.7%) | 12,091 (44.3%) |
| Public Administration | 7,128 (49.5%) | 7,263 (50.5%) |
| Total | 223,192 (53.6%) | 193,079 (46.4%) |
Education in Denver
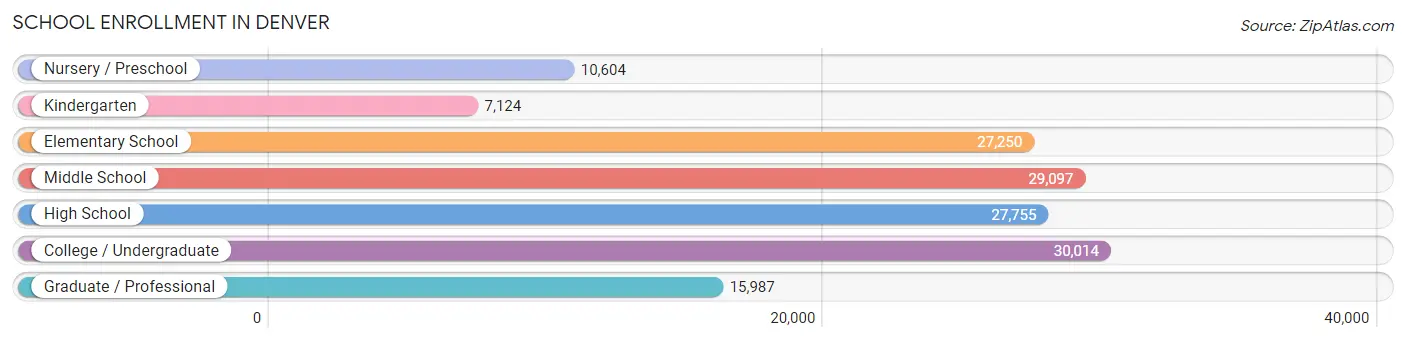
School Enrollment in Denver
The most common levels of schooling among the 147,831 students in Denver are college / undergraduate (30,014 | 20.3%), middle school (29,097 | 19.7%), and high school (27,755 | 18.8%).
| School Level | # Students | % Students |
| Nursery / Preschool | 10,604 | 7.2% |
| Kindergarten | 7,124 | 4.8% |
| Elementary School | 27,250 | 18.4% |
| Middle School | 29,097 | 19.7% |
| High School | 27,755 | 18.8% |
| College / Undergraduate | 30,014 | 20.3% |
| Graduate / Professional | 15,987 | 10.8% |
| Total | 147,831 | 100.0% |
School Enrollment by Age by Funding Source in Denver
Out of a total of 147,831 students who are enrolled in schools in Denver, 27,792 (18.8%) attend a private institution, while the remaining 120,039 (81.2%) are enrolled in public schools. The age group of 3 to 4 year olds has the highest likelihood of being enrolled in private schools, with 3,867 (45.1% in the age bracket) enrolled. Conversely, the age group of 15 to 17 year olds has the lowest likelihood of being enrolled in a private school, with 17,965 (91.4% in the age bracket) attending a public institution.
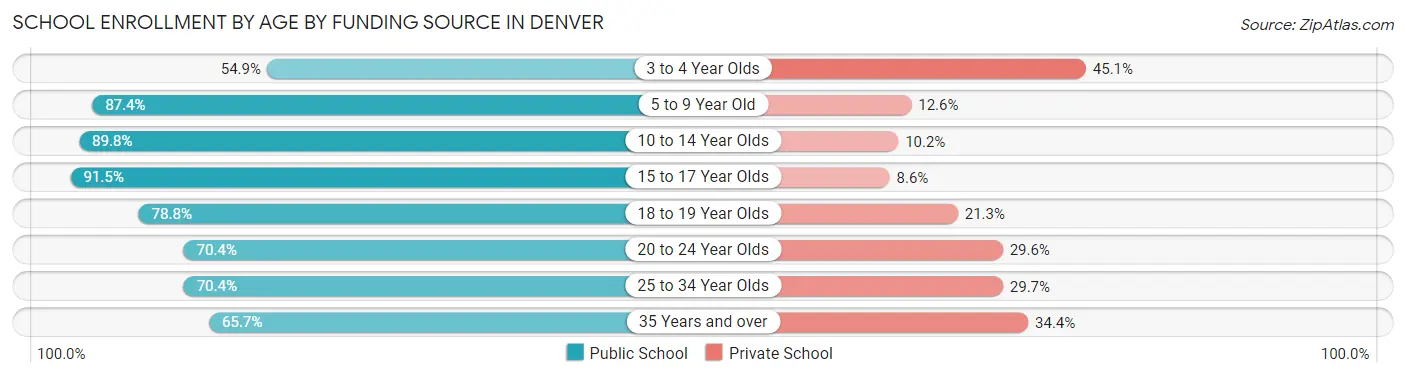
| Age Bracket | Public School | Private School |
| 3 to 4 Year Olds | 4,705 (54.9%) | 3,867 (45.1%) |
| 5 to 9 Year Old | 28,637 (87.4%) | 4,127 (12.6%) |
| 10 to 14 Year Olds | 33,010 (89.8%) | 3,733 (10.2%) |
| 15 to 17 Year Olds | 17,965 (91.4%) | 1,679 (8.6%) |
| 18 to 19 Year Olds | 7,751 (78.7%) | 2,091 (21.2%) |
| 20 to 24 Year Olds | 10,025 (70.4%) | 4,219 (29.6%) |
| 25 to 34 Year Olds | 11,938 (70.4%) | 5,032 (29.6%) |
| 35 Years and over | 5,943 (65.6%) | 3,109 (34.4%) |
| Total | 120,039 (81.2%) | 27,792 (18.8%) |
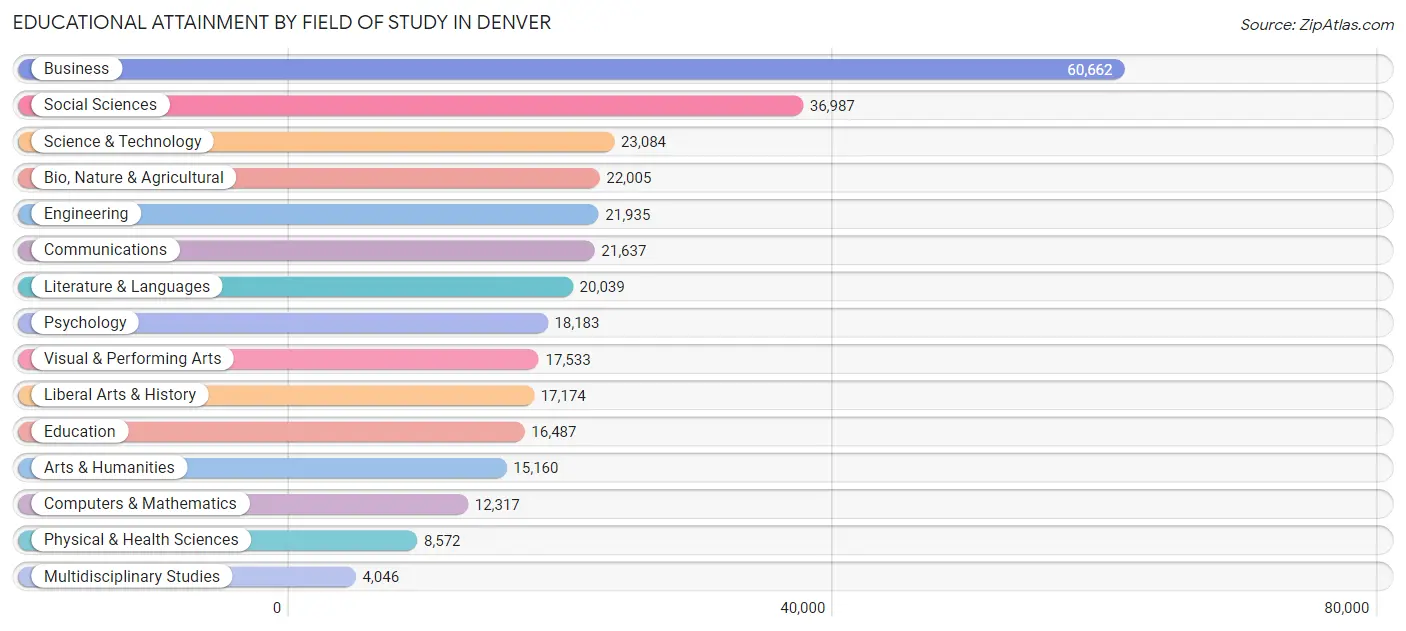
Educational Attainment by Field of Study in Denver
Business (60,662 | 19.2%), social sciences (36,987 | 11.7%), science & technology (23,084 | 7.3%), bio, nature & agricultural (22,005 | 7.0%), and engineering (21,935 | 7.0%) are the most common fields of study among 315,821 individuals in Denver who have obtained a bachelor's degree or higher.
| Field of Study | # Graduates | % Graduates |
| Computers & Mathematics | 12,317 | 3.9% |
| Bio, Nature & Agricultural | 22,005 | 7.0% |
| Physical & Health Sciences | 8,572 | 2.7% |
| Psychology | 18,183 | 5.8% |
| Social Sciences | 36,987 | 11.7% |
| Engineering | 21,935 | 7.0% |
| Multidisciplinary Studies | 4,046 | 1.3% |
| Science & Technology | 23,084 | 7.3% |
| Business | 60,662 | 19.2% |
| Education | 16,487 | 5.2% |
| Literature & Languages | 20,039 | 6.4% |
| Liberal Arts & History | 17,174 | 5.4% |
| Visual & Performing Arts | 17,533 | 5.6% |
| Communications | 21,637 | 6.9% |
| Arts & Humanities | 15,160 | 4.8% |
| Total | 315,821 | 100.0% |
Transportation & Commute in Denver
Vehicle Availability by Sex in Denver
The most prevalent vehicle ownership categories in Denver are males with 2 vehicles (90,463, accounting for 41.3%) and females with 2 vehicles (77,178, making up 48.4%).
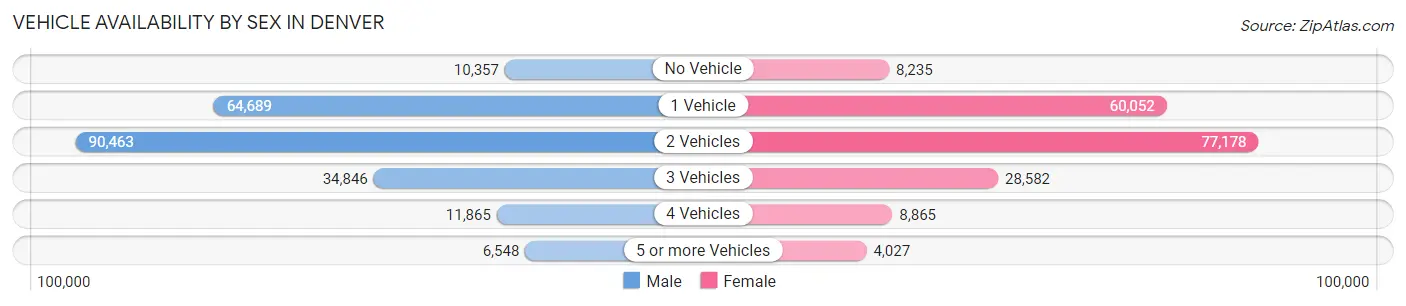
| Vehicles Available | Male | Female |
| No Vehicle | 10,357 (4.7%) | 8,235 (4.4%) |
| 1 Vehicle | 64,689 (29.6%) | 60,052 (32.1%) |
| 2 Vehicles | 90,463 (41.3%) | 77,178 (41.3%) |
| 3 Vehicles | 34,846 (15.9%) | 28,582 (15.3%) |
| 4 Vehicles | 11,865 (5.4%) | 8,865 (4.7%) |
| 5 or more Vehicles | 6,548 (3.0%) | 4,027 (2.1%) |
| Total | 218,768 (100.0%) | 186,939 (100.0%) |
Commute Time in Denver
The most frequently occuring commute durations in Denver are 30 to 34 minutes (59,107 commuters, 18.3%), 20 to 24 minutes (54,818 commuters, 16.9%), and 15 to 19 minutes (53,453 commuters, 16.5%).
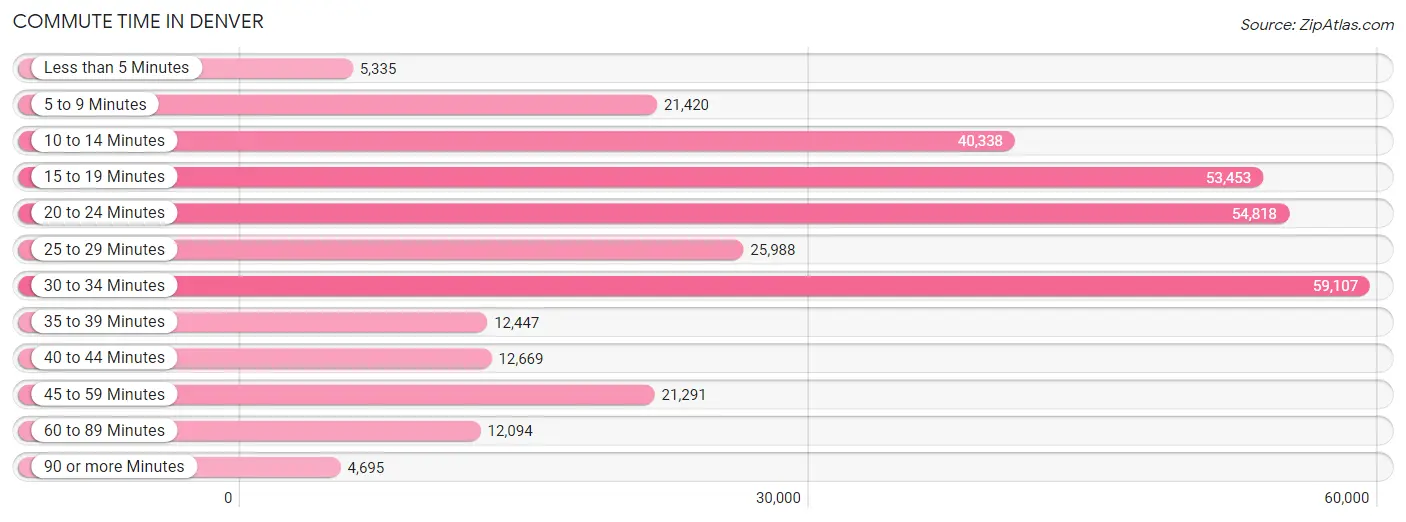
| Commute Time | # Commuters | % Commuters |
| Less than 5 Minutes | 5,335 | 1.7% |
| 5 to 9 Minutes | 21,420 | 6.6% |
| 10 to 14 Minutes | 40,338 | 12.5% |
| 15 to 19 Minutes | 53,453 | 16.5% |
| 20 to 24 Minutes | 54,818 | 16.9% |
| 25 to 29 Minutes | 25,988 | 8.0% |
| 30 to 34 Minutes | 59,107 | 18.3% |
| 35 to 39 Minutes | 12,447 | 3.8% |
| 40 to 44 Minutes | 12,669 | 3.9% |
| 45 to 59 Minutes | 21,291 | 6.6% |
| 60 to 89 Minutes | 12,094 | 3.7% |
| 90 or more Minutes | 4,695 | 1.5% |
Commute Time by Sex in Denver
The most common commute times in Denver are 30 to 34 minutes (33,629 commuters, 19.1%) for males and 30 to 34 minutes (25,478 commuters, 17.3%) for females.
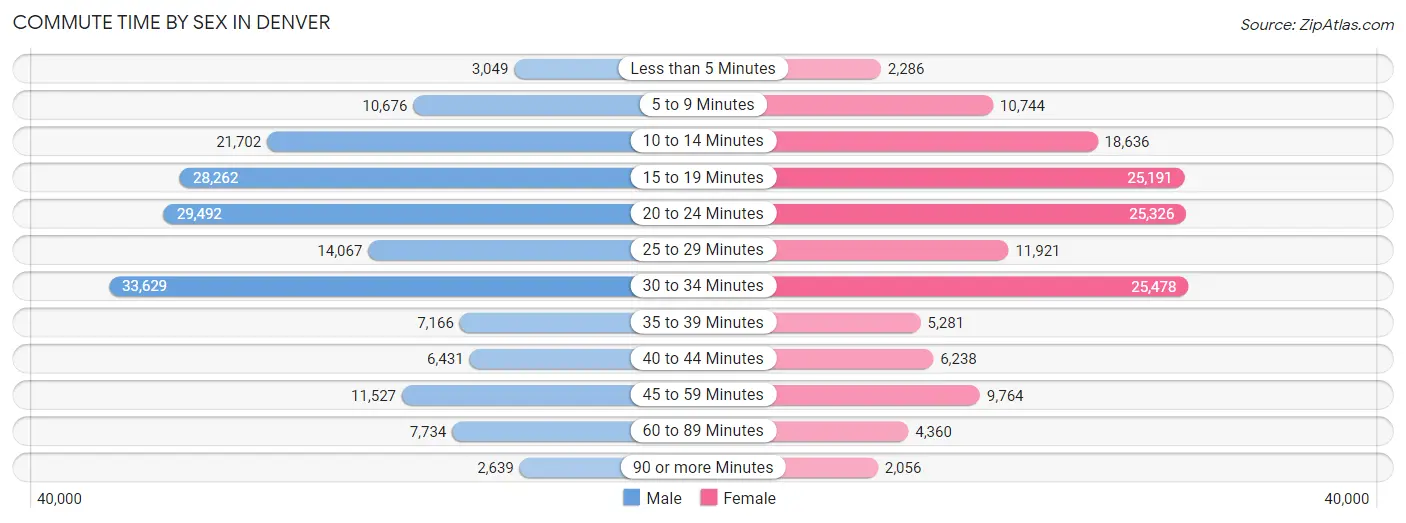
| Commute Time | Male | Female |
| Less than 5 Minutes | 3,049 (1.7%) | 2,286 (1.5%) |
| 5 to 9 Minutes | 10,676 (6.0%) | 10,744 (7.3%) |
| 10 to 14 Minutes | 21,702 (12.3%) | 18,636 (12.7%) |
| 15 to 19 Minutes | 28,262 (16.0%) | 25,191 (17.1%) |
| 20 to 24 Minutes | 29,492 (16.7%) | 25,326 (17.2%) |
| 25 to 29 Minutes | 14,067 (8.0%) | 11,921 (8.1%) |
| 30 to 34 Minutes | 33,629 (19.1%) | 25,478 (17.3%) |
| 35 to 39 Minutes | 7,166 (4.1%) | 5,281 (3.6%) |
| 40 to 44 Minutes | 6,431 (3.6%) | 6,238 (4.2%) |
| 45 to 59 Minutes | 11,527 (6.5%) | 9,764 (6.6%) |
| 60 to 89 Minutes | 7,734 (4.4%) | 4,360 (3.0%) |
| 90 or more Minutes | 2,639 (1.5%) | 2,056 (1.4%) |
Time of Departure to Work by Sex in Denver
The most frequent times of departure to work in Denver are 7:00 AM to 7:29 AM (25,105, 14.2%) for males and 7:00 AM to 7:29 AM (22,675, 15.4%) for females.
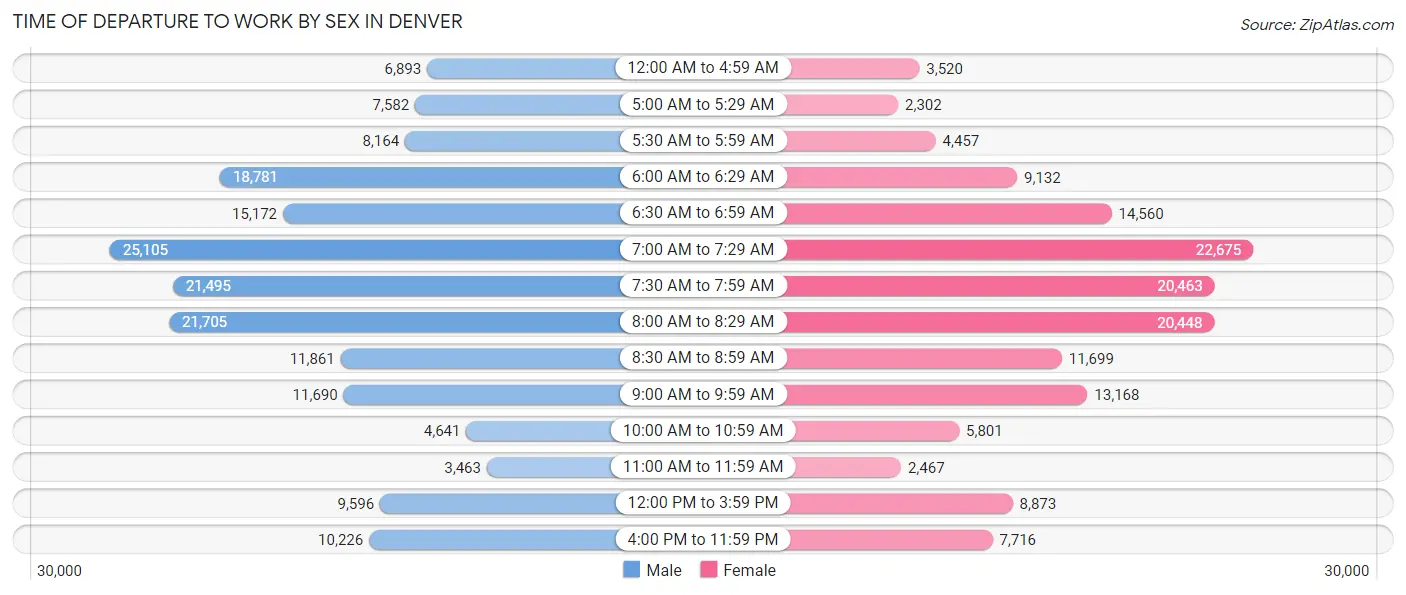
| Time of Departure | Male | Female |
| 12:00 AM to 4:59 AM | 6,893 (3.9%) | 3,520 (2.4%) |
| 5:00 AM to 5:29 AM | 7,582 (4.3%) | 2,302 (1.6%) |
| 5:30 AM to 5:59 AM | 8,164 (4.6%) | 4,457 (3.0%) |
| 6:00 AM to 6:29 AM | 18,781 (10.6%) | 9,132 (6.2%) |
| 6:30 AM to 6:59 AM | 15,172 (8.6%) | 14,560 (9.9%) |
| 7:00 AM to 7:29 AM | 25,105 (14.2%) | 22,675 (15.4%) |
| 7:30 AM to 7:59 AM | 21,495 (12.2%) | 20,463 (13.9%) |
| 8:00 AM to 8:29 AM | 21,705 (12.3%) | 20,448 (13.9%) |
| 8:30 AM to 8:59 AM | 11,861 (6.7%) | 11,699 (7.9%) |
| 9:00 AM to 9:59 AM | 11,690 (6.6%) | 13,168 (8.9%) |
| 10:00 AM to 10:59 AM | 4,641 (2.6%) | 5,801 (3.9%) |
| 11:00 AM to 11:59 AM | 3,463 (2.0%) | 2,467 (1.7%) |
| 12:00 PM to 3:59 PM | 9,596 (5.4%) | 8,873 (6.0%) |
| 4:00 PM to 11:59 PM | 10,226 (5.8%) | 7,716 (5.2%) |
| Total | 176,374 (100.0%) | 147,281 (100.0%) |
Housing Occupancy in Denver
Occupancy by Ownership in Denver
Of the total 322,964 dwellings in Denver, owner-occupied units account for 159,483 (49.4%), while renter-occupied units make up 163,481 (50.6%).
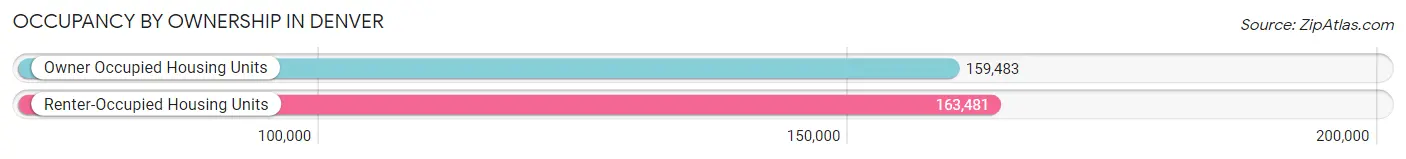
| Occupancy | # Housing Units | % Housing Units |
| Owner Occupied Housing Units | 159,483 | 49.4% |
| Renter-Occupied Housing Units | 163,481 | 50.6% |
| Total Occupied Housing Units | 322,964 | 100.0% |
Occupancy by Household Size in Denver
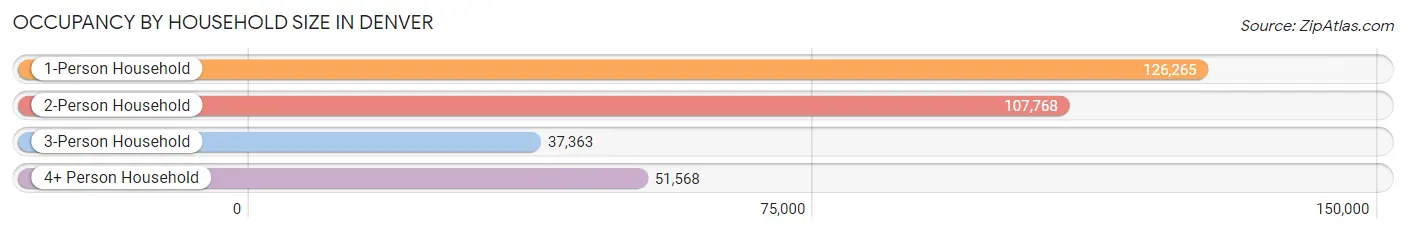
| Household Size | # Housing Units | % Housing Units |
| 1-Person Household | 126,265 | 39.1% |
| 2-Person Household | 107,768 | 33.4% |
| 3-Person Household | 37,363 | 11.6% |
| 4+ Person Household | 51,568 | 16.0% |
| Total Housing Units | 322,964 | 100.0% |
Occupancy by Ownership by Household Size in Denver
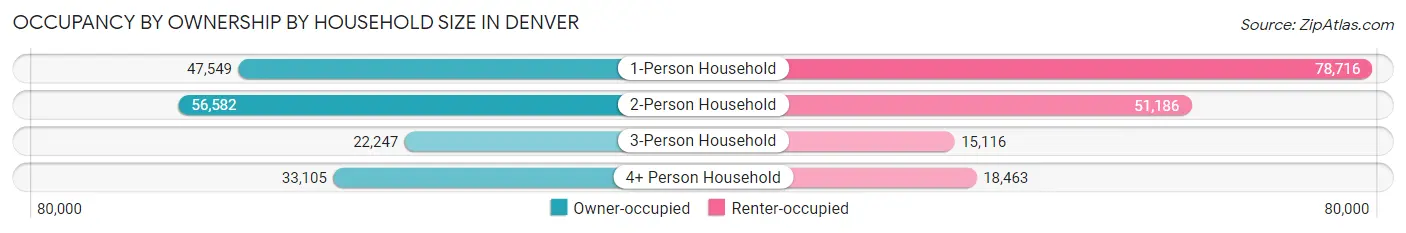
| Household Size | Owner-occupied | Renter-occupied |
| 1-Person Household | 47,549 (37.7%) | 78,716 (62.3%) |
| 2-Person Household | 56,582 (52.5%) | 51,186 (47.5%) |
| 3-Person Household | 22,247 (59.5%) | 15,116 (40.5%) |
| 4+ Person Household | 33,105 (64.2%) | 18,463 (35.8%) |
| Total Housing Units | 159,483 (49.4%) | 163,481 (50.6%) |
Occupancy by Educational Attainment in Denver
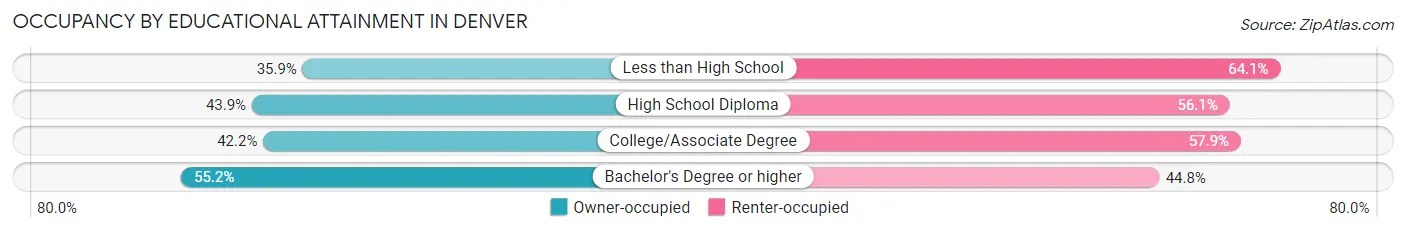
| Household Size | Owner-occupied | Renter-occupied |
| Less than High School | 8,711 (35.9%) | 15,558 (64.1%) |
| High School Diploma | 18,287 (43.9%) | 23,327 (56.1%) |
| College/Associate Degree | 30,361 (42.1%) | 41,672 (57.9%) |
| Bachelor's Degree or higher | 102,124 (55.2%) | 82,924 (44.8%) |
Occupancy by Age of Householder in Denver
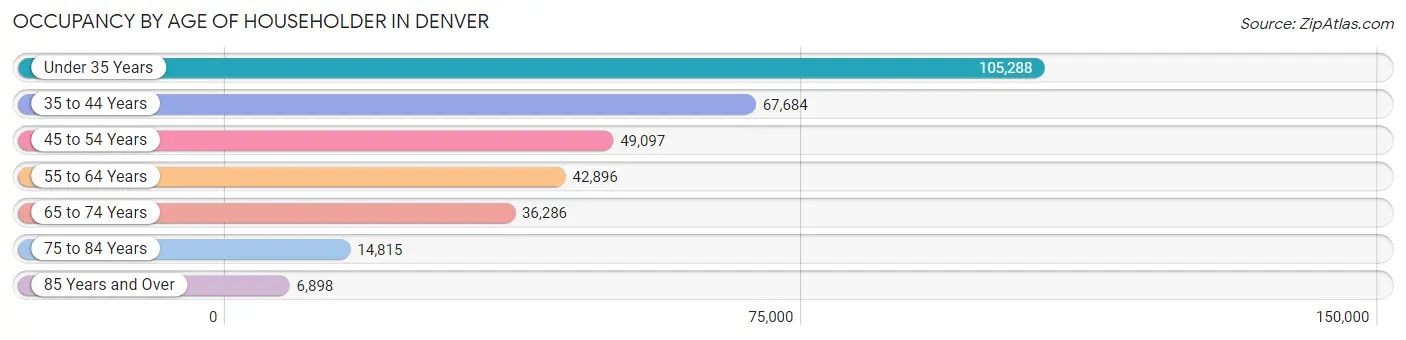
| Age Bracket | # Households | % Households |
| Under 35 Years | 105,288 | 32.6% |
| 35 to 44 Years | 67,684 | 21.0% |
| 45 to 54 Years | 49,097 | 15.2% |
| 55 to 64 Years | 42,896 | 13.3% |
| 65 to 74 Years | 36,286 | 11.2% |
| 75 to 84 Years | 14,815 | 4.6% |
| 85 Years and Over | 6,898 | 2.1% |
| Total | 322,964 | 100.0% |
Housing Finances in Denver
Median Income by Occupancy in Denver
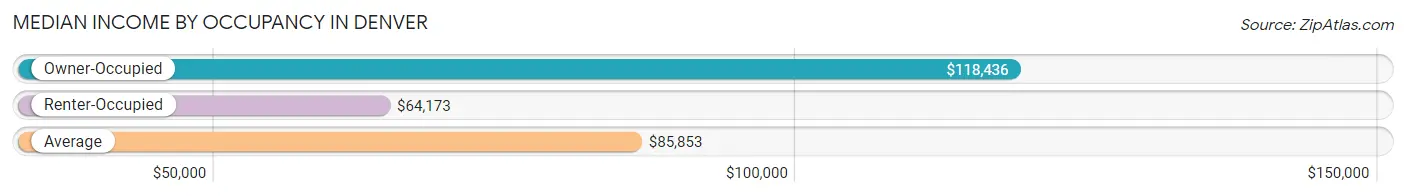
| Occupancy Type | # Households | Median Income |
| Owner-Occupied | 159,483 (49.4%) | $118,436 |
| Renter-Occupied | 163,481 (50.6%) | $64,173 |
| Average | 322,964 (100.0%) | $85,853 |
Occupancy by Householder Income Bracket in Denver
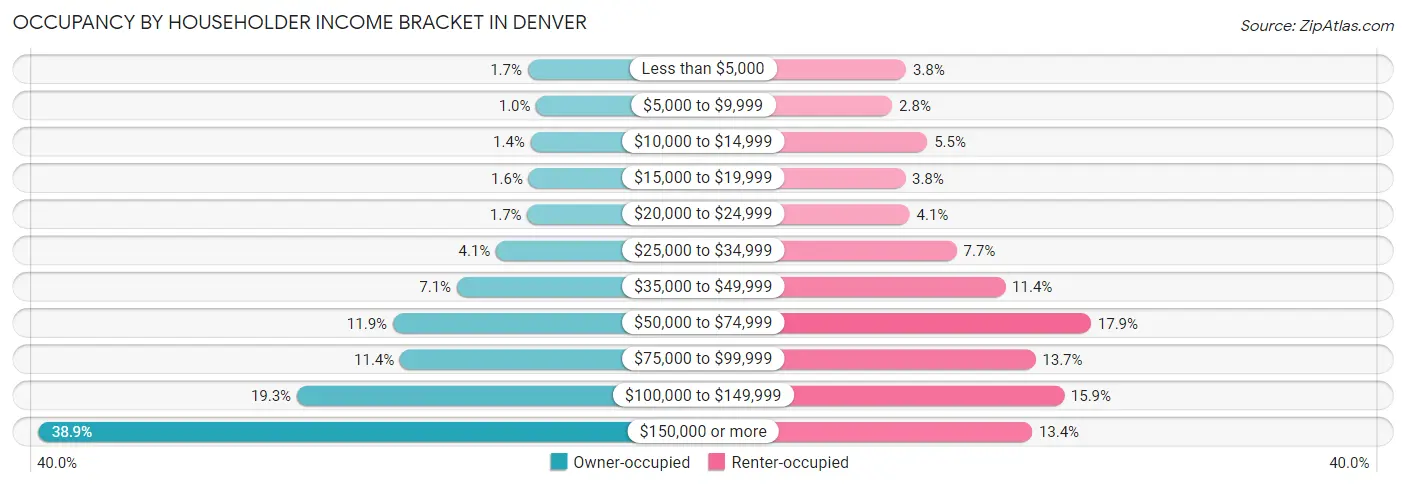
| Income Bracket | Owner-occupied | Renter-occupied |
| Less than $5,000 | 2,643 (1.7%) | 6,282 (3.8%) |
| $5,000 to $9,999 | 1,610 (1.0%) | 4,562 (2.8%) |
| $10,000 to $14,999 | 2,290 (1.4%) | 8,923 (5.5%) |
| $15,000 to $19,999 | 2,533 (1.6%) | 6,157 (3.8%) |
| $20,000 to $24,999 | 2,690 (1.7%) | 6,728 (4.1%) |
| $25,000 to $34,999 | 6,496 (4.1%) | 12,587 (7.7%) |
| $35,000 to $49,999 | 11,253 (7.1%) | 18,630 (11.4%) |
| $50,000 to $74,999 | 19,050 (11.9%) | 29,307 (17.9%) |
| $75,000 to $99,999 | 18,159 (11.4%) | 22,390 (13.7%) |
| $100,000 to $149,999 | 30,704 (19.3%) | 25,949 (15.9%) |
| $150,000 or more | 62,055 (38.9%) | 21,966 (13.4%) |
| Total | 159,483 (100.0%) | 163,481 (100.0%) |
Monthly Housing Cost Tiers in Denver
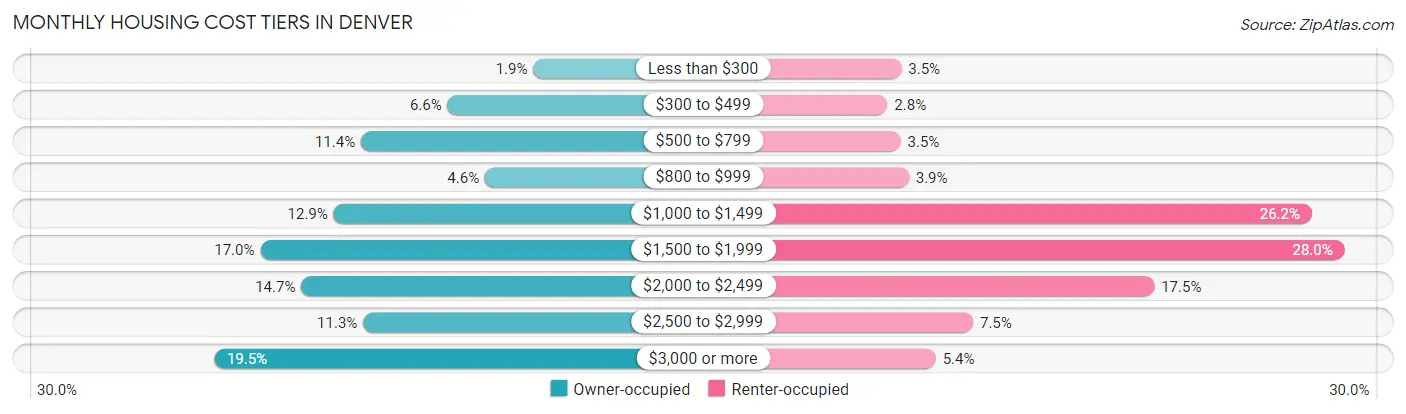
| Monthly Cost | Owner-occupied | Renter-occupied |
| Less than $300 | 3,029 (1.9%) | 5,766 (3.5%) |
| $300 to $499 | 10,591 (6.6%) | 4,512 (2.8%) |
| $500 to $799 | 18,212 (11.4%) | 5,707 (3.5%) |
| $800 to $999 | 7,284 (4.6%) | 6,438 (3.9%) |
| $1,000 to $1,499 | 20,628 (12.9%) | 42,826 (26.2%) |
| $1,500 to $1,999 | 27,079 (17.0%) | 45,792 (28.0%) |
| $2,000 to $2,499 | 23,474 (14.7%) | 28,610 (17.5%) |
| $2,500 to $2,999 | 18,026 (11.3%) | 12,249 (7.5%) |
| $3,000 or more | 31,160 (19.5%) | 8,880 (5.4%) |
| Total | 159,483 (100.0%) | 163,481 (100.0%) |
Physical Housing Characteristics in Denver
Housing Structures in Denver
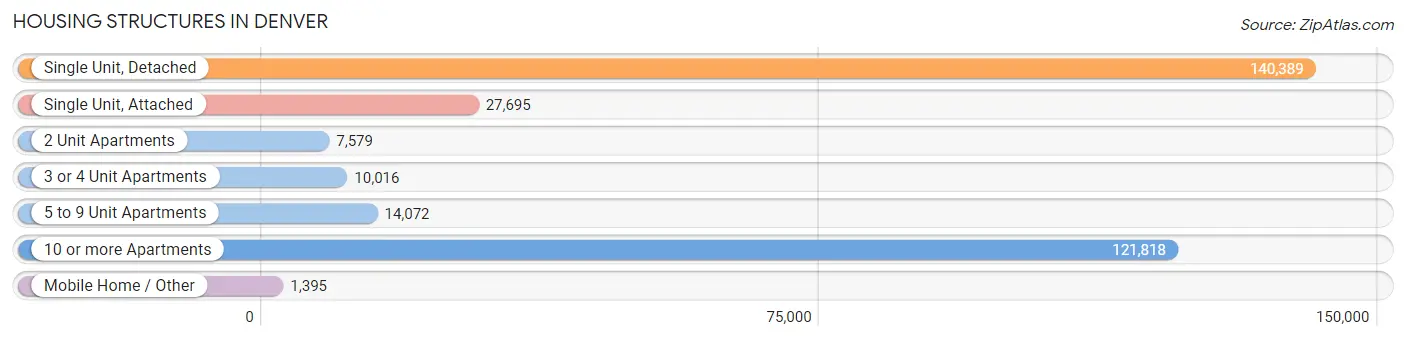
| Structure Type | # Housing Units | % Housing Units |
| Single Unit, Detached | 140,389 | 43.5% |
| Single Unit, Attached | 27,695 | 8.6% |
| 2 Unit Apartments | 7,579 | 2.4% |
| 3 or 4 Unit Apartments | 10,016 | 3.1% |
| 5 to 9 Unit Apartments | 14,072 | 4.4% |
| 10 or more Apartments | 121,818 | 37.7% |
| Mobile Home / Other | 1,395 | 0.4% |
| Total | 322,964 | 100.0% |
Housing Structures by Occupancy in Denver
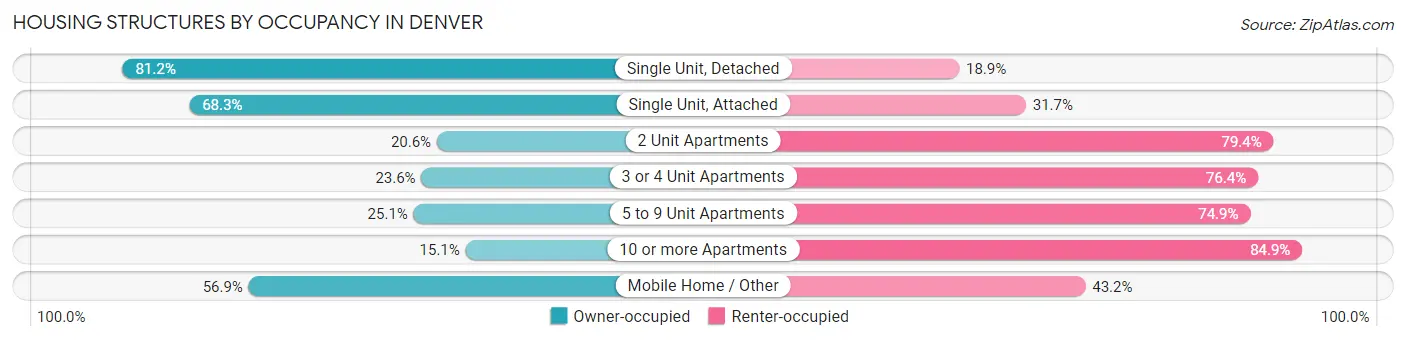
| Structure Type | Owner-occupied | Renter-occupied |
| Single Unit, Detached | 113,931 (81.1%) | 26,458 (18.9%) |
| Single Unit, Attached | 18,916 (68.3%) | 8,779 (31.7%) |
| 2 Unit Apartments | 1,562 (20.6%) | 6,017 (79.4%) |
| 3 or 4 Unit Apartments | 2,363 (23.6%) | 7,653 (76.4%) |
| 5 to 9 Unit Apartments | 3,531 (25.1%) | 10,541 (74.9%) |
| 10 or more Apartments | 18,387 (15.1%) | 103,431 (84.9%) |
| Mobile Home / Other | 793 (56.9%) | 602 (43.1%) |
| Total | 159,483 (49.4%) | 163,481 (50.6%) |
Housing Structures by Number of Rooms in Denver
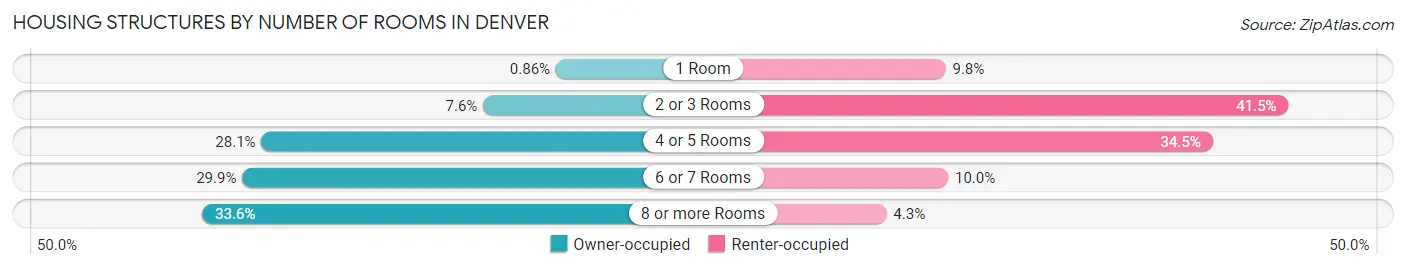
| Number of Rooms | Owner-occupied | Renter-occupied |
| 1 Room | 1,373 (0.9%) | 15,968 (9.8%) |
| 2 or 3 Rooms | 12,102 (7.6%) | 67,807 (41.5%) |
| 4 or 5 Rooms | 44,813 (28.1%) | 56,329 (34.5%) |
| 6 or 7 Rooms | 47,633 (29.9%) | 16,354 (10.0%) |
| 8 or more Rooms | 53,562 (33.6%) | 7,023 (4.3%) |
| Total | 159,483 (100.0%) | 163,481 (100.0%) |
Housing Structure by Heating Type in Denver
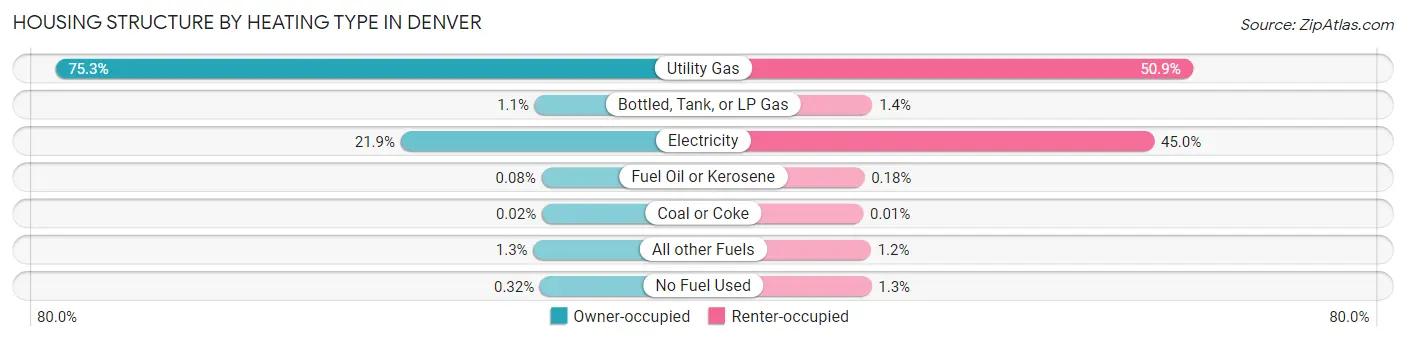
| Heating Type | Owner-occupied | Renter-occupied |
| Utility Gas | 120,025 (75.3%) | 83,238 (50.9%) |
| Bottled, Tank, or LP Gas | 1,806 (1.1%) | 2,318 (1.4%) |
| Electricity | 34,847 (21.8%) | 73,557 (45.0%) |
| Fuel Oil or Kerosene | 131 (0.1%) | 302 (0.2%) |
| Coal or Coke | 30 (0.0%) | 23 (0.0%) |
| All other Fuels | 2,141 (1.3%) | 1,950 (1.2%) |
| No Fuel Used | 503 (0.3%) | 2,093 (1.3%) |
| Total | 159,483 (100.0%) | 163,481 (100.0%) |
Household Vehicle Usage in Denver
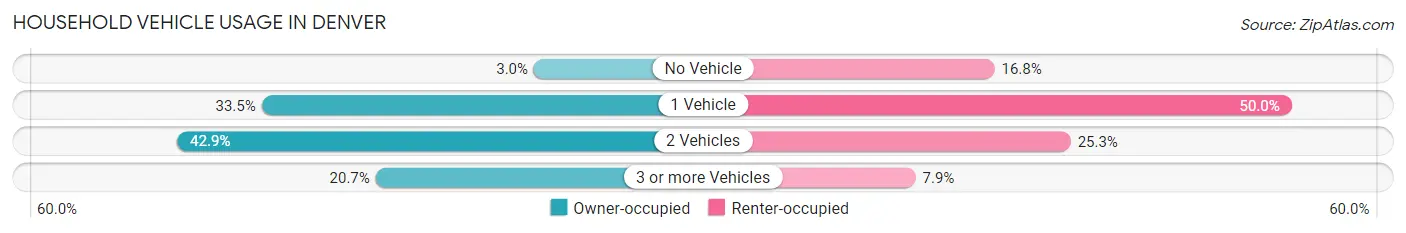
| Vehicles per Household | Owner-occupied | Renter-occupied |
| No Vehicle | 4,699 (2.9%) | 27,395 (16.8%) |
| 1 Vehicle | 53,359 (33.5%) | 81,794 (50.0%) |
| 2 Vehicles | 68,439 (42.9%) | 41,347 (25.3%) |
| 3 or more Vehicles | 32,986 (20.7%) | 12,945 (7.9%) |
| Total | 159,483 (100.0%) | 163,481 (100.0%) |
Real Estate & Mortgages in Denver
Real Estate and Mortgage Overview in Denver
| Characteristic | Without Mortgage | With Mortgage |
| Housing Units | 40,379 | 119,104 |
| Median Property Value | $519,300 | $547,100 |
| Median Household Income | $81,064 | $52,046 |
| Monthly Housing Costs | $599 | $30,848 |
| Real Estate Taxes | $2,344 | $2,417 |
Property Value by Mortgage Status in Denver
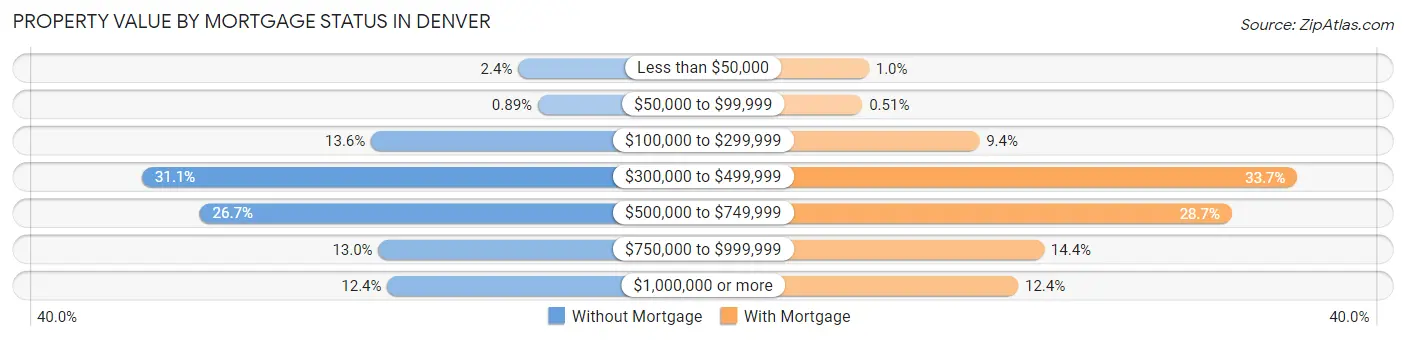
| Property Value | Without Mortgage | With Mortgage |
| Less than $50,000 | 965 (2.4%) | 1,204 (1.0%) |
| $50,000 to $99,999 | 360 (0.9%) | 605 (0.5%) |
| $100,000 to $299,999 | 5,492 (13.6%) | 11,225 (9.4%) |
| $300,000 to $499,999 | 12,541 (31.1%) | 40,092 (33.7%) |
| $500,000 to $749,999 | 10,767 (26.7%) | 34,141 (28.7%) |
| $750,000 to $999,999 | 5,264 (13.0%) | 17,091 (14.3%) |
| $1,000,000 or more | 4,990 (12.4%) | 14,746 (12.4%) |
| Total | 40,379 (100.0%) | 119,104 (100.0%) |
Household Income by Mortgage Status in Denver
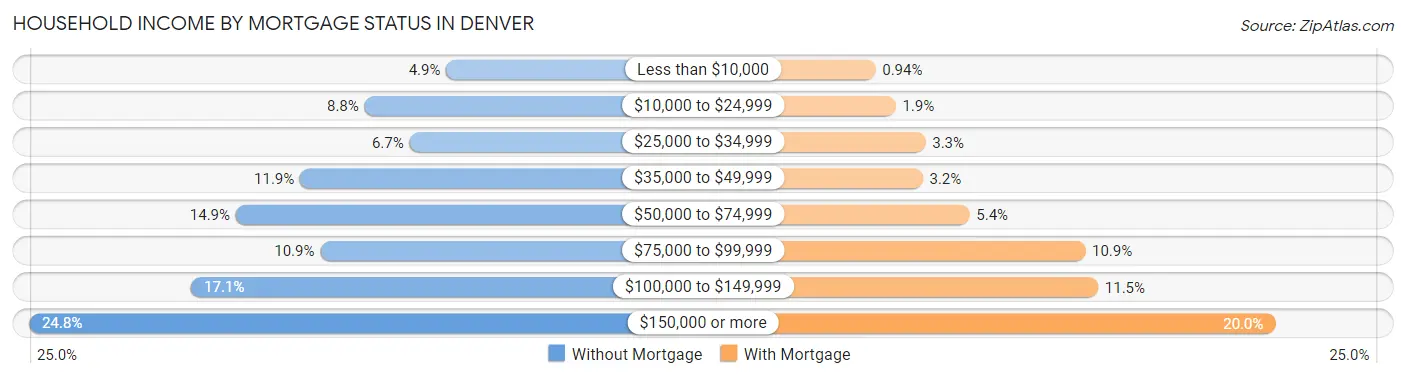
| Household Income | Without Mortgage | With Mortgage |
| Less than $10,000 | 1,988 (4.9%) | 1,114 (0.9%) |
| $10,000 to $24,999 | 3,557 (8.8%) | 2,265 (1.9%) |
| $25,000 to $34,999 | 2,695 (6.7%) | 3,956 (3.3%) |
| $35,000 to $49,999 | 4,796 (11.9%) | 3,801 (3.2%) |
| $50,000 to $74,999 | 6,031 (14.9%) | 6,457 (5.4%) |
| $75,000 to $99,999 | 4,409 (10.9%) | 13,019 (10.9%) |
| $100,000 to $149,999 | 6,894 (17.1%) | 13,750 (11.5%) |
| $150,000 or more | 10,009 (24.8%) | 23,810 (20.0%) |
| Total | 40,379 (100.0%) | 119,104 (100.0%) |
Property Value to Household Income Ratio in Denver
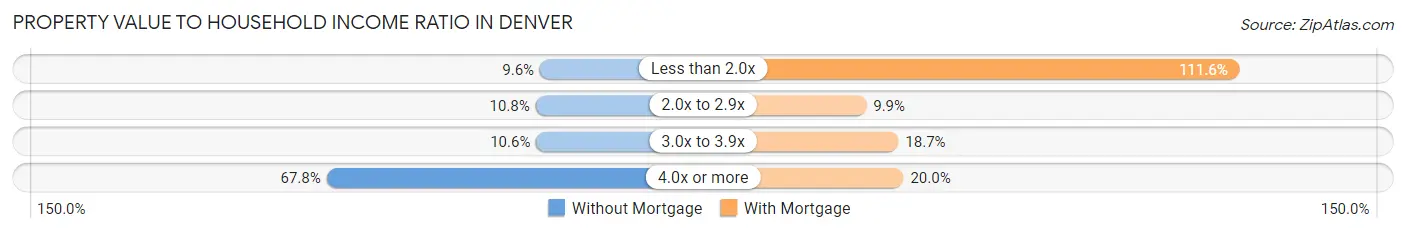
| Value-to-Income Ratio | Without Mortgage | With Mortgage |
| Less than 2.0x | 3,880 (9.6%) | 132,935 (111.6%) |
| 2.0x to 2.9x | 4,365 (10.8%) | 11,792 (9.9%) |
| 3.0x to 3.9x | 4,290 (10.6%) | 22,219 (18.7%) |
| 4.0x or more | 27,357 (67.7%) | 23,867 (20.0%) |
| Total | 40,379 (100.0%) | 119,104 (100.0%) |
Real Estate Taxes by Mortgage Status in Denver
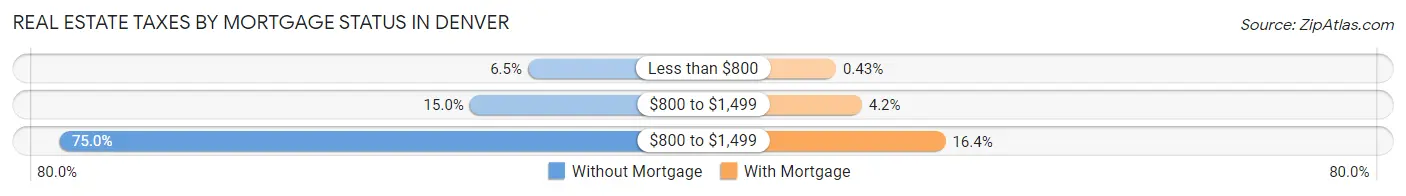
| Property Taxes | Without Mortgage | With Mortgage |
| Less than $800 | 2,614 (6.5%) | 515 (0.4%) |
| $800 to $1,499 | 6,044 (15.0%) | 5,004 (4.2%) |
| $800 to $1,499 | 30,273 (75.0%) | 19,566 (16.4%) |
| Total | 40,379 (100.0%) | 119,104 (100.0%) |
Health & Disability in Denver
Health Insurance Coverage by Age in Denver
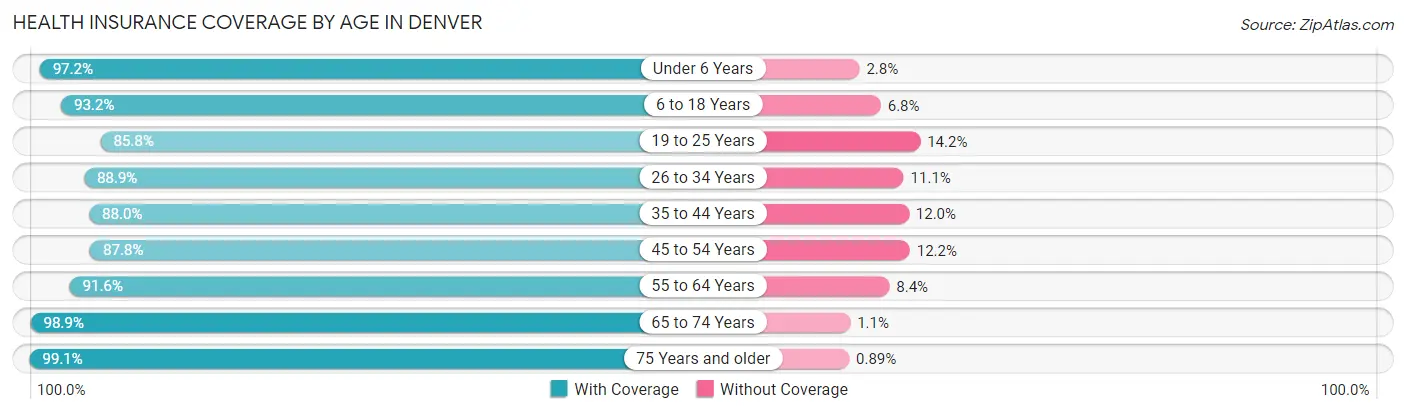
| Age Bracket | With Coverage | Without Coverage |
| Under 6 Years | 46,047 (97.2%) | 1,339 (2.8%) |
| 6 to 18 Years | 86,028 (93.2%) | 6,289 (6.8%) |
| 19 to 25 Years | 57,009 (85.8%) | 9,406 (14.2%) |
| 26 to 34 Years | 131,966 (88.9%) | 16,421 (11.1%) |
| 35 to 44 Years | 102,706 (88.0%) | 14,055 (12.0%) |
| 45 to 54 Years | 72,267 (87.8%) | 10,047 (12.2%) |
| 55 to 64 Years | 61,717 (91.6%) | 5,658 (8.4%) |
| 65 to 74 Years | 51,100 (98.9%) | 576 (1.1%) |
| 75 Years and older | 31,078 (99.1%) | 279 (0.9%) |
| Total | 639,918 (90.9%) | 64,070 (9.1%) |
Health Insurance Coverage by Citizenship Status in Denver
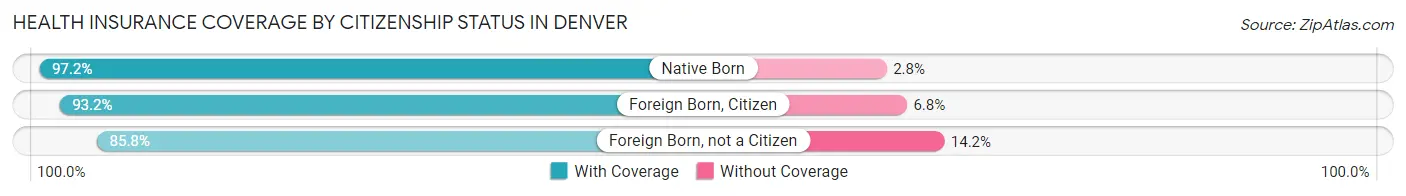
| Citizenship Status | With Coverage | Without Coverage |
| Native Born | 46,047 (97.2%) | 1,339 (2.8%) |
| Foreign Born, Citizen | 86,028 (93.2%) | 6,289 (6.8%) |
| Foreign Born, not a Citizen | 57,009 (85.8%) | 9,406 (14.2%) |
Health Insurance Coverage by Household Income in Denver
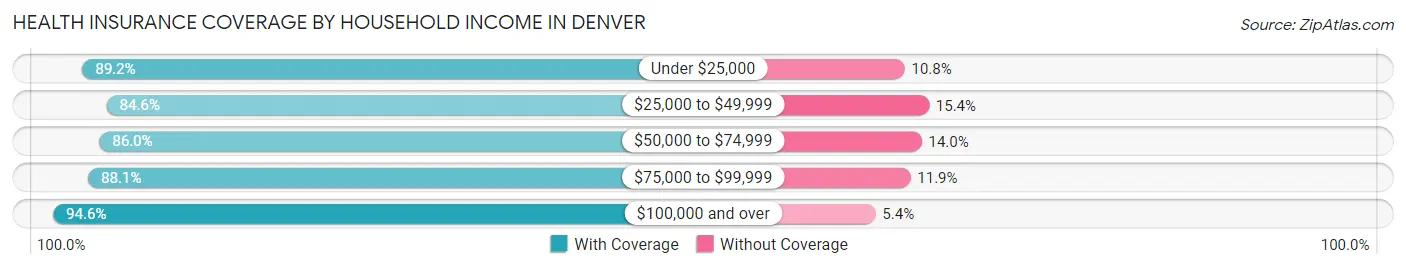
| Household Income | With Coverage | Without Coverage |
| Under $25,000 | 62,722 (89.2%) | 7,612 (10.8%) |
| $25,000 to $49,999 | 75,082 (84.6%) | 13,635 (15.4%) |
| $50,000 to $74,999 | 79,588 (86.0%) | 12,963 (14.0%) |
| $75,000 to $99,999 | 78,185 (88.1%) | 10,566 (11.9%) |
| $100,000 and over | 335,232 (94.6%) | 18,988 (5.4%) |
Public vs Private Health Insurance Coverage by Age in Denver
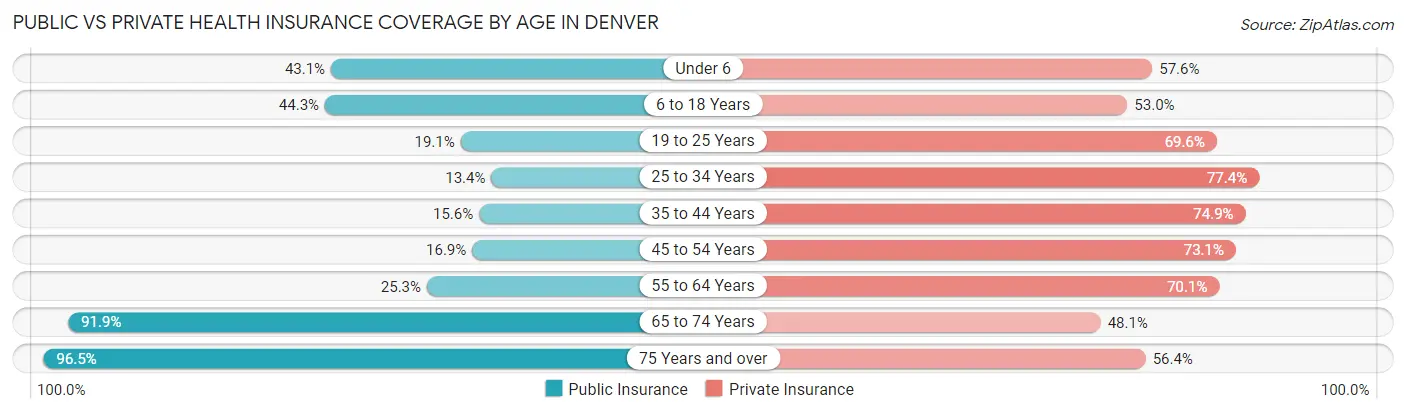
| Age Bracket | Public Insurance | Private Insurance |
| Under 6 | 20,441 (43.1%) | 27,307 (57.6%) |
| 6 to 18 Years | 40,855 (44.3%) | 48,933 (53.0%) |
| 19 to 25 Years | 12,676 (19.1%) | 46,221 (69.6%) |
| 25 to 34 Years | 19,860 (13.4%) | 114,903 (77.4%) |
| 35 to 44 Years | 18,263 (15.6%) | 87,471 (74.9%) |
| 45 to 54 Years | 13,941 (16.9%) | 60,198 (73.1%) |
| 55 to 64 Years | 17,072 (25.3%) | 47,198 (70.1%) |
| 65 to 74 Years | 47,508 (91.9%) | 24,838 (48.1%) |
| 75 Years and over | 30,259 (96.5%) | 17,690 (56.4%) |
| Total | 220,875 (31.4%) | 474,759 (67.4%) |
Disability Status by Sex by Age in Denver
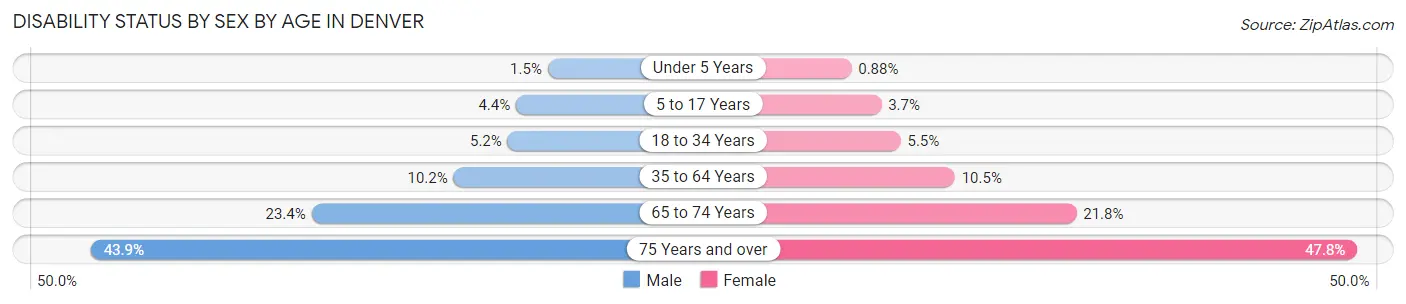
| Age Bracket | Male | Female |
| Under 5 Years | 290 (1.5%) | 171 (0.9%) |
| 5 to 17 Years | 2,073 (4.4%) | 1,683 (3.7%) |
| 18 to 34 Years | 5,811 (5.2%) | 5,962 (5.4%) |
| 35 to 64 Years | 14,164 (10.2%) | 13,352 (10.5%) |
| 65 to 74 Years | 5,642 (23.4%) | 5,991 (21.8%) |
| 75 Years and over | 5,521 (43.9%) | 8,977 (47.8%) |
Disability Class by Sex by Age in Denver
Disability Class: Hearing Difficulty
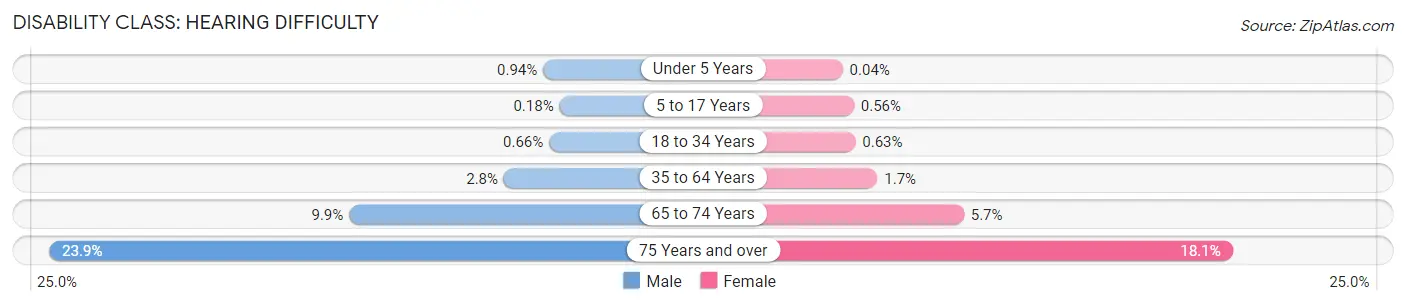
| Age Bracket | Male | Female |
| Under 5 Years | 189 (0.9%) | 7 (0.0%) |
| 5 to 17 Years | 87 (0.2%) | 257 (0.6%) |
| 18 to 34 Years | 738 (0.7%) | 692 (0.6%) |
| 35 to 64 Years | 3,831 (2.8%) | 2,105 (1.7%) |
| 65 to 74 Years | 2,400 (9.9%) | 1,559 (5.7%) |
| 75 Years and over | 3,004 (23.9%) | 3,403 (18.1%) |
Disability Class: Vision Difficulty
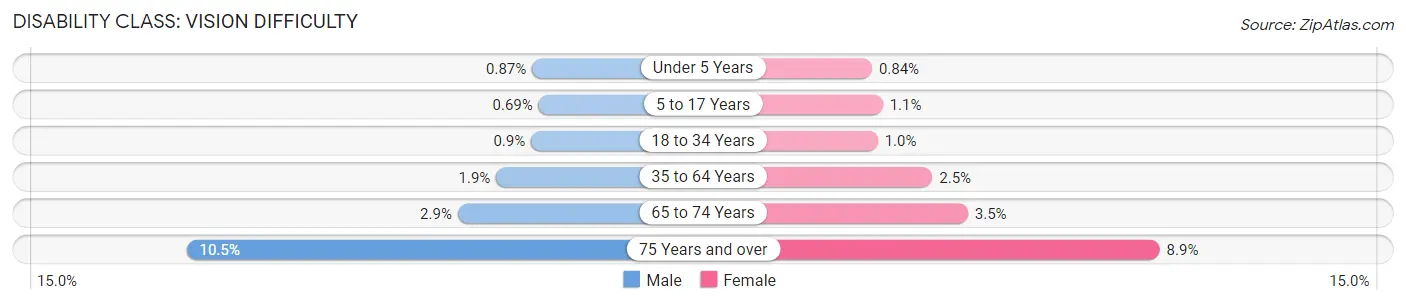
| Age Bracket | Male | Female |
| Under 5 Years | 174 (0.9%) | 164 (0.8%) |
| 5 to 17 Years | 325 (0.7%) | 524 (1.1%) |
| 18 to 34 Years | 1,009 (0.9%) | 1,097 (1.0%) |
| 35 to 64 Years | 2,603 (1.9%) | 3,214 (2.5%) |
| 65 to 74 Years | 709 (2.9%) | 966 (3.5%) |
| 75 Years and over | 1,320 (10.5%) | 1,661 (8.8%) |
Disability Class: Cognitive Difficulty
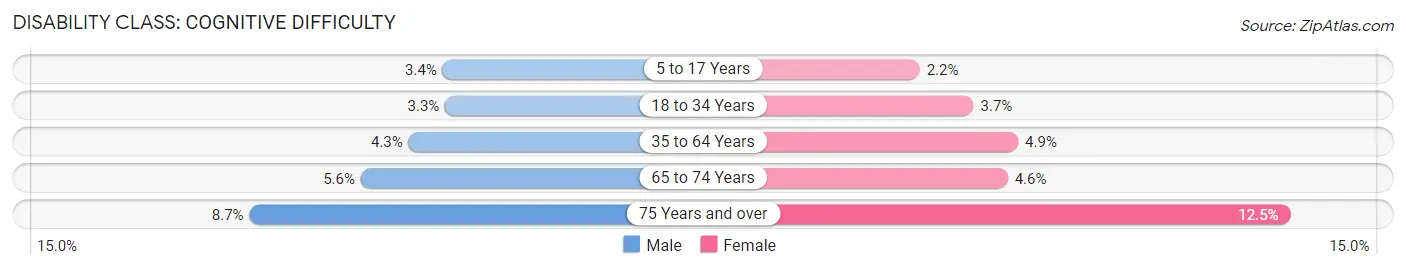
| Age Bracket | Male | Female |
| 5 to 17 Years | 1,587 (3.4%) | 997 (2.2%) |
| 18 to 34 Years | 3,692 (3.3%) | 4,011 (3.7%) |
| 35 to 64 Years | 5,994 (4.3%) | 6,260 (4.9%) |
| 65 to 74 Years | 1,361 (5.6%) | 1,272 (4.6%) |
| 75 Years and over | 1,100 (8.7%) | 2,345 (12.5%) |
Disability Class: Ambulatory Difficulty
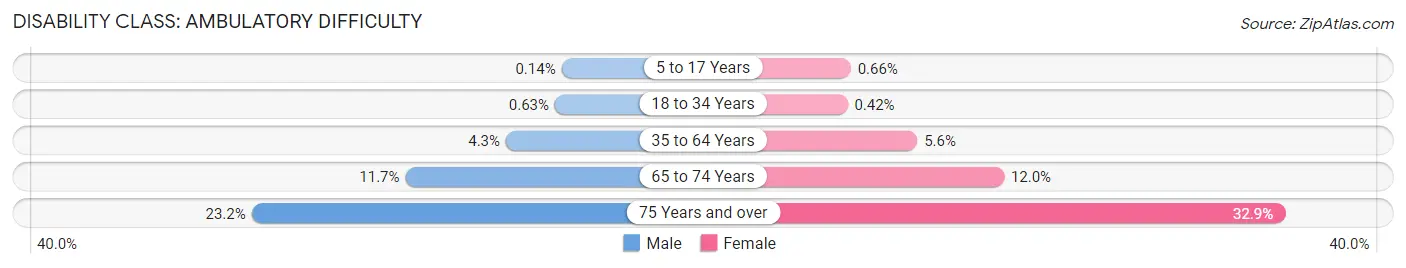
| Age Bracket | Male | Female |
| 5 to 17 Years | 64 (0.1%) | 303 (0.7%) |
| 18 to 34 Years | 709 (0.6%) | 464 (0.4%) |
| 35 to 64 Years | 5,940 (4.3%) | 7,132 (5.6%) |
| 65 to 74 Years | 2,832 (11.7%) | 3,315 (12.0%) |
| 75 Years and over | 2,914 (23.2%) | 6,176 (32.9%) |
Disability Class: Self-Care Difficulty
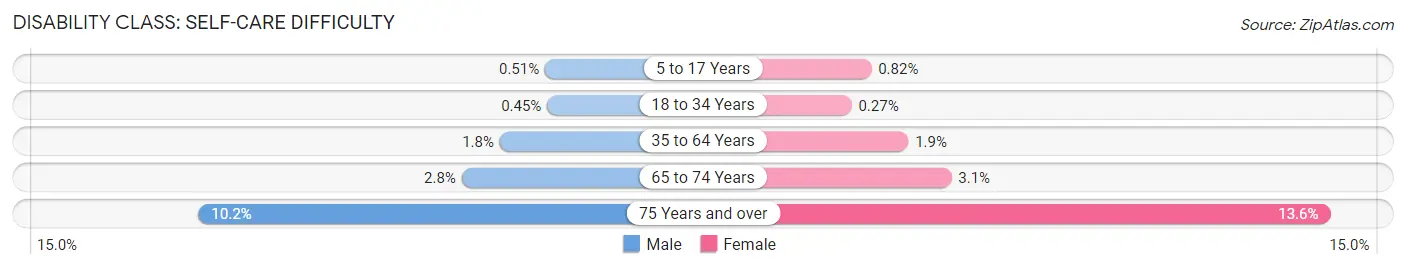
| Age Bracket | Male | Female |
| 5 to 17 Years | 239 (0.5%) | 376 (0.8%) |
| 18 to 34 Years | 508 (0.4%) | 296 (0.3%) |
| 35 to 64 Years | 2,467 (1.8%) | 2,359 (1.8%) |
| 65 to 74 Years | 682 (2.8%) | 840 (3.0%) |
| 75 Years and over | 1,279 (10.2%) | 2,552 (13.6%) |
Technology Access in Denver
Computing Device Access in Denver
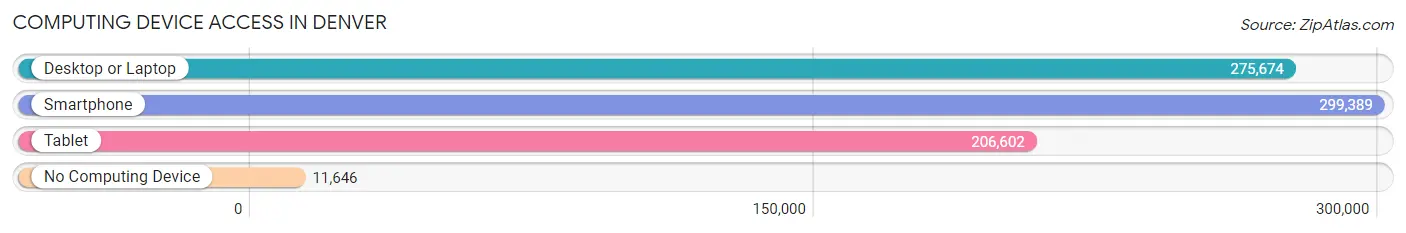
| Device Type | # Households | % Households |
| Desktop or Laptop | 275,674 | 85.4% |
| Smartphone | 299,389 | 92.7% |
| Tablet | 206,602 | 64.0% |
| No Computing Device | 11,646 | 3.6% |
| Total | 322,964 | 100.0% |
Internet Access in Denver
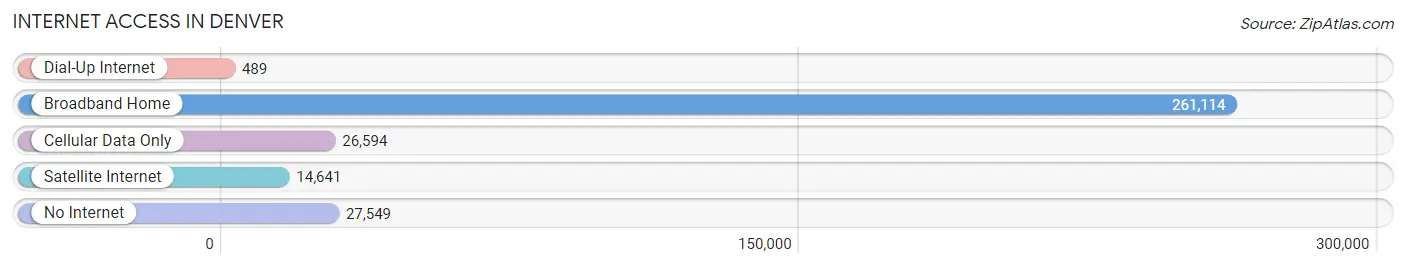
| Internet Type | # Households | % Households |
| Dial-Up Internet | 489 | 0.2% |
| Broadband Home | 261,114 | 80.8% |
| Cellular Data Only | 26,594 | 8.2% |
| Satellite Internet | 14,641 | 4.5% |
| No Internet | 27,549 | 8.5% |
| Total | 322,964 | 100.0% |
Denver Summary
Denver, Colorado is the capital of the state and the most populous city in the Rocky Mountain region. It is located in the South Platte River Valley on the western edge of the High Plains just east of the Front Range of the Rocky Mountains. Denver is nicknamed the “Mile High City” because its official elevation is one mile (1.6 km) above sea level, making it the highest major city in the United States.
History
Denver was founded in 1858 as a mining town during the Pike’s Peak Gold Rush. The city was named after James W. Denver, a governor of the Kansas Territory. The city grew rapidly during the late 19th century, and by 1900 it was the 22nd largest city in the United States. Denver was the host city of the 1908 Democratic National Convention, which nominated William Jennings Bryan for president.
Geography
Denver is located in the South Platte River Valley on the western edge of the High Plains, just east of the Front Range of the Rocky Mountains. The city lies at an elevation of 5,280 feet (1,609 m) above sea level, making it the highest major city in the United States. The city is located in the foothills of the Rocky Mountains, and is surrounded by a variety of natural features, including the South Platte River, Cherry Creek, and the Rocky Mountains.
Economy
Denver’s economy is based on a variety of industries, including aerospace, finance, healthcare, manufacturing, telecommunications, and tourism. The city is home to several major corporations, including the headquarters of Frontier Airlines, Molson Coors Brewing Company, and the Denver Broncos. The city is also a major transportation hub, with Denver International Airport serving as the primary airport for the region.
Demographics
As of the 2010 census, the population of Denver was 600,158, making it the 24th most populous city in the United States. The city is racially and ethnically diverse, with the largest racial/ethnic groups being White (54.3%), Hispanic or Latino (31.2%), African American (10.2%), and Asian (3.2%). The median household income in Denver is $54,735, and the median age is 34.7 years. The city has a higher-than-average percentage of college-educated adults, with 37.2% of the population having a bachelor’s degree or higher.
Common Questions
What is Per Capita Income in Denver?
Per Capita income in Denver is $56,381.
What is the Median Family Income in Denver?
Median Family Income in Denver is $109,682.
What is the Median Household income in Denver?
Median Household Income in Denver is $85,853.
What is Income or Wage Gap in Denver?
Income or Wage Gap in Denver is 17.7%.
Women in Denver earn 82.3 cents for every dollar earned by a man.
What is Family Income Deficit in Denver?
Family Income Deficit in Denver is $11,824.
Families that are below poverty line in Denver earn $11,824 less on average than the poverty threshold level.
What is Inequality or Gini Index in Denver?
Inequality or Gini Index in Denver is 0.49.
What is the Total Population of Denver?
Total Population of Denver is 710,800.
What is the Total Male Population of Denver?
Total Male Population of Denver is 359,302.
What is the Total Female Population of Denver?
Total Female Population of Denver is 351,498.
What is the Ratio of Males per 100 Females in Denver?
There are 102.22 Males per 100 Females in Denver.
What is the Ratio of Females per 100 Males in Denver?
There are 97.83 Females per 100 Males in Denver.
What is the Median Population Age in Denver?
Median Population Age in Denver is 34.9 Years.
What is the Average Family Size in Denver
Average Family Size in Denver is 3.0 People.
What is the Average Household Size in Denver
Average Household Size in Denver is 2.1 People.
How Large is the Labor Force in Denver?
There are 437,813 People in the Labor Forcein in Denver.
What is the Percentage of People in the Labor Force in Denver?
74.0% of People are in the Labor Force in Denver.
What is the Unemployment Rate in Denver?
Unemployment Rate in Denver is 4.7%.