Carthage, MO Map & Demographics
Carthage Map
Carthage Overview
$21,019
PER CAPITA INCOME
$47,364
AVG FAMILY INCOME
$43,526
AVG HOUSEHOLD INCOME
21.7%
WAGE / INCOME GAP [ % ]
78.3¢/ $1
WAGE / INCOME GAP [ $ ]
$10,515
FAMILY INCOME DEFICIT
0.45
INEQUALITY / GINI INDEX
15,491
TOTAL POPULATION
7,271
MALE POPULATION
8,220
FEMALE POPULATION
88.45
MALES / 100 FEMALES
113.05
FEMALES / 100 MALES
31.6
MEDIAN AGE
3.3
AVG FAMILY SIZE
2.7
AVG HOUSEHOLD SIZE
6,452
LABOR FORCE [ PEOPLE ]
57.7%
PERCENT IN LABOR FORCE
4.4%
UNEMPLOYMENT RATE
Carthage Zip Codes
Carthage Area Codes
Income in Carthage
Income Overview in Carthage
Per Capita Income in Carthage is $21,019, while median incomes of families and households are $47,364 and $43,526 respectively.
| Characteristic | Number | Measure |
| Per Capita Income | 15,491 | $21,019 |
| Median Family Income | 3,717 | $47,364 |
| Mean Family Income | 3,717 | $61,292 |
| Median Household Income | 5,612 | $43,526 |
| Mean Household Income | 5,612 | $56,475 |
| Income Deficit | 3,717 | $10,515 |
| Wage / Income Gap (%) | 15,491 | 21.74% |
| Wage / Income Gap ($) | 15,491 | 78.26¢ per $1 |
| Gini / Inequality Index | 15,491 | 0.45 |
Earnings by Sex in Carthage
Average Earnings in Carthage are $29,551, $34,076 for men and $26,667 for women, a difference of 21.7%.
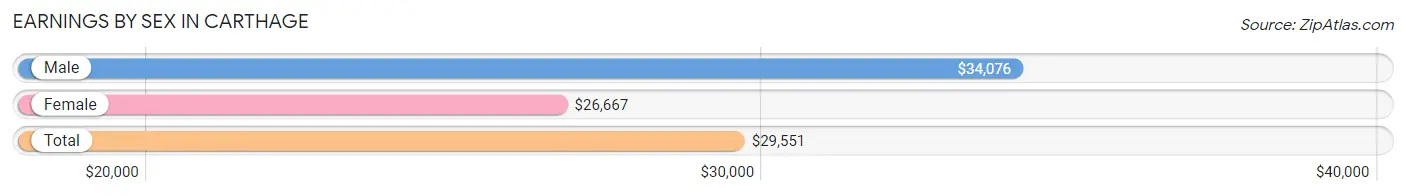
| Sex | Number | Average Earnings |
| Male | 3,638 (51.6%) | $34,076 |
| Female | 3,408 (48.4%) | $26,667 |
| Total | 7,046 (100.0%) | $29,551 |
Earnings by Sex by Income Bracket in Carthage
The most common earnings brackets in Carthage are $40,000 to $44,999 for men (388 | 10.7%) and $25,000 to $29,999 for women (362 | 10.6%).
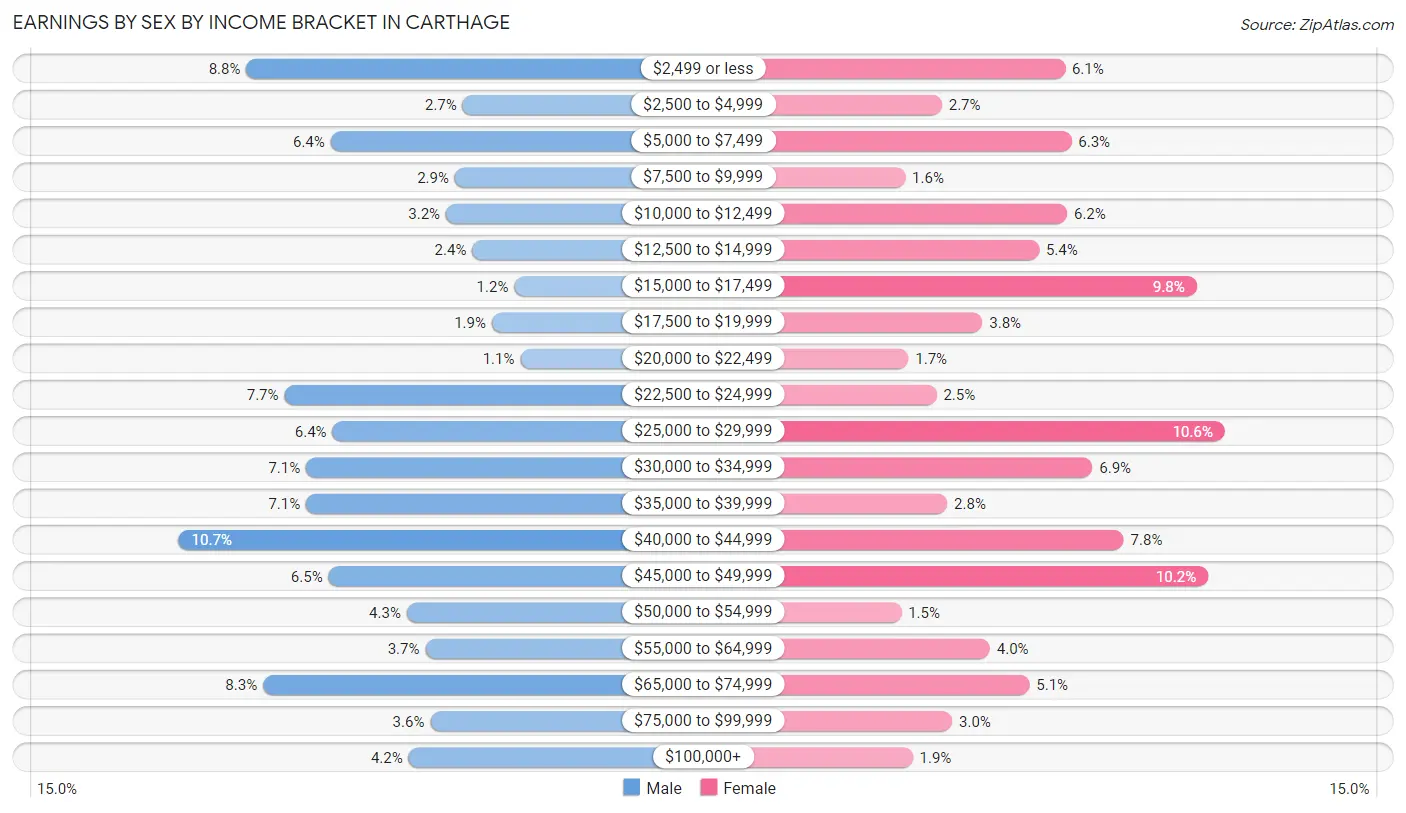
| Income | Male | Female |
| $2,499 or less | 319 (8.8%) | 209 (6.1%) |
| $2,500 to $4,999 | 98 (2.7%) | 91 (2.7%) |
| $5,000 to $7,499 | 233 (6.4%) | 215 (6.3%) |
| $7,500 to $9,999 | 106 (2.9%) | 56 (1.6%) |
| $10,000 to $12,499 | 115 (3.2%) | 211 (6.2%) |
| $12,500 to $14,999 | 88 (2.4%) | 184 (5.4%) |
| $15,000 to $17,499 | 45 (1.2%) | 335 (9.8%) |
| $17,500 to $19,999 | 68 (1.9%) | 130 (3.8%) |
| $20,000 to $22,499 | 39 (1.1%) | 59 (1.7%) |
| $22,500 to $24,999 | 280 (7.7%) | 86 (2.5%) |
| $25,000 to $29,999 | 231 (6.4%) | 362 (10.6%) |
| $30,000 to $34,999 | 258 (7.1%) | 235 (6.9%) |
| $35,000 to $39,999 | 258 (7.1%) | 96 (2.8%) |
| $40,000 to $44,999 | 388 (10.7%) | 265 (7.8%) |
| $45,000 to $49,999 | 235 (6.5%) | 346 (10.2%) |
| $50,000 to $54,999 | 155 (4.3%) | 52 (1.5%) |
| $55,000 to $64,999 | 136 (3.7%) | 137 (4.0%) |
| $65,000 to $74,999 | 302 (8.3%) | 175 (5.1%) |
| $75,000 to $99,999 | 131 (3.6%) | 101 (3.0%) |
| $100,000+ | 153 (4.2%) | 63 (1.8%) |
| Total | 3,638 (100.0%) | 3,408 (100.0%) |
Earnings by Sex by Educational Attainment in Carthage
Average earnings in Carthage are $37,716 for men and $30,136 for women, a difference of 20.1%. Men with an educational attainment of college or associate's degree enjoy the highest average annual earnings of $48,180, while those with less than high school education earn the least with $24,144. Women with an educational attainment of graduate degree earn the most with the average annual earnings of $68,116, while those with college or associate's degree education have the smallest earnings of $22,005.
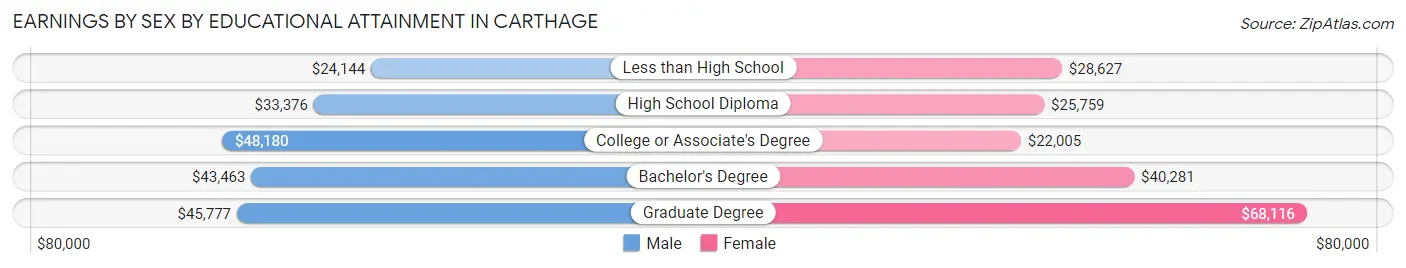
| Educational Attainment | Male Income | Female Income |
| Less than High School | $24,144 | $28,627 |
| High School Diploma | $33,376 | $25,759 |
| College or Associate's Degree | $48,180 | $22,005 |
| Bachelor's Degree | $43,463 | $40,281 |
| Graduate Degree | $45,777 | $68,116 |
| Total | $37,716 | $30,136 |
Family Income in Carthage
Family Income Brackets in Carthage
According to the Carthage family income data, there are 703 families falling into the $35,000 to $49,999 income range, which is the most common income bracket and makes up 18.9% of all families. Conversely, the $150,000 to $199,999 income bracket is the least frequent group with only 63 families (1.7%) belonging to this category.
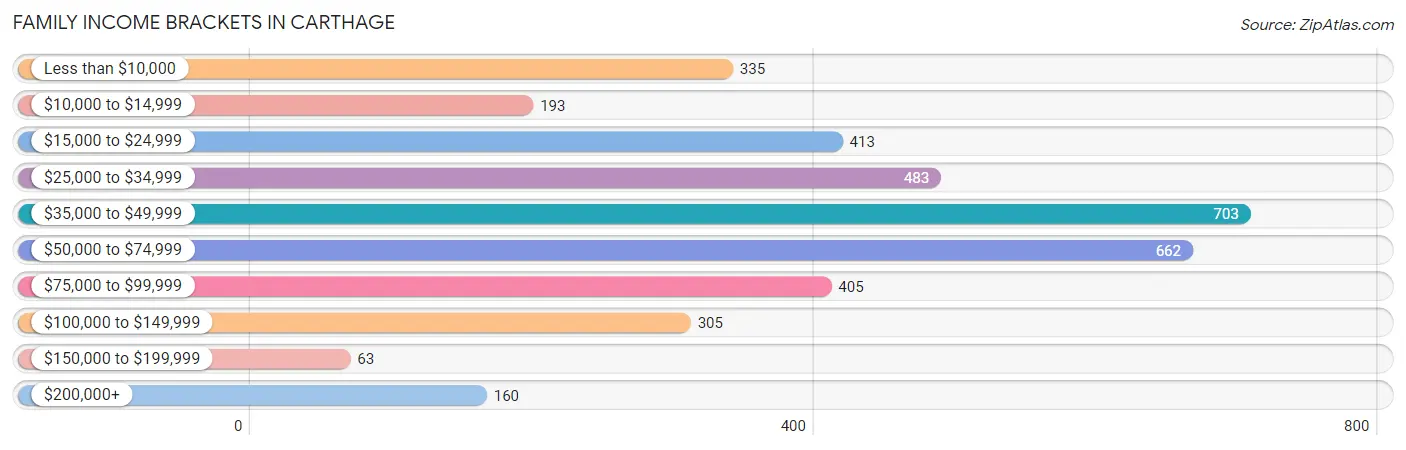
| Income Bracket | # Families | % Families |
| Less than $10,000 | 335 | 9.0% |
| $10,000 to $14,999 | 193 | 5.2% |
| $15,000 to $24,999 | 413 | 11.1% |
| $25,000 to $34,999 | 483 | 13.0% |
| $35,000 to $49,999 | 703 | 18.9% |
| $50,000 to $74,999 | 662 | 17.8% |
| $75,000 to $99,999 | 405 | 10.9% |
| $100,000 to $149,999 | 305 | 8.2% |
| $150,000 to $199,999 | 63 | 1.7% |
| $200,000+ | 160 | 4.3% |
Family Income by Famaliy Size in Carthage
4-person families (446 | 12.0%) account for the highest median family income in Carthage with $56,967 per family, while 2-person families (1,689 | 45.4%) have the highest median income of $24,406 per family member.
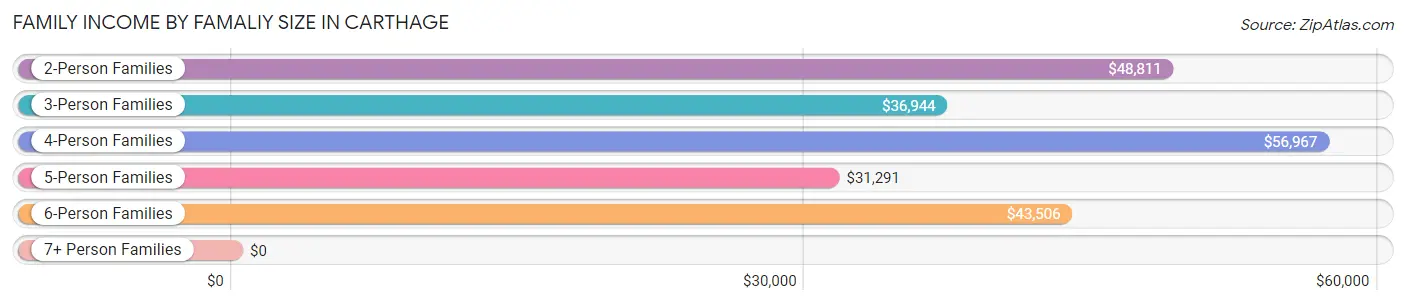
| Income Bracket | # Families | Median Income |
| 2-Person Families | 1,689 (45.4%) | $48,811 |
| 3-Person Families | 804 (21.6%) | $36,944 |
| 4-Person Families | 446 (12.0%) | $56,967 |
| 5-Person Families | 502 (13.5%) | $31,291 |
| 6-Person Families | 189 (5.1%) | $43,506 |
| 7+ Person Families | 87 (2.3%) | $0 |
| Total | 3,717 (100.0%) | $47,364 |
Family Income by Number of Earners in Carthage
The median family income in Carthage is $47,364, with families comprising 3+ earners (321) having the highest median family income of $112,330, while families with no earners (453) have the lowest median family income of $25,893, accounting for 8.6% and 12.2% of families, respectively.
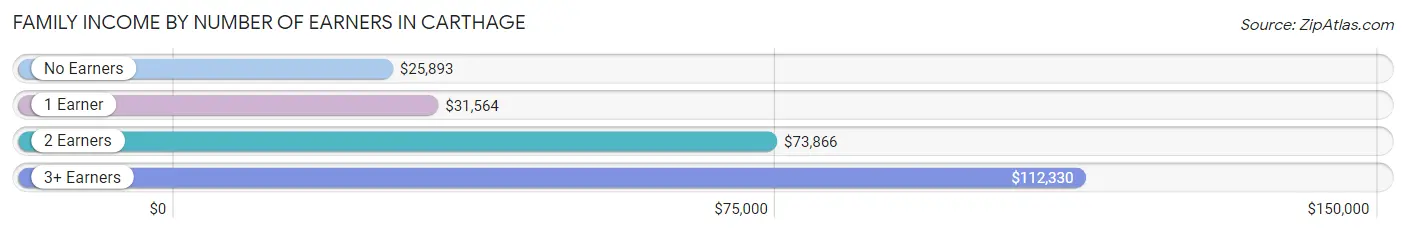
| Number of Earners | # Families | Median Income |
| No Earners | 453 (12.2%) | $25,893 |
| 1 Earner | 1,792 (48.2%) | $31,564 |
| 2 Earners | 1,151 (31.0%) | $73,866 |
| 3+ Earners | 321 (8.6%) | $112,330 |
| Total | 3,717 (100.0%) | $47,364 |
Household Income in Carthage
Household Income Brackets in Carthage
With 993 households falling in the category, the $35,000 to $49,999 income range is the most frequent in Carthage, accounting for 17.7% of all households. In contrast, only 62 households (1.1%) fall into the $150,000 to $199,999 income bracket, making it the least populous group.
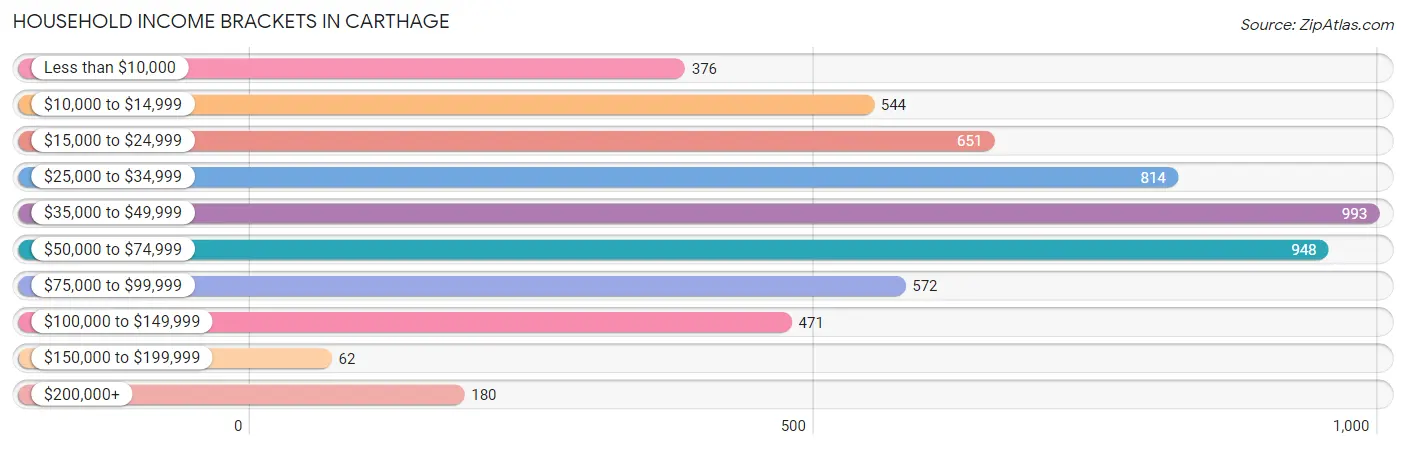
| Income Bracket | # Households | % Households |
| Less than $10,000 | 376 | 6.7% |
| $10,000 to $14,999 | 544 | 9.7% |
| $15,000 to $24,999 | 651 | 11.6% |
| $25,000 to $34,999 | 814 | 14.5% |
| $35,000 to $49,999 | 993 | 17.7% |
| $50,000 to $74,999 | 948 | 16.9% |
| $75,000 to $99,999 | 572 | 10.2% |
| $100,000 to $149,999 | 471 | 8.4% |
| $150,000 to $199,999 | 62 | 1.1% |
| $200,000+ | 180 | 3.2% |
Household Income by Householder Age in Carthage
The median household income in Carthage is $43,526, with the highest median household income of $49,813 found in the 45 to 64 years age bracket for the primary householder. A total of 1,891 households (33.7%) fall into this category. Meanwhile, the 25 to 44 years age bracket for the primary householder has the lowest median household income of $33,179, with 2,153 households (38.4%) in this group.
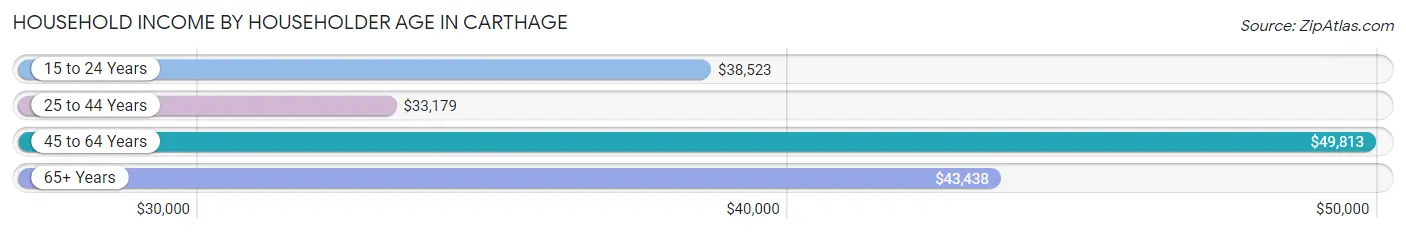
| Income Bracket | # Households | Median Income |
| 15 to 24 Years | 378 (6.7%) | $38,523 |
| 25 to 44 Years | 2,153 (38.4%) | $33,179 |
| 45 to 64 Years | 1,891 (33.7%) | $49,813 |
| 65+ Years | 1,190 (21.2%) | $43,438 |
| Total | 5,612 (100.0%) | $43,526 |
Poverty in Carthage
Income Below Poverty by Sex and Age in Carthage
With 30.4% poverty level for males and 38.8% for females among the residents of Carthage, 6 to 11 year old males and 5 year old females are the most vulnerable to poverty, with 483 males (53.9%) and 44 females (84.6%) in their respective age groups living below the poverty level.
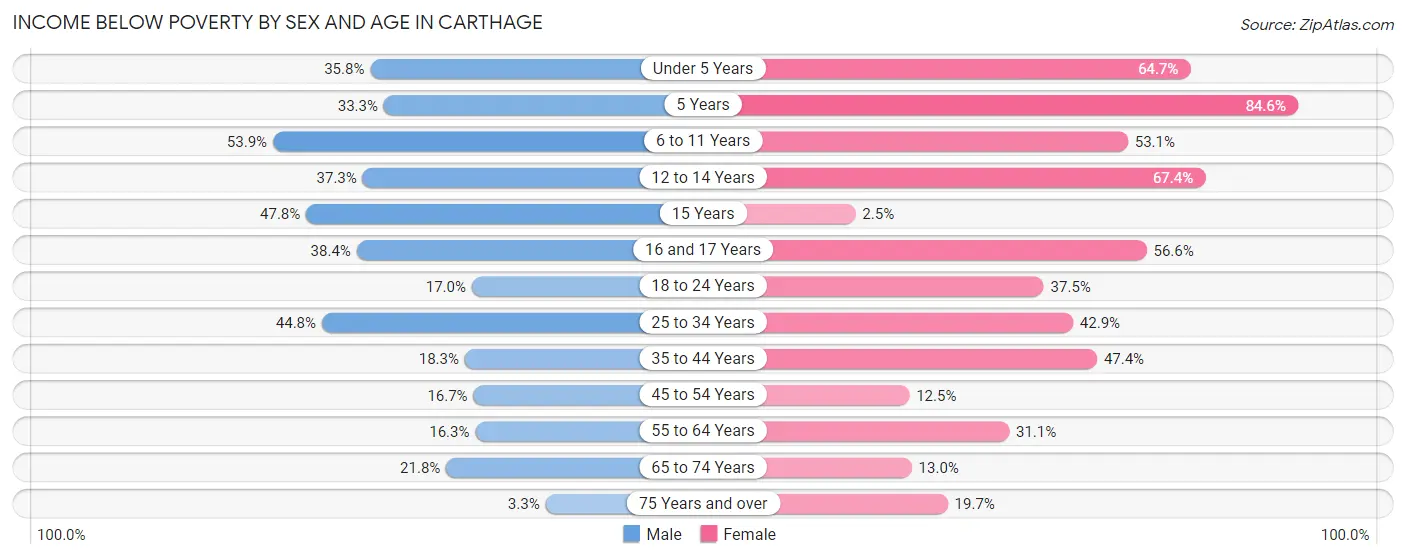
| Age Bracket | Male | Female |
| Under 5 Years | 229 (35.8%) | 430 (64.7%) |
| 5 Years | 28 (33.3%) | 44 (84.6%) |
| 6 to 11 Years | 483 (53.9%) | 266 (53.1%) |
| 12 to 14 Years | 98 (37.3%) | 513 (67.4%) |
| 15 Years | 85 (47.7%) | 6 (2.5%) |
| 16 and 17 Years | 132 (38.4%) | 138 (56.6%) |
| 18 to 24 Years | 123 (17.0%) | 296 (37.5%) |
| 25 to 34 Years | 493 (44.8%) | 305 (42.9%) |
| 35 to 44 Years | 158 (18.3%) | 629 (47.4%) |
| 45 to 54 Years | 122 (16.7%) | 135 (12.5%) |
| 55 to 64 Years | 91 (16.3%) | 199 (31.0%) |
| 65 to 74 Years | 87 (21.7%) | 72 (13.0%) |
| 75 Years and over | 8 (3.3%) | 100 (19.7%) |
| Total | 2,137 (30.4%) | 3,133 (38.8%) |
Income Above Poverty by Sex and Age in Carthage
According to the poverty statistics in Carthage, males aged 75 years and over and females aged 15 years are the age groups that are most secure financially, with 96.7% of males and 97.5% of females in these age groups living above the poverty line.
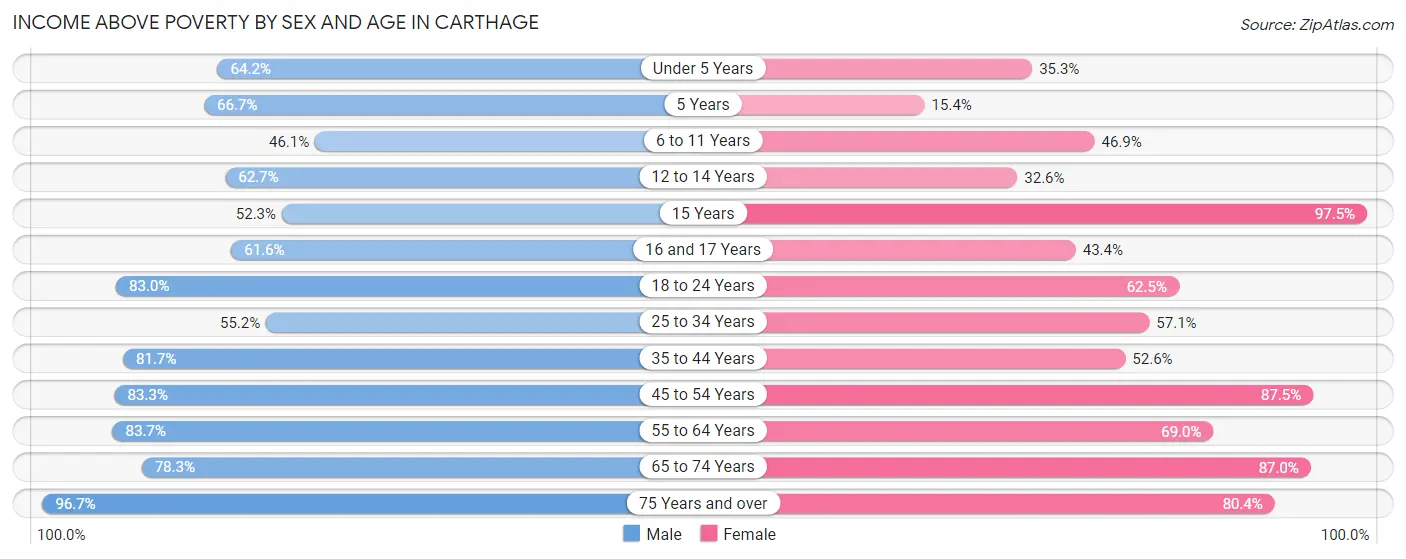
| Age Bracket | Male | Female |
| Under 5 Years | 410 (64.2%) | 235 (35.3%) |
| 5 Years | 56 (66.7%) | 8 (15.4%) |
| 6 to 11 Years | 413 (46.1%) | 235 (46.9%) |
| 12 to 14 Years | 165 (62.7%) | 248 (32.6%) |
| 15 Years | 93 (52.2%) | 231 (97.5%) |
| 16 and 17 Years | 212 (61.6%) | 106 (43.4%) |
| 18 to 24 Years | 601 (83.0%) | 494 (62.5%) |
| 25 to 34 Years | 607 (55.2%) | 406 (57.1%) |
| 35 to 44 Years | 706 (81.7%) | 699 (52.6%) |
| 45 to 54 Years | 609 (83.3%) | 943 (87.5%) |
| 55 to 64 Years | 466 (83.7%) | 442 (69.0%) |
| 65 to 74 Years | 313 (78.2%) | 483 (87.0%) |
| 75 Years and over | 233 (96.7%) | 409 (80.3%) |
| Total | 4,884 (69.6%) | 4,939 (61.2%) |
Income Below Poverty Among Married-Couple Families in Carthage
The poverty statistics for married-couple families in Carthage show that 23.4% or 471 of the total 2,017 families live below the poverty line. Families with 3 or 4 children have the highest poverty rate of 75.7%, comprising of 370 families. On the other hand, families with 1 or 2 children have the lowest poverty rate of 0.0%, which includes 0 families.
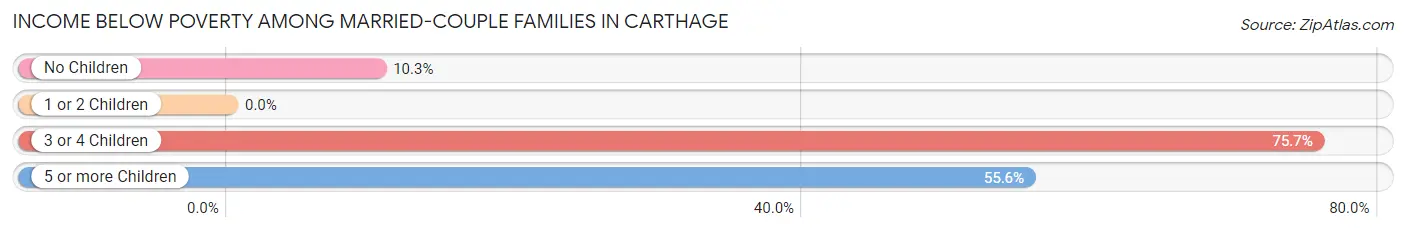
| Children | Above Poverty | Below Poverty |
| No Children | 747 (89.7%) | 86 (10.3%) |
| 1 or 2 Children | 668 (100.0%) | 0 (0.0%) |
| 3 or 4 Children | 119 (24.3%) | 370 (75.7%) |
| 5 or more Children | 12 (44.4%) | 15 (55.6%) |
| Total | 1,546 (76.6%) | 471 (23.4%) |
Income Below Poverty Among Single-Parent Households in Carthage
According to the poverty data in Carthage, 34.8% or 129 single-father households and 39.7% or 528 single-mother households are living below the poverty line. Among single-father households, those with 3 or 4 children have the highest poverty rate, with 78 households (100.0%) experiencing poverty. Likewise, among single-mother households, those with 1 or 2 children have the highest poverty rate, with 428 households (43.6%) falling below the poverty line.
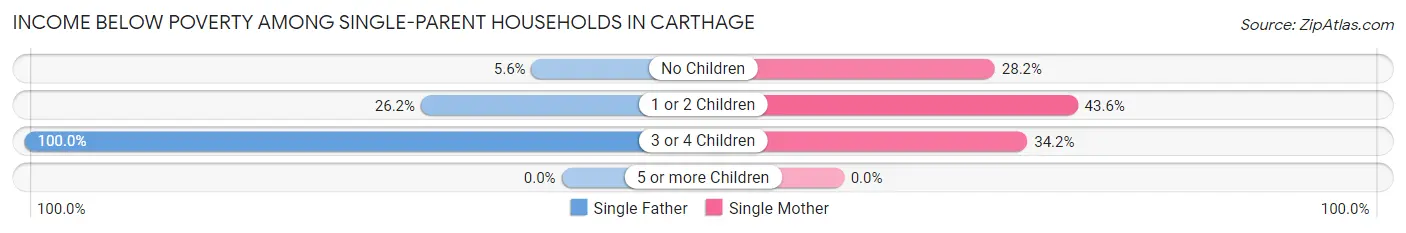
| Children | Single Father | Single Mother |
| No Children | 7 (5.6%) | 87 (28.2%) |
| 1 or 2 Children | 44 (26.2%) | 428 (43.6%) |
| 3 or 4 Children | 78 (100.0%) | 13 (34.2%) |
| 5 or more Children | 0 (0.0%) | 0 (0.0%) |
| Total | 129 (34.8%) | 528 (39.7%) |
Income Below Poverty Among Married-Couple vs Single-Parent Households in Carthage
The poverty data for Carthage shows that 471 of the married-couple family households (23.4%) and 657 of the single-parent households (38.7%) are living below the poverty level. Within the married-couple family households, those with 3 or 4 children have the highest poverty rate, with 370 households (75.7%) falling below the poverty line. Among the single-parent households, those with 3 or 4 children have the highest poverty rate, with 91 household (78.4%) living below poverty.
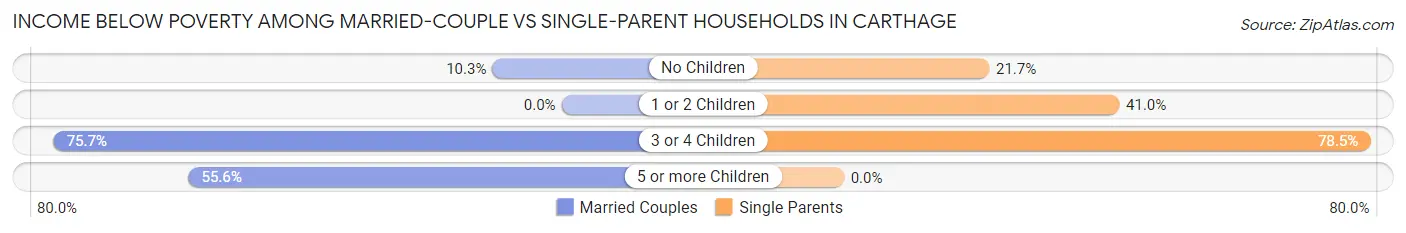
| Children | Married-Couple Families | Single-Parent Households |
| No Children | 86 (10.3%) | 94 (21.7%) |
| 1 or 2 Children | 0 (0.0%) | 472 (41.0%) |
| 3 or 4 Children | 370 (75.7%) | 91 (78.4%) |
| 5 or more Children | 15 (55.6%) | 0 (0.0%) |
| Total | 471 (23.4%) | 657 (38.7%) |
Race in Carthage
The most populous races in Carthage are White / Caucasian (12,032 | 77.7%), Hispanic or Latino (5,180 | 33.4%), and Two or more Races (1,587 | 10.2%).
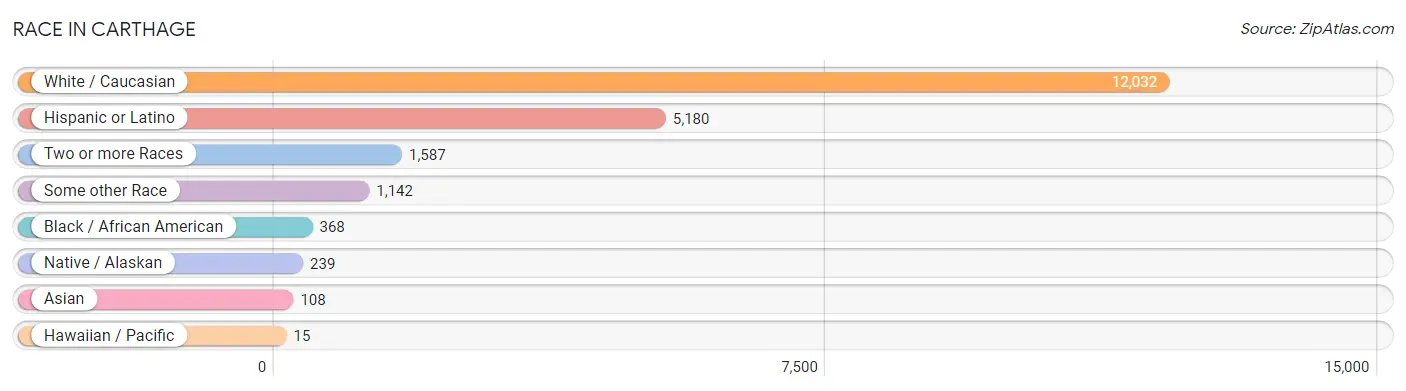
| Race | # Population | % Population |
| Asian | 108 | 0.7% |
| Black / African American | 368 | 2.4% |
| Hawaiian / Pacific | 15 | 0.1% |
| Hispanic or Latino | 5,180 | 33.4% |
| Native / Alaskan | 239 | 1.5% |
| White / Caucasian | 12,032 | 77.7% |
| Two or more Races | 1,587 | 10.2% |
| Some other Race | 1,142 | 7.4% |
| Total | 15,491 | 100.0% |
Ancestry in Carthage
The most populous ancestries reported in Carthage are Central American (3,481 | 22.5%), Guatemalan (3,036 | 19.6%), German (1,818 | 11.7%), American (1,730 | 11.2%), and English (1,368 | 8.8%), together accounting for 73.8% of all Carthage residents.
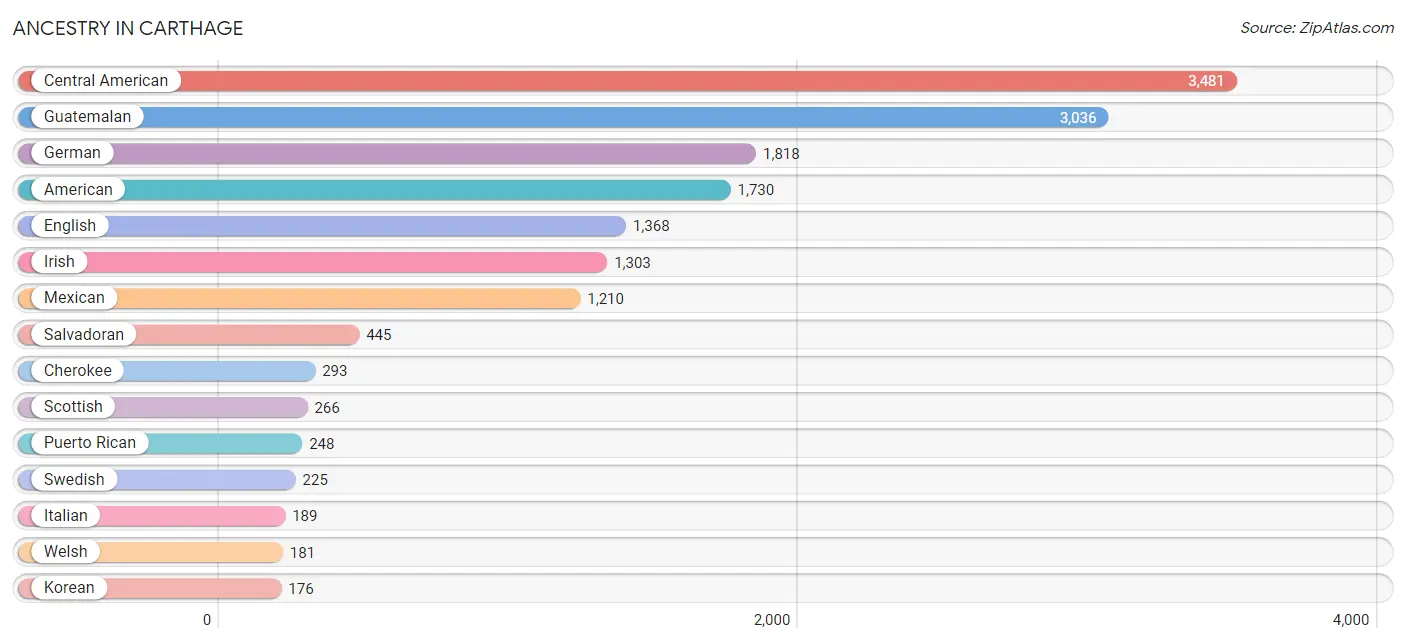
| Ancestry | # Population | % Population |
| American | 1,730 | 11.2% |
| Belgian | 4 | 0.0% |
| British | 53 | 0.3% |
| Central American | 3,481 | 22.5% |
| Cherokee | 293 | 1.9% |
| Choctaw | 36 | 0.2% |
| Creek | 18 | 0.1% |
| Czech | 18 | 0.1% |
| Dutch | 137 | 0.9% |
| Dutch West Indian | 1 | 0.0% |
| English | 1,368 | 8.8% |
| European | 86 | 0.6% |
| Fijian | 15 | 0.1% |
| Finnish | 120 | 0.8% |
| French | 129 | 0.8% |
| German | 1,818 | 11.7% |
| Guamanian / Chamorro | 7 | 0.1% |
| Guatemalan | 3,036 | 19.6% |
| Hungarian | 9 | 0.1% |
| Indian (Asian) | 31 | 0.2% |
| Iranian | 5 | 0.0% |
| Irish | 1,303 | 8.4% |
| Iroquois | 65 | 0.4% |
| Italian | 189 | 1.2% |
| Korean | 176 | 1.1% |
| Mexican | 1,210 | 7.8% |
| Navajo | 133 | 0.9% |
| Northern European | 14 | 0.1% |
| Pakistani | 22 | 0.1% |
| Polish | 111 | 0.7% |
| Puerto Rican | 248 | 1.6% |
| Romanian | 49 | 0.3% |
| Russian | 12 | 0.1% |
| Salvadoran | 445 | 2.9% |
| Scandinavian | 18 | 0.1% |
| Scotch-Irish | 157 | 1.0% |
| Scottish | 266 | 1.7% |
| Serbian | 15 | 0.1% |
| Spaniard | 166 | 1.1% |
| Spanish | 46 | 0.3% |
| Sri Lankan | 82 | 0.5% |
| Swedish | 225 | 1.5% |
| Welsh | 181 | 1.2% | View All 43 Rows |
Immigrants in Carthage
The most numerous immigrant groups reported in Carthage came from Central America (2,039 | 13.2%), Latin America (2,039 | 13.2%), Guatemala (1,309 | 8.5%), Mexico (500 | 3.2%), and El Salvador (226 | 1.5%), together accounting for 39.5% of all Carthage residents.
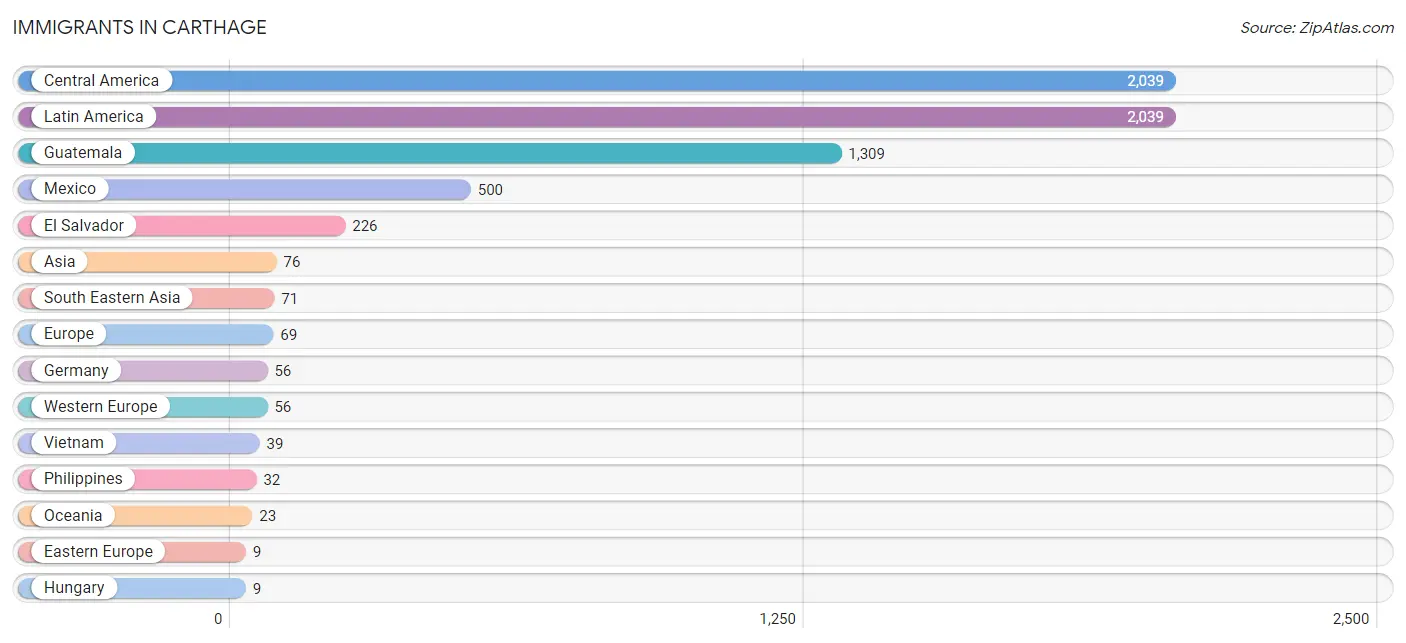
| Immigration Origin | # Population | % Population |
| Asia | 76 | 0.5% |
| Central America | 2,039 | 13.2% |
| Eastern Europe | 9 | 0.1% |
| El Salvador | 226 | 1.5% |
| England | 4 | 0.0% |
| Europe | 69 | 0.4% |
| Germany | 56 | 0.4% |
| Guatemala | 1,309 | 8.5% |
| Hungary | 9 | 0.1% |
| Iran | 5 | 0.0% |
| Latin America | 2,039 | 13.2% |
| Mexico | 500 | 3.2% |
| Micronesia | 8 | 0.1% |
| Northern Europe | 4 | 0.0% |
| Oceania | 23 | 0.2% |
| Philippines | 32 | 0.2% |
| South Central Asia | 5 | 0.0% |
| South Eastern Asia | 71 | 0.5% |
| Vietnam | 39 | 0.3% |
| Western Europe | 56 | 0.4% | View All 20 Rows |
Sex and Age in Carthage
Sex and Age in Carthage
The most populous age groups in Carthage are 10 to 14 Years (737 | 10.1%) for men and 10 to 14 Years (958 | 11.7%) for women.
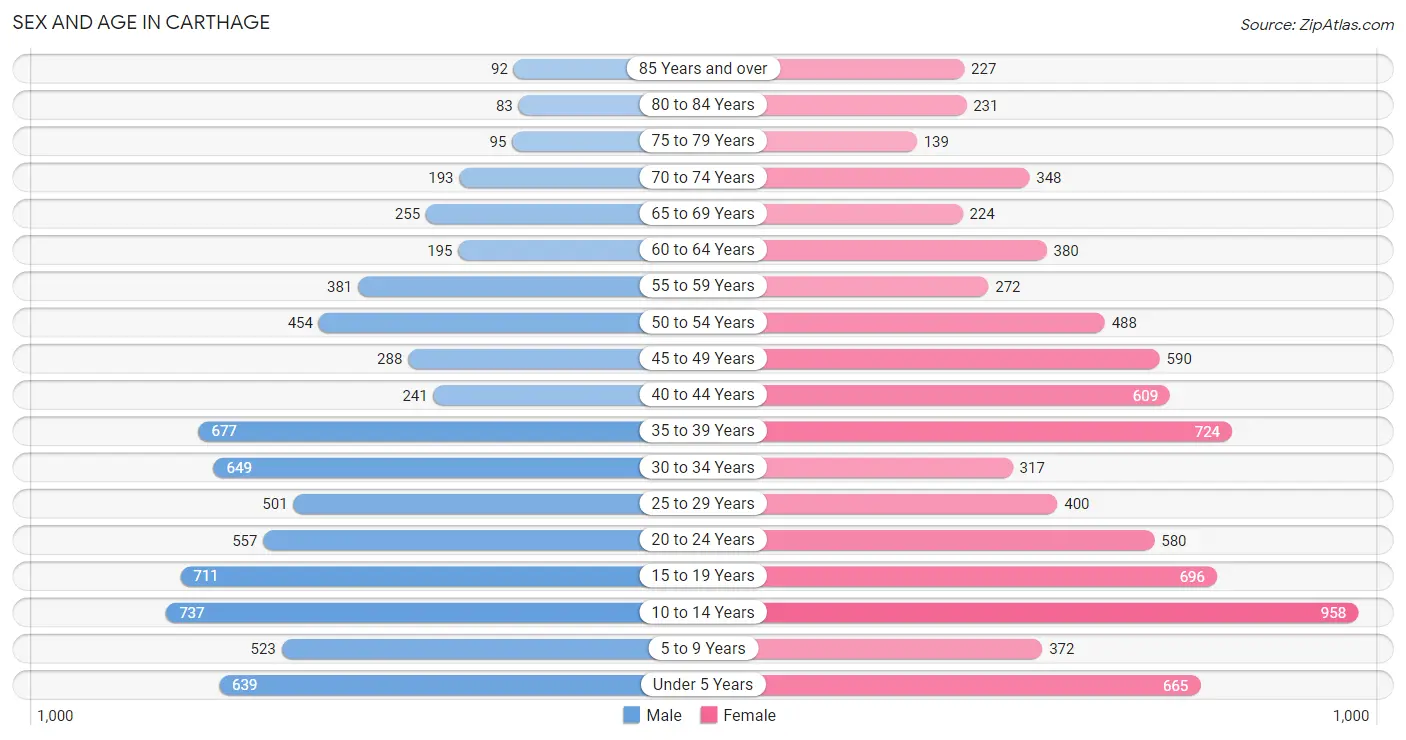
| Age Bracket | Male | Female |
| Under 5 Years | 639 (8.8%) | 665 (8.1%) |
| 5 to 9 Years | 523 (7.2%) | 372 (4.5%) |
| 10 to 14 Years | 737 (10.1%) | 958 (11.7%) |
| 15 to 19 Years | 711 (9.8%) | 696 (8.5%) |
| 20 to 24 Years | 557 (7.7%) | 580 (7.1%) |
| 25 to 29 Years | 501 (6.9%) | 400 (4.9%) |
| 30 to 34 Years | 649 (8.9%) | 317 (3.9%) |
| 35 to 39 Years | 677 (9.3%) | 724 (8.8%) |
| 40 to 44 Years | 241 (3.3%) | 609 (7.4%) |
| 45 to 49 Years | 288 (4.0%) | 590 (7.2%) |
| 50 to 54 Years | 454 (6.2%) | 488 (5.9%) |
| 55 to 59 Years | 381 (5.2%) | 272 (3.3%) |
| 60 to 64 Years | 195 (2.7%) | 380 (4.6%) |
| 65 to 69 Years | 255 (3.5%) | 224 (2.7%) |
| 70 to 74 Years | 193 (2.6%) | 348 (4.2%) |
| 75 to 79 Years | 95 (1.3%) | 139 (1.7%) |
| 80 to 84 Years | 83 (1.1%) | 231 (2.8%) |
| 85 Years and over | 92 (1.3%) | 227 (2.8%) |
| Total | 7,271 (100.0%) | 8,220 (100.0%) |
Families and Households in Carthage
Median Family Size in Carthage
The median family size in Carthage is 3.30 persons per family, with married-couple families (2,017 | 54.3%) accounting for the largest median family size of 3.73 persons per family. On the other hand, single female/mother families (1,329 | 35.7%) represent the smallest median family size with 2.64 persons per family.
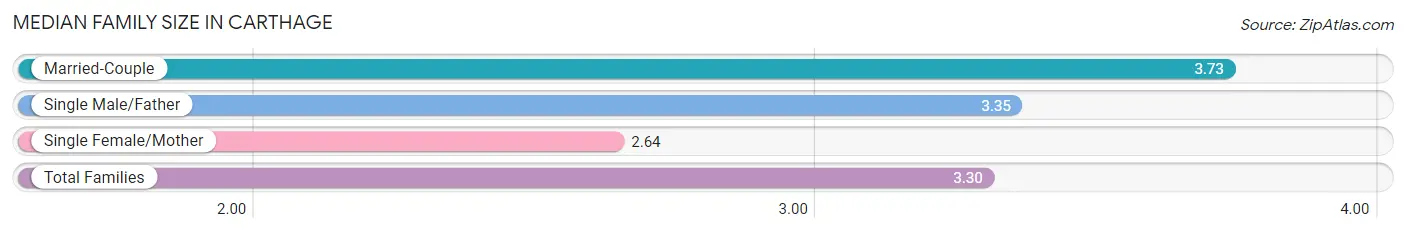
| Family Type | # Families | Family Size |
| Married-Couple | 2,017 (54.3%) | 3.73 |
| Single Male/Father | 371 (10.0%) | 3.35 |
| Single Female/Mother | 1,329 (35.7%) | 2.64 |
| Total Families | 3,717 (100.0%) | 3.30 |
Median Household Size in Carthage
The median household size in Carthage is 2.67 persons per household, with married-couple households (2,017 | 35.9%) accounting for the largest median household size of 3.78 persons per household. non-family households (1,895 | 33.8%) represent the smallest median household size with 1.08 persons per household.
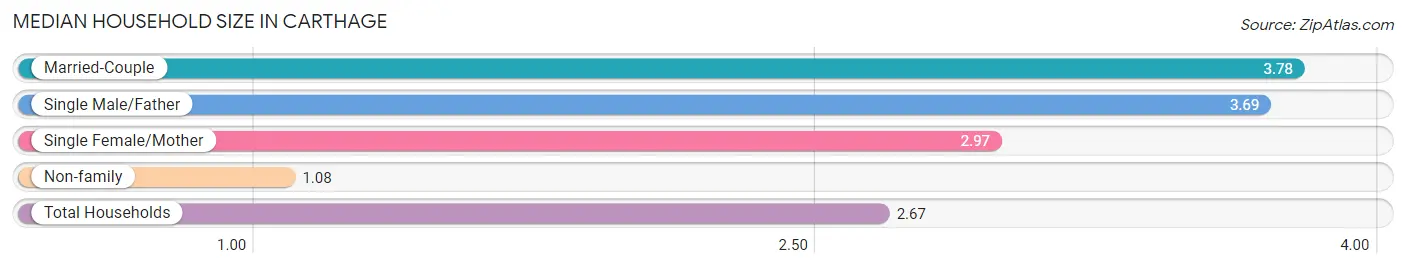
| Household Type | # Households | Household Size |
| Married-Couple | 2,017 (35.9%) | 3.78 |
| Single Male/Father | 371 (6.6%) | 3.69 |
| Single Female/Mother | 1,329 (23.7%) | 2.97 |
| Non-family | 1,895 (33.8%) | 1.08 |
| Total Households | 5,612 (100.0%) | 2.67 |
Household Size by Marriage Status in Carthage
Out of a total of 5,612 households in Carthage, 3,717 (66.2%) are family households, while 1,895 (33.8%) are nonfamily households. The most numerous type of family households are 2-person households, comprising 1,504, and the most common type of nonfamily households are 1-person households, comprising 1,665.
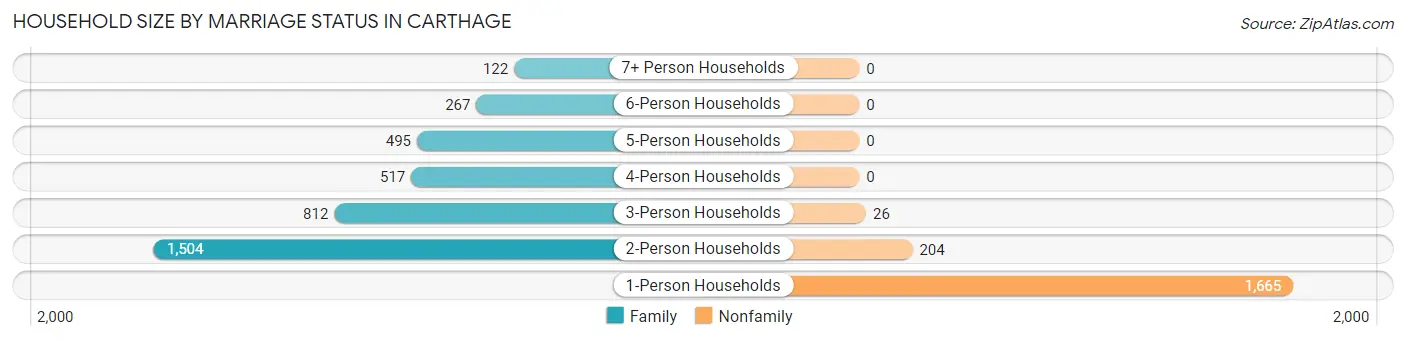
| Household Size | Family Households | Nonfamily Households |
| 1-Person Households | - | 1,665 (29.7%) |
| 2-Person Households | 1,504 (26.8%) | 204 (3.6%) |
| 3-Person Households | 812 (14.5%) | 26 (0.5%) |
| 4-Person Households | 517 (9.2%) | 0 (0.0%) |
| 5-Person Households | 495 (8.8%) | 0 (0.0%) |
| 6-Person Households | 267 (4.8%) | 0 (0.0%) |
| 7+ Person Households | 122 (2.2%) | 0 (0.0%) |
| Total | 3,717 (66.2%) | 1,895 (33.8%) |
Female Fertility in Carthage
Fertility by Age in Carthage
Average fertility rate in Carthage is 54.0 births per 1,000 women. Women in the age bracket of 20 to 34 years have the highest fertility rate with 87.0 births per 1,000 women. Women in the age bracket of 20 to 34 years acount for 50.9% of all women with births.
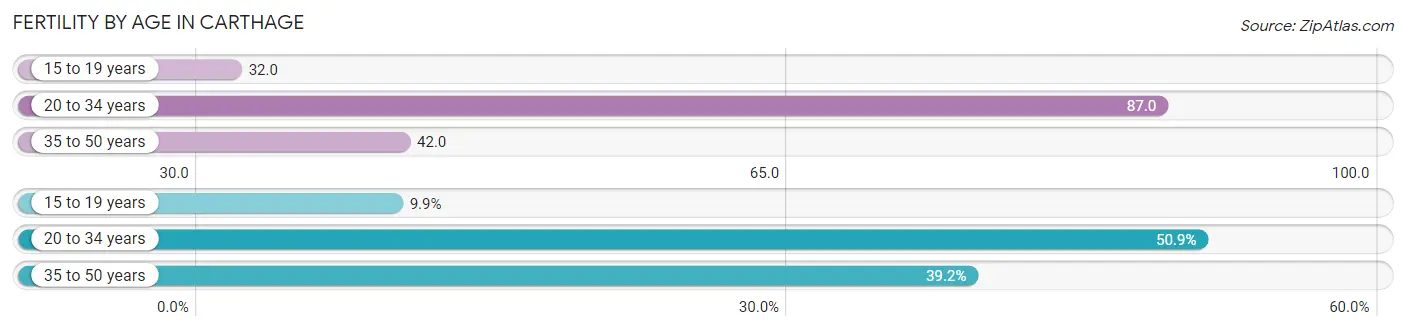
| Age Bracket | Women with Births | Births / 1,000 Women |
| 15 to 19 years | 22 (9.9%) | 32.0 |
| 20 to 34 years | 113 (50.9%) | 87.0 |
| 35 to 50 years | 87 (39.2%) | 42.0 |
| Total | 222 (100.0%) | 54.0 |
Fertility by Age by Marriage Status in Carthage
70.7% of women with births (222) in Carthage are married. The highest percentage of unmarried women with births falls into 35 to 50 years age bracket with 48.3% of them unmarried at the time of birth, while the lowest percentage of unmarried women with births belong to 15 to 19 years age bracket with 0.0% of them unmarried.
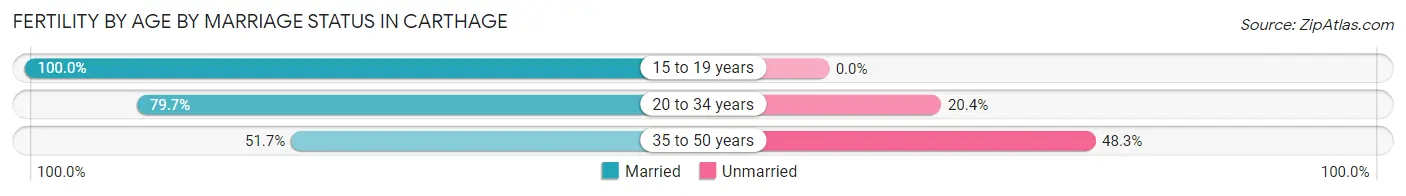
| Age Bracket | Married | Unmarried |
| 15 to 19 years | 22 (100.0%) | 0 (0.0%) |
| 20 to 34 years | 90 (79.6%) | 23 (20.3%) |
| 35 to 50 years | 45 (51.7%) | 42 (48.3%) |
| Total | 157 (70.7%) | 65 (29.3%) |
Fertility by Education in Carthage
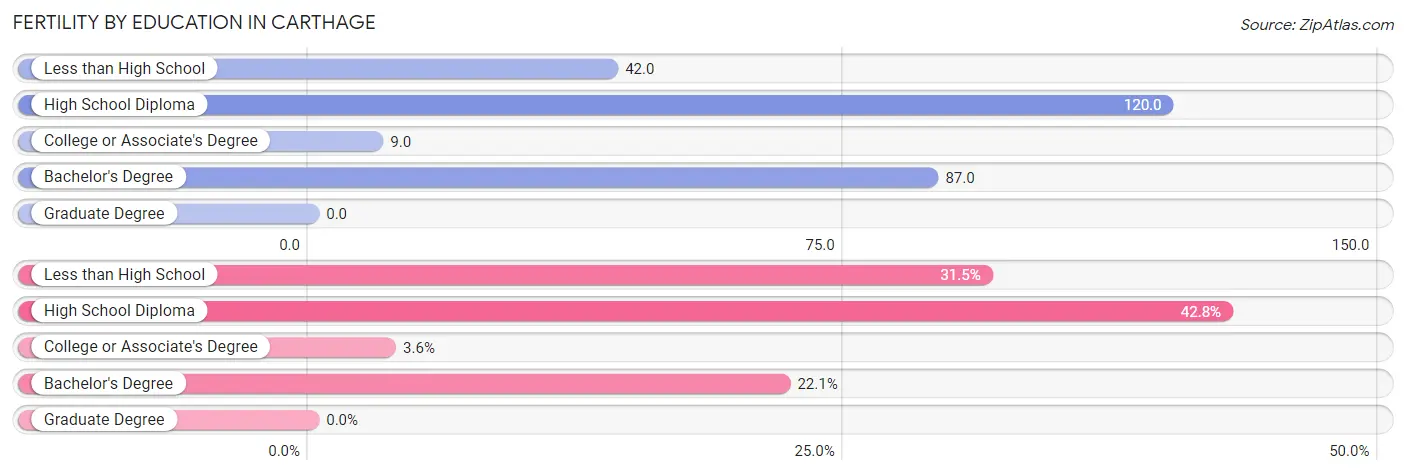
| Educational Attainment | Women with Births | Births / 1,000 Women |
| Less than High School | 70 (31.5%) | 42.0 |
| High School Diploma | 95 (42.8%) | 120.0 |
| College or Associate's Degree | 8 (3.6%) | 9.0 |
| Bachelor's Degree | 49 (22.1%) | 87.0 |
| Graduate Degree | 0 (0.0%) | 0.0 |
| Total | 222 (100.0%) | 54.0 |
Fertility by Education by Marriage Status in Carthage
29.3% of women with births in Carthage are unmarried. Women with the educational attainment of less than high school are most likely to be married with 100.0% of them married at childbirth, while women with the educational attainment of high school diploma are least likely to be married with 55.8% of them unmarried at childbirth.
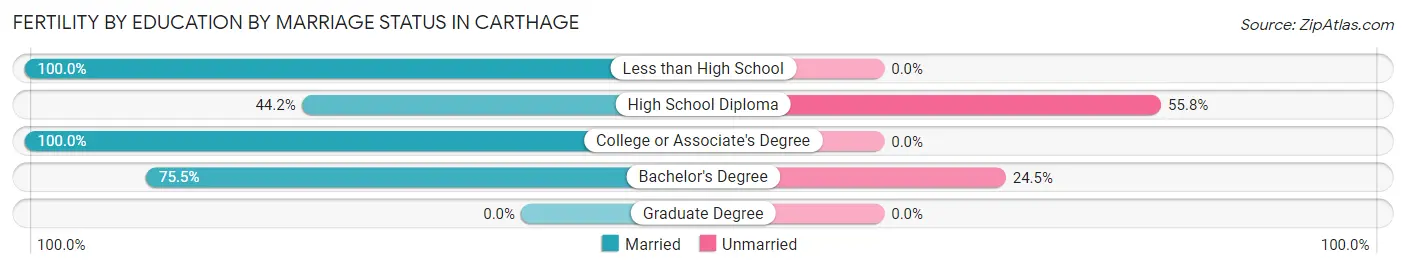
| Educational Attainment | Married | Unmarried |
| Less than High School | 70 (100.0%) | 0 (0.0%) |
| High School Diploma | 42 (44.2%) | 53 (55.8%) |
| College or Associate's Degree | 8 (100.0%) | 0 (0.0%) |
| Bachelor's Degree | 37 (75.5%) | 12 (24.5%) |
| Graduate Degree | 0 (0.0%) | 0 (0.0%) |
| Total | 157 (70.7%) | 65 (29.3%) |
Employment Characteristics in Carthage
Employment by Class of Employer in Carthage
Among the 6,000 employed individuals in Carthage, private company employees (3,981 | 66.3%), not-for-profit organizations (602 | 10.0%), and self-employed (not incorporated) (495 | 8.3%) make up the most common classes of employment.
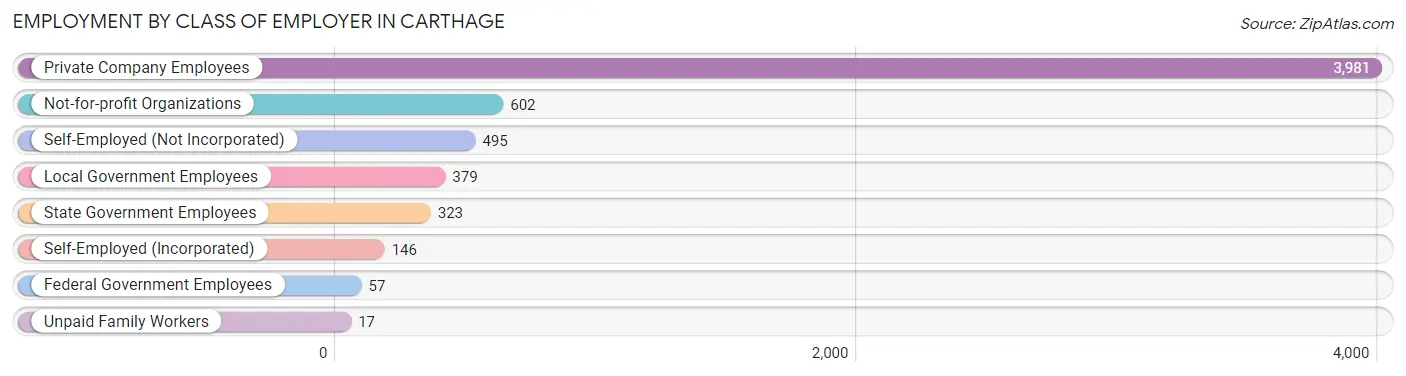
| Employer Class | # Employees | % Employees |
| Private Company Employees | 3,981 | 66.3% |
| Self-Employed (Incorporated) | 146 | 2.4% |
| Self-Employed (Not Incorporated) | 495 | 8.3% |
| Not-for-profit Organizations | 602 | 10.0% |
| Local Government Employees | 379 | 6.3% |
| State Government Employees | 323 | 5.4% |
| Federal Government Employees | 57 | 0.9% |
| Unpaid Family Workers | 17 | 0.3% |
| Total | 6,000 | 100.0% |
Employment Status by Age in Carthage
According to the labor force statistics for Carthage, out of the total population over 16 years of age (11,182), 57.7% or 6,452 individuals are in the labor force, with 4.4% or 284 of them unemployed. The age group with the highest labor force participation rate is 25 to 29 years, with 91.8% or 827 individuals in the labor force. Within the labor force, the 16 to 19 years age range has the highest percentage of unemployed individuals, with 16.2% or 50 of them being unemployed.
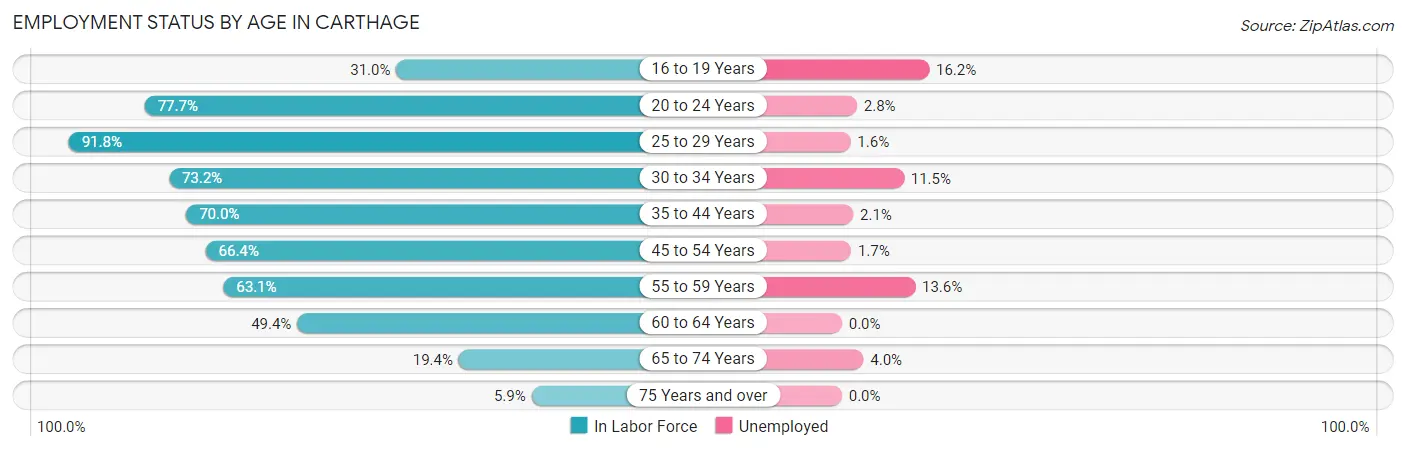
| Age Bracket | In Labor Force | Unemployed |
| 16 to 19 Years | 308 (31.0%) | 50 (16.2%) |
| 20 to 24 Years | 883 (77.7%) | 25 (2.8%) |
| 25 to 29 Years | 827 (91.8%) | 13 (1.6%) |
| 30 to 34 Years | 707 (73.2%) | 81 (11.5%) |
| 35 to 44 Years | 1,576 (70.0%) | 33 (2.1%) |
| 45 to 54 Years | 1,208 (66.4%) | 21 (1.7%) |
| 55 to 59 Years | 412 (63.1%) | 56 (13.6%) |
| 60 to 64 Years | 284 (49.4%) | 0 (0.0%) |
| 65 to 74 Years | 198 (19.4%) | 8 (4.0%) |
| 75 Years and over | 51 (5.9%) | 0 (0.0%) |
| Total | 6,452 (57.7%) | 284 (4.4%) |
Employment Status by Educational Attainment in Carthage
According to labor force statistics for Carthage, 70.0% of individuals (5,016) out of the total population between 25 and 64 years of age (7,166) are in the labor force, with 4.0% or 201 of them being unemployed. The group with the highest labor force participation rate are those with the educational attainment of bachelor's degree or higher, with 86.9% or 1,395 individuals in the labor force. Within the labor force, individuals with college / associate degree education have the highest percentage of unemployment, with 8.4% or 89 of them being unemployed.
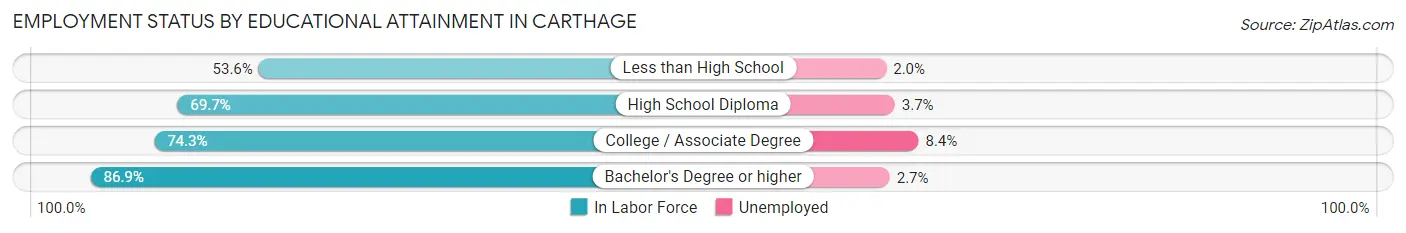
| Educational Attainment | In Labor Force | Unemployed |
| Less than High School | 1,075 (53.6%) | 40 (2.0%) |
| High School Diploma | 1,478 (69.7%) | 78 (3.7%) |
| College / Associate Degree | 1,065 (74.3%) | 120 (8.4%) |
| Bachelor's Degree or higher | 1,395 (86.9%) | 43 (2.7%) |
| Total | 5,016 (70.0%) | 287 (4.0%) |
Employment Occupations by Sex in Carthage
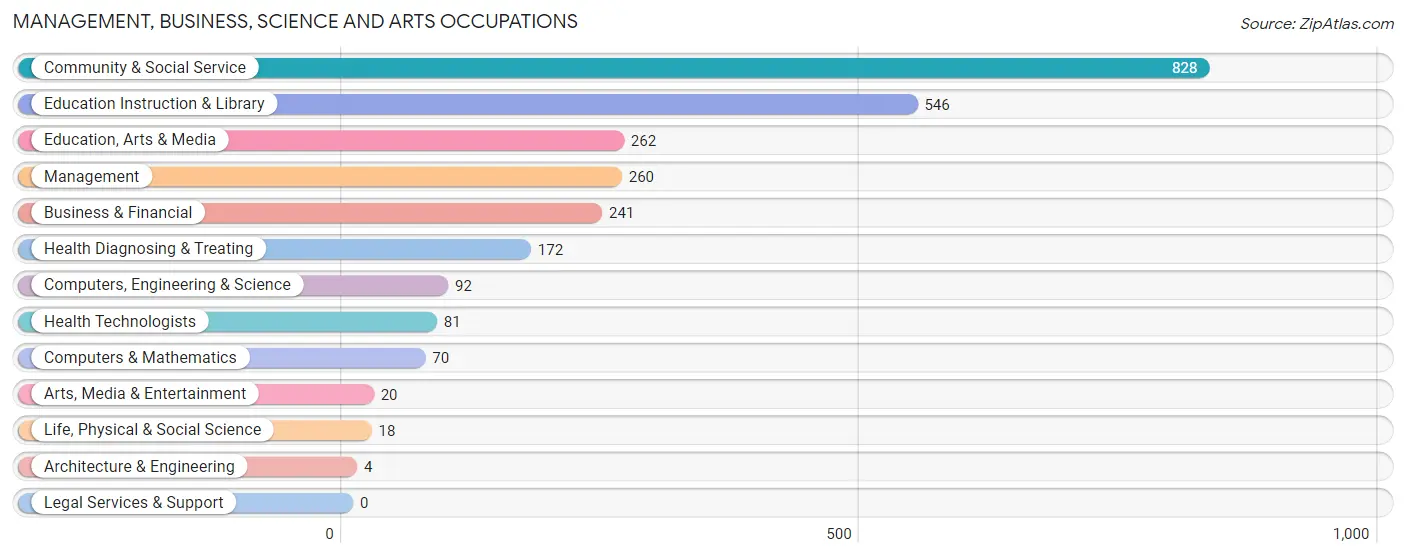
Management, Business, Science and Arts Occupations
The most common Management, Business, Science and Arts occupations in Carthage are Community & Social Service (828 | 13.4%), Education Instruction & Library (546 | 8.8%), Education, Arts & Media (262 | 4.3%), Management (260 | 4.2%), and Business & Financial (241 | 3.9%).
Management, Business, Science and Arts Occupations by Sex
Within the Management, Business, Science and Arts occupations in Carthage, the most male-oriented occupations are Computers, Engineering & Science (100.0%), Computers & Mathematics (100.0%), and Architecture & Engineering (100.0%), while the most female-oriented occupations are Health Diagnosing & Treating (90.1%), Education Instruction & Library (86.6%), and Health Technologists (79.0%).
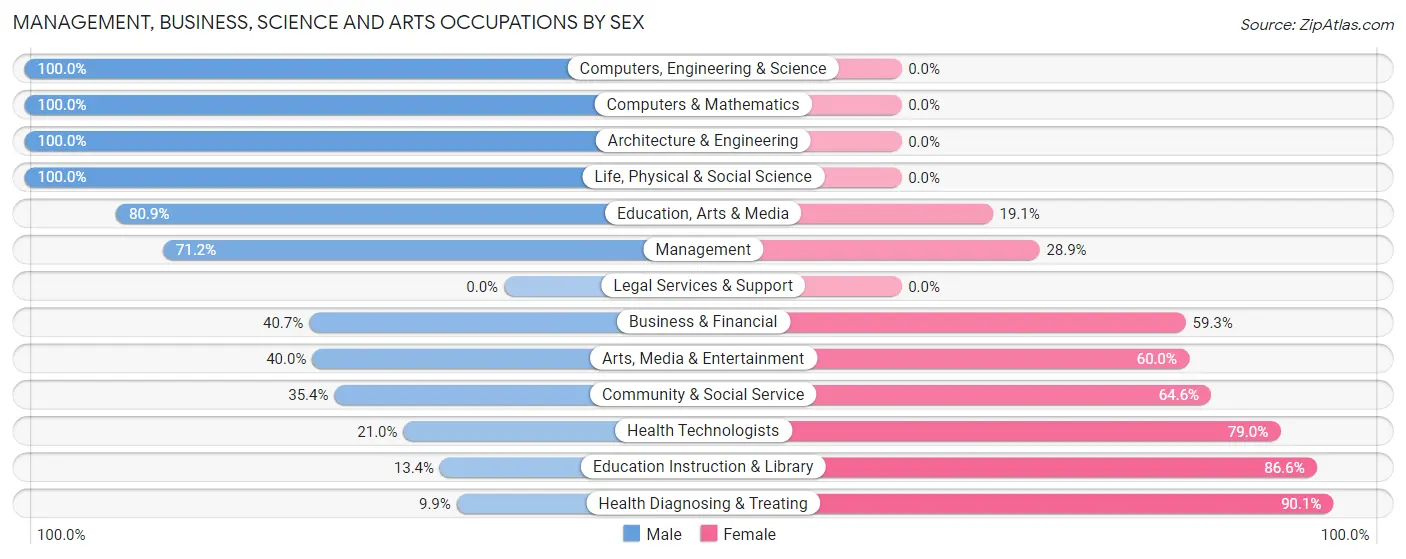
| Occupation | Male | Female |
| Management | 185 (71.2%) | 75 (28.8%) |
| Business & Financial | 98 (40.7%) | 143 (59.3%) |
| Computers, Engineering & Science | 92 (100.0%) | 0 (0.0%) |
| Computers & Mathematics | 70 (100.0%) | 0 (0.0%) |
| Architecture & Engineering | 4 (100.0%) | 0 (0.0%) |
| Life, Physical & Social Science | 18 (100.0%) | 0 (0.0%) |
| Community & Social Service | 293 (35.4%) | 535 (64.6%) |
| Education, Arts & Media | 212 (80.9%) | 50 (19.1%) |
| Legal Services & Support | 0 (0.0%) | 0 (0.0%) |
| Education Instruction & Library | 73 (13.4%) | 473 (86.6%) |
| Arts, Media & Entertainment | 8 (40.0%) | 12 (60.0%) |
| Health Diagnosing & Treating | 17 (9.9%) | 155 (90.1%) |
| Health Technologists | 17 (21.0%) | 64 (79.0%) |
| Total (Category) | 685 (43.0%) | 908 (57.0%) |
| Total (Overall) | 3,257 (52.8%) | 2,911 (47.2%) |
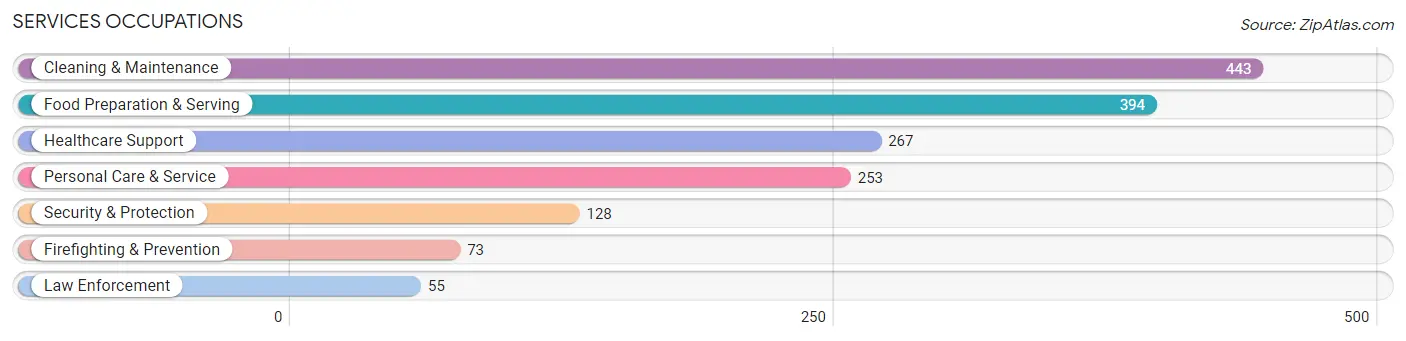
Services Occupations
The most common Services occupations in Carthage are Cleaning & Maintenance (443 | 7.2%), Food Preparation & Serving (394 | 6.4%), Healthcare Support (267 | 4.3%), Personal Care & Service (253 | 4.1%), and Security & Protection (128 | 2.1%).
Services Occupations by Sex
Within the Services occupations in Carthage, the most male-oriented occupations are Law Enforcement (100.0%), Security & Protection (93.0%), and Firefighting & Prevention (87.7%), while the most female-oriented occupations are Healthcare Support (98.1%), Personal Care & Service (91.7%), and Food Preparation & Serving (73.4%).
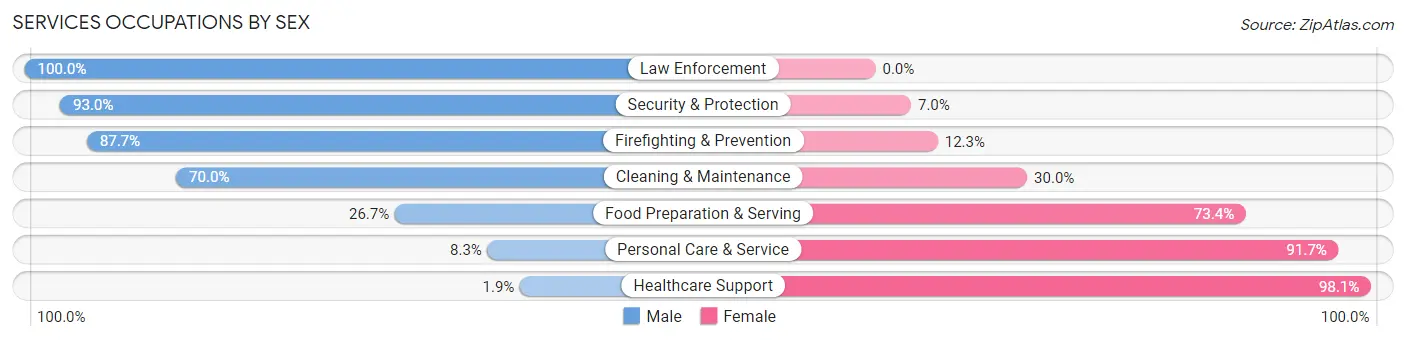
| Occupation | Male | Female |
| Healthcare Support | 5 (1.9%) | 262 (98.1%) |
| Security & Protection | 119 (93.0%) | 9 (7.0%) |
| Firefighting & Prevention | 64 (87.7%) | 9 (12.3%) |
| Law Enforcement | 55 (100.0%) | 0 (0.0%) |
| Food Preparation & Serving | 105 (26.7%) | 289 (73.4%) |
| Cleaning & Maintenance | 310 (70.0%) | 133 (30.0%) |
| Personal Care & Service | 21 (8.3%) | 232 (91.7%) |
| Total (Category) | 560 (37.7%) | 925 (62.3%) |
| Total (Overall) | 3,257 (52.8%) | 2,911 (47.2%) |
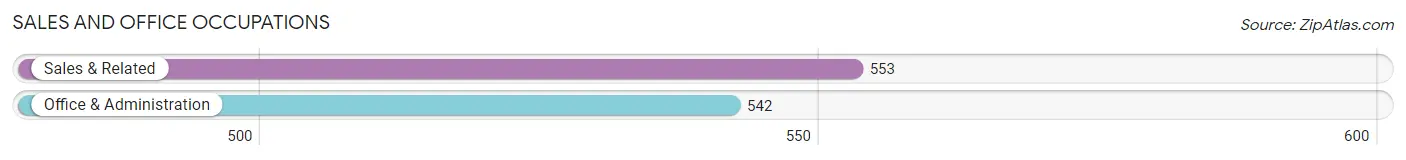
Sales and Office Occupations
The most common Sales and Office occupations in Carthage are Sales & Related (553 | 9.0%), and Office & Administration (542 | 8.8%).
Sales and Office Occupations by Sex
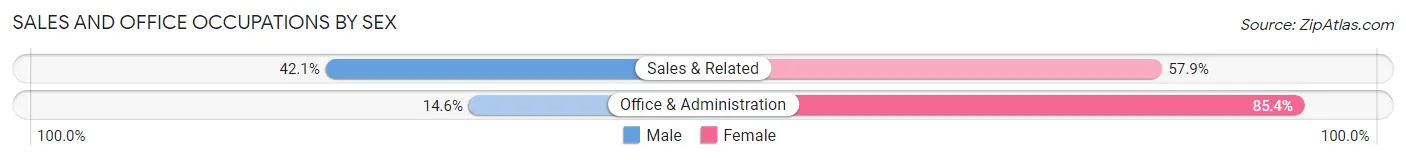
| Occupation | Male | Female |
| Sales & Related | 233 (42.1%) | 320 (57.9%) |
| Office & Administration | 79 (14.6%) | 463 (85.4%) |
| Total (Category) | 312 (28.5%) | 783 (71.5%) |
| Total (Overall) | 3,257 (52.8%) | 2,911 (47.2%) |
Natural Resources, Construction and Maintenance Occupations
The most common Natural Resources, Construction and Maintenance occupations in Carthage are Construction & Extraction (334 | 5.4%), Installation, Maintenance & Repair (217 | 3.5%), and Farming, Fishing & Forestry (33 | 0.5%).
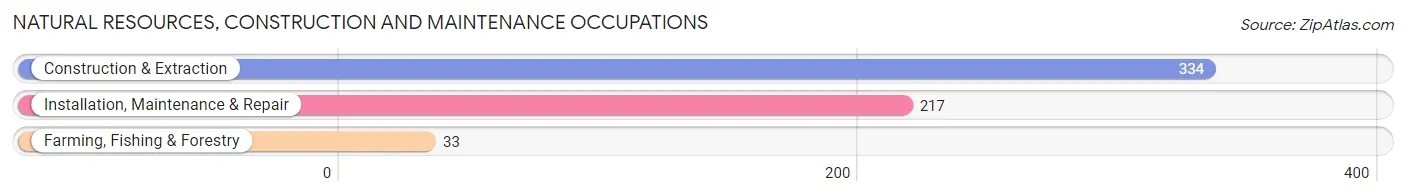
Natural Resources, Construction and Maintenance Occupations by Sex
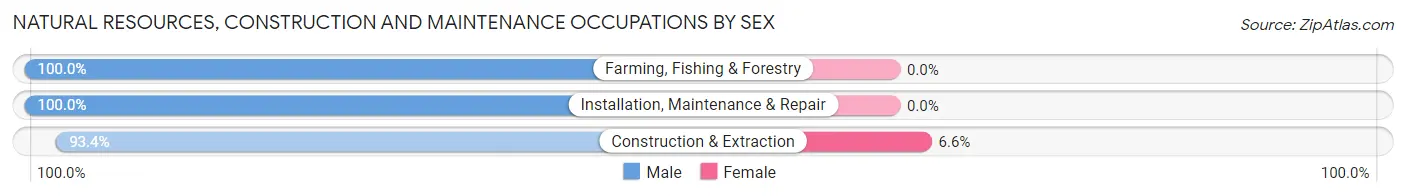
| Occupation | Male | Female |
| Farming, Fishing & Forestry | 33 (100.0%) | 0 (0.0%) |
| Construction & Extraction | 312 (93.4%) | 22 (6.6%) |
| Installation, Maintenance & Repair | 217 (100.0%) | 0 (0.0%) |
| Total (Category) | 562 (96.2%) | 22 (3.8%) |
| Total (Overall) | 3,257 (52.8%) | 2,911 (47.2%) |
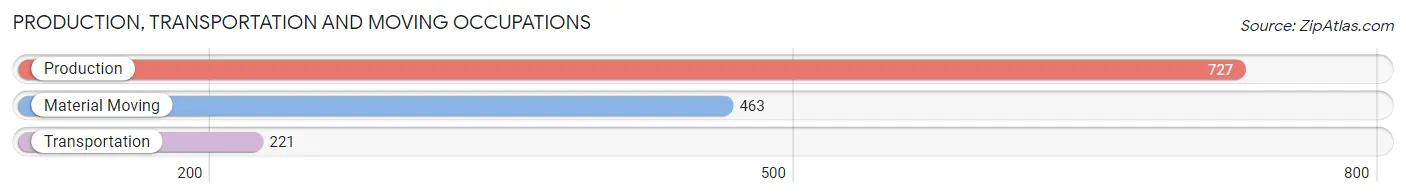
Production, Transportation and Moving Occupations
The most common Production, Transportation and Moving occupations in Carthage are Production (727 | 11.8%), Material Moving (463 | 7.5%), and Transportation (221 | 3.6%).
Production, Transportation and Moving Occupations by Sex
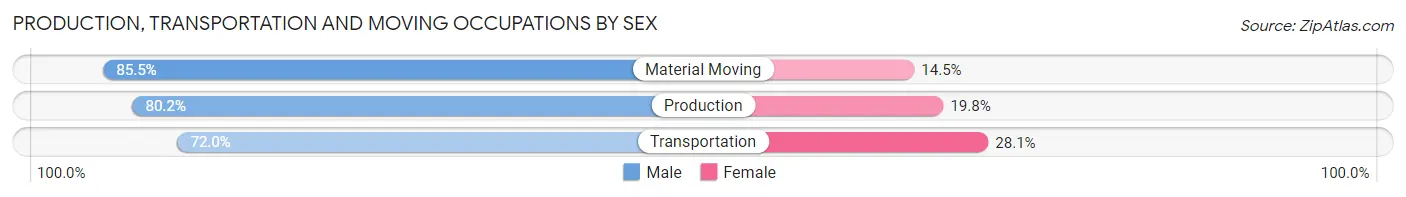
| Occupation | Male | Female |
| Production | 583 (80.2%) | 144 (19.8%) |
| Transportation | 159 (72.0%) | 62 (28.1%) |
| Material Moving | 396 (85.5%) | 67 (14.5%) |
| Total (Category) | 1,138 (80.6%) | 273 (19.4%) |
| Total (Overall) | 3,257 (52.8%) | 2,911 (47.2%) |
Employment Industries by Sex in Carthage
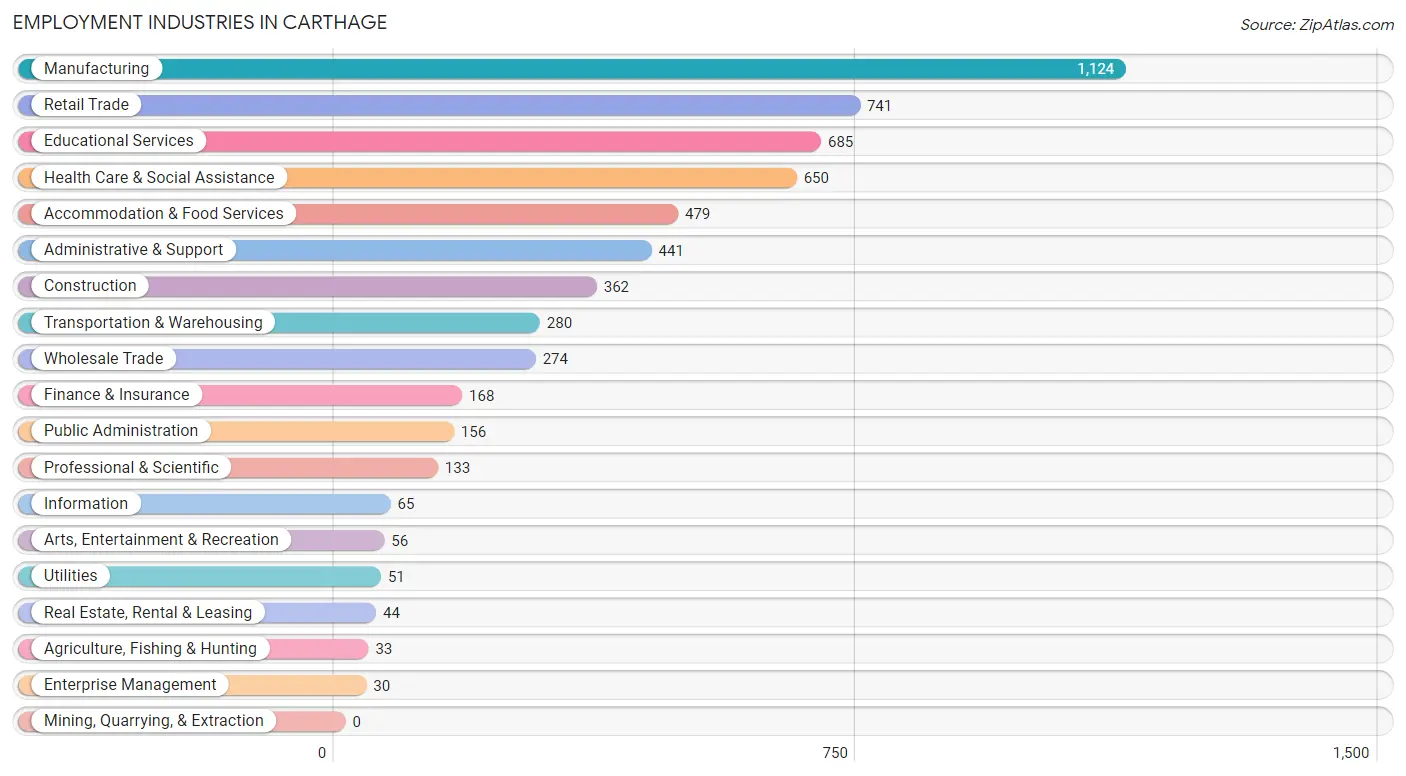
Employment Industries in Carthage
The major employment industries in Carthage include Manufacturing (1,124 | 18.2%), Retail Trade (741 | 12.0%), Educational Services (685 | 11.1%), Health Care & Social Assistance (650 | 10.5%), and Accommodation & Food Services (479 | 7.8%).
Employment Industries by Sex in Carthage
The Carthage industries that see more men than women are Agriculture, Fishing & Hunting (100.0%), Real Estate, Rental & Leasing (100.0%), and Construction (93.9%), whereas the industries that tend to have a higher number of women are Enterprise Management (100.0%), Health Care & Social Assistance (92.9%), and Educational Services (78.5%).
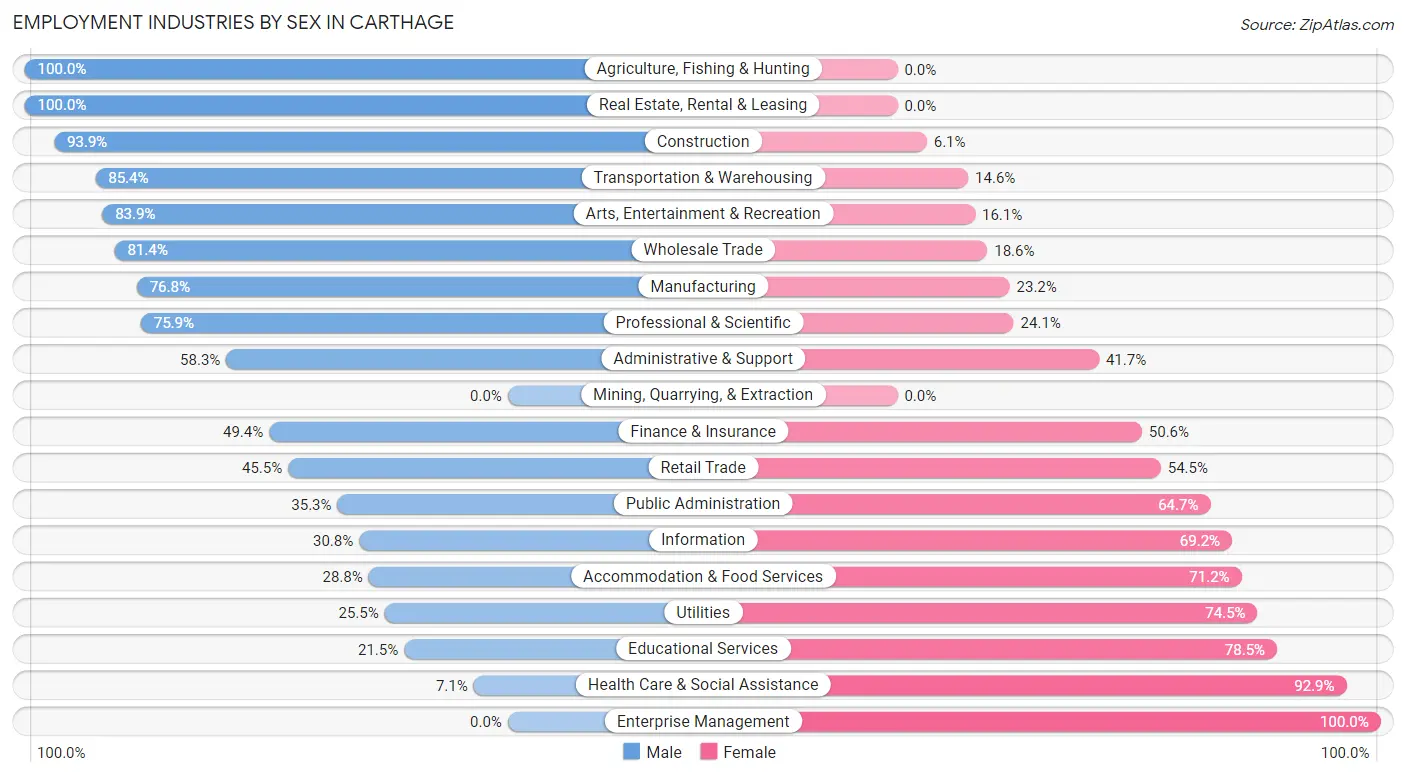
| Industry | Male | Female |
| Agriculture, Fishing & Hunting | 33 (100.0%) | 0 (0.0%) |
| Mining, Quarrying, & Extraction | 0 (0.0%) | 0 (0.0%) |
| Construction | 340 (93.9%) | 22 (6.1%) |
| Manufacturing | 863 (76.8%) | 261 (23.2%) |
| Wholesale Trade | 223 (81.4%) | 51 (18.6%) |
| Retail Trade | 337 (45.5%) | 404 (54.5%) |
| Transportation & Warehousing | 239 (85.4%) | 41 (14.6%) |
| Utilities | 13 (25.5%) | 38 (74.5%) |
| Information | 20 (30.8%) | 45 (69.2%) |
| Finance & Insurance | 83 (49.4%) | 85 (50.6%) |
| Real Estate, Rental & Leasing | 44 (100.0%) | 0 (0.0%) |
| Professional & Scientific | 101 (75.9%) | 32 (24.1%) |
| Enterprise Management | 0 (0.0%) | 30 (100.0%) |
| Administrative & Support | 257 (58.3%) | 184 (41.7%) |
| Educational Services | 147 (21.5%) | 538 (78.5%) |
| Health Care & Social Assistance | 46 (7.1%) | 604 (92.9%) |
| Arts, Entertainment & Recreation | 47 (83.9%) | 9 (16.1%) |
| Accommodation & Food Services | 138 (28.8%) | 341 (71.2%) |
| Public Administration | 55 (35.3%) | 101 (64.7%) |
| Total | 3,257 (52.8%) | 2,911 (47.2%) |
Education in Carthage
School Enrollment in Carthage
The most common levels of schooling among the 4,437 students in Carthage are middle school (1,463 | 33.0%), high school (1,219 | 27.5%), and elementary school (722 | 16.3%).
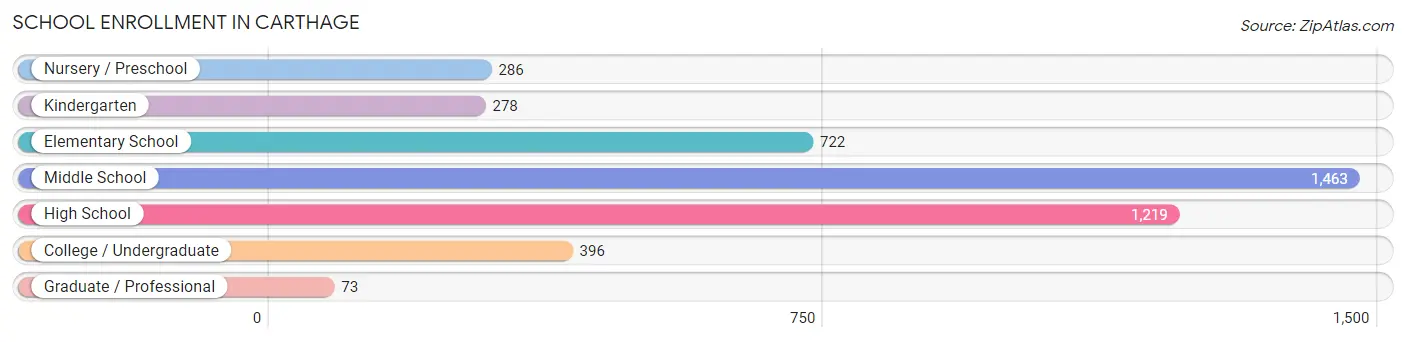
| School Level | # Students | % Students |
| Nursery / Preschool | 286 | 6.5% |
| Kindergarten | 278 | 6.3% |
| Elementary School | 722 | 16.3% |
| Middle School | 1,463 | 33.0% |
| High School | 1,219 | 27.5% |
| College / Undergraduate | 396 | 8.9% |
| Graduate / Professional | 73 | 1.7% |
| Total | 4,437 | 100.0% |
School Enrollment by Age by Funding Source in Carthage
Out of a total of 4,437 students who are enrolled in schools in Carthage, 466 (10.5%) attend a private institution, while the remaining 3,971 (89.5%) are enrolled in public schools. The age group of 3 to 4 year olds has the highest likelihood of being enrolled in private schools, with 77 (27.0% in the age bracket) enrolled. Conversely, the age group of 35 years and over has the lowest likelihood of being enrolled in a private school, with 76 (100.0% in the age bracket) attending a public institution.
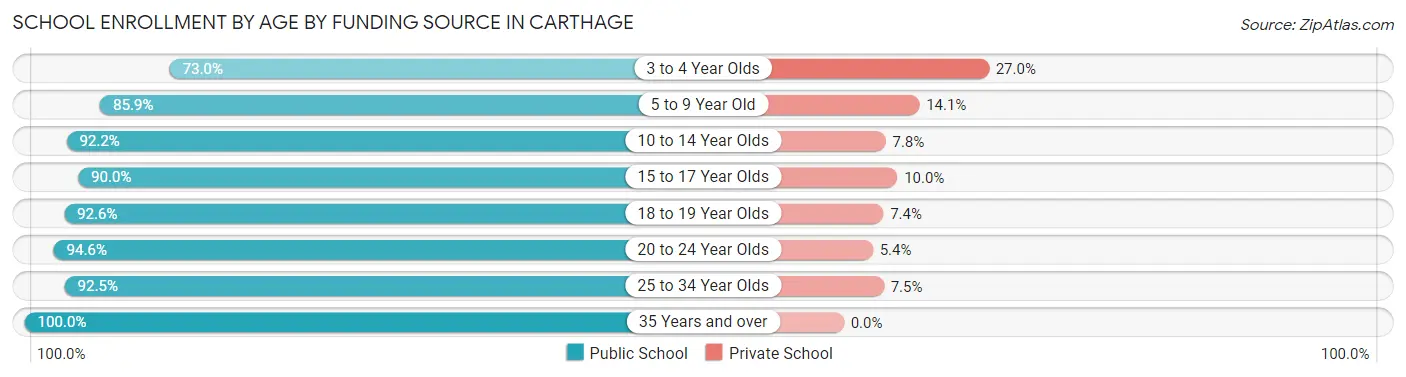
| Age Bracket | Public School | Private School |
| 3 to 4 Year Olds | 208 (73.0%) | 77 (27.0%) |
| 5 to 9 Year Old | 751 (85.9%) | 123 (14.1%) |
| 10 to 14 Year Olds | 1,548 (92.2%) | 131 (7.8%) |
| 15 to 17 Year Olds | 903 (90.0%) | 100 (10.0%) |
| 18 to 19 Year Olds | 214 (92.6%) | 17 (7.4%) |
| 20 to 24 Year Olds | 210 (94.6%) | 12 (5.4%) |
| 25 to 34 Year Olds | 62 (92.5%) | 5 (7.5%) |
| 35 Years and over | 76 (100.0%) | 0 (0.0%) |
| Total | 3,971 (89.5%) | 466 (10.5%) |
Educational Attainment by Field of Study in Carthage
Education (519 | 24.9%), business (383 | 18.4%), liberal arts & history (291 | 14.0%), science & technology (214 | 10.3%), and literature & languages (115 | 5.5%) are the most common fields of study among 2,086 individuals in Carthage who have obtained a bachelor's degree or higher.
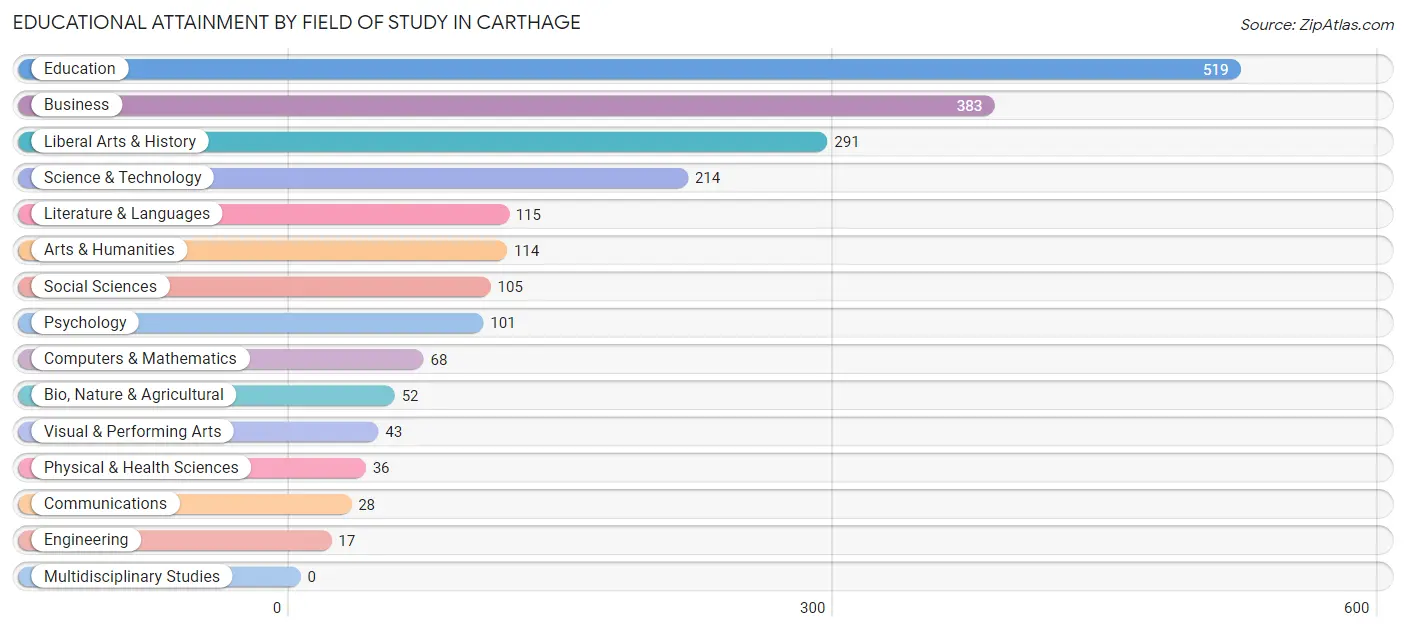
| Field of Study | # Graduates | % Graduates |
| Computers & Mathematics | 68 | 3.3% |
| Bio, Nature & Agricultural | 52 | 2.5% |
| Physical & Health Sciences | 36 | 1.7% |
| Psychology | 101 | 4.8% |
| Social Sciences | 105 | 5.0% |
| Engineering | 17 | 0.8% |
| Multidisciplinary Studies | 0 | 0.0% |
| Science & Technology | 214 | 10.3% |
| Business | 383 | 18.4% |
| Education | 519 | 24.9% |
| Literature & Languages | 115 | 5.5% |
| Liberal Arts & History | 291 | 14.0% |
| Visual & Performing Arts | 43 | 2.1% |
| Communications | 28 | 1.3% |
| Arts & Humanities | 114 | 5.5% |
| Total | 2,086 | 100.0% |
Transportation & Commute in Carthage
Vehicle Availability by Sex in Carthage
The most prevalent vehicle ownership categories in Carthage are males with 2 vehicles (1,178, accounting for 37.0%) and females with 2 vehicles (1,055, making up 42.0%).
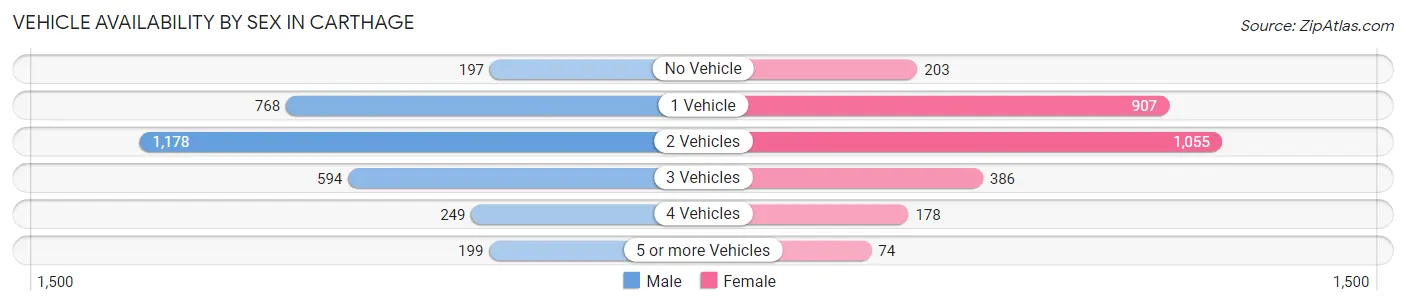
| Vehicles Available | Male | Female |
| No Vehicle | 197 (6.2%) | 203 (7.2%) |
| 1 Vehicle | 768 (24.1%) | 907 (32.4%) |
| 2 Vehicles | 1,178 (37.0%) | 1,055 (37.6%) |
| 3 Vehicles | 594 (18.6%) | 386 (13.8%) |
| 4 Vehicles | 249 (7.8%) | 178 (6.4%) |
| 5 or more Vehicles | 199 (6.2%) | 74 (2.6%) |
| Total | 3,185 (100.0%) | 2,803 (100.0%) |
Commute Time in Carthage
The most frequently occuring commute durations in Carthage are 10 to 14 minutes (1,398 commuters, 25.1%), 5 to 9 minutes (1,385 commuters, 24.9%), and 20 to 24 minutes (826 commuters, 14.8%).
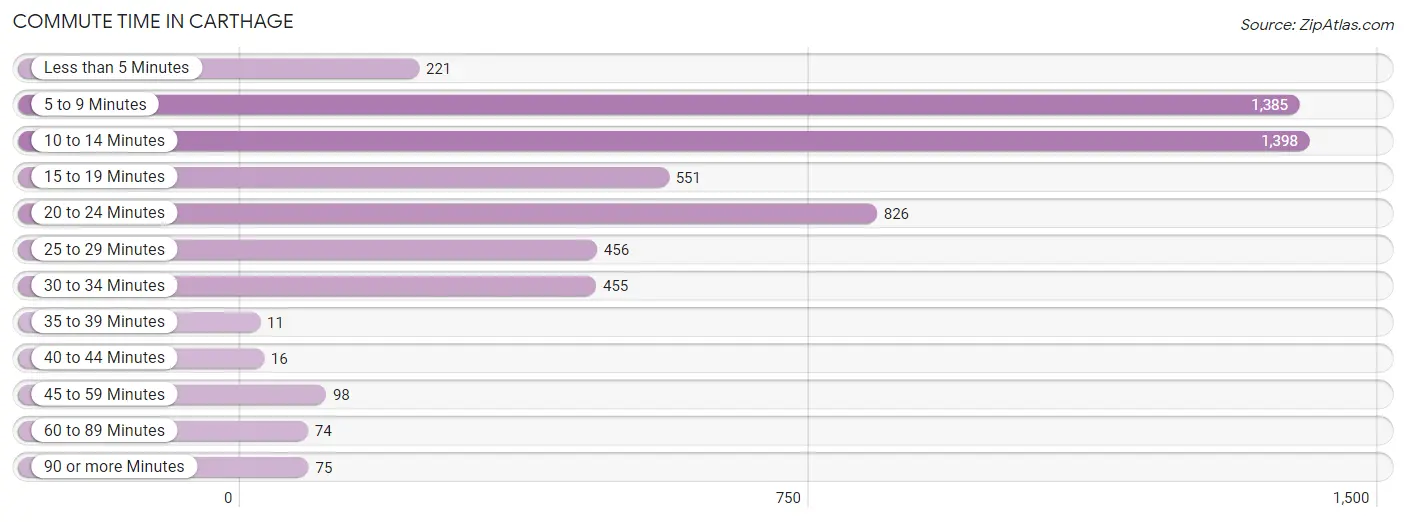
| Commute Time | # Commuters | % Commuters |
| Less than 5 Minutes | 221 | 4.0% |
| 5 to 9 Minutes | 1,385 | 24.9% |
| 10 to 14 Minutes | 1,398 | 25.1% |
| 15 to 19 Minutes | 551 | 9.9% |
| 20 to 24 Minutes | 826 | 14.8% |
| 25 to 29 Minutes | 456 | 8.2% |
| 30 to 34 Minutes | 455 | 8.2% |
| 35 to 39 Minutes | 11 | 0.2% |
| 40 to 44 Minutes | 16 | 0.3% |
| 45 to 59 Minutes | 98 | 1.8% |
| 60 to 89 Minutes | 74 | 1.3% |
| 90 or more Minutes | 75 | 1.3% |
Commute Time by Sex in Carthage
The most common commute times in Carthage are 10 to 14 minutes (900 commuters, 29.4%) for males and 5 to 9 minutes (728 commuters, 29.0%) for females.
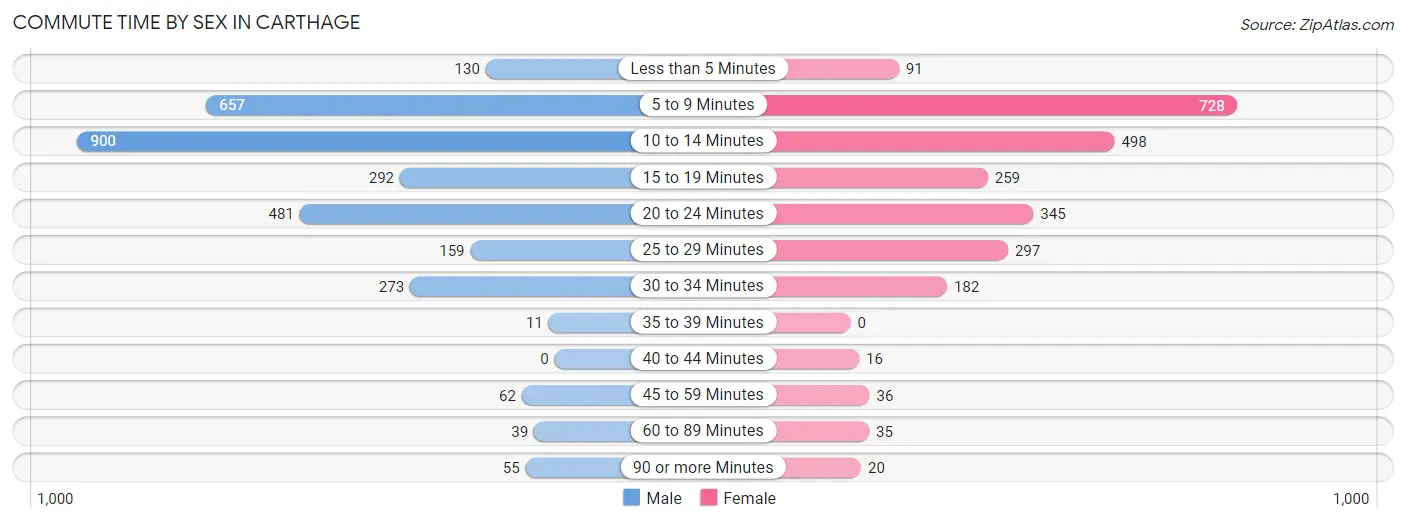
| Commute Time | Male | Female |
| Less than 5 Minutes | 130 (4.3%) | 91 (3.6%) |
| 5 to 9 Minutes | 657 (21.5%) | 728 (29.0%) |
| 10 to 14 Minutes | 900 (29.4%) | 498 (19.9%) |
| 15 to 19 Minutes | 292 (9.6%) | 259 (10.3%) |
| 20 to 24 Minutes | 481 (15.7%) | 345 (13.8%) |
| 25 to 29 Minutes | 159 (5.2%) | 297 (11.8%) |
| 30 to 34 Minutes | 273 (8.9%) | 182 (7.3%) |
| 35 to 39 Minutes | 11 (0.4%) | 0 (0.0%) |
| 40 to 44 Minutes | 0 (0.0%) | 16 (0.6%) |
| 45 to 59 Minutes | 62 (2.0%) | 36 (1.4%) |
| 60 to 89 Minutes | 39 (1.3%) | 35 (1.4%) |
| 90 or more Minutes | 55 (1.8%) | 20 (0.8%) |
Time of Departure to Work by Sex in Carthage
The most frequent times of departure to work in Carthage are 7:30 AM to 7:59 AM (396, 13.0%) for males and 7:00 AM to 7:29 AM (399, 15.9%) for females.
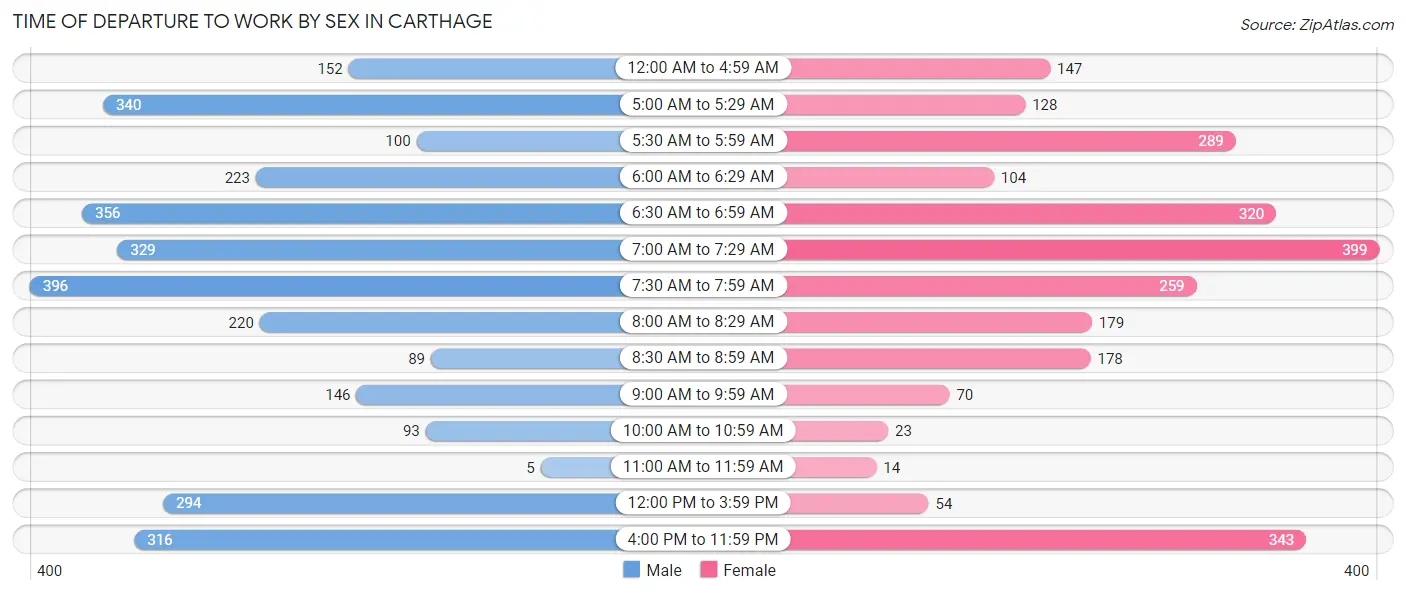
| Time of Departure | Male | Female |
| 12:00 AM to 4:59 AM | 152 (5.0%) | 147 (5.9%) |
| 5:00 AM to 5:29 AM | 340 (11.1%) | 128 (5.1%) |
| 5:30 AM to 5:59 AM | 100 (3.3%) | 289 (11.5%) |
| 6:00 AM to 6:29 AM | 223 (7.3%) | 104 (4.2%) |
| 6:30 AM to 6:59 AM | 356 (11.6%) | 320 (12.8%) |
| 7:00 AM to 7:29 AM | 329 (10.8%) | 399 (15.9%) |
| 7:30 AM to 7:59 AM | 396 (13.0%) | 259 (10.3%) |
| 8:00 AM to 8:29 AM | 220 (7.2%) | 179 (7.1%) |
| 8:30 AM to 8:59 AM | 89 (2.9%) | 178 (7.1%) |
| 9:00 AM to 9:59 AM | 146 (4.8%) | 70 (2.8%) |
| 10:00 AM to 10:59 AM | 93 (3.0%) | 23 (0.9%) |
| 11:00 AM to 11:59 AM | 5 (0.2%) | 14 (0.6%) |
| 12:00 PM to 3:59 PM | 294 (9.6%) | 54 (2.1%) |
| 4:00 PM to 11:59 PM | 316 (10.3%) | 343 (13.7%) |
| Total | 3,059 (100.0%) | 2,507 (100.0%) |
Housing Occupancy in Carthage
Occupancy by Ownership in Carthage
Of the total 5,612 dwellings in Carthage, owner-occupied units account for 2,628 (46.8%), while renter-occupied units make up 2,984 (53.2%).
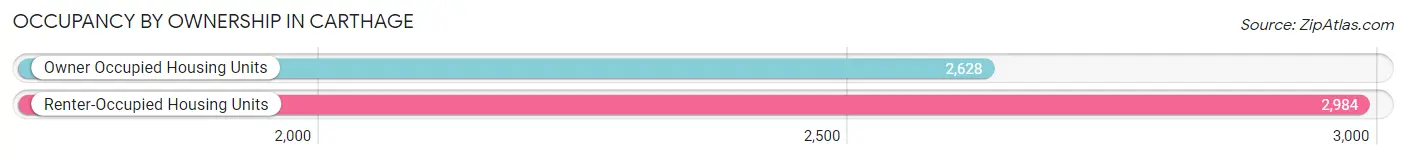
| Occupancy | # Housing Units | % Housing Units |
| Owner Occupied Housing Units | 2,628 | 46.8% |
| Renter-Occupied Housing Units | 2,984 | 53.2% |
| Total Occupied Housing Units | 5,612 | 100.0% |
Occupancy by Household Size in Carthage
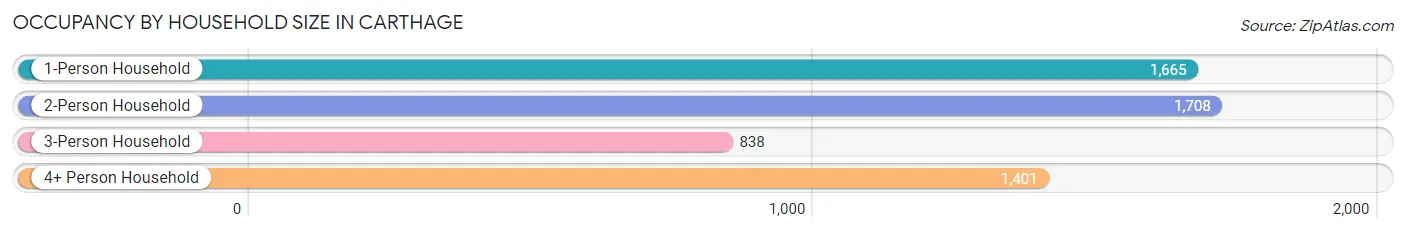
| Household Size | # Housing Units | % Housing Units |
| 1-Person Household | 1,665 | 29.7% |
| 2-Person Household | 1,708 | 30.4% |
| 3-Person Household | 838 | 14.9% |
| 4+ Person Household | 1,401 | 25.0% |
| Total Housing Units | 5,612 | 100.0% |
Occupancy by Ownership by Household Size in Carthage
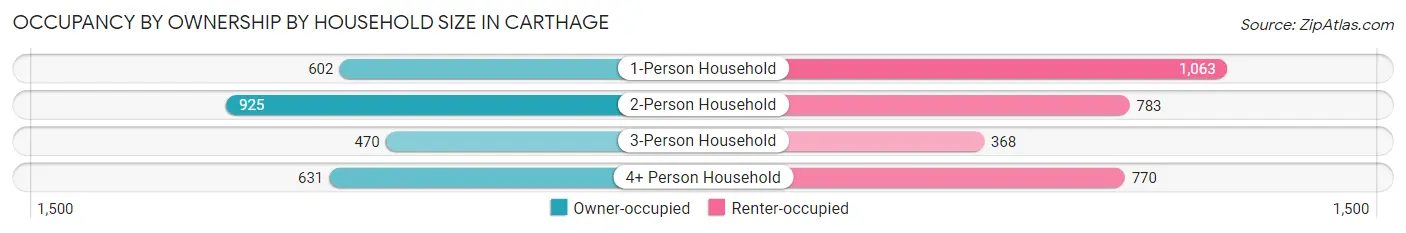
| Household Size | Owner-occupied | Renter-occupied |
| 1-Person Household | 602 (36.2%) | 1,063 (63.8%) |
| 2-Person Household | 925 (54.2%) | 783 (45.8%) |
| 3-Person Household | 470 (56.1%) | 368 (43.9%) |
| 4+ Person Household | 631 (45.0%) | 770 (55.0%) |
| Total Housing Units | 2,628 (46.8%) | 2,984 (53.2%) |
Occupancy by Educational Attainment in Carthage
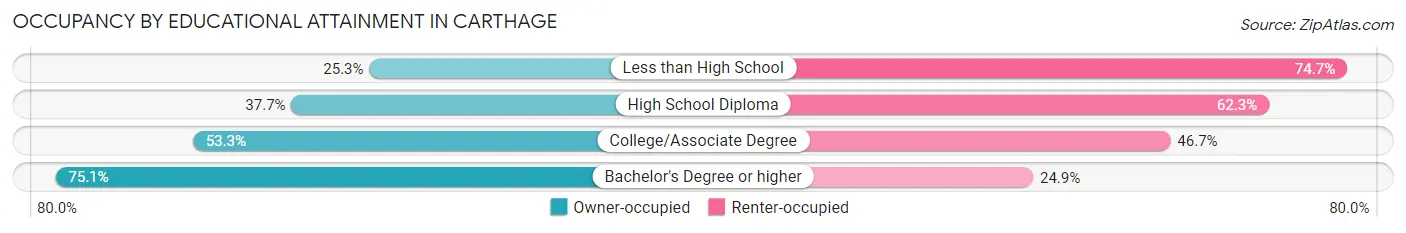
| Household Size | Owner-occupied | Renter-occupied |
| Less than High School | 374 (25.3%) | 1,103 (74.7%) |
| High School Diploma | 627 (37.7%) | 1,037 (62.3%) |
| College/Associate Degree | 561 (53.3%) | 491 (46.7%) |
| Bachelor's Degree or higher | 1,066 (75.1%) | 353 (24.9%) |
Occupancy by Age of Householder in Carthage
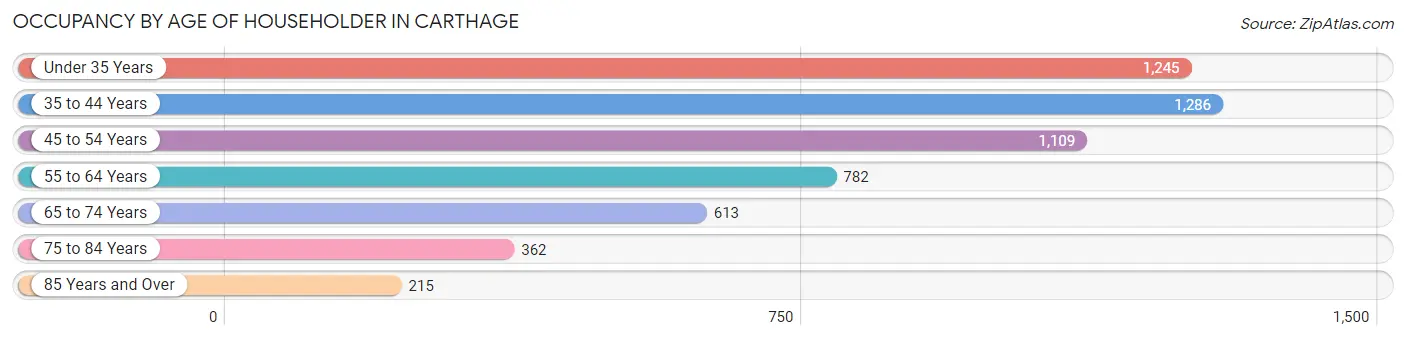
| Age Bracket | # Households | % Households |
| Under 35 Years | 1,245 | 22.2% |
| 35 to 44 Years | 1,286 | 22.9% |
| 45 to 54 Years | 1,109 | 19.8% |
| 55 to 64 Years | 782 | 13.9% |
| 65 to 74 Years | 613 | 10.9% |
| 75 to 84 Years | 362 | 6.5% |
| 85 Years and Over | 215 | 3.8% |
| Total | 5,612 | 100.0% |
Housing Finances in Carthage
Median Income by Occupancy in Carthage
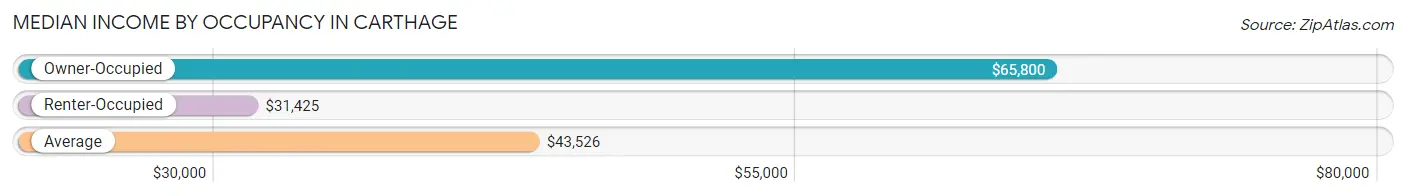
| Occupancy Type | # Households | Median Income |
| Owner-Occupied | 2,628 (46.8%) | $65,800 |
| Renter-Occupied | 2,984 (53.2%) | $31,425 |
| Average | 5,612 (100.0%) | $43,526 |
Occupancy by Householder Income Bracket in Carthage
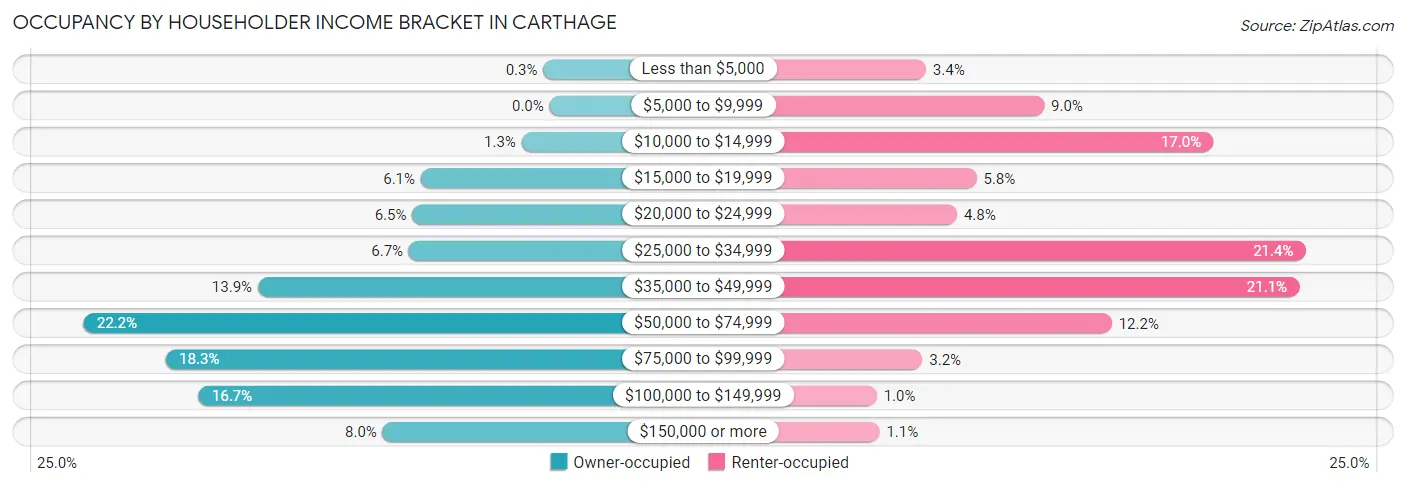
| Income Bracket | Owner-occupied | Renter-occupied |
| Less than $5,000 | 8 (0.3%) | 100 (3.4%) |
| $5,000 to $9,999 | 0 (0.0%) | 268 (9.0%) |
| $10,000 to $14,999 | 35 (1.3%) | 508 (17.0%) |
| $15,000 to $19,999 | 161 (6.1%) | 172 (5.8%) |
| $20,000 to $24,999 | 172 (6.5%) | 144 (4.8%) |
| $25,000 to $34,999 | 176 (6.7%) | 639 (21.4%) |
| $35,000 to $49,999 | 365 (13.9%) | 630 (21.1%) |
| $50,000 to $74,999 | 583 (22.2%) | 364 (12.2%) |
| $75,000 to $99,999 | 480 (18.3%) | 95 (3.2%) |
| $100,000 to $149,999 | 439 (16.7%) | 30 (1.0%) |
| $150,000 or more | 209 (8.0%) | 34 (1.1%) |
| Total | 2,628 (100.0%) | 2,984 (100.0%) |
Monthly Housing Cost Tiers in Carthage
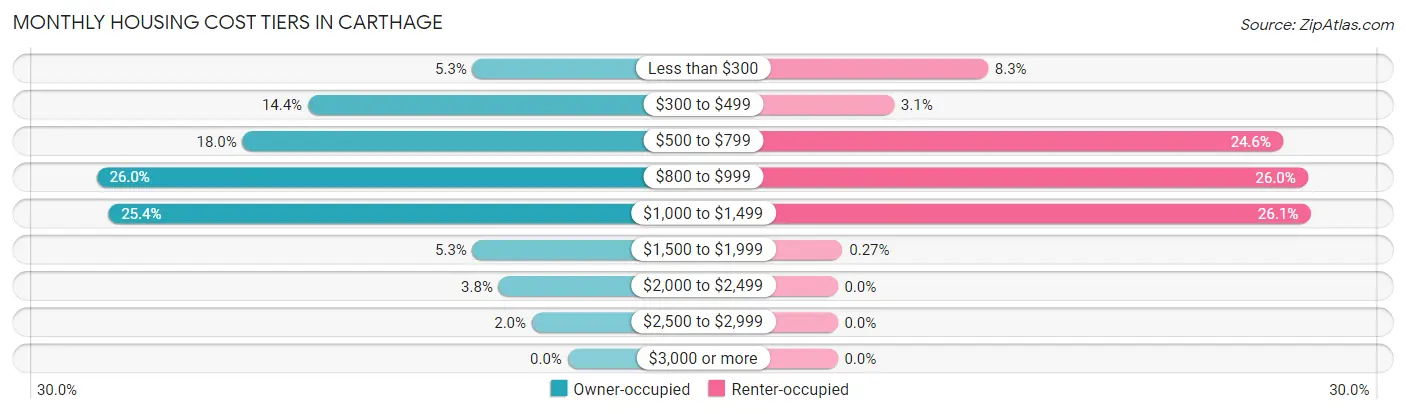
| Monthly Cost | Owner-occupied | Renter-occupied |
| Less than $300 | 138 (5.2%) | 248 (8.3%) |
| $300 to $499 | 377 (14.3%) | 93 (3.1%) |
| $500 to $799 | 472 (18.0%) | 734 (24.6%) |
| $800 to $999 | 684 (26.0%) | 775 (26.0%) |
| $1,000 to $1,499 | 667 (25.4%) | 779 (26.1%) |
| $1,500 to $1,999 | 138 (5.2%) | 8 (0.3%) |
| $2,000 to $2,499 | 100 (3.8%) | 0 (0.0%) |
| $2,500 to $2,999 | 52 (2.0%) | 0 (0.0%) |
| $3,000 or more | 0 (0.0%) | 0 (0.0%) |
| Total | 2,628 (100.0%) | 2,984 (100.0%) |
Physical Housing Characteristics in Carthage
Housing Structures in Carthage
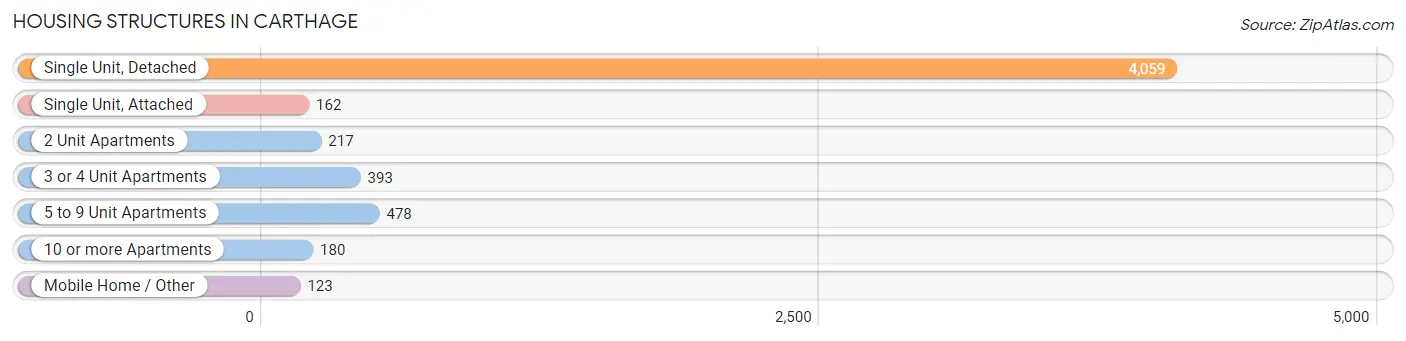
| Structure Type | # Housing Units | % Housing Units |
| Single Unit, Detached | 4,059 | 72.3% |
| Single Unit, Attached | 162 | 2.9% |
| 2 Unit Apartments | 217 | 3.9% |
| 3 or 4 Unit Apartments | 393 | 7.0% |
| 5 to 9 Unit Apartments | 478 | 8.5% |
| 10 or more Apartments | 180 | 3.2% |
| Mobile Home / Other | 123 | 2.2% |
| Total | 5,612 | 100.0% |
Housing Structures by Occupancy in Carthage
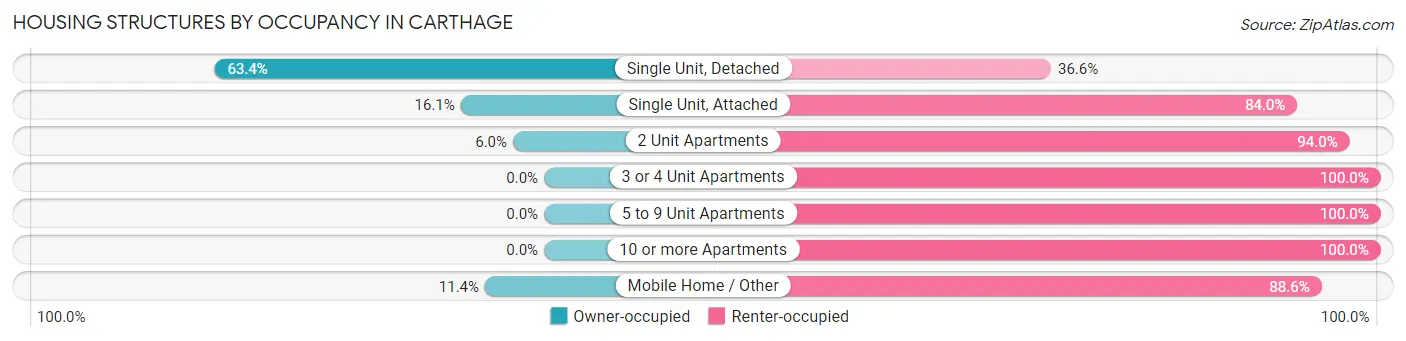
| Structure Type | Owner-occupied | Renter-occupied |
| Single Unit, Detached | 2,575 (63.4%) | 1,484 (36.6%) |
| Single Unit, Attached | 26 (16.1%) | 136 (84.0%) |
| 2 Unit Apartments | 13 (6.0%) | 204 (94.0%) |
| 3 or 4 Unit Apartments | 0 (0.0%) | 393 (100.0%) |
| 5 to 9 Unit Apartments | 0 (0.0%) | 478 (100.0%) |
| 10 or more Apartments | 0 (0.0%) | 180 (100.0%) |
| Mobile Home / Other | 14 (11.4%) | 109 (88.6%) |
| Total | 2,628 (46.8%) | 2,984 (53.2%) |
Housing Structures by Number of Rooms in Carthage
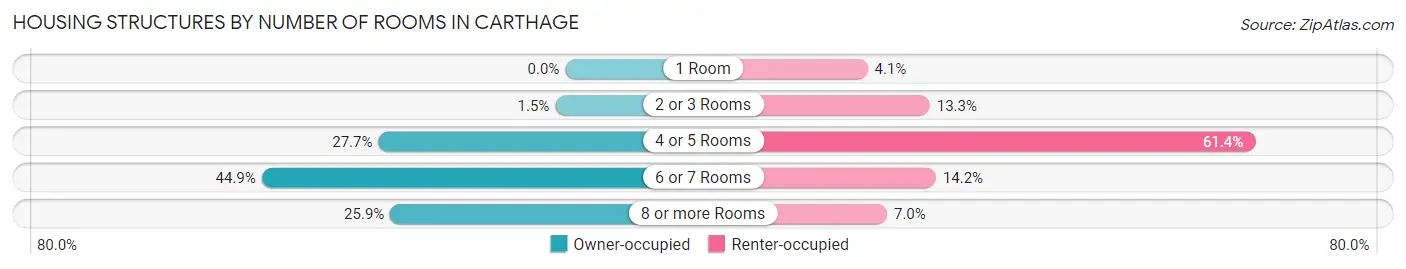
| Number of Rooms | Owner-occupied | Renter-occupied |
| 1 Room | 0 (0.0%) | 122 (4.1%) |
| 2 or 3 Rooms | 39 (1.5%) | 397 (13.3%) |
| 4 or 5 Rooms | 727 (27.7%) | 1,833 (61.4%) |
| 6 or 7 Rooms | 1,181 (44.9%) | 424 (14.2%) |
| 8 or more Rooms | 681 (25.9%) | 208 (7.0%) |
| Total | 2,628 (100.0%) | 2,984 (100.0%) |
Housing Structure by Heating Type in Carthage
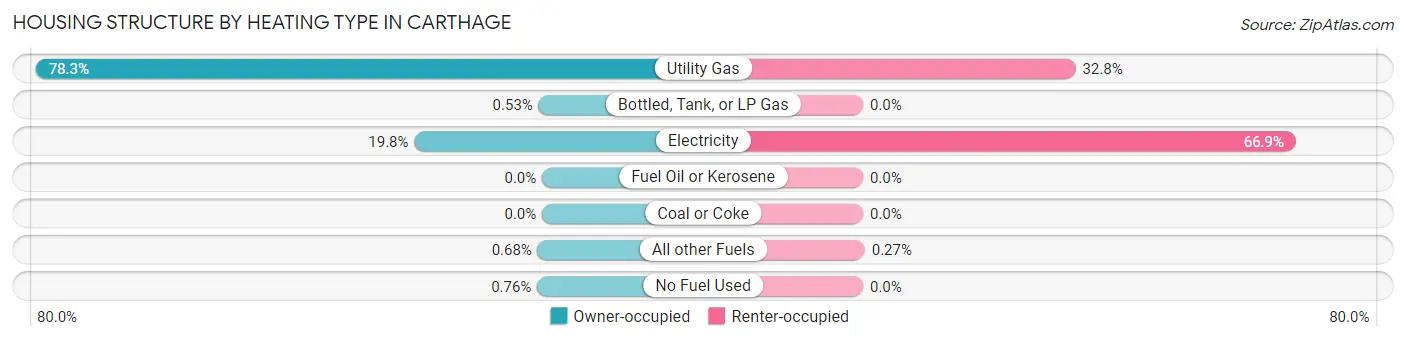
| Heating Type | Owner-occupied | Renter-occupied |
| Utility Gas | 2,057 (78.3%) | 980 (32.8%) |
| Bottled, Tank, or LP Gas | 14 (0.5%) | 0 (0.0%) |
| Electricity | 519 (19.8%) | 1,996 (66.9%) |
| Fuel Oil or Kerosene | 0 (0.0%) | 0 (0.0%) |
| Coal or Coke | 0 (0.0%) | 0 (0.0%) |
| All other Fuels | 18 (0.7%) | 8 (0.3%) |
| No Fuel Used | 20 (0.8%) | 0 (0.0%) |
| Total | 2,628 (100.0%) | 2,984 (100.0%) |
Household Vehicle Usage in Carthage
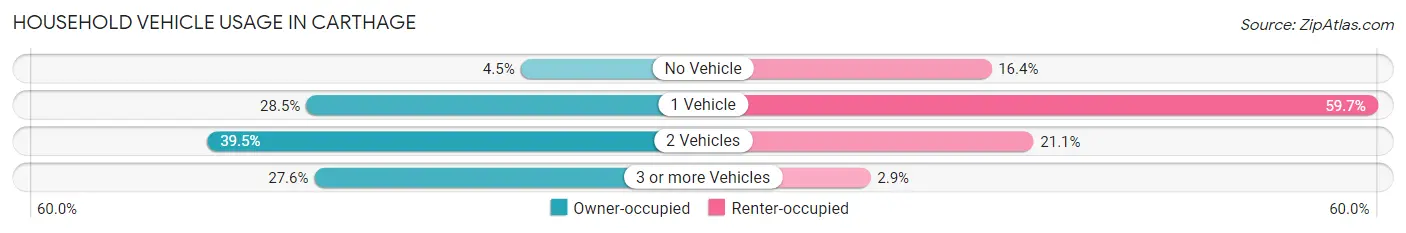
| Vehicles per Household | Owner-occupied | Renter-occupied |
| No Vehicle | 117 (4.4%) | 489 (16.4%) |
| 1 Vehicle | 748 (28.5%) | 1,780 (59.7%) |
| 2 Vehicles | 1,039 (39.5%) | 630 (21.1%) |
| 3 or more Vehicles | 724 (27.6%) | 85 (2.9%) |
| Total | 2,628 (100.0%) | 2,984 (100.0%) |
Real Estate & Mortgages in Carthage
Real Estate and Mortgage Overview in Carthage
| Characteristic | Without Mortgage | With Mortgage |
| Housing Units | 915 | 1,713 |
| Median Property Value | $88,900 | $137,500 |
| Median Household Income | $44,344 | $190 |
| Monthly Housing Costs | $467 | $0 |
| Real Estate Taxes | $753 | $0 |
Property Value by Mortgage Status in Carthage
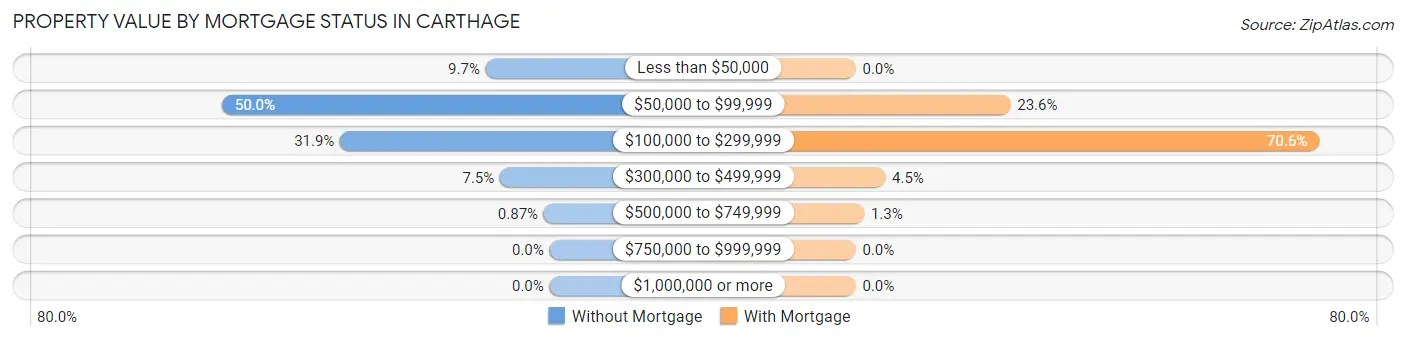
| Property Value | Without Mortgage | With Mortgage |
| Less than $50,000 | 89 (9.7%) | 0 (0.0%) |
| $50,000 to $99,999 | 457 (49.9%) | 404 (23.6%) |
| $100,000 to $299,999 | 292 (31.9%) | 1,210 (70.6%) |
| $300,000 to $499,999 | 69 (7.5%) | 77 (4.5%) |
| $500,000 to $749,999 | 8 (0.9%) | 22 (1.3%) |
| $750,000 to $999,999 | 0 (0.0%) | 0 (0.0%) |
| $1,000,000 or more | 0 (0.0%) | 0 (0.0%) |
| Total | 915 (100.0%) | 1,713 (100.0%) |
Household Income by Mortgage Status in Carthage
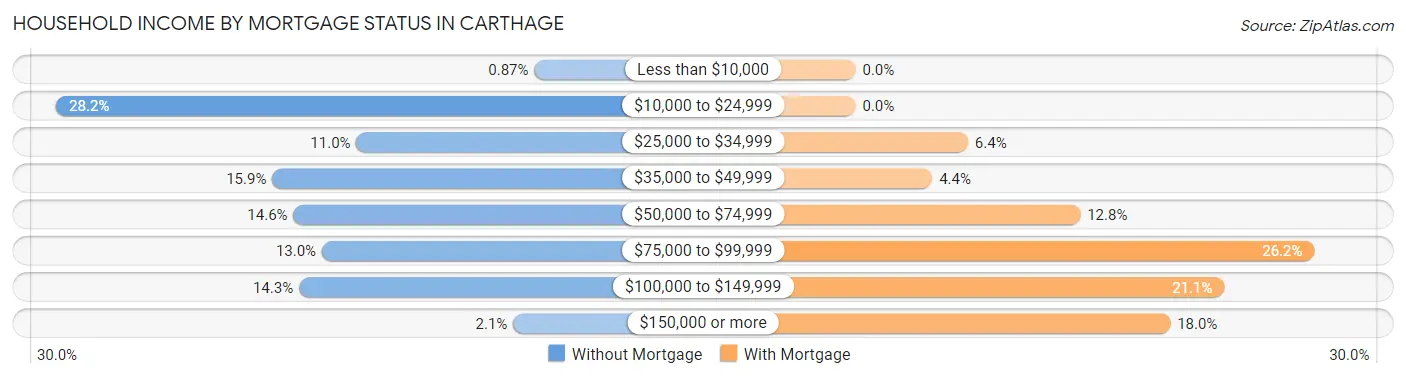
| Household Income | Without Mortgage | With Mortgage |
| Less than $10,000 | 8 (0.9%) | 0 (0.0%) |
| $10,000 to $24,999 | 258 (28.2%) | 0 (0.0%) |
| $25,000 to $34,999 | 101 (11.0%) | 110 (6.4%) |
| $35,000 to $49,999 | 145 (15.9%) | 75 (4.4%) |
| $50,000 to $74,999 | 134 (14.6%) | 220 (12.8%) |
| $75,000 to $99,999 | 119 (13.0%) | 449 (26.2%) |
| $100,000 to $149,999 | 131 (14.3%) | 361 (21.1%) |
| $150,000 or more | 19 (2.1%) | 308 (18.0%) |
| Total | 915 (100.0%) | 1,713 (100.0%) |
Property Value to Household Income Ratio in Carthage
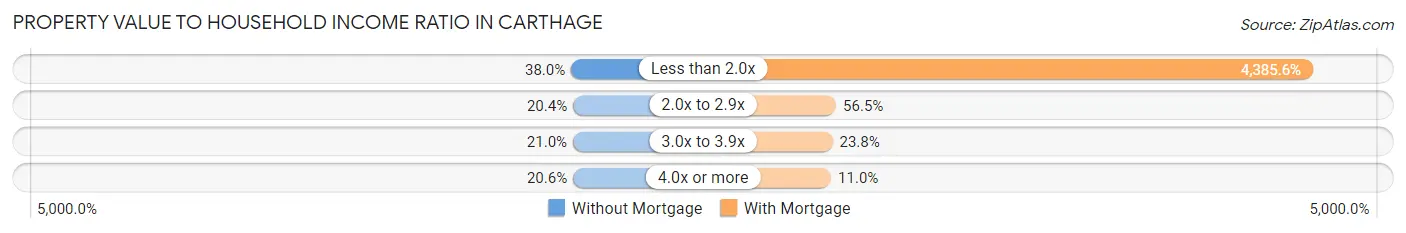
| Value-to-Income Ratio | Without Mortgage | With Mortgage |
| Less than 2.0x | 348 (38.0%) | 75,125 (4,385.6%) |
| 2.0x to 2.9x | 187 (20.4%) | 968 (56.5%) |
| 3.0x to 3.9x | 192 (21.0%) | 407 (23.8%) |
| 4.0x or more | 188 (20.5%) | 189 (11.0%) |
| Total | 915 (100.0%) | 1,713 (100.0%) |
Real Estate Taxes by Mortgage Status in Carthage
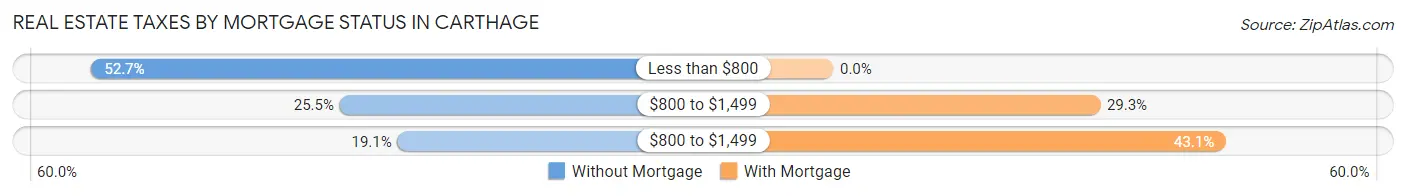
| Property Taxes | Without Mortgage | With Mortgage |
| Less than $800 | 482 (52.7%) | 0 (0.0%) |
| $800 to $1,499 | 233 (25.5%) | 501 (29.2%) |
| $800 to $1,499 | 175 (19.1%) | 738 (43.1%) |
| Total | 915 (100.0%) | 1,713 (100.0%) |
Health & Disability in Carthage
Health Insurance Coverage by Age in Carthage
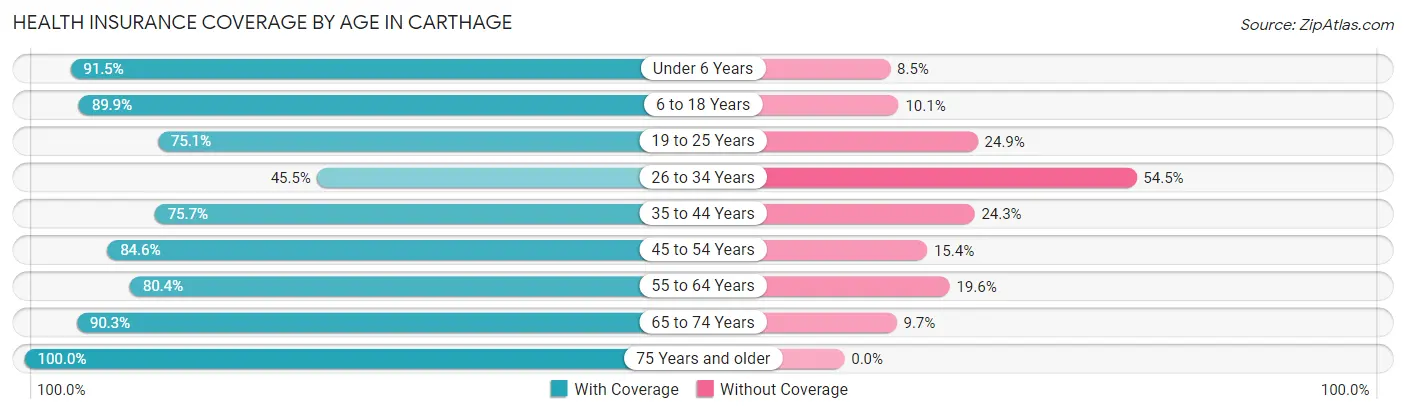
| Age Bracket | With Coverage | Without Coverage |
| Under 6 Years | 1,317 (91.5%) | 123 (8.5%) |
| 6 to 18 Years | 3,326 (89.9%) | 374 (10.1%) |
| 19 to 25 Years | 1,182 (75.1%) | 391 (24.9%) |
| 26 to 34 Years | 687 (45.5%) | 822 (54.5%) |
| 35 to 44 Years | 1,660 (75.7%) | 532 (24.3%) |
| 45 to 54 Years | 1,530 (84.6%) | 279 (15.4%) |
| 55 to 64 Years | 963 (80.4%) | 235 (19.6%) |
| 65 to 74 Years | 862 (90.3%) | 93 (9.7%) |
| 75 Years and older | 750 (100.0%) | 0 (0.0%) |
| Total | 12,277 (81.2%) | 2,849 (18.8%) |
Health Insurance Coverage by Citizenship Status in Carthage
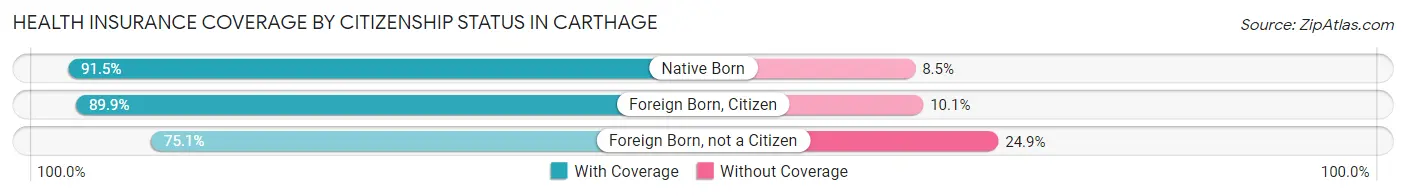
| Citizenship Status | With Coverage | Without Coverage |
| Native Born | 1,317 (91.5%) | 123 (8.5%) |
| Foreign Born, Citizen | 3,326 (89.9%) | 374 (10.1%) |
| Foreign Born, not a Citizen | 1,182 (75.1%) | 391 (24.9%) |
Health Insurance Coverage by Household Income in Carthage
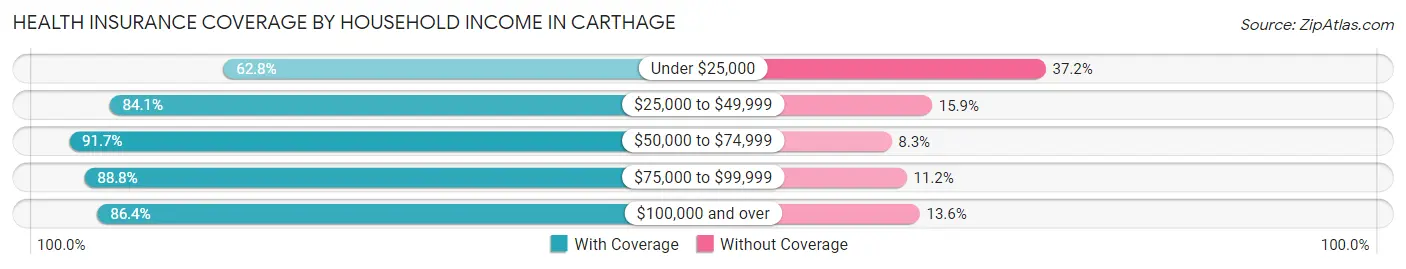
| Household Income | With Coverage | Without Coverage |
| Under $25,000 | 2,080 (62.8%) | 1,234 (37.2%) |
| $25,000 to $49,999 | 4,332 (84.1%) | 821 (15.9%) |
| $50,000 to $74,999 | 2,076 (91.7%) | 189 (8.3%) |
| $75,000 to $99,999 | 1,562 (88.8%) | 197 (11.2%) |
| $100,000 and over | 2,148 (86.4%) | 339 (13.6%) |
Public vs Private Health Insurance Coverage by Age in Carthage
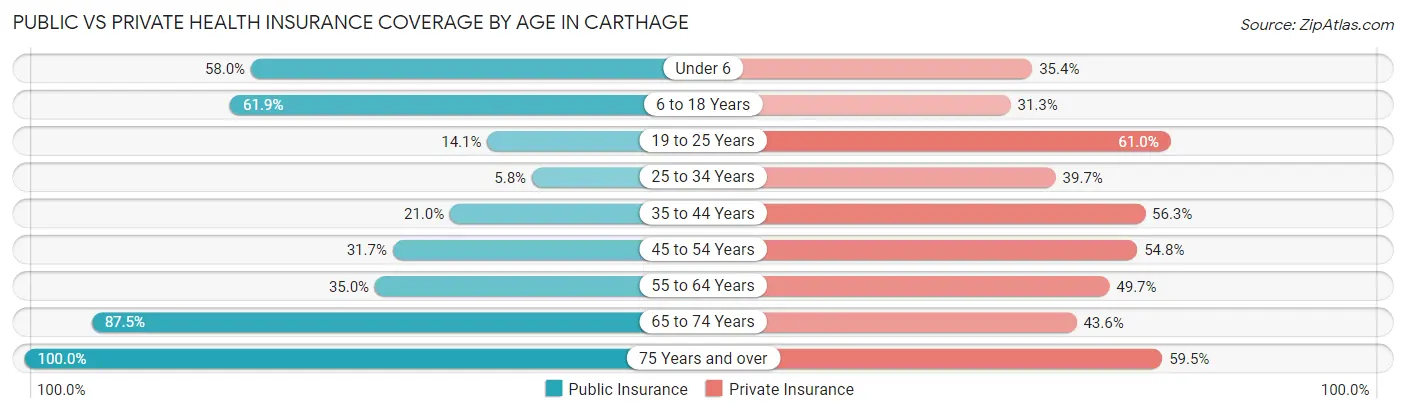
| Age Bracket | Public Insurance | Private Insurance |
| Under 6 | 835 (58.0%) | 509 (35.3%) |
| 6 to 18 Years | 2,289 (61.9%) | 1,159 (31.3%) |
| 19 to 25 Years | 222 (14.1%) | 960 (61.0%) |
| 25 to 34 Years | 88 (5.8%) | 599 (39.7%) |
| 35 to 44 Years | 461 (21.0%) | 1,234 (56.3%) |
| 45 to 54 Years | 573 (31.7%) | 992 (54.8%) |
| 55 to 64 Years | 419 (35.0%) | 595 (49.7%) |
| 65 to 74 Years | 836 (87.5%) | 416 (43.6%) |
| 75 Years and over | 750 (100.0%) | 446 (59.5%) |
| Total | 6,473 (42.8%) | 6,910 (45.7%) |
Disability Status by Sex by Age in Carthage
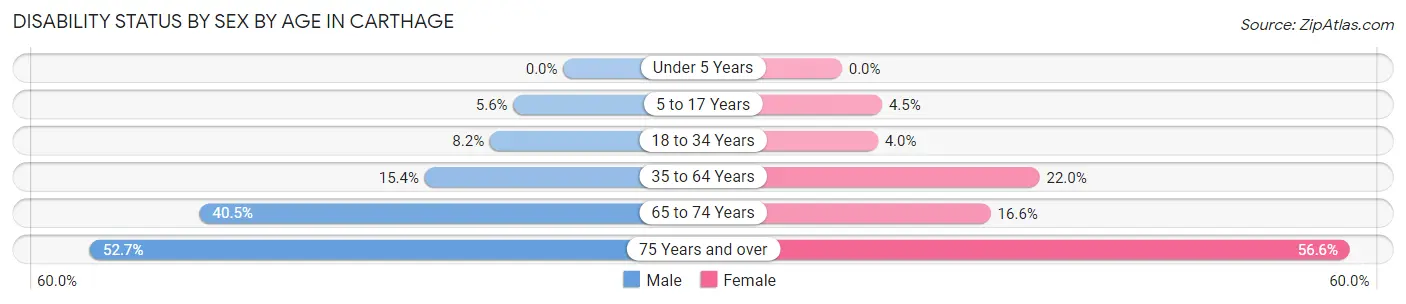
| Age Bracket | Male | Female |
| Under 5 Years | 0 (0.0%) | 0 (0.0%) |
| 5 to 17 Years | 99 (5.6%) | 81 (4.5%) |
| 18 to 34 Years | 149 (8.2%) | 60 (4.0%) |
| 35 to 64 Years | 332 (15.4%) | 671 (22.0%) |
| 65 to 74 Years | 162 (40.5%) | 92 (16.6%) |
| 75 Years and over | 127 (52.7%) | 288 (56.6%) |
Disability Class by Sex by Age in Carthage
Disability Class: Hearing Difficulty
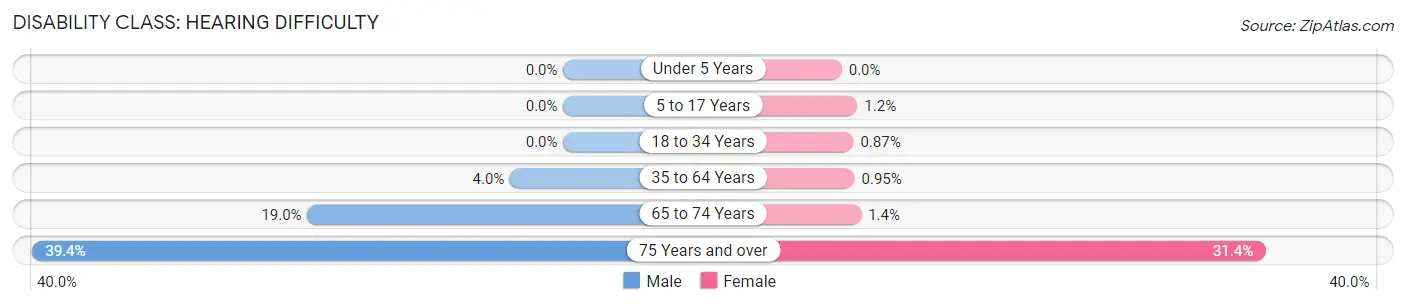
| Age Bracket | Male | Female |
| Under 5 Years | 0 (0.0%) | 0 (0.0%) |
| 5 to 17 Years | 0 (0.0%) | 21 (1.2%) |
| 18 to 34 Years | 0 (0.0%) | 13 (0.9%) |
| 35 to 64 Years | 85 (4.0%) | 29 (0.9%) |
| 65 to 74 Years | 76 (19.0%) | 8 (1.4%) |
| 75 Years and over | 95 (39.4%) | 160 (31.4%) |
Disability Class: Vision Difficulty
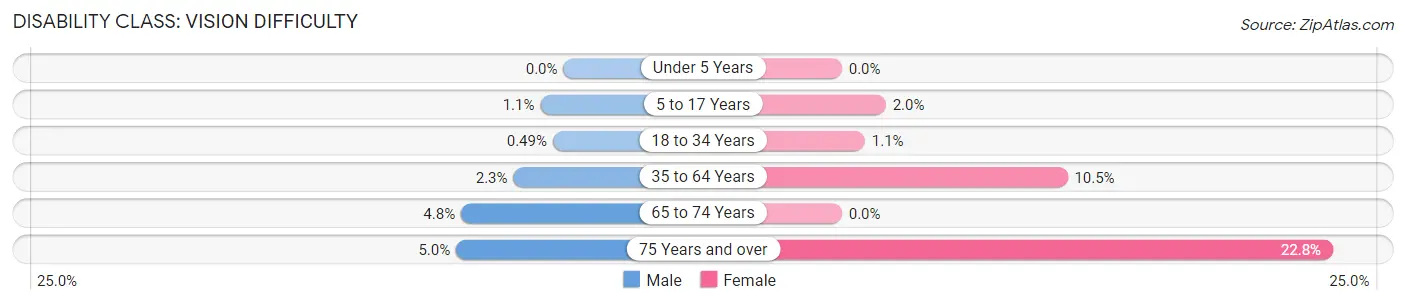
| Age Bracket | Male | Female |
| Under 5 Years | 0 (0.0%) | 0 (0.0%) |
| 5 to 17 Years | 19 (1.1%) | 37 (2.0%) |
| 18 to 34 Years | 9 (0.5%) | 16 (1.1%) |
| 35 to 64 Years | 50 (2.3%) | 319 (10.5%) |
| 65 to 74 Years | 19 (4.8%) | 0 (0.0%) |
| 75 Years and over | 12 (5.0%) | 116 (22.8%) |
Disability Class: Cognitive Difficulty
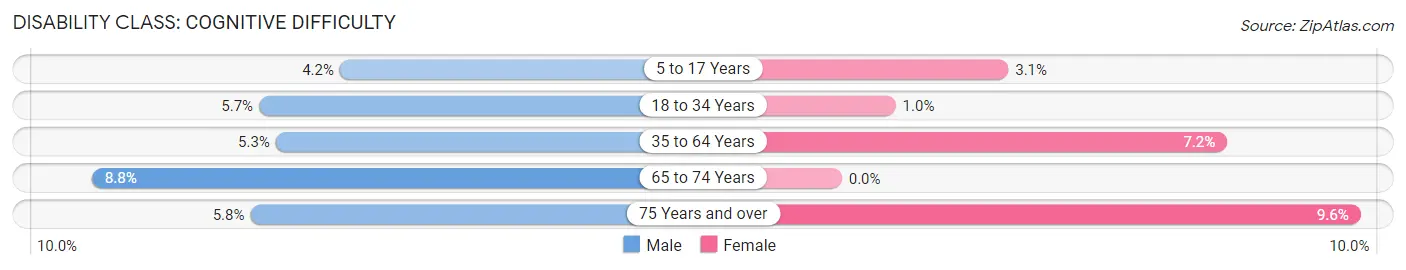
| Age Bracket | Male | Female |
| 5 to 17 Years | 74 (4.2%) | 56 (3.1%) |
| 18 to 34 Years | 103 (5.7%) | 15 (1.0%) |
| 35 to 64 Years | 115 (5.3%) | 218 (7.1%) |
| 65 to 74 Years | 35 (8.7%) | 0 (0.0%) |
| 75 Years and over | 14 (5.8%) | 49 (9.6%) |
Disability Class: Ambulatory Difficulty
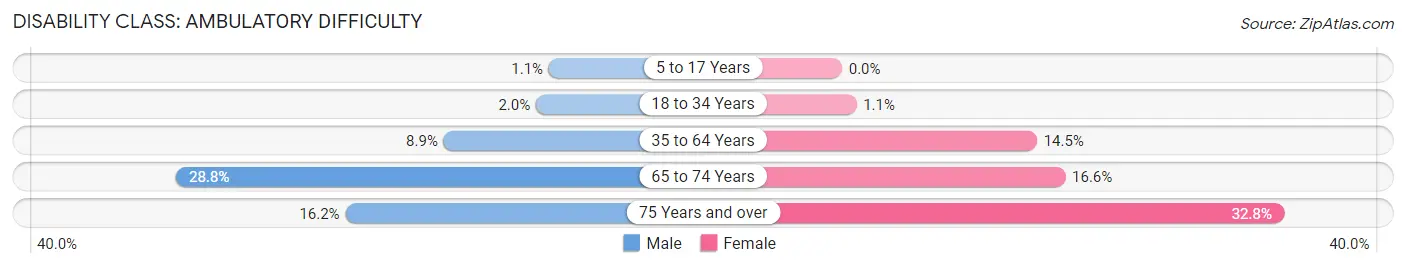
| Age Bracket | Male | Female |
| 5 to 17 Years | 19 (1.1%) | 0 (0.0%) |
| 18 to 34 Years | 37 (2.0%) | 16 (1.1%) |
| 35 to 64 Years | 191 (8.9%) | 441 (14.5%) |
| 65 to 74 Years | 115 (28.7%) | 92 (16.6%) |
| 75 Years and over | 39 (16.2%) | 167 (32.8%) |
Disability Class: Self-Care Difficulty
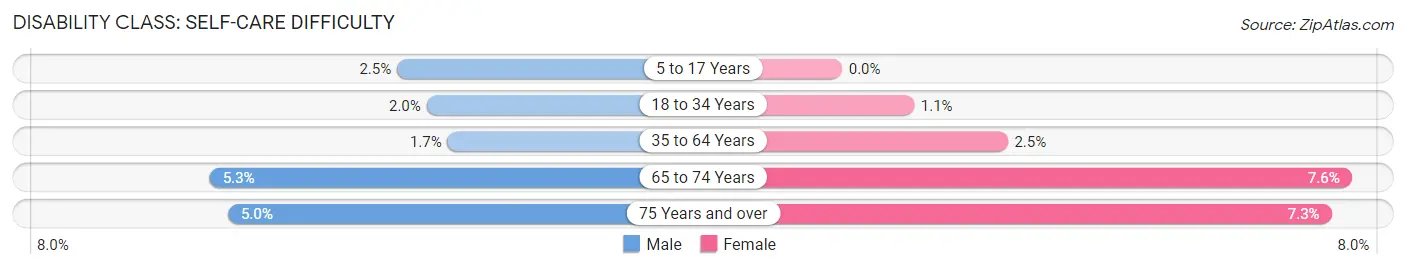
| Age Bracket | Male | Female |
| 5 to 17 Years | 44 (2.5%) | 0 (0.0%) |
| 18 to 34 Years | 37 (2.0%) | 16 (1.1%) |
| 35 to 64 Years | 37 (1.7%) | 75 (2.5%) |
| 65 to 74 Years | 21 (5.2%) | 42 (7.6%) |
| 75 Years and over | 12 (5.0%) | 37 (7.3%) |
Technology Access in Carthage
Computing Device Access in Carthage
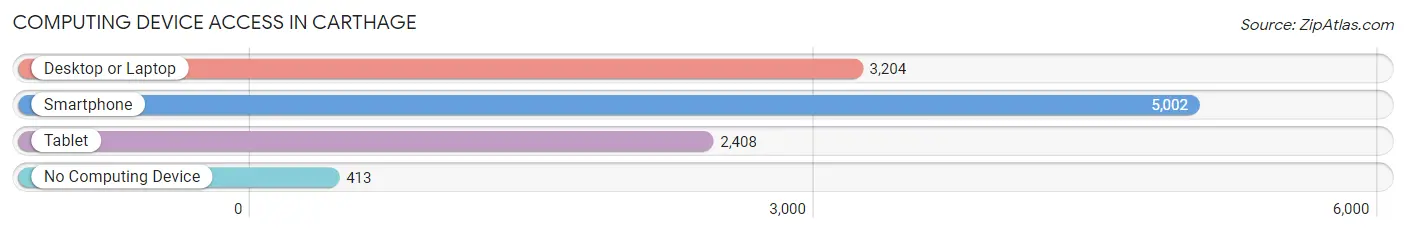
| Device Type | # Households | % Households |
| Desktop or Laptop | 3,204 | 57.1% |
| Smartphone | 5,002 | 89.1% |
| Tablet | 2,408 | 42.9% |
| No Computing Device | 413 | 7.4% |
| Total | 5,612 | 100.0% |
Internet Access in Carthage
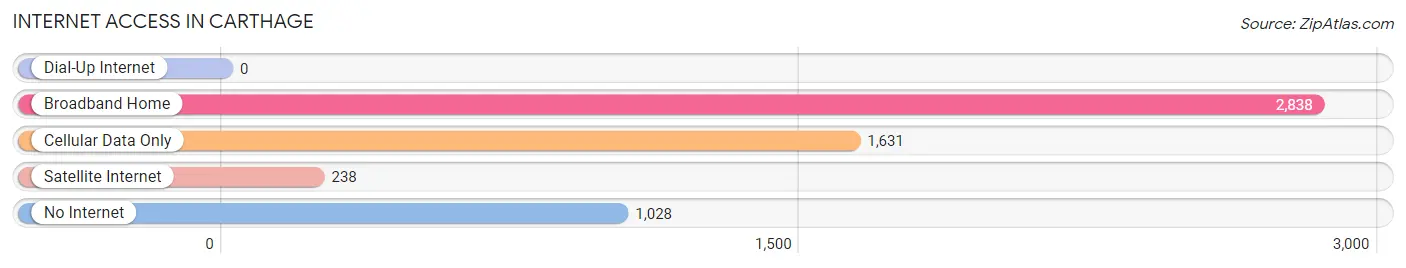
| Internet Type | # Households | % Households |
| Dial-Up Internet | 0 | 0.0% |
| Broadband Home | 2,838 | 50.6% |
| Cellular Data Only | 1,631 | 29.1% |
| Satellite Internet | 238 | 4.2% |
| No Internet | 1,028 | 18.3% |
| Total | 5,612 | 100.0% |
Carthage Summary
Carthage, Missouri is a small city located in the southwestern corner of the state, about 30 miles south of Joplin. It is the county seat of Jasper County and is part of the Joplin, Missouri Metropolitan Statistical Area. The city has a population of 14,378 as of the 2010 census, making it the largest city in Jasper County.
History
Carthage was founded in 1842 by Moses Byers, a settler from Tennessee. The city was named after the ancient city of Carthage in Tunisia, which was destroyed by the Romans in 146 BC. The city was incorporated in 1843 and quickly became a center of commerce and industry in the region. The first railroad line to reach the city was the St. Louis and San Francisco Railway in 1872.
The city experienced a period of rapid growth in the late 19th and early 20th centuries, with the population increasing from 1,000 in 1880 to over 10,000 by 1920. During this time, the city became a major center for the mining and processing of lead and zinc ore. The city also became a major hub for the railroad industry, with the St. Louis and San Francisco Railway, the Missouri Pacific Railroad, and the Kansas City Southern Railway all having major operations in the city.
Geography
Carthage is located in the southwestern corner of Missouri, about 30 miles south of Joplin. The city is situated in the Ozark Plateau region of the state, with rolling hills and valleys. The city is located at the intersection of two major highways, US Route 71 and US Route 66. The city is also located near the Spring River, which flows through the city and is a popular destination for fishing and other recreational activities.
Economy
The economy of Carthage is largely based on agriculture and manufacturing. The city is home to several large agricultural operations, including a large hog farm and a large dairy farm. The city is also home to several manufacturing companies, including a large paper mill and a large furniture factory. The city is also home to several retail stores, restaurants, and other businesses.
Demographics
As of the 2010 census, the population of Carthage was 14,378. The racial makeup of the city was 87.3% White, 8.2% African American, 0.5% Native American, 0.7% Asian, 0.1% Pacific Islander, 1.2% from other races, and 2.1% from two or more races. Hispanic or Latino of any race were 3.2% of the population.
The median income for a household in the city was $37,945, and the median income for a family was $45,945. The per capita income for the city was $20,845. About 11.2% of families and 14.2% of the population were below the poverty line, including 19.2% of those under age 18 and 8.2% of those age 65 or over.
Common Questions
What is Per Capita Income in Carthage?
Per Capita income in Carthage is $21,019.
What is the Median Family Income in Carthage?
Median Family Income in Carthage is $47,364.
What is the Median Household income in Carthage?
Median Household Income in Carthage is $43,526.
What is Income or Wage Gap in Carthage?
Income or Wage Gap in Carthage is 21.7%.
Women in Carthage earn 78.3 cents for every dollar earned by a man.
What is Family Income Deficit in Carthage?
Family Income Deficit in Carthage is $10,515.
Families that are below poverty line in Carthage earn $10,515 less on average than the poverty threshold level.
What is Inequality or Gini Index in Carthage?
Inequality or Gini Index in Carthage is 0.45.
What is the Total Population of Carthage?
Total Population of Carthage is 15,491.
What is the Total Male Population of Carthage?
Total Male Population of Carthage is 7,271.
What is the Total Female Population of Carthage?
Total Female Population of Carthage is 8,220.
What is the Ratio of Males per 100 Females in Carthage?
There are 88.45 Males per 100 Females in Carthage.
What is the Ratio of Females per 100 Males in Carthage?
There are 113.05 Females per 100 Males in Carthage.
What is the Median Population Age in Carthage?
Median Population Age in Carthage is 31.6 Years.
What is the Average Family Size in Carthage
Average Family Size in Carthage is 3.3 People.
What is the Average Household Size in Carthage
Average Household Size in Carthage is 2.7 People.
How Large is the Labor Force in Carthage?
There are 6,452 People in the Labor Forcein in Carthage.
What is the Percentage of People in the Labor Force in Carthage?
57.7% of People are in the Labor Force in Carthage.
What is the Unemployment Rate in Carthage?
Unemployment Rate in Carthage is 4.4%.