Cranston, RI Map & Demographics
Cranston Map
Cranston Overview
$41,572
PER CAPITA INCOME
$104,674
AVG FAMILY INCOME
$83,123
AVG HOUSEHOLD INCOME
24.7%
WAGE / INCOME GAP [ % ]
75.3¢/ $1
WAGE / INCOME GAP [ $ ]
0.44
INEQUALITY / GINI INDEX
82,691
TOTAL POPULATION
41,528
MALE POPULATION
41,163
FEMALE POPULATION
100.89
MALES / 100 FEMALES
99.12
FEMALES / 100 MALES
39.9
MEDIAN AGE
3.1
AVG FAMILY SIZE
2.4
AVG HOUSEHOLD SIZE
44,220
LABOR FORCE [ PEOPLE ]
64.8%
PERCENT IN LABOR FORCE
5.6%
UNEMPLOYMENT RATE
Cranston Area Codes
Income in Cranston
Income Overview in Cranston
Per Capita Income in Cranston is $41,572, while median incomes of families and households are $104,674 and $83,123 respectively.
| Characteristic | Number | Measure |
| Per Capita Income | 82,691 | $41,572 |
| Median Family Income | 19,750 | $104,674 |
| Mean Family Income | 19,750 | $124,812 |
| Median Household Income | 32,434 | $83,123 |
| Mean Household Income | 32,434 | $102,800 |
| Income Deficit | 19,750 | $0 |
| Wage / Income Gap (%) | 82,691 | 24.71% |
| Wage / Income Gap ($) | 82,691 | 75.29¢ per $1 |
| Gini / Inequality Index | 82,691 | 0.44 |
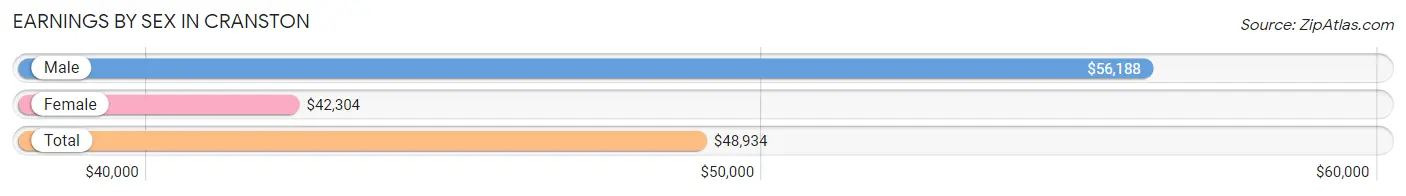
Earnings by Sex in Cranston
Average Earnings in Cranston are $48,934, $56,188 for men and $42,304 for women, a difference of 24.7%.
| Sex | Number | Average Earnings |
| Male | 23,430 (51.8%) | $56,188 |
| Female | 21,840 (48.2%) | $42,304 |
| Total | 45,270 (100.0%) | $48,934 |
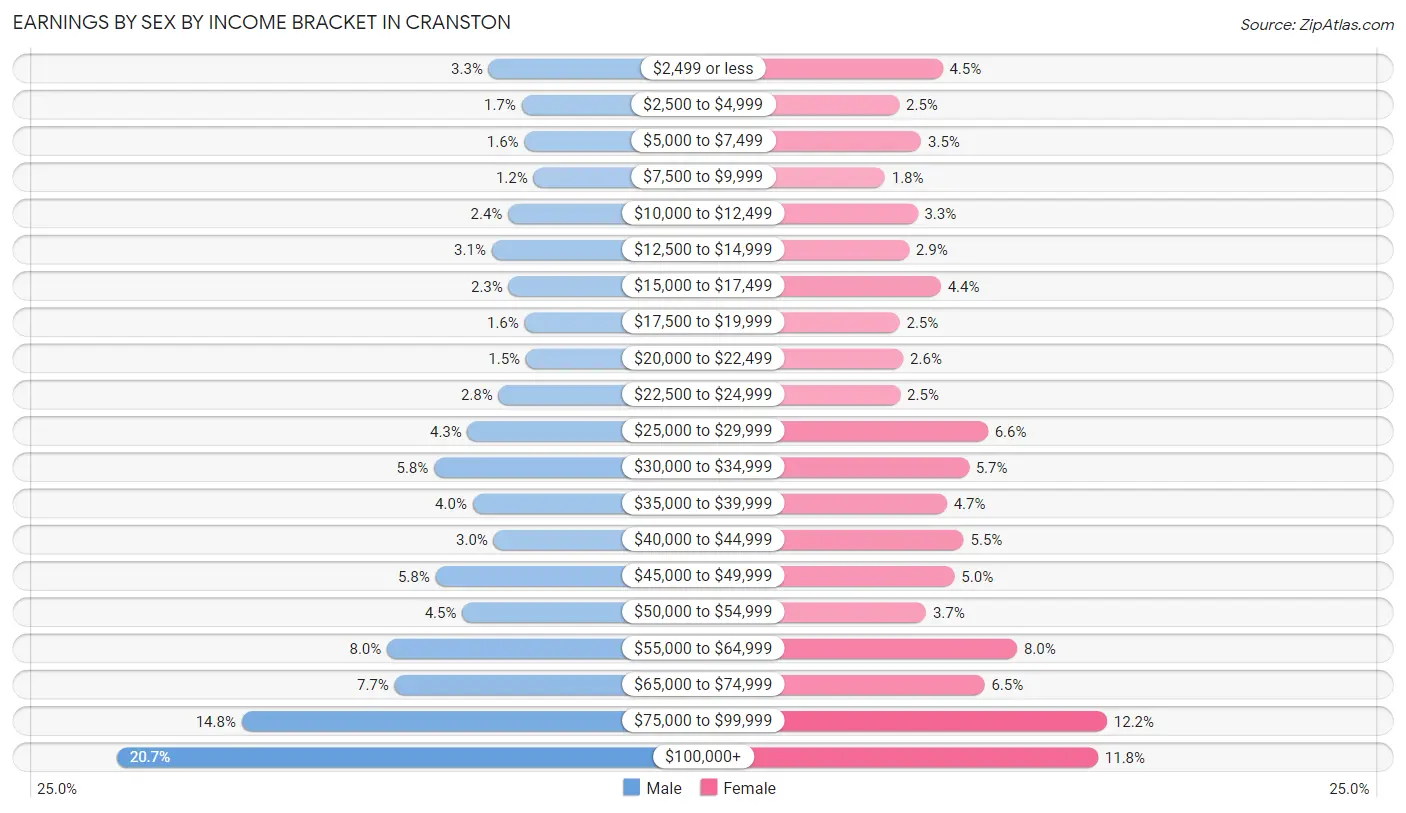
Earnings by Sex by Income Bracket in Cranston
The most common earnings brackets in Cranston are $100,000+ for men (4,845 | 20.7%) and $75,000 to $99,999 for women (2,660 | 12.2%).
| Income | Male | Female |
| $2,499 or less | 764 (3.3%) | 979 (4.5%) |
| $2,500 to $4,999 | 403 (1.7%) | 534 (2.5%) |
| $5,000 to $7,499 | 372 (1.6%) | 761 (3.5%) |
| $7,500 to $9,999 | 271 (1.2%) | 389 (1.8%) |
| $10,000 to $12,499 | 550 (2.4%) | 722 (3.3%) |
| $12,500 to $14,999 | 732 (3.1%) | 636 (2.9%) |
| $15,000 to $17,499 | 547 (2.3%) | 962 (4.4%) |
| $17,500 to $19,999 | 371 (1.6%) | 540 (2.5%) |
| $20,000 to $22,499 | 356 (1.5%) | 577 (2.6%) |
| $22,500 to $24,999 | 657 (2.8%) | 546 (2.5%) |
| $25,000 to $29,999 | 996 (4.3%) | 1,442 (6.6%) |
| $30,000 to $34,999 | 1,363 (5.8%) | 1,247 (5.7%) |
| $35,000 to $39,999 | 940 (4.0%) | 1,022 (4.7%) |
| $40,000 to $44,999 | 711 (3.0%) | 1,194 (5.5%) |
| $45,000 to $49,999 | 1,348 (5.8%) | 1,101 (5.0%) |
| $50,000 to $54,999 | 1,055 (4.5%) | 811 (3.7%) |
| $55,000 to $64,999 | 1,879 (8.0%) | 1,741 (8.0%) |
| $65,000 to $74,999 | 1,796 (7.7%) | 1,408 (6.5%) |
| $75,000 to $99,999 | 3,474 (14.8%) | 2,660 (12.2%) |
| $100,000+ | 4,845 (20.7%) | 2,568 (11.8%) |
| Total | 23,430 (100.0%) | 21,840 (100.0%) |
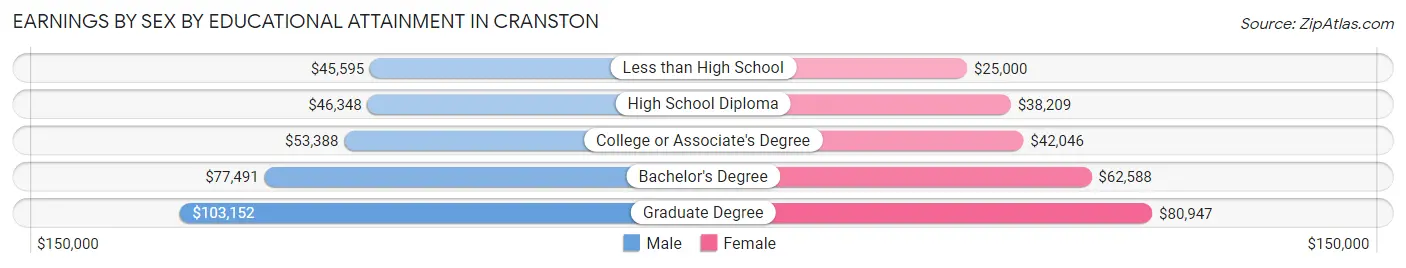
Earnings by Sex by Educational Attainment in Cranston
Average earnings in Cranston are $62,680 for men and $48,353 for women, a difference of 22.9%. Men with an educational attainment of graduate degree enjoy the highest average annual earnings of $103,152, while those with less than high school education earn the least with $45,595. Women with an educational attainment of graduate degree earn the most with the average annual earnings of $80,947, while those with less than high school education have the smallest earnings of $25,000.
| Educational Attainment | Male Income | Female Income |
| Less than High School | $45,595 | $25,000 |
| High School Diploma | $46,348 | $38,209 |
| College or Associate's Degree | $53,388 | $42,046 |
| Bachelor's Degree | $77,491 | $62,588 |
| Graduate Degree | $103,152 | $80,947 |
| Total | $62,680 | $48,353 |
Family Income in Cranston
Family Income Brackets in Cranston
According to the Cranston family income data, there are 5,155 families falling into the $100,000 to $149,999 income range, which is the most common income bracket and makes up 26.1% of all families. Conversely, the $10,000 to $14,999 income bracket is the least frequent group with only 257 families (1.3%) belonging to this category.
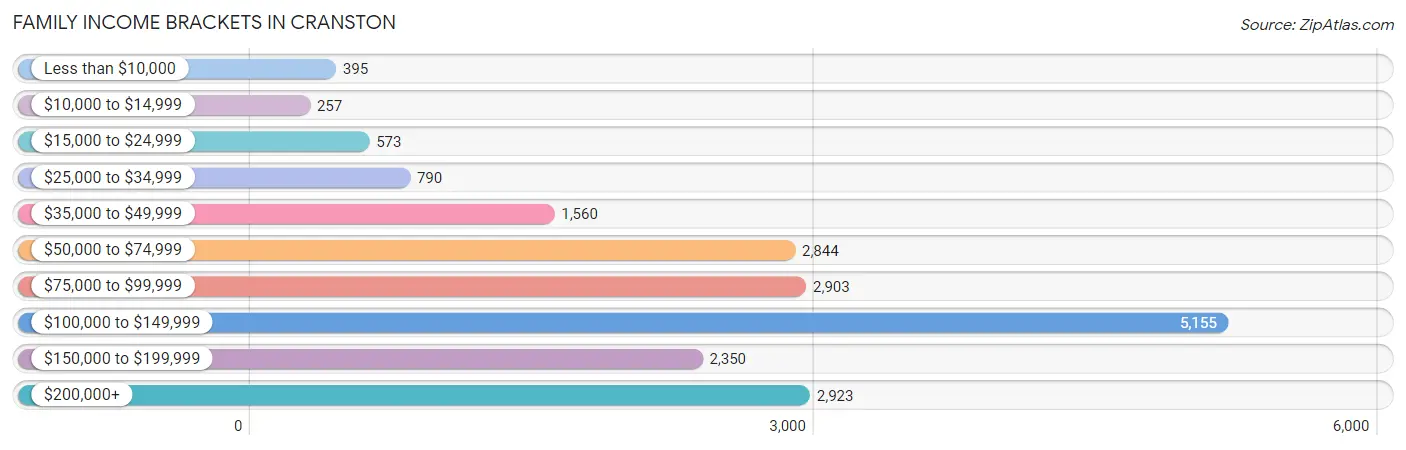
| Income Bracket | # Families | % Families |
| Less than $10,000 | 395 | 2.0% |
| $10,000 to $14,999 | 257 | 1.3% |
| $15,000 to $24,999 | 573 | 2.9% |
| $25,000 to $34,999 | 790 | 4.0% |
| $35,000 to $49,999 | 1,560 | 7.9% |
| $50,000 to $74,999 | 2,844 | 14.4% |
| $75,000 to $99,999 | 2,903 | 14.7% |
| $100,000 to $149,999 | 5,155 | 26.1% |
| $150,000 to $199,999 | 2,350 | 11.9% |
| $200,000+ | 2,923 | 14.8% |
Family Income by Famaliy Size in Cranston
4-person families (3,785 | 19.2%) account for the highest median family income in Cranston with $137,296 per family, while 2-person families (9,389 | 47.5%) have the highest median income of $46,312 per family member.
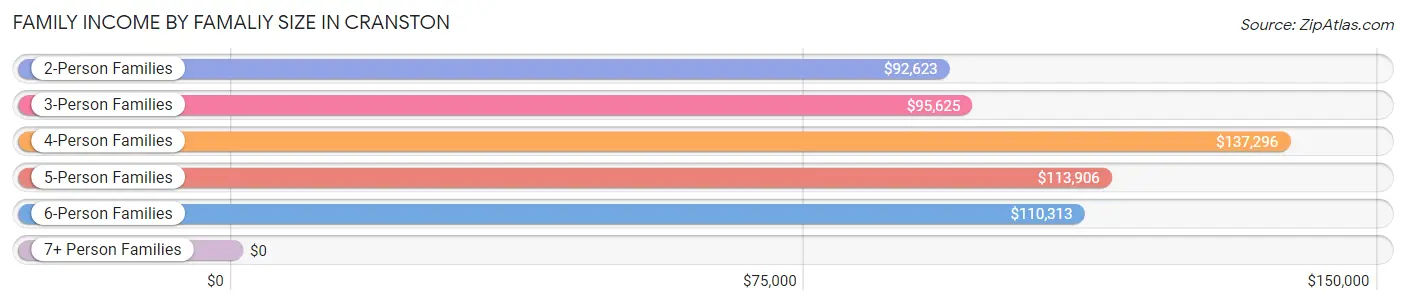
| Income Bracket | # Families | Median Income |
| 2-Person Families | 9,389 (47.5%) | $92,623 |
| 3-Person Families | 4,844 (24.5%) | $95,625 |
| 4-Person Families | 3,785 (19.2%) | $137,296 |
| 5-Person Families | 1,210 (6.1%) | $113,906 |
| 6-Person Families | 353 (1.8%) | $110,313 |
| 7+ Person Families | 169 (0.9%) | $0 |
| Total | 19,750 (100.0%) | $104,674 |
Family Income by Number of Earners in Cranston
The median family income in Cranston is $104,674, with families comprising 3+ earners (2,478) having the highest median family income of $162,143, while families with no earners (2,190) have the lowest median family income of $41,827, accounting for 12.6% and 11.1% of families, respectively.
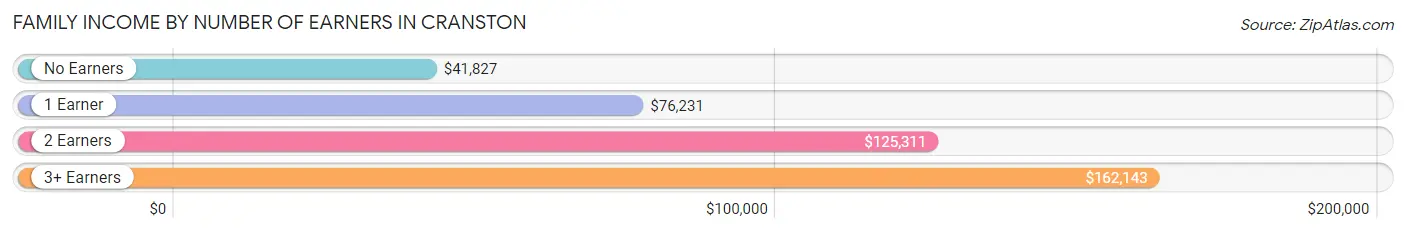
| Number of Earners | # Families | Median Income |
| No Earners | 2,190 (11.1%) | $41,827 |
| 1 Earner | 5,661 (28.7%) | $76,231 |
| 2 Earners | 9,421 (47.7%) | $125,311 |
| 3+ Earners | 2,478 (12.6%) | $162,143 |
| Total | 19,750 (100.0%) | $104,674 |
Household Income in Cranston
Household Income Brackets in Cranston
With 6,844 households falling in the category, the $100,000 to $149,999 income range is the most frequent in Cranston, accounting for 21.1% of all households. In contrast, only 1,395 households (4.3%) fall into the less than $10,000 income bracket, making it the least populous group.
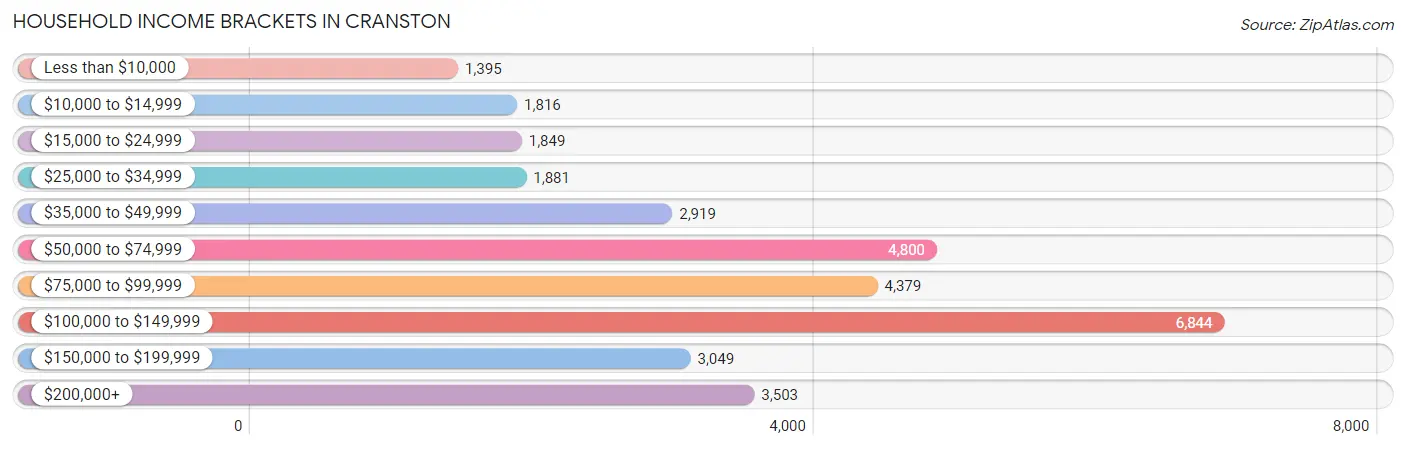
| Income Bracket | # Households | % Households |
| Less than $10,000 | 1,395 | 4.3% |
| $10,000 to $14,999 | 1,816 | 5.6% |
| $15,000 to $24,999 | 1,849 | 5.7% |
| $25,000 to $34,999 | 1,881 | 5.8% |
| $35,000 to $49,999 | 2,919 | 9.0% |
| $50,000 to $74,999 | 4,800 | 14.8% |
| $75,000 to $99,999 | 4,379 | 13.5% |
| $100,000 to $149,999 | 6,844 | 21.1% |
| $150,000 to $199,999 | 3,049 | 9.4% |
| $200,000+ | 3,503 | 10.8% |
Household Income by Householder Age in Cranston
The median household income in Cranston is $83,123, with the highest median household income of $96,587 found in the 45 to 64 years age bracket for the primary householder. A total of 12,293 households (37.9%) fall into this category. Meanwhile, the 15 to 24 years age bracket for the primary householder has the lowest median household income of $39,063, with 641 households (2.0%) in this group.
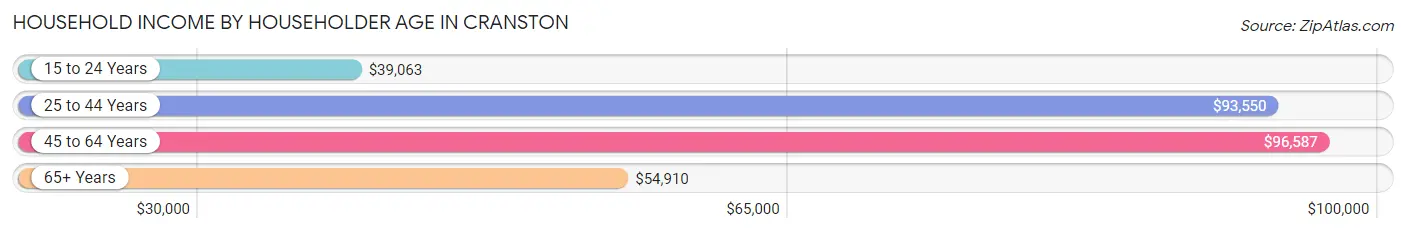
| Income Bracket | # Households | Median Income |
| 15 to 24 Years | 641 (2.0%) | $39,063 |
| 25 to 44 Years | 10,909 (33.6%) | $93,550 |
| 45 to 64 Years | 12,293 (37.9%) | $96,587 |
| 65+ Years | 8,591 (26.5%) | $54,910 |
| Total | 32,434 (100.0%) | $83,123 |
Poverty in Cranston
Income Below Poverty by Sex and Age in Cranston
With 8.1% poverty level for males and 9.7% for females among the residents of Cranston, 6 to 11 year old males and 65 to 74 year old females are the most vulnerable to poverty, with 398 males (14.2%) and 801 females (19.0%) in their respective age groups living below the poverty level.
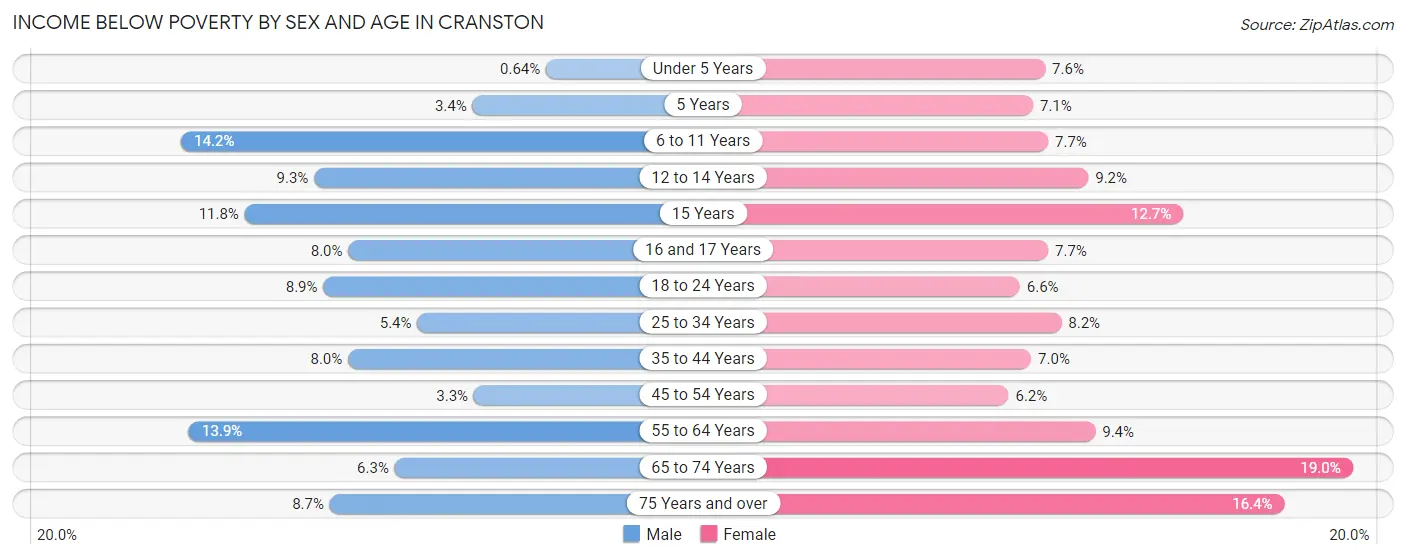
| Age Bracket | Male | Female |
| Under 5 Years | 10 (0.6%) | 201 (7.5%) |
| 5 Years | 14 (3.4%) | 53 (7.1%) |
| 6 to 11 Years | 398 (14.2%) | 175 (7.7%) |
| 12 to 14 Years | 152 (9.2%) | 115 (9.1%) |
| 15 Years | 57 (11.8%) | 47 (12.7%) |
| 16 and 17 Years | 74 (8.0%) | 59 (7.7%) |
| 18 to 24 Years | 256 (8.9%) | 201 (6.6%) |
| 25 to 34 Years | 333 (5.4%) | 447 (8.2%) |
| 35 to 44 Years | 432 (8.0%) | 387 (7.0%) |
| 45 to 54 Years | 155 (3.3%) | 280 (6.2%) |
| 55 to 64 Years | 860 (13.9%) | 567 (9.4%) |
| 65 to 74 Years | 217 (6.3%) | 801 (19.0%) |
| 75 Years and over | 185 (8.7%) | 570 (16.4%) |
| Total | 3,143 (8.1%) | 3,903 (9.7%) |
Income Above Poverty by Sex and Age in Cranston
According to the poverty statistics in Cranston, males aged under 5 years and females aged 45 to 54 years are the age groups that are most secure financially, with 99.4% of males and 93.8% of females in these age groups living above the poverty line.
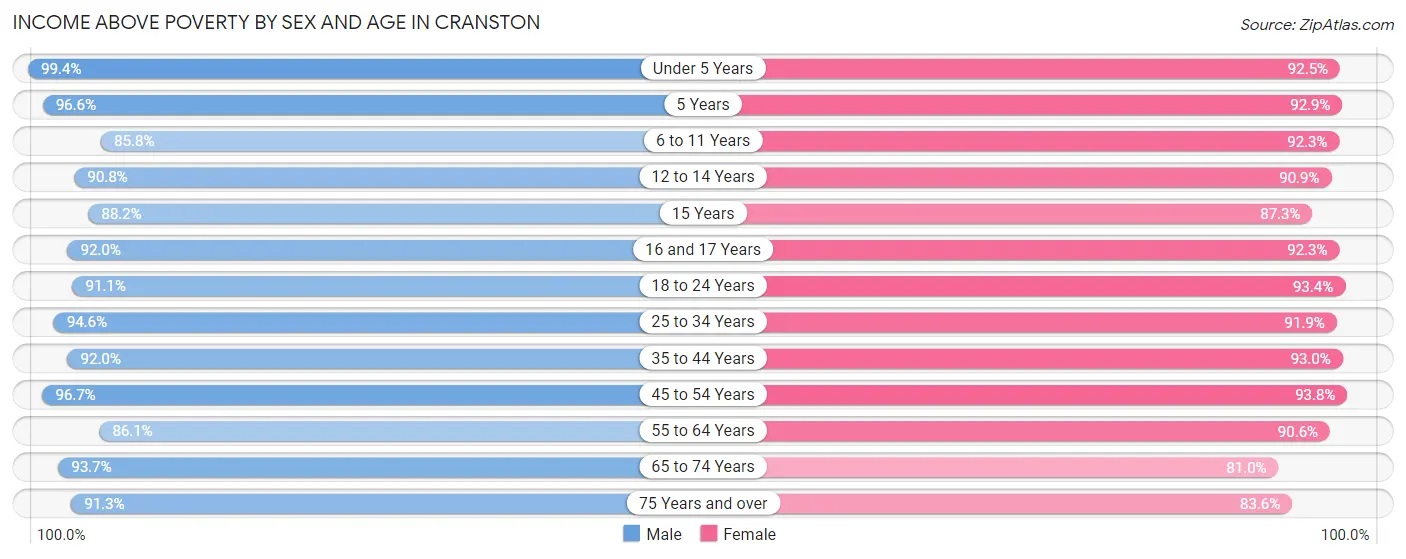
| Age Bracket | Male | Female |
| Under 5 Years | 1,542 (99.4%) | 2,463 (92.4%) |
| 5 Years | 402 (96.6%) | 693 (92.9%) |
| 6 to 11 Years | 2,406 (85.8%) | 2,110 (92.3%) |
| 12 to 14 Years | 1,492 (90.7%) | 1,142 (90.8%) |
| 15 Years | 425 (88.2%) | 324 (87.3%) |
| 16 and 17 Years | 853 (92.0%) | 711 (92.3%) |
| 18 to 24 Years | 2,616 (91.1%) | 2,840 (93.4%) |
| 25 to 34 Years | 5,812 (94.6%) | 5,039 (91.8%) |
| 35 to 44 Years | 4,974 (92.0%) | 5,116 (93.0%) |
| 45 to 54 Years | 4,513 (96.7%) | 4,243 (93.8%) |
| 55 to 64 Years | 5,325 (86.1%) | 5,460 (90.6%) |
| 65 to 74 Years | 3,251 (93.7%) | 3,424 (81.0%) |
| 75 Years and over | 1,948 (91.3%) | 2,899 (83.6%) |
| Total | 35,559 (91.9%) | 36,464 (90.3%) |
Income Below Poverty Among Married-Couple Families in Cranston
The poverty statistics for married-couple families in Cranston show that 2.0% or 292 of the total 14,340 families live below the poverty line. Families with 5 or more children have the highest poverty rate of 100.0%, comprising of 27 families. On the other hand, families with 1 or 2 children have the lowest poverty rate of 1.7%, which includes 85 families.
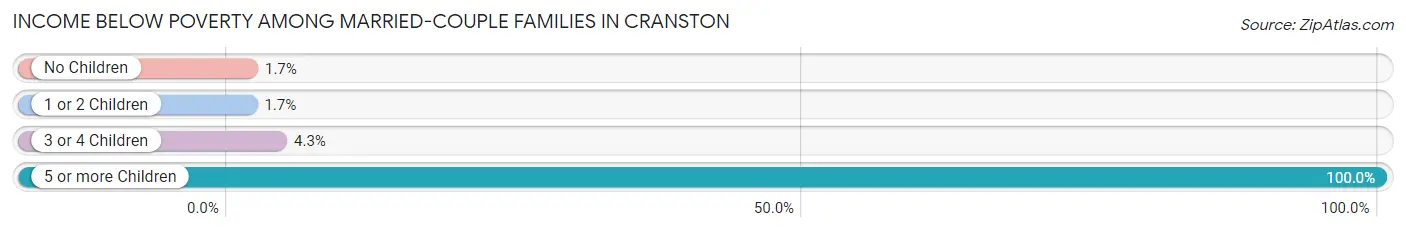
| Children | Above Poverty | Below Poverty |
| No Children | 8,418 (98.3%) | 149 (1.7%) |
| 1 or 2 Children | 4,935 (98.3%) | 85 (1.7%) |
| 3 or 4 Children | 695 (95.7%) | 31 (4.3%) |
| 5 or more Children | 0 (0.0%) | 27 (100.0%) |
| Total | 14,048 (98.0%) | 292 (2.0%) |
Income Below Poverty Among Single-Parent Households in Cranston
According to the poverty data in Cranston, 6.2% or 83 single-father households and 16.9% or 688 single-mother households are living below the poverty line. Among single-father households, those with no children have the highest poverty rate, with 64 households (9.6%) experiencing poverty. Likewise, among single-mother households, those with 3 or 4 children have the highest poverty rate, with 104 households (74.8%) falling below the poverty line.
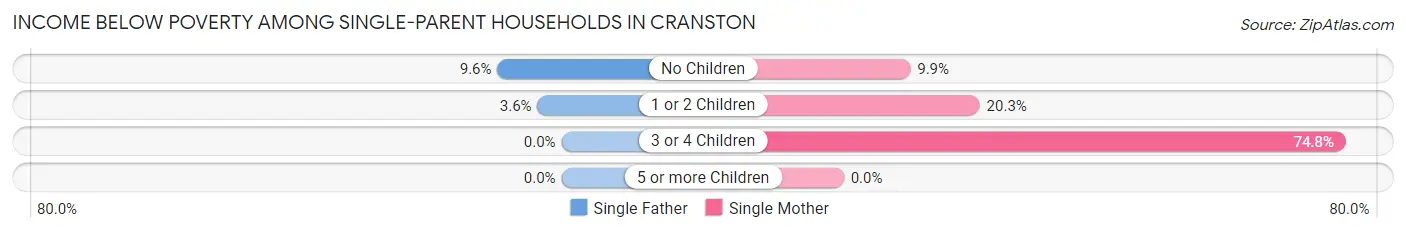
| Children | Single Father | Single Mother |
| No Children | 64 (9.6%) | 203 (9.9%) |
| 1 or 2 Children | 19 (3.6%) | 381 (20.3%) |
| 3 or 4 Children | 0 (0.0%) | 104 (74.8%) |
| 5 or more Children | 0 (0.0%) | 0 (0.0%) |
| Total | 83 (6.2%) | 688 (16.9%) |
Income Below Poverty Among Married-Couple vs Single-Parent Households in Cranston
The poverty data for Cranston shows that 292 of the married-couple family households (2.0%) and 771 of the single-parent households (14.2%) are living below the poverty level. Within the married-couple family households, those with 5 or more children have the highest poverty rate, with 27 households (100.0%) falling below the poverty line. Among the single-parent households, those with 3 or 4 children have the highest poverty rate, with 104 household (36.5%) living below poverty.
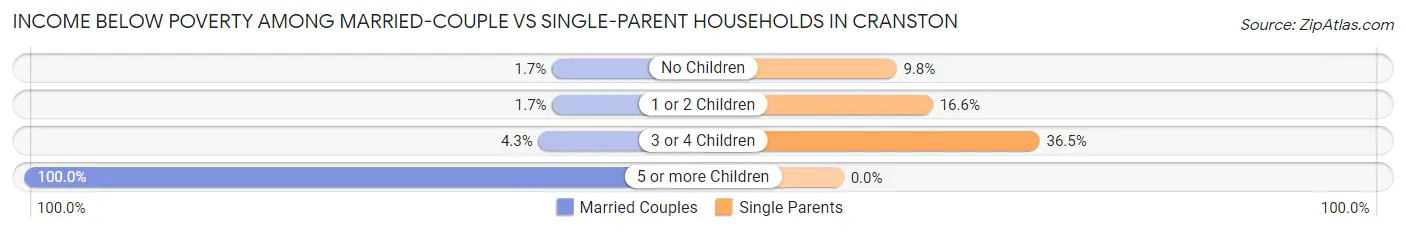
| Children | Married-Couple Families | Single-Parent Households |
| No Children | 149 (1.7%) | 267 (9.8%) |
| 1 or 2 Children | 85 (1.7%) | 400 (16.6%) |
| 3 or 4 Children | 31 (4.3%) | 104 (36.5%) |
| 5 or more Children | 27 (100.0%) | 0 (0.0%) |
| Total | 292 (2.0%) | 771 (14.2%) |
Race in Cranston
The most populous races in Cranston are White / Caucasian (59,958 | 72.5%), Hispanic or Latino (15,128 | 18.3%), and Two or more Races (7,187 | 8.7%).
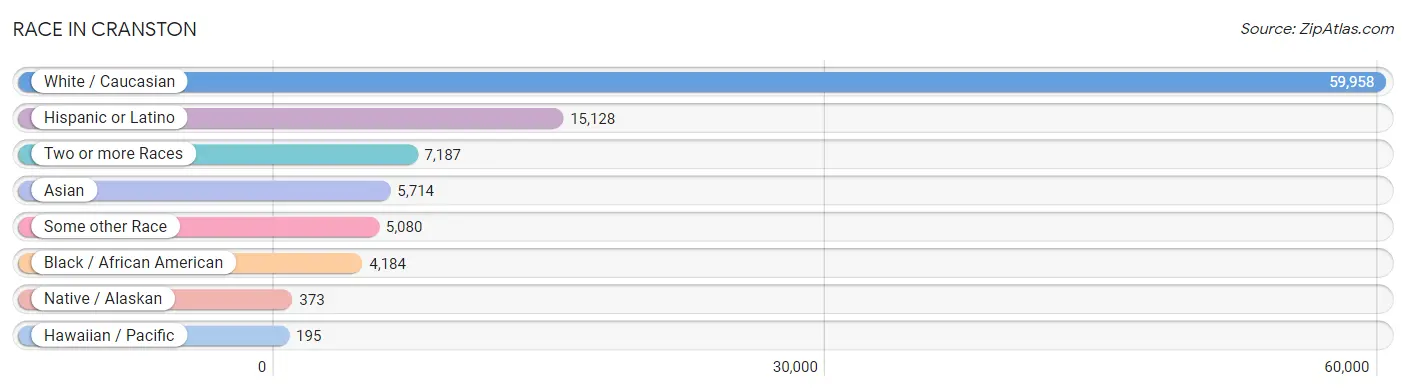
| Race | # Population | % Population |
| Asian | 5,714 | 6.9% |
| Black / African American | 4,184 | 5.1% |
| Hawaiian / Pacific | 195 | 0.2% |
| Hispanic or Latino | 15,128 | 18.3% |
| Native / Alaskan | 373 | 0.4% |
| White / Caucasian | 59,958 | 72.5% |
| Two or more Races | 7,187 | 8.7% |
| Some other Race | 5,080 | 6.1% |
| Total | 82,691 | 100.0% |
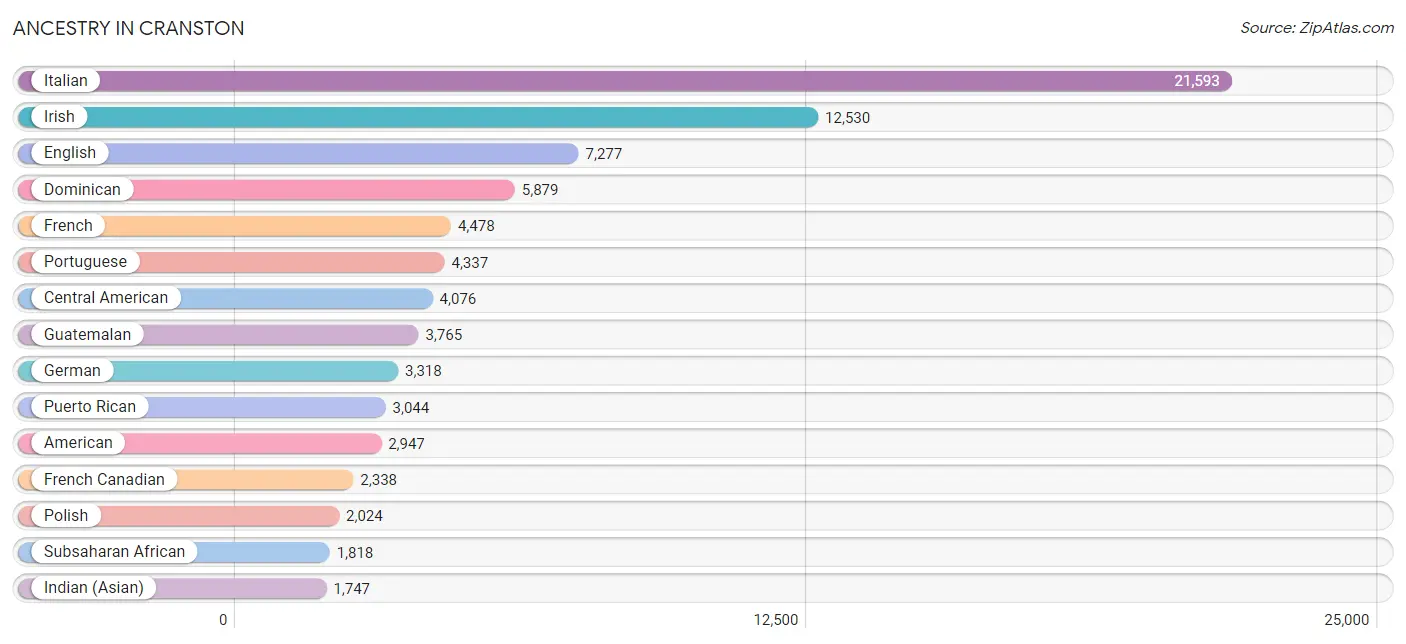
Ancestry in Cranston
The most populous ancestries reported in Cranston are Italian (21,593 | 26.1%), Irish (12,530 | 15.1%), English (7,277 | 8.8%), Dominican (5,879 | 7.1%), and French (4,478 | 5.4%), together accounting for 62.6% of all Cranston residents.
| Ancestry | # Population | % Population |
| African | 71 | 0.1% |
| American | 2,947 | 3.6% |
| Arab | 885 | 1.1% |
| Argentinean | 116 | 0.1% |
| Armenian | 542 | 0.7% |
| Australian | 16 | 0.0% |
| Austrian | 168 | 0.2% |
| Bangladeshi | 44 | 0.1% |
| Barbadian | 4 | 0.0% |
| Basque | 6 | 0.0% |
| Belgian | 55 | 0.1% |
| Bermudan | 23 | 0.0% |
| Bhutanese | 159 | 0.2% |
| Blackfeet | 54 | 0.1% |
| Bolivian | 190 | 0.2% |
| Brazilian | 57 | 0.1% |
| British | 251 | 0.3% |
| British West Indian | 45 | 0.1% |
| Bulgarian | 23 | 0.0% |
| Burmese | 188 | 0.2% |
| Canadian | 114 | 0.1% |
| Cape Verdean | 889 | 1.1% |
| Central American | 4,076 | 4.9% |
| Central American Indian | 210 | 0.3% |
| Cherokee | 119 | 0.1% |
| Chippewa | 46 | 0.1% |
| Colombian | 129 | 0.2% |
| Croatian | 34 | 0.0% |
| Crow | 23 | 0.0% |
| Cuban | 53 | 0.1% |
| Czech | 38 | 0.1% |
| Czechoslovakian | 9 | 0.0% |
| Danish | 17 | 0.0% |
| Dominican | 5,879 | 7.1% |
| Dutch | 229 | 0.3% |
| Eastern European | 169 | 0.2% |
| Ecuadorian | 197 | 0.2% |
| Egyptian | 207 | 0.3% |
| English | 7,277 | 8.8% |
| European | 291 | 0.4% |
| Filipino | 19 | 0.0% |
| French | 4,478 | 5.4% |
| French American Indian | 9 | 0.0% |
| French Canadian | 2,338 | 2.8% |
| German | 3,318 | 4.0% |
| Greek | 1,106 | 1.3% |
| Guatemalan | 3,765 | 4.5% |
| Guyanese | 62 | 0.1% |
| Haitian | 491 | 0.6% |
| Honduran | 53 | 0.1% |
| Hungarian | 148 | 0.2% |
| Icelander | 17 | 0.0% |
| Indian (Asian) | 1,747 | 2.1% |
| Iraqi | 24 | 0.0% |
| Irish | 12,530 | 15.1% |
| Iroquois | 36 | 0.0% |
| Israeli | 12 | 0.0% |
| Italian | 21,593 | 26.1% |
| Jamaican | 144 | 0.2% |
| Japanese | 1,332 | 1.6% |
| Kenyan | 5 | 0.0% |
| Korean | 1,492 | 1.8% |
| Laotian | 16 | 0.0% |
| Latvian | 60 | 0.1% |
| Lebanese | 315 | 0.4% |
| Liberian | 70 | 0.1% |
| Lithuanian | 159 | 0.2% |
| Luxembourger | 10 | 0.0% |
| Malaysian | 355 | 0.4% |
| Mexican | 600 | 0.7% |
| Mexican American Indian | 161 | 0.2% |
| Mongolian | 5 | 0.0% |
| Moroccan | 54 | 0.1% |
| Native Hawaiian | 71 | 0.1% |
| Nicaraguan | 14 | 0.0% |
| Nigerian | 700 | 0.9% |
| Northern European | 111 | 0.1% |
| Norwegian | 278 | 0.3% |
| Pakistani | 6 | 0.0% |
| Peruvian | 190 | 0.2% |
| Polish | 2,024 | 2.5% |
| Portuguese | 4,337 | 5.2% |
| Puerto Rican | 3,044 | 3.7% |
| Romanian | 47 | 0.1% |
| Russian | 754 | 0.9% |
| Salvadoran | 244 | 0.3% |
| Samoan | 72 | 0.1% |
| Scandinavian | 48 | 0.1% |
| Scotch-Irish | 163 | 0.2% |
| Scottish | 972 | 1.2% |
| Senegalese | 20 | 0.0% |
| Slavic | 9 | 0.0% |
| Slovak | 67 | 0.1% |
| South African | 11 | 0.0% |
| South American | 928 | 1.1% |
| South American Indian | 23 | 0.0% |
| Spaniard | 104 | 0.1% |
| Spanish | 32 | 0.0% |
| Sri Lankan | 302 | 0.4% |
| Subsaharan African | 1,818 | 2.2% |
| Swedish | 881 | 1.1% |
| Swiss | 38 | 0.1% |
| Syrian | 152 | 0.2% |
| Thai | 762 | 0.9% |
| Trinidadian and Tobagonian | 200 | 0.2% |
| Turkish | 16 | 0.0% |
| Ukrainian | 189 | 0.2% |
| Venezuelan | 106 | 0.1% |
| Vietnamese | 23 | 0.0% |
| Welsh | 377 | 0.5% |
| West Indian | 4 | 0.0% | View All 111 Rows |
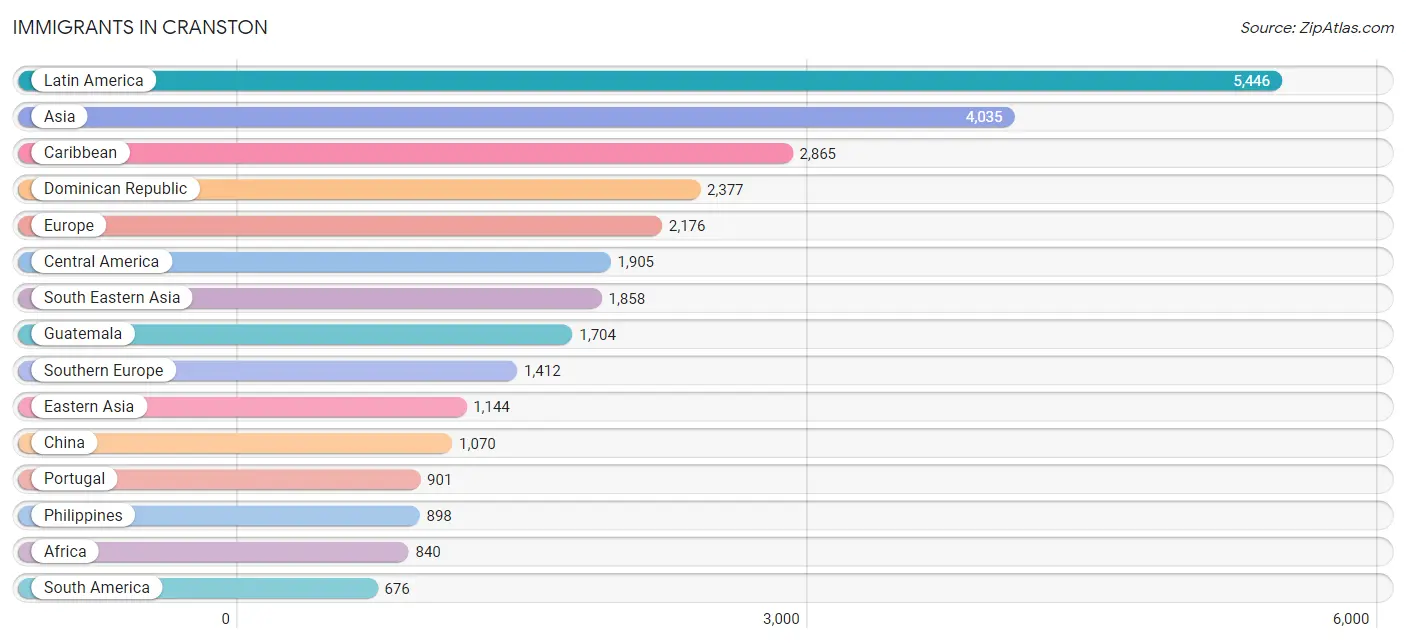
Immigrants in Cranston
The most numerous immigrant groups reported in Cranston came from Latin America (5,446 | 6.6%), Asia (4,035 | 4.9%), Caribbean (2,865 | 3.5%), Dominican Republic (2,377 | 2.9%), and Europe (2,176 | 2.6%), together accounting for 20.4% of all Cranston residents.
| Immigration Origin | # Population | % Population |
| Africa | 840 | 1.0% |
| Argentina | 63 | 0.1% |
| Armenia | 85 | 0.1% |
| Asia | 4,035 | 4.9% |
| Australia | 13 | 0.0% |
| Azores | 177 | 0.2% |
| Bangladesh | 23 | 0.0% |
| Barbados | 4 | 0.0% |
| Belarus | 78 | 0.1% |
| Belgium | 3 | 0.0% |
| Bolivia | 107 | 0.1% |
| Brazil | 94 | 0.1% |
| Bulgaria | 21 | 0.0% |
| Cabo Verde | 97 | 0.1% |
| Cambodia | 354 | 0.4% |
| Canada | 190 | 0.2% |
| Caribbean | 2,865 | 3.5% |
| Central America | 1,905 | 2.3% |
| China | 1,070 | 1.3% |
| Colombia | 96 | 0.1% |
| Costa Rica | 2 | 0.0% |
| Cuba | 37 | 0.0% |
| Dominican Republic | 2,377 | 2.9% |
| Eastern Africa | 11 | 0.0% |
| Eastern Asia | 1,144 | 1.4% |
| Eastern Europe | 476 | 0.6% |
| Ecuador | 131 | 0.2% |
| Egypt | 118 | 0.1% |
| El Salvador | 124 | 0.2% |
| England | 45 | 0.1% |
| Europe | 2,176 | 2.6% |
| Fiji | 72 | 0.1% |
| France | 31 | 0.0% |
| Germany | 76 | 0.1% |
| Greece | 123 | 0.2% |
| Guatemala | 1,704 | 2.1% |
| Guyana | 49 | 0.1% |
| Haiti | 286 | 0.4% |
| Honduras | 27 | 0.0% |
| Hong Kong | 152 | 0.2% |
| Hungary | 76 | 0.1% |
| India | 550 | 0.7% |
| Indonesia | 30 | 0.0% |
| Iraq | 105 | 0.1% |
| Israel | 23 | 0.0% |
| Italy | 388 | 0.5% |
| Jamaica | 21 | 0.0% |
| Japan | 12 | 0.0% |
| Kenya | 5 | 0.0% |
| Korea | 62 | 0.1% |
| Laos | 279 | 0.3% |
| Latin America | 5,446 | 6.6% |
| Latvia | 21 | 0.0% |
| Lebanon | 48 | 0.1% |
| Liberia | 81 | 0.1% |
| Lithuania | 41 | 0.1% |
| Malaysia | 32 | 0.0% |
| Mexico | 34 | 0.0% |
| Middle Africa | 17 | 0.0% |
| Morocco | 6 | 0.0% |
| Nicaragua | 14 | 0.0% |
| Nigeria | 421 | 0.5% |
| Northern Africa | 124 | 0.2% |
| Northern Europe | 165 | 0.2% |
| Oceania | 104 | 0.1% |
| Peru | 126 | 0.2% |
| Philippines | 898 | 1.1% |
| Poland | 66 | 0.1% |
| Portugal | 901 | 1.1% |
| Romania | 17 | 0.0% |
| Russia | 86 | 0.1% |
| Scotland | 33 | 0.0% |
| Senegal | 25 | 0.0% |
| South Africa | 11 | 0.0% |
| South America | 676 | 0.8% |
| South Central Asia | 608 | 0.7% |
| South Eastern Asia | 1,858 | 2.2% |
| Southern Europe | 1,412 | 1.7% |
| Sri Lanka | 17 | 0.0% |
| Sweden | 25 | 0.0% |
| Syria | 156 | 0.2% |
| Taiwan | 27 | 0.0% |
| Thailand | 133 | 0.2% |
| Trinidad and Tobago | 140 | 0.2% |
| Turkey | 8 | 0.0% |
| Ukraine | 43 | 0.1% |
| Uzbekistan | 18 | 0.0% |
| Venezuela | 10 | 0.0% |
| Vietnam | 132 | 0.2% |
| Western Africa | 674 | 0.8% |
| Western Asia | 425 | 0.5% |
| Western Europe | 110 | 0.1% |
| Zimbabwe | 6 | 0.0% | View All 93 Rows |
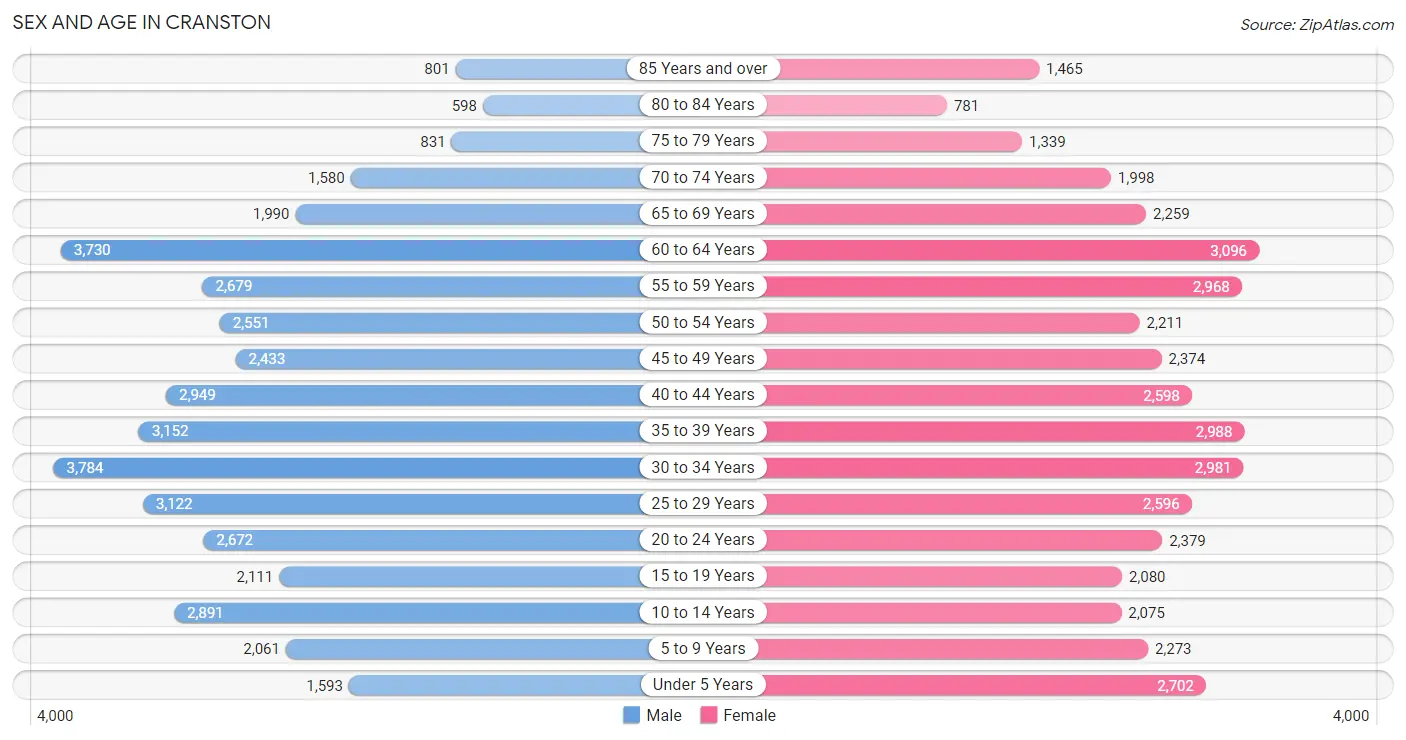
Sex and Age in Cranston
Sex and Age in Cranston
The most populous age groups in Cranston are 30 to 34 Years (3,784 | 9.1%) for men and 60 to 64 Years (3,096 | 7.5%) for women.
| Age Bracket | Male | Female |
| Under 5 Years | 1,593 (3.8%) | 2,702 (6.6%) |
| 5 to 9 Years | 2,061 (5.0%) | 2,273 (5.5%) |
| 10 to 14 Years | 2,891 (7.0%) | 2,075 (5.0%) |
| 15 to 19 Years | 2,111 (5.1%) | 2,080 (5.1%) |
| 20 to 24 Years | 2,672 (6.4%) | 2,379 (5.8%) |
| 25 to 29 Years | 3,122 (7.5%) | 2,596 (6.3%) |
| 30 to 34 Years | 3,784 (9.1%) | 2,981 (7.2%) |
| 35 to 39 Years | 3,152 (7.6%) | 2,988 (7.3%) |
| 40 to 44 Years | 2,949 (7.1%) | 2,598 (6.3%) |
| 45 to 49 Years | 2,433 (5.9%) | 2,374 (5.8%) |
| 50 to 54 Years | 2,551 (6.1%) | 2,211 (5.4%) |
| 55 to 59 Years | 2,679 (6.5%) | 2,968 (7.2%) |
| 60 to 64 Years | 3,730 (9.0%) | 3,096 (7.5%) |
| 65 to 69 Years | 1,990 (4.8%) | 2,259 (5.5%) |
| 70 to 74 Years | 1,580 (3.8%) | 1,998 (4.9%) |
| 75 to 79 Years | 831 (2.0%) | 1,339 (3.3%) |
| 80 to 84 Years | 598 (1.4%) | 781 (1.9%) |
| 85 Years and over | 801 (1.9%) | 1,465 (3.6%) |
| Total | 41,528 (100.0%) | 41,163 (100.0%) |
Families and Households in Cranston
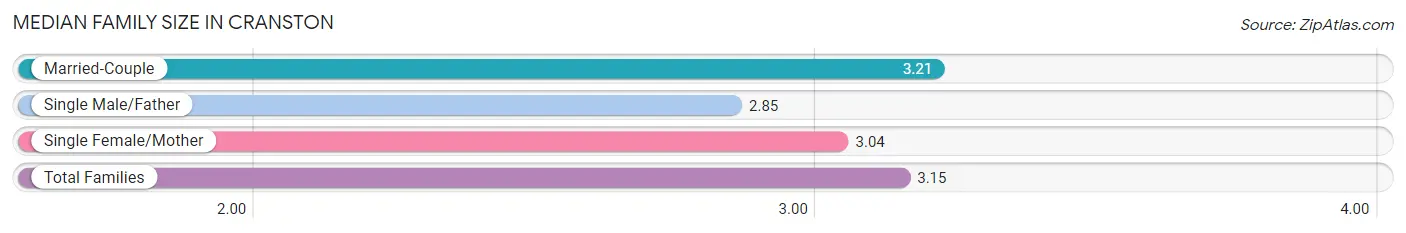
Median Family Size in Cranston
The median family size in Cranston is 3.15 persons per family, with married-couple families (14,340 | 72.6%) accounting for the largest median family size of 3.21 persons per family. On the other hand, single male/father families (1,346 | 6.8%) represent the smallest median family size with 2.85 persons per family.
| Family Type | # Families | Family Size |
| Married-Couple | 14,340 (72.6%) | 3.21 |
| Single Male/Father | 1,346 (6.8%) | 2.85 |
| Single Female/Mother | 4,064 (20.6%) | 3.04 |
| Total Families | 19,750 (100.0%) | 3.15 |
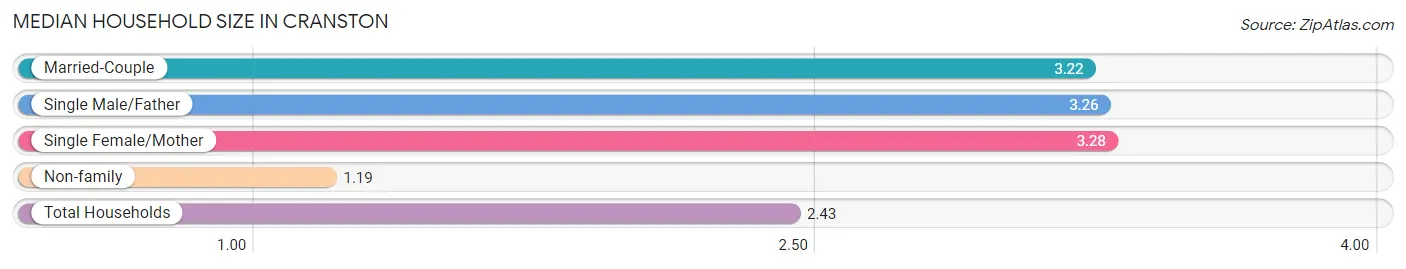
Median Household Size in Cranston
The median household size in Cranston is 2.43 persons per household, with single female/mother households (4,064 | 12.5%) accounting for the largest median household size of 3.28 persons per household. non-family households (12,684 | 39.1%) represent the smallest median household size with 1.19 persons per household.
| Household Type | # Households | Household Size |
| Married-Couple | 14,340 (44.2%) | 3.22 |
| Single Male/Father | 1,346 (4.2%) | 3.26 |
| Single Female/Mother | 4,064 (12.5%) | 3.28 |
| Non-family | 12,684 (39.1%) | 1.19 |
| Total Households | 32,434 (100.0%) | 2.43 |
Household Size by Marriage Status in Cranston
Out of a total of 32,434 households in Cranston, 19,750 (60.9%) are family households, while 12,684 (39.1%) are nonfamily households. The most numerous type of family households are 2-person households, comprising 8,826, and the most common type of nonfamily households are 1-person households, comprising 10,531.
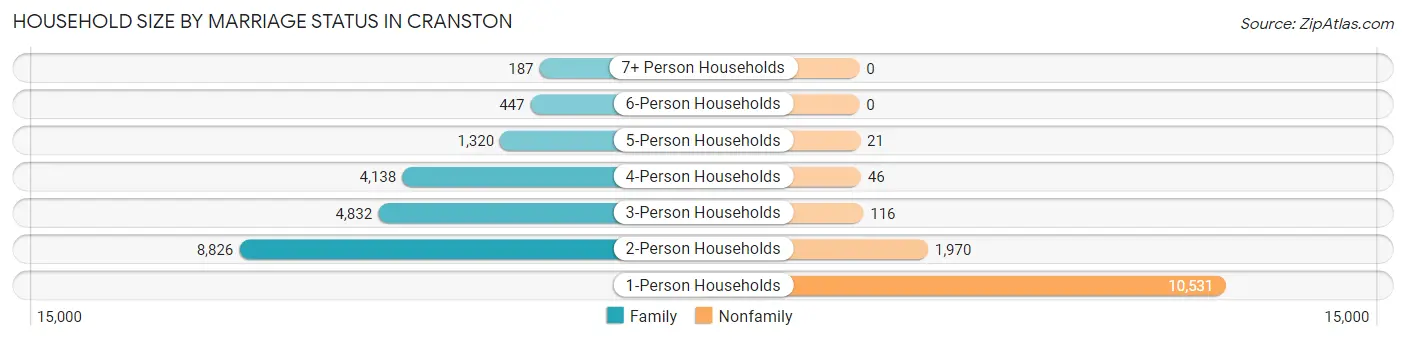
| Household Size | Family Households | Nonfamily Households |
| 1-Person Households | - | 10,531 (32.5%) |
| 2-Person Households | 8,826 (27.2%) | 1,970 (6.1%) |
| 3-Person Households | 4,832 (14.9%) | 116 (0.4%) |
| 4-Person Households | 4,138 (12.8%) | 46 (0.1%) |
| 5-Person Households | 1,320 (4.1%) | 21 (0.1%) |
| 6-Person Households | 447 (1.4%) | 0 (0.0%) |
| 7+ Person Households | 187 (0.6%) | 0 (0.0%) |
| Total | 19,750 (60.9%) | 12,684 (39.1%) |
Female Fertility in Cranston
Fertility by Age in Cranston
Average fertility rate in Cranston is 45.0 births per 1,000 women. Women in the age bracket of 35 to 50 years have the highest fertility rate with 59.0 births per 1,000 women. Women in the age bracket of 35 to 50 years acount for 60.6% of all women with births.
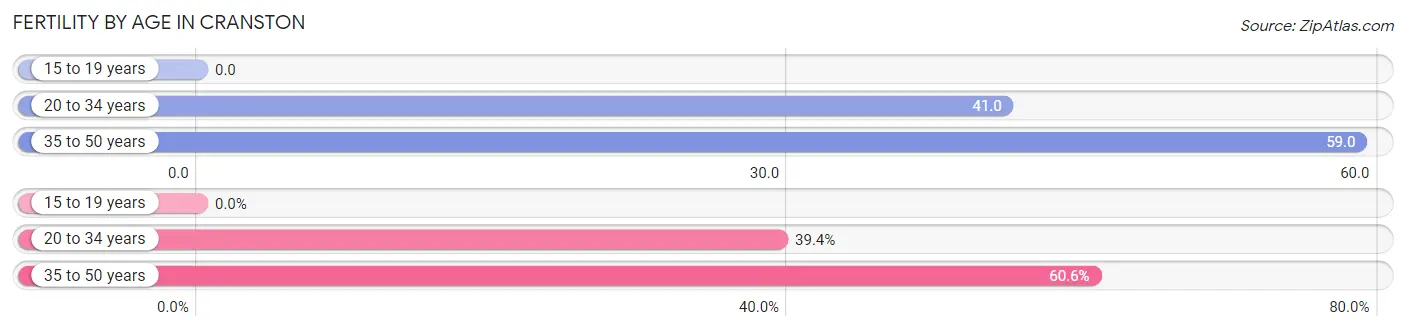
| Age Bracket | Women with Births | Births / 1,000 Women |
| 15 to 19 years | 0 (0.0%) | 0.0 |
| 20 to 34 years | 326 (39.4%) | 41.0 |
| 35 to 50 years | 502 (60.6%) | 59.0 |
| Total | 828 (100.0%) | 45.0 |
Fertility by Age by Marriage Status in Cranston
72.2% of women with births (828) in Cranston are married. The highest percentage of unmarried women with births falls into 20 to 34 years age bracket with 41.7% of them unmarried at the time of birth, while the lowest percentage of unmarried women with births belong to 35 to 50 years age bracket with 18.7% of them unmarried.
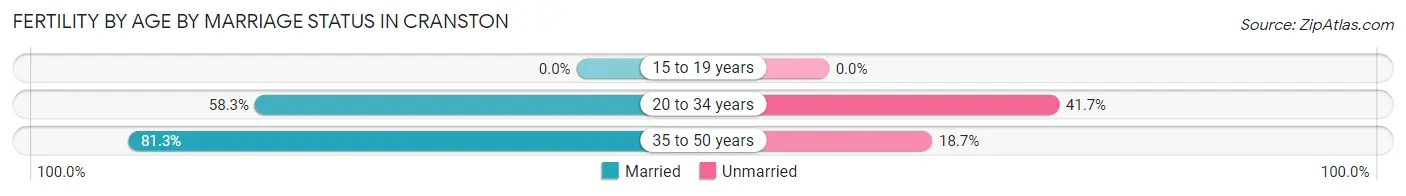
| Age Bracket | Married | Unmarried |
| 15 to 19 years | 0 (0.0%) | 0 (0.0%) |
| 20 to 34 years | 190 (58.3%) | 136 (41.7%) |
| 35 to 50 years | 408 (81.3%) | 94 (18.7%) |
| Total | 598 (72.2%) | 230 (27.8%) |
Fertility by Education in Cranston
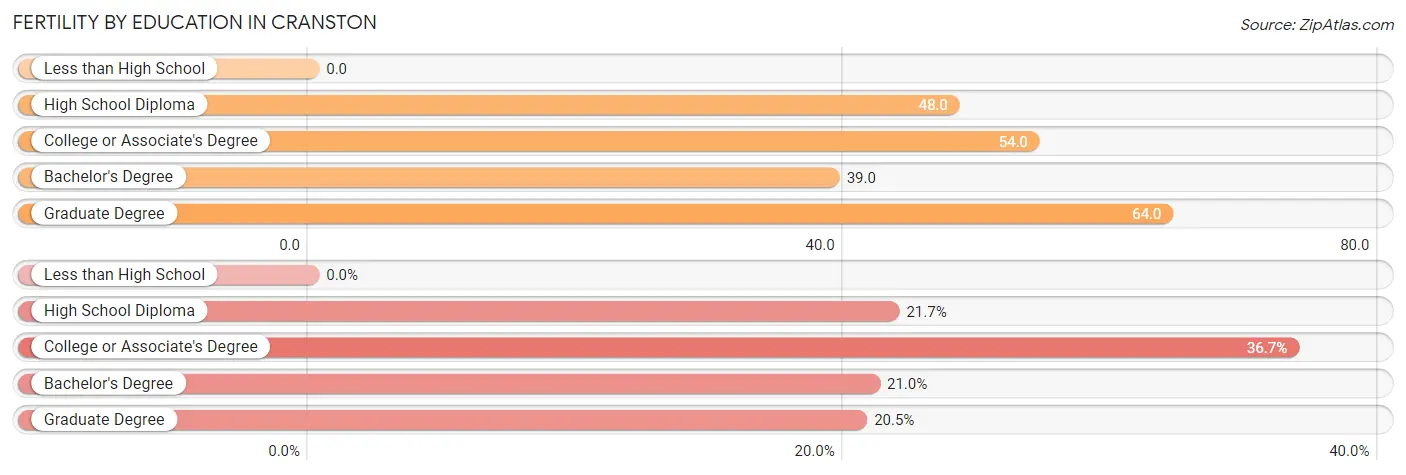
| Educational Attainment | Women with Births | Births / 1,000 Women |
| Less than High School | 0 (0.0%) | 0.0 |
| High School Diploma | 180 (21.7%) | 48.0 |
| College or Associate's Degree | 304 (36.7%) | 54.0 |
| Bachelor's Degree | 174 (21.0%) | 39.0 |
| Graduate Degree | 170 (20.5%) | 64.0 |
| Total | 828 (100.0%) | 45.0 |
Fertility by Education by Marriage Status in Cranston
27.8% of women with births in Cranston are unmarried. Women with the educational attainment of bachelor's degree are most likely to be married with 89.7% of them married at childbirth, while women with the educational attainment of college or associate's degree are least likely to be married with 43.4% of them unmarried at childbirth.
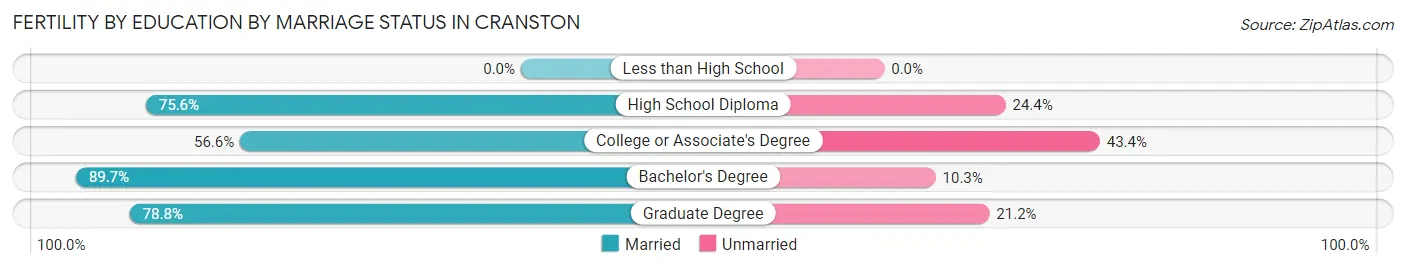
| Educational Attainment | Married | Unmarried |
| Less than High School | 0 (0.0%) | 0 (0.0%) |
| High School Diploma | 136 (75.6%) | 44 (24.4%) |
| College or Associate's Degree | 172 (56.6%) | 132 (43.4%) |
| Bachelor's Degree | 156 (89.7%) | 18 (10.3%) |
| Graduate Degree | 134 (78.8%) | 36 (21.2%) |
| Total | 598 (72.2%) | 230 (27.8%) |
Employment Characteristics in Cranston
Employment by Class of Employer in Cranston
Among the 40,734 employed individuals in Cranston, private company employees (26,307 | 64.6%), not-for-profit organizations (5,223 | 12.8%), and local government employees (2,708 | 6.7%) make up the most common classes of employment.
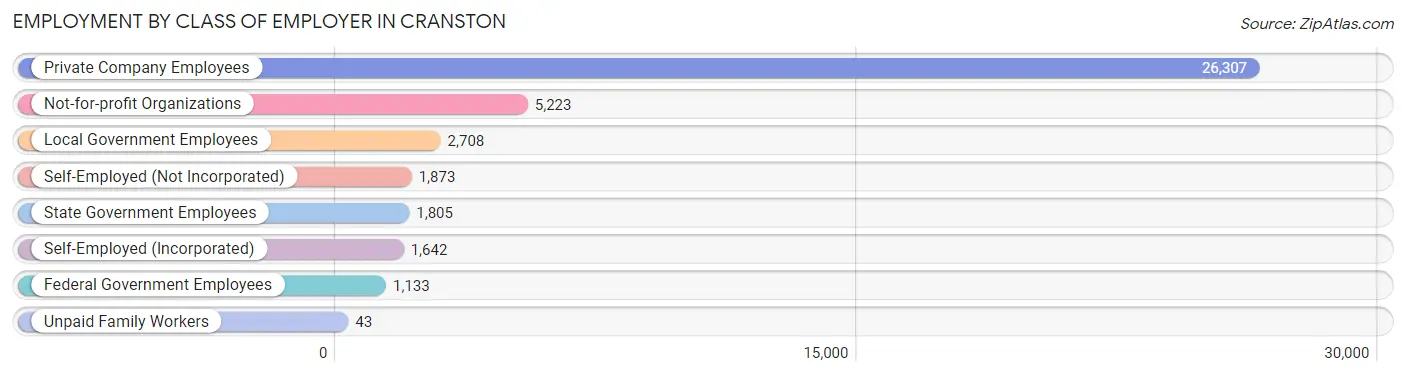
| Employer Class | # Employees | % Employees |
| Private Company Employees | 26,307 | 64.6% |
| Self-Employed (Incorporated) | 1,642 | 4.0% |
| Self-Employed (Not Incorporated) | 1,873 | 4.6% |
| Not-for-profit Organizations | 5,223 | 12.8% |
| Local Government Employees | 2,708 | 6.7% |
| State Government Employees | 1,805 | 4.4% |
| Federal Government Employees | 1,133 | 2.8% |
| Unpaid Family Workers | 43 | 0.1% |
| Total | 40,734 | 100.0% |
Employment Status by Age in Cranston
According to the labor force statistics for Cranston, out of the total population over 16 years of age (68,240), 64.8% or 44,220 individuals are in the labor force, with 5.6% or 2,476 of them unemployed. The age group with the highest labor force participation rate is 30 to 34 years, with 88.5% or 5,987 individuals in the labor force. Within the labor force, the 20 to 24 years age range has the highest percentage of unemployed individuals, with 15.0% or 527 of them being unemployed.
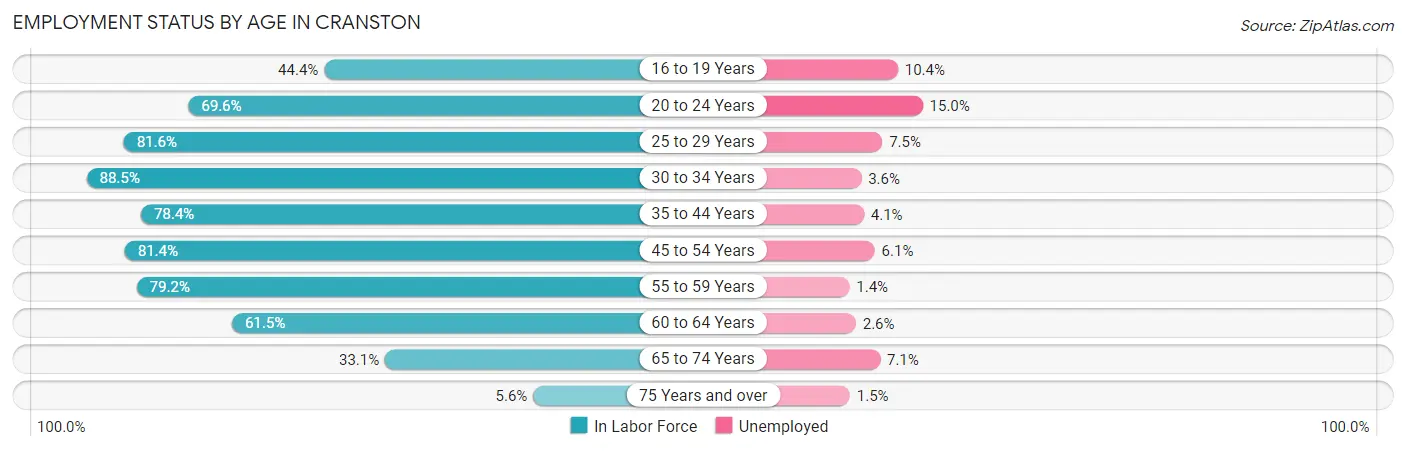
| Age Bracket | In Labor Force | Unemployed |
| 16 to 19 Years | 1,481 (44.4%) | 154 (10.4%) |
| 20 to 24 Years | 3,515 (69.6%) | 527 (15.0%) |
| 25 to 29 Years | 4,666 (81.6%) | 350 (7.5%) |
| 30 to 34 Years | 5,987 (88.5%) | 216 (3.6%) |
| 35 to 44 Years | 9,163 (78.4%) | 376 (4.1%) |
| 45 to 54 Years | 7,789 (81.4%) | 475 (6.1%) |
| 55 to 59 Years | 4,472 (79.2%) | 63 (1.4%) |
| 60 to 64 Years | 4,198 (61.5%) | 109 (2.6%) |
| 65 to 74 Years | 2,591 (33.1%) | 184 (7.1%) |
| 75 Years and over | 326 (5.6%) | 5 (1.5%) |
| Total | 44,220 (64.8%) | 2,476 (5.6%) |
Employment Status by Educational Attainment in Cranston
According to labor force statistics for Cranston, 78.5% of individuals (36,276) out of the total population between 25 and 64 years of age (46,212) are in the labor force, with 4.4% or 1,596 of them being unemployed. The group with the highest labor force participation rate are those with the educational attainment of bachelor's degree or higher, with 91.3% or 14,977 individuals in the labor force. Within the labor force, individuals with high school diploma education have the highest percentage of unemployment, with 7.8% or 596 of them being unemployed.
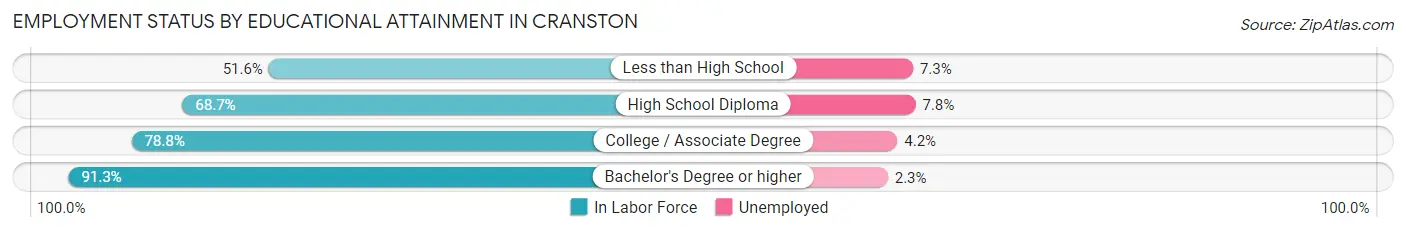
| Educational Attainment | In Labor Force | Unemployed |
| Less than High School | 2,006 (51.6%) | 284 (7.3%) |
| High School Diploma | 7,642 (68.7%) | 868 (7.8%) |
| College / Associate Degree | 11,661 (78.8%) | 622 (4.2%) |
| Bachelor's Degree or higher | 14,977 (91.3%) | 377 (2.3%) |
| Total | 36,276 (78.5%) | 2,033 (4.4%) |
Employment Occupations by Sex in Cranston
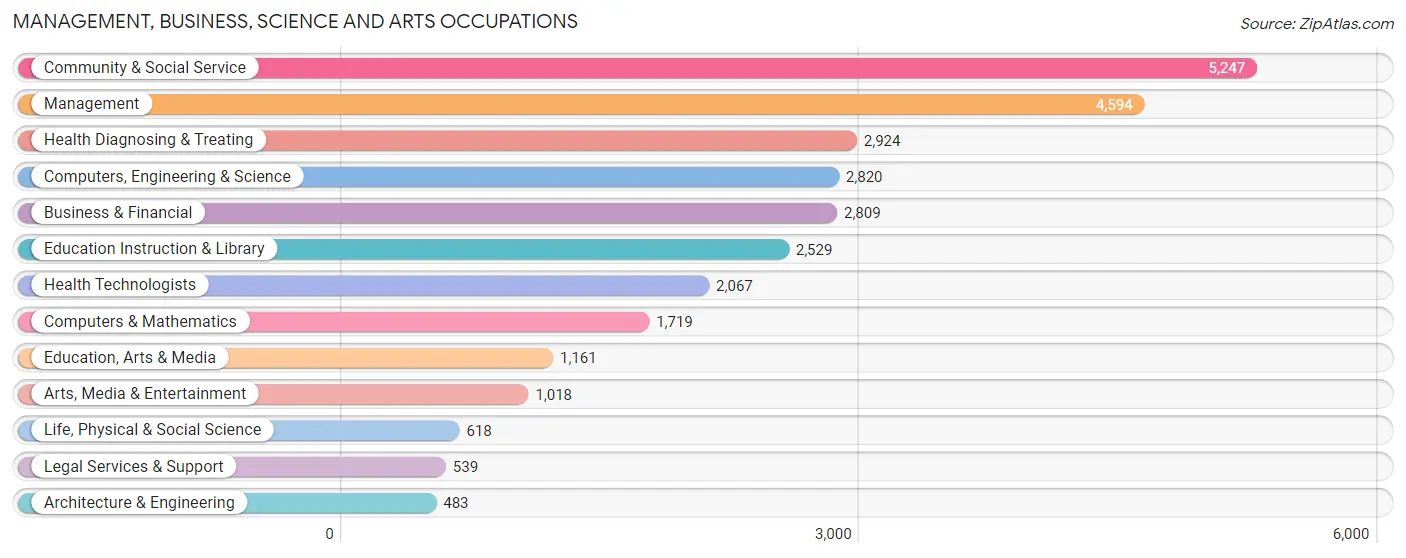
Management, Business, Science and Arts Occupations
The most common Management, Business, Science and Arts occupations in Cranston are Community & Social Service (5,247 | 12.6%), Management (4,594 | 11.0%), Health Diagnosing & Treating (2,924 | 7.0%), Computers, Engineering & Science (2,820 | 6.8%), and Business & Financial (2,809 | 6.7%).
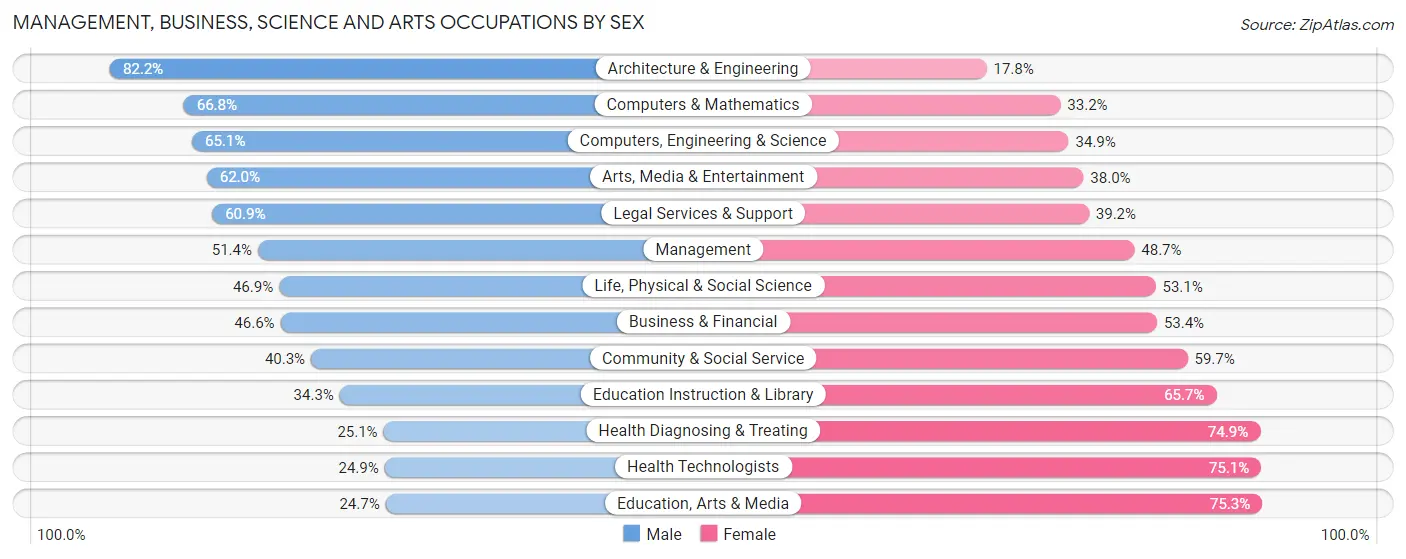
Management, Business, Science and Arts Occupations by Sex
Within the Management, Business, Science and Arts occupations in Cranston, the most male-oriented occupations are Architecture & Engineering (82.2%), Computers & Mathematics (66.8%), and Computers, Engineering & Science (65.1%), while the most female-oriented occupations are Education, Arts & Media (75.3%), Health Technologists (75.1%), and Health Diagnosing & Treating (74.9%).
| Occupation | Male | Female |
| Management | 2,359 (51.3%) | 2,235 (48.6%) |
| Business & Financial | 1,310 (46.6%) | 1,499 (53.4%) |
| Computers, Engineering & Science | 1,835 (65.1%) | 985 (34.9%) |
| Computers & Mathematics | 1,148 (66.8%) | 571 (33.2%) |
| Architecture & Engineering | 397 (82.2%) | 86 (17.8%) |
| Life, Physical & Social Science | 290 (46.9%) | 328 (53.1%) |
| Community & Social Service | 2,113 (40.3%) | 3,134 (59.7%) |
| Education, Arts & Media | 287 (24.7%) | 874 (75.3%) |
| Legal Services & Support | 328 (60.9%) | 211 (39.2%) |
| Education Instruction & Library | 867 (34.3%) | 1,662 (65.7%) |
| Arts, Media & Entertainment | 631 (62.0%) | 387 (38.0%) |
| Health Diagnosing & Treating | 735 (25.1%) | 2,189 (74.9%) |
| Health Technologists | 515 (24.9%) | 1,552 (75.1%) |
| Total (Category) | 8,352 (45.4%) | 10,042 (54.6%) |
| Total (Overall) | 21,483 (51.5%) | 20,198 (48.5%) |
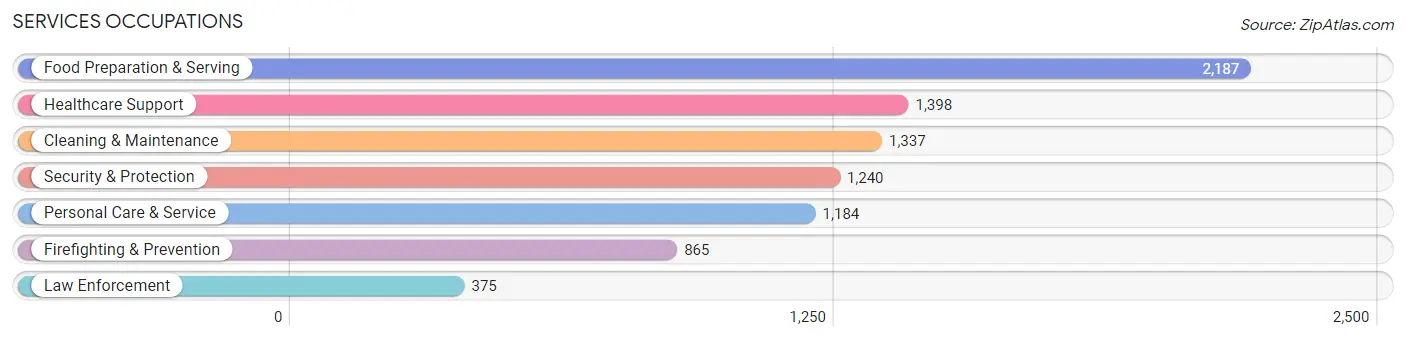
Services Occupations
The most common Services occupations in Cranston are Food Preparation & Serving (2,187 | 5.2%), Healthcare Support (1,398 | 3.4%), Cleaning & Maintenance (1,337 | 3.2%), Security & Protection (1,240 | 3.0%), and Personal Care & Service (1,184 | 2.8%).
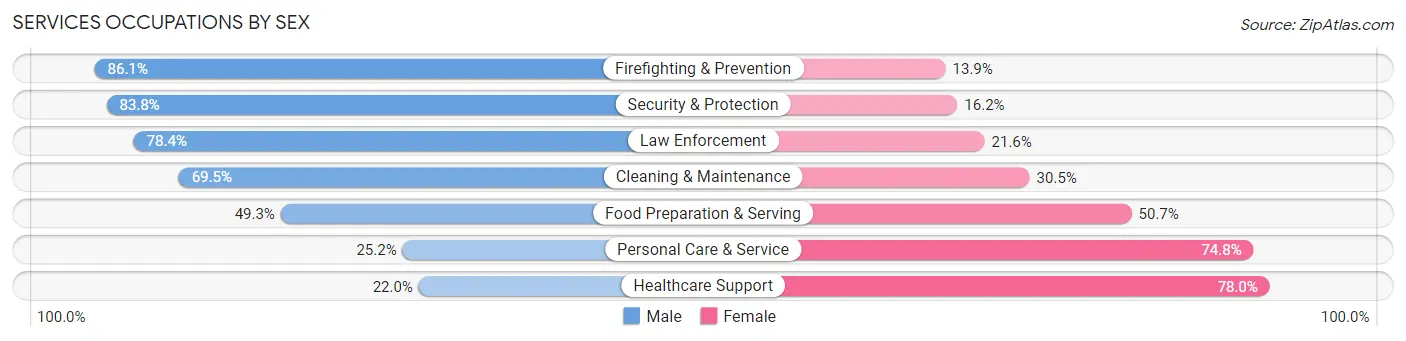
Services Occupations by Sex
Within the Services occupations in Cranston, the most male-oriented occupations are Firefighting & Prevention (86.1%), Security & Protection (83.8%), and Law Enforcement (78.4%), while the most female-oriented occupations are Healthcare Support (78.0%), Personal Care & Service (74.8%), and Food Preparation & Serving (50.7%).
| Occupation | Male | Female |
| Healthcare Support | 307 (22.0%) | 1,091 (78.0%) |
| Security & Protection | 1,039 (83.8%) | 201 (16.2%) |
| Firefighting & Prevention | 745 (86.1%) | 120 (13.9%) |
| Law Enforcement | 294 (78.4%) | 81 (21.6%) |
| Food Preparation & Serving | 1,078 (49.3%) | 1,109 (50.7%) |
| Cleaning & Maintenance | 929 (69.5%) | 408 (30.5%) |
| Personal Care & Service | 298 (25.2%) | 886 (74.8%) |
| Total (Category) | 3,651 (49.7%) | 3,695 (50.3%) |
| Total (Overall) | 21,483 (51.5%) | 20,198 (48.5%) |
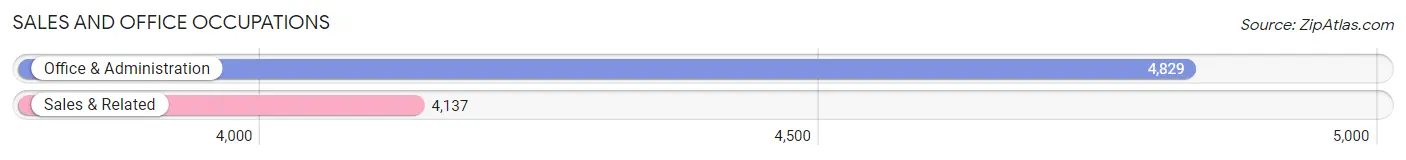
Sales and Office Occupations
The most common Sales and Office occupations in Cranston are Office & Administration (4,829 | 11.6%), and Sales & Related (4,137 | 9.9%).
Sales and Office Occupations by Sex
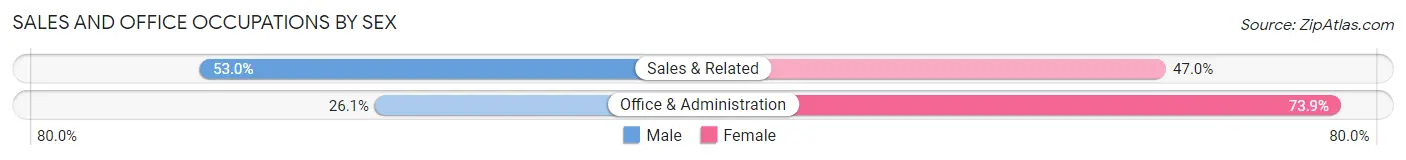
| Occupation | Male | Female |
| Sales & Related | 2,192 (53.0%) | 1,945 (47.0%) |
| Office & Administration | 1,261 (26.1%) | 3,568 (73.9%) |
| Total (Category) | 3,453 (38.5%) | 5,513 (61.5%) |
| Total (Overall) | 21,483 (51.5%) | 20,198 (48.5%) |
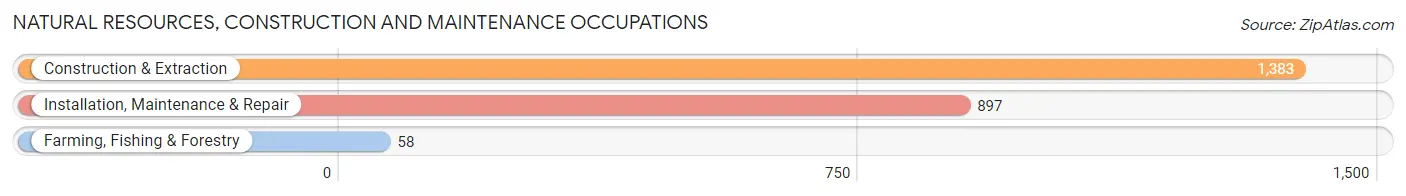
Natural Resources, Construction and Maintenance Occupations
The most common Natural Resources, Construction and Maintenance occupations in Cranston are Construction & Extraction (1,383 | 3.3%), Installation, Maintenance & Repair (897 | 2.1%), and Farming, Fishing & Forestry (58 | 0.1%).
Natural Resources, Construction and Maintenance Occupations by Sex
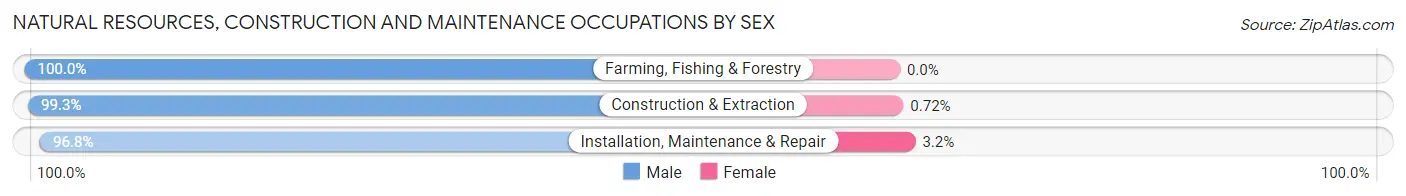
| Occupation | Male | Female |
| Farming, Fishing & Forestry | 58 (100.0%) | 0 (0.0%) |
| Construction & Extraction | 1,373 (99.3%) | 10 (0.7%) |
| Installation, Maintenance & Repair | 868 (96.8%) | 29 (3.2%) |
| Total (Category) | 2,299 (98.3%) | 39 (1.7%) |
| Total (Overall) | 21,483 (51.5%) | 20,198 (48.5%) |
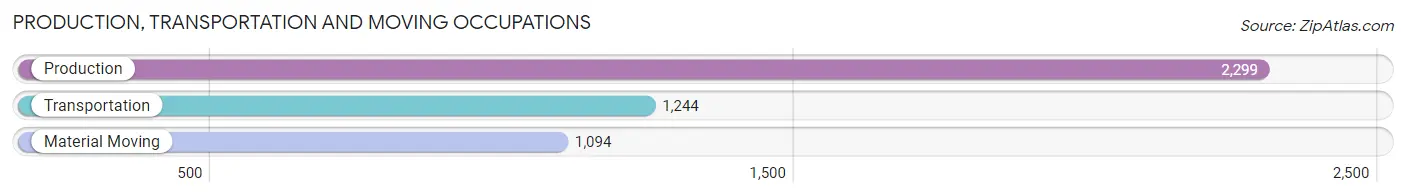
Production, Transportation and Moving Occupations
The most common Production, Transportation and Moving occupations in Cranston are Production (2,299 | 5.5%), Transportation (1,244 | 3.0%), and Material Moving (1,094 | 2.6%).
Production, Transportation and Moving Occupations by Sex
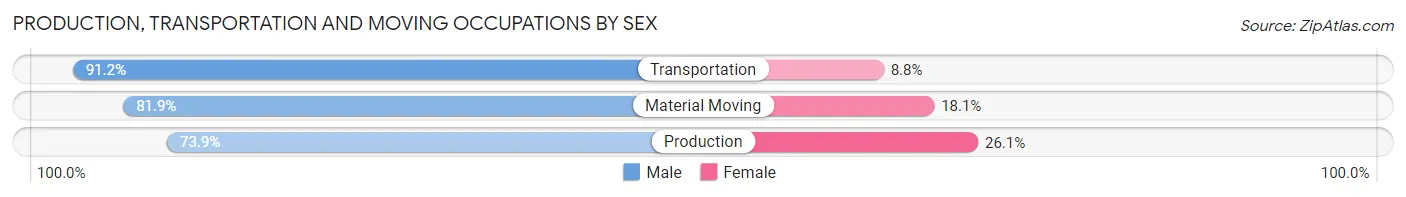
| Occupation | Male | Female |
| Production | 1,698 (73.9%) | 601 (26.1%) |
| Transportation | 1,134 (91.2%) | 110 (8.8%) |
| Material Moving | 896 (81.9%) | 198 (18.1%) |
| Total (Category) | 3,728 (80.4%) | 909 (19.6%) |
| Total (Overall) | 21,483 (51.5%) | 20,198 (48.5%) |
Employment Industries by Sex in Cranston
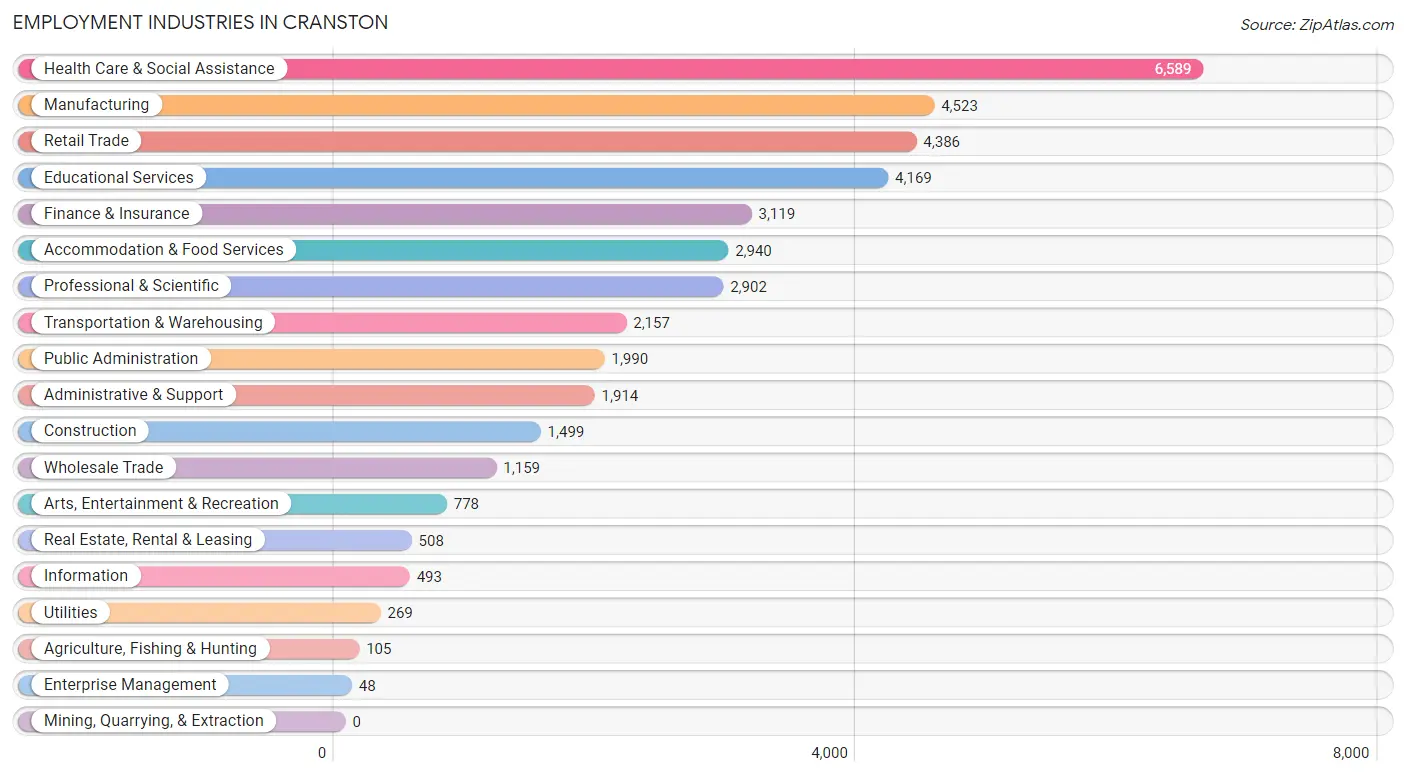
Employment Industries in Cranston
The major employment industries in Cranston include Health Care & Social Assistance (6,589 | 15.8%), Manufacturing (4,523 | 10.8%), Retail Trade (4,386 | 10.5%), Educational Services (4,169 | 10.0%), and Finance & Insurance (3,119 | 7.5%).
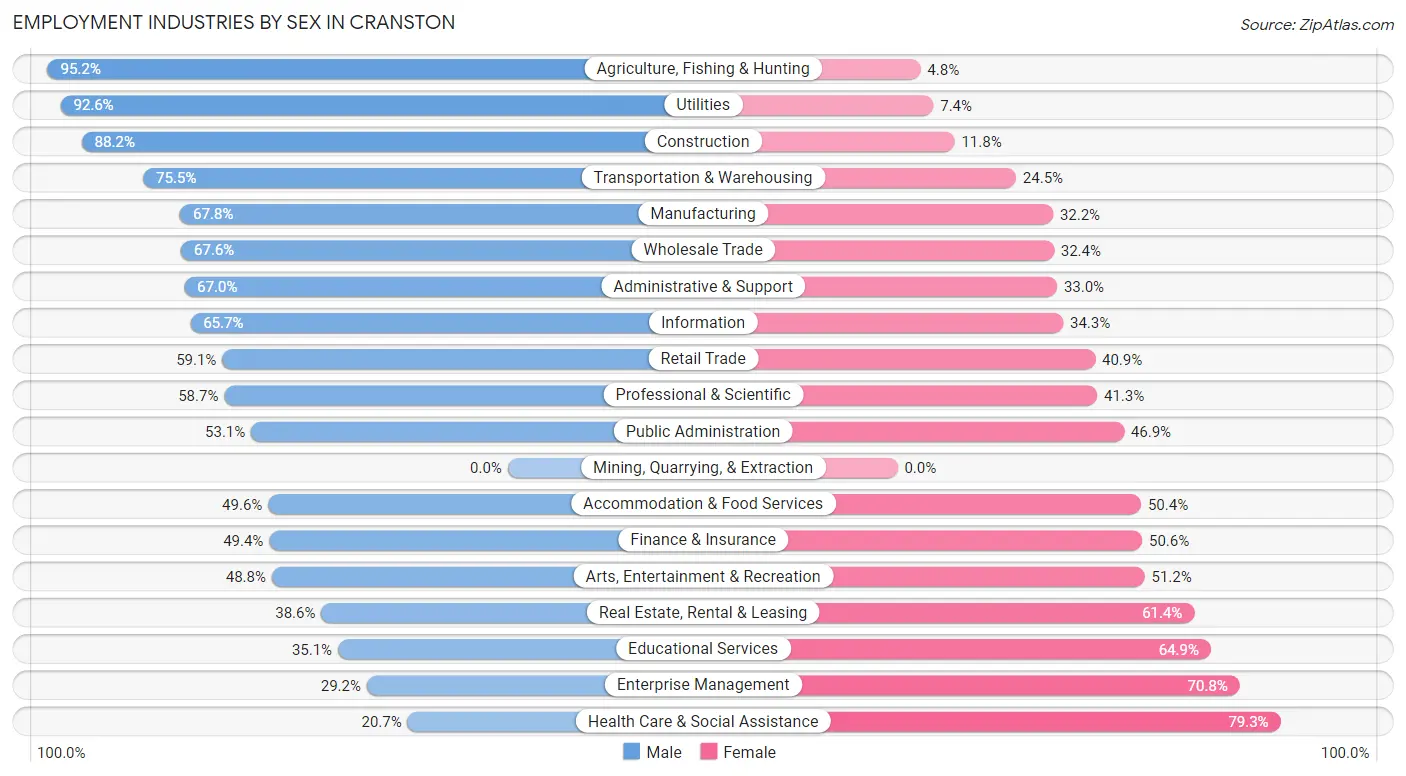
Employment Industries by Sex in Cranston
The Cranston industries that see more men than women are Agriculture, Fishing & Hunting (95.2%), Utilities (92.6%), and Construction (88.2%), whereas the industries that tend to have a higher number of women are Health Care & Social Assistance (79.3%), Enterprise Management (70.8%), and Educational Services (64.9%).
| Industry | Male | Female |
| Agriculture, Fishing & Hunting | 100 (95.2%) | 5 (4.8%) |
| Mining, Quarrying, & Extraction | 0 (0.0%) | 0 (0.0%) |
| Construction | 1,322 (88.2%) | 177 (11.8%) |
| Manufacturing | 3,067 (67.8%) | 1,456 (32.2%) |
| Wholesale Trade | 784 (67.6%) | 375 (32.4%) |
| Retail Trade | 2,592 (59.1%) | 1,794 (40.9%) |
| Transportation & Warehousing | 1,628 (75.5%) | 529 (24.5%) |
| Utilities | 249 (92.6%) | 20 (7.4%) |
| Information | 324 (65.7%) | 169 (34.3%) |
| Finance & Insurance | 1,540 (49.4%) | 1,579 (50.6%) |
| Real Estate, Rental & Leasing | 196 (38.6%) | 312 (61.4%) |
| Professional & Scientific | 1,703 (58.7%) | 1,199 (41.3%) |
| Enterprise Management | 14 (29.2%) | 34 (70.8%) |
| Administrative & Support | 1,282 (67.0%) | 632 (33.0%) |
| Educational Services | 1,465 (35.1%) | 2,704 (64.9%) |
| Health Care & Social Assistance | 1,366 (20.7%) | 5,223 (79.3%) |
| Arts, Entertainment & Recreation | 380 (48.8%) | 398 (51.2%) |
| Accommodation & Food Services | 1,458 (49.6%) | 1,482 (50.4%) |
| Public Administration | 1,057 (53.1%) | 933 (46.9%) |
| Total | 21,483 (51.5%) | 20,198 (48.5%) |
Education in Cranston
School Enrollment in Cranston
The most common levels of schooling among the 17,844 students in Cranston are college / undergraduate (4,283 | 24.0%), elementary school (3,636 | 20.4%), and middle school (3,635 | 20.4%).
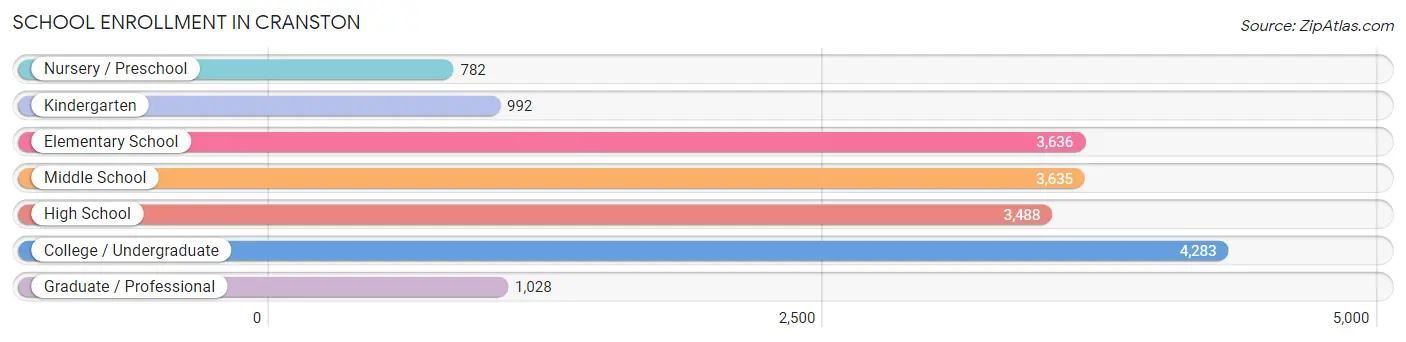
| School Level | # Students | % Students |
| Nursery / Preschool | 782 | 4.4% |
| Kindergarten | 992 | 5.6% |
| Elementary School | 3,636 | 20.4% |
| Middle School | 3,635 | 20.4% |
| High School | 3,488 | 19.6% |
| College / Undergraduate | 4,283 | 24.0% |
| Graduate / Professional | 1,028 | 5.8% |
| Total | 17,844 | 100.0% |
School Enrollment by Age by Funding Source in Cranston
Out of a total of 17,844 students who are enrolled in schools in Cranston, 3,819 (21.4%) attend a private institution, while the remaining 14,025 (78.6%) are enrolled in public schools. The age group of 3 to 4 year olds has the highest likelihood of being enrolled in private schools, with 309 (49.8% in the age bracket) enrolled. Conversely, the age group of 10 to 14 year olds has the lowest likelihood of being enrolled in a private school, with 4,096 (84.9% in the age bracket) attending a public institution.
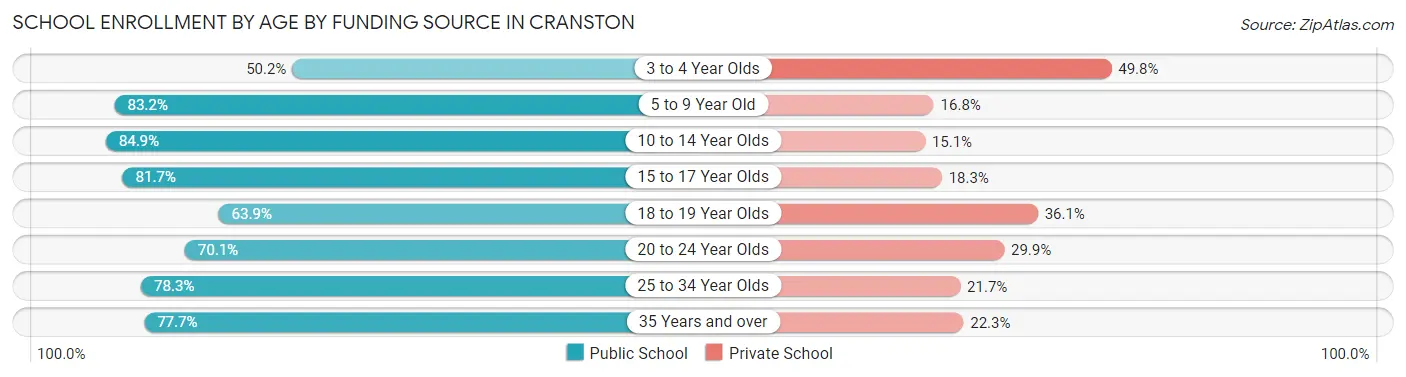
| Age Bracket | Public School | Private School |
| 3 to 4 Year Olds | 311 (50.2%) | 309 (49.8%) |
| 5 to 9 Year Old | 3,252 (83.2%) | 655 (16.8%) |
| 10 to 14 Year Olds | 4,096 (84.9%) | 731 (15.1%) |
| 15 to 17 Year Olds | 2,126 (81.7%) | 475 (18.3%) |
| 18 to 19 Year Olds | 804 (63.9%) | 455 (36.1%) |
| 20 to 24 Year Olds | 1,552 (70.1%) | 661 (29.9%) |
| 25 to 34 Year Olds | 1,007 (78.3%) | 279 (21.7%) |
| 35 Years and over | 879 (77.7%) | 252 (22.3%) |
| Total | 14,025 (78.6%) | 3,819 (21.4%) |
Educational Attainment by Field of Study in Cranston
Business (4,465 | 20.1%), education (2,400 | 10.8%), science & technology (2,053 | 9.3%), psychology (1,668 | 7.5%), and literature & languages (1,649 | 7.4%) are the most common fields of study among 22,173 individuals in Cranston who have obtained a bachelor's degree or higher.
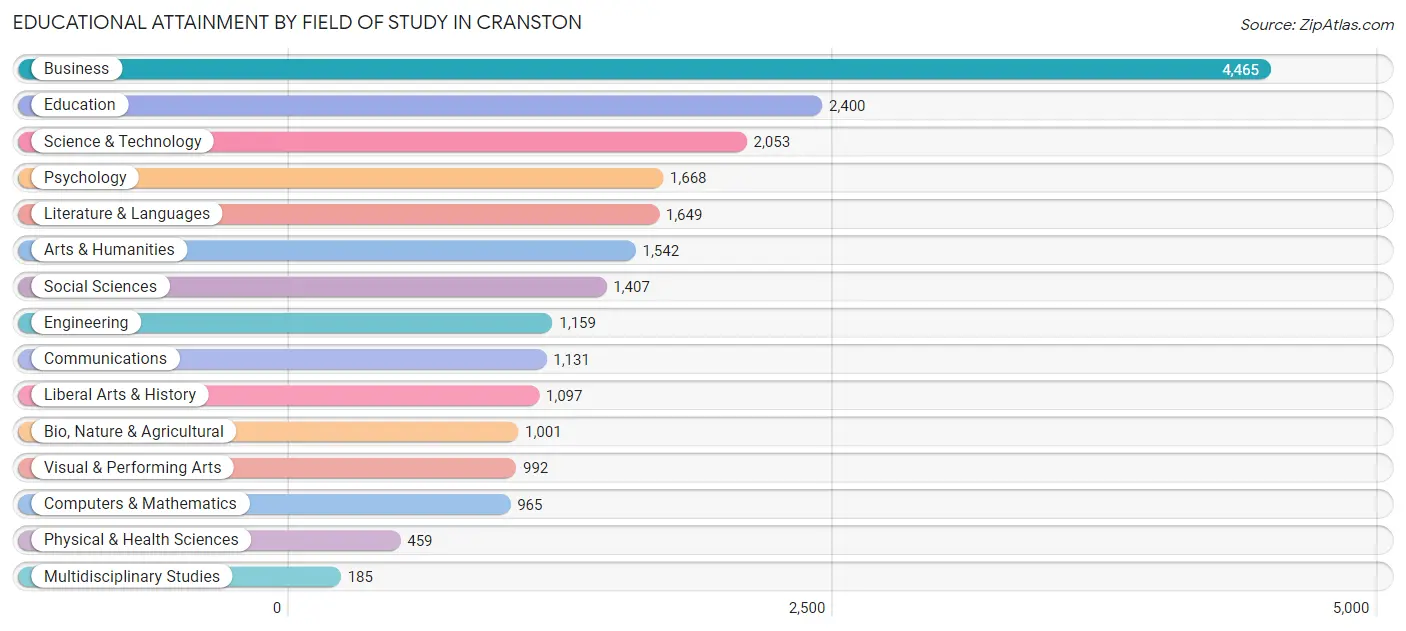
| Field of Study | # Graduates | % Graduates |
| Computers & Mathematics | 965 | 4.3% |
| Bio, Nature & Agricultural | 1,001 | 4.5% |
| Physical & Health Sciences | 459 | 2.1% |
| Psychology | 1,668 | 7.5% |
| Social Sciences | 1,407 | 6.4% |
| Engineering | 1,159 | 5.2% |
| Multidisciplinary Studies | 185 | 0.8% |
| Science & Technology | 2,053 | 9.3% |
| Business | 4,465 | 20.1% |
| Education | 2,400 | 10.8% |
| Literature & Languages | 1,649 | 7.4% |
| Liberal Arts & History | 1,097 | 5.0% |
| Visual & Performing Arts | 992 | 4.5% |
| Communications | 1,131 | 5.1% |
| Arts & Humanities | 1,542 | 7.0% |
| Total | 22,173 | 100.0% |
Transportation & Commute in Cranston
Vehicle Availability by Sex in Cranston
The most prevalent vehicle ownership categories in Cranston are males with 2 vehicles (10,509, accounting for 49.8%) and females with 2 vehicles (9,859, making up 54.1%).
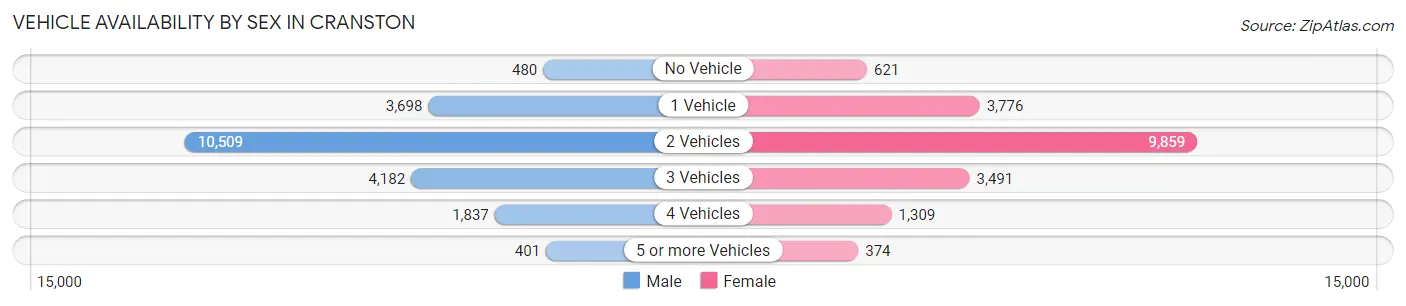
| Vehicles Available | Male | Female |
| No Vehicle | 480 (2.3%) | 621 (3.2%) |
| 1 Vehicle | 3,698 (17.5%) | 3,776 (19.4%) |
| 2 Vehicles | 10,509 (49.8%) | 9,859 (50.7%) |
| 3 Vehicles | 4,182 (19.8%) | 3,491 (18.0%) |
| 4 Vehicles | 1,837 (8.7%) | 1,309 (6.7%) |
| 5 or more Vehicles | 401 (1.9%) | 374 (1.9%) |
| Total | 21,107 (100.0%) | 19,430 (100.0%) |
Commute Time in Cranston
The most frequently occuring commute durations in Cranston are 15 to 19 minutes (8,362 commuters, 22.4%), 20 to 24 minutes (7,143 commuters, 19.1%), and 10 to 14 minutes (5,700 commuters, 15.2%).
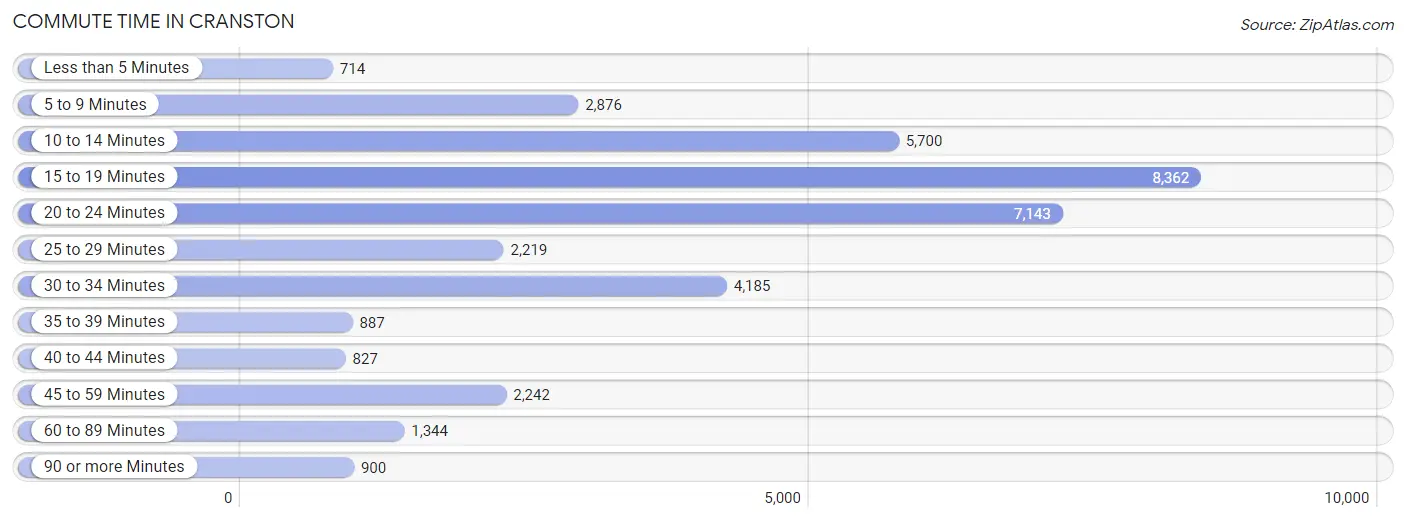
| Commute Time | # Commuters | % Commuters |
| Less than 5 Minutes | 714 | 1.9% |
| 5 to 9 Minutes | 2,876 | 7.7% |
| 10 to 14 Minutes | 5,700 | 15.2% |
| 15 to 19 Minutes | 8,362 | 22.4% |
| 20 to 24 Minutes | 7,143 | 19.1% |
| 25 to 29 Minutes | 2,219 | 5.9% |
| 30 to 34 Minutes | 4,185 | 11.2% |
| 35 to 39 Minutes | 887 | 2.4% |
| 40 to 44 Minutes | 827 | 2.2% |
| 45 to 59 Minutes | 2,242 | 6.0% |
| 60 to 89 Minutes | 1,344 | 3.6% |
| 90 or more Minutes | 900 | 2.4% |
Commute Time by Sex in Cranston
The most common commute times in Cranston are 15 to 19 minutes (3,957 commuters, 20.2%) for males and 15 to 19 minutes (4,405 commuters, 24.8%) for females.
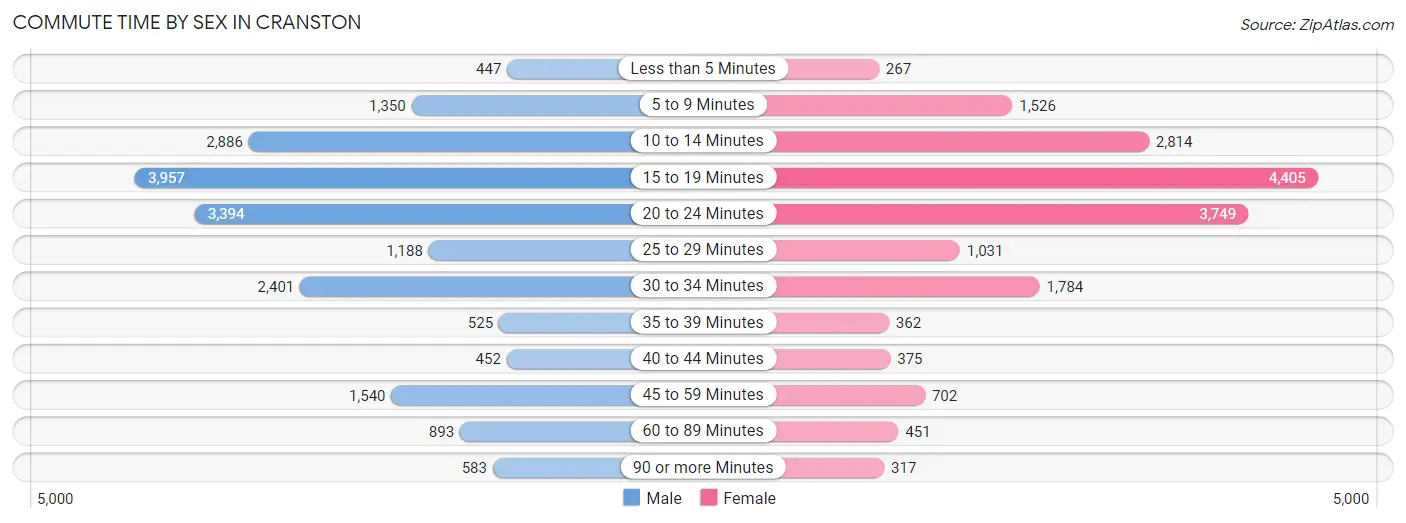
| Commute Time | Male | Female |
| Less than 5 Minutes | 447 (2.3%) | 267 (1.5%) |
| 5 to 9 Minutes | 1,350 (6.9%) | 1,526 (8.6%) |
| 10 to 14 Minutes | 2,886 (14.7%) | 2,814 (15.8%) |
| 15 to 19 Minutes | 3,957 (20.2%) | 4,405 (24.8%) |
| 20 to 24 Minutes | 3,394 (17.3%) | 3,749 (21.1%) |
| 25 to 29 Minutes | 1,188 (6.1%) | 1,031 (5.8%) |
| 30 to 34 Minutes | 2,401 (12.2%) | 1,784 (10.0%) |
| 35 to 39 Minutes | 525 (2.7%) | 362 (2.0%) |
| 40 to 44 Minutes | 452 (2.3%) | 375 (2.1%) |
| 45 to 59 Minutes | 1,540 (7.9%) | 702 (4.0%) |
| 60 to 89 Minutes | 893 (4.5%) | 451 (2.5%) |
| 90 or more Minutes | 583 (3.0%) | 317 (1.8%) |
Time of Departure to Work by Sex in Cranston
The most frequent times of departure to work in Cranston are 7:30 AM to 7:59 AM (3,016, 15.4%) for males and 7:00 AM to 7:29 AM (3,218, 18.1%) for females.
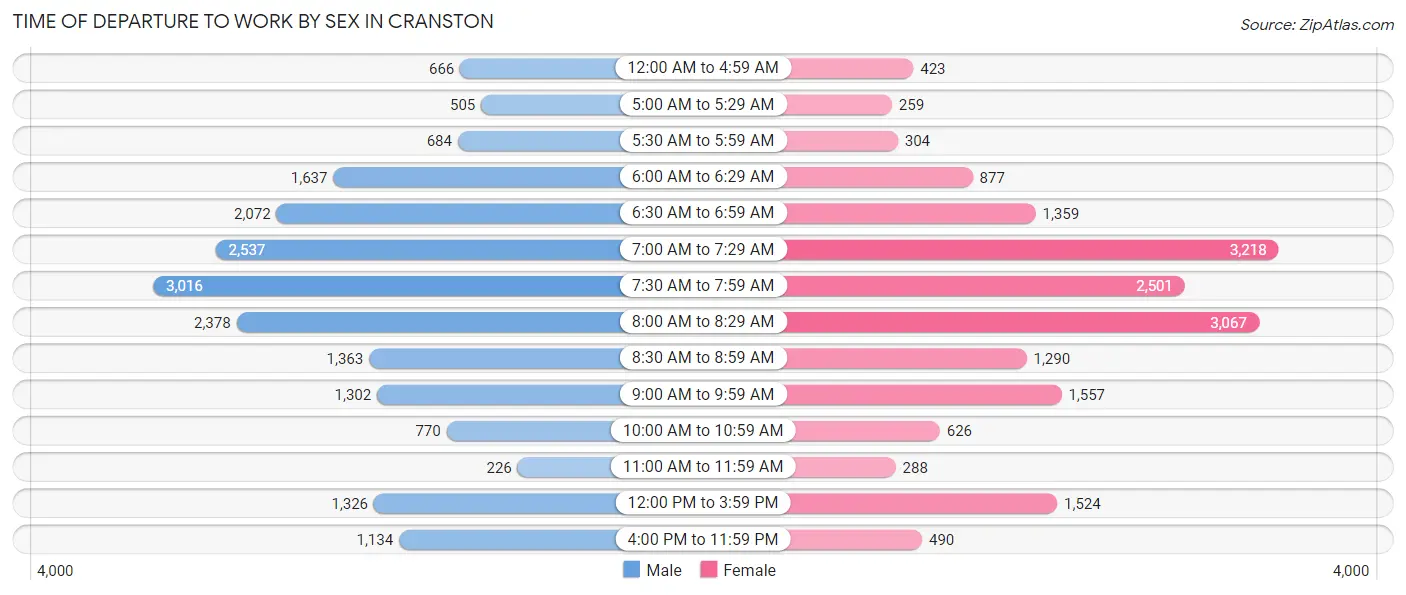
| Time of Departure | Male | Female |
| 12:00 AM to 4:59 AM | 666 (3.4%) | 423 (2.4%) |
| 5:00 AM to 5:29 AM | 505 (2.6%) | 259 (1.5%) |
| 5:30 AM to 5:59 AM | 684 (3.5%) | 304 (1.7%) |
| 6:00 AM to 6:29 AM | 1,637 (8.4%) | 877 (4.9%) |
| 6:30 AM to 6:59 AM | 2,072 (10.6%) | 1,359 (7.6%) |
| 7:00 AM to 7:29 AM | 2,537 (12.9%) | 3,218 (18.1%) |
| 7:30 AM to 7:59 AM | 3,016 (15.4%) | 2,501 (14.1%) |
| 8:00 AM to 8:29 AM | 2,378 (12.1%) | 3,067 (17.2%) |
| 8:30 AM to 8:59 AM | 1,363 (7.0%) | 1,290 (7.2%) |
| 9:00 AM to 9:59 AM | 1,302 (6.6%) | 1,557 (8.8%) |
| 10:00 AM to 10:59 AM | 770 (3.9%) | 626 (3.5%) |
| 11:00 AM to 11:59 AM | 226 (1.1%) | 288 (1.6%) |
| 12:00 PM to 3:59 PM | 1,326 (6.8%) | 1,524 (8.6%) |
| 4:00 PM to 11:59 PM | 1,134 (5.8%) | 490 (2.8%) |
| Total | 19,616 (100.0%) | 17,783 (100.0%) |
Housing Occupancy in Cranston
Occupancy by Ownership in Cranston
Of the total 32,434 dwellings in Cranston, owner-occupied units account for 21,333 (65.8%), while renter-occupied units make up 11,101 (34.2%).
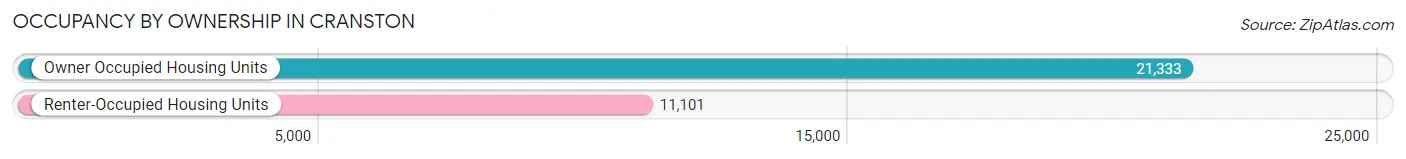
| Occupancy | # Housing Units | % Housing Units |
| Owner Occupied Housing Units | 21,333 | 65.8% |
| Renter-Occupied Housing Units | 11,101 | 34.2% |
| Total Occupied Housing Units | 32,434 | 100.0% |
Occupancy by Household Size in Cranston
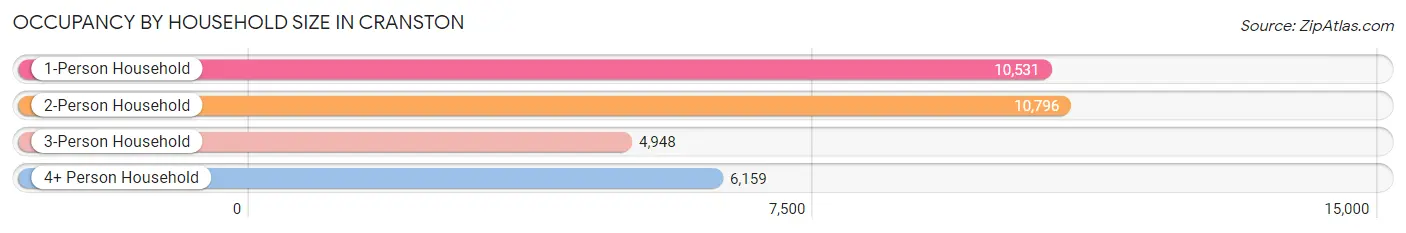
| Household Size | # Housing Units | % Housing Units |
| 1-Person Household | 10,531 | 32.5% |
| 2-Person Household | 10,796 | 33.3% |
| 3-Person Household | 4,948 | 15.3% |
| 4+ Person Household | 6,159 | 19.0% |
| Total Housing Units | 32,434 | 100.0% |
Occupancy by Ownership by Household Size in Cranston
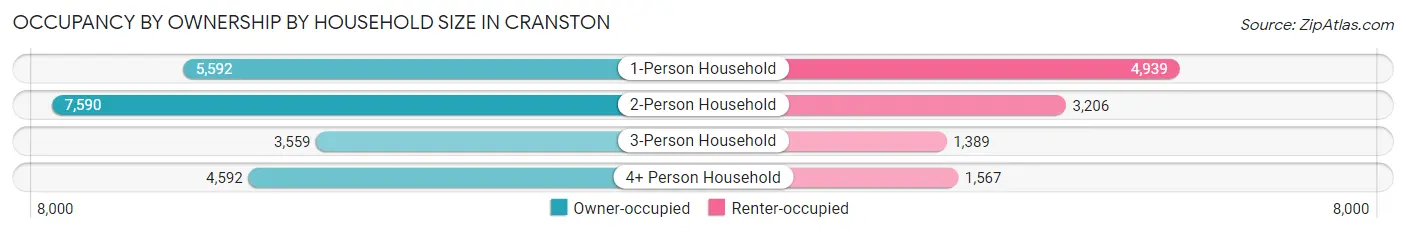
| Household Size | Owner-occupied | Renter-occupied |
| 1-Person Household | 5,592 (53.1%) | 4,939 (46.9%) |
| 2-Person Household | 7,590 (70.3%) | 3,206 (29.7%) |
| 3-Person Household | 3,559 (71.9%) | 1,389 (28.1%) |
| 4+ Person Household | 4,592 (74.6%) | 1,567 (25.4%) |
| Total Housing Units | 21,333 (65.8%) | 11,101 (34.2%) |
Occupancy by Educational Attainment in Cranston
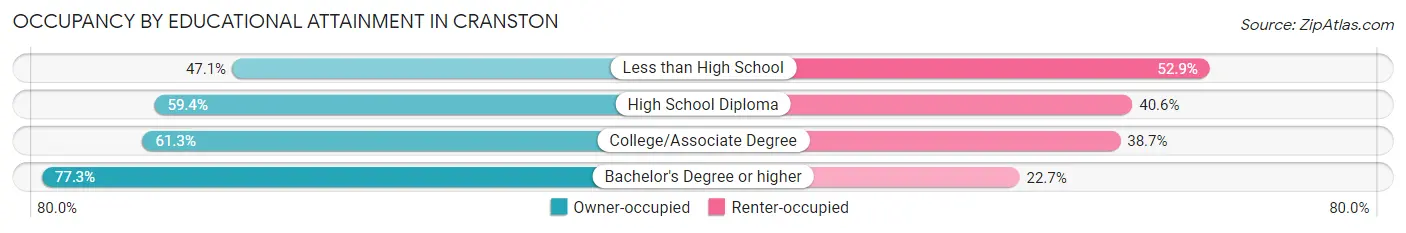
| Household Size | Owner-occupied | Renter-occupied |
| Less than High School | 1,159 (47.1%) | 1,301 (52.9%) |
| High School Diploma | 4,743 (59.4%) | 3,244 (40.6%) |
| College/Associate Degree | 5,967 (61.3%) | 3,770 (38.7%) |
| Bachelor's Degree or higher | 9,464 (77.3%) | 2,786 (22.7%) |
Occupancy by Age of Householder in Cranston

| Age Bracket | # Households | % Households |
| Under 35 Years | 5,871 | 18.1% |
| 35 to 44 Years | 5,679 | 17.5% |
| 45 to 54 Years | 4,880 | 15.0% |
| 55 to 64 Years | 7,413 | 22.9% |
| 65 to 74 Years | 4,733 | 14.6% |
| 75 to 84 Years | 2,346 | 7.2% |
| 85 Years and Over | 1,512 | 4.7% |
| Total | 32,434 | 100.0% |
Housing Finances in Cranston
Median Income by Occupancy in Cranston
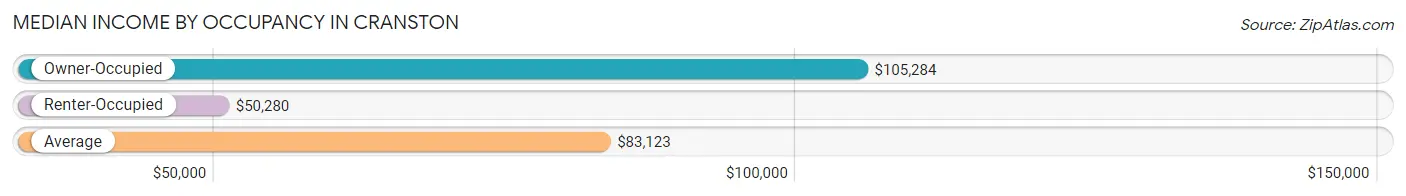
| Occupancy Type | # Households | Median Income |
| Owner-Occupied | 21,333 (65.8%) | $105,284 |
| Renter-Occupied | 11,101 (34.2%) | $50,280 |
| Average | 32,434 (100.0%) | $83,123 |
Occupancy by Householder Income Bracket in Cranston
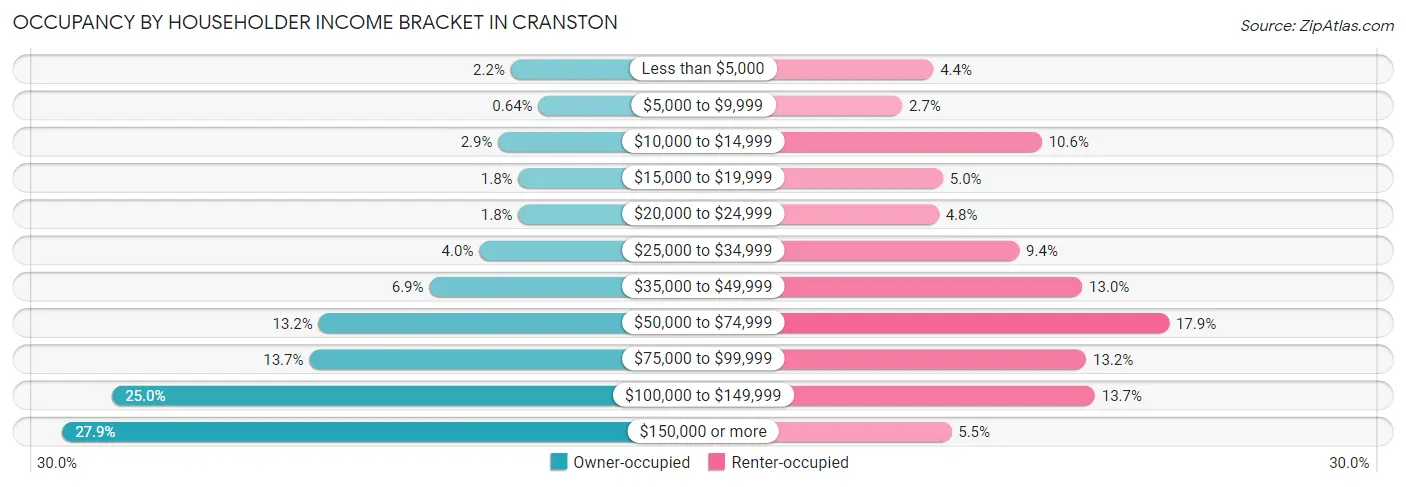
| Income Bracket | Owner-occupied | Renter-occupied |
| Less than $5,000 | 473 (2.2%) | 493 (4.4%) |
| $5,000 to $9,999 | 136 (0.6%) | 295 (2.7%) |
| $10,000 to $14,999 | 624 (2.9%) | 1,181 (10.6%) |
| $15,000 to $19,999 | 379 (1.8%) | 554 (5.0%) |
| $20,000 to $24,999 | 379 (1.8%) | 527 (4.8%) |
| $25,000 to $34,999 | 857 (4.0%) | 1,038 (9.3%) |
| $35,000 to $49,999 | 1,466 (6.9%) | 1,438 (13.0%) |
| $50,000 to $74,999 | 2,817 (13.2%) | 1,988 (17.9%) |
| $75,000 to $99,999 | 2,929 (13.7%) | 1,462 (13.2%) |
| $100,000 to $149,999 | 5,331 (25.0%) | 1,518 (13.7%) |
| $150,000 or more | 5,942 (27.9%) | 607 (5.5%) |
| Total | 21,333 (100.0%) | 11,101 (100.0%) |
Monthly Housing Cost Tiers in Cranston
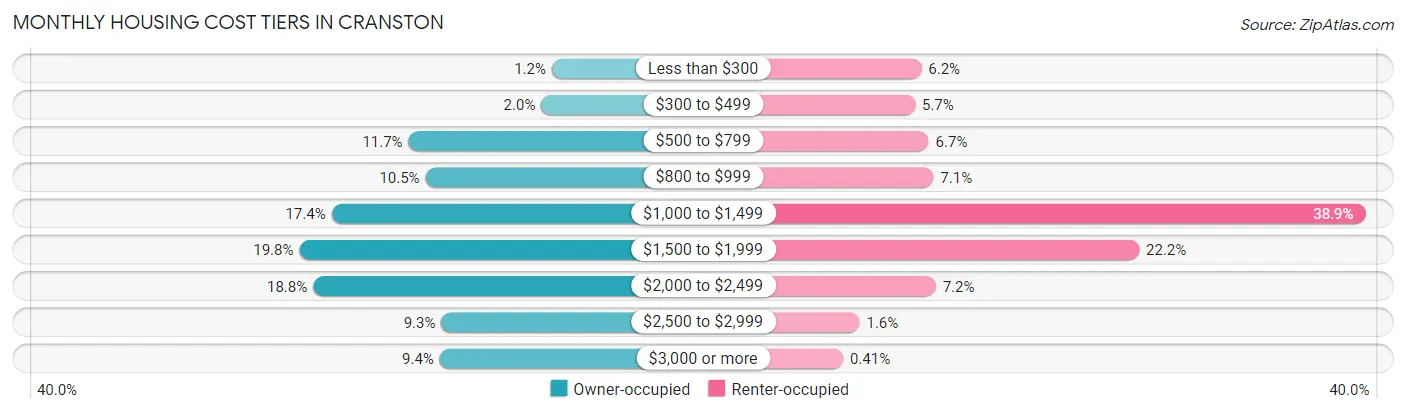
| Monthly Cost | Owner-occupied | Renter-occupied |
| Less than $300 | 249 (1.2%) | 686 (6.2%) |
| $300 to $499 | 415 (1.9%) | 634 (5.7%) |
| $500 to $799 | 2,503 (11.7%) | 746 (6.7%) |
| $800 to $999 | 2,235 (10.5%) | 785 (7.1%) |
| $1,000 to $1,499 | 3,713 (17.4%) | 4,316 (38.9%) |
| $1,500 to $1,999 | 4,217 (19.8%) | 2,467 (22.2%) |
| $2,000 to $2,499 | 4,002 (18.8%) | 804 (7.2%) |
| $2,500 to $2,999 | 1,987 (9.3%) | 181 (1.6%) |
| $3,000 or more | 2,012 (9.4%) | 46 (0.4%) |
| Total | 21,333 (100.0%) | 11,101 (100.0%) |
Physical Housing Characteristics in Cranston
Housing Structures in Cranston
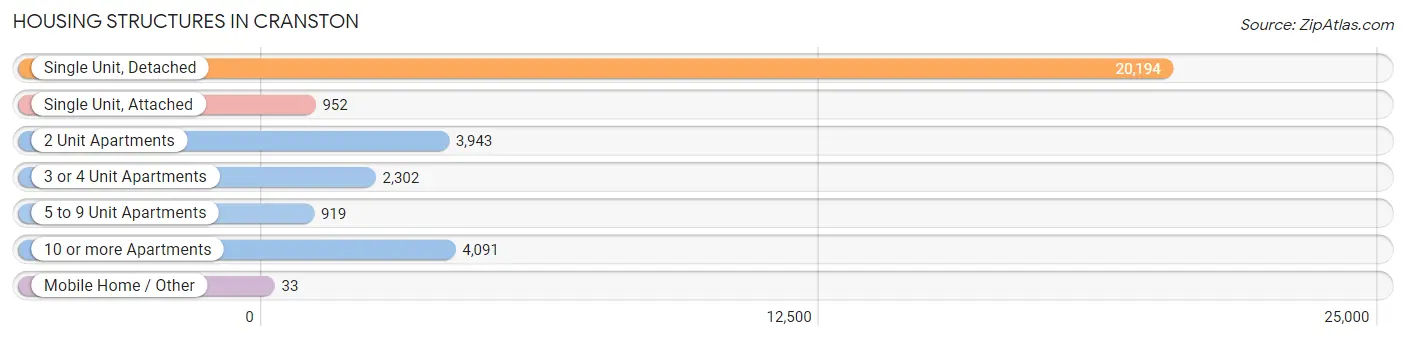
| Structure Type | # Housing Units | % Housing Units |
| Single Unit, Detached | 20,194 | 62.3% |
| Single Unit, Attached | 952 | 2.9% |
| 2 Unit Apartments | 3,943 | 12.2% |
| 3 or 4 Unit Apartments | 2,302 | 7.1% |
| 5 to 9 Unit Apartments | 919 | 2.8% |
| 10 or more Apartments | 4,091 | 12.6% |
| Mobile Home / Other | 33 | 0.1% |
| Total | 32,434 | 100.0% |
Housing Structures by Occupancy in Cranston
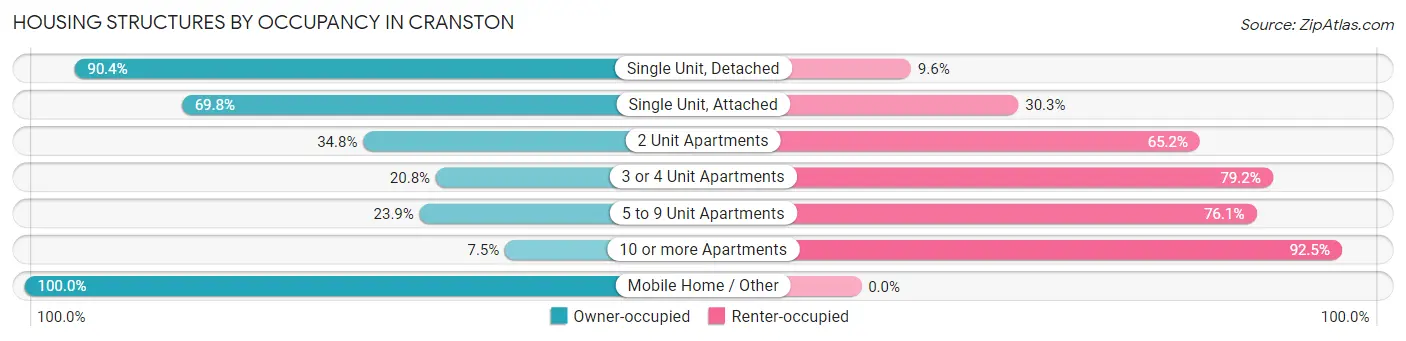
| Structure Type | Owner-occupied | Renter-occupied |
| Single Unit, Detached | 18,259 (90.4%) | 1,935 (9.6%) |
| Single Unit, Attached | 664 (69.8%) | 288 (30.2%) |
| 2 Unit Apartments | 1,372 (34.8%) | 2,571 (65.2%) |
| 3 or 4 Unit Apartments | 479 (20.8%) | 1,823 (79.2%) |
| 5 to 9 Unit Apartments | 220 (23.9%) | 699 (76.1%) |
| 10 or more Apartments | 306 (7.5%) | 3,785 (92.5%) |
| Mobile Home / Other | 33 (100.0%) | 0 (0.0%) |
| Total | 21,333 (65.8%) | 11,101 (34.2%) |
Housing Structures by Number of Rooms in Cranston
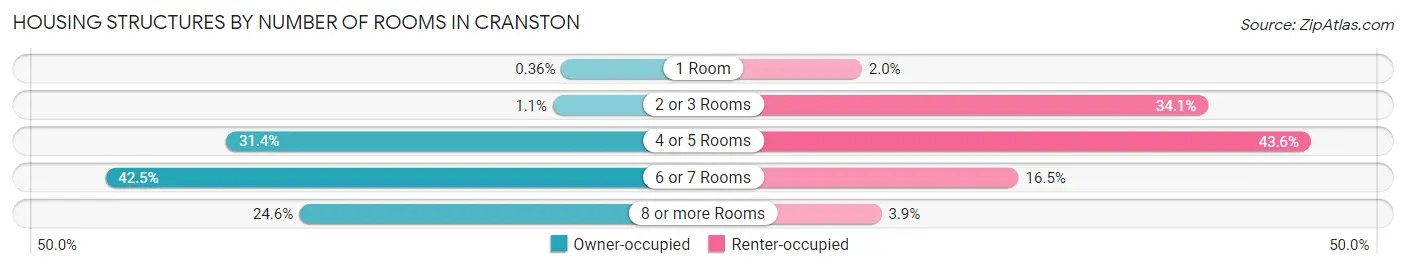
| Number of Rooms | Owner-occupied | Renter-occupied |
| 1 Room | 76 (0.4%) | 225 (2.0%) |
| 2 or 3 Rooms | 243 (1.1%) | 3,780 (34.1%) |
| 4 or 5 Rooms | 6,689 (31.4%) | 4,834 (43.5%) |
| 6 or 7 Rooms | 9,073 (42.5%) | 1,835 (16.5%) |
| 8 or more Rooms | 5,252 (24.6%) | 427 (3.8%) |
| Total | 21,333 (100.0%) | 11,101 (100.0%) |
Housing Structure by Heating Type in Cranston
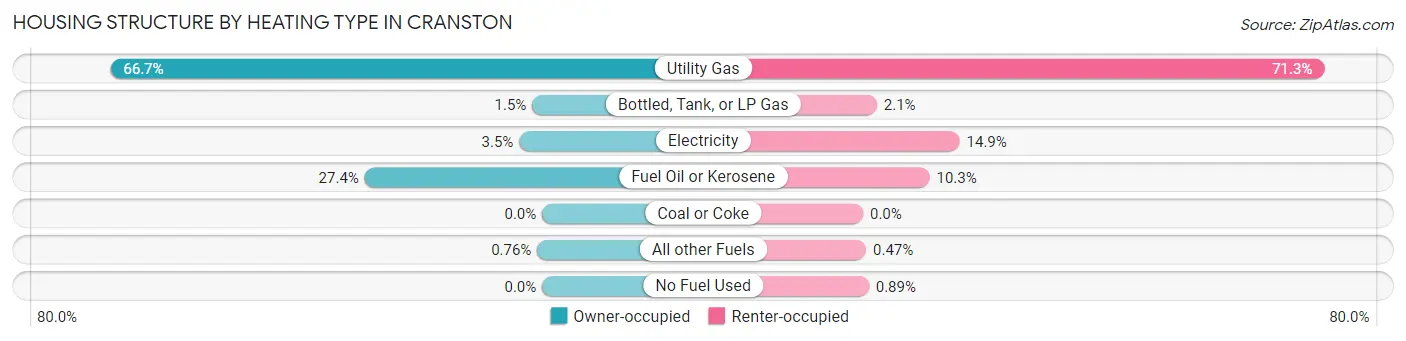
| Heating Type | Owner-occupied | Renter-occupied |
| Utility Gas | 14,238 (66.7%) | 7,914 (71.3%) |
| Bottled, Tank, or LP Gas | 326 (1.5%) | 238 (2.1%) |
| Electricity | 755 (3.5%) | 1,657 (14.9%) |
| Fuel Oil or Kerosene | 5,851 (27.4%) | 1,141 (10.3%) |
| Coal or Coke | 0 (0.0%) | 0 (0.0%) |
| All other Fuels | 163 (0.8%) | 52 (0.5%) |
| No Fuel Used | 0 (0.0%) | 99 (0.9%) |
| Total | 21,333 (100.0%) | 11,101 (100.0%) |
Household Vehicle Usage in Cranston
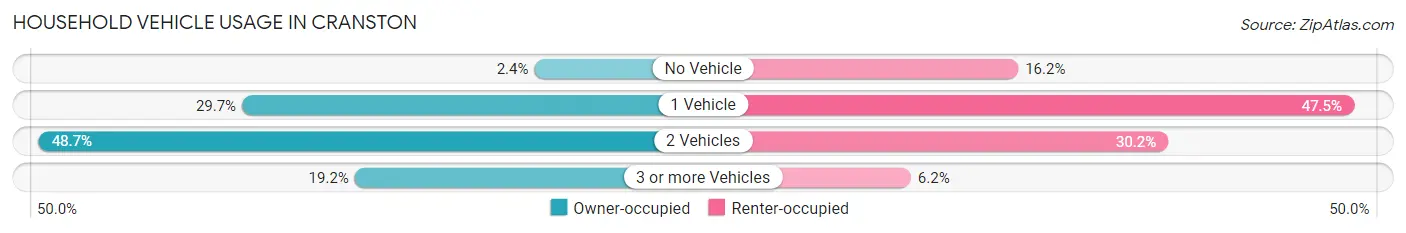
| Vehicles per Household | Owner-occupied | Renter-occupied |
| No Vehicle | 517 (2.4%) | 1,796 (16.2%) |
| 1 Vehicle | 6,338 (29.7%) | 5,273 (47.5%) |
| 2 Vehicles | 10,384 (48.7%) | 3,348 (30.2%) |
| 3 or more Vehicles | 4,094 (19.2%) | 684 (6.2%) |
| Total | 21,333 (100.0%) | 11,101 (100.0%) |
Real Estate & Mortgages in Cranston
Real Estate and Mortgage Overview in Cranston
| Characteristic | Without Mortgage | With Mortgage |
| Housing Units | 7,216 | 14,117 |
| Median Property Value | $304,500 | $335,000 |
| Median Household Income | $74,920 | $4,561 |
| Monthly Housing Costs | $841 | $1,985 |
| Real Estate Taxes | $4,930 | $89 |
Property Value by Mortgage Status in Cranston
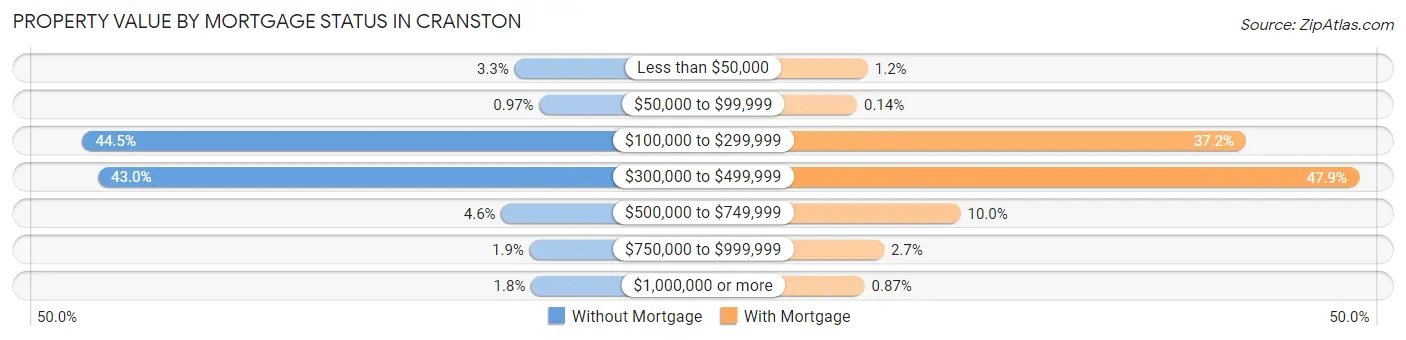
| Property Value | Without Mortgage | With Mortgage |
| Less than $50,000 | 240 (3.3%) | 165 (1.2%) |
| $50,000 to $99,999 | 70 (1.0%) | 20 (0.1%) |
| $100,000 to $299,999 | 3,210 (44.5%) | 5,248 (37.2%) |
| $300,000 to $499,999 | 3,102 (43.0%) | 6,766 (47.9%) |
| $500,000 to $749,999 | 331 (4.6%) | 1,412 (10.0%) |
| $750,000 to $999,999 | 137 (1.9%) | 383 (2.7%) |
| $1,000,000 or more | 126 (1.8%) | 123 (0.9%) |
| Total | 7,216 (100.0%) | 14,117 (100.0%) |
Household Income by Mortgage Status in Cranston
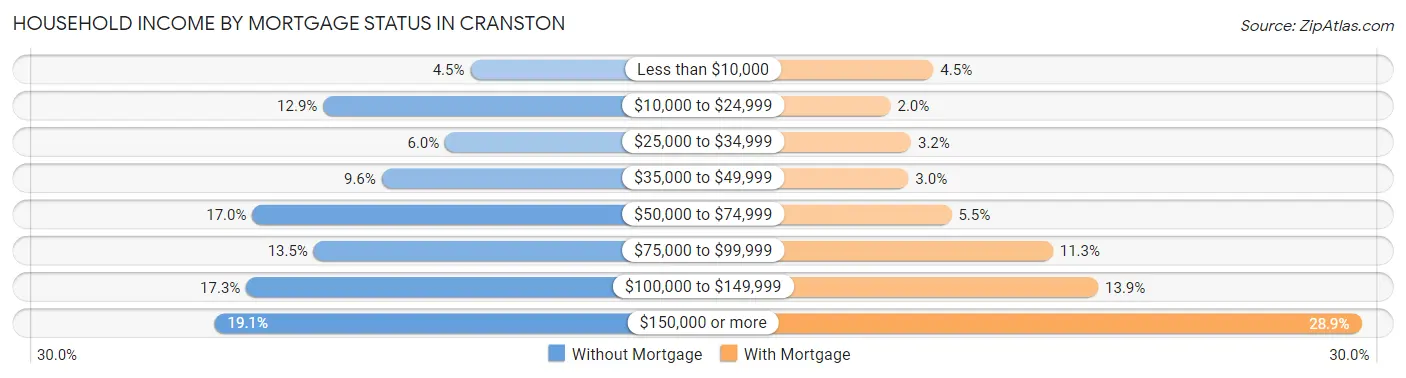
| Household Income | Without Mortgage | With Mortgage |
| Less than $10,000 | 327 (4.5%) | 628 (4.4%) |
| $10,000 to $24,999 | 934 (12.9%) | 282 (2.0%) |
| $25,000 to $34,999 | 431 (6.0%) | 448 (3.2%) |
| $35,000 to $49,999 | 693 (9.6%) | 426 (3.0%) |
| $50,000 to $74,999 | 1,226 (17.0%) | 773 (5.5%) |
| $75,000 to $99,999 | 973 (13.5%) | 1,591 (11.3%) |
| $100,000 to $149,999 | 1,251 (17.3%) | 1,956 (13.9%) |
| $150,000 or more | 1,381 (19.1%) | 4,080 (28.9%) |
| Total | 7,216 (100.0%) | 14,117 (100.0%) |
Property Value to Household Income Ratio in Cranston
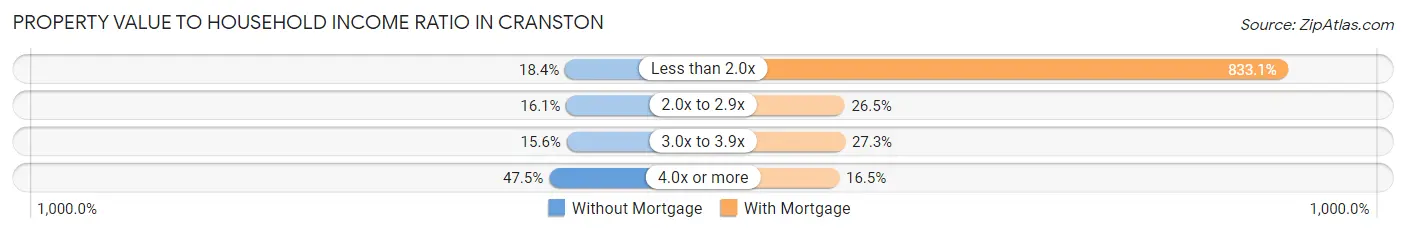
| Value-to-Income Ratio | Without Mortgage | With Mortgage |
| Less than 2.0x | 1,329 (18.4%) | 117,603 (833.1%) |
| 2.0x to 2.9x | 1,160 (16.1%) | 3,739 (26.5%) |
| 3.0x to 3.9x | 1,123 (15.6%) | 3,853 (27.3%) |
| 4.0x or more | 3,428 (47.5%) | 2,335 (16.5%) |
| Total | 7,216 (100.0%) | 14,117 (100.0%) |
Real Estate Taxes by Mortgage Status in Cranston
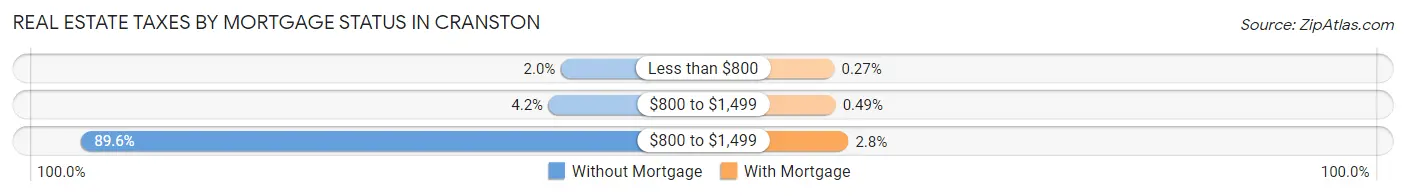
| Property Taxes | Without Mortgage | With Mortgage |
| Less than $800 | 144 (2.0%) | 38 (0.3%) |
| $800 to $1,499 | 305 (4.2%) | 69 (0.5%) |
| $800 to $1,499 | 6,467 (89.6%) | 398 (2.8%) |
| Total | 7,216 (100.0%) | 14,117 (100.0%) |
Health & Disability in Cranston
Health Insurance Coverage by Age in Cranston
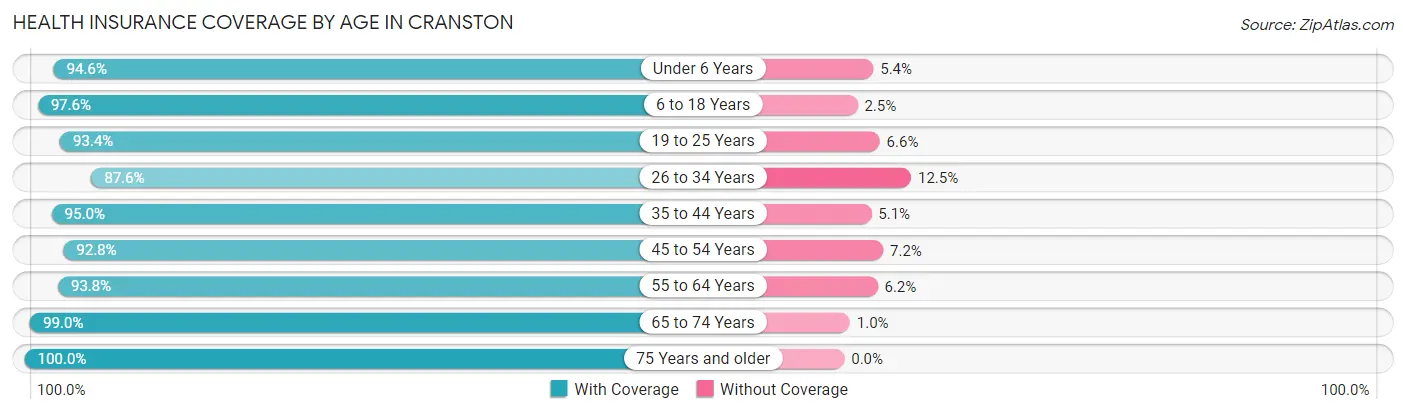
| Age Bracket | With Coverage | Without Coverage |
| Under 6 Years | 5,180 (94.6%) | 296 (5.4%) |
| 6 to 18 Years | 11,185 (97.6%) | 281 (2.5%) |
| 19 to 25 Years | 5,827 (93.4%) | 411 (6.6%) |
| 26 to 34 Years | 9,543 (87.5%) | 1,357 (12.4%) |
| 35 to 44 Years | 10,358 (95.0%) | 551 (5.1%) |
| 45 to 54 Years | 8,518 (92.8%) | 664 (7.2%) |
| 55 to 64 Years | 11,443 (93.8%) | 757 (6.2%) |
| 65 to 74 Years | 7,614 (99.0%) | 79 (1.0%) |
| 75 Years and older | 5,602 (100.0%) | 0 (0.0%) |
| Total | 75,270 (94.5%) | 4,396 (5.5%) |
Health Insurance Coverage by Citizenship Status in Cranston
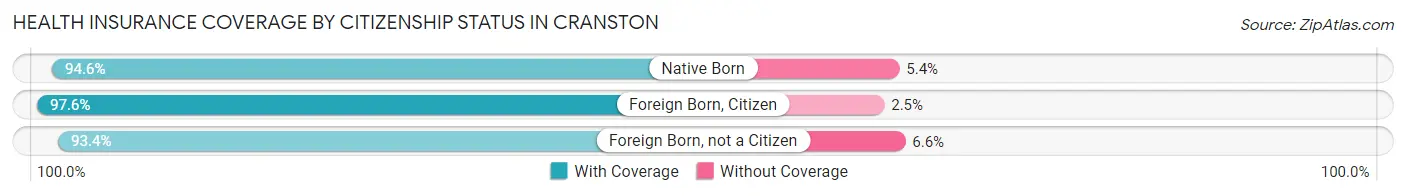
| Citizenship Status | With Coverage | Without Coverage |
| Native Born | 5,180 (94.6%) | 296 (5.4%) |
| Foreign Born, Citizen | 11,185 (97.6%) | 281 (2.5%) |
| Foreign Born, not a Citizen | 5,827 (93.4%) | 411 (6.6%) |
Health Insurance Coverage by Household Income in Cranston
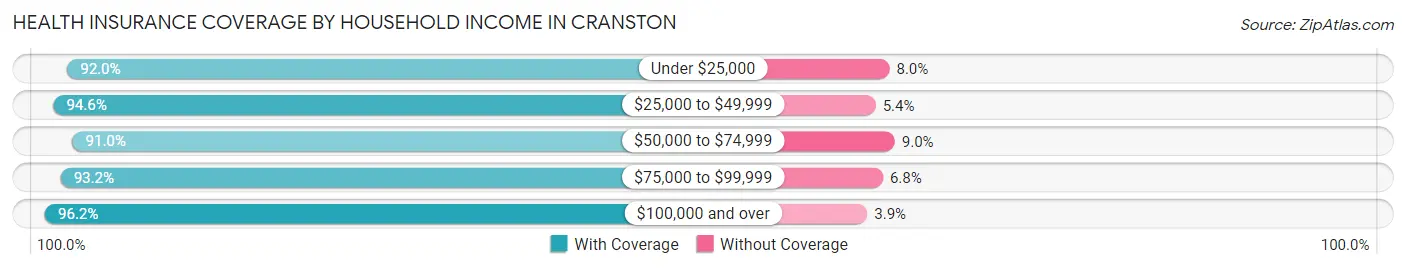
| Household Income | With Coverage | Without Coverage |
| Under $25,000 | 6,442 (92.0%) | 561 (8.0%) |
| $25,000 to $49,999 | 8,390 (94.6%) | 481 (5.4%) |
| $50,000 to $74,999 | 10,515 (91.0%) | 1,040 (9.0%) |
| $75,000 to $99,999 | 10,160 (93.2%) | 739 (6.8%) |
| $100,000 and over | 38,975 (96.2%) | 1,562 (3.8%) |
Public vs Private Health Insurance Coverage by Age in Cranston
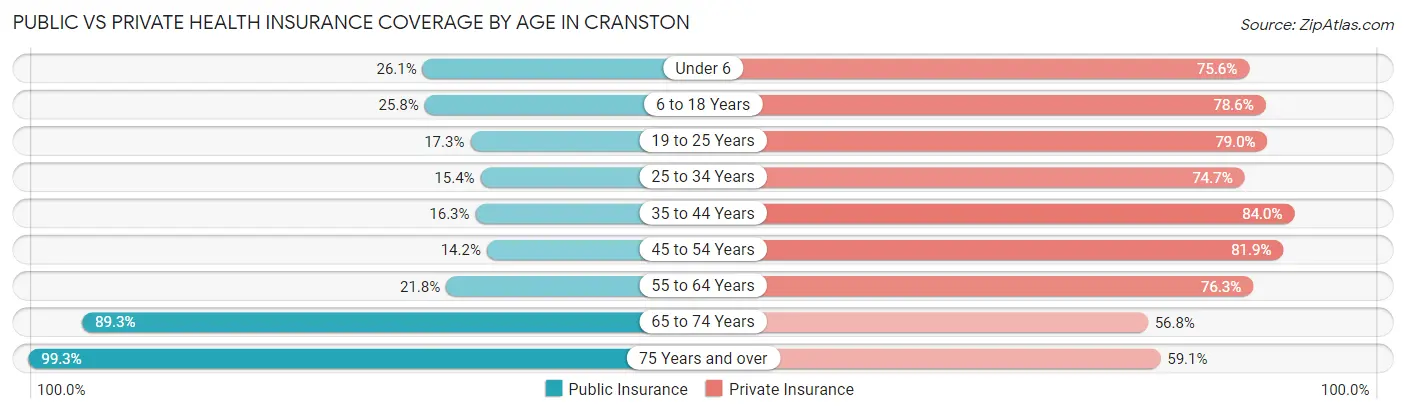
| Age Bracket | Public Insurance | Private Insurance |
| Under 6 | 1,431 (26.1%) | 4,140 (75.6%) |
| 6 to 18 Years | 2,952 (25.8%) | 9,017 (78.6%) |
| 19 to 25 Years | 1,078 (17.3%) | 4,928 (79.0%) |
| 25 to 34 Years | 1,679 (15.4%) | 8,147 (74.7%) |
| 35 to 44 Years | 1,781 (16.3%) | 9,163 (84.0%) |
| 45 to 54 Years | 1,306 (14.2%) | 7,523 (81.9%) |
| 55 to 64 Years | 2,657 (21.8%) | 9,313 (76.3%) |
| 65 to 74 Years | 6,871 (89.3%) | 4,368 (56.8%) |
| 75 Years and over | 5,562 (99.3%) | 3,312 (59.1%) |
| Total | 25,317 (31.8%) | 59,911 (75.2%) |
Disability Status by Sex by Age in Cranston
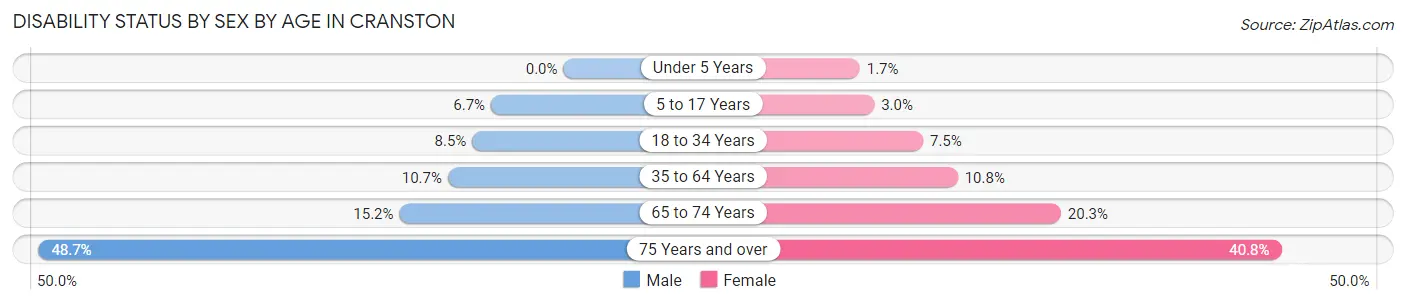
| Age Bracket | Male | Female |
| Under 5 Years | 0 (0.0%) | 45 (1.7%) |
| 5 to 17 Years | 427 (6.7%) | 165 (3.0%) |
| 18 to 34 Years | 776 (8.5%) | 661 (7.5%) |
| 35 to 64 Years | 1,741 (10.7%) | 1,727 (10.8%) |
| 65 to 74 Years | 528 (15.2%) | 859 (20.3%) |
| 75 Years and over | 1,039 (48.7%) | 1,415 (40.8%) |
Disability Class by Sex by Age in Cranston
Disability Class: Hearing Difficulty
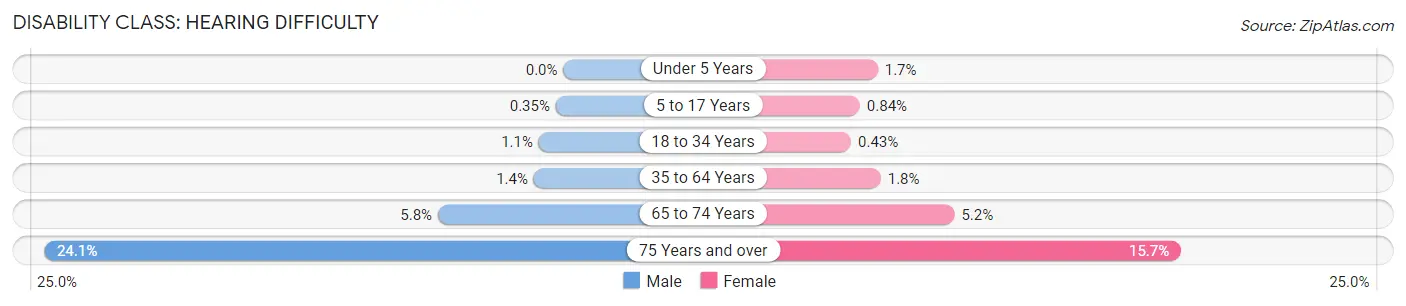
| Age Bracket | Male | Female |
| Under 5 Years | 0 (0.0%) | 45 (1.7%) |
| 5 to 17 Years | 22 (0.4%) | 46 (0.8%) |
| 18 to 34 Years | 105 (1.1%) | 38 (0.4%) |
| 35 to 64 Years | 222 (1.4%) | 290 (1.8%) |
| 65 to 74 Years | 202 (5.8%) | 221 (5.2%) |
| 75 Years and over | 514 (24.1%) | 546 (15.7%) |
Disability Class: Vision Difficulty
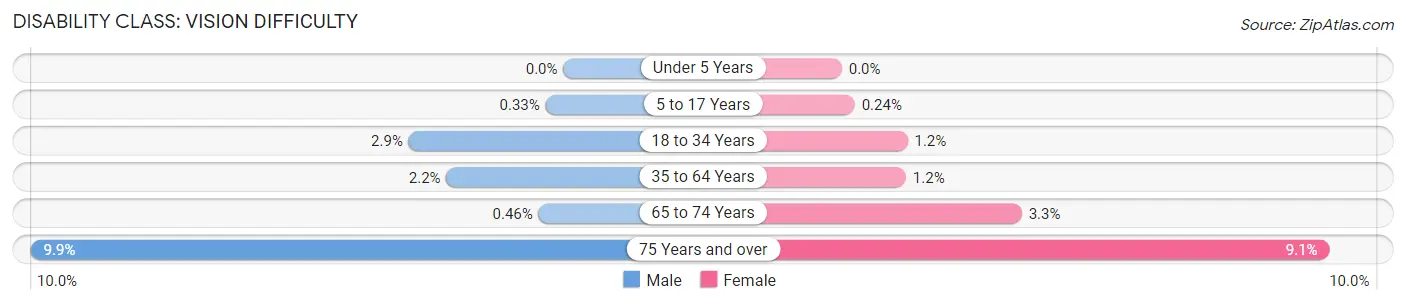
| Age Bracket | Male | Female |
| Under 5 Years | 0 (0.0%) | 0 (0.0%) |
| 5 to 17 Years | 21 (0.3%) | 13 (0.2%) |
| 18 to 34 Years | 263 (2.9%) | 107 (1.2%) |
| 35 to 64 Years | 352 (2.2%) | 191 (1.2%) |
| 65 to 74 Years | 16 (0.5%) | 141 (3.3%) |
| 75 Years and over | 211 (9.9%) | 314 (9.0%) |
Disability Class: Cognitive Difficulty
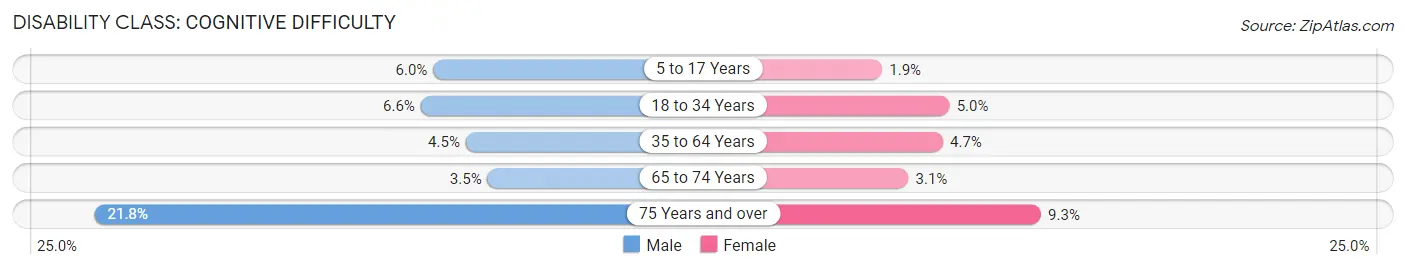
| Age Bracket | Male | Female |
| 5 to 17 Years | 384 (6.0%) | 103 (1.9%) |
| 18 to 34 Years | 607 (6.6%) | 439 (5.0%) |
| 35 to 64 Years | 735 (4.5%) | 755 (4.7%) |
| 65 to 74 Years | 122 (3.5%) | 131 (3.1%) |
| 75 Years and over | 464 (21.7%) | 321 (9.2%) |
Disability Class: Ambulatory Difficulty
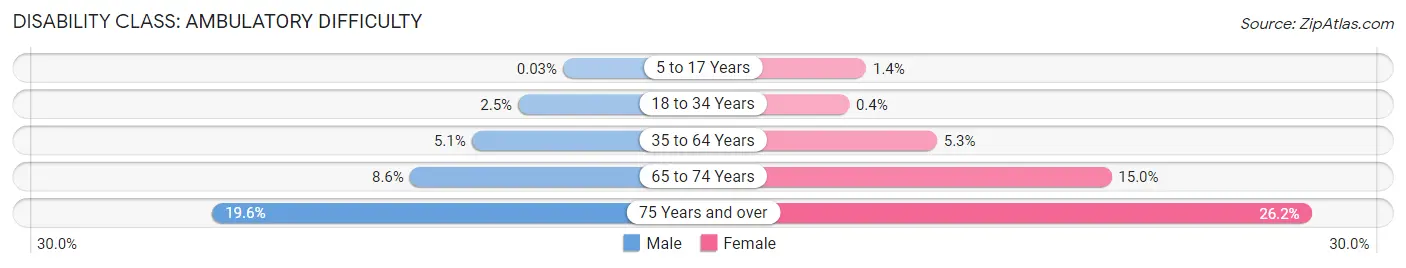
| Age Bracket | Male | Female |
| 5 to 17 Years | 2 (0.0%) | 74 (1.3%) |
| 18 to 34 Years | 232 (2.5%) | 35 (0.4%) |
| 35 to 64 Years | 830 (5.1%) | 850 (5.3%) |
| 65 to 74 Years | 297 (8.6%) | 634 (15.0%) |
| 75 Years and over | 417 (19.6%) | 907 (26.2%) |
Disability Class: Self-Care Difficulty
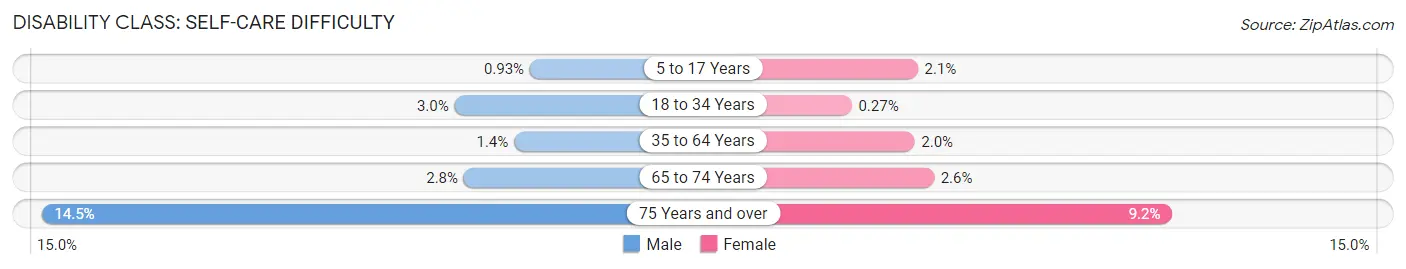
| Age Bracket | Male | Female |
| 5 to 17 Years | 59 (0.9%) | 116 (2.1%) |
| 18 to 34 Years | 278 (3.0%) | 24 (0.3%) |
| 35 to 64 Years | 223 (1.4%) | 324 (2.0%) |
| 65 to 74 Years | 96 (2.8%) | 108 (2.6%) |
| 75 Years and over | 310 (14.5%) | 319 (9.2%) |
Technology Access in Cranston
Computing Device Access in Cranston
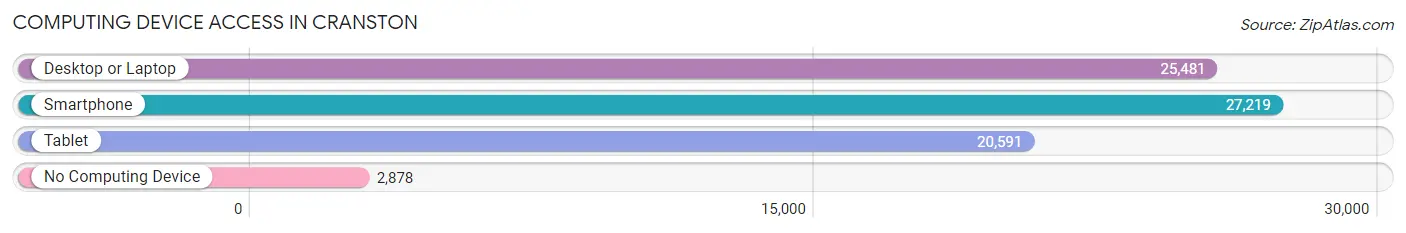
| Device Type | # Households | % Households |
| Desktop or Laptop | 25,481 | 78.6% |
| Smartphone | 27,219 | 83.9% |
| Tablet | 20,591 | 63.5% |
| No Computing Device | 2,878 | 8.9% |
| Total | 32,434 | 100.0% |
Internet Access in Cranston
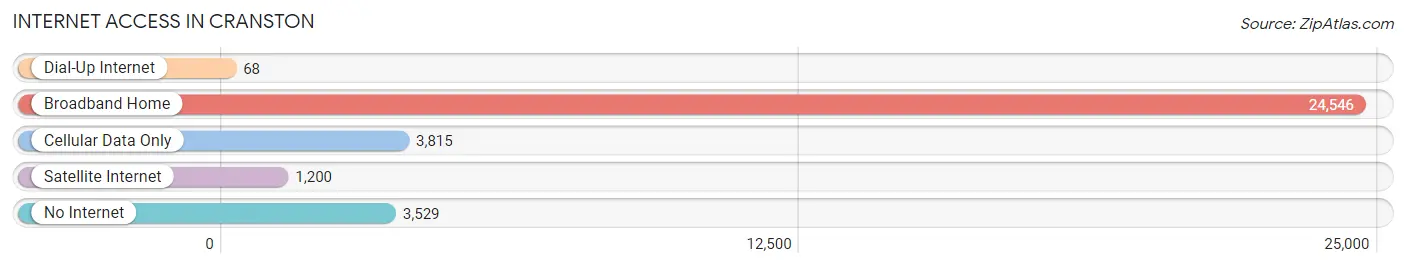
| Internet Type | # Households | % Households |
| Dial-Up Internet | 68 | 0.2% |
| Broadband Home | 24,546 | 75.7% |
| Cellular Data Only | 3,815 | 11.8% |
| Satellite Internet | 1,200 | 3.7% |
| No Internet | 3,529 | 10.9% |
| Total | 32,434 | 100.0% |
Cranston Summary
Cranston, Rhode Island is a city located in Providence County, Rhode Island. It is the third largest city in the state, with a population of 80,387 as of the 2010 census. The city is bordered by the cities of Providence, Warwick, and Johnston, as well as the towns of Scituate, West Greenwich, and North Providence.
Geography
Cranston is located in the center of Providence County, Rhode Island. It is bordered by the cities of Providence, Warwick, and Johnston, as well as the towns of Scituate, West Greenwich, and North Providence. The city covers an area of 24.4 square miles, with a population density of 3,281 people per square mile. The city is located on the western shore of Narragansett Bay, and is home to several parks and recreational areas, including the Cranston Country Club, the Cranston Yacht Club, and the Cranston Public Library.
Climate
Cranston has a humid continental climate, with warm summers and cold winters. The average temperature in the summer is around 75°F, while the average temperature in the winter is around 30°F. The city receives an average of 44 inches of precipitation per year, with the majority of it falling in the spring and summer months.
Economy
Cranston is home to a variety of businesses and industries, including manufacturing, retail, healthcare, and education. The city is home to several large employers, including the Rhode Island Hospital, the University of Rhode Island, and the Rhode Island Department of Education. The city also has a thriving retail sector, with several large shopping centers and malls, including the Garden City Center and the Chapel View Shopping Center.
Demographics
As of the 2010 census, Cranston had a population of 80,387. The racial makeup of the city was 79.2% White, 5.3% African American, 0.3% Native American, 5.2% Asian, 0.1% Pacific Islander, and 9.9% from other races. The median household income in the city was $54,817, and the median family income was $63,945. The per capita income in the city was $27,845.
Conclusion
Cranston, Rhode Island is a city located in Providence County, Rhode Island. It is the third largest city in the state, with a population of 80,387 as of the 2010 census. The city is bordered by the cities of Providence, Warwick, and Johnston, as well as the towns of Scituate, West Greenwich, and North Providence. Cranston has a humid continental climate, with warm summers and cold winters. The city is home to a variety of businesses and industries, including manufacturing, retail, healthcare, and education. As of the 2010 census, Cranston had a population of 80,387, with a median household income of $54,817 and a median family income of $63,945.
Common Questions
What is Per Capita Income in Cranston?
Per Capita income in Cranston is $41,572.
What is the Median Family Income in Cranston?
Median Family Income in Cranston is $104,674.
What is the Median Household income in Cranston?
Median Household Income in Cranston is $83,123.
What is Income or Wage Gap in Cranston?
Income or Wage Gap in Cranston is 24.7%.
Women in Cranston earn 75.3 cents for every dollar earned by a man.
What is Inequality or Gini Index in Cranston?
Inequality or Gini Index in Cranston is 0.44.
What is the Total Population of Cranston?
Total Population of Cranston is 82,691.
What is the Total Male Population of Cranston?
Total Male Population of Cranston is 41,528.
What is the Total Female Population of Cranston?
Total Female Population of Cranston is 41,163.
What is the Ratio of Males per 100 Females in Cranston?
There are 100.89 Males per 100 Females in Cranston.
What is the Ratio of Females per 100 Males in Cranston?
There are 99.12 Females per 100 Males in Cranston.
What is the Median Population Age in Cranston?
Median Population Age in Cranston is 39.9 Years.
What is the Average Family Size in Cranston
Average Family Size in Cranston is 3.1 People.
What is the Average Household Size in Cranston
Average Household Size in Cranston is 2.4 People.
How Large is the Labor Force in Cranston?
There are 44,220 People in the Labor Forcein in Cranston.
What is the Percentage of People in the Labor Force in Cranston?
64.8% of People are in the Labor Force in Cranston.
What is the Unemployment Rate in Cranston?
Unemployment Rate in Cranston is 5.6%.