Las Vegas, NV Map & Demographics
Las Vegas Map
Las Vegas Overview
$36,275
PER CAPITA INCOME
$81,758
AVG FAMILY INCOME
$66,356
AVG HOUSEHOLD INCOME
17.2%
WAGE / INCOME GAP [ % ]
82.8¢/ $1
WAGE / INCOME GAP [ $ ]
$12,066
FAMILY INCOME DEFICIT
0.49
INEQUALITY / GINI INDEX
644,835
TOTAL POPULATION
324,566
MALE POPULATION
320,269
FEMALE POPULATION
101.34
MALES / 100 FEMALES
98.68
FEMALES / 100 MALES
38.1
MEDIAN AGE
3.4
AVG FAMILY SIZE
2.6
AVG HOUSEHOLD SIZE
322,139
LABOR FORCE [ PEOPLE ]
62.6%
PERCENT IN LABOR FORCE
7.4%
UNEMPLOYMENT RATE
Las Vegas Zip Codes
Income in Las Vegas
Income Overview in Las Vegas
Per Capita Income in Las Vegas is $36,275, while median incomes of families and households are $81,758 and $66,356 respectively.
| Characteristic | Number | Measure |
| Per Capita Income | 644,835 | $36,275 |
| Median Family Income | 149,808 | $81,758 |
| Mean Family Income | 149,808 | $109,101 |
| Median Household Income | 240,462 | $66,356 |
| Mean Household Income | 240,462 | $93,515 |
| Income Deficit | 149,808 | $12,066 |
| Wage / Income Gap (%) | 644,835 | 17.18% |
| Wage / Income Gap ($) | 644,835 | 82.82¢ per $1 |
| Gini / Inequality Index | 644,835 | 0.49 |
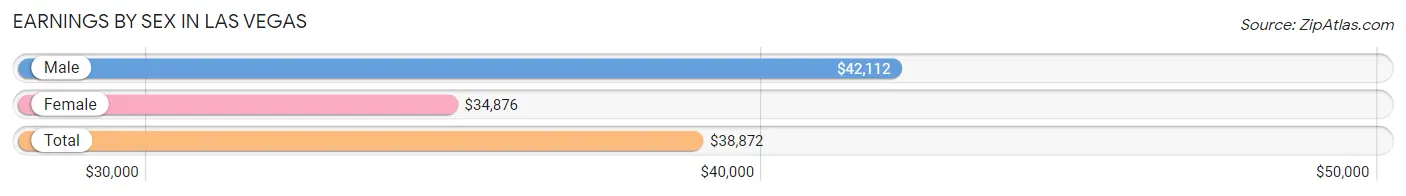
Earnings by Sex in Las Vegas
Average Earnings in Las Vegas are $38,872, $42,112 for men and $34,876 for women, a difference of 17.2%.
| Sex | Number | Average Earnings |
| Male | 177,554 (54.1%) | $42,112 |
| Female | 150,772 (45.9%) | $34,876 |
| Total | 328,326 (100.0%) | $38,872 |
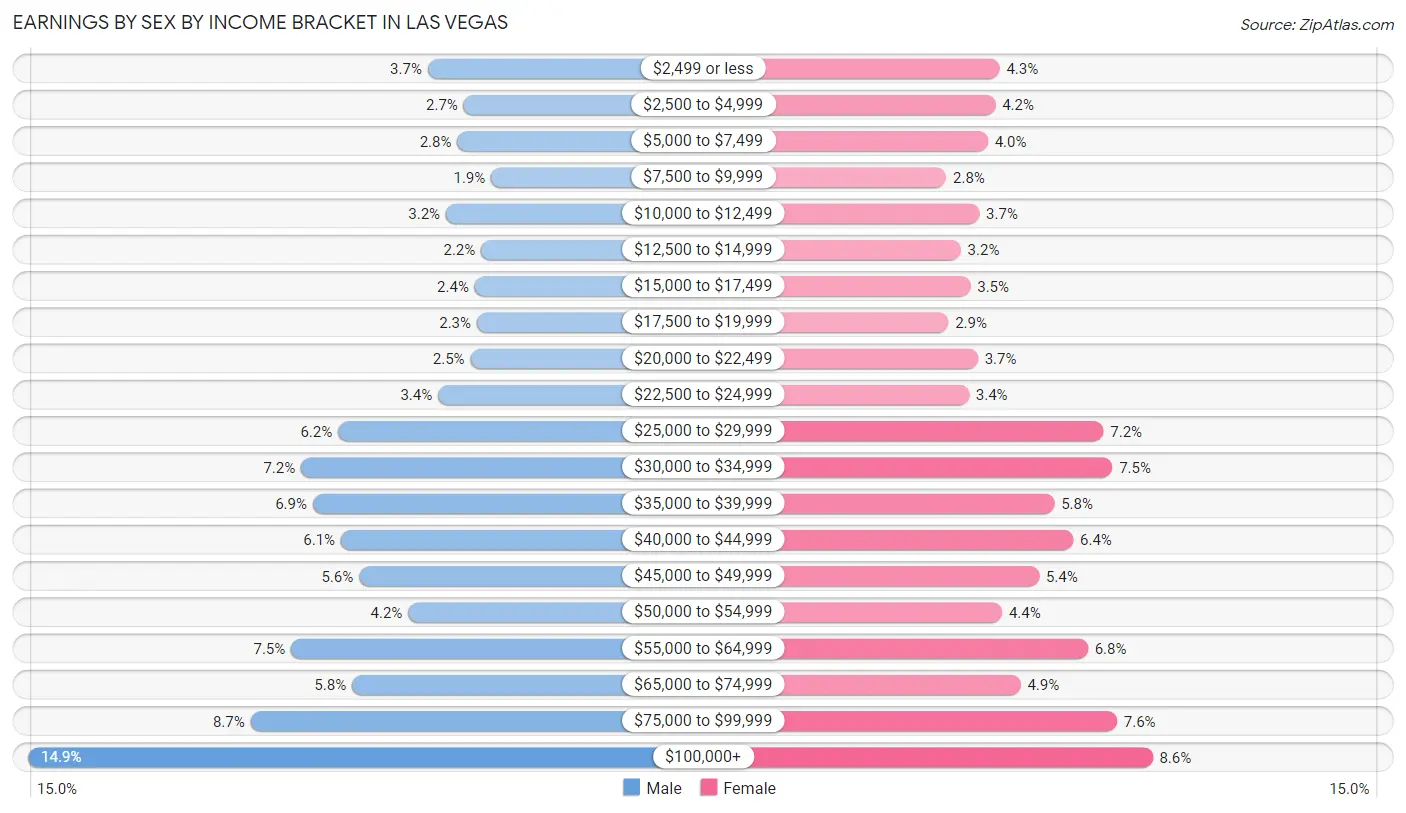
Earnings by Sex by Income Bracket in Las Vegas
The most common earnings brackets in Las Vegas are $100,000+ for men (26,460 | 14.9%) and $100,000+ for women (12,958 | 8.6%).
| Income | Male | Female |
| $2,499 or less | 6,521 (3.7%) | 6,466 (4.3%) |
| $2,500 to $4,999 | 4,727 (2.7%) | 6,294 (4.2%) |
| $5,000 to $7,499 | 5,047 (2.8%) | 5,965 (4.0%) |
| $7,500 to $9,999 | 3,353 (1.9%) | 4,203 (2.8%) |
| $10,000 to $12,499 | 5,612 (3.2%) | 5,602 (3.7%) |
| $12,500 to $14,999 | 3,861 (2.2%) | 4,818 (3.2%) |
| $15,000 to $17,499 | 4,174 (2.4%) | 5,229 (3.5%) |
| $17,500 to $19,999 | 4,064 (2.3%) | 4,297 (2.9%) |
| $20,000 to $22,499 | 4,392 (2.5%) | 5,541 (3.7%) |
| $22,500 to $24,999 | 5,999 (3.4%) | 5,179 (3.4%) |
| $25,000 to $29,999 | 10,993 (6.2%) | 10,876 (7.2%) |
| $30,000 to $34,999 | 12,837 (7.2%) | 11,248 (7.5%) |
| $35,000 to $39,999 | 12,256 (6.9%) | 8,788 (5.8%) |
| $40,000 to $44,999 | 10,843 (6.1%) | 9,594 (6.4%) |
| $45,000 to $49,999 | 9,945 (5.6%) | 8,136 (5.4%) |
| $50,000 to $54,999 | 7,488 (4.2%) | 6,569 (4.4%) |
| $55,000 to $64,999 | 13,333 (7.5%) | 10,208 (6.8%) |
| $65,000 to $74,999 | 10,297 (5.8%) | 7,354 (4.9%) |
| $75,000 to $99,999 | 15,352 (8.6%) | 11,447 (7.6%) |
| $100,000+ | 26,460 (14.9%) | 12,958 (8.6%) |
| Total | 177,554 (100.0%) | 150,772 (100.0%) |
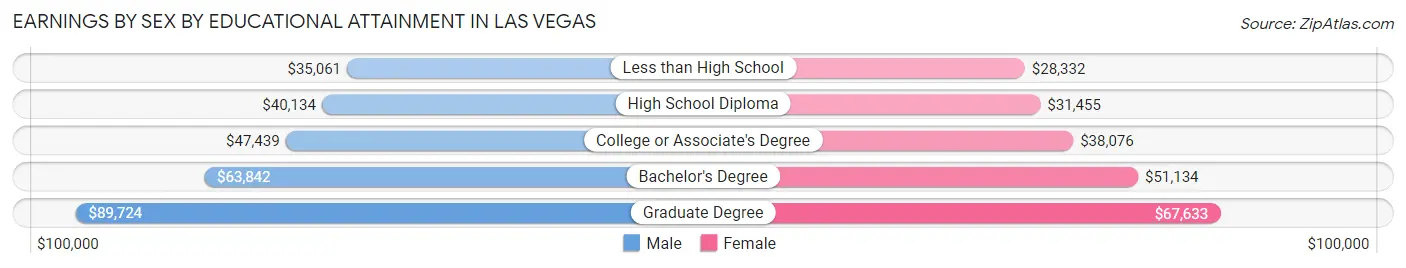
Earnings by Sex by Educational Attainment in Las Vegas
Average earnings in Las Vegas are $46,779 for men and $39,595 for women, a difference of 15.4%. Men with an educational attainment of graduate degree enjoy the highest average annual earnings of $89,724, while those with less than high school education earn the least with $35,061. Women with an educational attainment of graduate degree earn the most with the average annual earnings of $67,633, while those with less than high school education have the smallest earnings of $28,332.
| Educational Attainment | Male Income | Female Income |
| Less than High School | $35,061 | $28,332 |
| High School Diploma | $40,134 | $31,455 |
| College or Associate's Degree | $47,439 | $38,076 |
| Bachelor's Degree | $63,842 | $51,134 |
| Graduate Degree | $89,724 | $67,633 |
| Total | $46,779 | $39,595 |
Family Income in Las Vegas
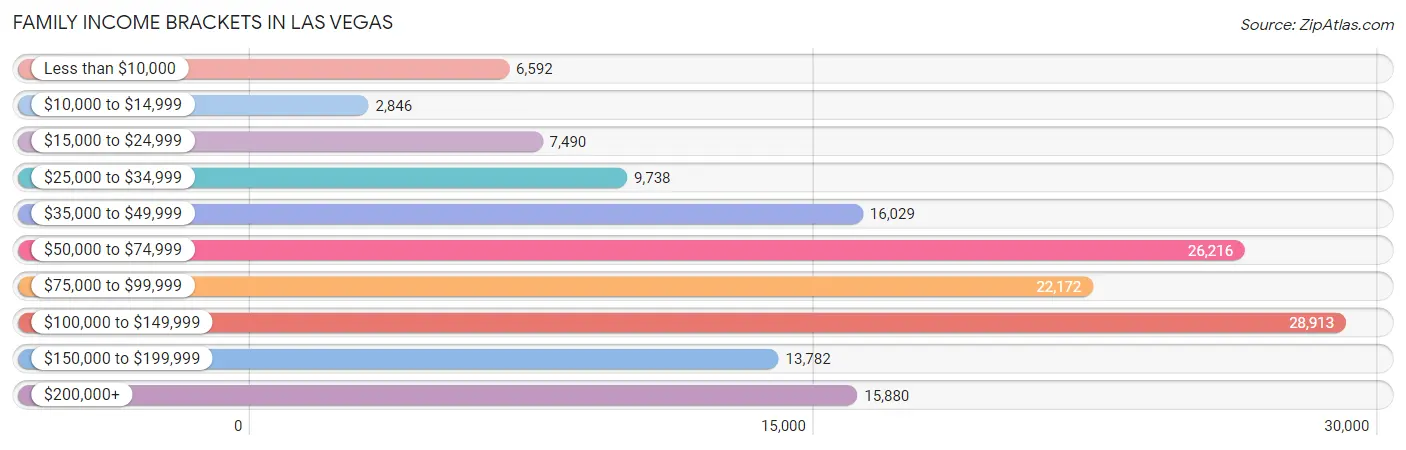
Family Income Brackets in Las Vegas
According to the Las Vegas family income data, there are 28,913 families falling into the $100,000 to $149,999 income range, which is the most common income bracket and makes up 19.3% of all families. Conversely, the $10,000 to $14,999 income bracket is the least frequent group with only 2,846 families (1.9%) belonging to this category.
| Income Bracket | # Families | % Families |
| Less than $10,000 | 6,592 | 4.4% |
| $10,000 to $14,999 | 2,846 | 1.9% |
| $15,000 to $24,999 | 7,490 | 5.0% |
| $25,000 to $34,999 | 9,738 | 6.5% |
| $35,000 to $49,999 | 16,029 | 10.7% |
| $50,000 to $74,999 | 26,216 | 17.5% |
| $75,000 to $99,999 | 22,172 | 14.8% |
| $100,000 to $149,999 | 28,913 | 19.3% |
| $150,000 to $199,999 | 13,782 | 9.2% |
| $200,000+ | 15,880 | 10.6% |
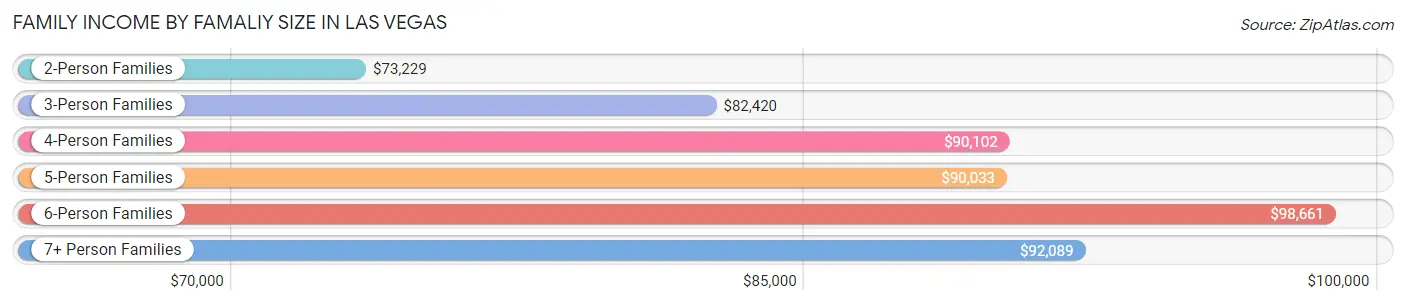
Family Income by Famaliy Size in Las Vegas
6-person families (6,117 | 4.1%) account for the highest median family income in Las Vegas with $98,661 per family, while 2-person families (66,167 | 44.2%) have the highest median income of $36,614 per family member.
| Income Bracket | # Families | Median Income |
| 2-Person Families | 66,167 (44.2%) | $73,229 |
| 3-Person Families | 33,968 (22.7%) | $82,420 |
| 4-Person Families | 26,514 (17.7%) | $90,102 |
| 5-Person Families | 13,249 (8.8%) | $90,033 |
| 6-Person Families | 6,117 (4.1%) | $98,661 |
| 7+ Person Families | 3,793 (2.5%) | $92,089 |
| Total | 149,808 (100.0%) | $81,758 |
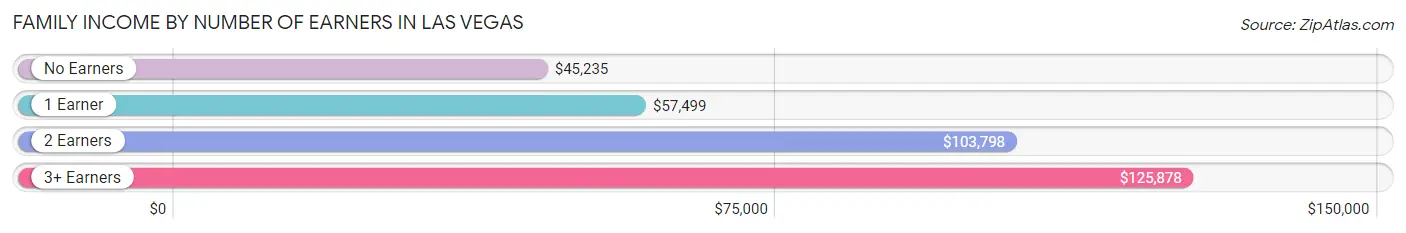
Family Income by Number of Earners in Las Vegas
The median family income in Las Vegas is $81,758, with families comprising 3+ earners (18,863) having the highest median family income of $125,878, while families with no earners (22,345) have the lowest median family income of $45,235, accounting for 12.6% and 14.9% of families, respectively.
| Number of Earners | # Families | Median Income |
| No Earners | 22,345 (14.9%) | $45,235 |
| 1 Earner | 53,063 (35.4%) | $57,499 |
| 2 Earners | 55,537 (37.1%) | $103,798 |
| 3+ Earners | 18,863 (12.6%) | $125,878 |
| Total | 149,808 (100.0%) | $81,758 |
Household Income in Las Vegas
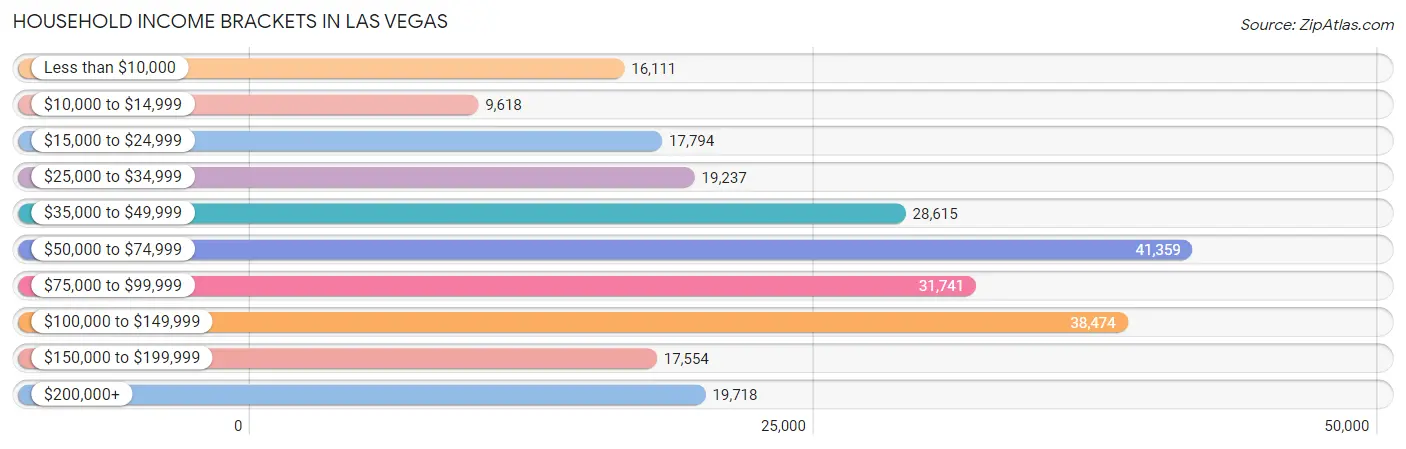
Household Income Brackets in Las Vegas
With 41,359 households falling in the category, the $50,000 to $74,999 income range is the most frequent in Las Vegas, accounting for 17.2% of all households. In contrast, only 9,618 households (4.0%) fall into the $10,000 to $14,999 income bracket, making it the least populous group.
| Income Bracket | # Households | % Households |
| Less than $10,000 | 16,111 | 6.7% |
| $10,000 to $14,999 | 9,618 | 4.0% |
| $15,000 to $24,999 | 17,794 | 7.4% |
| $25,000 to $34,999 | 19,237 | 8.0% |
| $35,000 to $49,999 | 28,615 | 11.9% |
| $50,000 to $74,999 | 41,359 | 17.2% |
| $75,000 to $99,999 | 31,741 | 13.2% |
| $100,000 to $149,999 | 38,474 | 16.0% |
| $150,000 to $199,999 | 17,554 | 7.3% |
| $200,000+ | 19,718 | 8.2% |
Household Income by Householder Age in Las Vegas
The median household income in Las Vegas is $66,356, with the highest median household income of $78,254 found in the 45 to 64 years age bracket for the primary householder. A total of 89,117 households (37.1%) fall into this category. Meanwhile, the 15 to 24 years age bracket for the primary householder has the lowest median household income of $47,764, with 7,631 households (3.2%) in this group.
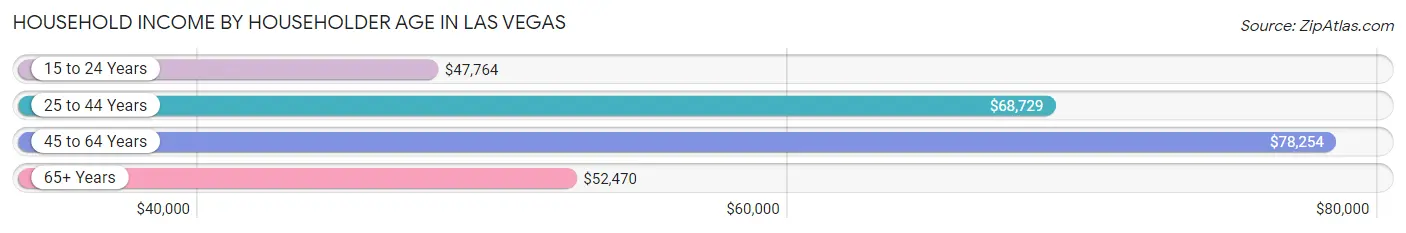
| Income Bracket | # Households | Median Income |
| 15 to 24 Years | 7,631 (3.2%) | $47,764 |
| 25 to 44 Years | 84,456 (35.1%) | $68,729 |
| 45 to 64 Years | 89,117 (37.1%) | $78,254 |
| 65+ Years | 59,258 (24.6%) | $52,470 |
| Total | 240,462 (100.0%) | $66,356 |
Poverty in Las Vegas
Income Below Poverty by Sex and Age in Las Vegas
With 13.6% poverty level for males and 15.7% for females among the residents of Las Vegas, under 5 year old males and 5 year old females are the most vulnerable to poverty, with 4,373 males (24.2%) and 947 females (24.3%) in their respective age groups living below the poverty level.
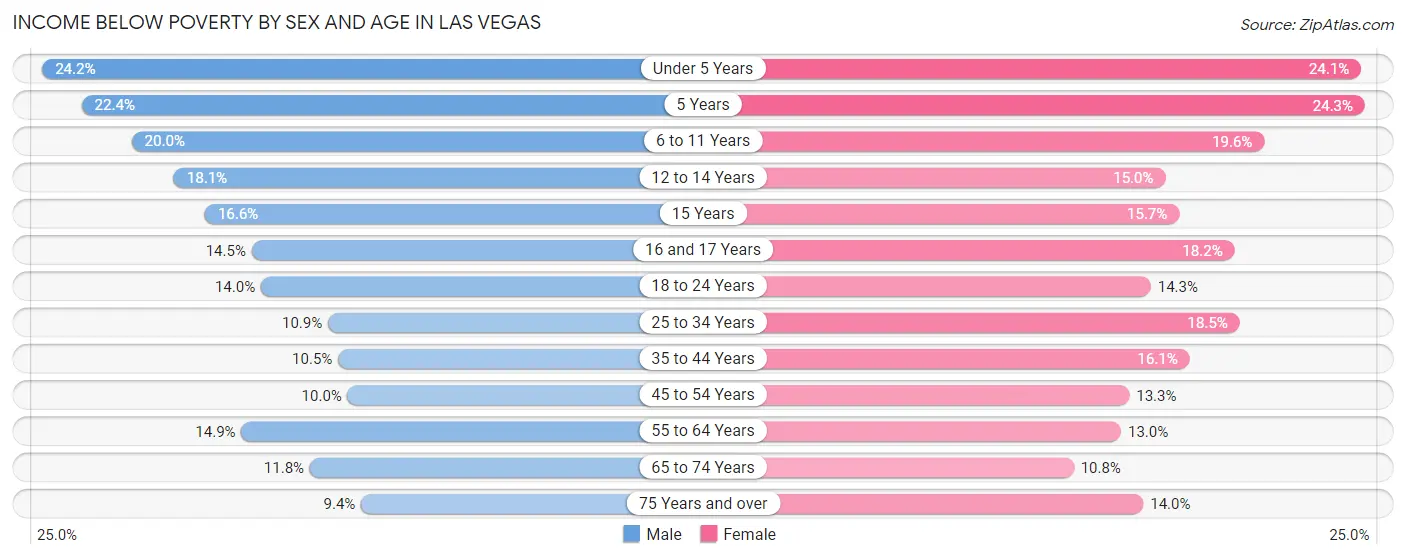
| Age Bracket | Male | Female |
| Under 5 Years | 4,373 (24.2%) | 4,582 (24.1%) |
| 5 Years | 876 (22.4%) | 947 (24.3%) |
| 6 to 11 Years | 5,144 (20.0%) | 4,439 (19.6%) |
| 12 to 14 Years | 2,523 (18.1%) | 1,821 (15.0%) |
| 15 Years | 662 (16.6%) | 759 (15.7%) |
| 16 and 17 Years | 1,299 (14.5%) | 1,532 (18.2%) |
| 18 to 24 Years | 4,043 (14.0%) | 3,746 (14.3%) |
| 25 to 34 Years | 5,055 (10.9%) | 8,293 (18.5%) |
| 35 to 44 Years | 4,484 (10.4%) | 7,068 (16.1%) |
| 45 to 54 Years | 4,276 (10.0%) | 5,413 (13.3%) |
| 55 to 64 Years | 5,926 (14.9%) | 5,005 (13.0%) |
| 65 to 74 Years | 3,216 (11.8%) | 3,369 (10.8%) |
| 75 Years and over | 1,613 (9.4%) | 2,986 (14.0%) |
| Total | 43,490 (13.6%) | 49,960 (15.7%) |
Income Above Poverty by Sex and Age in Las Vegas
According to the poverty statistics in Las Vegas, males aged 75 years and over and females aged 65 to 74 years are the age groups that are most secure financially, with 90.6% of males and 89.2% of females in these age groups living above the poverty line.
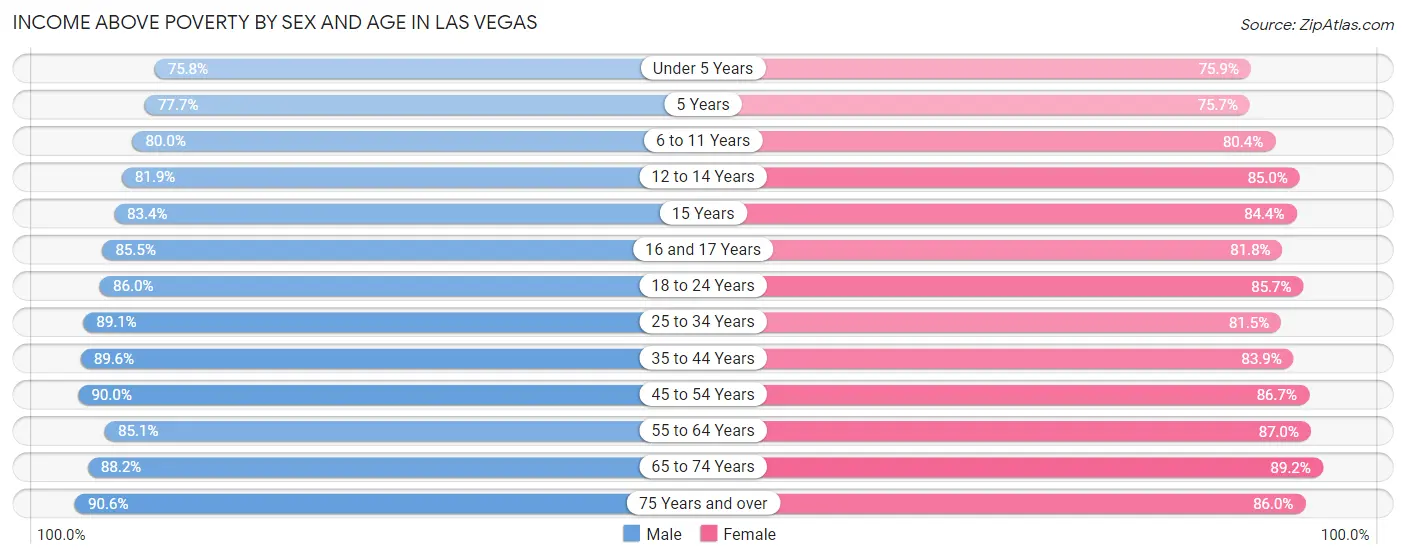
| Age Bracket | Male | Female |
| Under 5 Years | 13,712 (75.8%) | 14,429 (75.9%) |
| 5 Years | 3,044 (77.6%) | 2,955 (75.7%) |
| 6 to 11 Years | 20,543 (80.0%) | 18,211 (80.4%) |
| 12 to 14 Years | 11,442 (81.9%) | 10,313 (85.0%) |
| 15 Years | 3,318 (83.4%) | 4,091 (84.4%) |
| 16 and 17 Years | 7,682 (85.5%) | 6,878 (81.8%) |
| 18 to 24 Years | 24,764 (86.0%) | 22,368 (85.7%) |
| 25 to 34 Years | 41,244 (89.1%) | 36,623 (81.5%) |
| 35 to 44 Years | 38,424 (89.5%) | 36,734 (83.9%) |
| 45 to 54 Years | 38,428 (90.0%) | 35,163 (86.7%) |
| 55 to 64 Years | 33,730 (85.1%) | 33,626 (87.0%) |
| 65 to 74 Years | 24,134 (88.2%) | 27,935 (89.2%) |
| 75 Years and over | 15,582 (90.6%) | 18,359 (86.0%) |
| Total | 276,047 (86.4%) | 267,685 (84.3%) |
Income Below Poverty Among Married-Couple Families in Las Vegas
The poverty statistics for married-couple families in Las Vegas show that 5.9% or 5,899 of the total 99,589 families live below the poverty line. Families with 5 or more children have the highest poverty rate of 20.6%, comprising of 220 families. On the other hand, families with no children have the lowest poverty rate of 4.3%, which includes 2,412 families.
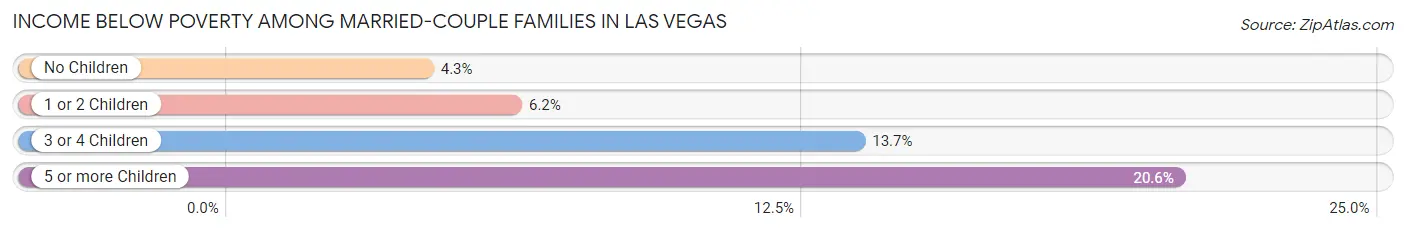
| Children | Above Poverty | Below Poverty |
| No Children | 54,228 (95.7%) | 2,412 (4.3%) |
| 1 or 2 Children | 30,769 (93.8%) | 2,027 (6.2%) |
| 3 or 4 Children | 7,846 (86.4%) | 1,240 (13.7%) |
| 5 or more Children | 847 (79.4%) | 220 (20.6%) |
| Total | 93,690 (94.1%) | 5,899 (5.9%) |
Income Below Poverty Among Single-Parent Households in Las Vegas
According to the poverty data in Las Vegas, 11.6% or 1,851 single-father households and 24.3% or 8,338 single-mother households are living below the poverty line. Among single-father households, those with 5 or more children have the highest poverty rate, with 57 households (42.5%) experiencing poverty. Likewise, among single-mother households, those with 5 or more children have the highest poverty rate, with 443 households (70.7%) falling below the poverty line.
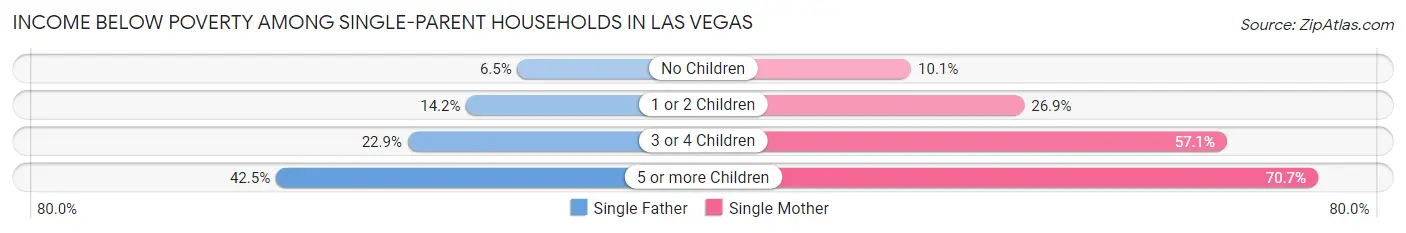
| Children | Single Father | Single Mother |
| No Children | 500 (6.5%) | 1,317 (10.1%) |
| 1 or 2 Children | 921 (14.2%) | 4,612 (26.9%) |
| 3 or 4 Children | 373 (22.9%) | 1,966 (57.1%) |
| 5 or more Children | 57 (42.5%) | 443 (70.7%) |
| Total | 1,851 (11.6%) | 8,338 (24.3%) |
Income Below Poverty Among Married-Couple vs Single-Parent Households in Las Vegas
The poverty data for Las Vegas shows that 5,899 of the married-couple family households (5.9%) and 10,189 of the single-parent households (20.3%) are living below the poverty level. Within the married-couple family households, those with 5 or more children have the highest poverty rate, with 220 households (20.6%) falling below the poverty line. Among the single-parent households, those with 5 or more children have the highest poverty rate, with 500 household (65.7%) living below poverty.
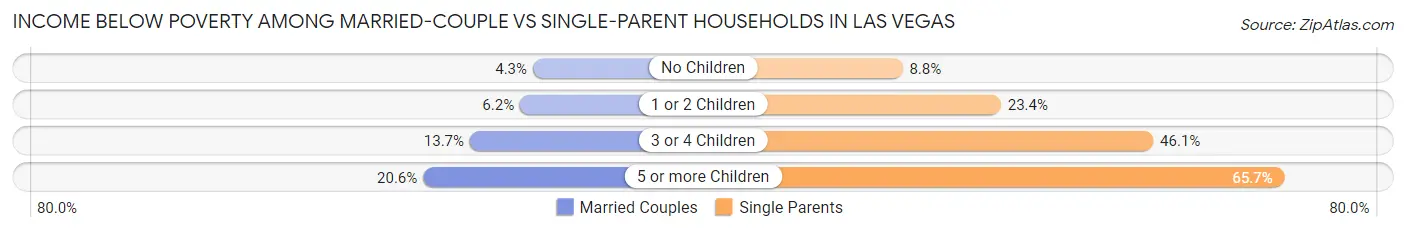
| Children | Married-Couple Families | Single-Parent Households |
| No Children | 2,412 (4.3%) | 1,817 (8.8%) |
| 1 or 2 Children | 2,027 (6.2%) | 5,533 (23.4%) |
| 3 or 4 Children | 1,240 (13.7%) | 2,339 (46.1%) |
| 5 or more Children | 220 (20.6%) | 500 (65.7%) |
| Total | 5,899 (5.9%) | 10,189 (20.3%) |
Race in Las Vegas
The most populous races in Las Vegas are White / Caucasian (335,404 | 52.0%), Hispanic or Latino (221,430 | 34.3%), and Two or more Races (89,665 | 13.9%).
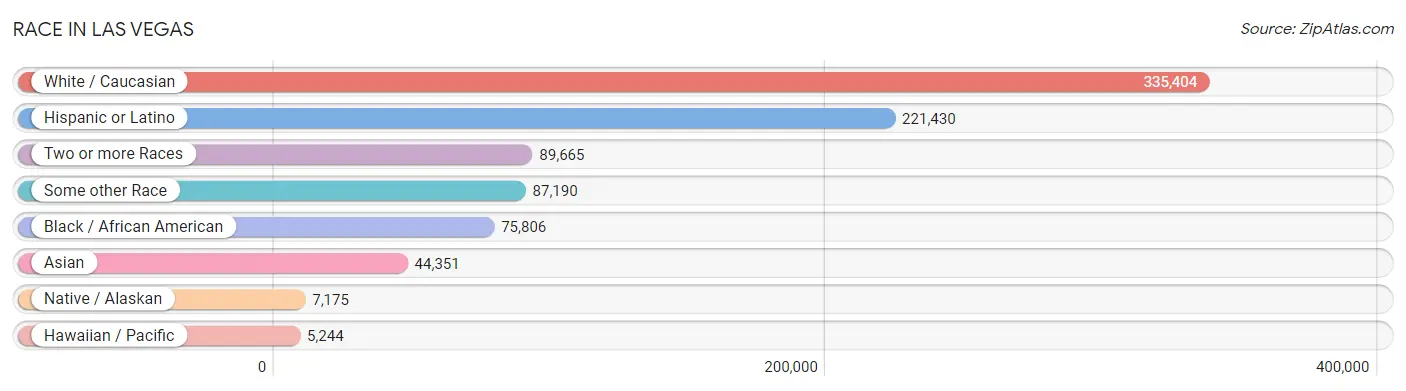
| Race | # Population | % Population |
| Asian | 44,351 | 6.9% |
| Black / African American | 75,806 | 11.8% |
| Hawaiian / Pacific | 5,244 | 0.8% |
| Hispanic or Latino | 221,430 | 34.3% |
| Native / Alaskan | 7,175 | 1.1% |
| White / Caucasian | 335,404 | 52.0% |
| Two or more Races | 89,665 | 13.9% |
| Some other Race | 87,190 | 13.5% |
| Total | 644,835 | 100.0% |
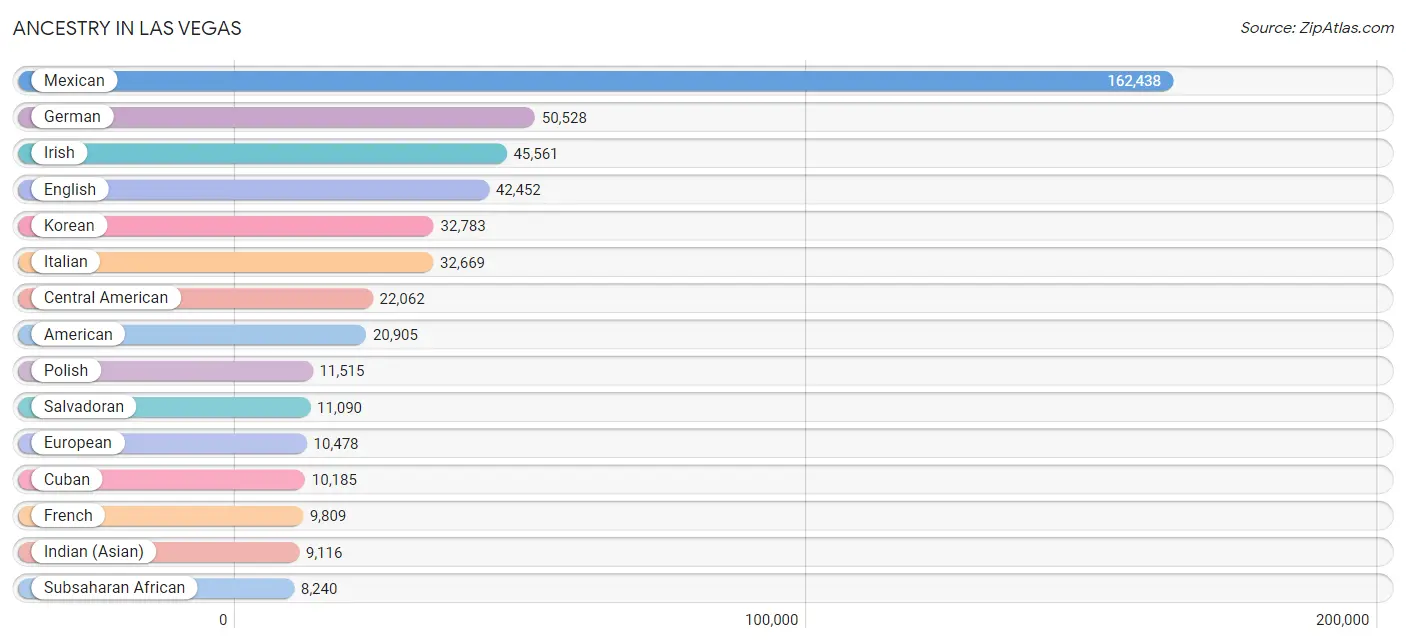
Ancestry in Las Vegas
The most populous ancestries reported in Las Vegas are Mexican (162,438 | 25.2%), German (50,528 | 7.8%), Irish (45,561 | 7.1%), English (42,452 | 6.6%), and Korean (32,783 | 5.1%), together accounting for 51.8% of all Las Vegas residents.
| Ancestry | # Population | % Population |
| Afghan | 29 | 0.0% |
| African | 6,434 | 1.0% |
| Alaska Native | 72 | 0.0% |
| Albanian | 147 | 0.0% |
| American | 20,905 | 3.2% |
| Apache | 366 | 0.1% |
| Arab | 3,528 | 0.5% |
| Arapaho | 5 | 0.0% |
| Argentinean | 1,417 | 0.2% |
| Armenian | 2,461 | 0.4% |
| Assyrian / Chaldean / Syriac | 137 | 0.0% |
| Australian | 324 | 0.1% |
| Austrian | 950 | 0.2% |
| Bangladeshi | 115 | 0.0% |
| Barbadian | 6 | 0.0% |
| Basque | 162 | 0.0% |
| Belgian | 403 | 0.1% |
| Belizean | 727 | 0.1% |
| Bhutanese | 6,311 | 1.0% |
| Blackfeet | 235 | 0.0% |
| Bolivian | 508 | 0.1% |
| Brazilian | 879 | 0.1% |
| British | 2,832 | 0.4% |
| British West Indian | 90 | 0.0% |
| Bulgarian | 631 | 0.1% |
| Burmese | 4,050 | 0.6% |
| Cajun | 32 | 0.0% |
| Cambodian | 86 | 0.0% |
| Canadian | 1,348 | 0.2% |
| Cape Verdean | 64 | 0.0% |
| Carpatho Rusyn | 22 | 0.0% |
| Celtic | 347 | 0.1% |
| Central American | 22,062 | 3.4% |
| Central American Indian | 872 | 0.1% |
| Cherokee | 2,203 | 0.3% |
| Cheyenne | 6 | 0.0% |
| Chickasaw | 71 | 0.0% |
| Chilean | 497 | 0.1% |
| Chinese | 49 | 0.0% |
| Chippewa | 74 | 0.0% |
| Choctaw | 334 | 0.1% |
| Colombian | 1,952 | 0.3% |
| Comanche | 197 | 0.0% |
| Costa Rican | 471 | 0.1% |
| Cree | 47 | 0.0% |
| Creek | 188 | 0.0% |
| Croatian | 478 | 0.1% |
| Cuban | 10,185 | 1.6% |
| Cypriot | 29 | 0.0% |
| Czech | 1,393 | 0.2% |
| Czechoslovakian | 450 | 0.1% |
| Danish | 2,692 | 0.4% |
| Delaware | 30 | 0.0% |
| Dominican | 1,164 | 0.2% |
| Dutch | 4,343 | 0.7% |
| Eastern European | 1,606 | 0.3% |
| Ecuadorian | 864 | 0.1% |
| Egyptian | 425 | 0.1% |
| English | 42,452 | 6.6% |
| Estonian | 61 | 0.0% |
| Ethiopian | 676 | 0.1% |
| European | 10,478 | 1.6% |
| Fijian | 93 | 0.0% |
| Filipino | 544 | 0.1% |
| Finnish | 787 | 0.1% |
| French | 9,809 | 1.5% |
| French American Indian | 91 | 0.0% |
| French Canadian | 1,972 | 0.3% |
| German | 50,528 | 7.8% |
| German Russian | 186 | 0.0% |
| Ghanaian | 25 | 0.0% |
| Greek | 2,250 | 0.4% |
| Guamanian / Chamorro | 1,480 | 0.2% |
| Guatemalan | 5,356 | 0.8% |
| Guyanese | 25 | 0.0% |
| Haitian | 747 | 0.1% |
| Honduran | 2,057 | 0.3% |
| Hopi | 119 | 0.0% |
| Houma | 6 | 0.0% |
| Hungarian | 2,562 | 0.4% |
| Icelander | 58 | 0.0% |
| Indian (Asian) | 9,116 | 1.4% |
| Indonesian | 10 | 0.0% |
| Inupiat | 86 | 0.0% |
| Iranian | 2,437 | 0.4% |
| Iraqi | 335 | 0.1% |
| Irish | 45,561 | 7.1% |
| Iroquois | 170 | 0.0% |
| Israeli | 1,225 | 0.2% |
| Italian | 32,669 | 5.1% |
| Jamaican | 1,161 | 0.2% |
| Japanese | 588 | 0.1% |
| Jordanian | 87 | 0.0% |
| Kenyan | 180 | 0.0% |
| Kiowa | 43 | 0.0% |
| Korean | 32,783 | 5.1% |
| Laotian | 523 | 0.1% |
| Latvian | 52 | 0.0% |
| Lebanese | 1,285 | 0.2% |
| Liberian | 74 | 0.0% |
| Lithuanian | 700 | 0.1% |
| Luxembourger | 13 | 0.0% |
| Macedonian | 61 | 0.0% |
| Malaysian | 590 | 0.1% |
| Maltese | 109 | 0.0% |
| Menominee | 4 | 0.0% |
| Mexican | 162,438 | 25.2% |
| Mexican American Indian | 4,489 | 0.7% |
| Mongolian | 54 | 0.0% |
| Moroccan | 257 | 0.0% |
| Native Hawaiian | 4,362 | 0.7% |
| Navajo | 487 | 0.1% |
| New Zealander | 97 | 0.0% |
| Nicaraguan | 1,896 | 0.3% |
| Nigerian | 447 | 0.1% |
| Northern European | 750 | 0.1% |
| Norwegian | 6,202 | 1.0% |
| Osage | 36 | 0.0% |
| Paiute | 211 | 0.0% |
| Pakistani | 1,634 | 0.3% |
| Palestinian | 245 | 0.0% |
| Panamanian | 498 | 0.1% |
| Paraguayan | 3 | 0.0% |
| Pennsylvania German | 129 | 0.0% |
| Peruvian | 1,651 | 0.3% |
| Pima | 10 | 0.0% |
| Polish | 11,515 | 1.8% |
| Portuguese | 2,880 | 0.4% |
| Potawatomi | 41 | 0.0% |
| Pueblo | 157 | 0.0% |
| Puerto Rican | 7,699 | 1.2% |
| Romanian | 1,311 | 0.2% |
| Russian | 5,456 | 0.9% |
| Salvadoran | 11,090 | 1.7% |
| Samoan | 2,230 | 0.4% |
| Scandinavian | 1,836 | 0.3% |
| Scotch-Irish | 2,799 | 0.4% |
| Scottish | 8,202 | 1.3% |
| Senegalese | 30 | 0.0% |
| Serbian | 406 | 0.1% |
| Shoshone | 125 | 0.0% |
| Sioux | 247 | 0.0% |
| Slavic | 290 | 0.0% |
| Slovak | 544 | 0.1% |
| Slovene | 172 | 0.0% |
| Somali | 48 | 0.0% |
| South African | 79 | 0.0% |
| South American | 7,598 | 1.2% |
| South American Indian | 59 | 0.0% |
| Soviet Union | 12 | 0.0% |
| Spaniard | 3,093 | 0.5% |
| Spanish | 2,043 | 0.3% |
| Spanish American | 80 | 0.0% |
| Sri Lankan | 3,182 | 0.5% |
| Subsaharan African | 8,240 | 1.3% |
| Swedish | 5,357 | 0.8% |
| Swiss | 1,366 | 0.2% |
| Syrian | 217 | 0.0% |
| Thai | 2,452 | 0.4% |
| Tlingit-Haida | 53 | 0.0% |
| Tongan | 153 | 0.0% |
| Trinidadian and Tobagonian | 28 | 0.0% |
| Turkish | 262 | 0.0% |
| U.S. Virgin Islander | 101 | 0.0% |
| Ugandan | 14 | 0.0% |
| Ukrainian | 1,267 | 0.2% |
| Uruguayan | 95 | 0.0% |
| Ute | 81 | 0.0% |
| Venezuelan | 596 | 0.1% |
| Vietnamese | 12 | 0.0% |
| Welsh | 2,255 | 0.4% |
| West Indian | 170 | 0.0% |
| Yaqui | 100 | 0.0% |
| Yugoslavian | 250 | 0.0% |
| Yuman | 49 | 0.0% |
| Yup'ik | 10 | 0.0% |
| Zimbabwean | 16 | 0.0% | View All 177 Rows |
Immigrants in Las Vegas
The most numerous immigrant groups reported in Las Vegas came from Latin America (83,177 | 12.9%), Central America (69,372 | 10.8%), Mexico (55,945 | 8.7%), Asia (34,825 | 5.4%), and South Eastern Asia (20,519 | 3.2%), together accounting for 40.9% of all Las Vegas residents.
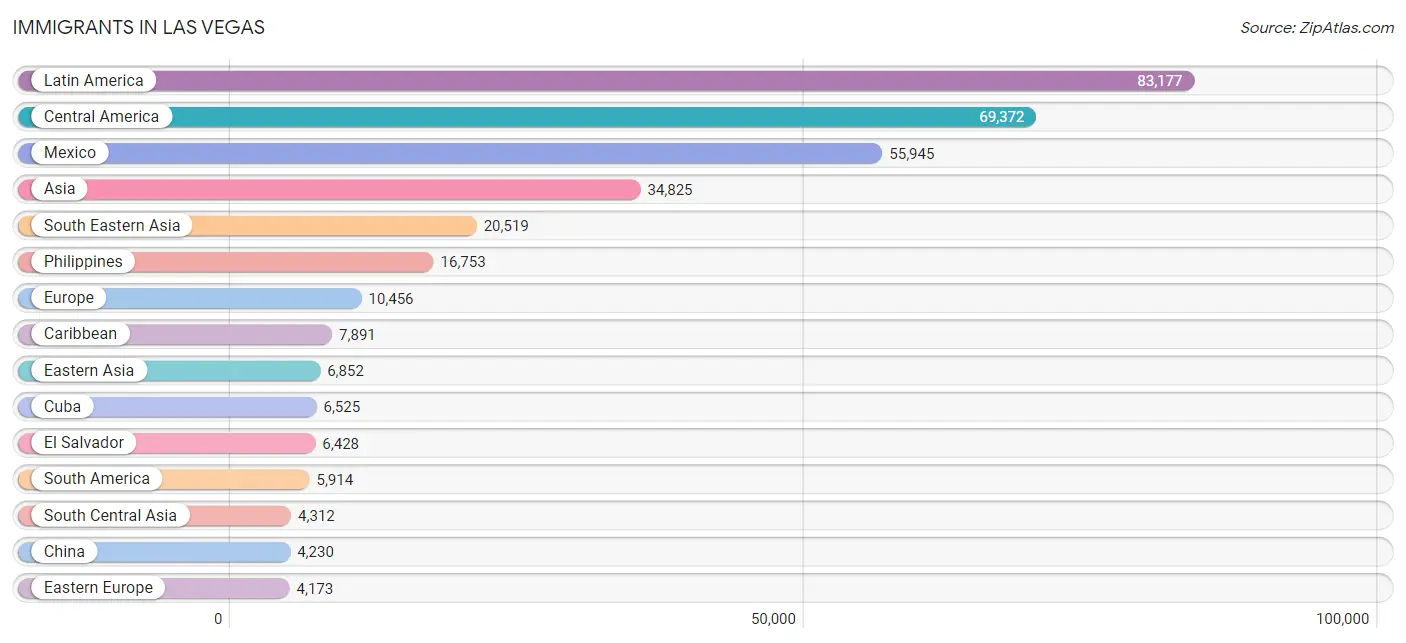
| Immigration Origin | # Population | % Population |
| Afghanistan | 43 | 0.0% |
| Africa | 2,344 | 0.4% |
| Albania | 161 | 0.0% |
| Argentina | 813 | 0.1% |
| Armenia | 817 | 0.1% |
| Asia | 34,825 | 5.4% |
| Australia | 346 | 0.1% |
| Austria | 90 | 0.0% |
| Bahamas | 77 | 0.0% |
| Barbados | 22 | 0.0% |
| Belarus | 61 | 0.0% |
| Belgium | 67 | 0.0% |
| Belize | 412 | 0.1% |
| Bolivia | 285 | 0.0% |
| Bosnia and Herzegovina | 61 | 0.0% |
| Brazil | 991 | 0.2% |
| Bulgaria | 550 | 0.1% |
| Cambodia | 192 | 0.0% |
| Cameroon | 18 | 0.0% |
| Canada | 2,552 | 0.4% |
| Caribbean | 7,891 | 1.2% |
| Central America | 69,372 | 10.8% |
| Chile | 425 | 0.1% |
| China | 4,230 | 0.7% |
| Colombia | 1,365 | 0.2% |
| Costa Rica | 229 | 0.0% |
| Croatia | 83 | 0.0% |
| Cuba | 6,525 | 1.0% |
| Czechoslovakia | 111 | 0.0% |
| Denmark | 110 | 0.0% |
| Dominican Republic | 354 | 0.1% |
| Eastern Africa | 877 | 0.1% |
| Eastern Asia | 6,852 | 1.1% |
| Eastern Europe | 4,173 | 0.6% |
| Ecuador | 415 | 0.1% |
| Egypt | 266 | 0.0% |
| El Salvador | 6,428 | 1.0% |
| England | 992 | 0.2% |
| Eritrea | 89 | 0.0% |
| Ethiopia | 330 | 0.1% |
| Europe | 10,456 | 1.6% |
| Fiji | 69 | 0.0% |
| France | 602 | 0.1% |
| Germany | 1,395 | 0.2% |
| Ghana | 14 | 0.0% |
| Greece | 228 | 0.0% |
| Guatemala | 3,542 | 0.5% |
| Guyana | 23 | 0.0% |
| Haiti | 189 | 0.0% |
| Honduras | 1,526 | 0.2% |
| Hong Kong | 228 | 0.0% |
| Hungary | 385 | 0.1% |
| India | 1,554 | 0.2% |
| Indonesia | 245 | 0.0% |
| Iran | 2,103 | 0.3% |
| Iraq | 371 | 0.1% |
| Ireland | 189 | 0.0% |
| Israel | 796 | 0.1% |
| Italy | 615 | 0.1% |
| Jamaica | 585 | 0.1% |
| Japan | 1,003 | 0.2% |
| Jordan | 236 | 0.0% |
| Kazakhstan | 51 | 0.0% |
| Kenya | 268 | 0.0% |
| Korea | 1,577 | 0.2% |
| Kuwait | 12 | 0.0% |
| Laos | 247 | 0.0% |
| Latin America | 83,177 | 12.9% |
| Latvia | 44 | 0.0% |
| Lebanon | 364 | 0.1% |
| Lithuania | 70 | 0.0% |
| Malaysia | 259 | 0.0% |
| Mexico | 55,945 | 8.7% |
| Micronesia | 6 | 0.0% |
| Middle Africa | 29 | 0.0% |
| Moldova | 80 | 0.0% |
| Morocco | 207 | 0.0% |
| Nepal | 110 | 0.0% |
| Netherlands | 226 | 0.0% |
| Nicaragua | 1,135 | 0.2% |
| Nigeria | 193 | 0.0% |
| North Macedonia | 58 | 0.0% |
| Northern Africa | 608 | 0.1% |
| Northern Europe | 2,769 | 0.4% |
| Norway | 28 | 0.0% |
| Oceania | 813 | 0.1% |
| Pakistan | 186 | 0.0% |
| Panama | 155 | 0.0% |
| Peru | 1,161 | 0.2% |
| Philippines | 16,753 | 2.6% |
| Poland | 618 | 0.1% |
| Portugal | 38 | 0.0% |
| Romania | 442 | 0.1% |
| Russia | 538 | 0.1% |
| Saudi Arabia | 51 | 0.0% |
| Scotland | 178 | 0.0% |
| Senegal | 128 | 0.0% |
| Serbia | 196 | 0.0% |
| Singapore | 105 | 0.0% |
| Somalia | 29 | 0.0% |
| South Africa | 183 | 0.0% |
| South America | 5,914 | 0.9% |
| South Central Asia | 4,312 | 0.7% |
| South Eastern Asia | 20,519 | 3.2% |
| Southern Europe | 1,046 | 0.2% |
| Spain | 156 | 0.0% |
| Sri Lanka | 50 | 0.0% |
| Sudan | 29 | 0.0% |
| Sweden | 72 | 0.0% |
| Switzerland | 40 | 0.0% |
| Syria | 30 | 0.0% |
| Taiwan | 971 | 0.2% |
| Thailand | 954 | 0.2% |
| Trinidad and Tobago | 39 | 0.0% |
| Turkey | 189 | 0.0% |
| Uganda | 14 | 0.0% |
| Ukraine | 490 | 0.1% |
| Uruguay | 58 | 0.0% |
| Uzbekistan | 196 | 0.0% |
| Venezuela | 315 | 0.1% |
| Vietnam | 1,745 | 0.3% |
| West Indies | 19 | 0.0% |
| Western Africa | 468 | 0.1% |
| Western Asia | 3,024 | 0.5% |
| Western Europe | 2,426 | 0.4% |
| Zimbabwe | 111 | 0.0% | View All 126 Rows |
Sex and Age in Las Vegas
Sex and Age in Las Vegas
The most populous age groups in Las Vegas are 30 to 34 Years (24,175 | 7.4%) for men and 25 to 29 Years (22,988 | 7.2%) for women.
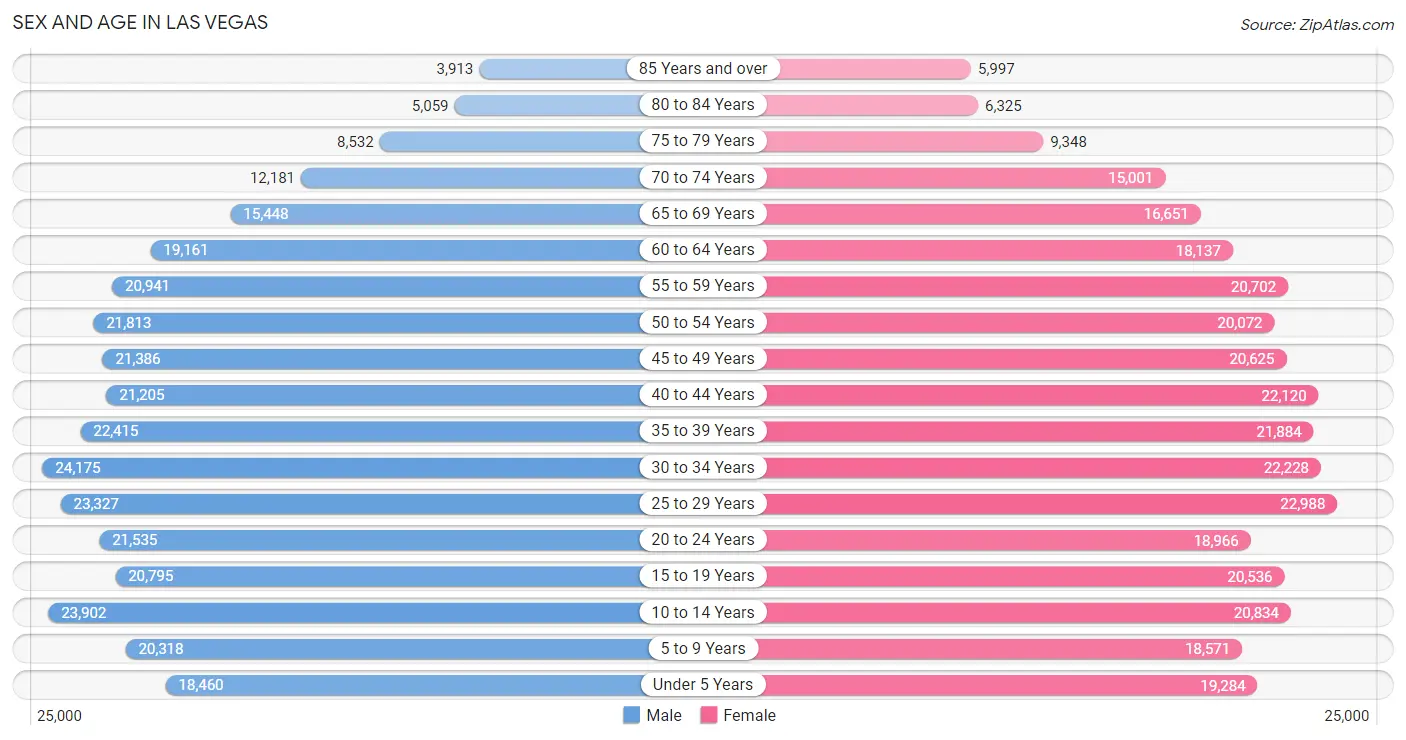
| Age Bracket | Male | Female |
| Under 5 Years | 18,460 (5.7%) | 19,284 (6.0%) |
| 5 to 9 Years | 20,318 (6.3%) | 18,571 (5.8%) |
| 10 to 14 Years | 23,902 (7.4%) | 20,834 (6.5%) |
| 15 to 19 Years | 20,795 (6.4%) | 20,536 (6.4%) |
| 20 to 24 Years | 21,535 (6.6%) | 18,966 (5.9%) |
| 25 to 29 Years | 23,327 (7.2%) | 22,988 (7.2%) |
| 30 to 34 Years | 24,175 (7.4%) | 22,228 (6.9%) |
| 35 to 39 Years | 22,415 (6.9%) | 21,884 (6.8%) |
| 40 to 44 Years | 21,205 (6.5%) | 22,120 (6.9%) |
| 45 to 49 Years | 21,386 (6.6%) | 20,625 (6.4%) |
| 50 to 54 Years | 21,813 (6.7%) | 20,072 (6.3%) |
| 55 to 59 Years | 20,941 (6.5%) | 20,702 (6.5%) |
| 60 to 64 Years | 19,161 (5.9%) | 18,137 (5.7%) |
| 65 to 69 Years | 15,448 (4.8%) | 16,651 (5.2%) |
| 70 to 74 Years | 12,181 (3.7%) | 15,001 (4.7%) |
| 75 to 79 Years | 8,532 (2.6%) | 9,348 (2.9%) |
| 80 to 84 Years | 5,059 (1.6%) | 6,325 (2.0%) |
| 85 Years and over | 3,913 (1.2%) | 5,997 (1.9%) |
| Total | 324,566 (100.0%) | 320,269 (100.0%) |
Families and Households in Las Vegas
Median Family Size in Las Vegas
The median family size in Las Vegas is 3.35 persons per family, with single female/mother families (34,313 | 22.9%) accounting for the largest median family size of 3.38 persons per family. On the other hand, single male/father families (15,906 | 10.6%) represent the smallest median family size with 3.20 persons per family.
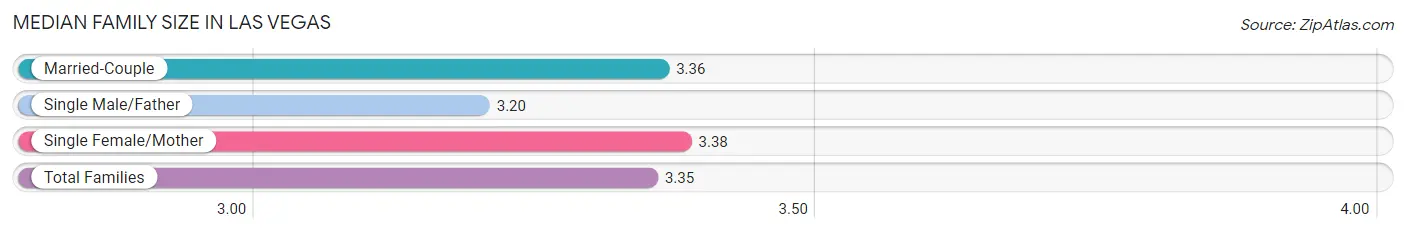
| Family Type | # Families | Family Size |
| Married-Couple | 99,589 (66.5%) | 3.36 |
| Single Male/Father | 15,906 (10.6%) | 3.20 |
| Single Female/Mother | 34,313 (22.9%) | 3.38 |
| Total Families | 149,808 (100.0%) | 3.35 |
Median Household Size in Las Vegas
The median household size in Las Vegas is 2.65 persons per household, with single female/mother households (34,313 | 14.3%) accounting for the largest median household size of 3.64 persons per household. non-family households (90,654 | 37.7%) represent the smallest median household size with 1.29 persons per household.
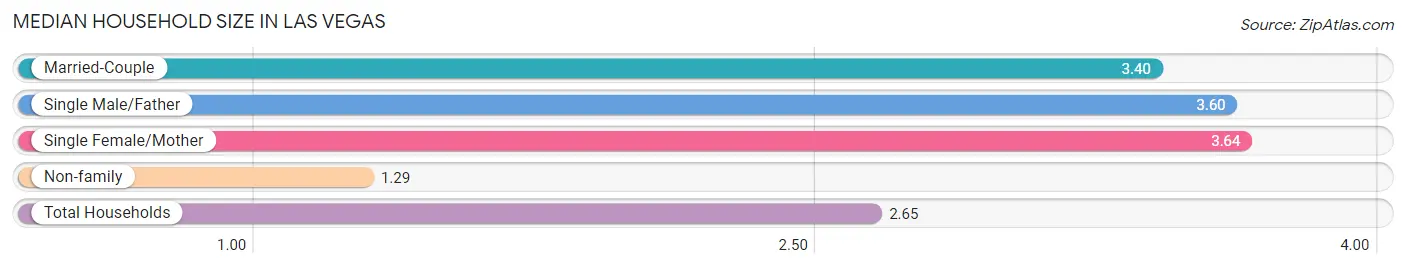
| Household Type | # Households | Household Size |
| Married-Couple | 99,589 (41.4%) | 3.40 |
| Single Male/Father | 15,906 (6.6%) | 3.60 |
| Single Female/Mother | 34,313 (14.3%) | 3.64 |
| Non-family | 90,654 (37.7%) | 1.29 |
| Total Households | 240,462 (100.0%) | 2.65 |
Household Size by Marriage Status in Las Vegas
Out of a total of 240,462 households in Las Vegas, 149,808 (62.3%) are family households, while 90,654 (37.7%) are nonfamily households. The most numerous type of family households are 2-person households, comprising 59,611, and the most common type of nonfamily households are 1-person households, comprising 72,781.
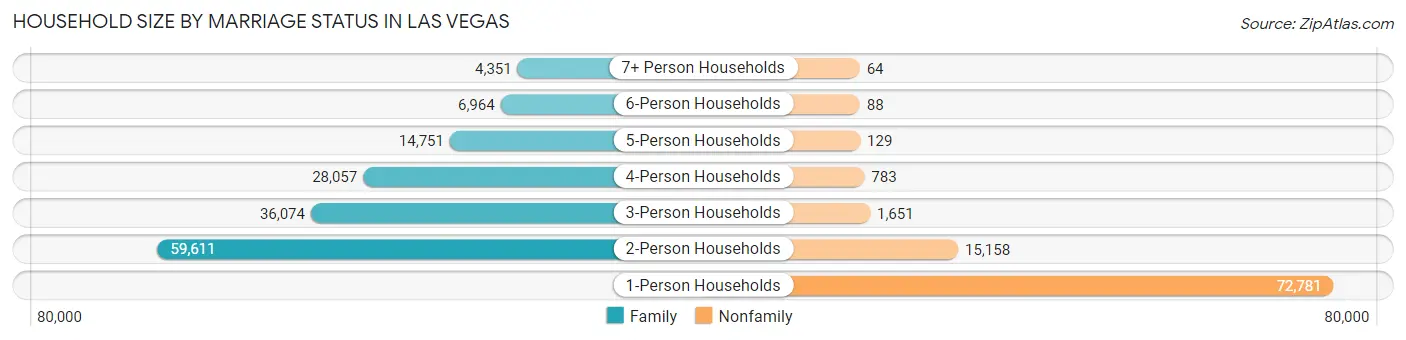
| Household Size | Family Households | Nonfamily Households |
| 1-Person Households | - | 72,781 (30.3%) |
| 2-Person Households | 59,611 (24.8%) | 15,158 (6.3%) |
| 3-Person Households | 36,074 (15.0%) | 1,651 (0.7%) |
| 4-Person Households | 28,057 (11.7%) | 783 (0.3%) |
| 5-Person Households | 14,751 (6.1%) | 129 (0.1%) |
| 6-Person Households | 6,964 (2.9%) | 88 (0.0%) |
| 7+ Person Households | 4,351 (1.8%) | 64 (0.0%) |
| Total | 149,808 (62.3%) | 90,654 (37.7%) |
Female Fertility in Las Vegas
Fertility by Age in Las Vegas
Average fertility rate in Las Vegas is 51.0 births per 1,000 women. Women in the age bracket of 20 to 34 years have the highest fertility rate with 86.0 births per 1,000 women. Women in the age bracket of 20 to 34 years acount for 70.1% of all women with births.
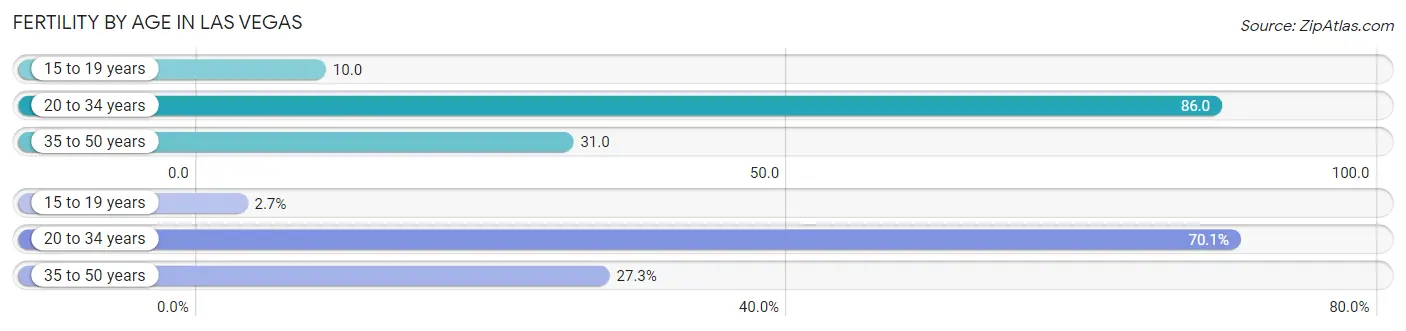
| Age Bracket | Women with Births | Births / 1,000 Women |
| 15 to 19 years | 211 (2.7%) | 10.0 |
| 20 to 34 years | 5,510 (70.1%) | 86.0 |
| 35 to 50 years | 2,143 (27.3%) | 31.0 |
| Total | 7,864 (100.0%) | 51.0 |
Fertility by Age by Marriage Status in Las Vegas
65.3% of women with births (7,864) in Las Vegas are married. The highest percentage of unmarried women with births falls into 15 to 19 years age bracket with 91.9% of them unmarried at the time of birth, while the lowest percentage of unmarried women with births belong to 20 to 34 years age bracket with 32.7% of them unmarried.
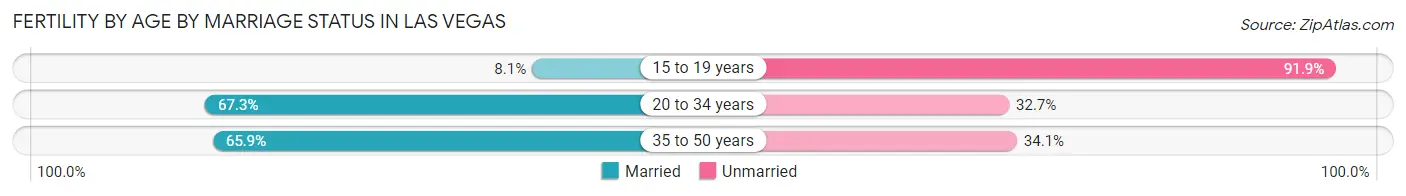
| Age Bracket | Married | Unmarried |
| 15 to 19 years | 17 (8.1%) | 194 (91.9%) |
| 20 to 34 years | 3,708 (67.3%) | 1,802 (32.7%) |
| 35 to 50 years | 1,412 (65.9%) | 731 (34.1%) |
| Total | 5,135 (65.3%) | 2,729 (34.7%) |
Fertility by Education in Las Vegas
Average fertility rate in Las Vegas is 51.0 births per 1,000 women. Women with the education attainment of graduate degree have the highest fertility rate of 66.0 births per 1,000 women, while women with the education attainment of less than high school have the lowest fertility at 40.0 births per 1,000 women. Women with the education attainment of college or associate's degree represent 29.7% of all women with births.
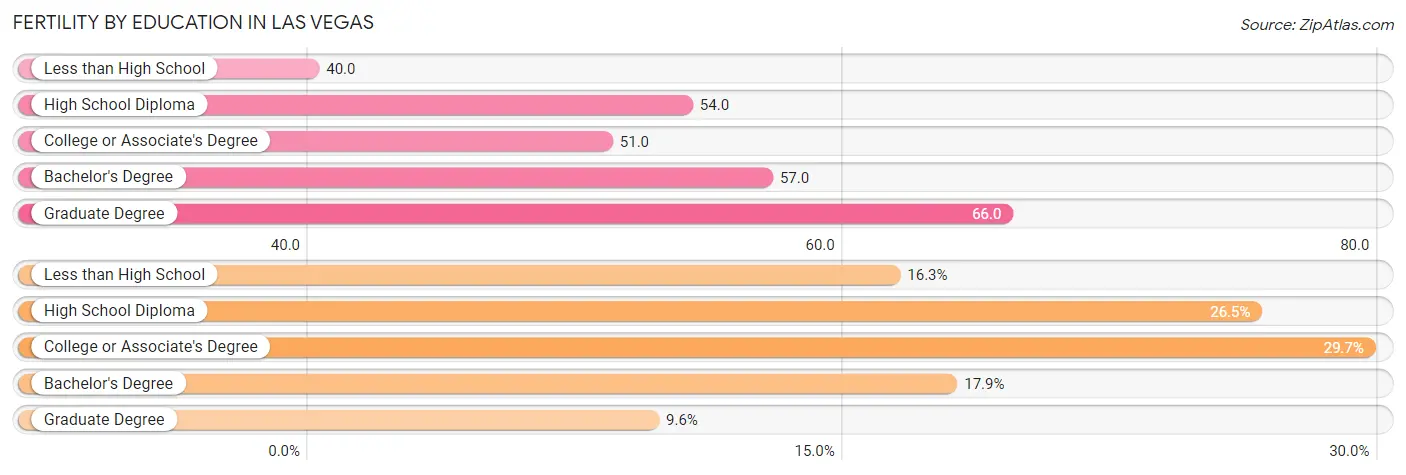
| Educational Attainment | Women with Births | Births / 1,000 Women |
| Less than High School | 1,284 (16.3%) | 40.0 |
| High School Diploma | 2,084 (26.5%) | 54.0 |
| College or Associate's Degree | 2,335 (29.7%) | 51.0 |
| Bachelor's Degree | 1,410 (17.9%) | 57.0 |
| Graduate Degree | 751 (9.6%) | 66.0 |
| Total | 7,864 (100.0%) | 51.0 |
Fertility by Education by Marriage Status in Las Vegas
34.7% of women with births in Las Vegas are unmarried. Women with the educational attainment of graduate degree are most likely to be married with 79.5% of them married at childbirth, while women with the educational attainment of high school diploma are least likely to be married with 50.8% of them unmarried at childbirth.
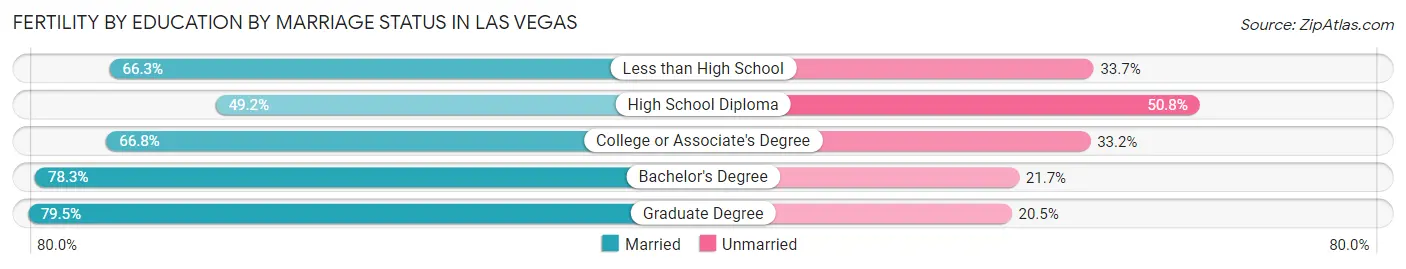
| Educational Attainment | Married | Unmarried |
| Less than High School | 851 (66.3%) | 433 (33.7%) |
| High School Diploma | 1,025 (49.2%) | 1,059 (50.8%) |
| College or Associate's Degree | 1,560 (66.8%) | 775 (33.2%) |
| Bachelor's Degree | 1,104 (78.3%) | 306 (21.7%) |
| Graduate Degree | 597 (79.5%) | 154 (20.5%) |
| Total | 5,135 (65.3%) | 2,729 (34.7%) |
Employment Characteristics in Las Vegas
Employment by Class of Employer in Las Vegas
Among the 290,898 employed individuals in Las Vegas, private company employees (216,845 | 74.5%), local government employees (17,918 | 6.2%), and self-employed (not incorporated) (16,659 | 5.7%) make up the most common classes of employment.
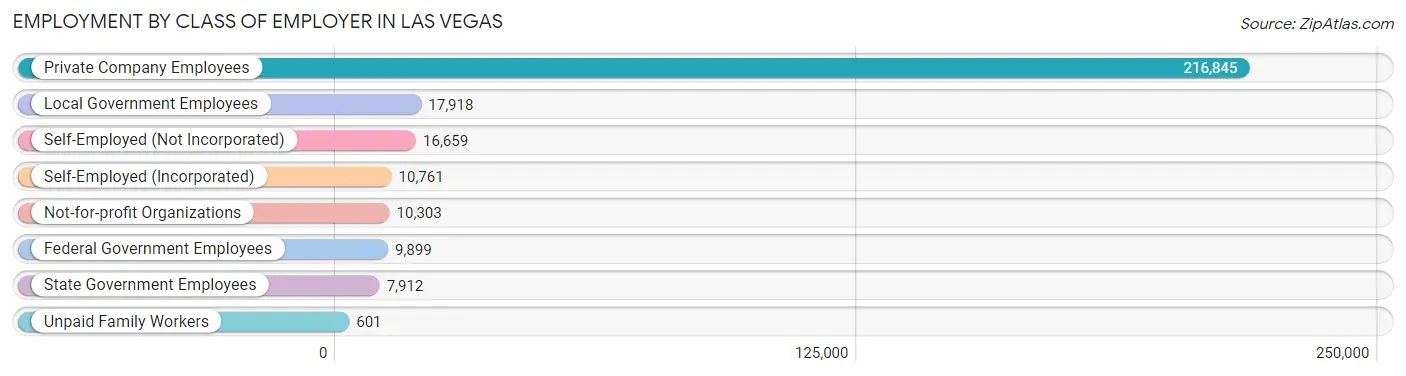
| Employer Class | # Employees | % Employees |
| Private Company Employees | 216,845 | 74.5% |
| Self-Employed (Incorporated) | 10,761 | 3.7% |
| Self-Employed (Not Incorporated) | 16,659 | 5.7% |
| Not-for-profit Organizations | 10,303 | 3.5% |
| Local Government Employees | 17,918 | 6.2% |
| State Government Employees | 7,912 | 2.7% |
| Federal Government Employees | 9,899 | 3.4% |
| Unpaid Family Workers | 601 | 0.2% |
| Total | 290,898 | 100.0% |
Employment Status by Age in Las Vegas
According to the labor force statistics for Las Vegas, out of the total population over 16 years of age (514,599), 62.6% or 322,139 individuals are in the labor force, with 7.4% or 23,838 of them unemployed. The age group with the highest labor force participation rate is 30 to 34 years, with 82.0% or 38,050 individuals in the labor force. Within the labor force, the 16 to 19 years age range has the highest percentage of unemployed individuals, with 18.3% or 2,311 of them being unemployed.
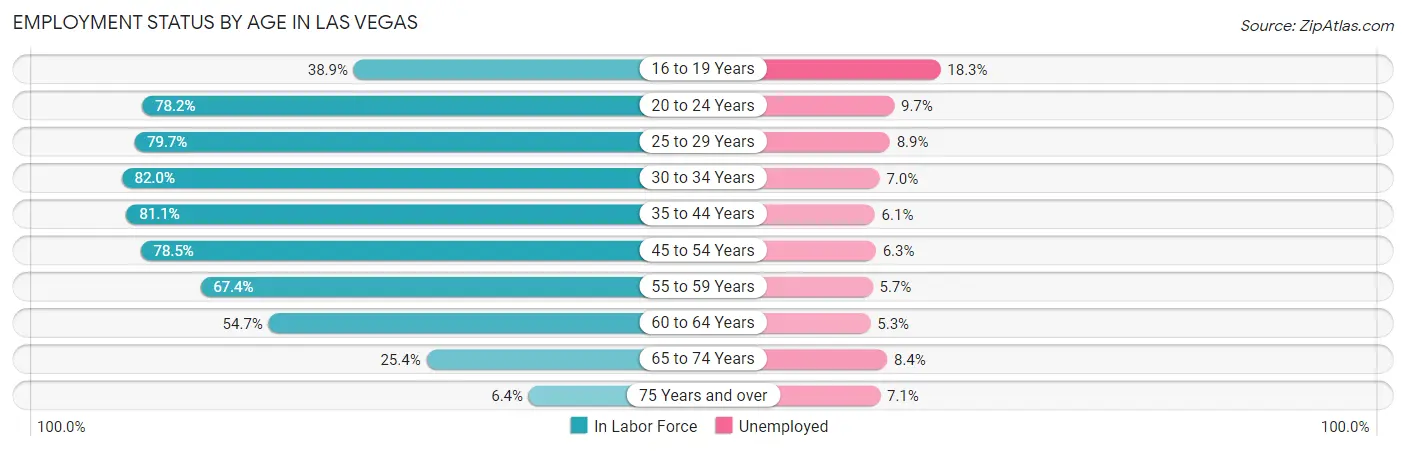
| Age Bracket | In Labor Force | Unemployed |
| 16 to 19 Years | 12,628 (38.9%) | 2,311 (18.3%) |
| 20 to 24 Years | 31,672 (78.2%) | 3,072 (9.7%) |
| 25 to 29 Years | 36,913 (79.7%) | 3,285 (8.9%) |
| 30 to 34 Years | 38,050 (82.0%) | 2,664 (7.0%) |
| 35 to 44 Years | 71,063 (81.1%) | 4,335 (6.1%) |
| 45 to 54 Years | 65,858 (78.5%) | 4,149 (6.3%) |
| 55 to 59 Years | 28,067 (67.4%) | 1,600 (5.7%) |
| 60 to 64 Years | 20,402 (54.7%) | 1,081 (5.3%) |
| 65 to 74 Years | 15,057 (25.4%) | 1,265 (8.4%) |
| 75 Years and over | 2,507 (6.4%) | 178 (7.1%) |
| Total | 322,139 (62.6%) | 23,838 (7.4%) |
Employment Status by Educational Attainment in Las Vegas
According to labor force statistics for Las Vegas, 75.9% of individuals (260,473) out of the total population between 25 and 64 years of age (343,179) are in the labor force, with 6.6% or 17,191 of them being unemployed. The group with the highest labor force participation rate are those with the educational attainment of bachelor's degree or higher, with 83.6% or 75,145 individuals in the labor force. Within the labor force, individuals with less than high school education have the highest percentage of unemployment, with 7.9% or 2,612 of them being unemployed.
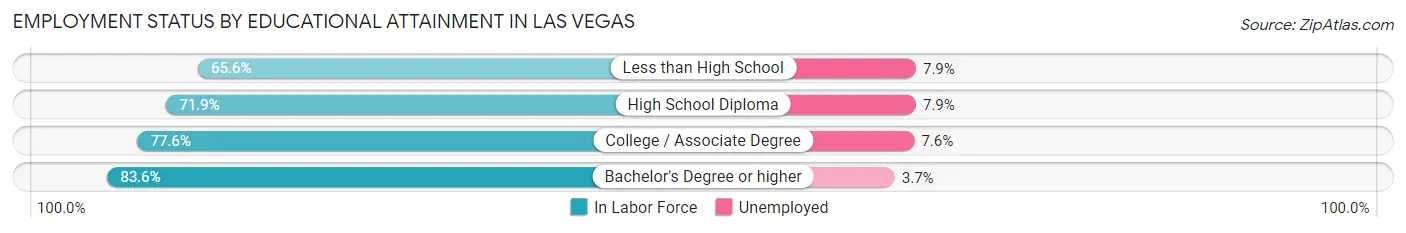
| Educational Attainment | In Labor Force | Unemployed |
| Less than High School | 33,060 (65.6%) | 3,981 (7.9%) |
| High School Diploma | 67,088 (71.9%) | 7,371 (7.9%) |
| College / Associate Degree | 85,040 (77.6%) | 8,329 (7.6%) |
| Bachelor's Degree or higher | 75,145 (83.6%) | 3,326 (3.7%) |
| Total | 260,473 (75.9%) | 22,650 (6.6%) |
Employment Occupations by Sex in Las Vegas
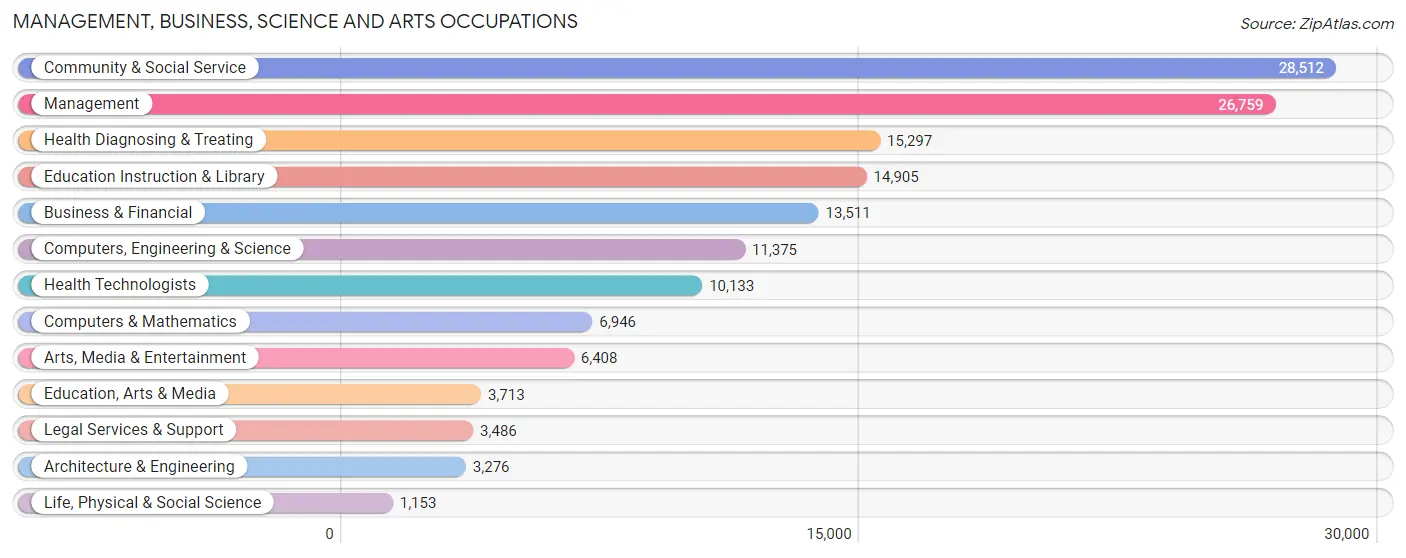
Management, Business, Science and Arts Occupations
The most common Management, Business, Science and Arts occupations in Las Vegas are Community & Social Service (28,512 | 9.7%), Management (26,759 | 9.1%), Health Diagnosing & Treating (15,297 | 5.2%), Education Instruction & Library (14,905 | 5.1%), and Business & Financial (13,511 | 4.6%).
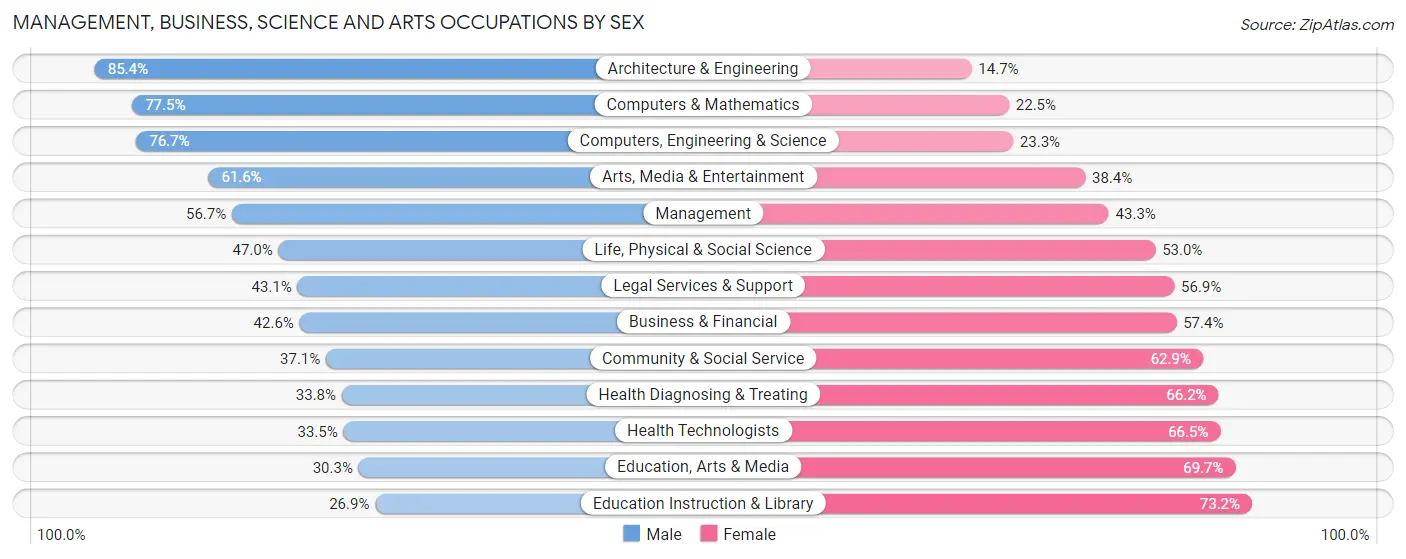
Management, Business, Science and Arts Occupations by Sex
Within the Management, Business, Science and Arts occupations in Las Vegas, the most male-oriented occupations are Architecture & Engineering (85.4%), Computers & Mathematics (77.5%), and Computers, Engineering & Science (76.7%), while the most female-oriented occupations are Education Instruction & Library (73.2%), Education, Arts & Media (69.7%), and Health Technologists (66.5%).
| Occupation | Male | Female |
| Management | 15,177 (56.7%) | 11,582 (43.3%) |
| Business & Financial | 5,758 (42.6%) | 7,753 (57.4%) |
| Computers, Engineering & Science | 8,724 (76.7%) | 2,651 (23.3%) |
| Computers & Mathematics | 5,386 (77.5%) | 1,560 (22.5%) |
| Architecture & Engineering | 2,796 (85.4%) | 480 (14.6%) |
| Life, Physical & Social Science | 542 (47.0%) | 611 (53.0%) |
| Community & Social Service | 10,578 (37.1%) | 17,934 (62.9%) |
| Education, Arts & Media | 1,125 (30.3%) | 2,588 (69.7%) |
| Legal Services & Support | 1,501 (43.1%) | 1,985 (56.9%) |
| Education Instruction & Library | 4,002 (26.9%) | 10,903 (73.2%) |
| Arts, Media & Entertainment | 3,950 (61.6%) | 2,458 (38.4%) |
| Health Diagnosing & Treating | 5,173 (33.8%) | 10,124 (66.2%) |
| Health Technologists | 3,390 (33.5%) | 6,743 (66.5%) |
| Total (Category) | 45,410 (47.6%) | 50,044 (52.4%) |
| Total (Overall) | 158,770 (53.8%) | 136,256 (46.2%) |
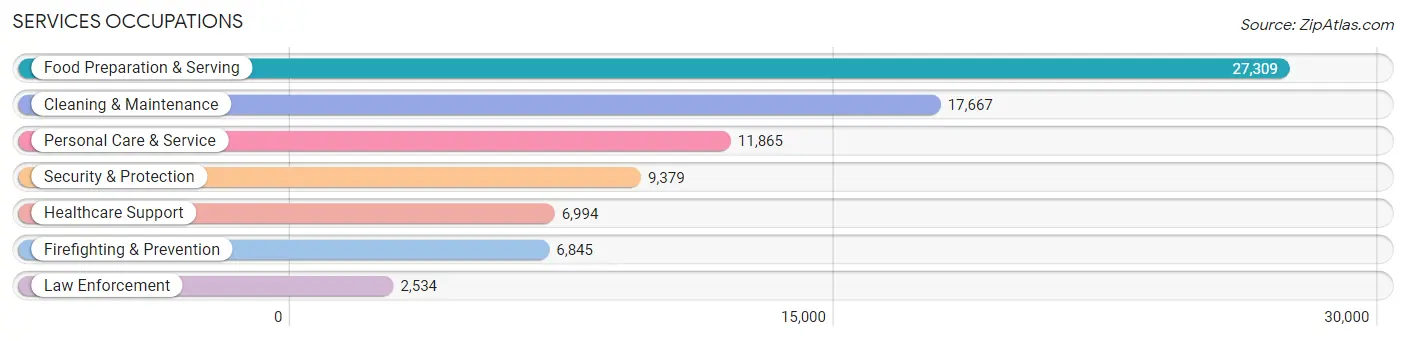
Services Occupations
The most common Services occupations in Las Vegas are Food Preparation & Serving (27,309 | 9.3%), Cleaning & Maintenance (17,667 | 6.0%), Personal Care & Service (11,865 | 4.0%), Security & Protection (9,379 | 3.2%), and Healthcare Support (6,994 | 2.4%).
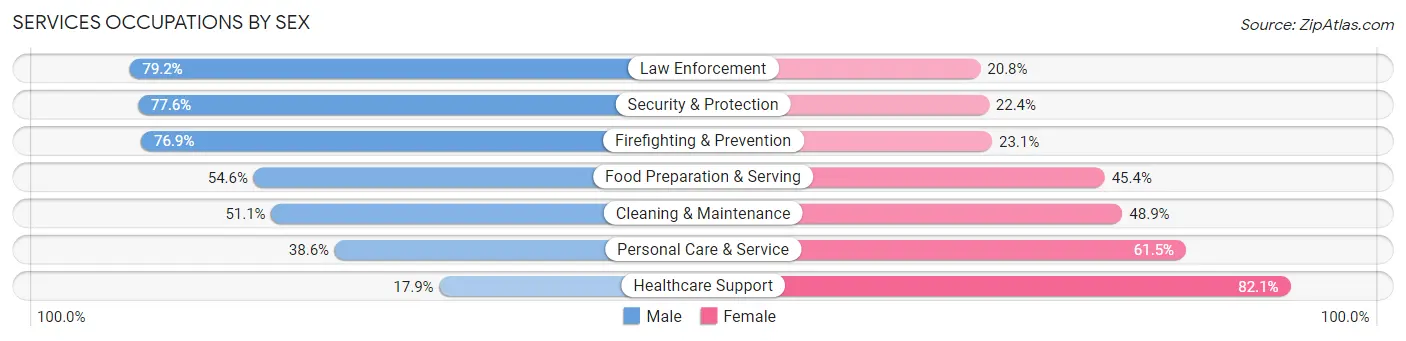
Services Occupations by Sex
Within the Services occupations in Las Vegas, the most male-oriented occupations are Law Enforcement (79.2%), Security & Protection (77.6%), and Firefighting & Prevention (76.9%), while the most female-oriented occupations are Healthcare Support (82.1%), Personal Care & Service (61.5%), and Cleaning & Maintenance (48.9%).
| Occupation | Male | Female |
| Healthcare Support | 1,249 (17.9%) | 5,745 (82.1%) |
| Security & Protection | 7,274 (77.6%) | 2,105 (22.4%) |
| Firefighting & Prevention | 5,266 (76.9%) | 1,579 (23.1%) |
| Law Enforcement | 2,008 (79.2%) | 526 (20.8%) |
| Food Preparation & Serving | 14,916 (54.6%) | 12,393 (45.4%) |
| Cleaning & Maintenance | 9,032 (51.1%) | 8,635 (48.9%) |
| Personal Care & Service | 4,574 (38.6%) | 7,291 (61.5%) |
| Total (Category) | 37,045 (50.6%) | 36,169 (49.4%) |
| Total (Overall) | 158,770 (53.8%) | 136,256 (46.2%) |
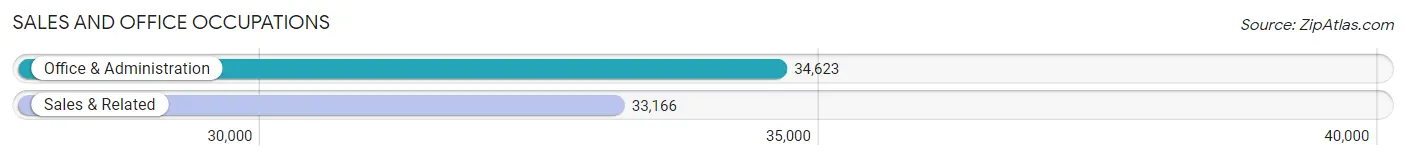
Sales and Office Occupations
The most common Sales and Office occupations in Las Vegas are Office & Administration (34,623 | 11.7%), and Sales & Related (33,166 | 11.2%).
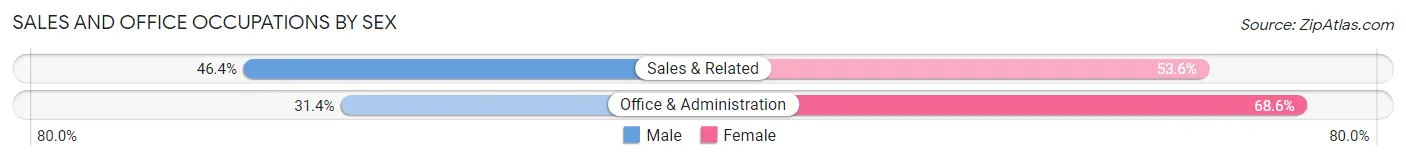
Sales and Office Occupations by Sex
| Occupation | Male | Female |
| Sales & Related | 15,400 (46.4%) | 17,766 (53.6%) |
| Office & Administration | 10,882 (31.4%) | 23,741 (68.6%) |
| Total (Category) | 26,282 (38.8%) | 41,507 (61.2%) |
| Total (Overall) | 158,770 (53.8%) | 136,256 (46.2%) |
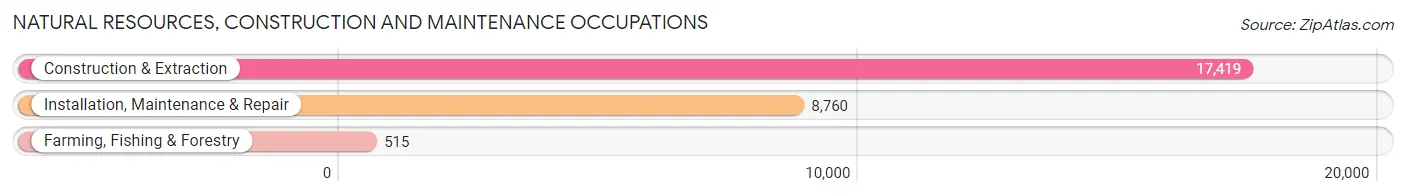
Natural Resources, Construction and Maintenance Occupations
The most common Natural Resources, Construction and Maintenance occupations in Las Vegas are Construction & Extraction (17,419 | 5.9%), Installation, Maintenance & Repair (8,760 | 3.0%), and Farming, Fishing & Forestry (515 | 0.2%).
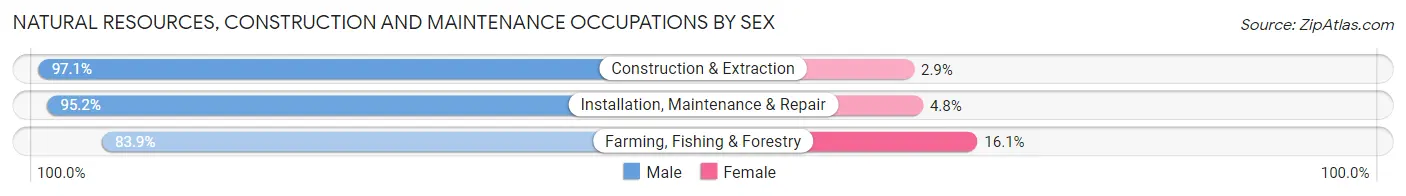
Natural Resources, Construction and Maintenance Occupations by Sex
| Occupation | Male | Female |
| Farming, Fishing & Forestry | 432 (83.9%) | 83 (16.1%) |
| Construction & Extraction | 16,907 (97.1%) | 512 (2.9%) |
| Installation, Maintenance & Repair | 8,340 (95.2%) | 420 (4.8%) |
| Total (Category) | 25,679 (96.2%) | 1,015 (3.8%) |
| Total (Overall) | 158,770 (53.8%) | 136,256 (46.2%) |
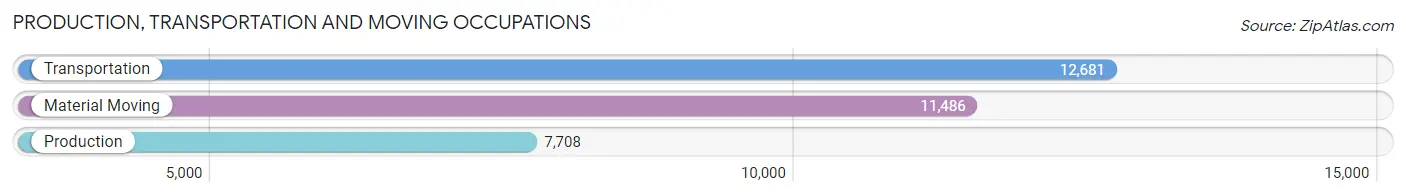
Production, Transportation and Moving Occupations
The most common Production, Transportation and Moving occupations in Las Vegas are Transportation (12,681 | 4.3%), Material Moving (11,486 | 3.9%), and Production (7,708 | 2.6%).
Production, Transportation and Moving Occupations by Sex

| Occupation | Male | Female |
| Production | 5,305 (68.8%) | 2,403 (31.2%) |
| Transportation | 10,503 (82.8%) | 2,178 (17.2%) |
| Material Moving | 8,546 (74.4%) | 2,940 (25.6%) |
| Total (Category) | 24,354 (76.4%) | 7,521 (23.6%) |
| Total (Overall) | 158,770 (53.8%) | 136,256 (46.2%) |
Employment Industries by Sex in Las Vegas
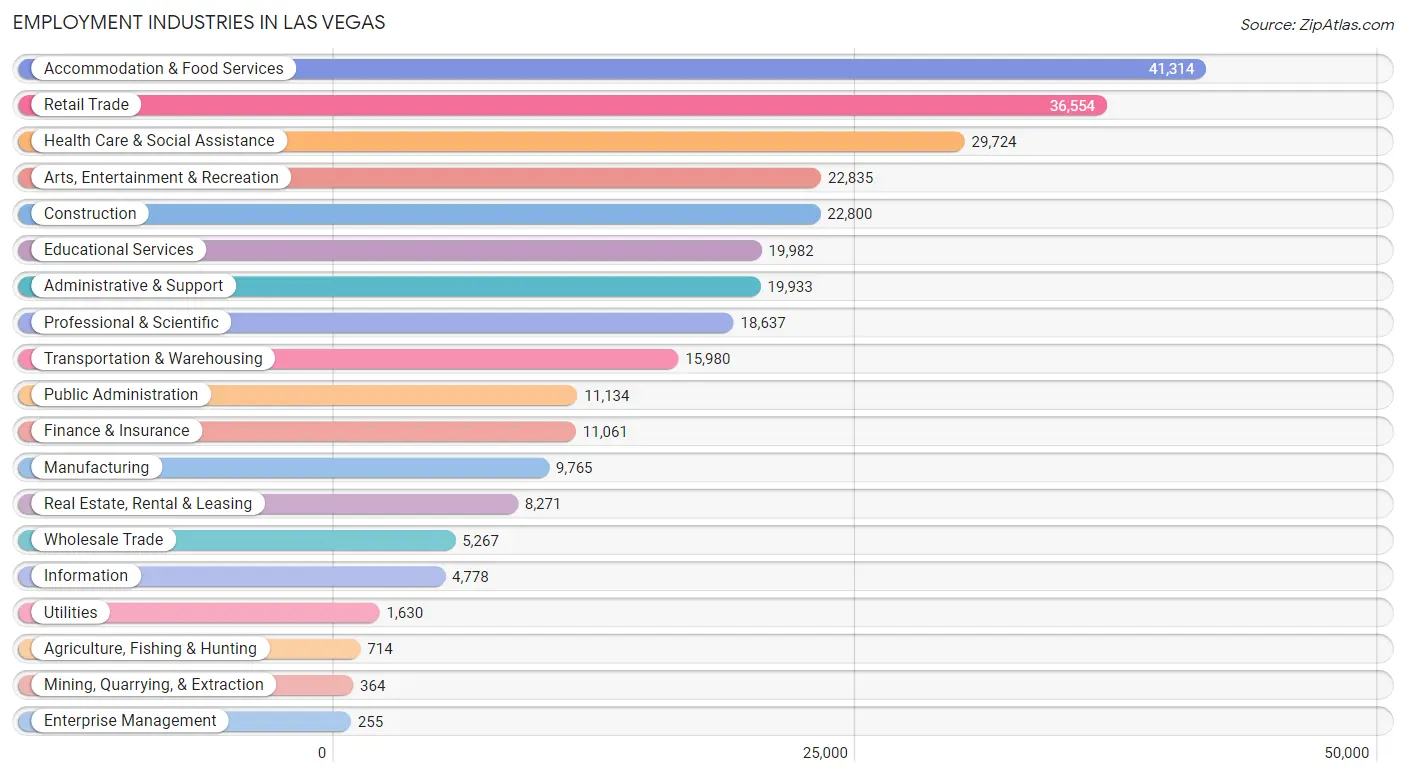
Employment Industries in Las Vegas
The major employment industries in Las Vegas include Accommodation & Food Services (41,314 | 14.0%), Retail Trade (36,554 | 12.4%), Health Care & Social Assistance (29,724 | 10.1%), Arts, Entertainment & Recreation (22,835 | 7.7%), and Construction (22,800 | 7.7%).
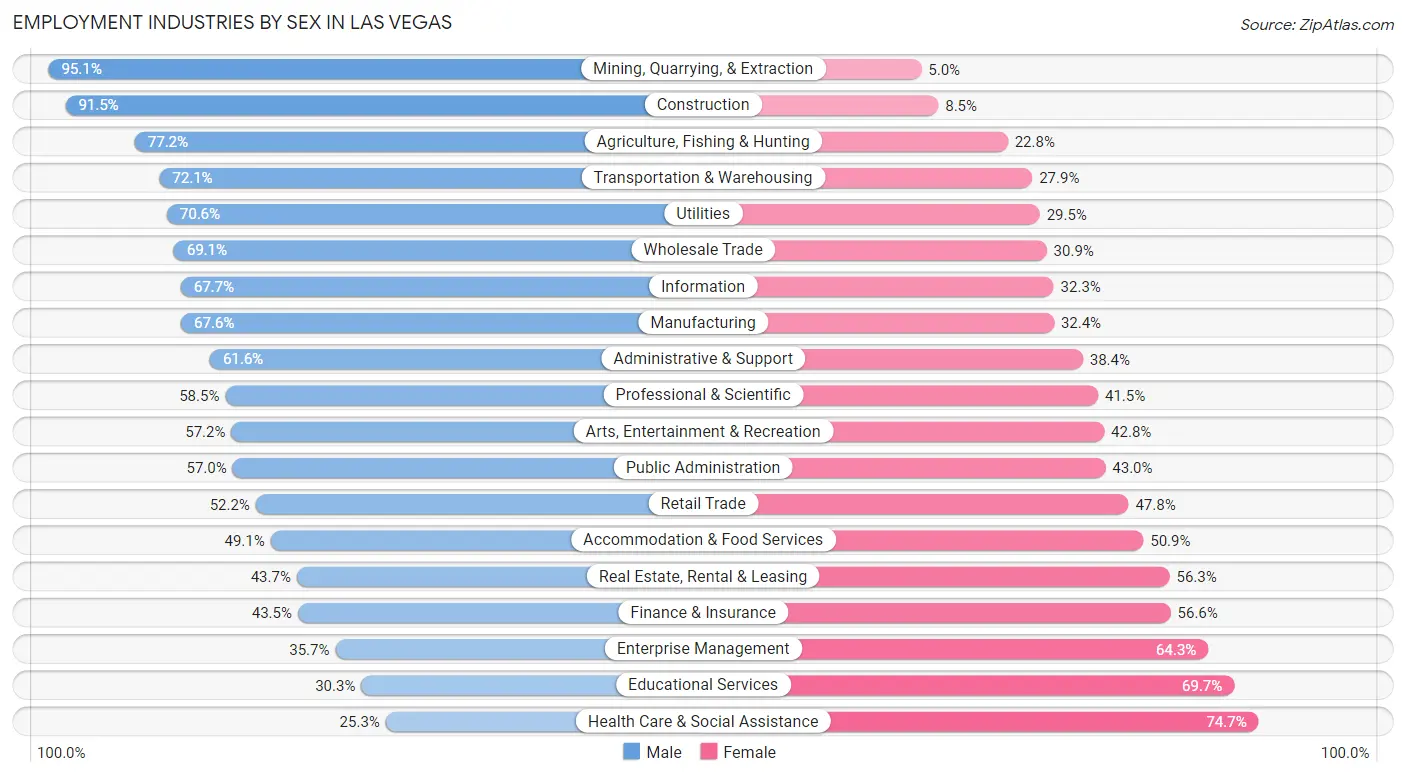
Employment Industries by Sex in Las Vegas
The Las Vegas industries that see more men than women are Mining, Quarrying, & Extraction (95.1%), Construction (91.5%), and Agriculture, Fishing & Hunting (77.2%), whereas the industries that tend to have a higher number of women are Health Care & Social Assistance (74.7%), Educational Services (69.7%), and Enterprise Management (64.3%).
| Industry | Male | Female |
| Agriculture, Fishing & Hunting | 551 (77.2%) | 163 (22.8%) |
| Mining, Quarrying, & Extraction | 346 (95.1%) | 18 (5.0%) |
| Construction | 20,870 (91.5%) | 1,930 (8.5%) |
| Manufacturing | 6,601 (67.6%) | 3,164 (32.4%) |
| Wholesale Trade | 3,640 (69.1%) | 1,627 (30.9%) |
| Retail Trade | 19,070 (52.2%) | 17,484 (47.8%) |
| Transportation & Warehousing | 11,520 (72.1%) | 4,460 (27.9%) |
| Utilities | 1,150 (70.6%) | 480 (29.4%) |
| Information | 3,233 (67.7%) | 1,545 (32.3%) |
| Finance & Insurance | 4,806 (43.4%) | 6,255 (56.6%) |
| Real Estate, Rental & Leasing | 3,612 (43.7%) | 4,659 (56.3%) |
| Professional & Scientific | 10,897 (58.5%) | 7,740 (41.5%) |
| Enterprise Management | 91 (35.7%) | 164 (64.3%) |
| Administrative & Support | 12,285 (61.6%) | 7,648 (38.4%) |
| Educational Services | 6,058 (30.3%) | 13,924 (69.7%) |
| Health Care & Social Assistance | 7,511 (25.3%) | 22,213 (74.7%) |
| Arts, Entertainment & Recreation | 13,065 (57.2%) | 9,770 (42.8%) |
| Accommodation & Food Services | 20,286 (49.1%) | 21,028 (50.9%) |
| Public Administration | 6,342 (57.0%) | 4,792 (43.0%) |
| Total | 158,770 (53.8%) | 136,256 (46.2%) |
Education in Las Vegas
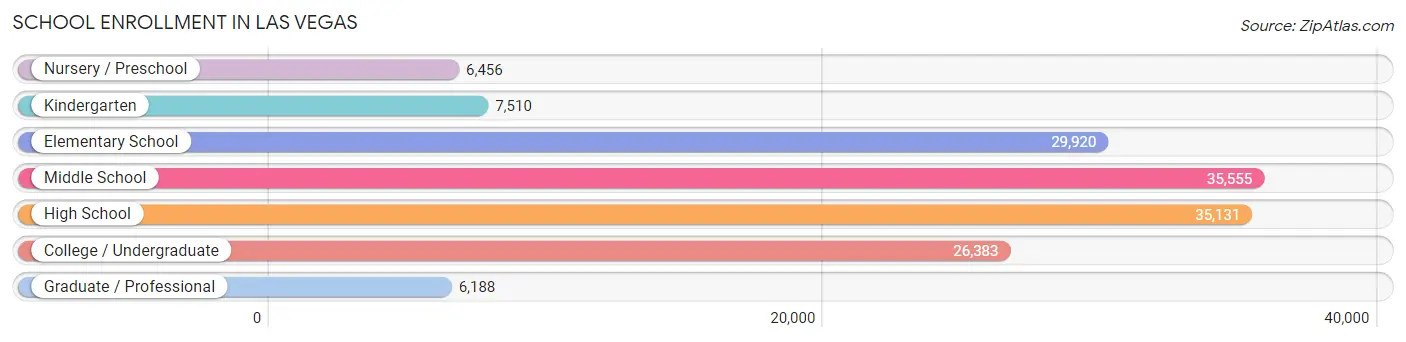
School Enrollment in Las Vegas
The most common levels of schooling among the 147,143 students in Las Vegas are middle school (35,555 | 24.2%), high school (35,131 | 23.9%), and elementary school (29,920 | 20.3%).
| School Level | # Students | % Students |
| Nursery / Preschool | 6,456 | 4.4% |
| Kindergarten | 7,510 | 5.1% |
| Elementary School | 29,920 | 20.3% |
| Middle School | 35,555 | 24.2% |
| High School | 35,131 | 23.9% |
| College / Undergraduate | 26,383 | 17.9% |
| Graduate / Professional | 6,188 | 4.2% |
| Total | 147,143 | 100.0% |
School Enrollment by Age by Funding Source in Las Vegas
Out of a total of 147,143 students who are enrolled in schools in Las Vegas, 19,864 (13.5%) attend a private institution, while the remaining 127,279 (86.5%) are enrolled in public schools. The age group of 35 years and over has the highest likelihood of being enrolled in private schools, with 3,198 (34.1% in the age bracket) enrolled. Conversely, the age group of 18 to 19 year olds has the lowest likelihood of being enrolled in a private school, with 7,888 (92.3% in the age bracket) attending a public institution.
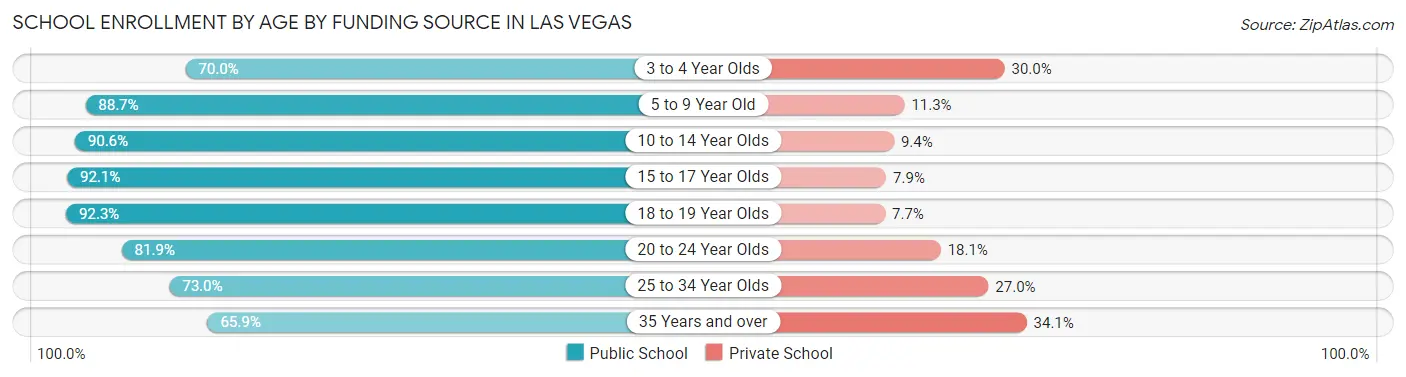
| Age Bracket | Public School | Private School |
| 3 to 4 Year Olds | 3,692 (70.0%) | 1,579 (30.0%) |
| 5 to 9 Year Old | 31,846 (88.7%) | 4,067 (11.3%) |
| 10 to 14 Year Olds | 39,319 (90.6%) | 4,065 (9.4%) |
| 15 to 17 Year Olds | 23,345 (92.1%) | 2,004 (7.9%) |
| 18 to 19 Year Olds | 7,888 (92.3%) | 659 (7.7%) |
| 20 to 24 Year Olds | 8,372 (81.9%) | 1,847 (18.1%) |
| 25 to 34 Year Olds | 6,627 (73.0%) | 2,446 (27.0%) |
| 35 Years and over | 6,189 (65.9%) | 3,198 (34.1%) |
| Total | 127,279 (86.5%) | 19,864 (13.5%) |
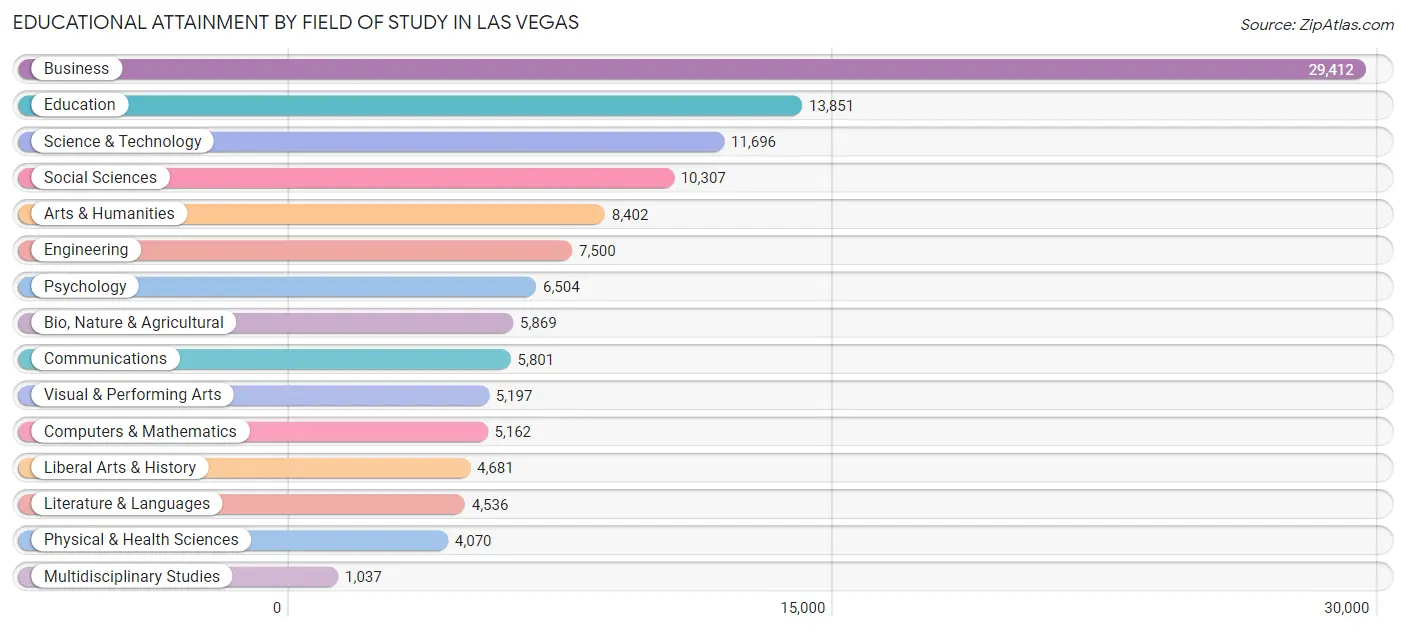
Educational Attainment by Field of Study in Las Vegas
Business (29,412 | 23.7%), education (13,851 | 11.2%), science & technology (11,696 | 9.4%), social sciences (10,307 | 8.3%), and arts & humanities (8,402 | 6.8%) are the most common fields of study among 124,025 individuals in Las Vegas who have obtained a bachelor's degree or higher.
| Field of Study | # Graduates | % Graduates |
| Computers & Mathematics | 5,162 | 4.2% |
| Bio, Nature & Agricultural | 5,869 | 4.7% |
| Physical & Health Sciences | 4,070 | 3.3% |
| Psychology | 6,504 | 5.2% |
| Social Sciences | 10,307 | 8.3% |
| Engineering | 7,500 | 6.0% |
| Multidisciplinary Studies | 1,037 | 0.8% |
| Science & Technology | 11,696 | 9.4% |
| Business | 29,412 | 23.7% |
| Education | 13,851 | 11.2% |
| Literature & Languages | 4,536 | 3.7% |
| Liberal Arts & History | 4,681 | 3.8% |
| Visual & Performing Arts | 5,197 | 4.2% |
| Communications | 5,801 | 4.7% |
| Arts & Humanities | 8,402 | 6.8% |
| Total | 124,025 | 100.0% |
Transportation & Commute in Las Vegas
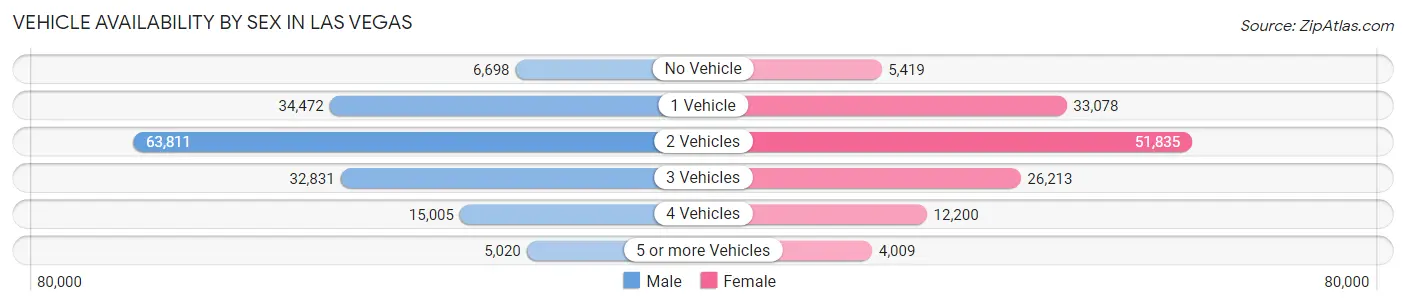
Vehicle Availability by Sex in Las Vegas
The most prevalent vehicle ownership categories in Las Vegas are males with 2 vehicles (63,811, accounting for 40.4%) and females with 2 vehicles (51,835, making up 48.1%).
| Vehicles Available | Male | Female |
| No Vehicle | 6,698 (4.2%) | 5,419 (4.1%) |
| 1 Vehicle | 34,472 (21.8%) | 33,078 (24.9%) |
| 2 Vehicles | 63,811 (40.4%) | 51,835 (39.1%) |
| 3 Vehicles | 32,831 (20.8%) | 26,213 (19.8%) |
| 4 Vehicles | 15,005 (9.5%) | 12,200 (9.2%) |
| 5 or more Vehicles | 5,020 (3.2%) | 4,009 (3.0%) |
| Total | 157,837 (100.0%) | 132,754 (100.0%) |
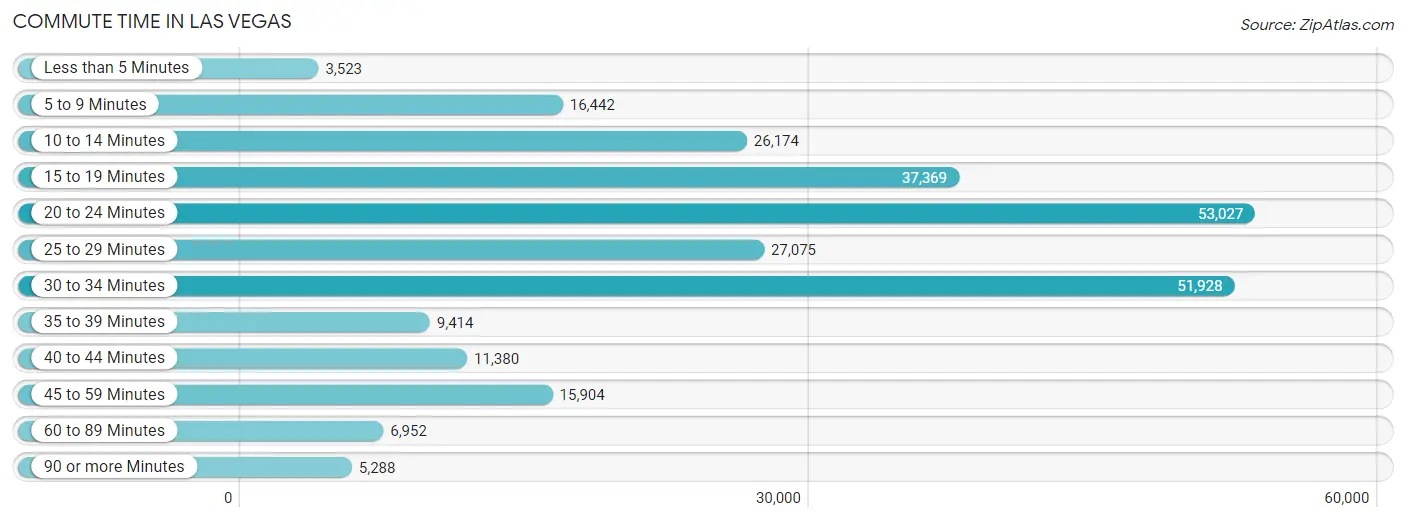
Commute Time in Las Vegas
The most frequently occuring commute durations in Las Vegas are 20 to 24 minutes (53,027 commuters, 20.1%), 30 to 34 minutes (51,928 commuters, 19.6%), and 15 to 19 minutes (37,369 commuters, 14.1%).
| Commute Time | # Commuters | % Commuters |
| Less than 5 Minutes | 3,523 | 1.3% |
| 5 to 9 Minutes | 16,442 | 6.2% |
| 10 to 14 Minutes | 26,174 | 9.9% |
| 15 to 19 Minutes | 37,369 | 14.1% |
| 20 to 24 Minutes | 53,027 | 20.1% |
| 25 to 29 Minutes | 27,075 | 10.2% |
| 30 to 34 Minutes | 51,928 | 19.6% |
| 35 to 39 Minutes | 9,414 | 3.6% |
| 40 to 44 Minutes | 11,380 | 4.3% |
| 45 to 59 Minutes | 15,904 | 6.0% |
| 60 to 89 Minutes | 6,952 | 2.6% |
| 90 or more Minutes | 5,288 | 2.0% |
Commute Time by Sex in Las Vegas
The most common commute times in Las Vegas are 30 to 34 minutes (30,770 commuters, 21.2%) for males and 20 to 24 minutes (23,489 commuters, 19.7%) for females.
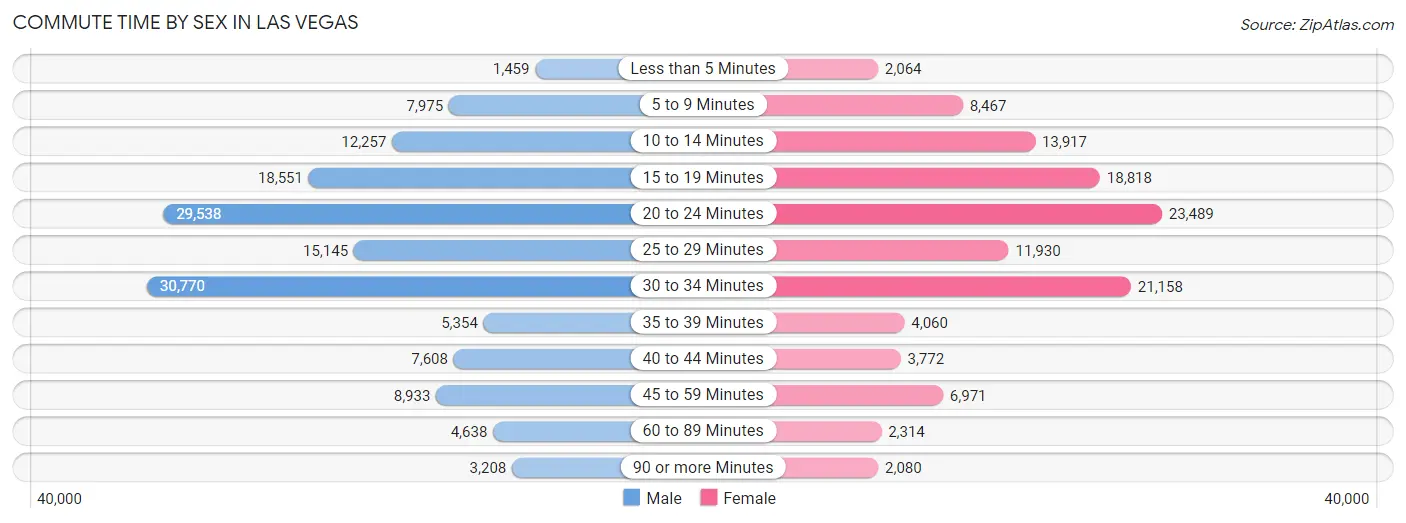
| Commute Time | Male | Female |
| Less than 5 Minutes | 1,459 (1.0%) | 2,064 (1.7%) |
| 5 to 9 Minutes | 7,975 (5.5%) | 8,467 (7.1%) |
| 10 to 14 Minutes | 12,257 (8.4%) | 13,917 (11.7%) |
| 15 to 19 Minutes | 18,551 (12.8%) | 18,818 (15.8%) |
| 20 to 24 Minutes | 29,538 (20.3%) | 23,489 (19.7%) |
| 25 to 29 Minutes | 15,145 (10.4%) | 11,930 (10.0%) |
| 30 to 34 Minutes | 30,770 (21.2%) | 21,158 (17.8%) |
| 35 to 39 Minutes | 5,354 (3.7%) | 4,060 (3.4%) |
| 40 to 44 Minutes | 7,608 (5.2%) | 3,772 (3.2%) |
| 45 to 59 Minutes | 8,933 (6.1%) | 6,971 (5.9%) |
| 60 to 89 Minutes | 4,638 (3.2%) | 2,314 (1.9%) |
| 90 or more Minutes | 3,208 (2.2%) | 2,080 (1.8%) |
Time of Departure to Work by Sex in Las Vegas
The most frequent times of departure to work in Las Vegas are 7:00 AM to 7:29 AM (16,449, 11.3%) for males and 7:00 AM to 7:29 AM (15,922, 13.4%) for females.
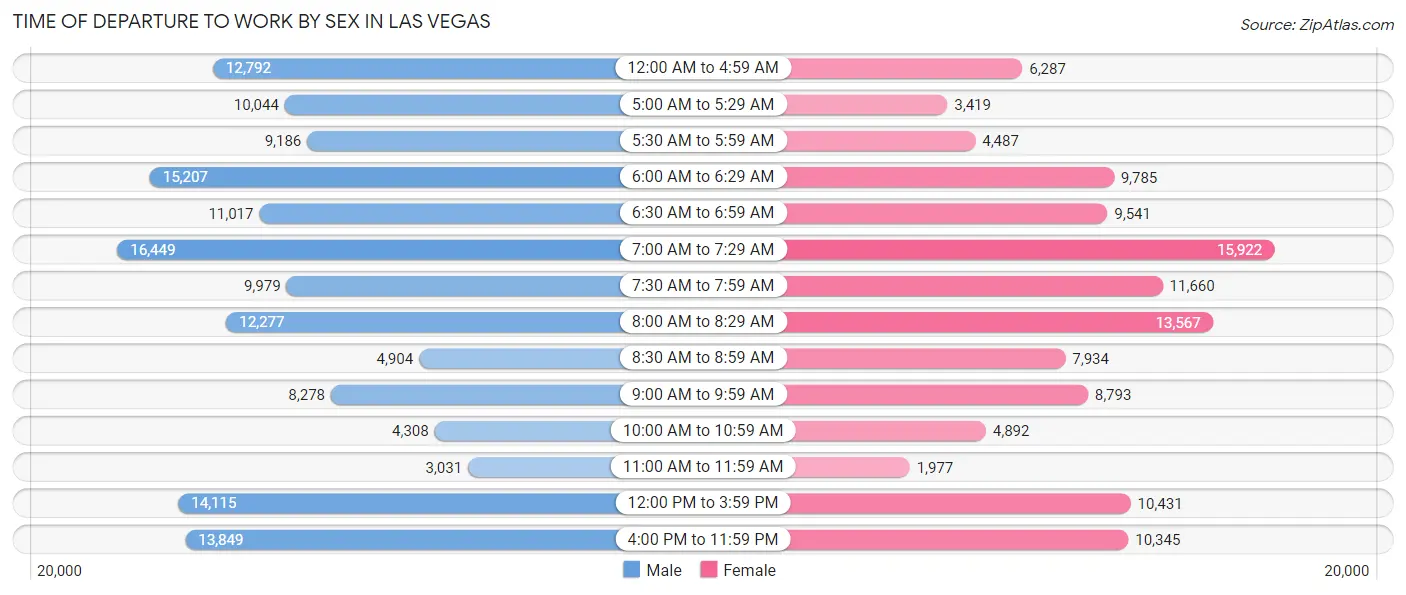
| Time of Departure | Male | Female |
| 12:00 AM to 4:59 AM | 12,792 (8.8%) | 6,287 (5.3%) |
| 5:00 AM to 5:29 AM | 10,044 (6.9%) | 3,419 (2.9%) |
| 5:30 AM to 5:59 AM | 9,186 (6.3%) | 4,487 (3.8%) |
| 6:00 AM to 6:29 AM | 15,207 (10.5%) | 9,785 (8.2%) |
| 6:30 AM to 6:59 AM | 11,017 (7.6%) | 9,541 (8.0%) |
| 7:00 AM to 7:29 AM | 16,449 (11.3%) | 15,922 (13.4%) |
| 7:30 AM to 7:59 AM | 9,979 (6.9%) | 11,660 (9.8%) |
| 8:00 AM to 8:29 AM | 12,277 (8.4%) | 13,567 (11.4%) |
| 8:30 AM to 8:59 AM | 4,904 (3.4%) | 7,934 (6.7%) |
| 9:00 AM to 9:59 AM | 8,278 (5.7%) | 8,793 (7.4%) |
| 10:00 AM to 10:59 AM | 4,308 (3.0%) | 4,892 (4.1%) |
| 11:00 AM to 11:59 AM | 3,031 (2.1%) | 1,977 (1.7%) |
| 12:00 PM to 3:59 PM | 14,115 (9.7%) | 10,431 (8.8%) |
| 4:00 PM to 11:59 PM | 13,849 (9.5%) | 10,345 (8.7%) |
| Total | 145,436 (100.0%) | 119,040 (100.0%) |
Housing Occupancy in Las Vegas
Occupancy by Ownership in Las Vegas
Of the total 240,462 dwellings in Las Vegas, owner-occupied units account for 131,837 (54.8%), while renter-occupied units make up 108,625 (45.2%).
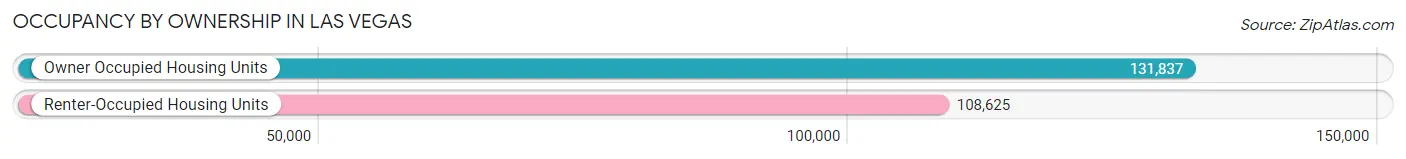
| Occupancy | # Housing Units | % Housing Units |
| Owner Occupied Housing Units | 131,837 | 54.8% |
| Renter-Occupied Housing Units | 108,625 | 45.2% |
| Total Occupied Housing Units | 240,462 | 100.0% |
Occupancy by Household Size in Las Vegas
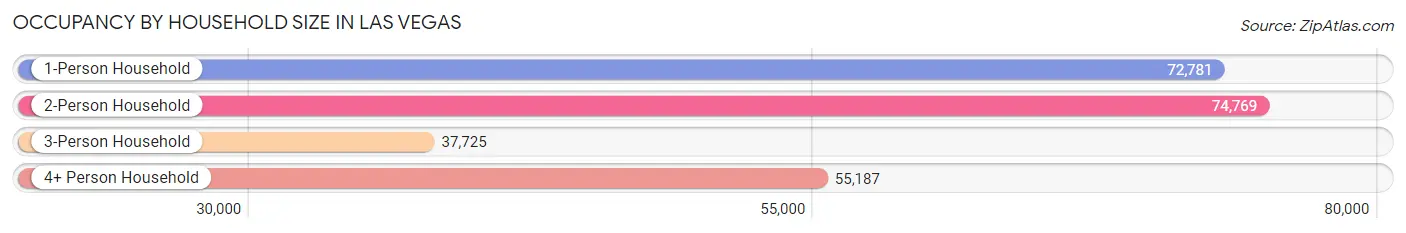
| Household Size | # Housing Units | % Housing Units |
| 1-Person Household | 72,781 | 30.3% |
| 2-Person Household | 74,769 | 31.1% |
| 3-Person Household | 37,725 | 15.7% |
| 4+ Person Household | 55,187 | 23.0% |
| Total Housing Units | 240,462 | 100.0% |
Occupancy by Ownership by Household Size in Las Vegas
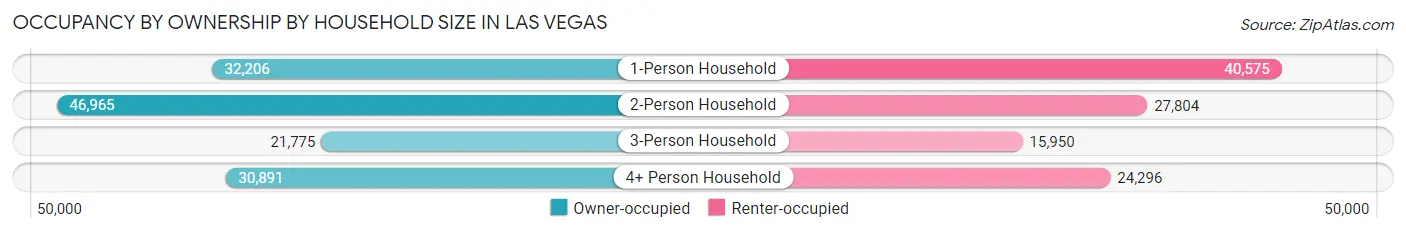
| Household Size | Owner-occupied | Renter-occupied |
| 1-Person Household | 32,206 (44.3%) | 40,575 (55.7%) |
| 2-Person Household | 46,965 (62.8%) | 27,804 (37.2%) |
| 3-Person Household | 21,775 (57.7%) | 15,950 (42.3%) |
| 4+ Person Household | 30,891 (56.0%) | 24,296 (44.0%) |
| Total Housing Units | 131,837 (54.8%) | 108,625 (45.2%) |
Occupancy by Educational Attainment in Las Vegas
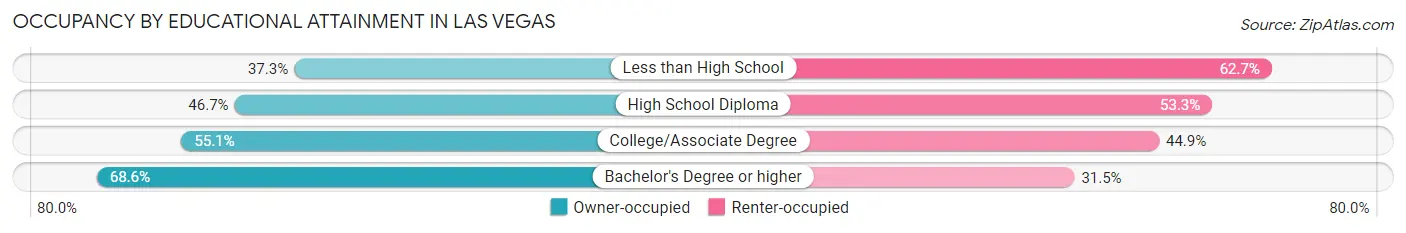
| Household Size | Owner-occupied | Renter-occupied |
| Less than High School | 10,697 (37.3%) | 18,008 (62.7%) |
| High School Diploma | 27,512 (46.7%) | 31,374 (53.3%) |
| College/Associate Degree | 45,855 (55.1%) | 37,323 (44.9%) |
| Bachelor's Degree or higher | 47,773 (68.5%) | 21,920 (31.5%) |
Occupancy by Age of Householder in Las Vegas
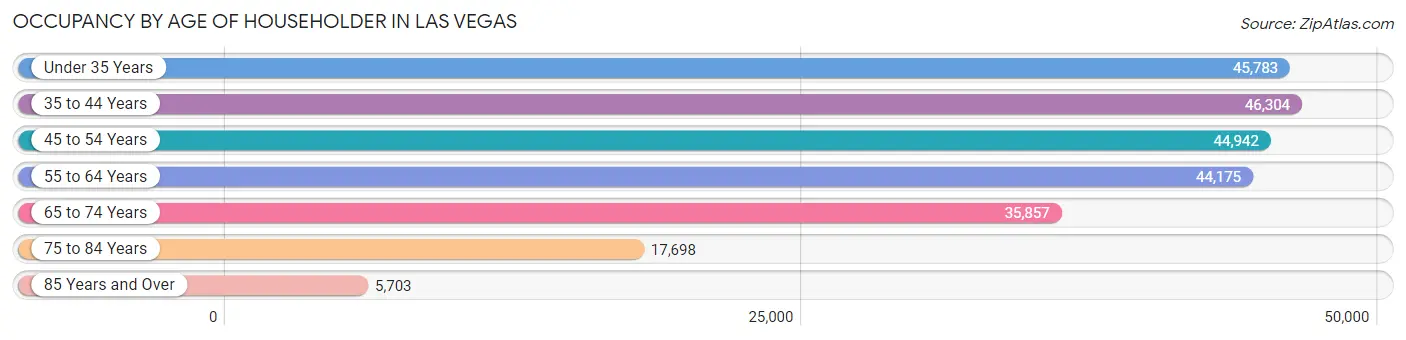
| Age Bracket | # Households | % Households |
| Under 35 Years | 45,783 | 19.0% |
| 35 to 44 Years | 46,304 | 19.3% |
| 45 to 54 Years | 44,942 | 18.7% |
| 55 to 64 Years | 44,175 | 18.4% |
| 65 to 74 Years | 35,857 | 14.9% |
| 75 to 84 Years | 17,698 | 7.4% |
| 85 Years and Over | 5,703 | 2.4% |
| Total | 240,462 | 100.0% |
Housing Finances in Las Vegas
Median Income by Occupancy in Las Vegas
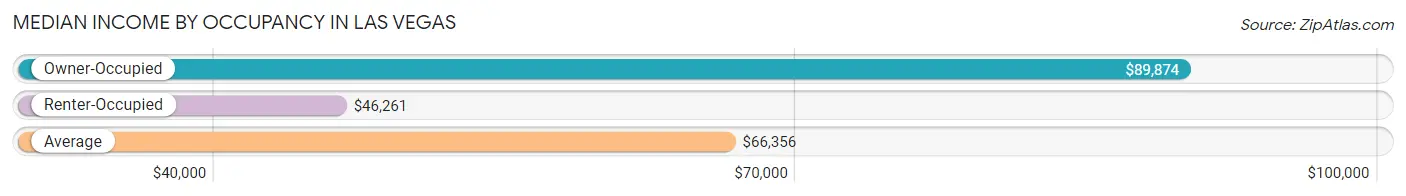
| Occupancy Type | # Households | Median Income |
| Owner-Occupied | 131,837 (54.8%) | $89,874 |
| Renter-Occupied | 108,625 (45.2%) | $46,261 |
| Average | 240,462 (100.0%) | $66,356 |
Occupancy by Householder Income Bracket in Las Vegas
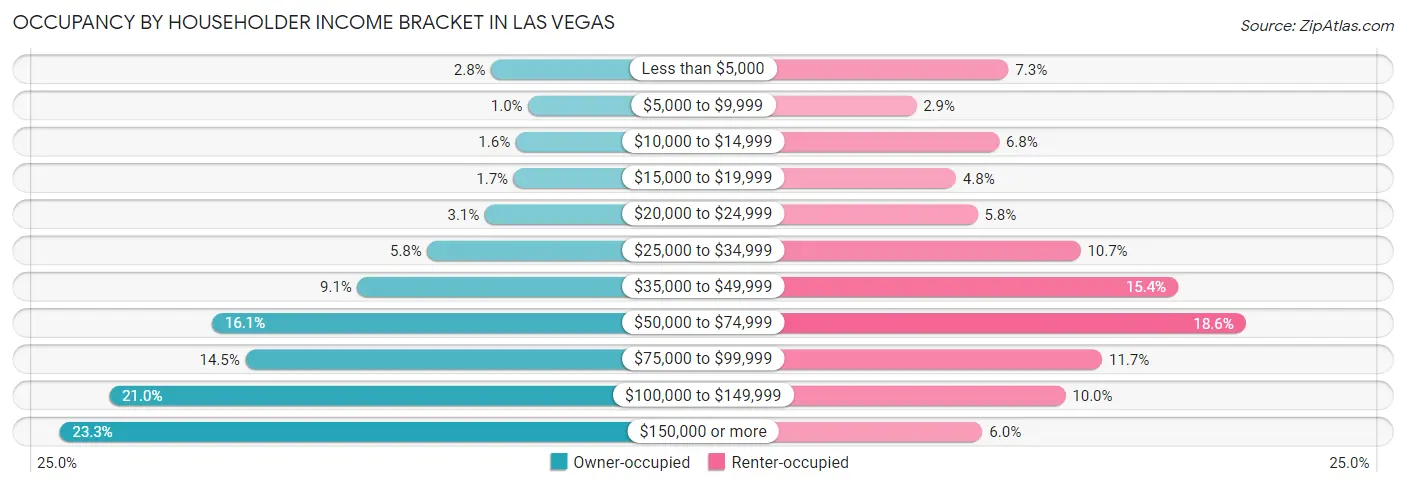
| Income Bracket | Owner-occupied | Renter-occupied |
| Less than $5,000 | 3,653 (2.8%) | 7,903 (7.3%) |
| $5,000 to $9,999 | 1,338 (1.0%) | 3,138 (2.9%) |
| $10,000 to $14,999 | 2,114 (1.6%) | 7,419 (6.8%) |
| $15,000 to $19,999 | 2,241 (1.7%) | 5,197 (4.8%) |
| $20,000 to $24,999 | 4,053 (3.1%) | 6,315 (5.8%) |
| $25,000 to $34,999 | 7,663 (5.8%) | 11,636 (10.7%) |
| $35,000 to $49,999 | 12,056 (9.1%) | 16,679 (15.3%) |
| $50,000 to $74,999 | 21,203 (16.1%) | 20,174 (18.6%) |
| $75,000 to $99,999 | 19,087 (14.5%) | 12,749 (11.7%) |
| $100,000 to $149,999 | 27,660 (21.0%) | 10,851 (10.0%) |
| $150,000 or more | 30,769 (23.3%) | 6,564 (6.0%) |
| Total | 131,837 (100.0%) | 108,625 (100.0%) |
Monthly Housing Cost Tiers in Las Vegas
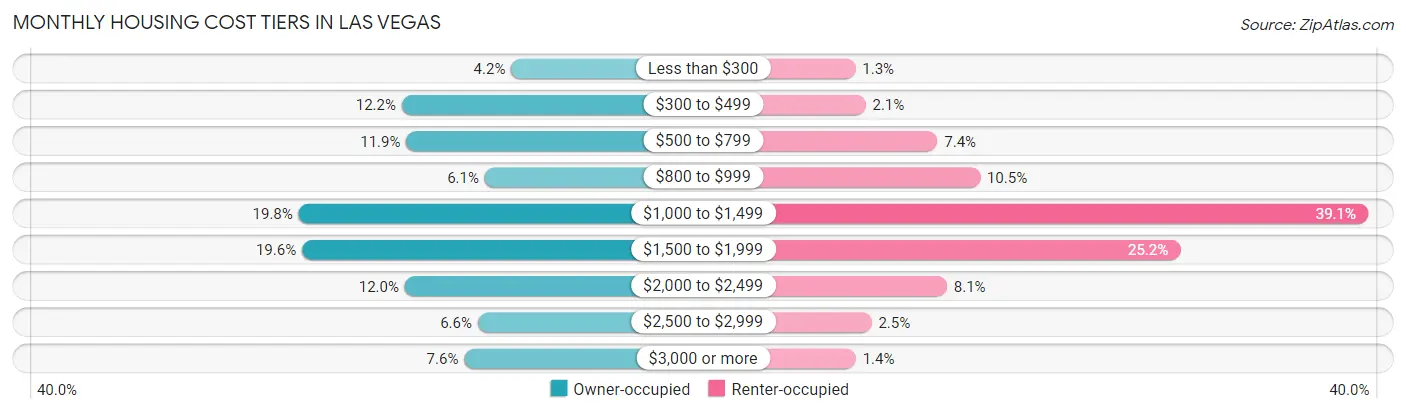
| Monthly Cost | Owner-occupied | Renter-occupied |
| Less than $300 | 5,483 (4.2%) | 1,432 (1.3%) |
| $300 to $499 | 16,110 (12.2%) | 2,251 (2.1%) |
| $500 to $799 | 15,676 (11.9%) | 7,991 (7.4%) |
| $800 to $999 | 8,055 (6.1%) | 11,401 (10.5%) |
| $1,000 to $1,499 | 26,124 (19.8%) | 42,428 (39.1%) |
| $1,500 to $1,999 | 25,798 (19.6%) | 27,401 (25.2%) |
| $2,000 to $2,499 | 15,816 (12.0%) | 8,755 (8.1%) |
| $2,500 to $2,999 | 8,730 (6.6%) | 2,728 (2.5%) |
| $3,000 or more | 10,045 (7.6%) | 1,467 (1.3%) |
| Total | 131,837 (100.0%) | 108,625 (100.0%) |
Physical Housing Characteristics in Las Vegas
Housing Structures in Las Vegas
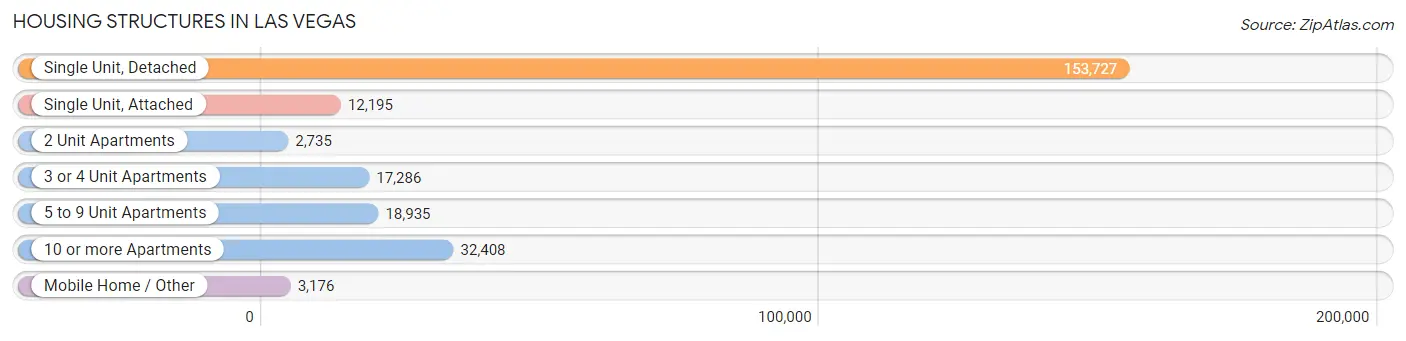
| Structure Type | # Housing Units | % Housing Units |
| Single Unit, Detached | 153,727 | 63.9% |
| Single Unit, Attached | 12,195 | 5.1% |
| 2 Unit Apartments | 2,735 | 1.1% |
| 3 or 4 Unit Apartments | 17,286 | 7.2% |
| 5 to 9 Unit Apartments | 18,935 | 7.9% |
| 10 or more Apartments | 32,408 | 13.5% |
| Mobile Home / Other | 3,176 | 1.3% |
| Total | 240,462 | 100.0% |
Housing Structures by Occupancy in Las Vegas
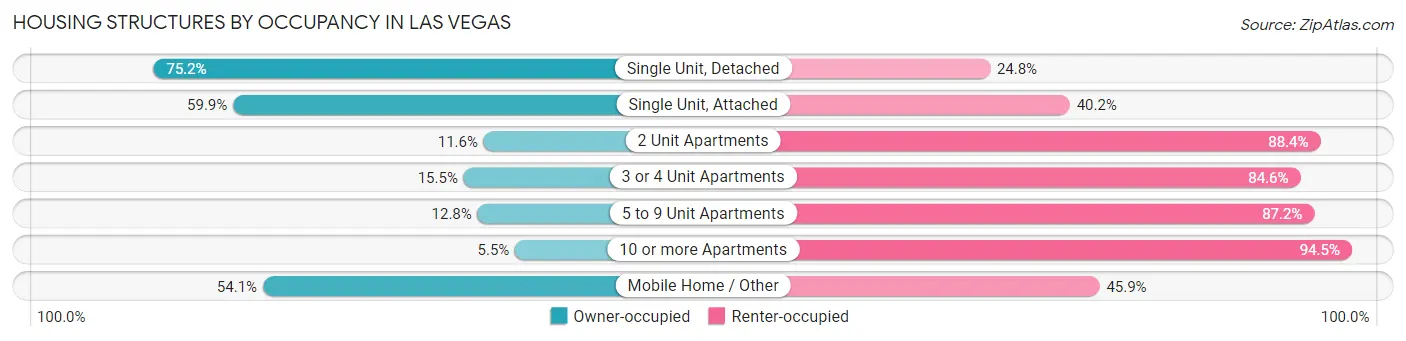
| Structure Type | Owner-occupied | Renter-occupied |
| Single Unit, Detached | 115,619 (75.2%) | 38,108 (24.8%) |
| Single Unit, Attached | 7,299 (59.9%) | 4,896 (40.2%) |
| 2 Unit Apartments | 317 (11.6%) | 2,418 (88.4%) |
| 3 or 4 Unit Apartments | 2,670 (15.4%) | 14,616 (84.6%) |
| 5 to 9 Unit Apartments | 2,419 (12.8%) | 16,516 (87.2%) |
| 10 or more Apartments | 1,794 (5.5%) | 30,614 (94.5%) |
| Mobile Home / Other | 1,719 (54.1%) | 1,457 (45.9%) |
| Total | 131,837 (54.8%) | 108,625 (45.2%) |
Housing Structures by Number of Rooms in Las Vegas
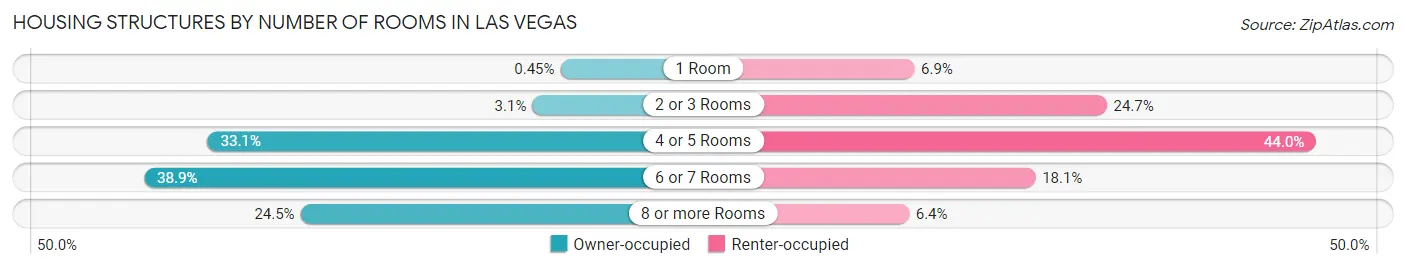
| Number of Rooms | Owner-occupied | Renter-occupied |
| 1 Room | 593 (0.4%) | 7,457 (6.9%) |
| 2 or 3 Rooms | 4,021 (3.0%) | 26,790 (24.7%) |
| 4 or 5 Rooms | 43,603 (33.1%) | 47,839 (44.0%) |
| 6 or 7 Rooms | 51,338 (38.9%) | 19,622 (18.1%) |
| 8 or more Rooms | 32,282 (24.5%) | 6,917 (6.4%) |
| Total | 131,837 (100.0%) | 108,625 (100.0%) |
Housing Structure by Heating Type in Las Vegas
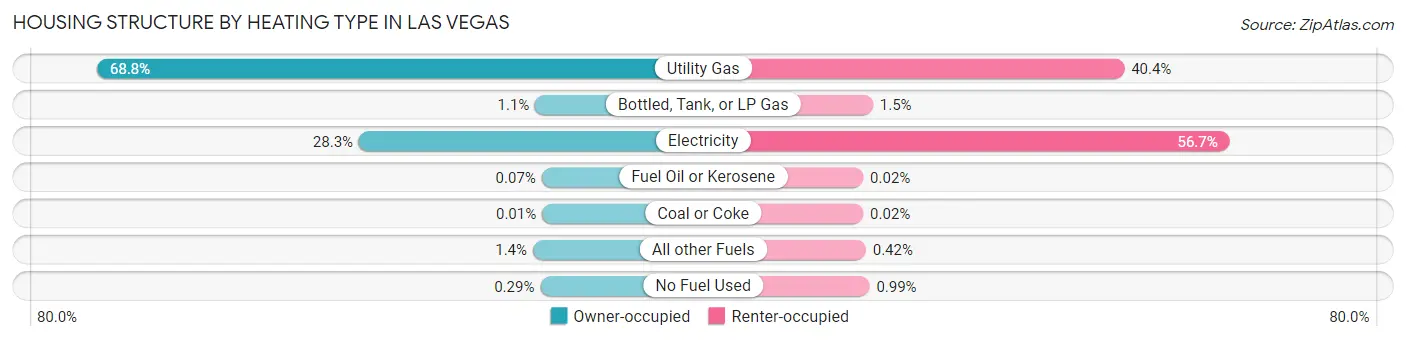
| Heating Type | Owner-occupied | Renter-occupied |
| Utility Gas | 90,735 (68.8%) | 43,853 (40.4%) |
| Bottled, Tank, or LP Gas | 1,413 (1.1%) | 1,655 (1.5%) |
| Electricity | 37,331 (28.3%) | 61,539 (56.7%) |
| Fuel Oil or Kerosene | 86 (0.1%) | 23 (0.0%) |
| Coal or Coke | 7 (0.0%) | 24 (0.0%) |
| All other Fuels | 1,883 (1.4%) | 459 (0.4%) |
| No Fuel Used | 382 (0.3%) | 1,072 (1.0%) |
| Total | 131,837 (100.0%) | 108,625 (100.0%) |
Household Vehicle Usage in Las Vegas
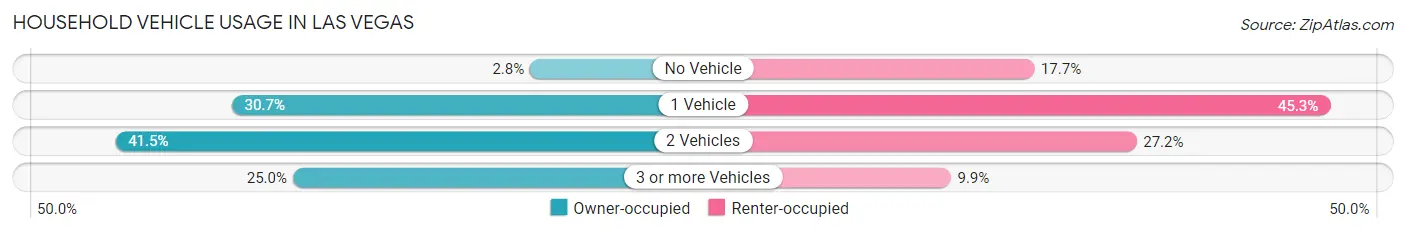
| Vehicles per Household | Owner-occupied | Renter-occupied |
| No Vehicle | 3,719 (2.8%) | 19,175 (17.6%) |
| 1 Vehicle | 40,450 (30.7%) | 49,196 (45.3%) |
| 2 Vehicles | 54,767 (41.5%) | 29,542 (27.2%) |
| 3 or more Vehicles | 32,901 (25.0%) | 10,712 (9.9%) |
| Total | 131,837 (100.0%) | 108,625 (100.0%) |
Real Estate & Mortgages in Las Vegas
Real Estate and Mortgage Overview in Las Vegas
| Characteristic | Without Mortgage | With Mortgage |
| Housing Units | 40,754 | 91,083 |
| Median Property Value | $342,600 | $373,200 |
| Median Household Income | $69,372 | $23,642 |
| Monthly Housing Costs | $496 | $9,847 |
| Real Estate Taxes | $1,856 | $3,101 |
Property Value by Mortgage Status in Las Vegas
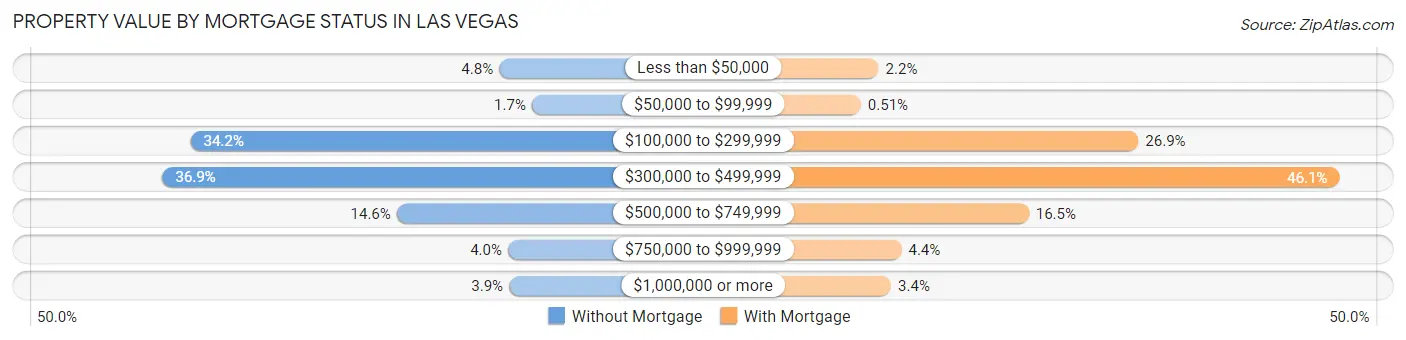
| Property Value | Without Mortgage | With Mortgage |
| Less than $50,000 | 1,964 (4.8%) | 2,003 (2.2%) |
| $50,000 to $99,999 | 692 (1.7%) | 463 (0.5%) |
| $100,000 to $299,999 | 13,933 (34.2%) | 24,540 (26.9%) |
| $300,000 to $499,999 | 15,027 (36.9%) | 41,967 (46.1%) |
| $500,000 to $749,999 | 5,939 (14.6%) | 15,032 (16.5%) |
| $750,000 to $999,999 | 1,620 (4.0%) | 3,986 (4.4%) |
| $1,000,000 or more | 1,579 (3.9%) | 3,092 (3.4%) |
| Total | 40,754 (100.0%) | 91,083 (100.0%) |
Household Income by Mortgage Status in Las Vegas
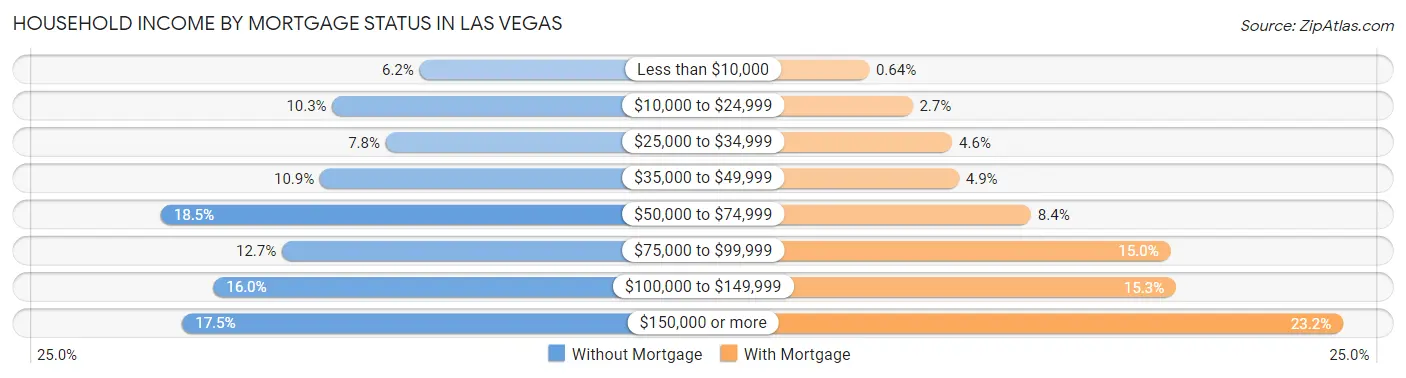
| Household Income | Without Mortgage | With Mortgage |
| Less than $10,000 | 2,522 (6.2%) | 584 (0.6%) |
| $10,000 to $24,999 | 4,214 (10.3%) | 2,469 (2.7%) |
| $25,000 to $34,999 | 3,178 (7.8%) | 4,194 (4.6%) |
| $35,000 to $49,999 | 4,455 (10.9%) | 4,485 (4.9%) |
| $50,000 to $74,999 | 7,544 (18.5%) | 7,601 (8.4%) |
| $75,000 to $99,999 | 5,191 (12.7%) | 13,659 (15.0%) |
| $100,000 to $149,999 | 6,523 (16.0%) | 13,896 (15.3%) |
| $150,000 or more | 7,127 (17.5%) | 21,137 (23.2%) |
| Total | 40,754 (100.0%) | 91,083 (100.0%) |
Property Value to Household Income Ratio in Las Vegas
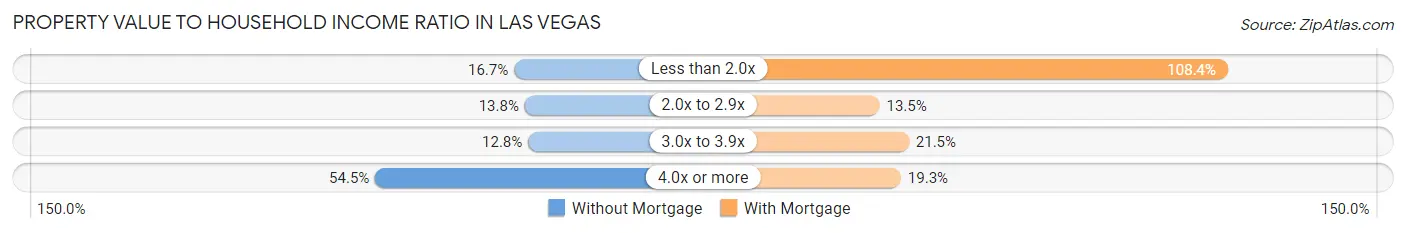
| Value-to-Income Ratio | Without Mortgage | With Mortgage |
| Less than 2.0x | 6,793 (16.7%) | 98,721 (108.4%) |
| 2.0x to 2.9x | 5,603 (13.8%) | 12,302 (13.5%) |
| 3.0x to 3.9x | 5,232 (12.8%) | 19,588 (21.5%) |
| 4.0x or more | 22,215 (54.5%) | 17,620 (19.3%) |
| Total | 40,754 (100.0%) | 91,083 (100.0%) |
Real Estate Taxes by Mortgage Status in Las Vegas
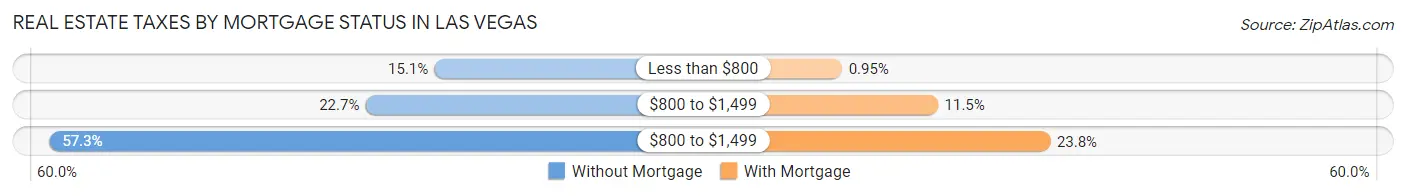
| Property Taxes | Without Mortgage | With Mortgage |
| Less than $800 | 6,163 (15.1%) | 869 (0.9%) |
| $800 to $1,499 | 9,237 (22.7%) | 10,436 (11.5%) |
| $800 to $1,499 | 23,349 (57.3%) | 21,646 (23.8%) |
| Total | 40,754 (100.0%) | 91,083 (100.0%) |
Health & Disability in Las Vegas
Health Insurance Coverage by Age in Las Vegas
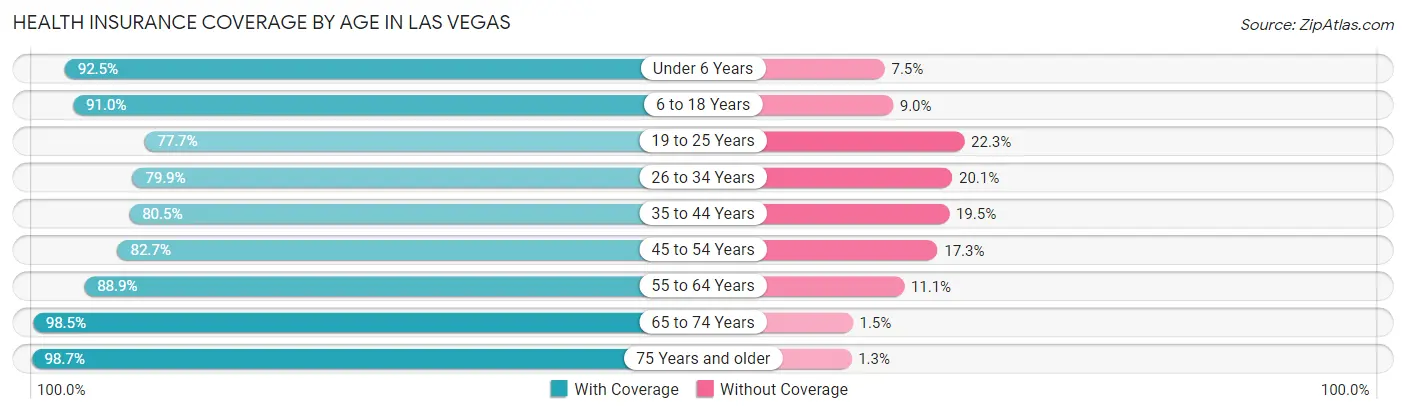
| Age Bracket | With Coverage | Without Coverage |
| Under 6 Years | 42,234 (92.5%) | 3,430 (7.5%) |
| 6 to 18 Years | 99,926 (91.0%) | 9,936 (9.0%) |
| 19 to 25 Years | 43,540 (77.7%) | 12,522 (22.3%) |
| 26 to 34 Years | 63,857 (79.9%) | 16,067 (20.1%) |
| 35 to 44 Years | 68,839 (80.5%) | 16,701 (19.5%) |
| 45 to 54 Years | 68,683 (82.7%) | 14,407 (17.3%) |
| 55 to 64 Years | 69,573 (88.9%) | 8,704 (11.1%) |
| 65 to 74 Years | 57,755 (98.5%) | 899 (1.5%) |
| 75 Years and older | 38,042 (98.7%) | 498 (1.3%) |
| Total | 552,449 (86.9%) | 83,164 (13.1%) |
Health Insurance Coverage by Citizenship Status in Las Vegas
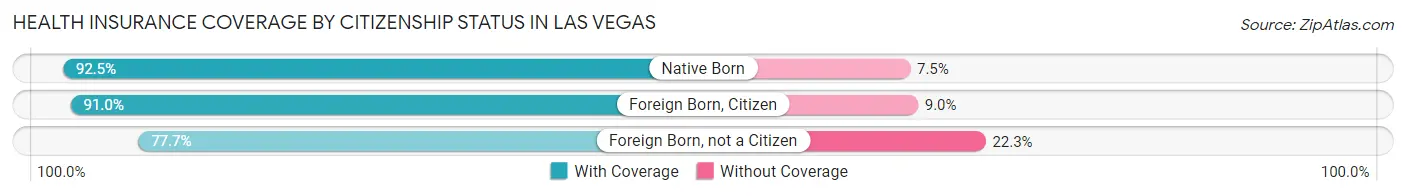
| Citizenship Status | With Coverage | Without Coverage |
| Native Born | 42,234 (92.5%) | 3,430 (7.5%) |
| Foreign Born, Citizen | 99,926 (91.0%) | 9,936 (9.0%) |
| Foreign Born, not a Citizen | 43,540 (77.7%) | 12,522 (22.3%) |
Health Insurance Coverage by Household Income in Las Vegas
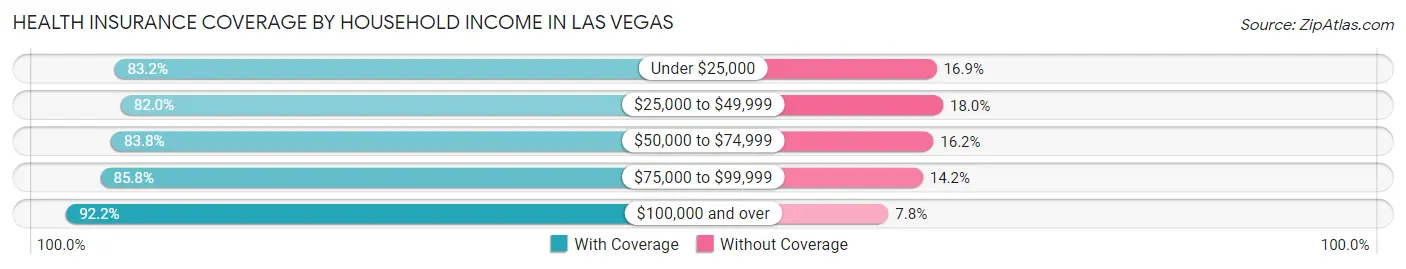
| Household Income | With Coverage | Without Coverage |
| Under $25,000 | 65,706 (83.2%) | 13,312 (16.9%) |
| $25,000 to $49,999 | 88,858 (82.0%) | 19,554 (18.0%) |
| $50,000 to $74,999 | 90,393 (83.8%) | 17,496 (16.2%) |
| $75,000 to $99,999 | 82,003 (85.8%) | 13,617 (14.2%) |
| $100,000 and over | 223,750 (92.2%) | 18,928 (7.8%) |
Public vs Private Health Insurance Coverage by Age in Las Vegas
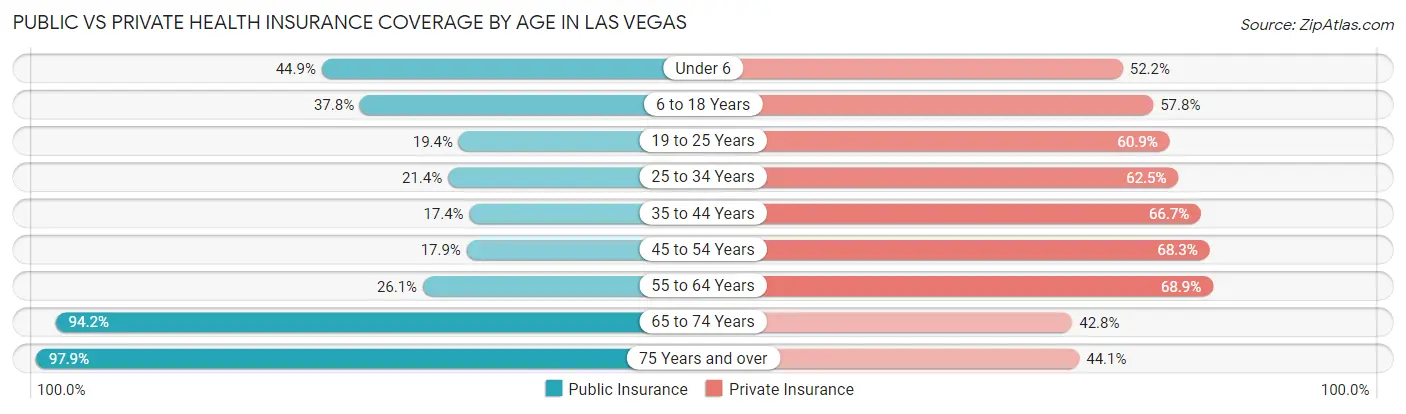
| Age Bracket | Public Insurance | Private Insurance |
| Under 6 | 20,480 (44.9%) | 23,817 (52.2%) |
| 6 to 18 Years | 41,470 (37.8%) | 63,507 (57.8%) |
| 19 to 25 Years | 10,878 (19.4%) | 34,114 (60.9%) |
| 25 to 34 Years | 17,112 (21.4%) | 49,916 (62.5%) |
| 35 to 44 Years | 14,911 (17.4%) | 57,054 (66.7%) |
| 45 to 54 Years | 14,905 (17.9%) | 56,716 (68.3%) |
| 55 to 64 Years | 20,396 (26.1%) | 53,931 (68.9%) |
| 65 to 74 Years | 55,271 (94.2%) | 25,095 (42.8%) |
| 75 Years and over | 37,737 (97.9%) | 16,993 (44.1%) |
| Total | 233,160 (36.7%) | 381,143 (60.0%) |
Disability Status by Sex by Age in Las Vegas
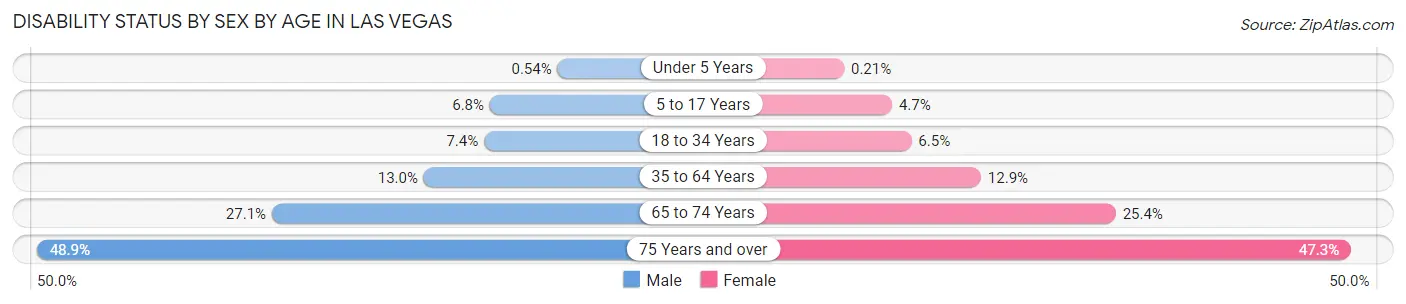
| Age Bracket | Male | Female |
| Under 5 Years | 100 (0.5%) | 40 (0.2%) |
| 5 to 17 Years | 3,895 (6.8%) | 2,455 (4.7%) |
| 18 to 34 Years | 5,403 (7.4%) | 4,560 (6.5%) |
| 35 to 64 Years | 16,081 (13.0%) | 15,845 (12.9%) |
| 65 to 74 Years | 7,398 (27.1%) | 7,959 (25.4%) |
| 75 Years and over | 8,404 (48.9%) | 10,088 (47.3%) |
Disability Class by Sex by Age in Las Vegas
Disability Class: Hearing Difficulty
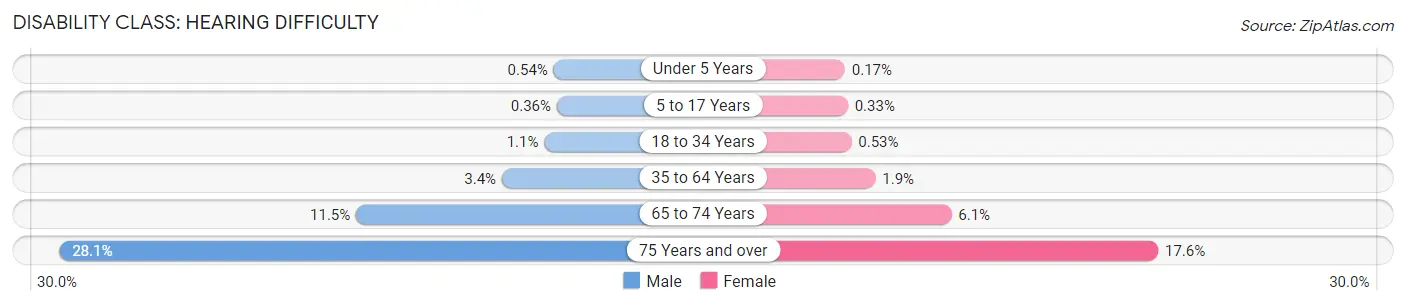
| Age Bracket | Male | Female |
| Under 5 Years | 100 (0.5%) | 32 (0.2%) |
| 5 to 17 Years | 205 (0.4%) | 176 (0.3%) |
| 18 to 34 Years | 778 (1.1%) | 373 (0.5%) |
| 35 to 64 Years | 4,247 (3.4%) | 2,290 (1.9%) |
| 65 to 74 Years | 3,156 (11.5%) | 1,911 (6.1%) |
| 75 Years and over | 4,826 (28.1%) | 3,758 (17.6%) |
Disability Class: Vision Difficulty
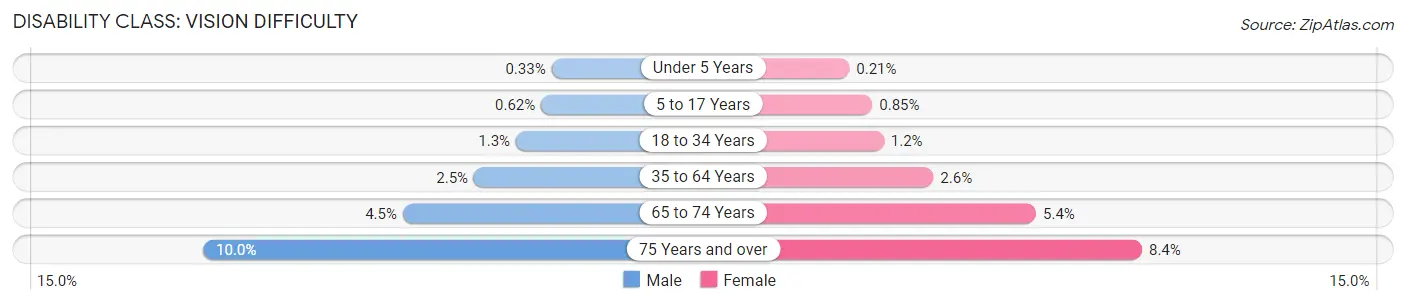
| Age Bracket | Male | Female |
| Under 5 Years | 61 (0.3%) | 40 (0.2%) |
| 5 to 17 Years | 357 (0.6%) | 448 (0.9%) |
| 18 to 34 Years | 972 (1.3%) | 827 (1.2%) |
| 35 to 64 Years | 3,096 (2.5%) | 3,128 (2.5%) |
| 65 to 74 Years | 1,222 (4.5%) | 1,695 (5.4%) |
| 75 Years and over | 1,724 (10.0%) | 1,785 (8.4%) |
Disability Class: Cognitive Difficulty
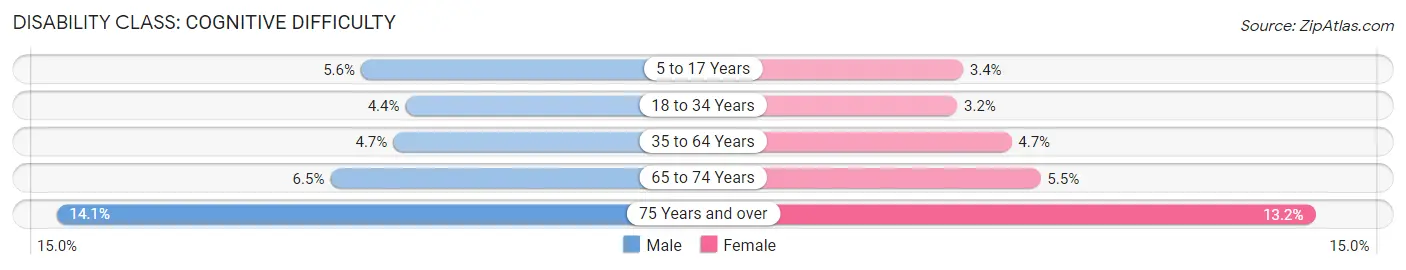
| Age Bracket | Male | Female |
| 5 to 17 Years | 3,223 (5.6%) | 1,776 (3.4%) |
| 18 to 34 Years | 3,234 (4.4%) | 2,265 (3.2%) |
| 35 to 64 Years | 5,880 (4.7%) | 5,798 (4.7%) |
| 65 to 74 Years | 1,774 (6.5%) | 1,731 (5.5%) |
| 75 Years and over | 2,427 (14.1%) | 2,814 (13.2%) |
Disability Class: Ambulatory Difficulty
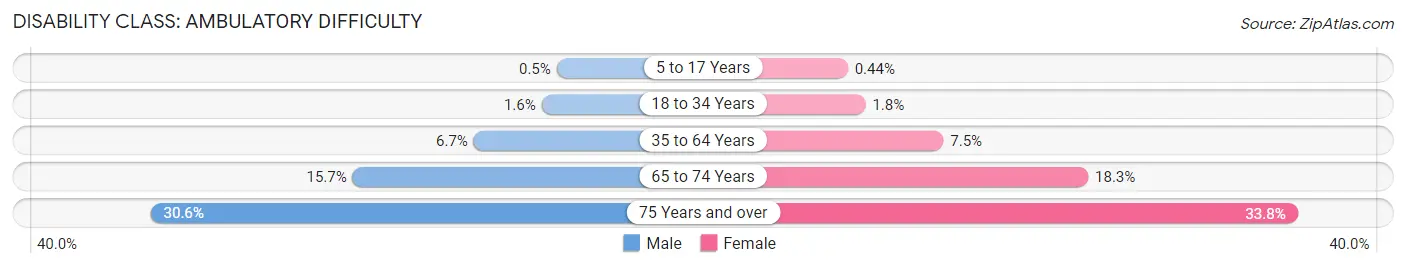
| Age Bracket | Male | Female |
| 5 to 17 Years | 287 (0.5%) | 233 (0.4%) |
| 18 to 34 Years | 1,186 (1.6%) | 1,240 (1.8%) |
| 35 to 64 Years | 8,266 (6.7%) | 9,258 (7.5%) |
| 65 to 74 Years | 4,280 (15.7%) | 5,725 (18.3%) |
| 75 Years and over | 5,269 (30.6%) | 7,221 (33.8%) |
Disability Class: Self-Care Difficulty
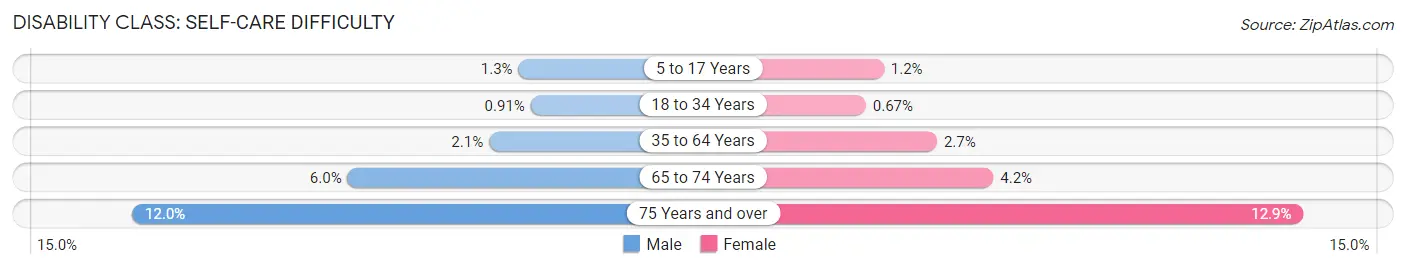
| Age Bracket | Male | Female |
| 5 to 17 Years | 717 (1.3%) | 617 (1.2%) |
| 18 to 34 Years | 671 (0.9%) | 472 (0.7%) |
| 35 to 64 Years | 2,564 (2.1%) | 3,257 (2.6%) |
| 65 to 74 Years | 1,644 (6.0%) | 1,321 (4.2%) |
| 75 Years and over | 2,065 (12.0%) | 2,743 (12.9%) |
Technology Access in Las Vegas
Computing Device Access in Las Vegas
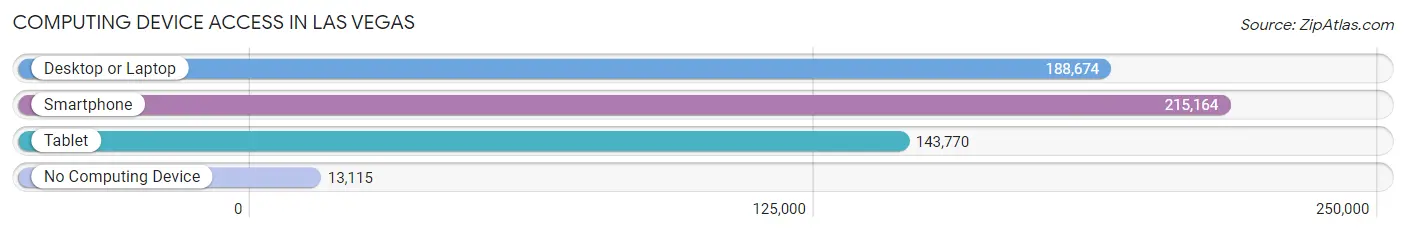
| Device Type | # Households | % Households |
| Desktop or Laptop | 188,674 | 78.5% |
| Smartphone | 215,164 | 89.5% |
| Tablet | 143,770 | 59.8% |
| No Computing Device | 13,115 | 5.4% |
| Total | 240,462 | 100.0% |
Internet Access in Las Vegas
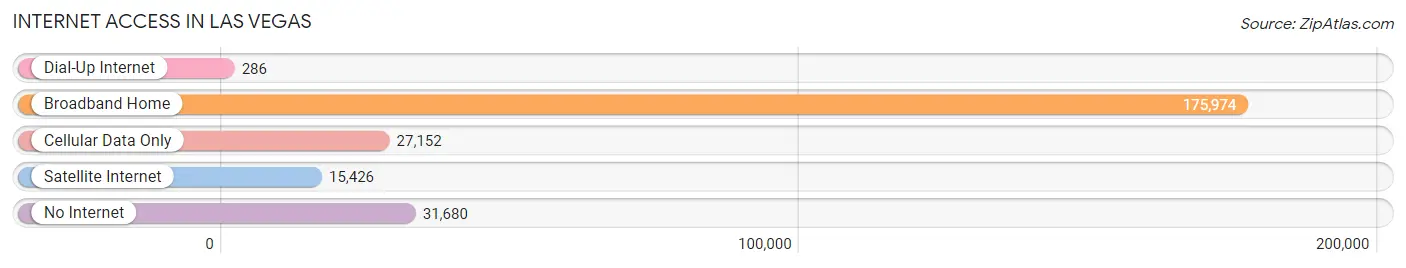
| Internet Type | # Households | % Households |
| Dial-Up Internet | 286 | 0.1% |
| Broadband Home | 175,974 | 73.2% |
| Cellular Data Only | 27,152 | 11.3% |
| Satellite Internet | 15,426 | 6.4% |
| No Internet | 31,680 | 13.2% |
| Total | 240,462 | 100.0% |
Las Vegas Summary
Las Vegas, Nevada is a city located in the Mojave Desert in Clark County, Nevada. It is the most populous city in the state and the 28th most populous city in the United States. Las Vegas is known for its vibrant nightlife, casinos, and entertainment. It is also a major tourist destination, with over 40 million visitors each year.
History
Las Vegas was founded in 1905 by ranchers and railroad workers and was originally named Las Vegas Rancho. The city was incorporated in 1911 and was named after the Spanish phrase “the meadows”. Las Vegas was a small, isolated town until 1931 when the construction of the Hoover Dam brought an influx of workers and tourists to the area. This led to the development of the city’s first casino, the El Rancho Vegas, in 1941.
The city experienced a major population boom in the 1950s and 1960s, when it became a popular destination for tourists and gamblers. This led to the construction of many of the city’s iconic hotels and casinos, such as the Flamingo, the Sands, and the Tropicana. The city also became a major entertainment hub, hosting a variety of shows and concerts.
In the 1970s, Las Vegas began to diversify its economy, becoming a major center for conventions and business meetings. This led to the construction of many of the city’s large hotels and resorts, such as the MGM Grand and the Bellagio.
Geography
Las Vegas is located in the Mojave Desert in Clark County, Nevada. The city is situated in a basin on the floor of the Las Vegas Valley, surrounded by mountains on all sides. The city is located at an elevation of 2,030 feet (620 m) above sea level.
The city has a total area of 135.8 square miles (351.9 km2), of which 135.3 square miles (350.9 km2) is land and 0.5 square miles (1.0 km2) is water. The city is located in the Mojave Desert, which is characterized by hot, dry summers and mild winters.
Economy
Las Vegas is a major tourist destination and is home to a variety of industries. The city’s economy is largely driven by tourism, with over 40 million visitors each year. The city is also a major center for conventions and business meetings.
The city’s economy is also driven by the gaming industry, with over 50 casinos and resorts located in the city. The city is also home to a variety of other industries, such as manufacturing, finance, and technology.
Demographics
As of the 2019 census, the population of Las Vegas was 644,644. The city has a population density of 4,741 people per square mile (1,827/km2). The racial makeup of the city was 63.2% White, 8.7% African American, 0.9% Native American, 8.2% Asian, 0.4% Pacific Islander, and 16.6% from other races.
The median household income in Las Vegas was $51,890 in 2019. The city’s poverty rate was 17.2%, with 24.3% of the population living below the poverty line. The city’s unemployment rate was 4.2% in 2019.
Common Questions
What is Per Capita Income in Las Vegas?
Per Capita income in Las Vegas is $36,275.
What is the Median Family Income in Las Vegas?
Median Family Income in Las Vegas is $81,758.
What is the Median Household income in Las Vegas?
Median Household Income in Las Vegas is $66,356.
What is Income or Wage Gap in Las Vegas?
Income or Wage Gap in Las Vegas is 17.2%.
Women in Las Vegas earn 82.8 cents for every dollar earned by a man.
What is Family Income Deficit in Las Vegas?
Family Income Deficit in Las Vegas is $12,066.
Families that are below poverty line in Las Vegas earn $12,066 less on average than the poverty threshold level.
What is Inequality or Gini Index in Las Vegas?
Inequality or Gini Index in Las Vegas is 0.49.
What is the Total Population of Las Vegas?
Total Population of Las Vegas is 644,835.
What is the Total Male Population of Las Vegas?
Total Male Population of Las Vegas is 324,566.
What is the Total Female Population of Las Vegas?
Total Female Population of Las Vegas is 320,269.
What is the Ratio of Males per 100 Females in Las Vegas?
There are 101.34 Males per 100 Females in Las Vegas.
What is the Ratio of Females per 100 Males in Las Vegas?
There are 98.68 Females per 100 Males in Las Vegas.
What is the Median Population Age in Las Vegas?
Median Population Age in Las Vegas is 38.1 Years.
What is the Average Family Size in Las Vegas
Average Family Size in Las Vegas is 3.4 People.
What is the Average Household Size in Las Vegas
Average Household Size in Las Vegas is 2.6 People.
How Large is the Labor Force in Las Vegas?
There are 322,139 People in the Labor Forcein in Las Vegas.
What is the Percentage of People in the Labor Force in Las Vegas?
62.6% of People are in the Labor Force in Las Vegas.
What is the Unemployment Rate in Las Vegas?
Unemployment Rate in Las Vegas is 7.4%.