Sioux City, IA Map & Demographics
Sioux City Map
Sioux City Overview
$31,428
PER CAPITA INCOME
$81,639
AVG FAMILY INCOME
$64,250
AVG HOUSEHOLD INCOME
25.9%
WAGE / INCOME GAP [ % ]
74.1¢/ $1
WAGE / INCOME GAP [ $ ]
$11,265
FAMILY INCOME DEFICIT
0.43
INEQUALITY / GINI INDEX
85,469
TOTAL POPULATION
42,694
MALE POPULATION
42,775
FEMALE POPULATION
99.81
MALES / 100 FEMALES
100.19
FEMALES / 100 MALES
34.8
MEDIAN AGE
3.2
AVG FAMILY SIZE
2.5
AVG HOUSEHOLD SIZE
44,882
LABOR FORCE [ PEOPLE ]
68.5%
PERCENT IN LABOR FORCE
4.7%
UNEMPLOYMENT RATE
Sioux City Area Codes
Income in Sioux City
Income Overview in Sioux City
Per Capita Income in Sioux City is $31,428, while median incomes of families and households are $81,639 and $64,250 respectively.
| Characteristic | Number | Measure |
| Per Capita Income | 85,469 | $31,428 |
| Median Family Income | 20,219 | $81,639 |
| Mean Family Income | 20,219 | $96,359 |
| Median Household Income | 32,449 | $64,250 |
| Mean Household Income | 32,449 | $81,401 |
| Income Deficit | 20,219 | $11,265 |
| Wage / Income Gap (%) | 85,469 | 25.93% |
| Wage / Income Gap ($) | 85,469 | 74.07¢ per $1 |
| Gini / Inequality Index | 85,469 | 0.43 |
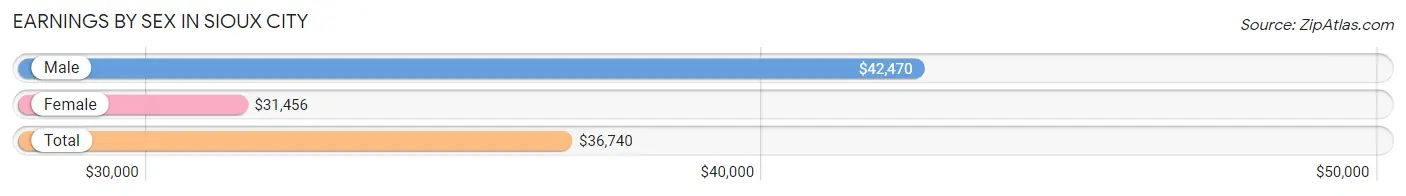
Earnings by Sex in Sioux City
Average Earnings in Sioux City are $36,740, $42,470 for men and $31,456 for women, a difference of 25.9%.
| Sex | Number | Average Earnings |
| Male | 24,818 (52.6%) | $42,470 |
| Female | 22,392 (47.4%) | $31,456 |
| Total | 47,210 (100.0%) | $36,740 |
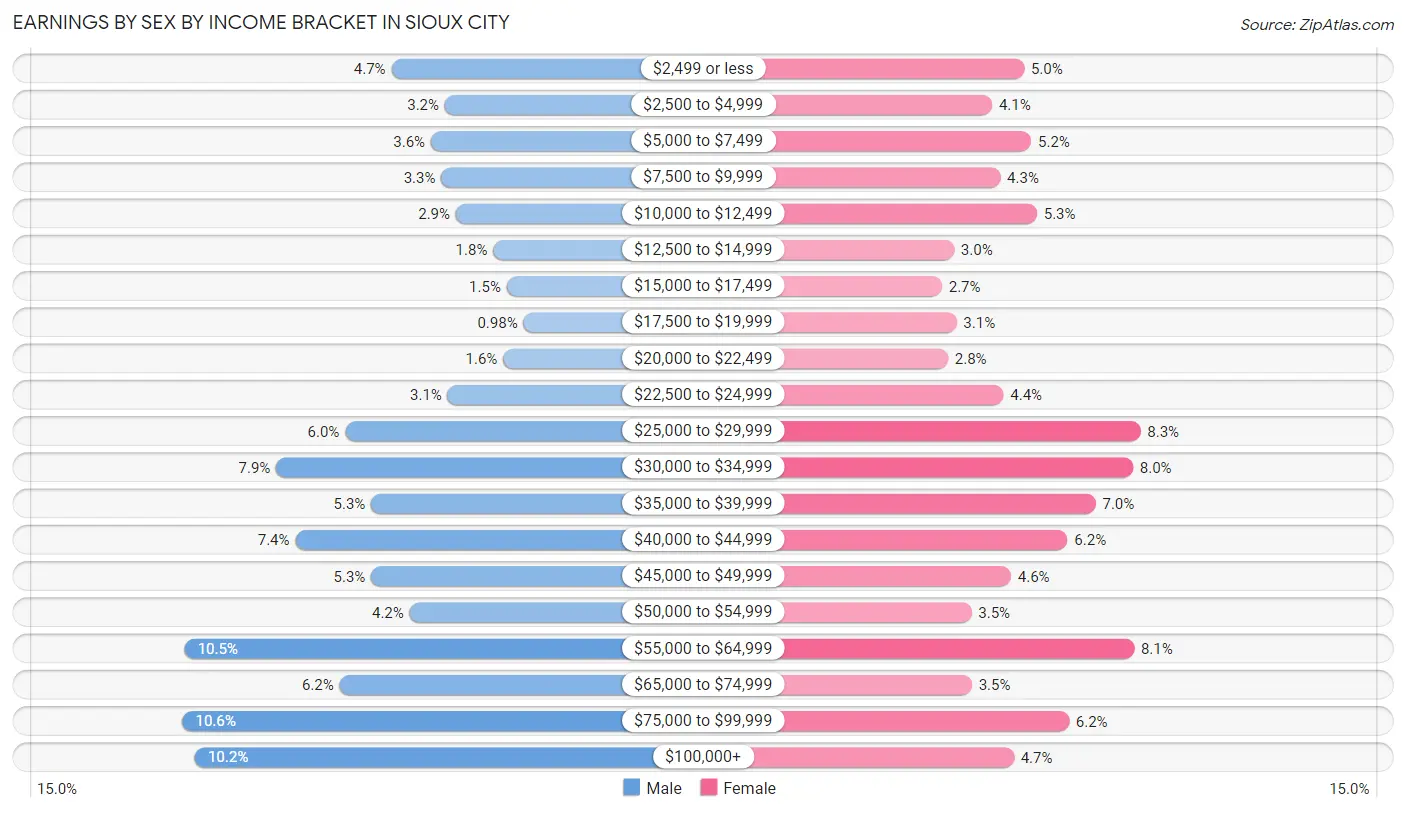
Earnings by Sex by Income Bracket in Sioux City
The most common earnings brackets in Sioux City are $75,000 to $99,999 for men (2,621 | 10.6%) and $25,000 to $29,999 for women (1,848 | 8.3%).
| Income | Male | Female |
| $2,499 or less | 1,164 (4.7%) | 1,115 (5.0%) |
| $2,500 to $4,999 | 792 (3.2%) | 913 (4.1%) |
| $5,000 to $7,499 | 888 (3.6%) | 1,161 (5.2%) |
| $7,500 to $9,999 | 817 (3.3%) | 965 (4.3%) |
| $10,000 to $12,499 | 715 (2.9%) | 1,195 (5.3%) |
| $12,500 to $14,999 | 455 (1.8%) | 674 (3.0%) |
| $15,000 to $17,499 | 361 (1.5%) | 597 (2.7%) |
| $17,500 to $19,999 | 243 (1.0%) | 690 (3.1%) |
| $20,000 to $22,499 | 385 (1.5%) | 636 (2.8%) |
| $22,500 to $24,999 | 772 (3.1%) | 985 (4.4%) |
| $25,000 to $29,999 | 1,487 (6.0%) | 1,848 (8.3%) |
| $30,000 to $34,999 | 1,969 (7.9%) | 1,801 (8.0%) |
| $35,000 to $39,999 | 1,306 (5.3%) | 1,566 (7.0%) |
| $40,000 to $44,999 | 1,835 (7.4%) | 1,389 (6.2%) |
| $45,000 to $49,999 | 1,305 (5.3%) | 1,033 (4.6%) |
| $50,000 to $54,999 | 1,037 (4.2%) | 784 (3.5%) |
| $55,000 to $64,999 | 2,606 (10.5%) | 1,807 (8.1%) |
| $65,000 to $74,999 | 1,526 (6.1%) | 785 (3.5%) |
| $75,000 to $99,999 | 2,621 (10.6%) | 1,397 (6.2%) |
| $100,000+ | 2,534 (10.2%) | 1,051 (4.7%) |
| Total | 24,818 (100.0%) | 22,392 (100.0%) |
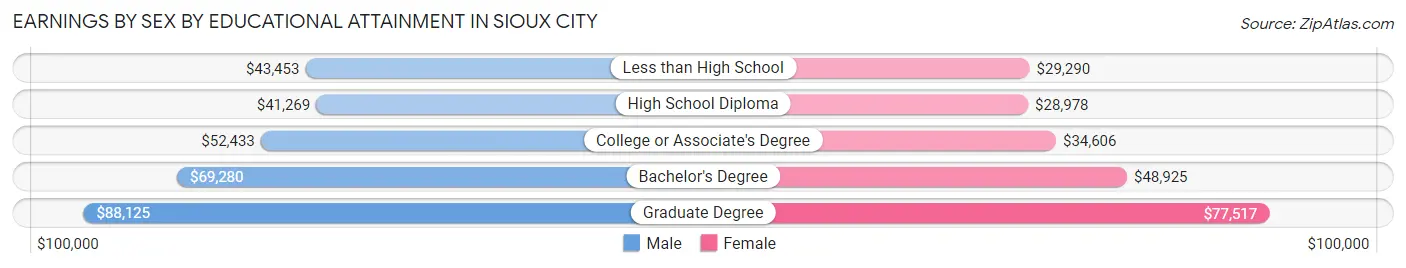
Earnings by Sex by Educational Attainment in Sioux City
Average earnings in Sioux City are $49,064 for men and $37,093 for women, a difference of 24.4%. Men with an educational attainment of graduate degree enjoy the highest average annual earnings of $88,125, while those with high school diploma education earn the least with $41,269. Women with an educational attainment of graduate degree earn the most with the average annual earnings of $77,517, while those with high school diploma education have the smallest earnings of $28,978.
| Educational Attainment | Male Income | Female Income |
| Less than High School | $43,453 | $29,290 |
| High School Diploma | $41,269 | $28,978 |
| College or Associate's Degree | $52,433 | $34,606 |
| Bachelor's Degree | $69,280 | $48,925 |
| Graduate Degree | $88,125 | $77,517 |
| Total | $49,064 | $37,093 |
Family Income in Sioux City
Family Income Brackets in Sioux City
According to the Sioux City family income data, there are 4,853 families falling into the $100,000 to $149,999 income range, which is the most common income bracket and makes up 24.0% of all families. Conversely, the $10,000 to $14,999 income bracket is the least frequent group with only 445 families (2.2%) belonging to this category.
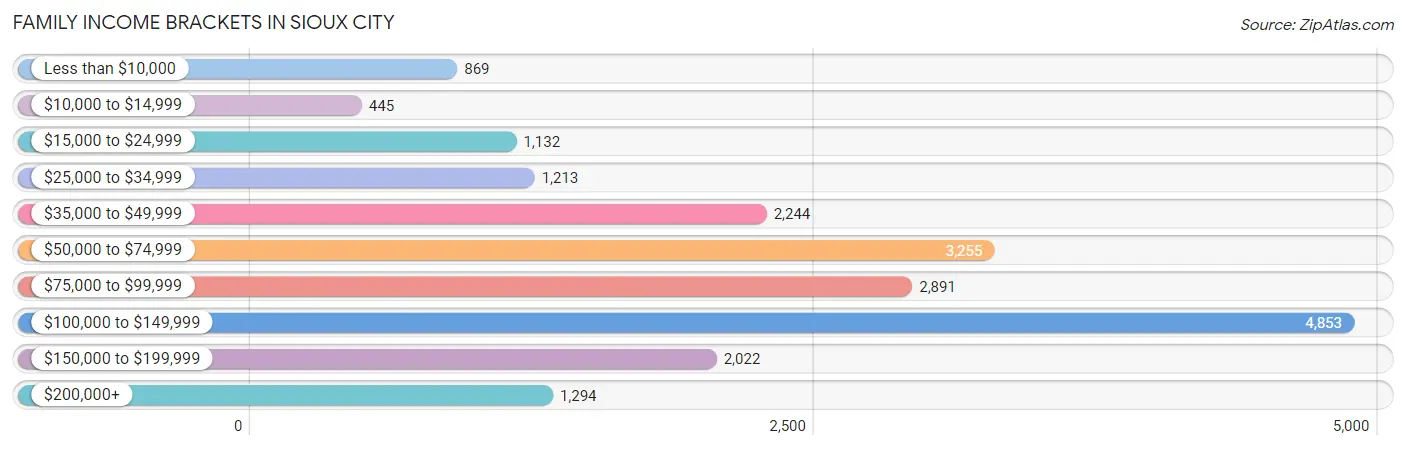
| Income Bracket | # Families | % Families |
| Less than $10,000 | 869 | 4.3% |
| $10,000 to $14,999 | 445 | 2.2% |
| $15,000 to $24,999 | 1,132 | 5.6% |
| $25,000 to $34,999 | 1,213 | 6.0% |
| $35,000 to $49,999 | 2,244 | 11.1% |
| $50,000 to $74,999 | 3,255 | 16.1% |
| $75,000 to $99,999 | 2,891 | 14.3% |
| $100,000 to $149,999 | 4,853 | 24.0% |
| $150,000 to $199,999 | 2,022 | 10.0% |
| $200,000+ | 1,294 | 6.4% |
Family Income by Famaliy Size in Sioux City
6-person families (654 | 3.2%) account for the highest median family income in Sioux City with $100,306 per family, while 2-person families (8,733 | 43.2%) have the highest median income of $36,998 per family member.
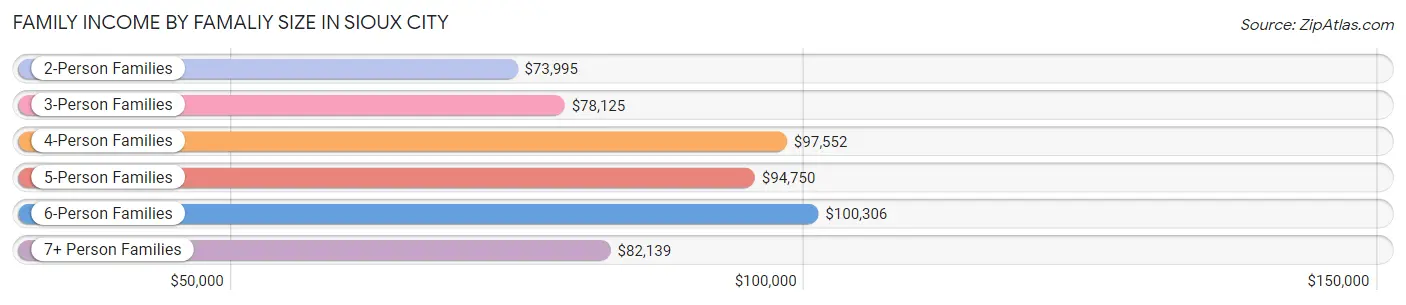
| Income Bracket | # Families | Median Income |
| 2-Person Families | 8,733 (43.2%) | $73,995 |
| 3-Person Families | 4,495 (22.2%) | $78,125 |
| 4-Person Families | 4,179 (20.7%) | $97,552 |
| 5-Person Families | 1,797 (8.9%) | $94,750 |
| 6-Person Families | 654 (3.2%) | $100,306 |
| 7+ Person Families | 361 (1.8%) | $82,139 |
| Total | 20,219 (100.0%) | $81,639 |
Family Income by Number of Earners in Sioux City
The median family income in Sioux City is $81,639, with families comprising 3+ earners (3,155) having the highest median family income of $145,642, while families with no earners (2,501) have the lowest median family income of $44,509, accounting for 15.6% and 12.4% of families, respectively.
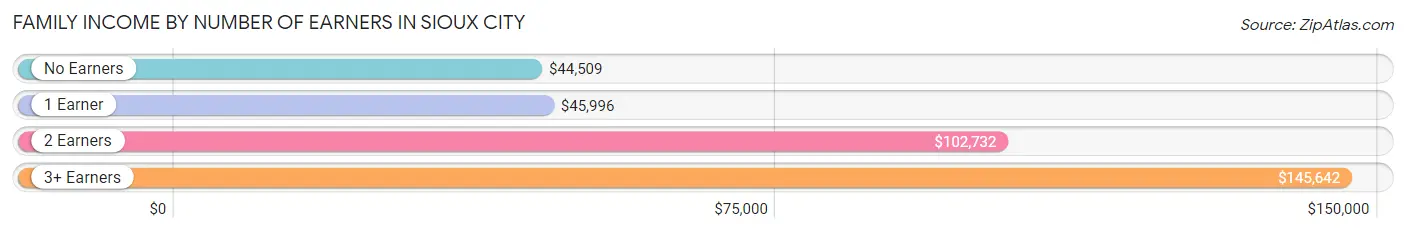
| Number of Earners | # Families | Median Income |
| No Earners | 2,501 (12.4%) | $44,509 |
| 1 Earner | 6,562 (32.5%) | $45,996 |
| 2 Earners | 8,001 (39.6%) | $102,732 |
| 3+ Earners | 3,155 (15.6%) | $145,642 |
| Total | 20,219 (100.0%) | $81,639 |
Household Income in Sioux City
Household Income Brackets in Sioux City
With 6,198 households falling in the category, the $100,000 to $149,999 income range is the most frequent in Sioux City, accounting for 19.1% of all households. In contrast, only 1,395 households (4.3%) fall into the $10,000 to $14,999 income bracket, making it the least populous group.
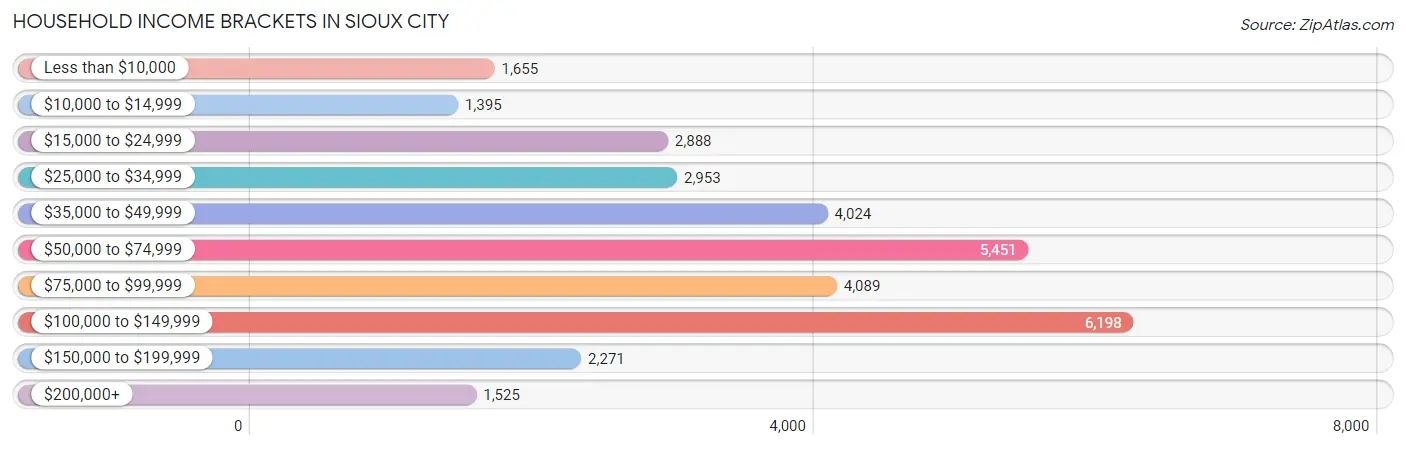
| Income Bracket | # Households | % Households |
| Less than $10,000 | 1,655 | 5.1% |
| $10,000 to $14,999 | 1,395 | 4.3% |
| $15,000 to $24,999 | 2,888 | 8.9% |
| $25,000 to $34,999 | 2,953 | 9.1% |
| $35,000 to $49,999 | 4,024 | 12.4% |
| $50,000 to $74,999 | 5,451 | 16.8% |
| $75,000 to $99,999 | 4,089 | 12.6% |
| $100,000 to $149,999 | 6,198 | 19.1% |
| $150,000 to $199,999 | 2,271 | 7.0% |
| $200,000+ | 1,525 | 4.7% |
Household Income by Householder Age in Sioux City
The median household income in Sioux City is $64,250, with the highest median household income of $82,330 found in the 45 to 64 years age bracket for the primary householder. A total of 11,798 households (36.4%) fall into this category. Meanwhile, the 65+ years age bracket for the primary householder has the lowest median household income of $46,290, with 7,858 households (24.2%) in this group.
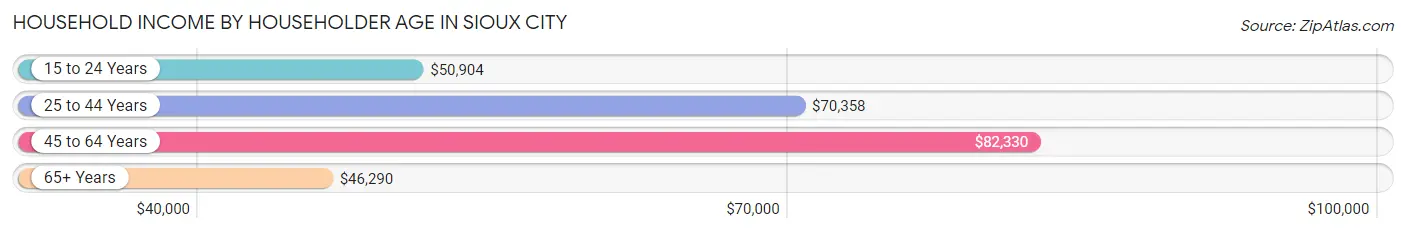
| Income Bracket | # Households | Median Income |
| 15 to 24 Years | 1,930 (5.9%) | $50,904 |
| 25 to 44 Years | 10,863 (33.5%) | $70,358 |
| 45 to 64 Years | 11,798 (36.4%) | $82,330 |
| 65+ Years | 7,858 (24.2%) | $46,290 |
| Total | 32,449 (100.0%) | $64,250 |
Poverty in Sioux City
Income Below Poverty by Sex and Age in Sioux City
With 13.2% poverty level for males and 16.4% for females among the residents of Sioux City, 15 year old males and 16 and 17 year old females are the most vulnerable to poverty, with 261 males (36.8%) and 254 females (23.9%) in their respective age groups living below the poverty level.
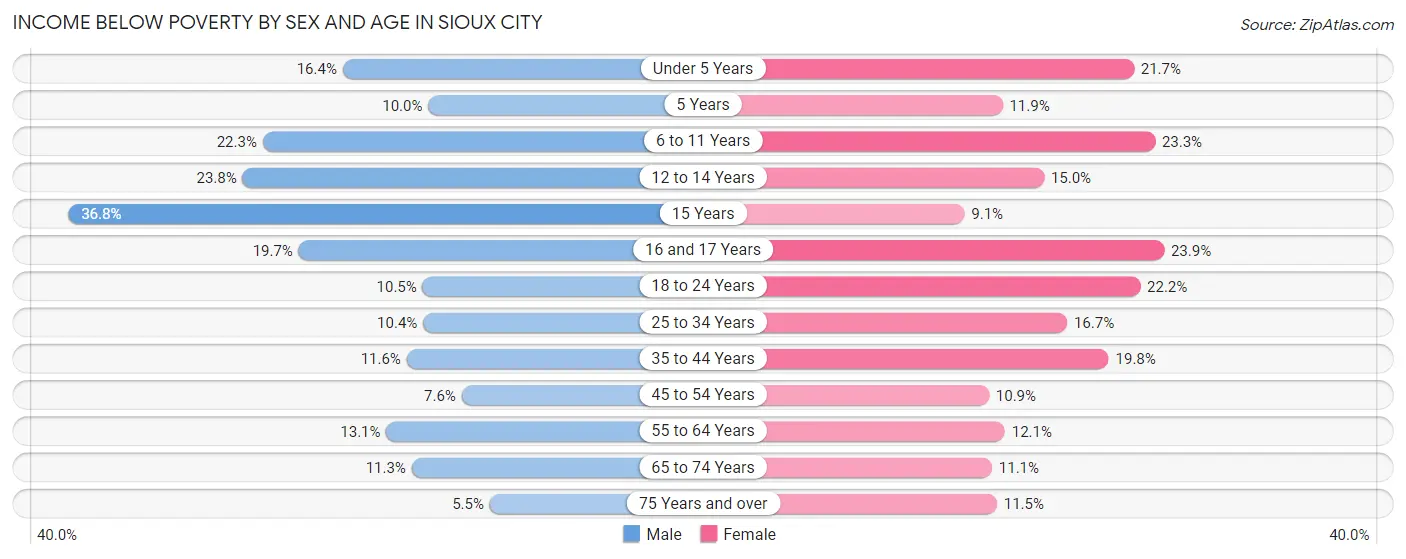
| Age Bracket | Male | Female |
| Under 5 Years | 519 (16.4%) | 605 (21.7%) |
| 5 Years | 68 (10.0%) | 91 (11.9%) |
| 6 to 11 Years | 854 (22.3%) | 817 (23.3%) |
| 12 to 14 Years | 397 (23.8%) | 270 (15.0%) |
| 15 Years | 261 (36.8%) | 64 (9.1%) |
| 16 and 17 Years | 256 (19.7%) | 254 (23.9%) |
| 18 to 24 Years | 422 (10.4%) | 932 (22.2%) |
| 25 to 34 Years | 588 (10.4%) | 857 (16.7%) |
| 35 to 44 Years | 612 (11.6%) | 1,028 (19.8%) |
| 45 to 54 Years | 384 (7.5%) | 549 (10.9%) |
| 55 to 64 Years | 648 (13.1%) | 567 (12.1%) |
| 65 to 74 Years | 372 (11.3%) | 415 (11.1%) |
| 75 Years and over | 94 (5.5%) | 334 (11.5%) |
| Total | 5,475 (13.2%) | 6,783 (16.4%) |
Income Above Poverty by Sex and Age in Sioux City
According to the poverty statistics in Sioux City, males aged 75 years and over and females aged 15 years are the age groups that are most secure financially, with 94.5% of males and 90.9% of females in these age groups living above the poverty line.
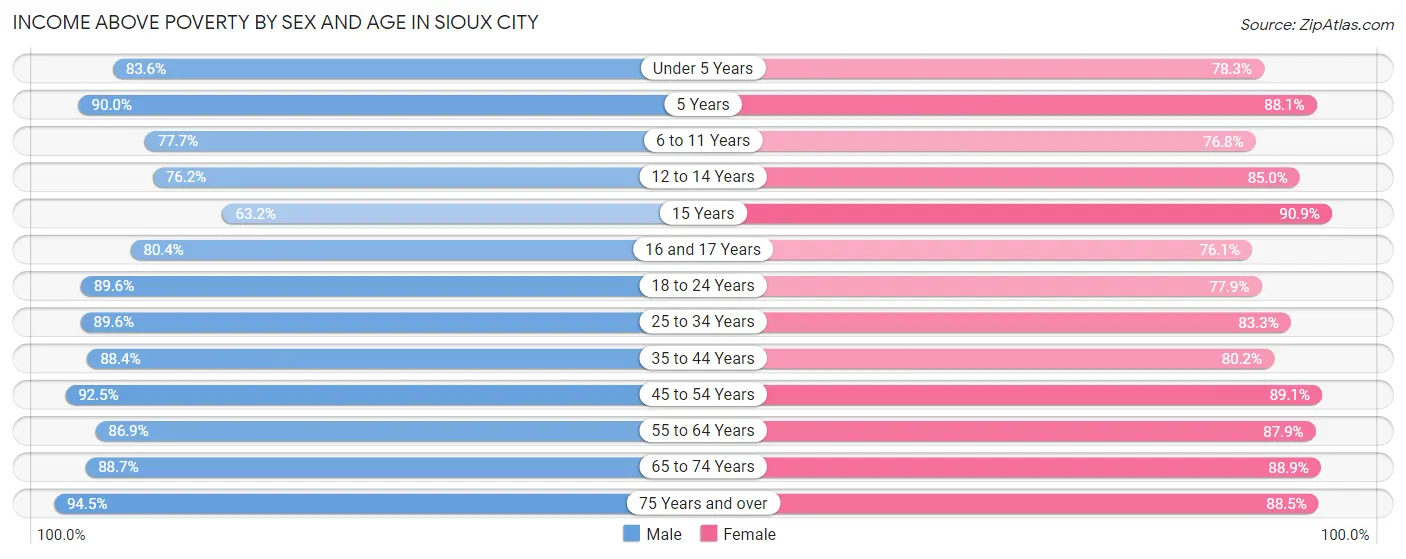
| Age Bracket | Male | Female |
| Under 5 Years | 2,650 (83.6%) | 2,185 (78.3%) |
| 5 Years | 610 (90.0%) | 672 (88.1%) |
| 6 to 11 Years | 2,972 (77.7%) | 2,697 (76.7%) |
| 12 to 14 Years | 1,270 (76.2%) | 1,529 (85.0%) |
| 15 Years | 449 (63.2%) | 639 (90.9%) |
| 16 and 17 Years | 1,047 (80.3%) | 808 (76.1%) |
| 18 to 24 Years | 3,617 (89.5%) | 3,275 (77.8%) |
| 25 to 34 Years | 5,062 (89.6%) | 4,269 (83.3%) |
| 35 to 44 Years | 4,649 (88.4%) | 4,162 (80.2%) |
| 45 to 54 Years | 4,705 (92.4%) | 4,477 (89.1%) |
| 55 to 64 Years | 4,282 (86.9%) | 4,118 (87.9%) |
| 65 to 74 Years | 2,932 (88.7%) | 3,309 (88.9%) |
| 75 Years and over | 1,627 (94.5%) | 2,568 (88.5%) |
| Total | 35,872 (86.8%) | 34,708 (83.7%) |
Income Below Poverty Among Married-Couple Families in Sioux City
The poverty statistics for married-couple families in Sioux City show that 4.2% or 564 of the total 13,585 families live below the poverty line. Families with 5 or more children have the highest poverty rate of 19.9%, comprising of 45 families. On the other hand, families with 1 or 2 children have the lowest poverty rate of 2.7%, which includes 126 families.
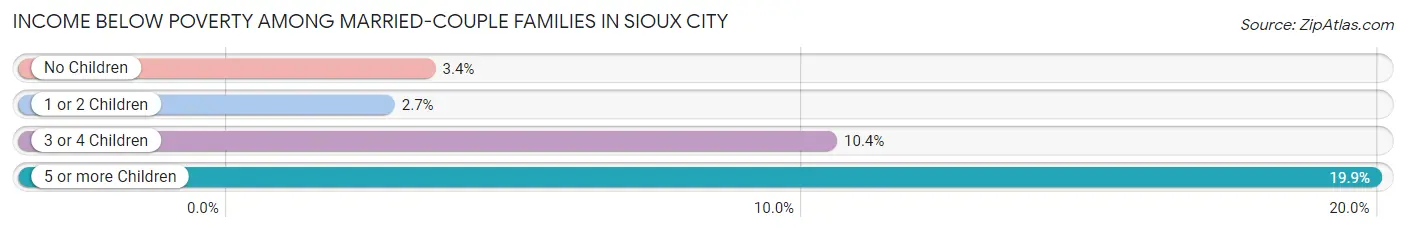
| Children | Above Poverty | Below Poverty |
| No Children | 7,176 (96.6%) | 256 (3.4%) |
| 1 or 2 Children | 4,488 (97.3%) | 126 (2.7%) |
| 3 or 4 Children | 1,176 (89.6%) | 137 (10.4%) |
| 5 or more Children | 181 (80.1%) | 45 (19.9%) |
| Total | 13,021 (95.9%) | 564 (4.2%) |
Income Below Poverty Among Single-Parent Households in Sioux City
According to the poverty data in Sioux City, 10.0% or 191 single-father households and 31.9% or 1,504 single-mother households are living below the poverty line. Among single-father households, those with 1 or 2 children have the highest poverty rate, with 126 households (12.1%) experiencing poverty. Likewise, among single-mother households, those with 5 or more children have the highest poverty rate, with 36 households (66.7%) falling below the poverty line.
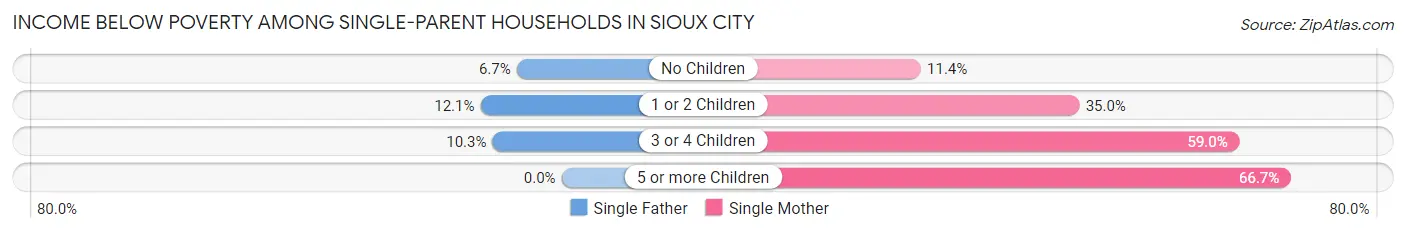
| Children | Single Father | Single Mother |
| No Children | 42 (6.7%) | 160 (11.4%) |
| 1 or 2 Children | 126 (12.1%) | 898 (35.0%) |
| 3 or 4 Children | 23 (10.3%) | 410 (59.0%) |
| 5 or more Children | 0 (0.0%) | 36 (66.7%) |
| Total | 191 (10.0%) | 1,504 (31.9%) |
Income Below Poverty Among Married-Couple vs Single-Parent Households in Sioux City
The poverty data for Sioux City shows that 564 of the married-couple family households (4.2%) and 1,695 of the single-parent households (25.6%) are living below the poverty level. Within the married-couple family households, those with 5 or more children have the highest poverty rate, with 45 households (19.9%) falling below the poverty line. Among the single-parent households, those with 3 or 4 children have the highest poverty rate, with 433 household (47.2%) living below poverty.
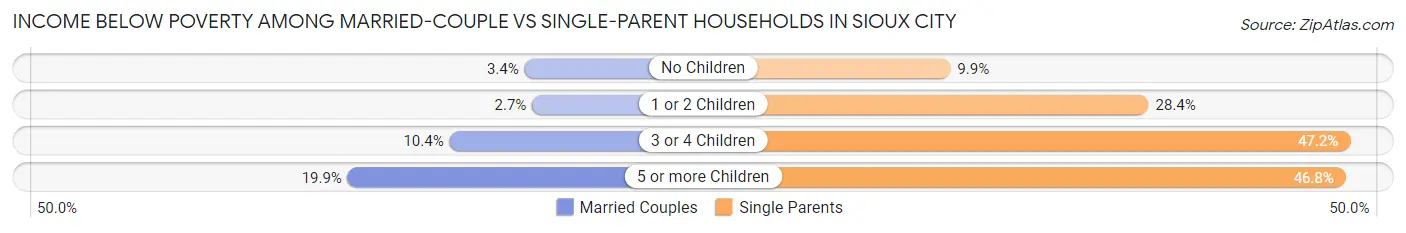
| Children | Married-Couple Families | Single-Parent Households |
| No Children | 256 (3.4%) | 202 (9.9%) |
| 1 or 2 Children | 126 (2.7%) | 1,024 (28.4%) |
| 3 or 4 Children | 137 (10.4%) | 433 (47.2%) |
| 5 or more Children | 45 (19.9%) | 36 (46.8%) |
| Total | 564 (4.2%) | 1,695 (25.6%) |
Race in Sioux City
The most populous races in Sioux City are White / Caucasian (62,231 | 72.8%), Hispanic or Latino (18,264 | 21.4%), and Two or more Races (10,885 | 12.7%).
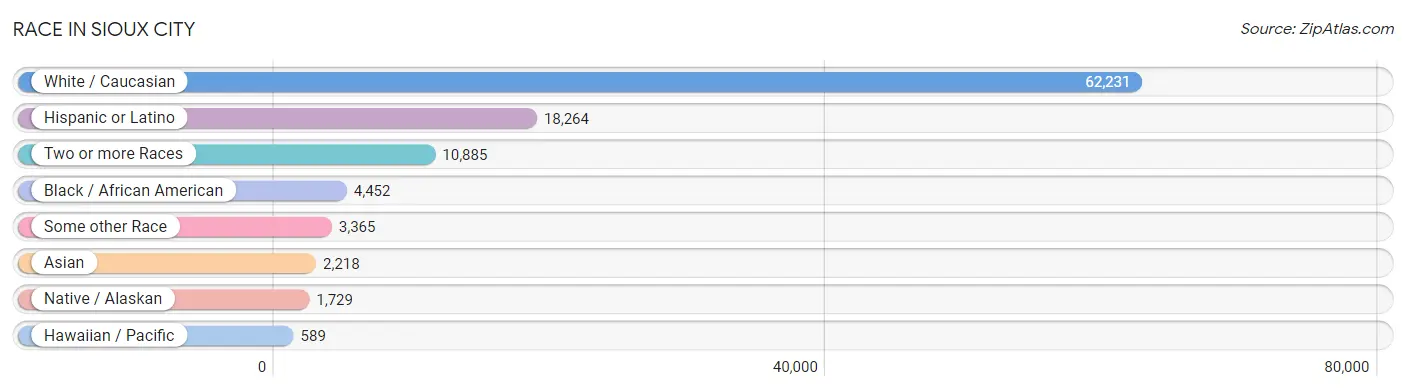
| Race | # Population | % Population |
| Asian | 2,218 | 2.6% |
| Black / African American | 4,452 | 5.2% |
| Hawaiian / Pacific | 589 | 0.7% |
| Hispanic or Latino | 18,264 | 21.4% |
| Native / Alaskan | 1,729 | 2.0% |
| White / Caucasian | 62,231 | 72.8% |
| Two or more Races | 10,885 | 12.7% |
| Some other Race | 3,365 | 3.9% |
| Total | 85,469 | 100.0% |
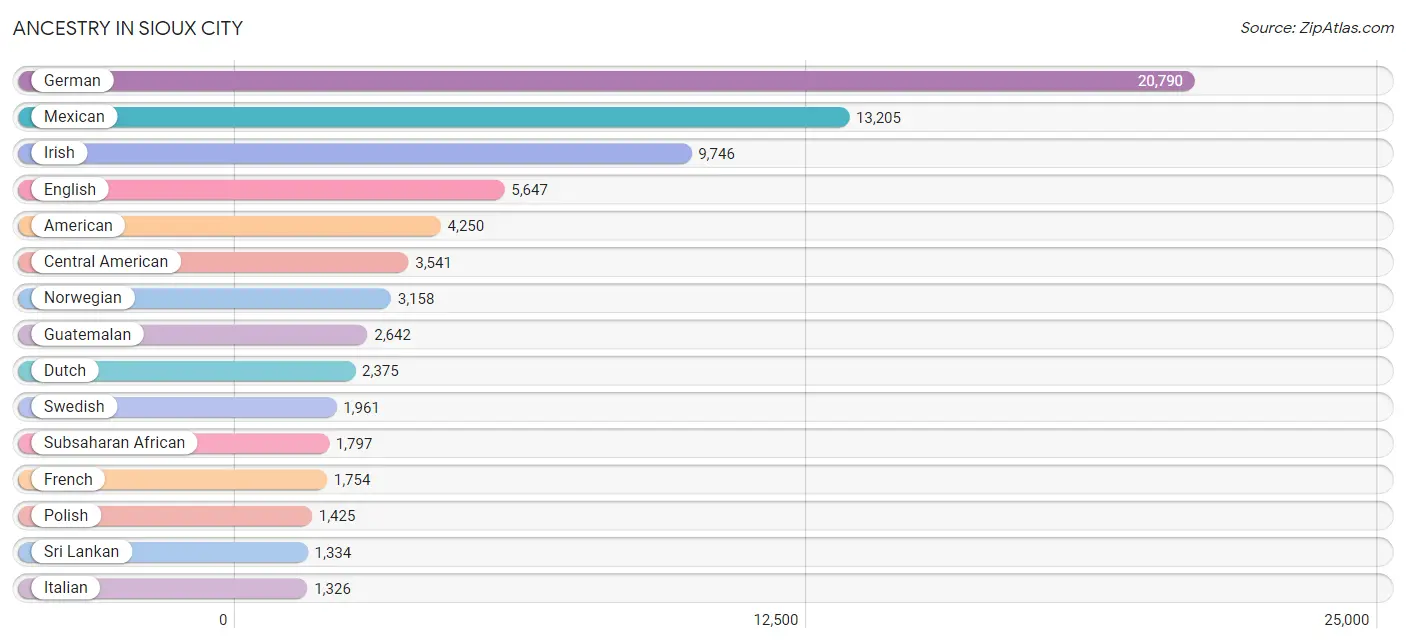
Ancestry in Sioux City
The most populous ancestries reported in Sioux City are German (20,790 | 24.3%), Mexican (13,205 | 15.4%), Irish (9,746 | 11.4%), English (5,647 | 6.6%), and American (4,250 | 5.0%), together accounting for 62.8% of all Sioux City residents.
| Ancestry | # Population | % Population |
| African | 421 | 0.5% |
| Albanian | 5 | 0.0% |
| American | 4,250 | 5.0% |
| Apache | 1 | 0.0% |
| Arab | 482 | 0.6% |
| Armenian | 37 | 0.0% |
| Belgian | 26 | 0.0% |
| Bhutanese | 107 | 0.1% |
| Bolivian | 64 | 0.1% |
| British | 260 | 0.3% |
| Burmese | 260 | 0.3% |
| Cajun | 10 | 0.0% |
| Canadian | 100 | 0.1% |
| Cape Verdean | 5 | 0.0% |
| Central American | 3,541 | 4.1% |
| Central American Indian | 25 | 0.0% |
| Cherokee | 54 | 0.1% |
| Cheyenne | 115 | 0.1% |
| Chilean | 54 | 0.1% |
| Chippewa | 49 | 0.1% |
| Choctaw | 17 | 0.0% |
| Colombian | 48 | 0.1% |
| Croatian | 65 | 0.1% |
| Cuban | 39 | 0.1% |
| Cypriot | 11 | 0.0% |
| Czech | 592 | 0.7% |
| Czechoslovakian | 34 | 0.0% |
| Danish | 1,195 | 1.4% |
| Dominican | 85 | 0.1% |
| Dutch | 2,375 | 2.8% |
| Eastern European | 71 | 0.1% |
| Ecuadorian | 31 | 0.0% |
| Egyptian | 11 | 0.0% |
| English | 5,647 | 6.6% |
| Ethiopian | 878 | 1.0% |
| European | 1,237 | 1.5% |
| Finnish | 5 | 0.0% |
| French | 1,754 | 2.1% |
| French Canadian | 377 | 0.4% |
| German | 20,790 | 24.3% |
| German Russian | 16 | 0.0% |
| Greek | 214 | 0.3% |
| Guamanian / Chamorro | 151 | 0.2% |
| Guatemalan | 2,642 | 3.1% |
| Honduran | 114 | 0.1% |
| Hungarian | 36 | 0.0% |
| Icelander | 127 | 0.2% |
| Indian (Asian) | 175 | 0.2% |
| Indonesian | 30 | 0.0% |
| Iranian | 8 | 0.0% |
| Irish | 9,746 | 11.4% |
| Iroquois | 85 | 0.1% |
| Italian | 1,326 | 1.5% |
| Jamaican | 13 | 0.0% |
| Japanese | 158 | 0.2% |
| Jordanian | 57 | 0.1% |
| Korean | 374 | 0.4% |
| Lebanese | 223 | 0.3% |
| Lithuanian | 40 | 0.1% |
| Luxembourger | 117 | 0.1% |
| Malaysian | 555 | 0.6% |
| Mexican | 13,205 | 15.4% |
| Mexican American Indian | 115 | 0.1% |
| Mongolian | 13 | 0.0% |
| Native Hawaiian | 34 | 0.0% |
| Navajo | 82 | 0.1% |
| Nicaraguan | 92 | 0.1% |
| Nigerian | 11 | 0.0% |
| Northern European | 74 | 0.1% |
| Norwegian | 3,158 | 3.7% |
| Pakistani | 20 | 0.0% |
| Panamanian | 17 | 0.0% |
| Pennsylvania German | 32 | 0.0% |
| Peruvian | 29 | 0.0% |
| Polish | 1,425 | 1.7% |
| Portuguese | 46 | 0.1% |
| Puerto Rican | 491 | 0.6% |
| Romanian | 33 | 0.0% |
| Russian | 408 | 0.5% |
| Salvadoran | 575 | 0.7% |
| Samoan | 295 | 0.4% |
| Scandinavian | 304 | 0.4% |
| Scotch-Irish | 447 | 0.5% |
| Scottish | 704 | 0.8% |
| Senegalese | 43 | 0.1% |
| Serbian | 9 | 0.0% |
| Sioux | 751 | 0.9% |
| Slavic | 5 | 0.0% |
| Slovak | 14 | 0.0% |
| Somali | 34 | 0.0% |
| South American | 226 | 0.3% |
| South American Indian | 10 | 0.0% |
| Spaniard | 93 | 0.1% |
| Spanish | 33 | 0.0% |
| Sri Lankan | 1,334 | 1.6% |
| Subsaharan African | 1,797 | 2.1% |
| Sudanese | 33 | 0.0% |
| Swedish | 1,961 | 2.3% |
| Swiss | 145 | 0.2% |
| Syrian | 112 | 0.1% |
| Thai | 75 | 0.1% |
| Turkish | 4 | 0.0% |
| Ukrainian | 38 | 0.0% |
| Welsh | 283 | 0.3% |
| West Indian | 118 | 0.1% |
| Yugoslavian | 8 | 0.0% | View All 106 Rows |
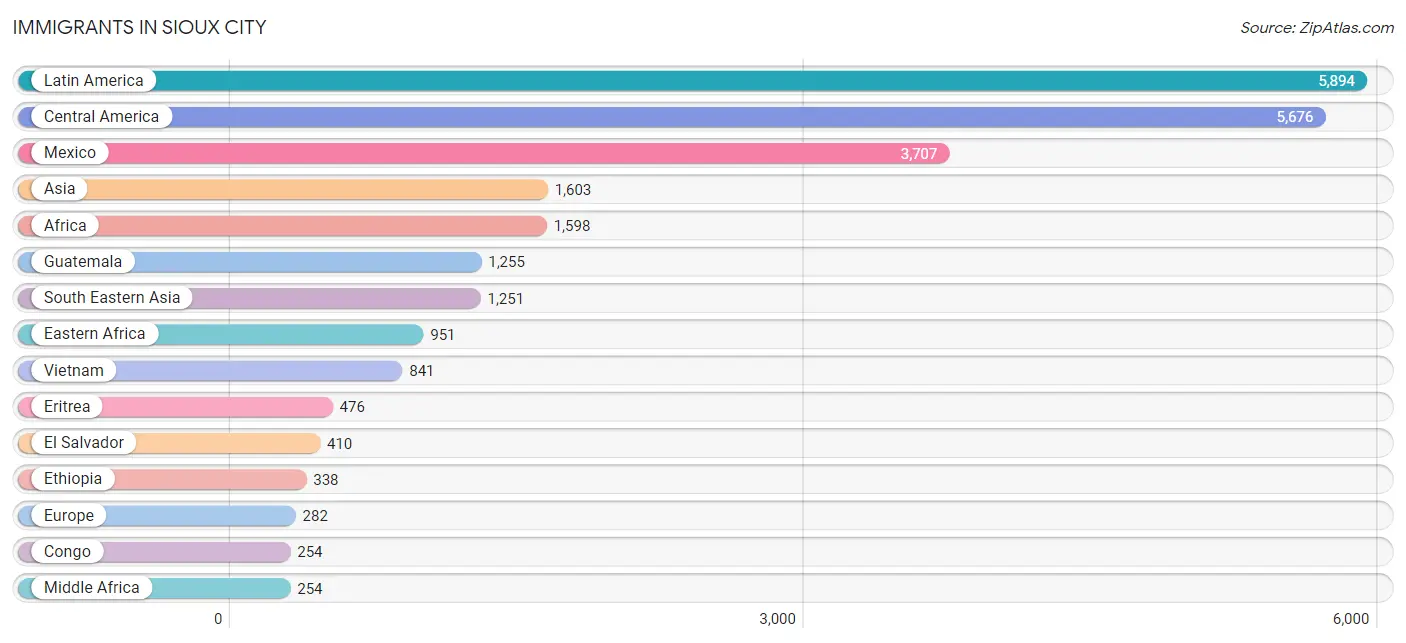
Immigrants in Sioux City
The most numerous immigrant groups reported in Sioux City came from Latin America (5,894 | 6.9%), Central America (5,676 | 6.6%), Mexico (3,707 | 4.3%), Asia (1,603 | 1.9%), and Africa (1,598 | 1.9%), together accounting for 21.6% of all Sioux City residents.
| Immigration Origin | # Population | % Population |
| Africa | 1,598 | 1.9% |
| Asia | 1,603 | 1.9% |
| Bahamas | 16 | 0.0% |
| Cambodia | 47 | 0.1% |
| Canada | 48 | 0.1% |
| Caribbean | 134 | 0.2% |
| Central America | 5,676 | 6.6% |
| Chile | 10 | 0.0% |
| China | 58 | 0.1% |
| Colombia | 37 | 0.0% |
| Congo | 254 | 0.3% |
| Cuba | 34 | 0.0% |
| Eastern Africa | 951 | 1.1% |
| Eastern Asia | 245 | 0.3% |
| Eastern Europe | 32 | 0.0% |
| El Salvador | 410 | 0.5% |
| Eritrea | 476 | 0.6% |
| Ethiopia | 338 | 0.4% |
| Europe | 282 | 0.3% |
| Germany | 99 | 0.1% |
| Greece | 93 | 0.1% |
| Guatemala | 1,255 | 1.5% |
| Honduras | 42 | 0.1% |
| India | 45 | 0.1% |
| Iran | 8 | 0.0% |
| Ireland | 13 | 0.0% |
| Japan | 7 | 0.0% |
| Jordan | 43 | 0.1% |
| Kenya | 103 | 0.1% |
| Korea | 180 | 0.2% |
| Laos | 144 | 0.2% |
| Latin America | 5,894 | 6.9% |
| Liberia | 37 | 0.0% |
| Malaysia | 13 | 0.0% |
| Mexico | 3,707 | 4.3% |
| Micronesia | 180 | 0.2% |
| Middle Africa | 254 | 0.3% |
| Netherlands | 9 | 0.0% |
| Nicaragua | 151 | 0.2% |
| Northern Africa | 67 | 0.1% |
| Northern Europe | 49 | 0.1% |
| Oceania | 180 | 0.2% |
| Panama | 17 | 0.0% |
| Peru | 29 | 0.0% |
| Philippines | 137 | 0.2% |
| Poland | 16 | 0.0% |
| Russia | 16 | 0.0% |
| Senegal | 43 | 0.1% |
| Somalia | 34 | 0.0% |
| South America | 84 | 0.1% |
| South Central Asia | 53 | 0.1% |
| South Eastern Asia | 1,251 | 1.5% |
| Southern Europe | 93 | 0.1% |
| Sudan | 67 | 0.1% |
| Thailand | 39 | 0.1% |
| Venezuela | 8 | 0.0% |
| Vietnam | 841 | 1.0% |
| West Indies | 84 | 0.1% |
| Western Africa | 178 | 0.2% |
| Western Asia | 54 | 0.1% |
| Western Europe | 108 | 0.1% | View All 61 Rows |
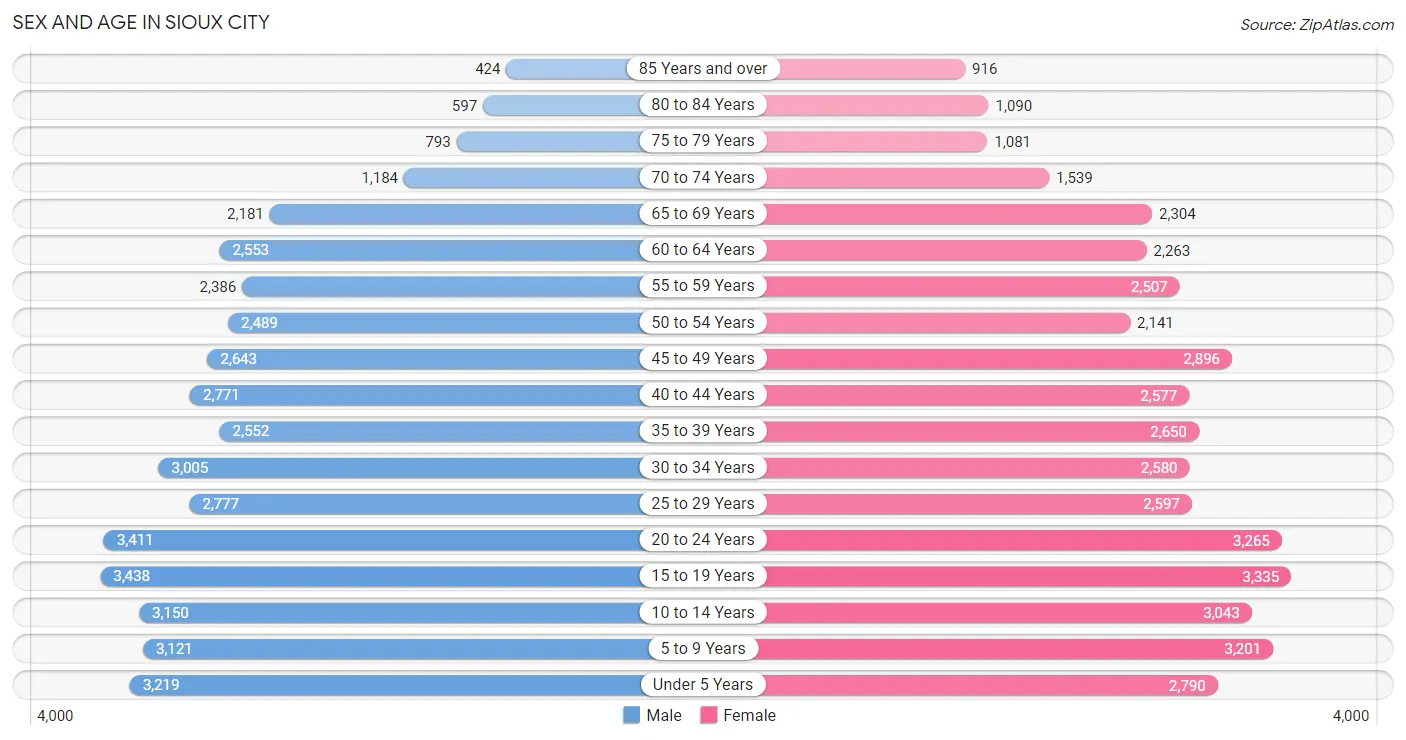
Sex and Age in Sioux City
Sex and Age in Sioux City
The most populous age groups in Sioux City are 15 to 19 Years (3,438 | 8.1%) for men and 15 to 19 Years (3,335 | 7.8%) for women.
| Age Bracket | Male | Female |
| Under 5 Years | 3,219 (7.5%) | 2,790 (6.5%) |
| 5 to 9 Years | 3,121 (7.3%) | 3,201 (7.5%) |
| 10 to 14 Years | 3,150 (7.4%) | 3,043 (7.1%) |
| 15 to 19 Years | 3,438 (8.1%) | 3,335 (7.8%) |
| 20 to 24 Years | 3,411 (8.0%) | 3,265 (7.6%) |
| 25 to 29 Years | 2,777 (6.5%) | 2,597 (6.1%) |
| 30 to 34 Years | 3,005 (7.0%) | 2,580 (6.0%) |
| 35 to 39 Years | 2,552 (6.0%) | 2,650 (6.2%) |
| 40 to 44 Years | 2,771 (6.5%) | 2,577 (6.0%) |
| 45 to 49 Years | 2,643 (6.2%) | 2,896 (6.8%) |
| 50 to 54 Years | 2,489 (5.8%) | 2,141 (5.0%) |
| 55 to 59 Years | 2,386 (5.6%) | 2,507 (5.9%) |
| 60 to 64 Years | 2,553 (6.0%) | 2,263 (5.3%) |
| 65 to 69 Years | 2,181 (5.1%) | 2,304 (5.4%) |
| 70 to 74 Years | 1,184 (2.8%) | 1,539 (3.6%) |
| 75 to 79 Years | 793 (1.9%) | 1,081 (2.5%) |
| 80 to 84 Years | 597 (1.4%) | 1,090 (2.5%) |
| 85 Years and over | 424 (1.0%) | 916 (2.1%) |
| Total | 42,694 (100.0%) | 42,775 (100.0%) |
Families and Households in Sioux City
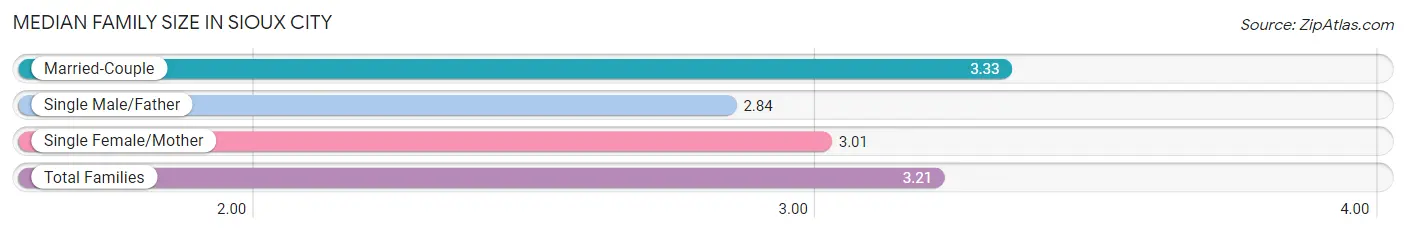
Median Family Size in Sioux City
The median family size in Sioux City is 3.21 persons per family, with married-couple families (13,585 | 67.2%) accounting for the largest median family size of 3.33 persons per family. On the other hand, single male/father families (1,916 | 9.5%) represent the smallest median family size with 2.84 persons per family.
| Family Type | # Families | Family Size |
| Married-Couple | 13,585 (67.2%) | 3.33 |
| Single Male/Father | 1,916 (9.5%) | 2.84 |
| Single Female/Mother | 4,718 (23.3%) | 3.01 |
| Total Families | 20,219 (100.0%) | 3.21 |
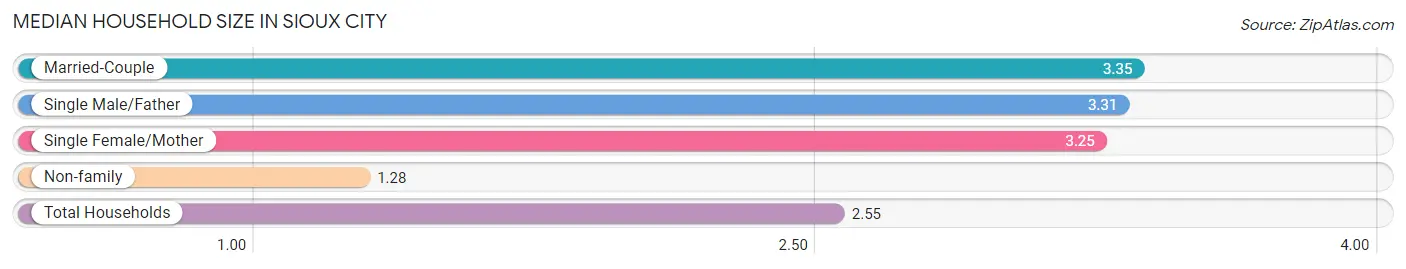
Median Household Size in Sioux City
The median household size in Sioux City is 2.55 persons per household, with married-couple households (13,585 | 41.9%) accounting for the largest median household size of 3.35 persons per household. non-family households (12,230 | 37.7%) represent the smallest median household size with 1.28 persons per household.
| Household Type | # Households | Household Size |
| Married-Couple | 13,585 (41.9%) | 3.35 |
| Single Male/Father | 1,916 (5.9%) | 3.31 |
| Single Female/Mother | 4,718 (14.5%) | 3.25 |
| Non-family | 12,230 (37.7%) | 1.28 |
| Total Households | 32,449 (100.0%) | 2.55 |
Household Size by Marriage Status in Sioux City
Out of a total of 32,449 households in Sioux City, 20,219 (62.3%) are family households, while 12,230 (37.7%) are nonfamily households. The most numerous type of family households are 2-person households, comprising 7,827, and the most common type of nonfamily households are 1-person households, comprising 9,700.
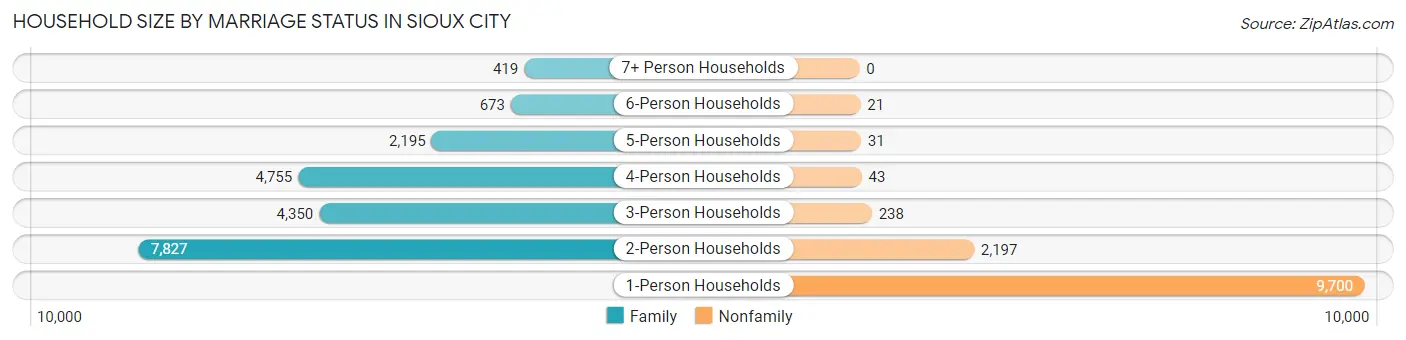
| Household Size | Family Households | Nonfamily Households |
| 1-Person Households | - | 9,700 (29.9%) |
| 2-Person Households | 7,827 (24.1%) | 2,197 (6.8%) |
| 3-Person Households | 4,350 (13.4%) | 238 (0.7%) |
| 4-Person Households | 4,755 (14.6%) | 43 (0.1%) |
| 5-Person Households | 2,195 (6.8%) | 31 (0.1%) |
| 6-Person Households | 673 (2.1%) | 21 (0.1%) |
| 7+ Person Households | 419 (1.3%) | 0 (0.0%) |
| Total | 20,219 (62.3%) | 12,230 (37.7%) |
Female Fertility in Sioux City
Fertility by Age in Sioux City
Average fertility rate in Sioux City is 51.0 births per 1,000 women. Women in the age bracket of 20 to 34 years have the highest fertility rate with 96.0 births per 1,000 women. Women in the age bracket of 20 to 34 years acount for 77.4% of all women with births.
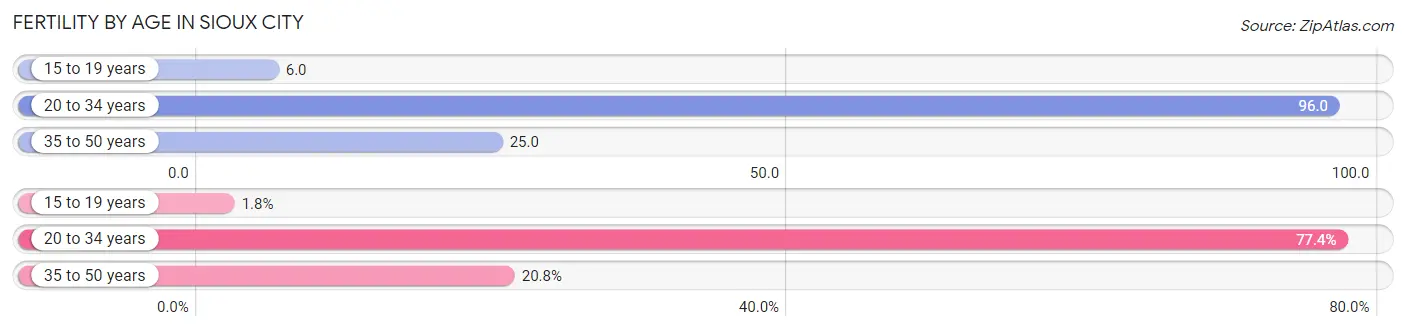
| Age Bracket | Women with Births | Births / 1,000 Women |
| 15 to 19 years | 19 (1.8%) | 6.0 |
| 20 to 34 years | 814 (77.4%) | 96.0 |
| 35 to 50 years | 219 (20.8%) | 25.0 |
| Total | 1,052 (100.0%) | 51.0 |
Fertility by Age by Marriage Status in Sioux City
58.2% of women with births (1,052) in Sioux City are married. The highest percentage of unmarried women with births falls into 15 to 19 years age bracket with 100.0% of them unmarried at the time of birth, while the lowest percentage of unmarried women with births belong to 20 to 34 years age bracket with 39.6% of them unmarried.
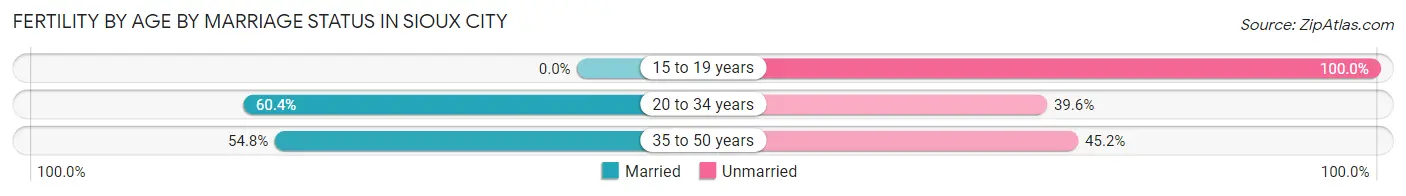
| Age Bracket | Married | Unmarried |
| 15 to 19 years | 0 (0.0%) | 19 (100.0%) |
| 20 to 34 years | 492 (60.4%) | 322 (39.6%) |
| 35 to 50 years | 120 (54.8%) | 99 (45.2%) |
| Total | 612 (58.2%) | 440 (41.8%) |
Fertility by Education in Sioux City
Average fertility rate in Sioux City is 51.0 births per 1,000 women. Women with the education attainment of high school diploma have the highest fertility rate of 76.0 births per 1,000 women, while women with the education attainment of less than high school have the lowest fertility at 23.0 births per 1,000 women. Women with the education attainment of college or associate's degree represent 35.4% of all women with births.
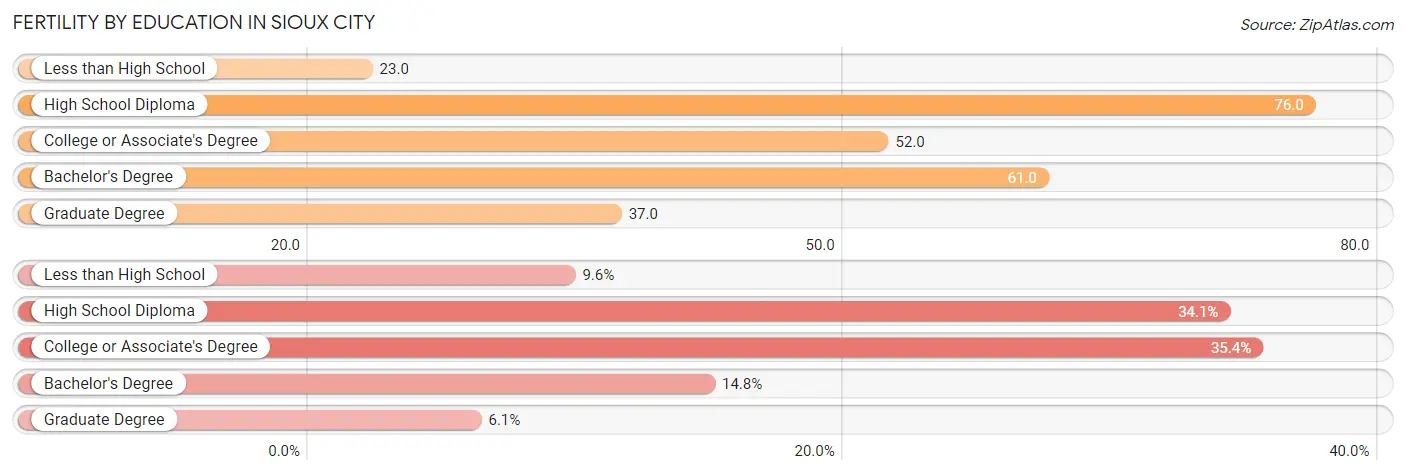
| Educational Attainment | Women with Births | Births / 1,000 Women |
| Less than High School | 101 (9.6%) | 23.0 |
| High School Diploma | 359 (34.1%) | 76.0 |
| College or Associate's Degree | 372 (35.4%) | 52.0 |
| Bachelor's Degree | 156 (14.8%) | 61.0 |
| Graduate Degree | 64 (6.1%) | 37.0 |
| Total | 1,052 (100.0%) | 51.0 |
Fertility by Education by Marriage Status in Sioux City
41.8% of women with births in Sioux City are unmarried. Women with the educational attainment of graduate degree are most likely to be married with 100.0% of them married at childbirth, while women with the educational attainment of high school diploma are least likely to be married with 58.2% of them unmarried at childbirth.
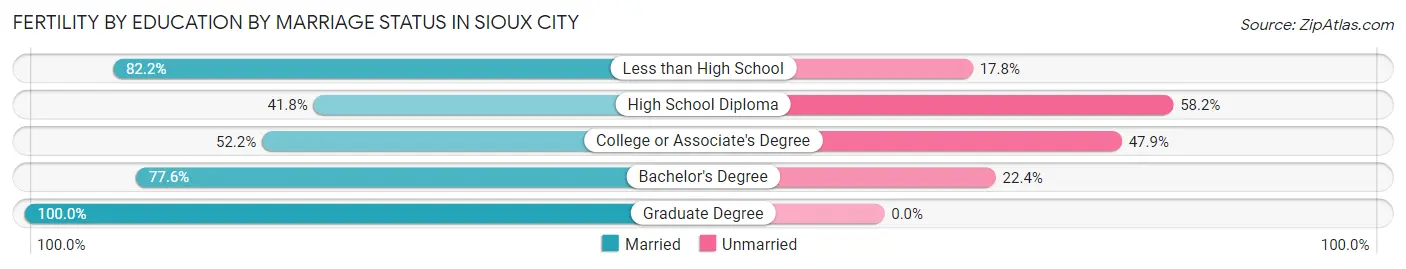
| Educational Attainment | Married | Unmarried |
| Less than High School | 83 (82.2%) | 18 (17.8%) |
| High School Diploma | 150 (41.8%) | 209 (58.2%) |
| College or Associate's Degree | 194 (52.1%) | 178 (47.8%) |
| Bachelor's Degree | 121 (77.6%) | 35 (22.4%) |
| Graduate Degree | 64 (100.0%) | 0 (0.0%) |
| Total | 612 (58.2%) | 440 (41.8%) |
Employment Characteristics in Sioux City
Employment by Class of Employer in Sioux City
Among the 41,917 employed individuals in Sioux City, private company employees (31,069 | 74.1%), not-for-profit organizations (3,972 | 9.5%), and local government employees (2,928 | 7.0%) make up the most common classes of employment.
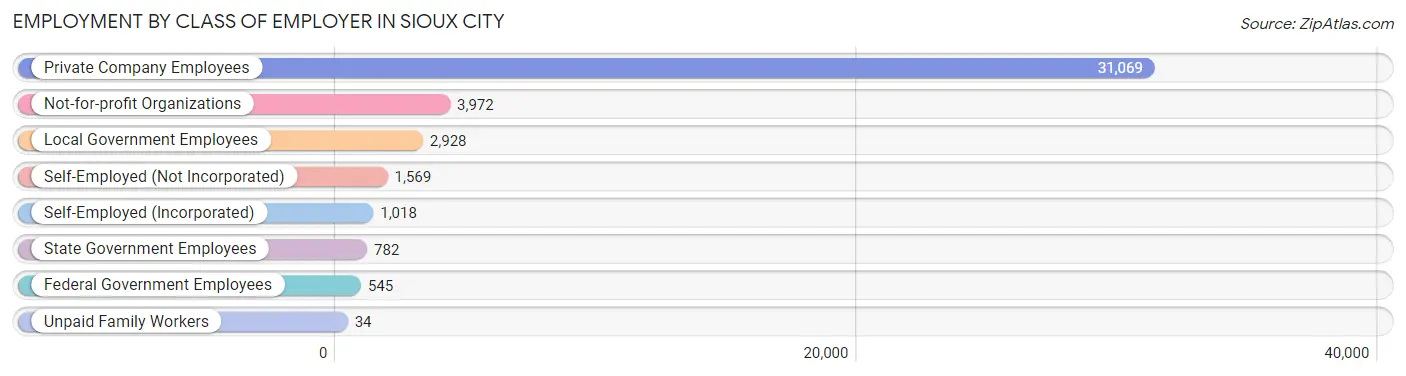
| Employer Class | # Employees | % Employees |
| Private Company Employees | 31,069 | 74.1% |
| Self-Employed (Incorporated) | 1,018 | 2.4% |
| Self-Employed (Not Incorporated) | 1,569 | 3.7% |
| Not-for-profit Organizations | 3,972 | 9.5% |
| Local Government Employees | 2,928 | 7.0% |
| State Government Employees | 782 | 1.9% |
| Federal Government Employees | 545 | 1.3% |
| Unpaid Family Workers | 34 | 0.1% |
| Total | 41,917 | 100.0% |
Employment Status by Age in Sioux City
According to the labor force statistics for Sioux City, out of the total population over 16 years of age (65,521), 68.5% or 44,882 individuals are in the labor force, with 4.7% or 2,109 of them unemployed. The age group with the highest labor force participation rate is 30 to 34 years, with 88.1% or 4,920 individuals in the labor force. Within the labor force, the 20 to 24 years age range has the highest percentage of unemployed individuals, with 11.1% or 600 of them being unemployed.
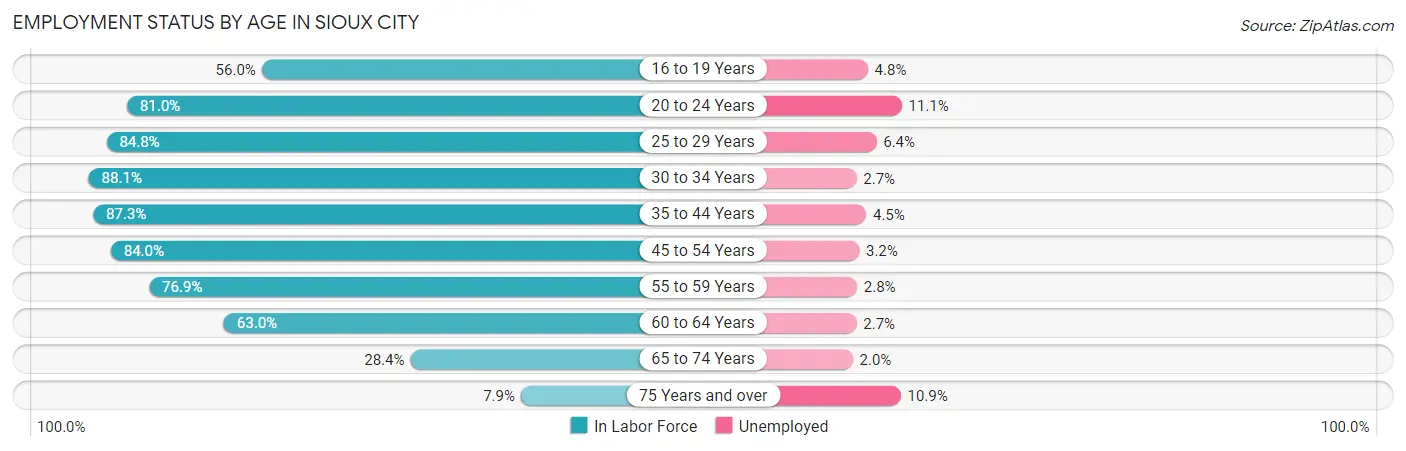
| Age Bracket | In Labor Force | Unemployed |
| 16 to 19 Years | 2,995 (56.0%) | 144 (4.8%) |
| 20 to 24 Years | 5,408 (81.0%) | 600 (11.1%) |
| 25 to 29 Years | 4,557 (84.8%) | 292 (6.4%) |
| 30 to 34 Years | 4,920 (88.1%) | 133 (2.7%) |
| 35 to 44 Years | 9,210 (87.3%) | 414 (4.5%) |
| 45 to 54 Years | 8,542 (84.0%) | 273 (3.2%) |
| 55 to 59 Years | 3,763 (76.9%) | 105 (2.8%) |
| 60 to 64 Years | 3,034 (63.0%) | 82 (2.7%) |
| 65 to 74 Years | 2,047 (28.4%) | 41 (2.0%) |
| 75 Years and over | 387 (7.9%) | 42 (10.9%) |
| Total | 44,882 (68.5%) | 2,109 (4.7%) |
Employment Status by Educational Attainment in Sioux City
According to labor force statistics for Sioux City, 82.2% of individuals (34,020) out of the total population between 25 and 64 years of age (41,387) are in the labor force, with 3.8% or 1,293 of them being unemployed. The group with the highest labor force participation rate are those with the educational attainment of bachelor's degree or higher, with 89.1% or 8,374 individuals in the labor force. Within the labor force, individuals with less than high school education have the highest percentage of unemployment, with 5.6% or 253 of them being unemployed.
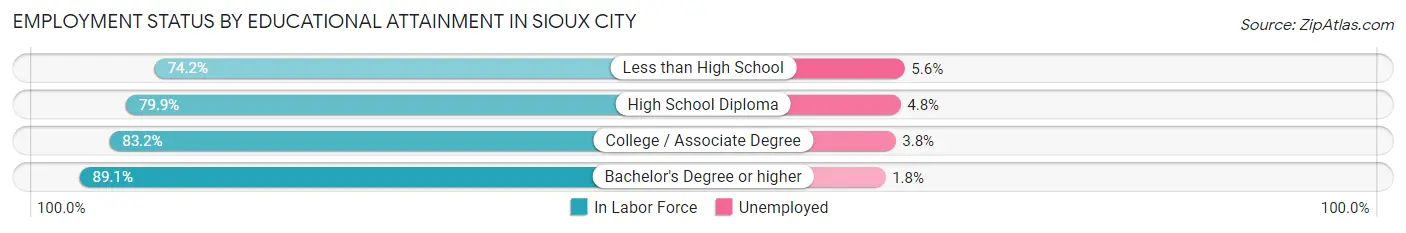
| Educational Attainment | In Labor Force | Unemployed |
| Less than High School | 4,521 (74.2%) | 341 (5.6%) |
| High School Diploma | 10,043 (79.9%) | 603 (4.8%) |
| College / Associate Degree | 11,087 (83.2%) | 506 (3.8%) |
| Bachelor's Degree or higher | 8,374 (89.1%) | 169 (1.8%) |
| Total | 34,020 (82.2%) | 1,573 (3.8%) |
Employment Occupations by Sex in Sioux City
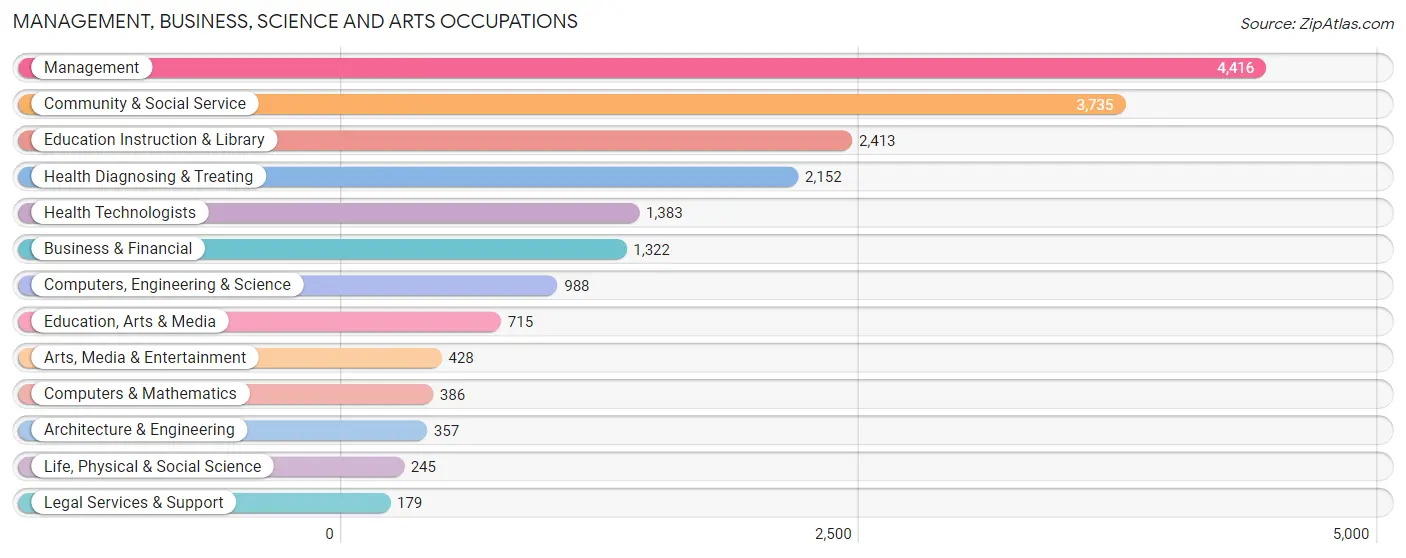
Management, Business, Science and Arts Occupations
The most common Management, Business, Science and Arts occupations in Sioux City are Management (4,416 | 10.3%), Community & Social Service (3,735 | 8.7%), Education Instruction & Library (2,413 | 5.7%), Health Diagnosing & Treating (2,152 | 5.0%), and Health Technologists (1,383 | 3.2%).
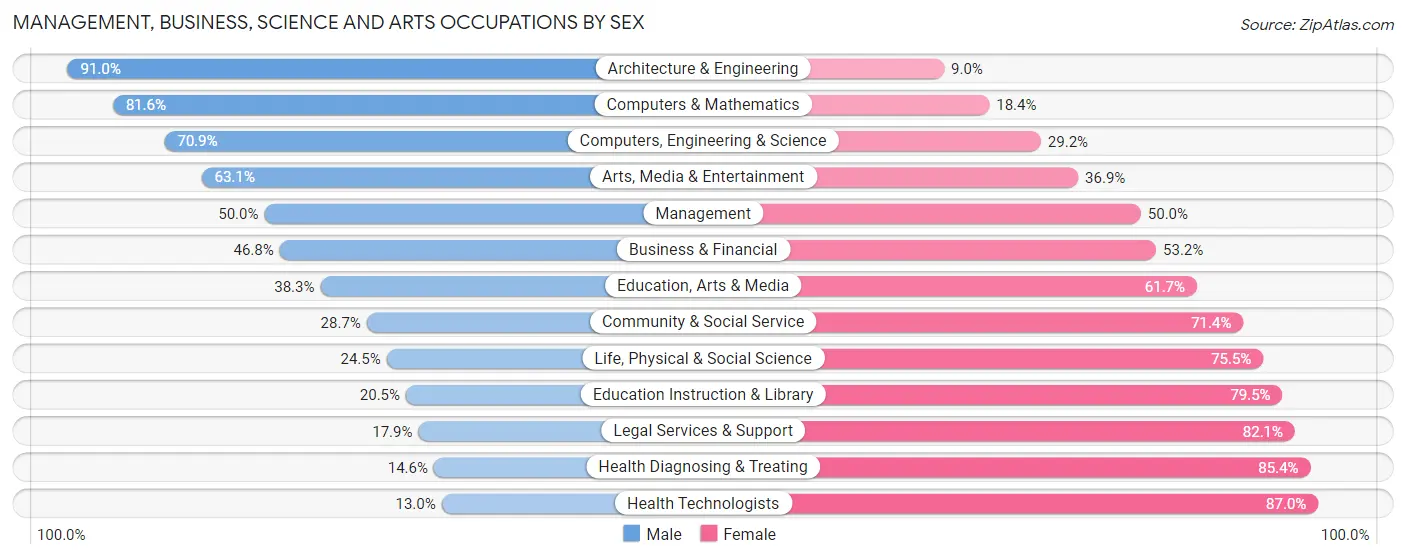
Management, Business, Science and Arts Occupations by Sex
Within the Management, Business, Science and Arts occupations in Sioux City, the most male-oriented occupations are Architecture & Engineering (91.0%), Computers & Mathematics (81.6%), and Computers, Engineering & Science (70.9%), while the most female-oriented occupations are Health Technologists (87.0%), Health Diagnosing & Treating (85.4%), and Legal Services & Support (82.1%).
| Occupation | Male | Female |
| Management | 2,208 (50.0%) | 2,208 (50.0%) |
| Business & Financial | 619 (46.8%) | 703 (53.2%) |
| Computers, Engineering & Science | 700 (70.9%) | 288 (29.1%) |
| Computers & Mathematics | 315 (81.6%) | 71 (18.4%) |
| Architecture & Engineering | 325 (91.0%) | 32 (9.0%) |
| Life, Physical & Social Science | 60 (24.5%) | 185 (75.5%) |
| Community & Social Service | 1,070 (28.6%) | 2,665 (71.4%) |
| Education, Arts & Media | 274 (38.3%) | 441 (61.7%) |
| Legal Services & Support | 32 (17.9%) | 147 (82.1%) |
| Education Instruction & Library | 494 (20.5%) | 1,919 (79.5%) |
| Arts, Media & Entertainment | 270 (63.1%) | 158 (36.9%) |
| Health Diagnosing & Treating | 315 (14.6%) | 1,837 (85.4%) |
| Health Technologists | 180 (13.0%) | 1,203 (87.0%) |
| Total (Category) | 4,912 (38.9%) | 7,701 (61.1%) |
| Total (Overall) | 22,504 (52.7%) | 20,195 (47.3%) |
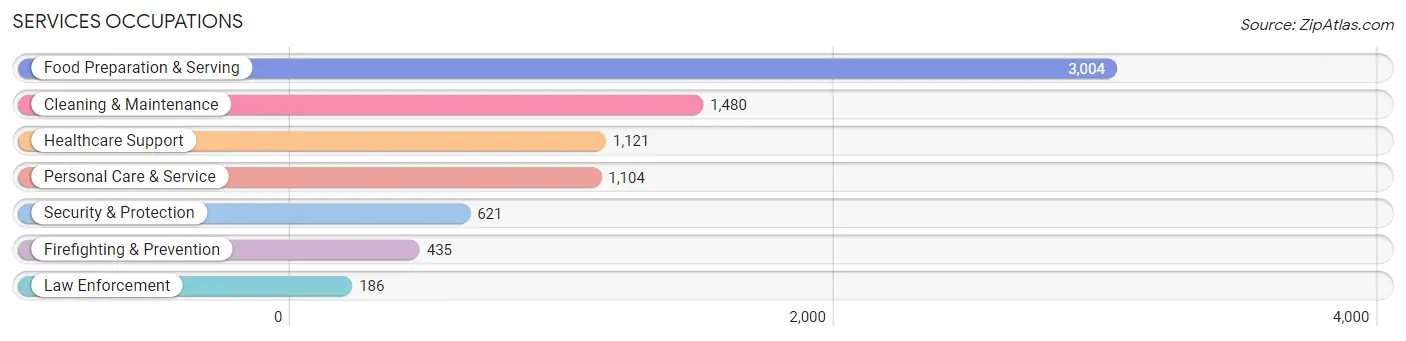
Services Occupations
The most common Services occupations in Sioux City are Food Preparation & Serving (3,004 | 7.0%), Cleaning & Maintenance (1,480 | 3.5%), Healthcare Support (1,121 | 2.6%), Personal Care & Service (1,104 | 2.6%), and Security & Protection (621 | 1.5%).
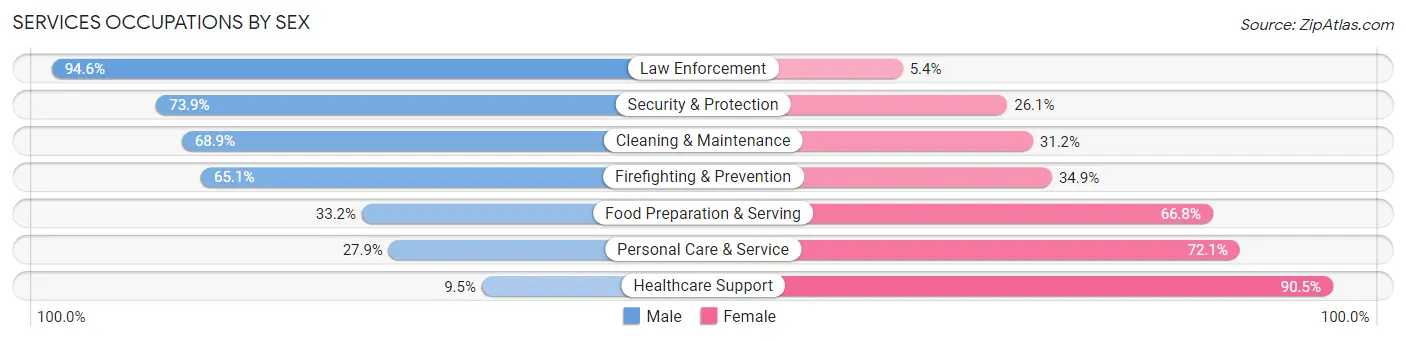
Services Occupations by Sex
Within the Services occupations in Sioux City, the most male-oriented occupations are Law Enforcement (94.6%), Security & Protection (73.9%), and Cleaning & Maintenance (68.9%), while the most female-oriented occupations are Healthcare Support (90.5%), Personal Care & Service (72.1%), and Food Preparation & Serving (66.8%).
| Occupation | Male | Female |
| Healthcare Support | 106 (9.5%) | 1,015 (90.5%) |
| Security & Protection | 459 (73.9%) | 162 (26.1%) |
| Firefighting & Prevention | 283 (65.1%) | 152 (34.9%) |
| Law Enforcement | 176 (94.6%) | 10 (5.4%) |
| Food Preparation & Serving | 998 (33.2%) | 2,006 (66.8%) |
| Cleaning & Maintenance | 1,019 (68.9%) | 461 (31.1%) |
| Personal Care & Service | 308 (27.9%) | 796 (72.1%) |
| Total (Category) | 2,890 (39.4%) | 4,440 (60.6%) |
| Total (Overall) | 22,504 (52.7%) | 20,195 (47.3%) |
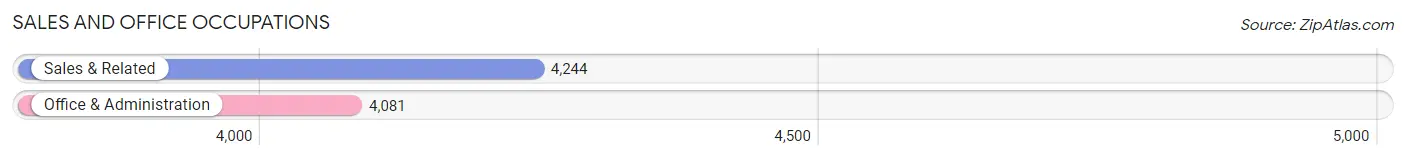
Sales and Office Occupations
The most common Sales and Office occupations in Sioux City are Sales & Related (4,244 | 9.9%), and Office & Administration (4,081 | 9.6%).
Sales and Office Occupations by Sex
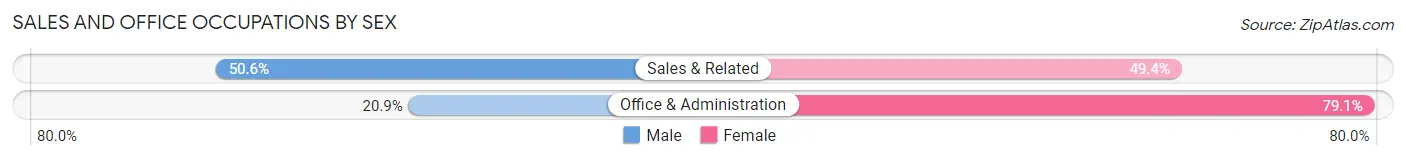
| Occupation | Male | Female |
| Sales & Related | 2,147 (50.6%) | 2,097 (49.4%) |
| Office & Administration | 854 (20.9%) | 3,227 (79.1%) |
| Total (Category) | 3,001 (36.0%) | 5,324 (63.9%) |
| Total (Overall) | 22,504 (52.7%) | 20,195 (47.3%) |
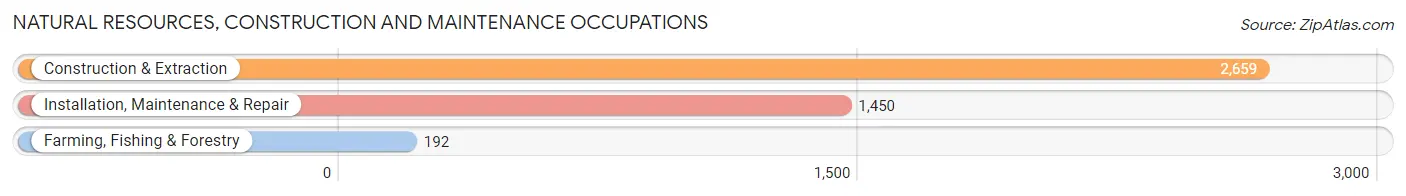
Natural Resources, Construction and Maintenance Occupations
The most common Natural Resources, Construction and Maintenance occupations in Sioux City are Construction & Extraction (2,659 | 6.2%), Installation, Maintenance & Repair (1,450 | 3.4%), and Farming, Fishing & Forestry (192 | 0.4%).
Natural Resources, Construction and Maintenance Occupations by Sex
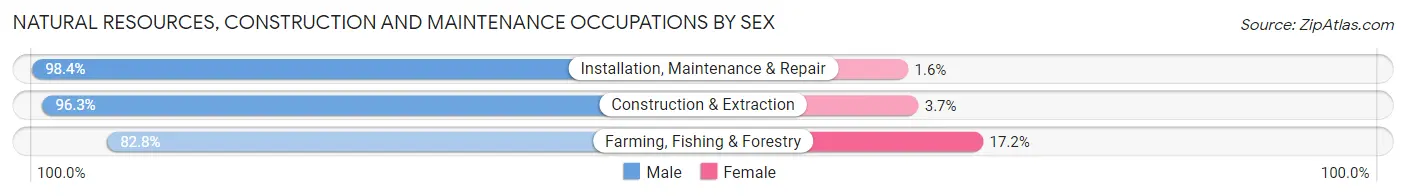
| Occupation | Male | Female |
| Farming, Fishing & Forestry | 159 (82.8%) | 33 (17.2%) |
| Construction & Extraction | 2,560 (96.3%) | 99 (3.7%) |
| Installation, Maintenance & Repair | 1,427 (98.4%) | 23 (1.6%) |
| Total (Category) | 4,146 (96.4%) | 155 (3.6%) |
| Total (Overall) | 22,504 (52.7%) | 20,195 (47.3%) |
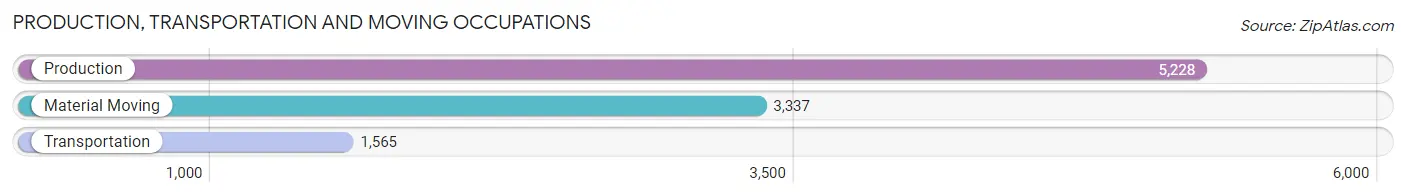
Production, Transportation and Moving Occupations
The most common Production, Transportation and Moving occupations in Sioux City are Production (5,228 | 12.2%), Material Moving (3,337 | 7.8%), and Transportation (1,565 | 3.7%).
Production, Transportation and Moving Occupations by Sex
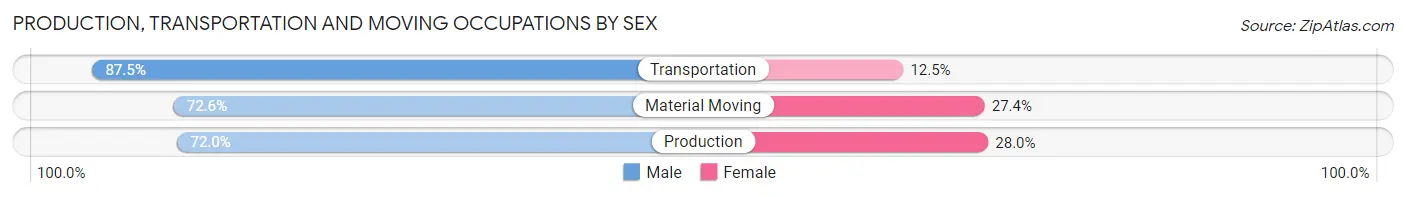
| Occupation | Male | Female |
| Production | 3,762 (72.0%) | 1,466 (28.0%) |
| Transportation | 1,370 (87.5%) | 195 (12.5%) |
| Material Moving | 2,423 (72.6%) | 914 (27.4%) |
| Total (Category) | 7,555 (74.6%) | 2,575 (25.4%) |
| Total (Overall) | 22,504 (52.7%) | 20,195 (47.3%) |
Employment Industries by Sex in Sioux City
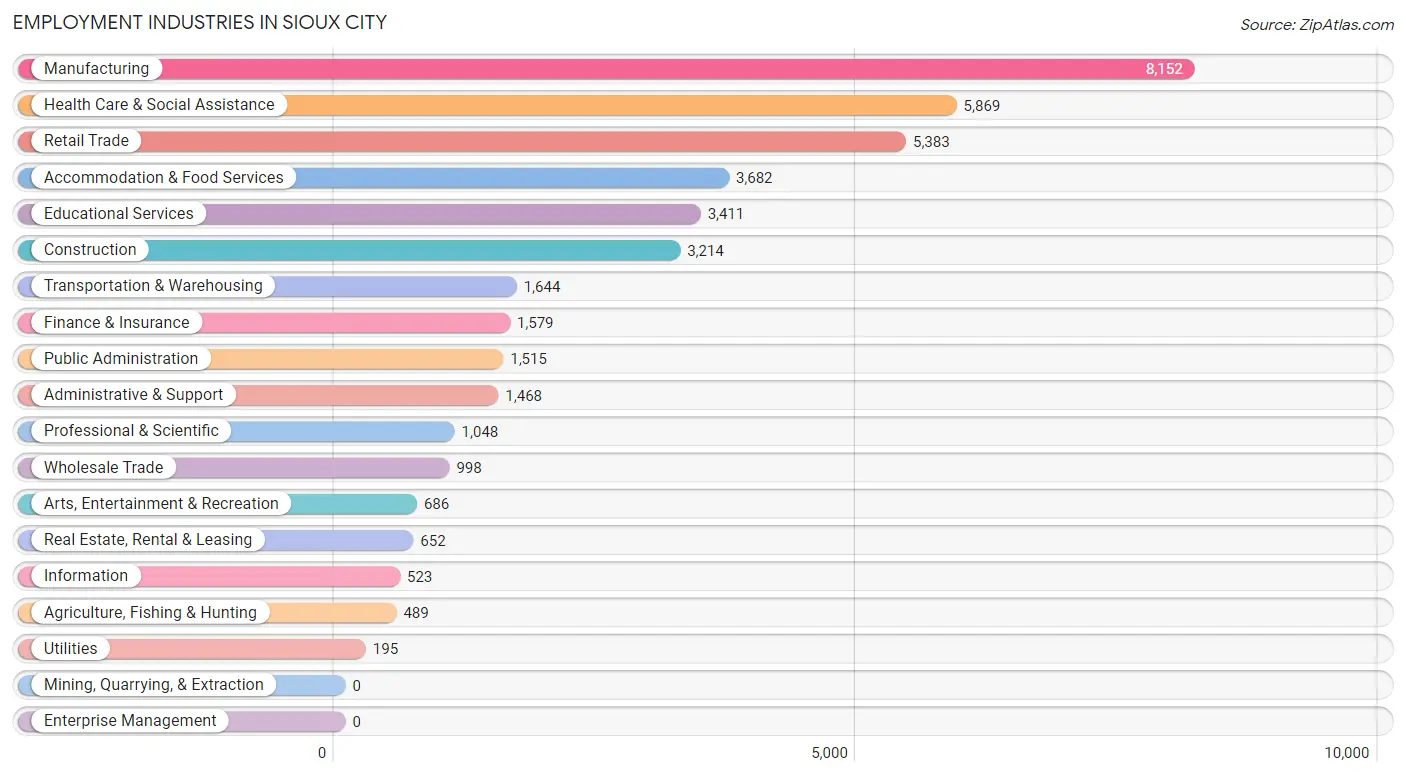
Employment Industries in Sioux City
The major employment industries in Sioux City include Manufacturing (8,152 | 19.1%), Health Care & Social Assistance (5,869 | 13.8%), Retail Trade (5,383 | 12.6%), Accommodation & Food Services (3,682 | 8.6%), and Educational Services (3,411 | 8.0%).
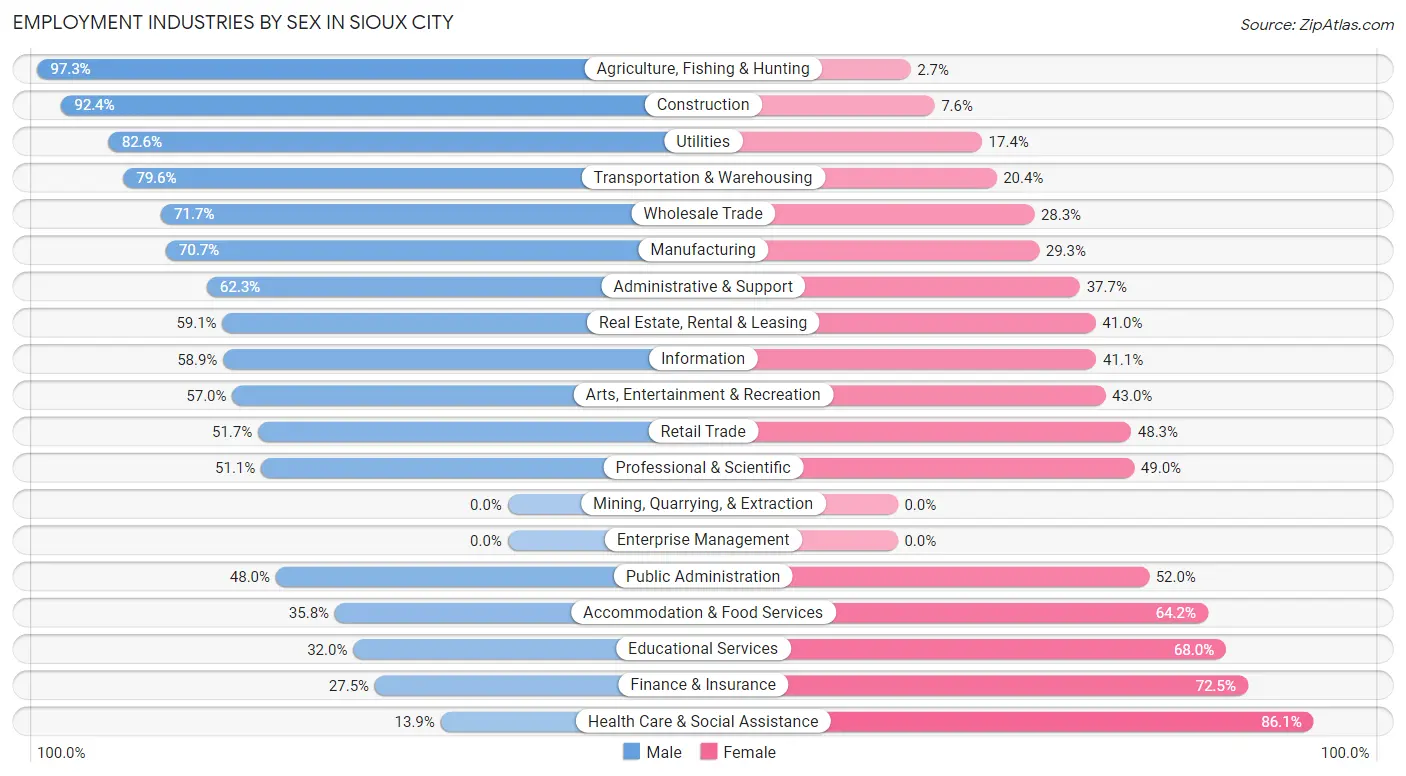
Employment Industries by Sex in Sioux City
The Sioux City industries that see more men than women are Agriculture, Fishing & Hunting (97.3%), Construction (92.4%), and Utilities (82.6%), whereas the industries that tend to have a higher number of women are Health Care & Social Assistance (86.1%), Finance & Insurance (72.5%), and Educational Services (68.0%).
| Industry | Male | Female |
| Agriculture, Fishing & Hunting | 476 (97.3%) | 13 (2.7%) |
| Mining, Quarrying, & Extraction | 0 (0.0%) | 0 (0.0%) |
| Construction | 2,969 (92.4%) | 245 (7.6%) |
| Manufacturing | 5,767 (70.7%) | 2,385 (29.3%) |
| Wholesale Trade | 716 (71.7%) | 282 (28.3%) |
| Retail Trade | 2,782 (51.7%) | 2,601 (48.3%) |
| Transportation & Warehousing | 1,308 (79.6%) | 336 (20.4%) |
| Utilities | 161 (82.6%) | 34 (17.4%) |
| Information | 308 (58.9%) | 215 (41.1%) |
| Finance & Insurance | 434 (27.5%) | 1,145 (72.5%) |
| Real Estate, Rental & Leasing | 385 (59.1%) | 267 (40.9%) |
| Professional & Scientific | 535 (51.0%) | 513 (48.9%) |
| Enterprise Management | 0 (0.0%) | 0 (0.0%) |
| Administrative & Support | 914 (62.3%) | 554 (37.7%) |
| Educational Services | 1,091 (32.0%) | 2,320 (68.0%) |
| Health Care & Social Assistance | 815 (13.9%) | 5,054 (86.1%) |
| Arts, Entertainment & Recreation | 391 (57.0%) | 295 (43.0%) |
| Accommodation & Food Services | 1,317 (35.8%) | 2,365 (64.2%) |
| Public Administration | 727 (48.0%) | 788 (52.0%) |
| Total | 22,504 (52.7%) | 20,195 (47.3%) |
Education in Sioux City
School Enrollment in Sioux City
The most common levels of schooling among the 22,909 students in Sioux City are high school (5,113 | 22.3%), middle school (5,017 | 21.9%), and elementary school (4,855 | 21.2%).
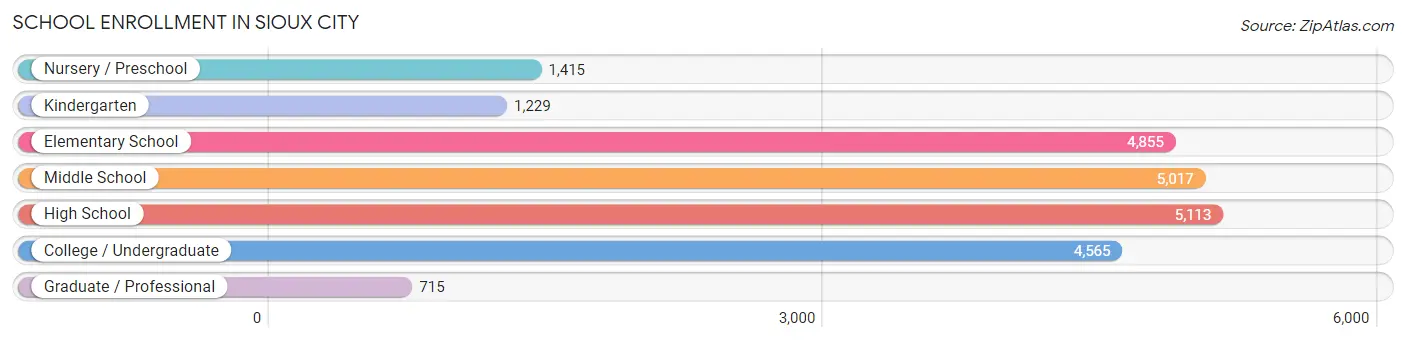
| School Level | # Students | % Students |
| Nursery / Preschool | 1,415 | 6.2% |
| Kindergarten | 1,229 | 5.4% |
| Elementary School | 4,855 | 21.2% |
| Middle School | 5,017 | 21.9% |
| High School | 5,113 | 22.3% |
| College / Undergraduate | 4,565 | 19.9% |
| Graduate / Professional | 715 | 3.1% |
| Total | 22,909 | 100.0% |
School Enrollment by Age by Funding Source in Sioux City
Out of a total of 22,909 students who are enrolled in schools in Sioux City, 4,009 (17.5%) attend a private institution, while the remaining 18,900 (82.5%) are enrolled in public schools. The age group of 20 to 24 year olds has the highest likelihood of being enrolled in private schools, with 1,170 (50.3% in the age bracket) enrolled. Conversely, the age group of 5 to 9 year old has the lowest likelihood of being enrolled in a private school, with 5,384 (90.9% in the age bracket) attending a public institution.
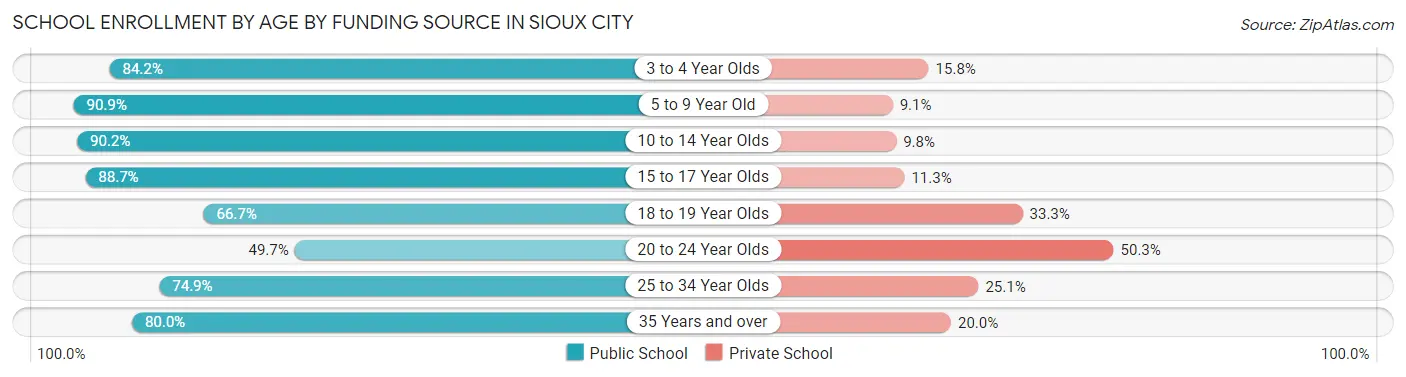
| Age Bracket | Public School | Private School |
| 3 to 4 Year Olds | 877 (84.2%) | 165 (15.8%) |
| 5 to 9 Year Old | 5,384 (90.9%) | 541 (9.1%) |
| 10 to 14 Year Olds | 5,483 (90.2%) | 595 (9.8%) |
| 15 to 17 Year Olds | 3,288 (88.7%) | 420 (11.3%) |
| 18 to 19 Year Olds | 1,502 (66.7%) | 751 (33.3%) |
| 20 to 24 Year Olds | 1,157 (49.7%) | 1,170 (50.3%) |
| 25 to 34 Year Olds | 656 (74.9%) | 220 (25.1%) |
| 35 Years and over | 560 (80.0%) | 140 (20.0%) |
| Total | 18,900 (82.5%) | 4,009 (17.5%) |
Educational Attainment by Field of Study in Sioux City
Business (2,777 | 21.1%), education (2,742 | 20.8%), science & technology (1,327 | 10.1%), arts & humanities (1,003 | 7.6%), and psychology (855 | 6.5%) are the most common fields of study among 13,156 individuals in Sioux City who have obtained a bachelor's degree or higher.
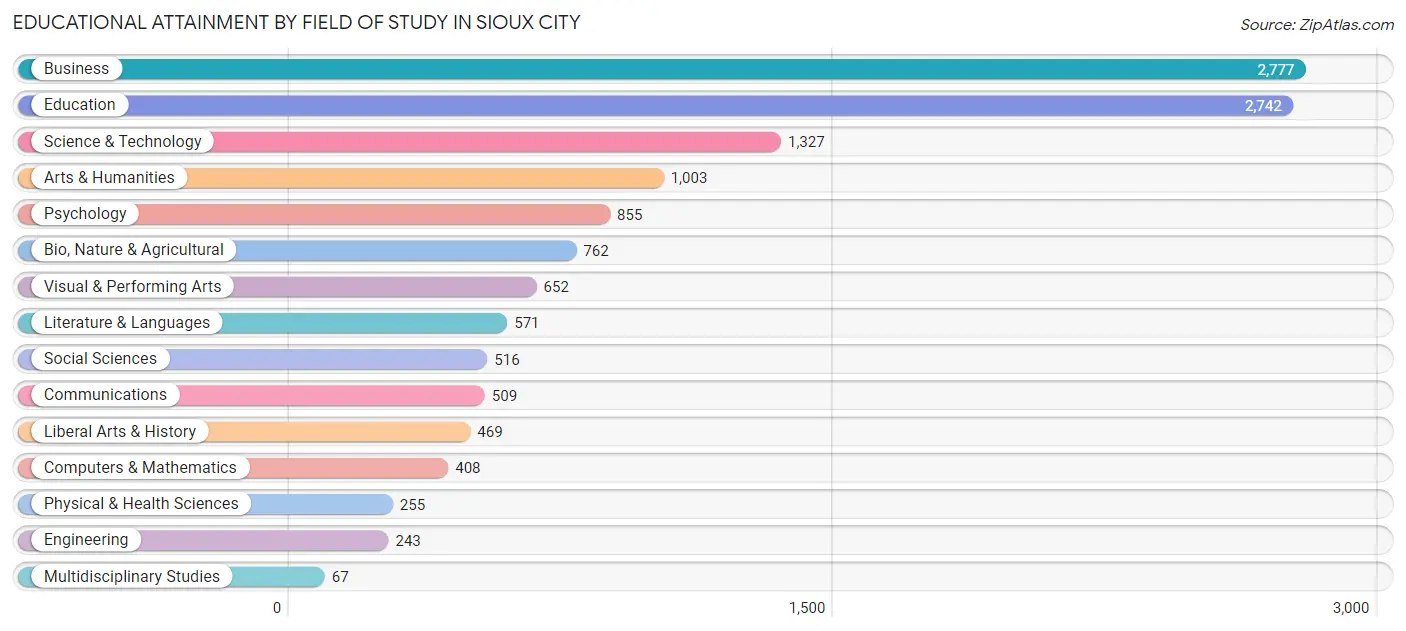
| Field of Study | # Graduates | % Graduates |
| Computers & Mathematics | 408 | 3.1% |
| Bio, Nature & Agricultural | 762 | 5.8% |
| Physical & Health Sciences | 255 | 1.9% |
| Psychology | 855 | 6.5% |
| Social Sciences | 516 | 3.9% |
| Engineering | 243 | 1.8% |
| Multidisciplinary Studies | 67 | 0.5% |
| Science & Technology | 1,327 | 10.1% |
| Business | 2,777 | 21.1% |
| Education | 2,742 | 20.8% |
| Literature & Languages | 571 | 4.3% |
| Liberal Arts & History | 469 | 3.6% |
| Visual & Performing Arts | 652 | 5.0% |
| Communications | 509 | 3.9% |
| Arts & Humanities | 1,003 | 7.6% |
| Total | 13,156 | 100.0% |
Transportation & Commute in Sioux City
Vehicle Availability by Sex in Sioux City
The most prevalent vehicle ownership categories in Sioux City are males with 2 vehicles (8,189, accounting for 37.7%) and females with 2 vehicles (7,359, making up 42.3%).
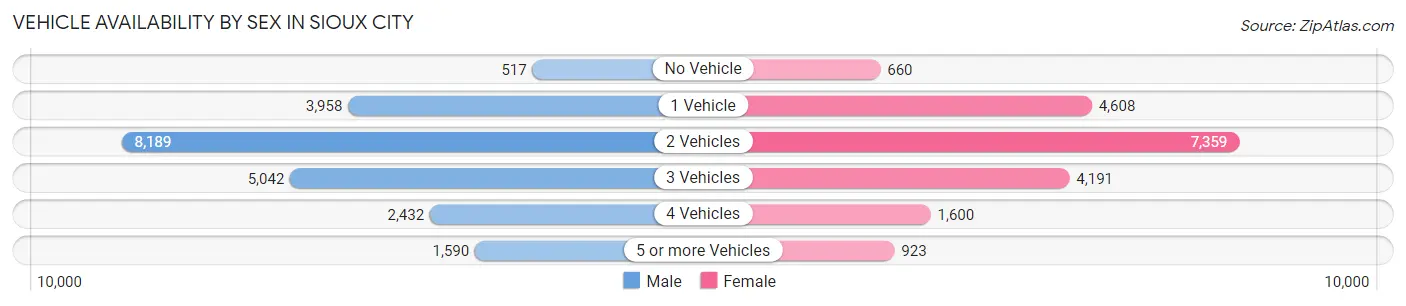
| Vehicles Available | Male | Female |
| No Vehicle | 517 (2.4%) | 660 (3.4%) |
| 1 Vehicle | 3,958 (18.2%) | 4,608 (23.8%) |
| 2 Vehicles | 8,189 (37.7%) | 7,359 (38.1%) |
| 3 Vehicles | 5,042 (23.2%) | 4,191 (21.7%) |
| 4 Vehicles | 2,432 (11.2%) | 1,600 (8.3%) |
| 5 or more Vehicles | 1,590 (7.3%) | 923 (4.8%) |
| Total | 21,728 (100.0%) | 19,341 (100.0%) |
Commute Time in Sioux City
The most frequently occuring commute durations in Sioux City are 15 to 19 minutes (10,578 commuters, 26.3%), 10 to 14 minutes (10,486 commuters, 26.0%), and 20 to 24 minutes (6,174 commuters, 15.3%).
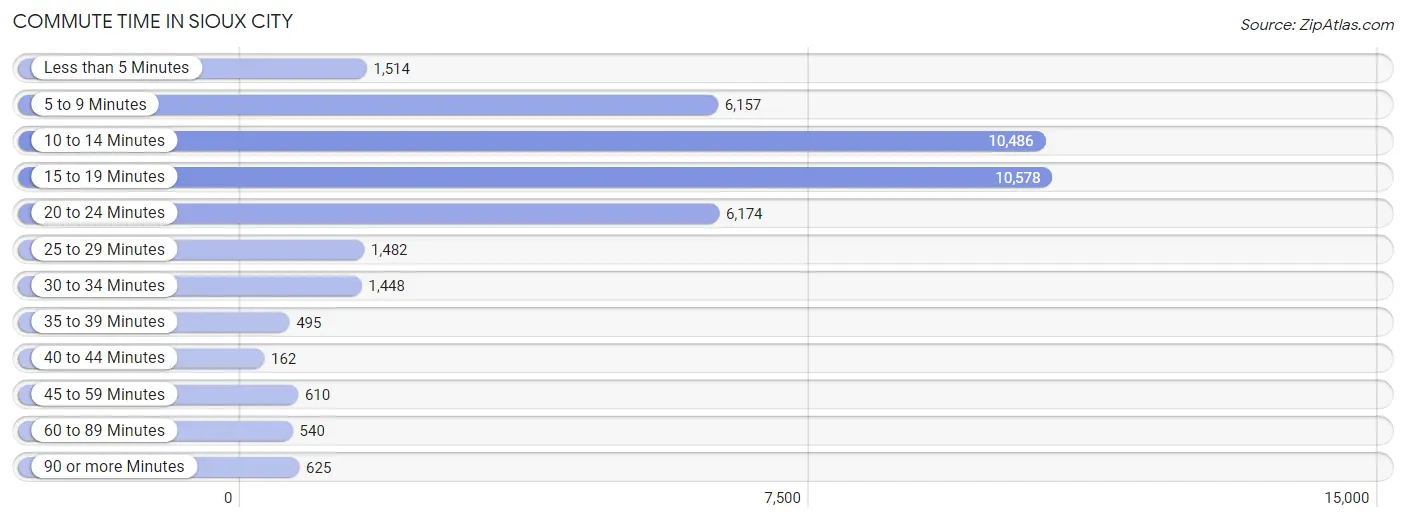
| Commute Time | # Commuters | % Commuters |
| Less than 5 Minutes | 1,514 | 3.8% |
| 5 to 9 Minutes | 6,157 | 15.3% |
| 10 to 14 Minutes | 10,486 | 26.0% |
| 15 to 19 Minutes | 10,578 | 26.3% |
| 20 to 24 Minutes | 6,174 | 15.3% |
| 25 to 29 Minutes | 1,482 | 3.7% |
| 30 to 34 Minutes | 1,448 | 3.6% |
| 35 to 39 Minutes | 495 | 1.2% |
| 40 to 44 Minutes | 162 | 0.4% |
| 45 to 59 Minutes | 610 | 1.5% |
| 60 to 89 Minutes | 540 | 1.3% |
| 90 or more Minutes | 625 | 1.5% |
Commute Time by Sex in Sioux City
The most common commute times in Sioux City are 15 to 19 minutes (5,700 commuters, 26.6%) for males and 10 to 14 minutes (5,644 commuters, 30.0%) for females.
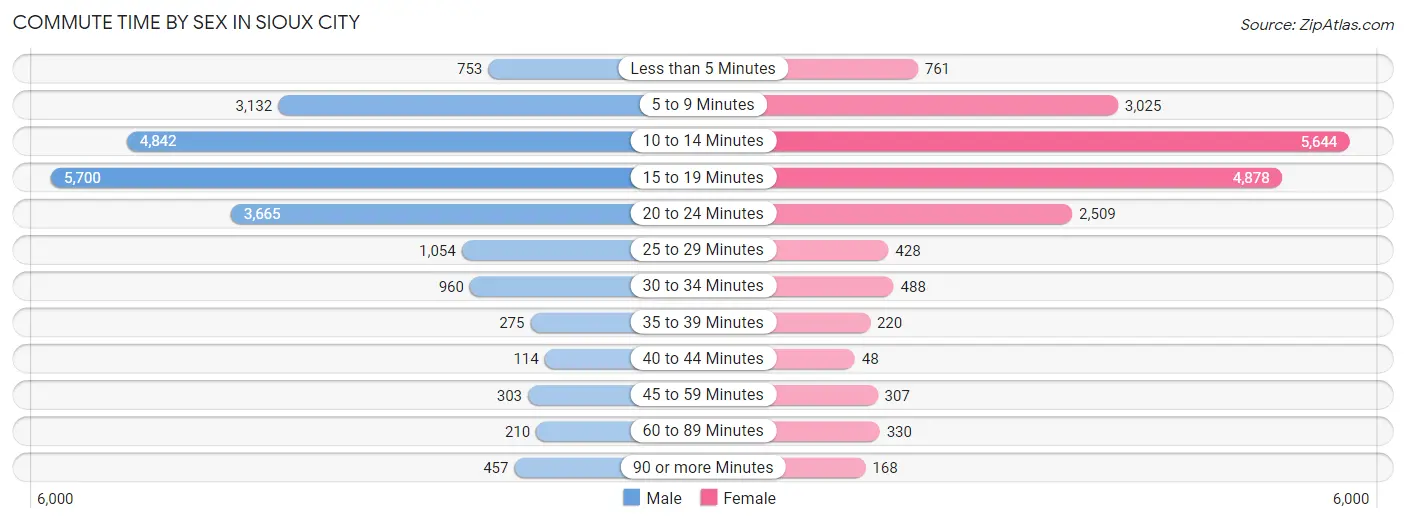
| Commute Time | Male | Female |
| Less than 5 Minutes | 753 (3.5%) | 761 (4.1%) |
| 5 to 9 Minutes | 3,132 (14.6%) | 3,025 (16.1%) |
| 10 to 14 Minutes | 4,842 (22.6%) | 5,644 (30.0%) |
| 15 to 19 Minutes | 5,700 (26.6%) | 4,878 (25.9%) |
| 20 to 24 Minutes | 3,665 (17.1%) | 2,509 (13.3%) |
| 25 to 29 Minutes | 1,054 (4.9%) | 428 (2.3%) |
| 30 to 34 Minutes | 960 (4.5%) | 488 (2.6%) |
| 35 to 39 Minutes | 275 (1.3%) | 220 (1.2%) |
| 40 to 44 Minutes | 114 (0.5%) | 48 (0.3%) |
| 45 to 59 Minutes | 303 (1.4%) | 307 (1.6%) |
| 60 to 89 Minutes | 210 (1.0%) | 330 (1.8%) |
| 90 or more Minutes | 457 (2.1%) | 168 (0.9%) |
Time of Departure to Work by Sex in Sioux City
The most frequent times of departure to work in Sioux City are 7:00 AM to 7:29 AM (3,315, 15.4%) for males and 7:30 AM to 7:59 AM (4,345, 23.1%) for females.
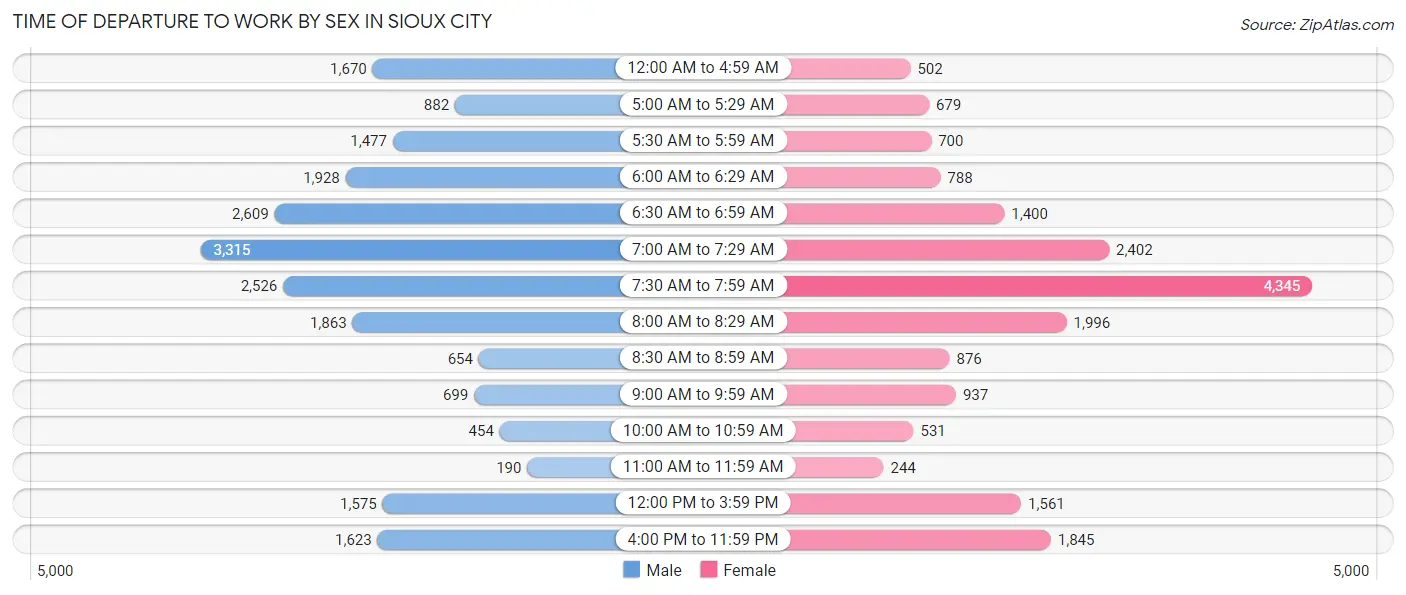
| Time of Departure | Male | Female |
| 12:00 AM to 4:59 AM | 1,670 (7.8%) | 502 (2.7%) |
| 5:00 AM to 5:29 AM | 882 (4.1%) | 679 (3.6%) |
| 5:30 AM to 5:59 AM | 1,477 (6.9%) | 700 (3.7%) |
| 6:00 AM to 6:29 AM | 1,928 (9.0%) | 788 (4.2%) |
| 6:30 AM to 6:59 AM | 2,609 (12.1%) | 1,400 (7.4%) |
| 7:00 AM to 7:29 AM | 3,315 (15.4%) | 2,402 (12.8%) |
| 7:30 AM to 7:59 AM | 2,526 (11.8%) | 4,345 (23.1%) |
| 8:00 AM to 8:29 AM | 1,863 (8.7%) | 1,996 (10.6%) |
| 8:30 AM to 8:59 AM | 654 (3.0%) | 876 (4.7%) |
| 9:00 AM to 9:59 AM | 699 (3.3%) | 937 (5.0%) |
| 10:00 AM to 10:59 AM | 454 (2.1%) | 531 (2.8%) |
| 11:00 AM to 11:59 AM | 190 (0.9%) | 244 (1.3%) |
| 12:00 PM to 3:59 PM | 1,575 (7.3%) | 1,561 (8.3%) |
| 4:00 PM to 11:59 PM | 1,623 (7.6%) | 1,845 (9.8%) |
| Total | 21,465 (100.0%) | 18,806 (100.0%) |
Housing Occupancy in Sioux City
Occupancy by Ownership in Sioux City
Of the total 32,449 dwellings in Sioux City, owner-occupied units account for 21,227 (65.4%), while renter-occupied units make up 11,222 (34.6%).
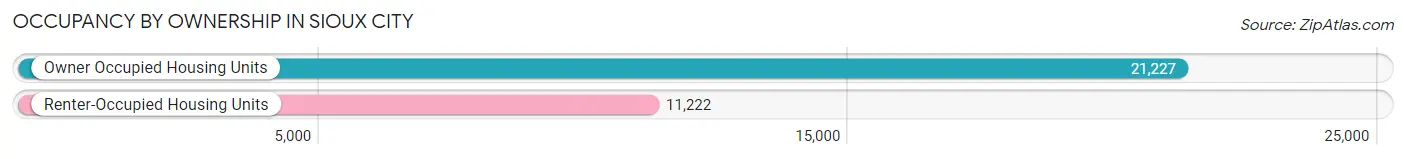
| Occupancy | # Housing Units | % Housing Units |
| Owner Occupied Housing Units | 21,227 | 65.4% |
| Renter-Occupied Housing Units | 11,222 | 34.6% |
| Total Occupied Housing Units | 32,449 | 100.0% |
Occupancy by Household Size in Sioux City
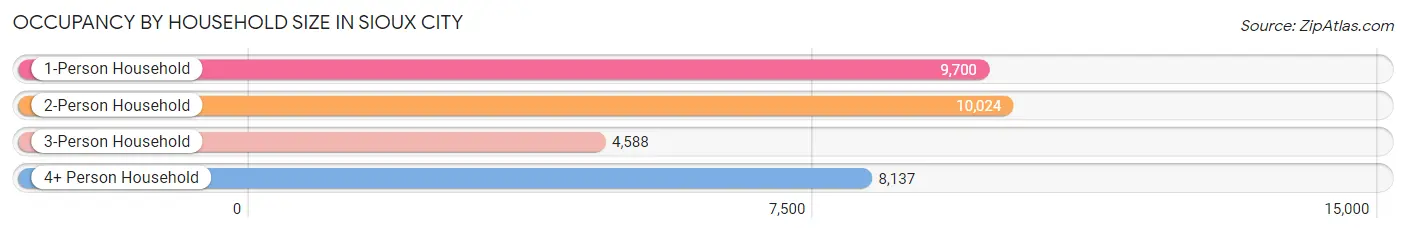
| Household Size | # Housing Units | % Housing Units |
| 1-Person Household | 9,700 | 29.9% |
| 2-Person Household | 10,024 | 30.9% |
| 3-Person Household | 4,588 | 14.1% |
| 4+ Person Household | 8,137 | 25.1% |
| Total Housing Units | 32,449 | 100.0% |
Occupancy by Ownership by Household Size in Sioux City
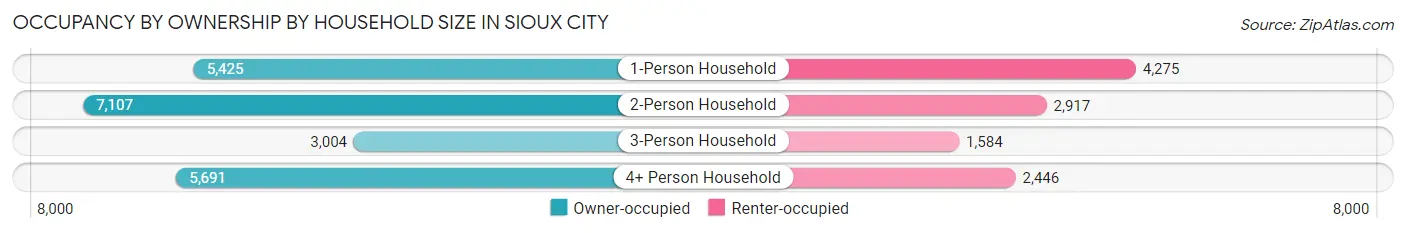
| Household Size | Owner-occupied | Renter-occupied |
| 1-Person Household | 5,425 (55.9%) | 4,275 (44.1%) |
| 2-Person Household | 7,107 (70.9%) | 2,917 (29.1%) |
| 3-Person Household | 3,004 (65.5%) | 1,584 (34.5%) |
| 4+ Person Household | 5,691 (69.9%) | 2,446 (30.1%) |
| Total Housing Units | 21,227 (65.4%) | 11,222 (34.6%) |
Occupancy by Educational Attainment in Sioux City
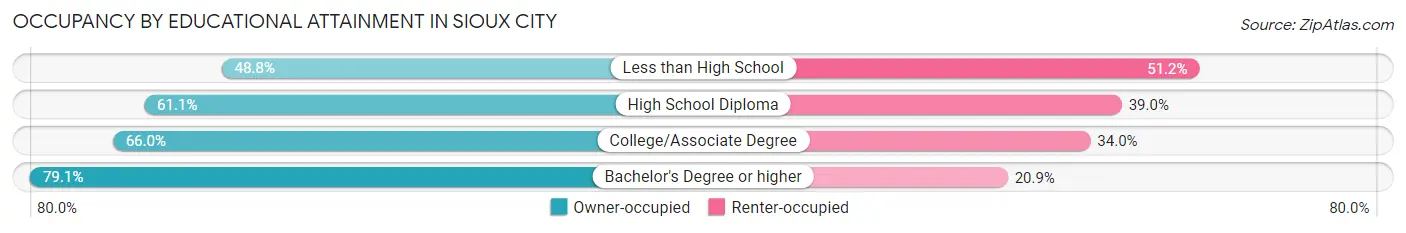
| Household Size | Owner-occupied | Renter-occupied |
| Less than High School | 2,018 (48.8%) | 2,121 (51.2%) |
| High School Diploma | 5,932 (61.1%) | 3,784 (39.0%) |
| College/Associate Degree | 7,235 (66.0%) | 3,724 (34.0%) |
| Bachelor's Degree or higher | 6,042 (79.1%) | 1,593 (20.9%) |
Occupancy by Age of Householder in Sioux City
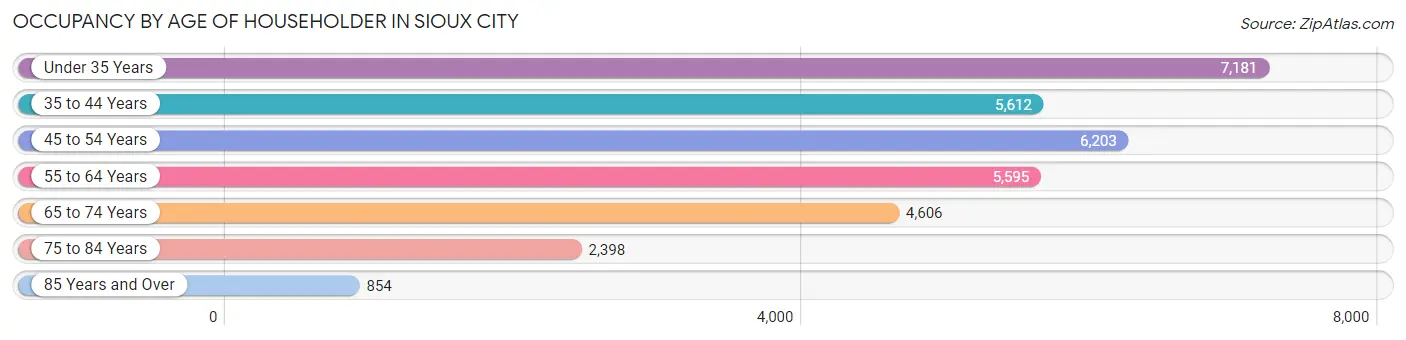
| Age Bracket | # Households | % Households |
| Under 35 Years | 7,181 | 22.1% |
| 35 to 44 Years | 5,612 | 17.3% |
| 45 to 54 Years | 6,203 | 19.1% |
| 55 to 64 Years | 5,595 | 17.2% |
| 65 to 74 Years | 4,606 | 14.2% |
| 75 to 84 Years | 2,398 | 7.4% |
| 85 Years and Over | 854 | 2.6% |
| Total | 32,449 | 100.0% |
Housing Finances in Sioux City
Median Income by Occupancy in Sioux City
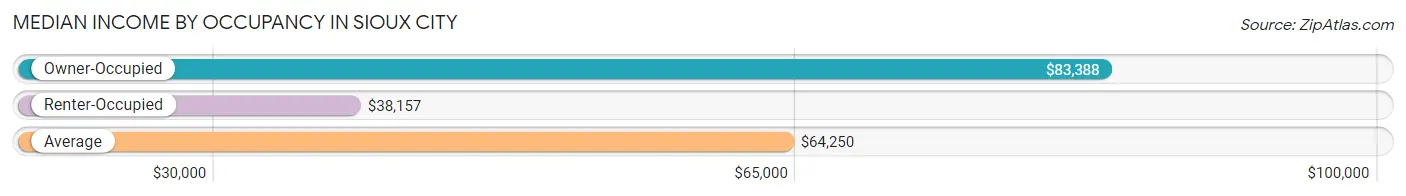
| Occupancy Type | # Households | Median Income |
| Owner-Occupied | 21,227 (65.4%) | $83,388 |
| Renter-Occupied | 11,222 (34.6%) | $38,157 |
| Average | 32,449 (100.0%) | $64,250 |
Occupancy by Householder Income Bracket in Sioux City
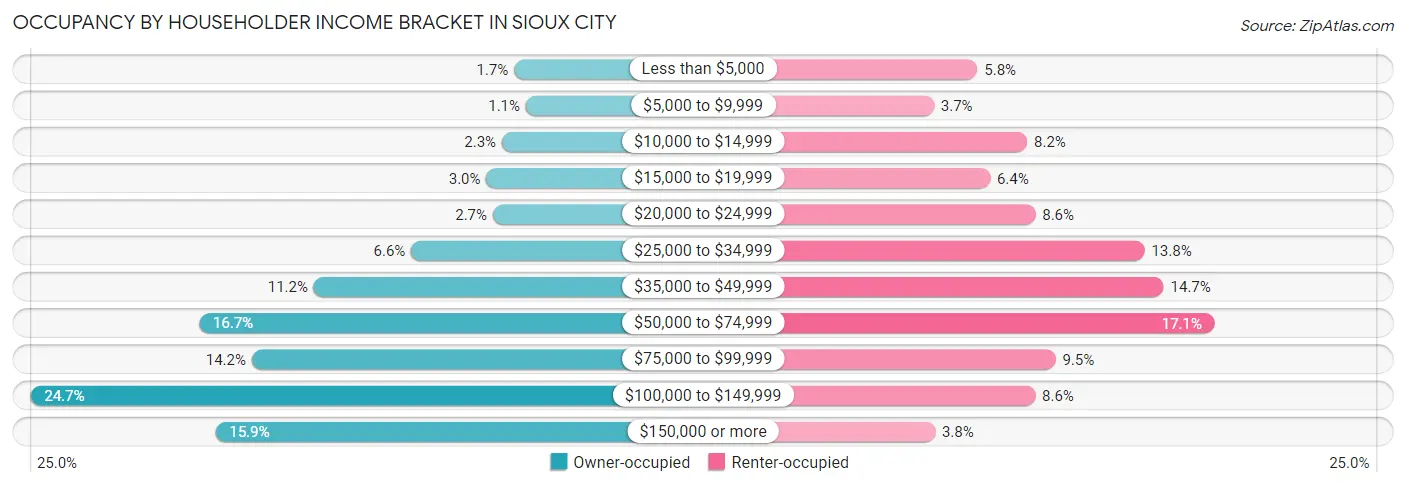
| Income Bracket | Owner-occupied | Renter-occupied |
| Less than $5,000 | 358 (1.7%) | 651 (5.8%) |
| $5,000 to $9,999 | 240 (1.1%) | 419 (3.7%) |
| $10,000 to $14,999 | 482 (2.3%) | 917 (8.2%) |
| $15,000 to $19,999 | 639 (3.0%) | 718 (6.4%) |
| $20,000 to $24,999 | 573 (2.7%) | 961 (8.6%) |
| $25,000 to $34,999 | 1,399 (6.6%) | 1,544 (13.8%) |
| $35,000 to $49,999 | 2,383 (11.2%) | 1,646 (14.7%) |
| $50,000 to $74,999 | 3,535 (16.7%) | 1,915 (17.1%) |
| $75,000 to $99,999 | 3,011 (14.2%) | 1,068 (9.5%) |
| $100,000 to $149,999 | 5,238 (24.7%) | 959 (8.6%) |
| $150,000 or more | 3,369 (15.9%) | 424 (3.8%) |
| Total | 21,227 (100.0%) | 11,222 (100.0%) |
Monthly Housing Cost Tiers in Sioux City
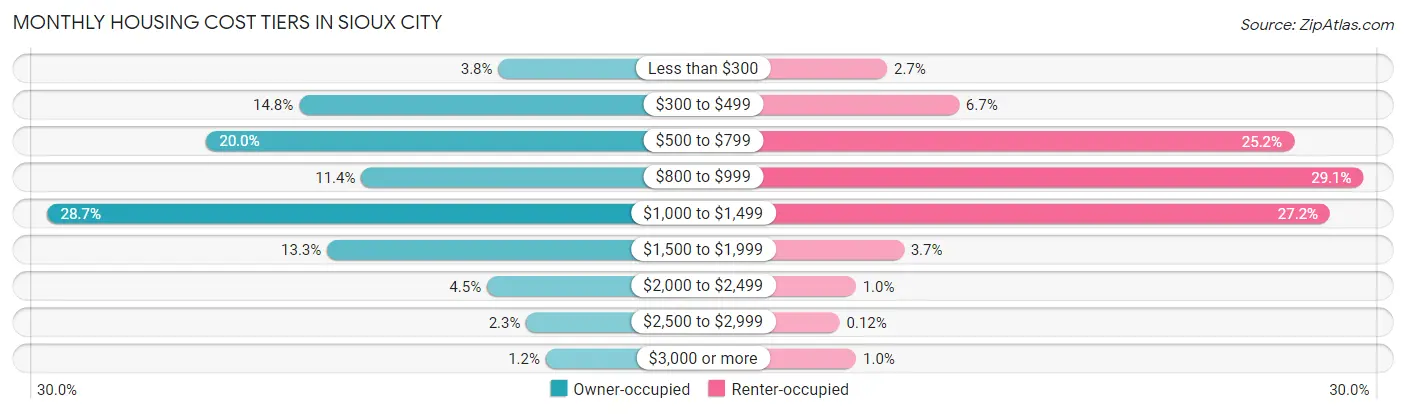
| Monthly Cost | Owner-occupied | Renter-occupied |
| Less than $300 | 812 (3.8%) | 308 (2.7%) |
| $300 to $499 | 3,150 (14.8%) | 753 (6.7%) |
| $500 to $799 | 4,237 (20.0%) | 2,829 (25.2%) |
| $800 to $999 | 2,420 (11.4%) | 3,260 (29.0%) |
| $1,000 to $1,499 | 6,098 (28.7%) | 3,052 (27.2%) |
| $1,500 to $1,999 | 2,821 (13.3%) | 411 (3.7%) |
| $2,000 to $2,499 | 946 (4.5%) | 113 (1.0%) |
| $2,500 to $2,999 | 486 (2.3%) | 14 (0.1%) |
| $3,000 or more | 257 (1.2%) | 116 (1.0%) |
| Total | 21,227 (100.0%) | 11,222 (100.0%) |
Physical Housing Characteristics in Sioux City
Housing Structures in Sioux City
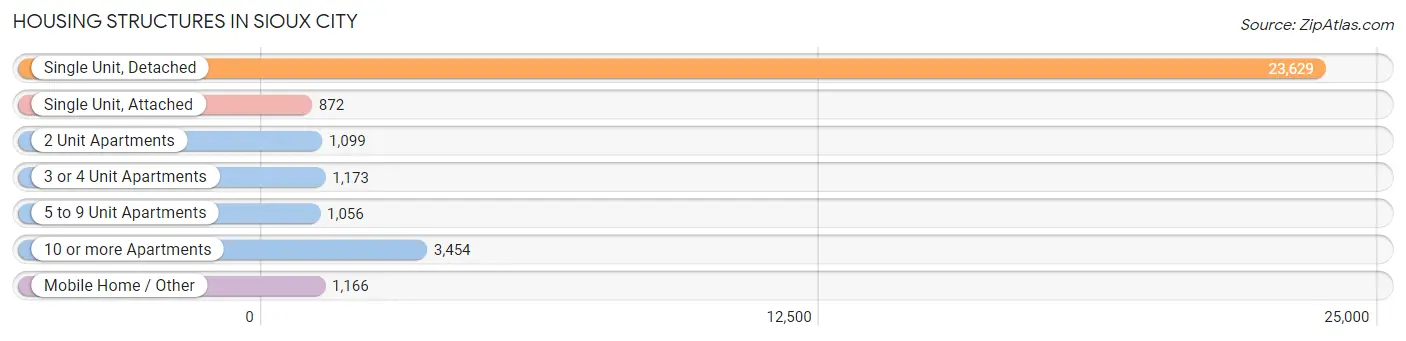
| Structure Type | # Housing Units | % Housing Units |
| Single Unit, Detached | 23,629 | 72.8% |
| Single Unit, Attached | 872 | 2.7% |
| 2 Unit Apartments | 1,099 | 3.4% |
| 3 or 4 Unit Apartments | 1,173 | 3.6% |
| 5 to 9 Unit Apartments | 1,056 | 3.3% |
| 10 or more Apartments | 3,454 | 10.6% |
| Mobile Home / Other | 1,166 | 3.6% |
| Total | 32,449 | 100.0% |
Housing Structures by Occupancy in Sioux City
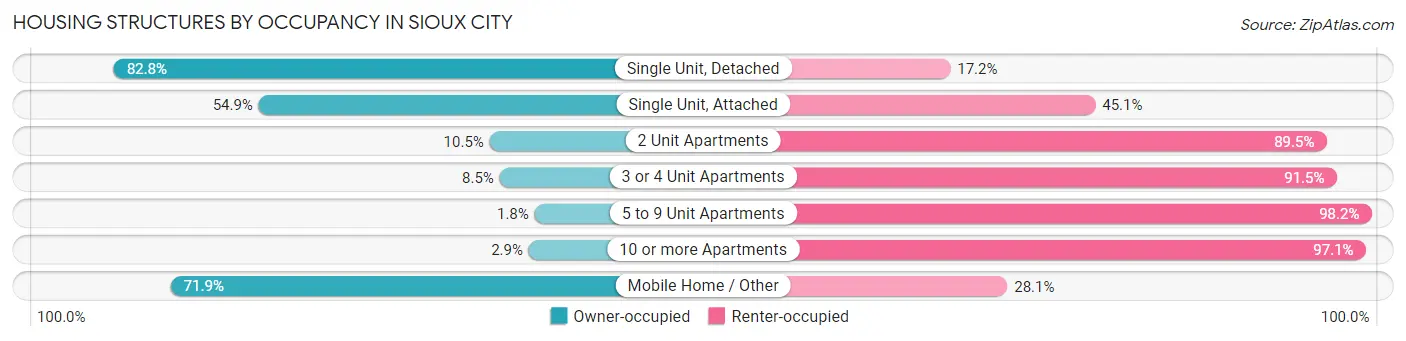
| Structure Type | Owner-occupied | Renter-occupied |
| Single Unit, Detached | 19,575 (82.8%) | 4,054 (17.2%) |
| Single Unit, Attached | 479 (54.9%) | 393 (45.1%) |
| 2 Unit Apartments | 115 (10.5%) | 984 (89.5%) |
| 3 or 4 Unit Apartments | 100 (8.5%) | 1,073 (91.5%) |
| 5 to 9 Unit Apartments | 19 (1.8%) | 1,037 (98.2%) |
| 10 or more Apartments | 101 (2.9%) | 3,353 (97.1%) |
| Mobile Home / Other | 838 (71.9%) | 328 (28.1%) |
| Total | 21,227 (65.4%) | 11,222 (34.6%) |
Housing Structures by Number of Rooms in Sioux City
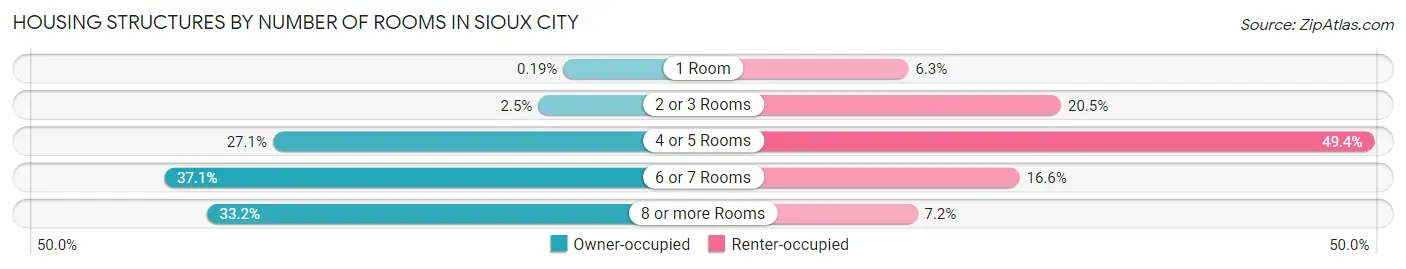
| Number of Rooms | Owner-occupied | Renter-occupied |
| 1 Room | 41 (0.2%) | 711 (6.3%) |
| 2 or 3 Rooms | 531 (2.5%) | 2,295 (20.4%) |
| 4 or 5 Rooms | 5,741 (27.1%) | 5,546 (49.4%) |
| 6 or 7 Rooms | 7,875 (37.1%) | 1,864 (16.6%) |
| 8 or more Rooms | 7,039 (33.2%) | 806 (7.2%) |
| Total | 21,227 (100.0%) | 11,222 (100.0%) |
Housing Structure by Heating Type in Sioux City
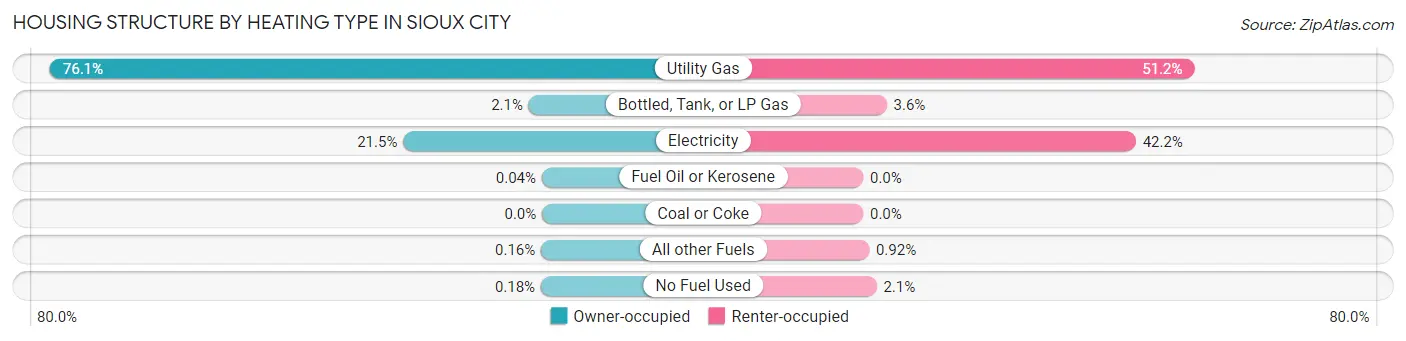
| Heating Type | Owner-occupied | Renter-occupied |
| Utility Gas | 16,151 (76.1%) | 5,747 (51.2%) |
| Bottled, Tank, or LP Gas | 438 (2.1%) | 409 (3.6%) |
| Electricity | 4,557 (21.5%) | 4,730 (42.1%) |
| Fuel Oil or Kerosene | 9 (0.0%) | 0 (0.0%) |
| Coal or Coke | 0 (0.0%) | 0 (0.0%) |
| All other Fuels | 33 (0.2%) | 103 (0.9%) |
| No Fuel Used | 39 (0.2%) | 233 (2.1%) |
| Total | 21,227 (100.0%) | 11,222 (100.0%) |
Household Vehicle Usage in Sioux City
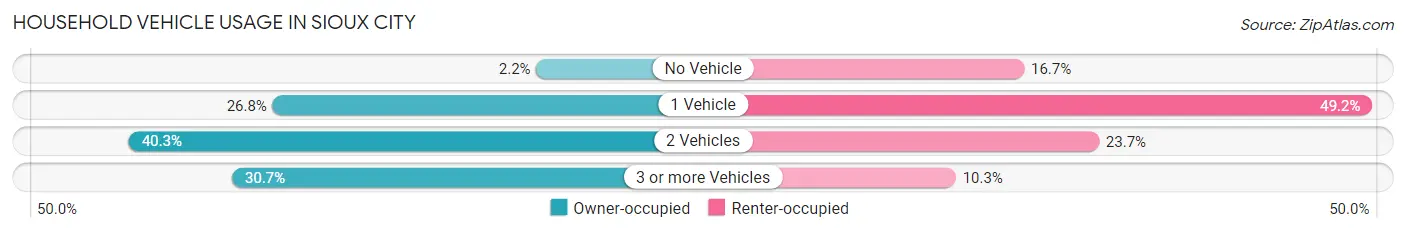
| Vehicles per Household | Owner-occupied | Renter-occupied |
| No Vehicle | 472 (2.2%) | 1,876 (16.7%) |
| 1 Vehicle | 5,697 (26.8%) | 5,525 (49.2%) |
| 2 Vehicles | 8,551 (40.3%) | 2,661 (23.7%) |
| 3 or more Vehicles | 6,507 (30.6%) | 1,160 (10.3%) |
| Total | 21,227 (100.0%) | 11,222 (100.0%) |
Real Estate & Mortgages in Sioux City
Real Estate and Mortgage Overview in Sioux City
| Characteristic | Without Mortgage | With Mortgage |
| Housing Units | 8,054 | 13,173 |
| Median Property Value | $128,100 | $161,200 |
| Median Household Income | $57,420 | $2,522 |
| Monthly Housing Costs | $510 | $251 |
| Real Estate Taxes | $2,327 | $137 |
Property Value by Mortgage Status in Sioux City
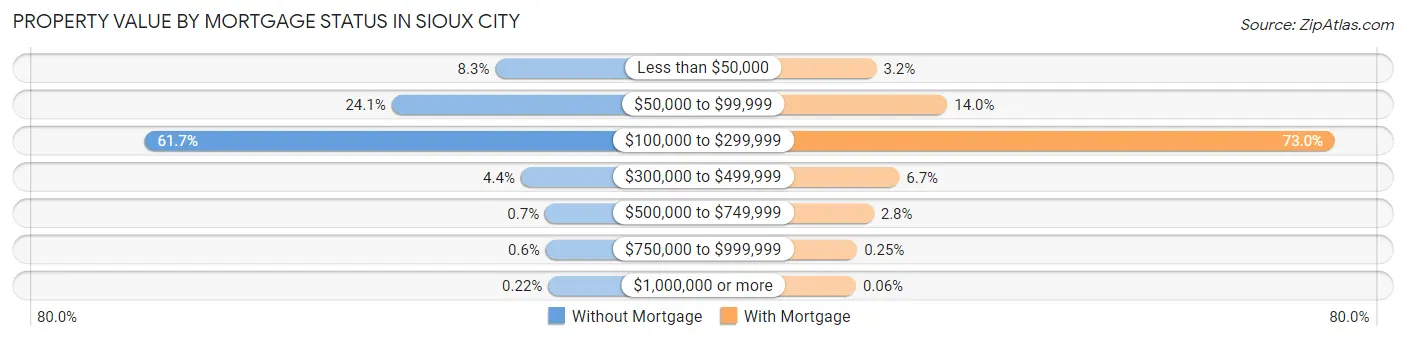
| Property Value | Without Mortgage | With Mortgage |
| Less than $50,000 | 667 (8.3%) | 421 (3.2%) |
| $50,000 to $99,999 | 1,940 (24.1%) | 1,843 (14.0%) |
| $100,000 to $299,999 | 4,971 (61.7%) | 9,622 (73.0%) |
| $300,000 to $499,999 | 354 (4.4%) | 880 (6.7%) |
| $500,000 to $749,999 | 56 (0.7%) | 366 (2.8%) |
| $750,000 to $999,999 | 48 (0.6%) | 33 (0.3%) |
| $1,000,000 or more | 18 (0.2%) | 8 (0.1%) |
| Total | 8,054 (100.0%) | 13,173 (100.0%) |
Household Income by Mortgage Status in Sioux City
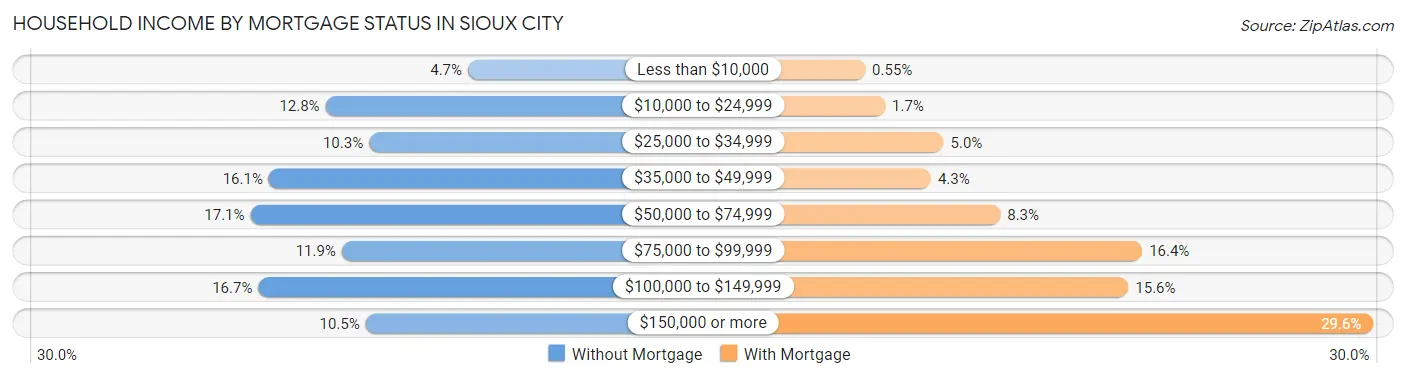
| Household Income | Without Mortgage | With Mortgage |
| Less than $10,000 | 376 (4.7%) | 73 (0.5%) |
| $10,000 to $24,999 | 1,032 (12.8%) | 222 (1.7%) |
| $25,000 to $34,999 | 831 (10.3%) | 662 (5.0%) |
| $35,000 to $49,999 | 1,293 (16.1%) | 568 (4.3%) |
| $50,000 to $74,999 | 1,377 (17.1%) | 1,090 (8.3%) |
| $75,000 to $99,999 | 957 (11.9%) | 2,158 (16.4%) |
| $100,000 to $149,999 | 1,341 (16.7%) | 2,054 (15.6%) |
| $150,000 or more | 847 (10.5%) | 3,897 (29.6%) |
| Total | 8,054 (100.0%) | 13,173 (100.0%) |
Property Value to Household Income Ratio in Sioux City
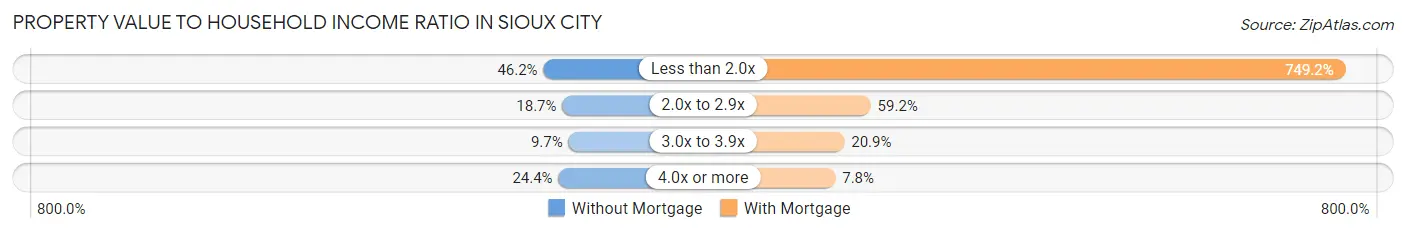
| Value-to-Income Ratio | Without Mortgage | With Mortgage |
| Less than 2.0x | 3,718 (46.2%) | 98,691 (749.2%) |
| 2.0x to 2.9x | 1,506 (18.7%) | 7,801 (59.2%) |
| 3.0x to 3.9x | 781 (9.7%) | 2,757 (20.9%) |
| 4.0x or more | 1,964 (24.4%) | 1,027 (7.8%) |
| Total | 8,054 (100.0%) | 13,173 (100.0%) |
Real Estate Taxes by Mortgage Status in Sioux City
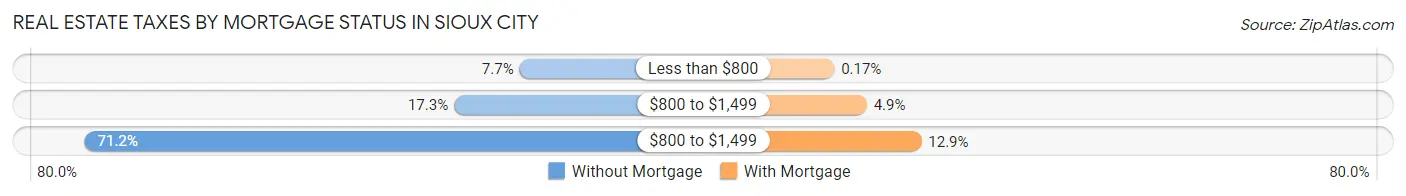
| Property Taxes | Without Mortgage | With Mortgage |
| Less than $800 | 619 (7.7%) | 22 (0.2%) |
| $800 to $1,499 | 1,390 (17.3%) | 648 (4.9%) |
| $800 to $1,499 | 5,737 (71.2%) | 1,699 (12.9%) |
| Total | 8,054 (100.0%) | 13,173 (100.0%) |
Health & Disability in Sioux City
Health Insurance Coverage by Age in Sioux City
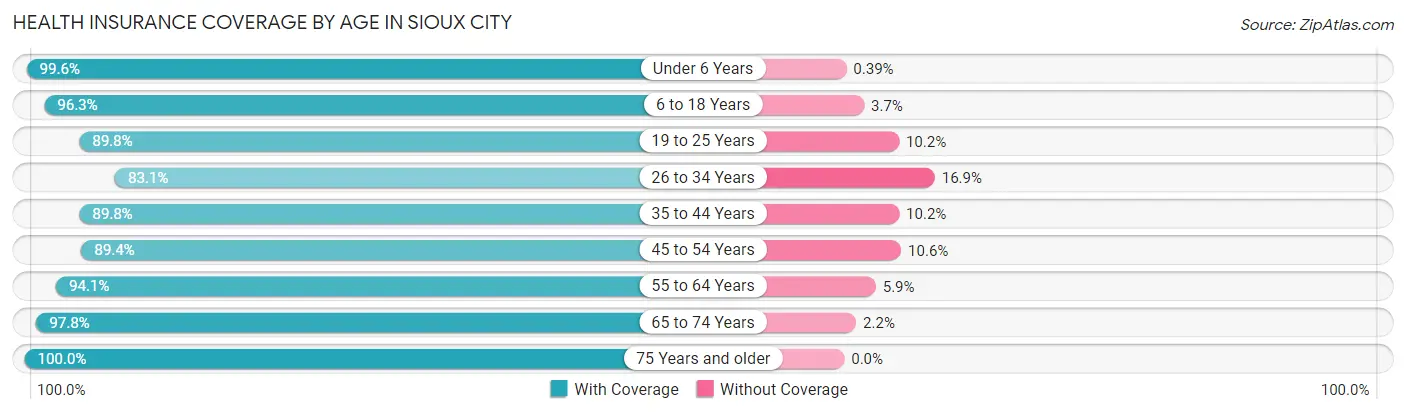
| Age Bracket | With Coverage | Without Coverage |
| Under 6 Years | 7,451 (99.6%) | 29 (0.4%) |
| 6 to 18 Years | 15,723 (96.3%) | 603 (3.7%) |
| 19 to 25 Years | 8,169 (89.8%) | 928 (10.2%) |
| 26 to 34 Years | 8,142 (83.1%) | 1,653 (16.9%) |
| 35 to 44 Years | 9,402 (89.8%) | 1,071 (10.2%) |
| 45 to 54 Years | 9,024 (89.4%) | 1,070 (10.6%) |
| 55 to 64 Years | 9,051 (94.1%) | 564 (5.9%) |
| 65 to 74 Years | 6,873 (97.8%) | 155 (2.2%) |
| 75 Years and older | 4,623 (100.0%) | 0 (0.0%) |
| Total | 78,458 (92.8%) | 6,073 (7.2%) |
Health Insurance Coverage by Citizenship Status in Sioux City
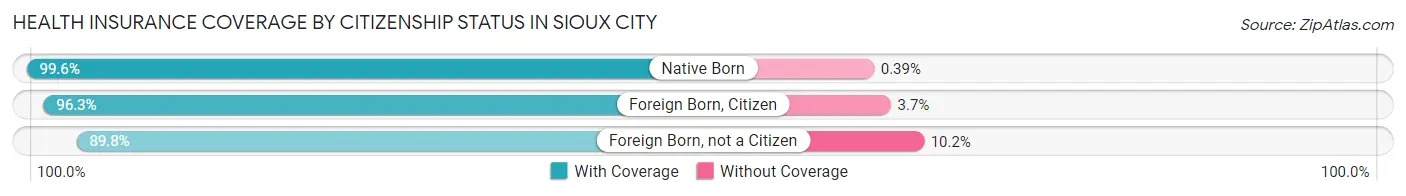
| Citizenship Status | With Coverage | Without Coverage |
| Native Born | 7,451 (99.6%) | 29 (0.4%) |
| Foreign Born, Citizen | 15,723 (96.3%) | 603 (3.7%) |
| Foreign Born, not a Citizen | 8,169 (89.8%) | 928 (10.2%) |
Health Insurance Coverage by Household Income in Sioux City
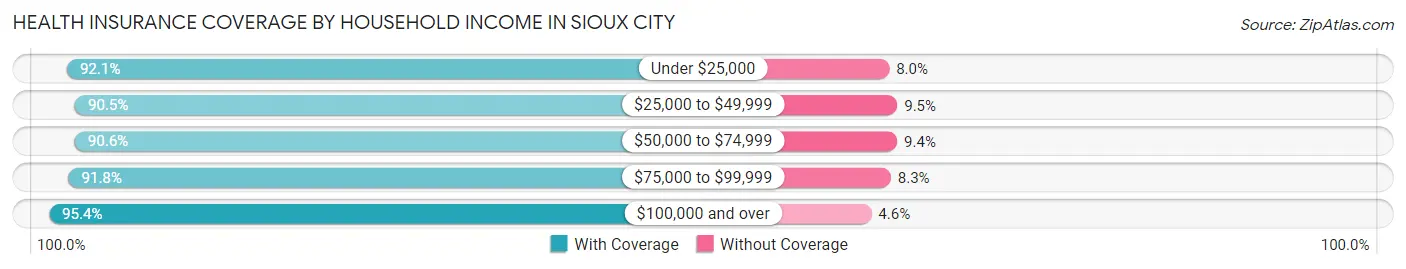
| Household Income | With Coverage | Without Coverage |
| Under $25,000 | 9,077 (92.0%) | 784 (8.0%) |
| $25,000 to $49,999 | 14,036 (90.5%) | 1,467 (9.5%) |
| $50,000 to $74,999 | 11,662 (90.6%) | 1,214 (9.4%) |
| $75,000 to $99,999 | 12,179 (91.7%) | 1,095 (8.3%) |
| $100,000 and over | 29,805 (95.4%) | 1,439 (4.6%) |
Public vs Private Health Insurance Coverage by Age in Sioux City
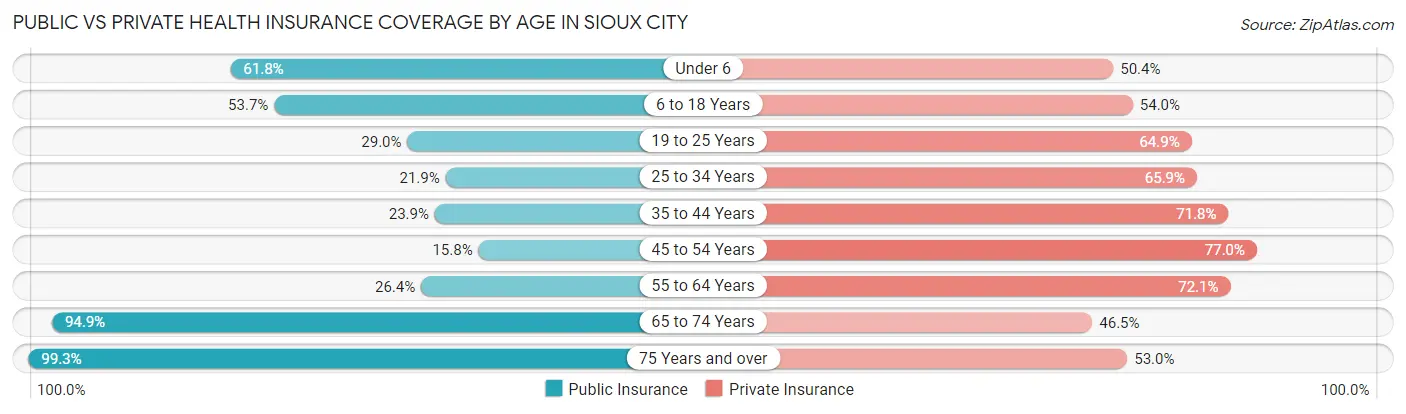
| Age Bracket | Public Insurance | Private Insurance |
| Under 6 | 4,622 (61.8%) | 3,769 (50.4%) |
| 6 to 18 Years | 8,764 (53.7%) | 8,821 (54.0%) |
| 19 to 25 Years | 2,634 (28.9%) | 5,904 (64.9%) |
| 25 to 34 Years | 2,142 (21.9%) | 6,455 (65.9%) |
| 35 to 44 Years | 2,499 (23.9%) | 7,514 (71.8%) |
| 45 to 54 Years | 1,590 (15.8%) | 7,776 (77.0%) |
| 55 to 64 Years | 2,539 (26.4%) | 6,933 (72.1%) |
| 65 to 74 Years | 6,671 (94.9%) | 3,269 (46.5%) |
| 75 Years and over | 4,590 (99.3%) | 2,450 (53.0%) |
| Total | 36,051 (42.6%) | 52,891 (62.6%) |
Disability Status by Sex by Age in Sioux City
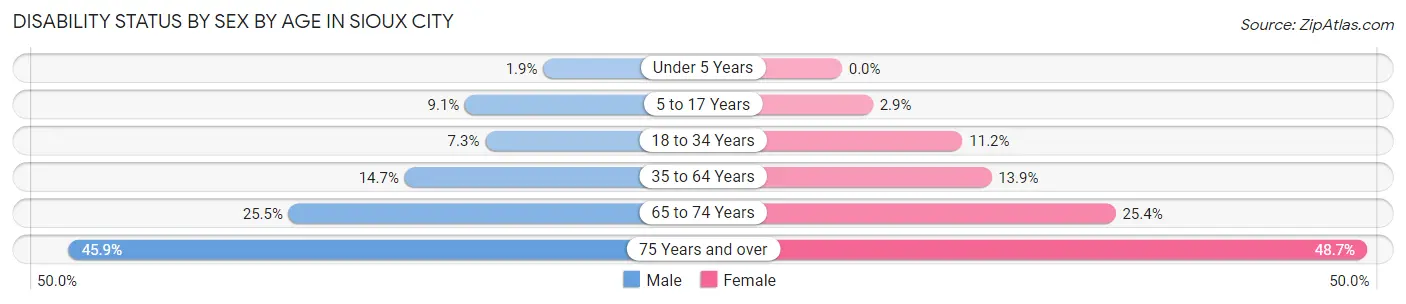
| Age Bracket | Male | Female |
| Under 5 Years | 60 (1.9%) | 0 (0.0%) |
| 5 to 17 Years | 754 (9.1%) | 230 (2.9%) |
| 18 to 34 Years | 756 (7.2%) | 1,116 (11.2%) |
| 35 to 64 Years | 2,246 (14.7%) | 2,071 (13.9%) |
| 65 to 74 Years | 842 (25.5%) | 946 (25.4%) |
| 75 Years and over | 790 (45.9%) | 1,414 (48.7%) |
Disability Class by Sex by Age in Sioux City
Disability Class: Hearing Difficulty
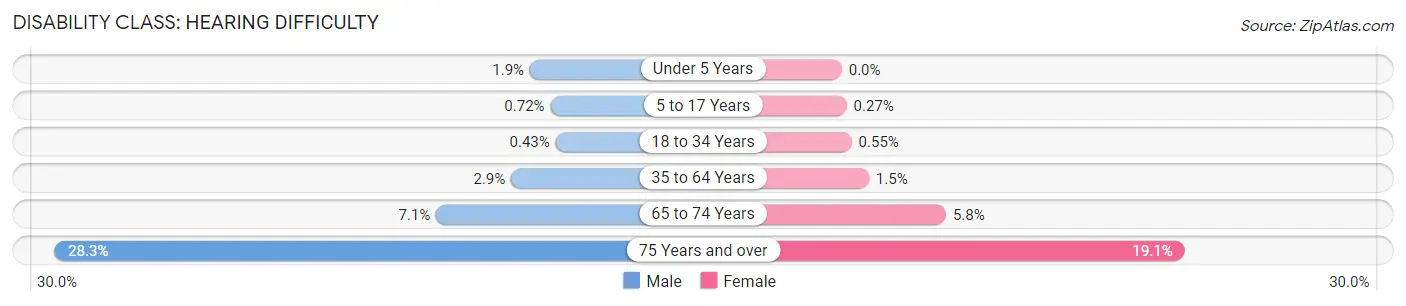
| Age Bracket | Male | Female |
| Under 5 Years | 60 (1.9%) | 0 (0.0%) |
| 5 to 17 Years | 60 (0.7%) | 22 (0.3%) |
| 18 to 34 Years | 45 (0.4%) | 55 (0.5%) |
| 35 to 64 Years | 444 (2.9%) | 226 (1.5%) |
| 65 to 74 Years | 234 (7.1%) | 216 (5.8%) |
| 75 Years and over | 487 (28.3%) | 554 (19.1%) |
Disability Class: Vision Difficulty
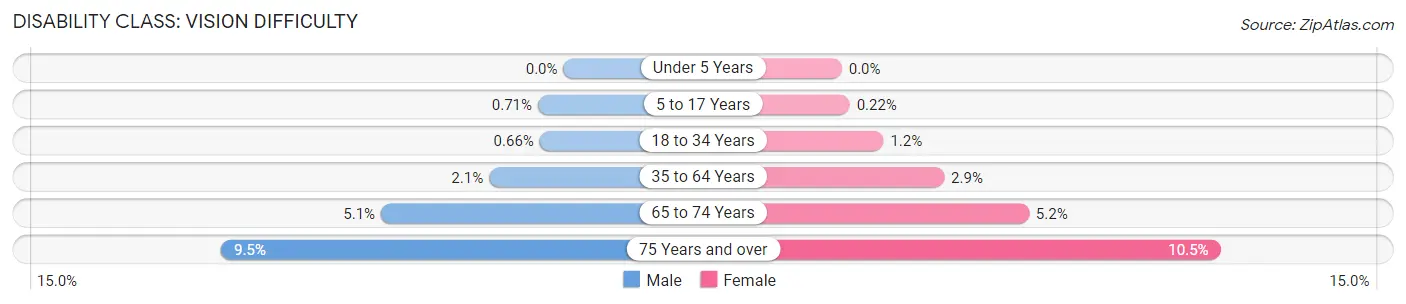
| Age Bracket | Male | Female |
| Under 5 Years | 0 (0.0%) | 0 (0.0%) |
| 5 to 17 Years | 59 (0.7%) | 18 (0.2%) |
| 18 to 34 Years | 69 (0.7%) | 116 (1.2%) |
| 35 to 64 Years | 315 (2.1%) | 426 (2.9%) |
| 65 to 74 Years | 168 (5.1%) | 194 (5.2%) |
| 75 Years and over | 164 (9.5%) | 306 (10.5%) |
Disability Class: Cognitive Difficulty
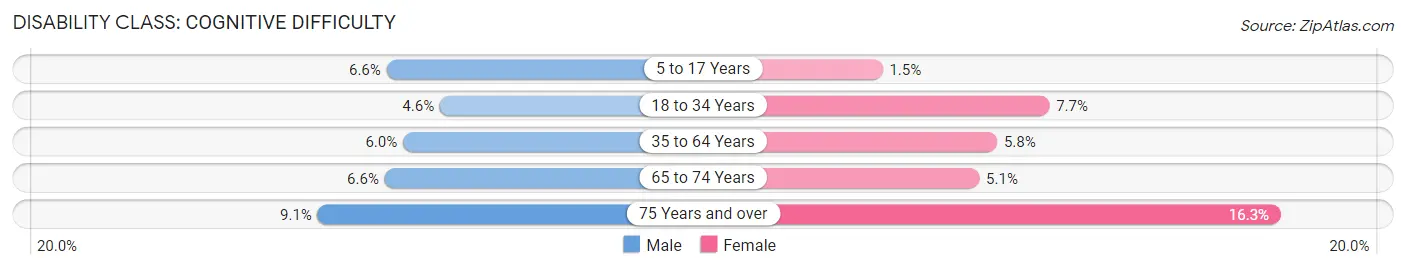
| Age Bracket | Male | Female |
| 5 to 17 Years | 543 (6.6%) | 121 (1.5%) |
| 18 to 34 Years | 477 (4.6%) | 768 (7.7%) |
| 35 to 64 Years | 908 (5.9%) | 860 (5.8%) |
| 65 to 74 Years | 219 (6.6%) | 190 (5.1%) |
| 75 Years and over | 157 (9.1%) | 473 (16.3%) |
Disability Class: Ambulatory Difficulty
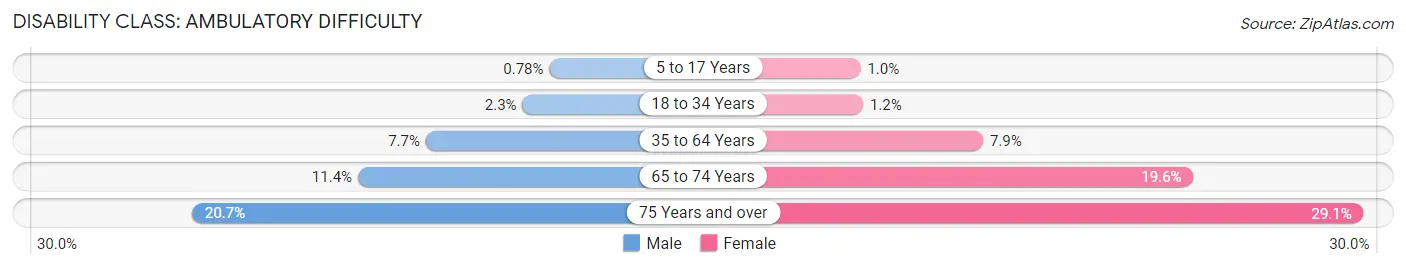
| Age Bracket | Male | Female |
| 5 to 17 Years | 65 (0.8%) | 83 (1.0%) |
| 18 to 34 Years | 238 (2.3%) | 118 (1.2%) |
| 35 to 64 Years | 1,169 (7.7%) | 1,173 (7.9%) |
| 65 to 74 Years | 378 (11.4%) | 729 (19.6%) |
| 75 Years and over | 356 (20.7%) | 843 (29.0%) |
Disability Class: Self-Care Difficulty
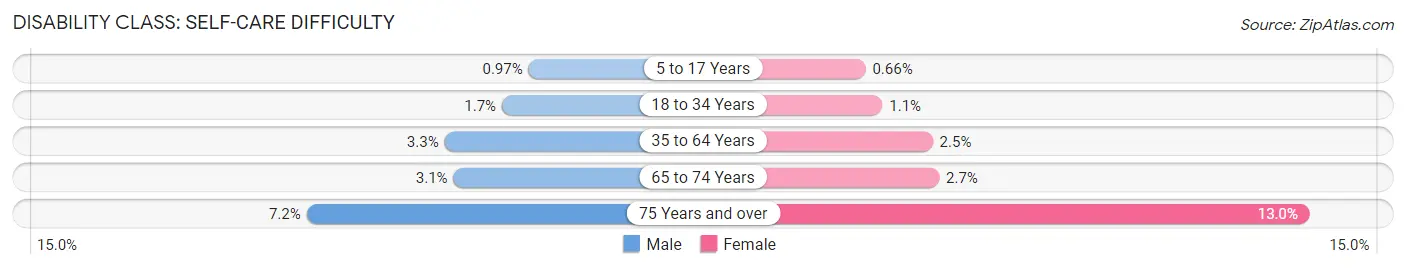
| Age Bracket | Male | Female |
| 5 to 17 Years | 80 (1.0%) | 53 (0.7%) |
| 18 to 34 Years | 178 (1.7%) | 113 (1.1%) |
| 35 to 64 Years | 505 (3.3%) | 377 (2.5%) |
| 65 to 74 Years | 101 (3.1%) | 101 (2.7%) |
| 75 Years and over | 123 (7.1%) | 378 (13.0%) |
Technology Access in Sioux City
Computing Device Access in Sioux City
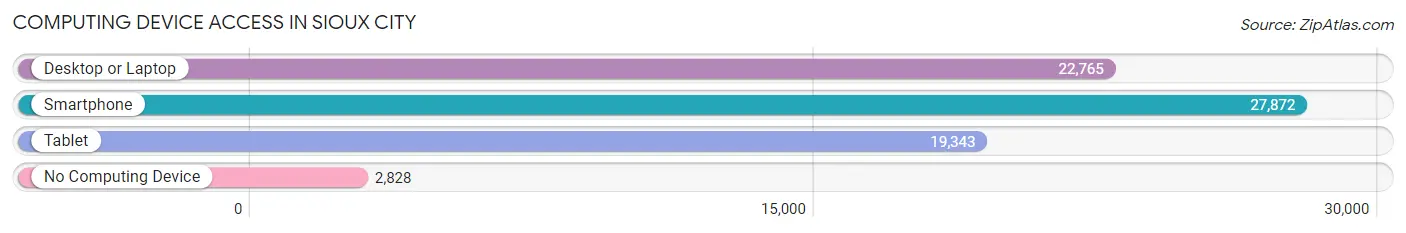
| Device Type | # Households | % Households |
| Desktop or Laptop | 22,765 | 70.2% |
| Smartphone | 27,872 | 85.9% |
| Tablet | 19,343 | 59.6% |
| No Computing Device | 2,828 | 8.7% |
| Total | 32,449 | 100.0% |
Internet Access in Sioux City
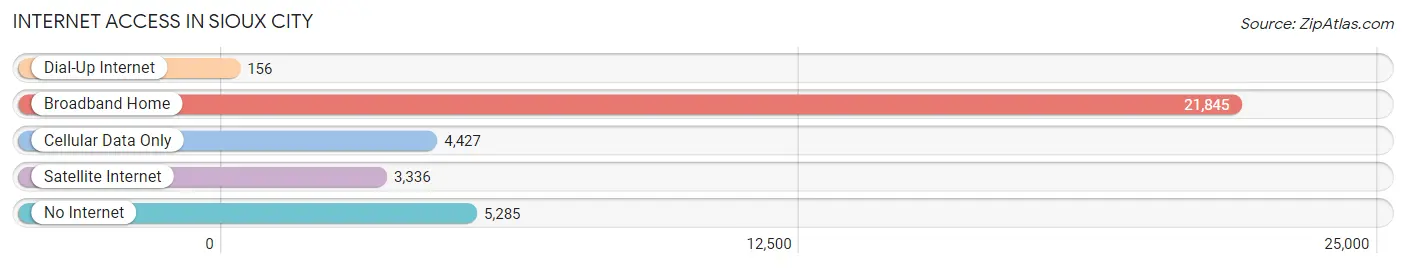
| Internet Type | # Households | % Households |
| Dial-Up Internet | 156 | 0.5% |
| Broadband Home | 21,845 | 67.3% |
| Cellular Data Only | 4,427 | 13.6% |
| Satellite Internet | 3,336 | 10.3% |
| No Internet | 5,285 | 16.3% |
| Total | 32,449 | 100.0% |
Sioux City Summary
Sioux City is a city located in Woodbury and Plymouth counties in the northwestern part of the U.S. state of Iowa. It is the county seat of Woodbury County and the fourth largest city in the state. As of the 2010 census, the city had a population of 82,684, making it the largest city in the Sioux City metropolitan area.
History
The area of Sioux City was first inhabited by the Ioway and Sioux tribes of Native Americans. The first European settlers arrived in the area in the 1830s, and the city was officially incorporated in 1857. The city was named after the Sioux tribe, and the name was later changed to Sioux City.
The city grew rapidly in the late 19th century, and by the early 20th century, it had become a major transportation hub for the region. The city was also a major center for the meatpacking industry, and it was home to several large meatpacking companies.
In the late 20th century, the city experienced a decline in the meatpacking industry, and the city's economy shifted to focus more on services and retail. The city has also become a major center for healthcare, education, and culture.
Geography
Sioux City is located in the northwestern corner of Iowa, on the Missouri River. It is bordered by South Dakota to the north, Nebraska to the west, and Iowa to the east and south. The city covers an area of 44.3 square miles, and has an elevation of 1,190 feet.
The city is located in a region of rolling hills and bluffs, and is home to several parks and recreational areas. The city is also home to several lakes, including Lake Okoboji and Lake Manawa.
Economy
The economy of Sioux City is largely based on services and retail. The city is home to several major employers, including Tyson Foods, Wells Fargo, and Mercy Medical Center. The city is also home to several major manufacturing companies, including John Deere, Cargill, and 3M.
The city is also home to several major educational institutions, including Briar Cliff University, Morningside College, and Western Iowa Tech Community College.
Demographics
As of the 2010 census, the population of Sioux City was 82,684. The racial makeup of the city was 79.2% White, 5.3% African American, 0.7% Native American, 2.2% Asian, 0.1% Pacific Islander, 9.7% from other races, and 2.8% from two or more races. Hispanic or Latino of any race were 18.2% of the population.
The median income for a household in the city was $41,919, and the median income for a family was $50,919. The per capita income for the city was $21,919. About 11.2% of families and 14.3% of the population were below the poverty line, including 19.2% of those under age 18 and 8.2% of those age 65 or over.
Common Questions
What is Per Capita Income in Sioux City?
Per Capita income in Sioux City is $31,428.
What is the Median Family Income in Sioux City?
Median Family Income in Sioux City is $81,639.
What is the Median Household income in Sioux City?
Median Household Income in Sioux City is $64,250.
What is Income or Wage Gap in Sioux City?
Income or Wage Gap in Sioux City is 25.9%.
Women in Sioux City earn 74.1 cents for every dollar earned by a man.
What is Family Income Deficit in Sioux City?
Family Income Deficit in Sioux City is $11,265.
Families that are below poverty line in Sioux City earn $11,265 less on average than the poverty threshold level.
What is Inequality or Gini Index in Sioux City?
Inequality or Gini Index in Sioux City is 0.43.
What is the Total Population of Sioux City?
Total Population of Sioux City is 85,469.
What is the Total Male Population of Sioux City?
Total Male Population of Sioux City is 42,694.
What is the Total Female Population of Sioux City?
Total Female Population of Sioux City is 42,775.
What is the Ratio of Males per 100 Females in Sioux City?
There are 99.81 Males per 100 Females in Sioux City.
What is the Ratio of Females per 100 Males in Sioux City?
There are 100.19 Females per 100 Males in Sioux City.
What is the Median Population Age in Sioux City?
Median Population Age in Sioux City is 34.8 Years.
What is the Average Family Size in Sioux City
Average Family Size in Sioux City is 3.2 People.
What is the Average Household Size in Sioux City
Average Household Size in Sioux City is 2.5 People.
How Large is the Labor Force in Sioux City?
There are 44,882 People in the Labor Forcein in Sioux City.
What is the Percentage of People in the Labor Force in Sioux City?
68.5% of People are in the Labor Force in Sioux City.
What is the Unemployment Rate in Sioux City?
Unemployment Rate in Sioux City is 4.7%.