Langley Park, MD Map & Demographics
Langley Park Map
Langley Park Overview
$21,160
PER CAPITA INCOME
$70,962
AVG FAMILY INCOME
$77,731
AVG HOUSEHOLD INCOME
27.8%
WAGE / INCOME GAP [ % ]
72.2¢/ $1
WAGE / INCOME GAP [ $ ]
$13,003
FAMILY INCOME DEFICIT
0.38
INEQUALITY / GINI INDEX
21,778
TOTAL POPULATION
12,221
MALE POPULATION
9,557
FEMALE POPULATION
127.87
MALES / 100 FEMALES
78.20
FEMALES / 100 MALES
29.3
MEDIAN AGE
4.3
AVG FAMILY SIZE
4.2
AVG HOUSEHOLD SIZE
10,760
LABOR FORCE [ PEOPLE ]
72.6%
PERCENT IN LABOR FORCE
7.3%
UNEMPLOYMENT RATE
Langley Park Area Codes
Income in Langley Park
Income Overview in Langley Park
Per Capita Income in Langley Park is $21,160, while median incomes of families and households are $70,962 and $77,731 respectively.
| Characteristic | Number | Measure |
| Per Capita Income | 21,778 | $21,160 |
| Median Family Income | 3,838 | $70,962 |
| Mean Family Income | 3,838 | $77,217 |
| Median Household Income | 5,198 | $77,731 |
| Mean Household Income | 5,198 | $83,621 |
| Income Deficit | 3,838 | $13,003 |
| Wage / Income Gap (%) | 21,778 | 27.76% |
| Wage / Income Gap ($) | 21,778 | 72.24¢ per $1 |
| Gini / Inequality Index | 21,778 | 0.38 |
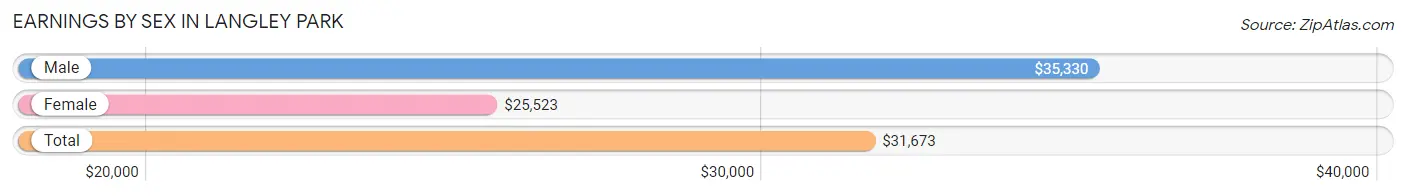
Earnings by Sex in Langley Park
Average Earnings in Langley Park are $31,673, $35,330 for men and $25,523 for women, a difference of 27.8%.
| Sex | Number | Average Earnings |
| Male | 7,651 (69.4%) | $35,330 |
| Female | 3,376 (30.6%) | $25,523 |
| Total | 11,027 (100.0%) | $31,673 |
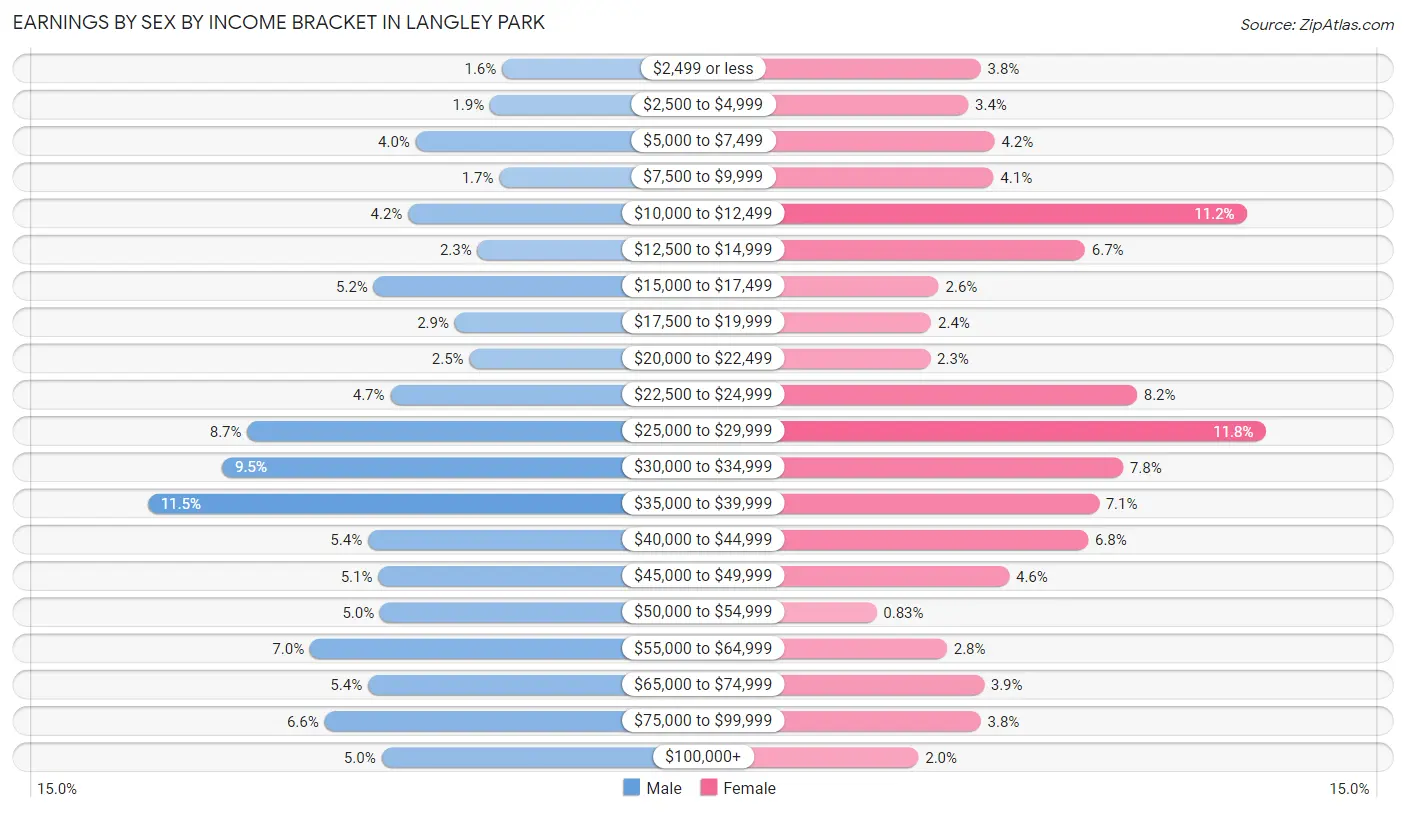
Earnings by Sex by Income Bracket in Langley Park
The most common earnings brackets in Langley Park are $35,000 to $39,999 for men (883 | 11.5%) and $25,000 to $29,999 for women (397 | 11.8%).
| Income | Male | Female |
| $2,499 or less | 121 (1.6%) | 127 (3.8%) |
| $2,500 to $4,999 | 147 (1.9%) | 115 (3.4%) |
| $5,000 to $7,499 | 307 (4.0%) | 140 (4.2%) |
| $7,500 to $9,999 | 127 (1.7%) | 139 (4.1%) |
| $10,000 to $12,499 | 323 (4.2%) | 379 (11.2%) |
| $12,500 to $14,999 | 174 (2.3%) | 226 (6.7%) |
| $15,000 to $17,499 | 397 (5.2%) | 87 (2.6%) |
| $17,500 to $19,999 | 223 (2.9%) | 80 (2.4%) |
| $20,000 to $22,499 | 191 (2.5%) | 79 (2.3%) |
| $22,500 to $24,999 | 361 (4.7%) | 275 (8.2%) |
| $25,000 to $29,999 | 669 (8.7%) | 397 (11.8%) |
| $30,000 to $34,999 | 723 (9.5%) | 262 (7.8%) |
| $35,000 to $39,999 | 883 (11.5%) | 239 (7.1%) |
| $40,000 to $44,999 | 409 (5.3%) | 229 (6.8%) |
| $45,000 to $49,999 | 387 (5.1%) | 154 (4.6%) |
| $50,000 to $54,999 | 383 (5.0%) | 28 (0.8%) |
| $55,000 to $64,999 | 534 (7.0%) | 95 (2.8%) |
| $65,000 to $74,999 | 409 (5.3%) | 130 (3.8%) |
| $75,000 to $99,999 | 503 (6.6%) | 127 (3.8%) |
| $100,000+ | 380 (5.0%) | 68 (2.0%) |
| Total | 7,651 (100.0%) | 3,376 (100.0%) |
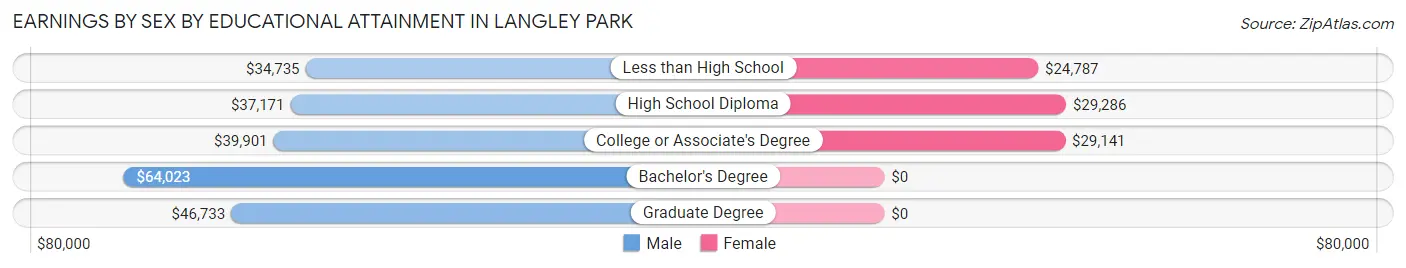
Earnings by Sex by Educational Attainment in Langley Park
Average earnings in Langley Park are $36,853 for men and $26,766 for women, a difference of 27.4%. Men with an educational attainment of bachelor's degree enjoy the highest average annual earnings of $64,023, while those with less than high school education earn the least with $34,735. Women with an educational attainment of high school diploma earn the most with the average annual earnings of $29,286, while those with less than high school education have the smallest earnings of $24,787.
| Educational Attainment | Male Income | Female Income |
| Less than High School | $34,735 | $24,787 |
| High School Diploma | $37,171 | $29,286 |
| College or Associate's Degree | $39,901 | $29,141 |
| Bachelor's Degree | $64,023 | $0 |
| Graduate Degree | $46,733 | $0 |
| Total | $36,853 | $26,766 |
Family Income in Langley Park
Family Income Brackets in Langley Park
According to the Langley Park family income data, there are 814 families falling into the $100,000 to $149,999 income range, which is the most common income bracket and makes up 21.2% of all families. Conversely, the $200,000+ income bracket is the least frequent group with only 61 families (1.6%) belonging to this category.
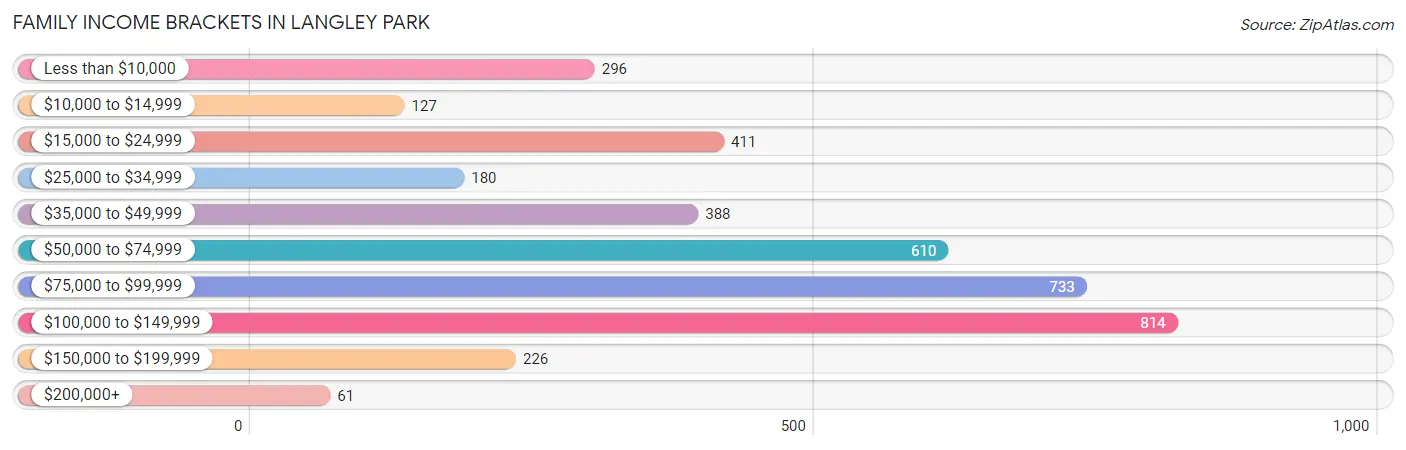
| Income Bracket | # Families | % Families |
| Less than $10,000 | 296 | 7.7% |
| $10,000 to $14,999 | 127 | 3.3% |
| $15,000 to $24,999 | 411 | 10.7% |
| $25,000 to $34,999 | 180 | 4.7% |
| $35,000 to $49,999 | 388 | 10.1% |
| $50,000 to $74,999 | 610 | 15.9% |
| $75,000 to $99,999 | 733 | 19.1% |
| $100,000 to $149,999 | 814 | 21.2% |
| $150,000 to $199,999 | 226 | 5.9% |
| $200,000+ | 61 | 1.6% |
Family Income by Famaliy Size in Langley Park
7+ person families (216 | 5.6%) account for the highest median family income in Langley Park with $112,727 per family, while 2-person families (689 | 17.9%) have the highest median income of $30,125 per family member.
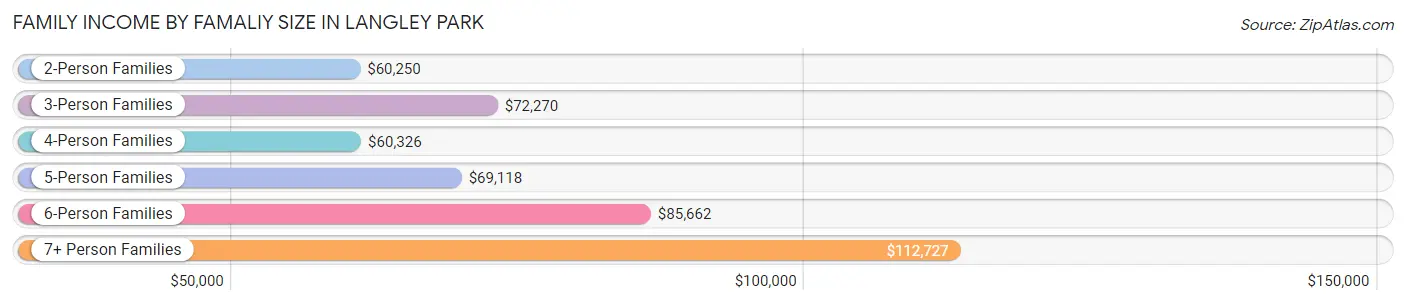
| Income Bracket | # Families | Median Income |
| 2-Person Families | 689 (17.9%) | $60,250 |
| 3-Person Families | 1,129 (29.4%) | $72,270 |
| 4-Person Families | 896 (23.4%) | $60,326 |
| 5-Person Families | 658 (17.1%) | $69,118 |
| 6-Person Families | 250 (6.5%) | $85,662 |
| 7+ Person Families | 216 (5.6%) | $112,727 |
| Total | 3,838 (100.0%) | $70,962 |
Family Income by Number of Earners in Langley Park
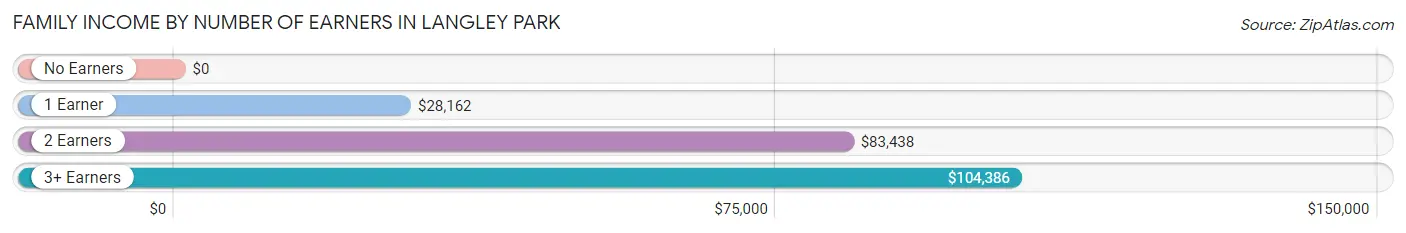
| Number of Earners | # Families | Median Income |
| No Earners | 164 (4.3%) | $0 |
| 1 Earner | 1,345 (35.0%) | $28,162 |
| 2 Earners | 1,437 (37.4%) | $83,438 |
| 3+ Earners | 892 (23.2%) | $104,386 |
| Total | 3,838 (100.0%) | $70,962 |
Household Income in Langley Park
Household Income Brackets in Langley Park
With 1,081 households falling in the category, the $75,000 to $99,999 income range is the most frequent in Langley Park, accounting for 20.8% of all households. In contrast, only 125 households (2.4%) fall into the $200,000+ income bracket, making it the least populous group.
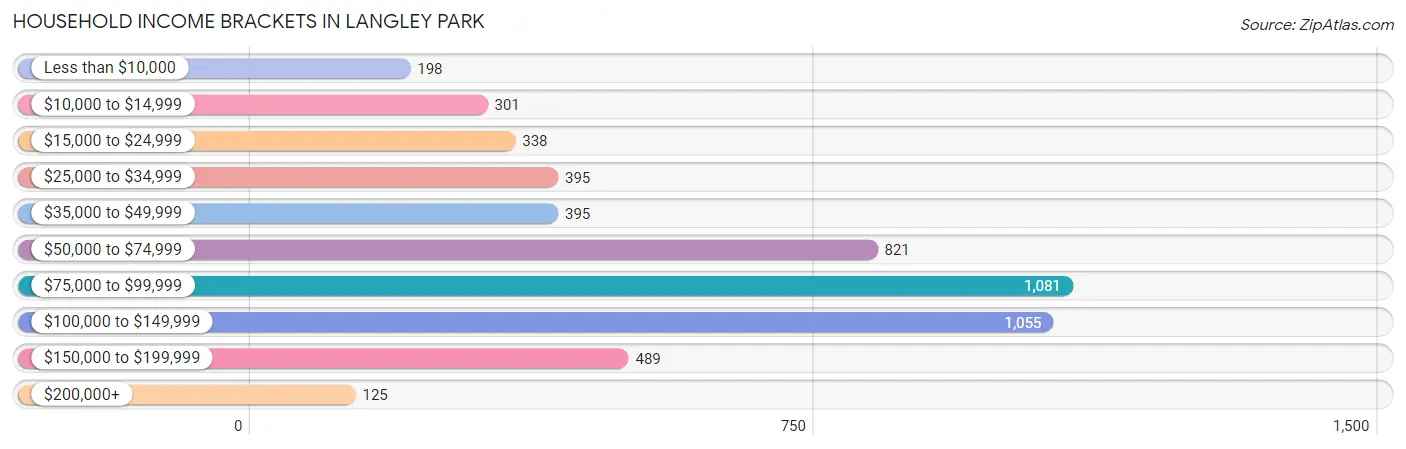
| Income Bracket | # Households | % Households |
| Less than $10,000 | 198 | 3.8% |
| $10,000 to $14,999 | 301 | 5.8% |
| $15,000 to $24,999 | 338 | 6.5% |
| $25,000 to $34,999 | 395 | 7.6% |
| $35,000 to $49,999 | 395 | 7.6% |
| $50,000 to $74,999 | 821 | 15.8% |
| $75,000 to $99,999 | 1,081 | 20.8% |
| $100,000 to $149,999 | 1,055 | 20.3% |
| $150,000 to $199,999 | 489 | 9.4% |
| $200,000+ | 125 | 2.4% |
Household Income by Householder Age in Langley Park
The median household income in Langley Park is $77,731, with the highest median household income of $82,445 found in the 45 to 64 years age bracket for the primary householder. A total of 1,949 households (37.5%) fall into this category. Meanwhile, the 15 to 24 years age bracket for the primary householder has the lowest median household income of $45,658, with 158 households (3.0%) in this group.
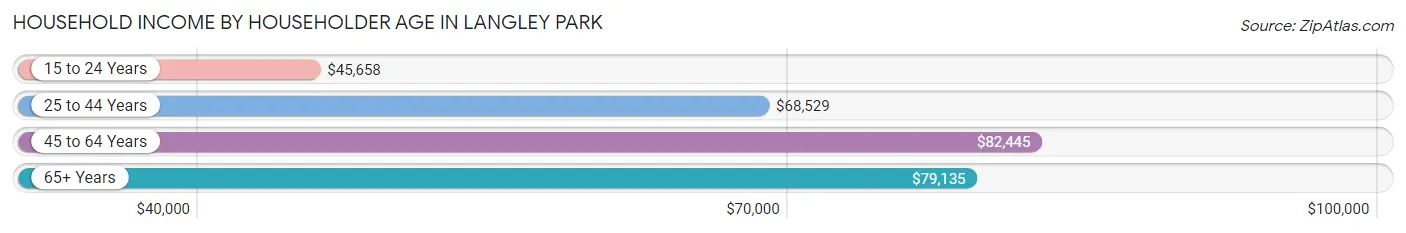
| Income Bracket | # Households | Median Income |
| 15 to 24 Years | 158 (3.0%) | $45,658 |
| 25 to 44 Years | 2,484 (47.8%) | $68,529 |
| 45 to 64 Years | 1,949 (37.5%) | $82,445 |
| 65+ Years | 607 (11.7%) | $79,135 |
| Total | 5,198 (100.0%) | $77,731 |
Poverty in Langley Park
Income Below Poverty by Sex and Age in Langley Park
With 21.5% poverty level for males and 32.3% for females among the residents of Langley Park, 15 year old males and 15 year old females are the most vulnerable to poverty, with 102 males (81.6%) and 109 females (70.8%) in their respective age groups living below the poverty level.
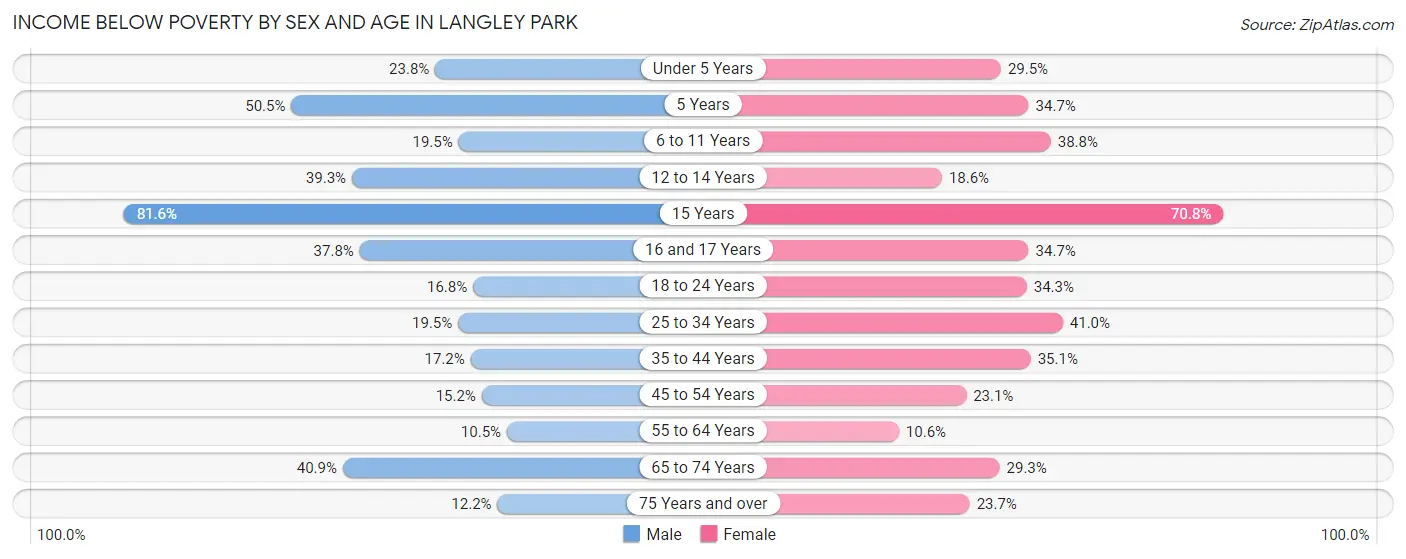
| Age Bracket | Male | Female |
| Under 5 Years | 260 (23.8%) | 402 (29.5%) |
| 5 Years | 260 (50.5%) | 86 (34.7%) |
| 6 to 11 Years | 206 (19.5%) | 410 (38.8%) |
| 12 to 14 Years | 199 (39.3%) | 95 (18.6%) |
| 15 Years | 102 (81.6%) | 109 (70.8%) |
| 16 and 17 Years | 121 (37.8%) | 129 (34.7%) |
| 18 to 24 Years | 171 (16.8%) | 239 (34.3%) |
| 25 to 34 Years | 473 (19.5%) | 677 (41.0%) |
| 35 to 44 Years | 336 (17.2%) | 471 (35.1%) |
| 45 to 54 Years | 235 (15.2%) | 172 (23.1%) |
| 55 to 64 Years | 116 (10.5%) | 60 (10.6%) |
| 65 to 74 Years | 79 (40.9%) | 152 (29.3%) |
| 75 Years and over | 12 (12.2%) | 61 (23.7%) |
| Total | 2,570 (21.5%) | 3,063 (32.3%) |
Income Above Poverty by Sex and Age in Langley Park
According to the poverty statistics in Langley Park, males aged 55 to 64 years and females aged 55 to 64 years are the age groups that are most secure financially, with 89.5% of males and 89.4% of females in these age groups living above the poverty line.
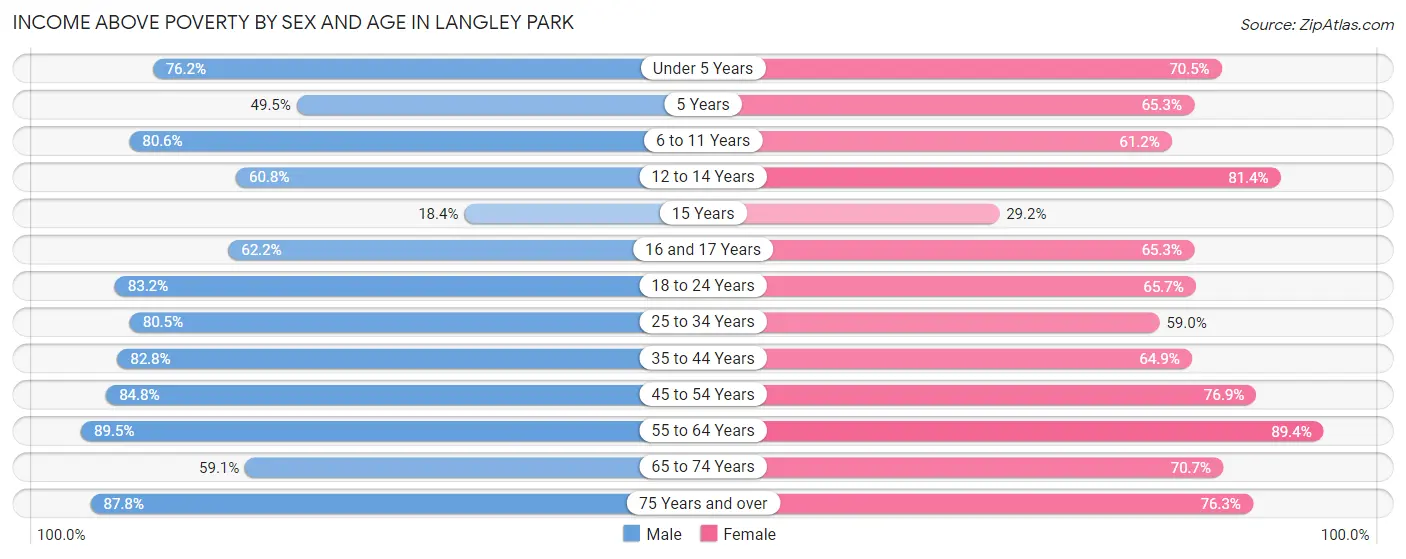
| Age Bracket | Male | Female |
| Under 5 Years | 833 (76.2%) | 959 (70.5%) |
| 5 Years | 255 (49.5%) | 162 (65.3%) |
| 6 to 11 Years | 853 (80.5%) | 647 (61.2%) |
| 12 to 14 Years | 308 (60.8%) | 416 (81.4%) |
| 15 Years | 23 (18.4%) | 45 (29.2%) |
| 16 and 17 Years | 199 (62.2%) | 243 (65.3%) |
| 18 to 24 Years | 849 (83.2%) | 457 (65.7%) |
| 25 to 34 Years | 1,949 (80.5%) | 973 (59.0%) |
| 35 to 44 Years | 1,616 (82.8%) | 872 (64.9%) |
| 45 to 54 Years | 1,315 (84.8%) | 573 (76.9%) |
| 55 to 64 Years | 991 (89.5%) | 506 (89.4%) |
| 65 to 74 Years | 114 (59.1%) | 367 (70.7%) |
| 75 Years and over | 86 (87.8%) | 196 (76.3%) |
| Total | 9,391 (78.5%) | 6,416 (67.7%) |
Income Below Poverty Among Married-Couple Families in Langley Park
The poverty statistics for married-couple families in Langley Park show that 12.6% or 197 of the total 1,562 families live below the poverty line. Families with 1 or 2 children have the highest poverty rate of 29.1%, comprising of 158 families. On the other hand, families with 3 or 4 children have the lowest poverty rate of 0.0%, which includes 0 families.
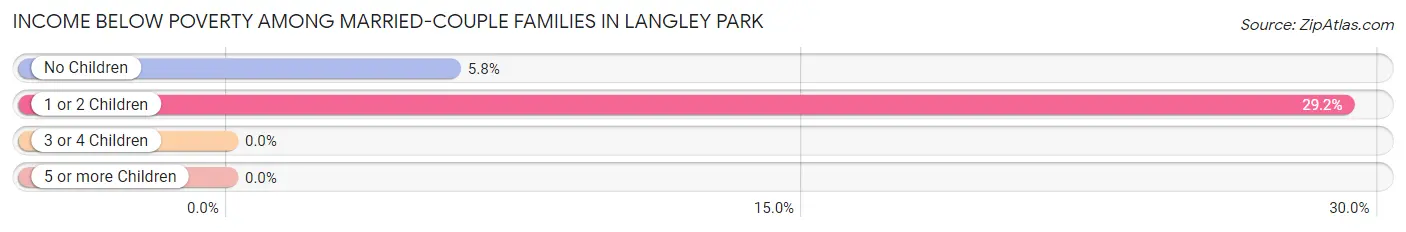
| Children | Above Poverty | Below Poverty |
| No Children | 631 (94.2%) | 39 (5.8%) |
| 1 or 2 Children | 384 (70.9%) | 158 (29.1%) |
| 3 or 4 Children | 315 (100.0%) | 0 (0.0%) |
| 5 or more Children | 35 (100.0%) | 0 (0.0%) |
| Total | 1,365 (87.4%) | 197 (12.6%) |
Income Below Poverty Among Single-Parent Households in Langley Park
According to the poverty data in Langley Park, 15.5% or 159 single-father households and 37.2% or 464 single-mother households are living below the poverty line. Among single-father households, those with 5 or more children have the highest poverty rate, with 19 households (46.3%) experiencing poverty. Likewise, among single-mother households, those with 3 or 4 children have the highest poverty rate, with 166 households (59.9%) falling below the poverty line.
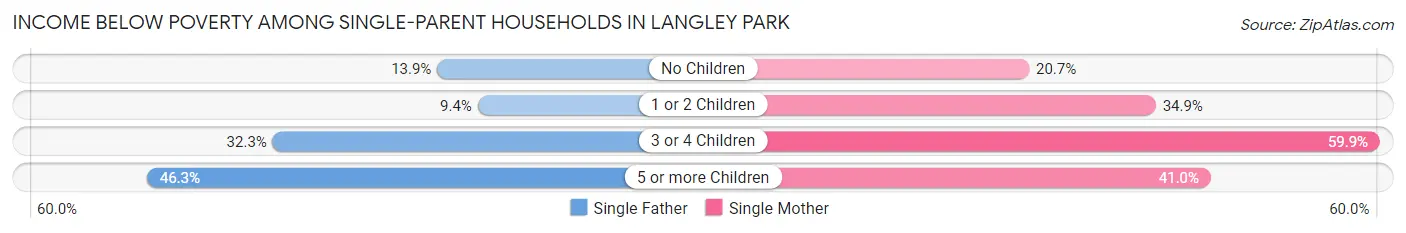
| Children | Single Father | Single Mother |
| No Children | 35 (13.9%) | 63 (20.7%) |
| 1 or 2 Children | 54 (9.4%) | 219 (34.9%) |
| 3 or 4 Children | 51 (32.3%) | 166 (59.9%) |
| 5 or more Children | 19 (46.3%) | 16 (41.0%) |
| Total | 159 (15.5%) | 464 (37.2%) |
Income Below Poverty Among Married-Couple vs Single-Parent Households in Langley Park
The poverty data for Langley Park shows that 197 of the married-couple family households (12.6%) and 623 of the single-parent households (27.4%) are living below the poverty level. Within the married-couple family households, those with 1 or 2 children have the highest poverty rate, with 158 households (29.1%) falling below the poverty line. Among the single-parent households, those with 3 or 4 children have the highest poverty rate, with 217 household (49.9%) living below poverty.
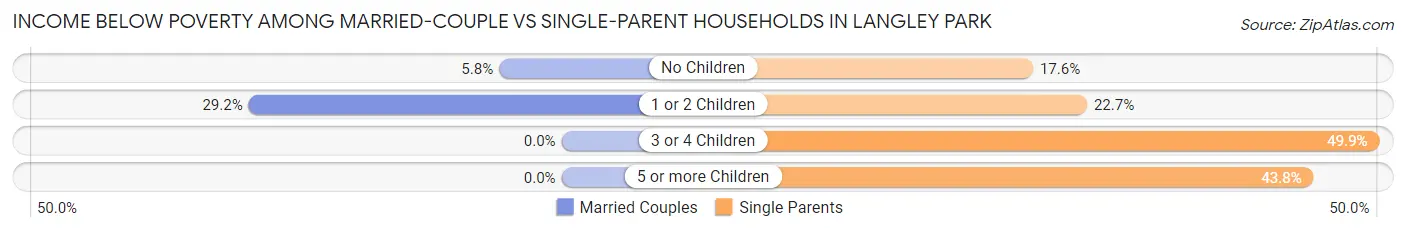
| Children | Married-Couple Families | Single-Parent Households |
| No Children | 39 (5.8%) | 98 (17.6%) |
| 1 or 2 Children | 158 (29.1%) | 273 (22.7%) |
| 3 or 4 Children | 0 (0.0%) | 217 (49.9%) |
| 5 or more Children | 0 (0.0%) | 35 (43.8%) |
| Total | 197 (12.6%) | 623 (27.4%) |
Race in Langley Park
The most populous races in Langley Park are Hispanic or Latino (18,076 | 83.0%), Some other Race (16,785 | 77.1%), and Black / African American (2,944 | 13.5%).
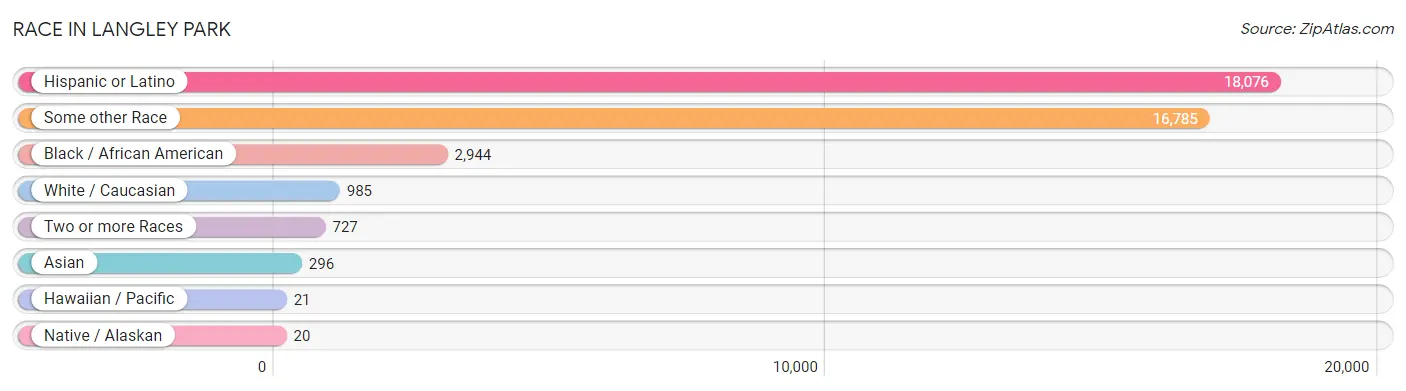
| Race | # Population | % Population |
| Asian | 296 | 1.4% |
| Black / African American | 2,944 | 13.5% |
| Hawaiian / Pacific | 21 | 0.1% |
| Hispanic or Latino | 18,076 | 83.0% |
| Native / Alaskan | 20 | 0.1% |
| White / Caucasian | 985 | 4.5% |
| Two or more Races | 727 | 3.3% |
| Some other Race | 16,785 | 77.1% |
| Total | 21,778 | 100.0% |
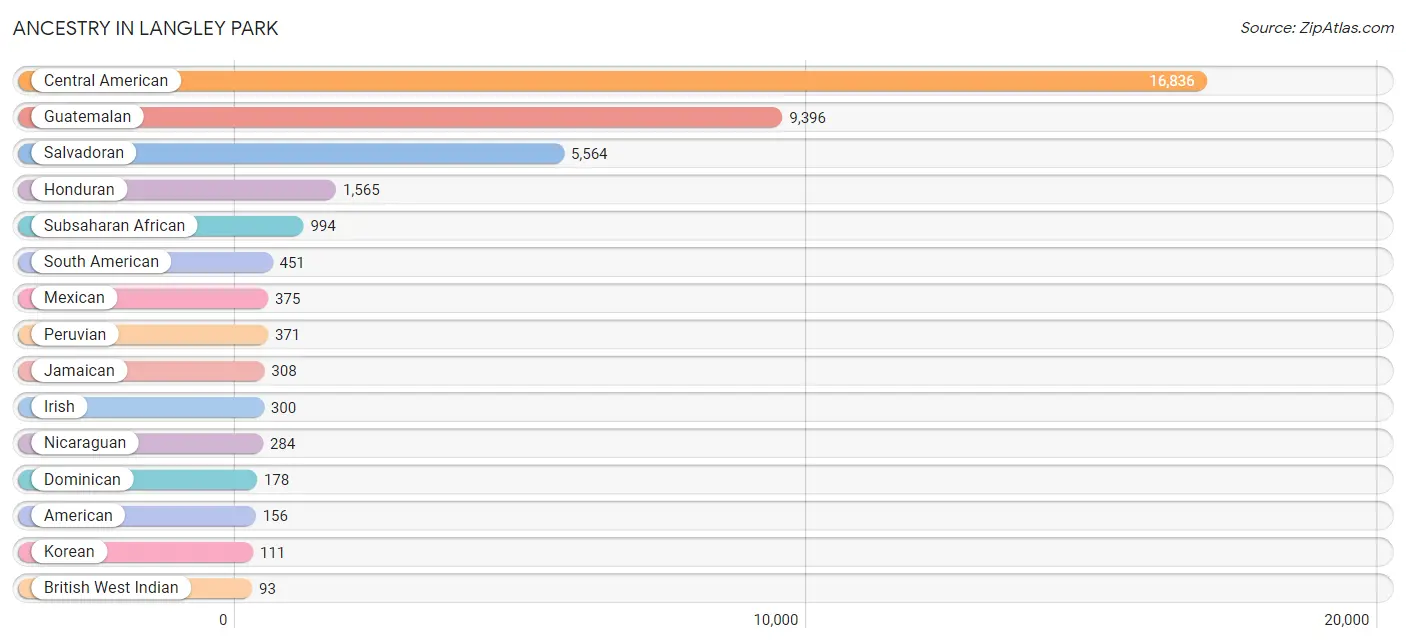
Ancestry in Langley Park
The most populous ancestries reported in Langley Park are Central American (16,836 | 77.3%), Guatemalan (9,396 | 43.1%), Salvadoran (5,564 | 25.6%), Honduran (1,565 | 7.2%), and Subsaharan African (994 | 4.6%), together accounting for 157.8% of all Langley Park residents.
| Ancestry | # Population | % Population |
| African | 12 | 0.1% |
| American | 156 | 0.7% |
| Arab | 75 | 0.3% |
| Barbadian | 7 | 0.0% |
| Bolivian | 24 | 0.1% |
| British West Indian | 93 | 0.4% |
| Burmese | 21 | 0.1% |
| Central American | 16,836 | 77.3% |
| Central American Indian | 20 | 0.1% |
| Cherokee | 5 | 0.0% |
| Colombian | 56 | 0.3% |
| Dominican | 178 | 0.8% |
| English | 73 | 0.3% |
| Ethiopian | 76 | 0.4% |
| European | 3 | 0.0% |
| French | 23 | 0.1% |
| German | 83 | 0.4% |
| Greek | 4 | 0.0% |
| Guamanian / Chamorro | 21 | 0.1% |
| Guatemalan | 9,396 | 43.1% |
| Haitian | 11 | 0.1% |
| Honduran | 1,565 | 7.2% |
| Hungarian | 7 | 0.0% |
| Indian (Asian) | 34 | 0.2% |
| Irish | 300 | 1.4% |
| Italian | 18 | 0.1% |
| Jamaican | 308 | 1.4% |
| Japanese | 25 | 0.1% |
| Korean | 111 | 0.5% |
| Lithuanian | 16 | 0.1% |
| Mexican | 375 | 1.7% |
| Moroccan | 27 | 0.1% |
| Nicaraguan | 284 | 1.3% |
| Nigerian | 78 | 0.4% |
| Panamanian | 27 | 0.1% |
| Peruvian | 371 | 1.7% |
| Puerto Rican | 79 | 0.4% |
| Russian | 7 | 0.0% |
| Salvadoran | 5,564 | 25.6% |
| Scotch-Irish | 23 | 0.1% |
| Sierra Leonean | 27 | 0.1% |
| South American | 451 | 2.1% |
| South American Indian | 5 | 0.0% |
| Sri Lankan | 30 | 0.1% |
| Subsaharan African | 994 | 4.6% |
| Thai | 10 | 0.1% |
| Trinidadian and Tobagonian | 75 | 0.3% |
| Turkish | 16 | 0.1% |
| Vietnamese | 51 | 0.2% |
| Welsh | 8 | 0.0% | View All 50 Rows |
Immigrants in Langley Park
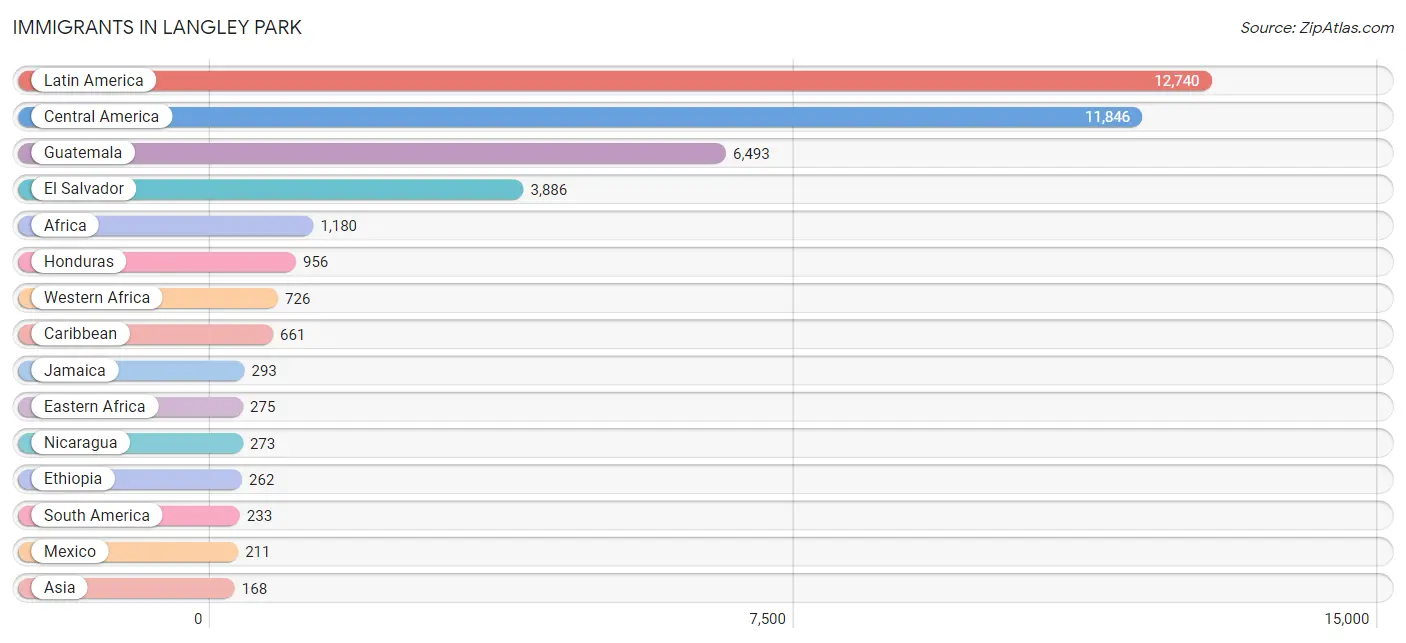
The most numerous immigrant groups reported in Langley Park came from Latin America (12,740 | 58.5%), Central America (11,846 | 54.4%), Guatemala (6,493 | 29.8%), El Salvador (3,886 | 17.8%), and Africa (1,180 | 5.4%), together accounting for 166.0% of all Langley Park residents.
| Immigration Origin | # Population | % Population |
| Africa | 1,180 | 5.4% |
| Asia | 168 | 0.8% |
| Bangladesh | 38 | 0.2% |
| Barbados | 7 | 0.0% |
| Belgium | 15 | 0.1% |
| Bolivia | 8 | 0.0% |
| Cambodia | 25 | 0.1% |
| Cameroon | 121 | 0.6% |
| Canada | 12 | 0.1% |
| Caribbean | 661 | 3.0% |
| Central America | 11,846 | 54.4% |
| China | 19 | 0.1% |
| Colombia | 56 | 0.3% |
| Dominica | 8 | 0.0% |
| Dominican Republic | 92 | 0.4% |
| Eastern Africa | 275 | 1.3% |
| Eastern Asia | 19 | 0.1% |
| El Salvador | 3,886 | 17.8% |
| England | 18 | 0.1% |
| Ethiopia | 262 | 1.2% |
| Europe | 50 | 0.2% |
| Germany | 8 | 0.0% |
| Grenada | 9 | 0.0% |
| Guatemala | 6,493 | 29.8% |
| Guyana | 17 | 0.1% |
| Haiti | 11 | 0.1% |
| Honduras | 956 | 4.4% |
| India | 10 | 0.1% |
| Jamaica | 293 | 1.3% |
| Latin America | 12,740 | 58.5% |
| Mexico | 211 | 1.0% |
| Middle Africa | 152 | 0.7% |
| Morocco | 27 | 0.1% |
| Nepal | 21 | 0.1% |
| Nicaragua | 273 | 1.3% |
| Nigeria | 40 | 0.2% |
| Northern Africa | 27 | 0.1% |
| Northern Europe | 18 | 0.1% |
| Panama | 27 | 0.1% |
| Peru | 152 | 0.7% |
| Philippines | 9 | 0.0% |
| Sierra Leone | 54 | 0.3% |
| South America | 233 | 1.1% |
| South Central Asia | 69 | 0.3% |
| South Eastern Asia | 64 | 0.3% |
| Switzerland | 9 | 0.0% |
| Trinidad and Tobago | 122 | 0.6% |
| Turkey | 16 | 0.1% |
| Vietnam | 30 | 0.1% |
| Western Africa | 726 | 3.3% |
| Western Asia | 16 | 0.1% |
| Western Europe | 32 | 0.2% |
| Zaire | 31 | 0.1% | View All 53 Rows |
Sex and Age in Langley Park
Sex and Age in Langley Park
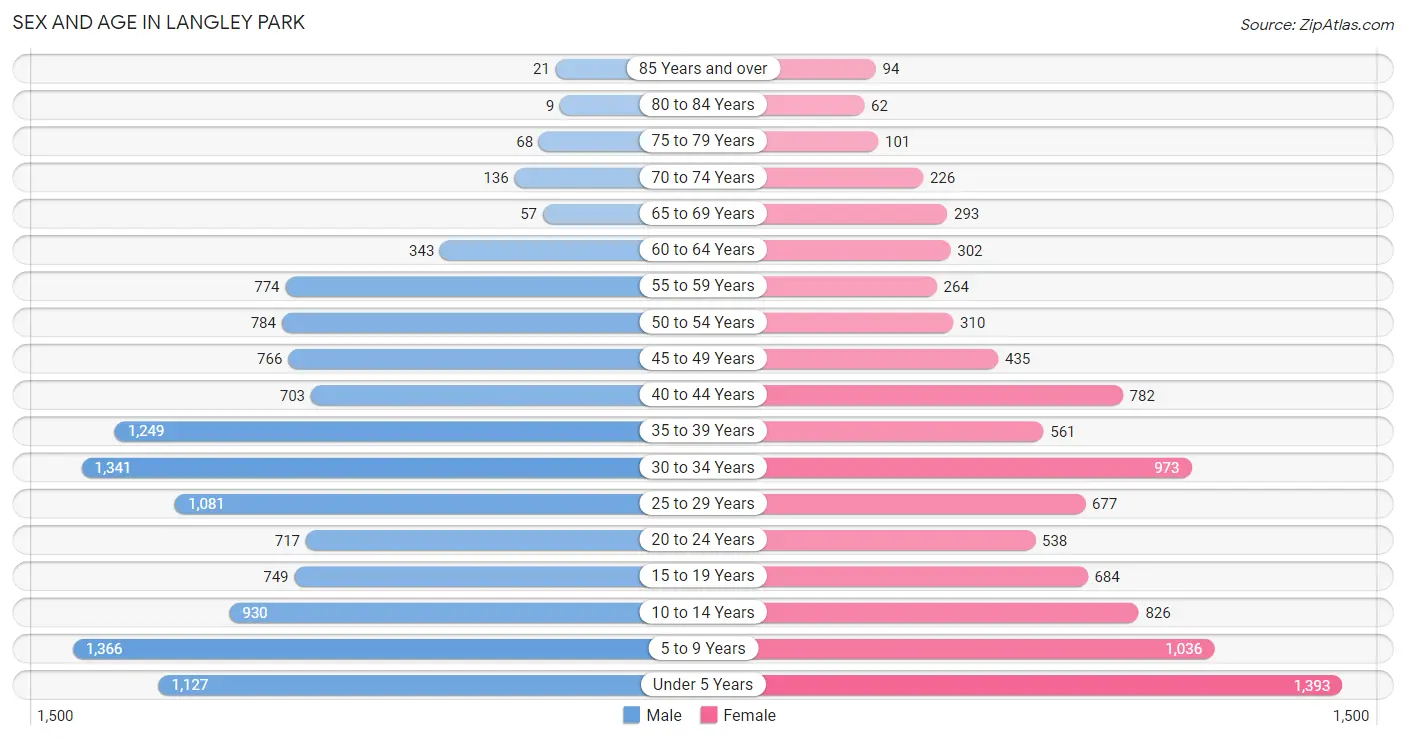
The most populous age groups in Langley Park are 5 to 9 Years (1,366 | 11.2%) for men and Under 5 Years (1,393 | 14.6%) for women.
| Age Bracket | Male | Female |
| Under 5 Years | 1,127 (9.2%) | 1,393 (14.6%) |
| 5 to 9 Years | 1,366 (11.2%) | 1,036 (10.8%) |
| 10 to 14 Years | 930 (7.6%) | 826 (8.6%) |
| 15 to 19 Years | 749 (6.1%) | 684 (7.2%) |
| 20 to 24 Years | 717 (5.9%) | 538 (5.6%) |
| 25 to 29 Years | 1,081 (8.8%) | 677 (7.1%) |
| 30 to 34 Years | 1,341 (11.0%) | 973 (10.2%) |
| 35 to 39 Years | 1,249 (10.2%) | 561 (5.9%) |
| 40 to 44 Years | 703 (5.8%) | 782 (8.2%) |
| 45 to 49 Years | 766 (6.3%) | 435 (4.5%) |
| 50 to 54 Years | 784 (6.4%) | 310 (3.2%) |
| 55 to 59 Years | 774 (6.3%) | 264 (2.8%) |
| 60 to 64 Years | 343 (2.8%) | 302 (3.2%) |
| 65 to 69 Years | 57 (0.5%) | 293 (3.1%) |
| 70 to 74 Years | 136 (1.1%) | 226 (2.4%) |
| 75 to 79 Years | 68 (0.6%) | 101 (1.1%) |
| 80 to 84 Years | 9 (0.1%) | 62 (0.6%) |
| 85 Years and over | 21 (0.2%) | 94 (1.0%) |
| Total | 12,221 (100.0%) | 9,557 (100.0%) |
Families and Households in Langley Park
Median Family Size in Langley Park
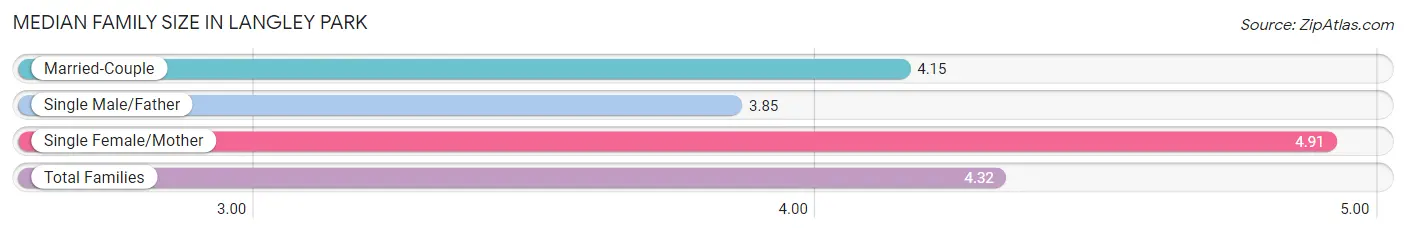
The median family size in Langley Park is 4.32 persons per family, with single female/mother families (1,248 | 32.5%) accounting for the largest median family size of 4.91 persons per family. On the other hand, single male/father families (1,028 | 26.8%) represent the smallest median family size with 3.85 persons per family.
| Family Type | # Families | Family Size |
| Married-Couple | 1,562 (40.7%) | 4.15 |
| Single Male/Father | 1,028 (26.8%) | 3.85 |
| Single Female/Mother | 1,248 (32.5%) | 4.91 |
| Total Families | 3,838 (100.0%) | 4.32 |
Median Household Size in Langley Park
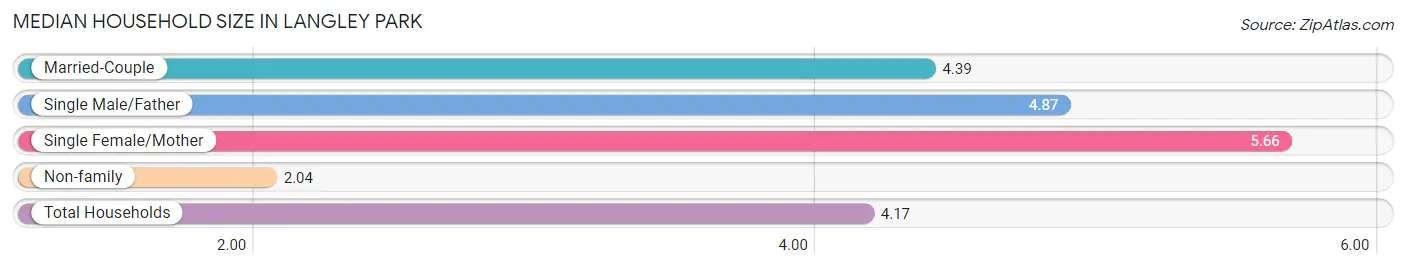
The median household size in Langley Park is 4.17 persons per household, with single female/mother households (1,248 | 24.0%) accounting for the largest median household size of 5.66 persons per household. non-family households (1,360 | 26.2%) represent the smallest median household size with 2.04 persons per household.
| Household Type | # Households | Household Size |
| Married-Couple | 1,562 (30.0%) | 4.39 |
| Single Male/Father | 1,028 (19.8%) | 4.87 |
| Single Female/Mother | 1,248 (24.0%) | 5.66 |
| Non-family | 1,360 (26.2%) | 2.04 |
| Total Households | 5,198 (100.0%) | 4.17 |
Household Size by Marriage Status in Langley Park
Out of a total of 5,198 households in Langley Park, 3,838 (73.8%) are family households, while 1,360 (26.2%) are nonfamily households. The most numerous type of family households are 4-person households, comprising 1,048, and the most common type of nonfamily households are 1-person households, comprising 833.
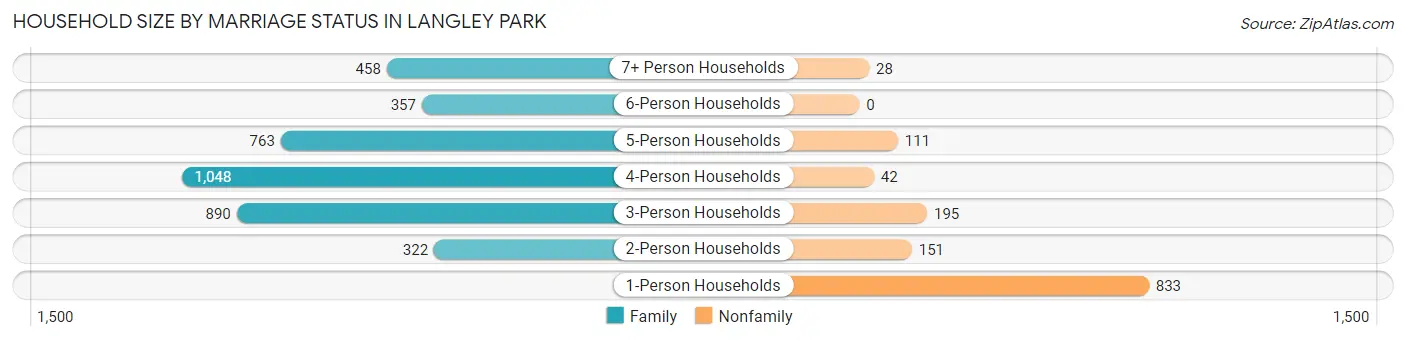
| Household Size | Family Households | Nonfamily Households |
| 1-Person Households | - | 833 (16.0%) |
| 2-Person Households | 322 (6.2%) | 151 (2.9%) |
| 3-Person Households | 890 (17.1%) | 195 (3.7%) |
| 4-Person Households | 1,048 (20.2%) | 42 (0.8%) |
| 5-Person Households | 763 (14.7%) | 111 (2.1%) |
| 6-Person Households | 357 (6.9%) | 0 (0.0%) |
| 7+ Person Households | 458 (8.8%) | 28 (0.5%) |
| Total | 3,838 (73.8%) | 1,360 (26.2%) |
Female Fertility in Langley Park
Fertility by Age in Langley Park
Average fertility rate in Langley Park is 83.0 births per 1,000 women. Women in the age bracket of 20 to 34 years have the highest fertility rate with 153.0 births per 1,000 women. Women in the age bracket of 20 to 34 years acount for 85.5% of all women with births.
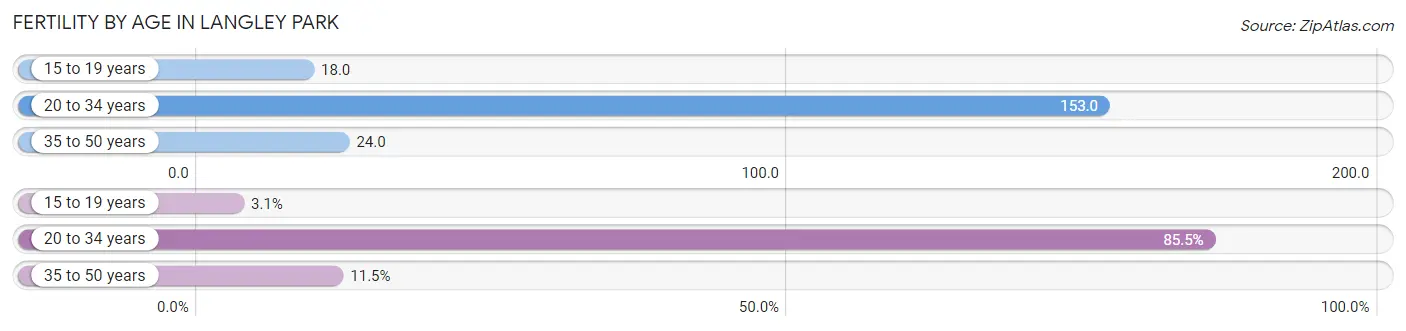
| Age Bracket | Women with Births | Births / 1,000 Women |
| 15 to 19 years | 12 (3.1%) | 18.0 |
| 20 to 34 years | 335 (85.5%) | 153.0 |
| 35 to 50 years | 45 (11.5%) | 24.0 |
| Total | 392 (100.0%) | 83.0 |
Fertility by Age by Marriage Status in Langley Park
29.3% of women with births (392) in Langley Park are married. The highest percentage of unmarried women with births falls into 15 to 19 years age bracket with 100.0% of them unmarried at the time of birth, while the lowest percentage of unmarried women with births belong to 35 to 50 years age bracket with 60.0% of them unmarried.
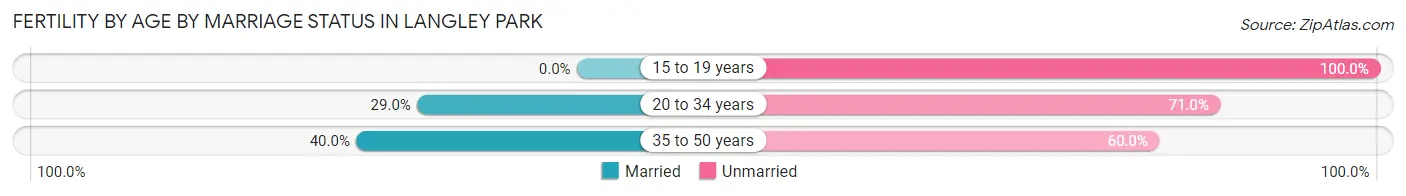
| Age Bracket | Married | Unmarried |
| 15 to 19 years | 0 (0.0%) | 12 (100.0%) |
| 20 to 34 years | 97 (29.0%) | 238 (71.0%) |
| 35 to 50 years | 18 (40.0%) | 27 (60.0%) |
| Total | 115 (29.3%) | 277 (70.7%) |
Fertility by Education in Langley Park
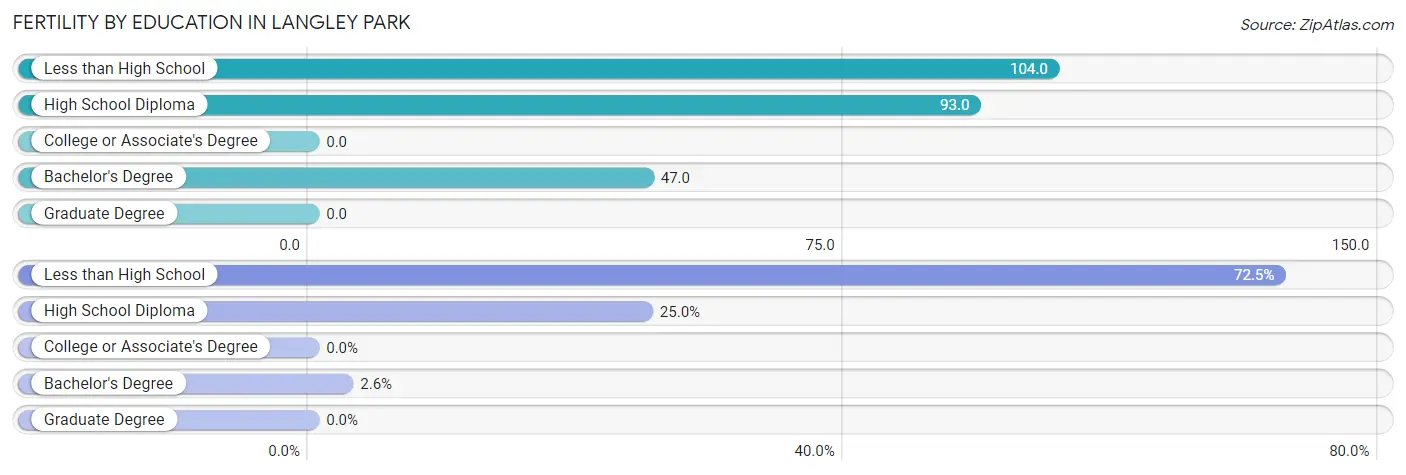
| Educational Attainment | Women with Births | Births / 1,000 Women |
| Less than High School | 284 (72.5%) | 104.0 |
| High School Diploma | 98 (25.0%) | 93.0 |
| College or Associate's Degree | 0 (0.0%) | 0.0 |
| Bachelor's Degree | 10 (2.5%) | 47.0 |
| Graduate Degree | 0 (0.0%) | 0.0 |
| Total | 392 (100.0%) | 83.0 |
Fertility by Education by Marriage Status in Langley Park
70.7% of women with births in Langley Park are unmarried. Women with the educational attainment of bachelor's degree are most likely to be married with 100.0% of them married at childbirth, while women with the educational attainment of less than high school are least likely to be married with 83.1% of them unmarried at childbirth.
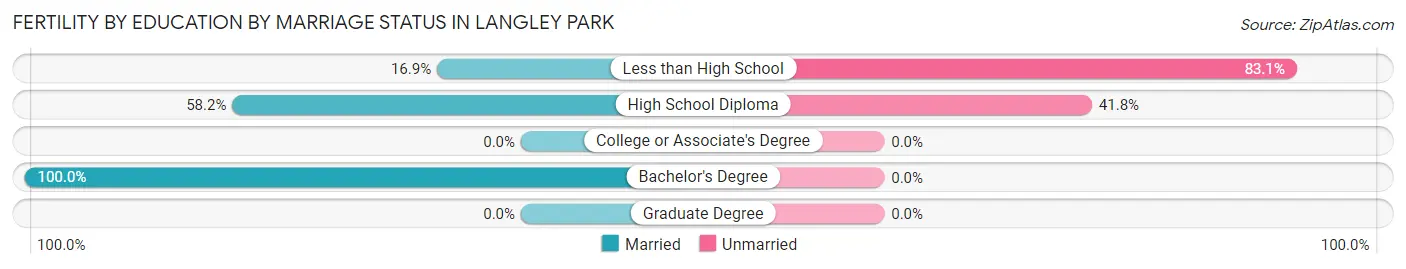
| Educational Attainment | Married | Unmarried |
| Less than High School | 48 (16.9%) | 236 (83.1%) |
| High School Diploma | 57 (58.2%) | 41 (41.8%) |
| College or Associate's Degree | 0 (0.0%) | 0 (0.0%) |
| Bachelor's Degree | 10 (100.0%) | 0 (0.0%) |
| Graduate Degree | 0 (0.0%) | 0 (0.0%) |
| Total | 115 (29.3%) | 277 (70.7%) |
Employment Characteristics in Langley Park
Employment by Class of Employer in Langley Park
Among the 9,612 employed individuals in Langley Park, private company employees (7,603 | 79.1%), self-employed (not incorporated) (1,229 | 12.8%), and not-for-profit organizations (293 | 3.0%) make up the most common classes of employment.
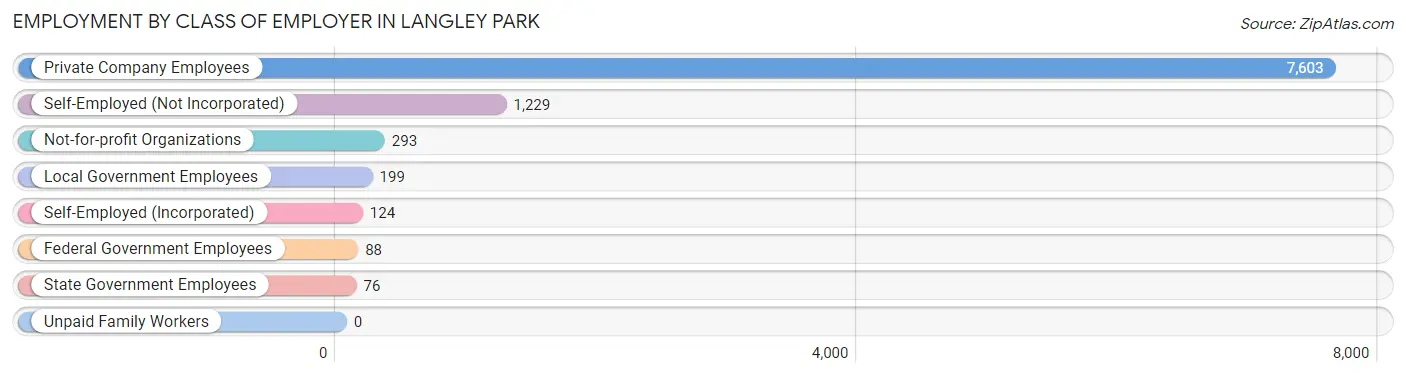
| Employer Class | # Employees | % Employees |
| Private Company Employees | 7,603 | 79.1% |
| Self-Employed (Incorporated) | 124 | 1.3% |
| Self-Employed (Not Incorporated) | 1,229 | 12.8% |
| Not-for-profit Organizations | 293 | 3.0% |
| Local Government Employees | 199 | 2.1% |
| State Government Employees | 76 | 0.8% |
| Federal Government Employees | 88 | 0.9% |
| Unpaid Family Workers | 0 | 0.0% |
| Total | 9,612 | 100.0% |
Employment Status by Age in Langley Park
According to the labor force statistics for Langley Park, out of the total population over 16 years of age (14,821), 72.6% or 10,760 individuals are in the labor force, with 7.3% or 785 of them unemployed. The age group with the highest labor force participation rate is 45 to 54 years, with 87.6% or 2,010 individuals in the labor force. Within the labor force, the 65 to 74 years age range has the highest percentage of unemployed individuals, with 30.5% or 69 of them being unemployed.
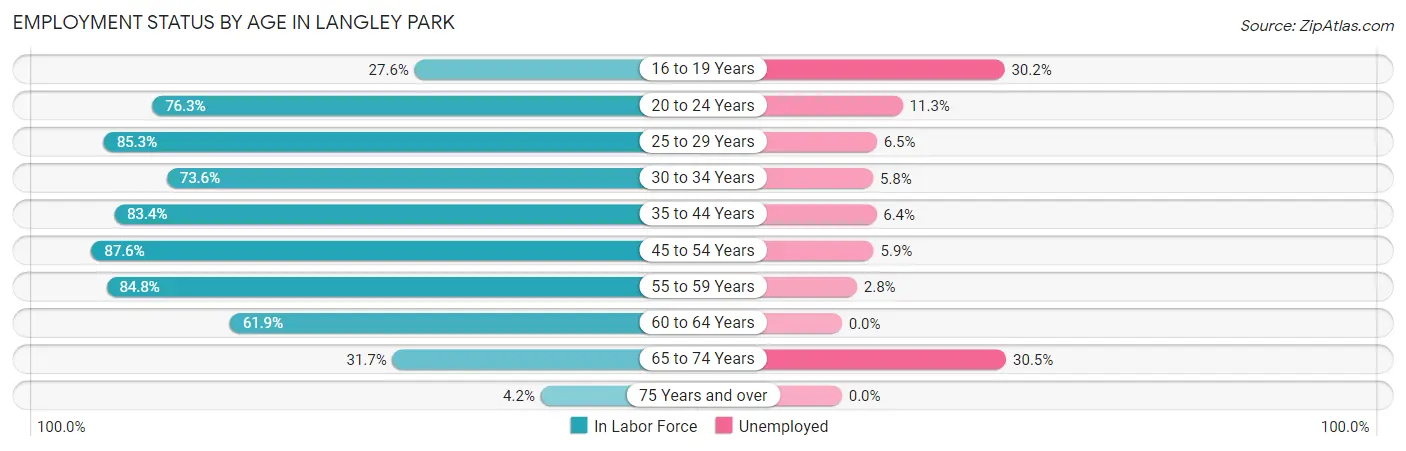
| Age Bracket | In Labor Force | Unemployed |
| 16 to 19 Years | 319 (27.6%) | 96 (30.2%) |
| 20 to 24 Years | 958 (76.3%) | 108 (11.3%) |
| 25 to 29 Years | 1,500 (85.3%) | 98 (6.5%) |
| 30 to 34 Years | 1,703 (73.6%) | 99 (5.8%) |
| 35 to 44 Years | 2,748 (83.4%) | 176 (6.4%) |
| 45 to 54 Years | 2,010 (87.6%) | 119 (5.9%) |
| 55 to 59 Years | 880 (84.8%) | 25 (2.8%) |
| 60 to 64 Years | 399 (61.9%) | 0 (0.0%) |
| 65 to 74 Years | 226 (31.7%) | 69 (30.5%) |
| 75 Years and over | 15 (4.2%) | 0 (0.0%) |
| Total | 10,760 (72.6%) | 785 (7.3%) |
Employment Status by Educational Attainment in Langley Park
According to labor force statistics for Langley Park, 81.5% of individuals (9,246) out of the total population between 25 and 64 years of age (11,345) are in the labor force, with 5.6% or 518 of them being unemployed. The group with the highest labor force participation rate are those with the educational attainment of bachelor's degree or higher, with 83.7% or 744 individuals in the labor force. Within the labor force, individuals with less than high school education have the highest percentage of unemployment, with 6.7% or 379 of them being unemployed.
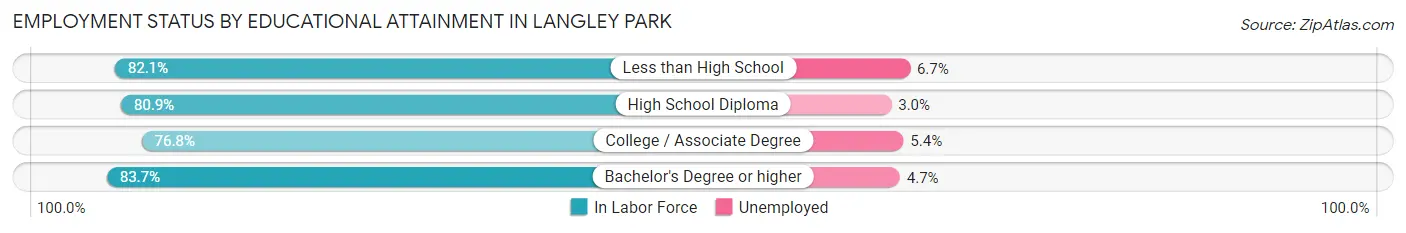
| Educational Attainment | In Labor Force | Unemployed |
| Less than High School | 5,658 (82.1%) | 462 (6.7%) |
| High School Diploma | 1,960 (80.9%) | 73 (3.0%) |
| College / Associate Degree | 876 (76.8%) | 62 (5.4%) |
| Bachelor's Degree or higher | 744 (83.7%) | 42 (4.7%) |
| Total | 9,246 (81.5%) | 635 (5.6%) |
Employment Occupations by Sex in Langley Park
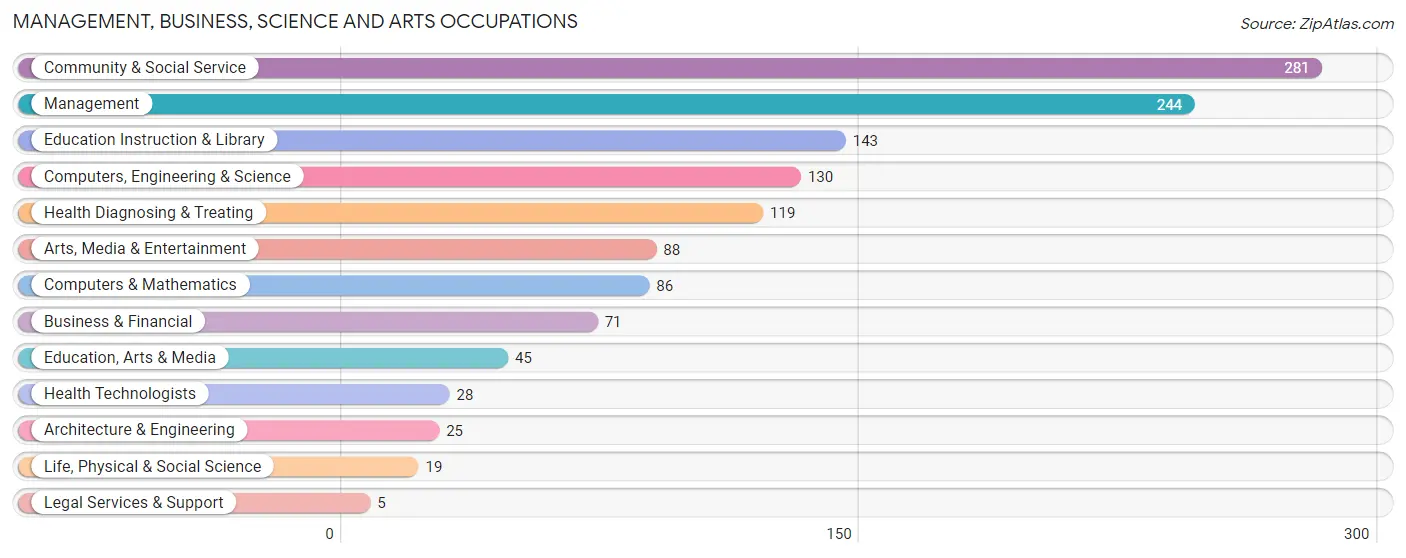
Management, Business, Science and Arts Occupations
The most common Management, Business, Science and Arts occupations in Langley Park are Community & Social Service (281 | 2.8%), Management (244 | 2.5%), Education Instruction & Library (143 | 1.4%), Computers, Engineering & Science (130 | 1.3%), and Health Diagnosing & Treating (119 | 1.2%).
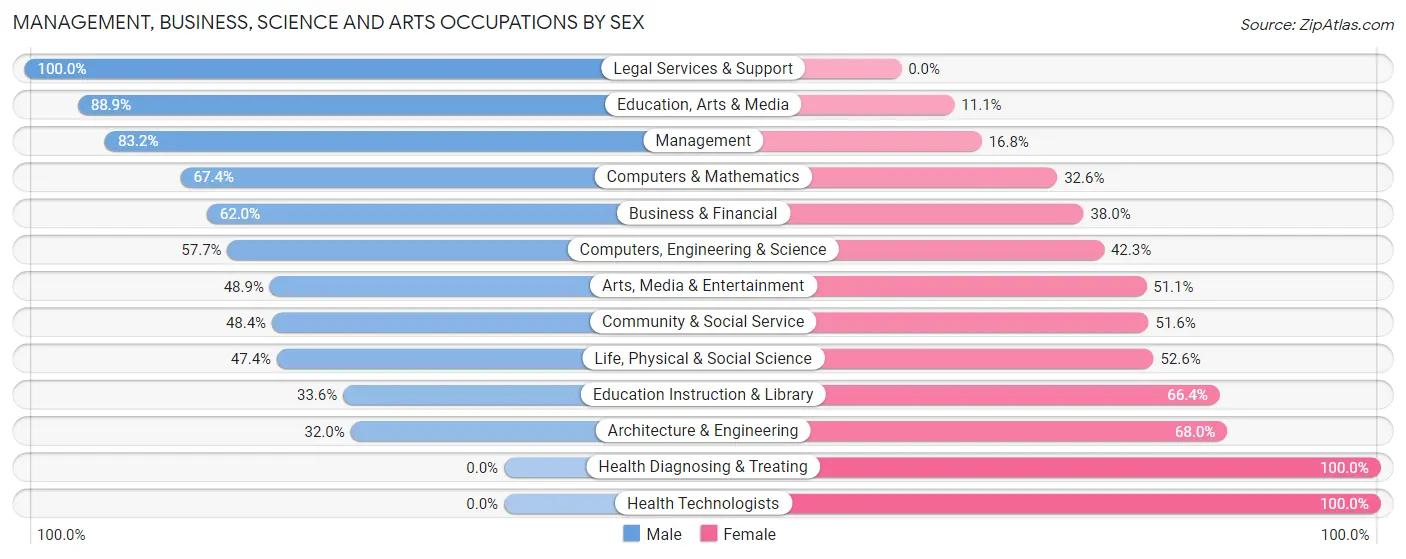
Management, Business, Science and Arts Occupations by Sex
Within the Management, Business, Science and Arts occupations in Langley Park, the most male-oriented occupations are Legal Services & Support (100.0%), Education, Arts & Media (88.9%), and Management (83.2%), while the most female-oriented occupations are Health Diagnosing & Treating (100.0%), Health Technologists (100.0%), and Architecture & Engineering (68.0%).
| Occupation | Male | Female |
| Management | 203 (83.2%) | 41 (16.8%) |
| Business & Financial | 44 (62.0%) | 27 (38.0%) |
| Computers, Engineering & Science | 75 (57.7%) | 55 (42.3%) |
| Computers & Mathematics | 58 (67.4%) | 28 (32.6%) |
| Architecture & Engineering | 8 (32.0%) | 17 (68.0%) |
| Life, Physical & Social Science | 9 (47.4%) | 10 (52.6%) |
| Community & Social Service | 136 (48.4%) | 145 (51.6%) |
| Education, Arts & Media | 40 (88.9%) | 5 (11.1%) |
| Legal Services & Support | 5 (100.0%) | 0 (0.0%) |
| Education Instruction & Library | 48 (33.6%) | 95 (66.4%) |
| Arts, Media & Entertainment | 43 (48.9%) | 45 (51.1%) |
| Health Diagnosing & Treating | 0 (0.0%) | 119 (100.0%) |
| Health Technologists | 0 (0.0%) | 28 (100.0%) |
| Total (Category) | 458 (54.2%) | 387 (45.8%) |
| Total (Overall) | 6,867 (68.9%) | 3,100 (31.1%) |
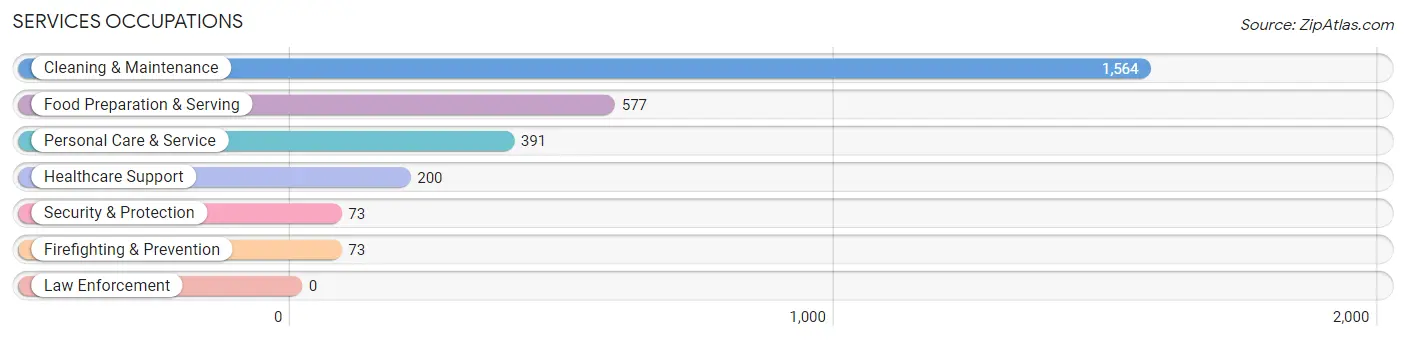
Services Occupations
The most common Services occupations in Langley Park are Cleaning & Maintenance (1,564 | 15.7%), Food Preparation & Serving (577 | 5.8%), Personal Care & Service (391 | 3.9%), Healthcare Support (200 | 2.0%), and Security & Protection (73 | 0.7%).
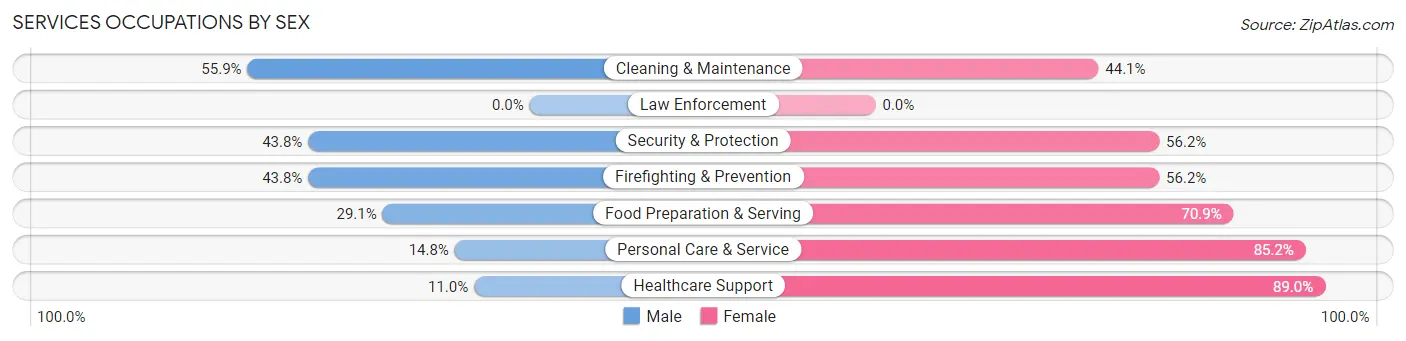
Services Occupations by Sex
Within the Services occupations in Langley Park, the most male-oriented occupations are Cleaning & Maintenance (55.9%), Security & Protection (43.8%), and Firefighting & Prevention (43.8%), while the most female-oriented occupations are Healthcare Support (89.0%), Personal Care & Service (85.2%), and Food Preparation & Serving (70.9%).
| Occupation | Male | Female |
| Healthcare Support | 22 (11.0%) | 178 (89.0%) |
| Security & Protection | 32 (43.8%) | 41 (56.2%) |
| Firefighting & Prevention | 32 (43.8%) | 41 (56.2%) |
| Law Enforcement | 0 (0.0%) | 0 (0.0%) |
| Food Preparation & Serving | 168 (29.1%) | 409 (70.9%) |
| Cleaning & Maintenance | 874 (55.9%) | 690 (44.1%) |
| Personal Care & Service | 58 (14.8%) | 333 (85.2%) |
| Total (Category) | 1,154 (41.1%) | 1,651 (58.9%) |
| Total (Overall) | 6,867 (68.9%) | 3,100 (31.1%) |
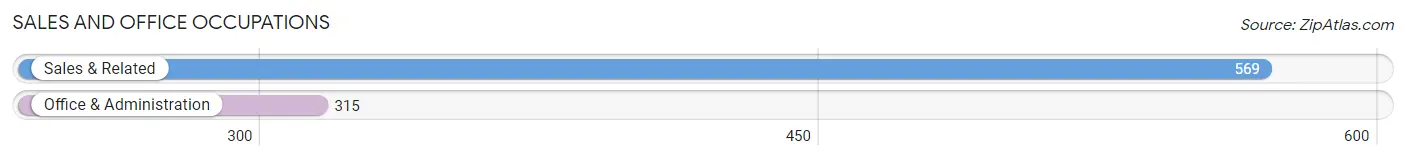
Sales and Office Occupations
The most common Sales and Office occupations in Langley Park are Sales & Related (569 | 5.7%), and Office & Administration (315 | 3.2%).
Sales and Office Occupations by Sex
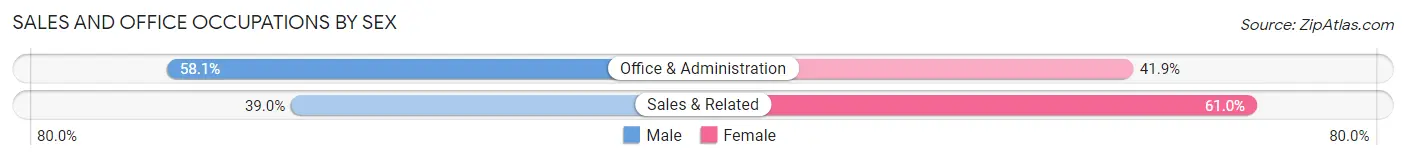
| Occupation | Male | Female |
| Sales & Related | 222 (39.0%) | 347 (61.0%) |
| Office & Administration | 183 (58.1%) | 132 (41.9%) |
| Total (Category) | 405 (45.8%) | 479 (54.2%) |
| Total (Overall) | 6,867 (68.9%) | 3,100 (31.1%) |
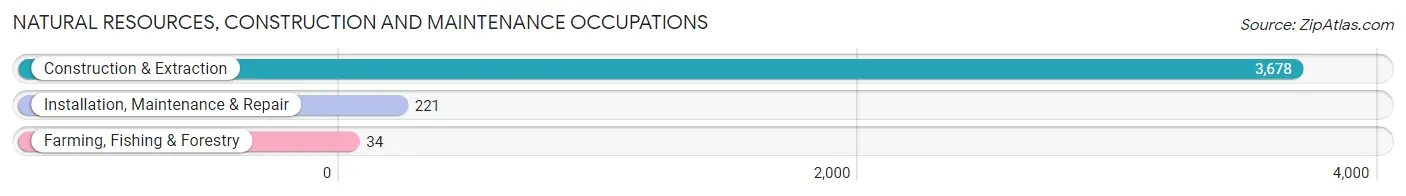
Natural Resources, Construction and Maintenance Occupations
The most common Natural Resources, Construction and Maintenance occupations in Langley Park are Construction & Extraction (3,678 | 36.9%), Installation, Maintenance & Repair (221 | 2.2%), and Farming, Fishing & Forestry (34 | 0.3%).
Natural Resources, Construction and Maintenance Occupations by Sex
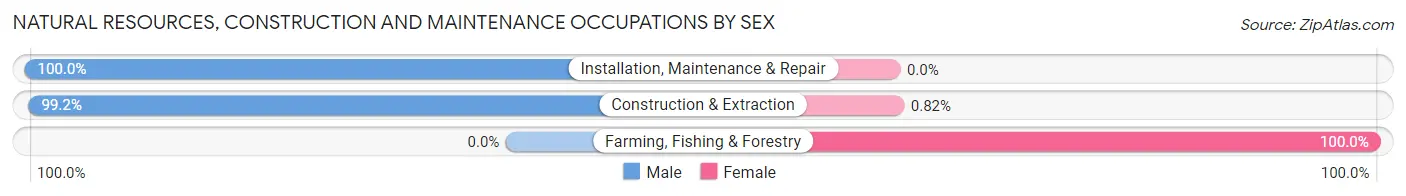
| Occupation | Male | Female |
| Farming, Fishing & Forestry | 0 (0.0%) | 34 (100.0%) |
| Construction & Extraction | 3,648 (99.2%) | 30 (0.8%) |
| Installation, Maintenance & Repair | 221 (100.0%) | 0 (0.0%) |
| Total (Category) | 3,869 (98.4%) | 64 (1.6%) |
| Total (Overall) | 6,867 (68.9%) | 3,100 (31.1%) |
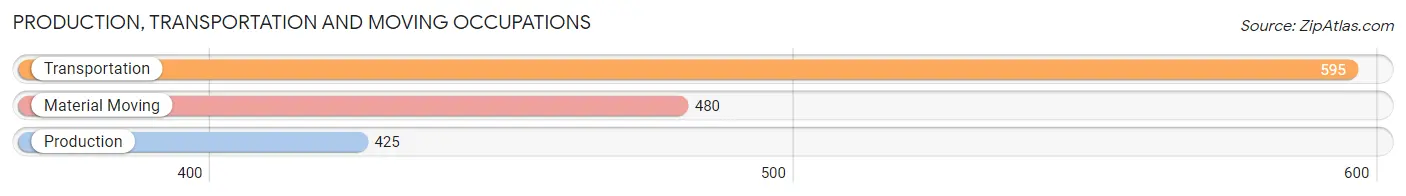
Production, Transportation and Moving Occupations
The most common Production, Transportation and Moving occupations in Langley Park are Transportation (595 | 6.0%), Material Moving (480 | 4.8%), and Production (425 | 4.3%).
Production, Transportation and Moving Occupations by Sex
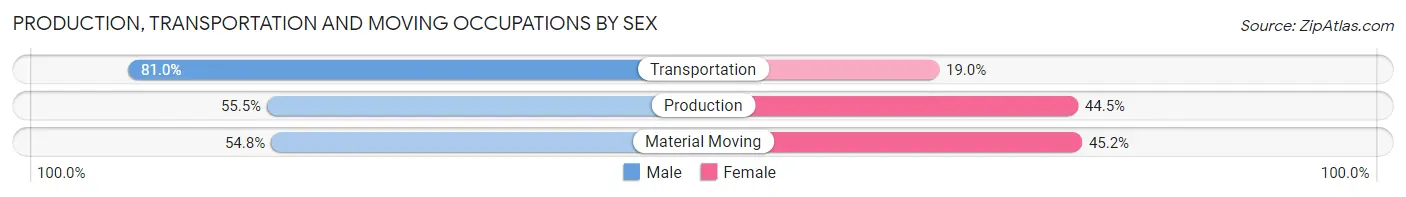
| Occupation | Male | Female |
| Production | 236 (55.5%) | 189 (44.5%) |
| Transportation | 482 (81.0%) | 113 (19.0%) |
| Material Moving | 263 (54.8%) | 217 (45.2%) |
| Total (Category) | 981 (65.4%) | 519 (34.6%) |
| Total (Overall) | 6,867 (68.9%) | 3,100 (31.1%) |
Employment Industries by Sex in Langley Park
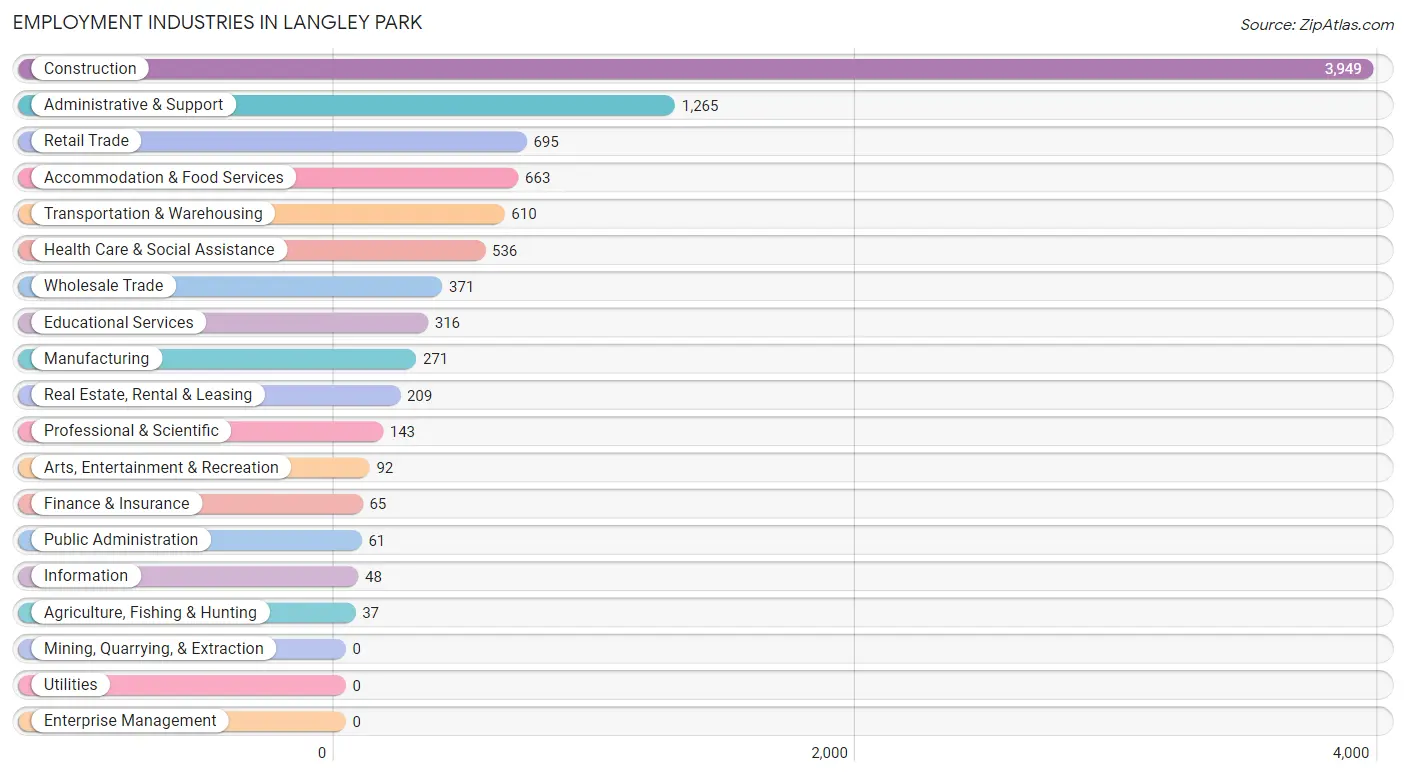
Employment Industries in Langley Park
The major employment industries in Langley Park include Construction (3,949 | 39.6%), Administrative & Support (1,265 | 12.7%), Retail Trade (695 | 7.0%), Accommodation & Food Services (663 | 6.7%), and Transportation & Warehousing (610 | 6.1%).
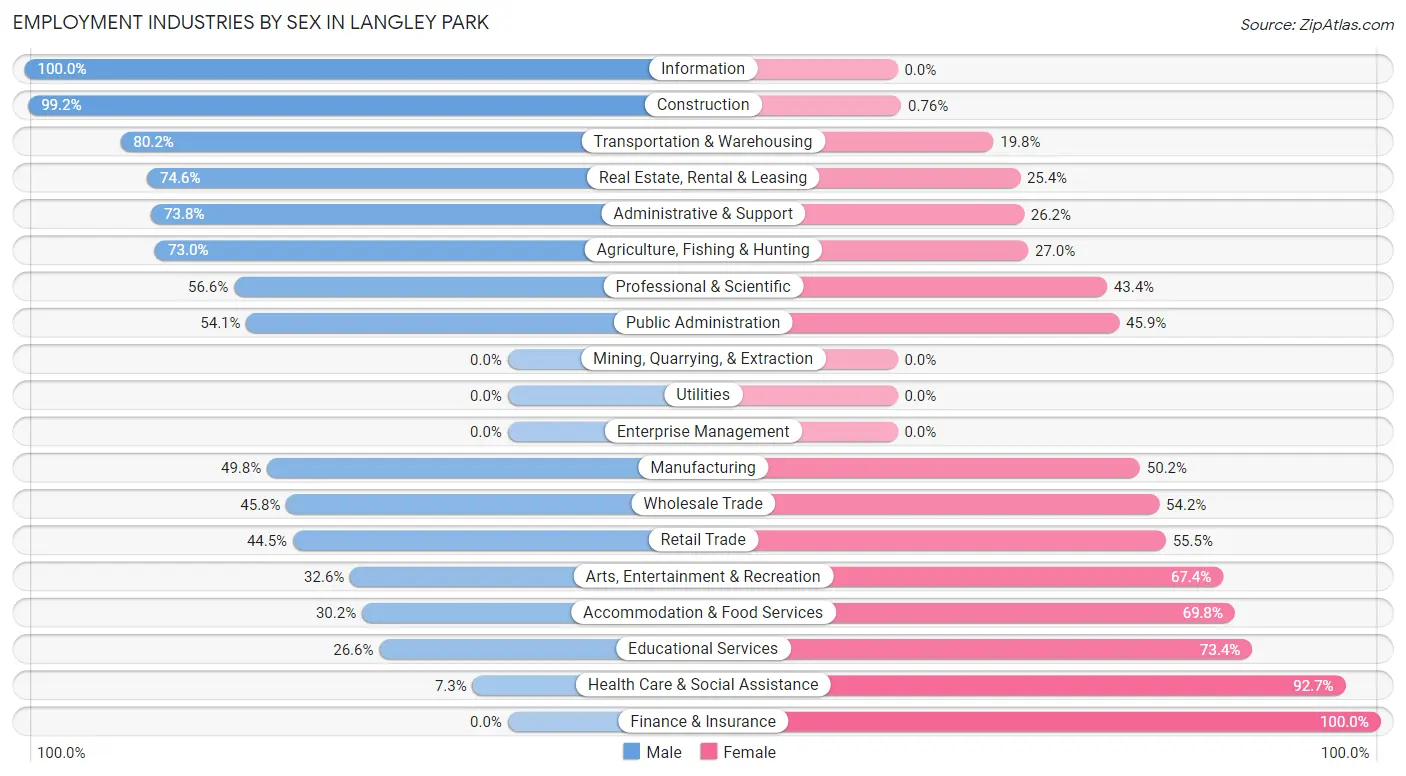
Employment Industries by Sex in Langley Park
The Langley Park industries that see more men than women are Information (100.0%), Construction (99.2%), and Transportation & Warehousing (80.2%), whereas the industries that tend to have a higher number of women are Finance & Insurance (100.0%), Health Care & Social Assistance (92.7%), and Educational Services (73.4%).
| Industry | Male | Female |
| Agriculture, Fishing & Hunting | 27 (73.0%) | 10 (27.0%) |
| Mining, Quarrying, & Extraction | 0 (0.0%) | 0 (0.0%) |
| Construction | 3,919 (99.2%) | 30 (0.8%) |
| Manufacturing | 135 (49.8%) | 136 (50.2%) |
| Wholesale Trade | 170 (45.8%) | 201 (54.2%) |
| Retail Trade | 309 (44.5%) | 386 (55.5%) |
| Transportation & Warehousing | 489 (80.2%) | 121 (19.8%) |
| Utilities | 0 (0.0%) | 0 (0.0%) |
| Information | 48 (100.0%) | 0 (0.0%) |
| Finance & Insurance | 0 (0.0%) | 65 (100.0%) |
| Real Estate, Rental & Leasing | 156 (74.6%) | 53 (25.4%) |
| Professional & Scientific | 81 (56.6%) | 62 (43.4%) |
| Enterprise Management | 0 (0.0%) | 0 (0.0%) |
| Administrative & Support | 934 (73.8%) | 331 (26.2%) |
| Educational Services | 84 (26.6%) | 232 (73.4%) |
| Health Care & Social Assistance | 39 (7.3%) | 497 (92.7%) |
| Arts, Entertainment & Recreation | 30 (32.6%) | 62 (67.4%) |
| Accommodation & Food Services | 200 (30.2%) | 463 (69.8%) |
| Public Administration | 33 (54.1%) | 28 (45.9%) |
| Total | 6,867 (68.9%) | 3,100 (31.1%) |
Education in Langley Park
School Enrollment in Langley Park
The most common levels of schooling among the 5,393 students in Langley Park are elementary school (1,450 | 26.9%), middle school (1,408 | 26.1%), and high school (1,256 | 23.3%).
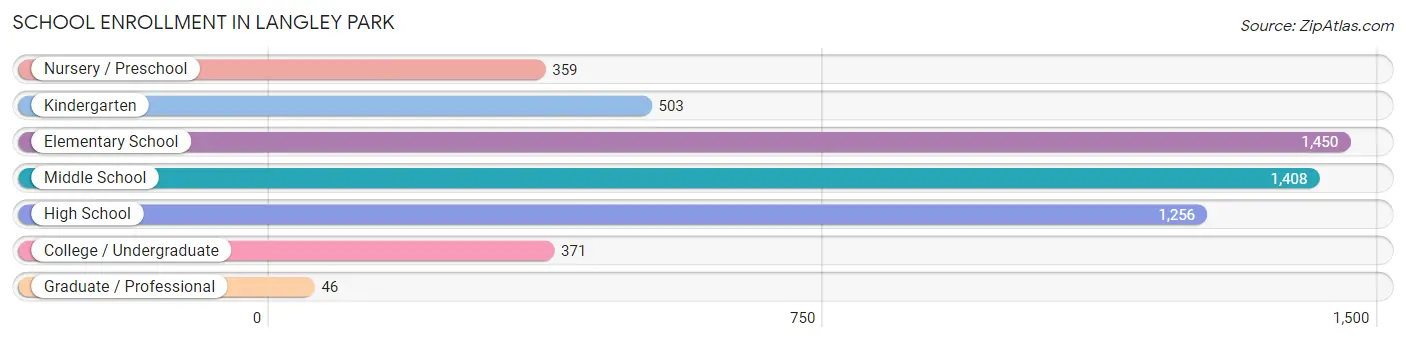
| School Level | # Students | % Students |
| Nursery / Preschool | 359 | 6.7% |
| Kindergarten | 503 | 9.3% |
| Elementary School | 1,450 | 26.9% |
| Middle School | 1,408 | 26.1% |
| High School | 1,256 | 23.3% |
| College / Undergraduate | 371 | 6.9% |
| Graduate / Professional | 46 | 0.9% |
| Total | 5,393 | 100.0% |
School Enrollment by Age by Funding Source in Langley Park
Out of a total of 5,393 students who are enrolled in schools in Langley Park, 388 (7.2%) attend a private institution, while the remaining 5,005 (92.8%) are enrolled in public schools. The age group of 25 to 34 year olds has the highest likelihood of being enrolled in private schools, with 59 (50.4% in the age bracket) enrolled. Conversely, the age group of 3 to 4 year olds has the lowest likelihood of being enrolled in a private school, with 172 (100.0% in the age bracket) attending a public institution.
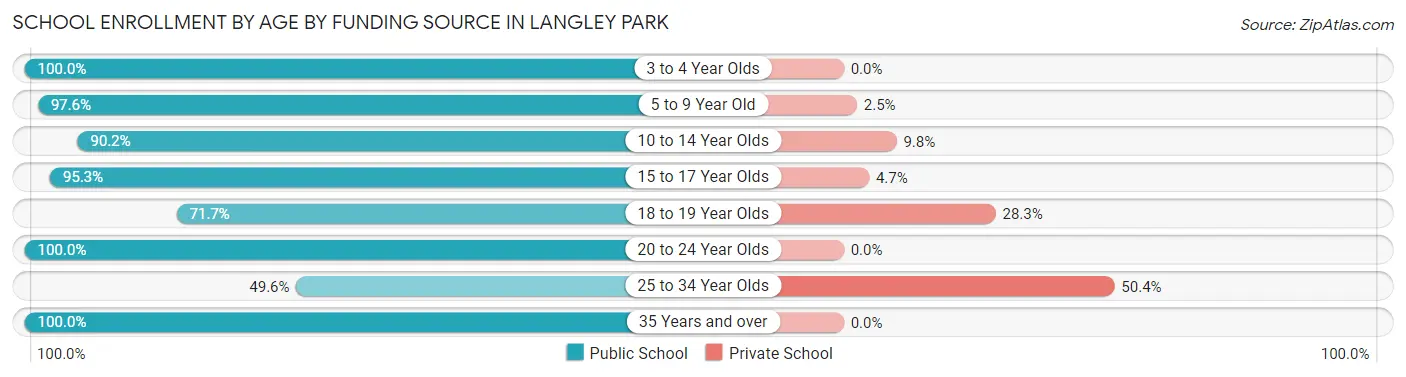
| Age Bracket | Public School | Private School |
| 3 to 4 Year Olds | 172 (100.0%) | 0 (0.0%) |
| 5 to 9 Year Old | 1,987 (97.6%) | 50 (2.5%) |
| 10 to 14 Year Olds | 1,505 (90.2%) | 164 (9.8%) |
| 15 to 17 Year Olds | 850 (95.3%) | 42 (4.7%) |
| 18 to 19 Year Olds | 185 (71.7%) | 73 (28.3%) |
| 20 to 24 Year Olds | 189 (100.0%) | 0 (0.0%) |
| 25 to 34 Year Olds | 58 (49.6%) | 59 (50.4%) |
| 35 Years and over | 59 (100.0%) | 0 (0.0%) |
| Total | 5,005 (92.8%) | 388 (7.2%) |
Educational Attainment by Field of Study in Langley Park
Education (220 | 19.4%), business (152 | 13.4%), physical & health sciences (108 | 9.5%), visual & performing arts (94 | 8.3%), and liberal arts & history (91 | 8.0%) are the most common fields of study among 1,132 individuals in Langley Park who have obtained a bachelor's degree or higher.
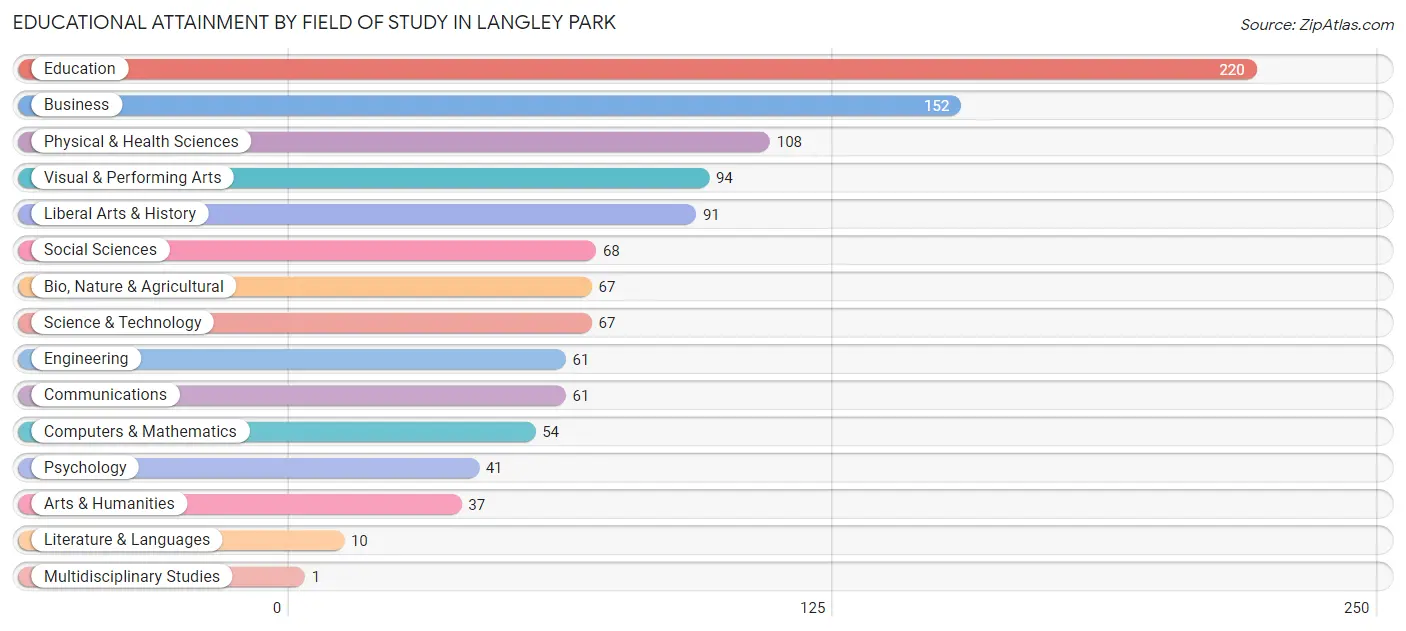
| Field of Study | # Graduates | % Graduates |
| Computers & Mathematics | 54 | 4.8% |
| Bio, Nature & Agricultural | 67 | 5.9% |
| Physical & Health Sciences | 108 | 9.5% |
| Psychology | 41 | 3.6% |
| Social Sciences | 68 | 6.0% |
| Engineering | 61 | 5.4% |
| Multidisciplinary Studies | 1 | 0.1% |
| Science & Technology | 67 | 5.9% |
| Business | 152 | 13.4% |
| Education | 220 | 19.4% |
| Literature & Languages | 10 | 0.9% |
| Liberal Arts & History | 91 | 8.0% |
| Visual & Performing Arts | 94 | 8.3% |
| Communications | 61 | 5.4% |
| Arts & Humanities | 37 | 3.3% |
| Total | 1,132 | 100.0% |
Transportation & Commute in Langley Park
Vehicle Availability by Sex in Langley Park
The most prevalent vehicle ownership categories in Langley Park are males with 1 vehicle (2,159, accounting for 32.0%) and females with 1 vehicle (799, making up 75.5%).
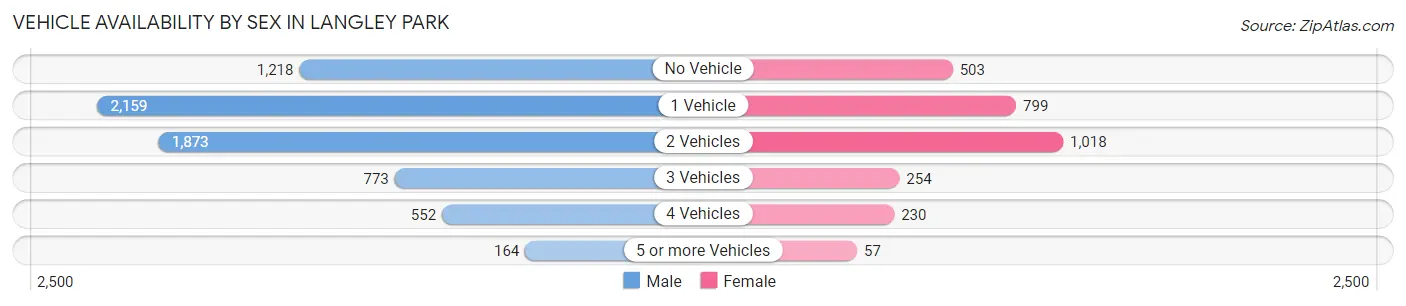
| Vehicles Available | Male | Female |
| No Vehicle | 1,218 (18.1%) | 503 (17.6%) |
| 1 Vehicle | 2,159 (32.0%) | 799 (27.9%) |
| 2 Vehicles | 1,873 (27.8%) | 1,018 (35.6%) |
| 3 Vehicles | 773 (11.5%) | 254 (8.9%) |
| 4 Vehicles | 552 (8.2%) | 230 (8.0%) |
| 5 or more Vehicles | 164 (2.4%) | 57 (2.0%) |
| Total | 6,739 (100.0%) | 2,861 (100.0%) |
Commute Time in Langley Park
The most frequently occuring commute durations in Langley Park are 30 to 34 minutes (2,006 commuters, 21.5%), 60 to 89 minutes (1,785 commuters, 19.2%), and 45 to 59 minutes (1,399 commuters, 15.0%).
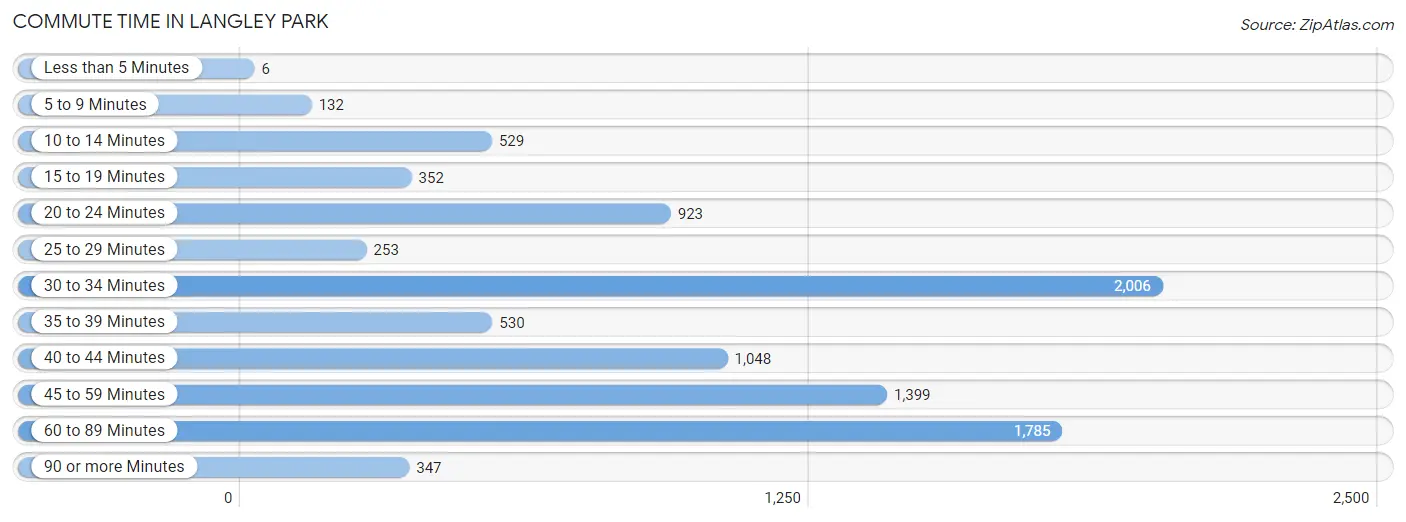
| Commute Time | # Commuters | % Commuters |
| Less than 5 Minutes | 6 | 0.1% |
| 5 to 9 Minutes | 132 | 1.4% |
| 10 to 14 Minutes | 529 | 5.7% |
| 15 to 19 Minutes | 352 | 3.8% |
| 20 to 24 Minutes | 923 | 9.9% |
| 25 to 29 Minutes | 253 | 2.7% |
| 30 to 34 Minutes | 2,006 | 21.5% |
| 35 to 39 Minutes | 530 | 5.7% |
| 40 to 44 Minutes | 1,048 | 11.3% |
| 45 to 59 Minutes | 1,399 | 15.0% |
| 60 to 89 Minutes | 1,785 | 19.2% |
| 90 or more Minutes | 347 | 3.7% |
Commute Time by Sex in Langley Park
The most common commute times in Langley Park are 60 to 89 minutes (1,402 commuters, 21.2%) for males and 30 to 34 minutes (671 commuters, 24.8%) for females.
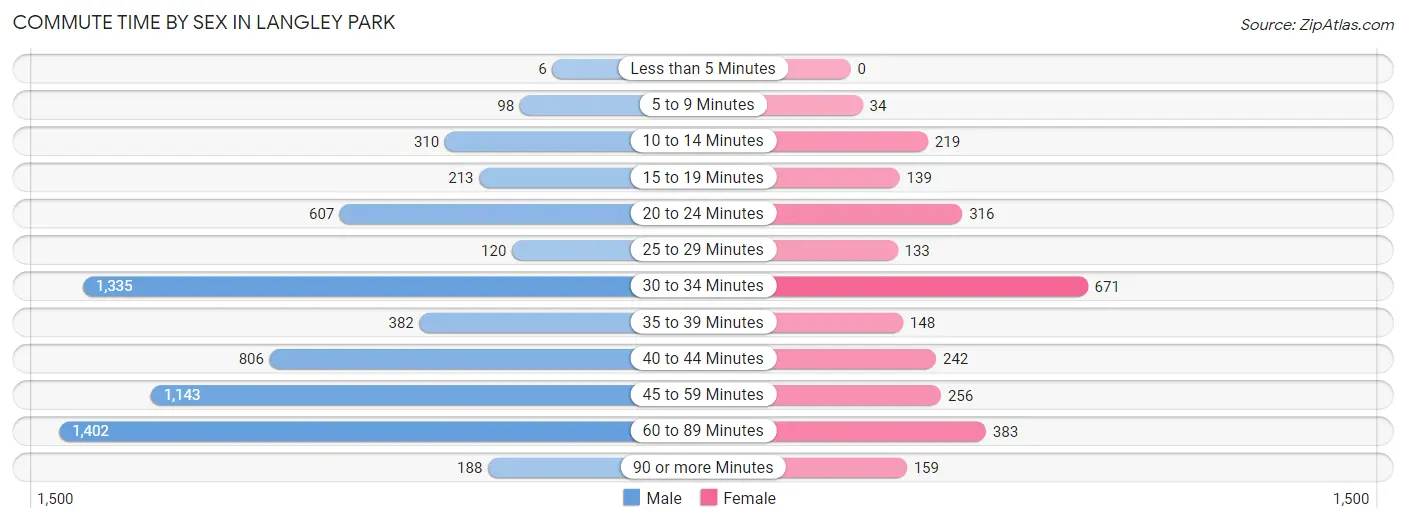
| Commute Time | Male | Female |
| Less than 5 Minutes | 6 (0.1%) | 0 (0.0%) |
| 5 to 9 Minutes | 98 (1.5%) | 34 (1.3%) |
| 10 to 14 Minutes | 310 (4.7%) | 219 (8.1%) |
| 15 to 19 Minutes | 213 (3.2%) | 139 (5.1%) |
| 20 to 24 Minutes | 607 (9.2%) | 316 (11.7%) |
| 25 to 29 Minutes | 120 (1.8%) | 133 (4.9%) |
| 30 to 34 Minutes | 1,335 (20.2%) | 671 (24.8%) |
| 35 to 39 Minutes | 382 (5.8%) | 148 (5.5%) |
| 40 to 44 Minutes | 806 (12.2%) | 242 (9.0%) |
| 45 to 59 Minutes | 1,143 (17.3%) | 256 (9.5%) |
| 60 to 89 Minutes | 1,402 (21.2%) | 383 (14.2%) |
| 90 or more Minutes | 188 (2.8%) | 159 (5.9%) |
Time of Departure to Work by Sex in Langley Park
The most frequent times of departure to work in Langley Park are 6:00 AM to 6:29 AM (2,158, 32.7%) for males and 6:00 AM to 6:29 AM (513, 19.0%) for females.
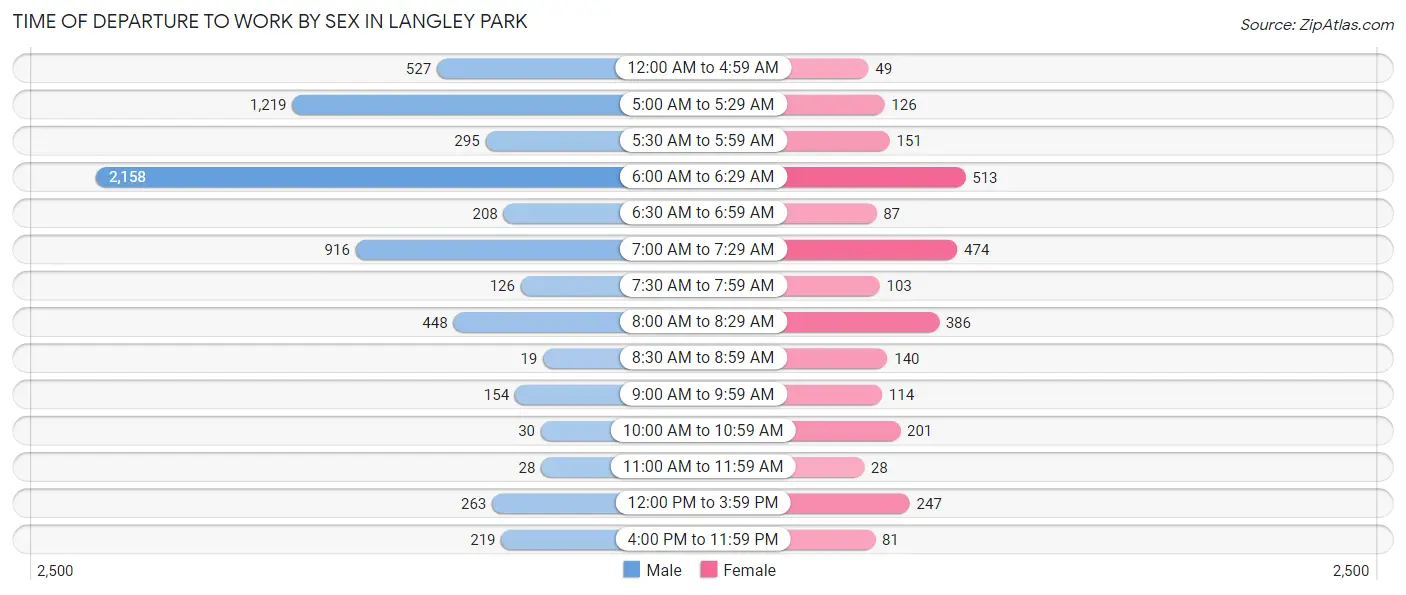
| Time of Departure | Male | Female |
| 12:00 AM to 4:59 AM | 527 (8.0%) | 49 (1.8%) |
| 5:00 AM to 5:29 AM | 1,219 (18.4%) | 126 (4.7%) |
| 5:30 AM to 5:59 AM | 295 (4.5%) | 151 (5.6%) |
| 6:00 AM to 6:29 AM | 2,158 (32.7%) | 513 (19.0%) |
| 6:30 AM to 6:59 AM | 208 (3.2%) | 87 (3.2%) |
| 7:00 AM to 7:29 AM | 916 (13.9%) | 474 (17.6%) |
| 7:30 AM to 7:59 AM | 126 (1.9%) | 103 (3.8%) |
| 8:00 AM to 8:29 AM | 448 (6.8%) | 386 (14.3%) |
| 8:30 AM to 8:59 AM | 19 (0.3%) | 140 (5.2%) |
| 9:00 AM to 9:59 AM | 154 (2.3%) | 114 (4.2%) |
| 10:00 AM to 10:59 AM | 30 (0.4%) | 201 (7.4%) |
| 11:00 AM to 11:59 AM | 28 (0.4%) | 28 (1.0%) |
| 12:00 PM to 3:59 PM | 263 (4.0%) | 247 (9.1%) |
| 4:00 PM to 11:59 PM | 219 (3.3%) | 81 (3.0%) |
| Total | 6,610 (100.0%) | 2,700 (100.0%) |
Housing Occupancy in Langley Park
Occupancy by Ownership in Langley Park
Of the total 5,198 dwellings in Langley Park, owner-occupied units account for 1,187 (22.8%), while renter-occupied units make up 4,011 (77.2%).
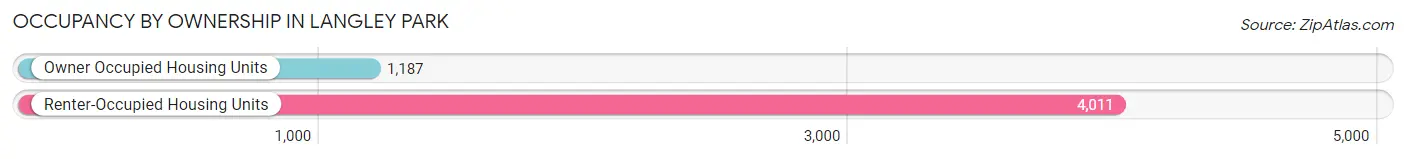
| Occupancy | # Housing Units | % Housing Units |
| Owner Occupied Housing Units | 1,187 | 22.8% |
| Renter-Occupied Housing Units | 4,011 | 77.2% |
| Total Occupied Housing Units | 5,198 | 100.0% |
Occupancy by Household Size in Langley Park
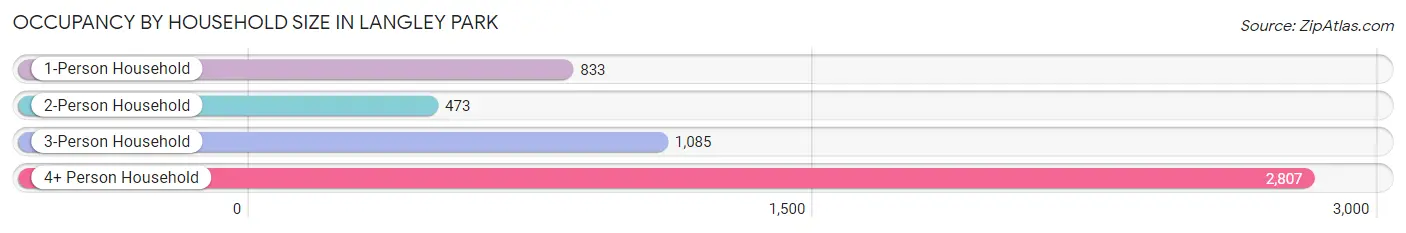
| Household Size | # Housing Units | % Housing Units |
| 1-Person Household | 833 | 16.0% |
| 2-Person Household | 473 | 9.1% |
| 3-Person Household | 1,085 | 20.9% |
| 4+ Person Household | 2,807 | 54.0% |
| Total Housing Units | 5,198 | 100.0% |
Occupancy by Ownership by Household Size in Langley Park
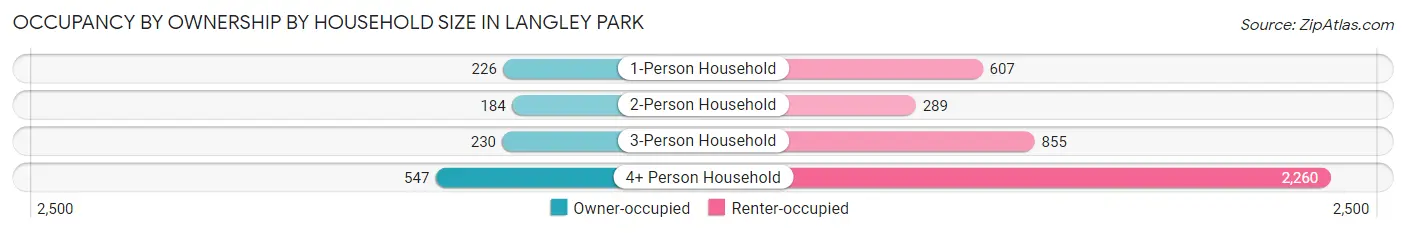
| Household Size | Owner-occupied | Renter-occupied |
| 1-Person Household | 226 (27.1%) | 607 (72.9%) |
| 2-Person Household | 184 (38.9%) | 289 (61.1%) |
| 3-Person Household | 230 (21.2%) | 855 (78.8%) |
| 4+ Person Household | 547 (19.5%) | 2,260 (80.5%) |
| Total Housing Units | 1,187 (22.8%) | 4,011 (77.2%) |
Occupancy by Educational Attainment in Langley Park
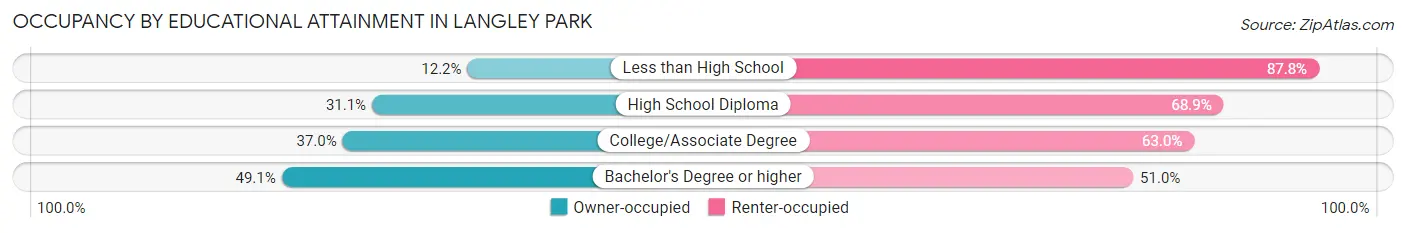
| Household Size | Owner-occupied | Renter-occupied |
| Less than High School | 362 (12.2%) | 2,601 (87.8%) |
| High School Diploma | 344 (31.1%) | 761 (68.9%) |
| College/Associate Degree | 224 (37.0%) | 382 (63.0%) |
| Bachelor's Degree or higher | 257 (49.0%) | 267 (50.9%) |
Occupancy by Age of Householder in Langley Park
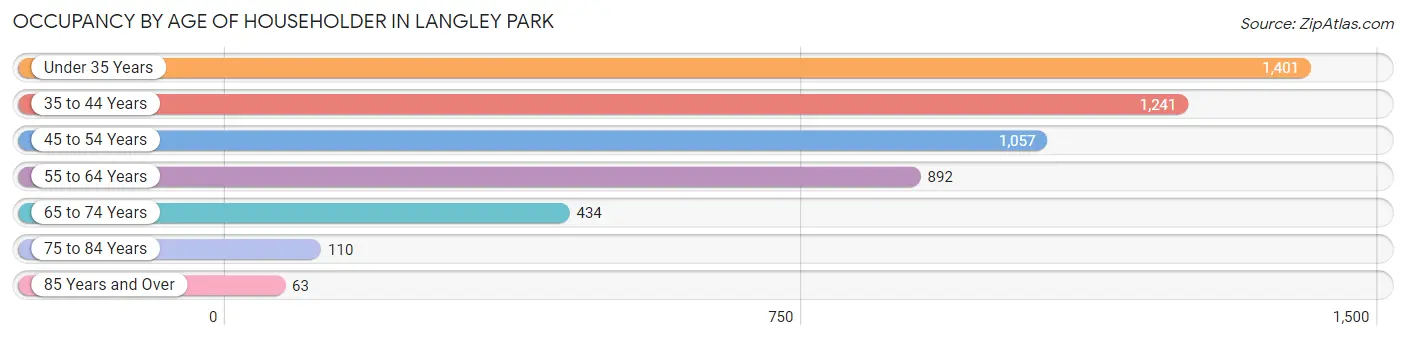
| Age Bracket | # Households | % Households |
| Under 35 Years | 1,401 | 27.0% |
| 35 to 44 Years | 1,241 | 23.9% |
| 45 to 54 Years | 1,057 | 20.3% |
| 55 to 64 Years | 892 | 17.2% |
| 65 to 74 Years | 434 | 8.4% |
| 75 to 84 Years | 110 | 2.1% |
| 85 Years and Over | 63 | 1.2% |
| Total | 5,198 | 100.0% |
Housing Finances in Langley Park
Median Income by Occupancy in Langley Park
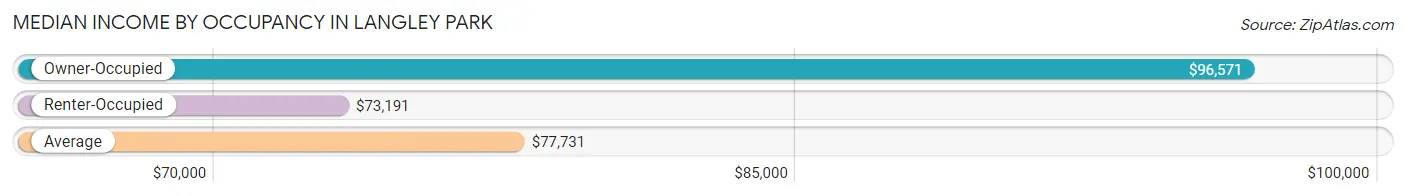
| Occupancy Type | # Households | Median Income |
| Owner-Occupied | 1,187 (22.8%) | $96,571 |
| Renter-Occupied | 4,011 (77.2%) | $73,191 |
| Average | 5,198 (100.0%) | $77,731 |
Occupancy by Householder Income Bracket in Langley Park
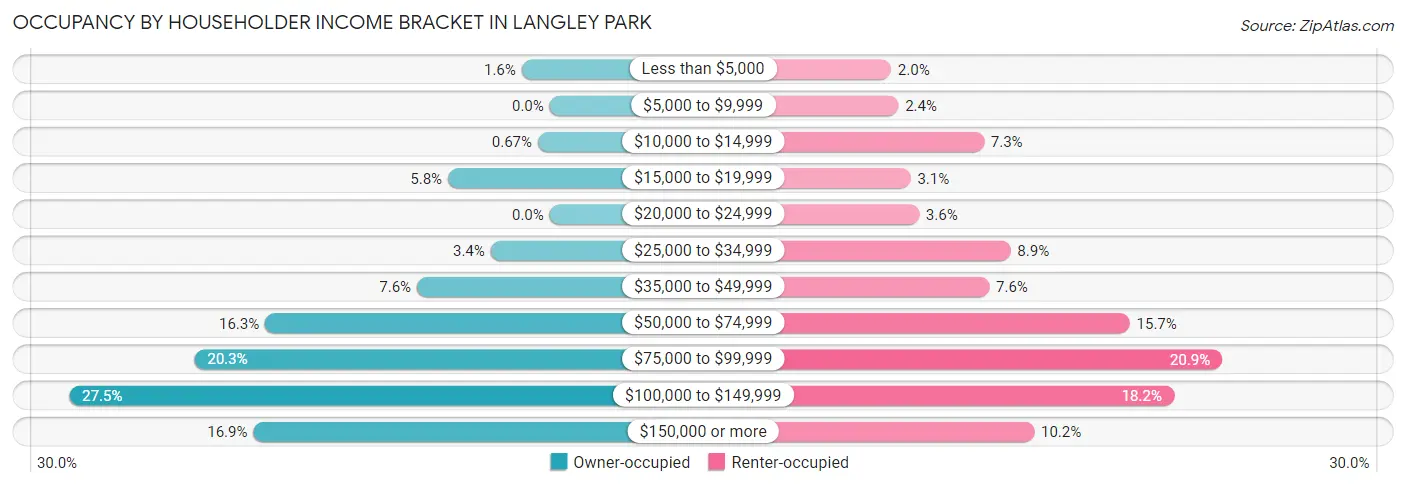
| Income Bracket | Owner-occupied | Renter-occupied |
| Less than $5,000 | 19 (1.6%) | 81 (2.0%) |
| $5,000 to $9,999 | 0 (0.0%) | 98 (2.4%) |
| $10,000 to $14,999 | 8 (0.7%) | 294 (7.3%) |
| $15,000 to $19,999 | 69 (5.8%) | 126 (3.1%) |
| $20,000 to $24,999 | 0 (0.0%) | 145 (3.6%) |
| $25,000 to $34,999 | 40 (3.4%) | 355 (8.8%) |
| $35,000 to $49,999 | 90 (7.6%) | 306 (7.6%) |
| $50,000 to $74,999 | 193 (16.3%) | 628 (15.7%) |
| $75,000 to $99,999 | 241 (20.3%) | 840 (20.9%) |
| $100,000 to $149,999 | 326 (27.5%) | 729 (18.2%) |
| $150,000 or more | 201 (16.9%) | 409 (10.2%) |
| Total | 1,187 (100.0%) | 4,011 (100.0%) |
Monthly Housing Cost Tiers in Langley Park
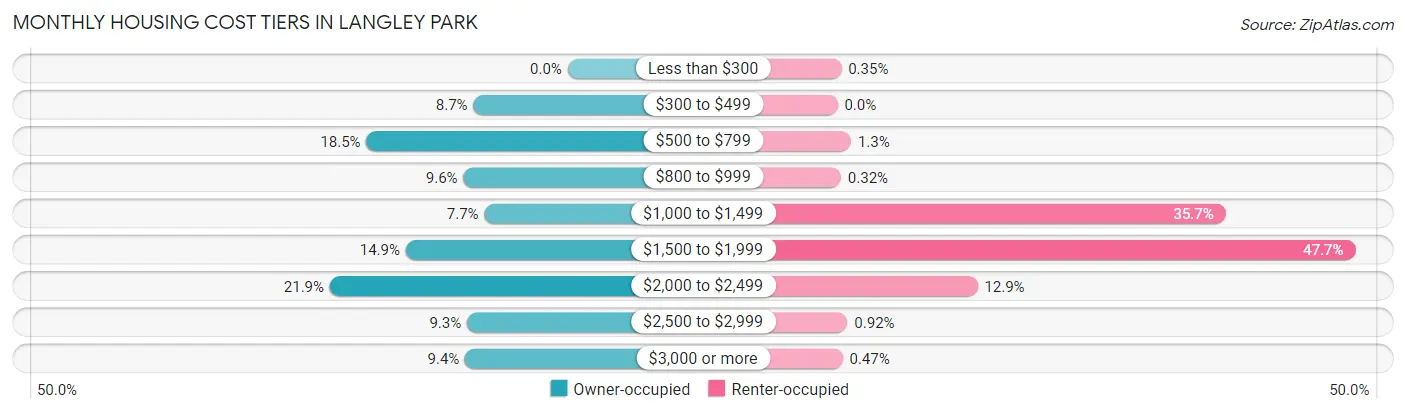
| Monthly Cost | Owner-occupied | Renter-occupied |
| Less than $300 | 0 (0.0%) | 14 (0.4%) |
| $300 to $499 | 103 (8.7%) | 0 (0.0%) |
| $500 to $799 | 220 (18.5%) | 50 (1.3%) |
| $800 to $999 | 114 (9.6%) | 13 (0.3%) |
| $1,000 to $1,499 | 91 (7.7%) | 1,433 (35.7%) |
| $1,500 to $1,999 | 177 (14.9%) | 1,912 (47.7%) |
| $2,000 to $2,499 | 260 (21.9%) | 517 (12.9%) |
| $2,500 to $2,999 | 110 (9.3%) | 37 (0.9%) |
| $3,000 or more | 112 (9.4%) | 19 (0.5%) |
| Total | 1,187 (100.0%) | 4,011 (100.0%) |
Physical Housing Characteristics in Langley Park
Housing Structures in Langley Park
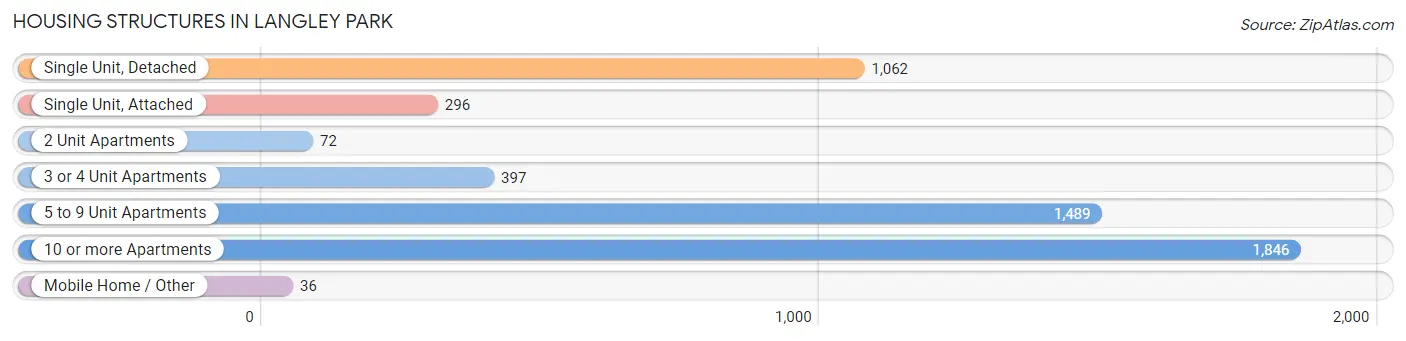
| Structure Type | # Housing Units | % Housing Units |
| Single Unit, Detached | 1,062 | 20.4% |
| Single Unit, Attached | 296 | 5.7% |
| 2 Unit Apartments | 72 | 1.4% |
| 3 or 4 Unit Apartments | 397 | 7.6% |
| 5 to 9 Unit Apartments | 1,489 | 28.6% |
| 10 or more Apartments | 1,846 | 35.5% |
| Mobile Home / Other | 36 | 0.7% |
| Total | 5,198 | 100.0% |
Housing Structures by Occupancy in Langley Park
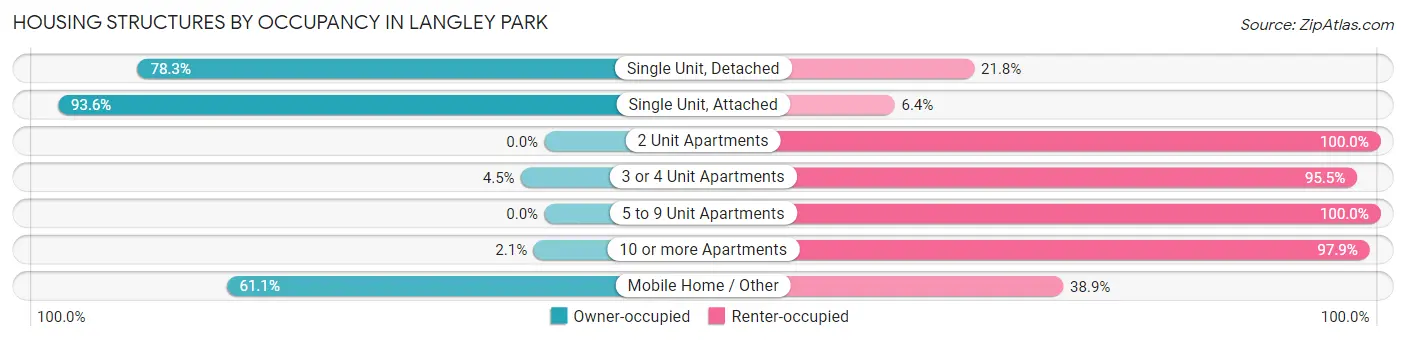
| Structure Type | Owner-occupied | Renter-occupied |
| Single Unit, Detached | 831 (78.2%) | 231 (21.7%) |
| Single Unit, Attached | 277 (93.6%) | 19 (6.4%) |
| 2 Unit Apartments | 0 (0.0%) | 72 (100.0%) |
| 3 or 4 Unit Apartments | 18 (4.5%) | 379 (95.5%) |
| 5 to 9 Unit Apartments | 0 (0.0%) | 1,489 (100.0%) |
| 10 or more Apartments | 39 (2.1%) | 1,807 (97.9%) |
| Mobile Home / Other | 22 (61.1%) | 14 (38.9%) |
| Total | 1,187 (22.8%) | 4,011 (77.2%) |
Housing Structures by Number of Rooms in Langley Park
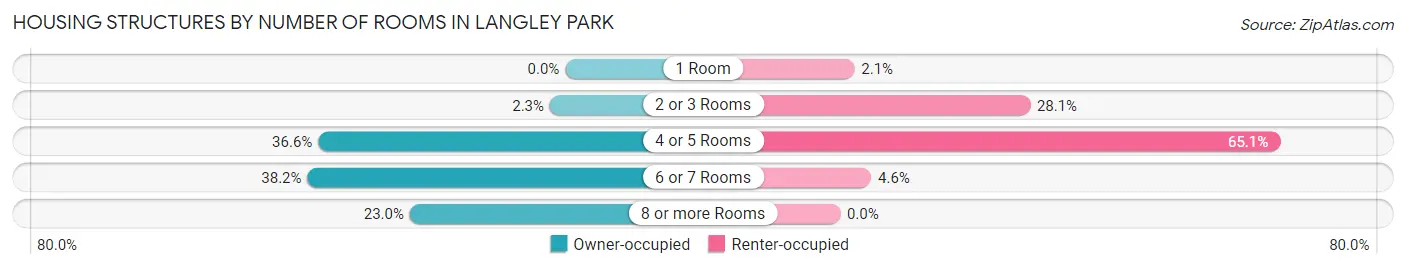
| Number of Rooms | Owner-occupied | Renter-occupied |
| 1 Room | 0 (0.0%) | 86 (2.1%) |
| 2 or 3 Rooms | 27 (2.3%) | 1,128 (28.1%) |
| 4 or 5 Rooms | 434 (36.6%) | 2,612 (65.1%) |
| 6 or 7 Rooms | 453 (38.2%) | 185 (4.6%) |
| 8 or more Rooms | 273 (23.0%) | 0 (0.0%) |
| Total | 1,187 (100.0%) | 4,011 (100.0%) |
Housing Structure by Heating Type in Langley Park
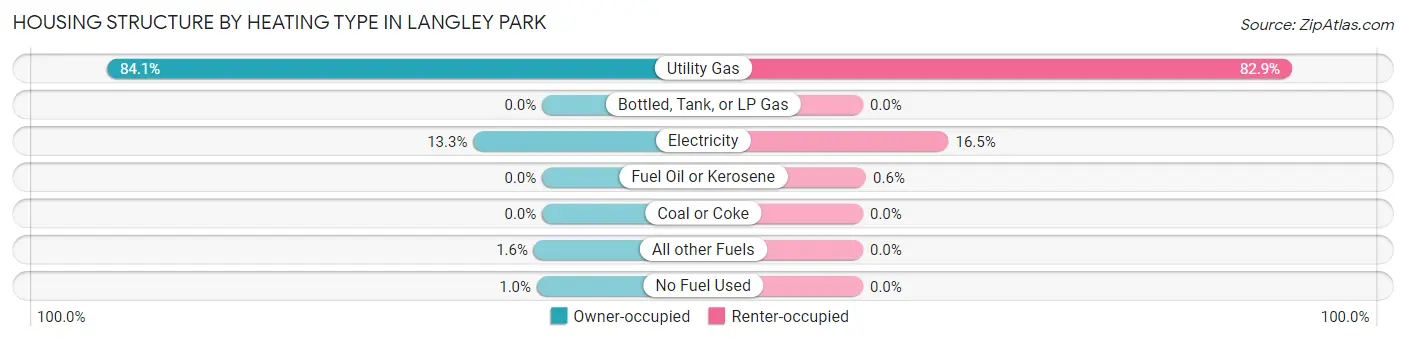
| Heating Type | Owner-occupied | Renter-occupied |
| Utility Gas | 998 (84.1%) | 3,324 (82.9%) |
| Bottled, Tank, or LP Gas | 0 (0.0%) | 0 (0.0%) |
| Electricity | 158 (13.3%) | 663 (16.5%) |
| Fuel Oil or Kerosene | 0 (0.0%) | 24 (0.6%) |
| Coal or Coke | 0 (0.0%) | 0 (0.0%) |
| All other Fuels | 19 (1.6%) | 0 (0.0%) |
| No Fuel Used | 12 (1.0%) | 0 (0.0%) |
| Total | 1,187 (100.0%) | 4,011 (100.0%) |
Household Vehicle Usage in Langley Park
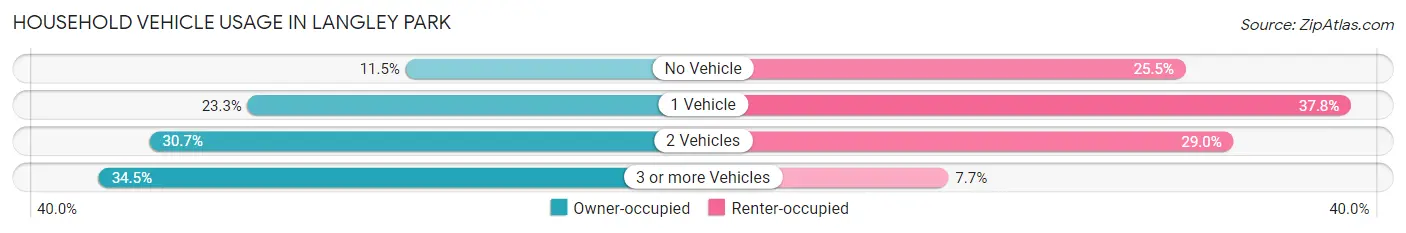
| Vehicles per Household | Owner-occupied | Renter-occupied |
| No Vehicle | 137 (11.5%) | 1,021 (25.5%) |
| 1 Vehicle | 277 (23.3%) | 1,516 (37.8%) |
| 2 Vehicles | 364 (30.7%) | 1,164 (29.0%) |
| 3 or more Vehicles | 409 (34.5%) | 310 (7.7%) |
| Total | 1,187 (100.0%) | 4,011 (100.0%) |
Real Estate & Mortgages in Langley Park
Real Estate and Mortgage Overview in Langley Park
| Characteristic | Without Mortgage | With Mortgage |
| Housing Units | 433 | 754 |
| Median Property Value | $292,500 | $364,100 |
| Median Household Income | $79,904 | $181 |
| Monthly Housing Costs | $653 | $112 |
| Real Estate Taxes | $3,671 | $16 |
Property Value by Mortgage Status in Langley Park
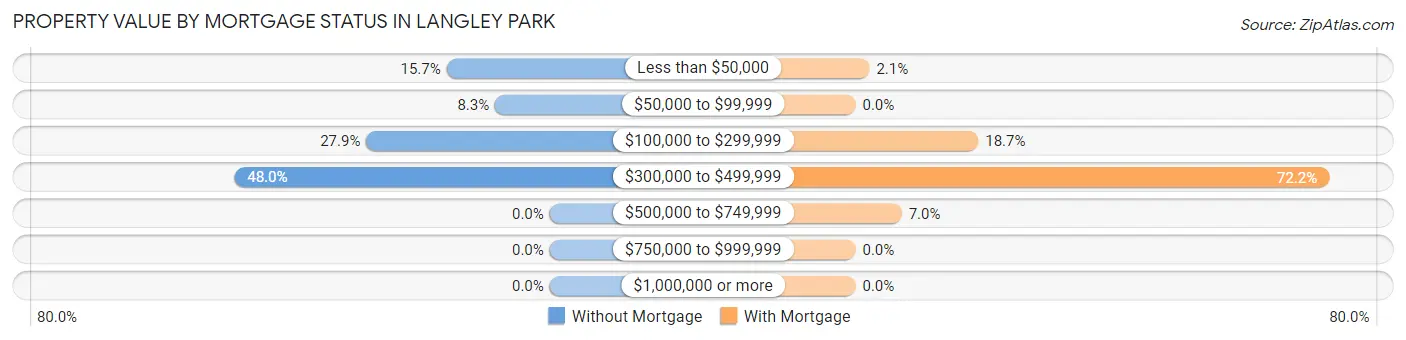
| Property Value | Without Mortgage | With Mortgage |
| Less than $50,000 | 68 (15.7%) | 16 (2.1%) |
| $50,000 to $99,999 | 36 (8.3%) | 0 (0.0%) |
| $100,000 to $299,999 | 121 (27.9%) | 141 (18.7%) |
| $300,000 to $499,999 | 208 (48.0%) | 544 (72.2%) |
| $500,000 to $749,999 | 0 (0.0%) | 53 (7.0%) |
| $750,000 to $999,999 | 0 (0.0%) | 0 (0.0%) |
| $1,000,000 or more | 0 (0.0%) | 0 (0.0%) |
| Total | 433 (100.0%) | 754 (100.0%) |
Household Income by Mortgage Status in Langley Park
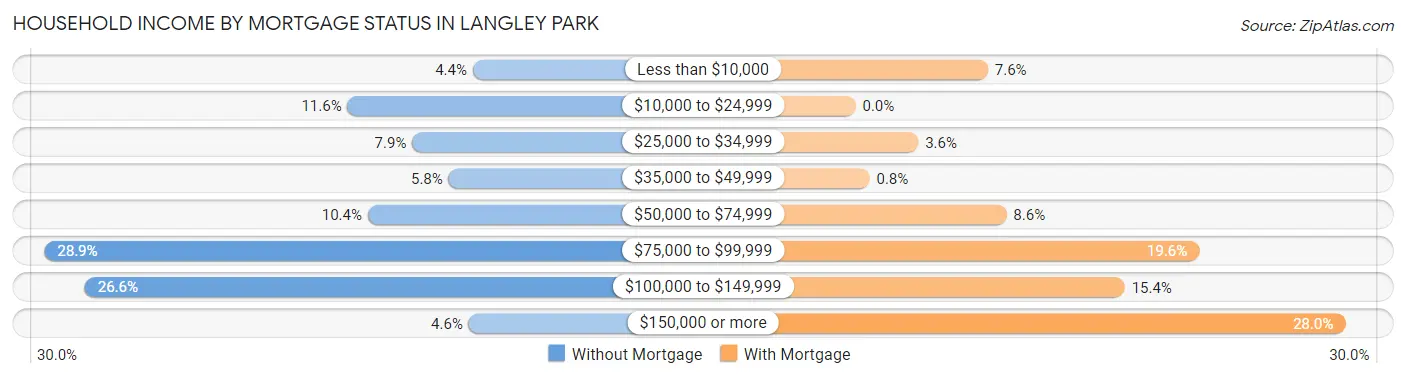
| Household Income | Without Mortgage | With Mortgage |
| Less than $10,000 | 19 (4.4%) | 57 (7.6%) |
| $10,000 to $24,999 | 50 (11.6%) | 0 (0.0%) |
| $25,000 to $34,999 | 34 (7.9%) | 27 (3.6%) |
| $35,000 to $49,999 | 25 (5.8%) | 6 (0.8%) |
| $50,000 to $74,999 | 45 (10.4%) | 65 (8.6%) |
| $75,000 to $99,999 | 125 (28.9%) | 148 (19.6%) |
| $100,000 to $149,999 | 115 (26.6%) | 116 (15.4%) |
| $150,000 or more | 20 (4.6%) | 211 (28.0%) |
| Total | 433 (100.0%) | 754 (100.0%) |
Property Value to Household Income Ratio in Langley Park
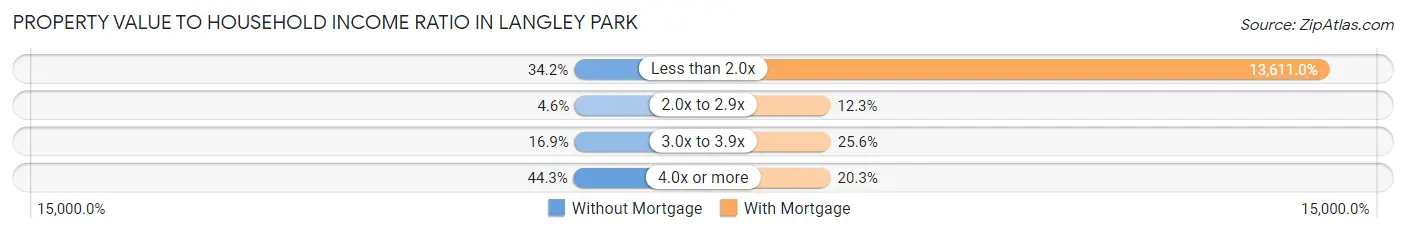
| Value-to-Income Ratio | Without Mortgage | With Mortgage |
| Less than 2.0x | 148 (34.2%) | 102,627 (13,611.0%) |
| 2.0x to 2.9x | 20 (4.6%) | 93 (12.3%) |
| 3.0x to 3.9x | 73 (16.9%) | 193 (25.6%) |
| 4.0x or more | 192 (44.3%) | 153 (20.3%) |
| Total | 433 (100.0%) | 754 (100.0%) |
Real Estate Taxes by Mortgage Status in Langley Park
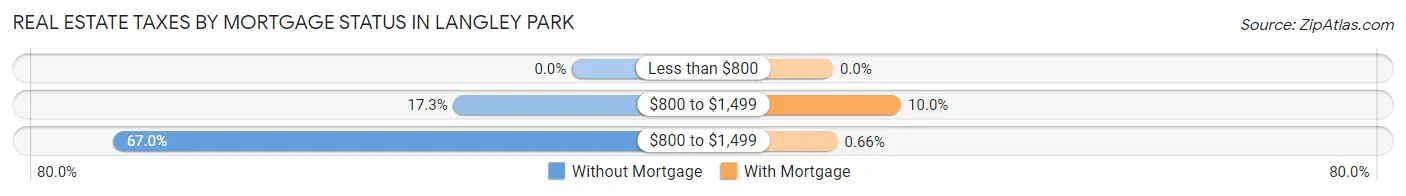
| Property Taxes | Without Mortgage | With Mortgage |
| Less than $800 | 0 (0.0%) | 0 (0.0%) |
| $800 to $1,499 | 75 (17.3%) | 75 (10.0%) |
| $800 to $1,499 | 290 (67.0%) | 5 (0.7%) |
| Total | 433 (100.0%) | 754 (100.0%) |
Health & Disability in Langley Park
Health Insurance Coverage by Age in Langley Park
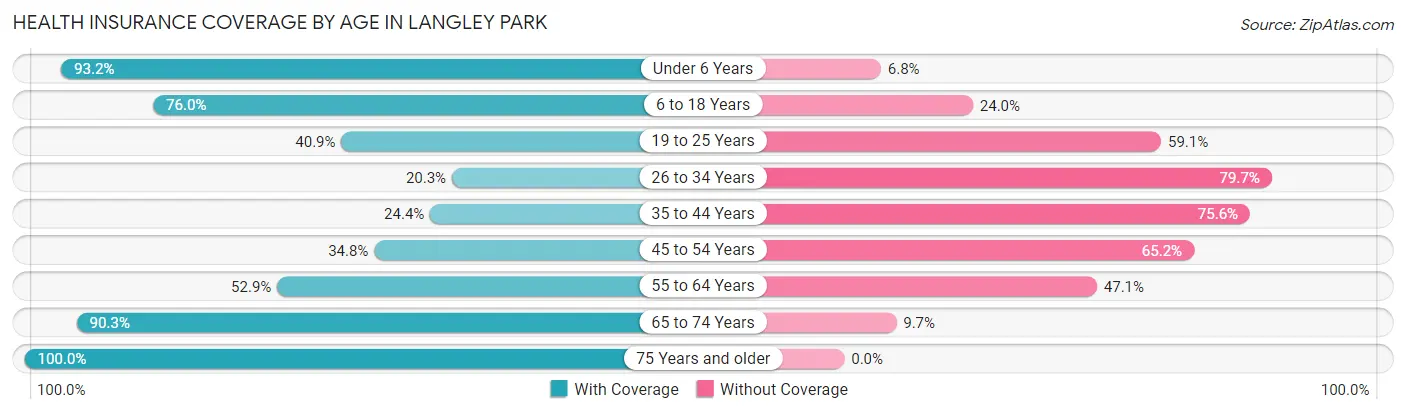
| Age Bracket | With Coverage | Without Coverage |
| Under 6 Years | 3,059 (93.2%) | 224 (6.8%) |
| 6 to 18 Years | 3,528 (76.0%) | 1,113 (24.0%) |
| 19 to 25 Years | 715 (40.9%) | 1,032 (59.1%) |
| 26 to 34 Years | 765 (20.3%) | 3,001 (79.7%) |
| 35 to 44 Years | 803 (24.4%) | 2,492 (75.6%) |
| 45 to 54 Years | 799 (34.8%) | 1,496 (65.2%) |
| 55 to 64 Years | 885 (52.9%) | 788 (47.1%) |
| 65 to 74 Years | 643 (90.3%) | 69 (9.7%) |
| 75 Years and older | 355 (100.0%) | 0 (0.0%) |
| Total | 11,552 (53.1%) | 10,215 (46.9%) |
Health Insurance Coverage by Citizenship Status in Langley Park
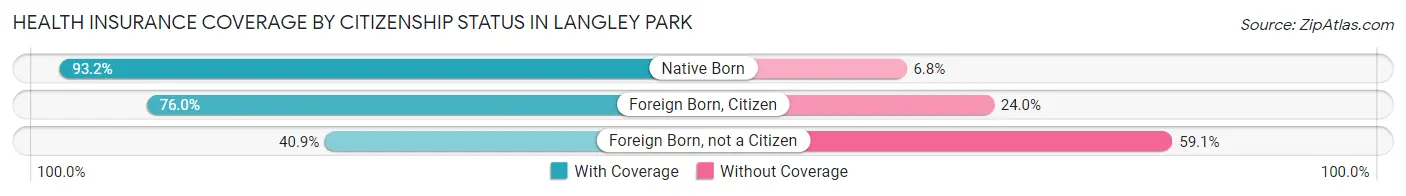
| Citizenship Status | With Coverage | Without Coverage |
| Native Born | 3,059 (93.2%) | 224 (6.8%) |
| Foreign Born, Citizen | 3,528 (76.0%) | 1,113 (24.0%) |
| Foreign Born, not a Citizen | 715 (40.9%) | 1,032 (59.1%) |
Health Insurance Coverage by Household Income in Langley Park
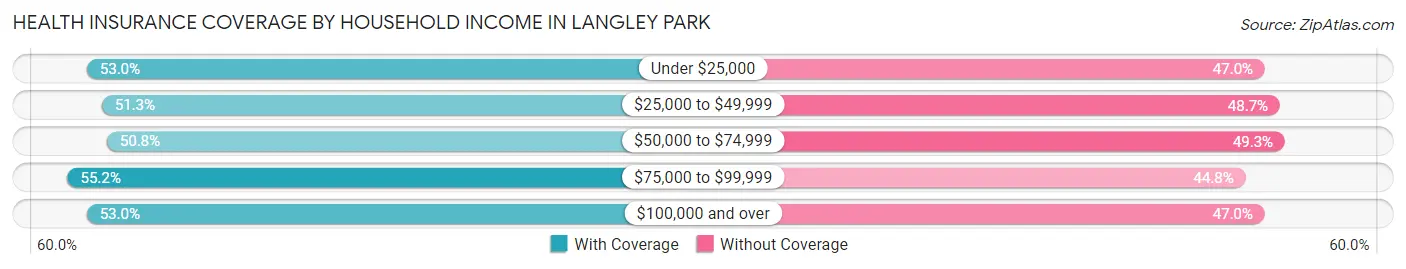
| Household Income | With Coverage | Without Coverage |
| Under $25,000 | 1,332 (53.0%) | 1,181 (47.0%) |
| $25,000 to $49,999 | 1,472 (51.3%) | 1,396 (48.7%) |
| $50,000 to $74,999 | 1,730 (50.7%) | 1,679 (49.2%) |
| $75,000 to $99,999 | 2,630 (55.2%) | 2,137 (44.8%) |
| $100,000 and over | 4,312 (53.0%) | 3,822 (47.0%) |
Public vs Private Health Insurance Coverage by Age in Langley Park
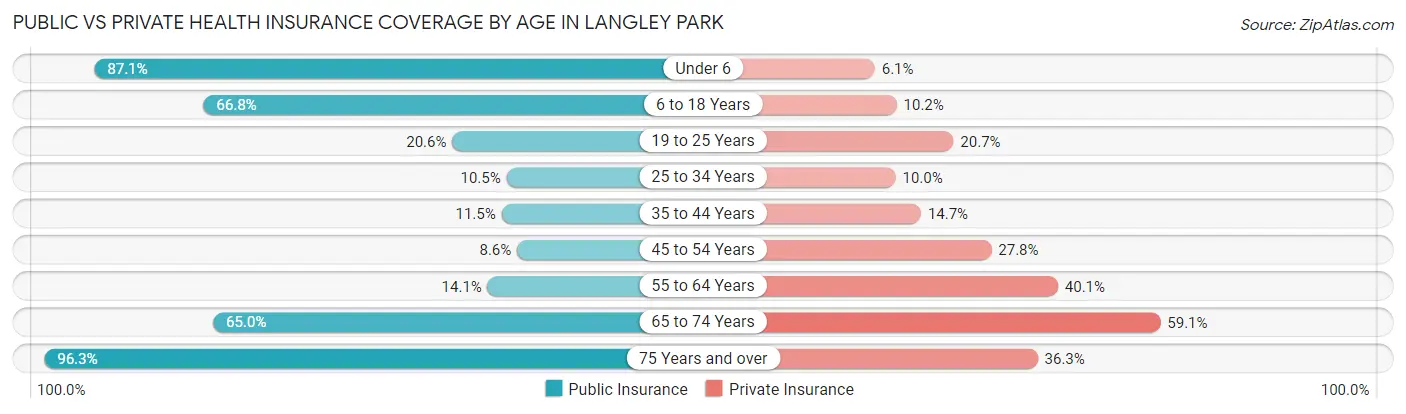
| Age Bracket | Public Insurance | Private Insurance |
| Under 6 | 2,858 (87.1%) | 201 (6.1%) |
| 6 to 18 Years | 3,100 (66.8%) | 472 (10.2%) |
| 19 to 25 Years | 360 (20.6%) | 362 (20.7%) |
| 25 to 34 Years | 397 (10.5%) | 376 (10.0%) |
| 35 to 44 Years | 378 (11.5%) | 484 (14.7%) |
| 45 to 54 Years | 197 (8.6%) | 637 (27.8%) |
| 55 to 64 Years | 235 (14.1%) | 671 (40.1%) |
| 65 to 74 Years | 463 (65.0%) | 421 (59.1%) |
| 75 Years and over | 342 (96.3%) | 129 (36.3%) |
| Total | 8,330 (38.3%) | 3,753 (17.2%) |
Disability Status by Sex by Age in Langley Park
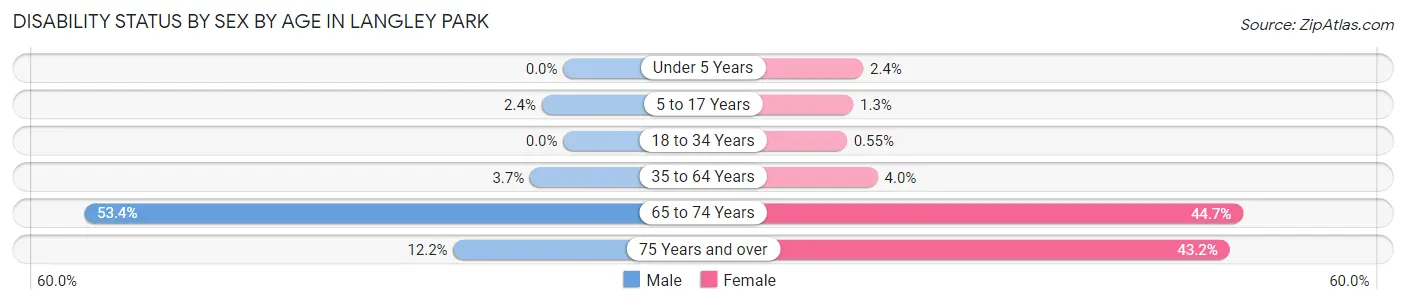
| Age Bracket | Male | Female |
| Under 5 Years | 0 (0.0%) | 33 (2.4%) |
| 5 to 17 Years | 66 (2.4%) | 30 (1.3%) |
| 18 to 34 Years | 0 (0.0%) | 13 (0.5%) |
| 35 to 64 Years | 171 (3.7%) | 106 (4.0%) |
| 65 to 74 Years | 103 (53.4%) | 232 (44.7%) |
| 75 Years and over | 12 (12.2%) | 111 (43.2%) |
Disability Class by Sex by Age in Langley Park
Disability Class: Hearing Difficulty
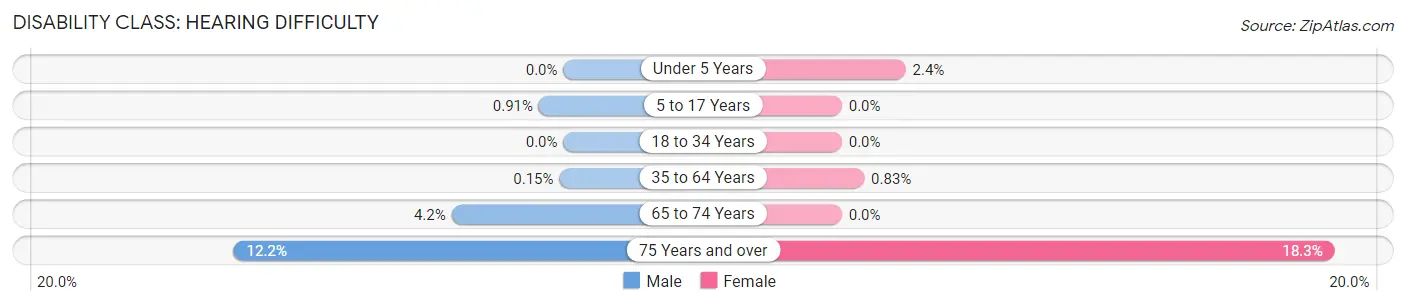
| Age Bracket | Male | Female |
| Under 5 Years | 0 (0.0%) | 33 (2.4%) |
| 5 to 17 Years | 25 (0.9%) | 0 (0.0%) |
| 18 to 34 Years | 0 (0.0%) | 0 (0.0%) |
| 35 to 64 Years | 7 (0.2%) | 22 (0.8%) |
| 65 to 74 Years | 8 (4.2%) | 0 (0.0%) |
| 75 Years and over | 12 (12.2%) | 47 (18.3%) |
Disability Class: Vision Difficulty
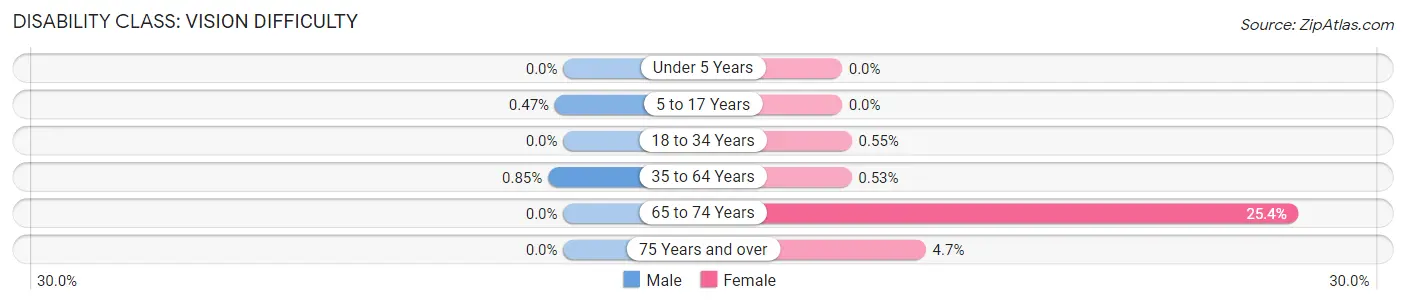
| Age Bracket | Male | Female |
| Under 5 Years | 0 (0.0%) | 0 (0.0%) |
| 5 to 17 Years | 13 (0.5%) | 0 (0.0%) |
| 18 to 34 Years | 0 (0.0%) | 13 (0.5%) |
| 35 to 64 Years | 39 (0.9%) | 14 (0.5%) |
| 65 to 74 Years | 0 (0.0%) | 132 (25.4%) |
| 75 Years and over | 0 (0.0%) | 12 (4.7%) |
Disability Class: Cognitive Difficulty
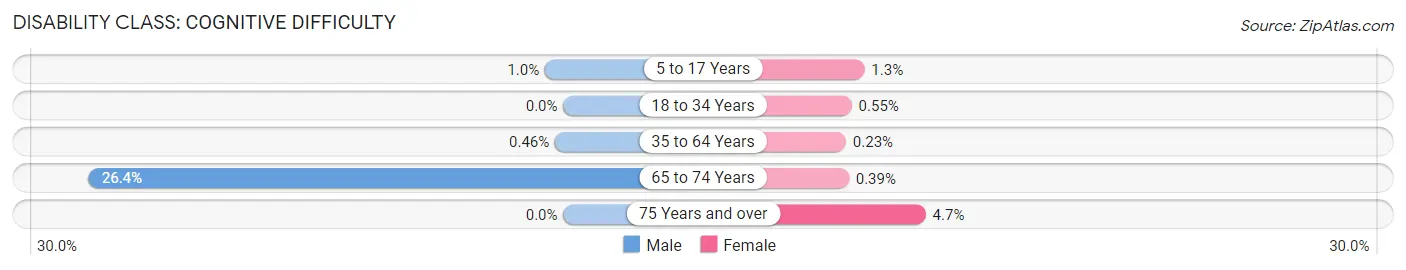
| Age Bracket | Male | Female |
| 5 to 17 Years | 28 (1.0%) | 30 (1.3%) |
| 18 to 34 Years | 0 (0.0%) | 13 (0.5%) |
| 35 to 64 Years | 21 (0.5%) | 6 (0.2%) |
| 65 to 74 Years | 51 (26.4%) | 2 (0.4%) |
| 75 Years and over | 0 (0.0%) | 12 (4.7%) |
Disability Class: Ambulatory Difficulty
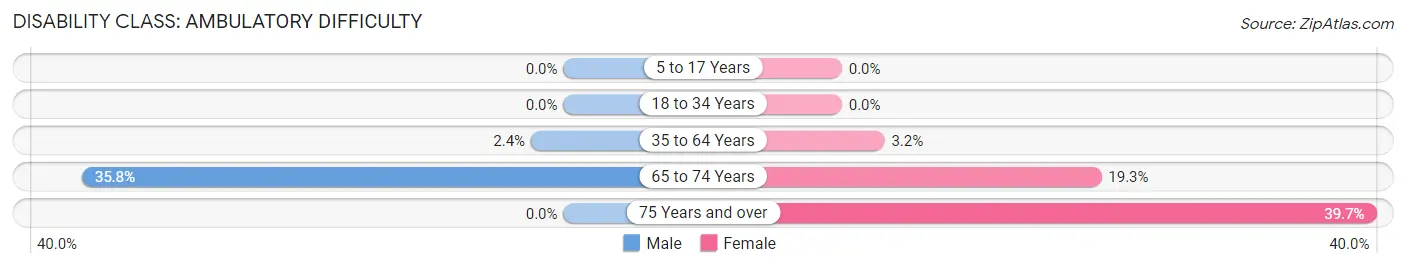
| Age Bracket | Male | Female |
| 5 to 17 Years | 0 (0.0%) | 0 (0.0%) |
| 18 to 34 Years | 0 (0.0%) | 0 (0.0%) |
| 35 to 64 Years | 111 (2.4%) | 84 (3.2%) |
| 65 to 74 Years | 69 (35.7%) | 100 (19.3%) |
| 75 Years and over | 0 (0.0%) | 102 (39.7%) |
Disability Class: Self-Care Difficulty
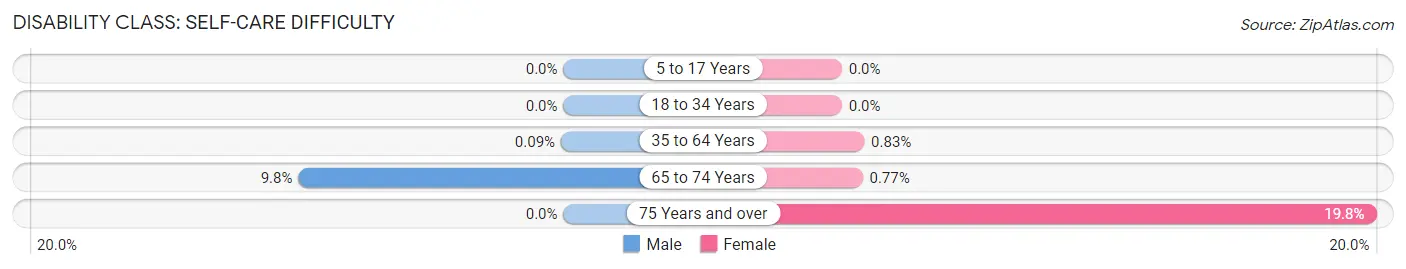
| Age Bracket | Male | Female |
| 5 to 17 Years | 0 (0.0%) | 0 (0.0%) |
| 18 to 34 Years | 0 (0.0%) | 0 (0.0%) |
| 35 to 64 Years | 4 (0.1%) | 22 (0.8%) |
| 65 to 74 Years | 19 (9.8%) | 4 (0.8%) |
| 75 Years and over | 0 (0.0%) | 51 (19.8%) |
Technology Access in Langley Park
Computing Device Access in Langley Park
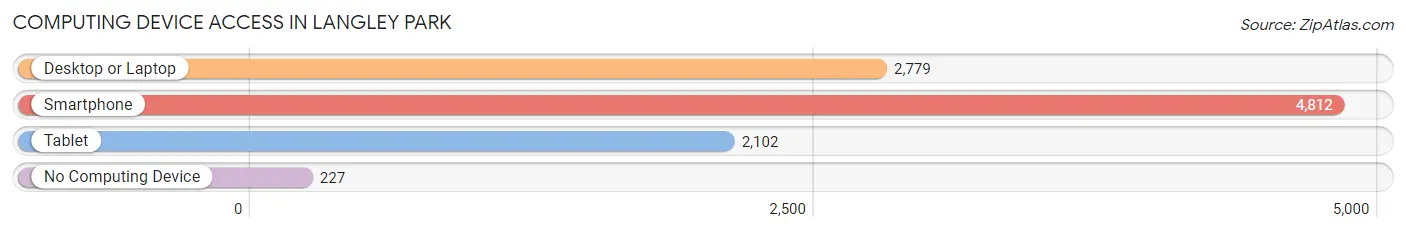
| Device Type | # Households | % Households |
| Desktop or Laptop | 2,779 | 53.5% |
| Smartphone | 4,812 | 92.6% |
| Tablet | 2,102 | 40.4% |
| No Computing Device | 227 | 4.4% |
| Total | 5,198 | 100.0% |
Internet Access in Langley Park
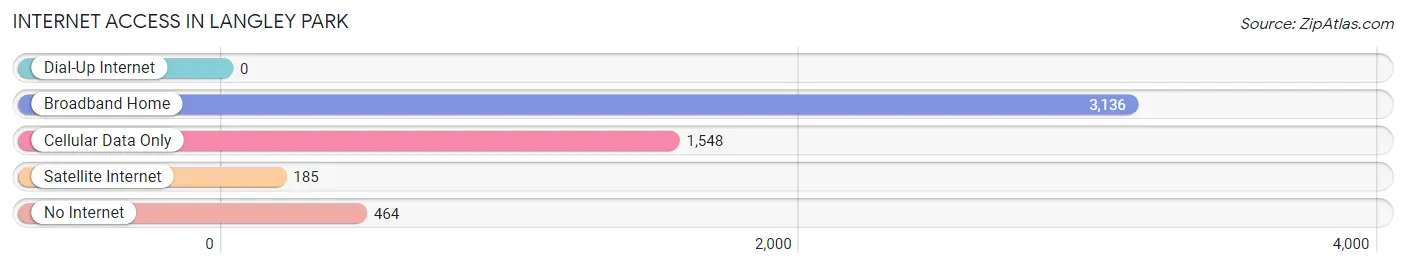
| Internet Type | # Households | % Households |
| Dial-Up Internet | 0 | 0.0% |
| Broadband Home | 3,136 | 60.3% |
| Cellular Data Only | 1,548 | 29.8% |
| Satellite Internet | 185 | 3.6% |
| No Internet | 464 | 8.9% |
| Total | 5,198 | 100.0% |
Langley Park Summary
Langley Park is an unincorporated area and census-designated place (CDP) in Prince George's County, Maryland, United States. It is located just north of the city of Hyattsville and is part of the Washington metropolitan area. As of the 2010 census, the population of Langley Park was 17,755.
History
Langley Park was founded in the early 20th century by the Washington Suburban Sanitary Commission (WSSC) as a planned community for workers of the Washington Suburban Sanitary District. The area was named after the Langley family, who owned a large tract of land in the area. The Langley family had been in the area since the late 1700s and had owned a large plantation in the area.
The WSSC developed the area as a planned community, with the intention of providing affordable housing for its workers. The area was developed with single-family homes, duplexes, and apartment buildings. The area was also designed to be a self-contained community, with its own schools, stores, and other amenities.
Geography
Langley Park is located at 38°58'45" North, 76°56'45" West (38.979167, -76.945278). It is bordered by the city of Hyattsville to the south, the city of Takoma Park to the west, and the city of Silver Spring to the north.
The area is located in the Piedmont region of Maryland, and is characterized by rolling hills and valleys. The area is located in the watershed of the Anacostia River, and is part of the Chesapeake Bay watershed.
Economy
Langley Park is a primarily residential area, with a small commercial district located along University Boulevard. The commercial district includes a variety of restaurants, stores, and other businesses.
The area is also home to a number of government and non-profit organizations, including the Langley Park Community Center, the Langley Park Boys and Girls Club, and the Langley Park Health Center.
Demographics
As of the 2010 census, the population of Langley Park was 17,755. The racial makeup of the area was 44.3% White, 28.2% African American, 0.5% Native American, 11.3% Asian, 0.2% Pacific Islander, 11.7% from other races, and 4.0% from two or more races. Hispanic or Latino of any race were 24.3% of the population.
The median household income in the area was $41,945, and the median family income was $50,945. The per capita income was $20,945. About 18.3% of the population was below the poverty line.
Common Questions
What is Per Capita Income in Langley Park?
Per Capita income in Langley Park is $21,160.
What is the Median Family Income in Langley Park?
Median Family Income in Langley Park is $70,962.
What is the Median Household income in Langley Park?
Median Household Income in Langley Park is $77,731.
What is Income or Wage Gap in Langley Park?
Income or Wage Gap in Langley Park is 27.8%.
Women in Langley Park earn 72.2 cents for every dollar earned by a man.
What is Family Income Deficit in Langley Park?
Family Income Deficit in Langley Park is $13,003.
Families that are below poverty line in Langley Park earn $13,003 less on average than the poverty threshold level.
What is Inequality or Gini Index in Langley Park?
Inequality or Gini Index in Langley Park is 0.38.
What is the Total Population of Langley Park?
Total Population of Langley Park is 21,778.
What is the Total Male Population of Langley Park?
Total Male Population of Langley Park is 12,221.
What is the Total Female Population of Langley Park?
Total Female Population of Langley Park is 9,557.
What is the Ratio of Males per 100 Females in Langley Park?
There are 127.87 Males per 100 Females in Langley Park.
What is the Ratio of Females per 100 Males in Langley Park?
There are 78.20 Females per 100 Males in Langley Park.
What is the Median Population Age in Langley Park?
Median Population Age in Langley Park is 29.3 Years.
What is the Average Family Size in Langley Park
Average Family Size in Langley Park is 4.3 People.
What is the Average Household Size in Langley Park
Average Household Size in Langley Park is 4.2 People.
How Large is the Labor Force in Langley Park?
There are 10,760 People in the Labor Forcein in Langley Park.
What is the Percentage of People in the Labor Force in Langley Park?
72.6% of People are in the Labor Force in Langley Park.
What is the Unemployment Rate in Langley Park?
Unemployment Rate in Langley Park is 7.3%.