Dallas, TX Map & Demographics
Dallas Map
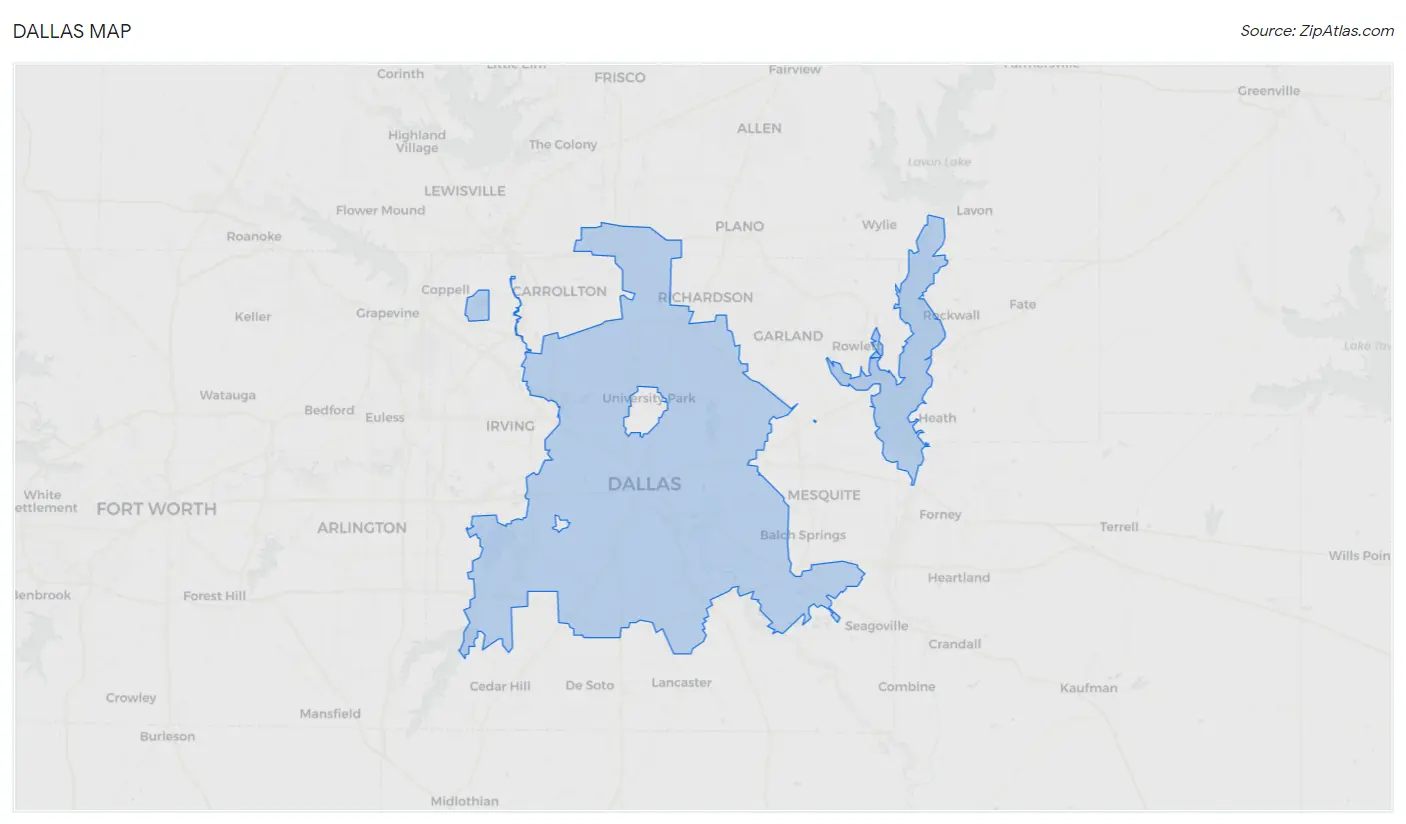
Dallas Overview
$41,761
PER CAPITA INCOME
$72,504
AVG FAMILY INCOME
$63,985
AVG HOUSEHOLD INCOME
22.0%
WAGE / INCOME GAP [ % ]
78.0¢/ $1
WAGE / INCOME GAP [ $ ]
$11,867
FAMILY INCOME DEFICIT
0.53
INEQUALITY / GINI INDEX
1,300,642
TOTAL POPULATION
648,990
MALE POPULATION
651,652
FEMALE POPULATION
99.59
MALES / 100 FEMALES
100.41
FEMALES / 100 MALES
33.1
MEDIAN AGE
3.4
AVG FAMILY SIZE
2.5
AVG HOUSEHOLD SIZE
698,301
LABOR FORCE [ PEOPLE ]
68.6%
PERCENT IN LABOR FORCE
5.0%
UNEMPLOYMENT RATE
Dallas Zip Codes
Income in Dallas
Income Overview in Dallas
Per Capita Income in Dallas is $41,761, while median incomes of families and households are $72,504 and $63,985 respectively.
| Characteristic | Number | Measure |
| Per Capita Income | 1,300,642 | $41,761 |
| Median Family Income | 286,044 | $72,504 |
| Mean Family Income | 286,044 | $122,295 |
| Median Household Income | 521,147 | $63,985 |
| Mean Household Income | 521,147 | $102,023 |
| Income Deficit | 286,044 | $11,867 |
| Wage / Income Gap (%) | 1,300,642 | 21.98% |
| Wage / Income Gap ($) | 1,300,642 | 78.02¢ per $1 |
| Gini / Inequality Index | 1,300,642 | 0.53 |
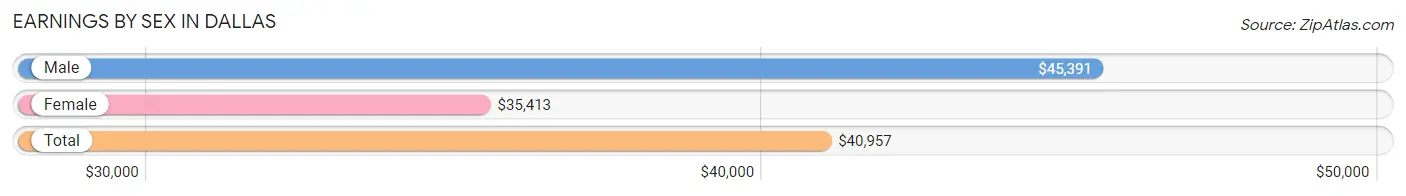
Earnings by Sex in Dallas
Average Earnings in Dallas are $40,957, $45,391 for men and $35,413 for women, a difference of 22.0%.
| Sex | Number | Average Earnings |
| Male | 388,773 (54.2%) | $45,391 |
| Female | 328,484 (45.8%) | $35,413 |
| Total | 717,257 (100.0%) | $40,957 |
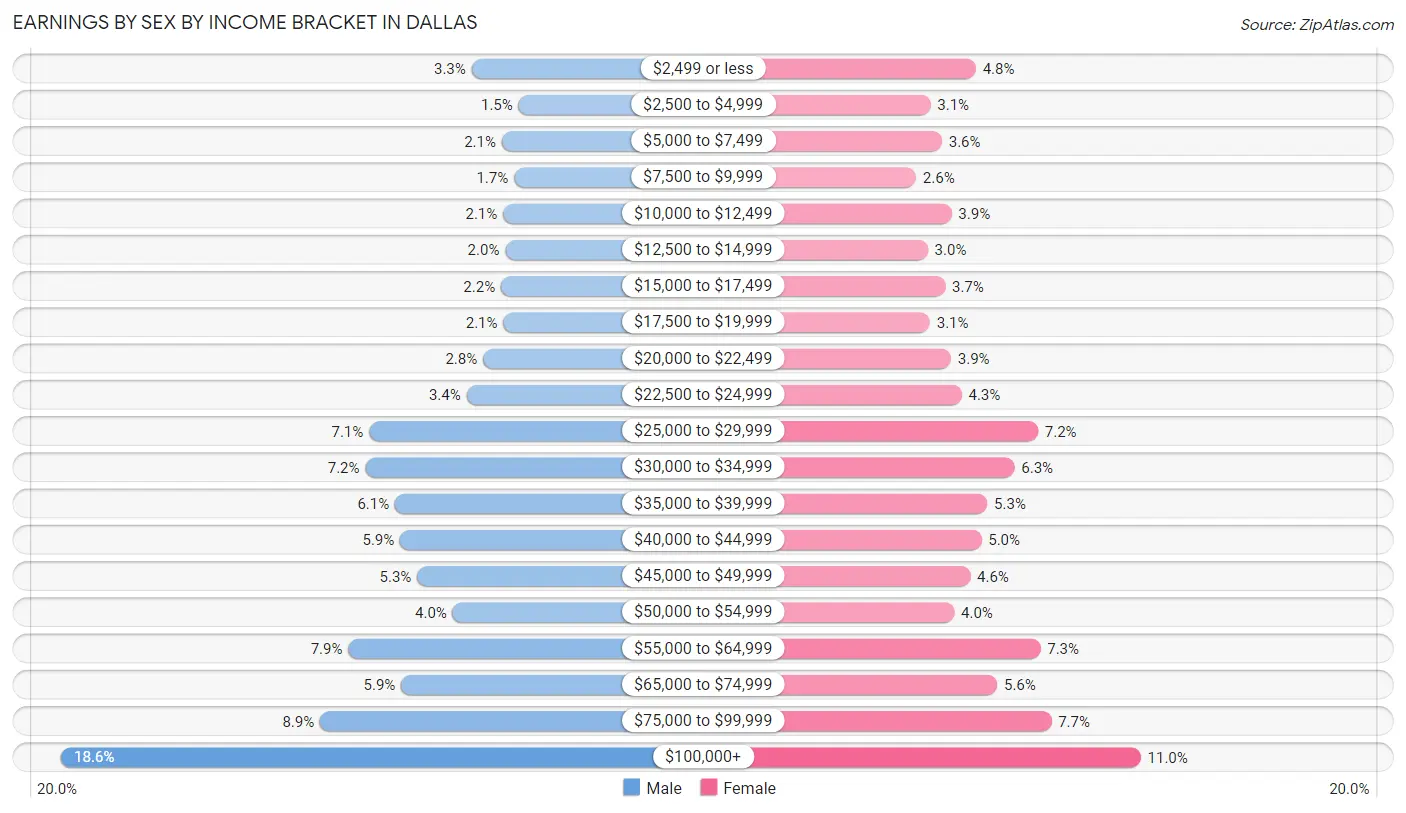
Earnings by Sex by Income Bracket in Dallas
The most common earnings brackets in Dallas are $100,000+ for men (72,441 | 18.6%) and $100,000+ for women (36,181 | 11.0%).
| Income | Male | Female |
| $2,499 or less | 12,624 (3.3%) | 15,872 (4.8%) |
| $2,500 to $4,999 | 5,799 (1.5%) | 10,271 (3.1%) |
| $5,000 to $7,499 | 8,236 (2.1%) | 11,691 (3.6%) |
| $7,500 to $9,999 | 6,449 (1.7%) | 8,513 (2.6%) |
| $10,000 to $12,499 | 8,045 (2.1%) | 12,863 (3.9%) |
| $12,500 to $14,999 | 7,738 (2.0%) | 9,964 (3.0%) |
| $15,000 to $17,499 | 8,361 (2.1%) | 12,102 (3.7%) |
| $17,500 to $19,999 | 8,028 (2.1%) | 10,223 (3.1%) |
| $20,000 to $22,499 | 10,976 (2.8%) | 12,803 (3.9%) |
| $22,500 to $24,999 | 13,371 (3.4%) | 14,132 (4.3%) |
| $25,000 to $29,999 | 27,571 (7.1%) | 23,534 (7.2%) |
| $30,000 to $34,999 | 28,098 (7.2%) | 20,643 (6.3%) |
| $35,000 to $39,999 | 23,803 (6.1%) | 17,287 (5.3%) |
| $40,000 to $44,999 | 23,068 (5.9%) | 16,545 (5.0%) |
| $45,000 to $49,999 | 20,569 (5.3%) | 15,182 (4.6%) |
| $50,000 to $54,999 | 15,392 (4.0%) | 13,219 (4.0%) |
| $55,000 to $64,999 | 30,588 (7.9%) | 23,820 (7.2%) |
| $65,000 to $74,999 | 22,888 (5.9%) | 18,485 (5.6%) |
| $75,000 to $99,999 | 34,728 (8.9%) | 25,154 (7.7%) |
| $100,000+ | 72,441 (18.6%) | 36,181 (11.0%) |
| Total | 388,773 (100.0%) | 328,484 (100.0%) |
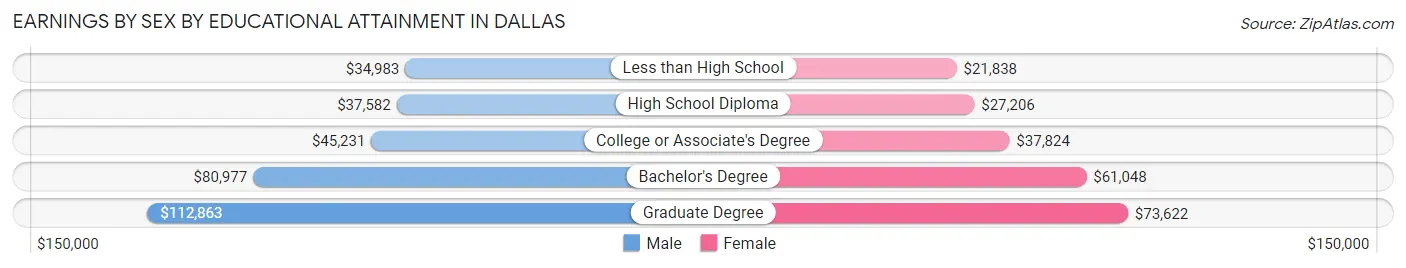
Earnings by Sex by Educational Attainment in Dallas
Average earnings in Dallas are $50,082 for men and $40,701 for women, a difference of 18.7%. Men with an educational attainment of graduate degree enjoy the highest average annual earnings of $112,863, while those with less than high school education earn the least with $34,983. Women with an educational attainment of graduate degree earn the most with the average annual earnings of $73,622, while those with less than high school education have the smallest earnings of $21,838.
| Educational Attainment | Male Income | Female Income |
| Less than High School | $34,983 | $21,838 |
| High School Diploma | $37,582 | $27,206 |
| College or Associate's Degree | $45,231 | $37,824 |
| Bachelor's Degree | $80,977 | $61,048 |
| Graduate Degree | $112,863 | $73,622 |
| Total | $50,082 | $40,701 |
Family Income in Dallas
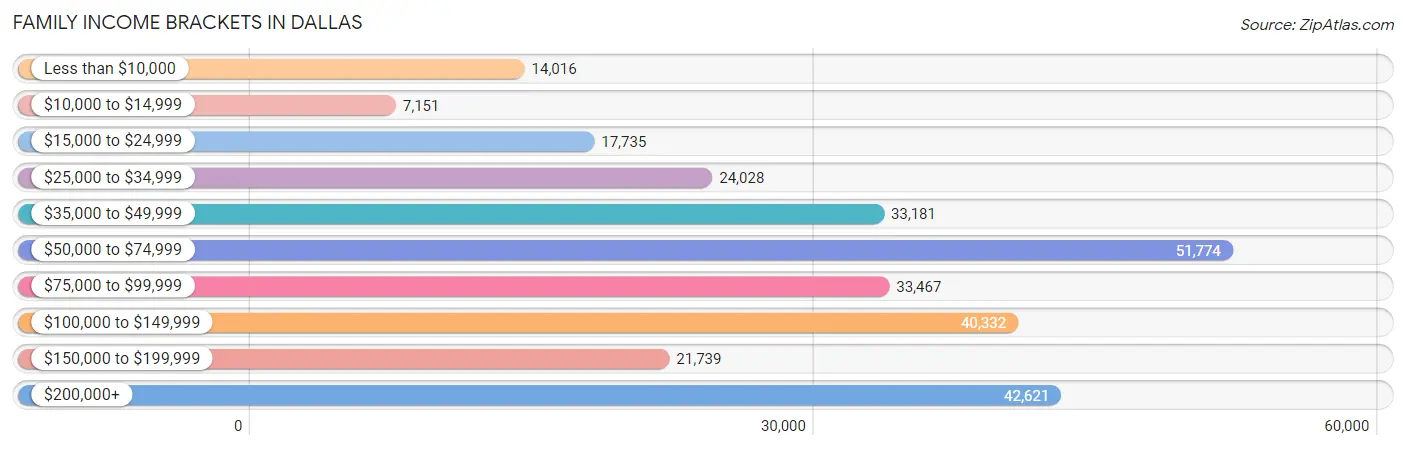
Family Income Brackets in Dallas
According to the Dallas family income data, there are 51,774 families falling into the $50,000 to $74,999 income range, which is the most common income bracket and makes up 18.1% of all families. Conversely, the $10,000 to $14,999 income bracket is the least frequent group with only 7,151 families (2.5%) belonging to this category.
| Income Bracket | # Families | % Families |
| Less than $10,000 | 14,016 | 4.9% |
| $10,000 to $14,999 | 7,151 | 2.5% |
| $15,000 to $24,999 | 17,735 | 6.2% |
| $25,000 to $34,999 | 24,028 | 8.4% |
| $35,000 to $49,999 | 33,181 | 11.6% |
| $50,000 to $74,999 | 51,774 | 18.1% |
| $75,000 to $99,999 | 33,467 | 11.7% |
| $100,000 to $149,999 | 40,332 | 14.1% |
| $150,000 to $199,999 | 21,739 | 7.6% |
| $200,000+ | 42,621 | 14.9% |
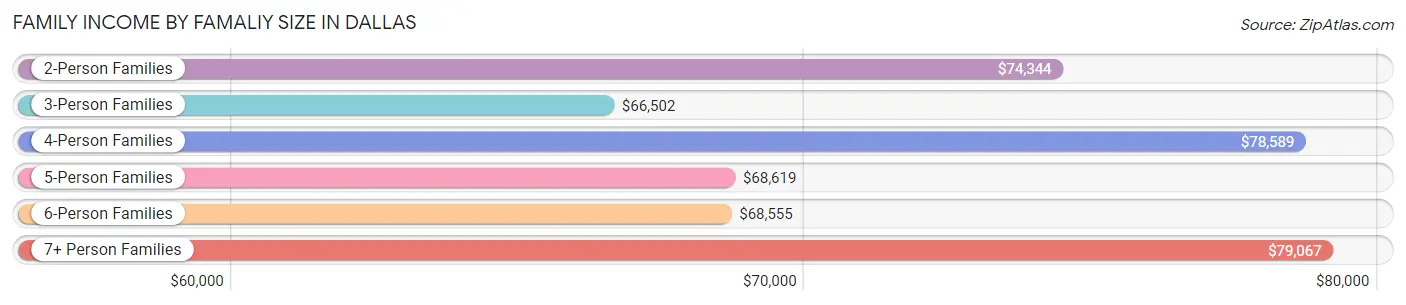
Family Income by Famaliy Size in Dallas
7+ person families (7,366 | 2.6%) account for the highest median family income in Dallas with $79,067 per family, while 2-person families (124,173 | 43.4%) have the highest median income of $37,172 per family member.
| Income Bracket | # Families | Median Income |
| 2-Person Families | 124,173 (43.4%) | $74,344 |
| 3-Person Families | 61,278 (21.4%) | $66,502 |
| 4-Person Families | 50,527 (17.7%) | $78,589 |
| 5-Person Families | 31,000 (10.8%) | $68,619 |
| 6-Person Families | 11,700 (4.1%) | $68,555 |
| 7+ Person Families | 7,366 (2.6%) | $79,067 |
| Total | 286,044 (100.0%) | $72,504 |
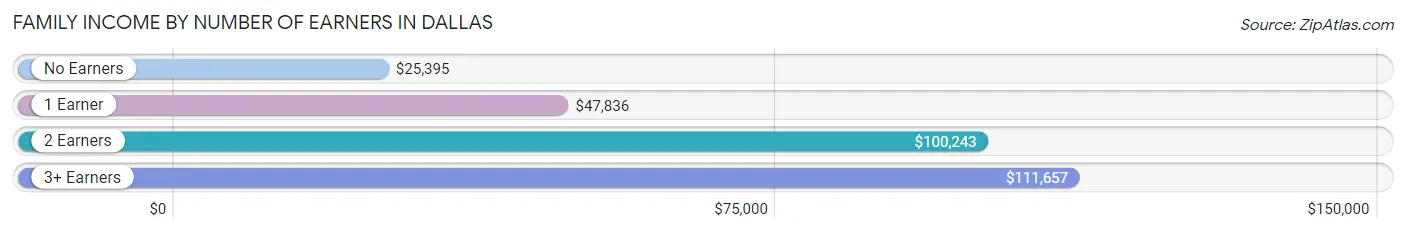
Family Income by Number of Earners in Dallas
The median family income in Dallas is $72,504, with families comprising 3+ earners (31,788) having the highest median family income of $111,657, while families with no earners (31,560) have the lowest median family income of $25,395, accounting for 11.1% and 11.0% of families, respectively.
| Number of Earners | # Families | Median Income |
| No Earners | 31,560 (11.0%) | $25,395 |
| 1 Earner | 101,350 (35.4%) | $47,836 |
| 2 Earners | 121,346 (42.4%) | $100,243 |
| 3+ Earners | 31,788 (11.1%) | $111,657 |
| Total | 286,044 (100.0%) | $72,504 |
Household Income in Dallas
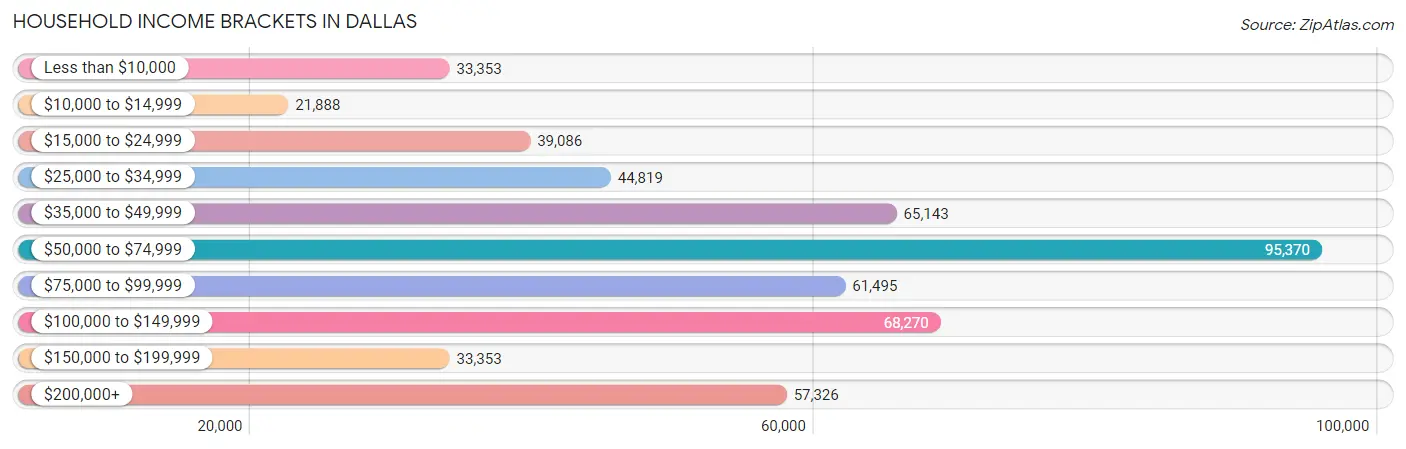
Household Income Brackets in Dallas
With 95,370 households falling in the category, the $50,000 to $74,999 income range is the most frequent in Dallas, accounting for 18.3% of all households. In contrast, only 21,888 households (4.2%) fall into the $10,000 to $14,999 income bracket, making it the least populous group.
| Income Bracket | # Households | % Households |
| Less than $10,000 | 33,353 | 6.4% |
| $10,000 to $14,999 | 21,888 | 4.2% |
| $15,000 to $24,999 | 39,086 | 7.5% |
| $25,000 to $34,999 | 44,819 | 8.6% |
| $35,000 to $49,999 | 65,143 | 12.5% |
| $50,000 to $74,999 | 95,370 | 18.3% |
| $75,000 to $99,999 | 61,495 | 11.8% |
| $100,000 to $149,999 | 68,270 | 13.1% |
| $150,000 to $199,999 | 33,353 | 6.4% |
| $200,000+ | 57,326 | 11.0% |
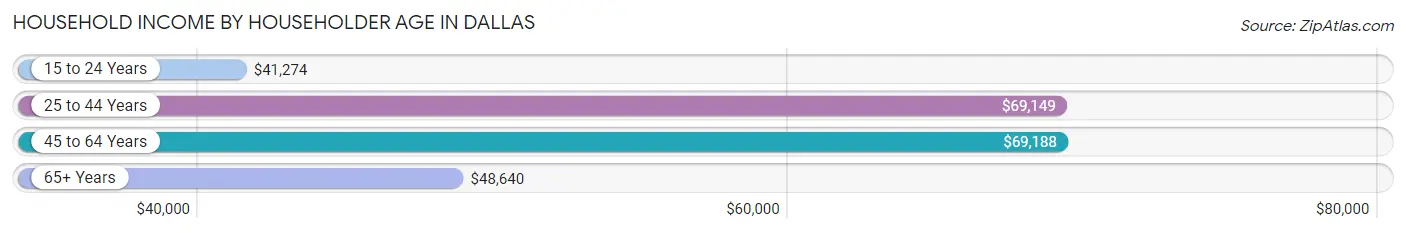
Household Income by Householder Age in Dallas
The median household income in Dallas is $63,985, with the highest median household income of $69,188 found in the 45 to 64 years age bracket for the primary householder. A total of 168,819 households (32.4%) fall into this category. Meanwhile, the 15 to 24 years age bracket for the primary householder has the lowest median household income of $41,274, with 32,653 households (6.3%) in this group.
| Income Bracket | # Households | Median Income |
| 15 to 24 Years | 32,653 (6.3%) | $41,274 |
| 25 to 44 Years | 226,889 (43.5%) | $69,149 |
| 45 to 64 Years | 168,819 (32.4%) | $69,188 |
| 65+ Years | 92,786 (17.8%) | $48,640 |
| Total | 521,147 (100.0%) | $63,985 |
Poverty in Dallas
Income Below Poverty by Sex and Age in Dallas
With 15.4% poverty level for males and 19.7% for females among the residents of Dallas, 15 year old males and 6 to 11 year old females are the most vulnerable to poverty, with 2,526 males (29.3%) and 14,596 females (28.8%) in their respective age groups living below the poverty level.
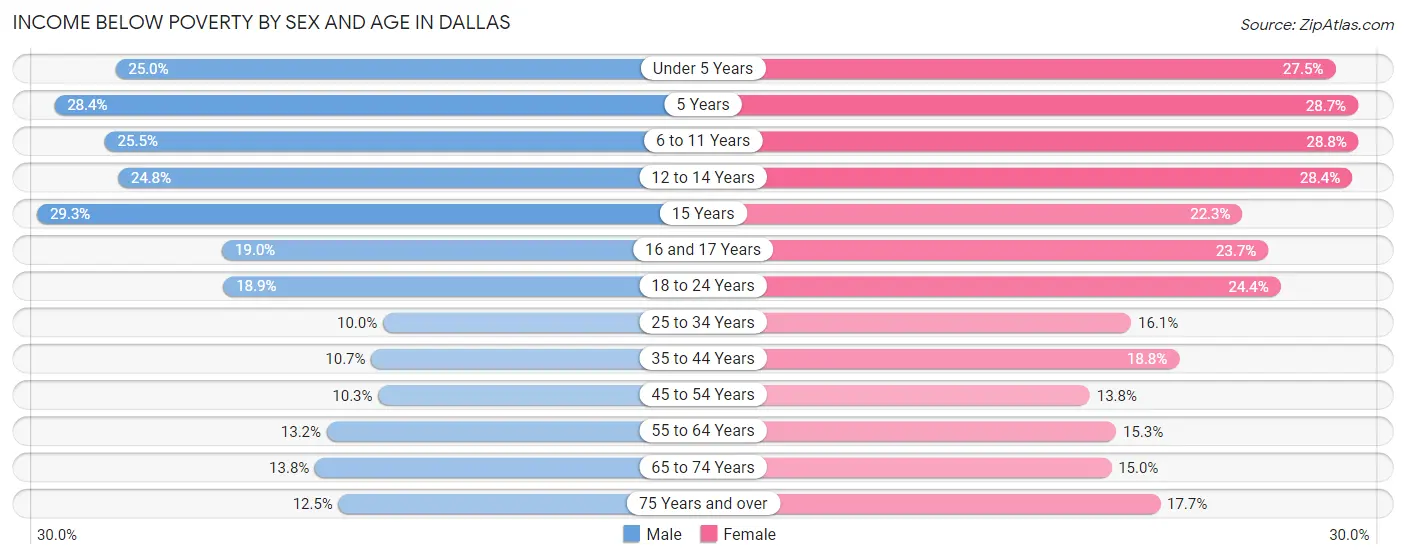
| Age Bracket | Male | Female |
| Under 5 Years | 11,021 (24.9%) | 12,786 (27.5%) |
| 5 Years | 2,601 (28.3%) | 2,298 (28.7%) |
| 6 to 11 Years | 13,419 (25.5%) | 14,596 (28.8%) |
| 12 to 14 Years | 6,893 (24.8%) | 6,876 (28.4%) |
| 15 Years | 2,526 (29.3%) | 1,812 (22.3%) |
| 16 and 17 Years | 3,271 (19.0%) | 4,030 (23.7%) |
| 18 to 24 Years | 11,780 (18.9%) | 15,753 (24.4%) |
| 25 to 34 Years | 12,180 (10.0%) | 19,183 (16.1%) |
| 35 to 44 Years | 9,731 (10.7%) | 16,319 (18.8%) |
| 45 to 54 Years | 7,853 (10.3%) | 10,157 (13.8%) |
| 55 to 64 Years | 8,974 (13.2%) | 10,456 (15.3%) |
| 65 to 74 Years | 5,546 (13.8%) | 6,891 (15.0%) |
| 75 Years and over | 2,643 (12.5%) | 5,958 (17.7%) |
| Total | 98,438 (15.4%) | 127,115 (19.7%) |
Income Above Poverty by Sex and Age in Dallas
According to the poverty statistics in Dallas, males aged 25 to 34 years and females aged 45 to 54 years are the age groups that are most secure financially, with 90.0% of males and 86.2% of females in these age groups living above the poverty line.
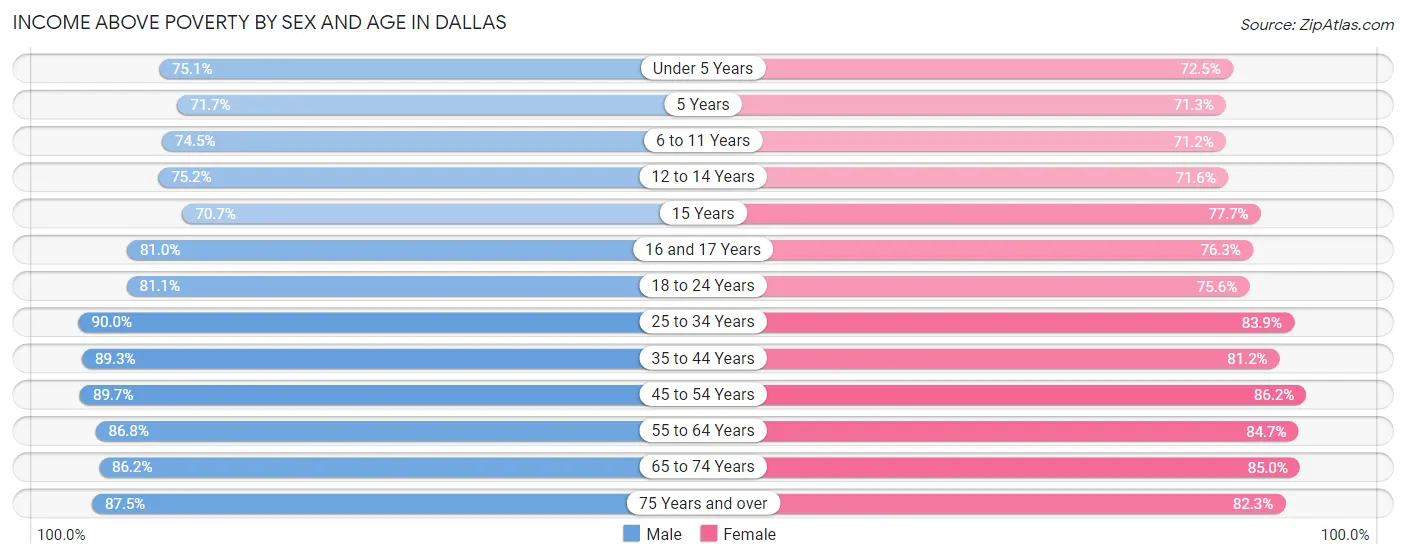
| Age Bracket | Male | Female |
| Under 5 Years | 33,144 (75.0%) | 33,757 (72.5%) |
| 5 Years | 6,575 (71.7%) | 5,698 (71.3%) |
| 6 to 11 Years | 39,114 (74.5%) | 36,111 (71.2%) |
| 12 to 14 Years | 20,892 (75.2%) | 17,330 (71.6%) |
| 15 Years | 6,093 (70.7%) | 6,315 (77.7%) |
| 16 and 17 Years | 13,935 (81.0%) | 12,945 (76.3%) |
| 18 to 24 Years | 50,402 (81.1%) | 48,716 (75.6%) |
| 25 to 34 Years | 109,168 (90.0%) | 99,907 (83.9%) |
| 35 to 44 Years | 81,268 (89.3%) | 70,580 (81.2%) |
| 45 to 54 Years | 68,411 (89.7%) | 63,383 (86.2%) |
| 55 to 64 Years | 59,142 (86.8%) | 58,030 (84.7%) |
| 65 to 74 Years | 34,585 (86.2%) | 39,059 (85.0%) |
| 75 Years and over | 18,484 (87.5%) | 27,668 (82.3%) |
| Total | 541,213 (84.6%) | 519,499 (80.3%) |
Income Below Poverty Among Married-Couple Families in Dallas
The poverty statistics for married-couple families in Dallas show that 7.9% or 14,474 of the total 184,347 families live below the poverty line. Families with 5 or more children have the highest poverty rate of 37.6%, comprising of 450 families. On the other hand, families with no children have the lowest poverty rate of 4.6%, which includes 4,530 families.
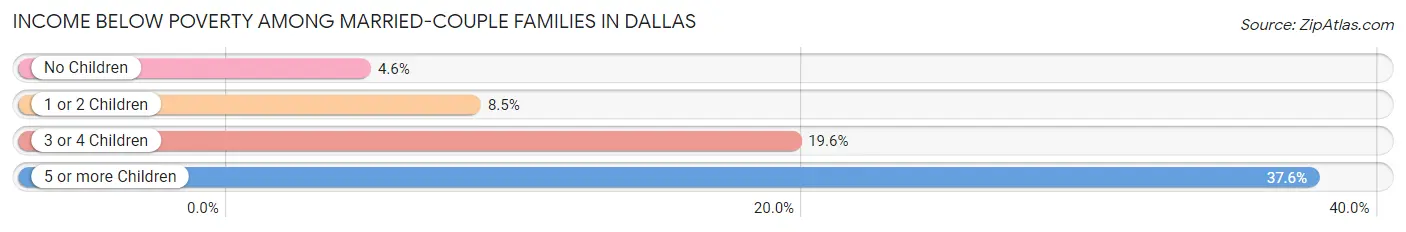
| Children | Above Poverty | Below Poverty |
| No Children | 93,312 (95.4%) | 4,530 (4.6%) |
| 1 or 2 Children | 59,387 (91.5%) | 5,487 (8.5%) |
| 3 or 4 Children | 16,428 (80.4%) | 4,007 (19.6%) |
| 5 or more Children | 746 (62.4%) | 450 (37.6%) |
| Total | 169,873 (92.1%) | 14,474 (7.9%) |
Income Below Poverty Among Single-Parent Households in Dallas
According to the poverty data in Dallas, 14.0% or 3,847 single-father households and 28.8% or 21,351 single-mother households are living below the poverty line. Among single-father households, those with 5 or more children have the highest poverty rate, with 144 households (59.3%) experiencing poverty. Likewise, among single-mother households, those with 5 or more children have the highest poverty rate, with 1,063 households (79.7%) falling below the poverty line.
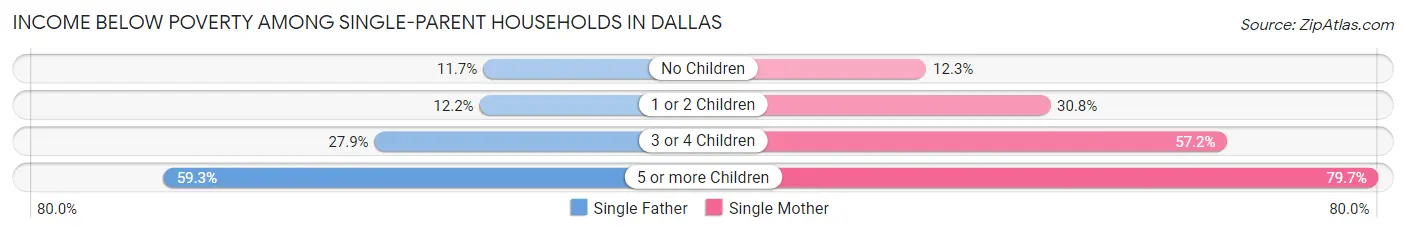
| Children | Single Father | Single Mother |
| No Children | 1,549 (11.7%) | 3,198 (12.3%) |
| 1 or 2 Children | 1,387 (12.2%) | 11,233 (30.8%) |
| 3 or 4 Children | 767 (27.9%) | 5,857 (57.2%) |
| 5 or more Children | 144 (59.3%) | 1,063 (79.7%) |
| Total | 3,847 (14.0%) | 21,351 (28.8%) |
Income Below Poverty Among Married-Couple vs Single-Parent Households in Dallas
The poverty data for Dallas shows that 14,474 of the married-couple family households (7.9%) and 25,198 of the single-parent households (24.8%) are living below the poverty level. Within the married-couple family households, those with 5 or more children have the highest poverty rate, with 450 households (37.6%) falling below the poverty line. Among the single-parent households, those with 5 or more children have the highest poverty rate, with 1,207 household (76.5%) living below poverty.
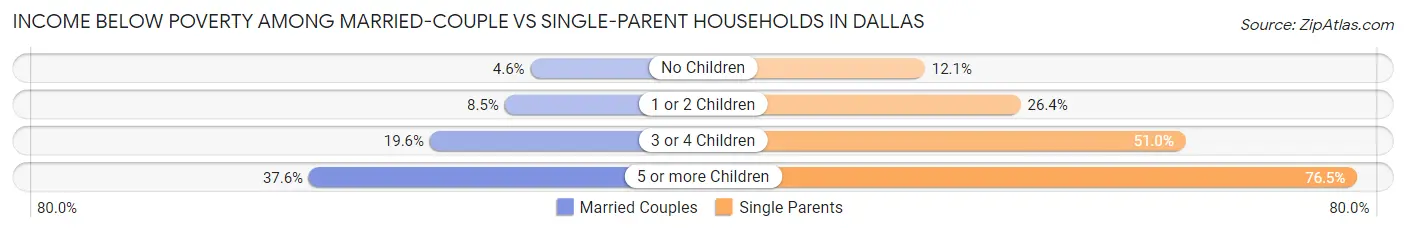
| Children | Married-Couple Families | Single-Parent Households |
| No Children | 4,530 (4.6%) | 4,747 (12.1%) |
| 1 or 2 Children | 5,487 (8.5%) | 12,620 (26.4%) |
| 3 or 4 Children | 4,007 (19.6%) | 6,624 (51.0%) |
| 5 or more Children | 450 (37.6%) | 1,207 (76.5%) |
| Total | 14,474 (7.9%) | 25,198 (24.8%) |
Race in Dallas
The most populous races in Dallas are White / Caucasian (626,150 | 48.1%), Hispanic or Latino (551,447 | 42.4%), and Black / African American (307,086 | 23.6%).
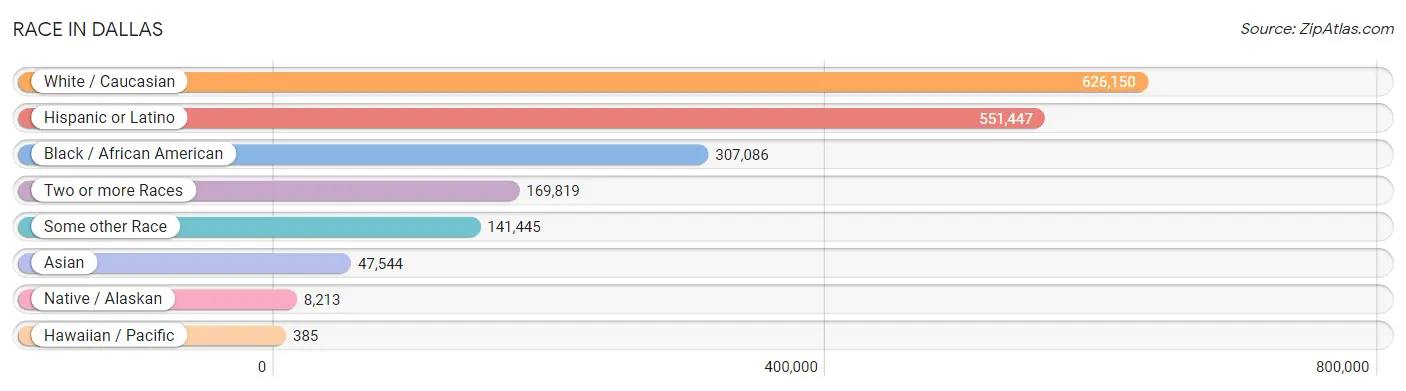
| Race | # Population | % Population |
| Asian | 47,544 | 3.7% |
| Black / African American | 307,086 | 23.6% |
| Hawaiian / Pacific | 385 | 0.0% |
| Hispanic or Latino | 551,447 | 42.4% |
| Native / Alaskan | 8,213 | 0.6% |
| White / Caucasian | 626,150 | 48.1% |
| Two or more Races | 169,819 | 13.1% |
| Some other Race | 141,445 | 10.9% |
| Total | 1,300,642 | 100.0% |
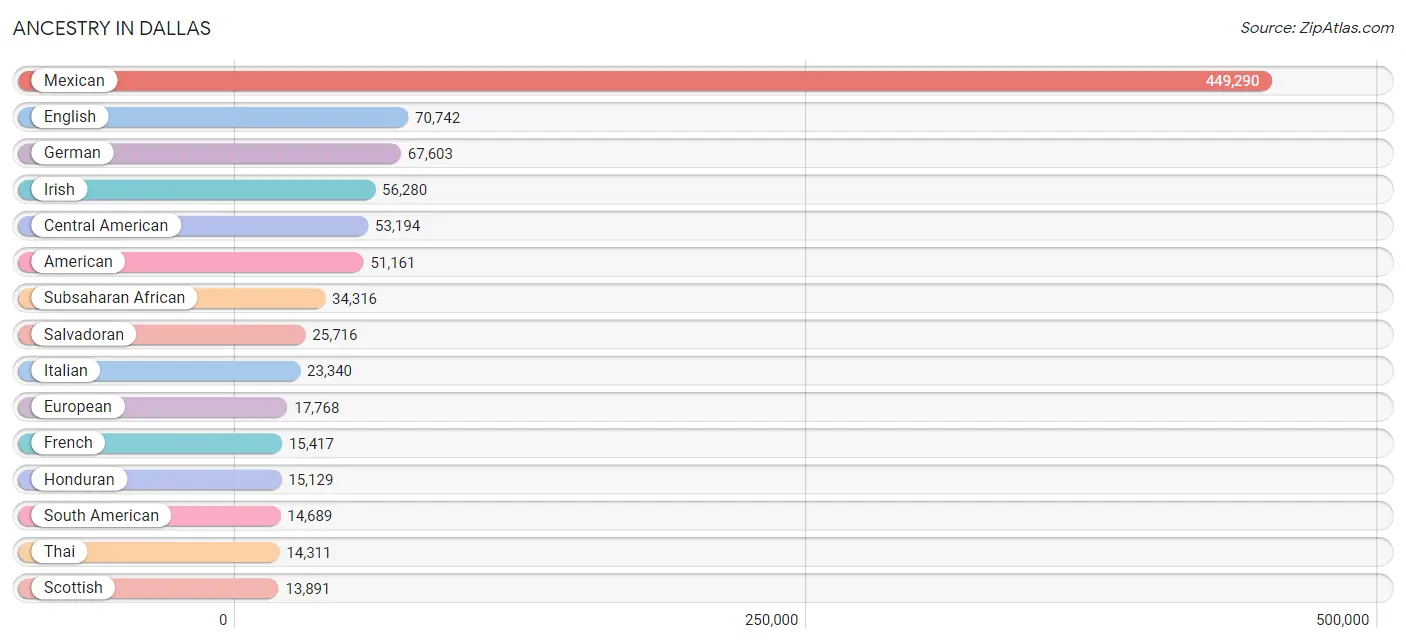
Ancestry in Dallas
The most populous ancestries reported in Dallas are Mexican (449,290 | 34.5%), English (70,742 | 5.4%), German (67,603 | 5.2%), Irish (56,280 | 4.3%), and Central American (53,194 | 4.1%), together accounting for 53.6% of all Dallas residents.
| Ancestry | # Population | % Population |
| Afghan | 1,003 | 0.1% |
| African | 12,254 | 0.9% |
| Alaska Native | 35 | 0.0% |
| Albanian | 382 | 0.0% |
| Alsatian | 18 | 0.0% |
| American | 51,161 | 3.9% |
| Apache | 999 | 0.1% |
| Arab | 6,930 | 0.5% |
| Argentinean | 986 | 0.1% |
| Armenian | 411 | 0.0% |
| Assyrian / Chaldean / Syriac | 6 | 0.0% |
| Australian | 367 | 0.0% |
| Austrian | 1,471 | 0.1% |
| Bahamian | 75 | 0.0% |
| Bangladeshi | 134 | 0.0% |
| Barbadian | 183 | 0.0% |
| Basque | 281 | 0.0% |
| Belgian | 712 | 0.1% |
| Belizean | 130 | 0.0% |
| Bhutanese | 2,686 | 0.2% |
| Blackfeet | 410 | 0.0% |
| Bolivian | 465 | 0.0% |
| Brazilian | 1,196 | 0.1% |
| British | 6,397 | 0.5% |
| British West Indian | 164 | 0.0% |
| Bulgarian | 357 | 0.0% |
| Burmese | 4,365 | 0.3% |
| Cajun | 503 | 0.0% |
| Cambodian | 162 | 0.0% |
| Canadian | 1,163 | 0.1% |
| Cape Verdean | 73 | 0.0% |
| Celtic | 156 | 0.0% |
| Central American | 53,194 | 4.1% |
| Central American Indian | 1,306 | 0.1% |
| Cherokee | 3,208 | 0.3% |
| Cheyenne | 21 | 0.0% |
| Chickasaw | 337 | 0.0% |
| Chilean | 575 | 0.0% |
| Chinese | 11 | 0.0% |
| Chippewa | 89 | 0.0% |
| Choctaw | 1,538 | 0.1% |
| Colombian | 2,921 | 0.2% |
| Comanche | 171 | 0.0% |
| Costa Rican | 734 | 0.1% |
| Creek | 255 | 0.0% |
| Croatian | 628 | 0.1% |
| Cuban | 5,056 | 0.4% |
| Cypriot | 9 | 0.0% |
| Czech | 5,100 | 0.4% |
| Czechoslovakian | 602 | 0.1% |
| Danish | 1,728 | 0.1% |
| Dominican | 1,552 | 0.1% |
| Dutch | 5,004 | 0.4% |
| Dutch West Indian | 52 | 0.0% |
| Eastern European | 2,778 | 0.2% |
| Ecuadorian | 1,010 | 0.1% |
| Egyptian | 812 | 0.1% |
| English | 70,742 | 5.4% |
| Estonian | 41 | 0.0% |
| Ethiopian | 6,243 | 0.5% |
| European | 17,768 | 1.4% |
| Filipino | 1,011 | 0.1% |
| Finnish | 484 | 0.0% |
| French | 15,417 | 1.2% |
| French American Indian | 11 | 0.0% |
| French Canadian | 1,636 | 0.1% |
| German | 67,603 | 5.2% |
| German Russian | 4 | 0.0% |
| Ghanaian | 646 | 0.1% |
| Greek | 1,656 | 0.1% |
| Guamanian / Chamorro | 285 | 0.0% |
| Guatemalan | 9,145 | 0.7% |
| Guyanese | 331 | 0.0% |
| Haitian | 571 | 0.0% |
| Honduran | 15,129 | 1.2% |
| Hungarian | 1,446 | 0.1% |
| Icelander | 168 | 0.0% |
| Indian (Asian) | 10,224 | 0.8% |
| Indonesian | 2,795 | 0.2% |
| Inupiat | 8 | 0.0% |
| Iranian | 2,734 | 0.2% |
| Iraqi | 339 | 0.0% |
| Irish | 56,280 | 4.3% |
| Iroquois | 44 | 0.0% |
| Israeli | 569 | 0.0% |
| Italian | 23,340 | 1.8% |
| Jamaican | 2,242 | 0.2% |
| Japanese | 919 | 0.1% |
| Jordanian | 241 | 0.0% |
| Kenyan | 2,075 | 0.2% |
| Korean | 5,230 | 0.4% |
| Laotian | 129 | 0.0% |
| Latvian | 120 | 0.0% |
| Lebanese | 2,272 | 0.2% |
| Liberian | 1,364 | 0.1% |
| Lithuanian | 869 | 0.1% |
| Lumbee | 11 | 0.0% |
| Luxembourger | 58 | 0.0% |
| Malaysian | 692 | 0.1% |
| Maltese | 32 | 0.0% |
| Mexican | 449,290 | 34.5% |
| Mexican American Indian | 4,529 | 0.4% |
| Mongolian | 81 | 0.0% |
| Moroccan | 718 | 0.1% |
| Native Hawaiian | 518 | 0.0% |
| Navajo | 296 | 0.0% |
| New Zealander | 193 | 0.0% |
| Nicaraguan | 1,486 | 0.1% |
| Nigerian | 7,230 | 0.6% |
| Northern European | 1,850 | 0.1% |
| Norwegian | 4,869 | 0.4% |
| Okinawan | 27 | 0.0% |
| Osage | 75 | 0.0% |
| Ottawa | 12 | 0.0% |
| Pakistani | 1,022 | 0.1% |
| Palestinian | 429 | 0.0% |
| Panamanian | 816 | 0.1% |
| Paraguayan | 206 | 0.0% |
| Pennsylvania German | 103 | 0.0% |
| Peruvian | 2,015 | 0.2% |
| Polish | 10,884 | 0.8% |
| Portuguese | 1,894 | 0.2% |
| Potawatomi | 19 | 0.0% |
| Pueblo | 161 | 0.0% |
| Puerto Rican | 7,373 | 0.6% |
| Romanian | 909 | 0.1% |
| Russian | 4,617 | 0.4% |
| Salvadoran | 25,716 | 2.0% |
| Samoan | 398 | 0.0% |
| Scandinavian | 1,350 | 0.1% |
| Scotch-Irish | 8,706 | 0.7% |
| Scottish | 13,891 | 1.1% |
| Seminole | 217 | 0.0% |
| Senegalese | 98 | 0.0% |
| Serbian | 273 | 0.0% |
| Shoshone | 11 | 0.0% |
| Sierra Leonean | 153 | 0.0% |
| Sioux | 109 | 0.0% |
| Slavic | 157 | 0.0% |
| Slovak | 503 | 0.0% |
| Slovene | 364 | 0.0% |
| Somali | 205 | 0.0% |
| South African | 548 | 0.0% |
| South American | 14,689 | 1.1% |
| South American Indian | 43 | 0.0% |
| Spaniard | 3,614 | 0.3% |
| Spanish | 1,721 | 0.1% |
| Spanish American | 107 | 0.0% |
| Spanish American Indian | 62 | 0.0% |
| Sri Lankan | 7,738 | 0.6% |
| Subsaharan African | 34,316 | 2.6% |
| Sudanese | 74 | 0.0% |
| Swedish | 5,265 | 0.4% |
| Swiss | 1,539 | 0.1% |
| Syrian | 393 | 0.0% |
| Thai | 14,311 | 1.1% |
| Tohono O'Odham | 15 | 0.0% |
| Tongan | 72 | 0.0% |
| Trinidadian and Tobagonian | 471 | 0.0% |
| Turkish | 953 | 0.1% |
| U.S. Virgin Islander | 185 | 0.0% |
| Ugandan | 70 | 0.0% |
| Ukrainian | 1,444 | 0.1% |
| Uruguayan | 84 | 0.0% |
| Ute | 14 | 0.0% |
| Venezuelan | 6,194 | 0.5% |
| Vietnamese | 367 | 0.0% |
| Welsh | 4,020 | 0.3% |
| West Indian | 853 | 0.1% |
| Yakama | 3 | 0.0% |
| Yaqui | 52 | 0.0% |
| Yugoslavian | 343 | 0.0% |
| Zimbabwean | 196 | 0.0% | View All 173 Rows |
Immigrants in Dallas
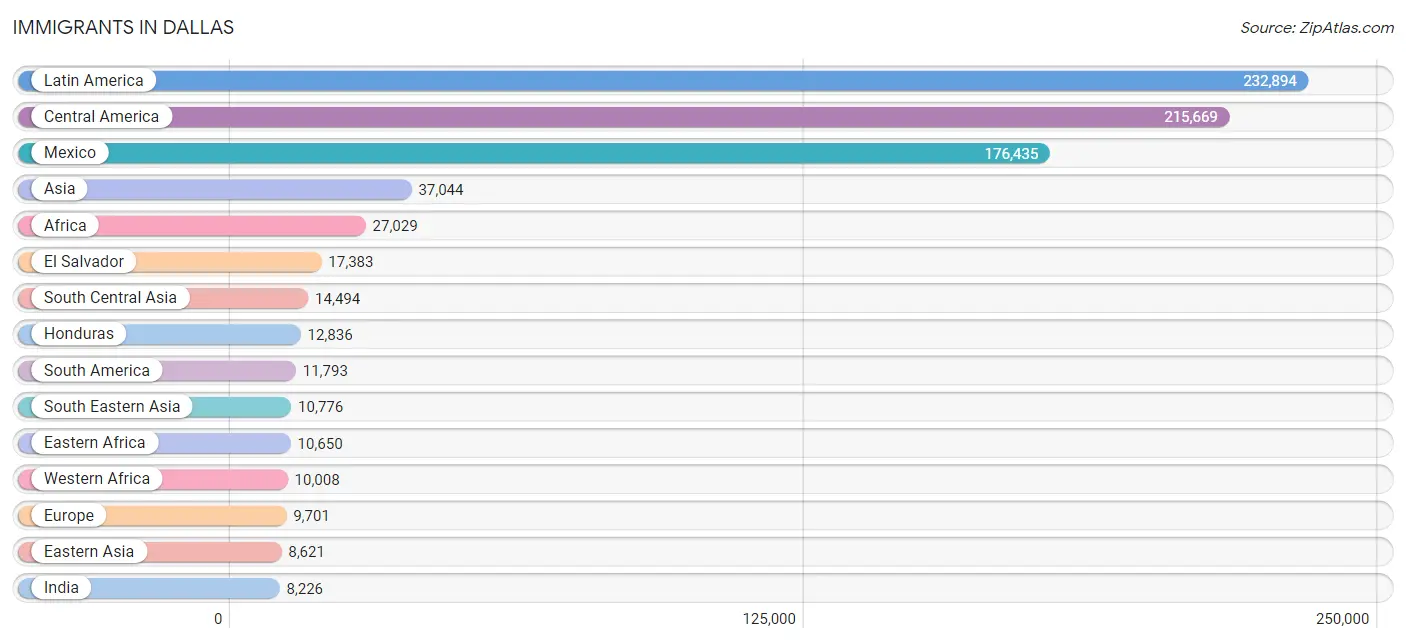
The most numerous immigrant groups reported in Dallas came from Latin America (232,894 | 17.9%), Central America (215,669 | 16.6%), Mexico (176,435 | 13.6%), Asia (37,044 | 2.9%), and Africa (27,029 | 2.1%), together accounting for 53.0% of all Dallas residents.
| Immigration Origin | # Population | % Population |
| Afghanistan | 975 | 0.1% |
| Africa | 27,029 | 2.1% |
| Albania | 233 | 0.0% |
| Argentina | 554 | 0.0% |
| Armenia | 32 | 0.0% |
| Asia | 37,044 | 2.9% |
| Australia | 254 | 0.0% |
| Austria | 20 | 0.0% |
| Azores | 37 | 0.0% |
| Bahamas | 90 | 0.0% |
| Bangladesh | 708 | 0.1% |
| Barbados | 14 | 0.0% |
| Belarus | 151 | 0.0% |
| Belgium | 54 | 0.0% |
| Belize | 72 | 0.0% |
| Bolivia | 302 | 0.0% |
| Bosnia and Herzegovina | 147 | 0.0% |
| Brazil | 1,244 | 0.1% |
| Bulgaria | 269 | 0.0% |
| Cabo Verde | 35 | 0.0% |
| Cambodia | 362 | 0.0% |
| Cameroon | 1,054 | 0.1% |
| Canada | 1,847 | 0.1% |
| Caribbean | 5,432 | 0.4% |
| Central America | 215,669 | 16.6% |
| Chile | 421 | 0.0% |
| China | 5,307 | 0.4% |
| Colombia | 1,420 | 0.1% |
| Congo | 411 | 0.0% |
| Costa Rica | 458 | 0.0% |
| Croatia | 24 | 0.0% |
| Cuba | 2,843 | 0.2% |
| Czechoslovakia | 133 | 0.0% |
| Denmark | 21 | 0.0% |
| Dominica | 67 | 0.0% |
| Dominican Republic | 650 | 0.1% |
| Eastern Africa | 10,650 | 0.8% |
| Eastern Asia | 8,621 | 0.7% |
| Eastern Europe | 3,546 | 0.3% |
| Ecuador | 405 | 0.0% |
| Egypt | 200 | 0.0% |
| El Salvador | 17,383 | 1.3% |
| England | 967 | 0.1% |
| Eritrea | 973 | 0.1% |
| Ethiopia | 5,441 | 0.4% |
| Europe | 9,701 | 0.7% |
| Fiji | 151 | 0.0% |
| France | 872 | 0.1% |
| Germany | 785 | 0.1% |
| Ghana | 490 | 0.0% |
| Greece | 216 | 0.0% |
| Guatemala | 7,078 | 0.5% |
| Guyana | 201 | 0.0% |
| Haiti | 300 | 0.0% |
| Honduras | 12,836 | 1.0% |
| Hong Kong | 204 | 0.0% |
| Hungary | 98 | 0.0% |
| India | 8,226 | 0.6% |
| Indonesia | 166 | 0.0% |
| Iran | 1,897 | 0.2% |
| Iraq | 719 | 0.1% |
| Ireland | 261 | 0.0% |
| Israel | 580 | 0.0% |
| Italy | 562 | 0.0% |
| Jamaica | 980 | 0.1% |
| Japan | 726 | 0.1% |
| Jordan | 268 | 0.0% |
| Kazakhstan | 53 | 0.0% |
| Kenya | 2,231 | 0.2% |
| Korea | 2,432 | 0.2% |
| Kuwait | 44 | 0.0% |
| Laos | 223 | 0.0% |
| Latin America | 232,894 | 17.9% |
| Latvia | 5 | 0.0% |
| Lebanon | 234 | 0.0% |
| Liberia | 1,044 | 0.1% |
| Lithuania | 9 | 0.0% |
| Malaysia | 190 | 0.0% |
| Mexico | 176,435 | 13.6% |
| Middle Africa | 2,371 | 0.2% |
| Moldova | 88 | 0.0% |
| Morocco | 339 | 0.0% |
| Nepal | 483 | 0.0% |
| Netherlands | 120 | 0.0% |
| Nicaragua | 974 | 0.1% |
| Nigeria | 6,882 | 0.5% |
| Northern Africa | 1,125 | 0.1% |
| Northern Europe | 2,470 | 0.2% |
| Norway | 42 | 0.0% |
| Oceania | 565 | 0.0% |
| Pakistan | 1,341 | 0.1% |
| Panama | 409 | 0.0% |
| Peru | 1,257 | 0.1% |
| Philippines | 2,320 | 0.2% |
| Poland | 331 | 0.0% |
| Portugal | 145 | 0.0% |
| Romania | 307 | 0.0% |
| Russia | 873 | 0.1% |
| Saudi Arabia | 207 | 0.0% |
| Scotland | 74 | 0.0% |
| Senegal | 63 | 0.0% |
| Serbia | 79 | 0.0% |
| Sierra Leone | 177 | 0.0% |
| Singapore | 105 | 0.0% |
| Somalia | 87 | 0.0% |
| South Africa | 933 | 0.1% |
| South America | 11,793 | 0.9% |
| South Central Asia | 14,494 | 1.1% |
| South Eastern Asia | 10,776 | 0.8% |
| Southern Europe | 1,700 | 0.1% |
| Spain | 777 | 0.1% |
| Sri Lanka | 486 | 0.0% |
| Sudan | 383 | 0.0% |
| Sweden | 62 | 0.0% |
| Switzerland | 134 | 0.0% |
| Syria | 124 | 0.0% |
| Taiwan | 1,056 | 0.1% |
| Thailand | 1,246 | 0.1% |
| Trinidad and Tobago | 59 | 0.0% |
| Turkey | 520 | 0.0% |
| Uganda | 92 | 0.0% |
| Ukraine | 622 | 0.1% |
| Uruguay | 46 | 0.0% |
| Uzbekistan | 37 | 0.0% |
| Venezuela | 5,603 | 0.4% |
| Vietnam | 4,482 | 0.3% |
| West Indies | 34 | 0.0% |
| Western Africa | 10,008 | 0.8% |
| Western Asia | 2,975 | 0.2% |
| Western Europe | 1,985 | 0.2% |
| Yemen | 95 | 0.0% |
| Zaire | 394 | 0.0% |
| Zimbabwe | 489 | 0.0% | View All 133 Rows |
Sex and Age in Dallas
Sex and Age in Dallas
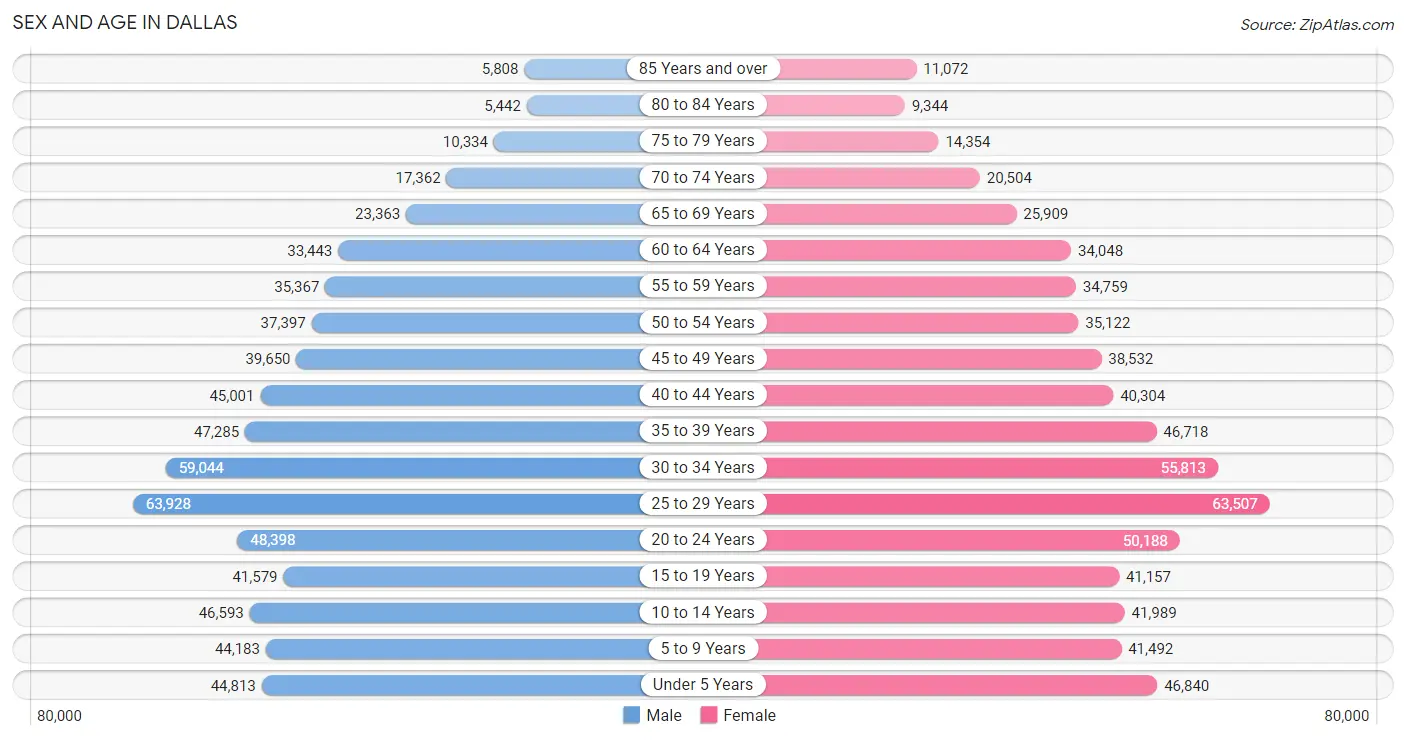
The most populous age groups in Dallas are 25 to 29 Years (63,928 | 9.9%) for men and 25 to 29 Years (63,507 | 9.8%) for women.
| Age Bracket | Male | Female |
| Under 5 Years | 44,813 (6.9%) | 46,840 (7.2%) |
| 5 to 9 Years | 44,183 (6.8%) | 41,492 (6.4%) |
| 10 to 14 Years | 46,593 (7.2%) | 41,989 (6.4%) |
| 15 to 19 Years | 41,579 (6.4%) | 41,157 (6.3%) |
| 20 to 24 Years | 48,398 (7.5%) | 50,188 (7.7%) |
| 25 to 29 Years | 63,928 (9.9%) | 63,507 (9.8%) |
| 30 to 34 Years | 59,044 (9.1%) | 55,813 (8.6%) |
| 35 to 39 Years | 47,285 (7.3%) | 46,718 (7.2%) |
| 40 to 44 Years | 45,001 (6.9%) | 40,304 (6.2%) |
| 45 to 49 Years | 39,650 (6.1%) | 38,532 (5.9%) |
| 50 to 54 Years | 37,397 (5.8%) | 35,122 (5.4%) |
| 55 to 59 Years | 35,367 (5.4%) | 34,759 (5.3%) |
| 60 to 64 Years | 33,443 (5.1%) | 34,048 (5.2%) |
| 65 to 69 Years | 23,363 (3.6%) | 25,909 (4.0%) |
| 70 to 74 Years | 17,362 (2.7%) | 20,504 (3.2%) |
| 75 to 79 Years | 10,334 (1.6%) | 14,354 (2.2%) |
| 80 to 84 Years | 5,442 (0.8%) | 9,344 (1.4%) |
| 85 Years and over | 5,808 (0.9%) | 11,072 (1.7%) |
| Total | 648,990 (100.0%) | 651,652 (100.0%) |
Families and Households in Dallas
Median Family Size in Dallas
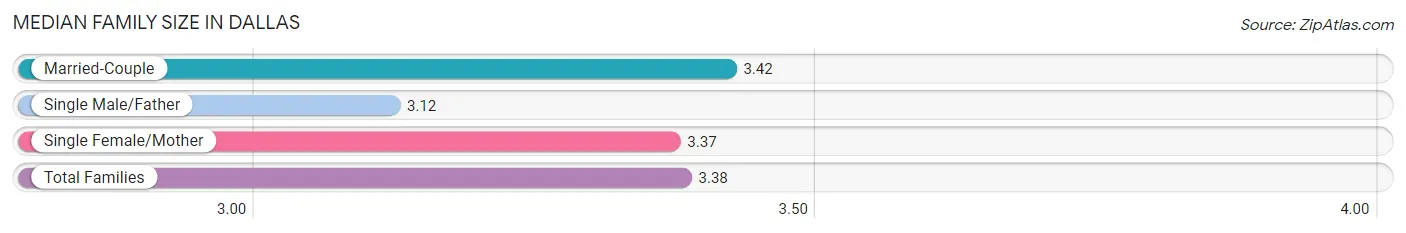
The median family size in Dallas is 3.38 persons per family, with married-couple families (184,347 | 64.4%) accounting for the largest median family size of 3.42 persons per family. On the other hand, single male/father families (27,584 | 9.6%) represent the smallest median family size with 3.12 persons per family.
| Family Type | # Families | Family Size |
| Married-Couple | 184,347 (64.4%) | 3.42 |
| Single Male/Father | 27,584 (9.6%) | 3.12 |
| Single Female/Mother | 74,113 (25.9%) | 3.37 |
| Total Families | 286,044 (100.0%) | 3.38 |
Median Household Size in Dallas
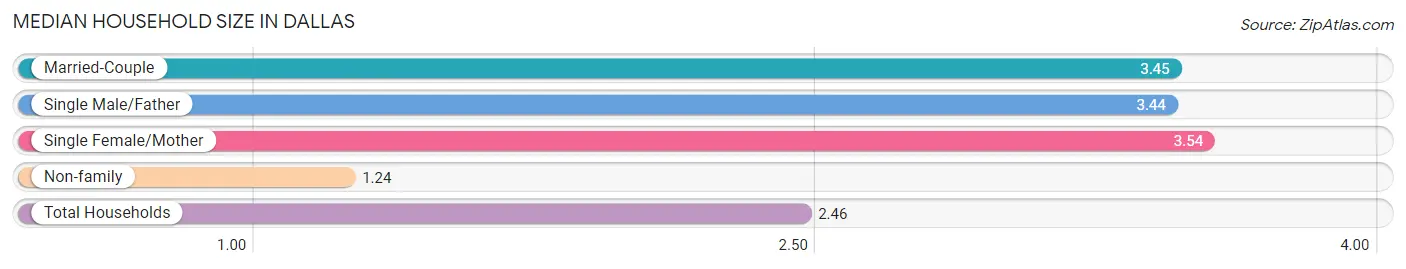
The median household size in Dallas is 2.46 persons per household, with single female/mother households (74,113 | 14.2%) accounting for the largest median household size of 3.54 persons per household. non-family households (235,103 | 45.1%) represent the smallest median household size with 1.24 persons per household.
| Household Type | # Households | Household Size |
| Married-Couple | 184,347 (35.4%) | 3.45 |
| Single Male/Father | 27,584 (5.3%) | 3.44 |
| Single Female/Mother | 74,113 (14.2%) | 3.54 |
| Non-family | 235,103 (45.1%) | 1.24 |
| Total Households | 521,147 (100.0%) | 2.46 |
Household Size by Marriage Status in Dallas
Out of a total of 521,147 households in Dallas, 286,044 (54.9%) are family households, while 235,103 (45.1%) are nonfamily households. The most numerous type of family households are 2-person households, comprising 115,603, and the most common type of nonfamily households are 1-person households, comprising 191,742.
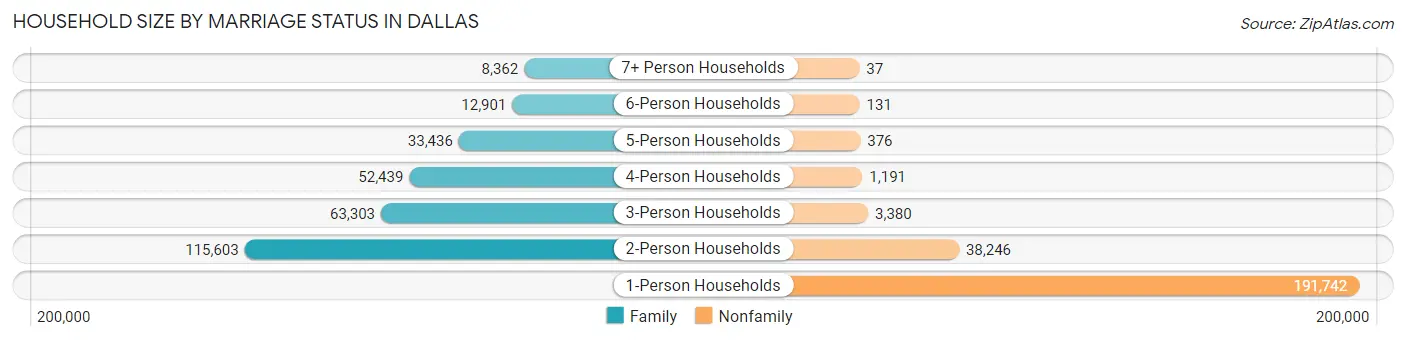
| Household Size | Family Households | Nonfamily Households |
| 1-Person Households | - | 191,742 (36.8%) |
| 2-Person Households | 115,603 (22.2%) | 38,246 (7.3%) |
| 3-Person Households | 63,303 (12.1%) | 3,380 (0.6%) |
| 4-Person Households | 52,439 (10.1%) | 1,191 (0.2%) |
| 5-Person Households | 33,436 (6.4%) | 376 (0.1%) |
| 6-Person Households | 12,901 (2.5%) | 131 (0.0%) |
| 7+ Person Households | 8,362 (1.6%) | 37 (0.0%) |
| Total | 286,044 (54.9%) | 235,103 (45.1%) |
Female Fertility in Dallas
Fertility by Age in Dallas
Average fertility rate in Dallas is 59.0 births per 1,000 women. Women in the age bracket of 20 to 34 years have the highest fertility rate with 82.0 births per 1,000 women. Women in the age bracket of 20 to 34 years acount for 68.2% of all women with births.
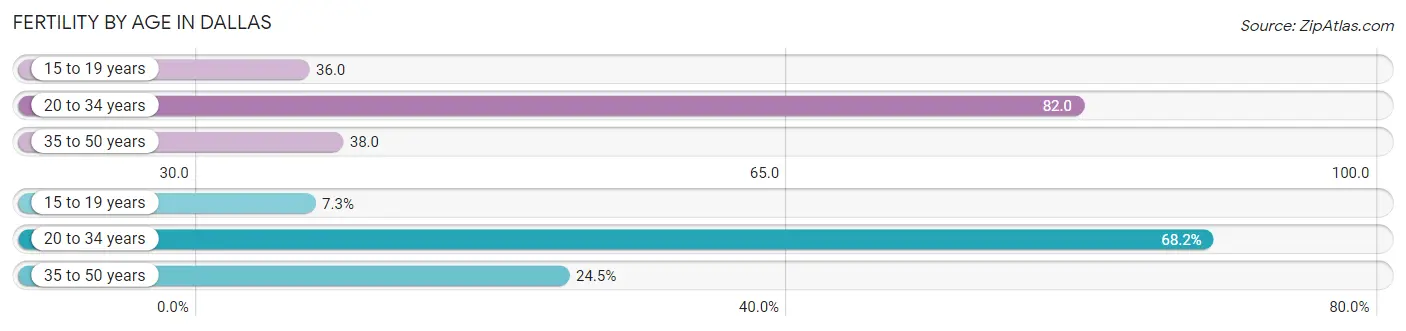
| Age Bracket | Women with Births | Births / 1,000 Women |
| 15 to 19 years | 1,486 (7.3%) | 36.0 |
| 20 to 34 years | 13,944 (68.2%) | 82.0 |
| 35 to 50 years | 5,007 (24.5%) | 38.0 |
| Total | 20,437 (100.0%) | 59.0 |
Fertility by Age by Marriage Status in Dallas
57.7% of women with births (20,437) in Dallas are married. The highest percentage of unmarried women with births falls into 15 to 19 years age bracket with 88.0% of them unmarried at the time of birth, while the lowest percentage of unmarried women with births belong to 35 to 50 years age bracket with 19.5% of them unmarried.
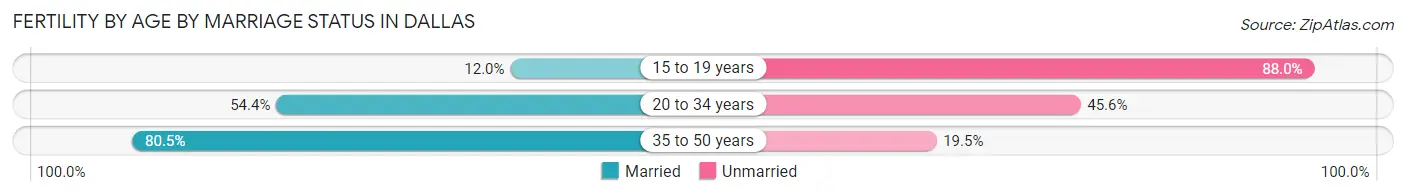
| Age Bracket | Married | Unmarried |
| 15 to 19 years | 178 (12.0%) | 1,308 (88.0%) |
| 20 to 34 years | 7,586 (54.4%) | 6,358 (45.6%) |
| 35 to 50 years | 4,031 (80.5%) | 976 (19.5%) |
| Total | 11,792 (57.7%) | 8,645 (42.3%) |
Fertility by Education in Dallas
Average fertility rate in Dallas is 59.0 births per 1,000 women. Women with the education attainment of high school diploma have the highest fertility rate of 73.0 births per 1,000 women, while women with the education attainment of bachelor's degree have the lowest fertility at 44.0 births per 1,000 women. Women with the education attainment of high school diploma represent 26.9% of all women with births.
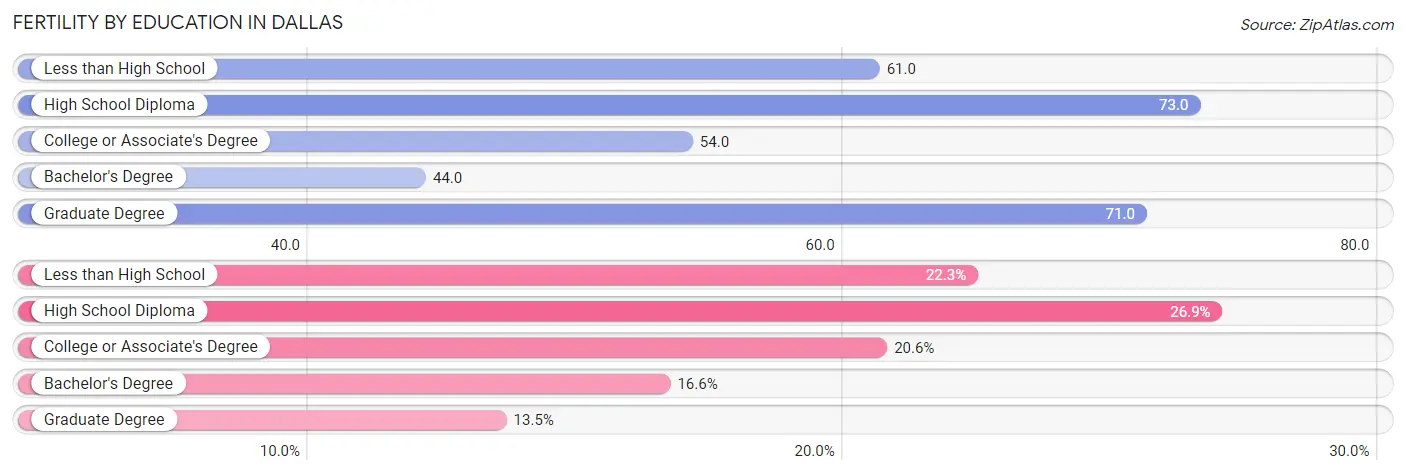
| Educational Attainment | Women with Births | Births / 1,000 Women |
| Less than High School | 4,566 (22.3%) | 61.0 |
| High School Diploma | 5,502 (26.9%) | 73.0 |
| College or Associate's Degree | 4,218 (20.6%) | 54.0 |
| Bachelor's Degree | 3,389 (16.6%) | 44.0 |
| Graduate Degree | 2,762 (13.5%) | 71.0 |
| Total | 20,437 (100.0%) | 59.0 |
Fertility by Education by Marriage Status in Dallas
42.3% of women with births in Dallas are unmarried. Women with the educational attainment of graduate degree are most likely to be married with 89.6% of them married at childbirth, while women with the educational attainment of high school diploma are least likely to be married with 57.2% of them unmarried at childbirth.
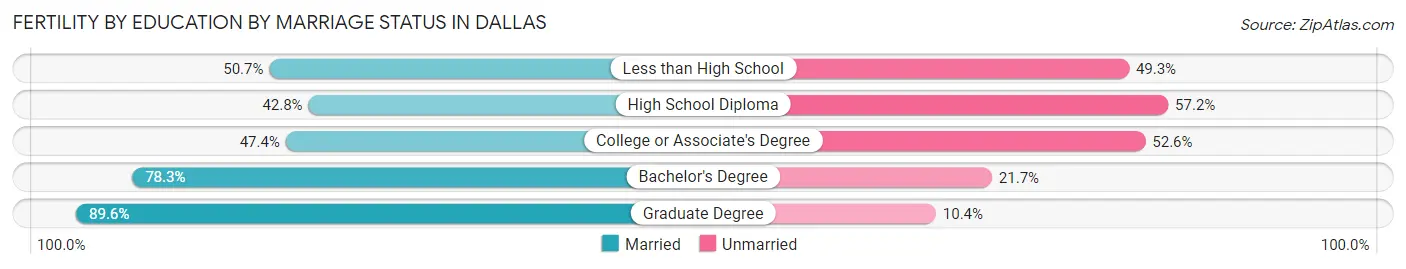
| Educational Attainment | Married | Unmarried |
| Less than High School | 2,315 (50.7%) | 2,251 (49.3%) |
| High School Diploma | 2,355 (42.8%) | 3,147 (57.2%) |
| College or Associate's Degree | 1,999 (47.4%) | 2,219 (52.6%) |
| Bachelor's Degree | 2,654 (78.3%) | 735 (21.7%) |
| Graduate Degree | 2,475 (89.6%) | 287 (10.4%) |
| Total | 11,792 (57.7%) | 8,645 (42.3%) |
Employment Characteristics in Dallas
Employment by Class of Employer in Dallas
Among the 653,525 employed individuals in Dallas, private company employees (488,749 | 74.8%), self-employed (not incorporated) (42,338 | 6.5%), and not-for-profit organizations (41,420 | 6.3%) make up the most common classes of employment.
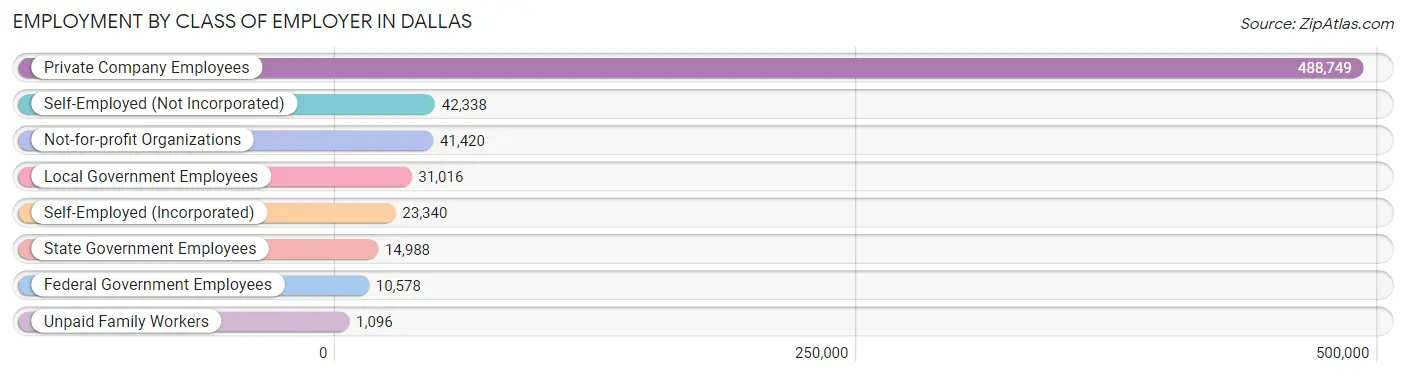
| Employer Class | # Employees | % Employees |
| Private Company Employees | 488,749 | 74.8% |
| Self-Employed (Incorporated) | 23,340 | 3.6% |
| Self-Employed (Not Incorporated) | 42,338 | 6.5% |
| Not-for-profit Organizations | 41,420 | 6.3% |
| Local Government Employees | 31,016 | 4.8% |
| State Government Employees | 14,988 | 2.3% |
| Federal Government Employees | 10,578 | 1.6% |
| Unpaid Family Workers | 1,096 | 0.2% |
| Total | 653,525 | 100.0% |
Employment Status by Age in Dallas
According to the labor force statistics for Dallas, out of the total population over 16 years of age (1,017,931), 68.6% or 698,301 individuals are in the labor force, with 5.0% or 34,915 of them unemployed. The age group with the highest labor force participation rate is 25 to 29 years, with 86.4% or 110,104 individuals in the labor force. Within the labor force, the 16 to 19 years age range has the highest percentage of unemployed individuals, with 14.9% or 3,242 of them being unemployed.
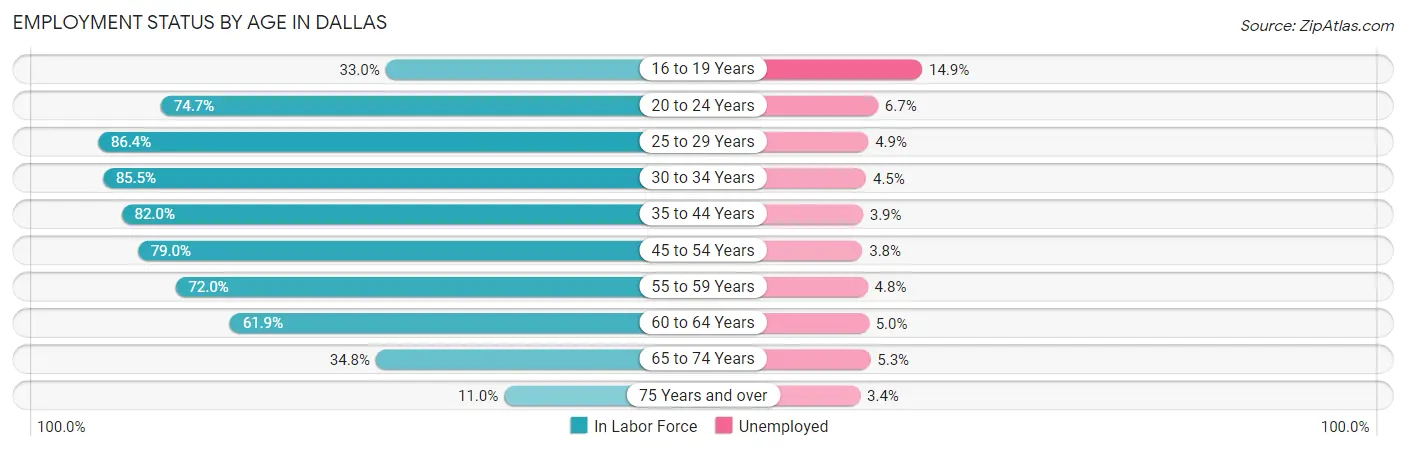
| Age Bracket | In Labor Force | Unemployed |
| 16 to 19 Years | 21,759 (33.0%) | 3,242 (14.9%) |
| 20 to 24 Years | 73,644 (74.7%) | 4,934 (6.7%) |
| 25 to 29 Years | 110,104 (86.4%) | 5,395 (4.9%) |
| 30 to 34 Years | 98,203 (85.5%) | 4,419 (4.5%) |
| 35 to 44 Years | 147,033 (82.0%) | 5,734 (3.9%) |
| 45 to 54 Years | 119,054 (79.0%) | 4,524 (3.8%) |
| 55 to 59 Years | 50,491 (72.0%) | 2,424 (4.8%) |
| 60 to 64 Years | 41,777 (61.9%) | 2,089 (5.0%) |
| 65 to 74 Years | 30,324 (34.8%) | 1,607 (5.3%) |
| 75 Years and over | 6,199 (11.0%) | 211 (3.4%) |
| Total | 698,301 (68.6%) | 34,915 (5.0%) |
Employment Status by Educational Attainment in Dallas
According to labor force statistics for Dallas, 79.8% of individuals (566,515) out of the total population between 25 and 64 years of age (709,918) are in the labor force, with 4.3% or 24,360 of them being unemployed. The group with the highest labor force participation rate are those with the educational attainment of bachelor's degree or higher, with 88.8% or 232,138 individuals in the labor force. Within the labor force, individuals with high school diploma education have the highest percentage of unemployment, with 5.8% or 6,560 of them being unemployed.
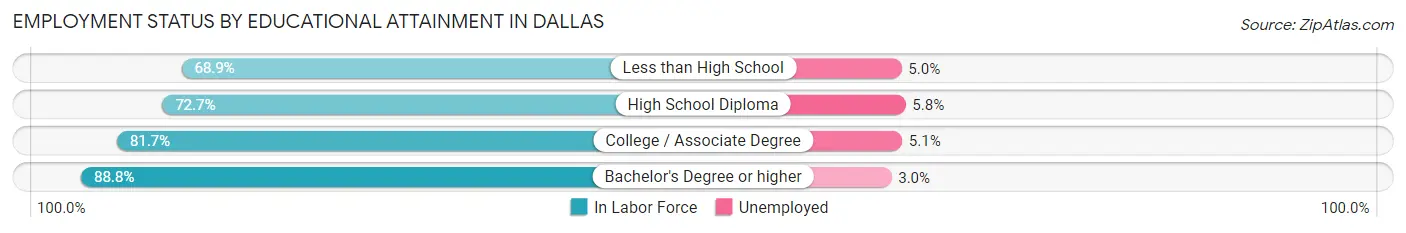
| Educational Attainment | In Labor Force | Unemployed |
| Less than High School | 96,299 (68.9%) | 6,988 (5.0%) |
| High School Diploma | 113,102 (72.7%) | 9,023 (5.8%) |
| College / Associate Degree | 125,133 (81.7%) | 7,811 (5.1%) |
| Bachelor's Degree or higher | 232,138 (88.8%) | 7,843 (3.0%) |
| Total | 566,515 (79.8%) | 30,526 (4.3%) |
Employment Occupations by Sex in Dallas
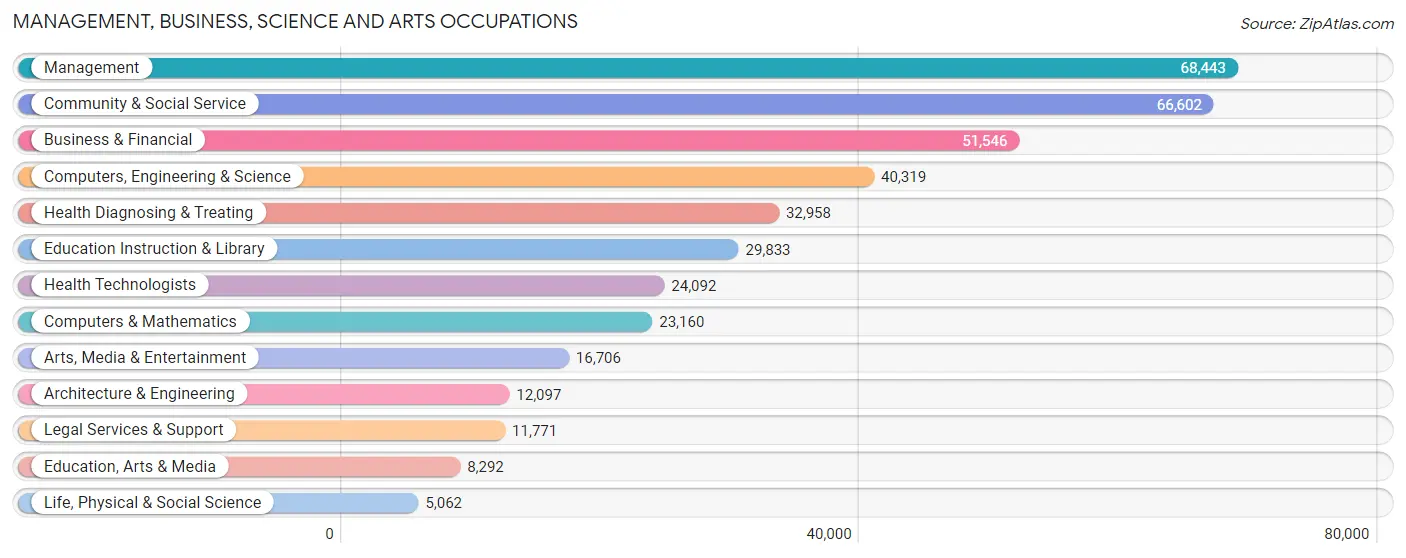
Management, Business, Science and Arts Occupations
The most common Management, Business, Science and Arts occupations in Dallas are Management (68,443 | 10.3%), Community & Social Service (66,602 | 10.0%), Business & Financial (51,546 | 7.8%), Computers, Engineering & Science (40,319 | 6.1%), and Health Diagnosing & Treating (32,958 | 5.0%).
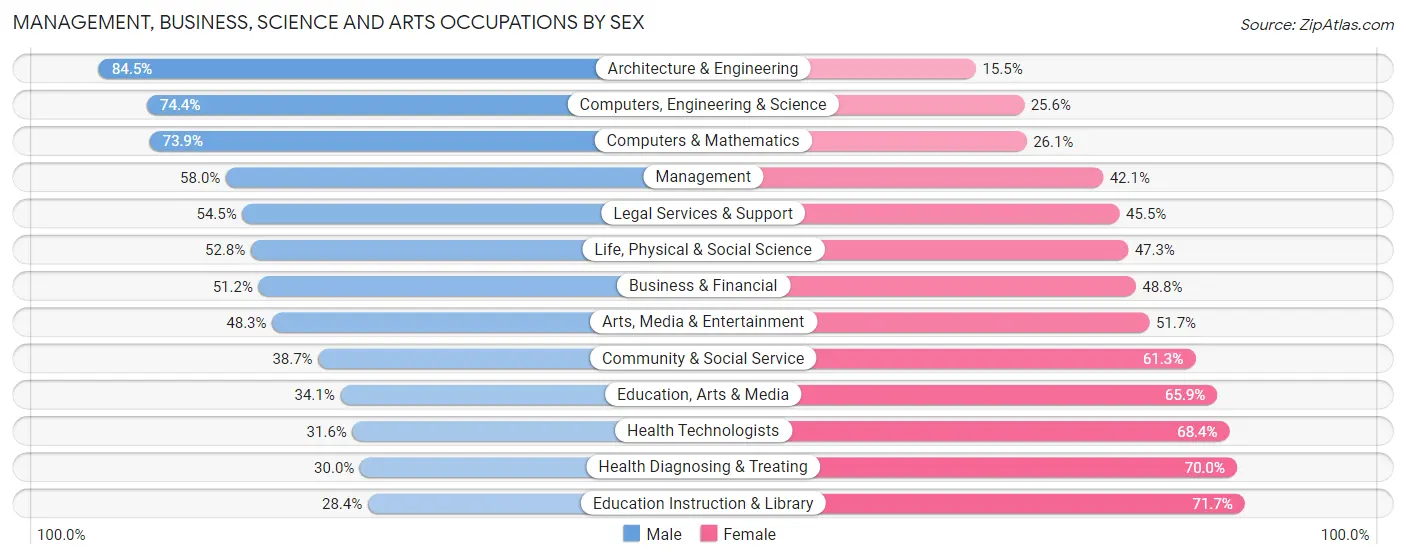
Management, Business, Science and Arts Occupations by Sex
Within the Management, Business, Science and Arts occupations in Dallas, the most male-oriented occupations are Architecture & Engineering (84.5%), Computers, Engineering & Science (74.4%), and Computers & Mathematics (73.9%), while the most female-oriented occupations are Education Instruction & Library (71.7%), Health Diagnosing & Treating (70.0%), and Health Technologists (68.4%).
| Occupation | Male | Female |
| Management | 39,664 (58.0%) | 28,779 (42.0%) |
| Business & Financial | 26,371 (51.2%) | 25,175 (48.8%) |
| Computers, Engineering & Science | 30,010 (74.4%) | 10,309 (25.6%) |
| Computers & Mathematics | 17,119 (73.9%) | 6,041 (26.1%) |
| Architecture & Engineering | 10,221 (84.5%) | 1,876 (15.5%) |
| Life, Physical & Social Science | 2,670 (52.7%) | 2,392 (47.2%) |
| Community & Social Service | 25,773 (38.7%) | 40,829 (61.3%) |
| Education, Arts & Media | 2,827 (34.1%) | 5,465 (65.9%) |
| Legal Services & Support | 6,419 (54.5%) | 5,352 (45.5%) |
| Education Instruction & Library | 8,457 (28.3%) | 21,376 (71.7%) |
| Arts, Media & Entertainment | 8,070 (48.3%) | 8,636 (51.7%) |
| Health Diagnosing & Treating | 9,889 (30.0%) | 23,069 (70.0%) |
| Health Technologists | 7,603 (31.6%) | 16,489 (68.4%) |
| Total (Category) | 131,707 (50.7%) | 128,161 (49.3%) |
| Total (Overall) | 362,702 (54.7%) | 300,638 (45.3%) |
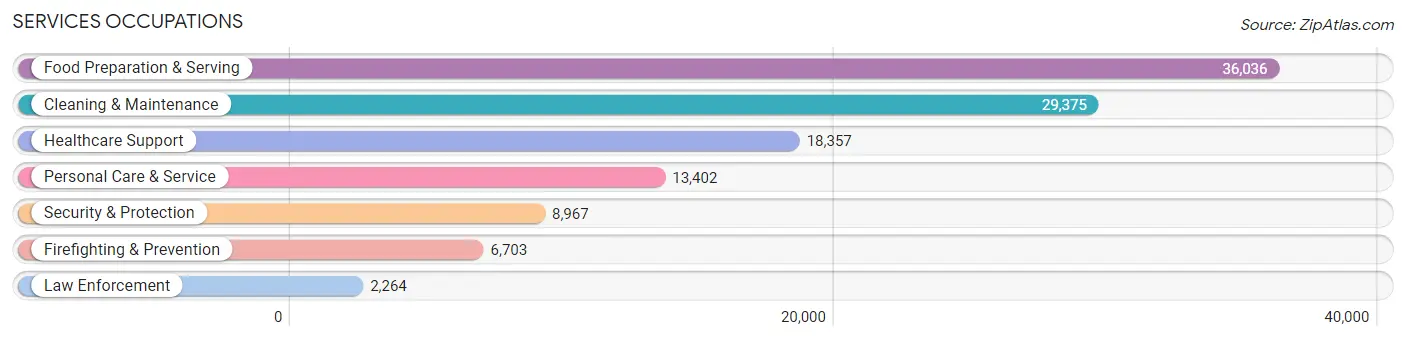
Services Occupations
The most common Services occupations in Dallas are Food Preparation & Serving (36,036 | 5.4%), Cleaning & Maintenance (29,375 | 4.4%), Healthcare Support (18,357 | 2.8%), Personal Care & Service (13,402 | 2.0%), and Security & Protection (8,967 | 1.3%).
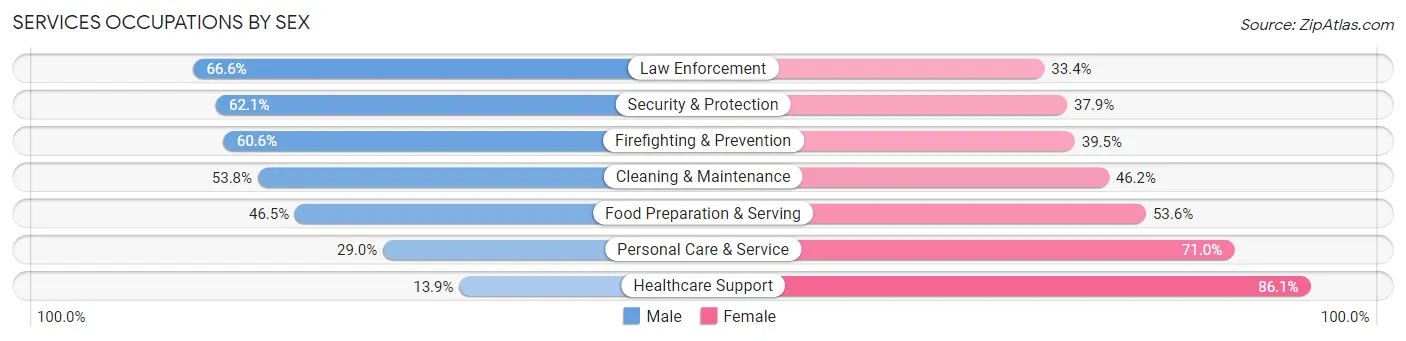
Services Occupations by Sex
Within the Services occupations in Dallas, the most male-oriented occupations are Law Enforcement (66.6%), Security & Protection (62.1%), and Firefighting & Prevention (60.6%), while the most female-oriented occupations are Healthcare Support (86.1%), Personal Care & Service (71.0%), and Food Preparation & Serving (53.5%).
| Occupation | Male | Female |
| Healthcare Support | 2,556 (13.9%) | 15,801 (86.1%) |
| Security & Protection | 5,566 (62.1%) | 3,401 (37.9%) |
| Firefighting & Prevention | 4,059 (60.6%) | 2,644 (39.5%) |
| Law Enforcement | 1,507 (66.6%) | 757 (33.4%) |
| Food Preparation & Serving | 16,739 (46.5%) | 19,297 (53.5%) |
| Cleaning & Maintenance | 15,807 (53.8%) | 13,568 (46.2%) |
| Personal Care & Service | 3,888 (29.0%) | 9,514 (71.0%) |
| Total (Category) | 44,556 (42.0%) | 61,581 (58.0%) |
| Total (Overall) | 362,702 (54.7%) | 300,638 (45.3%) |
Sales and Office Occupations
The most common Sales and Office occupations in Dallas are Office & Administration (70,904 | 10.7%), and Sales & Related (66,420 | 10.0%).

Sales and Office Occupations by Sex

| Occupation | Male | Female |
| Sales & Related | 33,410 (50.3%) | 33,010 (49.7%) |
| Office & Administration | 20,713 (29.2%) | 50,191 (70.8%) |
| Total (Category) | 54,123 (39.4%) | 83,201 (60.6%) |
| Total (Overall) | 362,702 (54.7%) | 300,638 (45.3%) |
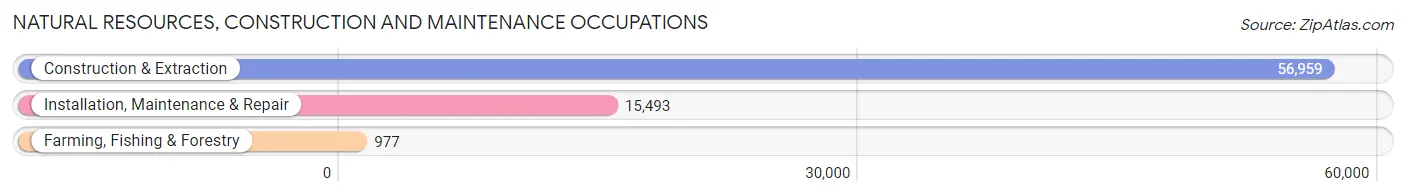
Natural Resources, Construction and Maintenance Occupations
The most common Natural Resources, Construction and Maintenance occupations in Dallas are Construction & Extraction (56,959 | 8.6%), Installation, Maintenance & Repair (15,493 | 2.3%), and Farming, Fishing & Forestry (977 | 0.2%).
Natural Resources, Construction and Maintenance Occupations by Sex
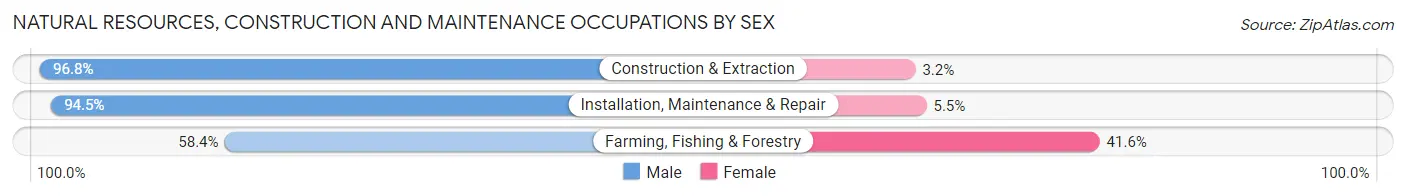
| Occupation | Male | Female |
| Farming, Fishing & Forestry | 571 (58.4%) | 406 (41.6%) |
| Construction & Extraction | 55,113 (96.8%) | 1,846 (3.2%) |
| Installation, Maintenance & Repair | 14,635 (94.5%) | 858 (5.5%) |
| Total (Category) | 70,319 (95.8%) | 3,110 (4.2%) |
| Total (Overall) | 362,702 (54.7%) | 300,638 (45.3%) |
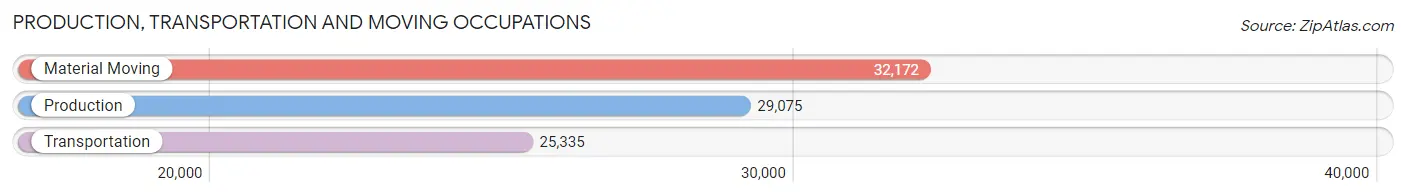
Production, Transportation and Moving Occupations
The most common Production, Transportation and Moving occupations in Dallas are Material Moving (32,172 | 4.9%), Production (29,075 | 4.4%), and Transportation (25,335 | 3.8%).
Production, Transportation and Moving Occupations by Sex
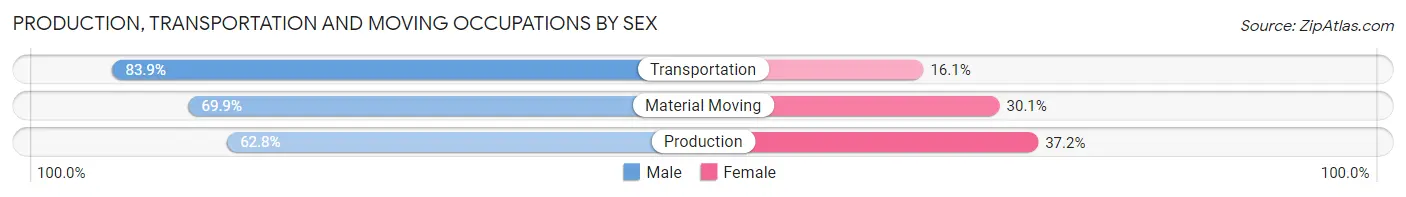
| Occupation | Male | Female |
| Production | 18,263 (62.8%) | 10,812 (37.2%) |
| Transportation | 21,245 (83.9%) | 4,090 (16.1%) |
| Material Moving | 22,489 (69.9%) | 9,683 (30.1%) |
| Total (Category) | 61,997 (71.6%) | 24,585 (28.4%) |
| Total (Overall) | 362,702 (54.7%) | 300,638 (45.3%) |
Employment Industries by Sex in Dallas
Employment Industries in Dallas
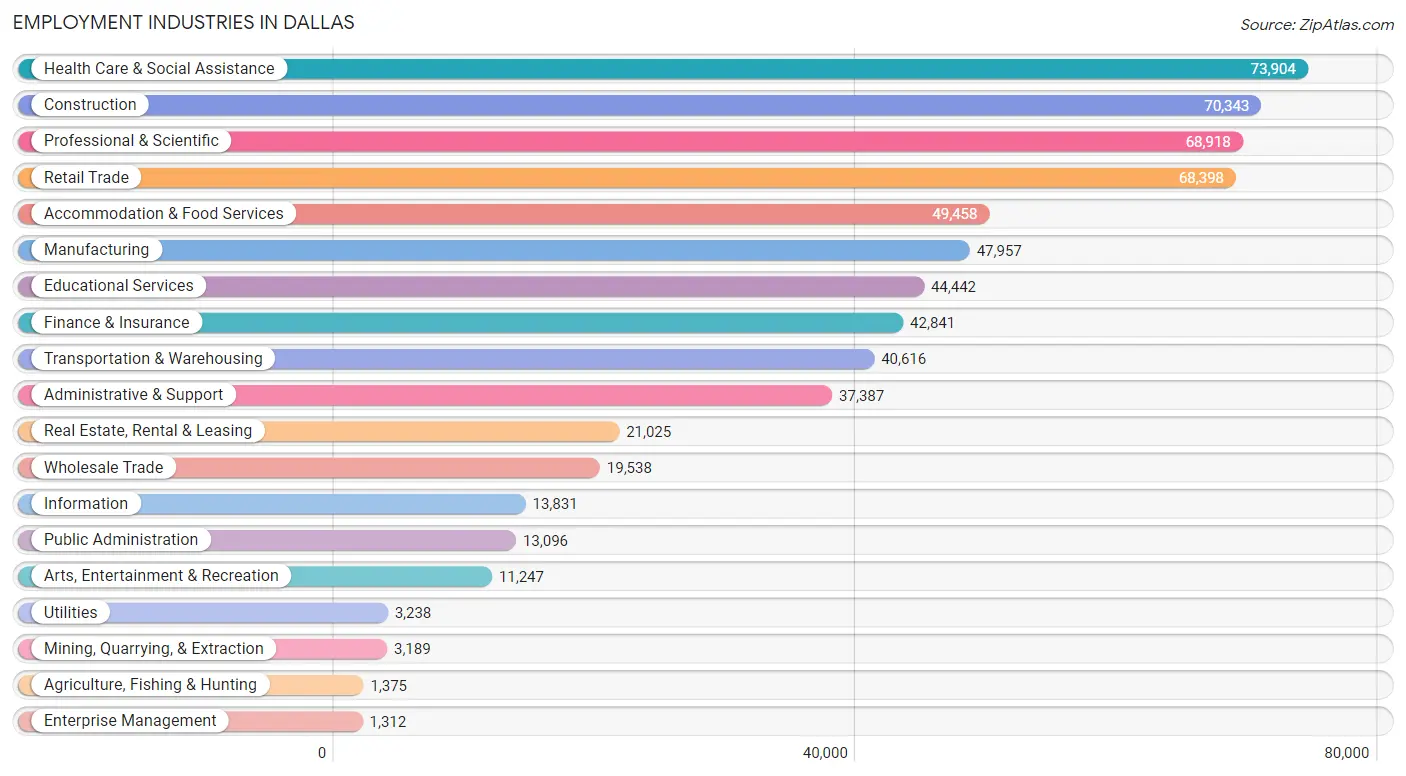
The major employment industries in Dallas include Health Care & Social Assistance (73,904 | 11.1%), Construction (70,343 | 10.6%), Professional & Scientific (68,918 | 10.4%), Retail Trade (68,398 | 10.3%), and Accommodation & Food Services (49,458 | 7.5%).
Employment Industries by Sex in Dallas
The Dallas industries that see more men than women are Construction (92.5%), Mining, Quarrying, & Extraction (78.6%), and Transportation & Warehousing (72.9%), whereas the industries that tend to have a higher number of women are Health Care & Social Assistance (74.6%), Educational Services (68.7%), and Enterprise Management (65.0%).
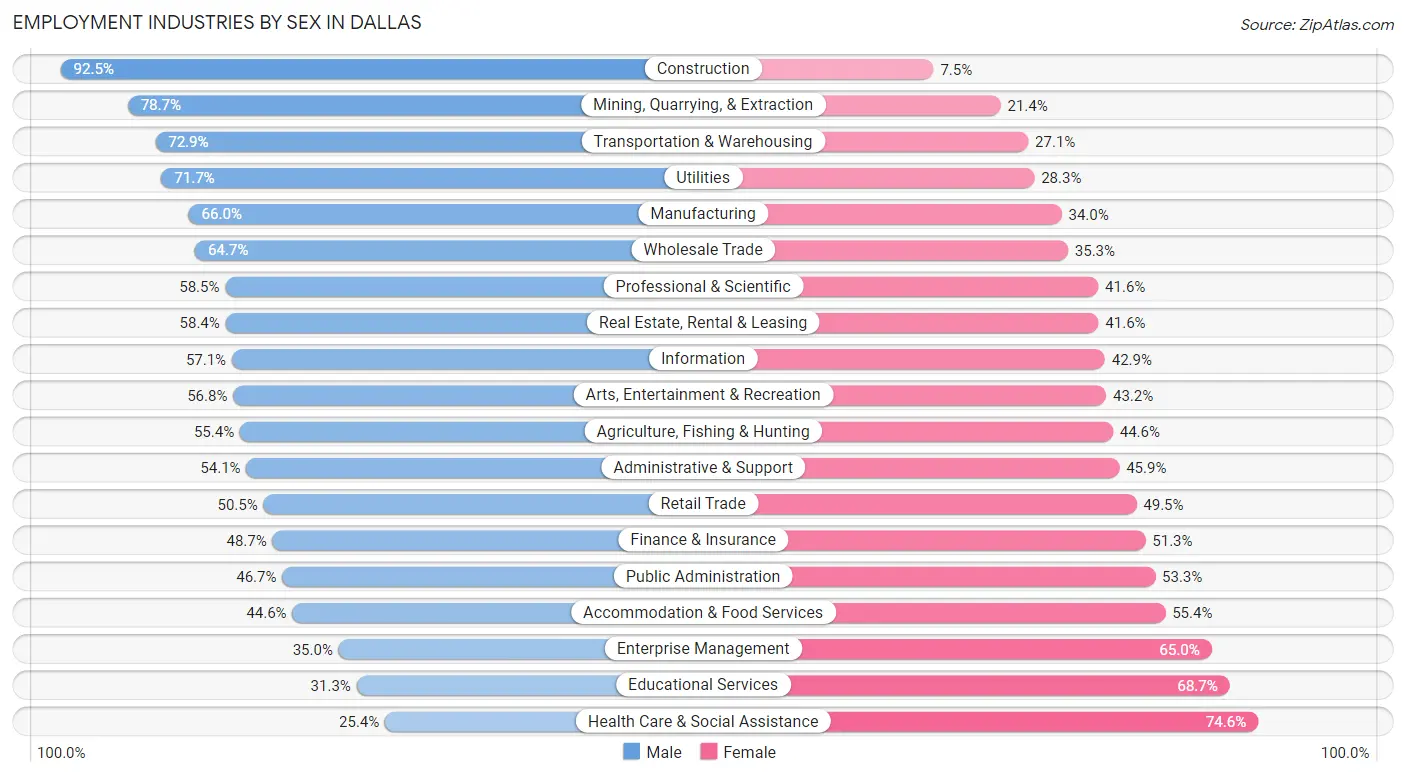
| Industry | Male | Female |
| Agriculture, Fishing & Hunting | 762 (55.4%) | 613 (44.6%) |
| Mining, Quarrying, & Extraction | 2,508 (78.6%) | 681 (21.3%) |
| Construction | 65,091 (92.5%) | 5,252 (7.5%) |
| Manufacturing | 31,664 (66.0%) | 16,293 (34.0%) |
| Wholesale Trade | 12,645 (64.7%) | 6,893 (35.3%) |
| Retail Trade | 34,566 (50.5%) | 33,832 (49.5%) |
| Transportation & Warehousing | 29,625 (72.9%) | 10,991 (27.1%) |
| Utilities | 2,321 (71.7%) | 917 (28.3%) |
| Information | 7,895 (57.1%) | 5,936 (42.9%) |
| Finance & Insurance | 20,854 (48.7%) | 21,987 (51.3%) |
| Real Estate, Rental & Leasing | 12,278 (58.4%) | 8,747 (41.6%) |
| Professional & Scientific | 40,285 (58.5%) | 28,633 (41.5%) |
| Enterprise Management | 459 (35.0%) | 853 (65.0%) |
| Administrative & Support | 20,224 (54.1%) | 17,163 (45.9%) |
| Educational Services | 13,897 (31.3%) | 30,545 (68.7%) |
| Health Care & Social Assistance | 18,759 (25.4%) | 55,145 (74.6%) |
| Arts, Entertainment & Recreation | 6,391 (56.8%) | 4,856 (43.2%) |
| Accommodation & Food Services | 22,045 (44.6%) | 27,413 (55.4%) |
| Public Administration | 6,111 (46.7%) | 6,985 (53.3%) |
| Total | 362,702 (54.7%) | 300,638 (45.3%) |
Education in Dallas
School Enrollment in Dallas
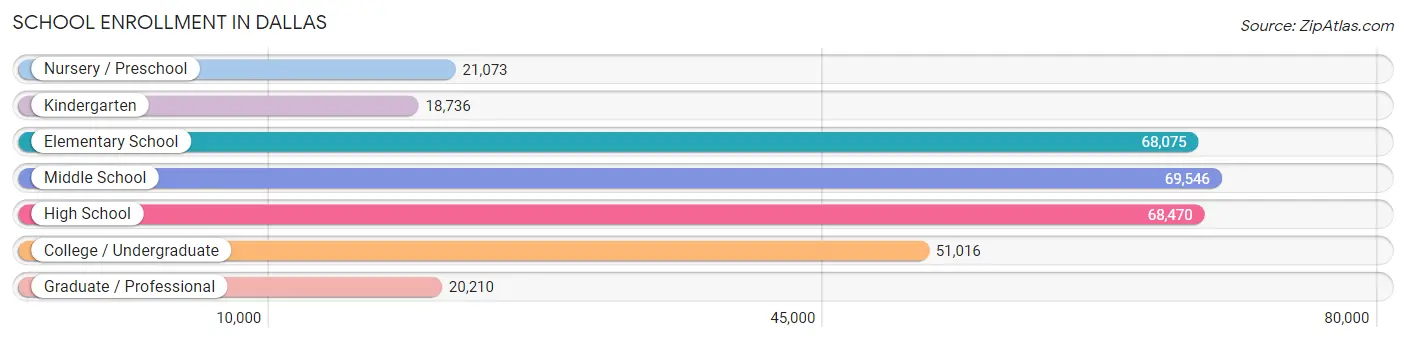
The most common levels of schooling among the 317,126 students in Dallas are middle school (69,546 | 21.9%), high school (68,470 | 21.6%), and elementary school (68,075 | 21.5%).
| School Level | # Students | % Students |
| Nursery / Preschool | 21,073 | 6.6% |
| Kindergarten | 18,736 | 5.9% |
| Elementary School | 68,075 | 21.5% |
| Middle School | 69,546 | 21.9% |
| High School | 68,470 | 21.6% |
| College / Undergraduate | 51,016 | 16.1% |
| Graduate / Professional | 20,210 | 6.4% |
| Total | 317,126 | 100.0% |
School Enrollment by Age by Funding Source in Dallas
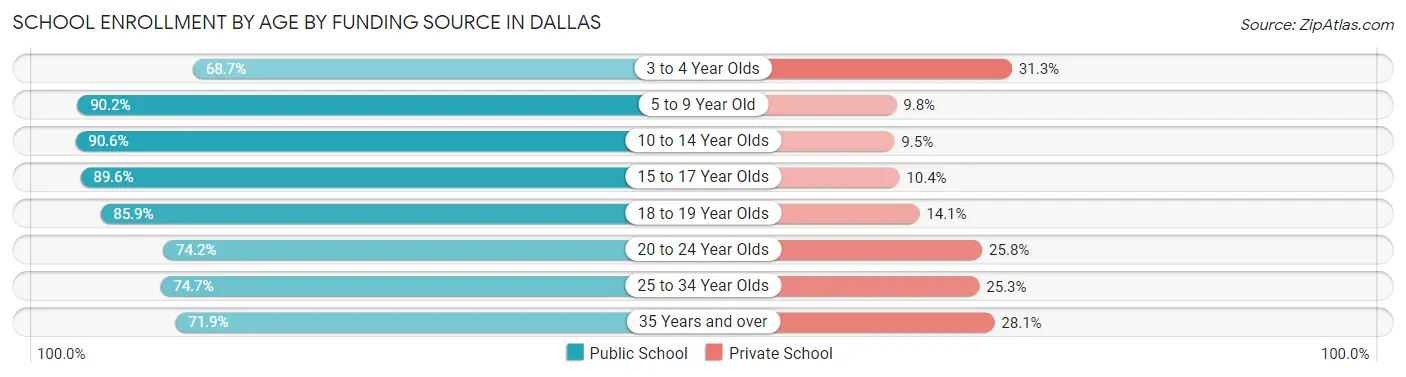
Out of a total of 317,126 students who are enrolled in schools in Dallas, 45,983 (14.5%) attend a private institution, while the remaining 271,143 (85.5%) are enrolled in public schools. The age group of 3 to 4 year olds has the highest likelihood of being enrolled in private schools, with 5,317 (31.3% in the age bracket) enrolled. Conversely, the age group of 10 to 14 year olds has the lowest likelihood of being enrolled in a private school, with 78,044 (90.5% in the age bracket) attending a public institution.
| Age Bracket | Public School | Private School |
| 3 to 4 Year Olds | 11,650 (68.7%) | 5,317 (31.3%) |
| 5 to 9 Year Old | 73,692 (90.2%) | 8,019 (9.8%) |
| 10 to 14 Year Olds | 78,044 (90.5%) | 8,142 (9.5%) |
| 15 to 17 Year Olds | 43,108 (89.6%) | 4,995 (10.4%) |
| 18 to 19 Year Olds | 17,277 (85.9%) | 2,837 (14.1%) |
| 20 to 24 Year Olds | 20,128 (74.2%) | 6,995 (25.8%) |
| 25 to 34 Year Olds | 17,201 (74.7%) | 5,821 (25.3%) |
| 35 Years and over | 9,997 (71.9%) | 3,903 (28.1%) |
| Total | 271,143 (85.5%) | 45,983 (14.5%) |
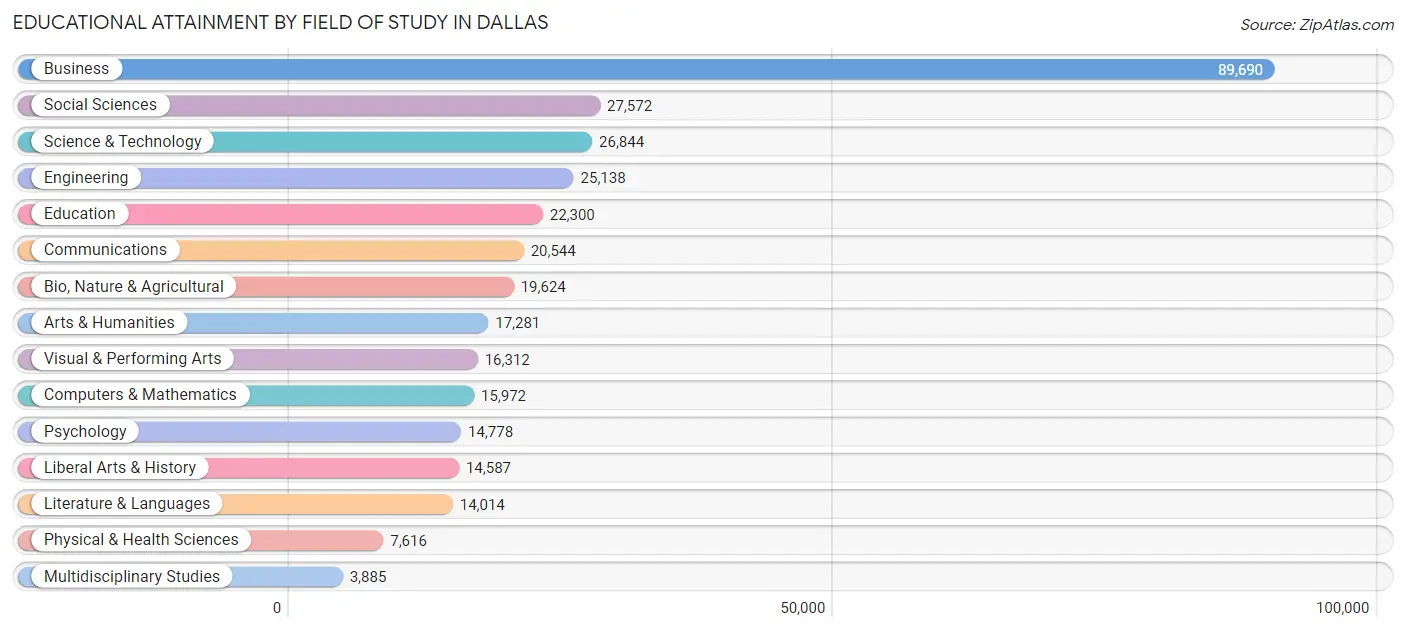
Educational Attainment by Field of Study in Dallas
Business (89,690 | 26.7%), social sciences (27,572 | 8.2%), science & technology (26,844 | 8.0%), engineering (25,138 | 7.5%), and education (22,300 | 6.6%) are the most common fields of study among 336,157 individuals in Dallas who have obtained a bachelor's degree or higher.
| Field of Study | # Graduates | % Graduates |
| Computers & Mathematics | 15,972 | 4.8% |
| Bio, Nature & Agricultural | 19,624 | 5.8% |
| Physical & Health Sciences | 7,616 | 2.3% |
| Psychology | 14,778 | 4.4% |
| Social Sciences | 27,572 | 8.2% |
| Engineering | 25,138 | 7.5% |
| Multidisciplinary Studies | 3,885 | 1.2% |
| Science & Technology | 26,844 | 8.0% |
| Business | 89,690 | 26.7% |
| Education | 22,300 | 6.6% |
| Literature & Languages | 14,014 | 4.2% |
| Liberal Arts & History | 14,587 | 4.3% |
| Visual & Performing Arts | 16,312 | 4.9% |
| Communications | 20,544 | 6.1% |
| Arts & Humanities | 17,281 | 5.1% |
| Total | 336,157 | 100.0% |
Transportation & Commute in Dallas
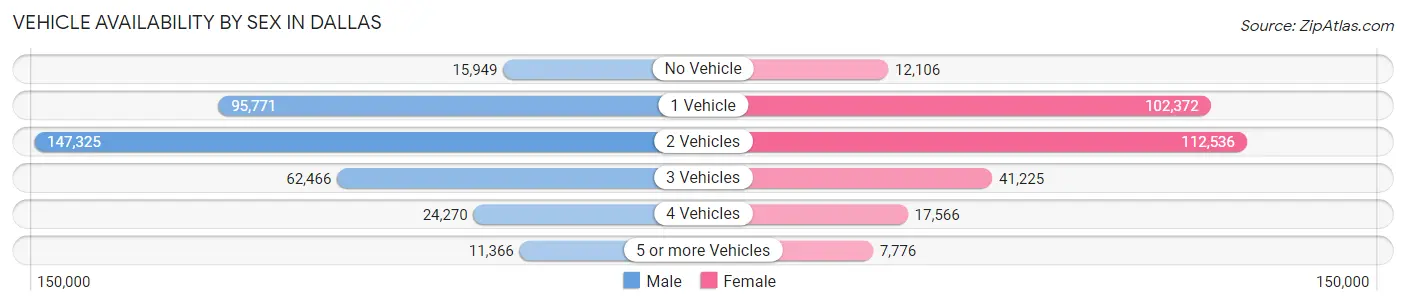
Vehicle Availability by Sex in Dallas
The most prevalent vehicle ownership categories in Dallas are males with 2 vehicles (147,325, accounting for 41.2%) and females with 2 vehicles (112,536, making up 50.2%).
| Vehicles Available | Male | Female |
| No Vehicle | 15,949 (4.5%) | 12,106 (4.1%) |
| 1 Vehicle | 95,771 (26.8%) | 102,372 (34.9%) |
| 2 Vehicles | 147,325 (41.2%) | 112,536 (38.3%) |
| 3 Vehicles | 62,466 (17.5%) | 41,225 (14.0%) |
| 4 Vehicles | 24,270 (6.8%) | 17,566 (6.0%) |
| 5 or more Vehicles | 11,366 (3.2%) | 7,776 (2.6%) |
| Total | 357,147 (100.0%) | 293,581 (100.0%) |
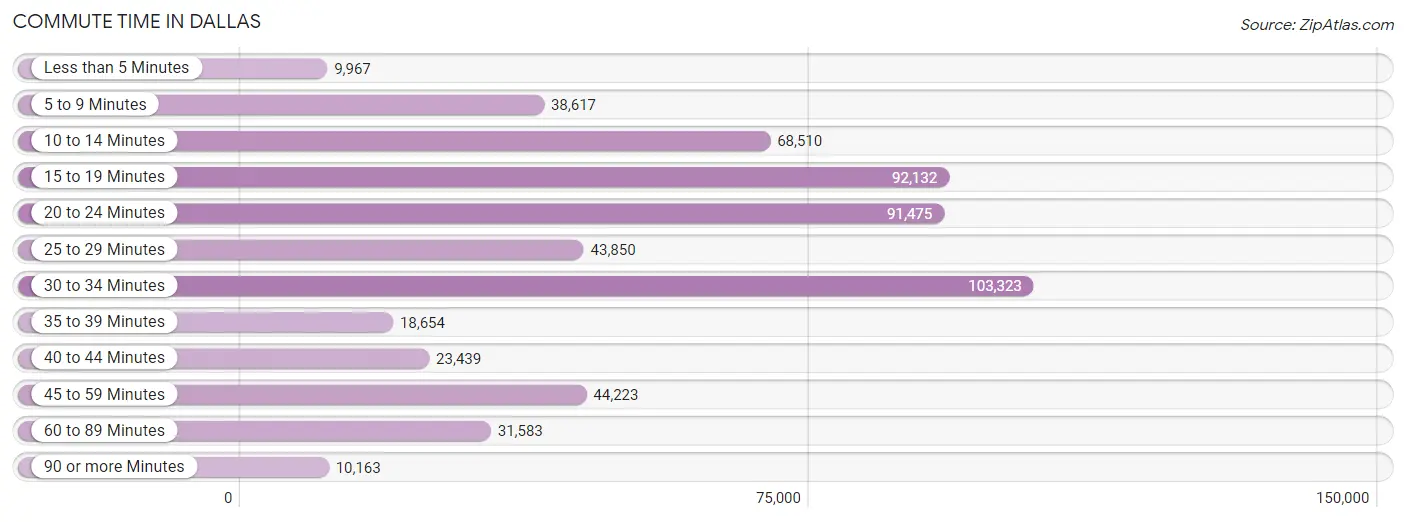
Commute Time in Dallas
The most frequently occuring commute durations in Dallas are 30 to 34 minutes (103,323 commuters, 17.9%), 15 to 19 minutes (92,132 commuters, 16.0%), and 20 to 24 minutes (91,475 commuters, 15.9%).
| Commute Time | # Commuters | % Commuters |
| Less than 5 Minutes | 9,967 | 1.7% |
| 5 to 9 Minutes | 38,617 | 6.7% |
| 10 to 14 Minutes | 68,510 | 11.9% |
| 15 to 19 Minutes | 92,132 | 16.0% |
| 20 to 24 Minutes | 91,475 | 15.9% |
| 25 to 29 Minutes | 43,850 | 7.6% |
| 30 to 34 Minutes | 103,323 | 17.9% |
| 35 to 39 Minutes | 18,654 | 3.2% |
| 40 to 44 Minutes | 23,439 | 4.1% |
| 45 to 59 Minutes | 44,223 | 7.7% |
| 60 to 89 Minutes | 31,583 | 5.5% |
| 90 or more Minutes | 10,163 | 1.8% |
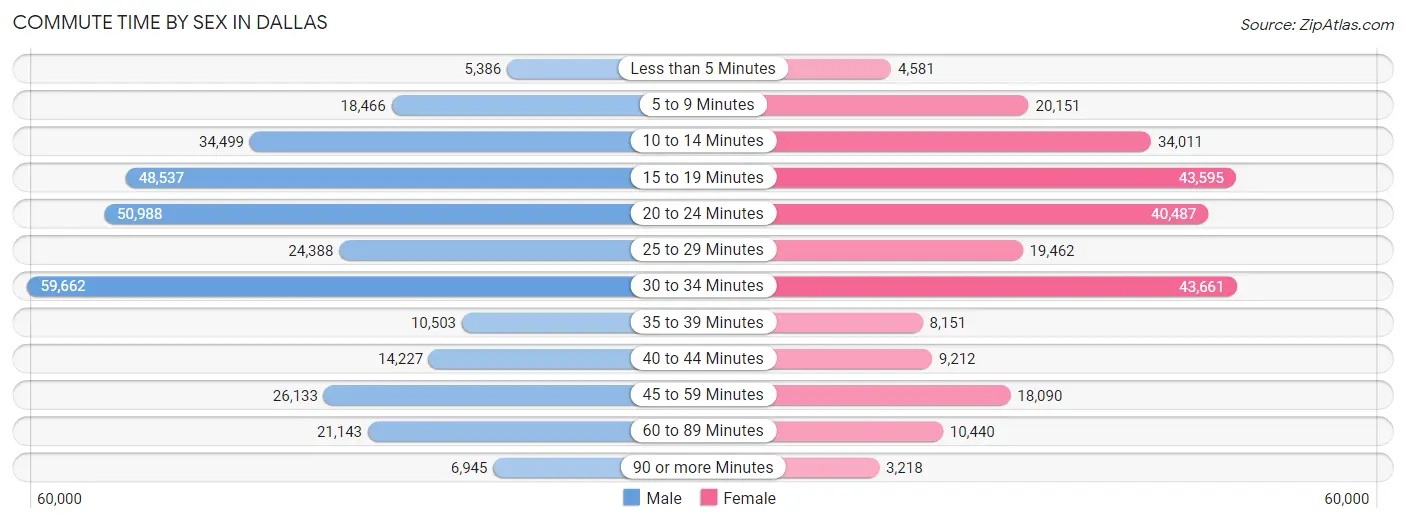
Commute Time by Sex in Dallas
The most common commute times in Dallas are 30 to 34 minutes (59,662 commuters, 18.6%) for males and 30 to 34 minutes (43,661 commuters, 17.1%) for females.
| Commute Time | Male | Female |
| Less than 5 Minutes | 5,386 (1.7%) | 4,581 (1.8%) |
| 5 to 9 Minutes | 18,466 (5.8%) | 20,151 (7.9%) |
| 10 to 14 Minutes | 34,499 (10.7%) | 34,011 (13.3%) |
| 15 to 19 Minutes | 48,537 (15.1%) | 43,595 (17.1%) |
| 20 to 24 Minutes | 50,988 (15.9%) | 40,487 (15.9%) |
| 25 to 29 Minutes | 24,388 (7.6%) | 19,462 (7.6%) |
| 30 to 34 Minutes | 59,662 (18.6%) | 43,661 (17.1%) |
| 35 to 39 Minutes | 10,503 (3.3%) | 8,151 (3.2%) |
| 40 to 44 Minutes | 14,227 (4.4%) | 9,212 (3.6%) |
| 45 to 59 Minutes | 26,133 (8.1%) | 18,090 (7.1%) |
| 60 to 89 Minutes | 21,143 (6.6%) | 10,440 (4.1%) |
| 90 or more Minutes | 6,945 (2.2%) | 3,218 (1.3%) |
Time of Departure to Work by Sex in Dallas
The most frequent times of departure to work in Dallas are 7:00 AM to 7:29 AM (44,118, 13.8%) for males and 8:00 AM to 8:29 AM (36,138, 14.2%) for females.
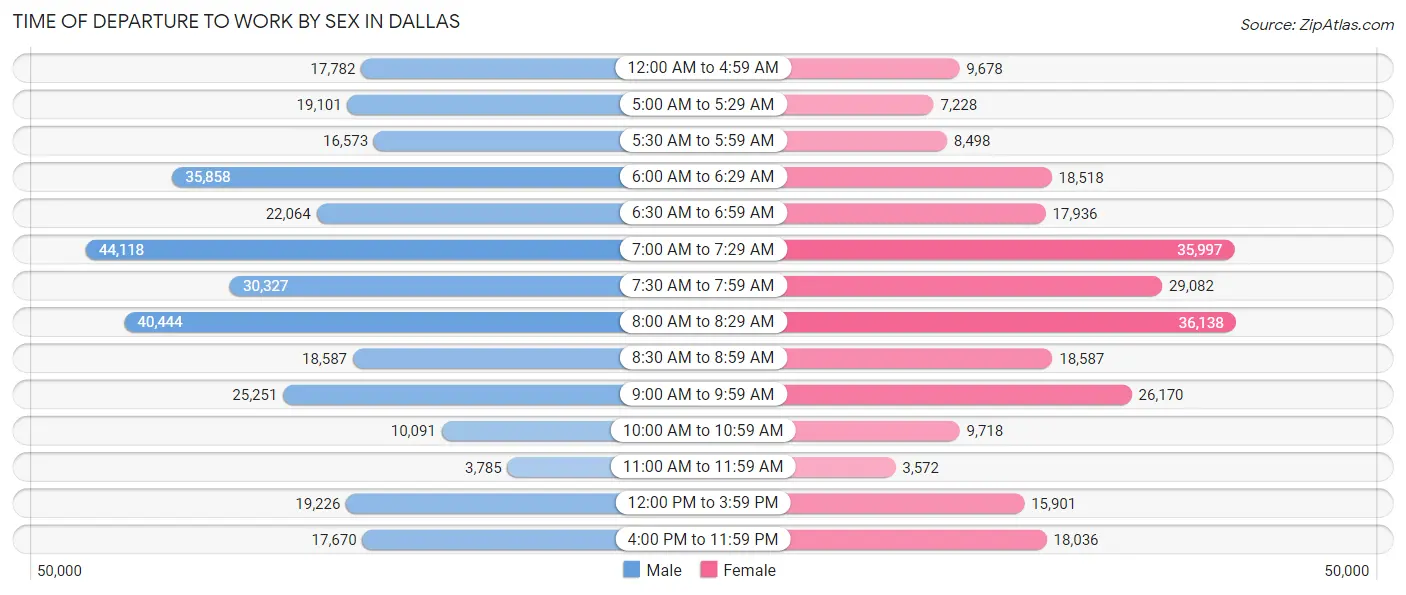
| Time of Departure | Male | Female |
| 12:00 AM to 4:59 AM | 17,782 (5.5%) | 9,678 (3.8%) |
| 5:00 AM to 5:29 AM | 19,101 (5.9%) | 7,228 (2.8%) |
| 5:30 AM to 5:59 AM | 16,573 (5.2%) | 8,498 (3.3%) |
| 6:00 AM to 6:29 AM | 35,858 (11.2%) | 18,518 (7.3%) |
| 6:30 AM to 6:59 AM | 22,064 (6.9%) | 17,936 (7.0%) |
| 7:00 AM to 7:29 AM | 44,118 (13.8%) | 35,997 (14.1%) |
| 7:30 AM to 7:59 AM | 30,327 (9.5%) | 29,082 (11.4%) |
| 8:00 AM to 8:29 AM | 40,444 (12.6%) | 36,138 (14.2%) |
| 8:30 AM to 8:59 AM | 18,587 (5.8%) | 18,587 (7.3%) |
| 9:00 AM to 9:59 AM | 25,251 (7.9%) | 26,170 (10.3%) |
| 10:00 AM to 10:59 AM | 10,091 (3.1%) | 9,718 (3.8%) |
| 11:00 AM to 11:59 AM | 3,785 (1.2%) | 3,572 (1.4%) |
| 12:00 PM to 3:59 PM | 19,226 (6.0%) | 15,901 (6.2%) |
| 4:00 PM to 11:59 PM | 17,670 (5.5%) | 18,036 (7.1%) |
| Total | 320,877 (100.0%) | 255,059 (100.0%) |
Housing Occupancy in Dallas
Occupancy by Ownership in Dallas
Of the total 521,147 dwellings in Dallas, owner-occupied units account for 218,575 (41.9%), while renter-occupied units make up 302,572 (58.1%).
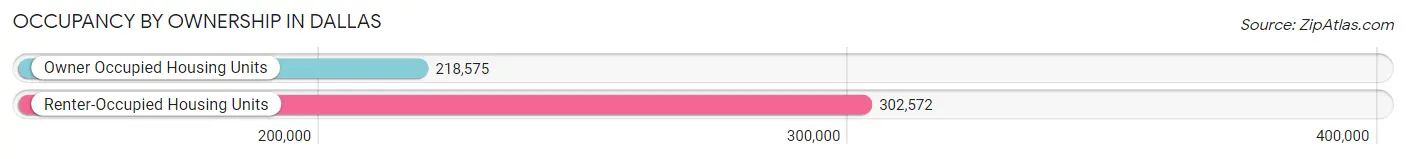
| Occupancy | # Housing Units | % Housing Units |
| Owner Occupied Housing Units | 218,575 | 41.9% |
| Renter-Occupied Housing Units | 302,572 | 58.1% |
| Total Occupied Housing Units | 521,147 | 100.0% |
Occupancy by Household Size in Dallas
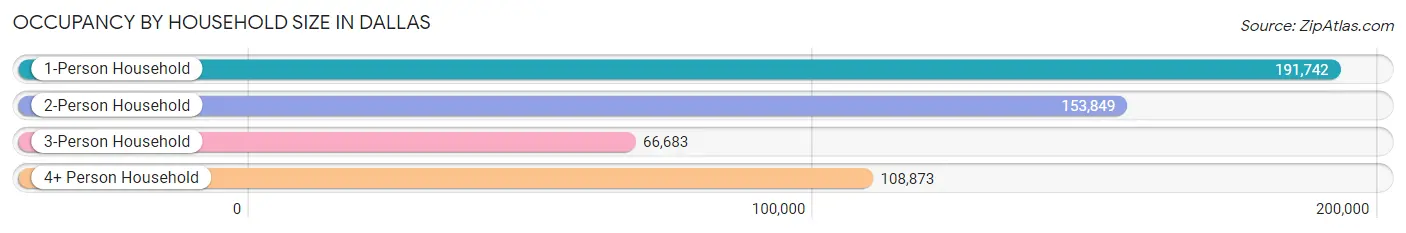
| Household Size | # Housing Units | % Housing Units |
| 1-Person Household | 191,742 | 36.8% |
| 2-Person Household | 153,849 | 29.5% |
| 3-Person Household | 66,683 | 12.8% |
| 4+ Person Household | 108,873 | 20.9% |
| Total Housing Units | 521,147 | 100.0% |
Occupancy by Ownership by Household Size in Dallas
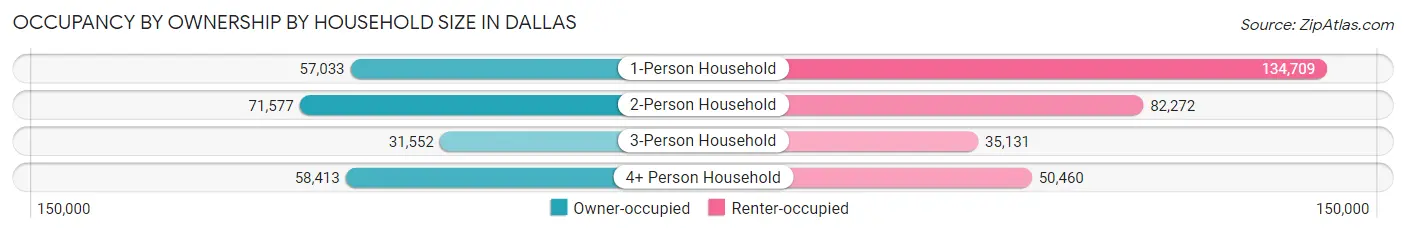
| Household Size | Owner-occupied | Renter-occupied |
| 1-Person Household | 57,033 (29.7%) | 134,709 (70.3%) |
| 2-Person Household | 71,577 (46.5%) | 82,272 (53.5%) |
| 3-Person Household | 31,552 (47.3%) | 35,131 (52.7%) |
| 4+ Person Household | 58,413 (53.6%) | 50,460 (46.4%) |
| Total Housing Units | 218,575 (41.9%) | 302,572 (58.1%) |
Occupancy by Educational Attainment in Dallas
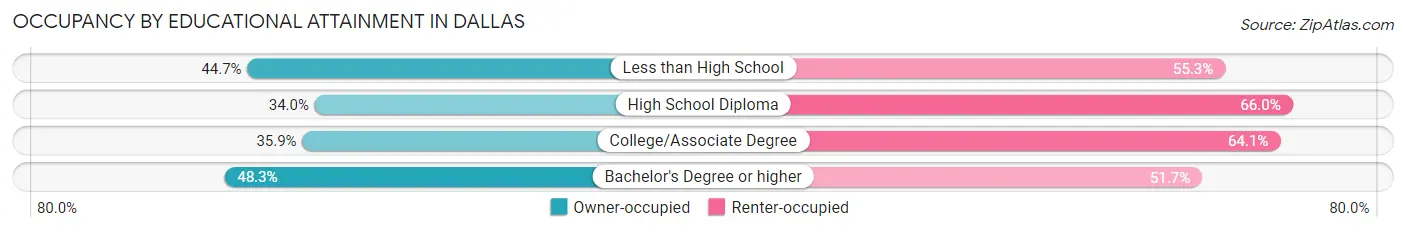
| Household Size | Owner-occupied | Renter-occupied |
| Less than High School | 38,186 (44.7%) | 47,325 (55.3%) |
| High School Diploma | 35,230 (34.0%) | 68,477 (66.0%) |
| College/Associate Degree | 44,182 (35.9%) | 78,782 (64.1%) |
| Bachelor's Degree or higher | 100,977 (48.3%) | 107,988 (51.7%) |
Occupancy by Age of Householder in Dallas
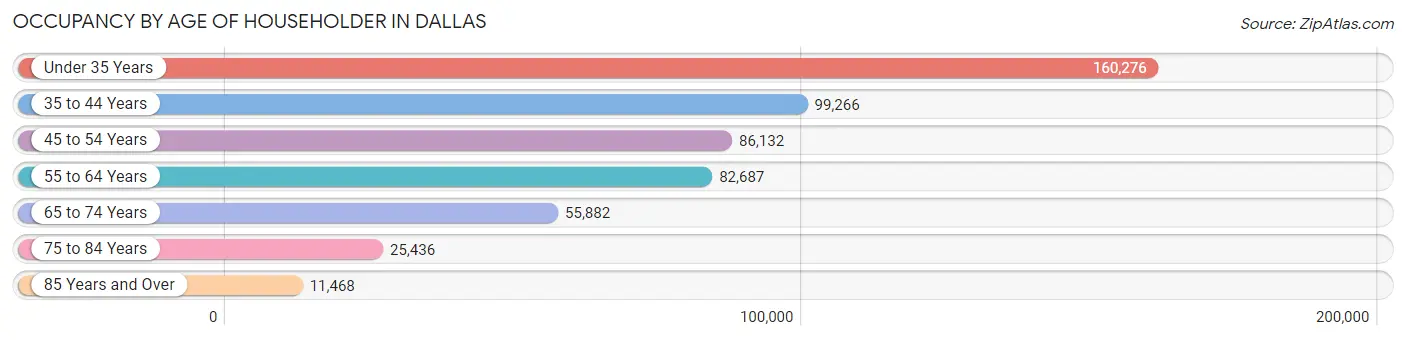
| Age Bracket | # Households | % Households |
| Under 35 Years | 160,276 | 30.7% |
| 35 to 44 Years | 99,266 | 19.1% |
| 45 to 54 Years | 86,132 | 16.5% |
| 55 to 64 Years | 82,687 | 15.9% |
| 65 to 74 Years | 55,882 | 10.7% |
| 75 to 84 Years | 25,436 | 4.9% |
| 85 Years and Over | 11,468 | 2.2% |
| Total | 521,147 | 100.0% |
Housing Finances in Dallas
Median Income by Occupancy in Dallas
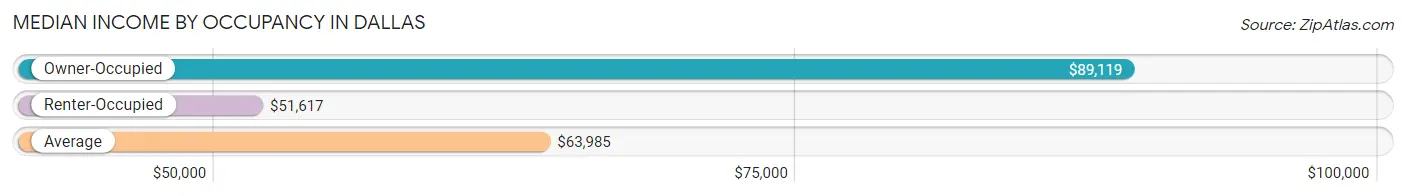
| Occupancy Type | # Households | Median Income |
| Owner-Occupied | 218,575 (41.9%) | $89,119 |
| Renter-Occupied | 302,572 (58.1%) | $51,617 |
| Average | 521,147 (100.0%) | $63,985 |
Occupancy by Householder Income Bracket in Dallas
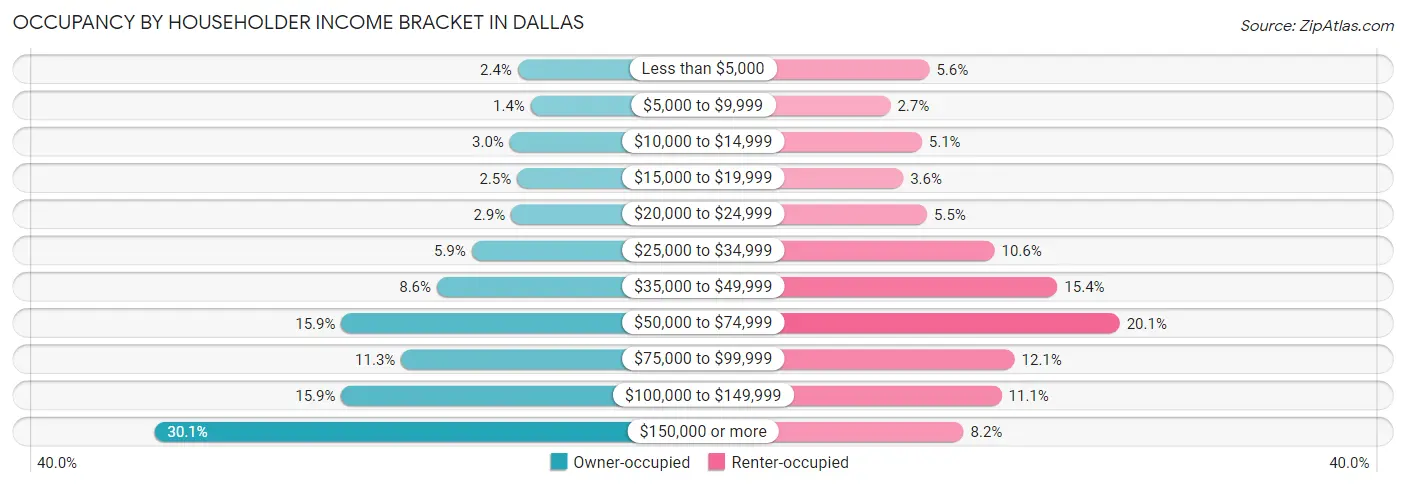
| Income Bracket | Owner-occupied | Renter-occupied |
| Less than $5,000 | 5,305 (2.4%) | 17,048 (5.6%) |
| $5,000 to $9,999 | 3,140 (1.4%) | 8,045 (2.7%) |
| $10,000 to $14,999 | 6,649 (3.0%) | 15,274 (5.1%) |
| $15,000 to $19,999 | 5,410 (2.5%) | 10,983 (3.6%) |
| $20,000 to $24,999 | 6,422 (2.9%) | 16,493 (5.4%) |
| $25,000 to $34,999 | 12,979 (5.9%) | 32,045 (10.6%) |
| $35,000 to $49,999 | 18,766 (8.6%) | 46,524 (15.4%) |
| $50,000 to $74,999 | 34,685 (15.9%) | 60,919 (20.1%) |
| $75,000 to $99,999 | 24,710 (11.3%) | 36,685 (12.1%) |
| $100,000 to $149,999 | 34,697 (15.9%) | 33,664 (11.1%) |
| $150,000 or more | 65,812 (30.1%) | 24,892 (8.2%) |
| Total | 218,575 (100.0%) | 302,572 (100.0%) |
Monthly Housing Cost Tiers in Dallas
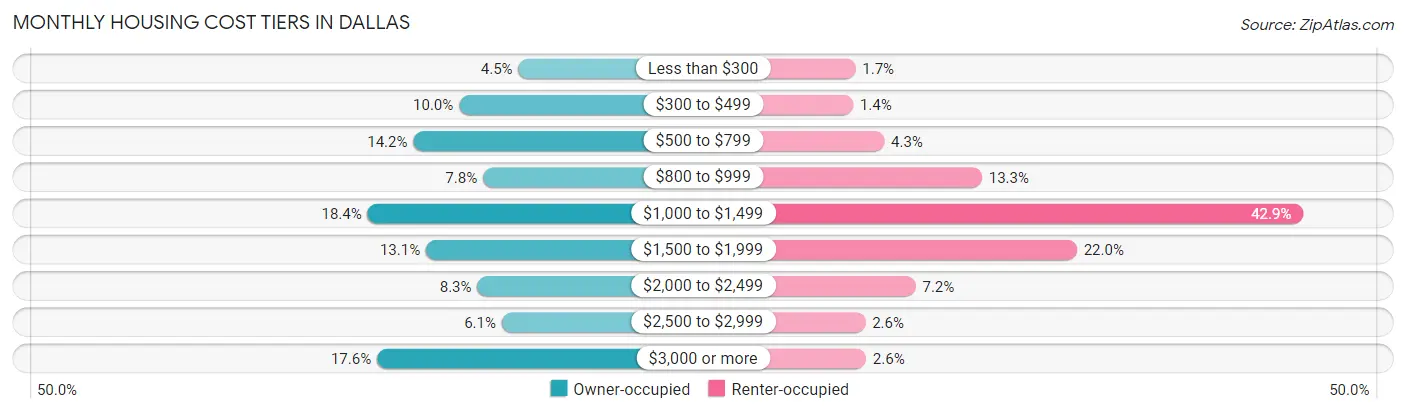
| Monthly Cost | Owner-occupied | Renter-occupied |
| Less than $300 | 9,925 (4.5%) | 4,993 (1.7%) |
| $300 to $499 | 21,864 (10.0%) | 4,334 (1.4%) |
| $500 to $799 | 31,073 (14.2%) | 13,021 (4.3%) |
| $800 to $999 | 17,048 (7.8%) | 40,202 (13.3%) |
| $1,000 to $1,499 | 40,291 (18.4%) | 129,751 (42.9%) |
| $1,500 to $1,999 | 28,520 (13.1%) | 66,658 (22.0%) |
| $2,000 to $2,499 | 18,196 (8.3%) | 21,764 (7.2%) |
| $2,500 to $2,999 | 13,278 (6.1%) | 7,750 (2.6%) |
| $3,000 or more | 38,380 (17.6%) | 7,919 (2.6%) |
| Total | 218,575 (100.0%) | 302,572 (100.0%) |
Physical Housing Characteristics in Dallas
Housing Structures in Dallas
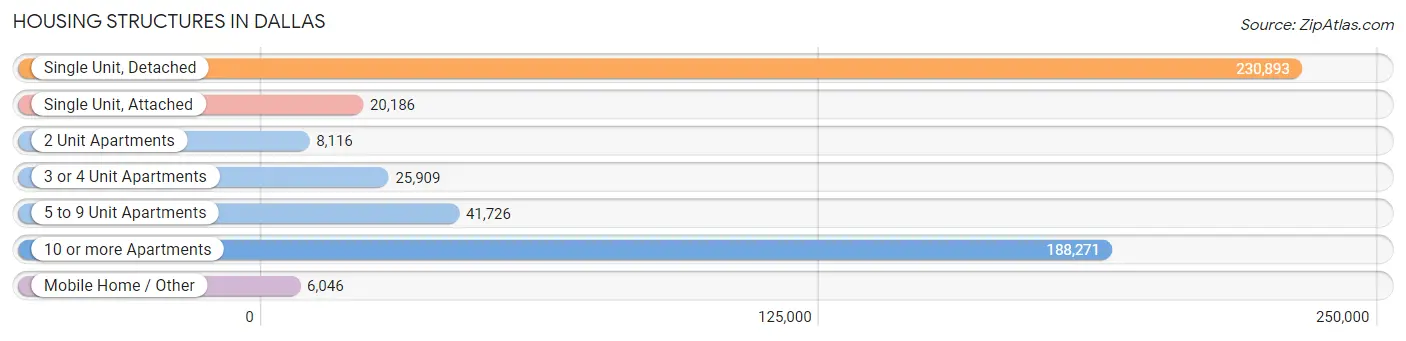
| Structure Type | # Housing Units | % Housing Units |
| Single Unit, Detached | 230,893 | 44.3% |
| Single Unit, Attached | 20,186 | 3.9% |
| 2 Unit Apartments | 8,116 | 1.6% |
| 3 or 4 Unit Apartments | 25,909 | 5.0% |
| 5 to 9 Unit Apartments | 41,726 | 8.0% |
| 10 or more Apartments | 188,271 | 36.1% |
| Mobile Home / Other | 6,046 | 1.2% |
| Total | 521,147 | 100.0% |
Housing Structures by Occupancy in Dallas
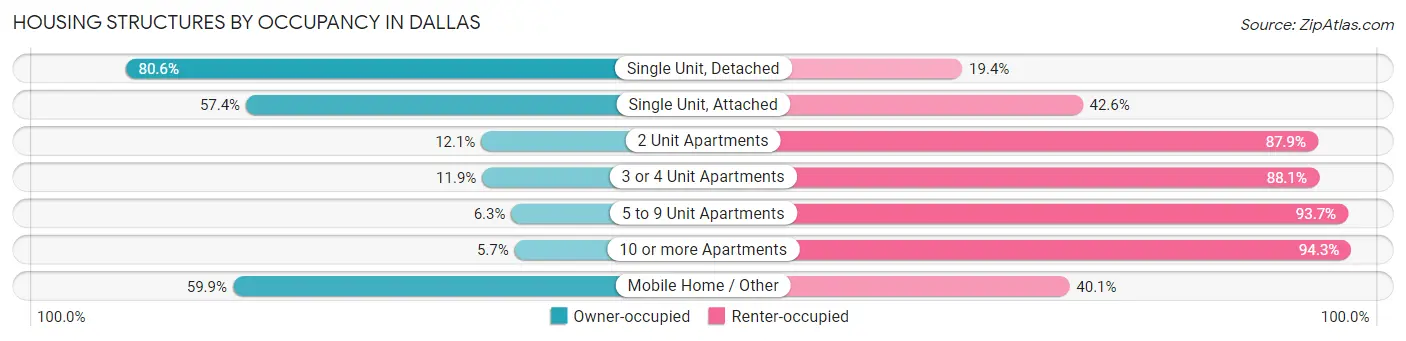
| Structure Type | Owner-occupied | Renter-occupied |
| Single Unit, Detached | 186,005 (80.6%) | 44,888 (19.4%) |
| Single Unit, Attached | 11,583 (57.4%) | 8,603 (42.6%) |
| 2 Unit Apartments | 981 (12.1%) | 7,135 (87.9%) |
| 3 or 4 Unit Apartments | 3,084 (11.9%) | 22,825 (88.1%) |
| 5 to 9 Unit Apartments | 2,623 (6.3%) | 39,103 (93.7%) |
| 10 or more Apartments | 10,677 (5.7%) | 177,594 (94.3%) |
| Mobile Home / Other | 3,622 (59.9%) | 2,424 (40.1%) |
| Total | 218,575 (41.9%) | 302,572 (58.1%) |
Housing Structures by Number of Rooms in Dallas
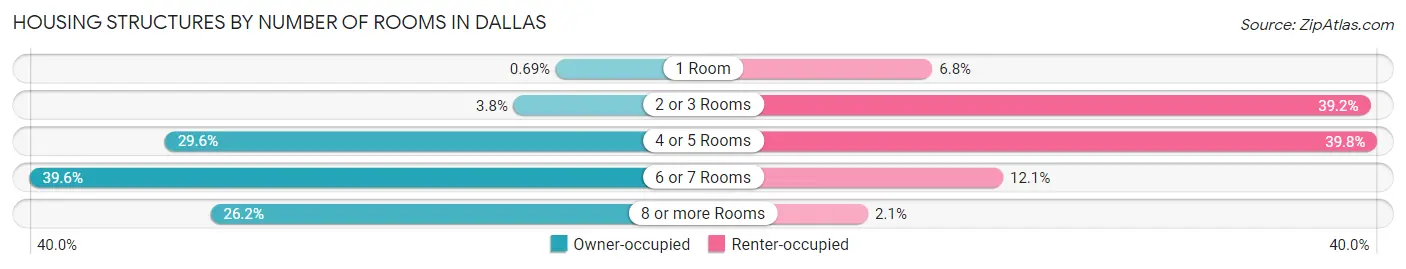
| Number of Rooms | Owner-occupied | Renter-occupied |
| 1 Room | 1,507 (0.7%) | 20,706 (6.8%) |
| 2 or 3 Rooms | 8,322 (3.8%) | 118,733 (39.2%) |
| 4 or 5 Rooms | 64,768 (29.6%) | 120,302 (39.8%) |
| 6 or 7 Rooms | 86,630 (39.6%) | 36,520 (12.1%) |
| 8 or more Rooms | 57,348 (26.2%) | 6,311 (2.1%) |
| Total | 218,575 (100.0%) | 302,572 (100.0%) |
Housing Structure by Heating Type in Dallas
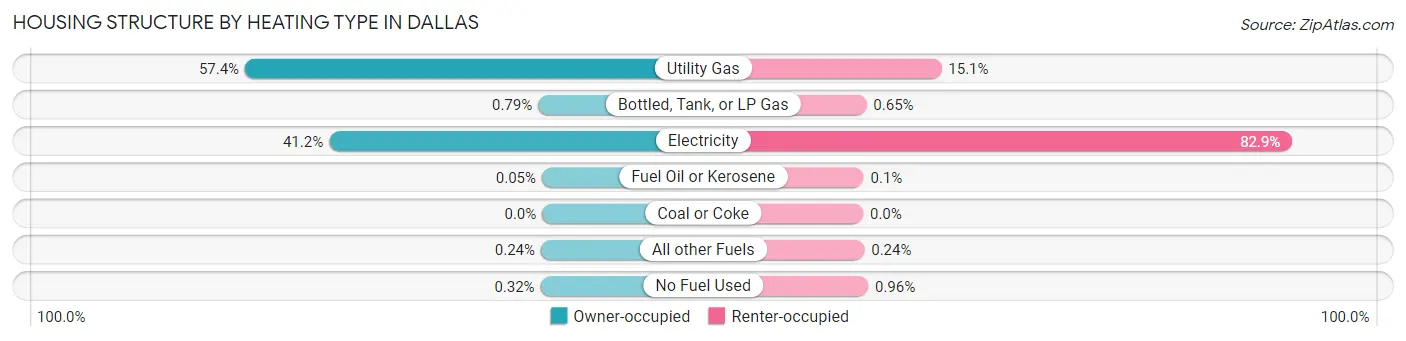
| Heating Type | Owner-occupied | Renter-occupied |
| Utility Gas | 125,497 (57.4%) | 45,791 (15.1%) |
| Bottled, Tank, or LP Gas | 1,722 (0.8%) | 1,976 (0.6%) |
| Electricity | 90,004 (41.2%) | 250,881 (82.9%) |
| Fuel Oil or Kerosene | 113 (0.1%) | 302 (0.1%) |
| Coal or Coke | 0 (0.0%) | 0 (0.0%) |
| All other Fuels | 530 (0.2%) | 714 (0.2%) |
| No Fuel Used | 709 (0.3%) | 2,908 (1.0%) |
| Total | 218,575 (100.0%) | 302,572 (100.0%) |
Household Vehicle Usage in Dallas
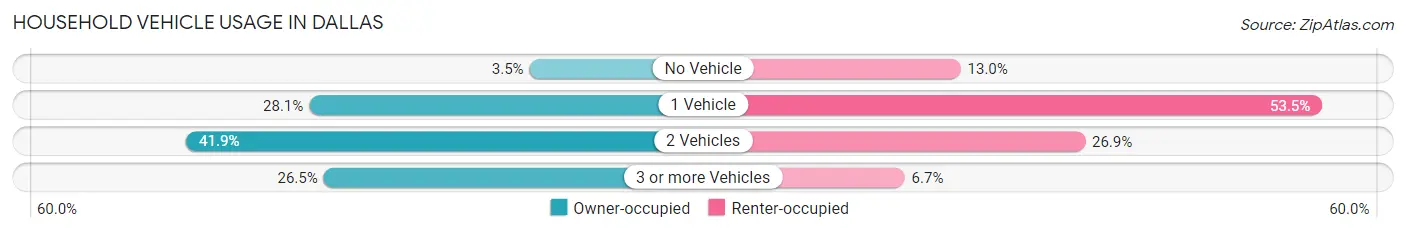
| Vehicles per Household | Owner-occupied | Renter-occupied |
| No Vehicle | 7,550 (3.5%) | 39,218 (13.0%) |
| 1 Vehicle | 61,489 (28.1%) | 161,716 (53.4%) |
| 2 Vehicles | 91,586 (41.9%) | 81,383 (26.9%) |
| 3 or more Vehicles | 57,950 (26.5%) | 20,255 (6.7%) |
| Total | 218,575 (100.0%) | 302,572 (100.0%) |
Real Estate & Mortgages in Dallas
Real Estate and Mortgage Overview in Dallas
| Characteristic | Without Mortgage | With Mortgage |
| Housing Units | 98,789 | 119,786 |
| Median Property Value | $217,500 | $325,500 |
| Median Household Income | $67,149 | $46,988 |
| Monthly Housing Costs | $685 | $35,075 |
| Real Estate Taxes | $3,225 | $6,470 |
Property Value by Mortgage Status in Dallas
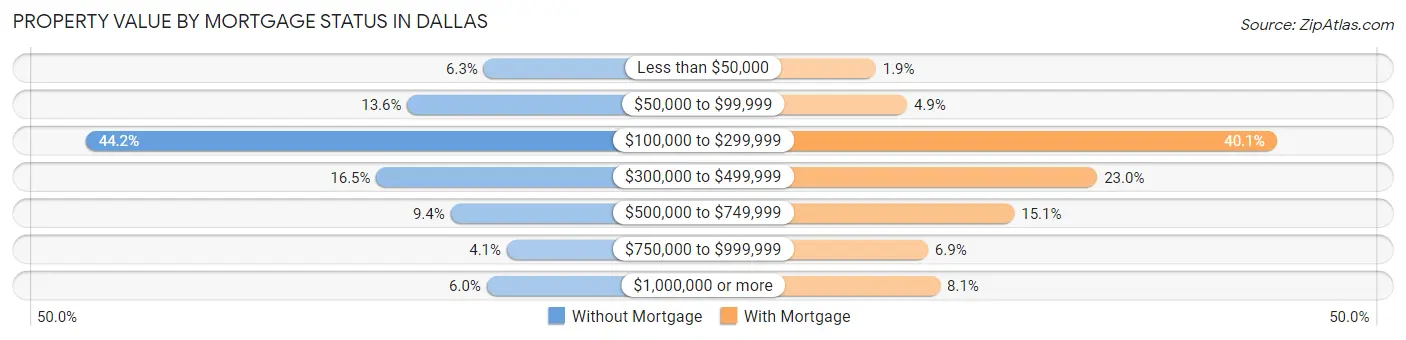
| Property Value | Without Mortgage | With Mortgage |
| Less than $50,000 | 6,207 (6.3%) | 2,311 (1.9%) |
| $50,000 to $99,999 | 13,390 (13.6%) | 5,871 (4.9%) |
| $100,000 to $299,999 | 43,632 (44.2%) | 48,026 (40.1%) |
| $300,000 to $499,999 | 16,302 (16.5%) | 27,572 (23.0%) |
| $500,000 to $749,999 | 9,316 (9.4%) | 18,112 (15.1%) |
| $750,000 to $999,999 | 4,025 (4.1%) | 8,251 (6.9%) |
| $1,000,000 or more | 5,917 (6.0%) | 9,643 (8.1%) |
| Total | 98,789 (100.0%) | 119,786 (100.0%) |
Household Income by Mortgage Status in Dallas
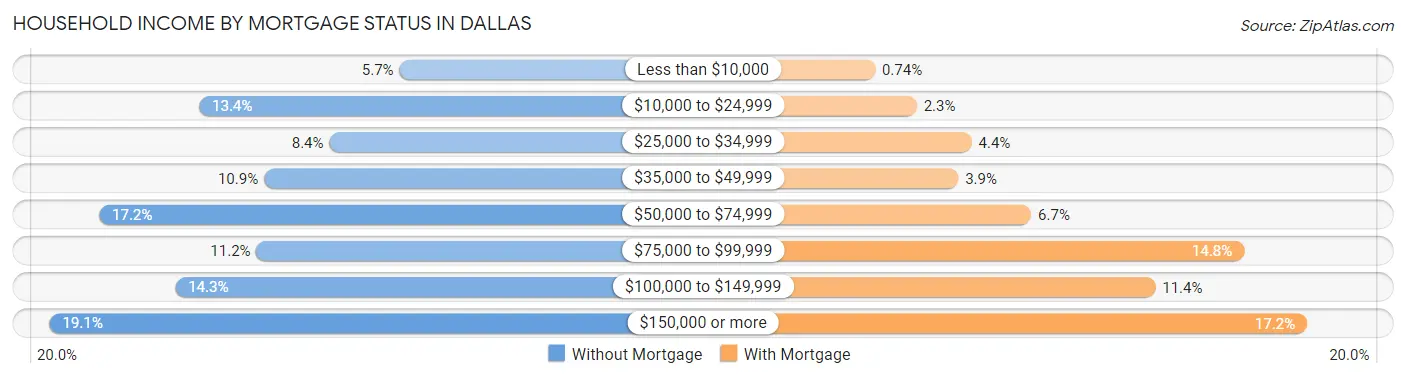
| Household Income | Without Mortgage | With Mortgage |
| Less than $10,000 | 5,654 (5.7%) | 890 (0.7%) |
| $10,000 to $24,999 | 13,191 (13.4%) | 2,791 (2.3%) |
| $25,000 to $34,999 | 8,293 (8.4%) | 5,290 (4.4%) |
| $35,000 to $49,999 | 10,748 (10.9%) | 4,686 (3.9%) |
| $50,000 to $74,999 | 16,951 (17.2%) | 8,018 (6.7%) |
| $75,000 to $99,999 | 11,036 (11.2%) | 17,734 (14.8%) |
| $100,000 to $149,999 | 14,092 (14.3%) | 13,674 (11.4%) |
| $150,000 or more | 18,824 (19.1%) | 20,605 (17.2%) |
| Total | 98,789 (100.0%) | 119,786 (100.0%) |
Property Value to Household Income Ratio in Dallas
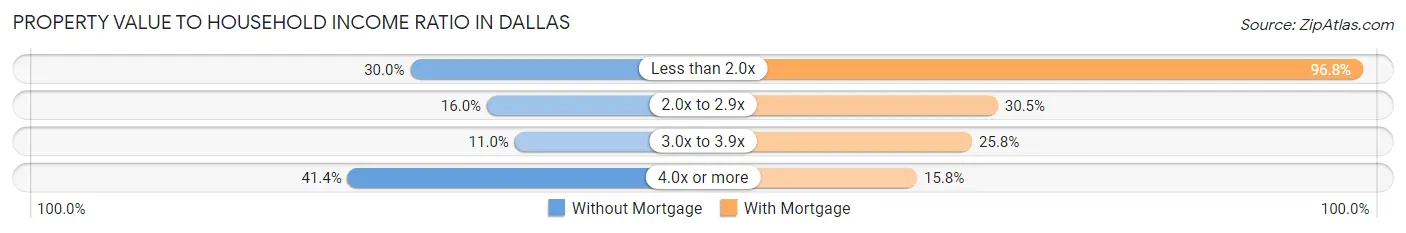
| Value-to-Income Ratio | Without Mortgage | With Mortgage |
| Less than 2.0x | 29,593 (30.0%) | 115,939 (96.8%) |
| 2.0x to 2.9x | 15,850 (16.0%) | 36,534 (30.5%) |
| 3.0x to 3.9x | 10,870 (11.0%) | 30,932 (25.8%) |
| 4.0x or more | 40,849 (41.3%) | 18,952 (15.8%) |
| Total | 98,789 (100.0%) | 119,786 (100.0%) |
Real Estate Taxes by Mortgage Status in Dallas
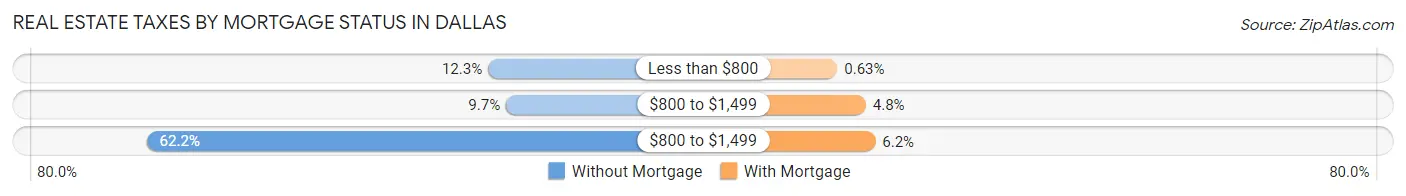
| Property Taxes | Without Mortgage | With Mortgage |
| Less than $800 | 12,138 (12.3%) | 754 (0.6%) |
| $800 to $1,499 | 9,539 (9.7%) | 5,734 (4.8%) |
| $800 to $1,499 | 61,407 (62.2%) | 7,403 (6.2%) |
| Total | 98,789 (100.0%) | 119,786 (100.0%) |
Health & Disability in Dallas
Health Insurance Coverage by Age in Dallas
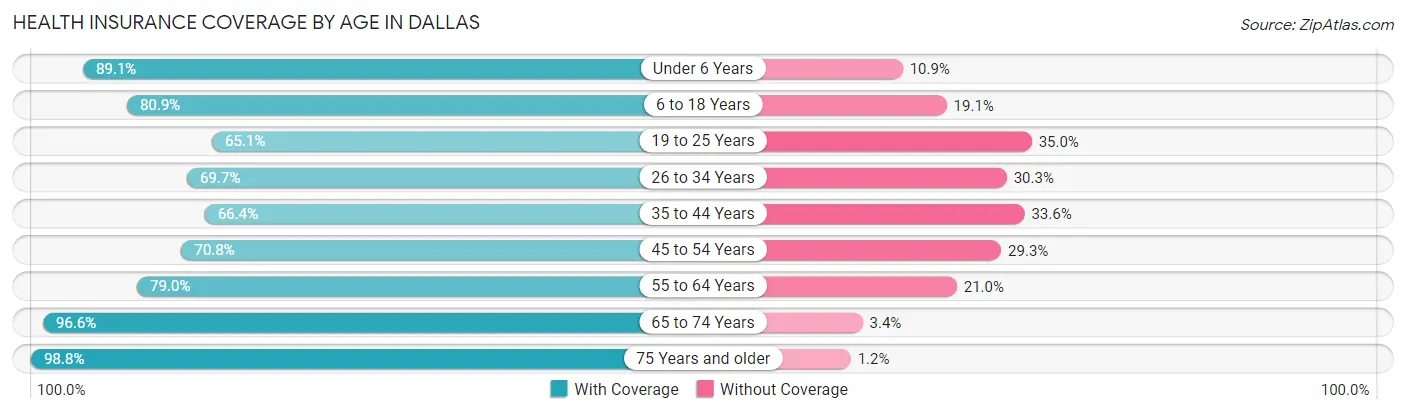
| Age Bracket | With Coverage | Without Coverage |
| Under 6 Years | 97,182 (89.1%) | 11,882 (10.9%) |
| 6 to 18 Years | 181,585 (80.9%) | 42,840 (19.1%) |
| 19 to 25 Years | 90,736 (65.0%) | 48,754 (34.9%) |
| 26 to 34 Years | 148,656 (69.7%) | 64,595 (30.3%) |
| 35 to 44 Years | 118,052 (66.4%) | 59,728 (33.6%) |
| 45 to 54 Years | 105,878 (70.8%) | 43,779 (29.2%) |
| 55 to 64 Years | 107,949 (79.0%) | 28,653 (21.0%) |
| 65 to 74 Years | 83,137 (96.6%) | 2,944 (3.4%) |
| 75 Years and older | 54,095 (98.8%) | 658 (1.2%) |
| Total | 987,270 (76.5%) | 303,833 (23.5%) |
Health Insurance Coverage by Citizenship Status in Dallas
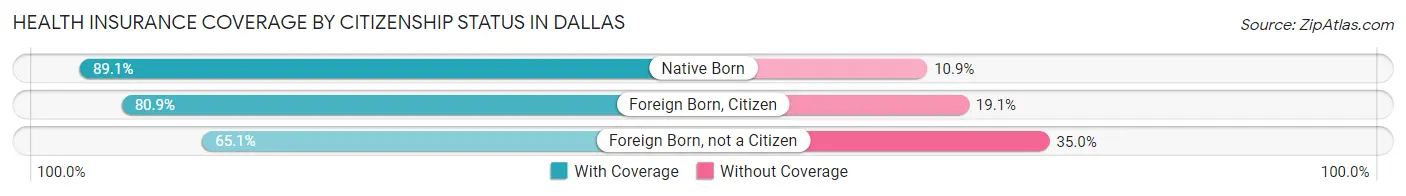
| Citizenship Status | With Coverage | Without Coverage |
| Native Born | 97,182 (89.1%) | 11,882 (10.9%) |
| Foreign Born, Citizen | 181,585 (80.9%) | 42,840 (19.1%) |
| Foreign Born, not a Citizen | 90,736 (65.0%) | 48,754 (34.9%) |
Health Insurance Coverage by Household Income in Dallas
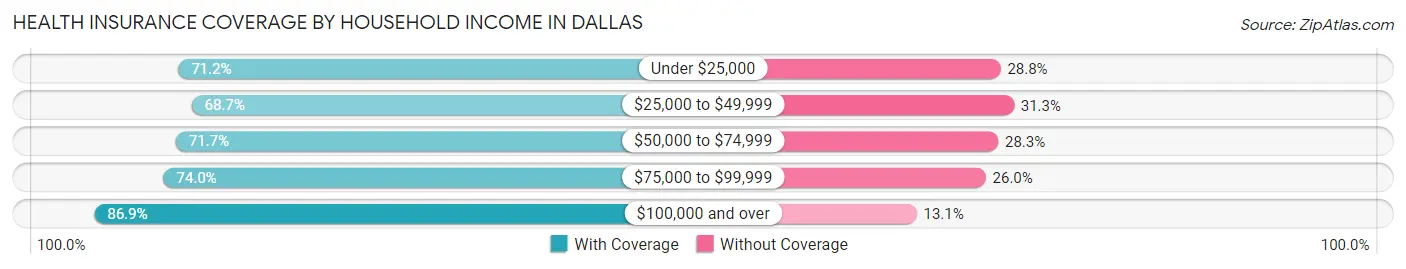
| Household Income | With Coverage | Without Coverage |
| Under $25,000 | 129,447 (71.2%) | 52,345 (28.8%) |
| $25,000 to $49,999 | 179,550 (68.7%) | 81,783 (31.3%) |
| $50,000 to $74,999 | 172,237 (71.7%) | 68,073 (28.3%) |
| $75,000 to $99,999 | 120,102 (74.0%) | 42,225 (26.0%) |
| $100,000 and over | 379,784 (86.9%) | 57,096 (13.1%) |
Public vs Private Health Insurance Coverage by Age in Dallas
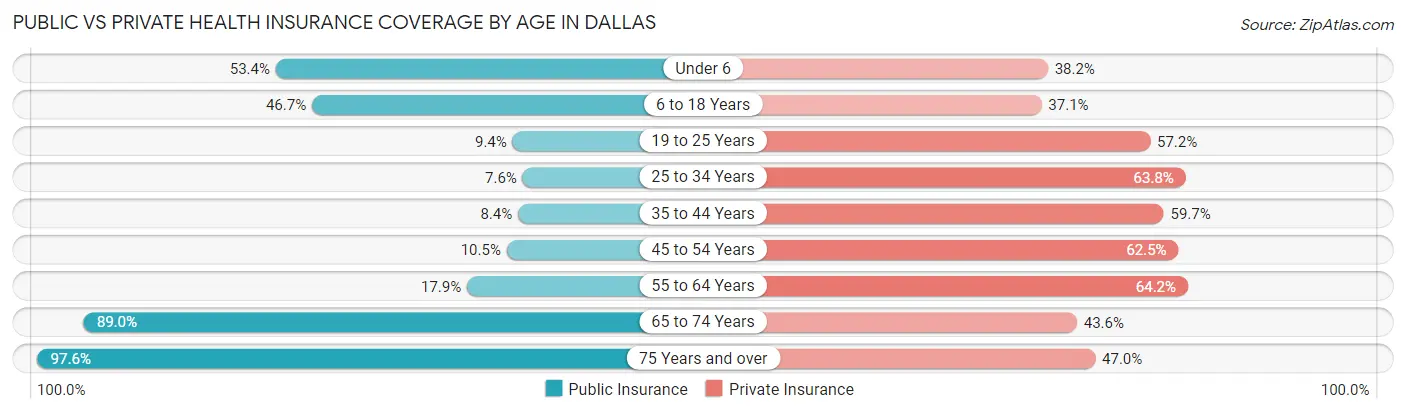
| Age Bracket | Public Insurance | Private Insurance |
| Under 6 | 58,209 (53.4%) | 41,682 (38.2%) |
| 6 to 18 Years | 104,722 (46.7%) | 83,156 (37.0%) |
| 19 to 25 Years | 13,137 (9.4%) | 79,798 (57.2%) |
| 25 to 34 Years | 16,100 (7.5%) | 136,096 (63.8%) |
| 35 to 44 Years | 14,943 (8.4%) | 106,179 (59.7%) |
| 45 to 54 Years | 15,724 (10.5%) | 93,513 (62.5%) |
| 55 to 64 Years | 24,422 (17.9%) | 87,741 (64.2%) |
| 65 to 74 Years | 76,612 (89.0%) | 37,549 (43.6%) |
| 75 Years and over | 53,424 (97.6%) | 25,746 (47.0%) |
| Total | 377,293 (29.2%) | 691,460 (53.6%) |
Disability Status by Sex by Age in Dallas
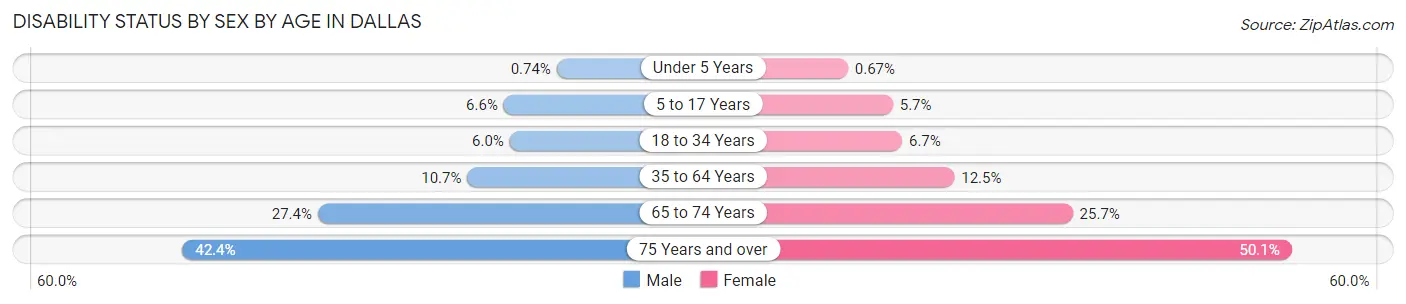
| Age Bracket | Male | Female |
| Under 5 Years | 332 (0.7%) | 313 (0.7%) |
| 5 to 17 Years | 7,737 (6.6%) | 6,168 (5.7%) |
| 18 to 34 Years | 11,021 (6.0%) | 12,426 (6.7%) |
| 35 to 64 Years | 25,177 (10.7%) | 28,677 (12.5%) |
| 65 to 74 Years | 10,975 (27.4%) | 11,814 (25.7%) |
| 75 Years and over | 8,965 (42.4%) | 16,841 (50.1%) |
Disability Class by Sex by Age in Dallas
Disability Class: Hearing Difficulty
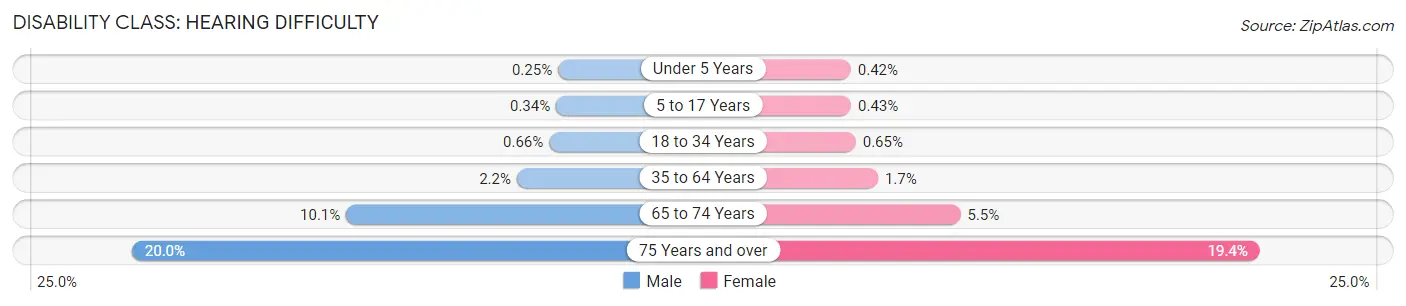
| Age Bracket | Male | Female |
| Under 5 Years | 112 (0.3%) | 197 (0.4%) |
| 5 to 17 Years | 393 (0.3%) | 469 (0.4%) |
| 18 to 34 Years | 1,224 (0.7%) | 1,201 (0.6%) |
| 35 to 64 Years | 5,091 (2.2%) | 3,845 (1.7%) |
| 65 to 74 Years | 4,045 (10.1%) | 2,533 (5.5%) |
| 75 Years and over | 4,230 (20.0%) | 6,521 (19.4%) |
Disability Class: Vision Difficulty
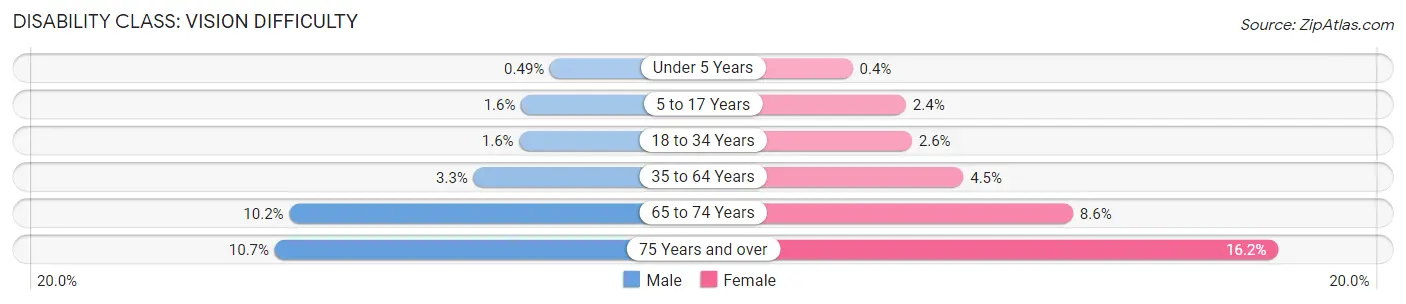
| Age Bracket | Male | Female |
| Under 5 Years | 220 (0.5%) | 189 (0.4%) |
| 5 to 17 Years | 1,817 (1.6%) | 2,588 (2.4%) |
| 18 to 34 Years | 3,005 (1.6%) | 4,817 (2.6%) |
| 35 to 64 Years | 7,835 (3.3%) | 10,322 (4.5%) |
| 65 to 74 Years | 4,082 (10.2%) | 3,942 (8.6%) |
| 75 Years and over | 2,263 (10.7%) | 5,448 (16.2%) |
Disability Class: Cognitive Difficulty
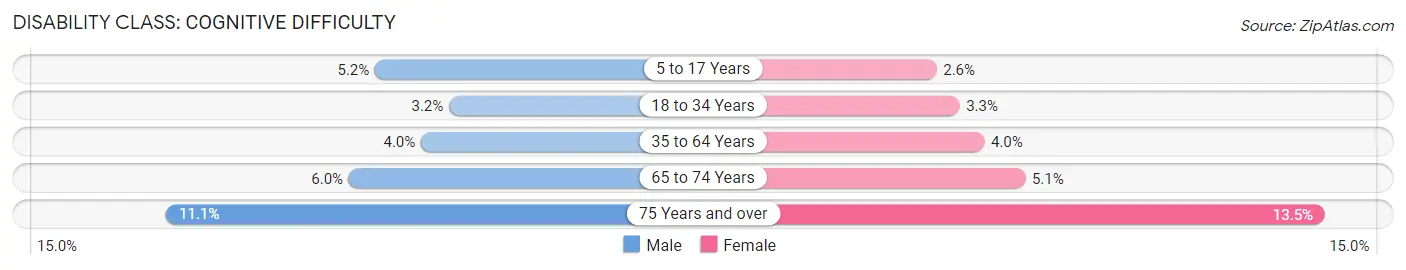
| Age Bracket | Male | Female |
| 5 to 17 Years | 6,099 (5.2%) | 2,853 (2.6%) |
| 18 to 34 Years | 5,860 (3.2%) | 6,056 (3.3%) |
| 35 to 64 Years | 9,317 (4.0%) | 9,052 (4.0%) |
| 65 to 74 Years | 2,394 (6.0%) | 2,342 (5.1%) |
| 75 Years and over | 2,336 (11.1%) | 4,522 (13.5%) |
Disability Class: Ambulatory Difficulty
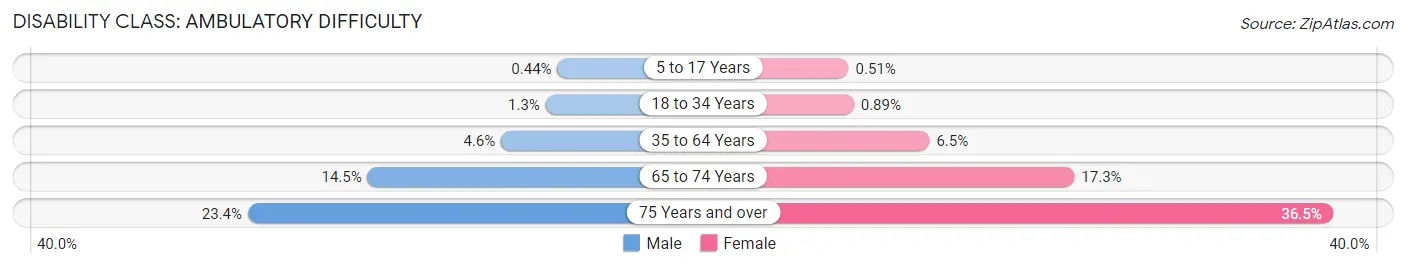
| Age Bracket | Male | Female |
| 5 to 17 Years | 512 (0.4%) | 553 (0.5%) |
| 18 to 34 Years | 2,416 (1.3%) | 1,645 (0.9%) |
| 35 to 64 Years | 10,862 (4.6%) | 14,888 (6.5%) |
| 65 to 74 Years | 5,836 (14.5%) | 7,934 (17.3%) |
| 75 Years and over | 4,949 (23.4%) | 12,277 (36.5%) |
Disability Class: Self-Care Difficulty
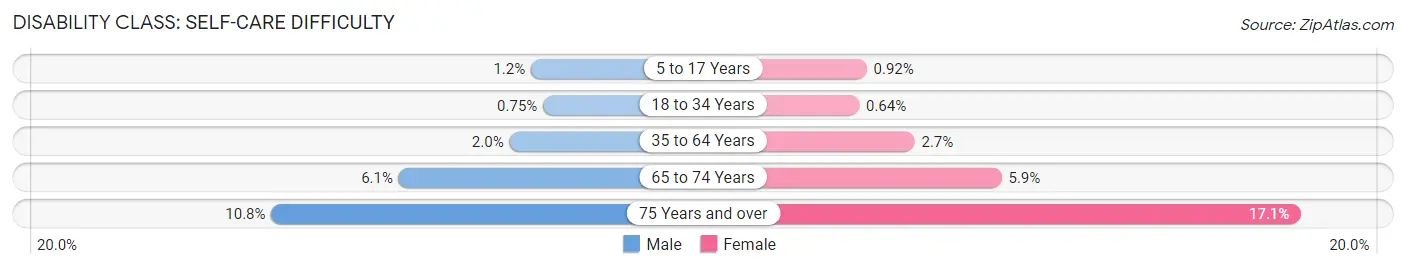
| Age Bracket | Male | Female |
| 5 to 17 Years | 1,395 (1.2%) | 995 (0.9%) |
| 18 to 34 Years | 1,379 (0.7%) | 1,183 (0.6%) |
| 35 to 64 Years | 4,705 (2.0%) | 6,170 (2.7%) |
| 65 to 74 Years | 2,454 (6.1%) | 2,727 (5.9%) |
| 75 Years and over | 2,291 (10.8%) | 5,732 (17.1%) |
Technology Access in Dallas
Computing Device Access in Dallas
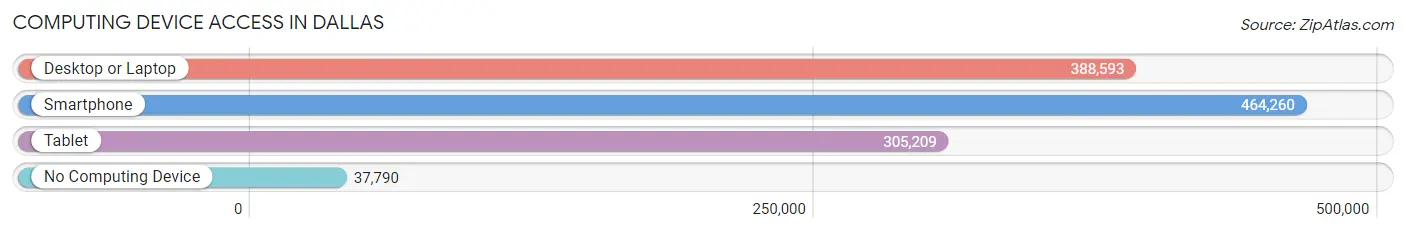
| Device Type | # Households | % Households |
| Desktop or Laptop | 388,593 | 74.6% |
| Smartphone | 464,260 | 89.1% |
| Tablet | 305,209 | 58.6% |
| No Computing Device | 37,790 | 7.2% |
| Total | 521,147 | 100.0% |
Internet Access in Dallas
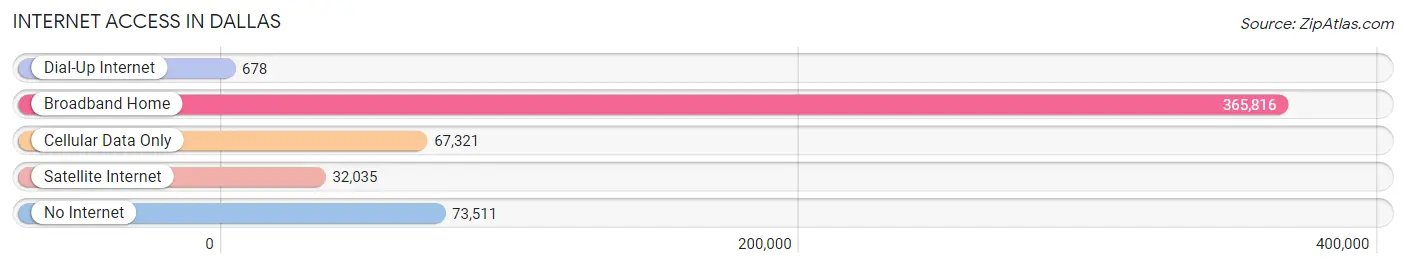
| Internet Type | # Households | % Households |
| Dial-Up Internet | 678 | 0.1% |
| Broadband Home | 365,816 | 70.2% |
| Cellular Data Only | 67,321 | 12.9% |
| Satellite Internet | 32,035 | 6.1% |
| No Internet | 73,511 | 14.1% |
| Total | 521,147 | 100.0% |
Dallas Summary
Dallas, Texas is a major city located in the state of Texas in the United States. It is the third-largest city in the state and the ninth-largest in the country. Dallas is located in the north-central part of the state, in the heart of the Dallas-Fort Worth-Arlington metropolitan area, which is the fourth-largest metropolitan area in the United States. The city is home to a population of 1,223,229 people, according to the 2019 U.S. Census Bureau estimate.
Geography
Dallas is located in the north-central part of Texas, in the heart of the Dallas-Fort Worth-Arlington metropolitan area. The city is situated on the Trinity River, which flows through the city and is a major tributary of the Red River. The city is surrounded by several suburbs, including Irving, Grand Prairie, and Mesquite. The city is also located near the Dallas-Fort Worth International Airport, which is one of the busiest airports in the world.
The city has a total area of 385.8 square miles, of which 375.2 square miles is land and 10.6 square miles is water. The city has a humid subtropical climate, with hot summers and mild winters. The average temperature in the city is 68°F, with an average high of 90°F in the summer and an average low of 46°F in the winter.
Economy
Dallas is a major economic center in the United States. The city is home to a number of Fortune 500 companies, including AT&T, Southwest Airlines, and Texas Instruments. The city is also home to a number of major financial institutions, including Bank of America, JPMorgan Chase, and Wells Fargo.
The city is also a major center for the technology industry, with a number of major tech companies, such as Dell, IBM, and Microsoft, having their headquarters in the city. The city is also home to a number of major healthcare companies, such as Baylor Scott & White Health and Tenet Healthcare.
The city has a gross domestic product (GDP) of $444.3 billion, making it the fourth-largest metropolitan economy in the United States. The city's unemployment rate was 3.7% in 2019, lower than the national average of 3.9%.
Demographics
As of the 2019 U.S. Census Bureau estimate, the city of Dallas had a population of 1,223,229 people. The city is racially and ethnically diverse, with the largest racial/ethnic groups being White (41.2%), Hispanic or Latino (34.2%), Black or African American (21.2%), and Asian (3.3%).
The median household income in the city is $50,935, and the median home value is $204,400. The city has a poverty rate of 17.2%, higher than the national average of 11.8%.
Conclusion
Dallas, Texas is a major city located in the north-central part of the state. It is the third-largest city in the state and the ninth-largest in the country. The city is home to a population of 1,223,229 people, according to the 2019 U.S. Census Bureau estimate. Dallas is a major economic center in the United States, with a number of Fortune 500 companies and major financial institutions located in the city. The city is also a major center for the technology industry, with a number of major tech companies having their headquarters in the city. The city is racially and ethnically diverse, with the largest racial/ethnic groups being White, Hispanic or Latino, Black or African American, and Asian. The median household income in the city is $50,935, and the median home value is $204,400.
Common Questions
What is Per Capita Income in Dallas?
Per Capita income in Dallas is $41,761.
What is the Median Family Income in Dallas?
Median Family Income in Dallas is $72,504.
What is the Median Household income in Dallas?
Median Household Income in Dallas is $63,985.
What is Income or Wage Gap in Dallas?
Income or Wage Gap in Dallas is 22.0%.
Women in Dallas earn 78.0 cents for every dollar earned by a man.
What is Family Income Deficit in Dallas?
Family Income Deficit in Dallas is $11,867.
Families that are below poverty line in Dallas earn $11,867 less on average than the poverty threshold level.
What is Inequality or Gini Index in Dallas?
Inequality or Gini Index in Dallas is 0.53.
What is the Total Population of Dallas?
Total Population of Dallas is 1,300,642.
What is the Total Male Population of Dallas?
Total Male Population of Dallas is 648,990.
What is the Total Female Population of Dallas?
Total Female Population of Dallas is 651,652.
What is the Ratio of Males per 100 Females in Dallas?
There are 99.59 Males per 100 Females in Dallas.
What is the Ratio of Females per 100 Males in Dallas?
There are 100.41 Females per 100 Males in Dallas.
What is the Median Population Age in Dallas?
Median Population Age in Dallas is 33.1 Years.
What is the Average Family Size in Dallas
Average Family Size in Dallas is 3.4 People.
What is the Average Household Size in Dallas
Average Household Size in Dallas is 2.5 People.
How Large is the Labor Force in Dallas?
There are 698,301 People in the Labor Forcein in Dallas.
What is the Percentage of People in the Labor Force in Dallas?
68.6% of People are in the Labor Force in Dallas.
What is the Unemployment Rate in Dallas?
Unemployment Rate in Dallas is 5.0%.