Garland, TX Map & Demographics
Garland Map
Garland Overview
$30,132
PER CAPITA INCOME
$77,710
AVG FAMILY INCOME
$71,044
AVG HOUSEHOLD INCOME
23.2%
WAGE / INCOME GAP [ % ]
76.8¢/ $1
WAGE / INCOME GAP [ $ ]
$11,042
FAMILY INCOME DEFICIT
0.41
INEQUALITY / GINI INDEX
244,026
TOTAL POPULATION
120,727
MALE POPULATION
123,299
FEMALE POPULATION
97.91
MALES / 100 FEMALES
102.13
FEMALES / 100 MALES
34.4
MEDIAN AGE
3.5
AVG FAMILY SIZE
3.0
AVG HOUSEHOLD SIZE
130,010
LABOR FORCE [ PEOPLE ]
68.9%
PERCENT IN LABOR FORCE
5.2%
UNEMPLOYMENT RATE
Income in Garland
Income Overview in Garland
Per Capita Income in Garland is $30,132, while median incomes of families and households are $77,710 and $71,044 respectively.
| Characteristic | Number | Measure |
| Per Capita Income | 244,026 | $30,132 |
| Median Family Income | 60,437 | $77,710 |
| Mean Family Income | 60,437 | $96,034 |
| Median Household Income | 79,770 | $71,044 |
| Mean Household Income | 79,770 | $90,179 |
| Income Deficit | 60,437 | $11,042 |
| Wage / Income Gap (%) | 244,026 | 23.24% |
| Wage / Income Gap ($) | 244,026 | 76.76¢ per $1 |
| Gini / Inequality Index | 244,026 | 0.41 |
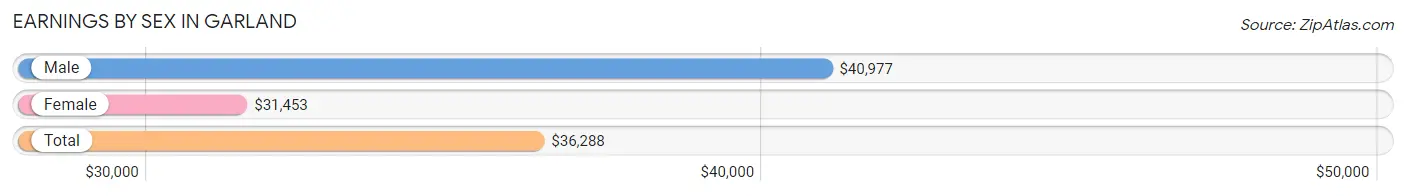
Earnings by Sex in Garland
Average Earnings in Garland are $36,288, $40,977 for men and $31,453 for women, a difference of 23.2%.
| Sex | Number | Average Earnings |
| Male | 70,738 (53.5%) | $40,977 |
| Female | 61,437 (46.5%) | $31,453 |
| Total | 132,175 (100.0%) | $36,288 |
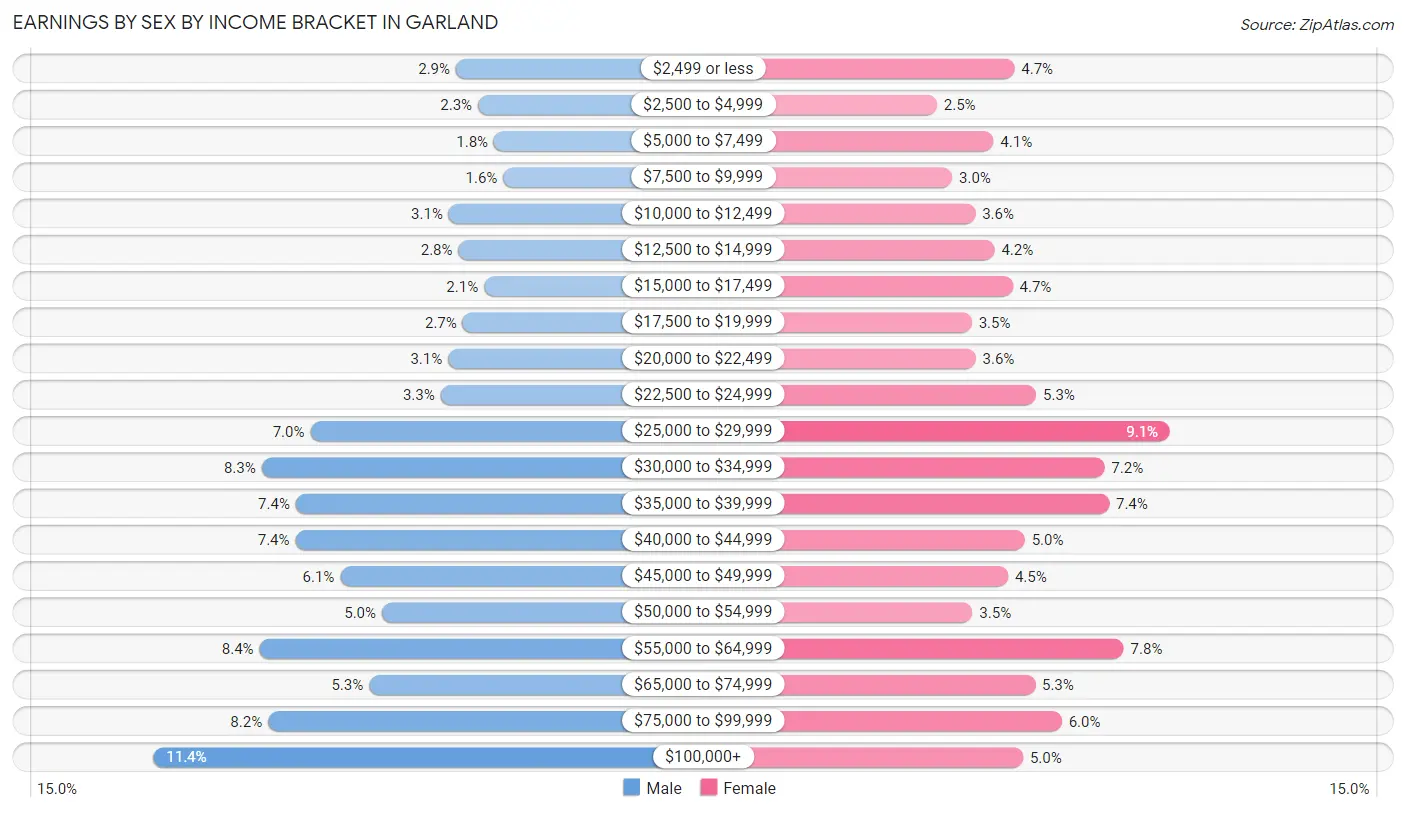
Earnings by Sex by Income Bracket in Garland
The most common earnings brackets in Garland are $100,000+ for men (8,048 | 11.4%) and $25,000 to $29,999 for women (5,581 | 9.1%).
| Income | Male | Female |
| $2,499 or less | 2,039 (2.9%) | 2,895 (4.7%) |
| $2,500 to $4,999 | 1,597 (2.3%) | 1,552 (2.5%) |
| $5,000 to $7,499 | 1,278 (1.8%) | 2,534 (4.1%) |
| $7,500 to $9,999 | 1,095 (1.5%) | 1,816 (3.0%) |
| $10,000 to $12,499 | 2,182 (3.1%) | 2,216 (3.6%) |
| $12,500 to $14,999 | 1,985 (2.8%) | 2,551 (4.2%) |
| $15,000 to $17,499 | 1,477 (2.1%) | 2,866 (4.7%) |
| $17,500 to $19,999 | 1,901 (2.7%) | 2,157 (3.5%) |
| $20,000 to $22,499 | 2,191 (3.1%) | 2,225 (3.6%) |
| $22,500 to $24,999 | 2,342 (3.3%) | 3,267 (5.3%) |
| $25,000 to $29,999 | 4,932 (7.0%) | 5,581 (9.1%) |
| $30,000 to $34,999 | 5,900 (8.3%) | 4,447 (7.2%) |
| $35,000 to $39,999 | 5,221 (7.4%) | 4,525 (7.4%) |
| $40,000 to $44,999 | 5,227 (7.4%) | 3,070 (5.0%) |
| $45,000 to $49,999 | 4,337 (6.1%) | 2,783 (4.5%) |
| $50,000 to $54,999 | 3,506 (5.0%) | 2,169 (3.5%) |
| $55,000 to $64,999 | 5,944 (8.4%) | 4,779 (7.8%) |
| $65,000 to $74,999 | 3,763 (5.3%) | 3,249 (5.3%) |
| $75,000 to $99,999 | 5,773 (8.2%) | 3,713 (6.0%) |
| $100,000+ | 8,048 (11.4%) | 3,042 (5.0%) |
| Total | 70,738 (100.0%) | 61,437 (100.0%) |
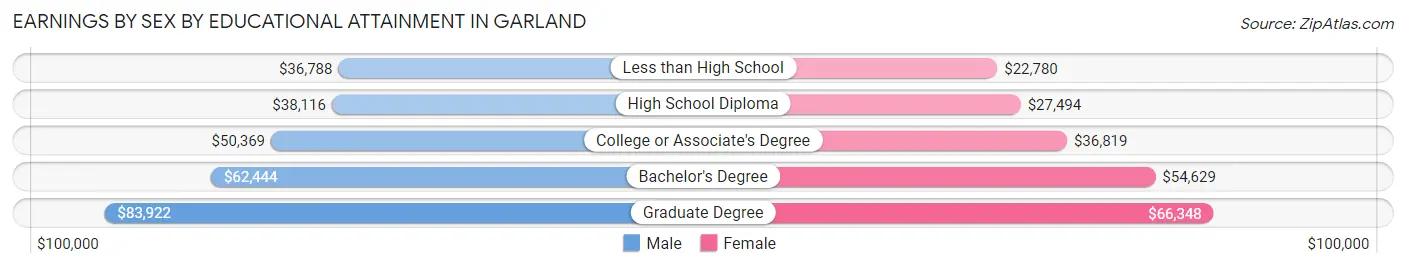
Earnings by Sex by Educational Attainment in Garland
Average earnings in Garland are $45,532 for men and $34,979 for women, a difference of 23.2%. Men with an educational attainment of graduate degree enjoy the highest average annual earnings of $83,922, while those with less than high school education earn the least with $36,788. Women with an educational attainment of graduate degree earn the most with the average annual earnings of $66,348, while those with less than high school education have the smallest earnings of $22,780.
| Educational Attainment | Male Income | Female Income |
| Less than High School | $36,788 | $22,780 |
| High School Diploma | $38,116 | $27,494 |
| College or Associate's Degree | $50,369 | $36,819 |
| Bachelor's Degree | $62,444 | $54,629 |
| Graduate Degree | $83,922 | $66,348 |
| Total | $45,532 | $34,979 |
Family Income in Garland
Family Income Brackets in Garland
According to the Garland family income data, there are 12,269 families falling into the $100,000 to $149,999 income range, which is the most common income bracket and makes up 20.3% of all families. Conversely, the $10,000 to $14,999 income bracket is the least frequent group with only 1,148 families (1.9%) belonging to this category.
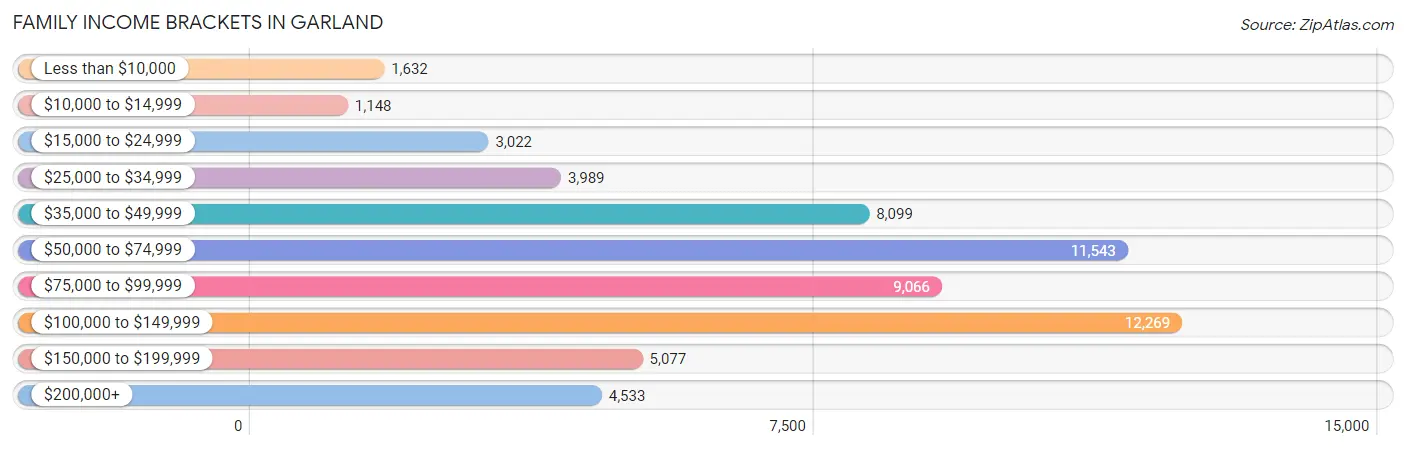
| Income Bracket | # Families | % Families |
| Less than $10,000 | 1,632 | 2.7% |
| $10,000 to $14,999 | 1,148 | 1.9% |
| $15,000 to $24,999 | 3,022 | 5.0% |
| $25,000 to $34,999 | 3,989 | 6.6% |
| $35,000 to $49,999 | 8,099 | 13.4% |
| $50,000 to $74,999 | 11,543 | 19.1% |
| $75,000 to $99,999 | 9,066 | 15.0% |
| $100,000 to $149,999 | 12,269 | 20.3% |
| $150,000 to $199,999 | 5,077 | 8.4% |
| $200,000+ | 4,533 | 7.5% |
Family Income by Famaliy Size in Garland
7+ person families (2,163 | 3.6%) account for the highest median family income in Garland with $132,966 per family, while 2-person families (23,421 | 38.8%) have the highest median income of $36,472 per family member.
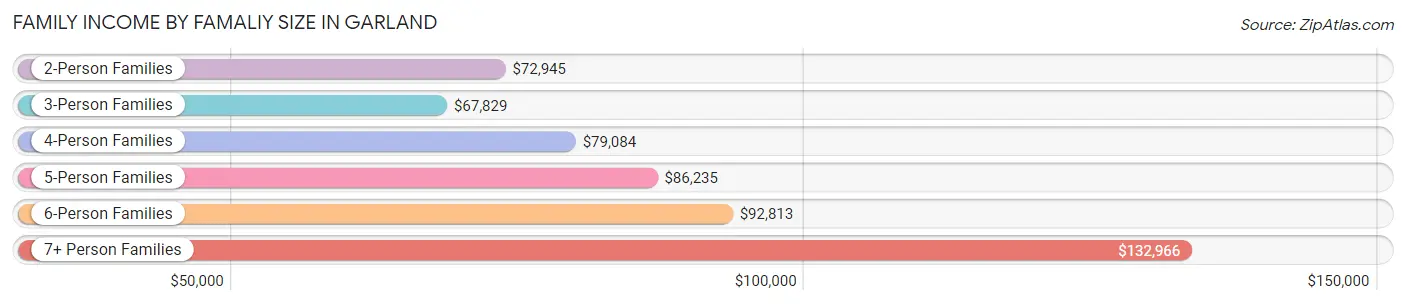
| Income Bracket | # Families | Median Income |
| 2-Person Families | 23,421 (38.8%) | $72,945 |
| 3-Person Families | 13,045 (21.6%) | $67,829 |
| 4-Person Families | 11,273 (18.6%) | $79,084 |
| 5-Person Families | 7,323 (12.1%) | $86,235 |
| 6-Person Families | 3,212 (5.3%) | $92,813 |
| 7+ Person Families | 2,163 (3.6%) | $132,966 |
| Total | 60,437 (100.0%) | $77,710 |
Family Income by Number of Earners in Garland
The median family income in Garland is $77,710, with families comprising 3+ earners (11,565) having the highest median family income of $116,445, while families with no earners (5,509) have the lowest median family income of $38,426, accounting for 19.1% and 9.1% of families, respectively.
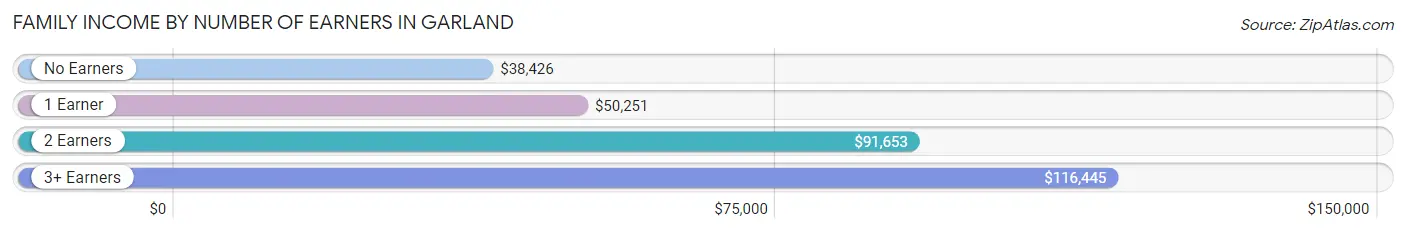
| Number of Earners | # Families | Median Income |
| No Earners | 5,509 (9.1%) | $38,426 |
| 1 Earner | 18,984 (31.4%) | $50,251 |
| 2 Earners | 24,379 (40.3%) | $91,653 |
| 3+ Earners | 11,565 (19.1%) | $116,445 |
| Total | 60,437 (100.0%) | $77,710 |
Household Income in Garland
Household Income Brackets in Garland
With 15,954 households falling in the category, the $50,000 to $74,999 income range is the most frequent in Garland, accounting for 20.0% of all households. In contrast, only 2,074 households (2.6%) fall into the $10,000 to $14,999 income bracket, making it the least populous group.
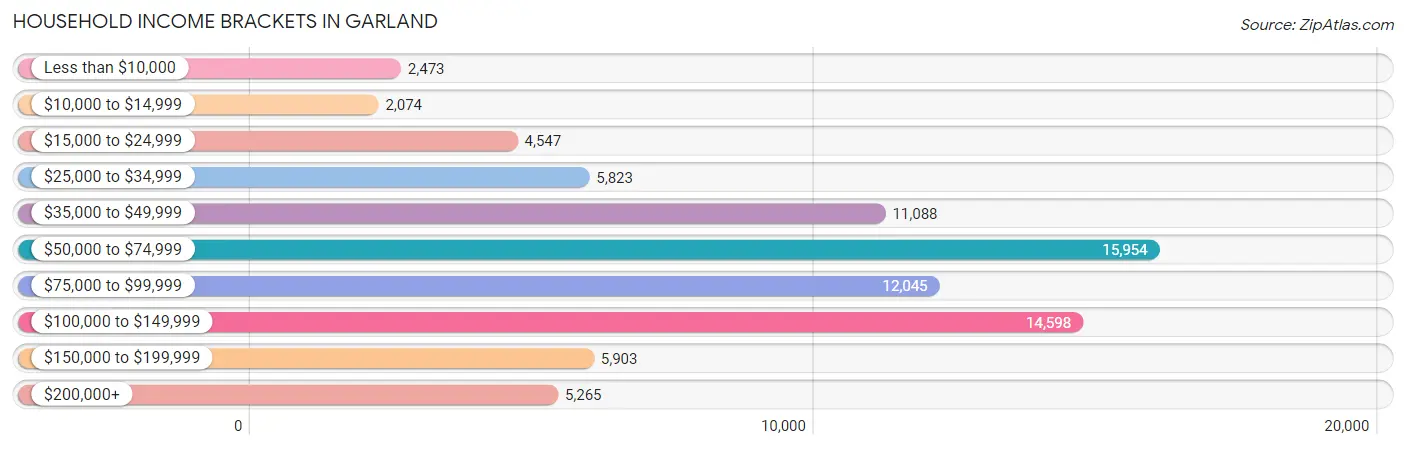
| Income Bracket | # Households | % Households |
| Less than $10,000 | 2,473 | 3.1% |
| $10,000 to $14,999 | 2,074 | 2.6% |
| $15,000 to $24,999 | 4,547 | 5.7% |
| $25,000 to $34,999 | 5,823 | 7.3% |
| $35,000 to $49,999 | 11,088 | 13.9% |
| $50,000 to $74,999 | 15,954 | 20.0% |
| $75,000 to $99,999 | 12,045 | 15.1% |
| $100,000 to $149,999 | 14,598 | 18.3% |
| $150,000 to $199,999 | 5,903 | 7.4% |
| $200,000+ | 5,265 | 6.6% |
Household Income by Householder Age in Garland
The median household income in Garland is $71,044, with the highest median household income of $80,992 found in the 45 to 64 years age bracket for the primary householder. A total of 31,972 households (40.1%) fall into this category. Meanwhile, the 15 to 24 years age bracket for the primary householder has the lowest median household income of $53,964, with 3,590 households (4.5%) in this group.
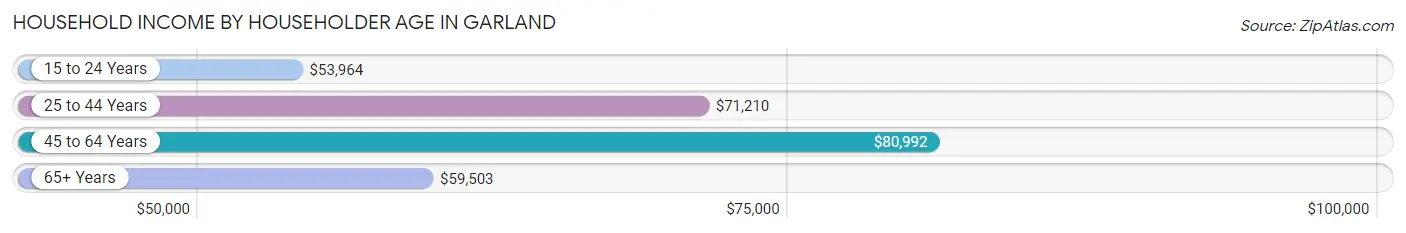
| Income Bracket | # Households | Median Income |
| 15 to 24 Years | 3,590 (4.5%) | $53,964 |
| 25 to 44 Years | 27,754 (34.8%) | $71,210 |
| 45 to 64 Years | 31,972 (40.1%) | $80,992 |
| 65+ Years | 16,454 (20.6%) | $59,503 |
| Total | 79,770 (100.0%) | $71,044 |
Poverty in Garland
Income Below Poverty by Sex and Age in Garland
With 11.4% poverty level for males and 12.1% for females among the residents of Garland, 5 year old males and 5 year old females are the most vulnerable to poverty, with 501 males (32.3%) and 495 females (23.0%) in their respective age groups living below the poverty level.
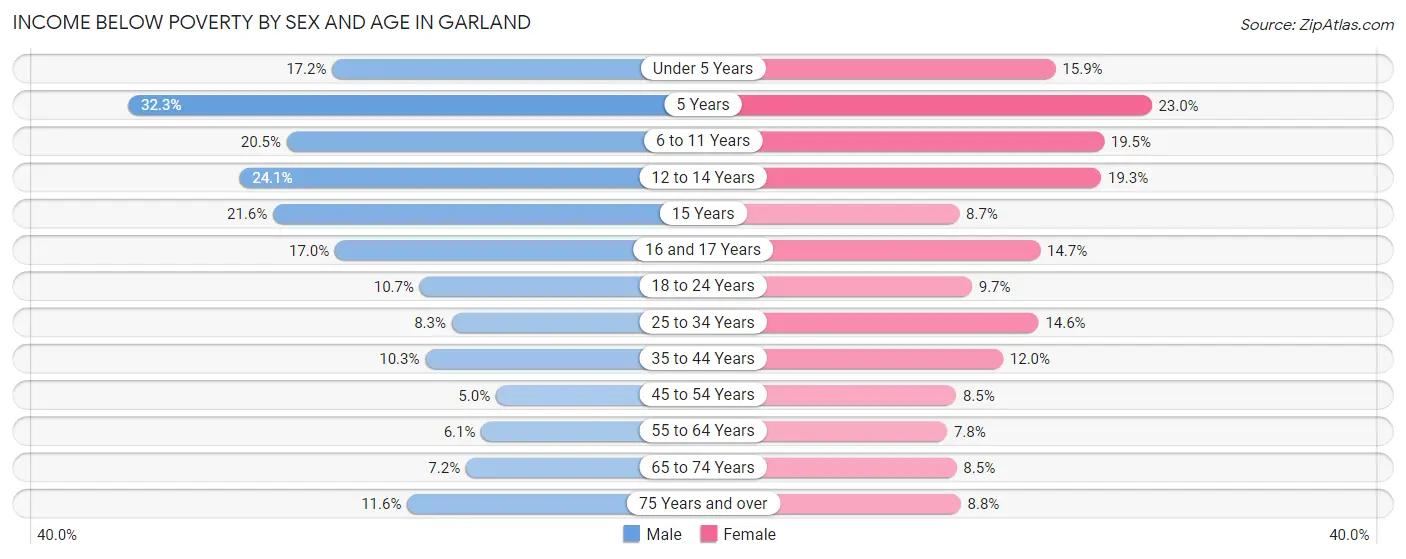
| Age Bracket | Male | Female |
| Under 5 Years | 1,427 (17.2%) | 1,053 (15.9%) |
| 5 Years | 501 (32.3%) | 495 (23.0%) |
| 6 to 11 Years | 2,133 (20.5%) | 2,159 (19.5%) |
| 12 to 14 Years | 1,409 (24.1%) | 1,054 (19.3%) |
| 15 Years | 359 (21.5%) | 148 (8.7%) |
| 16 and 17 Years | 727 (17.0%) | 495 (14.7%) |
| 18 to 24 Years | 1,423 (10.7%) | 1,251 (9.7%) |
| 25 to 34 Years | 1,450 (8.3%) | 2,447 (14.6%) |
| 35 to 44 Years | 1,545 (10.2%) | 1,781 (12.0%) |
| 45 to 54 Years | 713 (5.0%) | 1,317 (8.5%) |
| 55 to 64 Years | 911 (6.1%) | 1,203 (7.8%) |
| 65 to 74 Years | 606 (7.2%) | 883 (8.5%) |
| 75 Years and over | 539 (11.6%) | 559 (8.8%) |
| Total | 13,743 (11.4%) | 14,845 (12.1%) |
Income Above Poverty by Sex and Age in Garland
According to the poverty statistics in Garland, males aged 45 to 54 years and females aged 55 to 64 years are the age groups that are most secure financially, with 95.0% of males and 92.2% of females in these age groups living above the poverty line.
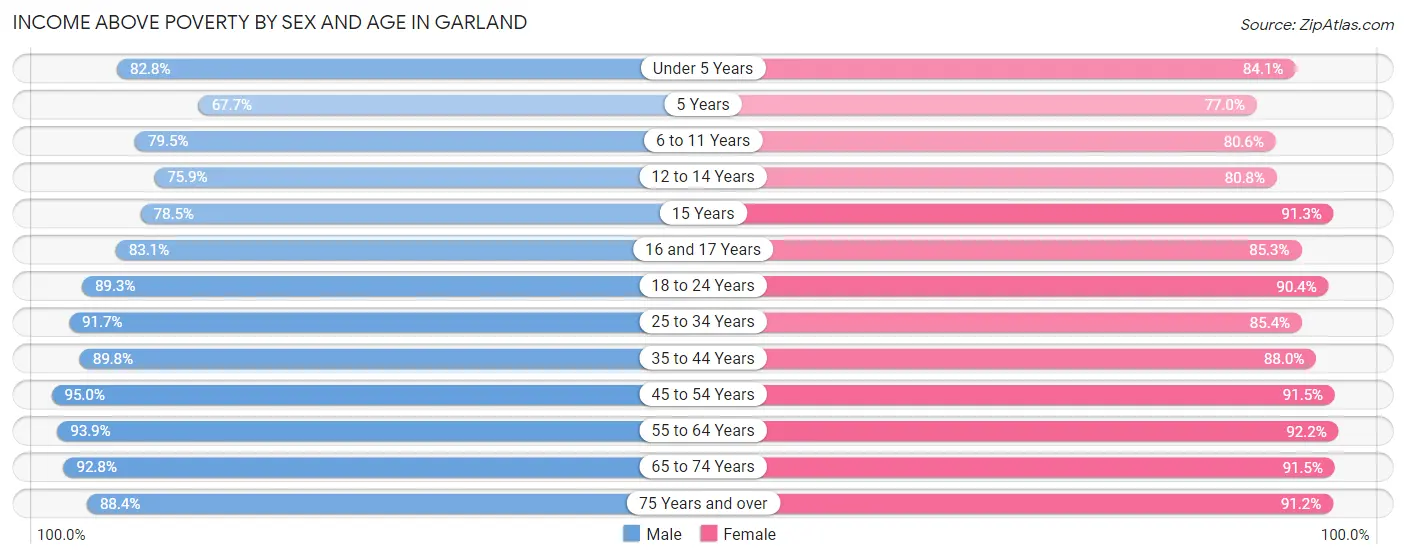
| Age Bracket | Male | Female |
| Under 5 Years | 6,891 (82.8%) | 5,587 (84.1%) |
| 5 Years | 1,049 (67.7%) | 1,658 (77.0%) |
| 6 to 11 Years | 8,257 (79.5%) | 8,939 (80.5%) |
| 12 to 14 Years | 4,448 (75.9%) | 4,421 (80.7%) |
| 15 Years | 1,307 (78.4%) | 1,552 (91.3%) |
| 16 and 17 Years | 3,561 (83.1%) | 2,868 (85.3%) |
| 18 to 24 Years | 11,929 (89.3%) | 11,718 (90.3%) |
| 25 to 34 Years | 16,067 (91.7%) | 14,317 (85.4%) |
| 35 to 44 Years | 13,528 (89.7%) | 13,107 (88.0%) |
| 45 to 54 Years | 13,550 (95.0%) | 14,207 (91.5%) |
| 55 to 64 Years | 14,058 (93.9%) | 14,208 (92.2%) |
| 65 to 74 Years | 7,772 (92.8%) | 9,495 (91.5%) |
| 75 Years and over | 4,110 (88.4%) | 5,781 (91.2%) |
| Total | 106,527 (88.6%) | 107,858 (87.9%) |
Income Below Poverty Among Married-Couple Families in Garland
The poverty statistics for married-couple families in Garland show that 6.1% or 2,529 of the total 41,214 families live below the poverty line. Families with 5 or more children have the highest poverty rate of 20.5%, comprising of 89 families. On the other hand, families with no children have the lowest poverty rate of 3.3%, which includes 718 families.
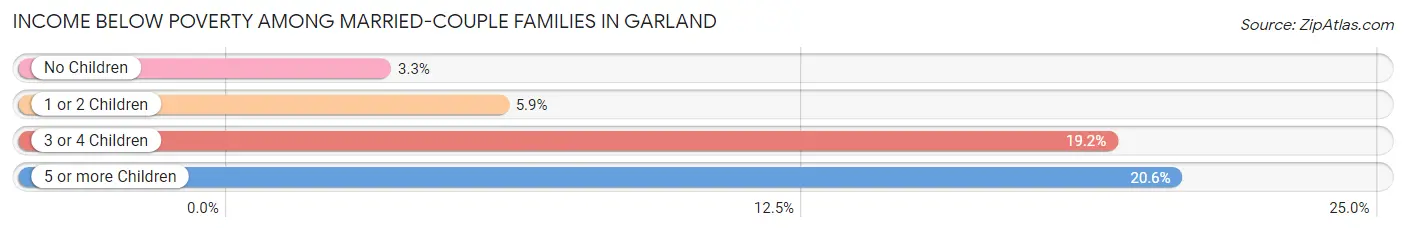
| Children | Above Poverty | Below Poverty |
| No Children | 20,822 (96.7%) | 718 (3.3%) |
| 1 or 2 Children | 13,926 (94.1%) | 871 (5.9%) |
| 3 or 4 Children | 3,593 (80.8%) | 851 (19.2%) |
| 5 or more Children | 344 (79.4%) | 89 (20.5%) |
| Total | 38,685 (93.9%) | 2,529 (6.1%) |
Income Below Poverty Among Single-Parent Households in Garland
According to the poverty data in Garland, 8.0% or 488 single-father households and 19.3% or 2,534 single-mother households are living below the poverty line. Among single-father households, those with 3 or 4 children have the highest poverty rate, with 222 households (34.1%) experiencing poverty. Likewise, among single-mother households, those with 5 or more children have the highest poverty rate, with 94 households (82.5%) falling below the poverty line.
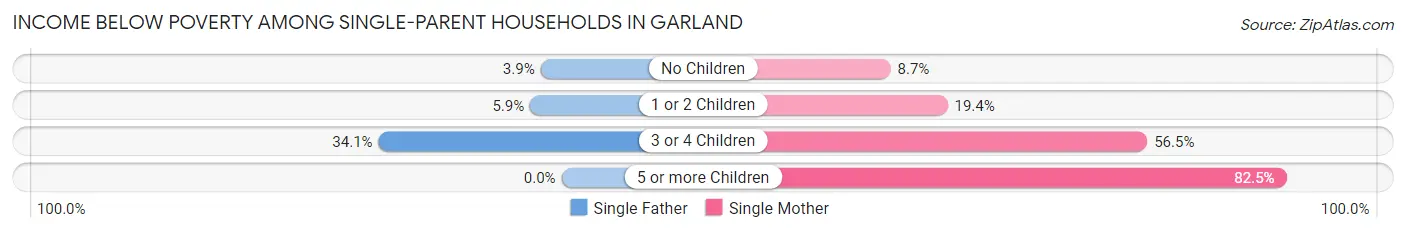
| Children | Single Father | Single Mother |
| No Children | 103 (3.9%) | 497 (8.7%) |
| 1 or 2 Children | 163 (5.9%) | 1,143 (19.4%) |
| 3 or 4 Children | 222 (34.1%) | 800 (56.5%) |
| 5 or more Children | 0 (0.0%) | 94 (82.5%) |
| Total | 488 (8.0%) | 2,534 (19.3%) |
Income Below Poverty Among Married-Couple vs Single-Parent Households in Garland
The poverty data for Garland shows that 2,529 of the married-couple family households (6.1%) and 3,022 of the single-parent households (15.7%) are living below the poverty level. Within the married-couple family households, those with 5 or more children have the highest poverty rate, with 89 households (20.5%) falling below the poverty line. Among the single-parent households, those with 5 or more children have the highest poverty rate, with 94 household (65.7%) living below poverty.
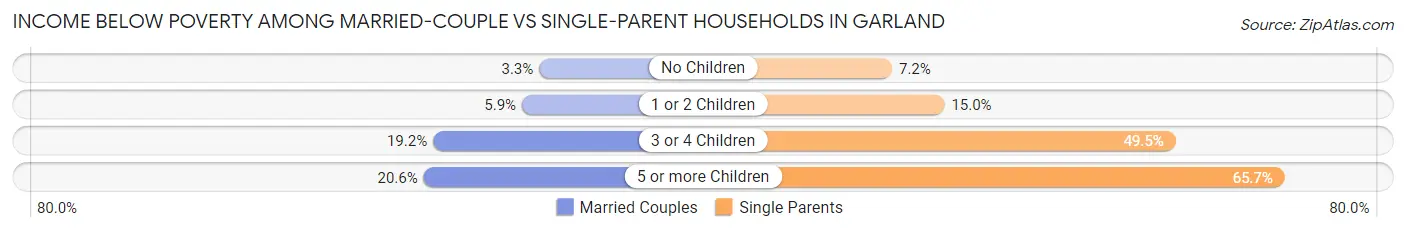
| Children | Married-Couple Families | Single-Parent Households |
| No Children | 718 (3.3%) | 600 (7.2%) |
| 1 or 2 Children | 871 (5.9%) | 1,306 (15.0%) |
| 3 or 4 Children | 851 (19.2%) | 1,022 (49.5%) |
| 5 or more Children | 89 (20.5%) | 94 (65.7%) |
| Total | 2,529 (6.1%) | 3,022 (15.7%) |
Race in Garland
The most populous races in Garland are Hispanic or Latino (108,506 | 44.5%), White / Caucasian (107,362 | 44.0%), and Two or more Races (50,475 | 20.7%).
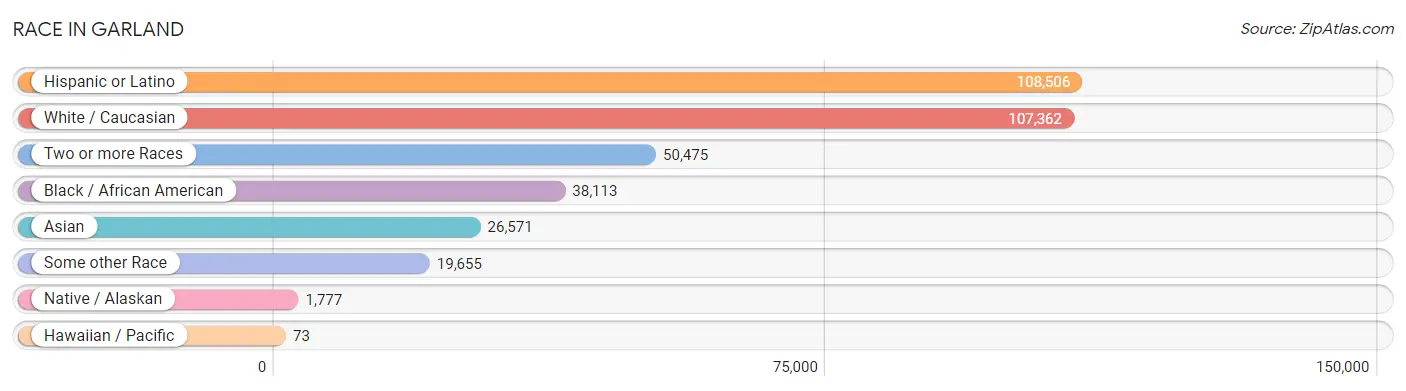
| Race | # Population | % Population |
| Asian | 26,571 | 10.9% |
| Black / African American | 38,113 | 15.6% |
| Hawaiian / Pacific | 73 | 0.0% |
| Hispanic or Latino | 108,506 | 44.5% |
| Native / Alaskan | 1,777 | 0.7% |
| White / Caucasian | 107,362 | 44.0% |
| Two or more Races | 50,475 | 20.7% |
| Some other Race | 19,655 | 8.1% |
| Total | 244,026 | 100.0% |
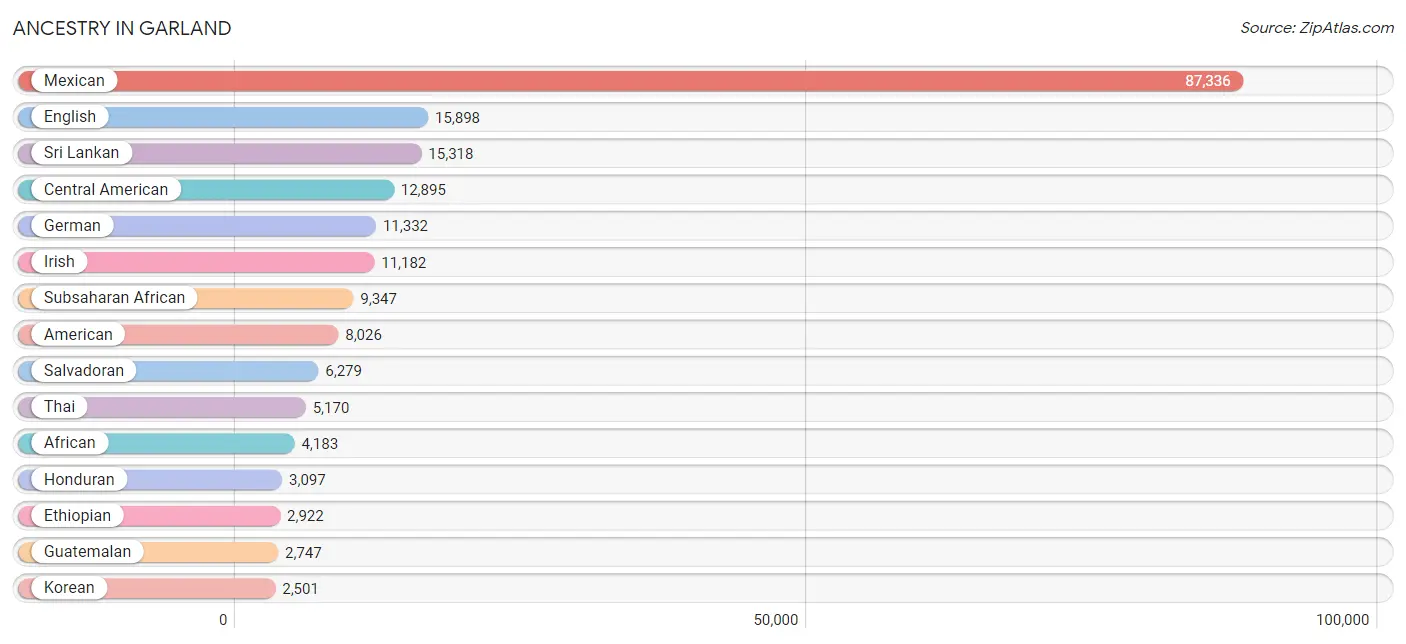
Ancestry in Garland
The most populous ancestries reported in Garland are Mexican (87,336 | 35.8%), English (15,898 | 6.5%), Sri Lankan (15,318 | 6.3%), Central American (12,895 | 5.3%), and German (11,332 | 4.6%), together accounting for 58.5% of all Garland residents.
| Ancestry | # Population | % Population |
| Afghan | 38 | 0.0% |
| African | 4,183 | 1.7% |
| Albanian | 61 | 0.0% |
| American | 8,026 | 3.3% |
| Apache | 142 | 0.1% |
| Arab | 1,239 | 0.5% |
| Argentinean | 226 | 0.1% |
| Australian | 15 | 0.0% |
| Austrian | 56 | 0.0% |
| Barbadian | 16 | 0.0% |
| Belgian | 52 | 0.0% |
| Belizean | 59 | 0.0% |
| Bermudan | 15 | 0.0% |
| Bhutanese | 237 | 0.1% |
| Blackfeet | 69 | 0.0% |
| Bolivian | 59 | 0.0% |
| Brazilian | 329 | 0.1% |
| British | 767 | 0.3% |
| British West Indian | 32 | 0.0% |
| Bulgarian | 29 | 0.0% |
| Burmese | 464 | 0.2% |
| Cajun | 78 | 0.0% |
| Cambodian | 51 | 0.0% |
| Canadian | 134 | 0.1% |
| Central American | 12,895 | 5.3% |
| Central American Indian | 234 | 0.1% |
| Cherokee | 538 | 0.2% |
| Chickasaw | 150 | 0.1% |
| Chilean | 19 | 0.0% |
| Choctaw | 336 | 0.1% |
| Colombian | 547 | 0.2% |
| Comanche | 68 | 0.0% |
| Costa Rican | 82 | 0.0% |
| Creek | 84 | 0.0% |
| Croatian | 36 | 0.0% |
| Cuban | 866 | 0.4% |
| Czech | 465 | 0.2% |
| Czechoslovakian | 41 | 0.0% |
| Danish | 291 | 0.1% |
| Delaware | 9 | 0.0% |
| Dominican | 163 | 0.1% |
| Dutch | 931 | 0.4% |
| Dutch West Indian | 23 | 0.0% |
| Eastern European | 28 | 0.0% |
| Ecuadorian | 194 | 0.1% |
| Egyptian | 125 | 0.1% |
| English | 15,898 | 6.5% |
| Ethiopian | 2,922 | 1.2% |
| European | 1,401 | 0.6% |
| Filipino | 186 | 0.1% |
| Finnish | 144 | 0.1% |
| French | 2,060 | 0.8% |
| French American Indian | 34 | 0.0% |
| French Canadian | 217 | 0.1% |
| German | 11,332 | 4.6% |
| German Russian | 65 | 0.0% |
| Ghanaian | 130 | 0.1% |
| Greek | 205 | 0.1% |
| Guamanian / Chamorro | 57 | 0.0% |
| Guatemalan | 2,747 | 1.1% |
| Haitian | 45 | 0.0% |
| Honduran | 3,097 | 1.3% |
| Hopi | 55 | 0.0% |
| Hungarian | 261 | 0.1% |
| Indian (Asian) | 2,365 | 1.0% |
| Indonesian | 701 | 0.3% |
| Iranian | 248 | 0.1% |
| Iraqi | 118 | 0.1% |
| Irish | 11,182 | 4.6% |
| Italian | 2,094 | 0.9% |
| Jamaican | 315 | 0.1% |
| Japanese | 597 | 0.2% |
| Jordanian | 43 | 0.0% |
| Kenyan | 649 | 0.3% |
| Korean | 2,501 | 1.0% |
| Laotian | 65 | 0.0% |
| Lebanese | 120 | 0.1% |
| Liberian | 216 | 0.1% |
| Lithuanian | 109 | 0.0% |
| Luxembourger | 22 | 0.0% |
| Macedonian | 31 | 0.0% |
| Malaysian | 597 | 0.2% |
| Mexican | 87,336 | 35.8% |
| Mexican American Indian | 912 | 0.4% |
| Mongolian | 136 | 0.1% |
| Moroccan | 73 | 0.0% |
| Native Hawaiian | 150 | 0.1% |
| Navajo | 32 | 0.0% |
| Nicaraguan | 562 | 0.2% |
| Nigerian | 828 | 0.3% |
| Northern European | 394 | 0.2% |
| Norwegian | 825 | 0.3% |
| Osage | 7 | 0.0% |
| Ottawa | 68 | 0.0% |
| Pakistani | 207 | 0.1% |
| Palestinian | 124 | 0.1% |
| Panamanian | 34 | 0.0% |
| Paraguayan | 43 | 0.0% |
| Peruvian | 422 | 0.2% |
| Polish | 1,307 | 0.5% |
| Portuguese | 268 | 0.1% |
| Potawatomi | 6 | 0.0% |
| Pueblo | 7 | 0.0% |
| Puerto Rican | 1,920 | 0.8% |
| Romanian | 50 | 0.0% |
| Russian | 511 | 0.2% |
| Salvadoran | 6,279 | 2.6% |
| Samoan | 13 | 0.0% |
| Scandinavian | 319 | 0.1% |
| Scotch-Irish | 1,561 | 0.6% |
| Scottish | 2,004 | 0.8% |
| Seminole | 55 | 0.0% |
| Serbian | 14 | 0.0% |
| Sioux | 14 | 0.0% |
| Slavic | 62 | 0.0% |
| Slovak | 98 | 0.0% |
| Slovene | 46 | 0.0% |
| Somali | 36 | 0.0% |
| South African | 27 | 0.0% |
| South American | 2,226 | 0.9% |
| Spaniard | 578 | 0.2% |
| Spanish | 75 | 0.0% |
| Sri Lankan | 15,318 | 6.3% |
| Subsaharan African | 9,347 | 3.8% |
| Sudanese | 157 | 0.1% |
| Swedish | 553 | 0.2% |
| Swiss | 54 | 0.0% |
| Syrian | 287 | 0.1% |
| Thai | 5,170 | 2.1% |
| Tohono O'Odham | 53 | 0.0% |
| Tongan | 45 | 0.0% |
| Trinidadian and Tobagonian | 193 | 0.1% |
| Turkish | 172 | 0.1% |
| U.S. Virgin Islander | 128 | 0.1% |
| Ukrainian | 311 | 0.1% |
| Uruguayan | 54 | 0.0% |
| Ute | 5 | 0.0% |
| Venezuelan | 633 | 0.3% |
| Vietnamese | 451 | 0.2% |
| Welsh | 476 | 0.2% |
| West Indian | 234 | 0.1% |
| Yugoslavian | 249 | 0.1% | View All 142 Rows |
Immigrants in Garland
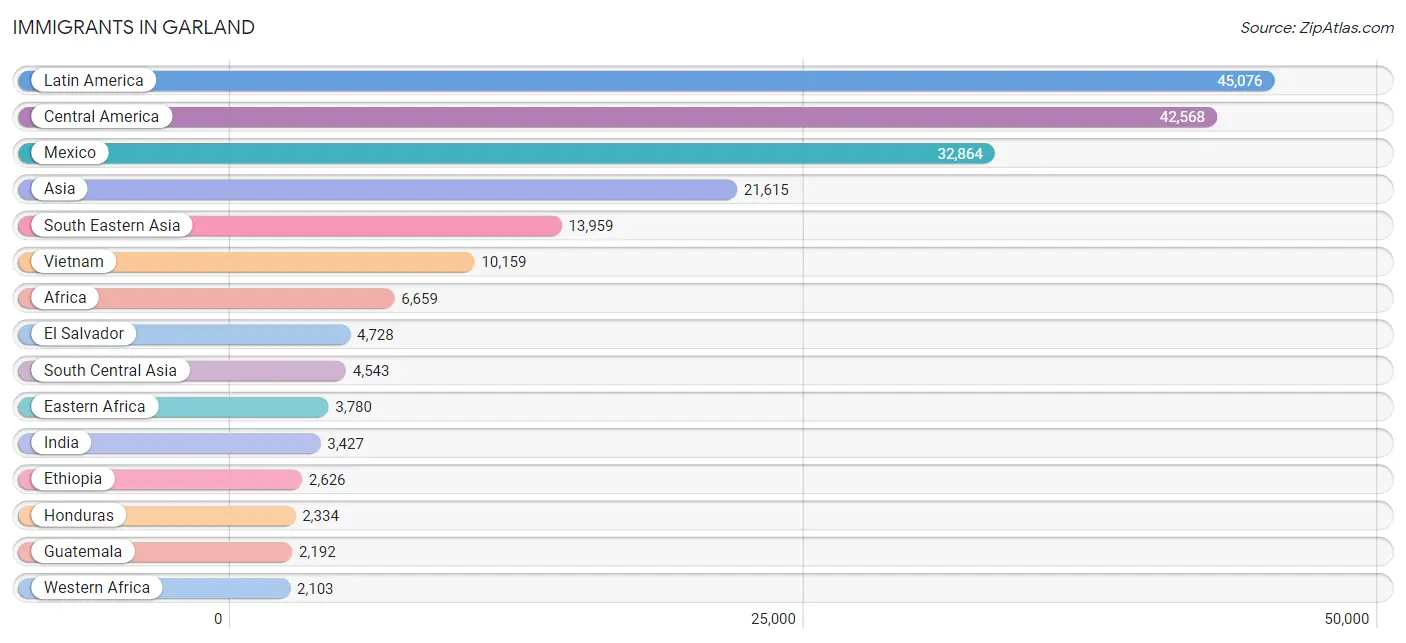
The most numerous immigrant groups reported in Garland came from Latin America (45,076 | 18.5%), Central America (42,568 | 17.4%), Mexico (32,864 | 13.5%), Asia (21,615 | 8.9%), and South Eastern Asia (13,959 | 5.7%), together accounting for 64.0% of all Garland residents.
| Immigration Origin | # Population | % Population |
| Afghanistan | 178 | 0.1% |
| Africa | 6,659 | 2.7% |
| Argentina | 59 | 0.0% |
| Asia | 21,615 | 8.9% |
| Austria | 12 | 0.0% |
| Bahamas | 19 | 0.0% |
| Bangladesh | 277 | 0.1% |
| Belize | 209 | 0.1% |
| Bolivia | 59 | 0.0% |
| Bosnia and Herzegovina | 181 | 0.1% |
| Brazil | 226 | 0.1% |
| Bulgaria | 29 | 0.0% |
| Cambodia | 414 | 0.2% |
| Cameroon | 140 | 0.1% |
| Canada | 336 | 0.1% |
| Caribbean | 739 | 0.3% |
| Central America | 42,568 | 17.4% |
| Chile | 56 | 0.0% |
| China | 1,539 | 0.6% |
| Colombia | 380 | 0.2% |
| Costa Rica | 5 | 0.0% |
| Cuba | 225 | 0.1% |
| Dominican Republic | 83 | 0.0% |
| Eastern Africa | 3,780 | 1.5% |
| Eastern Asia | 1,982 | 0.8% |
| Eastern Europe | 707 | 0.3% |
| Ecuador | 227 | 0.1% |
| Egypt | 105 | 0.0% |
| El Salvador | 4,728 | 1.9% |
| England | 77 | 0.0% |
| Eritrea | 542 | 0.2% |
| Ethiopia | 2,626 | 1.1% |
| Europe | 1,324 | 0.5% |
| France | 56 | 0.0% |
| Germany | 179 | 0.1% |
| Ghana | 329 | 0.1% |
| Greece | 22 | 0.0% |
| Grenada | 32 | 0.0% |
| Guatemala | 2,192 | 0.9% |
| Haiti | 16 | 0.0% |
| Honduras | 2,334 | 1.0% |
| Hong Kong | 237 | 0.1% |
| Hungary | 10 | 0.0% |
| India | 3,427 | 1.4% |
| Indonesia | 26 | 0.0% |
| Iran | 262 | 0.1% |
| Iraq | 86 | 0.0% |
| Israel | 26 | 0.0% |
| Italy | 14 | 0.0% |
| Jamaica | 189 | 0.1% |
| Japan | 100 | 0.0% |
| Jordan | 135 | 0.1% |
| Kazakhstan | 32 | 0.0% |
| Kenya | 284 | 0.1% |
| Korea | 343 | 0.1% |
| Kuwait | 66 | 0.0% |
| Laos | 475 | 0.2% |
| Latin America | 45,076 | 18.5% |
| Lebanon | 1 | 0.0% |
| Liberia | 88 | 0.0% |
| Malaysia | 489 | 0.2% |
| Mexico | 32,864 | 13.5% |
| Middle Africa | 199 | 0.1% |
| Morocco | 61 | 0.0% |
| Nepal | 23 | 0.0% |
| Netherlands | 17 | 0.0% |
| Nicaragua | 211 | 0.1% |
| Nigeria | 1,661 | 0.7% |
| North Macedonia | 31 | 0.0% |
| Northern Africa | 208 | 0.1% |
| Northern Europe | 277 | 0.1% |
| Oceania | 34 | 0.0% |
| Pakistan | 266 | 0.1% |
| Panama | 25 | 0.0% |
| Peru | 217 | 0.1% |
| Philippines | 1,700 | 0.7% |
| Poland | 71 | 0.0% |
| Portugal | 21 | 0.0% |
| Romania | 23 | 0.0% |
| Russia | 69 | 0.0% |
| Saudi Arabia | 170 | 0.1% |
| Scotland | 130 | 0.1% |
| Serbia | 7 | 0.0% |
| Sierra Leone | 25 | 0.0% |
| South Africa | 46 | 0.0% |
| South America | 1,769 | 0.7% |
| South Central Asia | 4,543 | 1.9% |
| South Eastern Asia | 13,959 | 5.7% |
| Southern Europe | 57 | 0.0% |
| Sri Lanka | 22 | 0.0% |
| Sudan | 30 | 0.0% |
| Sweden | 12 | 0.0% |
| Syria | 345 | 0.1% |
| Taiwan | 386 | 0.2% |
| Thailand | 125 | 0.1% |
| Trinidad and Tobago | 175 | 0.1% |
| Turkey | 151 | 0.1% |
| Uganda | 45 | 0.0% |
| Ukraine | 259 | 0.1% |
| Uruguay | 54 | 0.0% |
| Uzbekistan | 35 | 0.0% |
| Venezuela | 470 | 0.2% |
| Vietnam | 10,159 | 4.2% |
| Western Africa | 2,103 | 0.9% |
| Western Asia | 1,115 | 0.5% |
| Western Europe | 264 | 0.1% |
| Yemen | 103 | 0.0% |
| Zaire | 59 | 0.0% |
| Zimbabwe | 153 | 0.1% | View All 109 Rows |
Sex and Age in Garland
Sex and Age in Garland
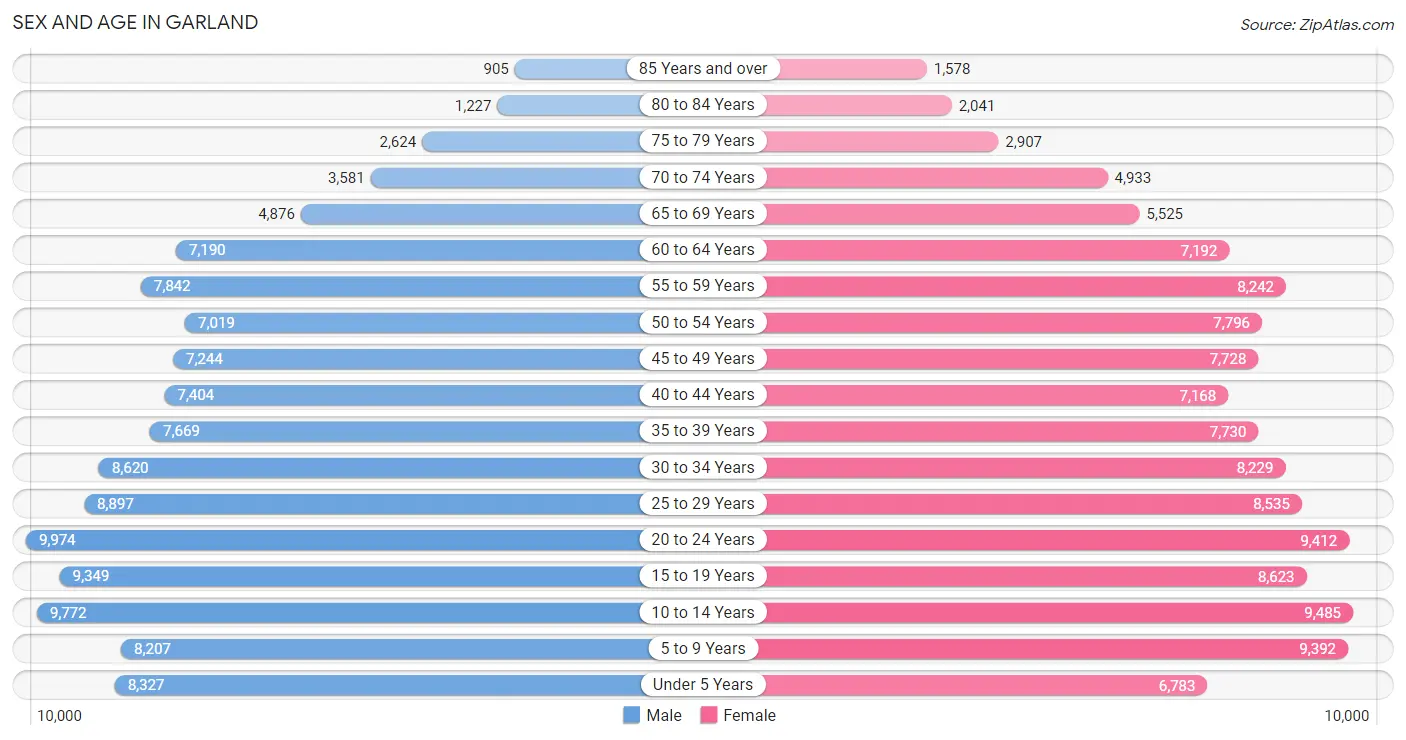
The most populous age groups in Garland are 20 to 24 Years (9,974 | 8.3%) for men and 10 to 14 Years (9,485 | 7.7%) for women.
| Age Bracket | Male | Female |
| Under 5 Years | 8,327 (6.9%) | 6,783 (5.5%) |
| 5 to 9 Years | 8,207 (6.8%) | 9,392 (7.6%) |
| 10 to 14 Years | 9,772 (8.1%) | 9,485 (7.7%) |
| 15 to 19 Years | 9,349 (7.7%) | 8,623 (7.0%) |
| 20 to 24 Years | 9,974 (8.3%) | 9,412 (7.6%) |
| 25 to 29 Years | 8,897 (7.4%) | 8,535 (6.9%) |
| 30 to 34 Years | 8,620 (7.1%) | 8,229 (6.7%) |
| 35 to 39 Years | 7,669 (6.4%) | 7,730 (6.3%) |
| 40 to 44 Years | 7,404 (6.1%) | 7,168 (5.8%) |
| 45 to 49 Years | 7,244 (6.0%) | 7,728 (6.3%) |
| 50 to 54 Years | 7,019 (5.8%) | 7,796 (6.3%) |
| 55 to 59 Years | 7,842 (6.5%) | 8,242 (6.7%) |
| 60 to 64 Years | 7,190 (6.0%) | 7,192 (5.8%) |
| 65 to 69 Years | 4,876 (4.0%) | 5,525 (4.5%) |
| 70 to 74 Years | 3,581 (3.0%) | 4,933 (4.0%) |
| 75 to 79 Years | 2,624 (2.2%) | 2,907 (2.4%) |
| 80 to 84 Years | 1,227 (1.0%) | 2,041 (1.7%) |
| 85 Years and over | 905 (0.7%) | 1,578 (1.3%) |
| Total | 120,727 (100.0%) | 123,299 (100.0%) |
Families and Households in Garland
Median Family Size in Garland
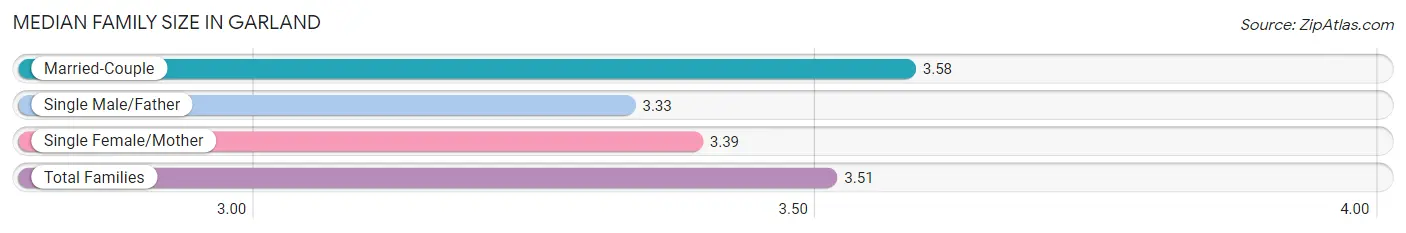
The median family size in Garland is 3.51 persons per family, with married-couple families (41,214 | 68.2%) accounting for the largest median family size of 3.58 persons per family. On the other hand, single male/father families (6,100 | 10.1%) represent the smallest median family size with 3.33 persons per family.
| Family Type | # Families | Family Size |
| Married-Couple | 41,214 (68.2%) | 3.58 |
| Single Male/Father | 6,100 (10.1%) | 3.33 |
| Single Female/Mother | 13,123 (21.7%) | 3.39 |
| Total Families | 60,437 (100.0%) | 3.51 |
Median Household Size in Garland
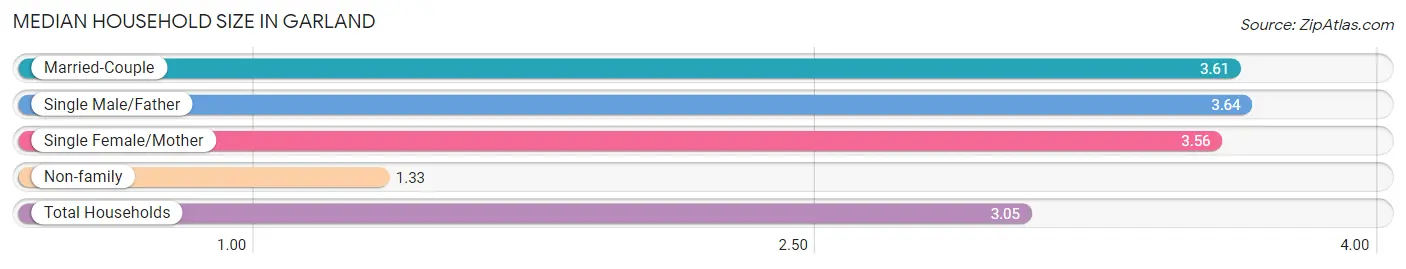
The median household size in Garland is 3.05 persons per household, with single male/father households (6,100 | 7.6%) accounting for the largest median household size of 3.64 persons per household. non-family households (19,333 | 24.2%) represent the smallest median household size with 1.33 persons per household.
| Household Type | # Households | Household Size |
| Married-Couple | 41,214 (51.7%) | 3.61 |
| Single Male/Father | 6,100 (7.6%) | 3.64 |
| Single Female/Mother | 13,123 (16.5%) | 3.56 |
| Non-family | 19,333 (24.2%) | 1.33 |
| Total Households | 79,770 (100.0%) | 3.05 |
Household Size by Marriage Status in Garland
Out of a total of 79,770 households in Garland, 60,437 (75.8%) are family households, while 19,333 (24.2%) are nonfamily households. The most numerous type of family households are 2-person households, comprising 21,420, and the most common type of nonfamily households are 1-person households, comprising 14,921.
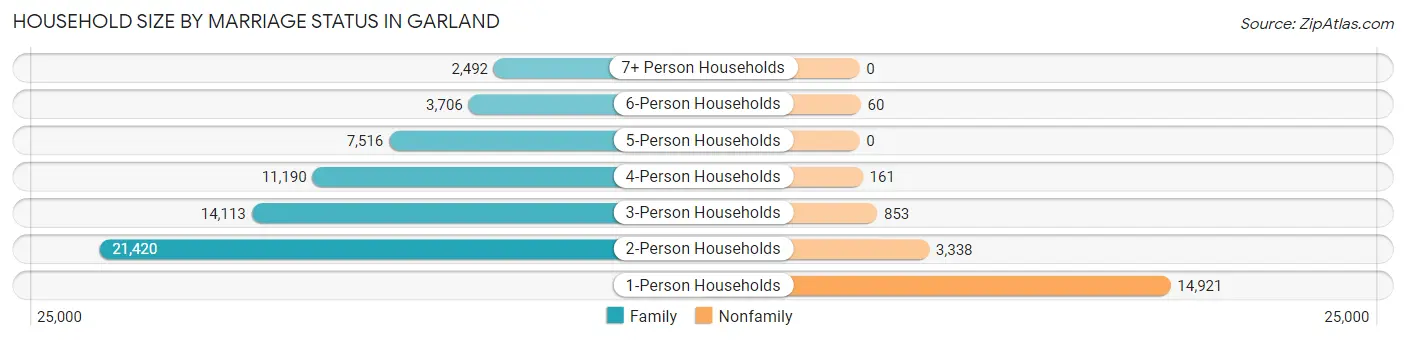
| Household Size | Family Households | Nonfamily Households |
| 1-Person Households | - | 14,921 (18.7%) |
| 2-Person Households | 21,420 (26.9%) | 3,338 (4.2%) |
| 3-Person Households | 14,113 (17.7%) | 853 (1.1%) |
| 4-Person Households | 11,190 (14.0%) | 161 (0.2%) |
| 5-Person Households | 7,516 (9.4%) | 0 (0.0%) |
| 6-Person Households | 3,706 (4.6%) | 60 (0.1%) |
| 7+ Person Households | 2,492 (3.1%) | 0 (0.0%) |
| Total | 60,437 (75.8%) | 19,333 (24.2%) |
Female Fertility in Garland
Fertility by Age in Garland
Average fertility rate in Garland is 46.0 births per 1,000 women. Women in the age bracket of 20 to 34 years have the highest fertility rate with 74.0 births per 1,000 women. Women in the age bracket of 20 to 34 years acount for 70.8% of all women with births.
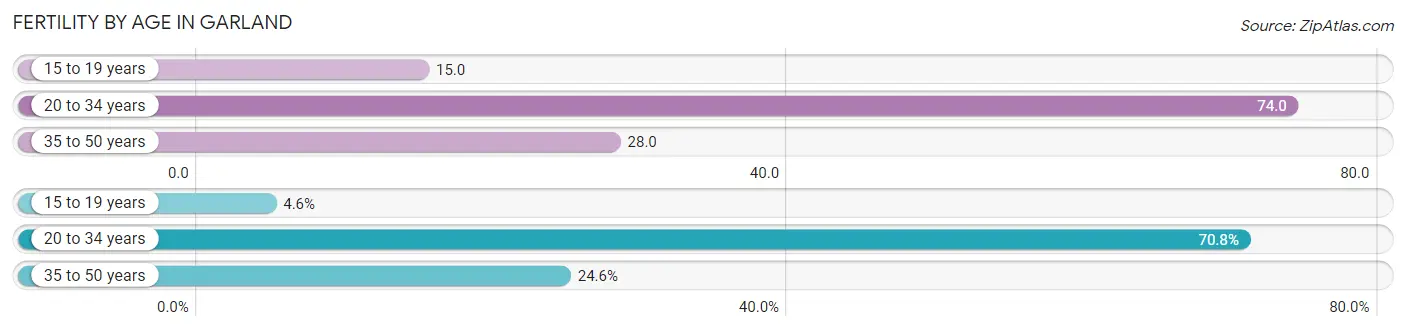
| Age Bracket | Women with Births | Births / 1,000 Women |
| 15 to 19 years | 127 (4.6%) | 15.0 |
| 20 to 34 years | 1,940 (70.8%) | 74.0 |
| 35 to 50 years | 675 (24.6%) | 28.0 |
| Total | 2,742 (100.0%) | 46.0 |
Fertility by Age by Marriage Status in Garland
62.6% of women with births (2,742) in Garland are married. The highest percentage of unmarried women with births falls into 20 to 34 years age bracket with 44.5% of them unmarried at the time of birth, while the lowest percentage of unmarried women with births belong to 35 to 50 years age bracket with 16.6% of them unmarried.
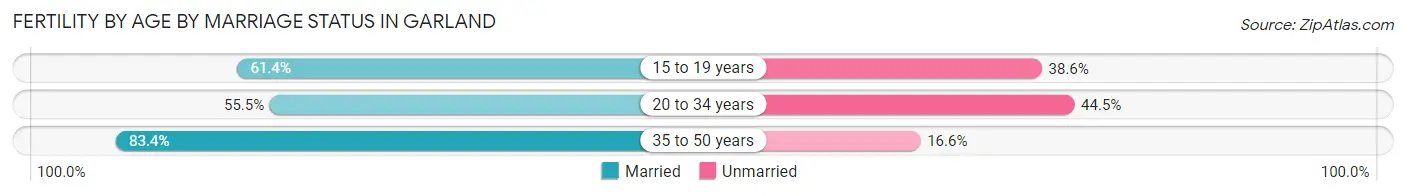
| Age Bracket | Married | Unmarried |
| 15 to 19 years | 78 (61.4%) | 49 (38.6%) |
| 20 to 34 years | 1,077 (55.5%) | 863 (44.5%) |
| 35 to 50 years | 563 (83.4%) | 112 (16.6%) |
| Total | 1,716 (62.6%) | 1,026 (37.4%) |
Fertility by Education in Garland
Average fertility rate in Garland is 46.0 births per 1,000 women. Women with the education attainment of bachelor's degree have the highest fertility rate of 63.0 births per 1,000 women, while women with the education attainment of less than high school have the lowest fertility at 22.0 births per 1,000 women. Women with the education attainment of college or associate's degree represent 36.5% of all women with births.
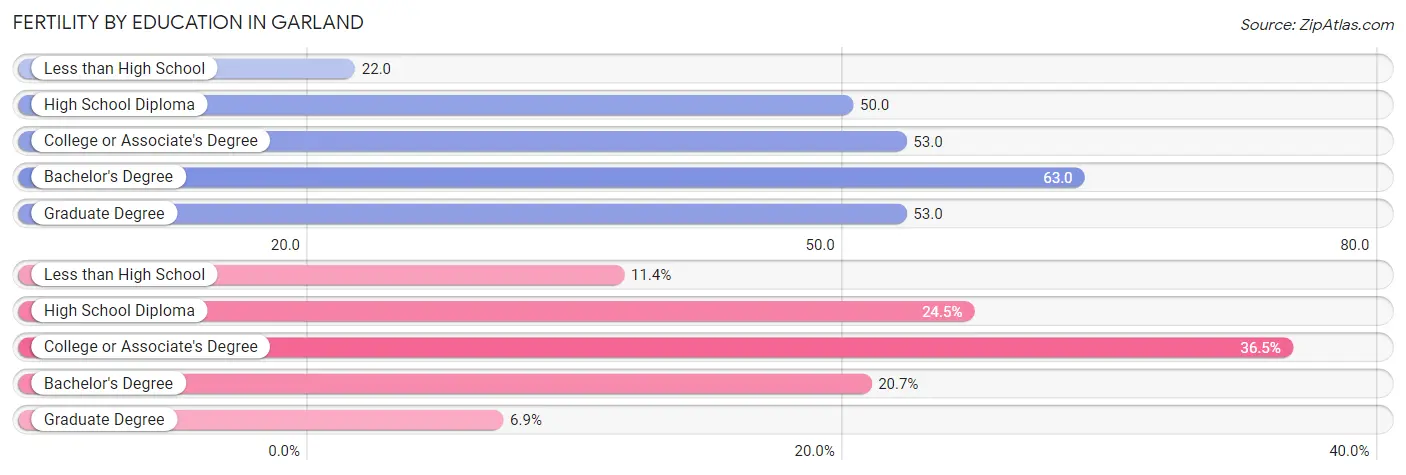
| Educational Attainment | Women with Births | Births / 1,000 Women |
| Less than High School | 313 (11.4%) | 22.0 |
| High School Diploma | 673 (24.5%) | 50.0 |
| College or Associate's Degree | 1,000 (36.5%) | 53.0 |
| Bachelor's Degree | 567 (20.7%) | 63.0 |
| Graduate Degree | 189 (6.9%) | 53.0 |
| Total | 2,742 (100.0%) | 46.0 |
Fertility by Education by Marriage Status in Garland
37.4% of women with births in Garland are unmarried. Women with the educational attainment of graduate degree are most likely to be married with 100.0% of them married at childbirth, while women with the educational attainment of high school diploma are least likely to be married with 56.2% of them unmarried at childbirth.
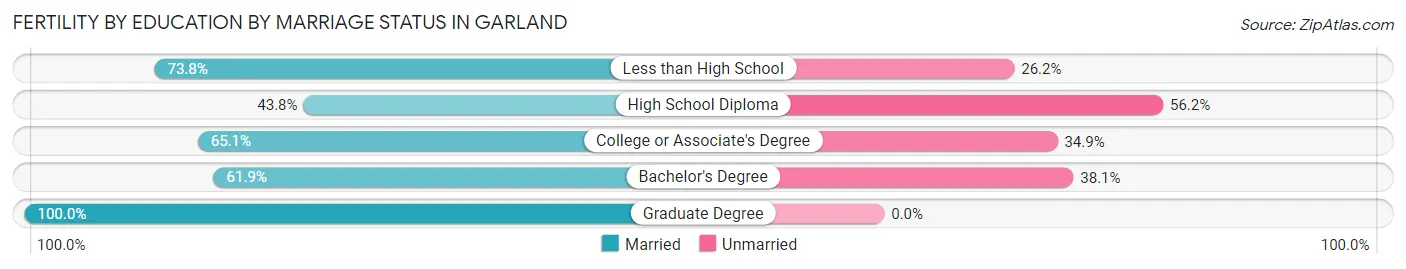
| Educational Attainment | Married | Unmarried |
| Less than High School | 231 (73.8%) | 82 (26.2%) |
| High School Diploma | 295 (43.8%) | 378 (56.2%) |
| College or Associate's Degree | 651 (65.1%) | 349 (34.9%) |
| Bachelor's Degree | 351 (61.9%) | 216 (38.1%) |
| Graduate Degree | 189 (100.0%) | 0 (0.0%) |
| Total | 1,716 (62.6%) | 1,026 (37.4%) |
Employment Characteristics in Garland
Employment by Class of Employer in Garland
Among the 120,174 employed individuals in Garland, private company employees (91,457 | 76.1%), self-employed (not incorporated) (8,592 | 7.1%), and not-for-profit organizations (6,676 | 5.6%) make up the most common classes of employment.
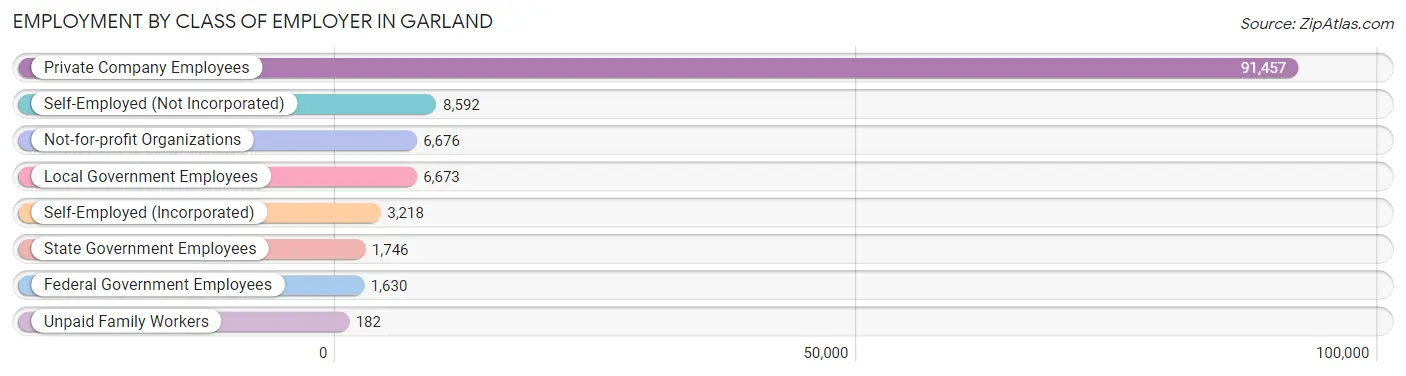
| Employer Class | # Employees | % Employees |
| Private Company Employees | 91,457 | 76.1% |
| Self-Employed (Incorporated) | 3,218 | 2.7% |
| Self-Employed (Not Incorporated) | 8,592 | 7.1% |
| Not-for-profit Organizations | 6,676 | 5.6% |
| Local Government Employees | 6,673 | 5.6% |
| State Government Employees | 1,746 | 1.5% |
| Federal Government Employees | 1,630 | 1.4% |
| Unpaid Family Workers | 182 | 0.2% |
| Total | 120,174 | 100.0% |
Employment Status by Age in Garland
According to the labor force statistics for Garland, out of the total population over 16 years of age (188,694), 68.9% or 130,010 individuals are in the labor force, with 5.2% or 6,761 of them unemployed. The age group with the highest labor force participation rate is 35 to 44 years, with 85.2% or 25,535 individuals in the labor force. Within the labor force, the 16 to 19 years age range has the highest percentage of unemployed individuals, with 16.8% or 910 of them being unemployed.
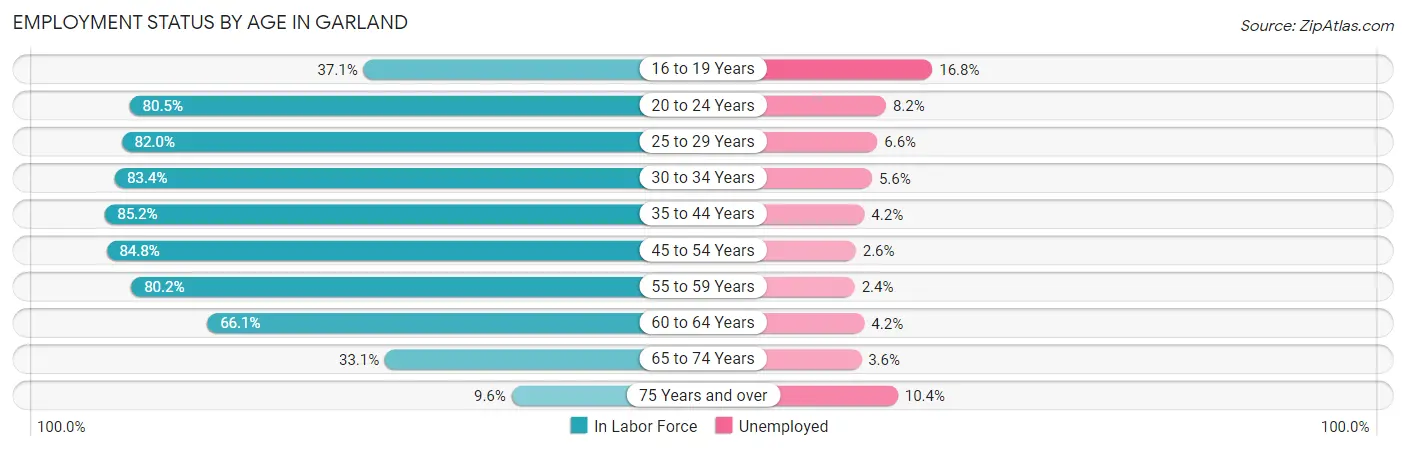
| Age Bracket | In Labor Force | Unemployed |
| 16 to 19 Years | 5,419 (37.1%) | 910 (16.8%) |
| 20 to 24 Years | 15,606 (80.5%) | 1,280 (8.2%) |
| 25 to 29 Years | 14,294 (82.0%) | 943 (6.6%) |
| 30 to 34 Years | 14,052 (83.4%) | 787 (5.6%) |
| 35 to 44 Years | 25,535 (85.2%) | 1,072 (4.2%) |
| 45 to 54 Years | 25,259 (84.8%) | 657 (2.6%) |
| 55 to 59 Years | 12,899 (80.2%) | 310 (2.4%) |
| 60 to 64 Years | 9,507 (66.1%) | 399 (4.2%) |
| 65 to 74 Years | 6,261 (33.1%) | 225 (3.6%) |
| 75 Years and over | 1,083 (9.6%) | 113 (10.4%) |
| Total | 130,010 (68.9%) | 6,761 (5.2%) |
Employment Status by Educational Attainment in Garland
According to labor force statistics for Garland, 81.6% of individuals (101,596) out of the total population between 25 and 64 years of age (124,505) are in the labor force, with 4.1% or 4,165 of them being unemployed. The group with the highest labor force participation rate are those with the educational attainment of bachelor's degree or higher, with 87.2% or 25,032 individuals in the labor force. Within the labor force, individuals with high school diploma education have the highest percentage of unemployment, with 5.2% or 1,307 of them being unemployed.
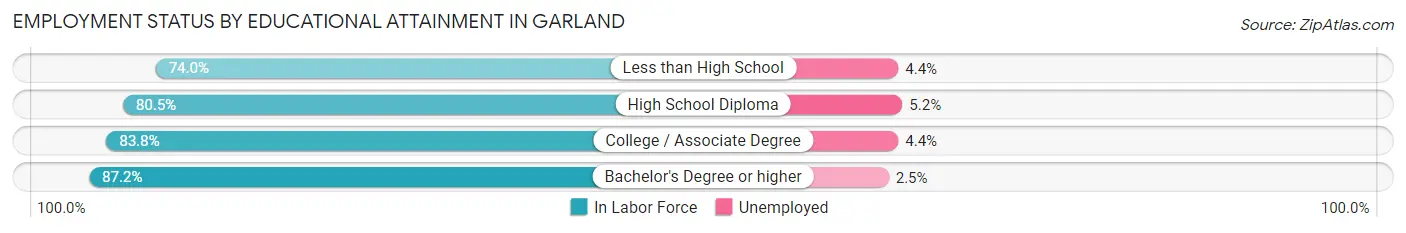
| Educational Attainment | In Labor Force | Unemployed |
| Less than High School | 20,380 (74.0%) | 1,212 (4.4%) |
| High School Diploma | 25,139 (80.5%) | 1,624 (5.2%) |
| College / Associate Degree | 31,032 (83.8%) | 1,629 (4.4%) |
| Bachelor's Degree or higher | 25,032 (87.2%) | 718 (2.5%) |
| Total | 101,596 (81.6%) | 5,105 (4.1%) |
Employment Occupations by Sex in Garland
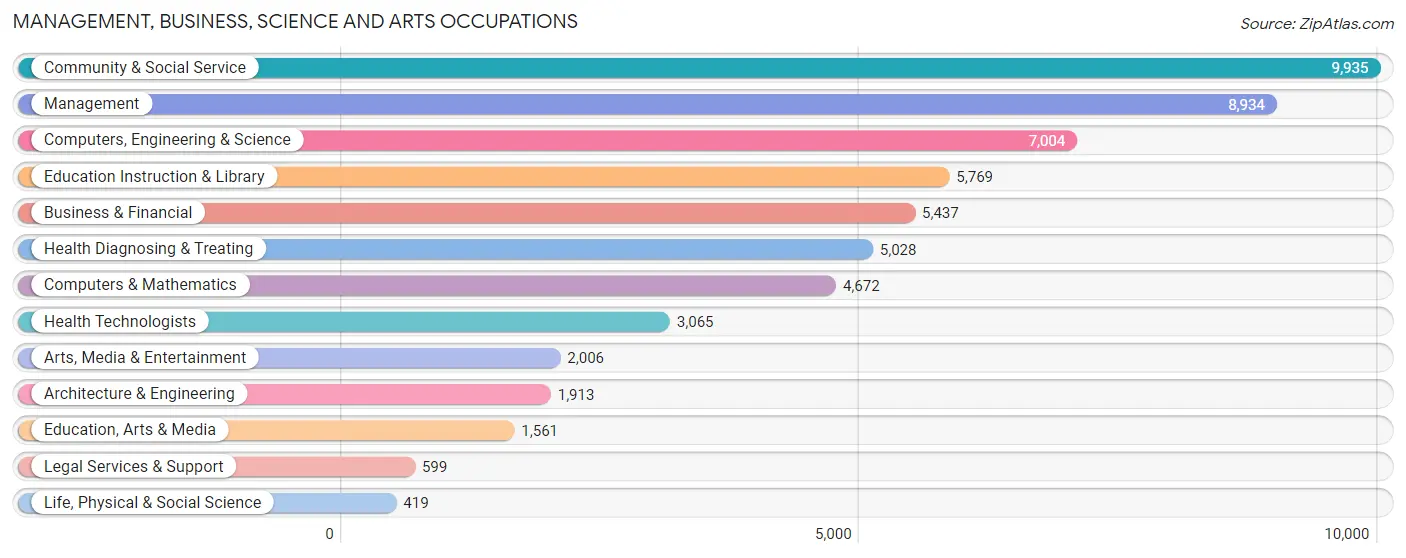
Management, Business, Science and Arts Occupations
The most common Management, Business, Science and Arts occupations in Garland are Community & Social Service (9,935 | 8.1%), Management (8,934 | 7.3%), Computers, Engineering & Science (7,004 | 5.7%), Education Instruction & Library (5,769 | 4.7%), and Business & Financial (5,437 | 4.4%).
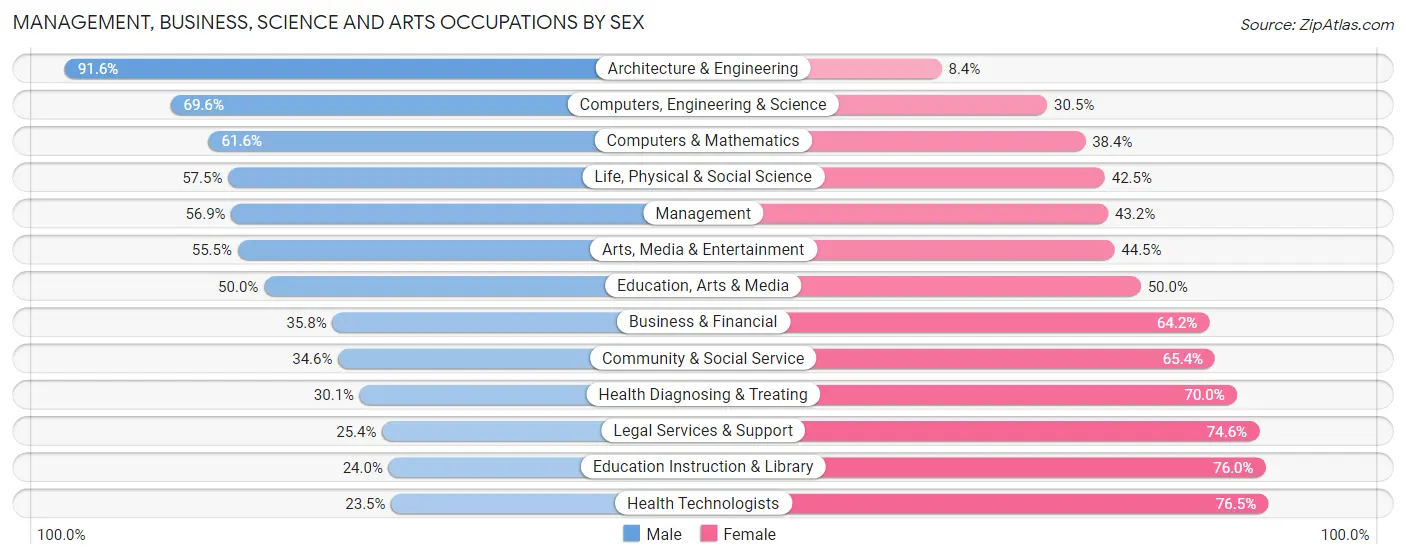
Management, Business, Science and Arts Occupations by Sex
Within the Management, Business, Science and Arts occupations in Garland, the most male-oriented occupations are Architecture & Engineering (91.6%), Computers, Engineering & Science (69.6%), and Computers & Mathematics (61.6%), while the most female-oriented occupations are Health Technologists (76.5%), Education Instruction & Library (76.0%), and Legal Services & Support (74.6%).
| Occupation | Male | Female |
| Management | 5,079 (56.9%) | 3,855 (43.1%) |
| Business & Financial | 1,944 (35.8%) | 3,493 (64.2%) |
| Computers, Engineering & Science | 4,871 (69.6%) | 2,133 (30.4%) |
| Computers & Mathematics | 2,878 (61.6%) | 1,794 (38.4%) |
| Architecture & Engineering | 1,752 (91.6%) | 161 (8.4%) |
| Life, Physical & Social Science | 241 (57.5%) | 178 (42.5%) |
| Community & Social Service | 3,434 (34.6%) | 6,501 (65.4%) |
| Education, Arts & Media | 781 (50.0%) | 780 (50.0%) |
| Legal Services & Support | 152 (25.4%) | 447 (74.6%) |
| Education Instruction & Library | 1,387 (24.0%) | 4,382 (76.0%) |
| Arts, Media & Entertainment | 1,114 (55.5%) | 892 (44.5%) |
| Health Diagnosing & Treating | 1,511 (30.0%) | 3,517 (70.0%) |
| Health Technologists | 720 (23.5%) | 2,345 (76.5%) |
| Total (Category) | 16,839 (46.3%) | 19,499 (53.7%) |
| Total (Overall) | 66,962 (54.4%) | 56,172 (45.6%) |
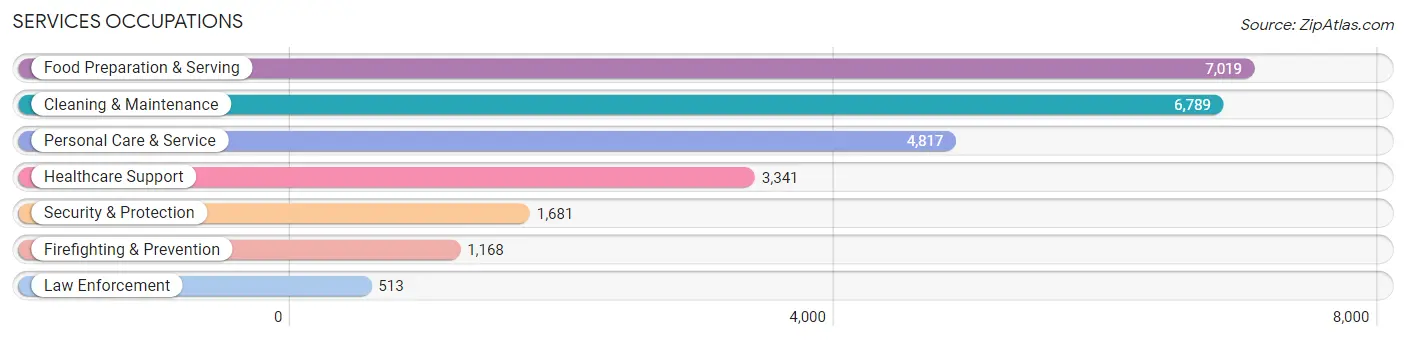
Services Occupations
The most common Services occupations in Garland are Food Preparation & Serving (7,019 | 5.7%), Cleaning & Maintenance (6,789 | 5.5%), Personal Care & Service (4,817 | 3.9%), Healthcare Support (3,341 | 2.7%), and Security & Protection (1,681 | 1.4%).
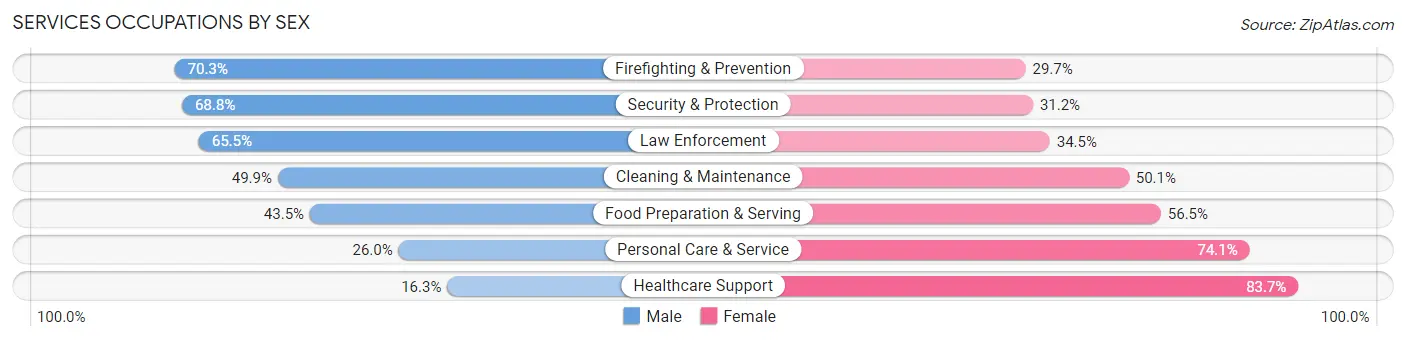
Services Occupations by Sex
Within the Services occupations in Garland, the most male-oriented occupations are Firefighting & Prevention (70.3%), Security & Protection (68.8%), and Law Enforcement (65.5%), while the most female-oriented occupations are Healthcare Support (83.7%), Personal Care & Service (74.1%), and Food Preparation & Serving (56.5%).
| Occupation | Male | Female |
| Healthcare Support | 545 (16.3%) | 2,796 (83.7%) |
| Security & Protection | 1,157 (68.8%) | 524 (31.2%) |
| Firefighting & Prevention | 821 (70.3%) | 347 (29.7%) |
| Law Enforcement | 336 (65.5%) | 177 (34.5%) |
| Food Preparation & Serving | 3,053 (43.5%) | 3,966 (56.5%) |
| Cleaning & Maintenance | 3,385 (49.9%) | 3,404 (50.1%) |
| Personal Care & Service | 1,250 (26.0%) | 3,567 (74.1%) |
| Total (Category) | 9,390 (39.7%) | 14,257 (60.3%) |
| Total (Overall) | 66,962 (54.4%) | 56,172 (45.6%) |
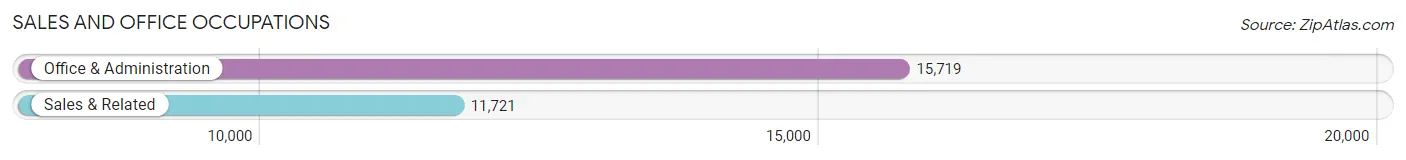
Sales and Office Occupations
The most common Sales and Office occupations in Garland are Office & Administration (15,719 | 12.8%), and Sales & Related (11,721 | 9.5%).
Sales and Office Occupations by Sex
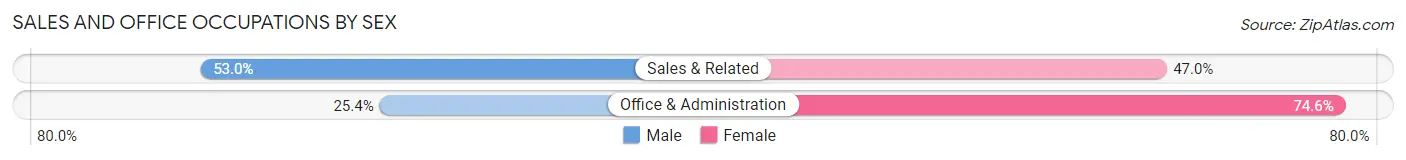
| Occupation | Male | Female |
| Sales & Related | 6,210 (53.0%) | 5,511 (47.0%) |
| Office & Administration | 3,992 (25.4%) | 11,727 (74.6%) |
| Total (Category) | 10,202 (37.2%) | 17,238 (62.8%) |
| Total (Overall) | 66,962 (54.4%) | 56,172 (45.6%) |
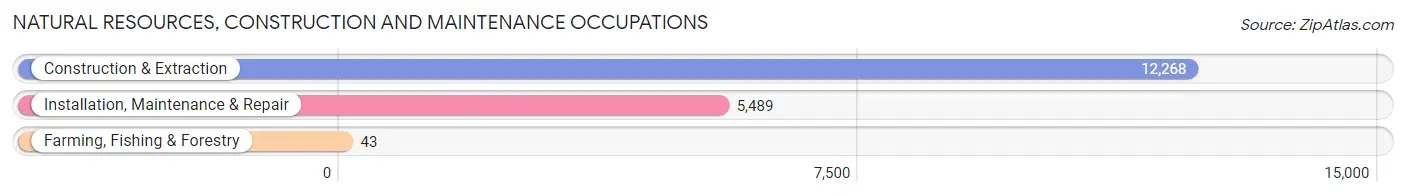
Natural Resources, Construction and Maintenance Occupations
The most common Natural Resources, Construction and Maintenance occupations in Garland are Construction & Extraction (12,268 | 10.0%), Installation, Maintenance & Repair (5,489 | 4.5%), and Farming, Fishing & Forestry (43 | 0.0%).
Natural Resources, Construction and Maintenance Occupations by Sex
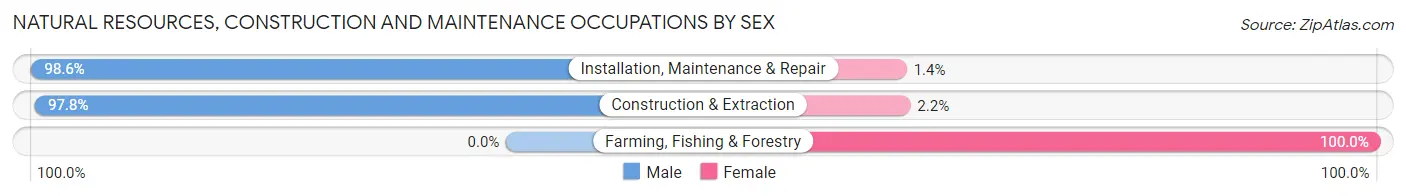
| Occupation | Male | Female |
| Farming, Fishing & Forestry | 0 (0.0%) | 43 (100.0%) |
| Construction & Extraction | 12,001 (97.8%) | 267 (2.2%) |
| Installation, Maintenance & Repair | 5,411 (98.6%) | 78 (1.4%) |
| Total (Category) | 17,412 (97.8%) | 388 (2.2%) |
| Total (Overall) | 66,962 (54.4%) | 56,172 (45.6%) |
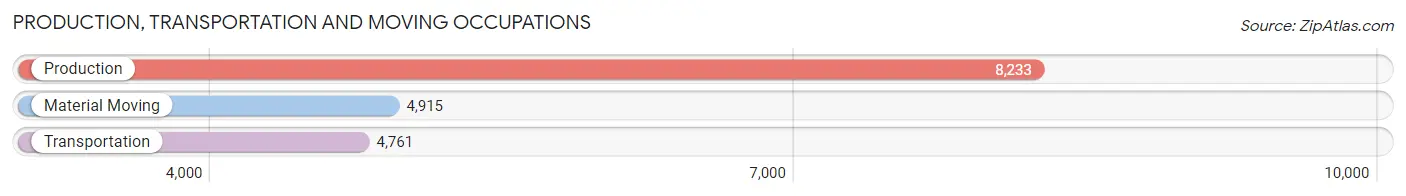
Production, Transportation and Moving Occupations
The most common Production, Transportation and Moving occupations in Garland are Production (8,233 | 6.7%), Material Moving (4,915 | 4.0%), and Transportation (4,761 | 3.9%).
Production, Transportation and Moving Occupations by Sex
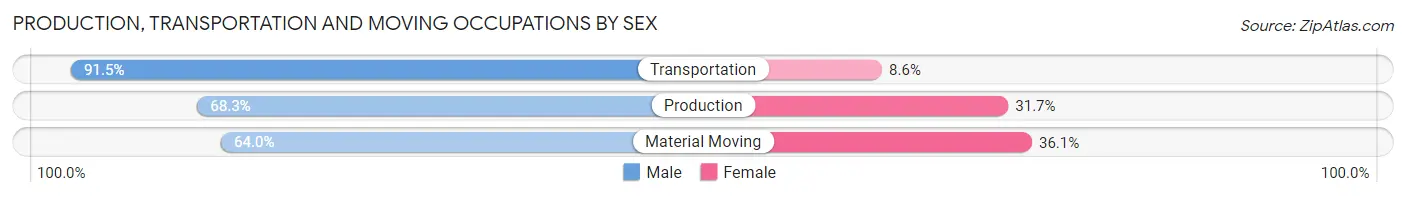
| Occupation | Male | Female |
| Production | 5,622 (68.3%) | 2,611 (31.7%) |
| Transportation | 4,354 (91.4%) | 407 (8.6%) |
| Material Moving | 3,143 (63.9%) | 1,772 (36.0%) |
| Total (Category) | 13,119 (73.3%) | 4,790 (26.8%) |
| Total (Overall) | 66,962 (54.4%) | 56,172 (45.6%) |
Employment Industries by Sex in Garland
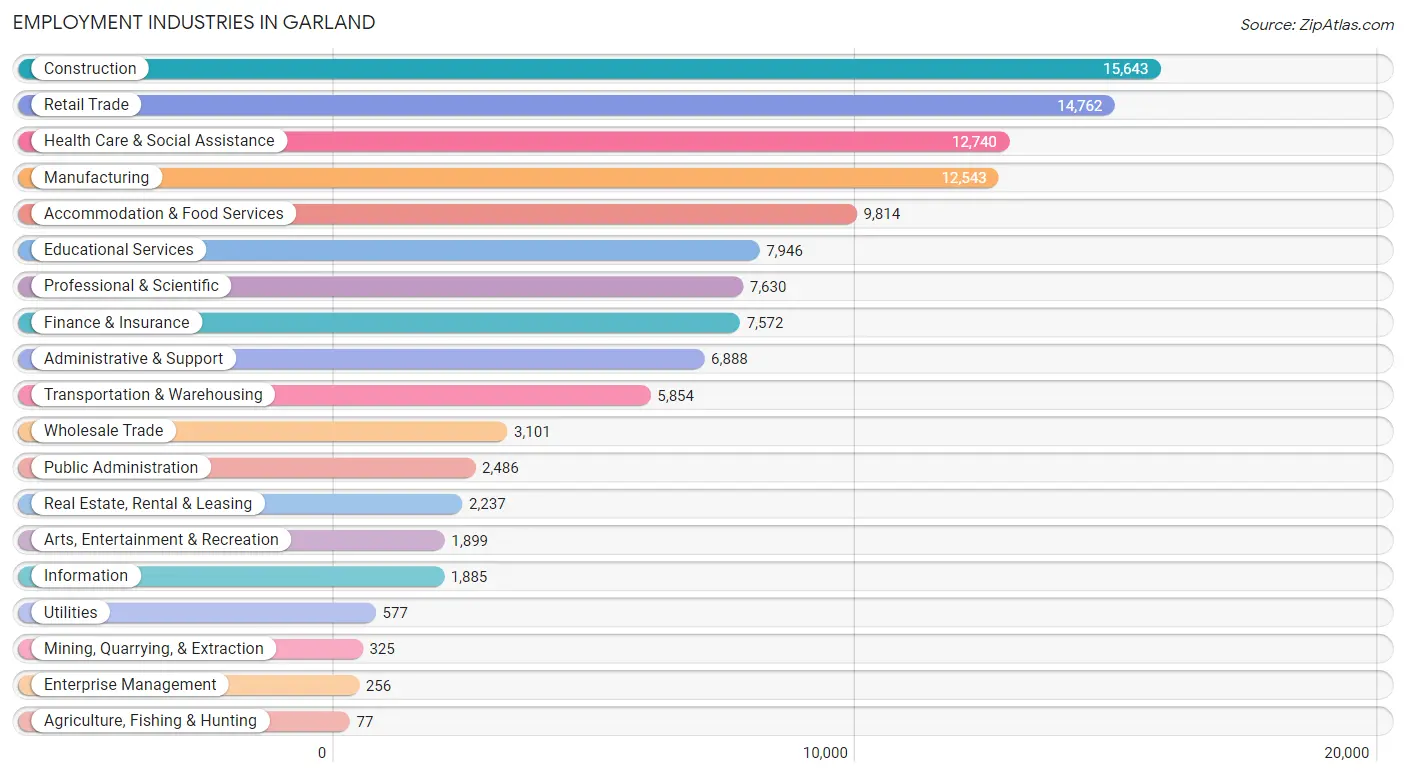
Employment Industries in Garland
The major employment industries in Garland include Construction (15,643 | 12.7%), Retail Trade (14,762 | 12.0%), Health Care & Social Assistance (12,740 | 10.3%), Manufacturing (12,543 | 10.2%), and Accommodation & Food Services (9,814 | 8.0%).
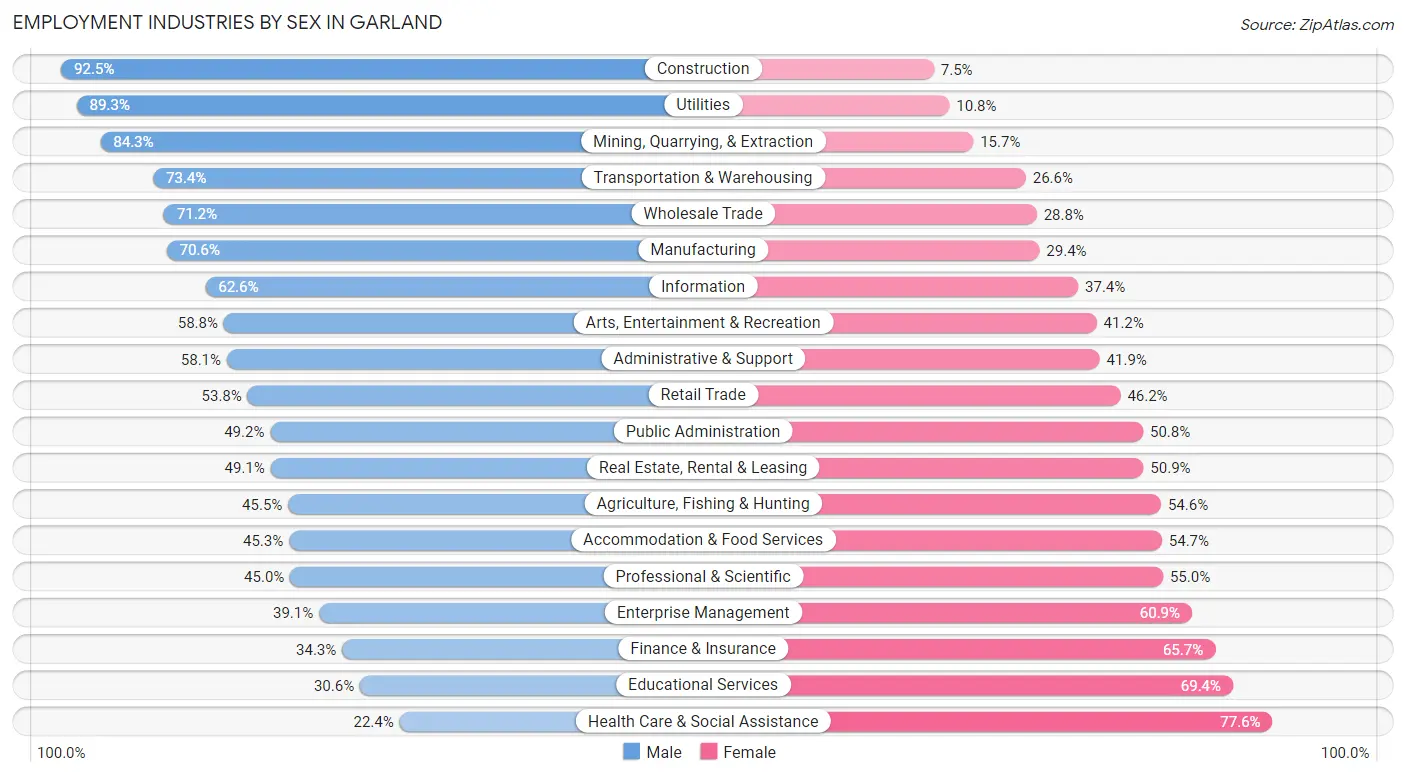
Employment Industries by Sex in Garland
The Garland industries that see more men than women are Construction (92.5%), Utilities (89.2%), and Mining, Quarrying, & Extraction (84.3%), whereas the industries that tend to have a higher number of women are Health Care & Social Assistance (77.6%), Educational Services (69.4%), and Finance & Insurance (65.7%).
| Industry | Male | Female |
| Agriculture, Fishing & Hunting | 35 (45.5%) | 42 (54.5%) |
| Mining, Quarrying, & Extraction | 274 (84.3%) | 51 (15.7%) |
| Construction | 14,464 (92.5%) | 1,179 (7.5%) |
| Manufacturing | 8,856 (70.6%) | 3,687 (29.4%) |
| Wholesale Trade | 2,207 (71.2%) | 894 (28.8%) |
| Retail Trade | 7,948 (53.8%) | 6,814 (46.2%) |
| Transportation & Warehousing | 4,298 (73.4%) | 1,556 (26.6%) |
| Utilities | 515 (89.2%) | 62 (10.7%) |
| Information | 1,180 (62.6%) | 705 (37.4%) |
| Finance & Insurance | 2,596 (34.3%) | 4,976 (65.7%) |
| Real Estate, Rental & Leasing | 1,098 (49.1%) | 1,139 (50.9%) |
| Professional & Scientific | 3,436 (45.0%) | 4,194 (55.0%) |
| Enterprise Management | 100 (39.1%) | 156 (60.9%) |
| Administrative & Support | 4,005 (58.1%) | 2,883 (41.9%) |
| Educational Services | 2,430 (30.6%) | 5,516 (69.4%) |
| Health Care & Social Assistance | 2,853 (22.4%) | 9,887 (77.6%) |
| Arts, Entertainment & Recreation | 1,116 (58.8%) | 783 (41.2%) |
| Accommodation & Food Services | 4,443 (45.3%) | 5,371 (54.7%) |
| Public Administration | 1,222 (49.2%) | 1,264 (50.8%) |
| Total | 66,962 (54.4%) | 56,172 (45.6%) |
Education in Garland
School Enrollment in Garland
The most common levels of schooling among the 65,982 students in Garland are middle school (15,131 | 22.9%), high school (14,540 | 22.0%), and college / undergraduate (13,835 | 21.0%).
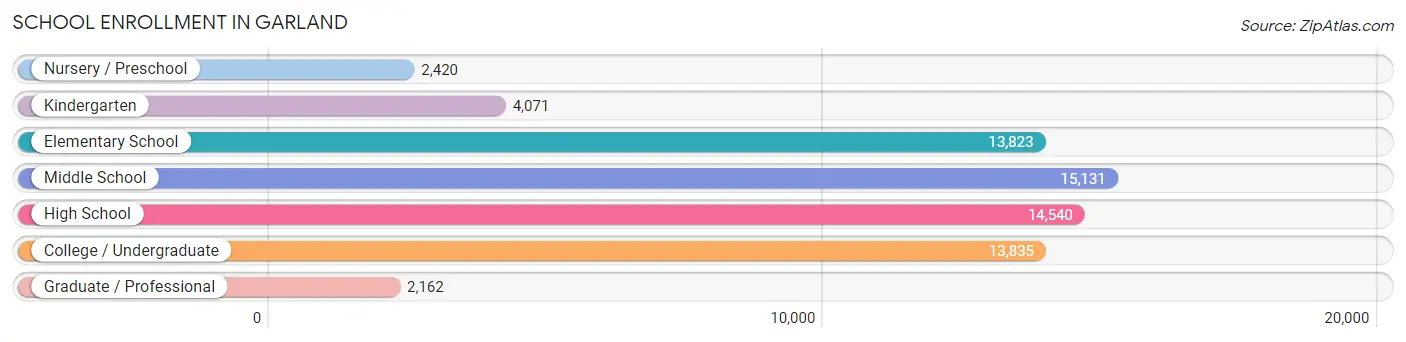
| School Level | # Students | % Students |
| Nursery / Preschool | 2,420 | 3.7% |
| Kindergarten | 4,071 | 6.2% |
| Elementary School | 13,823 | 20.9% |
| Middle School | 15,131 | 22.9% |
| High School | 14,540 | 22.0% |
| College / Undergraduate | 13,835 | 21.0% |
| Graduate / Professional | 2,162 | 3.3% |
| Total | 65,982 | 100.0% |
School Enrollment by Age by Funding Source in Garland
Out of a total of 65,982 students who are enrolled in schools in Garland, 5,542 (8.4%) attend a private institution, while the remaining 60,440 (91.6%) are enrolled in public schools. The age group of 3 to 4 year olds has the highest likelihood of being enrolled in private schools, with 564 (32.7% in the age bracket) enrolled. Conversely, the age group of 5 to 9 year old has the lowest likelihood of being enrolled in a private school, with 16,086 (96.2% in the age bracket) attending a public institution.
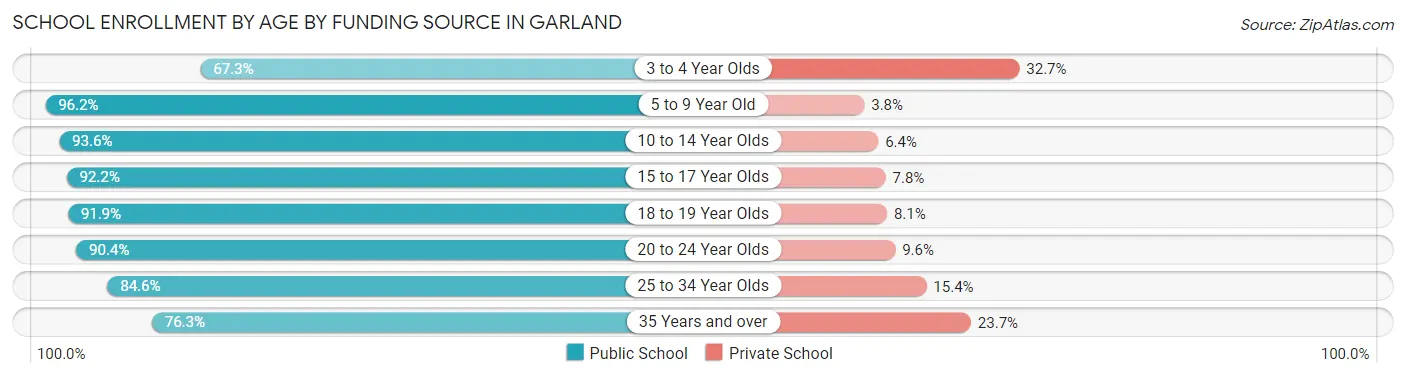
| Age Bracket | Public School | Private School |
| 3 to 4 Year Olds | 1,159 (67.3%) | 564 (32.7%) |
| 5 to 9 Year Old | 16,086 (96.2%) | 643 (3.8%) |
| 10 to 14 Year Olds | 17,569 (93.6%) | 1,209 (6.4%) |
| 15 to 17 Year Olds | 9,717 (92.2%) | 823 (7.8%) |
| 18 to 19 Year Olds | 4,620 (91.9%) | 405 (8.1%) |
| 20 to 24 Year Olds | 5,821 (90.4%) | 618 (9.6%) |
| 25 to 34 Year Olds | 3,420 (84.6%) | 623 (15.4%) |
| 35 Years and over | 2,064 (76.3%) | 641 (23.7%) |
| Total | 60,440 (91.6%) | 5,542 (8.4%) |
Educational Attainment by Field of Study in Garland
Business (9,594 | 24.3%), education (4,519 | 11.4%), science & technology (3,859 | 9.8%), engineering (3,099 | 7.9%), and arts & humanities (2,531 | 6.4%) are the most common fields of study among 39,499 individuals in Garland who have obtained a bachelor's degree or higher.
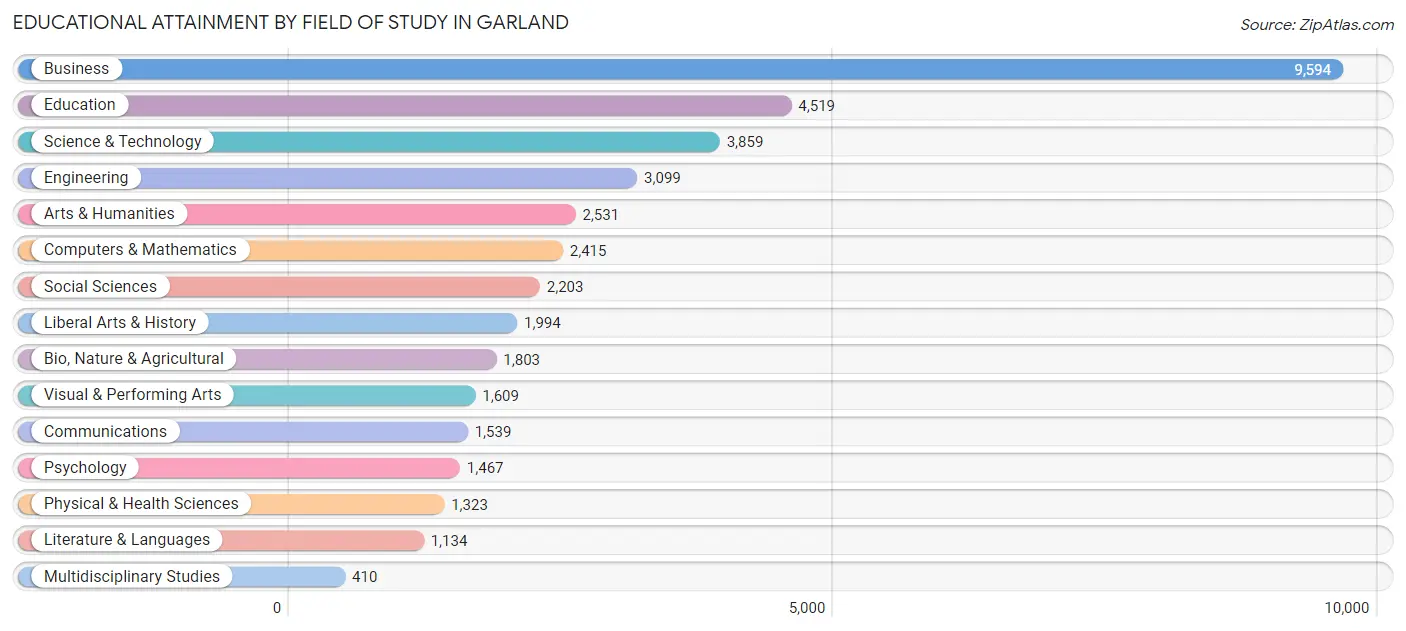
| Field of Study | # Graduates | % Graduates |
| Computers & Mathematics | 2,415 | 6.1% |
| Bio, Nature & Agricultural | 1,803 | 4.6% |
| Physical & Health Sciences | 1,323 | 3.4% |
| Psychology | 1,467 | 3.7% |
| Social Sciences | 2,203 | 5.6% |
| Engineering | 3,099 | 7.9% |
| Multidisciplinary Studies | 410 | 1.0% |
| Science & Technology | 3,859 | 9.8% |
| Business | 9,594 | 24.3% |
| Education | 4,519 | 11.4% |
| Literature & Languages | 1,134 | 2.9% |
| Liberal Arts & History | 1,994 | 5.1% |
| Visual & Performing Arts | 1,609 | 4.1% |
| Communications | 1,539 | 3.9% |
| Arts & Humanities | 2,531 | 6.4% |
| Total | 39,499 | 100.0% |
Transportation & Commute in Garland
Vehicle Availability by Sex in Garland
The most prevalent vehicle ownership categories in Garland are males with 2 vehicles (26,068, accounting for 39.9%) and females with 2 vehicles (22,595, making up 47.6%).
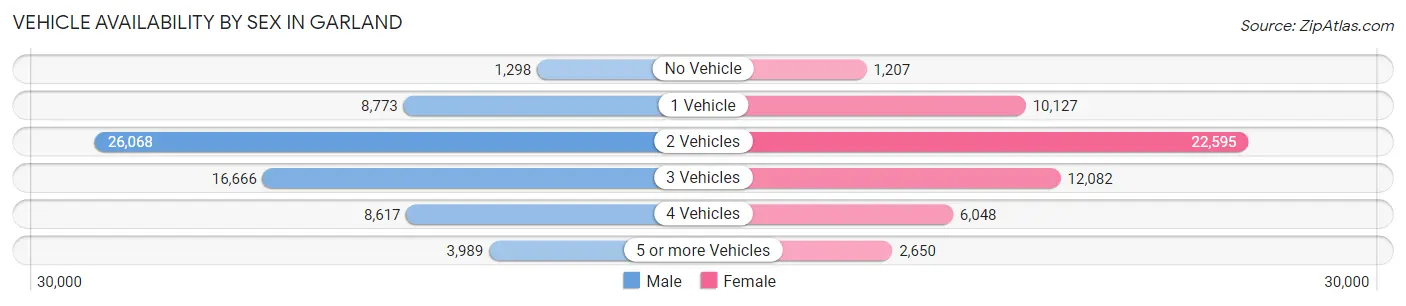
| Vehicles Available | Male | Female |
| No Vehicle | 1,298 (2.0%) | 1,207 (2.2%) |
| 1 Vehicle | 8,773 (13.4%) | 10,127 (18.5%) |
| 2 Vehicles | 26,068 (39.9%) | 22,595 (41.3%) |
| 3 Vehicles | 16,666 (25.5%) | 12,082 (22.1%) |
| 4 Vehicles | 8,617 (13.2%) | 6,048 (11.1%) |
| 5 or more Vehicles | 3,989 (6.1%) | 2,650 (4.8%) |
| Total | 65,411 (100.0%) | 54,709 (100.0%) |
Commute Time in Garland
The most frequently occuring commute durations in Garland are 30 to 34 minutes (30,628 commuters, 28.1%), 20 to 24 minutes (13,797 commuters, 12.7%), and 45 to 59 minutes (12,744 commuters, 11.7%).
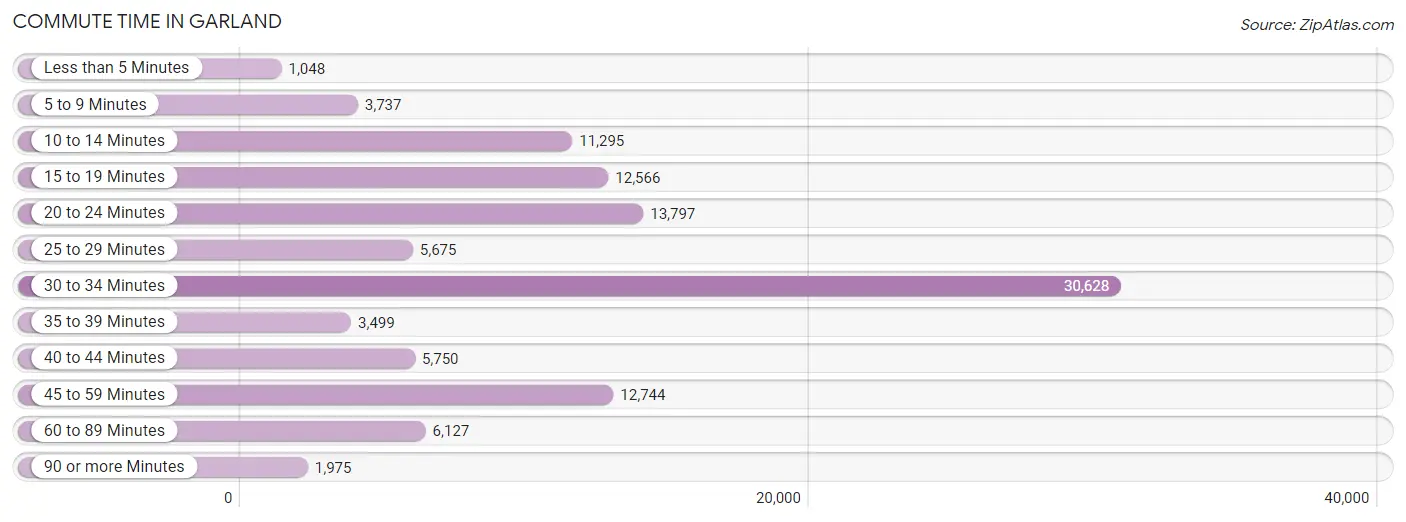
| Commute Time | # Commuters | % Commuters |
| Less than 5 Minutes | 1,048 | 1.0% |
| 5 to 9 Minutes | 3,737 | 3.4% |
| 10 to 14 Minutes | 11,295 | 10.4% |
| 15 to 19 Minutes | 12,566 | 11.6% |
| 20 to 24 Minutes | 13,797 | 12.7% |
| 25 to 29 Minutes | 5,675 | 5.2% |
| 30 to 34 Minutes | 30,628 | 28.1% |
| 35 to 39 Minutes | 3,499 | 3.2% |
| 40 to 44 Minutes | 5,750 | 5.3% |
| 45 to 59 Minutes | 12,744 | 11.7% |
| 60 to 89 Minutes | 6,127 | 5.6% |
| 90 or more Minutes | 1,975 | 1.8% |
Commute Time by Sex in Garland
The most common commute times in Garland are 30 to 34 minutes (16,762 commuters, 27.9%) for males and 30 to 34 minutes (13,866 commuters, 28.4%) for females.
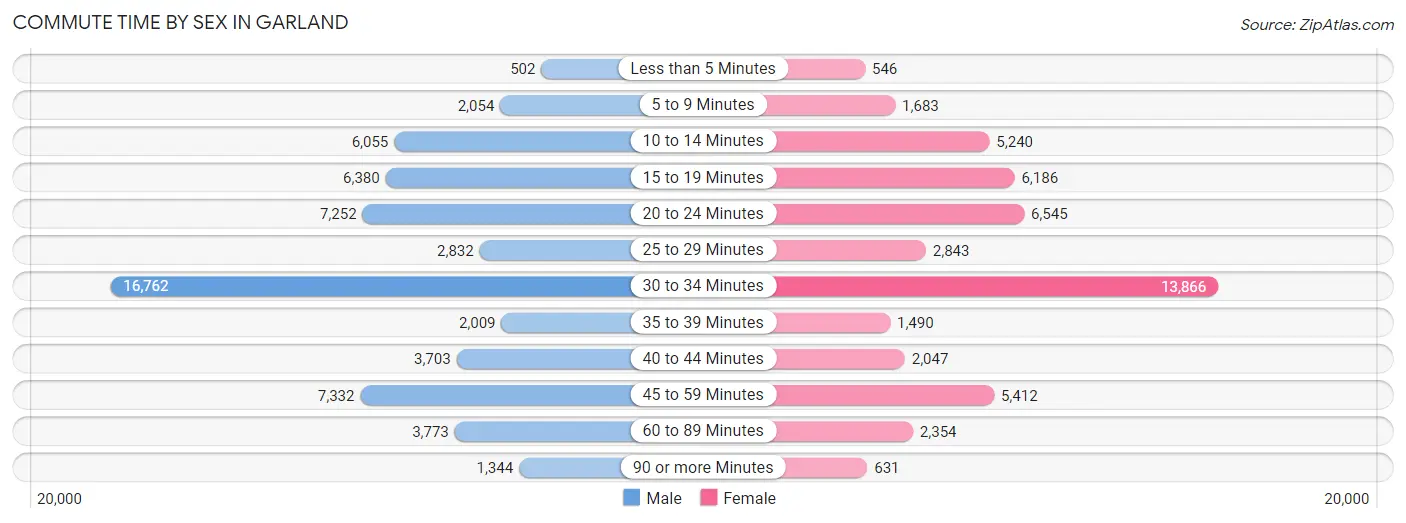
| Commute Time | Male | Female |
| Less than 5 Minutes | 502 (0.8%) | 546 (1.1%) |
| 5 to 9 Minutes | 2,054 (3.4%) | 1,683 (3.5%) |
| 10 to 14 Minutes | 6,055 (10.1%) | 5,240 (10.7%) |
| 15 to 19 Minutes | 6,380 (10.6%) | 6,186 (12.7%) |
| 20 to 24 Minutes | 7,252 (12.1%) | 6,545 (13.4%) |
| 25 to 29 Minutes | 2,832 (4.7%) | 2,843 (5.8%) |
| 30 to 34 Minutes | 16,762 (27.9%) | 13,866 (28.4%) |
| 35 to 39 Minutes | 2,009 (3.4%) | 1,490 (3.0%) |
| 40 to 44 Minutes | 3,703 (6.2%) | 2,047 (4.2%) |
| 45 to 59 Minutes | 7,332 (12.2%) | 5,412 (11.1%) |
| 60 to 89 Minutes | 3,773 (6.3%) | 2,354 (4.8%) |
| 90 or more Minutes | 1,344 (2.2%) | 631 (1.3%) |
Time of Departure to Work by Sex in Garland
The most frequent times of departure to work in Garland are 7:00 AM to 7:29 AM (10,134, 16.9%) for males and 7:00 AM to 7:29 AM (7,705, 15.8%) for females.
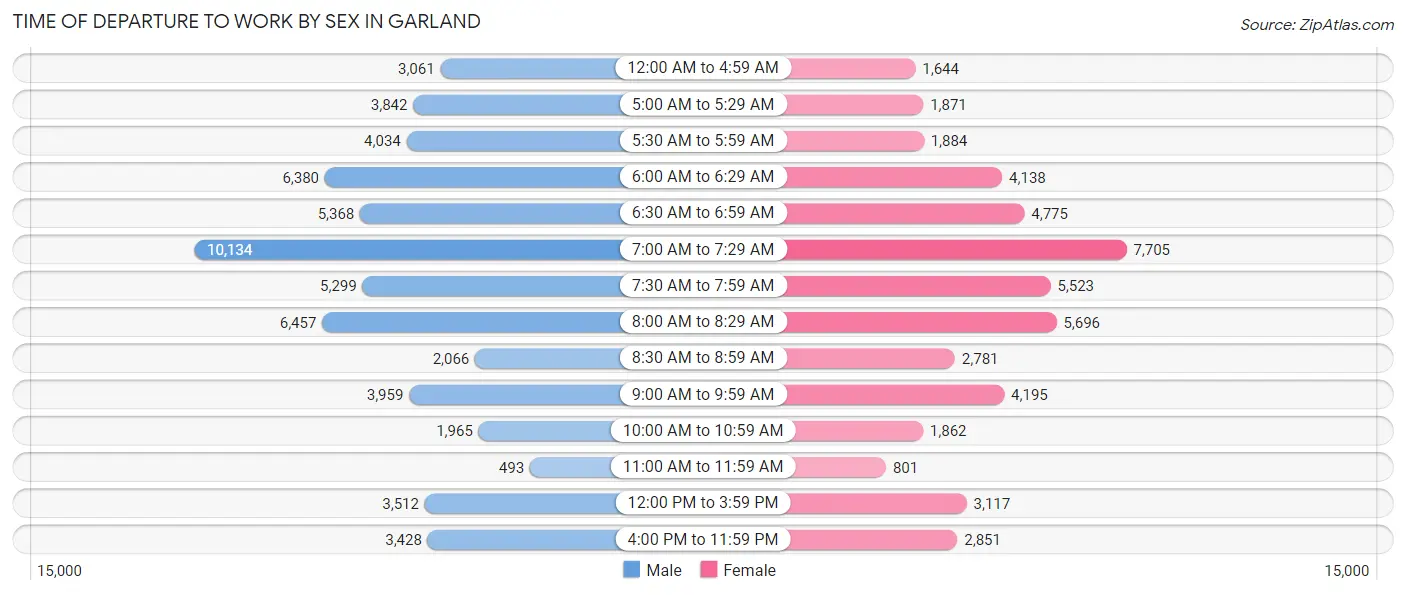
| Time of Departure | Male | Female |
| 12:00 AM to 4:59 AM | 3,061 (5.1%) | 1,644 (3.4%) |
| 5:00 AM to 5:29 AM | 3,842 (6.4%) | 1,871 (3.8%) |
| 5:30 AM to 5:59 AM | 4,034 (6.7%) | 1,884 (3.9%) |
| 6:00 AM to 6:29 AM | 6,380 (10.6%) | 4,138 (8.5%) |
| 6:30 AM to 6:59 AM | 5,368 (8.9%) | 4,775 (9.8%) |
| 7:00 AM to 7:29 AM | 10,134 (16.9%) | 7,705 (15.8%) |
| 7:30 AM to 7:59 AM | 5,299 (8.8%) | 5,523 (11.3%) |
| 8:00 AM to 8:29 AM | 6,457 (10.8%) | 5,696 (11.7%) |
| 8:30 AM to 8:59 AM | 2,066 (3.4%) | 2,781 (5.7%) |
| 9:00 AM to 9:59 AM | 3,959 (6.6%) | 4,195 (8.6%) |
| 10:00 AM to 10:59 AM | 1,965 (3.3%) | 1,862 (3.8%) |
| 11:00 AM to 11:59 AM | 493 (0.8%) | 801 (1.6%) |
| 12:00 PM to 3:59 PM | 3,512 (5.9%) | 3,117 (6.4%) |
| 4:00 PM to 11:59 PM | 3,428 (5.7%) | 2,851 (5.8%) |
| Total | 59,998 (100.0%) | 48,843 (100.0%) |
Housing Occupancy in Garland
Occupancy by Ownership in Garland
Of the total 79,770 dwellings in Garland, owner-occupied units account for 49,474 (62.0%), while renter-occupied units make up 30,296 (38.0%).
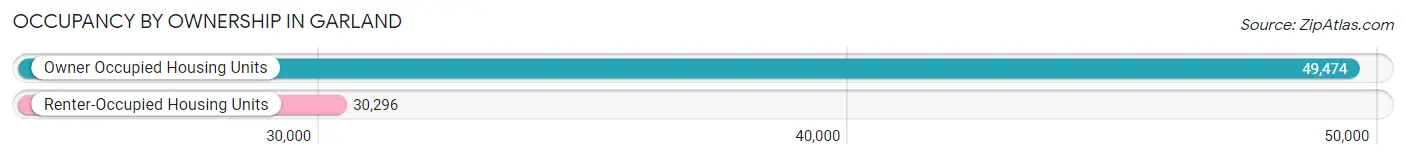
| Occupancy | # Housing Units | % Housing Units |
| Owner Occupied Housing Units | 49,474 | 62.0% |
| Renter-Occupied Housing Units | 30,296 | 38.0% |
| Total Occupied Housing Units | 79,770 | 100.0% |
Occupancy by Household Size in Garland
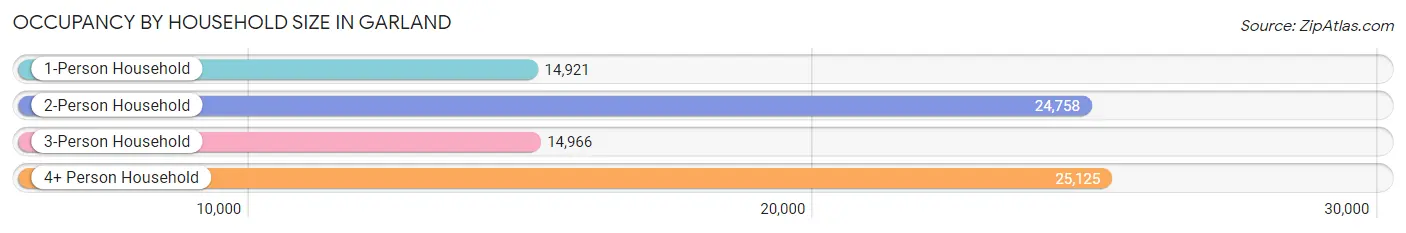
| Household Size | # Housing Units | % Housing Units |
| 1-Person Household | 14,921 | 18.7% |
| 2-Person Household | 24,758 | 31.0% |
| 3-Person Household | 14,966 | 18.8% |
| 4+ Person Household | 25,125 | 31.5% |
| Total Housing Units | 79,770 | 100.0% |
Occupancy by Ownership by Household Size in Garland
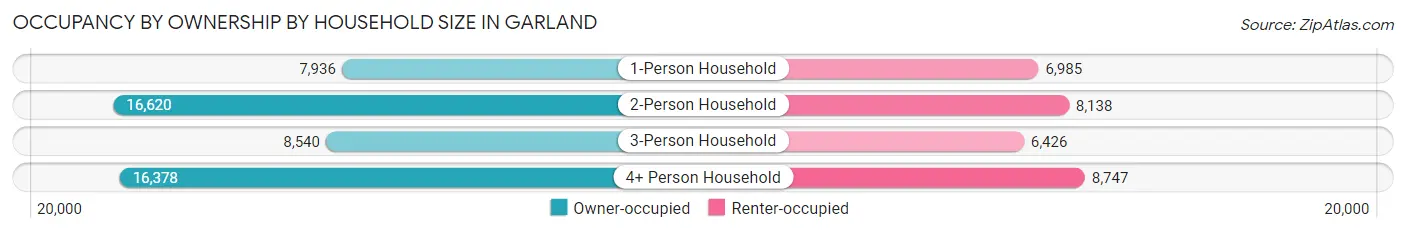
| Household Size | Owner-occupied | Renter-occupied |
| 1-Person Household | 7,936 (53.2%) | 6,985 (46.8%) |
| 2-Person Household | 16,620 (67.1%) | 8,138 (32.9%) |
| 3-Person Household | 8,540 (57.1%) | 6,426 (42.9%) |
| 4+ Person Household | 16,378 (65.2%) | 8,747 (34.8%) |
| Total Housing Units | 49,474 (62.0%) | 30,296 (38.0%) |
Occupancy by Educational Attainment in Garland
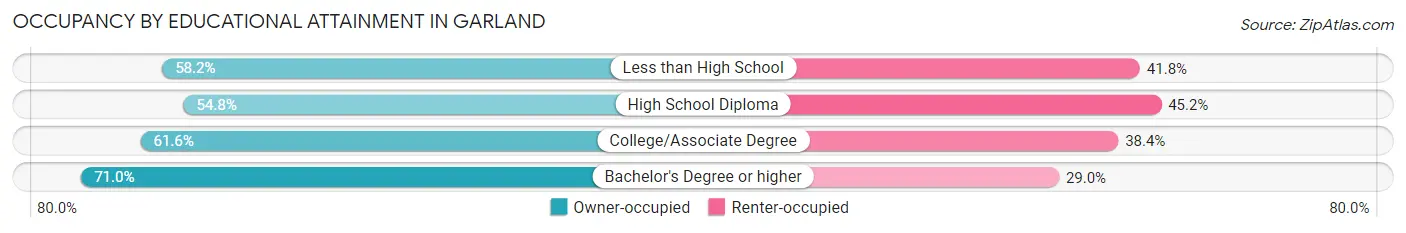
| Household Size | Owner-occupied | Renter-occupied |
| Less than High School | 8,019 (58.2%) | 5,766 (41.8%) |
| High School Diploma | 10,245 (54.8%) | 8,454 (45.2%) |
| College/Associate Degree | 15,506 (61.6%) | 9,664 (38.4%) |
| Bachelor's Degree or higher | 15,704 (71.0%) | 6,412 (29.0%) |
Occupancy by Age of Householder in Garland
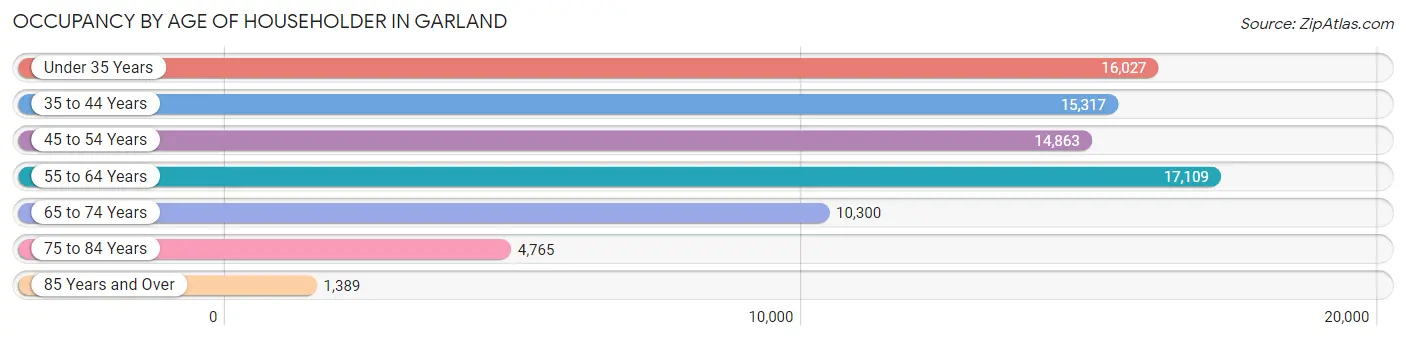
| Age Bracket | # Households | % Households |
| Under 35 Years | 16,027 | 20.1% |
| 35 to 44 Years | 15,317 | 19.2% |
| 45 to 54 Years | 14,863 | 18.6% |
| 55 to 64 Years | 17,109 | 21.4% |
| 65 to 74 Years | 10,300 | 12.9% |
| 75 to 84 Years | 4,765 | 6.0% |
| 85 Years and Over | 1,389 | 1.7% |
| Total | 79,770 | 100.0% |
Housing Finances in Garland
Median Income by Occupancy in Garland
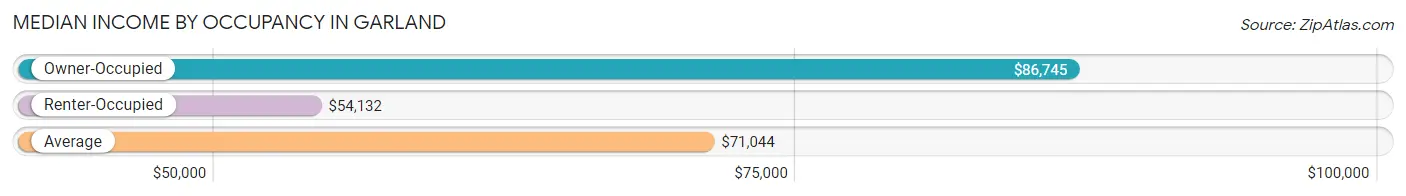
| Occupancy Type | # Households | Median Income |
| Owner-Occupied | 49,474 (62.0%) | $86,745 |
| Renter-Occupied | 30,296 (38.0%) | $54,132 |
| Average | 79,770 (100.0%) | $71,044 |
Occupancy by Householder Income Bracket in Garland
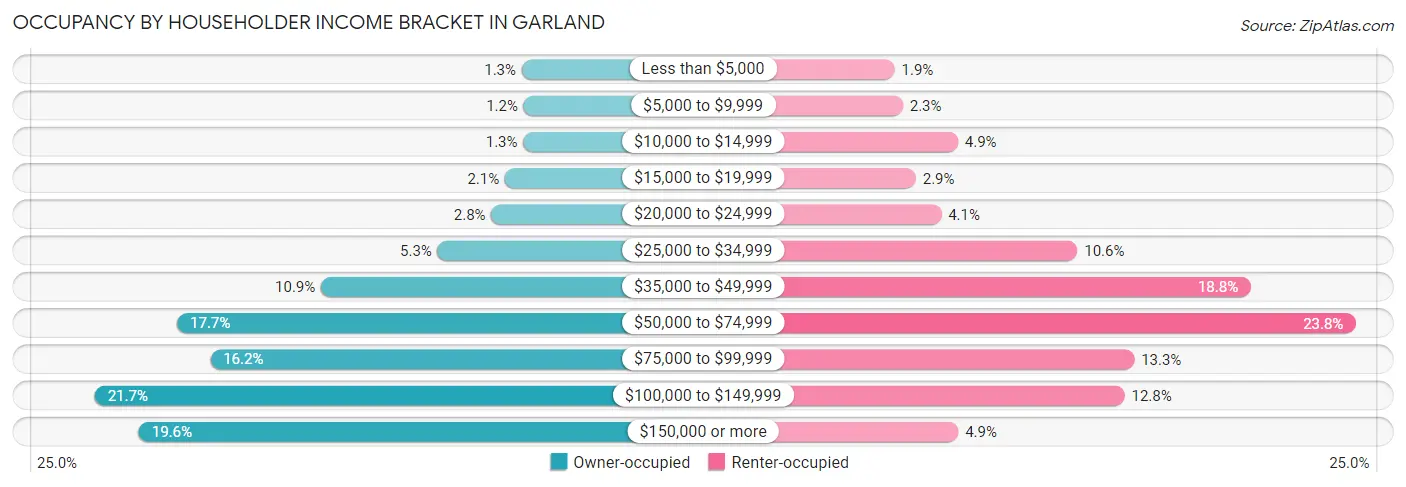
| Income Bracket | Owner-occupied | Renter-occupied |
| Less than $5,000 | 652 (1.3%) | 562 (1.9%) |
| $5,000 to $9,999 | 608 (1.2%) | 681 (2.2%) |
| $10,000 to $14,999 | 618 (1.3%) | 1,474 (4.9%) |
| $15,000 to $19,999 | 1,048 (2.1%) | 869 (2.9%) |
| $20,000 to $24,999 | 1,368 (2.8%) | 1,235 (4.1%) |
| $25,000 to $34,999 | 2,635 (5.3%) | 3,199 (10.6%) |
| $35,000 to $49,999 | 5,383 (10.9%) | 5,689 (18.8%) |
| $50,000 to $74,999 | 8,776 (17.7%) | 7,206 (23.8%) |
| $75,000 to $99,999 | 7,993 (16.2%) | 4,019 (13.3%) |
| $100,000 to $149,999 | 10,715 (21.7%) | 3,880 (12.8%) |
| $150,000 or more | 9,678 (19.6%) | 1,482 (4.9%) |
| Total | 49,474 (100.0%) | 30,296 (100.0%) |
Monthly Housing Cost Tiers in Garland
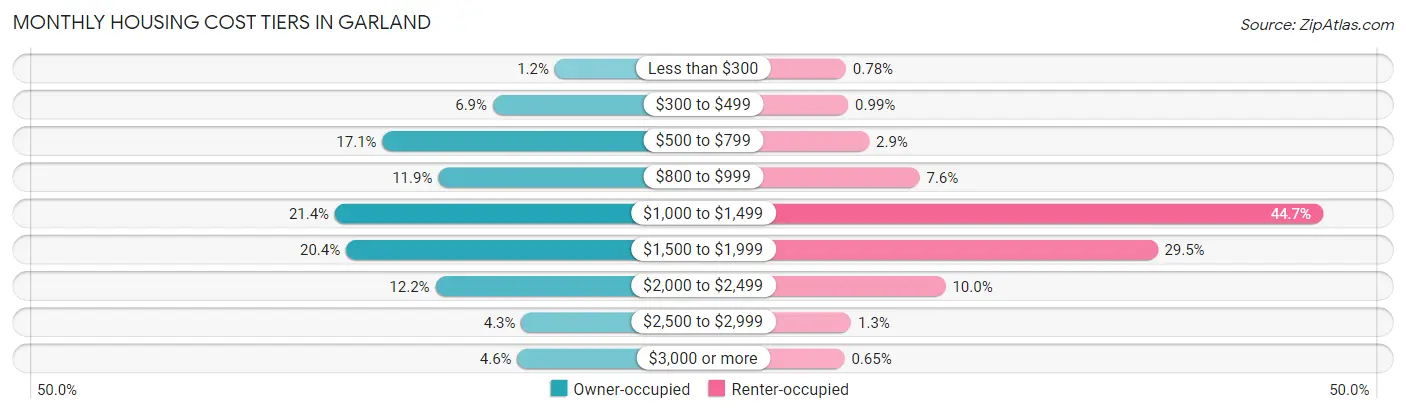
| Monthly Cost | Owner-occupied | Renter-occupied |
| Less than $300 | 589 (1.2%) | 236 (0.8%) |
| $300 to $499 | 3,411 (6.9%) | 299 (1.0%) |
| $500 to $799 | 8,440 (17.1%) | 885 (2.9%) |
| $800 to $999 | 5,898 (11.9%) | 2,289 (7.6%) |
| $1,000 to $1,499 | 10,603 (21.4%) | 13,536 (44.7%) |
| $1,500 to $1,999 | 10,100 (20.4%) | 8,926 (29.5%) |
| $2,000 to $2,499 | 6,027 (12.2%) | 3,015 (10.0%) |
| $2,500 to $2,999 | 2,115 (4.3%) | 381 (1.3%) |
| $3,000 or more | 2,291 (4.6%) | 198 (0.6%) |
| Total | 49,474 (100.0%) | 30,296 (100.0%) |
Physical Housing Characteristics in Garland
Housing Structures in Garland
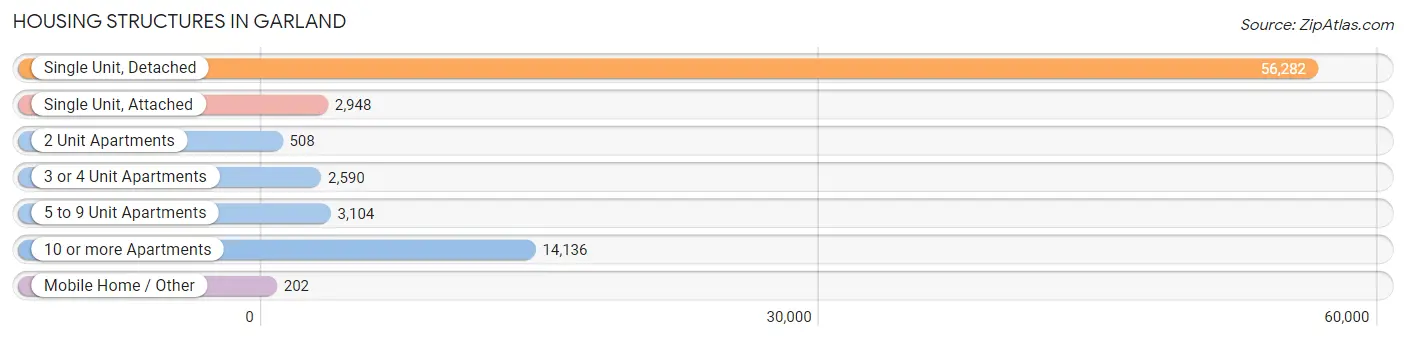
| Structure Type | # Housing Units | % Housing Units |
| Single Unit, Detached | 56,282 | 70.6% |
| Single Unit, Attached | 2,948 | 3.7% |
| 2 Unit Apartments | 508 | 0.6% |
| 3 or 4 Unit Apartments | 2,590 | 3.3% |
| 5 to 9 Unit Apartments | 3,104 | 3.9% |
| 10 or more Apartments | 14,136 | 17.7% |
| Mobile Home / Other | 202 | 0.3% |
| Total | 79,770 | 100.0% |
Housing Structures by Occupancy in Garland
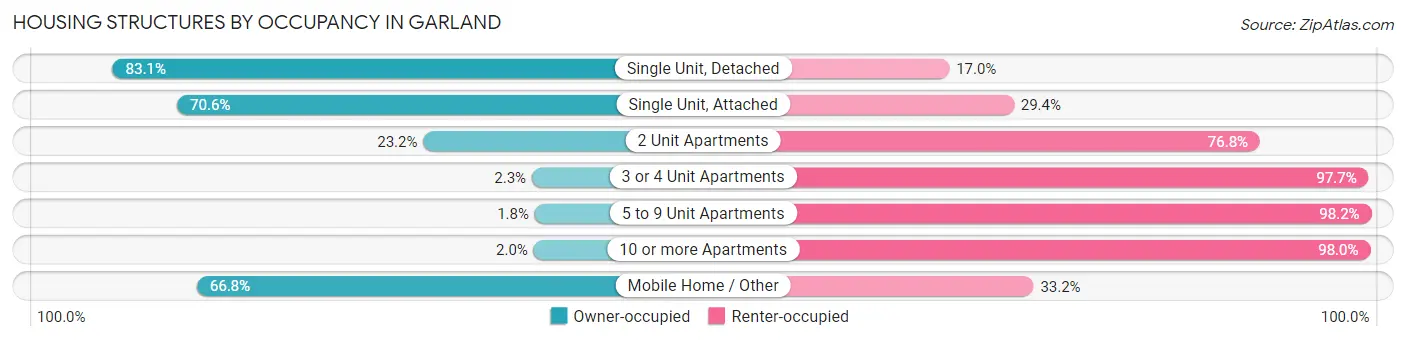
| Structure Type | Owner-occupied | Renter-occupied |
| Single Unit, Detached | 46,744 (83.1%) | 9,538 (17.0%) |
| Single Unit, Attached | 2,082 (70.6%) | 866 (29.4%) |
| 2 Unit Apartments | 118 (23.2%) | 390 (76.8%) |
| 3 or 4 Unit Apartments | 60 (2.3%) | 2,530 (97.7%) |
| 5 to 9 Unit Apartments | 55 (1.8%) | 3,049 (98.2%) |
| 10 or more Apartments | 280 (2.0%) | 13,856 (98.0%) |
| Mobile Home / Other | 135 (66.8%) | 67 (33.2%) |
| Total | 49,474 (62.0%) | 30,296 (38.0%) |
Housing Structures by Number of Rooms in Garland
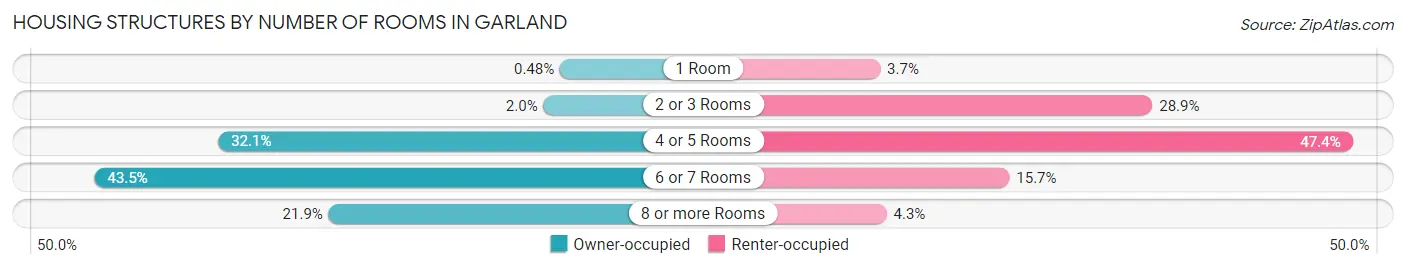
| Number of Rooms | Owner-occupied | Renter-occupied |
| 1 Room | 236 (0.5%) | 1,128 (3.7%) |
| 2 or 3 Rooms | 992 (2.0%) | 8,752 (28.9%) |
| 4 or 5 Rooms | 15,883 (32.1%) | 14,361 (47.4%) |
| 6 or 7 Rooms | 21,540 (43.5%) | 4,746 (15.7%) |
| 8 or more Rooms | 10,823 (21.9%) | 1,309 (4.3%) |
| Total | 49,474 (100.0%) | 30,296 (100.0%) |
Housing Structure by Heating Type in Garland
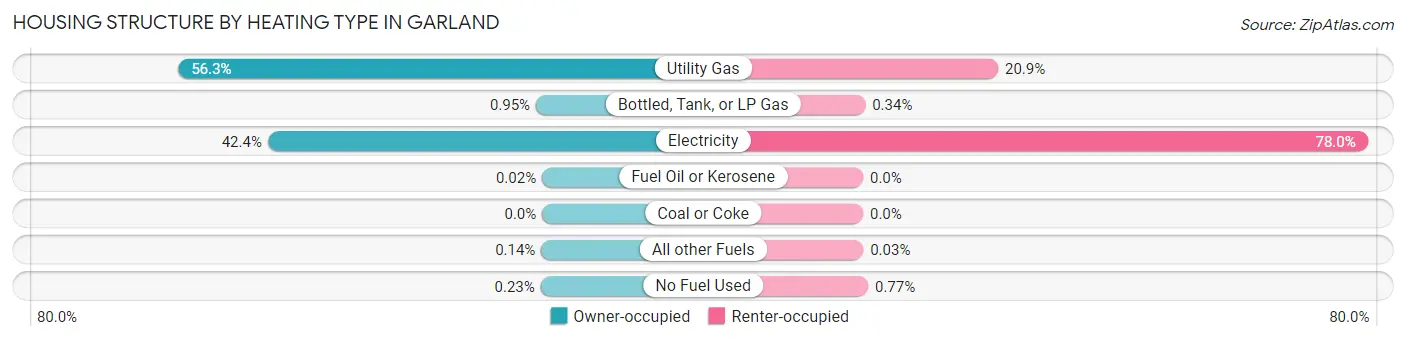
| Heating Type | Owner-occupied | Renter-occupied |
| Utility Gas | 27,829 (56.2%) | 6,322 (20.9%) |
| Bottled, Tank, or LP Gas | 471 (0.9%) | 104 (0.3%) |
| Electricity | 20,983 (42.4%) | 23,627 (78.0%) |
| Fuel Oil or Kerosene | 8 (0.0%) | 0 (0.0%) |
| Coal or Coke | 0 (0.0%) | 0 (0.0%) |
| All other Fuels | 67 (0.1%) | 9 (0.0%) |
| No Fuel Used | 116 (0.2%) | 234 (0.8%) |
| Total | 49,474 (100.0%) | 30,296 (100.0%) |
Household Vehicle Usage in Garland
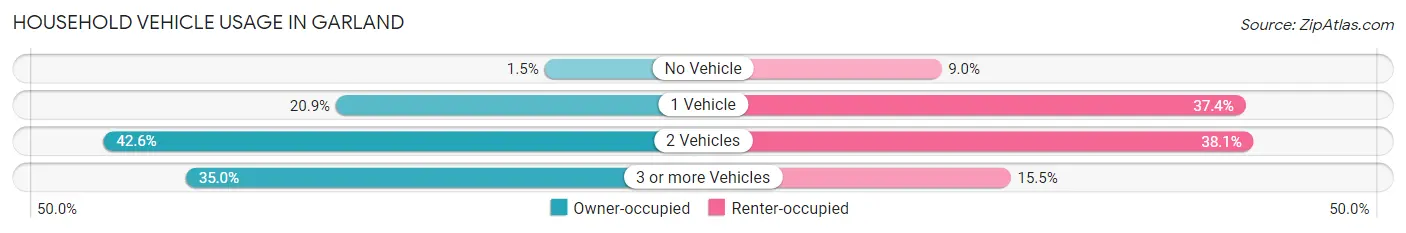
| Vehicles per Household | Owner-occupied | Renter-occupied |
| No Vehicle | 727 (1.5%) | 2,723 (9.0%) |
| 1 Vehicle | 10,358 (20.9%) | 11,332 (37.4%) |
| 2 Vehicles | 21,098 (42.6%) | 11,556 (38.1%) |
| 3 or more Vehicles | 17,291 (34.9%) | 4,685 (15.5%) |
| Total | 49,474 (100.0%) | 30,296 (100.0%) |
Real Estate & Mortgages in Garland
Real Estate and Mortgage Overview in Garland
| Characteristic | Without Mortgage | With Mortgage |
| Housing Units | 20,203 | 29,271 |
| Median Property Value | $218,000 | $236,900 |
| Median Household Income | $72,239 | $6,396 |
| Monthly Housing Costs | $733 | $2,239 |
| Real Estate Taxes | $3,483 | $768 |
Property Value by Mortgage Status in Garland
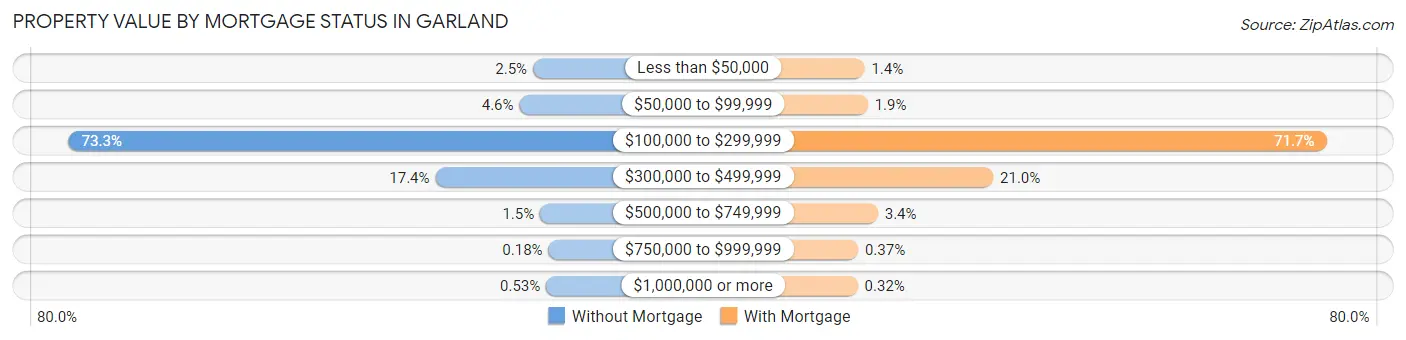
| Property Value | Without Mortgage | With Mortgage |
| Less than $50,000 | 514 (2.5%) | 398 (1.4%) |
| $50,000 to $99,999 | 931 (4.6%) | 542 (1.8%) |
| $100,000 to $299,999 | 14,804 (73.3%) | 21,000 (71.7%) |
| $300,000 to $499,999 | 3,518 (17.4%) | 6,134 (21.0%) |
| $500,000 to $749,999 | 292 (1.5%) | 993 (3.4%) |
| $750,000 to $999,999 | 36 (0.2%) | 109 (0.4%) |
| $1,000,000 or more | 108 (0.5%) | 95 (0.3%) |
| Total | 20,203 (100.0%) | 29,271 (100.0%) |
Household Income by Mortgage Status in Garland
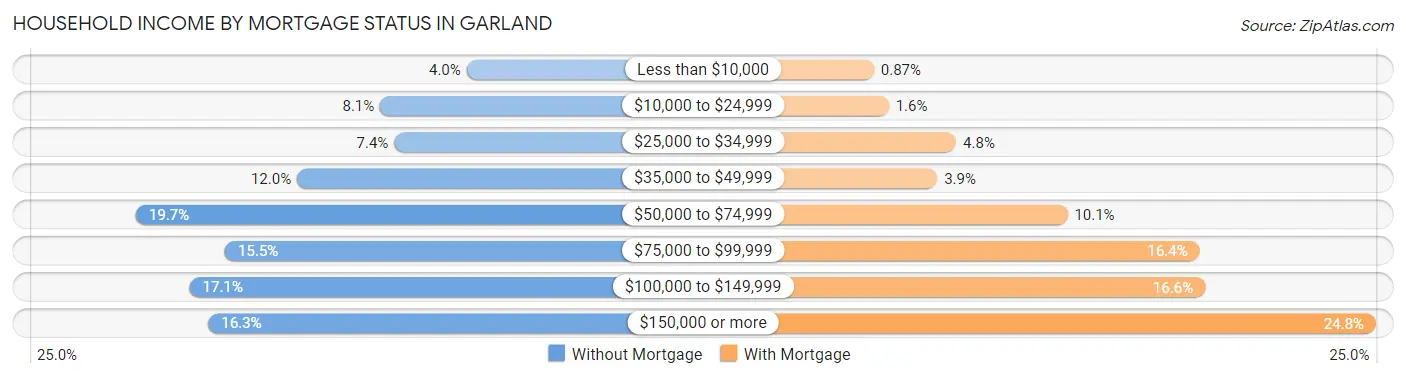
| Household Income | Without Mortgage | With Mortgage |
| Less than $10,000 | 798 (4.0%) | 254 (0.9%) |
| $10,000 to $24,999 | 1,631 (8.1%) | 462 (1.6%) |
| $25,000 to $34,999 | 1,496 (7.4%) | 1,403 (4.8%) |
| $35,000 to $49,999 | 2,430 (12.0%) | 1,139 (3.9%) |
| $50,000 to $74,999 | 3,981 (19.7%) | 2,953 (10.1%) |
| $75,000 to $99,999 | 3,123 (15.5%) | 4,795 (16.4%) |
| $100,000 to $149,999 | 3,462 (17.1%) | 4,870 (16.6%) |
| $150,000 or more | 3,282 (16.3%) | 7,253 (24.8%) |
| Total | 20,203 (100.0%) | 29,271 (100.0%) |
Property Value to Household Income Ratio in Garland
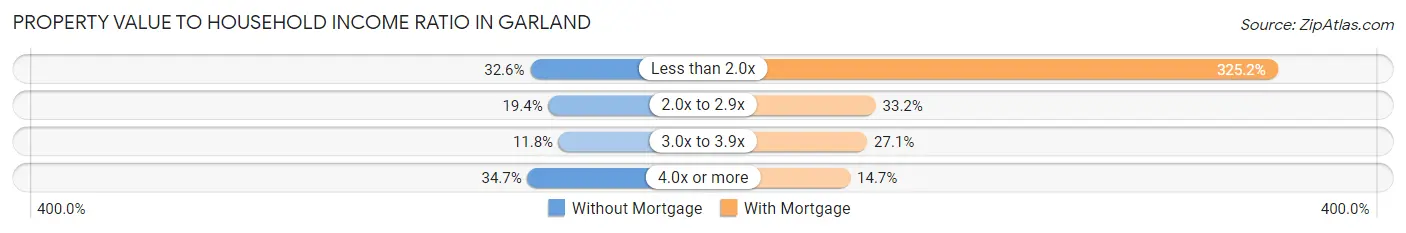
| Value-to-Income Ratio | Without Mortgage | With Mortgage |
| Less than 2.0x | 6,588 (32.6%) | 95,185 (325.2%) |
| 2.0x to 2.9x | 3,923 (19.4%) | 9,718 (33.2%) |
| 3.0x to 3.9x | 2,390 (11.8%) | 7,925 (27.1%) |
| 4.0x or more | 7,001 (34.6%) | 4,294 (14.7%) |
| Total | 20,203 (100.0%) | 29,271 (100.0%) |
Real Estate Taxes by Mortgage Status in Garland
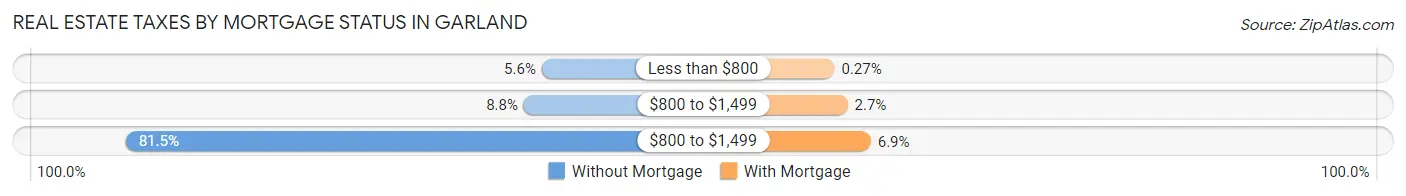
| Property Taxes | Without Mortgage | With Mortgage |
| Less than $800 | 1,121 (5.6%) | 78 (0.3%) |
| $800 to $1,499 | 1,782 (8.8%) | 779 (2.7%) |
| $800 to $1,499 | 16,470 (81.5%) | 2,017 (6.9%) |
| Total | 20,203 (100.0%) | 29,271 (100.0%) |
Health & Disability in Garland
Health Insurance Coverage by Age in Garland
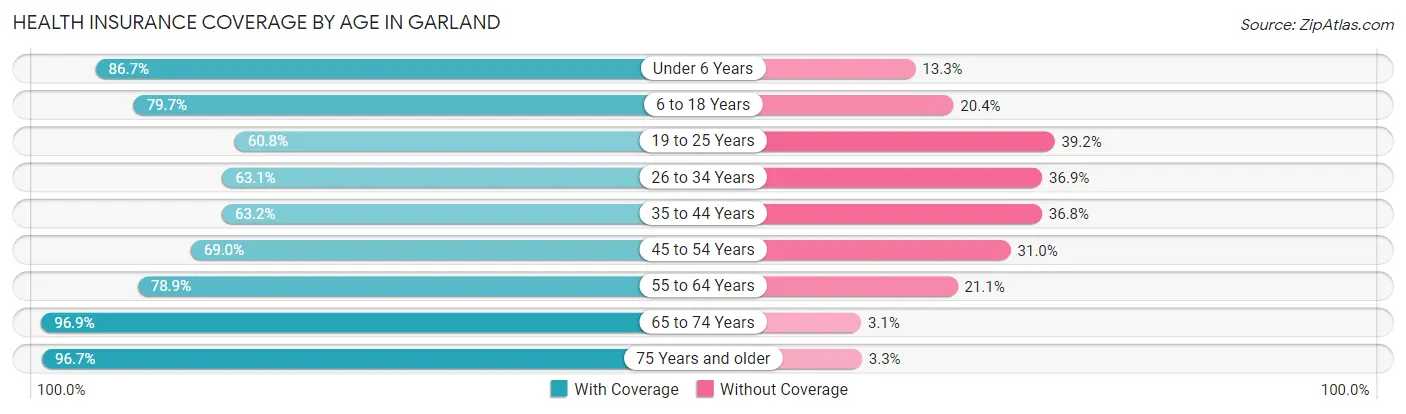
| Age Bracket | With Coverage | Without Coverage |
| Under 6 Years | 16,344 (86.7%) | 2,498 (13.3%) |
| 6 to 18 Years | 38,650 (79.6%) | 9,876 (20.3%) |
| 19 to 25 Years | 15,353 (60.8%) | 9,898 (39.2%) |
| 26 to 34 Years | 19,500 (63.1%) | 11,402 (36.9%) |
| 35 to 44 Years | 18,919 (63.2%) | 11,036 (36.8%) |
| 45 to 54 Years | 20,551 (69.0%) | 9,236 (31.0%) |
| 55 to 64 Years | 23,966 (78.9%) | 6,414 (21.1%) |
| 65 to 74 Years | 18,170 (96.9%) | 586 (3.1%) |
| 75 Years and older | 10,629 (96.7%) | 360 (3.3%) |
| Total | 182,082 (74.8%) | 61,306 (25.2%) |
Health Insurance Coverage by Citizenship Status in Garland
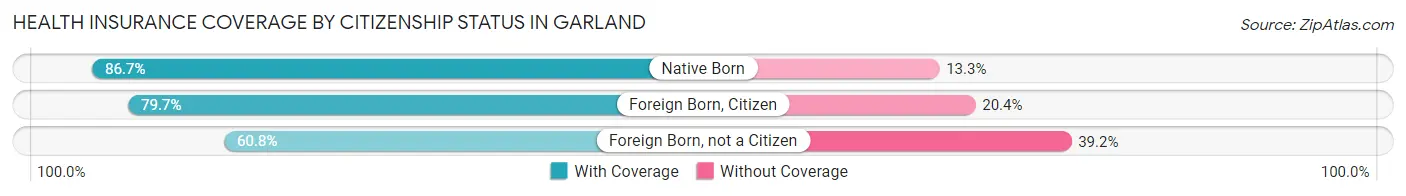
| Citizenship Status | With Coverage | Without Coverage |
| Native Born | 16,344 (86.7%) | 2,498 (13.3%) |
| Foreign Born, Citizen | 38,650 (79.6%) | 9,876 (20.3%) |
| Foreign Born, not a Citizen | 15,353 (60.8%) | 9,898 (39.2%) |
Health Insurance Coverage by Household Income in Garland
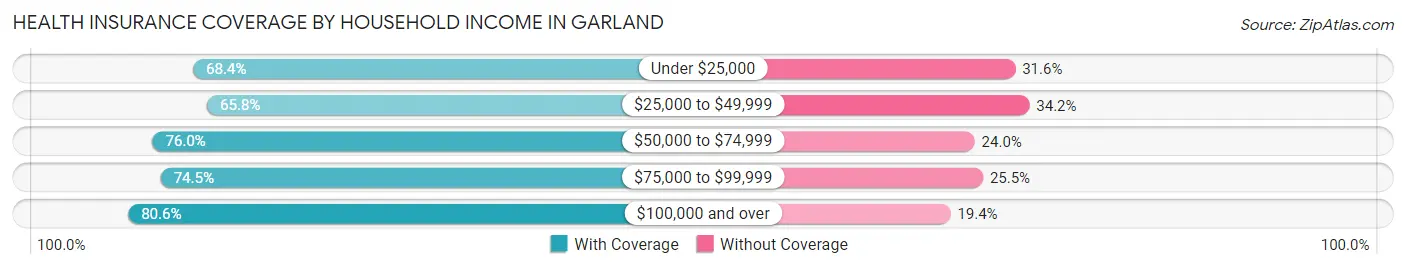
| Household Income | With Coverage | Without Coverage |
| Under $25,000 | 14,746 (68.4%) | 6,801 (31.6%) |
| $25,000 to $49,999 | 30,871 (65.8%) | 16,043 (34.2%) |
| $50,000 to $74,999 | 34,094 (76.0%) | 10,740 (24.0%) |
| $75,000 to $99,999 | 29,153 (74.5%) | 9,985 (25.5%) |
| $100,000 and over | 73,094 (80.6%) | 17,612 (19.4%) |
Public vs Private Health Insurance Coverage by Age in Garland
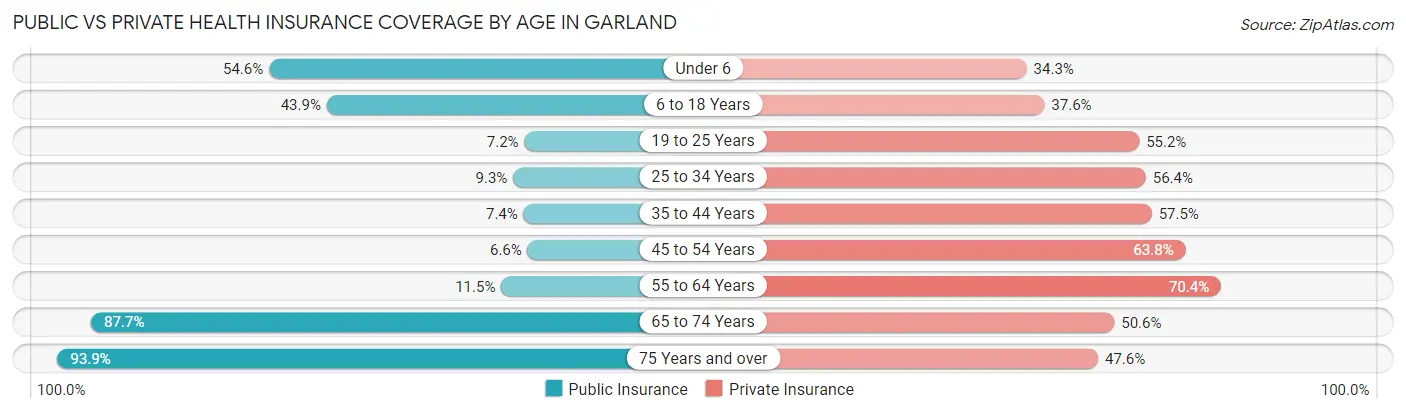
| Age Bracket | Public Insurance | Private Insurance |
| Under 6 | 10,293 (54.6%) | 6,464 (34.3%) |
| 6 to 18 Years | 21,314 (43.9%) | 18,253 (37.6%) |
| 19 to 25 Years | 1,825 (7.2%) | 13,939 (55.2%) |
| 25 to 34 Years | 2,877 (9.3%) | 17,437 (56.4%) |
| 35 to 44 Years | 2,211 (7.4%) | 17,229 (57.5%) |
| 45 to 54 Years | 1,974 (6.6%) | 19,002 (63.8%) |
| 55 to 64 Years | 3,503 (11.5%) | 21,384 (70.4%) |
| 65 to 74 Years | 16,442 (87.7%) | 9,487 (50.6%) |
| 75 Years and over | 10,319 (93.9%) | 5,227 (47.6%) |
| Total | 70,758 (29.1%) | 128,422 (52.8%) |
Disability Status by Sex by Age in Garland
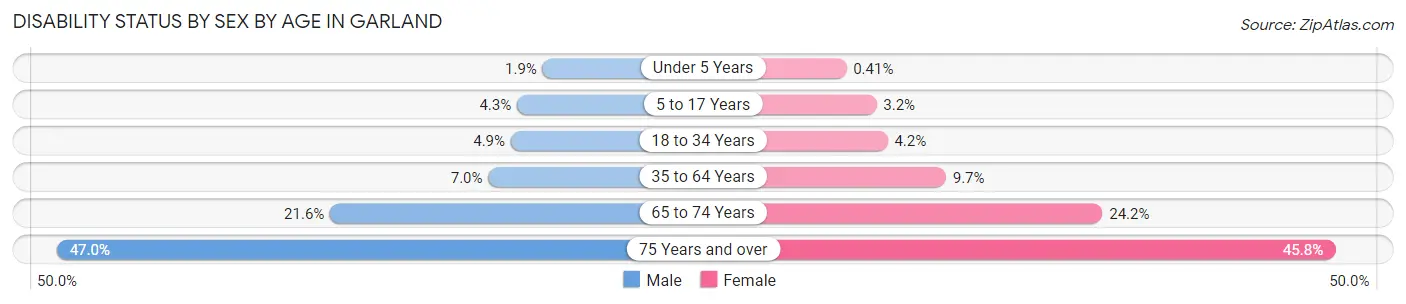
| Age Bracket | Male | Female |
| Under 5 Years | 160 (1.9%) | 28 (0.4%) |
| 5 to 17 Years | 1,028 (4.3%) | 768 (3.2%) |
| 18 to 34 Years | 1,499 (4.9%) | 1,261 (4.2%) |
| 35 to 64 Years | 3,082 (7.0%) | 4,421 (9.7%) |
| 65 to 74 Years | 1,813 (21.6%) | 2,509 (24.2%) |
| 75 Years and over | 2,186 (47.0%) | 2,902 (45.8%) |
Disability Class by Sex by Age in Garland
Disability Class: Hearing Difficulty
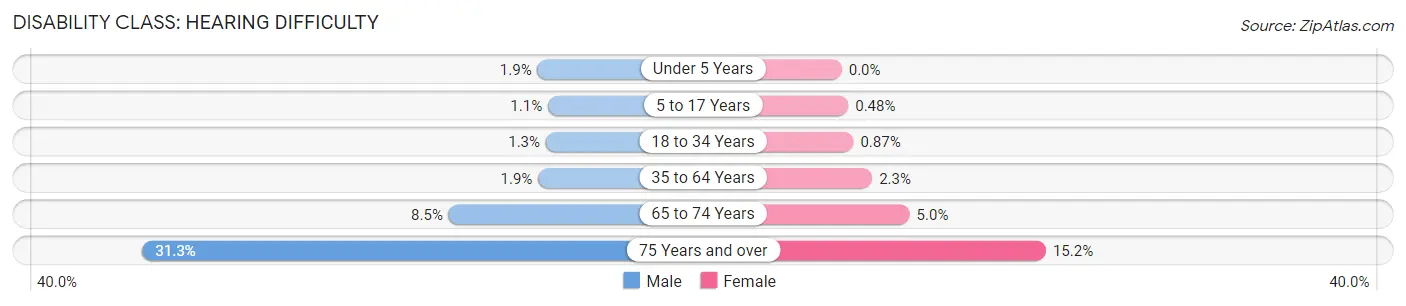
| Age Bracket | Male | Female |
| Under 5 Years | 160 (1.9%) | 0 (0.0%) |
| 5 to 17 Years | 272 (1.1%) | 114 (0.5%) |
| 18 to 34 Years | 399 (1.3%) | 260 (0.9%) |
| 35 to 64 Years | 828 (1.9%) | 1,034 (2.3%) |
| 65 to 74 Years | 713 (8.5%) | 523 (5.0%) |
| 75 Years and over | 1,453 (31.2%) | 961 (15.2%) |
Disability Class: Vision Difficulty
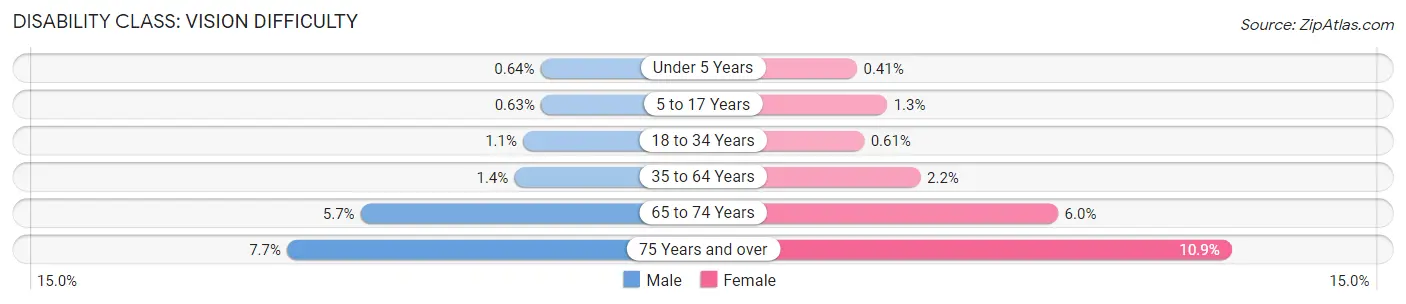
| Age Bracket | Male | Female |
| Under 5 Years | 53 (0.6%) | 28 (0.4%) |
| 5 to 17 Years | 150 (0.6%) | 299 (1.3%) |
| 18 to 34 Years | 349 (1.1%) | 181 (0.6%) |
| 35 to 64 Years | 607 (1.4%) | 1,001 (2.2%) |
| 65 to 74 Years | 473 (5.7%) | 624 (6.0%) |
| 75 Years and over | 358 (7.7%) | 688 (10.8%) |
Disability Class: Cognitive Difficulty
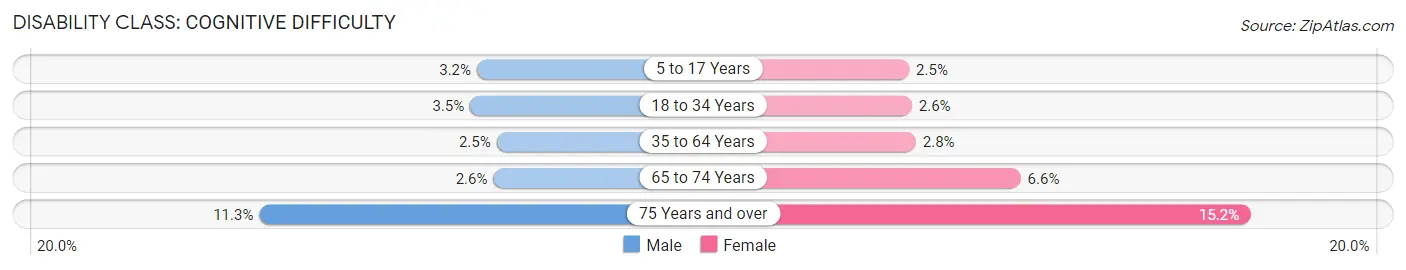
| Age Bracket | Male | Female |
| 5 to 17 Years | 769 (3.2%) | 598 (2.5%) |
| 18 to 34 Years | 1,065 (3.5%) | 774 (2.6%) |
| 35 to 64 Years | 1,100 (2.5%) | 1,260 (2.8%) |
| 65 to 74 Years | 218 (2.6%) | 689 (6.6%) |
| 75 Years and over | 525 (11.3%) | 963 (15.2%) |
Disability Class: Ambulatory Difficulty
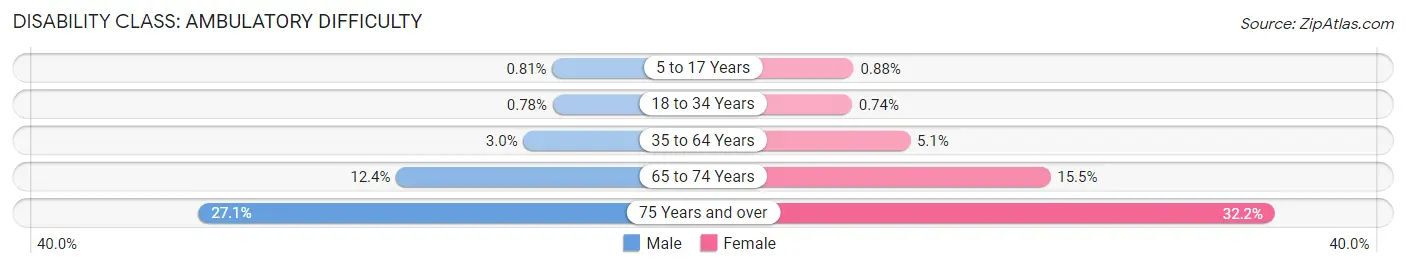
| Age Bracket | Male | Female |
| 5 to 17 Years | 193 (0.8%) | 210 (0.9%) |
| 18 to 34 Years | 241 (0.8%) | 219 (0.7%) |
| 35 to 64 Years | 1,310 (3.0%) | 2,320 (5.1%) |
| 65 to 74 Years | 1,039 (12.4%) | 1,607 (15.5%) |
| 75 Years and over | 1,260 (27.1%) | 2,038 (32.2%) |
Disability Class: Self-Care Difficulty
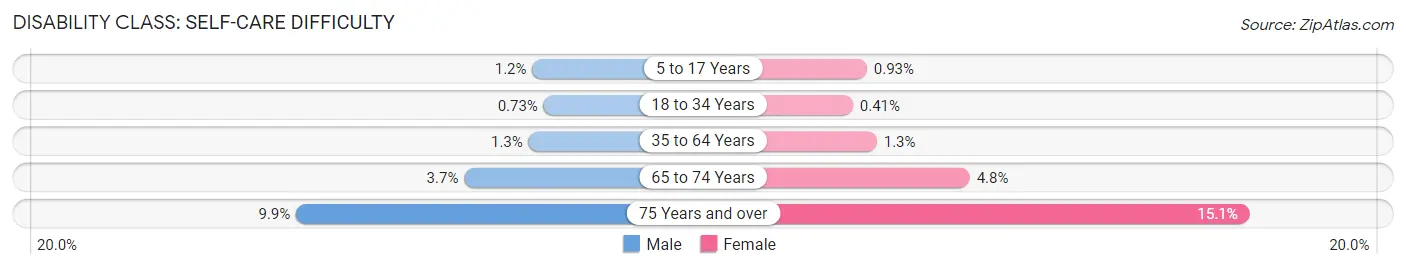
| Age Bracket | Male | Female |
| 5 to 17 Years | 276 (1.1%) | 222 (0.9%) |
| 18 to 34 Years | 224 (0.7%) | 122 (0.4%) |
| 35 to 64 Years | 571 (1.3%) | 597 (1.3%) |
| 65 to 74 Years | 308 (3.7%) | 493 (4.8%) |
| 75 Years and over | 461 (9.9%) | 960 (15.1%) |
Technology Access in Garland
Computing Device Access in Garland
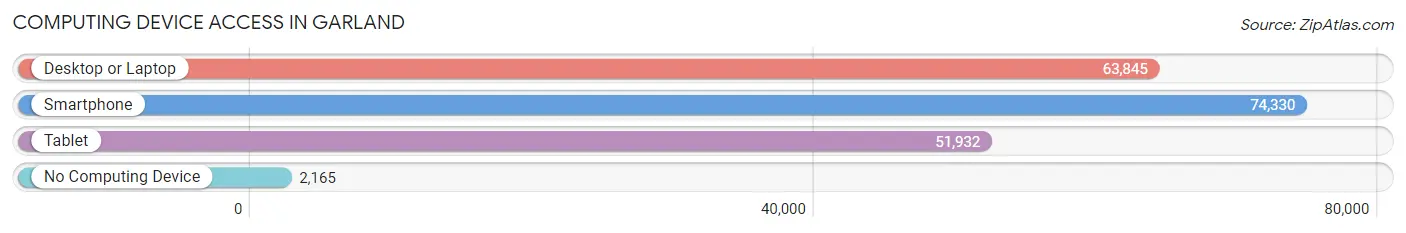
| Device Type | # Households | % Households |
| Desktop or Laptop | 63,845 | 80.0% |
| Smartphone | 74,330 | 93.2% |
| Tablet | 51,932 | 65.1% |
| No Computing Device | 2,165 | 2.7% |
| Total | 79,770 | 100.0% |
Internet Access in Garland
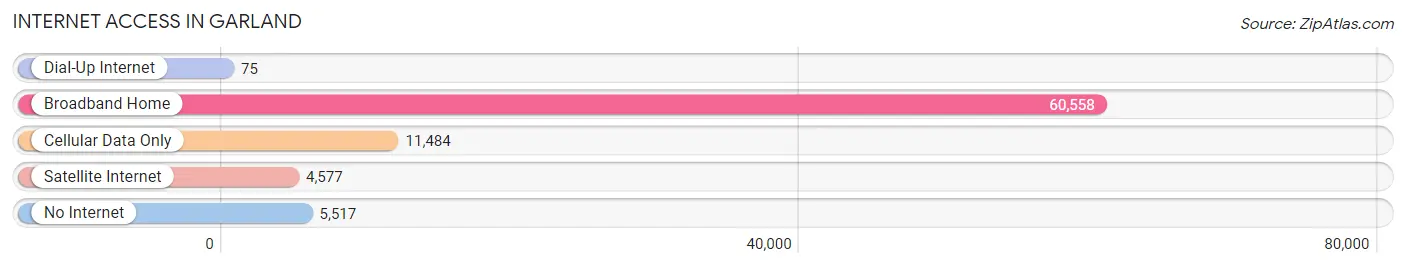
| Internet Type | # Households | % Households |
| Dial-Up Internet | 75 | 0.1% |
| Broadband Home | 60,558 | 75.9% |
| Cellular Data Only | 11,484 | 14.4% |
| Satellite Internet | 4,577 | 5.7% |
| No Internet | 5,517 | 6.9% |
| Total | 79,770 | 100.0% |
Garland Summary
Garland, Texas is a city located in the Dallas-Fort Worth metropolitan area in the U.S. state of Texas. It is the second-largest city in Dallas County and the twelfth-largest city in the state. As of the 2010 census, the city had a population of 226,876, making it the 87th-most populous city in the United States of America.
History
Garland was founded in 1891 by two real estate developers, Charles E. Cockrell and George W. Couch. The city was named after U.S. Attorney General Augustus Hill Garland, who was appointed by President Grover Cleveland in 1886. The city was incorporated in 1891 and was initially a farming community.
In the early 20th century, Garland experienced rapid growth due to the development of the cotton industry. The city was also a major hub for the railroad industry, with the Texas and Pacific Railway running through the city.
In the 1950s, Garland experienced a population boom due to the growth of the Dallas-Fort Worth metropolitan area. The city was also home to the first shopping mall in the area, Firewheel Town Center, which opened in 1961.
Geography
Garland is located in the Dallas-Fort Worth metropolitan area in the U.S. state of Texas. It is situated in the northeastern part of the state, approximately 20 miles northeast of downtown Dallas. The city is bordered by the cities of Richardson to the west, Mesquite to the east, and Sachse to the north.
Garland covers an area of 57.1 square miles and has an elevation of 545 feet. The city is located in the Blackland Prairie region of Texas, which is characterized by flat terrain and fertile soil.
Economy
Garland has a diverse economy that is driven by a variety of industries. The city is home to a number of corporate headquarters, including Raytheon, Frito-Lay, and Dr Pepper Snapple Group. The city is also home to a number of manufacturing and distribution centers, including those operated by PepsiCo, Nestle, and Kimberly-Clark.
The city is also home to a number of retail and entertainment venues, including Firewheel Town Center, which is the largest shopping mall in the Dallas-Fort Worth metropolitan area.
Demographics
As of the 2010 census, the city had a population of 226,876, making it the 87th-most populous city in the United States of America. The racial makeup of the city was 57.2% White, 24.3% African American, 0.7% Native American, 5.2% Asian, 0.1% Pacific Islander, 10.3% from other races, and 2.3% from two or more races. Hispanic or Latino of any race were 24.3% of the population.
The median household income in Garland was $50,945, and the median family income was $60,945. The per capita income for the city was $25,945. The poverty rate was 14.2%.
Garland is served by the Garland Independent School District, which consists of 33 elementary schools, 10 middle schools, and 5 high schools. The city is also home to a number of private schools, including Garland Christian Academy and Garland Montessori School.
Common Questions
What is Per Capita Income in Garland?
Per Capita income in Garland is $30,132.
What is the Median Family Income in Garland?
Median Family Income in Garland is $77,710.
What is the Median Household income in Garland?
Median Household Income in Garland is $71,044.
What is Income or Wage Gap in Garland?
Income or Wage Gap in Garland is 23.2%.
Women in Garland earn 76.8 cents for every dollar earned by a man.
What is Family Income Deficit in Garland?
Family Income Deficit in Garland is $11,042.
Families that are below poverty line in Garland earn $11,042 less on average than the poverty threshold level.
What is Inequality or Gini Index in Garland?
Inequality or Gini Index in Garland is 0.41.
What is the Total Population of Garland?
Total Population of Garland is 244,026.
What is the Total Male Population of Garland?
Total Male Population of Garland is 120,727.
What is the Total Female Population of Garland?
Total Female Population of Garland is 123,299.
What is the Ratio of Males per 100 Females in Garland?
There are 97.91 Males per 100 Females in Garland.
What is the Ratio of Females per 100 Males in Garland?
There are 102.13 Females per 100 Males in Garland.
What is the Median Population Age in Garland?
Median Population Age in Garland is 34.4 Years.
What is the Average Family Size in Garland
Average Family Size in Garland is 3.5 People.
What is the Average Household Size in Garland
Average Household Size in Garland is 3.0 People.
How Large is the Labor Force in Garland?
There are 130,010 People in the Labor Forcein in Garland.
What is the Percentage of People in the Labor Force in Garland?
68.9% of People are in the Labor Force in Garland.
What is the Unemployment Rate in Garland?
Unemployment Rate in Garland is 5.2%.