Grand Rapids, MI Map & Demographics
Grand Rapids Map
Grand Rapids Overview
$32,371
PER CAPITA INCOME
$77,651
AVG FAMILY INCOME
$61,634
AVG HOUSEHOLD INCOME
22.4%
WAGE / INCOME GAP [ % ]
77.6¢/ $1
WAGE / INCOME GAP [ $ ]
$11,247
FAMILY INCOME DEFICIT
0.44
INEQUALITY / GINI INDEX
198,096
TOTAL POPULATION
96,902
MALE POPULATION
101,194
FEMALE POPULATION
95.76
MALES / 100 FEMALES
104.43
FEMALES / 100 MALES
31.8
MEDIAN AGE
3.1
AVG FAMILY SIZE
2.4
AVG HOUSEHOLD SIZE
109,965
LABOR FORCE [ PEOPLE ]
68.7%
PERCENT IN LABOR FORCE
5.6%
UNEMPLOYMENT RATE
Grand Rapids Zip Codes
Grand Rapids Area Codes
Income in Grand Rapids
Income Overview in Grand Rapids
Per Capita Income in Grand Rapids is $32,371, while median incomes of families and households are $77,651 and $61,634 respectively.
| Characteristic | Number | Measure |
| Per Capita Income | 198,096 | $32,371 |
| Median Family Income | 42,629 | $77,651 |
| Mean Family Income | 42,629 | $92,825 |
| Median Household Income | 79,009 | $61,634 |
| Mean Household Income | 79,009 | $78,386 |
| Income Deficit | 42,629 | $11,247 |
| Wage / Income Gap (%) | 198,096 | 22.38% |
| Wage / Income Gap ($) | 198,096 | 77.62¢ per $1 |
| Gini / Inequality Index | 198,096 | 0.44 |
Earnings by Sex in Grand Rapids
Average Earnings in Grand Rapids are $35,865, $40,405 for men and $31,363 for women, a difference of 22.4%.
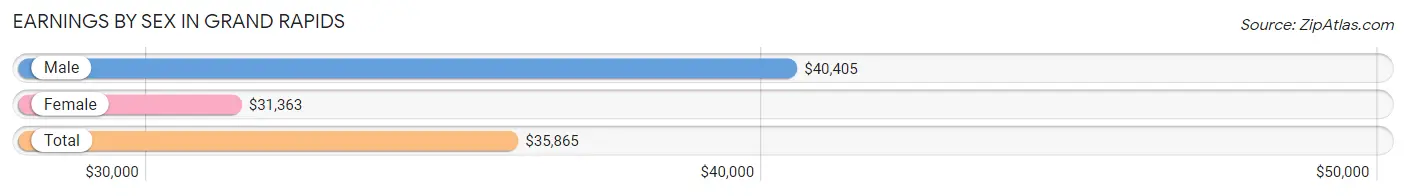
| Sex | Number | Average Earnings |
| Male | 59,669 (51.4%) | $40,405 |
| Female | 56,333 (48.6%) | $31,363 |
| Total | 116,002 (100.0%) | $35,865 |
Earnings by Sex by Income Bracket in Grand Rapids
The most common earnings brackets in Grand Rapids are $75,000 to $99,999 for men (6,086 | 10.2%) and $2,499 or less for women (4,501 | 8.0%).
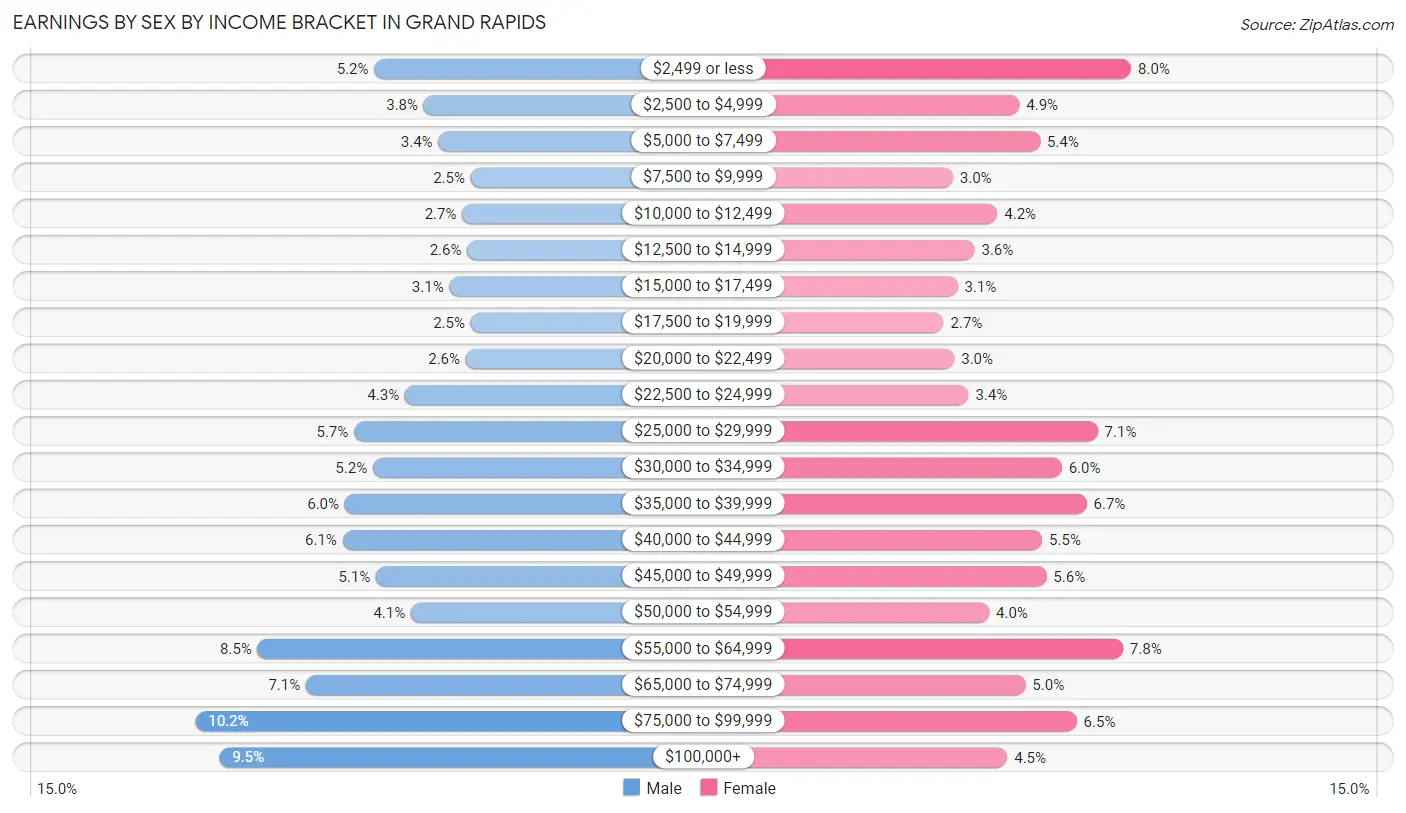
| Income | Male | Female |
| $2,499 or less | 3,087 (5.2%) | 4,501 (8.0%) |
| $2,500 to $4,999 | 2,254 (3.8%) | 2,730 (4.9%) |
| $5,000 to $7,499 | 2,012 (3.4%) | 3,058 (5.4%) |
| $7,500 to $9,999 | 1,466 (2.5%) | 1,681 (3.0%) |
| $10,000 to $12,499 | 1,610 (2.7%) | 2,382 (4.2%) |
| $12,500 to $14,999 | 1,527 (2.6%) | 2,020 (3.6%) |
| $15,000 to $17,499 | 1,826 (3.1%) | 1,752 (3.1%) |
| $17,500 to $19,999 | 1,466 (2.5%) | 1,532 (2.7%) |
| $20,000 to $22,499 | 1,550 (2.6%) | 1,699 (3.0%) |
| $22,500 to $24,999 | 2,573 (4.3%) | 1,926 (3.4%) |
| $25,000 to $29,999 | 3,425 (5.7%) | 3,972 (7.0%) |
| $30,000 to $34,999 | 3,110 (5.2%) | 3,400 (6.0%) |
| $35,000 to $39,999 | 3,579 (6.0%) | 3,797 (6.7%) |
| $40,000 to $44,999 | 3,615 (6.1%) | 3,091 (5.5%) |
| $45,000 to $49,999 | 3,058 (5.1%) | 3,159 (5.6%) |
| $50,000 to $54,999 | 2,468 (4.1%) | 2,252 (4.0%) |
| $55,000 to $64,999 | 5,041 (8.5%) | 4,372 (7.8%) |
| $65,000 to $74,999 | 4,231 (7.1%) | 2,827 (5.0%) |
| $75,000 to $99,999 | 6,086 (10.2%) | 3,639 (6.5%) |
| $100,000+ | 5,685 (9.5%) | 2,543 (4.5%) |
| Total | 59,669 (100.0%) | 56,333 (100.0%) |
Earnings by Sex by Educational Attainment in Grand Rapids
Average earnings in Grand Rapids are $47,268 for men and $38,428 for women, a difference of 18.7%. Men with an educational attainment of graduate degree enjoy the highest average annual earnings of $72,108, while those with less than high school education earn the least with $33,058. Women with an educational attainment of graduate degree earn the most with the average annual earnings of $60,434, while those with less than high school education have the smallest earnings of $21,295.
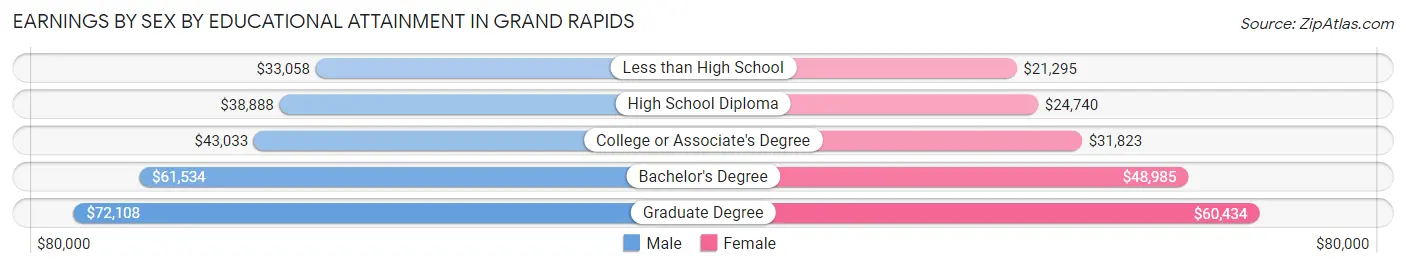
| Educational Attainment | Male Income | Female Income |
| Less than High School | $33,058 | $21,295 |
| High School Diploma | $38,888 | $24,740 |
| College or Associate's Degree | $43,033 | $31,823 |
| Bachelor's Degree | $61,534 | $48,985 |
| Graduate Degree | $72,108 | $60,434 |
| Total | $47,268 | $38,428 |
Family Income in Grand Rapids
Family Income Brackets in Grand Rapids
According to the Grand Rapids family income data, there are 9,250 families falling into the $100,000 to $149,999 income range, which is the most common income bracket and makes up 21.7% of all families. Conversely, the $10,000 to $14,999 income bracket is the least frequent group with only 1,449 families (3.4%) belonging to this category.
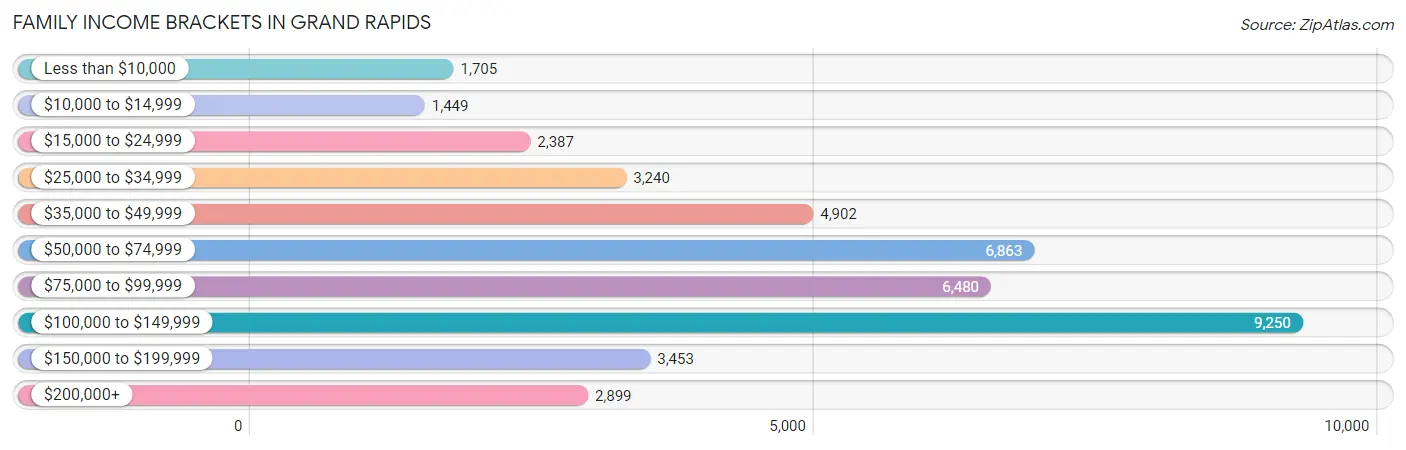
| Income Bracket | # Families | % Families |
| Less than $10,000 | 1,705 | 4.0% |
| $10,000 to $14,999 | 1,449 | 3.4% |
| $15,000 to $24,999 | 2,387 | 5.6% |
| $25,000 to $34,999 | 3,240 | 7.6% |
| $35,000 to $49,999 | 4,902 | 11.5% |
| $50,000 to $74,999 | 6,863 | 16.1% |
| $75,000 to $99,999 | 6,480 | 15.2% |
| $100,000 to $149,999 | 9,250 | 21.7% |
| $150,000 to $199,999 | 3,453 | 8.1% |
| $200,000+ | 2,899 | 6.8% |
Family Income by Famaliy Size in Grand Rapids
4-person families (6,922 | 16.2%) account for the highest median family income in Grand Rapids with $83,487 per family, while 2-person families (20,195 | 47.4%) have the highest median income of $37,620 per family member.
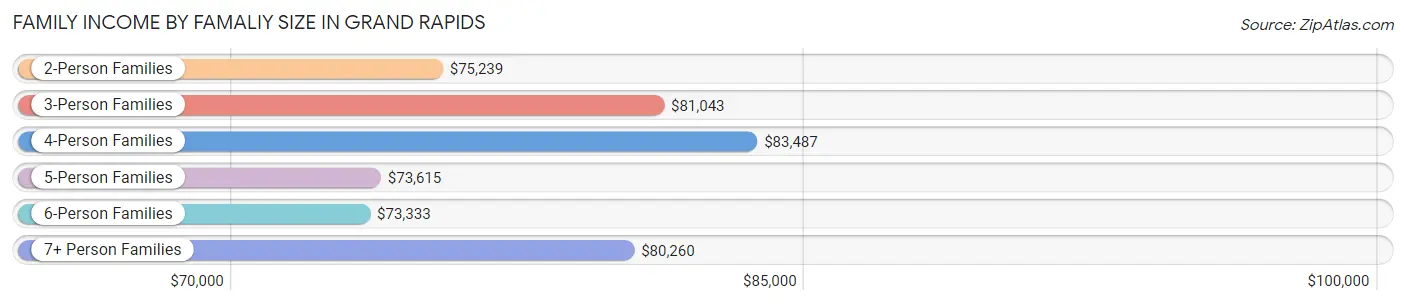
| Income Bracket | # Families | Median Income |
| 2-Person Families | 20,195 (47.4%) | $75,239 |
| 3-Person Families | 9,279 (21.8%) | $81,043 |
| 4-Person Families | 6,922 (16.2%) | $83,487 |
| 5-Person Families | 3,860 (9.0%) | $73,615 |
| 6-Person Families | 1,328 (3.1%) | $73,333 |
| 7+ Person Families | 1,045 (2.5%) | $80,260 |
| Total | 42,629 (100.0%) | $77,651 |
Family Income by Number of Earners in Grand Rapids
The median family income in Grand Rapids is $77,651, with families comprising 3+ earners (5,030) having the highest median family income of $115,978, while families with no earners (4,921) have the lowest median family income of $35,317, accounting for 11.8% and 11.5% of families, respectively.
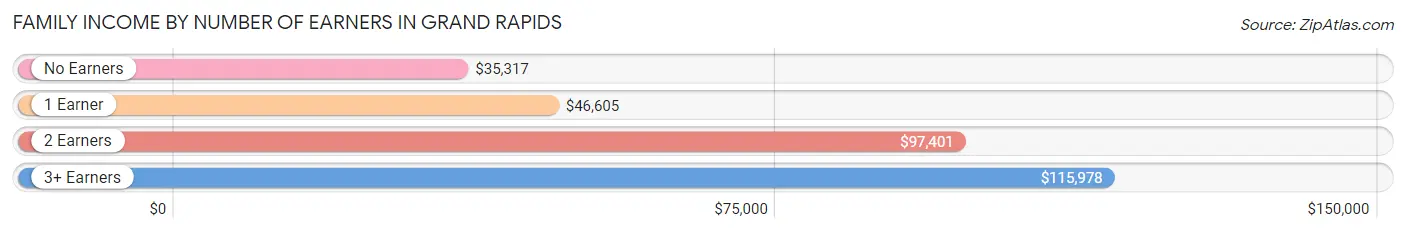
| Number of Earners | # Families | Median Income |
| No Earners | 4,921 (11.5%) | $35,317 |
| 1 Earner | 13,158 (30.9%) | $46,605 |
| 2 Earners | 19,520 (45.8%) | $97,401 |
| 3+ Earners | 5,030 (11.8%) | $115,978 |
| Total | 42,629 (100.0%) | $77,651 |
Household Income in Grand Rapids
Household Income Brackets in Grand Rapids
With 13,748 households falling in the category, the $50,000 to $74,999 income range is the most frequent in Grand Rapids, accounting for 17.4% of all households. In contrast, only 3,792 households (4.8%) fall into the $200,000+ income bracket, making it the least populous group.
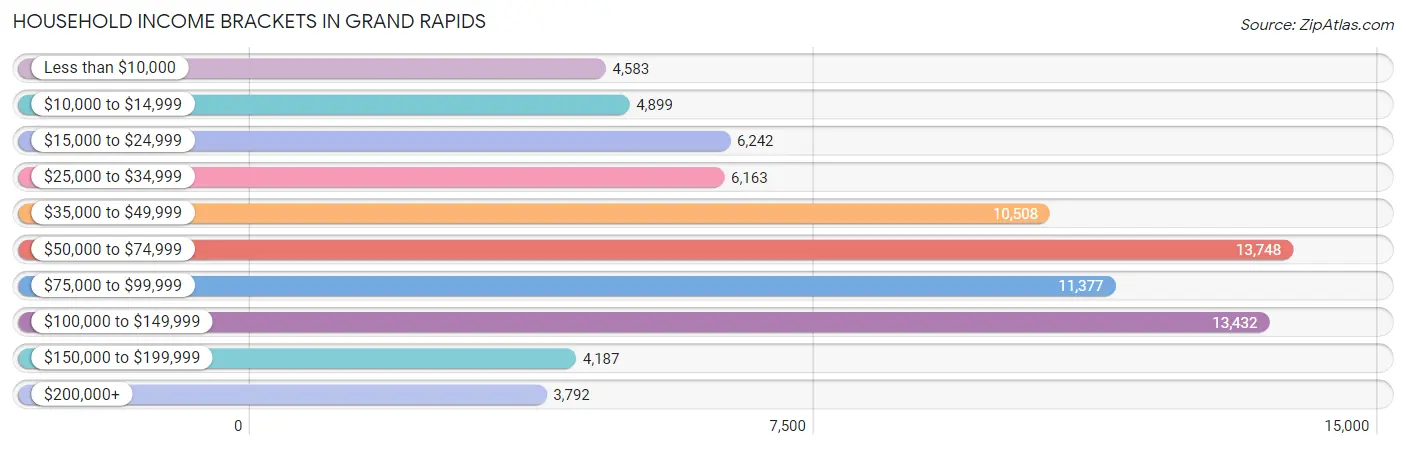
| Income Bracket | # Households | % Households |
| Less than $10,000 | 4,583 | 5.8% |
| $10,000 to $14,999 | 4,899 | 6.2% |
| $15,000 to $24,999 | 6,242 | 7.9% |
| $25,000 to $34,999 | 6,163 | 7.8% |
| $35,000 to $49,999 | 10,508 | 13.3% |
| $50,000 to $74,999 | 13,748 | 17.4% |
| $75,000 to $99,999 | 11,377 | 14.4% |
| $100,000 to $149,999 | 13,432 | 17.0% |
| $150,000 to $199,999 | 4,187 | 5.3% |
| $200,000+ | 3,792 | 4.8% |
Household Income by Householder Age in Grand Rapids
The median household income in Grand Rapids is $61,634, with the highest median household income of $73,611 found in the 25 to 44 years age bracket for the primary householder. A total of 32,922 households (41.7%) fall into this category. Meanwhile, the 65+ years age bracket for the primary householder has the lowest median household income of $42,754, with 16,972 households (21.5%) in this group.
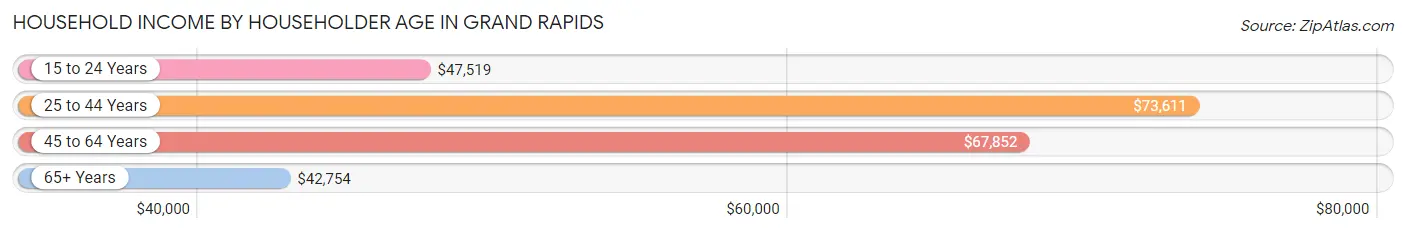
| Income Bracket | # Households | Median Income |
| 15 to 24 Years | 6,506 (8.2%) | $47,519 |
| 25 to 44 Years | 32,922 (41.7%) | $73,611 |
| 45 to 64 Years | 22,609 (28.6%) | $67,852 |
| 65+ Years | 16,972 (21.5%) | $42,754 |
| Total | 79,009 (100.0%) | $61,634 |
Poverty in Grand Rapids
Income Below Poverty by Sex and Age in Grand Rapids
With 16.9% poverty level for males and 21.1% for females among the residents of Grand Rapids, 5 year old males and 5 year old females are the most vulnerable to poverty, with 396 males (31.2%) and 404 females (38.3%) in their respective age groups living below the poverty level.
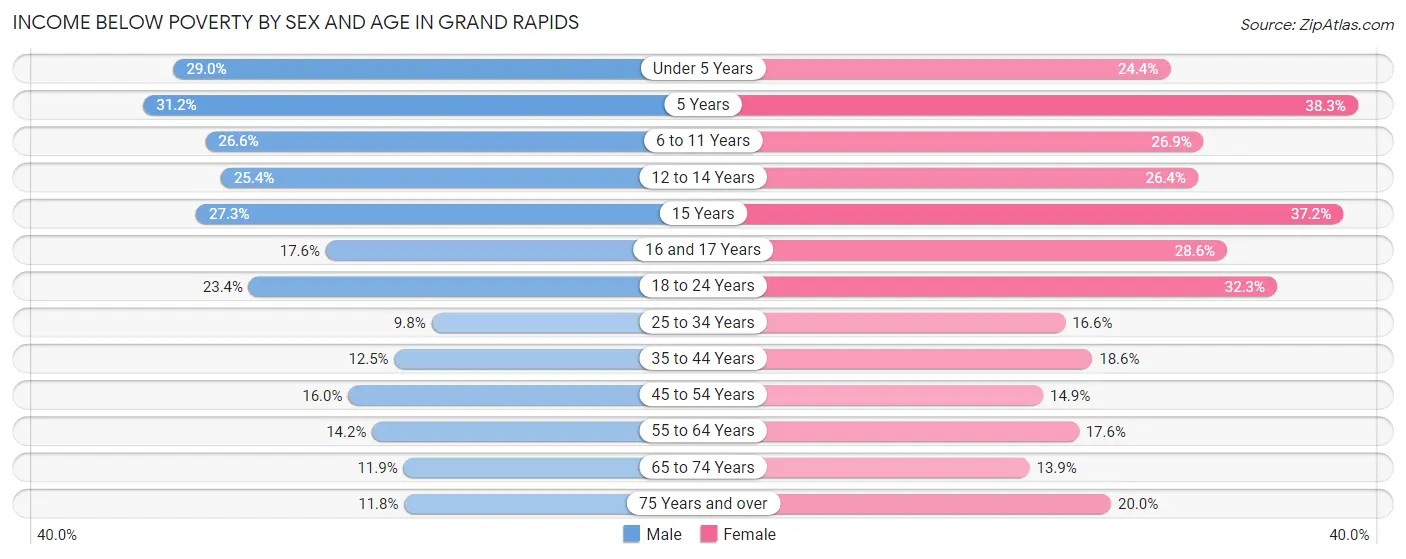
| Age Bracket | Male | Female |
| Under 5 Years | 1,954 (29.0%) | 1,499 (24.4%) |
| 5 Years | 396 (31.2%) | 404 (38.3%) |
| 6 to 11 Years | 1,785 (26.6%) | 1,629 (26.9%) |
| 12 to 14 Years | 676 (25.4%) | 1,001 (26.4%) |
| 15 Years | 309 (27.3%) | 601 (37.2%) |
| 16 and 17 Years | 425 (17.6%) | 572 (28.6%) |
| 18 to 24 Years | 2,723 (23.4%) | 3,962 (32.3%) |
| 25 to 34 Years | 1,913 (9.8%) | 3,321 (16.6%) |
| 35 to 44 Years | 1,479 (12.5%) | 2,216 (18.6%) |
| 45 to 54 Years | 1,526 (16.0%) | 1,388 (14.9%) |
| 55 to 64 Years | 1,399 (14.2%) | 1,700 (17.6%) |
| 65 to 74 Years | 775 (11.9%) | 1,130 (13.9%) |
| 75 Years and over | 369 (11.8%) | 1,204 (20.0%) |
| Total | 15,729 (16.9%) | 20,627 (21.1%) |
Income Above Poverty by Sex and Age in Grand Rapids
According to the poverty statistics in Grand Rapids, males aged 25 to 34 years and females aged 65 to 74 years are the age groups that are most secure financially, with 90.2% of males and 86.1% of females in these age groups living above the poverty line.
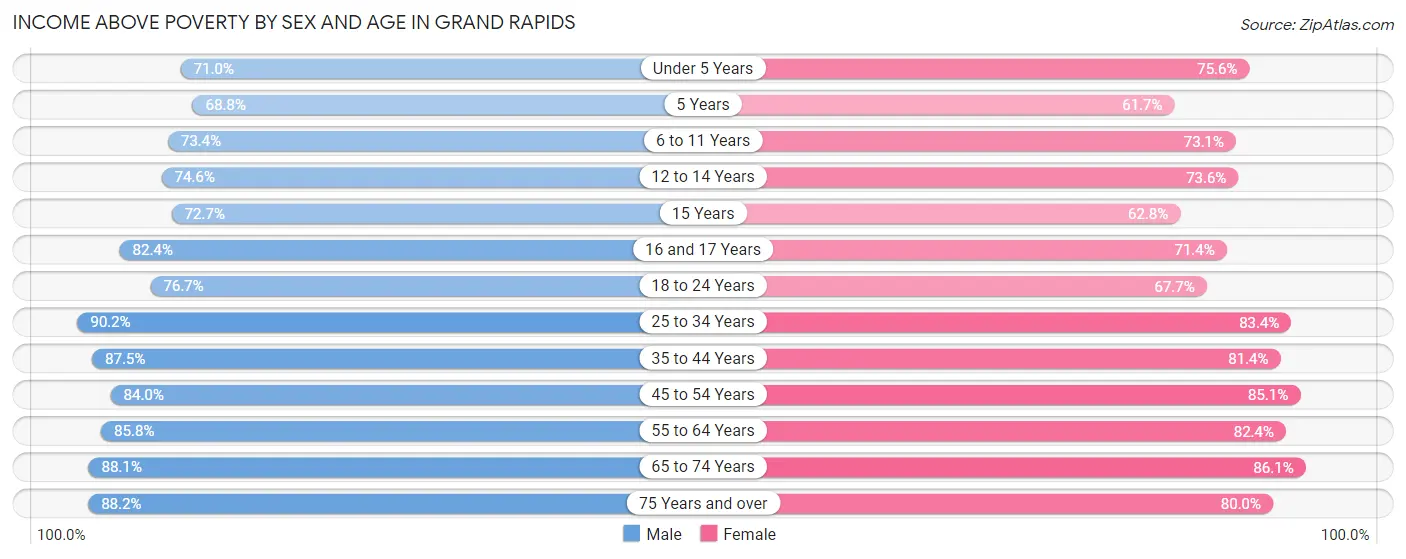
| Age Bracket | Male | Female |
| Under 5 Years | 4,793 (71.0%) | 4,651 (75.6%) |
| 5 Years | 874 (68.8%) | 651 (61.7%) |
| 6 to 11 Years | 4,930 (73.4%) | 4,436 (73.1%) |
| 12 to 14 Years | 1,983 (74.6%) | 2,786 (73.6%) |
| 15 Years | 824 (72.7%) | 1,014 (62.8%) |
| 16 and 17 Years | 1,984 (82.4%) | 1,429 (71.4%) |
| 18 to 24 Years | 8,937 (76.6%) | 8,304 (67.7%) |
| 25 to 34 Years | 17,629 (90.2%) | 16,699 (83.4%) |
| 35 to 44 Years | 10,315 (87.5%) | 9,695 (81.4%) |
| 45 to 54 Years | 8,031 (84.0%) | 7,902 (85.1%) |
| 55 to 64 Years | 8,460 (85.8%) | 7,965 (82.4%) |
| 65 to 74 Years | 5,754 (88.1%) | 6,975 (86.1%) |
| 75 Years and over | 2,756 (88.2%) | 4,819 (80.0%) |
| Total | 77,270 (83.1%) | 77,326 (78.9%) |
Income Below Poverty Among Married-Couple Families in Grand Rapids
The poverty statistics for married-couple families in Grand Rapids show that 5.0% or 1,399 of the total 28,119 families live below the poverty line. Families with 5 or more children have the highest poverty rate of 9.9%, comprising of 27 families. On the other hand, families with no children have the lowest poverty rate of 3.0%, which includes 490 families.
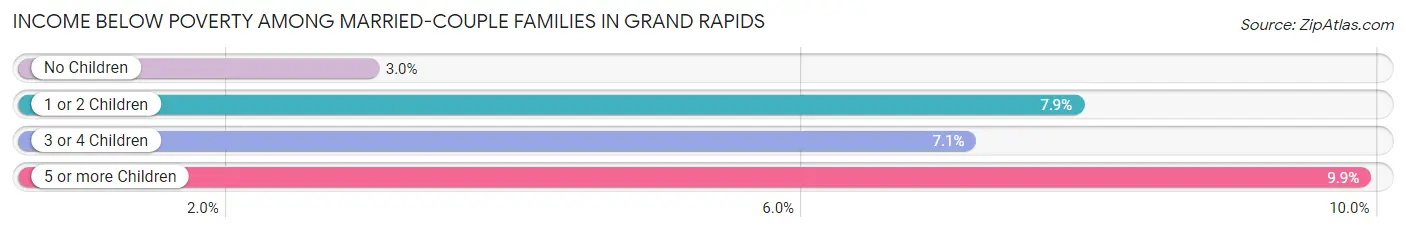
| Children | Above Poverty | Below Poverty |
| No Children | 15,934 (97.0%) | 490 (3.0%) |
| 1 or 2 Children | 8,161 (92.1%) | 699 (7.9%) |
| 3 or 4 Children | 2,379 (92.9%) | 183 (7.1%) |
| 5 or more Children | 246 (90.1%) | 27 (9.9%) |
| Total | 26,720 (95.0%) | 1,399 (5.0%) |
Income Below Poverty Among Single-Parent Households in Grand Rapids
According to the poverty data in Grand Rapids, 14.1% or 602 single-father households and 35.4% or 3,624 single-mother households are living below the poverty line. Among single-father households, those with 3 or 4 children have the highest poverty rate, with 125 households (32.4%) experiencing poverty. Likewise, among single-mother households, those with 5 or more children have the highest poverty rate, with 172 households (72.3%) falling below the poverty line.
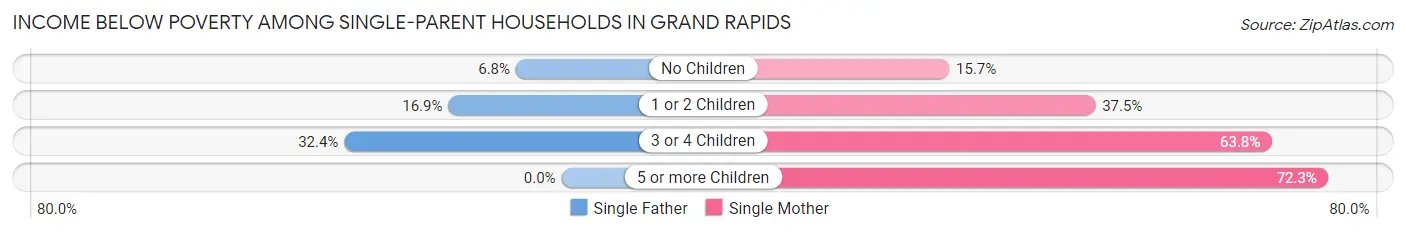
| Children | Single Father | Single Mother |
| No Children | 121 (6.8%) | 559 (15.7%) |
| 1 or 2 Children | 356 (16.9%) | 1,728 (37.5%) |
| 3 or 4 Children | 125 (32.4%) | 1,165 (63.8%) |
| 5 or more Children | 0 (0.0%) | 172 (72.3%) |
| Total | 602 (14.1%) | 3,624 (35.4%) |
Income Below Poverty Among Married-Couple vs Single-Parent Households in Grand Rapids
The poverty data for Grand Rapids shows that 1,399 of the married-couple family households (5.0%) and 4,226 of the single-parent households (29.1%) are living below the poverty level. Within the married-couple family households, those with 5 or more children have the highest poverty rate, with 27 households (9.9%) falling below the poverty line. Among the single-parent households, those with 5 or more children have the highest poverty rate, with 172 household (72.3%) living below poverty.
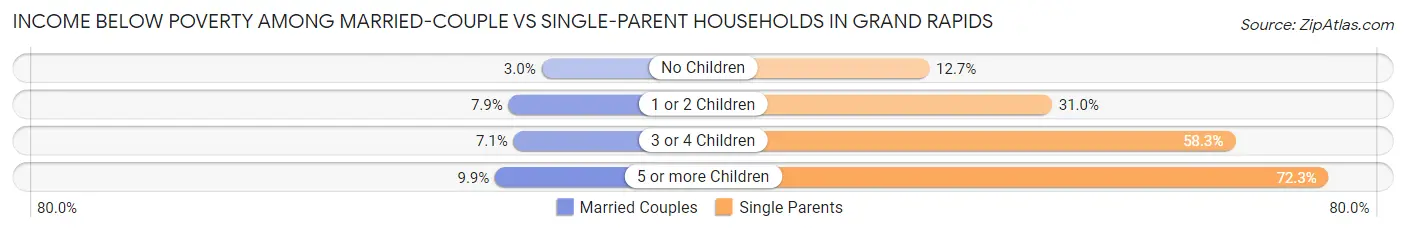
| Children | Married-Couple Families | Single-Parent Households |
| No Children | 490 (3.0%) | 680 (12.7%) |
| 1 or 2 Children | 699 (7.9%) | 2,084 (31.0%) |
| 3 or 4 Children | 183 (7.1%) | 1,290 (58.3%) |
| 5 or more Children | 27 (9.9%) | 172 (72.3%) |
| Total | 1,399 (5.0%) | 4,226 (29.1%) |
Race in Grand Rapids
The most populous races in Grand Rapids are White / Caucasian (124,770 | 63.0%), Black / African American (35,425 | 17.9%), and Hispanic or Latino (31,593 | 16.0%).
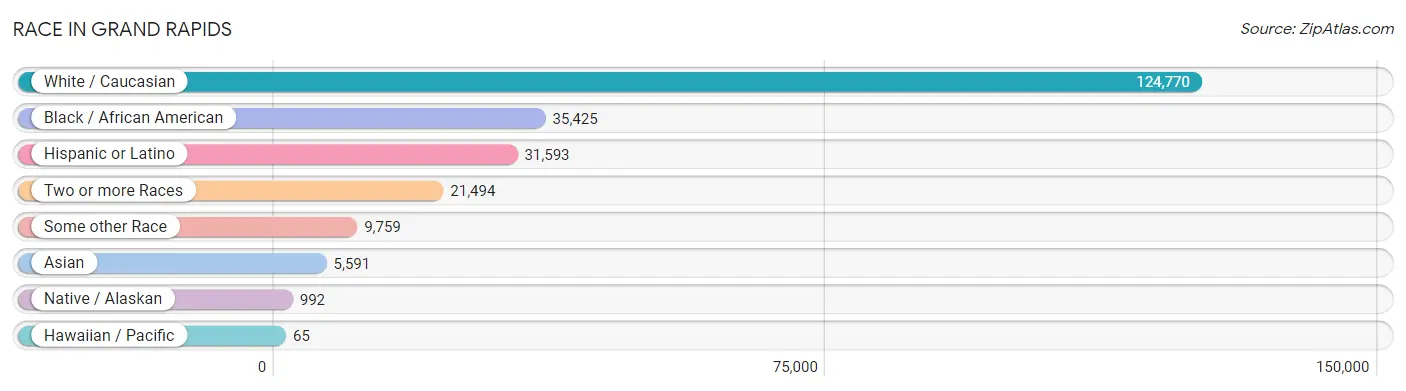
| Race | # Population | % Population |
| Asian | 5,591 | 2.8% |
| Black / African American | 35,425 | 17.9% |
| Hawaiian / Pacific | 65 | 0.0% |
| Hispanic or Latino | 31,593 | 16.0% |
| Native / Alaskan | 992 | 0.5% |
| White / Caucasian | 124,770 | 63.0% |
| Two or more Races | 21,494 | 10.8% |
| Some other Race | 9,759 | 4.9% |
| Total | 198,096 | 100.0% |
Ancestry in Grand Rapids
The most populous ancestries reported in Grand Rapids are German (27,696 | 14.0%), Dutch (24,136 | 12.2%), Mexican (19,335 | 9.8%), Irish (15,405 | 7.8%), and English (13,207 | 6.7%), together accounting for 50.4% of all Grand Rapids residents.
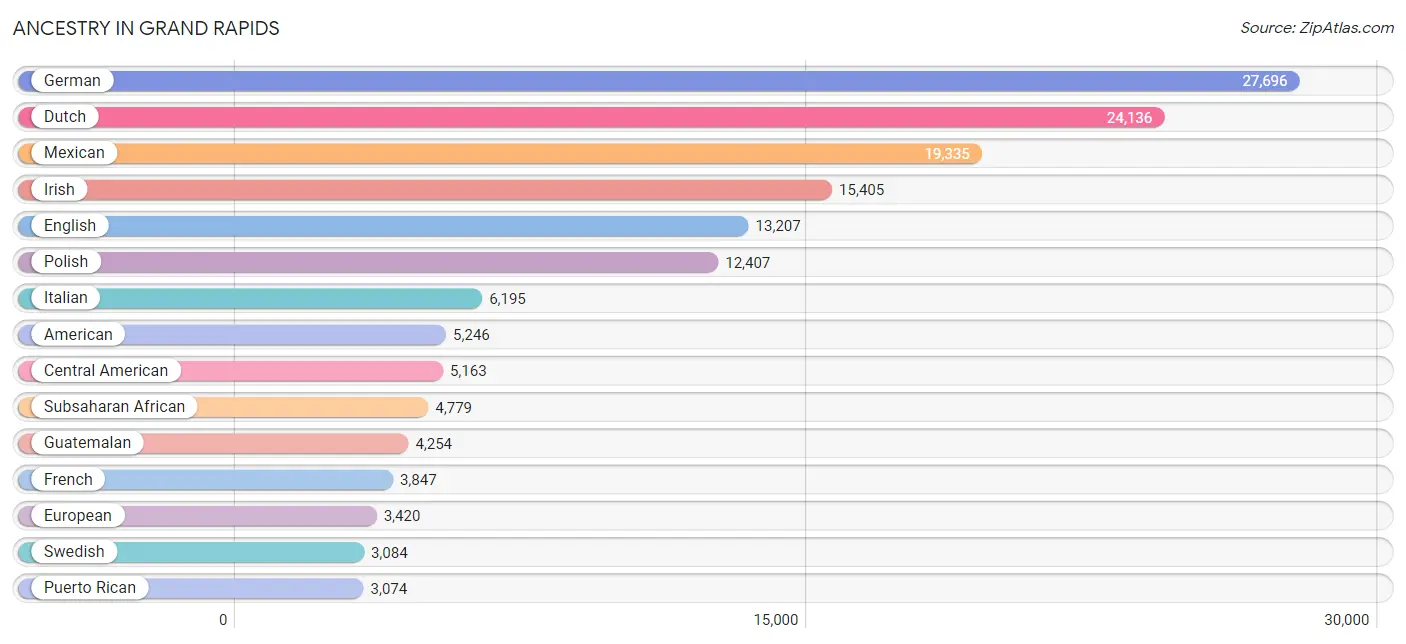
| Ancestry | # Population | % Population |
| African | 1,449 | 0.7% |
| Alaska Native | 3 | 0.0% |
| Albanian | 64 | 0.0% |
| American | 5,246 | 2.6% |
| Apache | 30 | 0.0% |
| Arab | 1,375 | 0.7% |
| Argentinean | 78 | 0.0% |
| Armenian | 115 | 0.1% |
| Australian | 32 | 0.0% |
| Austrian | 447 | 0.2% |
| Bangladeshi | 4 | 0.0% |
| Belgian | 321 | 0.2% |
| Bhutanese | 246 | 0.1% |
| Blackfeet | 14 | 0.0% |
| Brazilian | 54 | 0.0% |
| British | 1,586 | 0.8% |
| Bulgarian | 33 | 0.0% |
| Burmese | 1,426 | 0.7% |
| Canadian | 403 | 0.2% |
| Carpatho Rusyn | 11 | 0.0% |
| Central American | 5,163 | 2.6% |
| Central American Indian | 216 | 0.1% |
| Cherokee | 378 | 0.2% |
| Chilean | 245 | 0.1% |
| Chinese | 15 | 0.0% |
| Chippewa | 490 | 0.3% |
| Choctaw | 104 | 0.1% |
| Colombian | 150 | 0.1% |
| Creek | 30 | 0.0% |
| Croatian | 130 | 0.1% |
| Cuban | 581 | 0.3% |
| Czech | 680 | 0.3% |
| Czechoslovakian | 341 | 0.2% |
| Danish | 909 | 0.5% |
| Delaware | 7 | 0.0% |
| Dominican | 1,061 | 0.5% |
| Dutch | 24,136 | 12.2% |
| Eastern European | 531 | 0.3% |
| Ecuadorian | 108 | 0.1% |
| Egyptian | 5 | 0.0% |
| English | 13,207 | 6.7% |
| Estonian | 12 | 0.0% |
| Ethiopian | 359 | 0.2% |
| European | 3,420 | 1.7% |
| Filipino | 10 | 0.0% |
| Finnish | 628 | 0.3% |
| French | 3,847 | 1.9% |
| French American Indian | 46 | 0.0% |
| French Canadian | 1,041 | 0.5% |
| German | 27,696 | 14.0% |
| German Russian | 14 | 0.0% |
| Ghanaian | 68 | 0.0% |
| Greek | 778 | 0.4% |
| Guamanian / Chamorro | 38 | 0.0% |
| Guatemalan | 4,254 | 2.1% |
| Haitian | 345 | 0.2% |
| Honduran | 260 | 0.1% |
| Hopi | 95 | 0.1% |
| Hungarian | 700 | 0.4% |
| Icelander | 16 | 0.0% |
| Indian (Asian) | 1,228 | 0.6% |
| Indonesian | 716 | 0.4% |
| Inupiat | 6 | 0.0% |
| Iranian | 54 | 0.0% |
| Iraqi | 121 | 0.1% |
| Irish | 15,405 | 7.8% |
| Iroquois | 5 | 0.0% |
| Israeli | 91 | 0.1% |
| Italian | 6,195 | 3.1% |
| Jamaican | 385 | 0.2% |
| Japanese | 46 | 0.0% |
| Jordanian | 6 | 0.0% |
| Kenyan | 8 | 0.0% |
| Korean | 744 | 0.4% |
| Laotian | 181 | 0.1% |
| Latvian | 322 | 0.2% |
| Lebanese | 359 | 0.2% |
| Liberian | 183 | 0.1% |
| Lithuanian | 837 | 0.4% |
| Macedonian | 14 | 0.0% |
| Malaysian | 47 | 0.0% |
| Maltese | 59 | 0.0% |
| Menominee | 1 | 0.0% |
| Mexican | 19,335 | 9.8% |
| Mexican American Indian | 88 | 0.0% |
| Mongolian | 1 | 0.0% |
| Moroccan | 8 | 0.0% |
| Native Hawaiian | 89 | 0.0% |
| Navajo | 11 | 0.0% |
| New Zealander | 11 | 0.0% |
| Nicaraguan | 96 | 0.1% |
| Nigerian | 423 | 0.2% |
| Northern European | 316 | 0.2% |
| Norwegian | 1,372 | 0.7% |
| Ottawa | 240 | 0.1% |
| Pakistani | 84 | 0.0% |
| Palestinian | 67 | 0.0% |
| Panamanian | 184 | 0.1% |
| Pennsylvania German | 24 | 0.0% |
| Peruvian | 223 | 0.1% |
| Polish | 12,407 | 6.3% |
| Portuguese | 196 | 0.1% |
| Potawatomi | 506 | 0.3% |
| Pueblo | 84 | 0.0% |
| Puerto Rican | 3,074 | 1.5% |
| Romanian | 151 | 0.1% |
| Russian | 721 | 0.4% |
| Salvadoran | 369 | 0.2% |
| Scandinavian | 434 | 0.2% |
| Scotch-Irish | 1,048 | 0.5% |
| Scottish | 2,910 | 1.5% |
| Serbian | 239 | 0.1% |
| Sioux | 28 | 0.0% |
| Slavic | 28 | 0.0% |
| Slovak | 244 | 0.1% |
| Slovene | 93 | 0.1% |
| Somali | 392 | 0.2% |
| South African | 4 | 0.0% |
| South American | 868 | 0.4% |
| South American Indian | 7 | 0.0% |
| Spaniard | 464 | 0.2% |
| Spanish | 284 | 0.1% |
| Sri Lankan | 977 | 0.5% |
| Subsaharan African | 4,779 | 2.4% |
| Sudanese | 65 | 0.0% |
| Swedish | 3,084 | 1.6% |
| Swiss | 705 | 0.4% |
| Syrian | 409 | 0.2% |
| Thai | 1,589 | 0.8% |
| Tlingit-Haida | 8 | 0.0% |
| Trinidadian and Tobagonian | 18 | 0.0% |
| Turkish | 77 | 0.0% |
| Ukrainian | 533 | 0.3% |
| Uruguayan | 21 | 0.0% |
| Venezuelan | 43 | 0.0% |
| Vietnamese | 37 | 0.0% |
| Welsh | 901 | 0.4% |
| West Indian | 27 | 0.0% |
| Yaqui | 14 | 0.0% |
| Yugoslavian | 714 | 0.4% |
| Zimbabwean | 69 | 0.0% | View All 141 Rows |
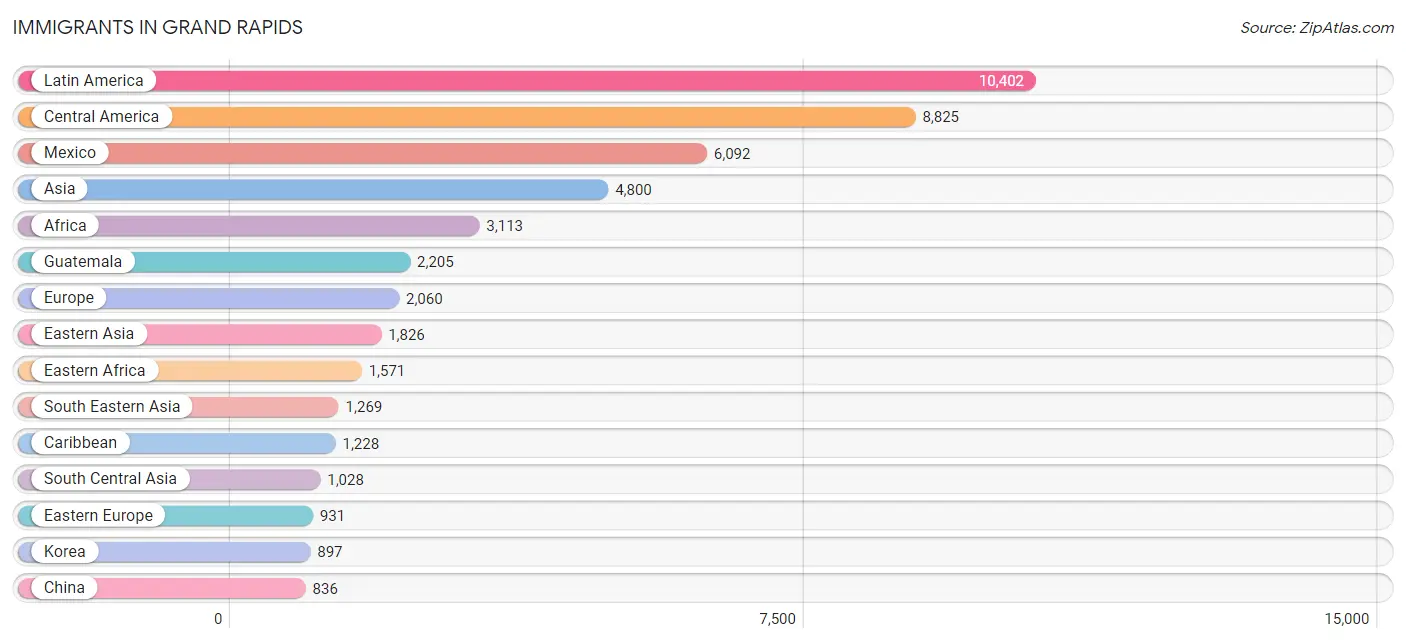
Immigrants in Grand Rapids
The most numerous immigrant groups reported in Grand Rapids came from Latin America (10,402 | 5.2%), Central America (8,825 | 4.4%), Mexico (6,092 | 3.1%), Asia (4,800 | 2.4%), and Africa (3,113 | 1.6%), together accounting for 16.8% of all Grand Rapids residents.
| Immigration Origin | # Population | % Population |
| Africa | 3,113 | 1.6% |
| Albania | 67 | 0.0% |
| Argentina | 6 | 0.0% |
| Asia | 4,800 | 2.4% |
| Australia | 56 | 0.0% |
| Bangladesh | 179 | 0.1% |
| Belarus | 13 | 0.0% |
| Bosnia and Herzegovina | 401 | 0.2% |
| Brazil | 116 | 0.1% |
| Bulgaria | 12 | 0.0% |
| Cambodia | 3 | 0.0% |
| Canada | 369 | 0.2% |
| Caribbean | 1,228 | 0.6% |
| Central America | 8,825 | 4.4% |
| Chile | 49 | 0.0% |
| China | 836 | 0.4% |
| Colombia | 100 | 0.1% |
| Congo | 235 | 0.1% |
| Croatia | 5 | 0.0% |
| Cuba | 407 | 0.2% |
| Czechoslovakia | 6 | 0.0% |
| Denmark | 17 | 0.0% |
| Dominican Republic | 611 | 0.3% |
| Eastern Africa | 1,571 | 0.8% |
| Eastern Asia | 1,826 | 0.9% |
| Eastern Europe | 931 | 0.5% |
| Ecuador | 7 | 0.0% |
| Egypt | 13 | 0.0% |
| El Salvador | 124 | 0.1% |
| England | 129 | 0.1% |
| Eritrea | 70 | 0.0% |
| Ethiopia | 191 | 0.1% |
| Europe | 2,060 | 1.0% |
| France | 55 | 0.0% |
| Germany | 315 | 0.2% |
| Ghana | 125 | 0.1% |
| Greece | 24 | 0.0% |
| Guatemala | 2,205 | 1.1% |
| Haiti | 99 | 0.1% |
| Honduras | 218 | 0.1% |
| Hong Kong | 52 | 0.0% |
| India | 678 | 0.3% |
| Indonesia | 20 | 0.0% |
| Iran | 19 | 0.0% |
| Iraq | 352 | 0.2% |
| Ireland | 4 | 0.0% |
| Israel | 27 | 0.0% |
| Italy | 73 | 0.0% |
| Jamaica | 111 | 0.1% |
| Japan | 93 | 0.1% |
| Jordan | 38 | 0.0% |
| Kazakhstan | 34 | 0.0% |
| Kenya | 11 | 0.0% |
| Korea | 897 | 0.4% |
| Latin America | 10,402 | 5.2% |
| Latvia | 92 | 0.1% |
| Lebanon | 5 | 0.0% |
| Liberia | 183 | 0.1% |
| Malaysia | 57 | 0.0% |
| Mexico | 6,092 | 3.1% |
| Middle Africa | 775 | 0.4% |
| Morocco | 8 | 0.0% |
| Nepal | 93 | 0.1% |
| Netherlands | 386 | 0.2% |
| Nicaragua | 60 | 0.0% |
| Nigeria | 328 | 0.2% |
| Northern Africa | 71 | 0.0% |
| Northern Europe | 231 | 0.1% |
| Oceania | 110 | 0.1% |
| Pakistan | 13 | 0.0% |
| Panama | 126 | 0.1% |
| Peru | 47 | 0.0% |
| Philippines | 239 | 0.1% |
| Poland | 95 | 0.1% |
| Romania | 30 | 0.0% |
| Russia | 158 | 0.1% |
| Scotland | 31 | 0.0% |
| Serbia | 21 | 0.0% |
| Somalia | 152 | 0.1% |
| South Africa | 25 | 0.0% |
| South America | 349 | 0.2% |
| South Central Asia | 1,028 | 0.5% |
| South Eastern Asia | 1,269 | 0.6% |
| Southern Europe | 126 | 0.1% |
| Spain | 13 | 0.0% |
| Sudan | 50 | 0.0% |
| Switzerland | 16 | 0.0% |
| Syria | 235 | 0.1% |
| Taiwan | 37 | 0.0% |
| Thailand | 16 | 0.0% |
| Ukraine | 31 | 0.0% |
| Venezuela | 24 | 0.0% |
| Vietnam | 430 | 0.2% |
| Western Africa | 636 | 0.3% |
| Western Asia | 677 | 0.3% |
| Western Europe | 772 | 0.4% |
| Zaire | 540 | 0.3% |
| Zimbabwe | 101 | 0.1% | View All 98 Rows |
Sex and Age in Grand Rapids
Sex and Age in Grand Rapids
The most populous age groups in Grand Rapids are 25 to 29 Years (10,881 | 11.2%) for men and 25 to 29 Years (11,323 | 11.2%) for women.
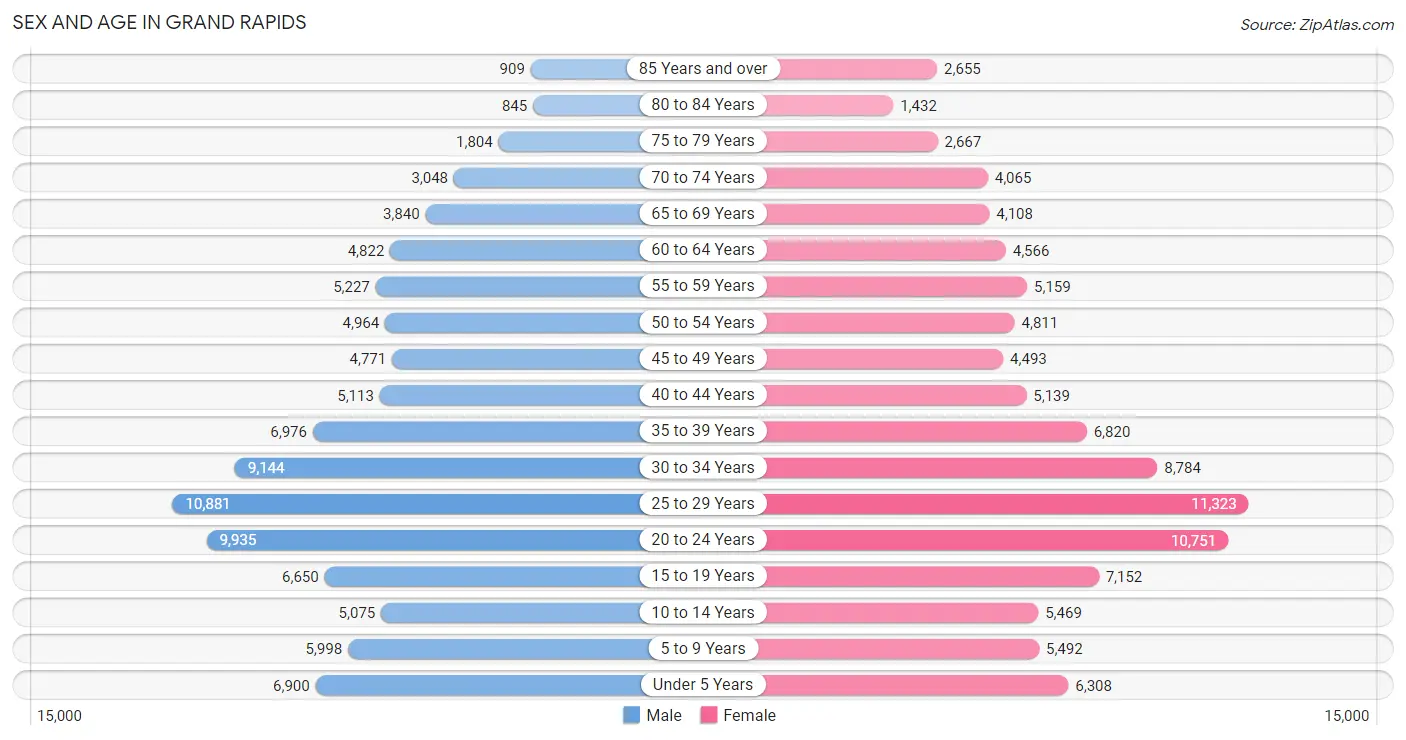
| Age Bracket | Male | Female |
| Under 5 Years | 6,900 (7.1%) | 6,308 (6.2%) |
| 5 to 9 Years | 5,998 (6.2%) | 5,492 (5.4%) |
| 10 to 14 Years | 5,075 (5.2%) | 5,469 (5.4%) |
| 15 to 19 Years | 6,650 (6.9%) | 7,152 (7.1%) |
| 20 to 24 Years | 9,935 (10.2%) | 10,751 (10.6%) |
| 25 to 29 Years | 10,881 (11.2%) | 11,323 (11.2%) |
| 30 to 34 Years | 9,144 (9.4%) | 8,784 (8.7%) |
| 35 to 39 Years | 6,976 (7.2%) | 6,820 (6.7%) |
| 40 to 44 Years | 5,113 (5.3%) | 5,139 (5.1%) |
| 45 to 49 Years | 4,771 (4.9%) | 4,493 (4.4%) |
| 50 to 54 Years | 4,964 (5.1%) | 4,811 (4.8%) |
| 55 to 59 Years | 5,227 (5.4%) | 5,159 (5.1%) |
| 60 to 64 Years | 4,822 (5.0%) | 4,566 (4.5%) |
| 65 to 69 Years | 3,840 (4.0%) | 4,108 (4.1%) |
| 70 to 74 Years | 3,048 (3.2%) | 4,065 (4.0%) |
| 75 to 79 Years | 1,804 (1.9%) | 2,667 (2.6%) |
| 80 to 84 Years | 845 (0.9%) | 1,432 (1.4%) |
| 85 Years and over | 909 (0.9%) | 2,655 (2.6%) |
| Total | 96,902 (100.0%) | 101,194 (100.0%) |
Families and Households in Grand Rapids
Median Family Size in Grand Rapids
The median family size in Grand Rapids is 3.13 persons per family, with single female/mother families (10,234 | 24.0%) accounting for the largest median family size of 3.37 persons per family. On the other hand, single male/father families (4,276 | 10.0%) represent the smallest median family size with 2.62 persons per family.
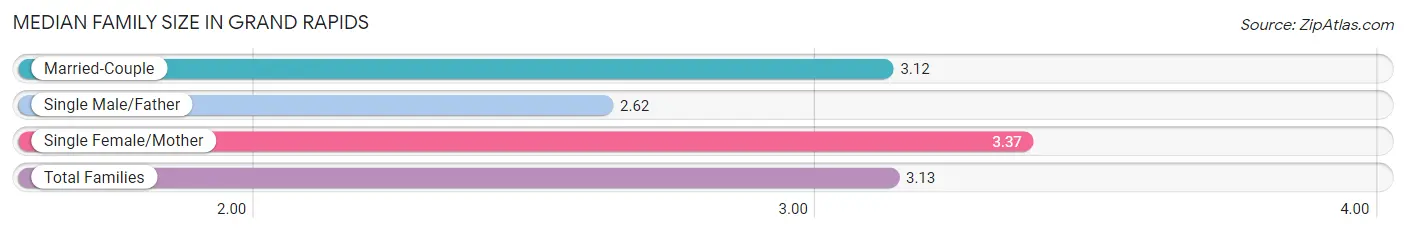
| Family Type | # Families | Family Size |
| Married-Couple | 28,119 (66.0%) | 3.12 |
| Single Male/Father | 4,276 (10.0%) | 2.62 |
| Single Female/Mother | 10,234 (24.0%) | 3.37 |
| Total Families | 42,629 (100.0%) | 3.13 |
Median Household Size in Grand Rapids
The median household size in Grand Rapids is 2.41 persons per household, with single female/mother households (10,234 | 13.0%) accounting for the largest median household size of 3.67 persons per household. non-family households (36,380 | 46.1%) represent the smallest median household size with 1.40 persons per household.
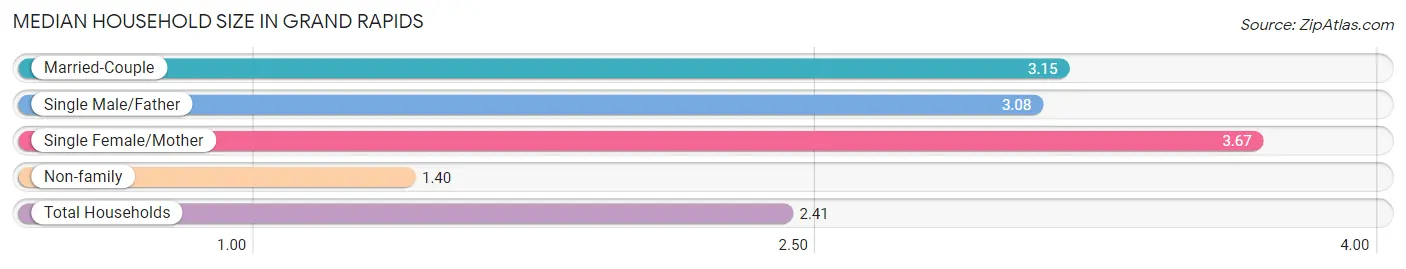
| Household Type | # Households | Household Size |
| Married-Couple | 28,119 (35.6%) | 3.15 |
| Single Male/Father | 4,276 (5.4%) | 3.08 |
| Single Female/Mother | 10,234 (13.0%) | 3.67 |
| Non-family | 36,380 (46.1%) | 1.40 |
| Total Households | 79,009 (100.0%) | 2.41 |
Household Size by Marriage Status in Grand Rapids
Out of a total of 79,009 households in Grand Rapids, 42,629 (53.9%) are family households, while 36,380 (46.1%) are nonfamily households. The most numerous type of family households are 2-person households, comprising 18,007, and the most common type of nonfamily households are 1-person households, comprising 26,582.
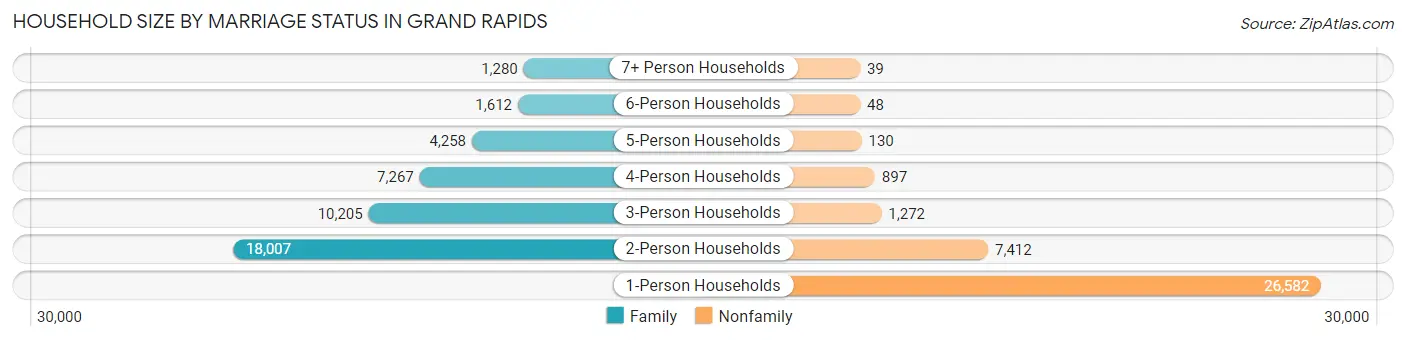
| Household Size | Family Households | Nonfamily Households |
| 1-Person Households | - | 26,582 (33.6%) |
| 2-Person Households | 18,007 (22.8%) | 7,412 (9.4%) |
| 3-Person Households | 10,205 (12.9%) | 1,272 (1.6%) |
| 4-Person Households | 7,267 (9.2%) | 897 (1.1%) |
| 5-Person Households | 4,258 (5.4%) | 130 (0.2%) |
| 6-Person Households | 1,612 (2.0%) | 48 (0.1%) |
| 7+ Person Households | 1,280 (1.6%) | 39 (0.1%) |
| Total | 42,629 (53.9%) | 36,380 (46.1%) |
Female Fertility in Grand Rapids
Fertility by Age in Grand Rapids
Average fertility rate in Grand Rapids is 54.0 births per 1,000 women. Women in the age bracket of 20 to 34 years have the highest fertility rate with 73.0 births per 1,000 women. Women in the age bracket of 20 to 34 years acount for 75.8% of all women with births.
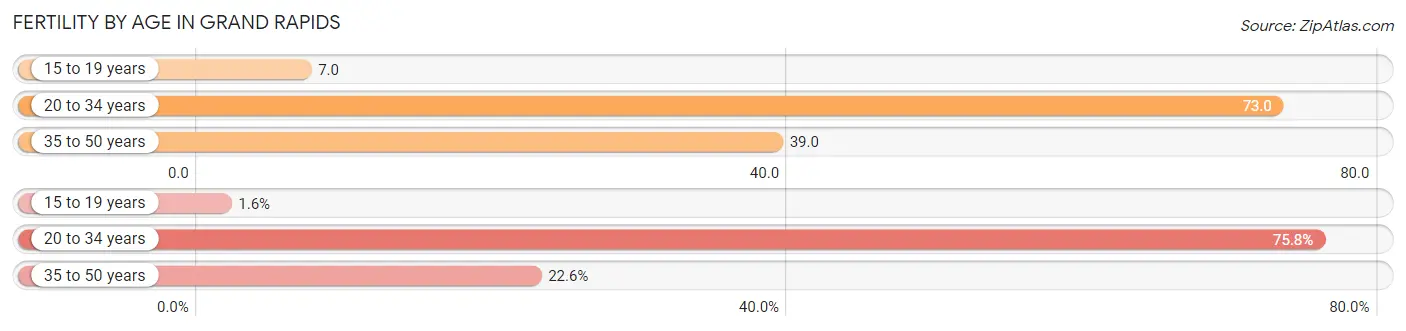
| Age Bracket | Women with Births | Births / 1,000 Women |
| 15 to 19 years | 47 (1.6%) | 7.0 |
| 20 to 34 years | 2,257 (75.8%) | 73.0 |
| 35 to 50 years | 673 (22.6%) | 39.0 |
| Total | 2,977 (100.0%) | 54.0 |
Fertility by Age by Marriage Status in Grand Rapids
61.2% of women with births (2,977) in Grand Rapids are married. The highest percentage of unmarried women with births falls into 15 to 19 years age bracket with 100.0% of them unmarried at the time of birth, while the lowest percentage of unmarried women with births belong to 35 to 50 years age bracket with 15.3% of them unmarried.
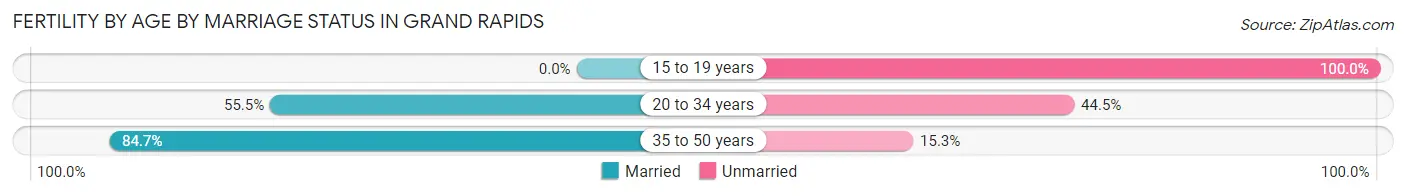
| Age Bracket | Married | Unmarried |
| 15 to 19 years | 0 (0.0%) | 47 (100.0%) |
| 20 to 34 years | 1,253 (55.5%) | 1,004 (44.5%) |
| 35 to 50 years | 570 (84.7%) | 103 (15.3%) |
| Total | 1,822 (61.2%) | 1,155 (38.8%) |
Fertility by Education in Grand Rapids
Average fertility rate in Grand Rapids is 54.0 births per 1,000 women. Women with the education attainment of graduate degree have the highest fertility rate of 71.0 births per 1,000 women, while women with the education attainment of less than high school have the lowest fertility at 38.0 births per 1,000 women. Women with the education attainment of bachelor's degree represent 31.7% of all women with births.
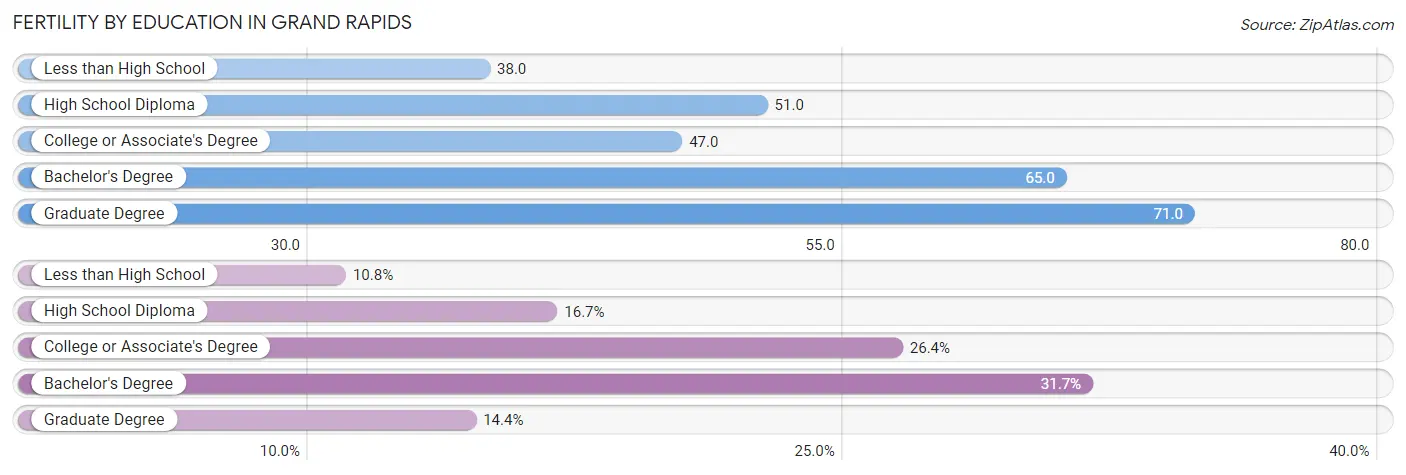
| Educational Attainment | Women with Births | Births / 1,000 Women |
| Less than High School | 320 (10.7%) | 38.0 |
| High School Diploma | 497 (16.7%) | 51.0 |
| College or Associate's Degree | 786 (26.4%) | 47.0 |
| Bachelor's Degree | 945 (31.7%) | 65.0 |
| Graduate Degree | 429 (14.4%) | 71.0 |
| Total | 2,977 (100.0%) | 54.0 |
Fertility by Education by Marriage Status in Grand Rapids
38.8% of women with births in Grand Rapids are unmarried. Women with the educational attainment of bachelor's degree are most likely to be married with 95.8% of them married at childbirth, while women with the educational attainment of less than high school are least likely to be married with 80.0% of them unmarried at childbirth.
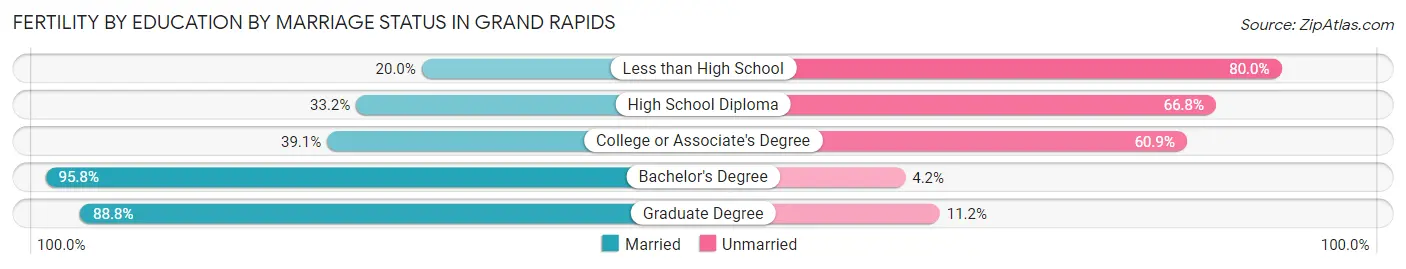
| Educational Attainment | Married | Unmarried |
| Less than High School | 64 (20.0%) | 256 (80.0%) |
| High School Diploma | 165 (33.2%) | 332 (66.8%) |
| College or Associate's Degree | 307 (39.1%) | 479 (60.9%) |
| Bachelor's Degree | 905 (95.8%) | 40 (4.2%) |
| Graduate Degree | 381 (88.8%) | 48 (11.2%) |
| Total | 1,822 (61.2%) | 1,155 (38.8%) |
Employment Characteristics in Grand Rapids
Employment by Class of Employer in Grand Rapids
Among the 101,943 employed individuals in Grand Rapids, private company employees (71,320 | 70.0%), not-for-profit organizations (16,677 | 16.4%), and self-employed (not incorporated) (4,485 | 4.4%) make up the most common classes of employment.
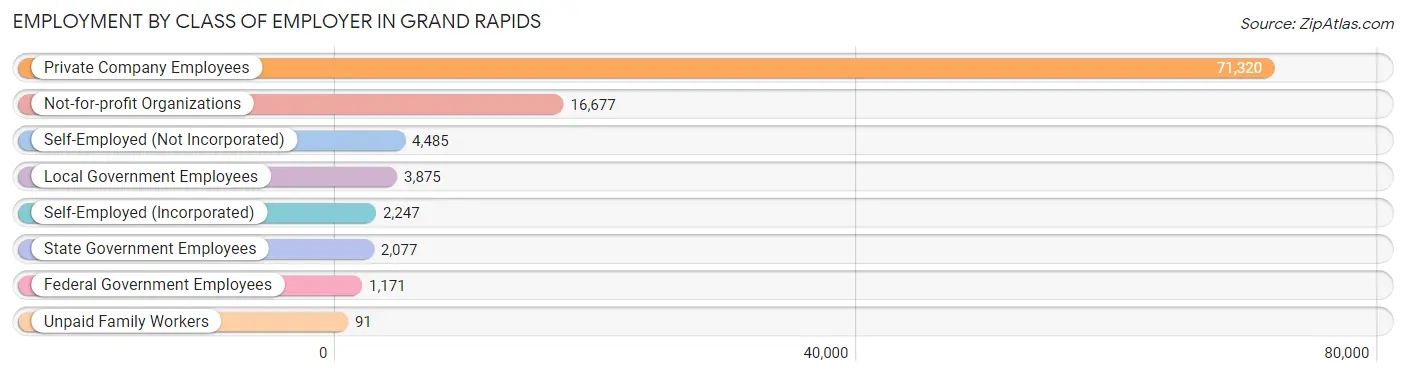
| Employer Class | # Employees | % Employees |
| Private Company Employees | 71,320 | 70.0% |
| Self-Employed (Incorporated) | 2,247 | 2.2% |
| Self-Employed (Not Incorporated) | 4,485 | 4.4% |
| Not-for-profit Organizations | 16,677 | 16.4% |
| Local Government Employees | 3,875 | 3.8% |
| State Government Employees | 2,077 | 2.0% |
| Federal Government Employees | 1,171 | 1.1% |
| Unpaid Family Workers | 91 | 0.1% |
| Total | 101,943 | 100.0% |
Employment Status by Age in Grand Rapids
According to the labor force statistics for Grand Rapids, out of the total population over 16 years of age (160,066), 68.7% or 109,965 individuals are in the labor force, with 5.6% or 6,158 of them unemployed. The age group with the highest labor force participation rate is 25 to 29 years, with 88.1% or 19,562 individuals in the labor force. Within the labor force, the 16 to 19 years age range has the highest percentage of unemployed individuals, with 13.5% or 746 of them being unemployed.
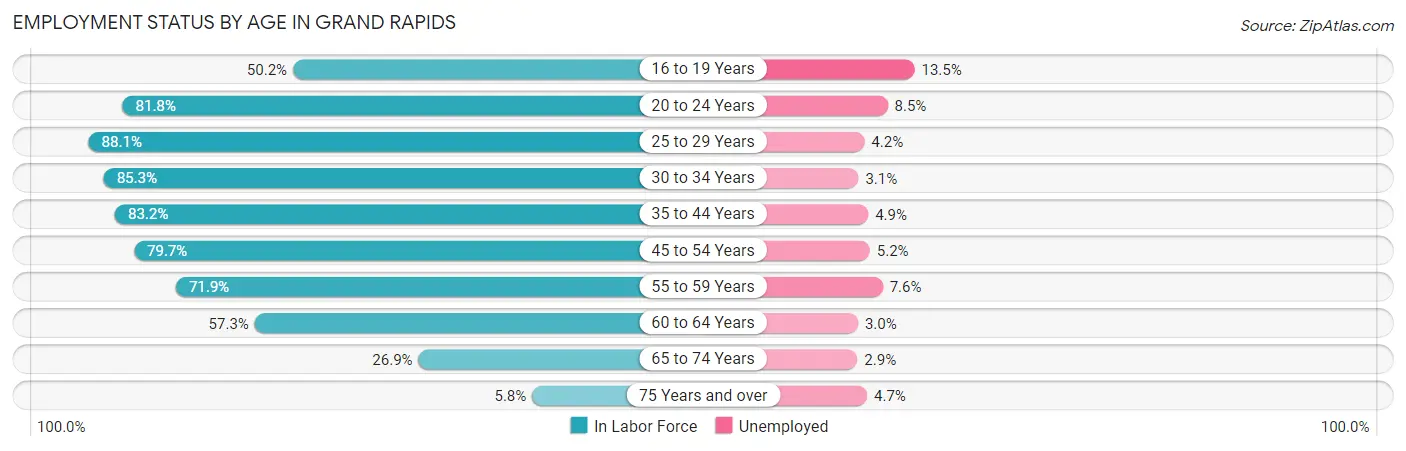
| Age Bracket | In Labor Force | Unemployed |
| 16 to 19 Years | 5,529 (50.2%) | 746 (13.5%) |
| 20 to 24 Years | 16,921 (81.8%) | 1,438 (8.5%) |
| 25 to 29 Years | 19,562 (88.1%) | 822 (4.2%) |
| 30 to 34 Years | 15,293 (85.3%) | 474 (3.1%) |
| 35 to 44 Years | 20,008 (83.2%) | 980 (4.9%) |
| 45 to 54 Years | 15,174 (79.7%) | 789 (5.2%) |
| 55 to 59 Years | 7,468 (71.9%) | 568 (7.6%) |
| 60 to 64 Years | 5,379 (57.3%) | 161 (3.0%) |
| 65 to 74 Years | 4,051 (26.9%) | 117 (2.9%) |
| 75 Years and over | 598 (5.8%) | 28 (4.7%) |
| Total | 109,965 (68.7%) | 6,158 (5.6%) |
Employment Status by Educational Attainment in Grand Rapids
According to labor force statistics for Grand Rapids, 80.5% of individuals (82,909) out of the total population between 25 and 64 years of age (102,993) are in the labor force, with 4.6% or 3,814 of them being unemployed. The group with the highest labor force participation rate are those with the educational attainment of bachelor's degree or higher, with 91.1% or 38,407 individuals in the labor force. Within the labor force, individuals with less than high school education have the highest percentage of unemployment, with 9.9% or 681 of them being unemployed.
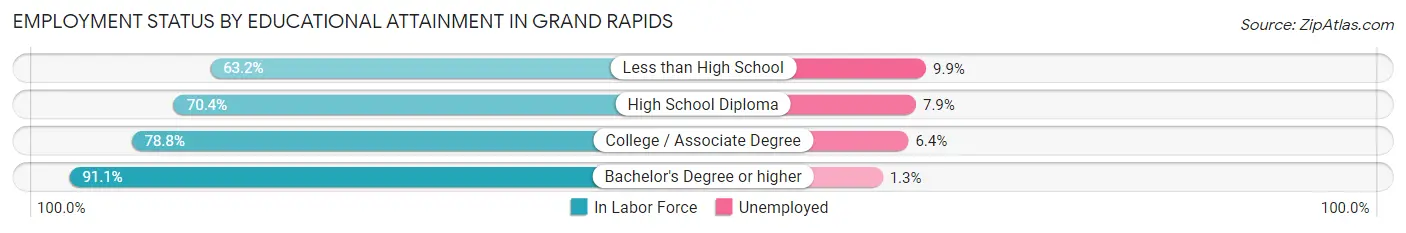
| Educational Attainment | In Labor Force | Unemployed |
| Less than High School | 6,879 (63.2%) | 1,078 (9.9%) |
| High School Diploma | 14,863 (70.4%) | 1,668 (7.9%) |
| College / Associate Degree | 22,724 (78.8%) | 1,846 (6.4%) |
| Bachelor's Degree or higher | 38,407 (91.1%) | 548 (1.3%) |
| Total | 82,909 (80.5%) | 4,738 (4.6%) |
Employment Occupations by Sex in Grand Rapids
Management, Business, Science and Arts Occupations
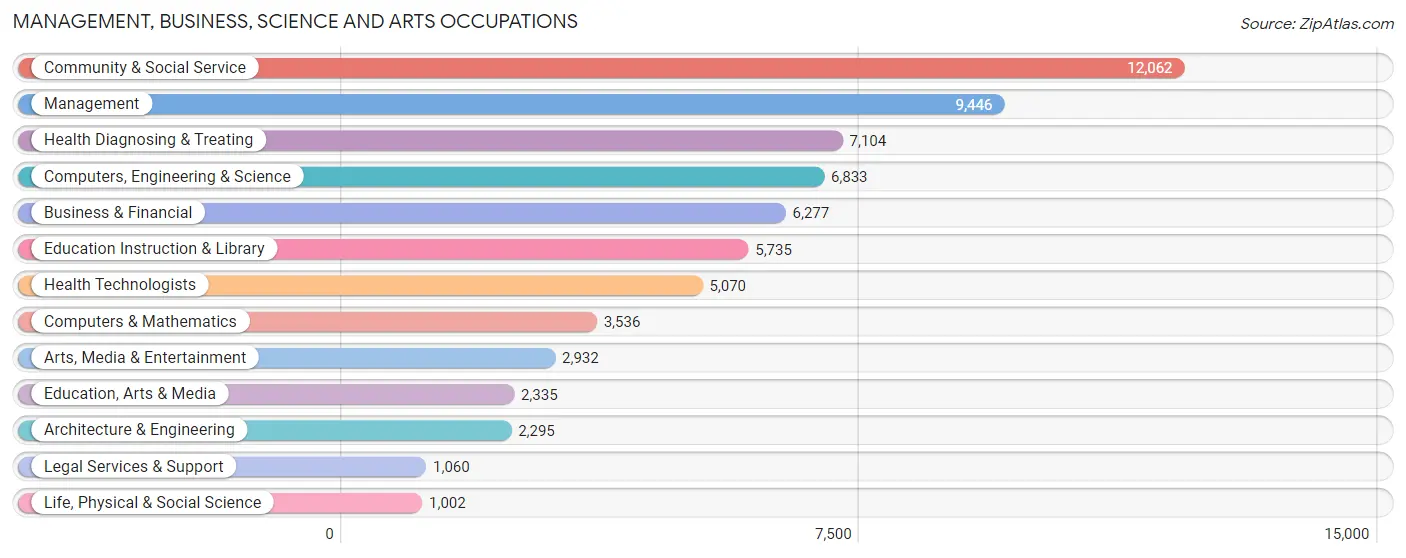
The most common Management, Business, Science and Arts occupations in Grand Rapids are Community & Social Service (12,062 | 11.6%), Management (9,446 | 9.1%), Health Diagnosing & Treating (7,104 | 6.9%), Computers, Engineering & Science (6,833 | 6.6%), and Business & Financial (6,277 | 6.0%).
Management, Business, Science and Arts Occupations by Sex
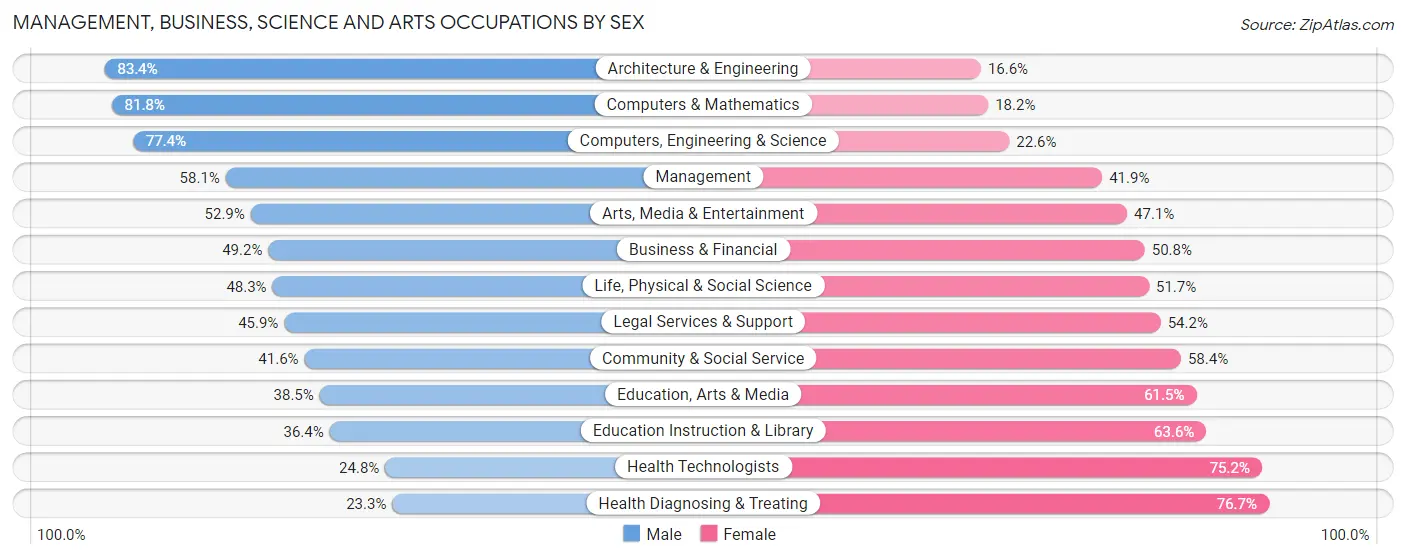
Within the Management, Business, Science and Arts occupations in Grand Rapids, the most male-oriented occupations are Architecture & Engineering (83.4%), Computers & Mathematics (81.8%), and Computers, Engineering & Science (77.4%), while the most female-oriented occupations are Health Diagnosing & Treating (76.7%), Health Technologists (75.2%), and Education Instruction & Library (63.6%).
| Occupation | Male | Female |
| Management | 5,484 (58.1%) | 3,962 (41.9%) |
| Business & Financial | 3,087 (49.2%) | 3,190 (50.8%) |
| Computers, Engineering & Science | 5,291 (77.4%) | 1,542 (22.6%) |
| Computers & Mathematics | 2,894 (81.8%) | 642 (18.2%) |
| Architecture & Engineering | 1,913 (83.4%) | 382 (16.6%) |
| Life, Physical & Social Science | 484 (48.3%) | 518 (51.7%) |
| Community & Social Service | 5,021 (41.6%) | 7,041 (58.4%) |
| Education, Arts & Media | 898 (38.5%) | 1,437 (61.5%) |
| Legal Services & Support | 486 (45.9%) | 574 (54.1%) |
| Education Instruction & Library | 2,087 (36.4%) | 3,648 (63.6%) |
| Arts, Media & Entertainment | 1,550 (52.9%) | 1,382 (47.1%) |
| Health Diagnosing & Treating | 1,656 (23.3%) | 5,448 (76.7%) |
| Health Technologists | 1,257 (24.8%) | 3,813 (75.2%) |
| Total (Category) | 20,539 (49.2%) | 21,183 (50.8%) |
| Total (Overall) | 53,312 (51.4%) | 50,466 (48.6%) |
Services Occupations
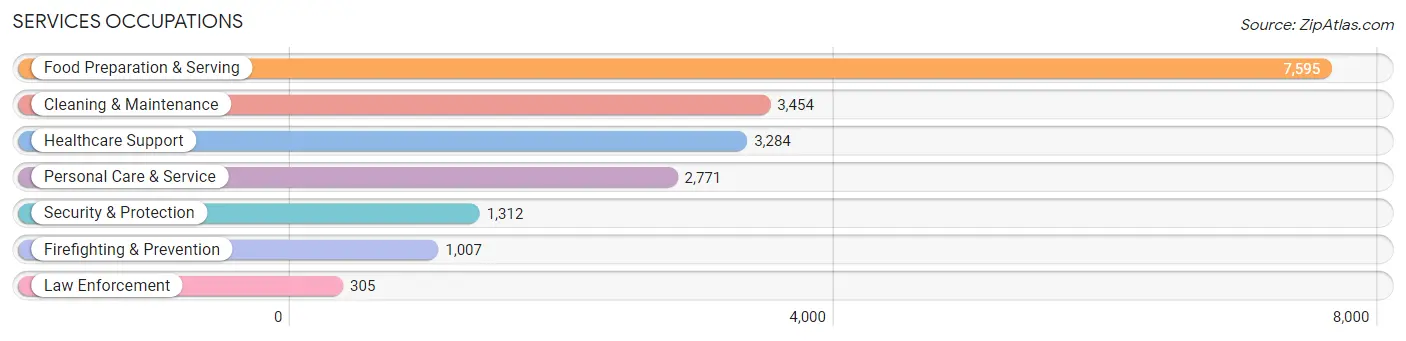
The most common Services occupations in Grand Rapids are Food Preparation & Serving (7,595 | 7.3%), Cleaning & Maintenance (3,454 | 3.3%), Healthcare Support (3,284 | 3.2%), Personal Care & Service (2,771 | 2.7%), and Security & Protection (1,312 | 1.3%).
Services Occupations by Sex
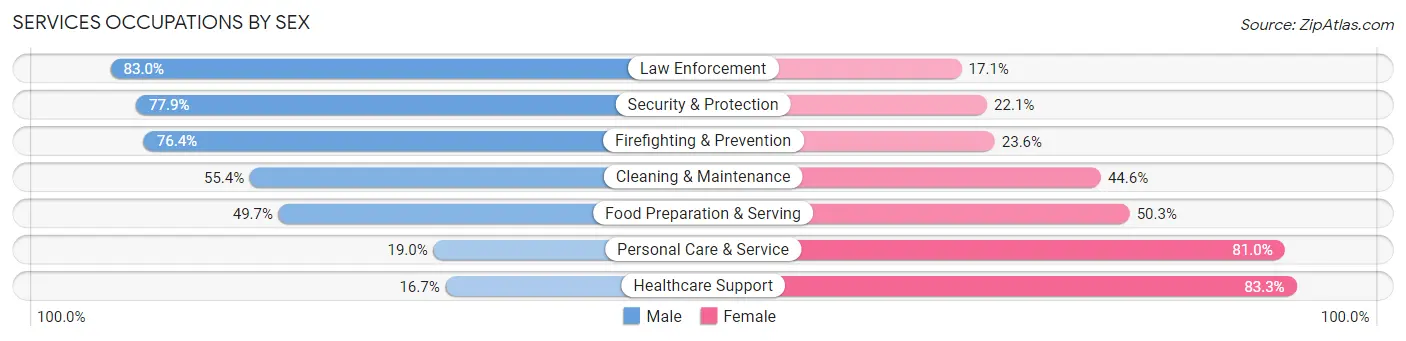
Within the Services occupations in Grand Rapids, the most male-oriented occupations are Law Enforcement (83.0%), Security & Protection (77.9%), and Firefighting & Prevention (76.4%), while the most female-oriented occupations are Healthcare Support (83.3%), Personal Care & Service (81.0%), and Food Preparation & Serving (50.3%).
| Occupation | Male | Female |
| Healthcare Support | 547 (16.7%) | 2,737 (83.3%) |
| Security & Protection | 1,022 (77.9%) | 290 (22.1%) |
| Firefighting & Prevention | 769 (76.4%) | 238 (23.6%) |
| Law Enforcement | 253 (83.0%) | 52 (17.1%) |
| Food Preparation & Serving | 3,772 (49.7%) | 3,823 (50.3%) |
| Cleaning & Maintenance | 1,912 (55.4%) | 1,542 (44.6%) |
| Personal Care & Service | 527 (19.0%) | 2,244 (81.0%) |
| Total (Category) | 7,780 (42.2%) | 10,636 (57.8%) |
| Total (Overall) | 53,312 (51.4%) | 50,466 (48.6%) |
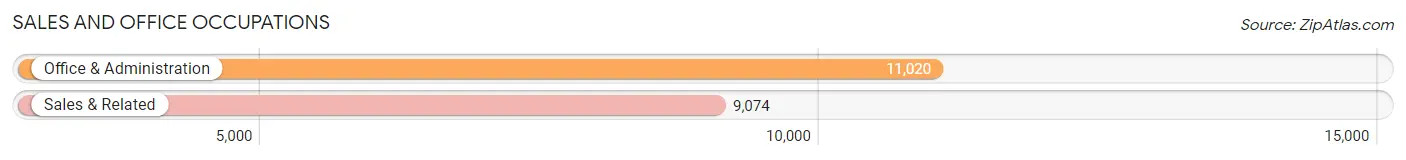
Sales and Office Occupations
The most common Sales and Office occupations in Grand Rapids are Office & Administration (11,020 | 10.6%), and Sales & Related (9,074 | 8.7%).
Sales and Office Occupations by Sex
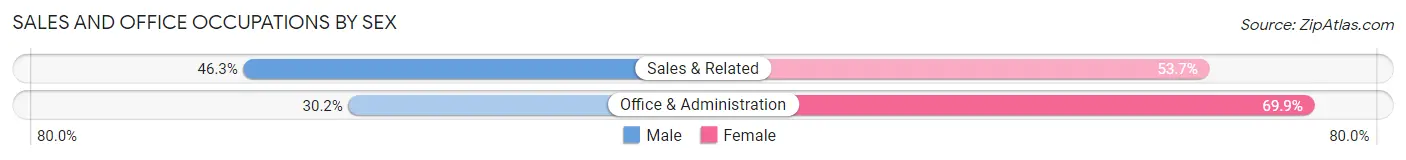
| Occupation | Male | Female |
| Sales & Related | 4,202 (46.3%) | 4,872 (53.7%) |
| Office & Administration | 3,323 (30.1%) | 7,697 (69.9%) |
| Total (Category) | 7,525 (37.4%) | 12,569 (62.5%) |
| Total (Overall) | 53,312 (51.4%) | 50,466 (48.6%) |
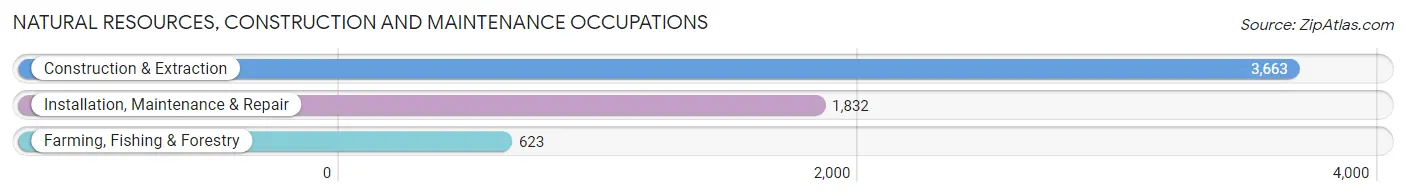
Natural Resources, Construction and Maintenance Occupations
The most common Natural Resources, Construction and Maintenance occupations in Grand Rapids are Construction & Extraction (3,663 | 3.5%), Installation, Maintenance & Repair (1,832 | 1.8%), and Farming, Fishing & Forestry (623 | 0.6%).
Natural Resources, Construction and Maintenance Occupations by Sex
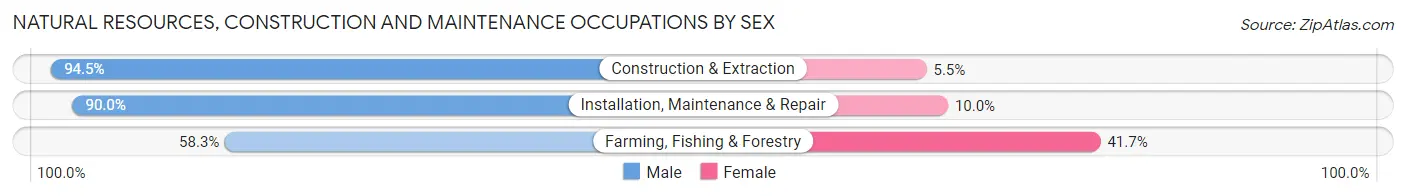
| Occupation | Male | Female |
| Farming, Fishing & Forestry | 363 (58.3%) | 260 (41.7%) |
| Construction & Extraction | 3,460 (94.5%) | 203 (5.5%) |
| Installation, Maintenance & Repair | 1,649 (90.0%) | 183 (10.0%) |
| Total (Category) | 5,472 (89.4%) | 646 (10.6%) |
| Total (Overall) | 53,312 (51.4%) | 50,466 (48.6%) |
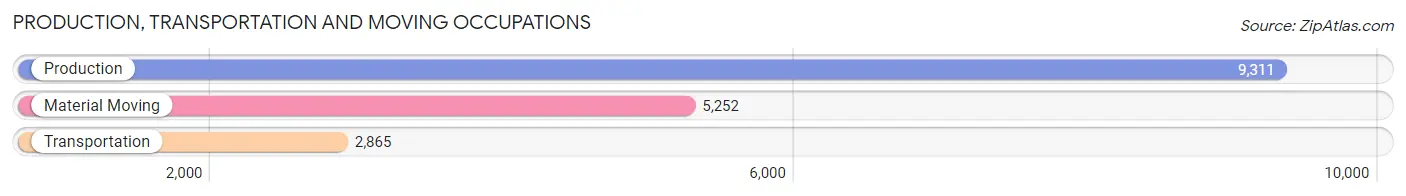
Production, Transportation and Moving Occupations
The most common Production, Transportation and Moving occupations in Grand Rapids are Production (9,311 | 9.0%), Material Moving (5,252 | 5.1%), and Transportation (2,865 | 2.8%).
Production, Transportation and Moving Occupations by Sex
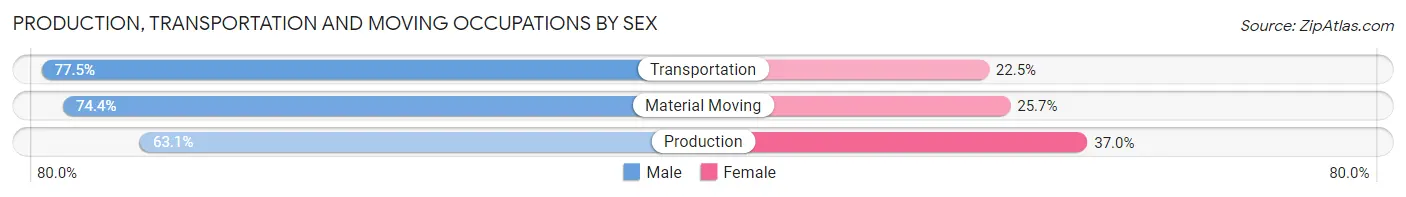
| Occupation | Male | Female |
| Production | 5,871 (63.0%) | 3,440 (36.9%) |
| Transportation | 2,220 (77.5%) | 645 (22.5%) |
| Material Moving | 3,905 (74.4%) | 1,347 (25.7%) |
| Total (Category) | 11,996 (68.8%) | 5,432 (31.2%) |
| Total (Overall) | 53,312 (51.4%) | 50,466 (48.6%) |
Employment Industries by Sex in Grand Rapids
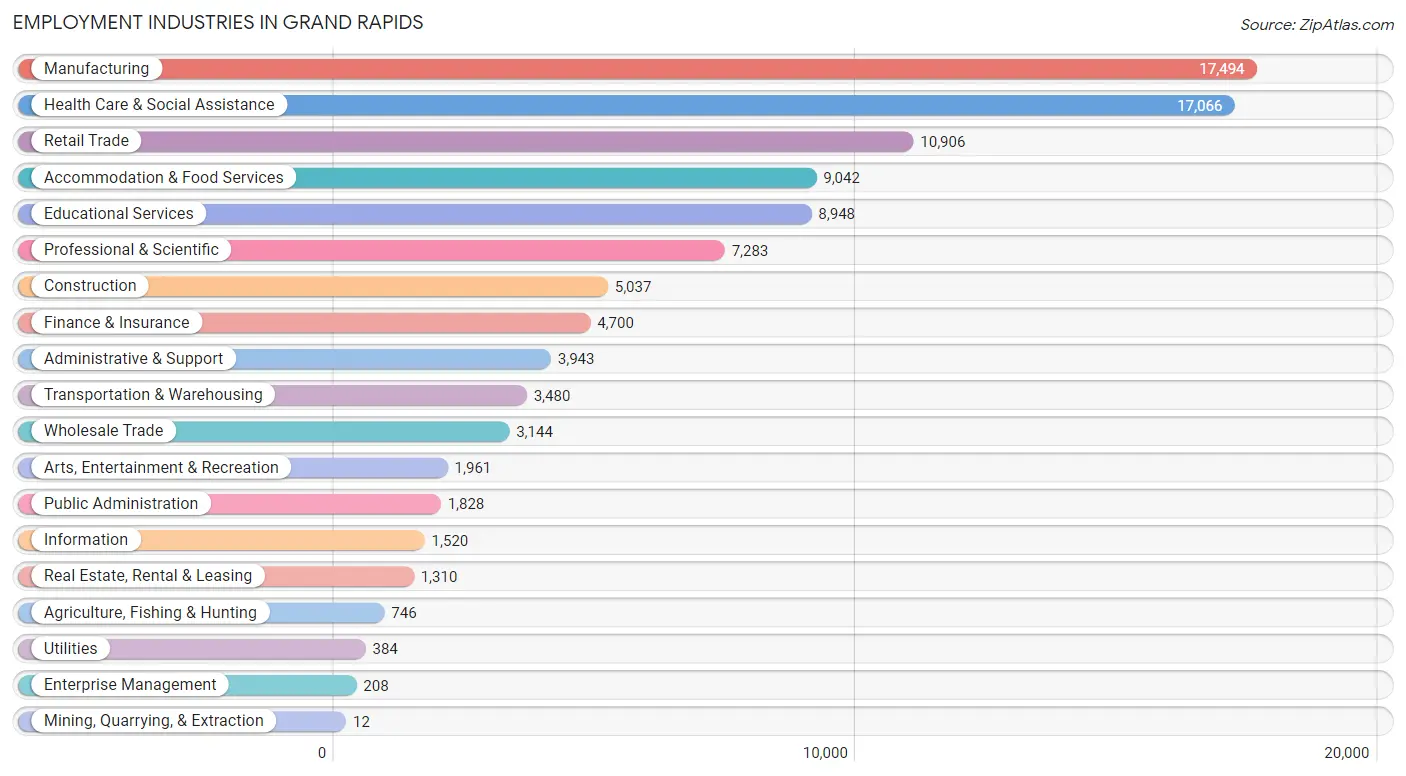
Employment Industries in Grand Rapids
The major employment industries in Grand Rapids include Manufacturing (17,494 | 16.9%), Health Care & Social Assistance (17,066 | 16.4%), Retail Trade (10,906 | 10.5%), Accommodation & Food Services (9,042 | 8.7%), and Educational Services (8,948 | 8.6%).
Employment Industries by Sex in Grand Rapids
The Grand Rapids industries that see more men than women are Construction (87.9%), Wholesale Trade (72.9%), and Transportation & Warehousing (72.1%), whereas the industries that tend to have a higher number of women are Mining, Quarrying, & Extraction (100.0%), Health Care & Social Assistance (75.0%), and Educational Services (64.6%).
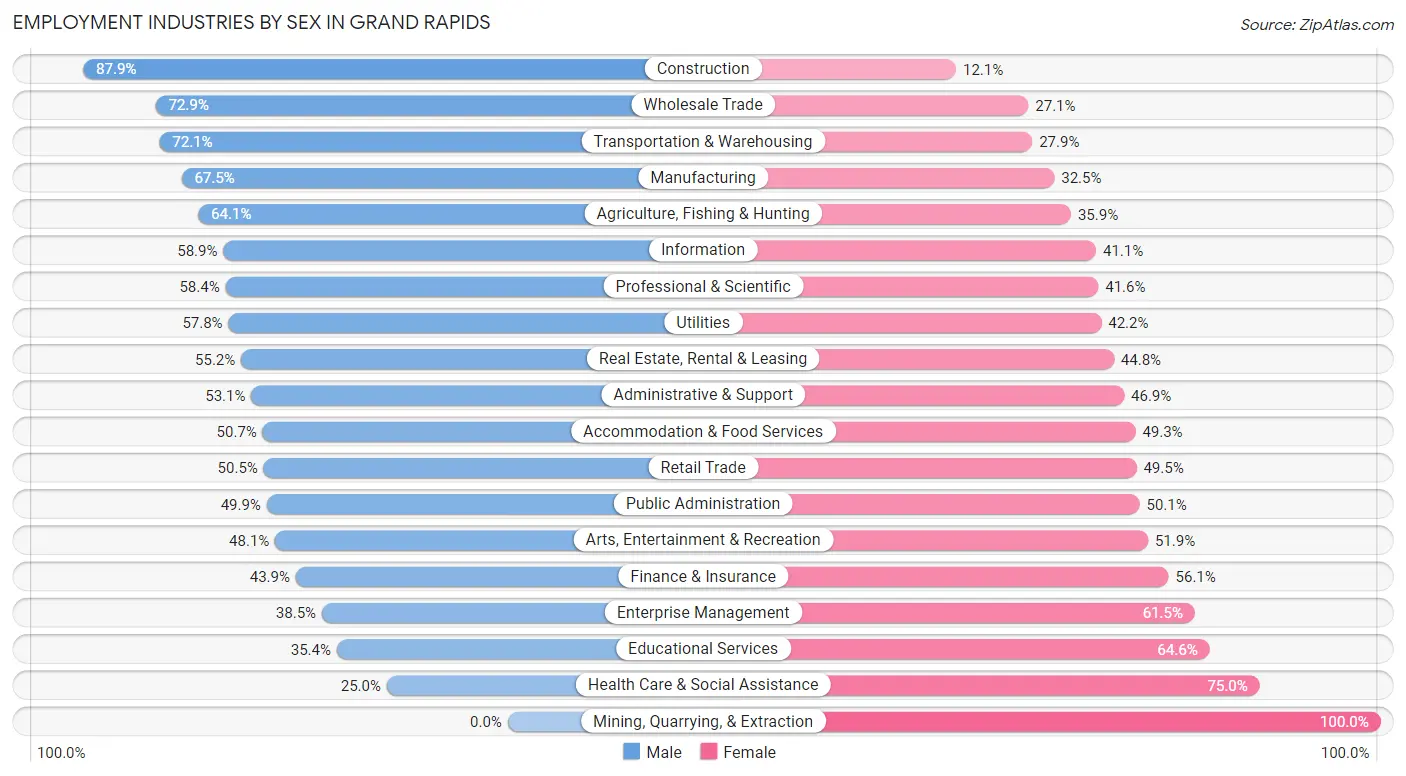
| Industry | Male | Female |
| Agriculture, Fishing & Hunting | 478 (64.1%) | 268 (35.9%) |
| Mining, Quarrying, & Extraction | 0 (0.0%) | 12 (100.0%) |
| Construction | 4,426 (87.9%) | 611 (12.1%) |
| Manufacturing | 11,813 (67.5%) | 5,681 (32.5%) |
| Wholesale Trade | 2,292 (72.9%) | 852 (27.1%) |
| Retail Trade | 5,510 (50.5%) | 5,396 (49.5%) |
| Transportation & Warehousing | 2,509 (72.1%) | 971 (27.9%) |
| Utilities | 222 (57.8%) | 162 (42.2%) |
| Information | 895 (58.9%) | 625 (41.1%) |
| Finance & Insurance | 2,062 (43.9%) | 2,638 (56.1%) |
| Real Estate, Rental & Leasing | 723 (55.2%) | 587 (44.8%) |
| Professional & Scientific | 4,255 (58.4%) | 3,028 (41.6%) |
| Enterprise Management | 80 (38.5%) | 128 (61.5%) |
| Administrative & Support | 2,093 (53.1%) | 1,850 (46.9%) |
| Educational Services | 3,166 (35.4%) | 5,782 (64.6%) |
| Health Care & Social Assistance | 4,274 (25.0%) | 12,792 (75.0%) |
| Arts, Entertainment & Recreation | 944 (48.1%) | 1,017 (51.9%) |
| Accommodation & Food Services | 4,587 (50.7%) | 4,455 (49.3%) |
| Public Administration | 912 (49.9%) | 916 (50.1%) |
| Total | 53,312 (51.4%) | 50,466 (48.6%) |
Education in Grand Rapids
School Enrollment in Grand Rapids
The most common levels of schooling among the 49,275 students in Grand Rapids are college / undergraduate (13,092 | 26.6%), high school (9,442 | 19.2%), and elementary school (9,238 | 18.8%).
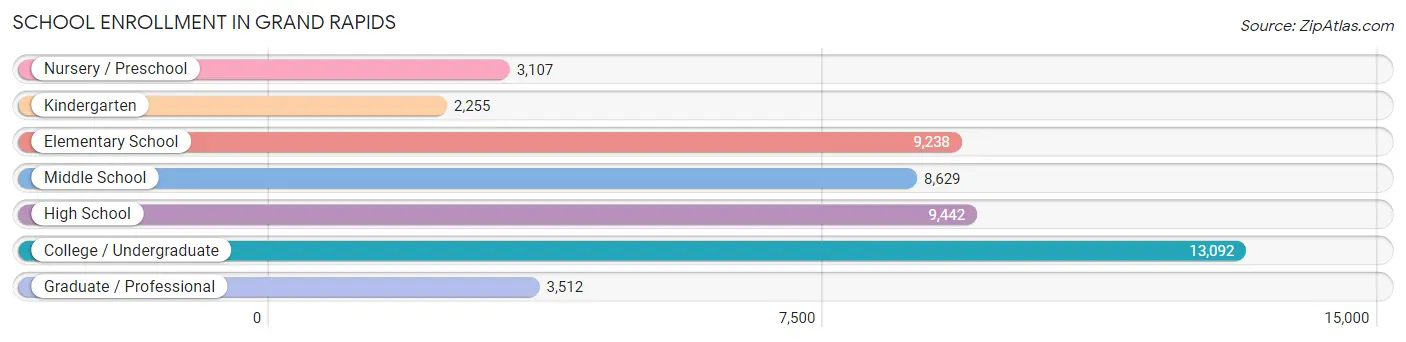
| School Level | # Students | % Students |
| Nursery / Preschool | 3,107 | 6.3% |
| Kindergarten | 2,255 | 4.6% |
| Elementary School | 9,238 | 18.8% |
| Middle School | 8,629 | 17.5% |
| High School | 9,442 | 19.2% |
| College / Undergraduate | 13,092 | 26.6% |
| Graduate / Professional | 3,512 | 7.1% |
| Total | 49,275 | 100.0% |
School Enrollment by Age by Funding Source in Grand Rapids
Out of a total of 49,275 students who are enrolled in schools in Grand Rapids, 13,058 (26.5%) attend a private institution, while the remaining 36,217 (73.5%) are enrolled in public schools. The age group of 18 to 19 year olds has the highest likelihood of being enrolled in private schools, with 1,940 (44.6% in the age bracket) enrolled. Conversely, the age group of 10 to 14 year olds has the lowest likelihood of being enrolled in a private school, with 8,607 (82.0% in the age bracket) attending a public institution.
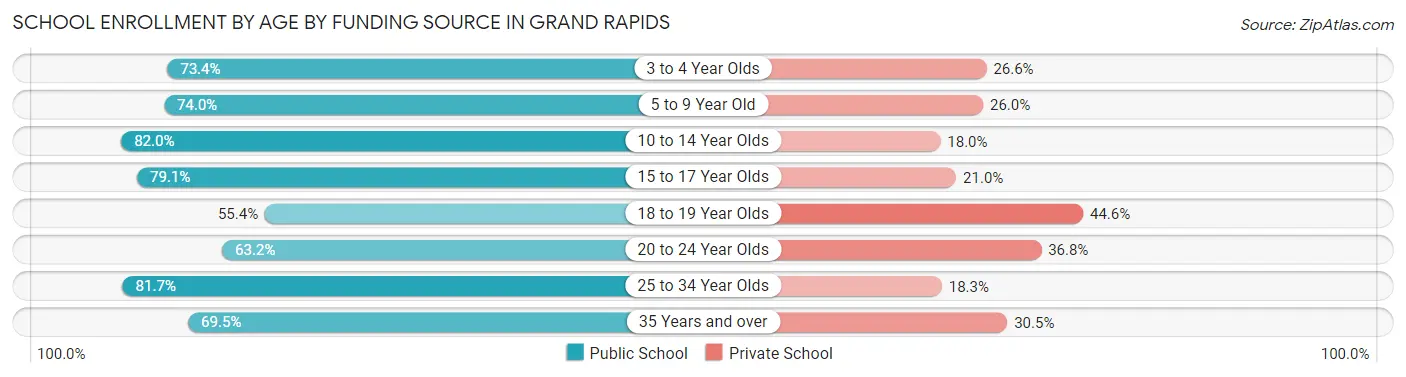
| Age Bracket | Public School | Private School |
| 3 to 4 Year Olds | 1,899 (73.4%) | 688 (26.6%) |
| 5 to 9 Year Old | 8,132 (74.0%) | 2,851 (26.0%) |
| 10 to 14 Year Olds | 8,607 (82.0%) | 1,890 (18.0%) |
| 15 to 17 Year Olds | 5,617 (79.0%) | 1,489 (20.9%) |
| 18 to 19 Year Olds | 2,411 (55.4%) | 1,940 (44.6%) |
| 20 to 24 Year Olds | 4,953 (63.2%) | 2,883 (36.8%) |
| 25 to 34 Year Olds | 3,359 (81.7%) | 751 (18.3%) |
| 35 Years and over | 1,255 (69.5%) | 550 (30.5%) |
| Total | 36,217 (73.5%) | 13,058 (26.5%) |
Educational Attainment by Field of Study in Grand Rapids
Business (10,988 | 19.5%), education (6,070 | 10.8%), science & technology (5,618 | 10.0%), arts & humanities (4,121 | 7.3%), and social sciences (3,989 | 7.1%) are the most common fields of study among 56,369 individuals in Grand Rapids who have obtained a bachelor's degree or higher.
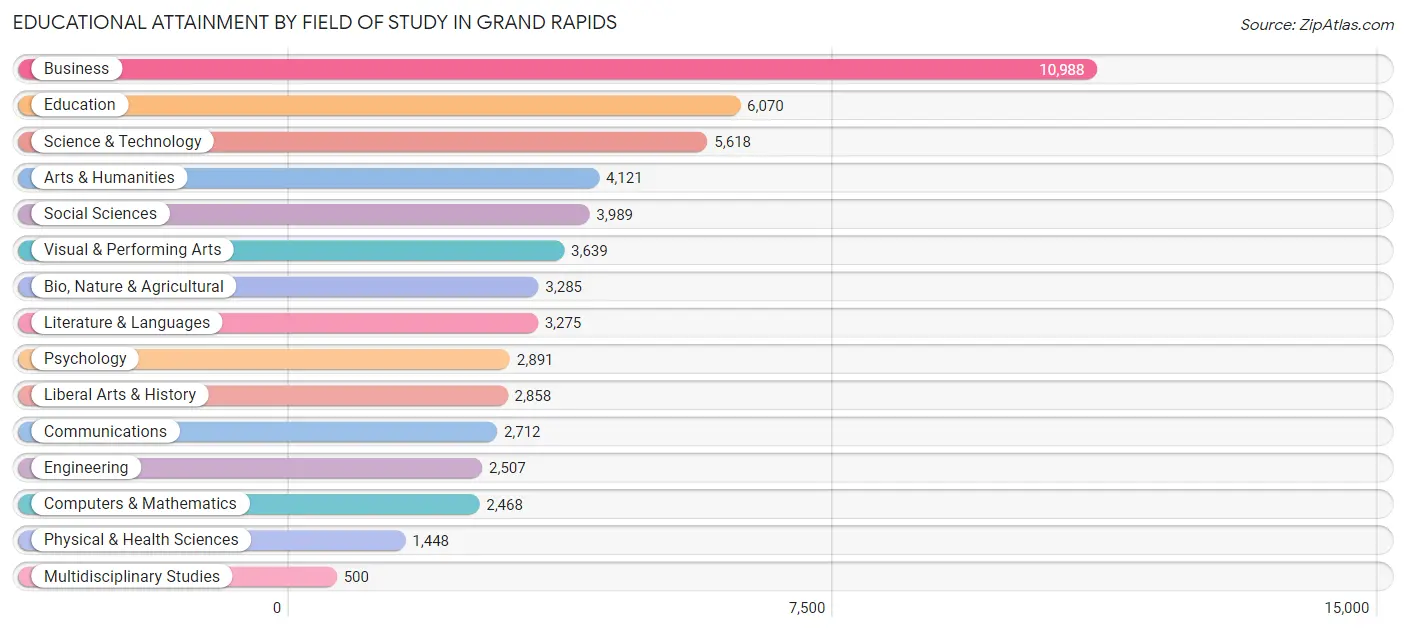
| Field of Study | # Graduates | % Graduates |
| Computers & Mathematics | 2,468 | 4.4% |
| Bio, Nature & Agricultural | 3,285 | 5.8% |
| Physical & Health Sciences | 1,448 | 2.6% |
| Psychology | 2,891 | 5.1% |
| Social Sciences | 3,989 | 7.1% |
| Engineering | 2,507 | 4.4% |
| Multidisciplinary Studies | 500 | 0.9% |
| Science & Technology | 5,618 | 10.0% |
| Business | 10,988 | 19.5% |
| Education | 6,070 | 10.8% |
| Literature & Languages | 3,275 | 5.8% |
| Liberal Arts & History | 2,858 | 5.1% |
| Visual & Performing Arts | 3,639 | 6.5% |
| Communications | 2,712 | 4.8% |
| Arts & Humanities | 4,121 | 7.3% |
| Total | 56,369 | 100.0% |
Transportation & Commute in Grand Rapids
Vehicle Availability by Sex in Grand Rapids
The most prevalent vehicle ownership categories in Grand Rapids are males with 2 vehicles (22,579, accounting for 43.5%) and females with 2 vehicles (19,727, making up 46.7%).
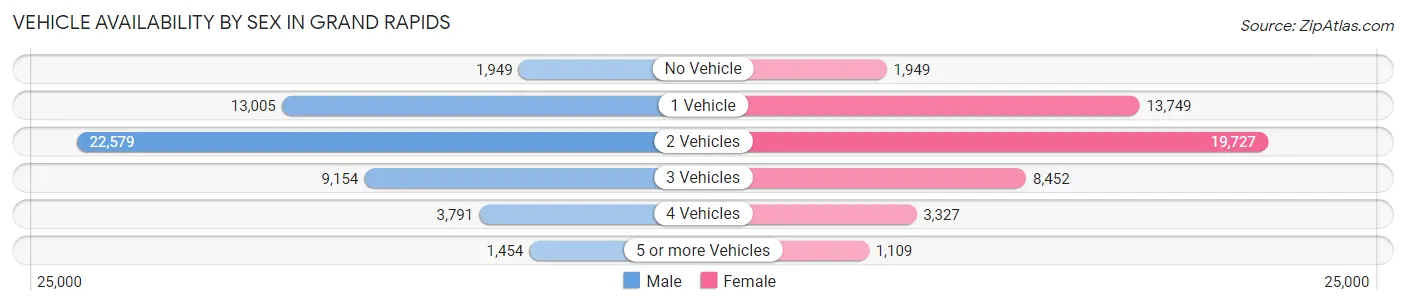
| Vehicles Available | Male | Female |
| No Vehicle | 1,949 (3.7%) | 1,949 (4.0%) |
| 1 Vehicle | 13,005 (25.0%) | 13,749 (28.5%) |
| 2 Vehicles | 22,579 (43.5%) | 19,727 (40.8%) |
| 3 Vehicles | 9,154 (17.6%) | 8,452 (17.5%) |
| 4 Vehicles | 3,791 (7.3%) | 3,327 (6.9%) |
| 5 or more Vehicles | 1,454 (2.8%) | 1,109 (2.3%) |
| Total | 51,932 (100.0%) | 48,313 (100.0%) |
Commute Time in Grand Rapids
The most frequently occuring commute durations in Grand Rapids are 15 to 19 minutes (22,496 commuters, 24.7%), 10 to 14 minutes (18,032 commuters, 19.8%), and 20 to 24 minutes (15,468 commuters, 17.0%).
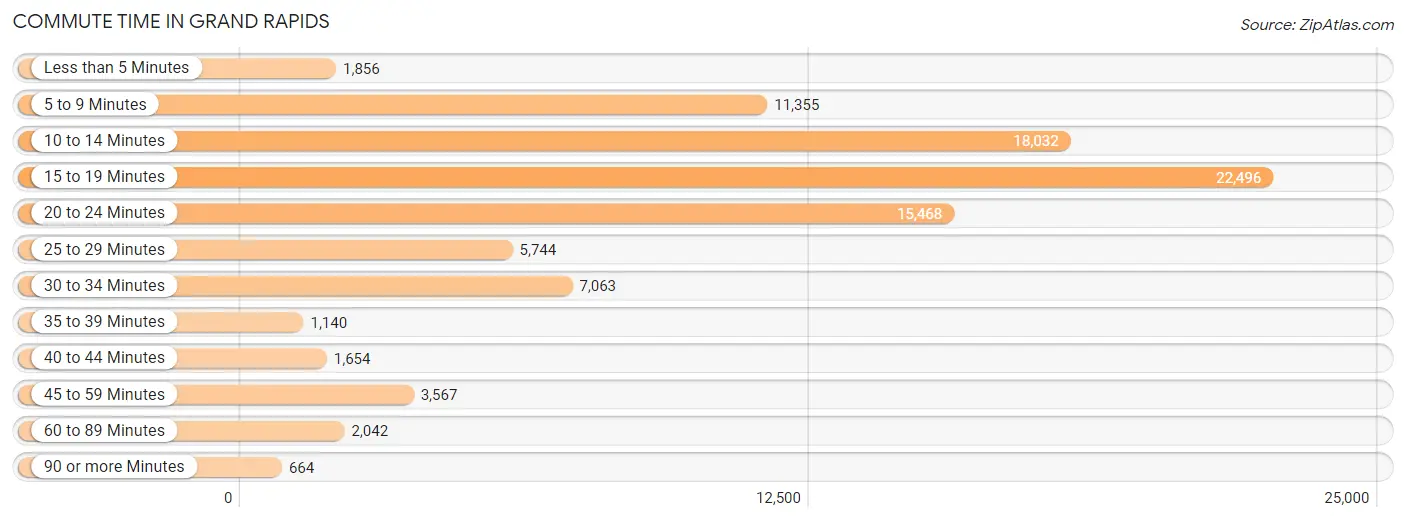
| Commute Time | # Commuters | % Commuters |
| Less than 5 Minutes | 1,856 | 2.0% |
| 5 to 9 Minutes | 11,355 | 12.5% |
| 10 to 14 Minutes | 18,032 | 19.8% |
| 15 to 19 Minutes | 22,496 | 24.7% |
| 20 to 24 Minutes | 15,468 | 17.0% |
| 25 to 29 Minutes | 5,744 | 6.3% |
| 30 to 34 Minutes | 7,063 | 7.7% |
| 35 to 39 Minutes | 1,140 | 1.3% |
| 40 to 44 Minutes | 1,654 | 1.8% |
| 45 to 59 Minutes | 3,567 | 3.9% |
| 60 to 89 Minutes | 2,042 | 2.2% |
| 90 or more Minutes | 664 | 0.7% |
Commute Time by Sex in Grand Rapids
The most common commute times in Grand Rapids are 15 to 19 minutes (11,311 commuters, 23.9%) for males and 15 to 19 minutes (11,185 commuters, 25.6%) for females.
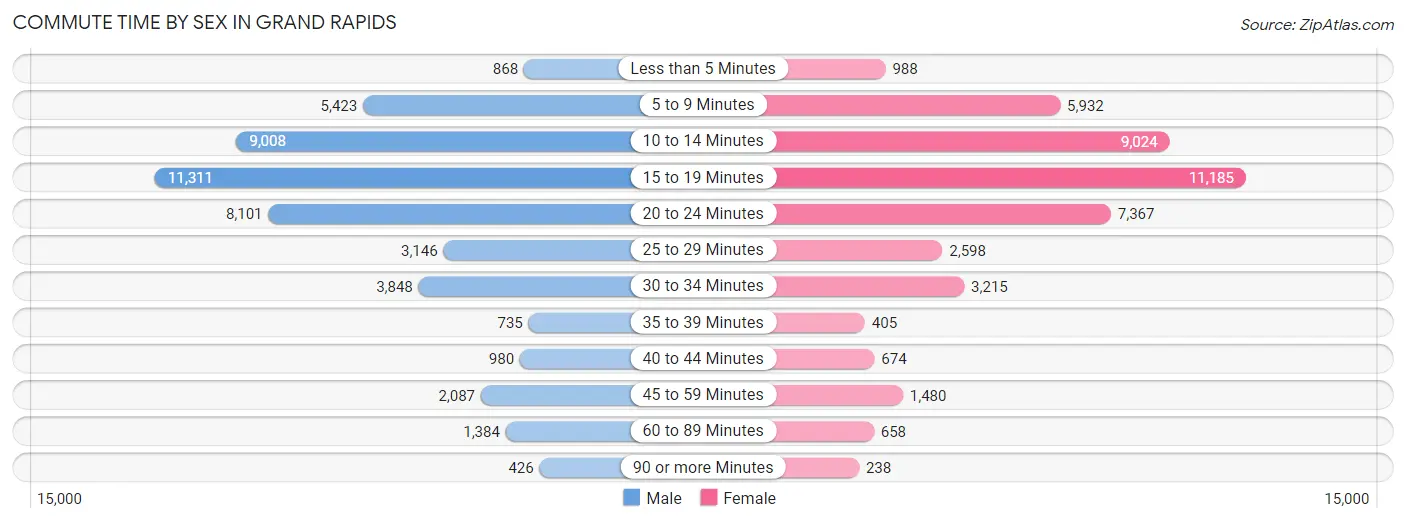
| Commute Time | Male | Female |
| Less than 5 Minutes | 868 (1.8%) | 988 (2.3%) |
| 5 to 9 Minutes | 5,423 (11.5%) | 5,932 (13.6%) |
| 10 to 14 Minutes | 9,008 (19.0%) | 9,024 (20.6%) |
| 15 to 19 Minutes | 11,311 (23.9%) | 11,185 (25.6%) |
| 20 to 24 Minutes | 8,101 (17.1%) | 7,367 (16.8%) |
| 25 to 29 Minutes | 3,146 (6.7%) | 2,598 (5.9%) |
| 30 to 34 Minutes | 3,848 (8.1%) | 3,215 (7.3%) |
| 35 to 39 Minutes | 735 (1.5%) | 405 (0.9%) |
| 40 to 44 Minutes | 980 (2.1%) | 674 (1.5%) |
| 45 to 59 Minutes | 2,087 (4.4%) | 1,480 (3.4%) |
| 60 to 89 Minutes | 1,384 (2.9%) | 658 (1.5%) |
| 90 or more Minutes | 426 (0.9%) | 238 (0.5%) |
Time of Departure to Work by Sex in Grand Rapids
The most frequent times of departure to work in Grand Rapids are 7:30 AM to 7:59 AM (6,893, 14.6%) for males and 7:30 AM to 7:59 AM (7,692, 17.6%) for females.
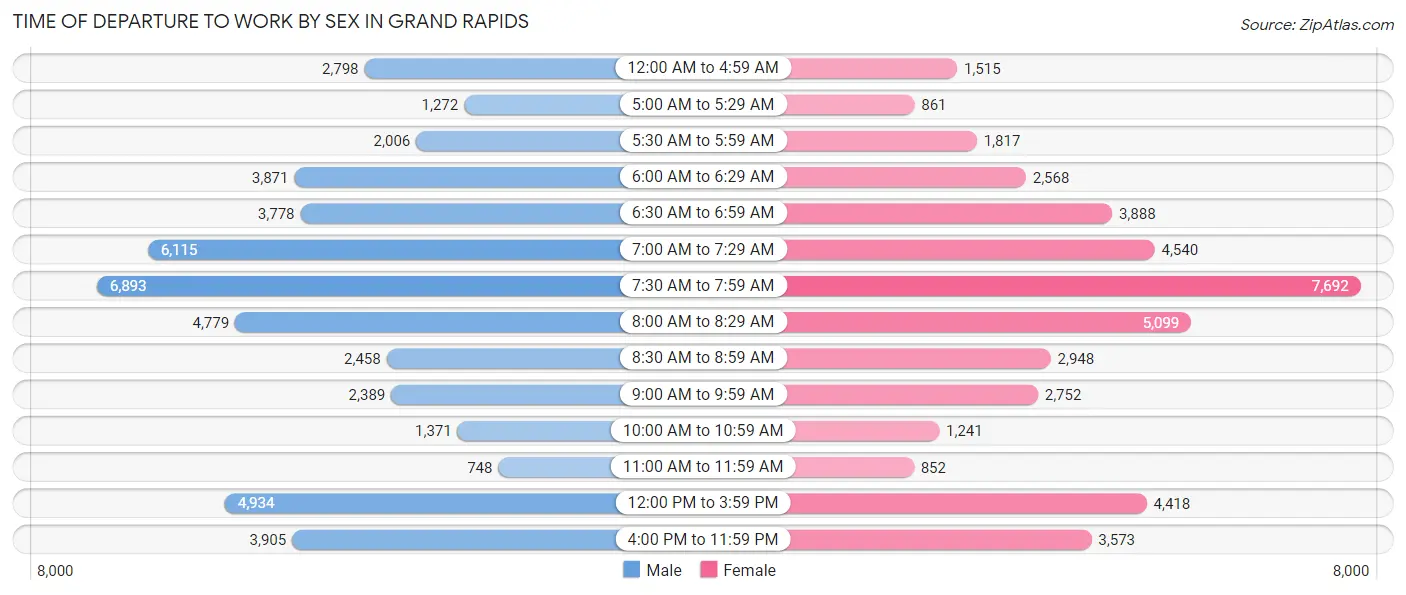
| Time of Departure | Male | Female |
| 12:00 AM to 4:59 AM | 2,798 (5.9%) | 1,515 (3.5%) |
| 5:00 AM to 5:29 AM | 1,272 (2.7%) | 861 (2.0%) |
| 5:30 AM to 5:59 AM | 2,006 (4.2%) | 1,817 (4.2%) |
| 6:00 AM to 6:29 AM | 3,871 (8.2%) | 2,568 (5.9%) |
| 6:30 AM to 6:59 AM | 3,778 (8.0%) | 3,888 (8.9%) |
| 7:00 AM to 7:29 AM | 6,115 (12.9%) | 4,540 (10.4%) |
| 7:30 AM to 7:59 AM | 6,893 (14.6%) | 7,692 (17.6%) |
| 8:00 AM to 8:29 AM | 4,779 (10.1%) | 5,099 (11.7%) |
| 8:30 AM to 8:59 AM | 2,458 (5.2%) | 2,948 (6.7%) |
| 9:00 AM to 9:59 AM | 2,389 (5.1%) | 2,752 (6.3%) |
| 10:00 AM to 10:59 AM | 1,371 (2.9%) | 1,241 (2.8%) |
| 11:00 AM to 11:59 AM | 748 (1.6%) | 852 (1.9%) |
| 12:00 PM to 3:59 PM | 4,934 (10.4%) | 4,418 (10.1%) |
| 4:00 PM to 11:59 PM | 3,905 (8.3%) | 3,573 (8.2%) |
| Total | 47,317 (100.0%) | 43,764 (100.0%) |
Housing Occupancy in Grand Rapids
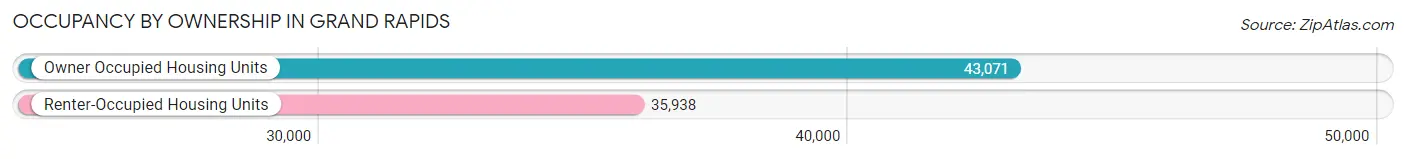
Occupancy by Ownership in Grand Rapids
Of the total 79,009 dwellings in Grand Rapids, owner-occupied units account for 43,071 (54.5%), while renter-occupied units make up 35,938 (45.5%).
| Occupancy | # Housing Units | % Housing Units |
| Owner Occupied Housing Units | 43,071 | 54.5% |
| Renter-Occupied Housing Units | 35,938 | 45.5% |
| Total Occupied Housing Units | 79,009 | 100.0% |
Occupancy by Household Size in Grand Rapids
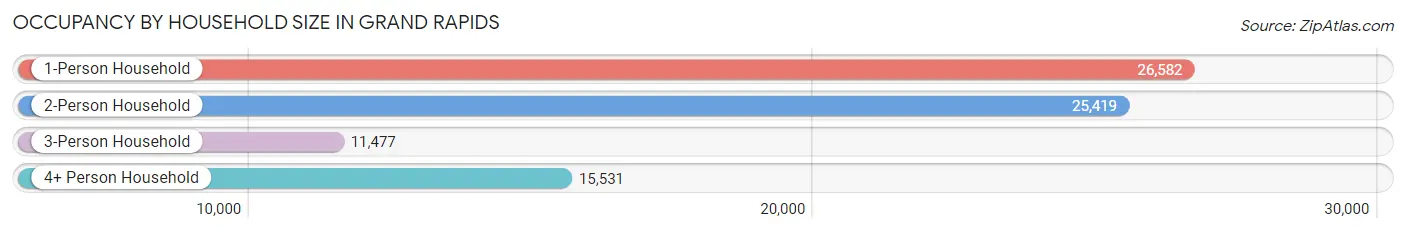
| Household Size | # Housing Units | % Housing Units |
| 1-Person Household | 26,582 | 33.6% |
| 2-Person Household | 25,419 | 32.2% |
| 3-Person Household | 11,477 | 14.5% |
| 4+ Person Household | 15,531 | 19.7% |
| Total Housing Units | 79,009 | 100.0% |
Occupancy by Ownership by Household Size in Grand Rapids
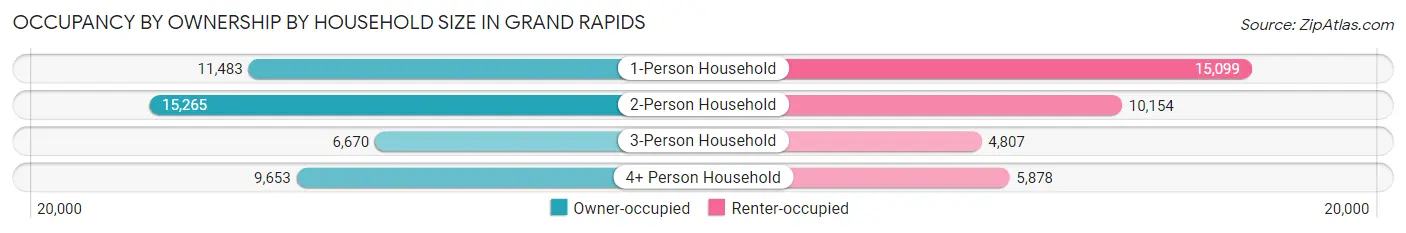
| Household Size | Owner-occupied | Renter-occupied |
| 1-Person Household | 11,483 (43.2%) | 15,099 (56.8%) |
| 2-Person Household | 15,265 (60.1%) | 10,154 (40.0%) |
| 3-Person Household | 6,670 (58.1%) | 4,807 (41.9%) |
| 4+ Person Household | 9,653 (62.2%) | 5,878 (37.9%) |
| Total Housing Units | 43,071 (54.5%) | 35,938 (45.5%) |
Occupancy by Educational Attainment in Grand Rapids
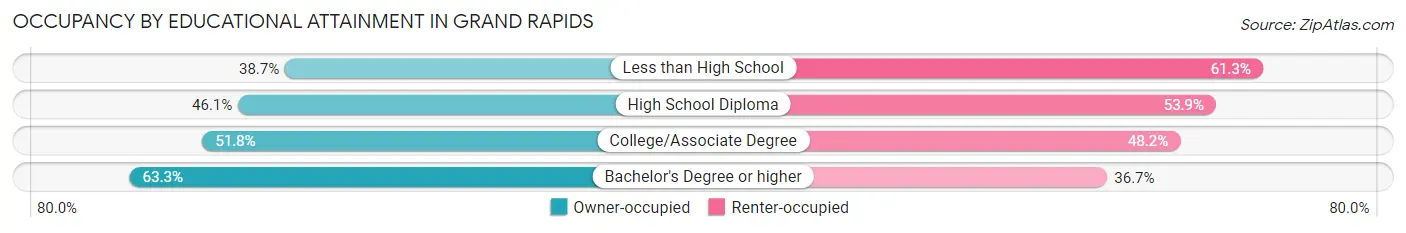
| Household Size | Owner-occupied | Renter-occupied |
| Less than High School | 2,664 (38.7%) | 4,222 (61.3%) |
| High School Diploma | 7,185 (46.1%) | 8,387 (53.9%) |
| College/Associate Degree | 11,641 (51.8%) | 10,833 (48.2%) |
| Bachelor's Degree or higher | 21,581 (63.3%) | 12,496 (36.7%) |
Occupancy by Age of Householder in Grand Rapids
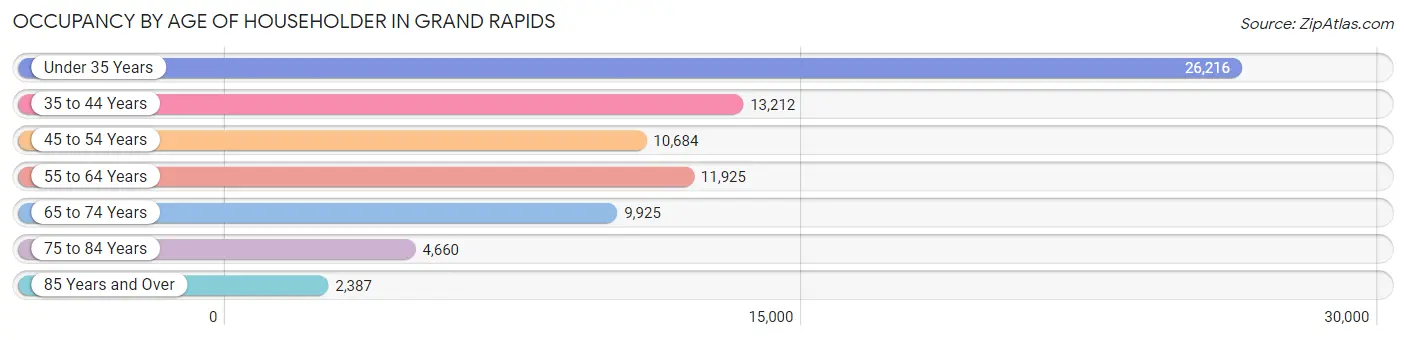
| Age Bracket | # Households | % Households |
| Under 35 Years | 26,216 | 33.2% |
| 35 to 44 Years | 13,212 | 16.7% |
| 45 to 54 Years | 10,684 | 13.5% |
| 55 to 64 Years | 11,925 | 15.1% |
| 65 to 74 Years | 9,925 | 12.6% |
| 75 to 84 Years | 4,660 | 5.9% |
| 85 Years and Over | 2,387 | 3.0% |
| Total | 79,009 | 100.0% |
Housing Finances in Grand Rapids
Median Income by Occupancy in Grand Rapids
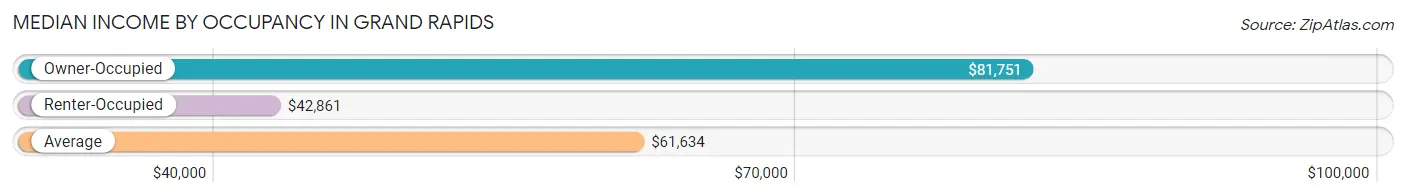
| Occupancy Type | # Households | Median Income |
| Owner-Occupied | 43,071 (54.5%) | $81,751 |
| Renter-Occupied | 35,938 (45.5%) | $42,861 |
| Average | 79,009 (100.0%) | $61,634 |
Occupancy by Householder Income Bracket in Grand Rapids
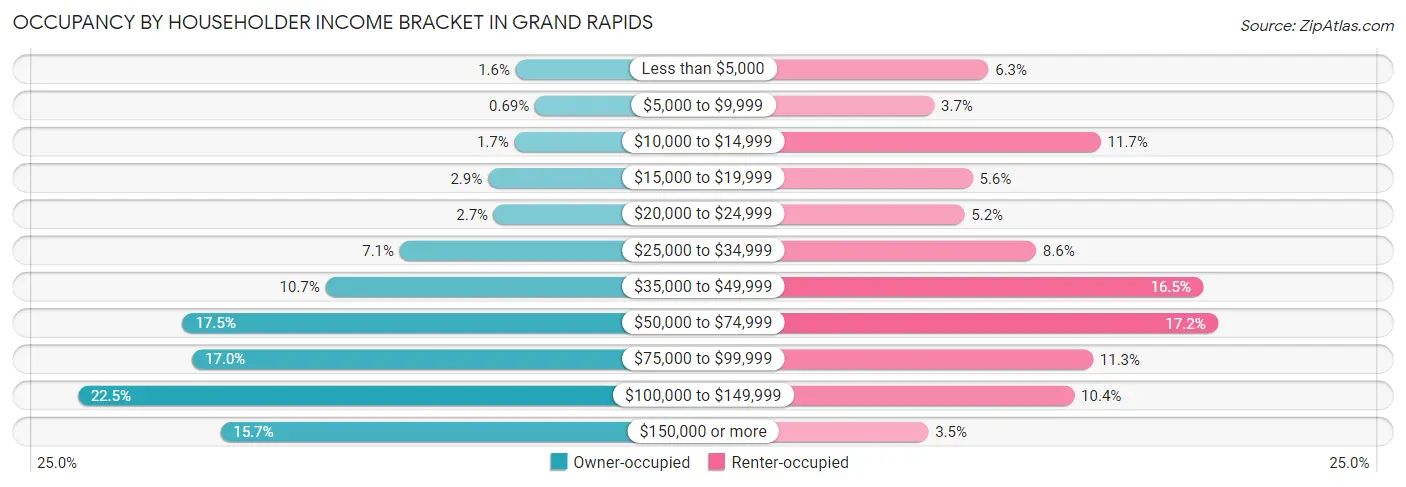
| Income Bracket | Owner-occupied | Renter-occupied |
| Less than $5,000 | 694 (1.6%) | 2,272 (6.3%) |
| $5,000 to $9,999 | 297 (0.7%) | 1,345 (3.7%) |
| $10,000 to $14,999 | 718 (1.7%) | 4,195 (11.7%) |
| $15,000 to $19,999 | 1,261 (2.9%) | 2,000 (5.6%) |
| $20,000 to $24,999 | 1,142 (2.6%) | 1,860 (5.2%) |
| $25,000 to $34,999 | 3,071 (7.1%) | 3,087 (8.6%) |
| $35,000 to $49,999 | 4,594 (10.7%) | 5,939 (16.5%) |
| $50,000 to $74,999 | 7,529 (17.5%) | 6,194 (17.2%) |
| $75,000 to $99,999 | 7,333 (17.0%) | 4,061 (11.3%) |
| $100,000 to $149,999 | 9,677 (22.5%) | 3,740 (10.4%) |
| $150,000 or more | 6,755 (15.7%) | 1,245 (3.5%) |
| Total | 43,071 (100.0%) | 35,938 (100.0%) |
Monthly Housing Cost Tiers in Grand Rapids
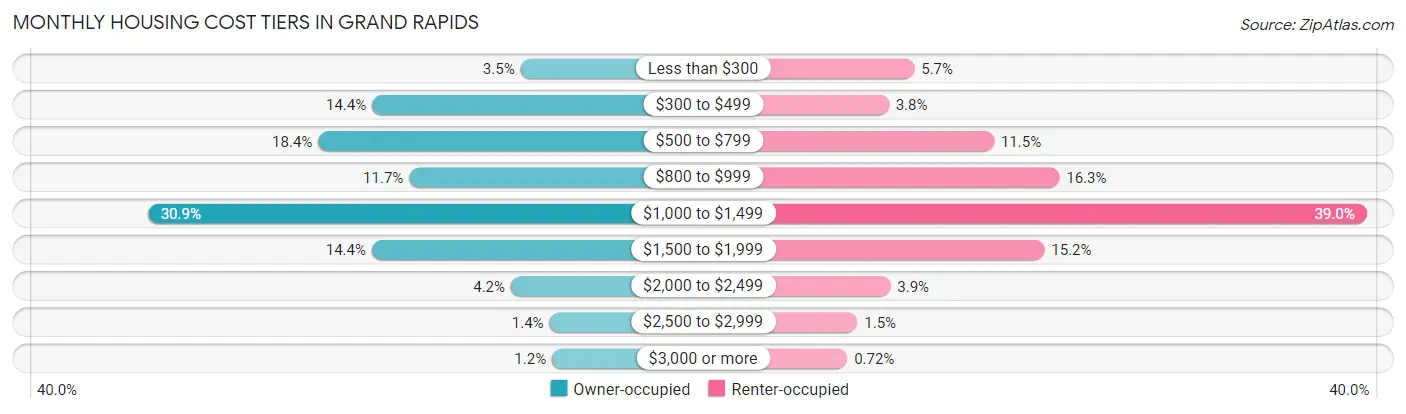
| Monthly Cost | Owner-occupied | Renter-occupied |
| Less than $300 | 1,499 (3.5%) | 2,035 (5.7%) |
| $300 to $499 | 6,205 (14.4%) | 1,359 (3.8%) |
| $500 to $799 | 7,915 (18.4%) | 4,142 (11.5%) |
| $800 to $999 | 5,031 (11.7%) | 5,873 (16.3%) |
| $1,000 to $1,499 | 13,323 (30.9%) | 14,008 (39.0%) |
| $1,500 to $1,999 | 6,215 (14.4%) | 5,478 (15.2%) |
| $2,000 to $2,499 | 1,803 (4.2%) | 1,400 (3.9%) |
| $2,500 to $2,999 | 580 (1.3%) | 529 (1.5%) |
| $3,000 or more | 500 (1.2%) | 257 (0.7%) |
| Total | 43,071 (100.0%) | 35,938 (100.0%) |
Physical Housing Characteristics in Grand Rapids
Housing Structures in Grand Rapids
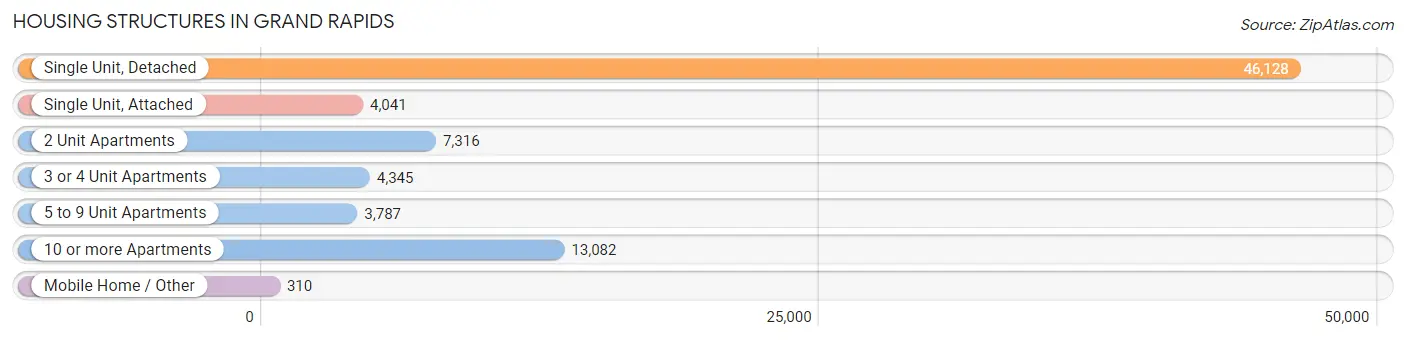
| Structure Type | # Housing Units | % Housing Units |
| Single Unit, Detached | 46,128 | 58.4% |
| Single Unit, Attached | 4,041 | 5.1% |
| 2 Unit Apartments | 7,316 | 9.3% |
| 3 or 4 Unit Apartments | 4,345 | 5.5% |
| 5 to 9 Unit Apartments | 3,787 | 4.8% |
| 10 or more Apartments | 13,082 | 16.6% |
| Mobile Home / Other | 310 | 0.4% |
| Total | 79,009 | 100.0% |
Housing Structures by Occupancy in Grand Rapids
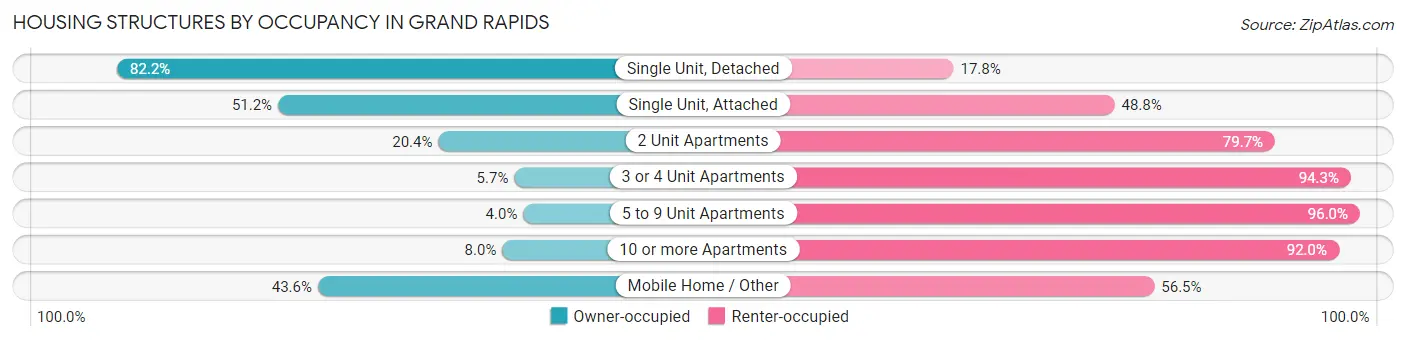
| Structure Type | Owner-occupied | Renter-occupied |
| Single Unit, Detached | 37,925 (82.2%) | 8,203 (17.8%) |
| Single Unit, Attached | 2,070 (51.2%) | 1,971 (48.8%) |
| 2 Unit Apartments | 1,489 (20.3%) | 5,827 (79.6%) |
| 3 or 4 Unit Apartments | 249 (5.7%) | 4,096 (94.3%) |
| 5 to 9 Unit Apartments | 151 (4.0%) | 3,636 (96.0%) |
| 10 or more Apartments | 1,052 (8.0%) | 12,030 (92.0%) |
| Mobile Home / Other | 135 (43.5%) | 175 (56.5%) |
| Total | 43,071 (54.5%) | 35,938 (45.5%) |
Housing Structures by Number of Rooms in Grand Rapids
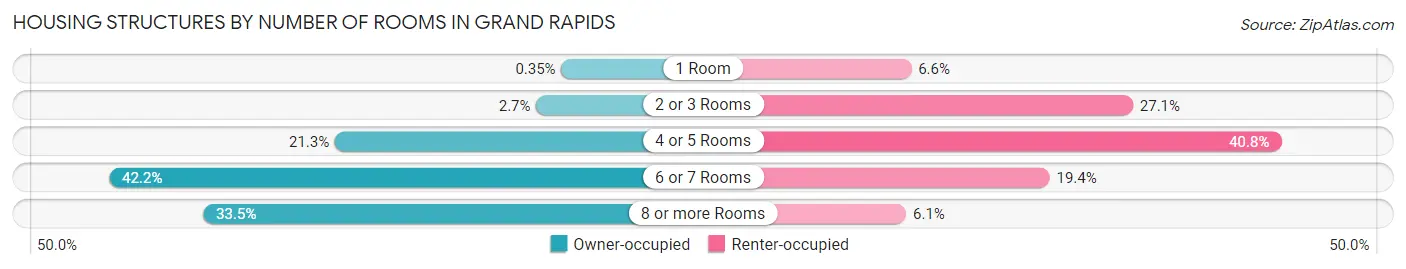
| Number of Rooms | Owner-occupied | Renter-occupied |
| 1 Room | 150 (0.4%) | 2,368 (6.6%) |
| 2 or 3 Rooms | 1,151 (2.7%) | 9,736 (27.1%) |
| 4 or 5 Rooms | 9,170 (21.3%) | 14,668 (40.8%) |
| 6 or 7 Rooms | 18,173 (42.2%) | 6,968 (19.4%) |
| 8 or more Rooms | 14,427 (33.5%) | 2,198 (6.1%) |
| Total | 43,071 (100.0%) | 35,938 (100.0%) |
Housing Structure by Heating Type in Grand Rapids
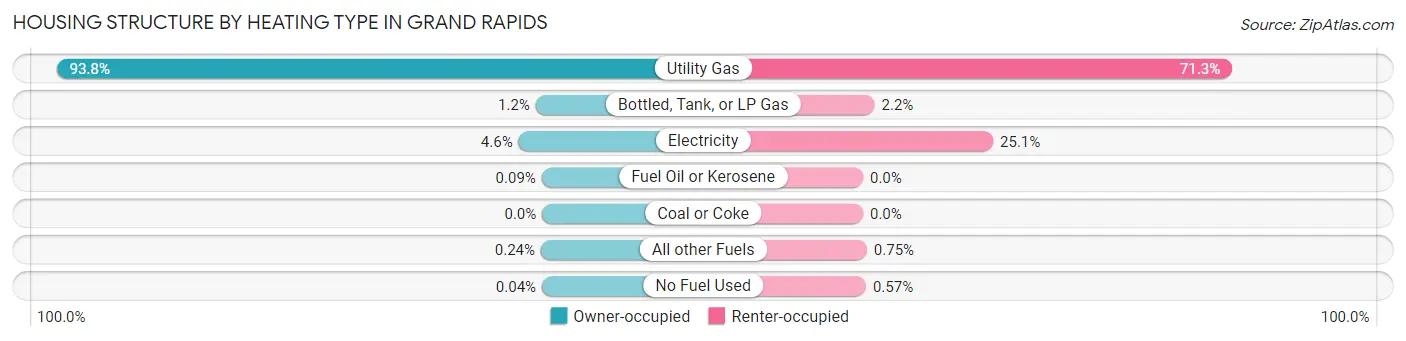
| Heating Type | Owner-occupied | Renter-occupied |
| Utility Gas | 40,410 (93.8%) | 25,627 (71.3%) |
| Bottled, Tank, or LP Gas | 535 (1.2%) | 803 (2.2%) |
| Electricity | 1,966 (4.6%) | 9,032 (25.1%) |
| Fuel Oil or Kerosene | 39 (0.1%) | 0 (0.0%) |
| Coal or Coke | 0 (0.0%) | 0 (0.0%) |
| All other Fuels | 104 (0.2%) | 271 (0.7%) |
| No Fuel Used | 17 (0.0%) | 205 (0.6%) |
| Total | 43,071 (100.0%) | 35,938 (100.0%) |
Household Vehicle Usage in Grand Rapids
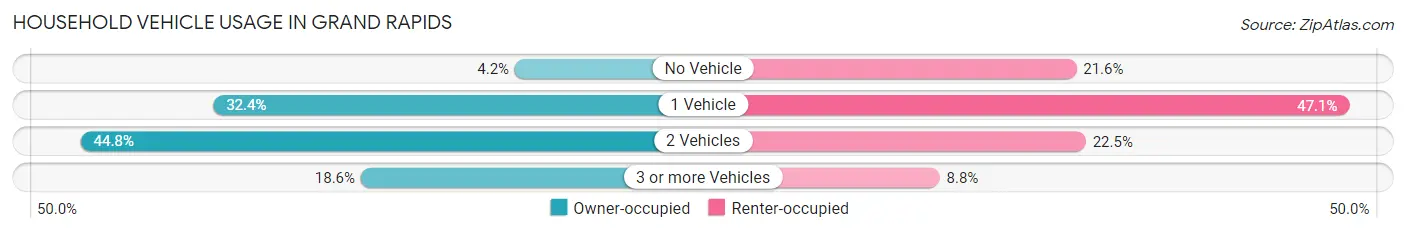
| Vehicles per Household | Owner-occupied | Renter-occupied |
| No Vehicle | 1,821 (4.2%) | 7,761 (21.6%) |
| 1 Vehicle | 13,951 (32.4%) | 16,920 (47.1%) |
| 2 Vehicles | 19,284 (44.8%) | 8,079 (22.5%) |
| 3 or more Vehicles | 8,015 (18.6%) | 3,178 (8.8%) |
| Total | 43,071 (100.0%) | 35,938 (100.0%) |
Real Estate & Mortgages in Grand Rapids
Real Estate and Mortgage Overview in Grand Rapids
| Characteristic | Without Mortgage | With Mortgage |
| Housing Units | 14,946 | 28,125 |
| Median Property Value | $193,900 | $208,300 |
| Median Household Income | $63,250 | $4,935 |
| Monthly Housing Costs | $496 | $479 |
| Real Estate Taxes | $2,127 | $923 |
Property Value by Mortgage Status in Grand Rapids
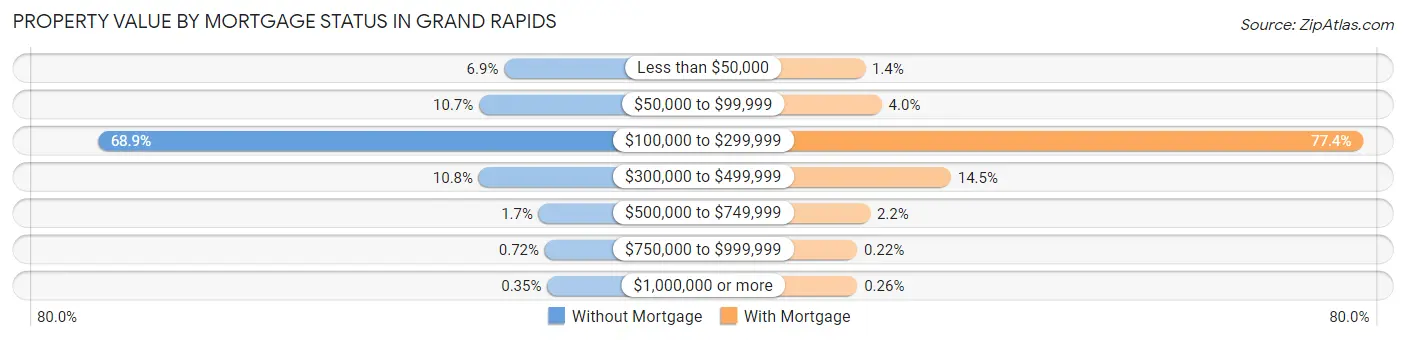
| Property Value | Without Mortgage | With Mortgage |
| Less than $50,000 | 1,033 (6.9%) | 405 (1.4%) |
| $50,000 to $99,999 | 1,605 (10.7%) | 1,118 (4.0%) |
| $100,000 to $299,999 | 10,291 (68.9%) | 21,764 (77.4%) |
| $300,000 to $499,999 | 1,611 (10.8%) | 4,082 (14.5%) |
| $500,000 to $749,999 | 246 (1.7%) | 620 (2.2%) |
| $750,000 to $999,999 | 108 (0.7%) | 62 (0.2%) |
| $1,000,000 or more | 52 (0.4%) | 74 (0.3%) |
| Total | 14,946 (100.0%) | 28,125 (100.0%) |
Household Income by Mortgage Status in Grand Rapids
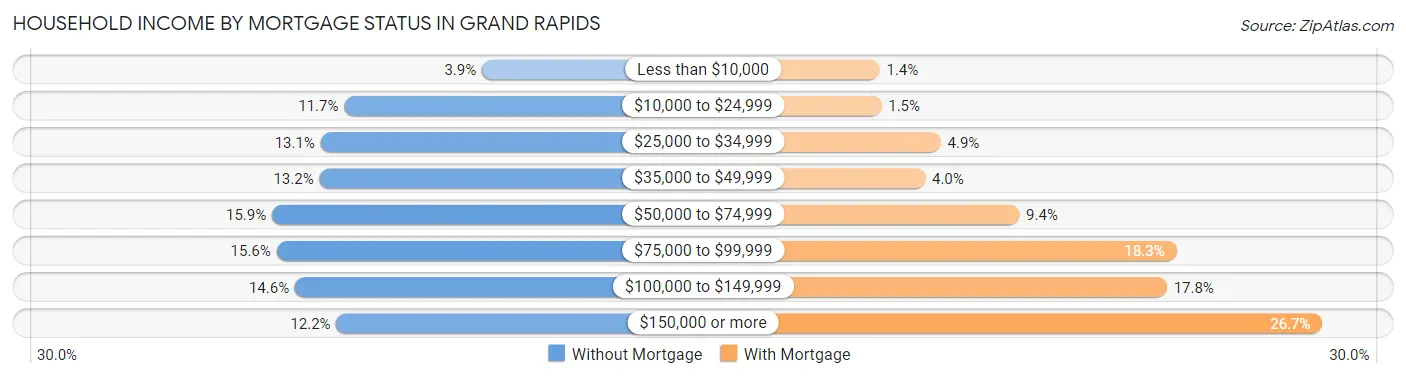
| Household Income | Without Mortgage | With Mortgage |
| Less than $10,000 | 577 (3.9%) | 386 (1.4%) |
| $10,000 to $24,999 | 1,753 (11.7%) | 414 (1.5%) |
| $25,000 to $34,999 | 1,955 (13.1%) | 1,368 (4.9%) |
| $35,000 to $49,999 | 1,965 (13.2%) | 1,116 (4.0%) |
| $50,000 to $74,999 | 2,370 (15.9%) | 2,629 (9.3%) |
| $75,000 to $99,999 | 2,331 (15.6%) | 5,159 (18.3%) |
| $100,000 to $149,999 | 2,175 (14.5%) | 5,002 (17.8%) |
| $150,000 or more | 1,820 (12.2%) | 7,502 (26.7%) |
| Total | 14,946 (100.0%) | 28,125 (100.0%) |
Property Value to Household Income Ratio in Grand Rapids
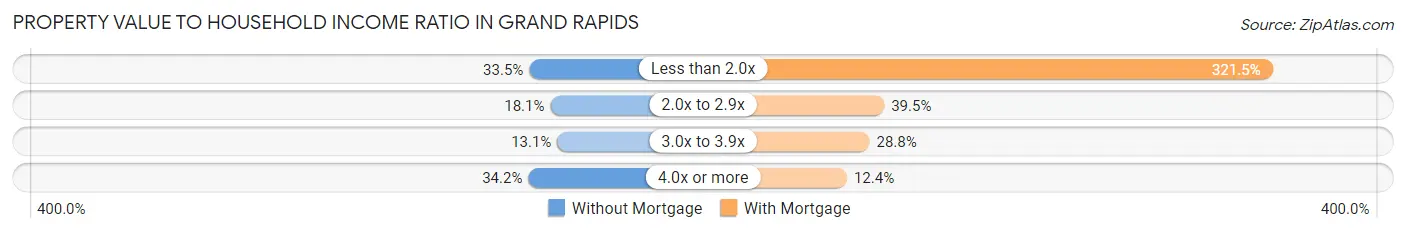
| Value-to-Income Ratio | Without Mortgage | With Mortgage |
| Less than 2.0x | 5,003 (33.5%) | 90,433 (321.5%) |
| 2.0x to 2.9x | 2,710 (18.1%) | 11,097 (39.5%) |
| 3.0x to 3.9x | 1,956 (13.1%) | 8,100 (28.8%) |
| 4.0x or more | 5,104 (34.2%) | 3,484 (12.4%) |
| Total | 14,946 (100.0%) | 28,125 (100.0%) |
Real Estate Taxes by Mortgage Status in Grand Rapids
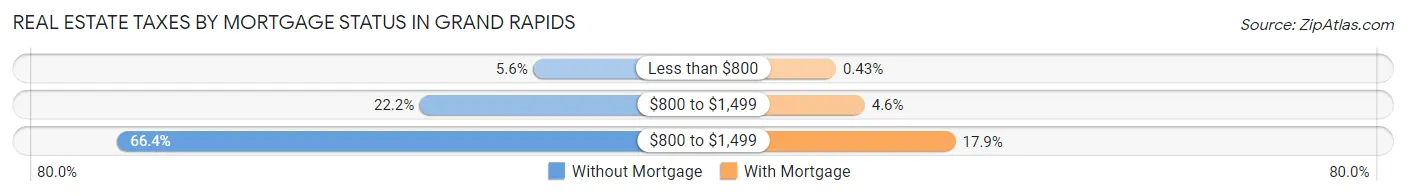
| Property Taxes | Without Mortgage | With Mortgage |
| Less than $800 | 843 (5.6%) | 120 (0.4%) |
| $800 to $1,499 | 3,321 (22.2%) | 1,304 (4.6%) |
| $800 to $1,499 | 9,928 (66.4%) | 5,038 (17.9%) |
| Total | 14,946 (100.0%) | 28,125 (100.0%) |
Health & Disability in Grand Rapids
Health Insurance Coverage by Age in Grand Rapids
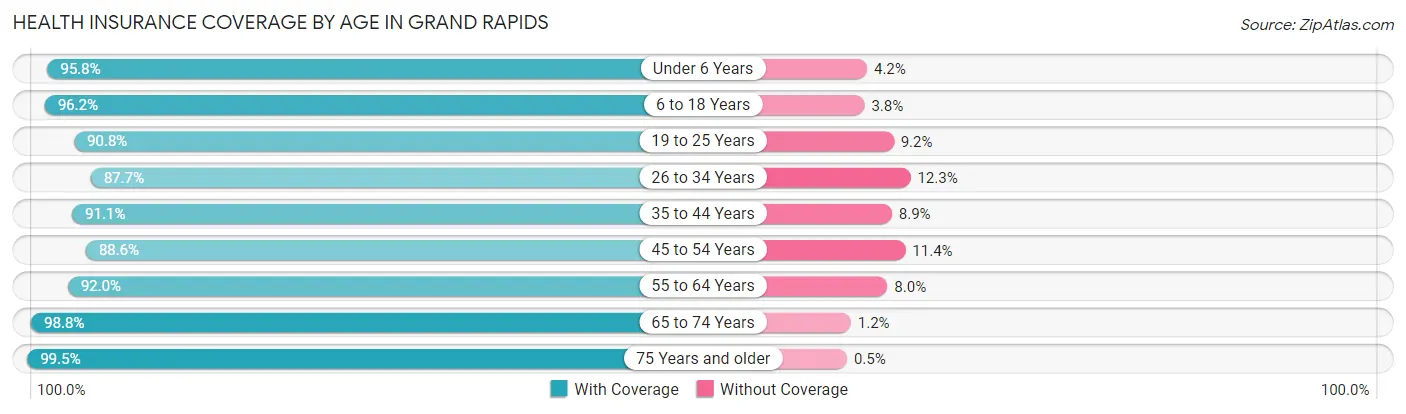
| Age Bracket | With Coverage | Without Coverage |
| Under 6 Years | 14,874 (95.8%) | 659 (4.2%) |
| 6 to 18 Years | 28,138 (96.2%) | 1,098 (3.8%) |
| 19 to 25 Years | 26,335 (90.8%) | 2,673 (9.2%) |
| 26 to 34 Years | 30,782 (87.7%) | 4,332 (12.3%) |
| 35 to 44 Years | 21,602 (91.1%) | 2,103 (8.9%) |
| 45 to 54 Years | 16,699 (88.6%) | 2,148 (11.4%) |
| 55 to 64 Years | 17,955 (92.0%) | 1,569 (8.0%) |
| 65 to 74 Years | 14,455 (98.8%) | 179 (1.2%) |
| 75 Years and older | 9,102 (99.5%) | 46 (0.5%) |
| Total | 179,942 (92.4%) | 14,807 (7.6%) |
Health Insurance Coverage by Citizenship Status in Grand Rapids
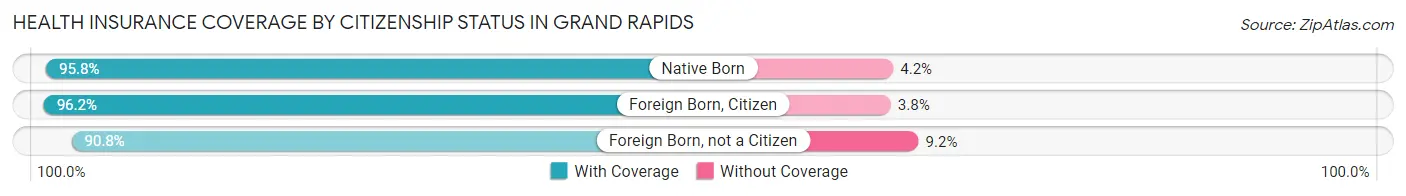
| Citizenship Status | With Coverage | Without Coverage |
| Native Born | 14,874 (95.8%) | 659 (4.2%) |
| Foreign Born, Citizen | 28,138 (96.2%) | 1,098 (3.8%) |
| Foreign Born, not a Citizen | 26,335 (90.8%) | 2,673 (9.2%) |
Health Insurance Coverage by Household Income in Grand Rapids
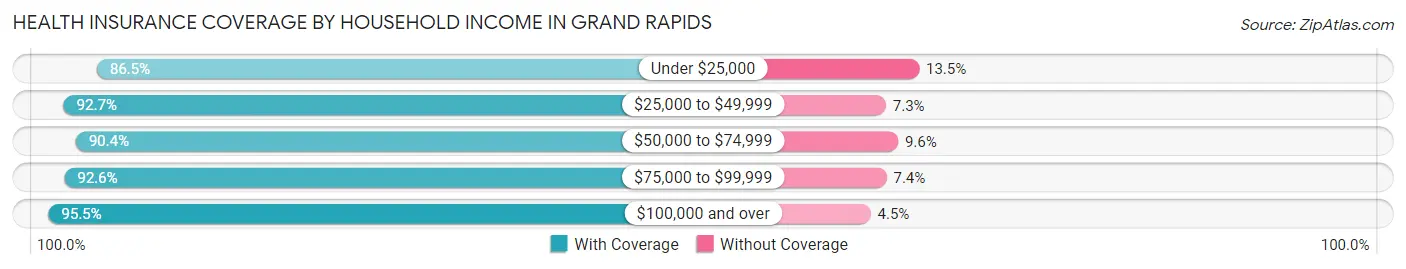
| Household Income | With Coverage | Without Coverage |
| Under $25,000 | 25,209 (86.5%) | 3,943 (13.5%) |
| $25,000 to $49,999 | 32,246 (92.7%) | 2,546 (7.3%) |
| $50,000 to $74,999 | 29,127 (90.4%) | 3,090 (9.6%) |
| $75,000 to $99,999 | 26,792 (92.6%) | 2,155 (7.4%) |
| $100,000 and over | 62,081 (95.5%) | 2,895 (4.5%) |
Public vs Private Health Insurance Coverage by Age in Grand Rapids
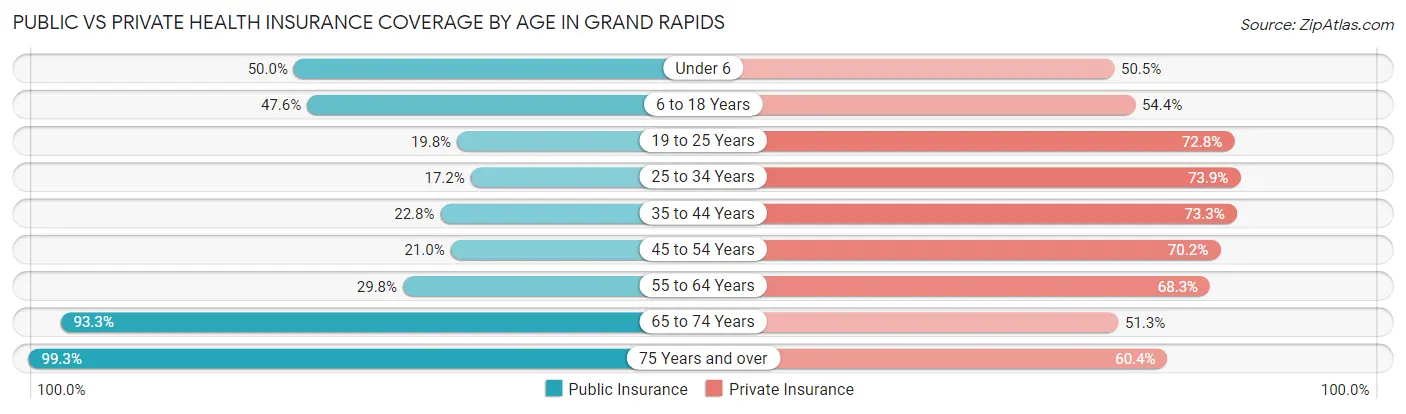
| Age Bracket | Public Insurance | Private Insurance |
| Under 6 | 7,773 (50.0%) | 7,850 (50.5%) |
| 6 to 18 Years | 13,907 (47.6%) | 15,911 (54.4%) |
| 19 to 25 Years | 5,729 (19.8%) | 21,115 (72.8%) |
| 25 to 34 Years | 6,049 (17.2%) | 25,962 (73.9%) |
| 35 to 44 Years | 5,414 (22.8%) | 17,365 (73.3%) |
| 45 to 54 Years | 3,949 (20.9%) | 13,229 (70.2%) |
| 55 to 64 Years | 5,817 (29.8%) | 13,338 (68.3%) |
| 65 to 74 Years | 13,658 (93.3%) | 7,504 (51.3%) |
| 75 Years and over | 9,080 (99.3%) | 5,528 (60.4%) |
| Total | 71,376 (36.6%) | 127,802 (65.6%) |
Disability Status by Sex by Age in Grand Rapids
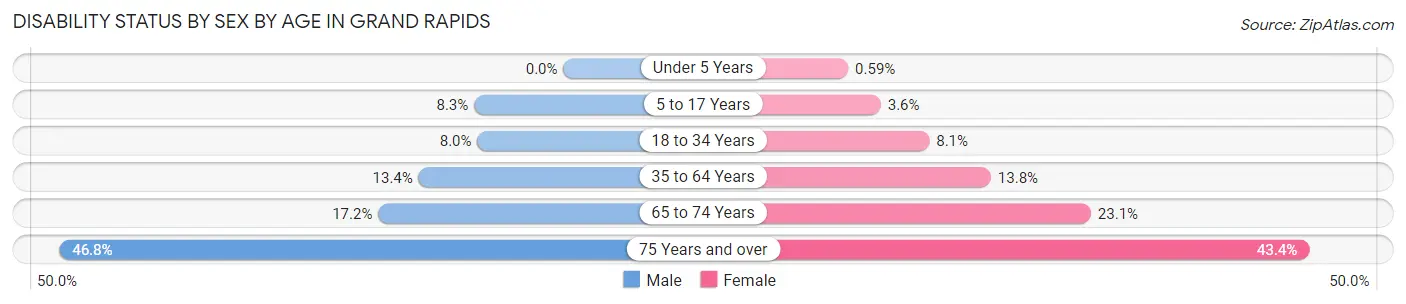
| Age Bracket | Male | Female |
| Under 5 Years | 0 (0.0%) | 37 (0.6%) |
| 5 to 17 Years | 1,207 (8.3%) | 529 (3.6%) |
| 18 to 34 Years | 2,575 (8.0%) | 2,780 (8.1%) |
| 35 to 64 Years | 4,193 (13.4%) | 4,272 (13.8%) |
| 65 to 74 Years | 1,122 (17.2%) | 1,874 (23.1%) |
| 75 Years and over | 1,462 (46.8%) | 2,612 (43.4%) |
Disability Class by Sex by Age in Grand Rapids
Disability Class: Hearing Difficulty
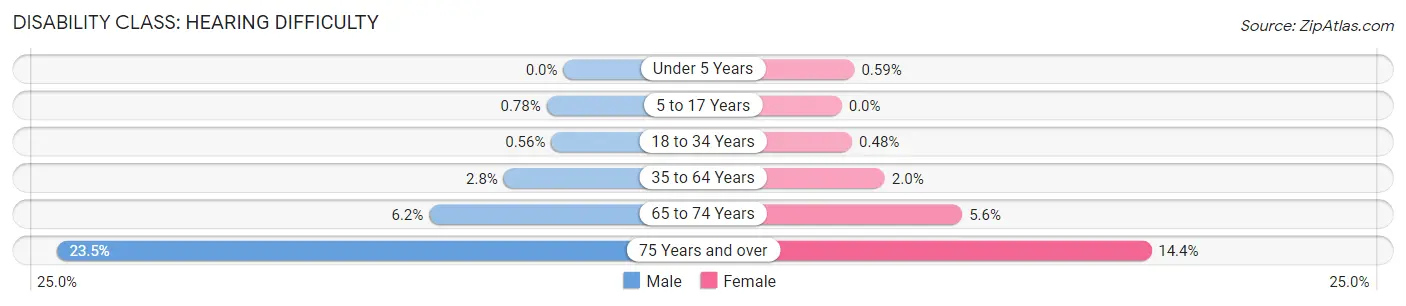
| Age Bracket | Male | Female |
| Under 5 Years | 0 (0.0%) | 37 (0.6%) |
| 5 to 17 Years | 113 (0.8%) | 0 (0.0%) |
| 18 to 34 Years | 180 (0.6%) | 166 (0.5%) |
| 35 to 64 Years | 863 (2.8%) | 617 (2.0%) |
| 65 to 74 Years | 407 (6.2%) | 453 (5.6%) |
| 75 Years and over | 735 (23.5%) | 865 (14.4%) |
Disability Class: Vision Difficulty
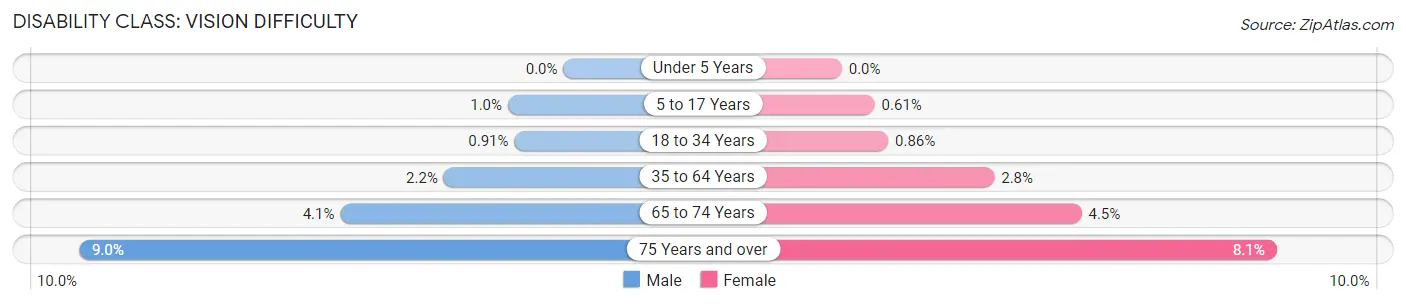
| Age Bracket | Male | Female |
| Under 5 Years | 0 (0.0%) | 0 (0.0%) |
| 5 to 17 Years | 150 (1.0%) | 89 (0.6%) |
| 18 to 34 Years | 294 (0.9%) | 294 (0.9%) |
| 35 to 64 Years | 693 (2.2%) | 872 (2.8%) |
| 65 to 74 Years | 270 (4.1%) | 361 (4.4%) |
| 75 Years and over | 281 (9.0%) | 486 (8.1%) |
Disability Class: Cognitive Difficulty
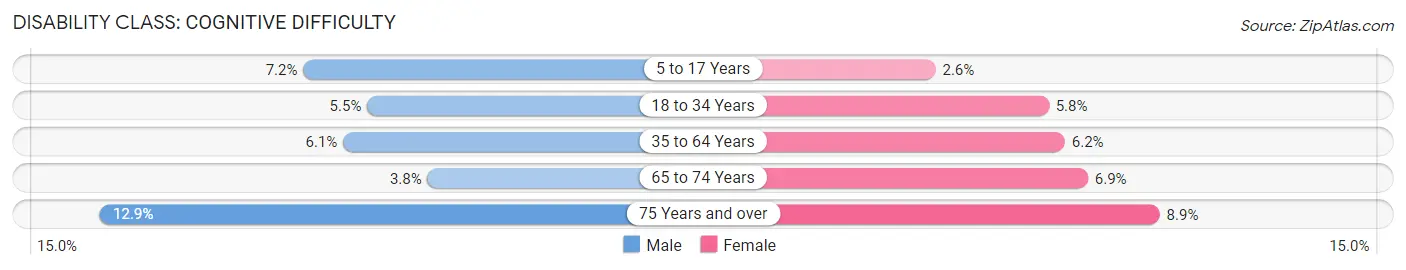
| Age Bracket | Male | Female |
| 5 to 17 Years | 1,055 (7.2%) | 382 (2.6%) |
| 18 to 34 Years | 1,762 (5.5%) | 1,970 (5.8%) |
| 35 to 64 Years | 1,912 (6.1%) | 1,918 (6.2%) |
| 65 to 74 Years | 247 (3.8%) | 555 (6.9%) |
| 75 Years and over | 403 (12.9%) | 533 (8.8%) |
Disability Class: Ambulatory Difficulty
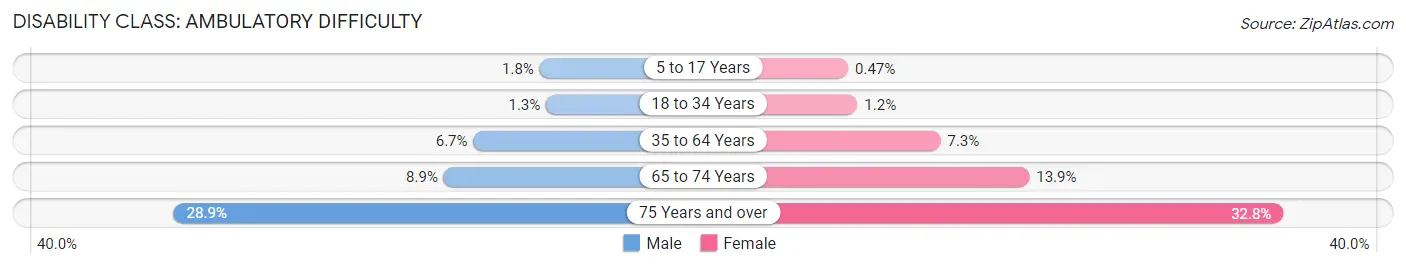
| Age Bracket | Male | Female |
| 5 to 17 Years | 257 (1.8%) | 69 (0.5%) |
| 18 to 34 Years | 413 (1.3%) | 396 (1.2%) |
| 35 to 64 Years | 2,085 (6.7%) | 2,261 (7.3%) |
| 65 to 74 Years | 580 (8.9%) | 1,128 (13.9%) |
| 75 Years and over | 904 (28.9%) | 1,974 (32.8%) |
Disability Class: Self-Care Difficulty
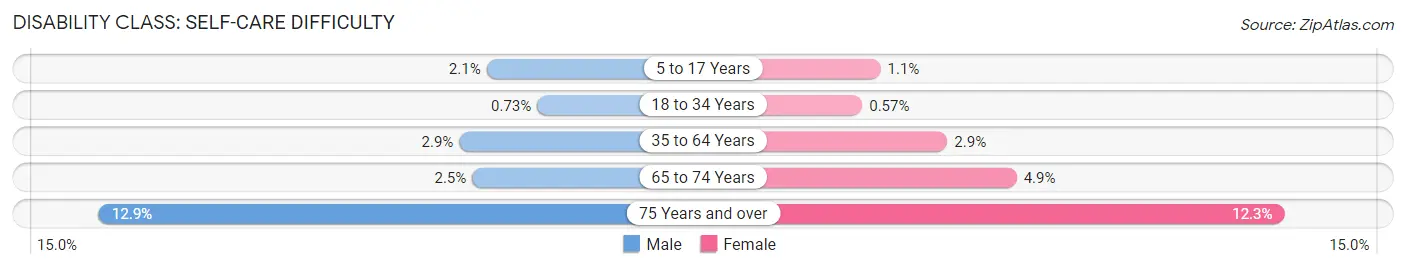
| Age Bracket | Male | Female |
| 5 to 17 Years | 312 (2.1%) | 158 (1.1%) |
| 18 to 34 Years | 235 (0.7%) | 194 (0.6%) |
| 35 to 64 Years | 905 (2.9%) | 909 (2.9%) |
| 65 to 74 Years | 166 (2.5%) | 395 (4.9%) |
| 75 Years and over | 404 (12.9%) | 742 (12.3%) |
Technology Access in Grand Rapids
Computing Device Access in Grand Rapids
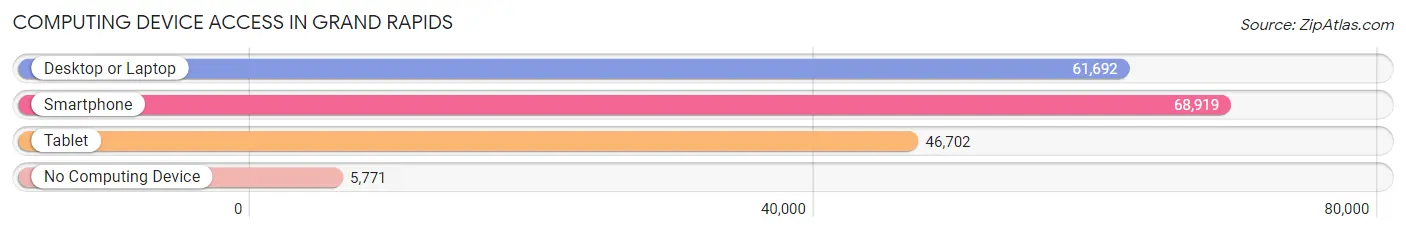
| Device Type | # Households | % Households |
| Desktop or Laptop | 61,692 | 78.1% |
| Smartphone | 68,919 | 87.2% |
| Tablet | 46,702 | 59.1% |
| No Computing Device | 5,771 | 7.3% |
| Total | 79,009 | 100.0% |
Internet Access in Grand Rapids
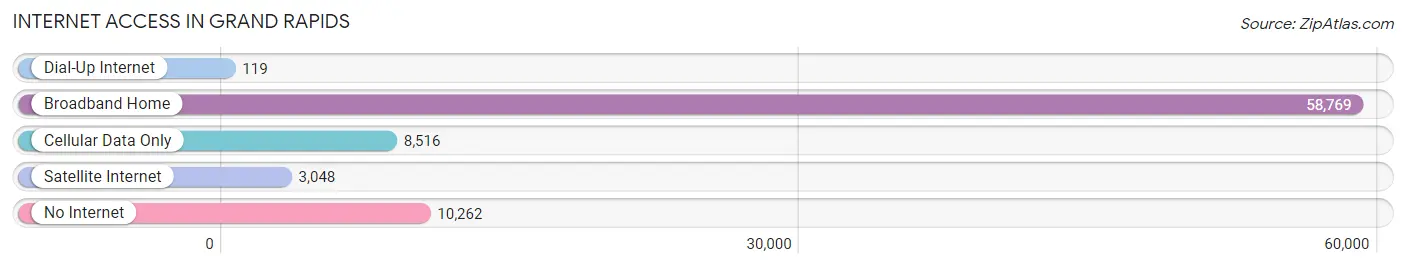
| Internet Type | # Households | % Households |
| Dial-Up Internet | 119 | 0.2% |
| Broadband Home | 58,769 | 74.4% |
| Cellular Data Only | 8,516 | 10.8% |
| Satellite Internet | 3,048 | 3.9% |
| No Internet | 10,262 | 13.0% |
| Total | 79,009 | 100.0% |
Grand Rapids Summary
Grand Rapids, Michigan is a city located in the western part of the state, in Kent County. It is the second-largest city in Michigan, with a population of over 200,000 people. Grand Rapids is known for its rich history, diverse geography, vibrant economy, and diverse demographics.
History
Grand Rapids was founded in 1826 by Louis Campau, a French-Canadian fur trader. The city was named after the rapids of the Grand River, which runs through the city. In the early years, the city was a major lumbering center, and the lumber industry was the main source of income for the city. In the late 19th century, the city began to diversify its economy, and it became a major manufacturing center. The city was also home to several major companies, such as the Grand Rapids Chair Company, the Grand Rapids Furniture Company, and the Grand Rapids Brewing Company.
Geography
Grand Rapids is located in the western part of Michigan, in Kent County. The city is situated on the Grand River, which runs through the city. The city is surrounded by several lakes, including Reeds Lake, Lake Michigan, and Lake Macatawa. The city is also home to several parks, including Millennium Park, John Ball Park, and Riverside Park.
Economy
Grand Rapids is a major economic center in Michigan. The city is home to several major companies, such as Amway, Steelcase, and Meijer. The city is also home to several major universities, such as Grand Valley State University, Calvin College, and Davenport University. The city is also home to several major hospitals, such as Spectrum Health, Mercy Health, and Metro Health.
Demographics
Grand Rapids is a diverse city, with a population of over 200,000 people. The city is home to a variety of ethnic and racial groups, including African Americans, Hispanics, Asians, and Native Americans. The city also has a large LGBT population. The median household income in Grand Rapids is $45,000, and the median home value is $150,000. The city has a high rate of poverty, with over 20% of the population living below the poverty line.
Grand Rapids is a vibrant city with a rich history, diverse geography, vibrant economy, and diverse demographics. The city is home to several major companies, universities, and hospitals, and it is a major economic center in Michigan. The city is also home to a variety of ethnic and racial groups, and it has a large LGBT population. The city has a high rate of poverty, but it is also home to a thriving economy and a vibrant culture.
Common Questions
What is Per Capita Income in Grand Rapids?
Per Capita income in Grand Rapids is $32,371.
What is the Median Family Income in Grand Rapids?
Median Family Income in Grand Rapids is $77,651.
What is the Median Household income in Grand Rapids?
Median Household Income in Grand Rapids is $61,634.
What is Income or Wage Gap in Grand Rapids?
Income or Wage Gap in Grand Rapids is 22.4%.
Women in Grand Rapids earn 77.6 cents for every dollar earned by a man.
What is Family Income Deficit in Grand Rapids?
Family Income Deficit in Grand Rapids is $11,247.
Families that are below poverty line in Grand Rapids earn $11,247 less on average than the poverty threshold level.
What is Inequality or Gini Index in Grand Rapids?
Inequality or Gini Index in Grand Rapids is 0.44.
What is the Total Population of Grand Rapids?
Total Population of Grand Rapids is 198,096.
What is the Total Male Population of Grand Rapids?
Total Male Population of Grand Rapids is 96,902.
What is the Total Female Population of Grand Rapids?
Total Female Population of Grand Rapids is 101,194.
What is the Ratio of Males per 100 Females in Grand Rapids?
There are 95.76 Males per 100 Females in Grand Rapids.
What is the Ratio of Females per 100 Males in Grand Rapids?
There are 104.43 Females per 100 Males in Grand Rapids.
What is the Median Population Age in Grand Rapids?
Median Population Age in Grand Rapids is 31.8 Years.
What is the Average Family Size in Grand Rapids
Average Family Size in Grand Rapids is 3.1 People.
What is the Average Household Size in Grand Rapids
Average Household Size in Grand Rapids is 2.4 People.
How Large is the Labor Force in Grand Rapids?
There are 109,965 People in the Labor Forcein in Grand Rapids.
What is the Percentage of People in the Labor Force in Grand Rapids?
68.7% of People are in the Labor Force in Grand Rapids.
What is the Unemployment Rate in Grand Rapids?
Unemployment Rate in Grand Rapids is 5.6%.