Tuckahoe, VA Map & Demographics
Tuckahoe Map
Tuckahoe Overview
$57,684
PER CAPITA INCOME
$117,413
AVG FAMILY INCOME
$89,920
AVG HOUSEHOLD INCOME
25.1%
WAGE / INCOME GAP [ % ]
74.9¢/ $1
WAGE / INCOME GAP [ $ ]
$8,154
FAMILY INCOME DEFICIT
0.51
INEQUALITY / GINI INDEX
48,049
TOTAL POPULATION
22,489
MALE POPULATION
25,560
FEMALE POPULATION
87.99
MALES / 100 FEMALES
113.66
FEMALES / 100 MALES
39.9
MEDIAN AGE
3.1
AVG FAMILY SIZE
2.5
AVG HOUSEHOLD SIZE
24,954
LABOR FORCE [ PEOPLE ]
65.7%
PERCENT IN LABOR FORCE
4.5%
UNEMPLOYMENT RATE
Income in Tuckahoe
Income Overview in Tuckahoe
Per Capita Income in Tuckahoe is $57,684, while median incomes of families and households are $117,413 and $89,920 respectively.
| Characteristic | Number | Measure |
| Per Capita Income | 48,049 | $57,684 |
| Median Family Income | 12,054 | $117,413 |
| Mean Family Income | 12,054 | $179,658 |
| Median Household Income | 19,236 | $89,920 |
| Mean Household Income | 19,236 | $141,128 |
| Income Deficit | 12,054 | $8,154 |
| Wage / Income Gap (%) | 48,049 | 25.07% |
| Wage / Income Gap ($) | 48,049 | 74.93¢ per $1 |
| Gini / Inequality Index | 48,049 | 0.51 |
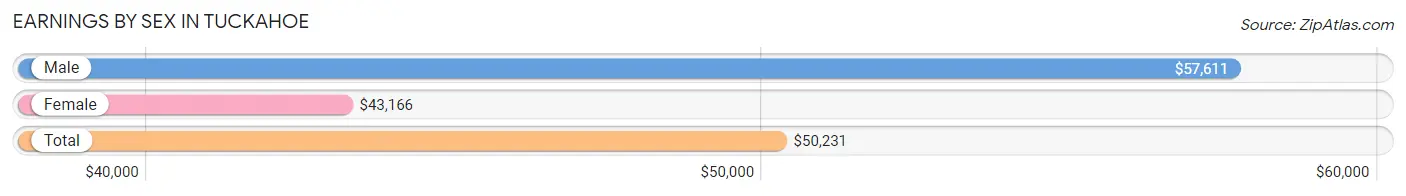
Earnings by Sex in Tuckahoe
Average Earnings in Tuckahoe are $50,231, $57,611 for men and $43,166 for women, a difference of 25.1%.
| Sex | Number | Average Earnings |
| Male | 13,842 (52.9%) | $57,611 |
| Female | 12,317 (47.1%) | $43,166 |
| Total | 26,159 (100.0%) | $50,231 |
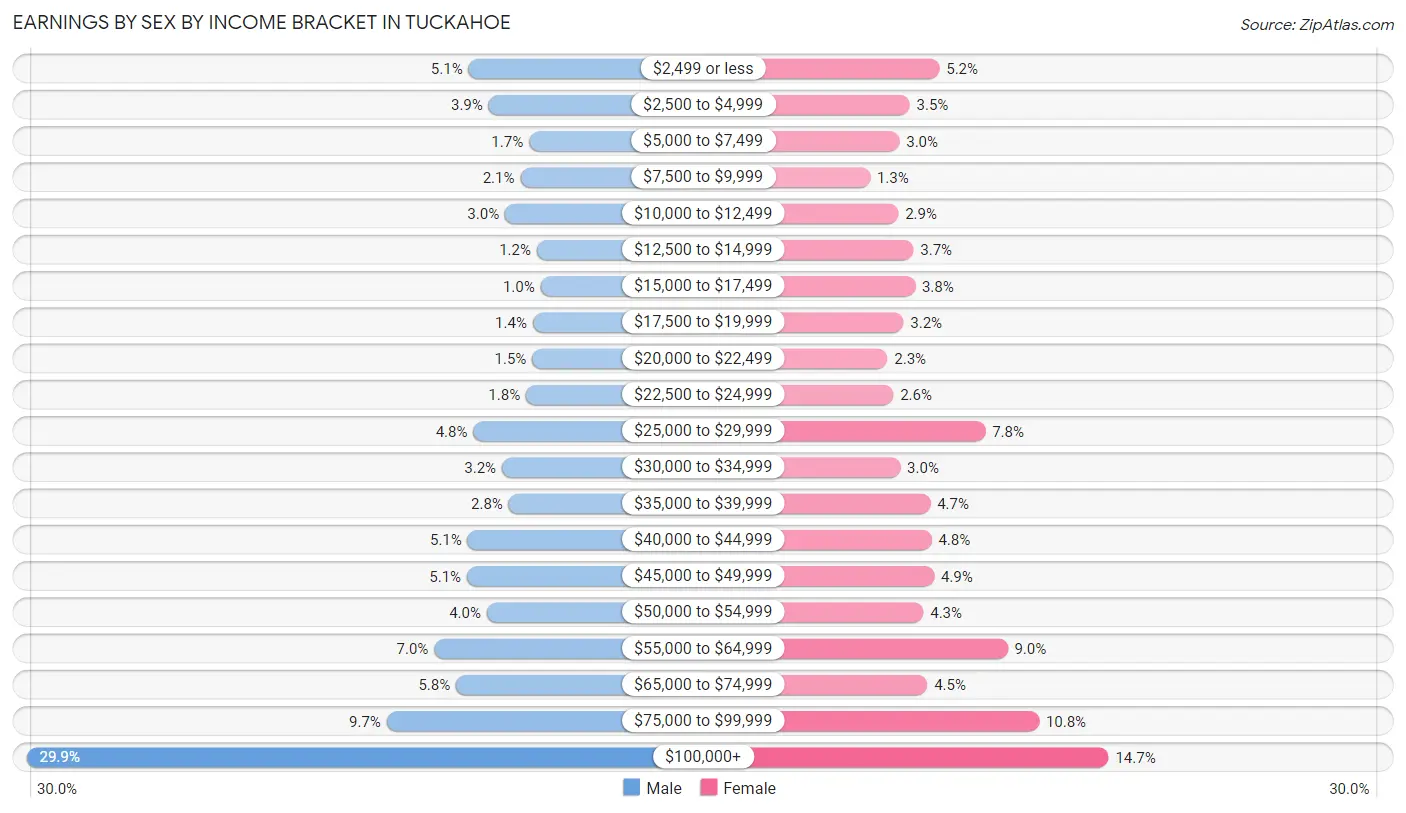
Earnings by Sex by Income Bracket in Tuckahoe
The most common earnings brackets in Tuckahoe are $100,000+ for men (4,138 | 29.9%) and $100,000+ for women (1,812 | 14.7%).
| Income | Male | Female |
| $2,499 or less | 699 (5.1%) | 640 (5.2%) |
| $2,500 to $4,999 | 543 (3.9%) | 435 (3.5%) |
| $5,000 to $7,499 | 229 (1.7%) | 363 (2.9%) |
| $7,500 to $9,999 | 296 (2.1%) | 160 (1.3%) |
| $10,000 to $12,499 | 415 (3.0%) | 356 (2.9%) |
| $12,500 to $14,999 | 167 (1.2%) | 461 (3.7%) |
| $15,000 to $17,499 | 139 (1.0%) | 472 (3.8%) |
| $17,500 to $19,999 | 200 (1.4%) | 392 (3.2%) |
| $20,000 to $22,499 | 204 (1.5%) | 281 (2.3%) |
| $22,500 to $24,999 | 252 (1.8%) | 321 (2.6%) |
| $25,000 to $29,999 | 662 (4.8%) | 958 (7.8%) |
| $30,000 to $34,999 | 439 (3.2%) | 369 (3.0%) |
| $35,000 to $39,999 | 386 (2.8%) | 578 (4.7%) |
| $40,000 to $44,999 | 706 (5.1%) | 586 (4.8%) |
| $45,000 to $49,999 | 712 (5.1%) | 604 (4.9%) |
| $50,000 to $54,999 | 557 (4.0%) | 530 (4.3%) |
| $55,000 to $64,999 | 966 (7.0%) | 1,112 (9.0%) |
| $65,000 to $74,999 | 796 (5.8%) | 557 (4.5%) |
| $75,000 to $99,999 | 1,336 (9.7%) | 1,330 (10.8%) |
| $100,000+ | 4,138 (29.9%) | 1,812 (14.7%) |
| Total | 13,842 (100.0%) | 12,317 (100.0%) |
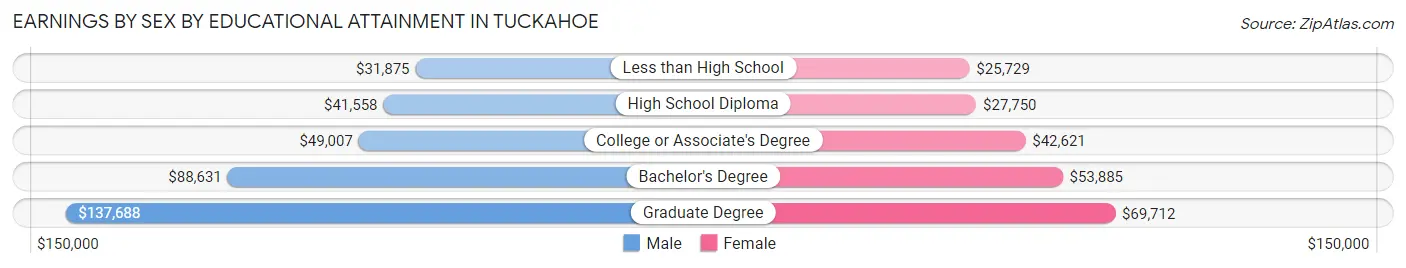
Earnings by Sex by Educational Attainment in Tuckahoe
Average earnings in Tuckahoe are $69,732 for men and $48,769 for women, a difference of 30.1%. Men with an educational attainment of graduate degree enjoy the highest average annual earnings of $137,688, while those with less than high school education earn the least with $31,875. Women with an educational attainment of graduate degree earn the most with the average annual earnings of $69,712, while those with less than high school education have the smallest earnings of $25,729.
| Educational Attainment | Male Income | Female Income |
| Less than High School | $31,875 | $25,729 |
| High School Diploma | $41,558 | $27,750 |
| College or Associate's Degree | $49,007 | $42,621 |
| Bachelor's Degree | $88,631 | $53,885 |
| Graduate Degree | $137,688 | $69,712 |
| Total | $69,732 | $48,769 |
Family Income in Tuckahoe
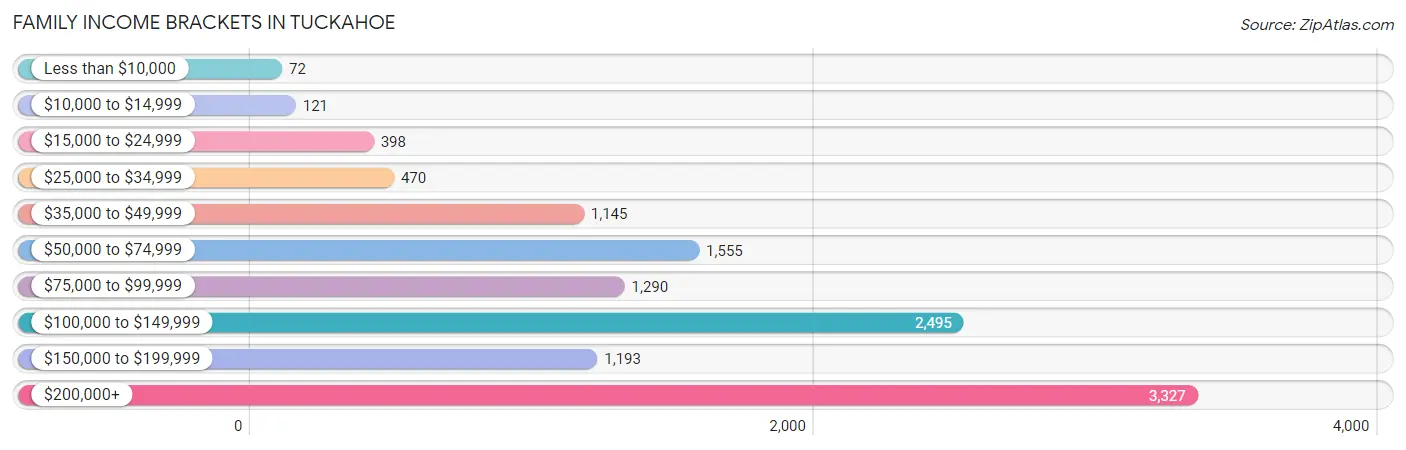
Family Income Brackets in Tuckahoe
According to the Tuckahoe family income data, there are 3,327 families falling into the $200,000+ income range, which is the most common income bracket and makes up 27.6% of all families. Conversely, the less than $10,000 income bracket is the least frequent group with only 72 families (0.6%) belonging to this category.
| Income Bracket | # Families | % Families |
| Less than $10,000 | 72 | 0.6% |
| $10,000 to $14,999 | 121 | 1.0% |
| $15,000 to $24,999 | 398 | 3.3% |
| $25,000 to $34,999 | 470 | 3.9% |
| $35,000 to $49,999 | 1,145 | 9.5% |
| $50,000 to $74,999 | 1,555 | 12.9% |
| $75,000 to $99,999 | 1,290 | 10.7% |
| $100,000 to $149,999 | 2,495 | 20.7% |
| $150,000 to $199,999 | 1,193 | 9.9% |
| $200,000+ | 3,327 | 27.6% |
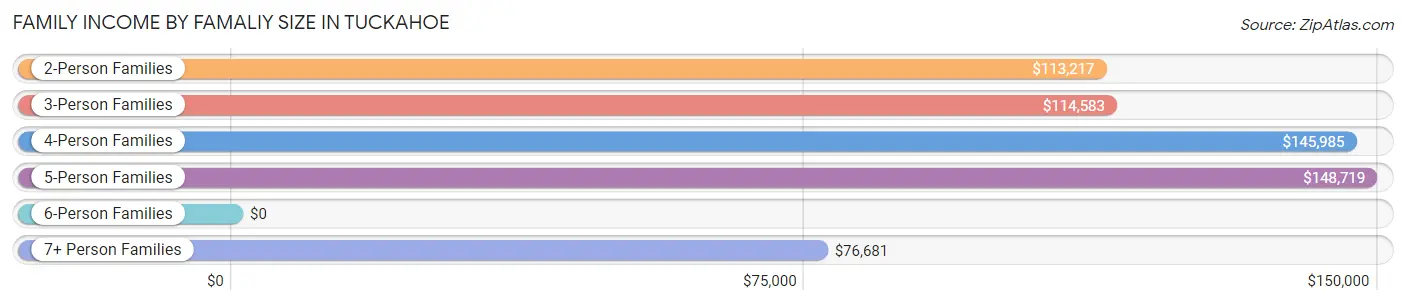
Family Income by Famaliy Size in Tuckahoe
5-person families (1,095 | 9.1%) account for the highest median family income in Tuckahoe with $148,719 per family, while 2-person families (5,750 | 47.7%) have the highest median income of $56,608 per family member.
| Income Bracket | # Families | Median Income |
| 2-Person Families | 5,750 (47.7%) | $113,217 |
| 3-Person Families | 2,714 (22.5%) | $114,583 |
| 4-Person Families | 2,186 (18.1%) | $145,985 |
| 5-Person Families | 1,095 (9.1%) | $148,719 |
| 6-Person Families | 266 (2.2%) | $0 |
| 7+ Person Families | 43 (0.4%) | $76,681 |
| Total | 12,054 (100.0%) | $117,413 |
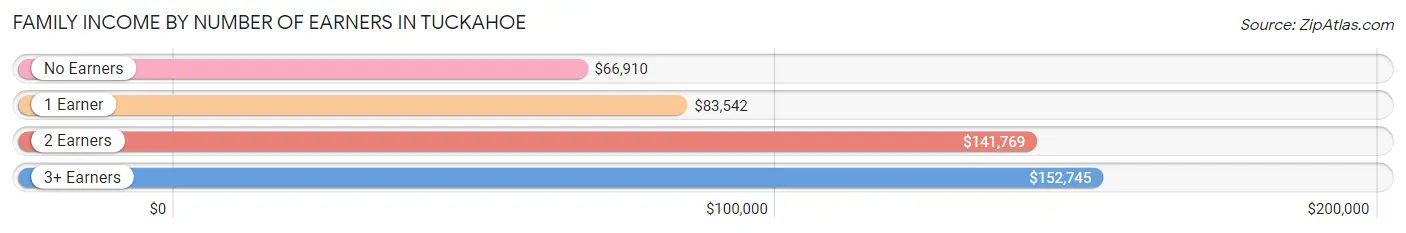
Family Income by Number of Earners in Tuckahoe
The median family income in Tuckahoe is $117,413, with families comprising 3+ earners (1,410) having the highest median family income of $152,745, while families with no earners (1,576) have the lowest median family income of $66,910, accounting for 11.7% and 13.1% of families, respectively.
| Number of Earners | # Families | Median Income |
| No Earners | 1,576 (13.1%) | $66,910 |
| 1 Earner | 3,700 (30.7%) | $83,542 |
| 2 Earners | 5,368 (44.5%) | $141,769 |
| 3+ Earners | 1,410 (11.7%) | $152,745 |
| Total | 12,054 (100.0%) | $117,413 |
Household Income in Tuckahoe
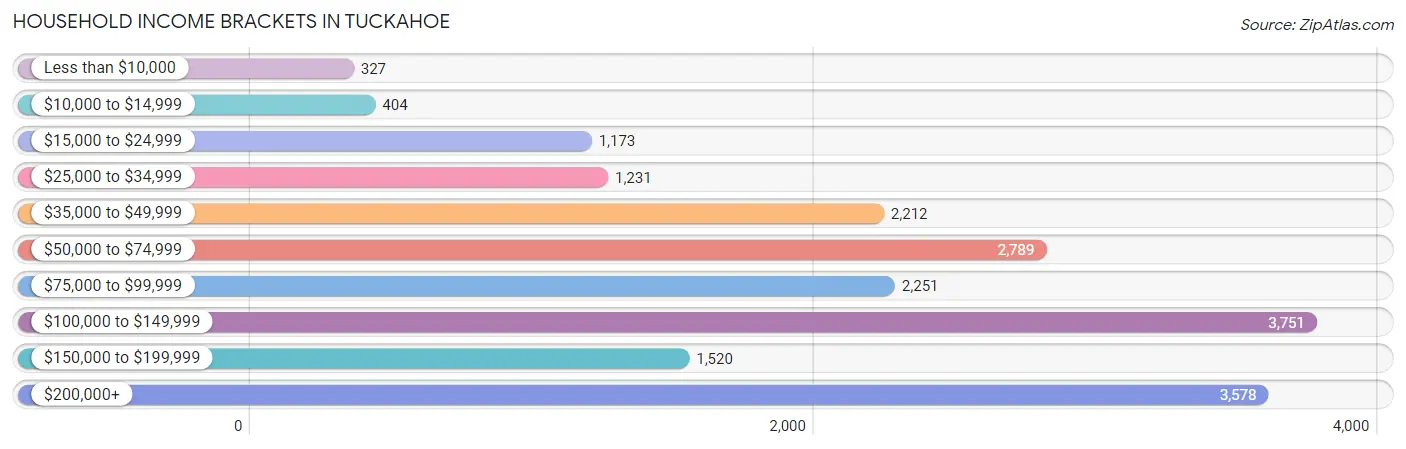
Household Income Brackets in Tuckahoe
With 3,751 households falling in the category, the $100,000 to $149,999 income range is the most frequent in Tuckahoe, accounting for 19.5% of all households. In contrast, only 327 households (1.7%) fall into the less than $10,000 income bracket, making it the least populous group.
| Income Bracket | # Households | % Households |
| Less than $10,000 | 327 | 1.7% |
| $10,000 to $14,999 | 404 | 2.1% |
| $15,000 to $24,999 | 1,173 | 6.1% |
| $25,000 to $34,999 | 1,231 | 6.4% |
| $35,000 to $49,999 | 2,212 | 11.5% |
| $50,000 to $74,999 | 2,789 | 14.5% |
| $75,000 to $99,999 | 2,251 | 11.7% |
| $100,000 to $149,999 | 3,751 | 19.5% |
| $150,000 to $199,999 | 1,520 | 7.9% |
| $200,000+ | 3,578 | 18.6% |
Household Income by Householder Age in Tuckahoe
The median household income in Tuckahoe is $89,920, with the highest median household income of $112,826 found in the 45 to 64 years age bracket for the primary householder. A total of 6,636 households (34.5%) fall into this category. Meanwhile, the 15 to 24 years age bracket for the primary householder has the lowest median household income of $45,556, with 424 households (2.2%) in this group.
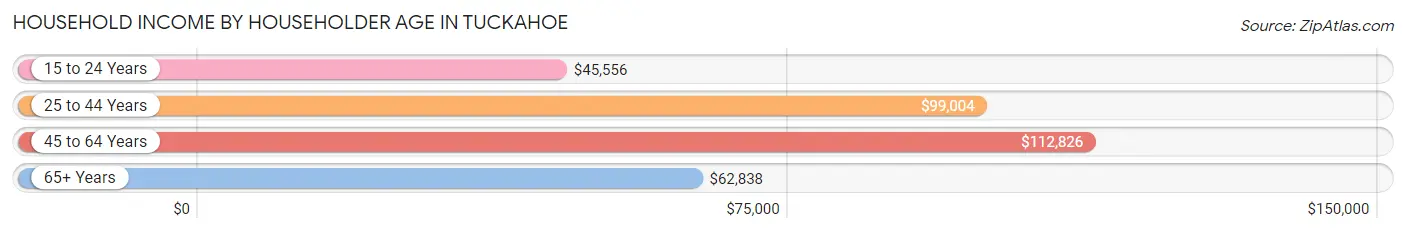
| Income Bracket | # Households | Median Income |
| 15 to 24 Years | 424 (2.2%) | $45,556 |
| 25 to 44 Years | 6,126 (31.9%) | $99,004 |
| 45 to 64 Years | 6,636 (34.5%) | $112,826 |
| 65+ Years | 6,050 (31.5%) | $62,838 |
| Total | 19,236 (100.0%) | $89,920 |
Poverty in Tuckahoe
Income Below Poverty by Sex and Age in Tuckahoe
With 7.0% poverty level for males and 6.9% for females among the residents of Tuckahoe, under 5 year old males and 15 year old females are the most vulnerable to poverty, with 162 males (12.9%) and 77 females (14.9%) in their respective age groups living below the poverty level.
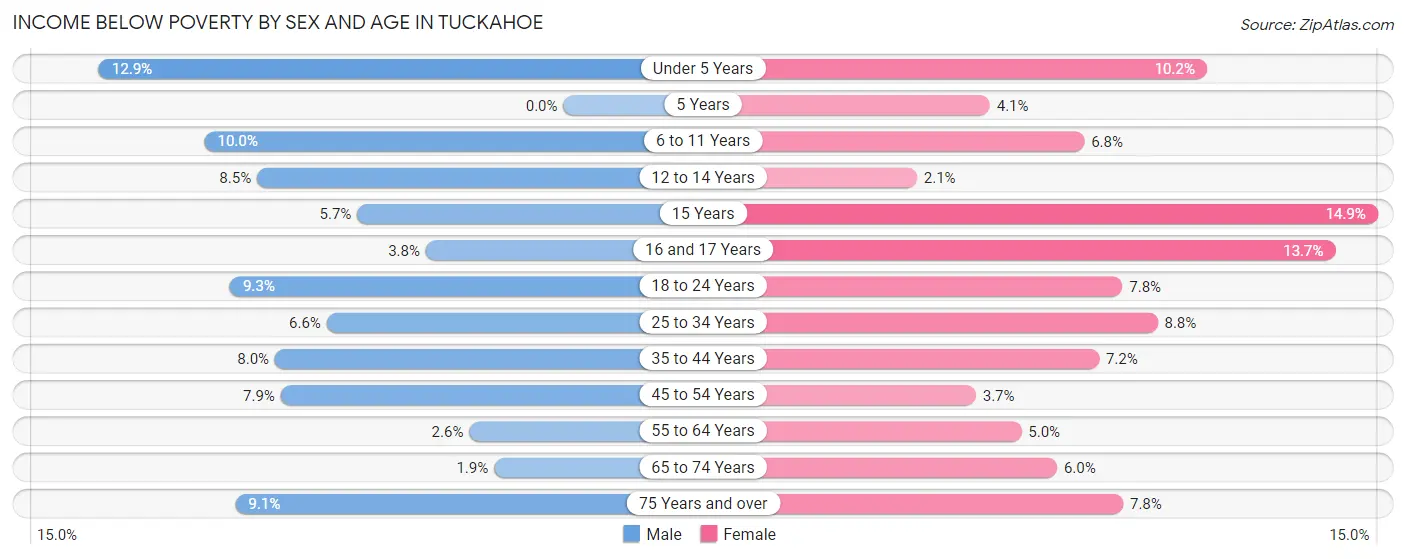
| Age Bracket | Male | Female |
| Under 5 Years | 162 (12.9%) | 214 (10.2%) |
| 5 Years | 0 (0.0%) | 14 (4.1%) |
| 6 to 11 Years | 149 (10.0%) | 109 (6.8%) |
| 12 to 14 Years | 94 (8.5%) | 20 (2.1%) |
| 15 Years | 22 (5.7%) | 77 (14.9%) |
| 16 and 17 Years | 28 (3.8%) | 82 (13.7%) |
| 18 to 24 Years | 187 (9.3%) | 138 (7.8%) |
| 25 to 34 Years | 223 (6.6%) | 235 (8.8%) |
| 35 to 44 Years | 225 (8.0%) | 214 (7.2%) |
| 45 to 54 Years | 241 (7.9%) | 121 (3.7%) |
| 55 to 64 Years | 66 (2.6%) | 150 (5.0%) |
| 65 to 74 Years | 36 (1.9%) | 163 (6.0%) |
| 75 Years and over | 136 (9.1%) | 217 (7.8%) |
| Total | 1,569 (7.0%) | 1,754 (6.9%) |
Income Above Poverty by Sex and Age in Tuckahoe
According to the poverty statistics in Tuckahoe, males aged 5 years and females aged 12 to 14 years are the age groups that are most secure financially, with 100.0% of males and 97.9% of females in these age groups living above the poverty line.
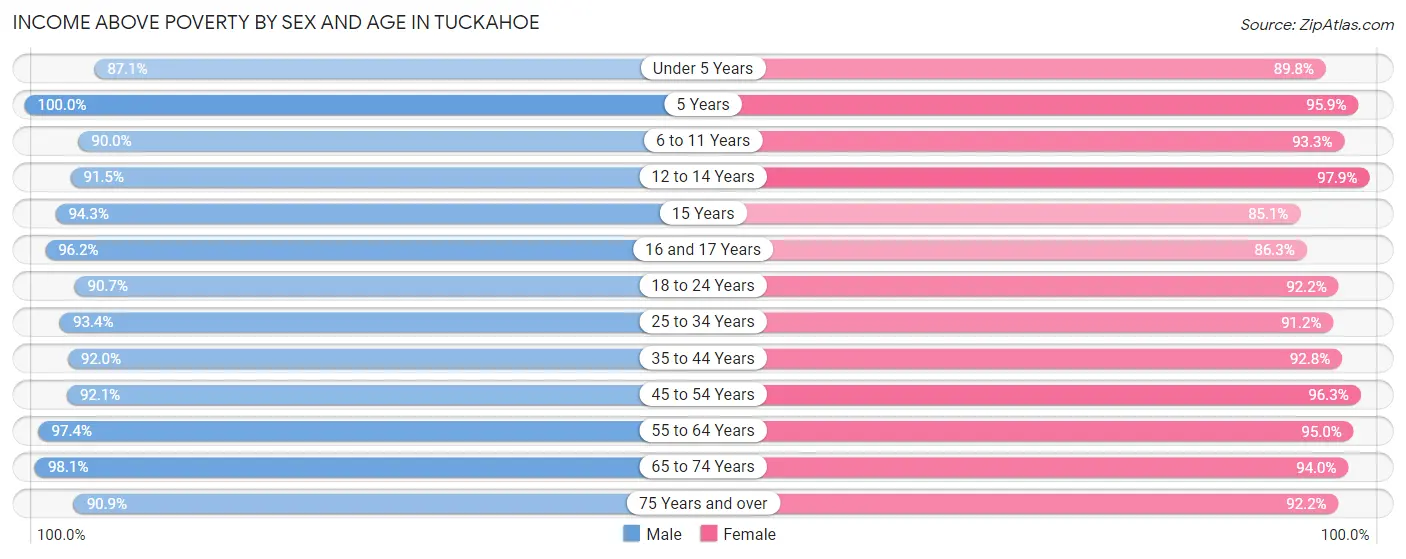
| Age Bracket | Male | Female |
| Under 5 Years | 1,091 (87.1%) | 1,892 (89.8%) |
| 5 Years | 276 (100.0%) | 326 (95.9%) |
| 6 to 11 Years | 1,342 (90.0%) | 1,506 (93.2%) |
| 12 to 14 Years | 1,008 (91.5%) | 935 (97.9%) |
| 15 Years | 361 (94.3%) | 439 (85.1%) |
| 16 and 17 Years | 703 (96.2%) | 515 (86.3%) |
| 18 to 24 Years | 1,829 (90.7%) | 1,630 (92.2%) |
| 25 to 34 Years | 3,159 (93.4%) | 2,440 (91.2%) |
| 35 to 44 Years | 2,577 (92.0%) | 2,773 (92.8%) |
| 45 to 54 Years | 2,822 (92.1%) | 3,122 (96.3%) |
| 55 to 64 Years | 2,457 (97.4%) | 2,851 (95.0%) |
| 65 to 74 Years | 1,833 (98.1%) | 2,556 (94.0%) |
| 75 Years and over | 1,353 (90.9%) | 2,556 (92.2%) |
| Total | 20,811 (93.0%) | 23,541 (93.1%) |
Income Below Poverty Among Married-Couple Families in Tuckahoe
The poverty statistics for married-couple families in Tuckahoe show that 2.7% or 243 of the total 9,109 families live below the poverty line. Families with 3 or 4 children have the highest poverty rate of 7.2%, comprising of 68 families. On the other hand, families with no children have the lowest poverty rate of 1.8%, which includes 87 families.
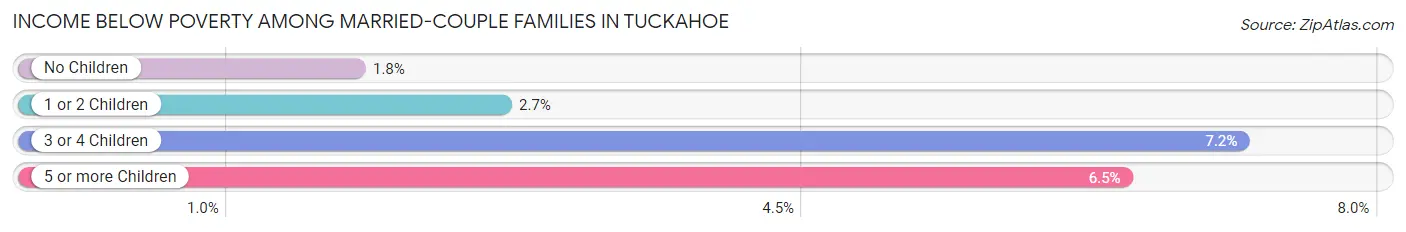
| Children | Above Poverty | Below Poverty |
| No Children | 4,814 (98.2%) | 87 (1.8%) |
| 1 or 2 Children | 3,141 (97.3%) | 86 (2.7%) |
| 3 or 4 Children | 882 (92.8%) | 68 (7.2%) |
| 5 or more Children | 29 (93.5%) | 2 (6.5%) |
| Total | 8,866 (97.3%) | 243 (2.7%) |
Income Below Poverty Among Single-Parent Households in Tuckahoe
According to the poverty data in Tuckahoe, 9.3% or 82 single-father households and 13.1% or 269 single-mother households are living below the poverty line. Among single-father households, those with no children have the highest poverty rate, with 56 households (18.2%) experiencing poverty. Likewise, among single-mother households, those with 3 or 4 children have the highest poverty rate, with 60 households (51.3%) falling below the poverty line.
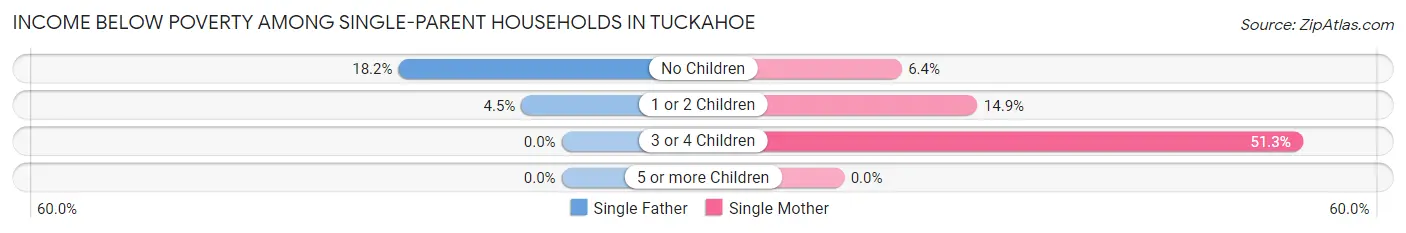
| Children | Single Father | Single Mother |
| No Children | 56 (18.2%) | 61 (6.4%) |
| 1 or 2 Children | 26 (4.5%) | 148 (14.9%) |
| 3 or 4 Children | 0 (0.0%) | 60 (51.3%) |
| 5 or more Children | 0 (0.0%) | 0 (0.0%) |
| Total | 82 (9.3%) | 269 (13.1%) |
Income Below Poverty Among Married-Couple vs Single-Parent Households in Tuckahoe
The poverty data for Tuckahoe shows that 243 of the married-couple family households (2.7%) and 351 of the single-parent households (11.9%) are living below the poverty level. Within the married-couple family households, those with 3 or 4 children have the highest poverty rate, with 68 households (7.2%) falling below the poverty line. Among the single-parent households, those with 3 or 4 children have the highest poverty rate, with 60 household (51.3%) living below poverty.
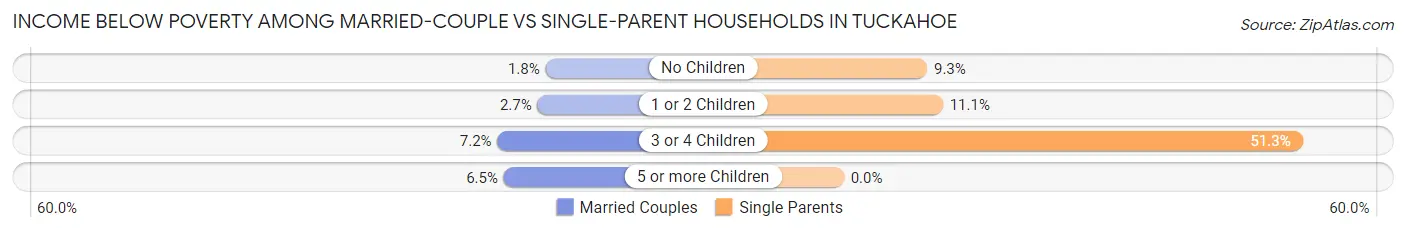
| Children | Married-Couple Families | Single-Parent Households |
| No Children | 87 (1.8%) | 117 (9.3%) |
| 1 or 2 Children | 86 (2.7%) | 174 (11.1%) |
| 3 or 4 Children | 68 (7.2%) | 60 (51.3%) |
| 5 or more Children | 2 (6.5%) | 0 (0.0%) |
| Total | 243 (2.7%) | 351 (11.9%) |
Race in Tuckahoe
The most populous races in Tuckahoe are White / Caucasian (36,316 | 75.6%), Black / African American (4,577 | 9.5%), and Two or more Races (3,026 | 6.3%).
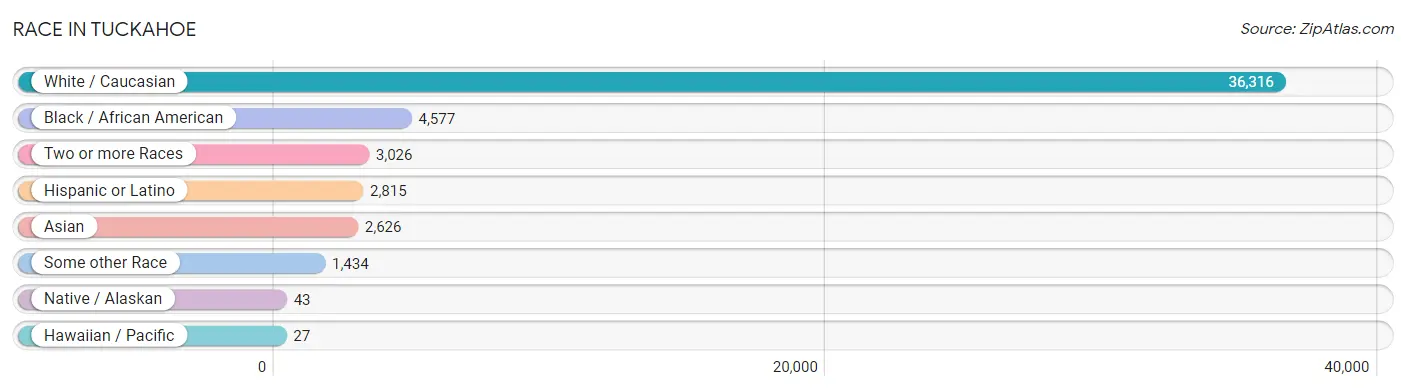
| Race | # Population | % Population |
| Asian | 2,626 | 5.5% |
| Black / African American | 4,577 | 9.5% |
| Hawaiian / Pacific | 27 | 0.1% |
| Hispanic or Latino | 2,815 | 5.9% |
| Native / Alaskan | 43 | 0.1% |
| White / Caucasian | 36,316 | 75.6% |
| Two or more Races | 3,026 | 6.3% |
| Some other Race | 1,434 | 3.0% |
| Total | 48,049 | 100.0% |
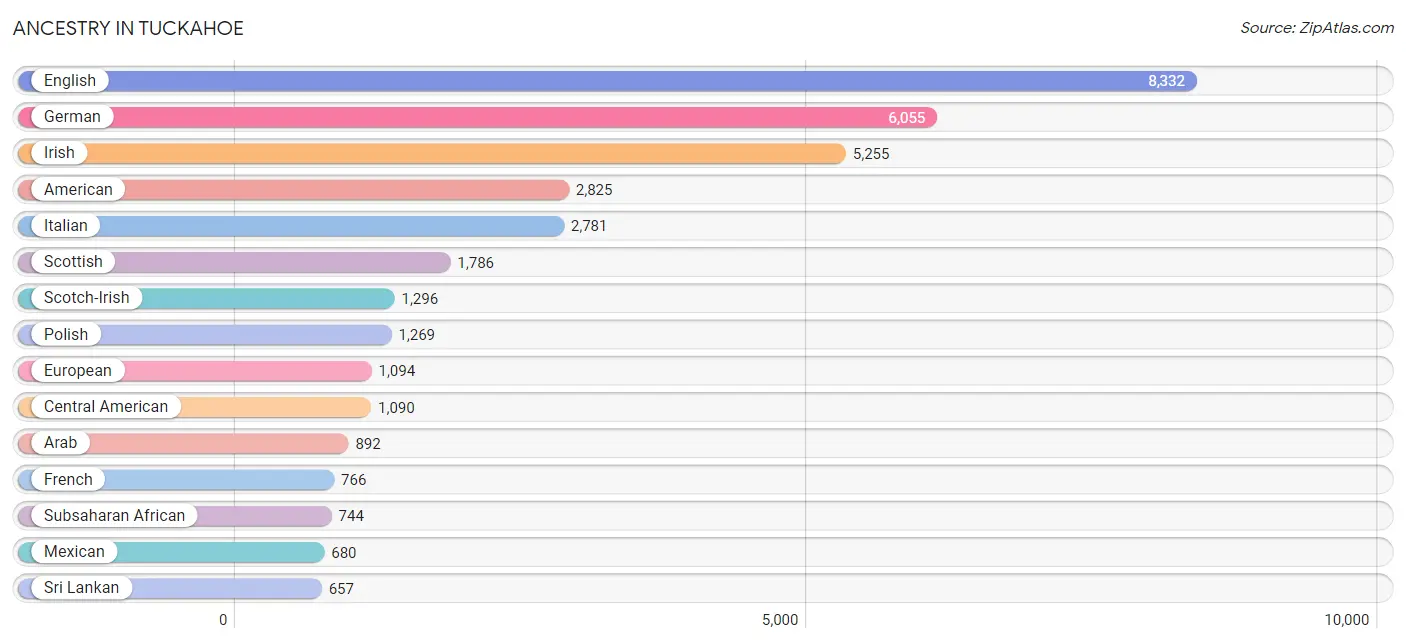
Ancestry in Tuckahoe
The most populous ancestries reported in Tuckahoe are English (8,332 | 17.3%), German (6,055 | 12.6%), Irish (5,255 | 10.9%), American (2,825 | 5.9%), and Italian (2,781 | 5.8%), together accounting for 52.5% of all Tuckahoe residents.
| Ancestry | # Population | % Population |
| Afghan | 245 | 0.5% |
| African | 309 | 0.6% |
| American | 2,825 | 5.9% |
| Arab | 892 | 1.9% |
| Argentinean | 112 | 0.2% |
| Armenian | 63 | 0.1% |
| Australian | 4 | 0.0% |
| Austrian | 79 | 0.2% |
| Barbadian | 19 | 0.0% |
| Bhutanese | 418 | 0.9% |
| Brazilian | 328 | 0.7% |
| British | 565 | 1.2% |
| Burmese | 324 | 0.7% |
| Cajun | 81 | 0.2% |
| Canadian | 214 | 0.4% |
| Celtic | 24 | 0.1% |
| Central American | 1,090 | 2.3% |
| Central American Indian | 24 | 0.1% |
| Cherokee | 52 | 0.1% |
| Choctaw | 51 | 0.1% |
| Colombian | 33 | 0.1% |
| Cuban | 197 | 0.4% |
| Czech | 131 | 0.3% |
| Czechoslovakian | 28 | 0.1% |
| Danish | 95 | 0.2% |
| Dominican | 22 | 0.1% |
| Dutch | 190 | 0.4% |
| Eastern European | 76 | 0.2% |
| Egyptian | 388 | 0.8% |
| English | 8,332 | 17.3% |
| Ethiopian | 110 | 0.2% |
| European | 1,094 | 2.3% |
| Filipino | 11 | 0.0% |
| Finnish | 5 | 0.0% |
| French | 766 | 1.6% |
| French Canadian | 159 | 0.3% |
| German | 6,055 | 12.6% |
| Greek | 185 | 0.4% |
| Guamanian / Chamorro | 57 | 0.1% |
| Guatemalan | 115 | 0.2% |
| Haitian | 15 | 0.0% |
| Honduran | 465 | 1.0% |
| Hungarian | 134 | 0.3% |
| Indian (Asian) | 261 | 0.5% |
| Indonesian | 79 | 0.2% |
| Iraqi | 150 | 0.3% |
| Irish | 5,255 | 10.9% |
| Israeli | 9 | 0.0% |
| Italian | 2,781 | 5.8% |
| Jamaican | 489 | 1.0% |
| Japanese | 138 | 0.3% |
| Kenyan | 24 | 0.1% |
| Korean | 392 | 0.8% |
| Laotian | 11 | 0.0% |
| Latvian | 44 | 0.1% |
| Lebanese | 201 | 0.4% |
| Liberian | 258 | 0.5% |
| Lithuanian | 65 | 0.1% |
| Mexican | 680 | 1.4% |
| Navajo | 7 | 0.0% |
| Nigerian | 14 | 0.0% |
| Northern European | 152 | 0.3% |
| Norwegian | 153 | 0.3% |
| Pakistani | 34 | 0.1% |
| Panamanian | 30 | 0.1% |
| Peruvian | 22 | 0.1% |
| Polish | 1,269 | 2.6% |
| Portuguese | 121 | 0.3% |
| Pueblo | 8 | 0.0% |
| Puerto Rican | 425 | 0.9% |
| Romanian | 57 | 0.1% |
| Russian | 239 | 0.5% |
| Salvadoran | 480 | 1.0% |
| Scandinavian | 211 | 0.4% |
| Scotch-Irish | 1,296 | 2.7% |
| Scottish | 1,786 | 3.7% |
| Serbian | 18 | 0.0% |
| Slavic | 9 | 0.0% |
| Slovak | 106 | 0.2% |
| Slovene | 14 | 0.0% |
| South African | 7 | 0.0% |
| South American | 210 | 0.4% |
| Soviet Union | 28 | 0.1% |
| Spaniard | 32 | 0.1% |
| Spanish | 20 | 0.0% |
| Sri Lankan | 657 | 1.4% |
| Subsaharan African | 744 | 1.5% |
| Swedish | 259 | 0.5% |
| Swiss | 112 | 0.2% |
| Thai | 628 | 1.3% |
| Trinidadian and Tobagonian | 45 | 0.1% |
| Turkish | 173 | 0.4% |
| Ukrainian | 105 | 0.2% |
| Venezuelan | 43 | 0.1% |
| Vietnamese | 5 | 0.0% |
| Welsh | 459 | 1.0% |
| Yugoslavian | 204 | 0.4% | View All 97 Rows |
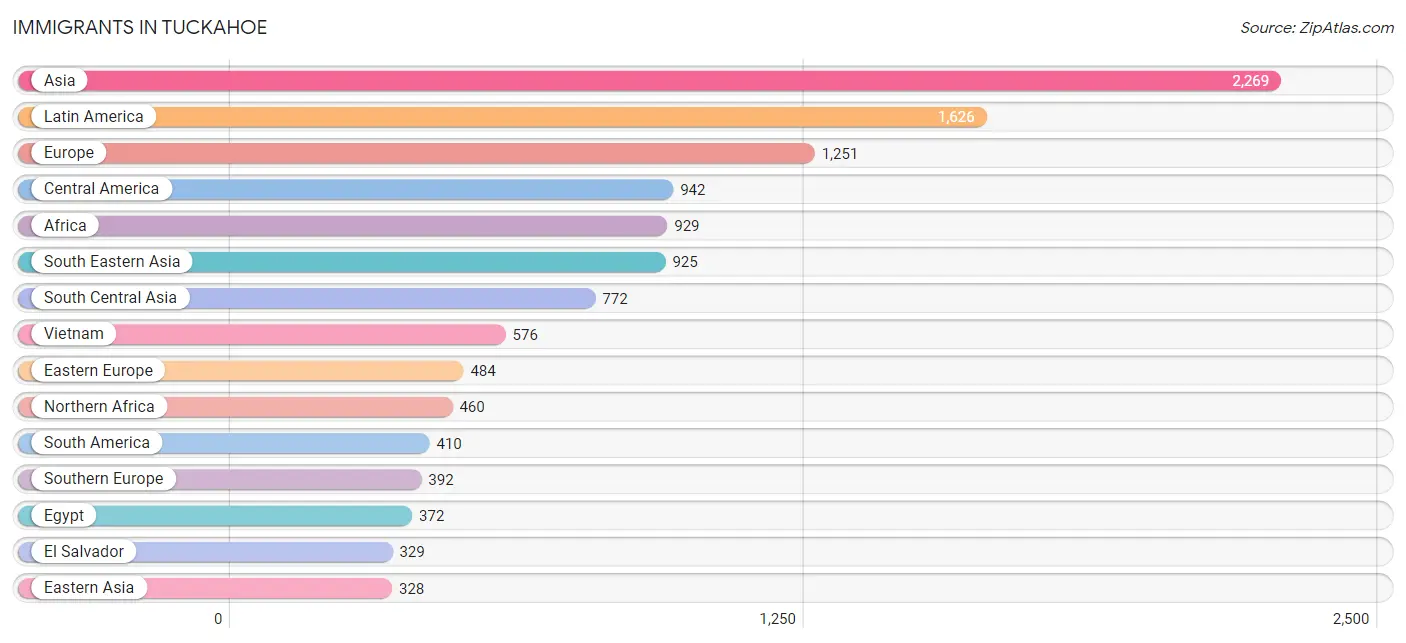
Immigrants in Tuckahoe
The most numerous immigrant groups reported in Tuckahoe came from Asia (2,269 | 4.7%), Latin America (1,626 | 3.4%), Europe (1,251 | 2.6%), Central America (942 | 2.0%), and Africa (929 | 1.9%), together accounting for 14.6% of all Tuckahoe residents.
| Immigration Origin | # Population | % Population |
| Afghanistan | 313 | 0.6% |
| Africa | 929 | 1.9% |
| Argentina | 64 | 0.1% |
| Asia | 2,269 | 4.7% |
| Austria | 16 | 0.0% |
| Bangladesh | 5 | 0.0% |
| Barbados | 19 | 0.0% |
| Belarus | 9 | 0.0% |
| Bosnia and Herzegovina | 152 | 0.3% |
| Brazil | 266 | 0.5% |
| Cambodia | 63 | 0.1% |
| Canada | 135 | 0.3% |
| Caribbean | 274 | 0.6% |
| Central America | 942 | 2.0% |
| China | 241 | 0.5% |
| Colombia | 18 | 0.0% |
| Congo | 41 | 0.1% |
| Cuba | 11 | 0.0% |
| Czechoslovakia | 60 | 0.1% |
| Dominican Republic | 22 | 0.1% |
| Eastern Africa | 102 | 0.2% |
| Eastern Asia | 328 | 0.7% |
| Eastern Europe | 484 | 1.0% |
| Egypt | 372 | 0.8% |
| El Salvador | 329 | 0.7% |
| England | 69 | 0.1% |
| Ethiopia | 42 | 0.1% |
| Europe | 1,251 | 2.6% |
| France | 16 | 0.0% |
| Germany | 107 | 0.2% |
| Greece | 99 | 0.2% |
| Guatemala | 83 | 0.2% |
| Haiti | 15 | 0.0% |
| Honduras | 256 | 0.5% |
| Hong Kong | 6 | 0.0% |
| India | 171 | 0.4% |
| Indonesia | 11 | 0.0% |
| Iran | 27 | 0.1% |
| Iraq | 113 | 0.2% |
| Ireland | 103 | 0.2% |
| Italy | 266 | 0.5% |
| Jamaica | 184 | 0.4% |
| Japan | 15 | 0.0% |
| Jordan | 29 | 0.1% |
| Kenya | 28 | 0.1% |
| Korea | 72 | 0.2% |
| Latin America | 1,626 | 3.4% |
| Latvia | 14 | 0.0% |
| Lebanon | 43 | 0.1% |
| Liberia | 258 | 0.5% |
| Malaysia | 26 | 0.1% |
| Mexico | 274 | 0.6% |
| Middle Africa | 41 | 0.1% |
| Moldova | 23 | 0.1% |
| Nepal | 23 | 0.1% |
| Northern Africa | 460 | 1.0% |
| Northern Europe | 236 | 0.5% |
| Oceania | 4 | 0.0% |
| Pakistan | 83 | 0.2% |
| Peru | 7 | 0.0% |
| Philippines | 184 | 0.4% |
| Poland | 39 | 0.1% |
| Portugal | 27 | 0.1% |
| Romania | 10 | 0.0% |
| Russia | 142 | 0.3% |
| Saudi Arabia | 27 | 0.1% |
| Sierra Leone | 15 | 0.0% |
| South Africa | 31 | 0.1% |
| South America | 410 | 0.9% |
| South Central Asia | 772 | 1.6% |
| South Eastern Asia | 925 | 1.9% |
| Southern Europe | 392 | 0.8% |
| Sudan | 88 | 0.2% |
| Taiwan | 11 | 0.0% |
| Thailand | 34 | 0.1% |
| Trinidad and Tobago | 23 | 0.1% |
| Ukraine | 35 | 0.1% |
| Uzbekistan | 61 | 0.1% |
| Venezuela | 55 | 0.1% |
| Vietnam | 576 | 1.2% |
| Western Africa | 273 | 0.6% |
| Western Asia | 244 | 0.5% |
| Western Europe | 139 | 0.3% | View All 83 Rows |
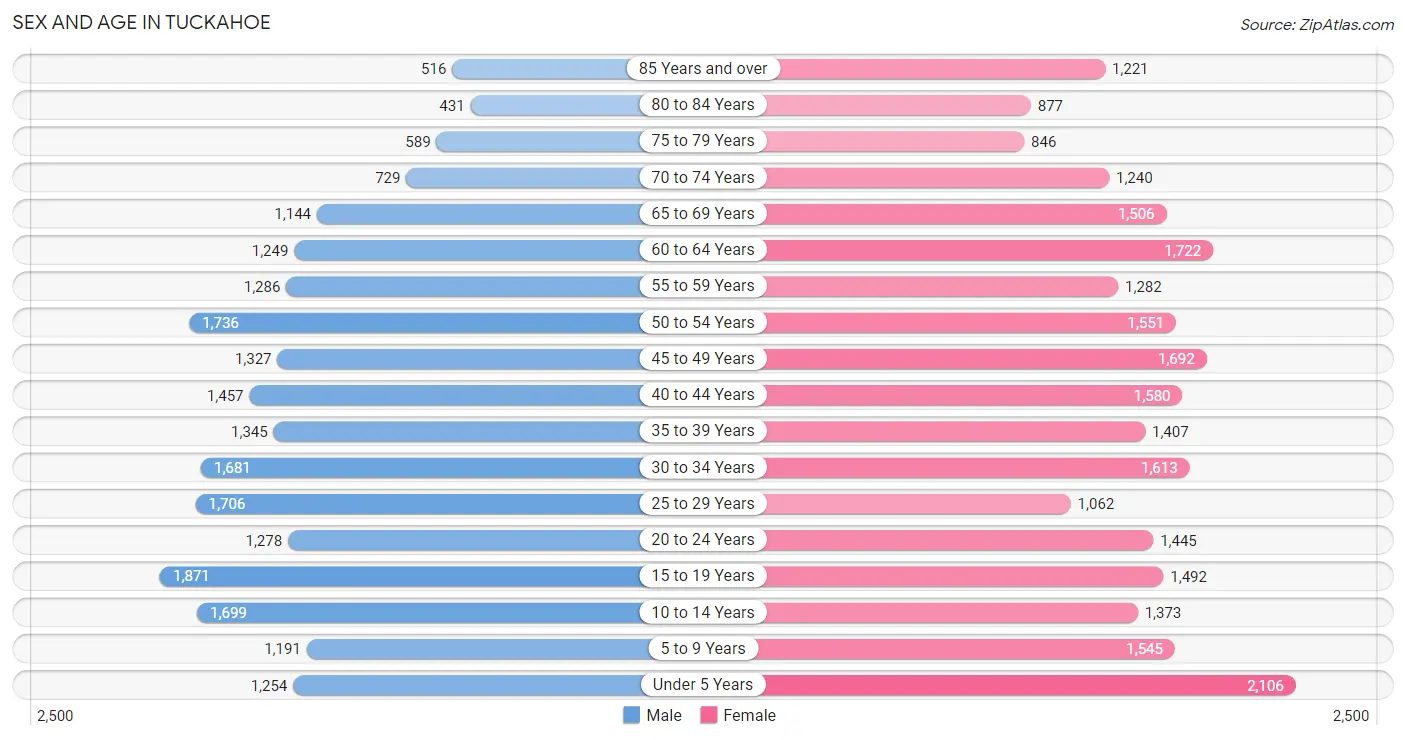
Sex and Age in Tuckahoe
Sex and Age in Tuckahoe
The most populous age groups in Tuckahoe are 15 to 19 Years (1,871 | 8.3%) for men and Under 5 Years (2,106 | 8.2%) for women.
| Age Bracket | Male | Female |
| Under 5 Years | 1,254 (5.6%) | 2,106 (8.2%) |
| 5 to 9 Years | 1,191 (5.3%) | 1,545 (6.0%) |
| 10 to 14 Years | 1,699 (7.5%) | 1,373 (5.4%) |
| 15 to 19 Years | 1,871 (8.3%) | 1,492 (5.8%) |
| 20 to 24 Years | 1,278 (5.7%) | 1,445 (5.7%) |
| 25 to 29 Years | 1,706 (7.6%) | 1,062 (4.2%) |
| 30 to 34 Years | 1,681 (7.5%) | 1,613 (6.3%) |
| 35 to 39 Years | 1,345 (6.0%) | 1,407 (5.5%) |
| 40 to 44 Years | 1,457 (6.5%) | 1,580 (6.2%) |
| 45 to 49 Years | 1,327 (5.9%) | 1,692 (6.6%) |
| 50 to 54 Years | 1,736 (7.7%) | 1,551 (6.1%) |
| 55 to 59 Years | 1,286 (5.7%) | 1,282 (5.0%) |
| 60 to 64 Years | 1,249 (5.6%) | 1,722 (6.7%) |
| 65 to 69 Years | 1,144 (5.1%) | 1,506 (5.9%) |
| 70 to 74 Years | 729 (3.2%) | 1,240 (4.9%) |
| 75 to 79 Years | 589 (2.6%) | 846 (3.3%) |
| 80 to 84 Years | 431 (1.9%) | 877 (3.4%) |
| 85 Years and over | 516 (2.3%) | 1,221 (4.8%) |
| Total | 22,489 (100.0%) | 25,560 (100.0%) |
Families and Households in Tuckahoe
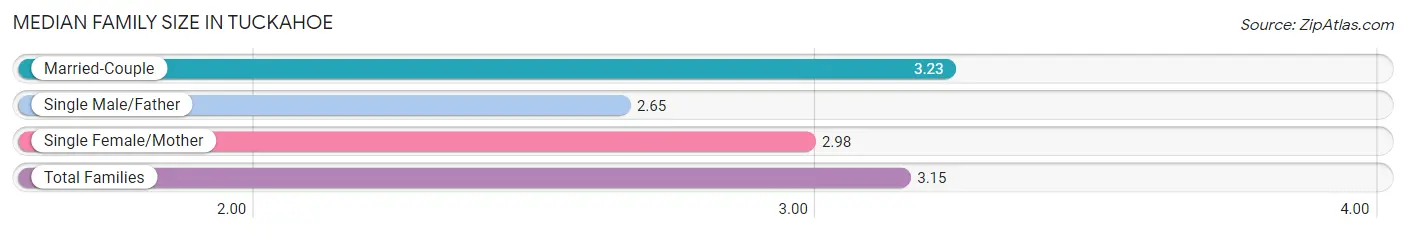
Median Family Size in Tuckahoe
The median family size in Tuckahoe is 3.15 persons per family, with married-couple families (9,109 | 75.6%) accounting for the largest median family size of 3.23 persons per family. On the other hand, single male/father families (885 | 7.3%) represent the smallest median family size with 2.65 persons per family.
| Family Type | # Families | Family Size |
| Married-Couple | 9,109 (75.6%) | 3.23 |
| Single Male/Father | 885 (7.3%) | 2.65 |
| Single Female/Mother | 2,060 (17.1%) | 2.98 |
| Total Families | 12,054 (100.0%) | 3.15 |
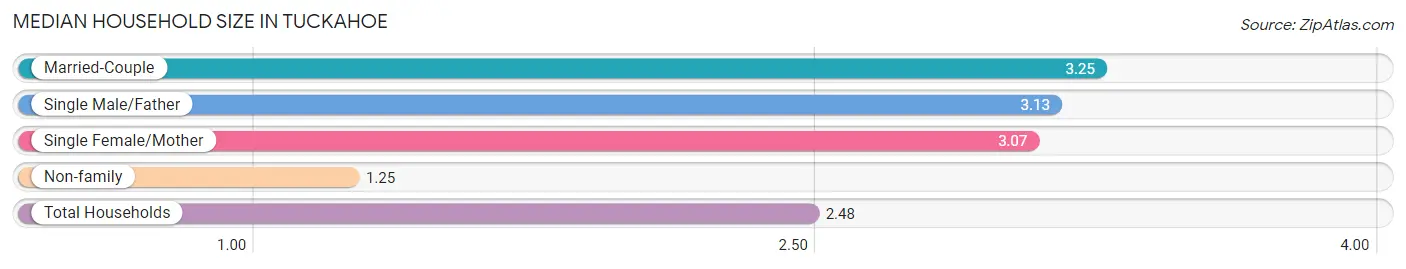
Median Household Size in Tuckahoe
The median household size in Tuckahoe is 2.48 persons per household, with married-couple households (9,109 | 47.3%) accounting for the largest median household size of 3.25 persons per household. non-family households (7,182 | 37.3%) represent the smallest median household size with 1.25 persons per household.
| Household Type | # Households | Household Size |
| Married-Couple | 9,109 (47.3%) | 3.25 |
| Single Male/Father | 885 (4.6%) | 3.13 |
| Single Female/Mother | 2,060 (10.7%) | 3.07 |
| Non-family | 7,182 (37.3%) | 1.25 |
| Total Households | 19,236 (100.0%) | 2.48 |
Household Size by Marriage Status in Tuckahoe
Out of a total of 19,236 households in Tuckahoe, 12,054 (62.7%) are family households, while 7,182 (37.3%) are nonfamily households. The most numerous type of family households are 2-person households, comprising 5,424, and the most common type of nonfamily households are 1-person households, comprising 5,805.
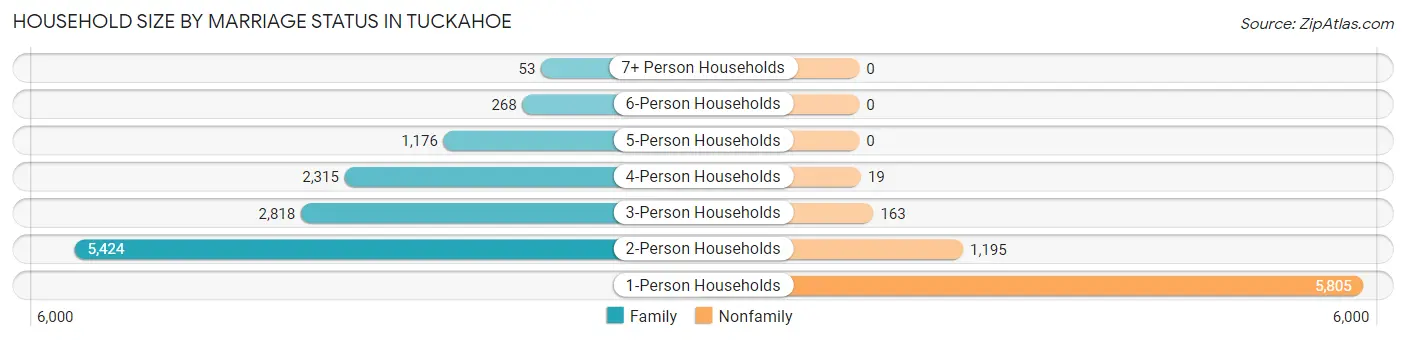
| Household Size | Family Households | Nonfamily Households |
| 1-Person Households | - | 5,805 (30.2%) |
| 2-Person Households | 5,424 (28.2%) | 1,195 (6.2%) |
| 3-Person Households | 2,818 (14.6%) | 163 (0.9%) |
| 4-Person Households | 2,315 (12.0%) | 19 (0.1%) |
| 5-Person Households | 1,176 (6.1%) | 0 (0.0%) |
| 6-Person Households | 268 (1.4%) | 0 (0.0%) |
| 7+ Person Households | 53 (0.3%) | 0 (0.0%) |
| Total | 12,054 (62.7%) | 7,182 (37.3%) |
Female Fertility in Tuckahoe
Fertility by Age in Tuckahoe
Average fertility rate in Tuckahoe is 28.0 births per 1,000 women. Women in the age bracket of 20 to 34 years have the highest fertility rate with 45.0 births per 1,000 women. Women in the age bracket of 20 to 34 years acount for 63.5% of all women with births.
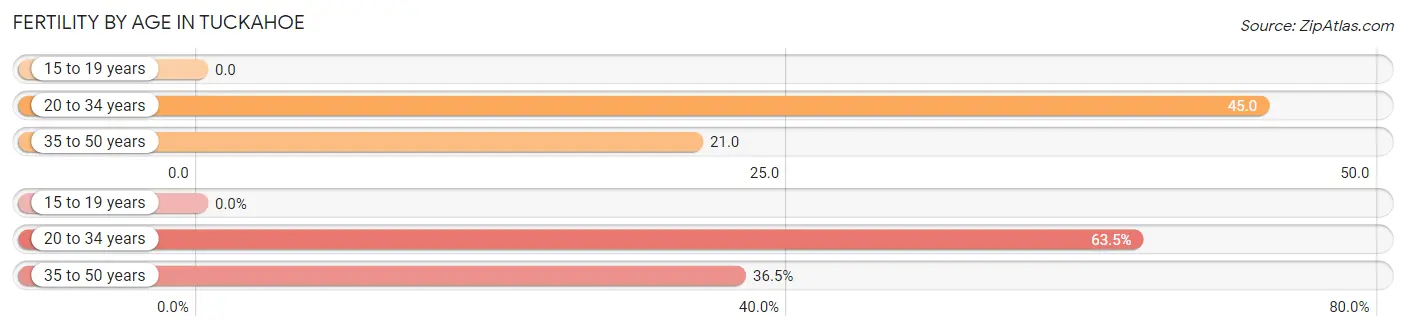
| Age Bracket | Women with Births | Births / 1,000 Women |
| 15 to 19 years | 0 (0.0%) | 0.0 |
| 20 to 34 years | 186 (63.5%) | 45.0 |
| 35 to 50 years | 107 (36.5%) | 21.0 |
| Total | 293 (100.0%) | 28.0 |
Fertility by Age by Marriage Status in Tuckahoe
78.2% of women with births (293) in Tuckahoe are married. The highest percentage of unmarried women with births falls into 20 to 34 years age bracket with 34.4% of them unmarried at the time of birth, while the lowest percentage of unmarried women with births belong to 35 to 50 years age bracket with 0.0% of them unmarried.
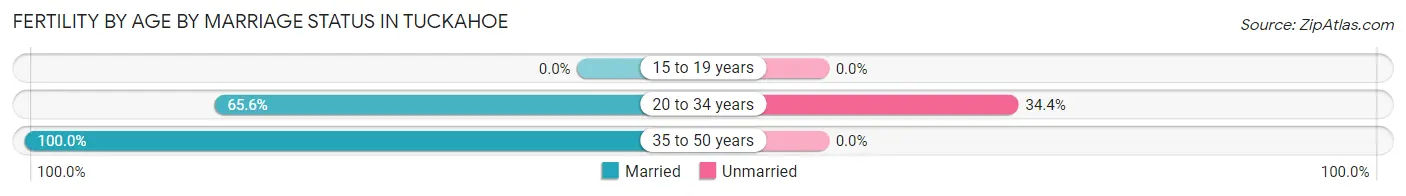
| Age Bracket | Married | Unmarried |
| 15 to 19 years | 0 (0.0%) | 0 (0.0%) |
| 20 to 34 years | 122 (65.6%) | 64 (34.4%) |
| 35 to 50 years | 107 (100.0%) | 0 (0.0%) |
| Total | 229 (78.2%) | 64 (21.8%) |
Fertility by Education in Tuckahoe
Average fertility rate in Tuckahoe is 28.0 births per 1,000 women. Women with the education attainment of bachelor's degree have the highest fertility rate of 39.0 births per 1,000 women, while women with the education attainment of college or associate's degree have the lowest fertility at 9.0 births per 1,000 women. Women with the education attainment of bachelor's degree represent 46.8% of all women with births.
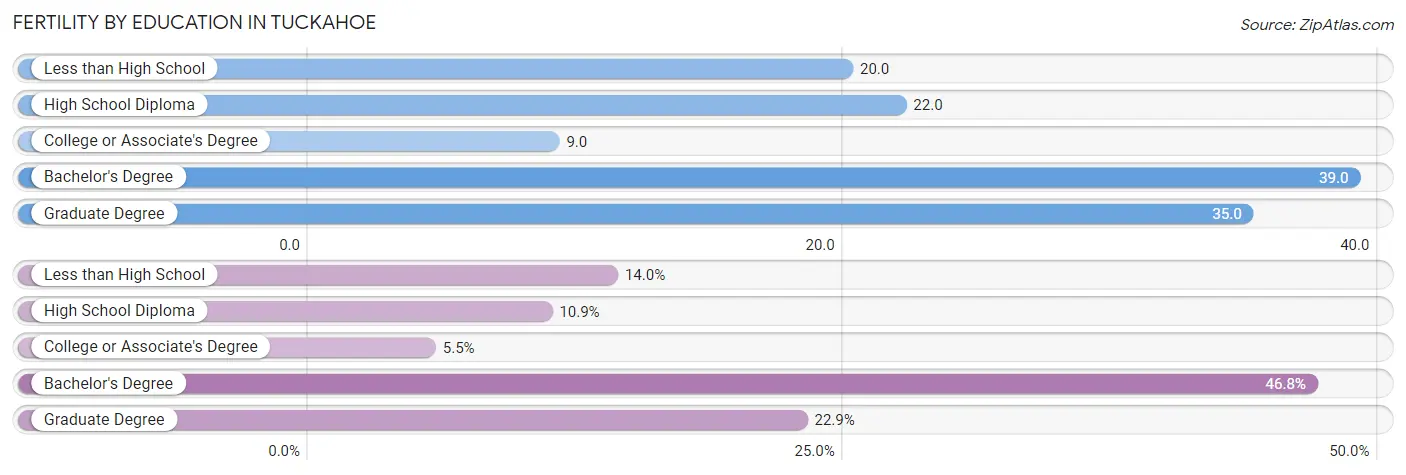
| Educational Attainment | Women with Births | Births / 1,000 Women |
| Less than High School | 41 (14.0%) | 20.0 |
| High School Diploma | 32 (10.9%) | 22.0 |
| College or Associate's Degree | 16 (5.5%) | 9.0 |
| Bachelor's Degree | 137 (46.8%) | 39.0 |
| Graduate Degree | 67 (22.9%) | 35.0 |
| Total | 293 (100.0%) | 28.0 |
Fertility by Education by Marriage Status in Tuckahoe
21.8% of women with births in Tuckahoe are unmarried. Women with the educational attainment of college or associate's degree are most likely to be married with 100.0% of them married at childbirth, while women with the educational attainment of less than high school are least likely to be married with 46.3% of them unmarried at childbirth.
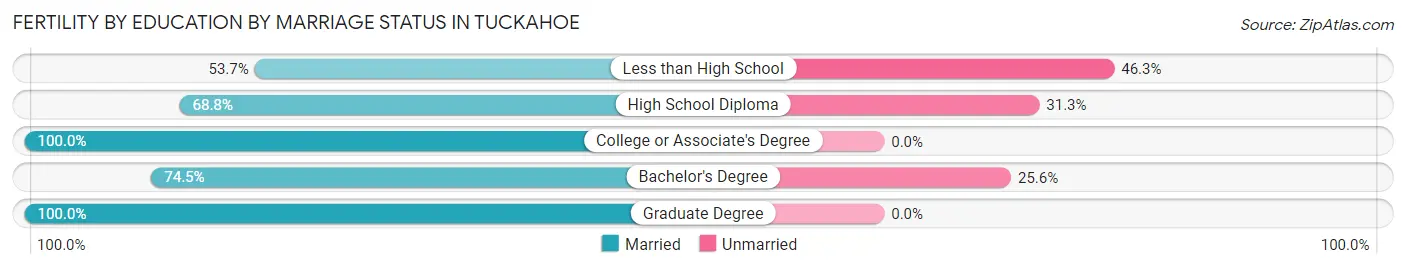
| Educational Attainment | Married | Unmarried |
| Less than High School | 22 (53.7%) | 19 (46.3%) |
| High School Diploma | 22 (68.8%) | 10 (31.2%) |
| College or Associate's Degree | 16 (100.0%) | 0 (0.0%) |
| Bachelor's Degree | 102 (74.5%) | 35 (25.6%) |
| Graduate Degree | 67 (100.0%) | 0 (0.0%) |
| Total | 229 (78.2%) | 64 (21.8%) |
Employment Characteristics in Tuckahoe
Employment by Class of Employer in Tuckahoe
Among the 23,313 employed individuals in Tuckahoe, private company employees (15,097 | 64.8%), not-for-profit organizations (2,289 | 9.8%), and local government employees (1,633 | 7.0%) make up the most common classes of employment.
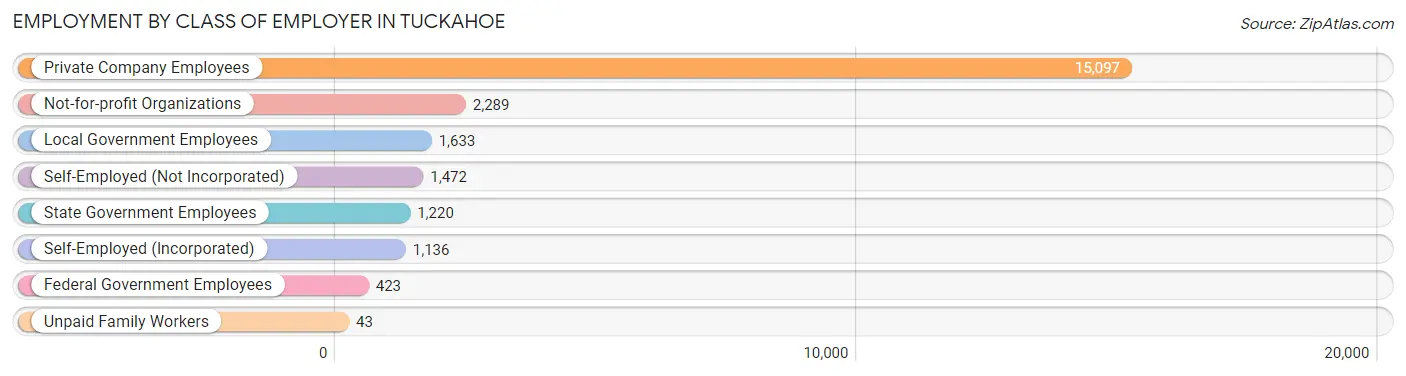
| Employer Class | # Employees | % Employees |
| Private Company Employees | 15,097 | 64.8% |
| Self-Employed (Incorporated) | 1,136 | 4.9% |
| Self-Employed (Not Incorporated) | 1,472 | 6.3% |
| Not-for-profit Organizations | 2,289 | 9.8% |
| Local Government Employees | 1,633 | 7.0% |
| State Government Employees | 1,220 | 5.2% |
| Federal Government Employees | 423 | 1.8% |
| Unpaid Family Workers | 43 | 0.2% |
| Total | 23,313 | 100.0% |
Employment Status by Age in Tuckahoe
According to the labor force statistics for Tuckahoe, out of the total population over 16 years of age (37,981), 65.7% or 24,954 individuals are in the labor force, with 4.5% or 1,123 of them unemployed. The age group with the highest labor force participation rate is 30 to 34 years, with 91.0% or 2,998 individuals in the labor force. Within the labor force, the 20 to 24 years age range has the highest percentage of unemployed individuals, with 8.4% or 172 of them being unemployed.
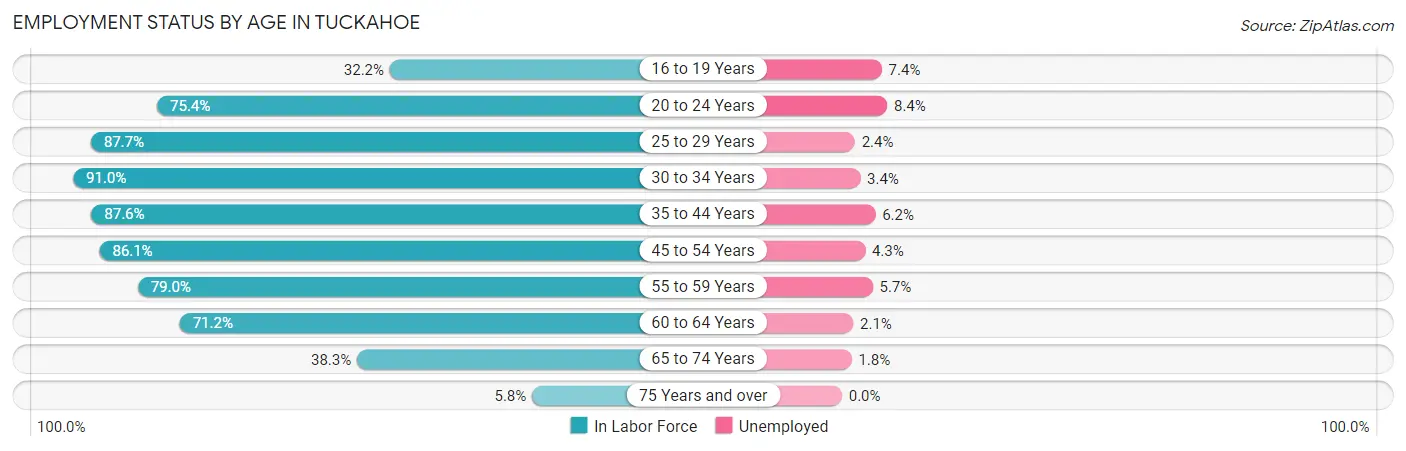
| Age Bracket | In Labor Force | Unemployed |
| 16 to 19 Years | 793 (32.2%) | 59 (7.4%) |
| 20 to 24 Years | 2,053 (75.4%) | 172 (8.4%) |
| 25 to 29 Years | 2,428 (87.7%) | 58 (2.4%) |
| 30 to 34 Years | 2,998 (91.0%) | 102 (3.4%) |
| 35 to 44 Years | 5,071 (87.6%) | 314 (6.2%) |
| 45 to 54 Years | 5,429 (86.1%) | 233 (4.3%) |
| 55 to 59 Years | 2,029 (79.0%) | 116 (5.7%) |
| 60 to 64 Years | 2,115 (71.2%) | 44 (2.1%) |
| 65 to 74 Years | 1,769 (38.3%) | 32 (1.8%) |
| 75 Years and over | 260 (5.8%) | 0 (0.0%) |
| Total | 24,954 (65.7%) | 1,123 (4.5%) |
Employment Status by Educational Attainment in Tuckahoe
According to labor force statistics for Tuckahoe, 84.7% of individuals (20,071) out of the total population between 25 and 64 years of age (23,696) are in the labor force, with 4.3% or 863 of them being unemployed. The group with the highest labor force participation rate are those with the educational attainment of bachelor's degree or higher, with 87.5% or 12,300 individuals in the labor force. Within the labor force, individuals with less than high school education have the highest percentage of unemployment, with 5.7% or 67 of them being unemployed.
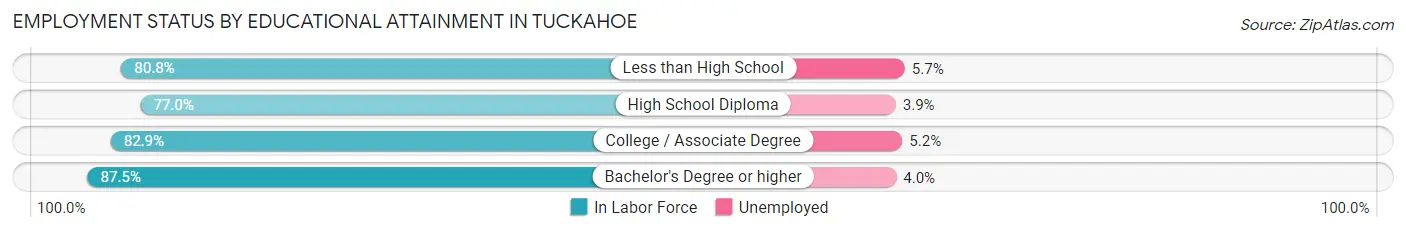
| Educational Attainment | In Labor Force | Unemployed |
| Less than High School | 1,172 (80.8%) | 83 (5.7%) |
| High School Diploma | 2,559 (77.0%) | 130 (3.9%) |
| College / Associate Degree | 4,033 (82.9%) | 253 (5.2%) |
| Bachelor's Degree or higher | 12,300 (87.5%) | 562 (4.0%) |
| Total | 20,071 (84.7%) | 1,019 (4.3%) |
Employment Occupations by Sex in Tuckahoe
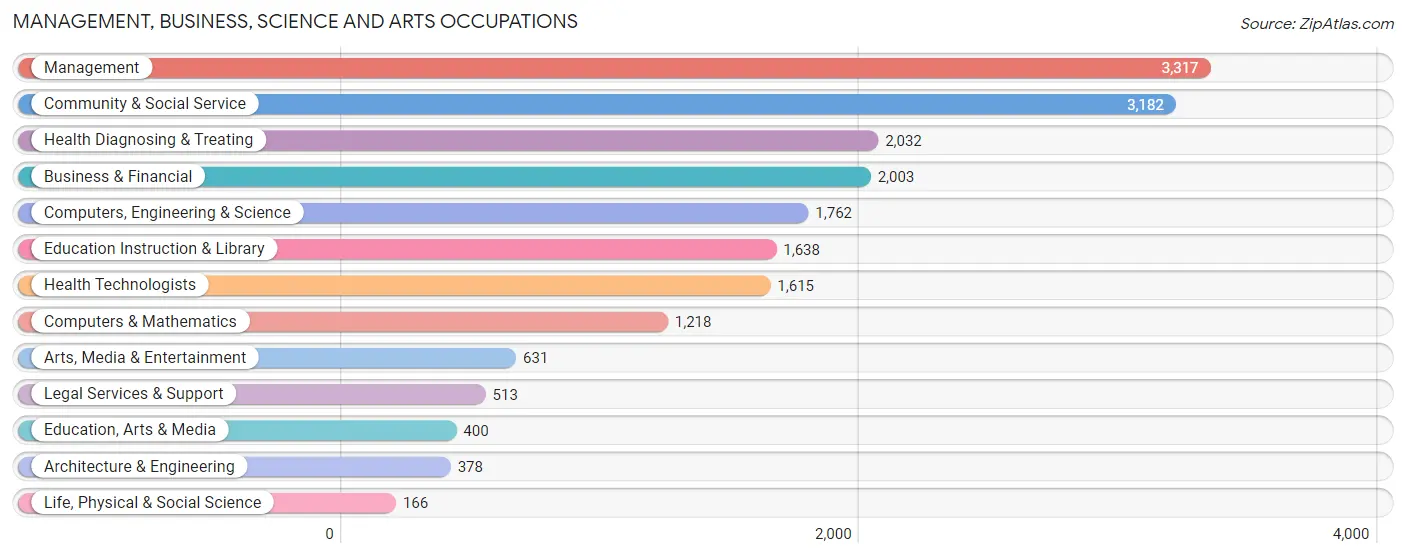
Management, Business, Science and Arts Occupations
The most common Management, Business, Science and Arts occupations in Tuckahoe are Management (3,317 | 13.9%), Community & Social Service (3,182 | 13.4%), Health Diagnosing & Treating (2,032 | 8.5%), Business & Financial (2,003 | 8.4%), and Computers, Engineering & Science (1,762 | 7.4%).
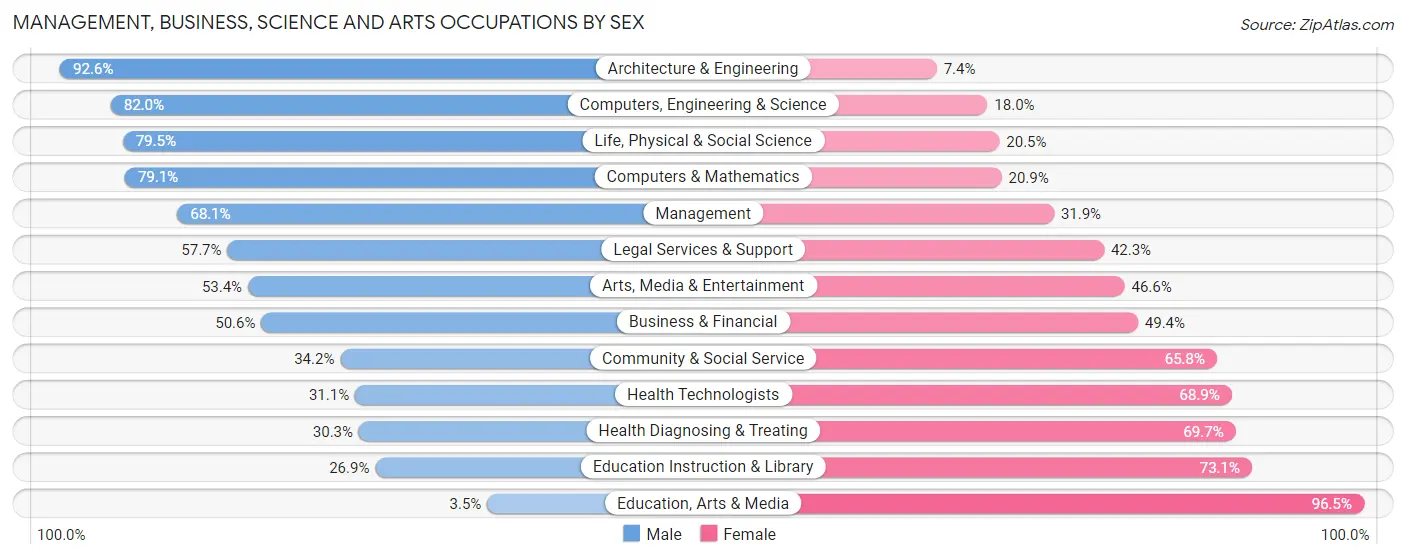
Management, Business, Science and Arts Occupations by Sex
Within the Management, Business, Science and Arts occupations in Tuckahoe, the most male-oriented occupations are Architecture & Engineering (92.6%), Computers, Engineering & Science (82.0%), and Life, Physical & Social Science (79.5%), while the most female-oriented occupations are Education, Arts & Media (96.5%), Education Instruction & Library (73.1%), and Health Diagnosing & Treating (69.7%).
| Occupation | Male | Female |
| Management | 2,260 (68.1%) | 1,057 (31.9%) |
| Business & Financial | 1,014 (50.6%) | 989 (49.4%) |
| Computers, Engineering & Science | 1,445 (82.0%) | 317 (18.0%) |
| Computers & Mathematics | 963 (79.1%) | 255 (20.9%) |
| Architecture & Engineering | 350 (92.6%) | 28 (7.4%) |
| Life, Physical & Social Science | 132 (79.5%) | 34 (20.5%) |
| Community & Social Service | 1,087 (34.2%) | 2,095 (65.8%) |
| Education, Arts & Media | 14 (3.5%) | 386 (96.5%) |
| Legal Services & Support | 296 (57.7%) | 217 (42.3%) |
| Education Instruction & Library | 440 (26.9%) | 1,198 (73.1%) |
| Arts, Media & Entertainment | 337 (53.4%) | 294 (46.6%) |
| Health Diagnosing & Treating | 615 (30.3%) | 1,417 (69.7%) |
| Health Technologists | 502 (31.1%) | 1,113 (68.9%) |
| Total (Category) | 6,421 (52.2%) | 5,875 (47.8%) |
| Total (Overall) | 12,493 (52.5%) | 11,304 (47.5%) |
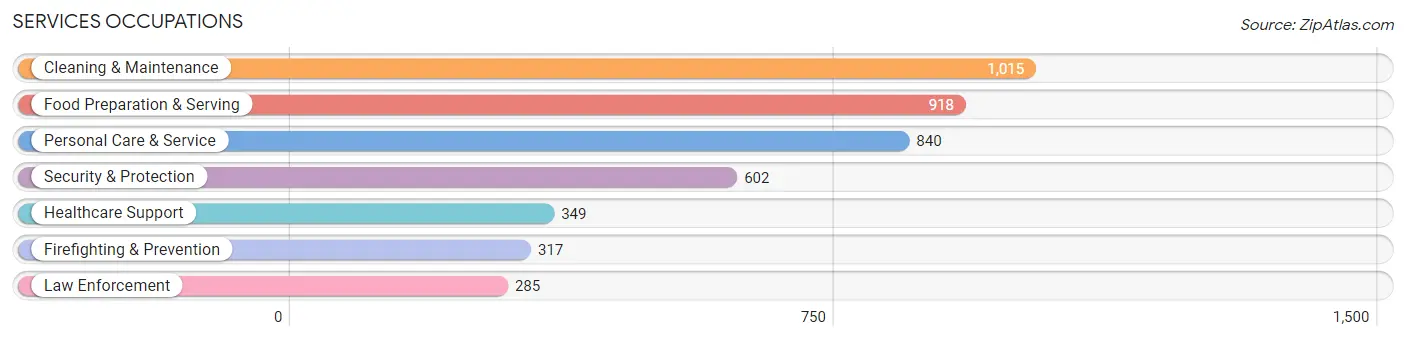
Services Occupations
The most common Services occupations in Tuckahoe are Cleaning & Maintenance (1,015 | 4.3%), Food Preparation & Serving (918 | 3.9%), Personal Care & Service (840 | 3.5%), Security & Protection (602 | 2.5%), and Healthcare Support (349 | 1.5%).
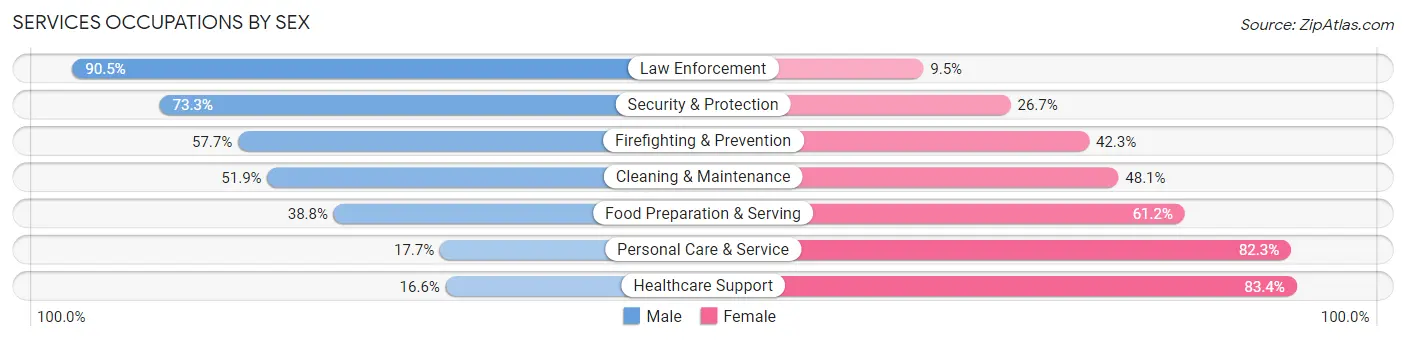
Services Occupations by Sex
Within the Services occupations in Tuckahoe, the most male-oriented occupations are Law Enforcement (90.5%), Security & Protection (73.3%), and Firefighting & Prevention (57.7%), while the most female-oriented occupations are Healthcare Support (83.4%), Personal Care & Service (82.3%), and Food Preparation & Serving (61.2%).
| Occupation | Male | Female |
| Healthcare Support | 58 (16.6%) | 291 (83.4%) |
| Security & Protection | 441 (73.3%) | 161 (26.7%) |
| Firefighting & Prevention | 183 (57.7%) | 134 (42.3%) |
| Law Enforcement | 258 (90.5%) | 27 (9.5%) |
| Food Preparation & Serving | 356 (38.8%) | 562 (61.2%) |
| Cleaning & Maintenance | 527 (51.9%) | 488 (48.1%) |
| Personal Care & Service | 149 (17.7%) | 691 (82.3%) |
| Total (Category) | 1,531 (41.1%) | 2,193 (58.9%) |
| Total (Overall) | 12,493 (52.5%) | 11,304 (47.5%) |
Sales and Office Occupations
The most common Sales and Office occupations in Tuckahoe are Sales & Related (2,545 | 10.7%), and Office & Administration (2,357 | 9.9%).

Sales and Office Occupations by Sex
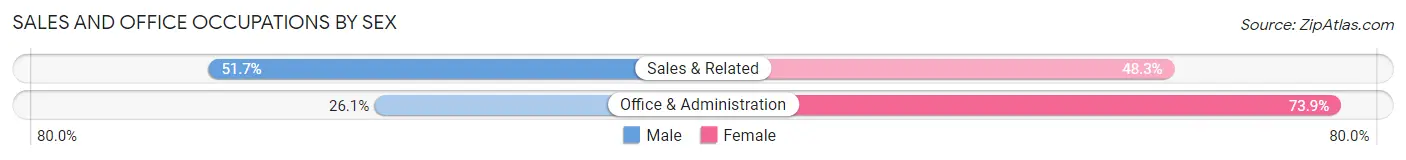
| Occupation | Male | Female |
| Sales & Related | 1,316 (51.7%) | 1,229 (48.3%) |
| Office & Administration | 615 (26.1%) | 1,742 (73.9%) |
| Total (Category) | 1,931 (39.4%) | 2,971 (60.6%) |
| Total (Overall) | 12,493 (52.5%) | 11,304 (47.5%) |
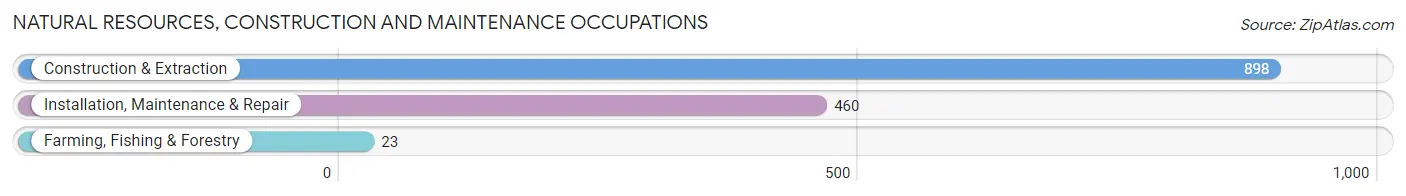
Natural Resources, Construction and Maintenance Occupations
The most common Natural Resources, Construction and Maintenance occupations in Tuckahoe are Construction & Extraction (898 | 3.8%), Installation, Maintenance & Repair (460 | 1.9%), and Farming, Fishing & Forestry (23 | 0.1%).
Natural Resources, Construction and Maintenance Occupations by Sex
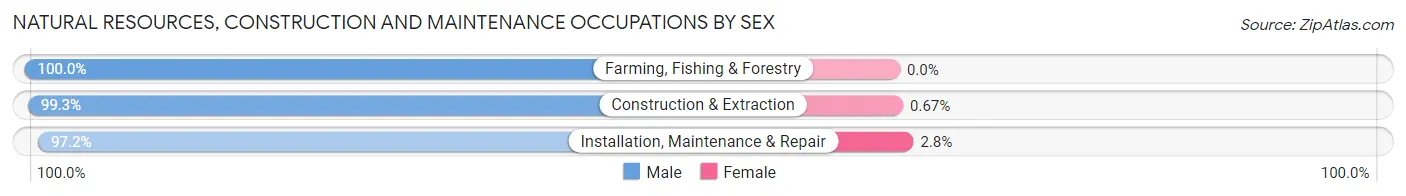
| Occupation | Male | Female |
| Farming, Fishing & Forestry | 23 (100.0%) | 0 (0.0%) |
| Construction & Extraction | 892 (99.3%) | 6 (0.7%) |
| Installation, Maintenance & Repair | 447 (97.2%) | 13 (2.8%) |
| Total (Category) | 1,362 (98.6%) | 19 (1.4%) |
| Total (Overall) | 12,493 (52.5%) | 11,304 (47.5%) |
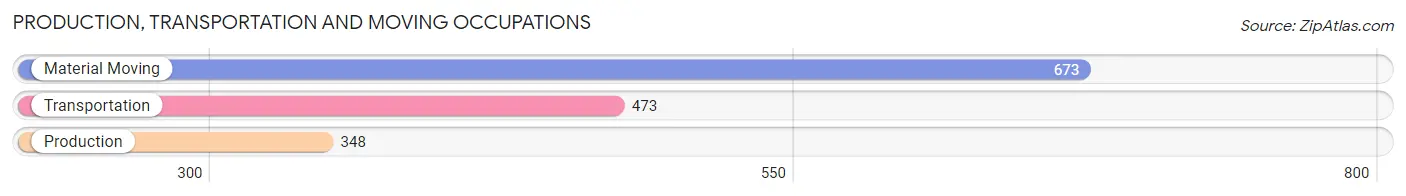
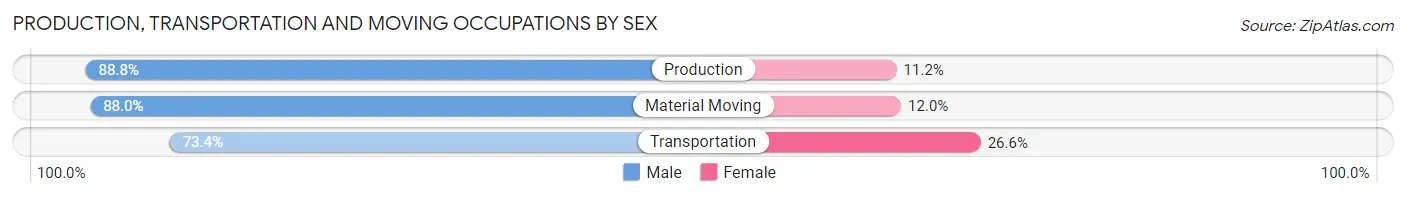
Production, Transportation and Moving Occupations
The most common Production, Transportation and Moving occupations in Tuckahoe are Material Moving (673 | 2.8%), Transportation (473 | 2.0%), and Production (348 | 1.5%).
Production, Transportation and Moving Occupations by Sex
| Occupation | Male | Female |
| Production | 309 (88.8%) | 39 (11.2%) |
| Transportation | 347 (73.4%) | 126 (26.6%) |
| Material Moving | 592 (88.0%) | 81 (12.0%) |
| Total (Category) | 1,248 (83.5%) | 246 (16.5%) |
| Total (Overall) | 12,493 (52.5%) | 11,304 (47.5%) |
Employment Industries by Sex in Tuckahoe
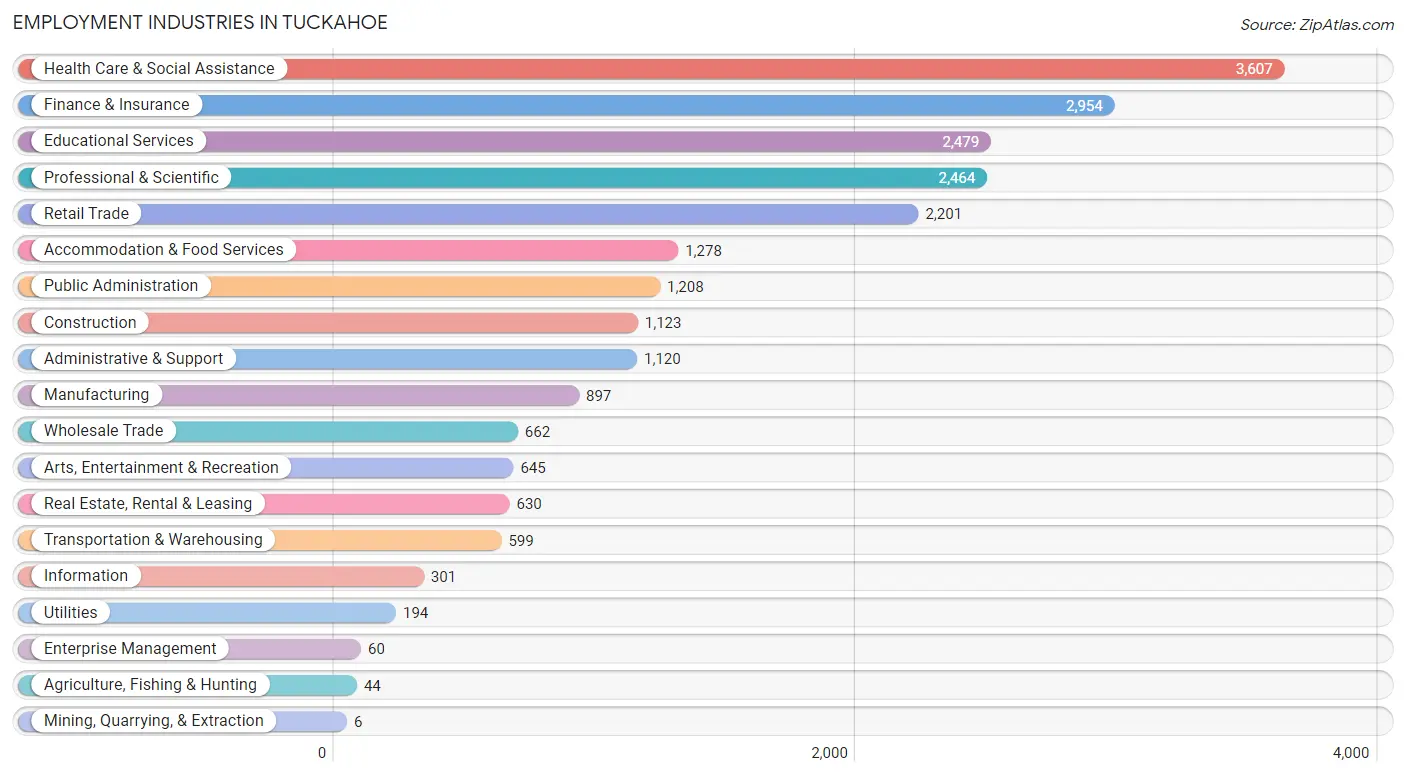
Employment Industries in Tuckahoe
The major employment industries in Tuckahoe include Health Care & Social Assistance (3,607 | 15.2%), Finance & Insurance (2,954 | 12.4%), Educational Services (2,479 | 10.4%), Professional & Scientific (2,464 | 10.3%), and Retail Trade (2,201 | 9.2%).
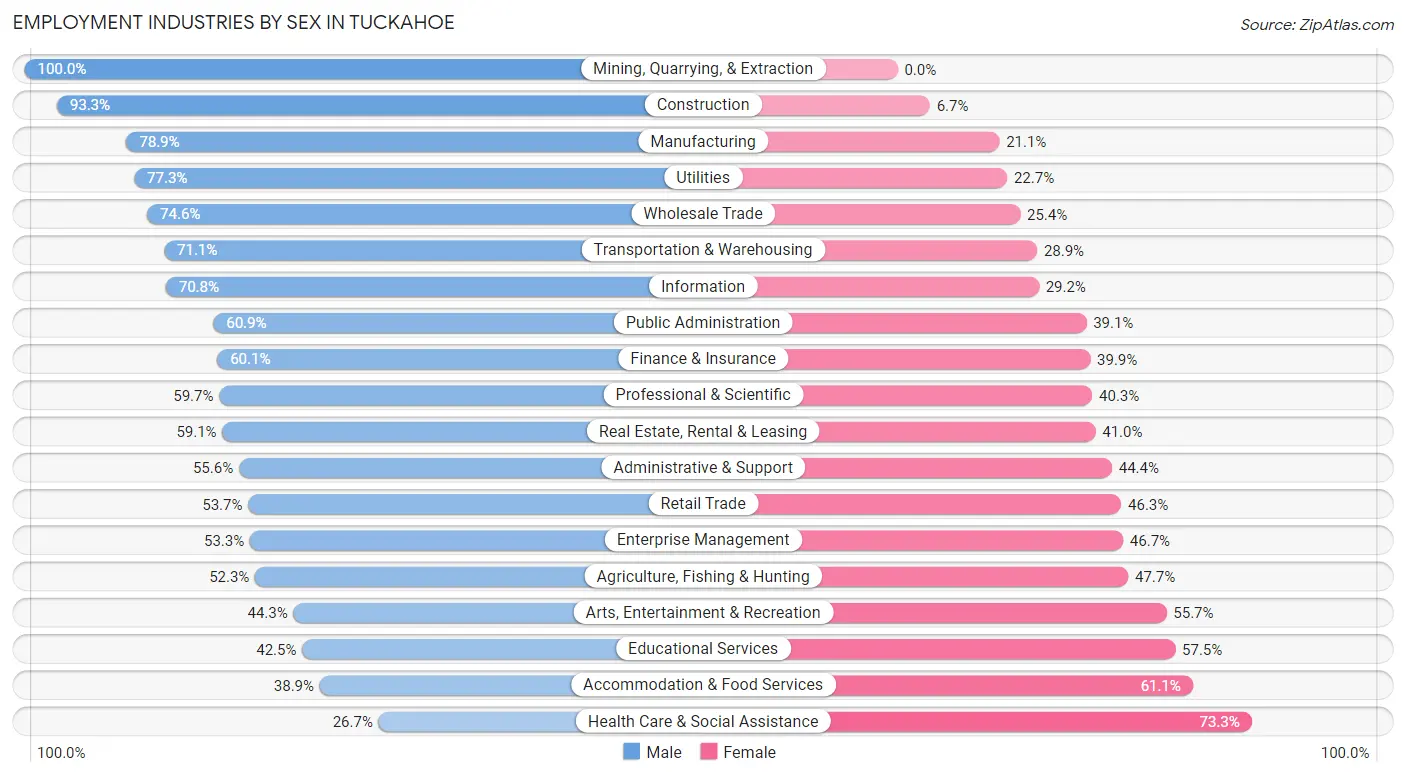
Employment Industries by Sex in Tuckahoe
The Tuckahoe industries that see more men than women are Mining, Quarrying, & Extraction (100.0%), Construction (93.3%), and Manufacturing (78.9%), whereas the industries that tend to have a higher number of women are Health Care & Social Assistance (73.3%), Accommodation & Food Services (61.1%), and Educational Services (57.5%).
| Industry | Male | Female |
| Agriculture, Fishing & Hunting | 23 (52.3%) | 21 (47.7%) |
| Mining, Quarrying, & Extraction | 6 (100.0%) | 0 (0.0%) |
| Construction | 1,048 (93.3%) | 75 (6.7%) |
| Manufacturing | 708 (78.9%) | 189 (21.1%) |
| Wholesale Trade | 494 (74.6%) | 168 (25.4%) |
| Retail Trade | 1,182 (53.7%) | 1,019 (46.3%) |
| Transportation & Warehousing | 426 (71.1%) | 173 (28.9%) |
| Utilities | 150 (77.3%) | 44 (22.7%) |
| Information | 213 (70.8%) | 88 (29.2%) |
| Finance & Insurance | 1,776 (60.1%) | 1,178 (39.9%) |
| Real Estate, Rental & Leasing | 372 (59.1%) | 258 (40.9%) |
| Professional & Scientific | 1,471 (59.7%) | 993 (40.3%) |
| Enterprise Management | 32 (53.3%) | 28 (46.7%) |
| Administrative & Support | 623 (55.6%) | 497 (44.4%) |
| Educational Services | 1,054 (42.5%) | 1,425 (57.5%) |
| Health Care & Social Assistance | 963 (26.7%) | 2,644 (73.3%) |
| Arts, Entertainment & Recreation | 286 (44.3%) | 359 (55.7%) |
| Accommodation & Food Services | 497 (38.9%) | 781 (61.1%) |
| Public Administration | 736 (60.9%) | 472 (39.1%) |
| Total | 12,493 (52.5%) | 11,304 (47.5%) |
Education in Tuckahoe
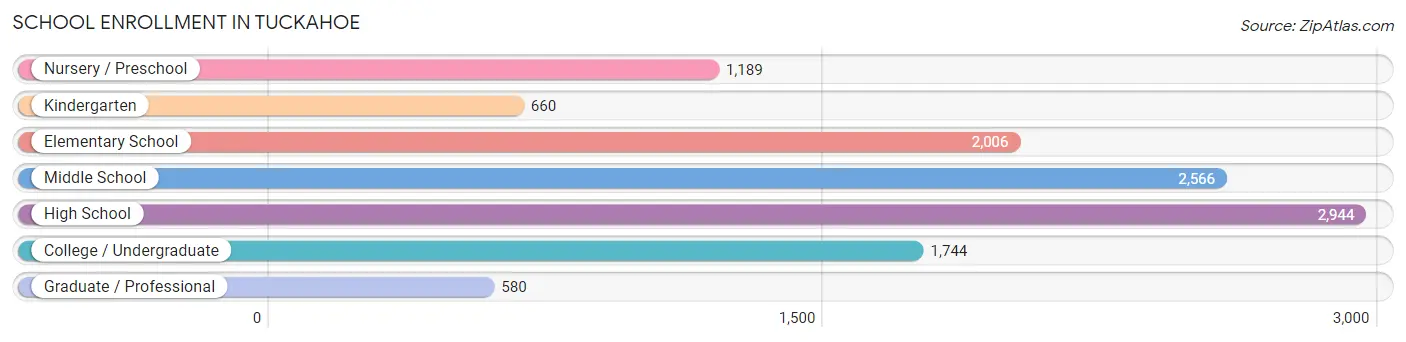
School Enrollment in Tuckahoe
The most common levels of schooling among the 11,689 students in Tuckahoe are high school (2,944 | 25.2%), middle school (2,566 | 22.0%), and elementary school (2,006 | 17.2%).
| School Level | # Students | % Students |
| Nursery / Preschool | 1,189 | 10.2% |
| Kindergarten | 660 | 5.7% |
| Elementary School | 2,006 | 17.2% |
| Middle School | 2,566 | 22.0% |
| High School | 2,944 | 25.2% |
| College / Undergraduate | 1,744 | 14.9% |
| Graduate / Professional | 580 | 5.0% |
| Total | 11,689 | 100.0% |
School Enrollment by Age by Funding Source in Tuckahoe
Out of a total of 11,689 students who are enrolled in schools in Tuckahoe, 3,226 (27.6%) attend a private institution, while the remaining 8,463 (72.4%) are enrolled in public schools. The age group of 3 to 4 year olds has the highest likelihood of being enrolled in private schools, with 806 (77.6% in the age bracket) enrolled. Conversely, the age group of 20 to 24 year olds has the lowest likelihood of being enrolled in a private school, with 749 (92.7% in the age bracket) attending a public institution.
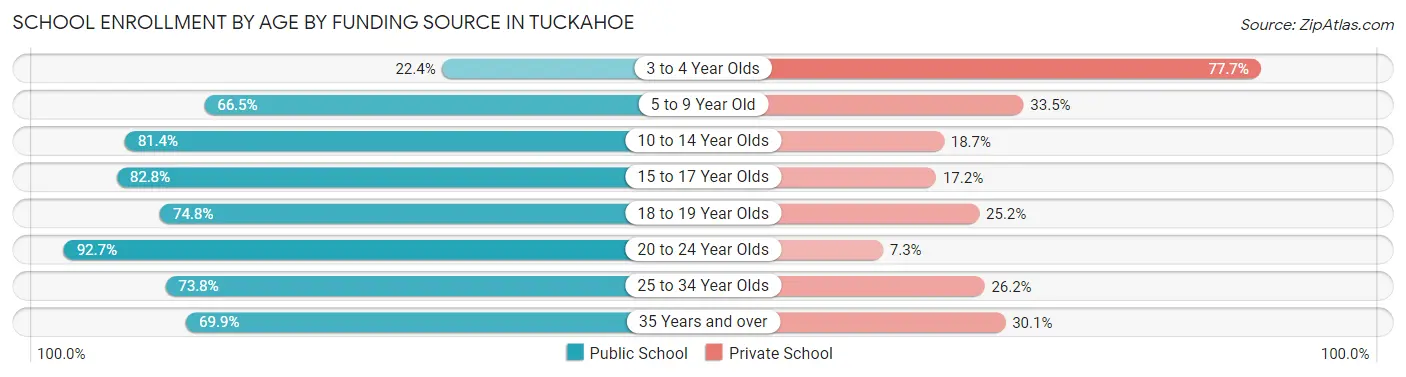
| Age Bracket | Public School | Private School |
| 3 to 4 Year Olds | 232 (22.4%) | 806 (77.6%) |
| 5 to 9 Year Old | 1,709 (66.5%) | 860 (33.5%) |
| 10 to 14 Year Olds | 2,442 (81.4%) | 560 (18.6%) |
| 15 to 17 Year Olds | 1,835 (82.8%) | 381 (17.2%) |
| 18 to 19 Year Olds | 747 (74.8%) | 252 (25.2%) |
| 20 to 24 Year Olds | 749 (92.7%) | 59 (7.3%) |
| 25 to 34 Year Olds | 287 (73.8%) | 102 (26.2%) |
| 35 Years and over | 467 (69.9%) | 201 (30.1%) |
| Total | 8,463 (72.4%) | 3,226 (27.6%) |
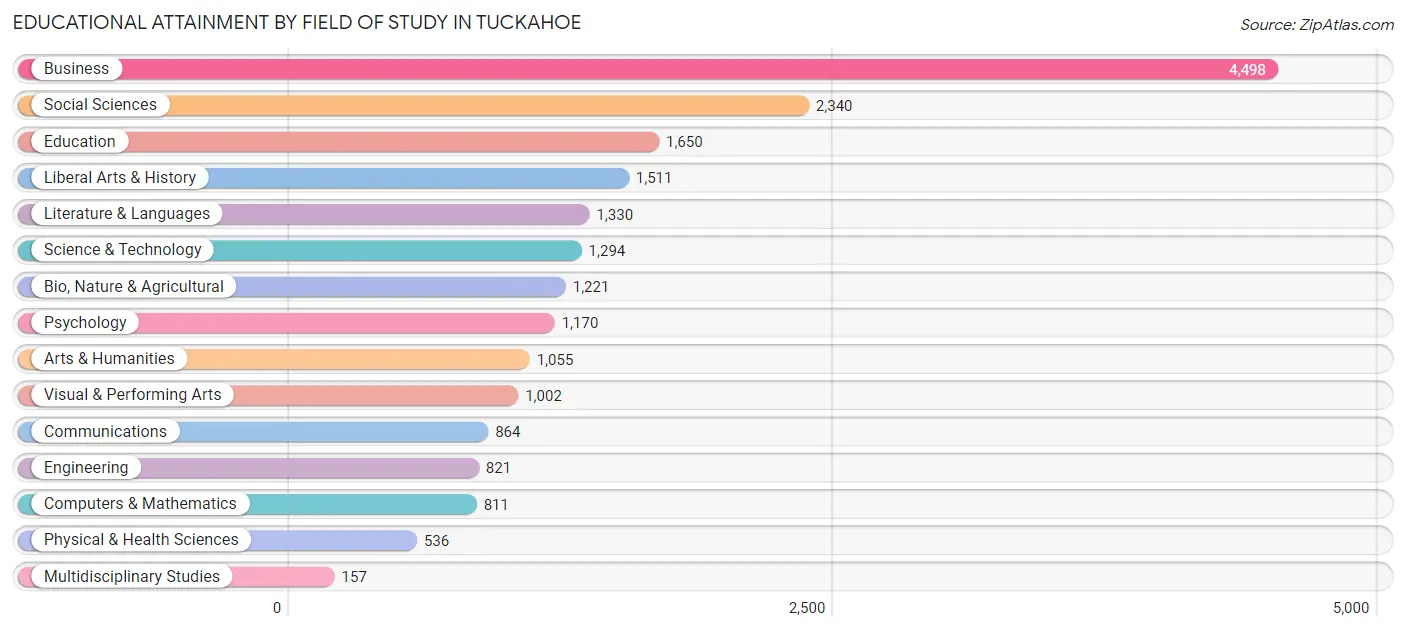
Educational Attainment by Field of Study in Tuckahoe
Business (4,498 | 22.2%), social sciences (2,340 | 11.6%), education (1,650 | 8.1%), liberal arts & history (1,511 | 7.5%), and literature & languages (1,330 | 6.6%) are the most common fields of study among 20,260 individuals in Tuckahoe who have obtained a bachelor's degree or higher.
| Field of Study | # Graduates | % Graduates |
| Computers & Mathematics | 811 | 4.0% |
| Bio, Nature & Agricultural | 1,221 | 6.0% |
| Physical & Health Sciences | 536 | 2.6% |
| Psychology | 1,170 | 5.8% |
| Social Sciences | 2,340 | 11.6% |
| Engineering | 821 | 4.1% |
| Multidisciplinary Studies | 157 | 0.8% |
| Science & Technology | 1,294 | 6.4% |
| Business | 4,498 | 22.2% |
| Education | 1,650 | 8.1% |
| Literature & Languages | 1,330 | 6.6% |
| Liberal Arts & History | 1,511 | 7.5% |
| Visual & Performing Arts | 1,002 | 5.0% |
| Communications | 864 | 4.3% |
| Arts & Humanities | 1,055 | 5.2% |
| Total | 20,260 | 100.0% |
Transportation & Commute in Tuckahoe
Vehicle Availability by Sex in Tuckahoe
The most prevalent vehicle ownership categories in Tuckahoe are males with 2 vehicles (5,640, accounting for 46.3%) and females with 2 vehicles (5,157, making up 50.9%).
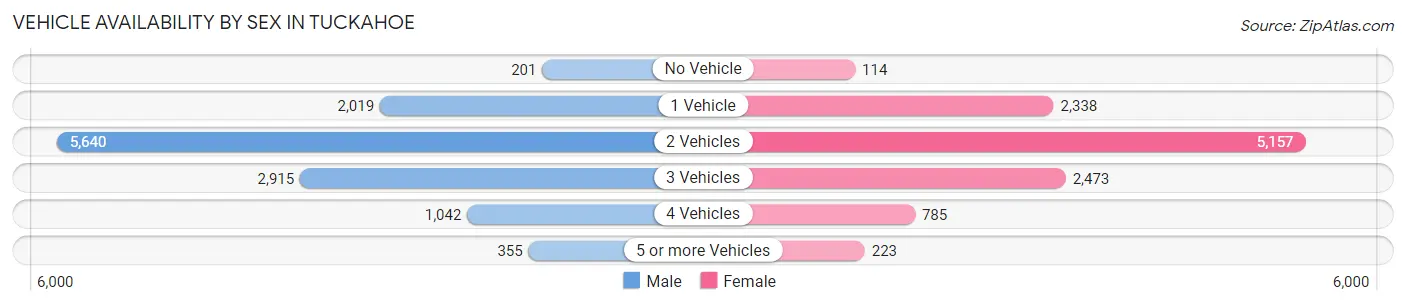
| Vehicles Available | Male | Female |
| No Vehicle | 201 (1.7%) | 114 (1.0%) |
| 1 Vehicle | 2,019 (16.6%) | 2,338 (21.1%) |
| 2 Vehicles | 5,640 (46.3%) | 5,157 (46.5%) |
| 3 Vehicles | 2,915 (23.9%) | 2,473 (22.3%) |
| 4 Vehicles | 1,042 (8.6%) | 785 (7.1%) |
| 5 or more Vehicles | 355 (2.9%) | 223 (2.0%) |
| Total | 12,172 (100.0%) | 11,090 (100.0%) |
Commute Time in Tuckahoe
The most frequently occuring commute durations in Tuckahoe are 15 to 19 minutes (4,179 commuters, 22.7%), 20 to 24 minutes (3,721 commuters, 20.2%), and 10 to 14 minutes (2,728 commuters, 14.8%).
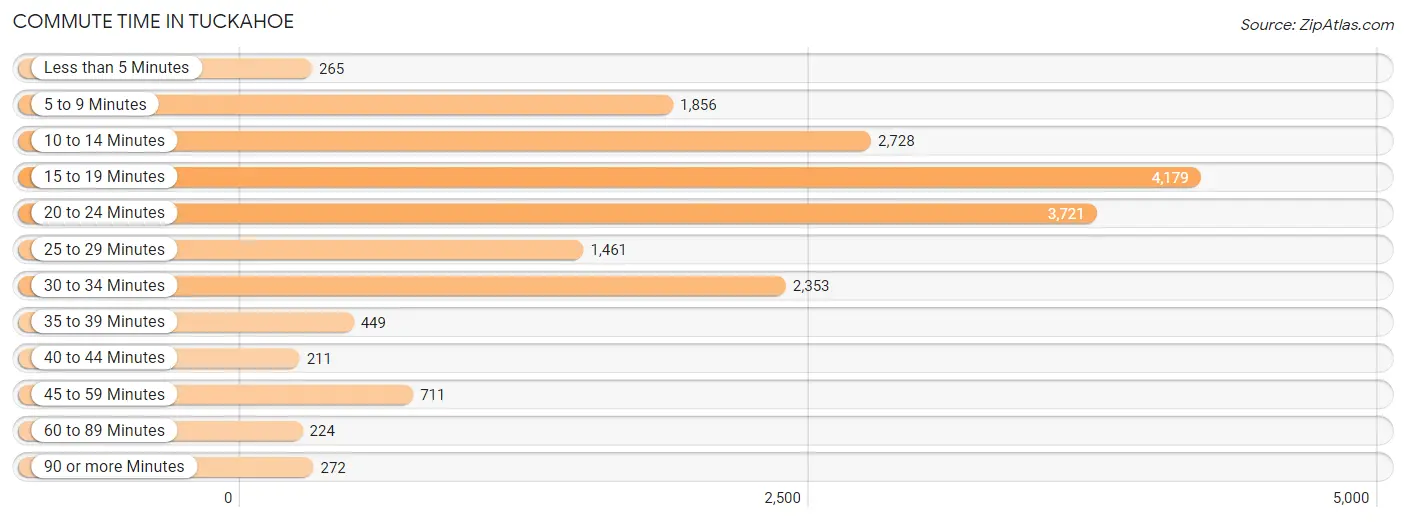
| Commute Time | # Commuters | % Commuters |
| Less than 5 Minutes | 265 | 1.4% |
| 5 to 9 Minutes | 1,856 | 10.1% |
| 10 to 14 Minutes | 2,728 | 14.8% |
| 15 to 19 Minutes | 4,179 | 22.7% |
| 20 to 24 Minutes | 3,721 | 20.2% |
| 25 to 29 Minutes | 1,461 | 7.9% |
| 30 to 34 Minutes | 2,353 | 12.8% |
| 35 to 39 Minutes | 449 | 2.4% |
| 40 to 44 Minutes | 211 | 1.1% |
| 45 to 59 Minutes | 711 | 3.9% |
| 60 to 89 Minutes | 224 | 1.2% |
| 90 or more Minutes | 272 | 1.5% |
Commute Time by Sex in Tuckahoe
The most common commute times in Tuckahoe are 15 to 19 minutes (2,083 commuters, 20.9%) for males and 15 to 19 minutes (2,096 commuters, 24.8%) for females.
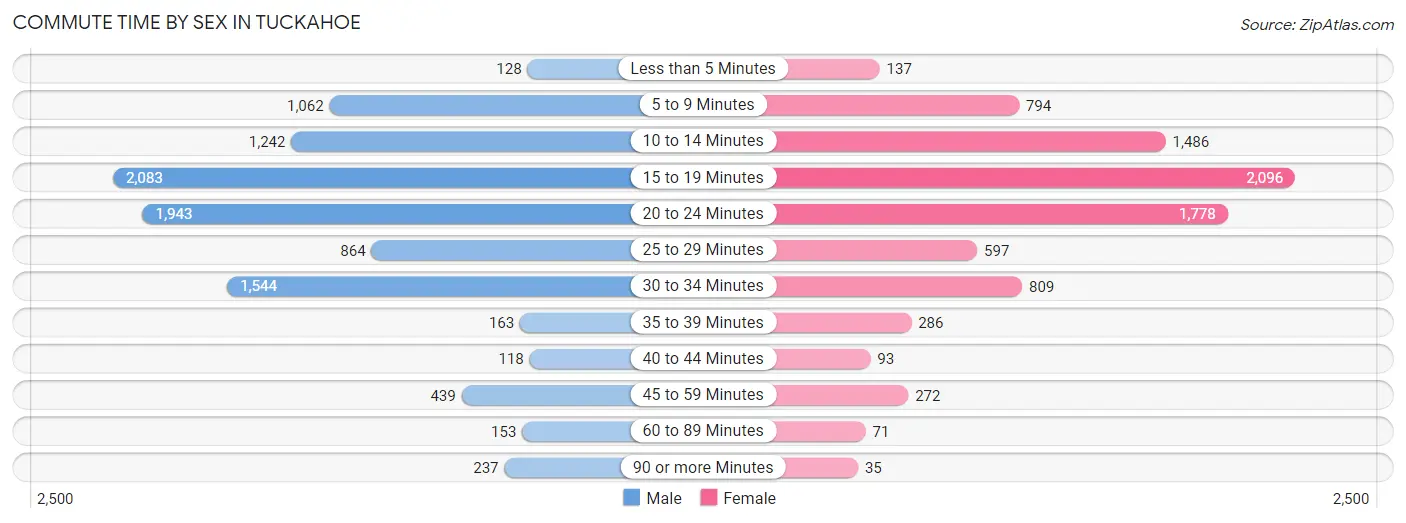
| Commute Time | Male | Female |
| Less than 5 Minutes | 128 (1.3%) | 137 (1.6%) |
| 5 to 9 Minutes | 1,062 (10.6%) | 794 (9.4%) |
| 10 to 14 Minutes | 1,242 (12.4%) | 1,486 (17.6%) |
| 15 to 19 Minutes | 2,083 (20.9%) | 2,096 (24.8%) |
| 20 to 24 Minutes | 1,943 (19.5%) | 1,778 (21.0%) |
| 25 to 29 Minutes | 864 (8.7%) | 597 (7.1%) |
| 30 to 34 Minutes | 1,544 (15.5%) | 809 (9.6%) |
| 35 to 39 Minutes | 163 (1.6%) | 286 (3.4%) |
| 40 to 44 Minutes | 118 (1.2%) | 93 (1.1%) |
| 45 to 59 Minutes | 439 (4.4%) | 272 (3.2%) |
| 60 to 89 Minutes | 153 (1.5%) | 71 (0.8%) |
| 90 or more Minutes | 237 (2.4%) | 35 (0.4%) |
Time of Departure to Work by Sex in Tuckahoe
The most frequent times of departure to work in Tuckahoe are 8:00 AM to 8:29 AM (1,700, 17.0%) for males and 7:30 AM to 7:59 AM (1,586, 18.8%) for females.
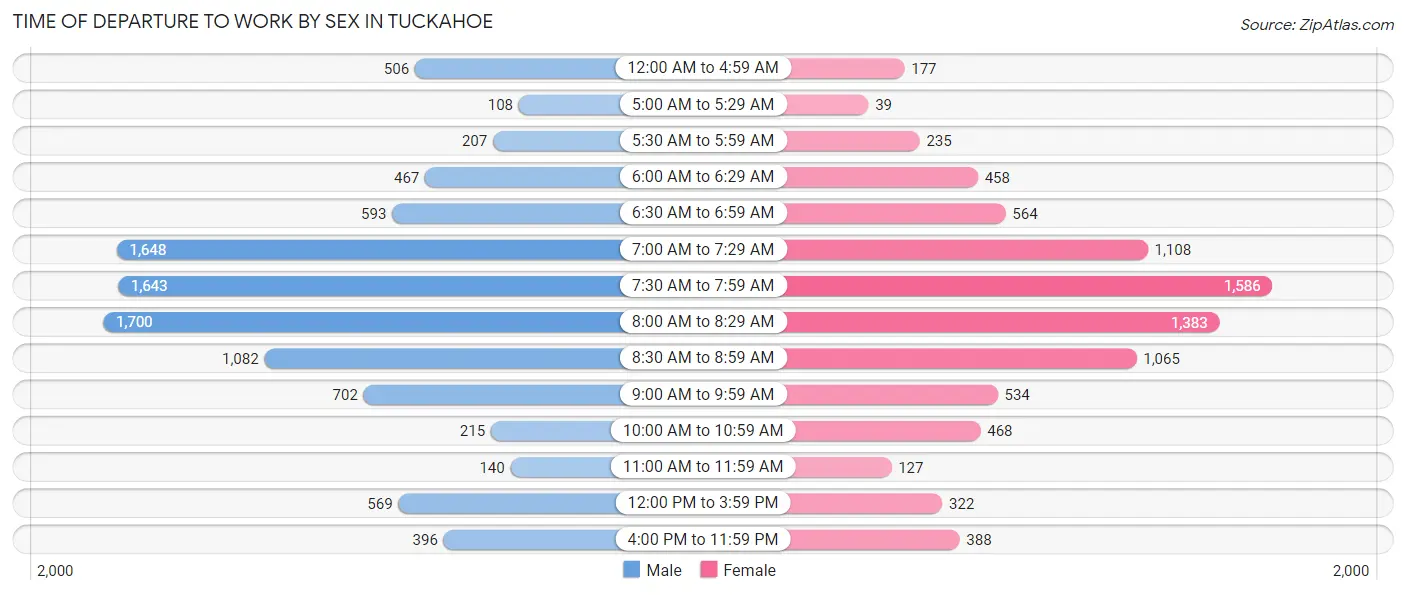
| Time of Departure | Male | Female |
| 12:00 AM to 4:59 AM | 506 (5.1%) | 177 (2.1%) |
| 5:00 AM to 5:29 AM | 108 (1.1%) | 39 (0.5%) |
| 5:30 AM to 5:59 AM | 207 (2.1%) | 235 (2.8%) |
| 6:00 AM to 6:29 AM | 467 (4.7%) | 458 (5.4%) |
| 6:30 AM to 6:59 AM | 593 (5.9%) | 564 (6.7%) |
| 7:00 AM to 7:29 AM | 1,648 (16.5%) | 1,108 (13.1%) |
| 7:30 AM to 7:59 AM | 1,643 (16.5%) | 1,586 (18.8%) |
| 8:00 AM to 8:29 AM | 1,700 (17.0%) | 1,383 (16.4%) |
| 8:30 AM to 8:59 AM | 1,082 (10.8%) | 1,065 (12.6%) |
| 9:00 AM to 9:59 AM | 702 (7.0%) | 534 (6.3%) |
| 10:00 AM to 10:59 AM | 215 (2.2%) | 468 (5.5%) |
| 11:00 AM to 11:59 AM | 140 (1.4%) | 127 (1.5%) |
| 12:00 PM to 3:59 PM | 569 (5.7%) | 322 (3.8%) |
| 4:00 PM to 11:59 PM | 396 (4.0%) | 388 (4.6%) |
| Total | 9,976 (100.0%) | 8,454 (100.0%) |
Housing Occupancy in Tuckahoe
Occupancy by Ownership in Tuckahoe
Of the total 19,236 dwellings in Tuckahoe, owner-occupied units account for 12,147 (63.1%), while renter-occupied units make up 7,089 (36.8%).
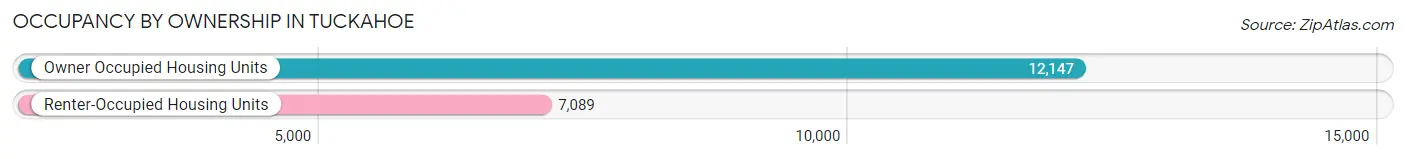
| Occupancy | # Housing Units | % Housing Units |
| Owner Occupied Housing Units | 12,147 | 63.1% |
| Renter-Occupied Housing Units | 7,089 | 36.8% |
| Total Occupied Housing Units | 19,236 | 100.0% |
Occupancy by Household Size in Tuckahoe
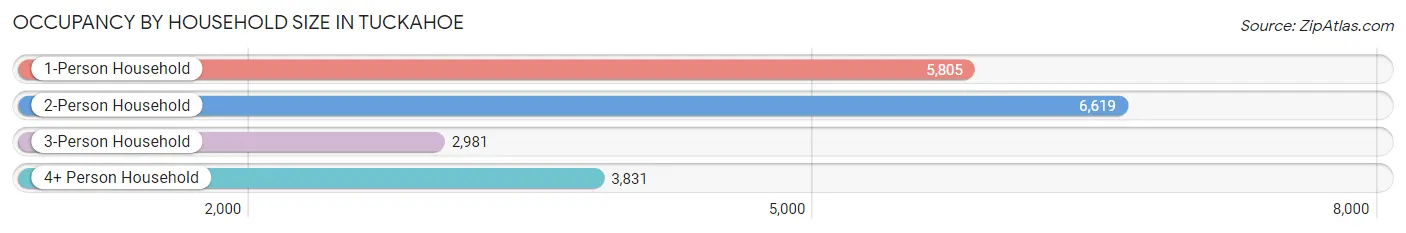
| Household Size | # Housing Units | % Housing Units |
| 1-Person Household | 5,805 | 30.2% |
| 2-Person Household | 6,619 | 34.4% |
| 3-Person Household | 2,981 | 15.5% |
| 4+ Person Household | 3,831 | 19.9% |
| Total Housing Units | 19,236 | 100.0% |
Occupancy by Ownership by Household Size in Tuckahoe
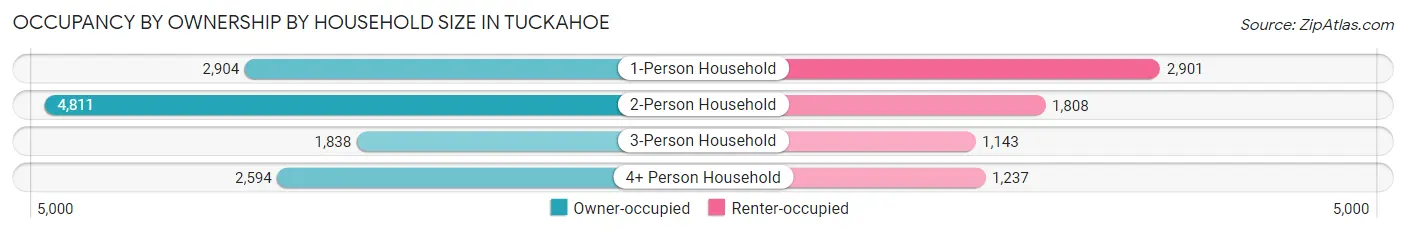
| Household Size | Owner-occupied | Renter-occupied |
| 1-Person Household | 2,904 (50.0%) | 2,901 (50.0%) |
| 2-Person Household | 4,811 (72.7%) | 1,808 (27.3%) |
| 3-Person Household | 1,838 (61.7%) | 1,143 (38.3%) |
| 4+ Person Household | 2,594 (67.7%) | 1,237 (32.3%) |
| Total Housing Units | 12,147 (63.1%) | 7,089 (36.8%) |
Occupancy by Educational Attainment in Tuckahoe
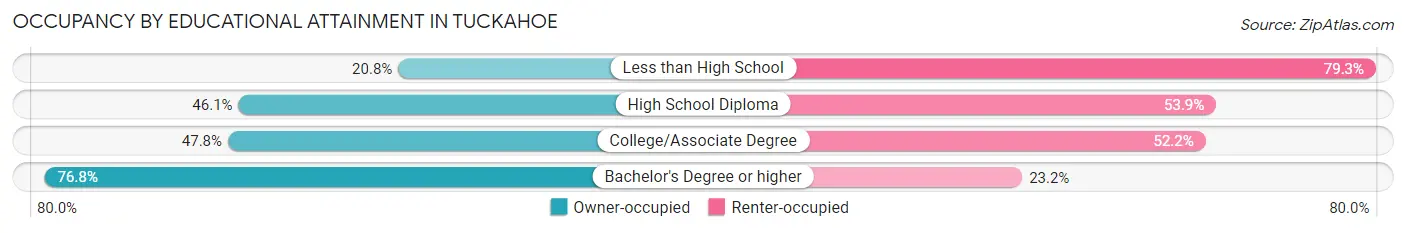
| Household Size | Owner-occupied | Renter-occupied |
| Less than High School | 210 (20.7%) | 802 (79.2%) |
| High School Diploma | 1,245 (46.1%) | 1,456 (53.9%) |
| College/Associate Degree | 2,030 (47.8%) | 2,220 (52.2%) |
| Bachelor's Degree or higher | 8,662 (76.8%) | 2,611 (23.2%) |
Occupancy by Age of Householder in Tuckahoe
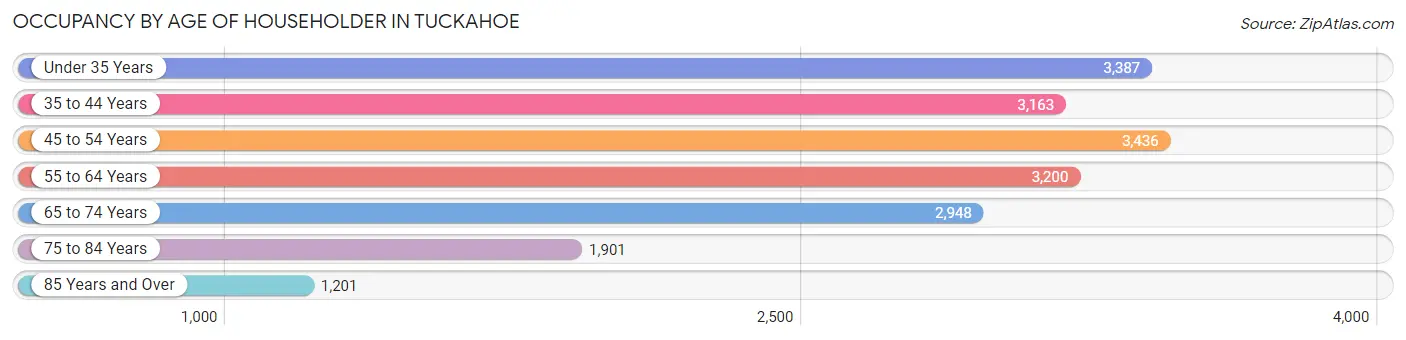
| Age Bracket | # Households | % Households |
| Under 35 Years | 3,387 | 17.6% |
| 35 to 44 Years | 3,163 | 16.4% |
| 45 to 54 Years | 3,436 | 17.9% |
| 55 to 64 Years | 3,200 | 16.6% |
| 65 to 74 Years | 2,948 | 15.3% |
| 75 to 84 Years | 1,901 | 9.9% |
| 85 Years and Over | 1,201 | 6.2% |
| Total | 19,236 | 100.0% |
Housing Finances in Tuckahoe
Median Income by Occupancy in Tuckahoe
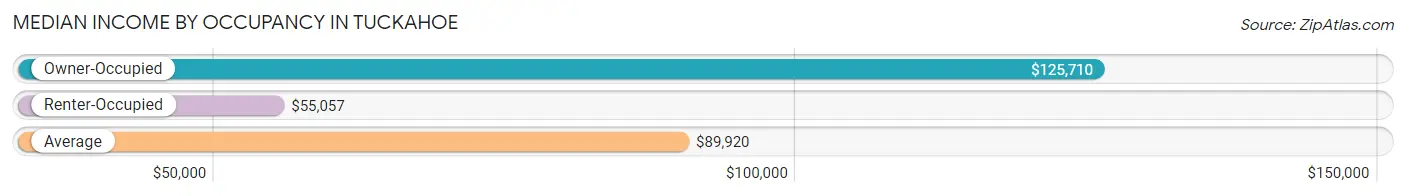
| Occupancy Type | # Households | Median Income |
| Owner-Occupied | 12,147 (63.1%) | $125,710 |
| Renter-Occupied | 7,089 (36.8%) | $55,057 |
| Average | 19,236 (100.0%) | $89,920 |
Occupancy by Householder Income Bracket in Tuckahoe
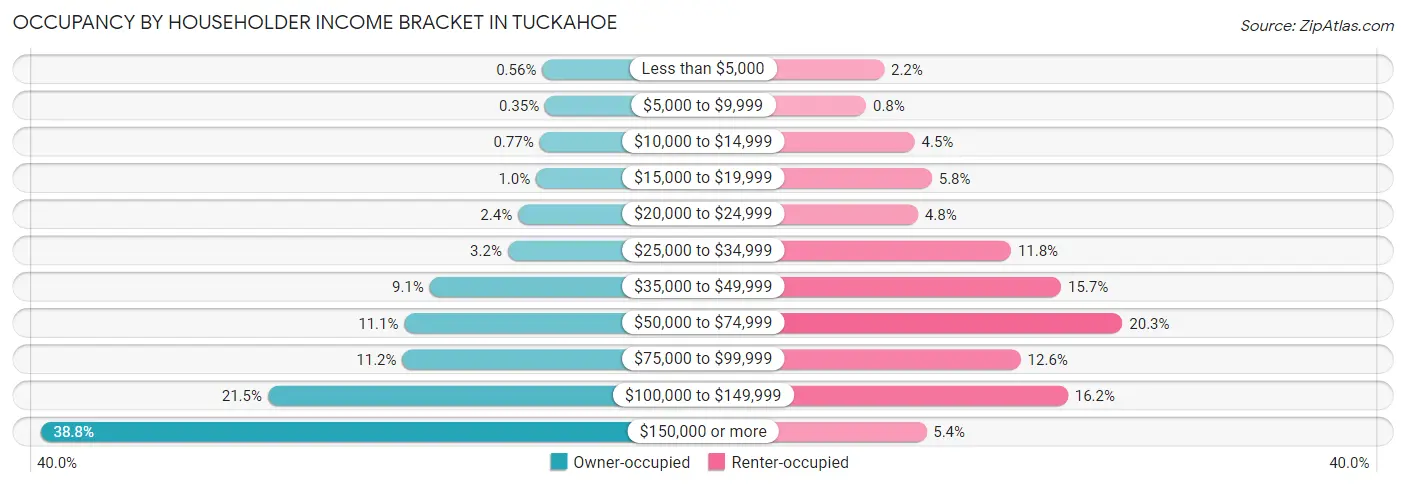
| Income Bracket | Owner-occupied | Renter-occupied |
| Less than $5,000 | 68 (0.6%) | 154 (2.2%) |
| $5,000 to $9,999 | 42 (0.4%) | 57 (0.8%) |
| $10,000 to $14,999 | 94 (0.8%) | 319 (4.5%) |
| $15,000 to $19,999 | 125 (1.0%) | 412 (5.8%) |
| $20,000 to $24,999 | 293 (2.4%) | 337 (4.8%) |
| $25,000 to $34,999 | 388 (3.2%) | 839 (11.8%) |
| $35,000 to $49,999 | 1,110 (9.1%) | 1,110 (15.7%) |
| $50,000 to $74,999 | 1,345 (11.1%) | 1,441 (20.3%) |
| $75,000 to $99,999 | 1,363 (11.2%) | 892 (12.6%) |
| $100,000 to $149,999 | 2,608 (21.5%) | 1,146 (16.2%) |
| $150,000 or more | 4,711 (38.8%) | 382 (5.4%) |
| Total | 12,147 (100.0%) | 7,089 (100.0%) |
Monthly Housing Cost Tiers in Tuckahoe
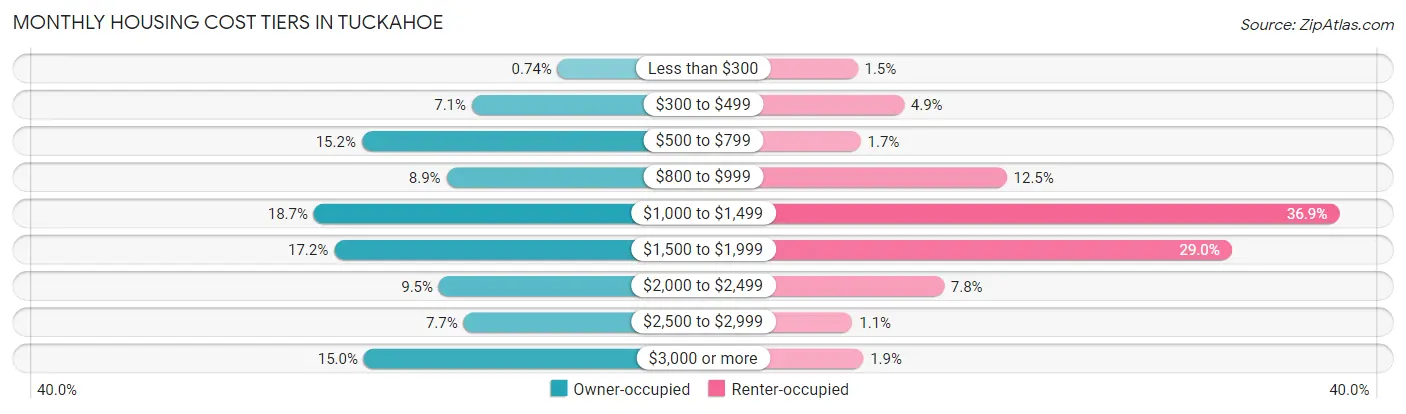
| Monthly Cost | Owner-occupied | Renter-occupied |
| Less than $300 | 90 (0.7%) | 105 (1.5%) |
| $300 to $499 | 857 (7.1%) | 347 (4.9%) |
| $500 to $799 | 1,843 (15.2%) | 121 (1.7%) |
| $800 to $999 | 1,085 (8.9%) | 883 (12.5%) |
| $1,000 to $1,499 | 2,271 (18.7%) | 2,619 (36.9%) |
| $1,500 to $1,999 | 2,091 (17.2%) | 2,058 (29.0%) |
| $2,000 to $2,499 | 1,153 (9.5%) | 556 (7.8%) |
| $2,500 to $2,999 | 932 (7.7%) | 78 (1.1%) |
| $3,000 or more | 1,825 (15.0%) | 135 (1.9%) |
| Total | 12,147 (100.0%) | 7,089 (100.0%) |
Physical Housing Characteristics in Tuckahoe
Housing Structures in Tuckahoe
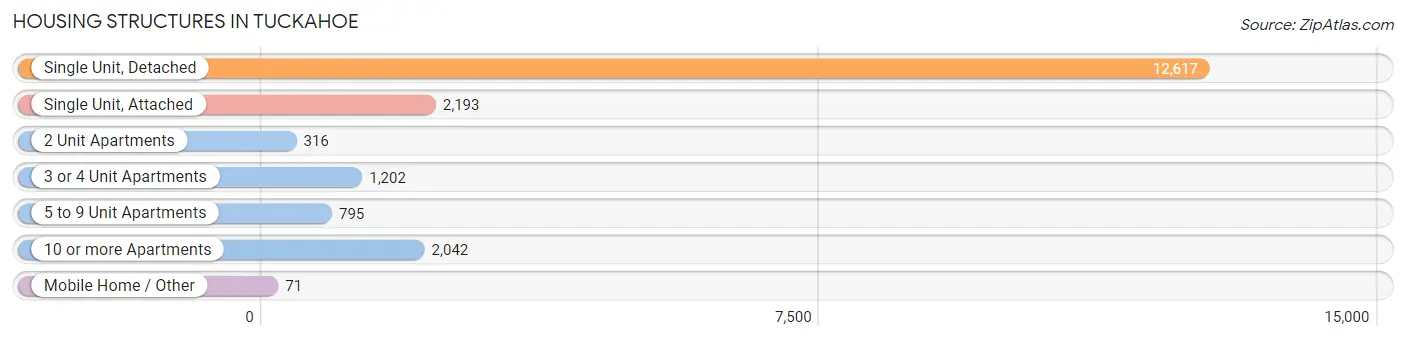
| Structure Type | # Housing Units | % Housing Units |
| Single Unit, Detached | 12,617 | 65.6% |
| Single Unit, Attached | 2,193 | 11.4% |
| 2 Unit Apartments | 316 | 1.6% |
| 3 or 4 Unit Apartments | 1,202 | 6.2% |
| 5 to 9 Unit Apartments | 795 | 4.1% |
| 10 or more Apartments | 2,042 | 10.6% |
| Mobile Home / Other | 71 | 0.4% |
| Total | 19,236 | 100.0% |
Housing Structures by Occupancy in Tuckahoe
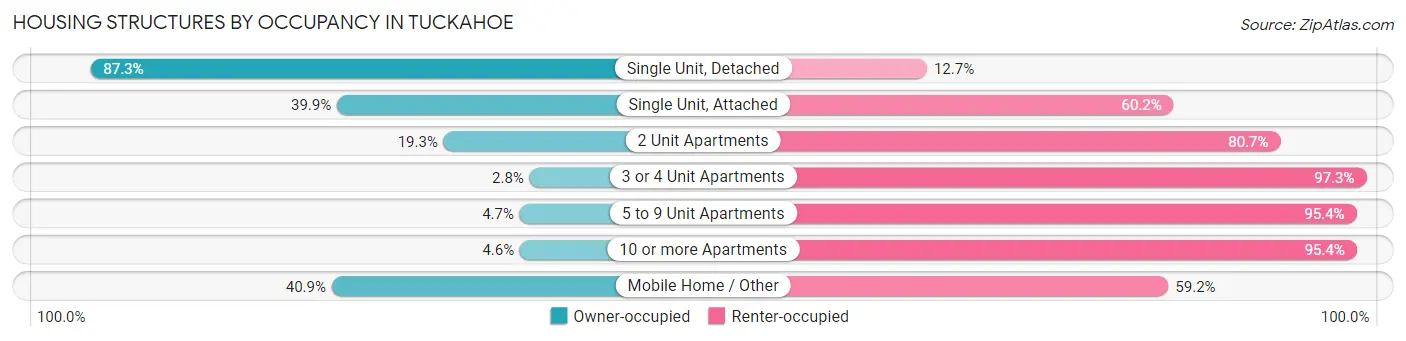
| Structure Type | Owner-occupied | Renter-occupied |
| Single Unit, Detached | 11,019 (87.3%) | 1,598 (12.7%) |
| Single Unit, Attached | 874 (39.9%) | 1,319 (60.2%) |
| 2 Unit Apartments | 61 (19.3%) | 255 (80.7%) |
| 3 or 4 Unit Apartments | 33 (2.8%) | 1,169 (97.3%) |
| 5 to 9 Unit Apartments | 37 (4.6%) | 758 (95.4%) |
| 10 or more Apartments | 94 (4.6%) | 1,948 (95.4%) |
| Mobile Home / Other | 29 (40.8%) | 42 (59.2%) |
| Total | 12,147 (63.1%) | 7,089 (36.8%) |
Housing Structures by Number of Rooms in Tuckahoe
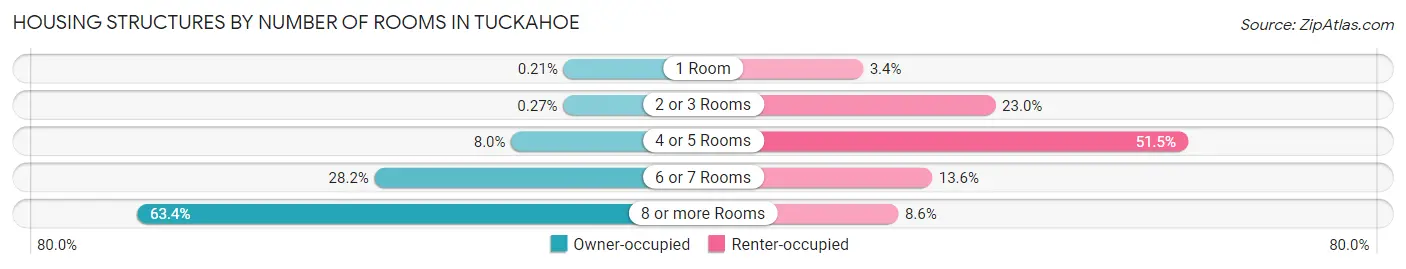
| Number of Rooms | Owner-occupied | Renter-occupied |
| 1 Room | 25 (0.2%) | 239 (3.4%) |
| 2 or 3 Rooms | 33 (0.3%) | 1,628 (23.0%) |
| 4 or 5 Rooms | 968 (8.0%) | 3,649 (51.5%) |
| 6 or 7 Rooms | 3,425 (28.2%) | 964 (13.6%) |
| 8 or more Rooms | 7,696 (63.4%) | 609 (8.6%) |
| Total | 12,147 (100.0%) | 7,089 (100.0%) |
Housing Structure by Heating Type in Tuckahoe
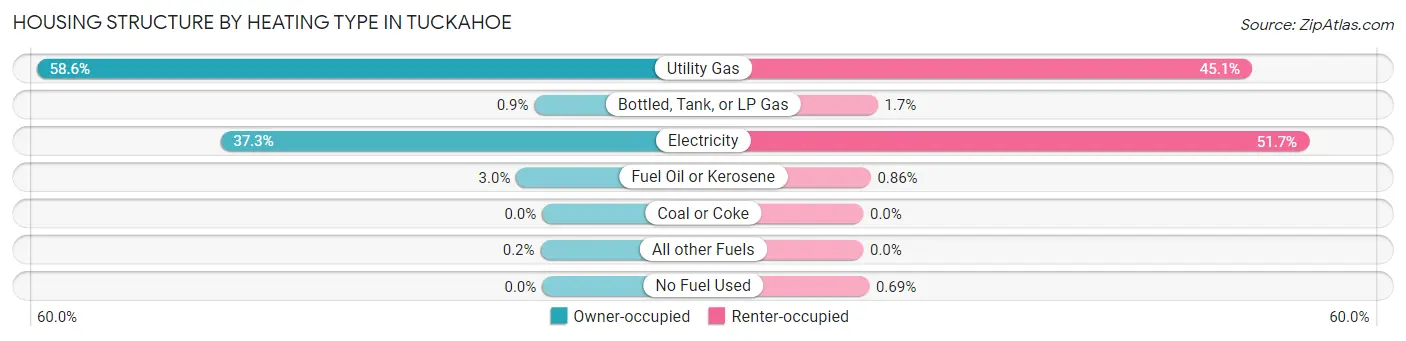
| Heating Type | Owner-occupied | Renter-occupied |
| Utility Gas | 7,118 (58.6%) | 3,196 (45.1%) |
| Bottled, Tank, or LP Gas | 109 (0.9%) | 119 (1.7%) |
| Electricity | 4,532 (37.3%) | 3,664 (51.7%) |
| Fuel Oil or Kerosene | 364 (3.0%) | 61 (0.9%) |
| Coal or Coke | 0 (0.0%) | 0 (0.0%) |
| All other Fuels | 24 (0.2%) | 0 (0.0%) |
| No Fuel Used | 0 (0.0%) | 49 (0.7%) |
| Total | 12,147 (100.0%) | 7,089 (100.0%) |
Household Vehicle Usage in Tuckahoe
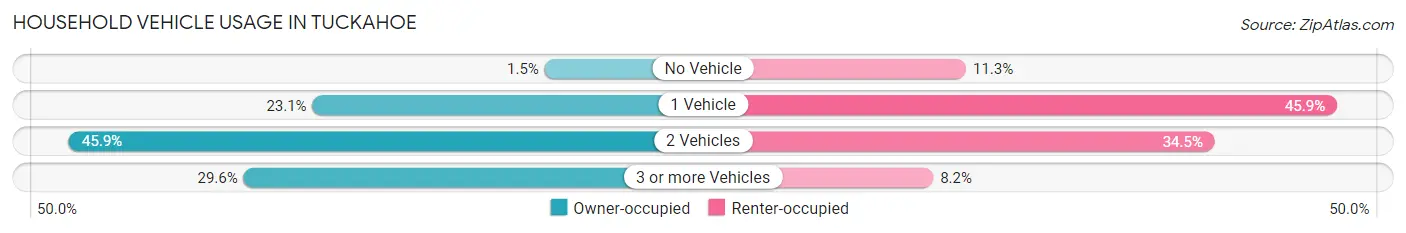
| Vehicles per Household | Owner-occupied | Renter-occupied |
| No Vehicle | 176 (1.5%) | 802 (11.3%) |
| 1 Vehicle | 2,809 (23.1%) | 3,256 (45.9%) |
| 2 Vehicles | 5,571 (45.9%) | 2,447 (34.5%) |
| 3 or more Vehicles | 3,591 (29.6%) | 584 (8.2%) |
| Total | 12,147 (100.0%) | 7,089 (100.0%) |
Real Estate & Mortgages in Tuckahoe
Real Estate and Mortgage Overview in Tuckahoe
| Characteristic | Without Mortgage | With Mortgage |
| Housing Units | 4,297 | 7,850 |
| Median Property Value | $412,700 | $390,300 |
| Median Household Income | $96,641 | $3,387 |
| Monthly Housing Costs | $704 | $1,792 |
| Real Estate Taxes | $3,290 | $328 |
Property Value by Mortgage Status in Tuckahoe
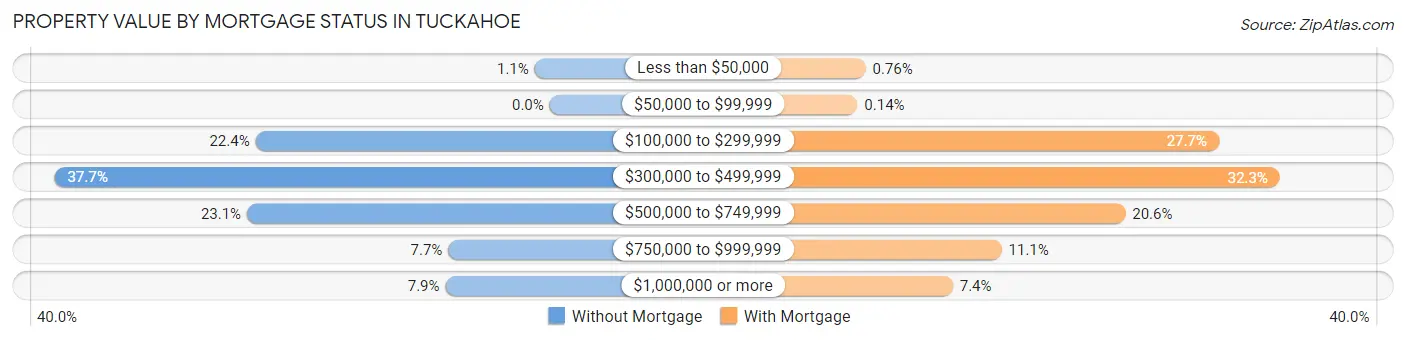
| Property Value | Without Mortgage | With Mortgage |
| Less than $50,000 | 49 (1.1%) | 60 (0.8%) |
| $50,000 to $99,999 | 0 (0.0%) | 11 (0.1%) |
| $100,000 to $299,999 | 963 (22.4%) | 2,173 (27.7%) |
| $300,000 to $499,999 | 1,621 (37.7%) | 2,537 (32.3%) |
| $500,000 to $749,999 | 991 (23.1%) | 1,613 (20.5%) |
| $750,000 to $999,999 | 332 (7.7%) | 874 (11.1%) |
| $1,000,000 or more | 341 (7.9%) | 582 (7.4%) |
| Total | 4,297 (100.0%) | 7,850 (100.0%) |
Household Income by Mortgage Status in Tuckahoe
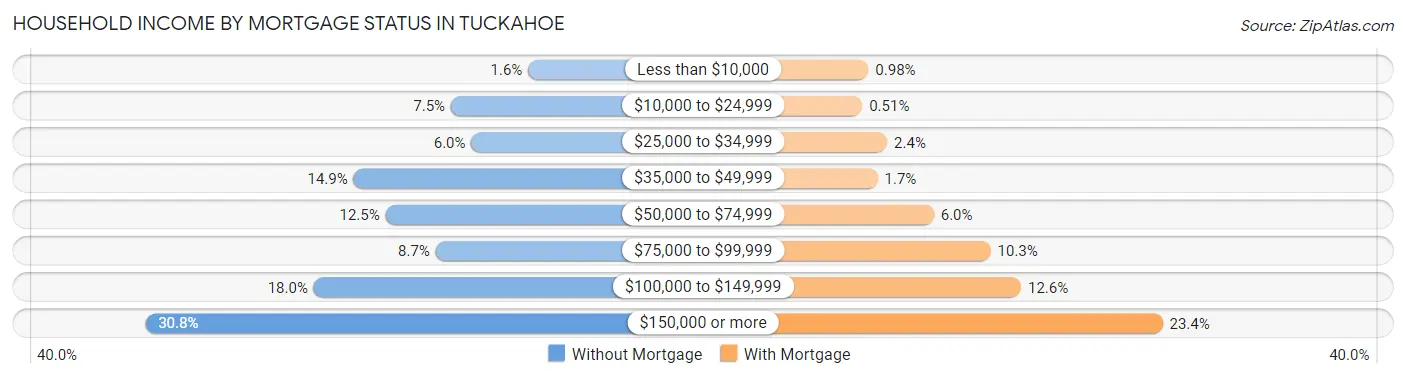
| Household Income | Without Mortgage | With Mortgage |
| Less than $10,000 | 70 (1.6%) | 77 (1.0%) |
| $10,000 to $24,999 | 323 (7.5%) | 40 (0.5%) |
| $25,000 to $34,999 | 256 (6.0%) | 189 (2.4%) |
| $35,000 to $49,999 | 642 (14.9%) | 132 (1.7%) |
| $50,000 to $74,999 | 537 (12.5%) | 468 (6.0%) |
| $75,000 to $99,999 | 373 (8.7%) | 808 (10.3%) |
| $100,000 to $149,999 | 772 (18.0%) | 990 (12.6%) |
| $150,000 or more | 1,324 (30.8%) | 1,836 (23.4%) |
| Total | 4,297 (100.0%) | 7,850 (100.0%) |
Property Value to Household Income Ratio in Tuckahoe
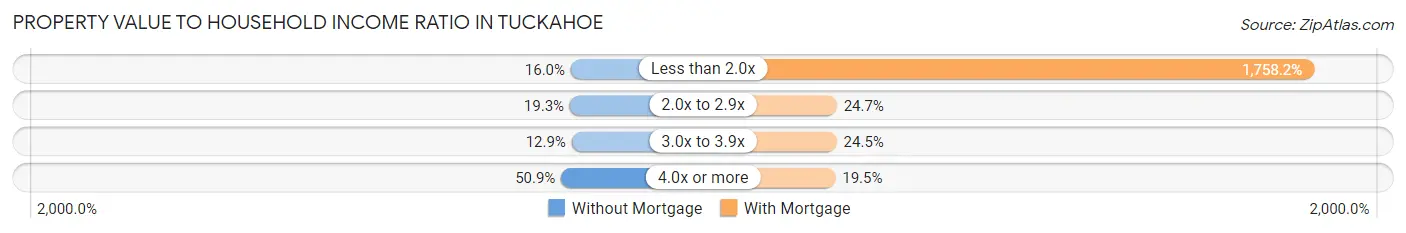
| Value-to-Income Ratio | Without Mortgage | With Mortgage |
| Less than 2.0x | 686 (16.0%) | 138,019 (1,758.2%) |
| 2.0x to 2.9x | 829 (19.3%) | 1,936 (24.7%) |
| 3.0x to 3.9x | 552 (12.9%) | 1,923 (24.5%) |
| 4.0x or more | 2,189 (50.9%) | 1,532 (19.5%) |
| Total | 4,297 (100.0%) | 7,850 (100.0%) |
Real Estate Taxes by Mortgage Status in Tuckahoe
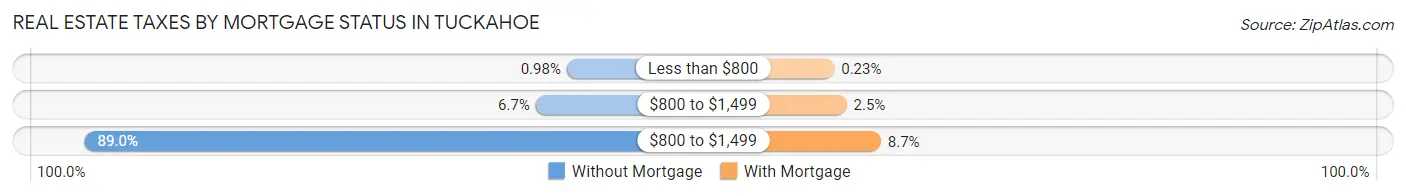
| Property Taxes | Without Mortgage | With Mortgage |
| Less than $800 | 42 (1.0%) | 18 (0.2%) |
| $800 to $1,499 | 286 (6.7%) | 195 (2.5%) |
| $800 to $1,499 | 3,825 (89.0%) | 685 (8.7%) |
| Total | 4,297 (100.0%) | 7,850 (100.0%) |
Health & Disability in Tuckahoe
Health Insurance Coverage by Age in Tuckahoe
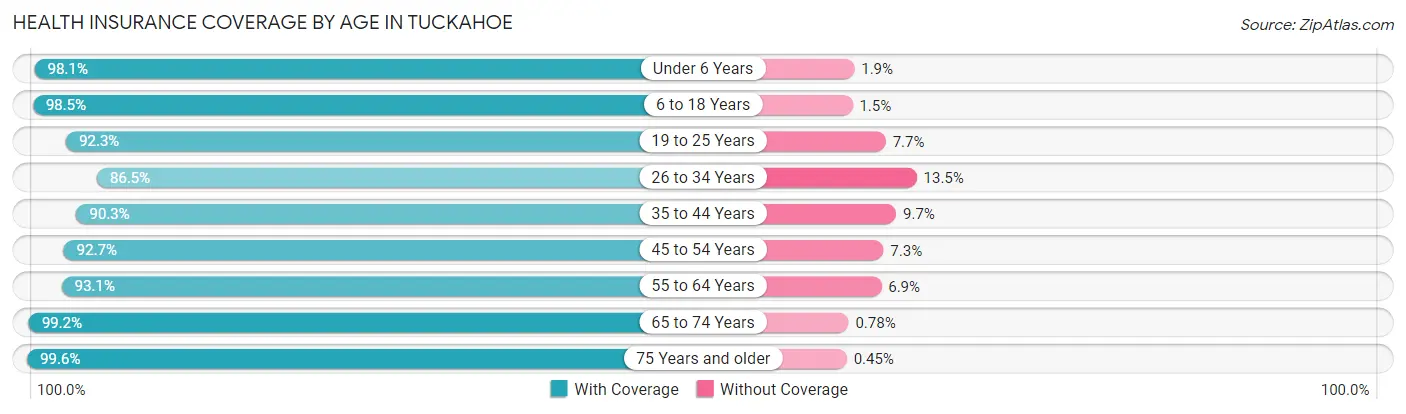
| Age Bracket | With Coverage | Without Coverage |
| Under 6 Years | 3,901 (98.1%) | 74 (1.9%) |
| 6 to 18 Years | 7,881 (98.5%) | 122 (1.5%) |
| 19 to 25 Years | 3,752 (92.3%) | 314 (7.7%) |
| 26 to 34 Years | 4,551 (86.5%) | 709 (13.5%) |
| 35 to 44 Years | 5,230 (90.3%) | 559 (9.7%) |
| 45 to 54 Years | 5,846 (92.7%) | 460 (7.3%) |
| 55 to 64 Years | 5,143 (93.1%) | 381 (6.9%) |
| 65 to 74 Years | 4,552 (99.2%) | 36 (0.8%) |
| 75 Years and older | 4,243 (99.6%) | 19 (0.4%) |
| Total | 45,099 (94.4%) | 2,674 (5.6%) |
Health Insurance Coverage by Citizenship Status in Tuckahoe
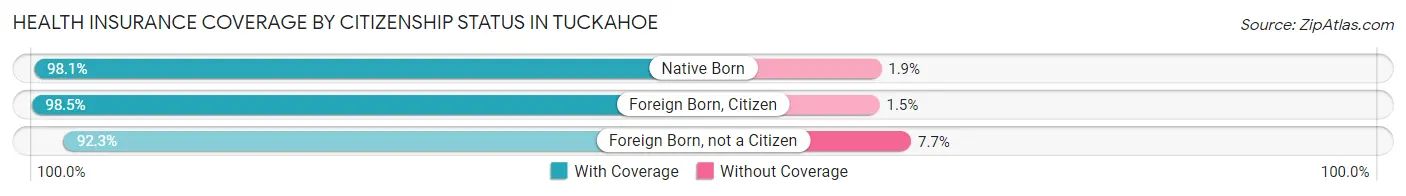
| Citizenship Status | With Coverage | Without Coverage |
| Native Born | 3,901 (98.1%) | 74 (1.9%) |
| Foreign Born, Citizen | 7,881 (98.5%) | 122 (1.5%) |
| Foreign Born, not a Citizen | 3,752 (92.3%) | 314 (7.7%) |
Health Insurance Coverage by Household Income in Tuckahoe
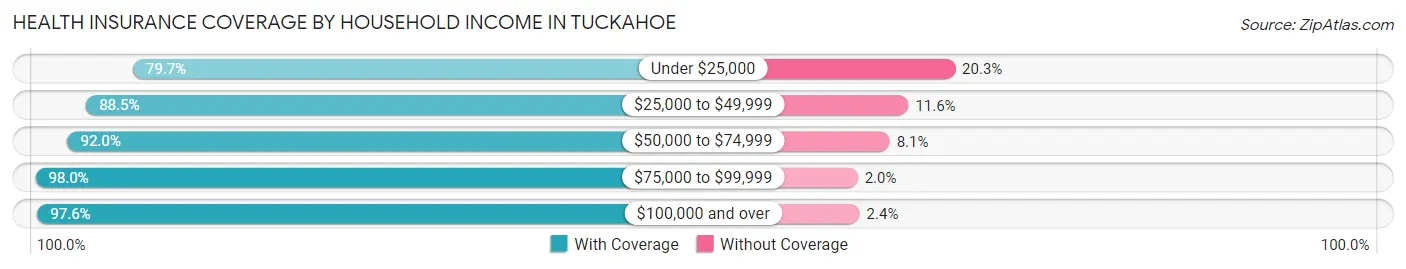
| Household Income | With Coverage | Without Coverage |
| Under $25,000 | 2,572 (79.7%) | 655 (20.3%) |
| $25,000 to $49,999 | 6,012 (88.4%) | 785 (11.6%) |
| $50,000 to $74,999 | 5,630 (91.9%) | 493 (8.1%) |
| $75,000 to $99,999 | 5,608 (98.0%) | 117 (2.0%) |
| $100,000 and over | 25,167 (97.6%) | 622 (2.4%) |
Public vs Private Health Insurance Coverage by Age in Tuckahoe
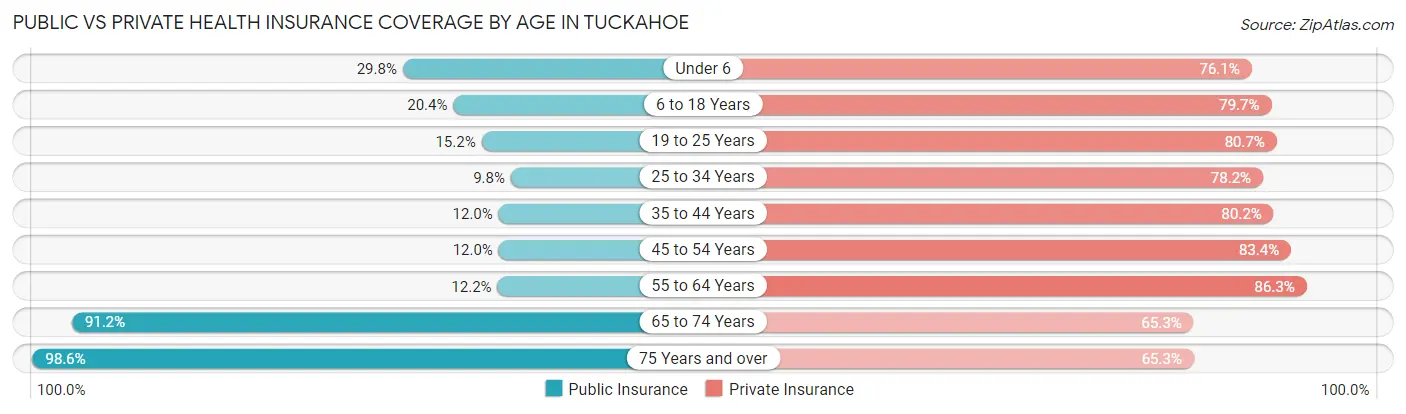
| Age Bracket | Public Insurance | Private Insurance |
| Under 6 | 1,185 (29.8%) | 3,023 (76.0%) |
| 6 to 18 Years | 1,635 (20.4%) | 6,379 (79.7%) |
| 19 to 25 Years | 618 (15.2%) | 3,282 (80.7%) |
| 25 to 34 Years | 513 (9.8%) | 4,111 (78.2%) |
| 35 to 44 Years | 696 (12.0%) | 4,640 (80.1%) |
| 45 to 54 Years | 757 (12.0%) | 5,258 (83.4%) |
| 55 to 64 Years | 676 (12.2%) | 4,766 (86.3%) |
| 65 to 74 Years | 4,185 (91.2%) | 2,996 (65.3%) |
| 75 Years and over | 4,200 (98.6%) | 2,784 (65.3%) |
| Total | 14,465 (30.3%) | 37,239 (77.9%) |
Disability Status by Sex by Age in Tuckahoe
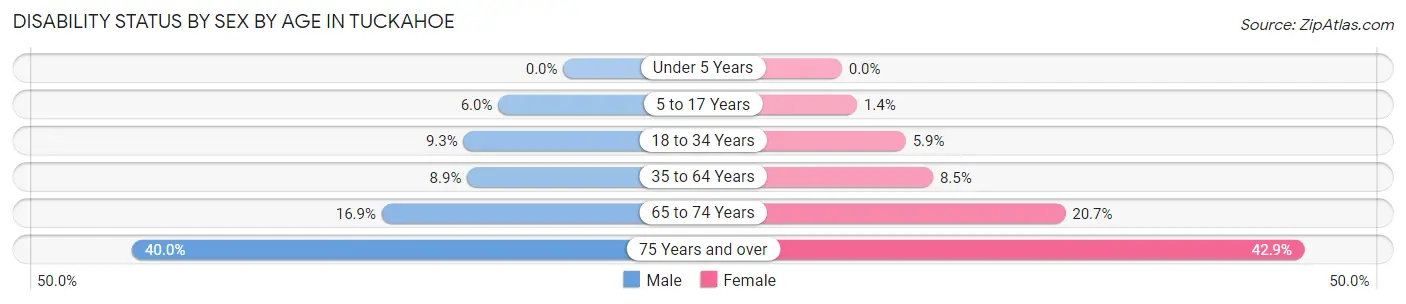
| Age Bracket | Male | Female |
| Under 5 Years | 0 (0.0%) | 0 (0.0%) |
| 5 to 17 Years | 242 (6.0%) | 57 (1.4%) |
| 18 to 34 Years | 501 (9.3%) | 267 (5.9%) |
| 35 to 64 Years | 748 (8.9%) | 781 (8.5%) |
| 65 to 74 Years | 315 (16.9%) | 564 (20.7%) |
| 75 Years and over | 596 (40.0%) | 1,189 (42.9%) |
Disability Class by Sex by Age in Tuckahoe
Disability Class: Hearing Difficulty
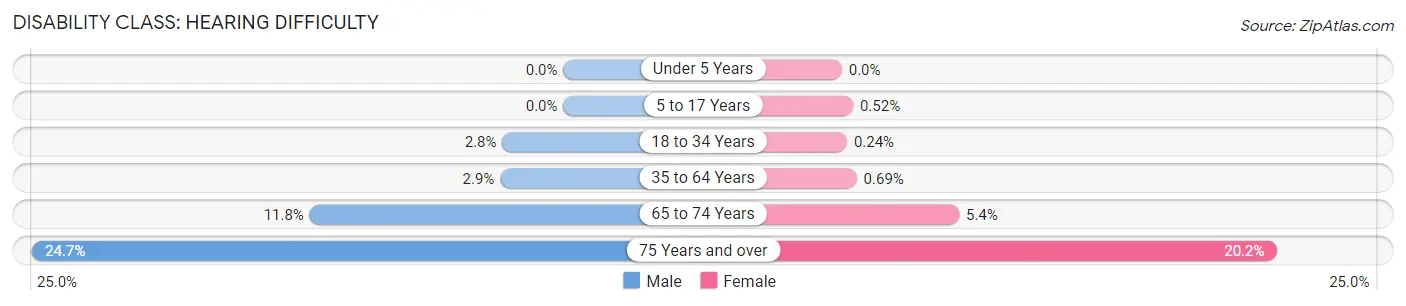
| Age Bracket | Male | Female |
| Under 5 Years | 0 (0.0%) | 0 (0.0%) |
| 5 to 17 Years | 0 (0.0%) | 21 (0.5%) |
| 18 to 34 Years | 153 (2.8%) | 11 (0.2%) |
| 35 to 64 Years | 246 (2.9%) | 64 (0.7%) |
| 65 to 74 Years | 220 (11.8%) | 148 (5.4%) |
| 75 Years and over | 367 (24.6%) | 559 (20.2%) |
Disability Class: Vision Difficulty
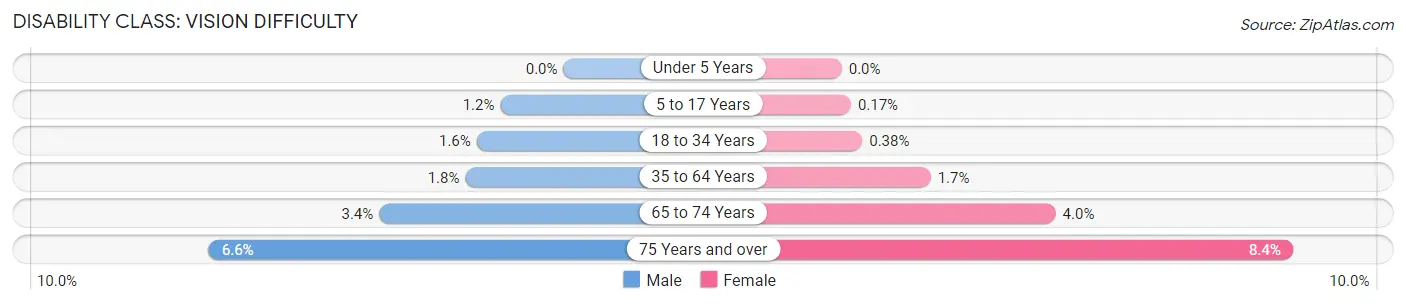
| Age Bracket | Male | Female |
| Under 5 Years | 0 (0.0%) | 0 (0.0%) |
| 5 to 17 Years | 47 (1.2%) | 7 (0.2%) |
| 18 to 34 Years | 87 (1.6%) | 17 (0.4%) |
| 35 to 64 Years | 153 (1.8%) | 152 (1.7%) |
| 65 to 74 Years | 64 (3.4%) | 108 (4.0%) |
| 75 Years and over | 98 (6.6%) | 232 (8.4%) |
Disability Class: Cognitive Difficulty
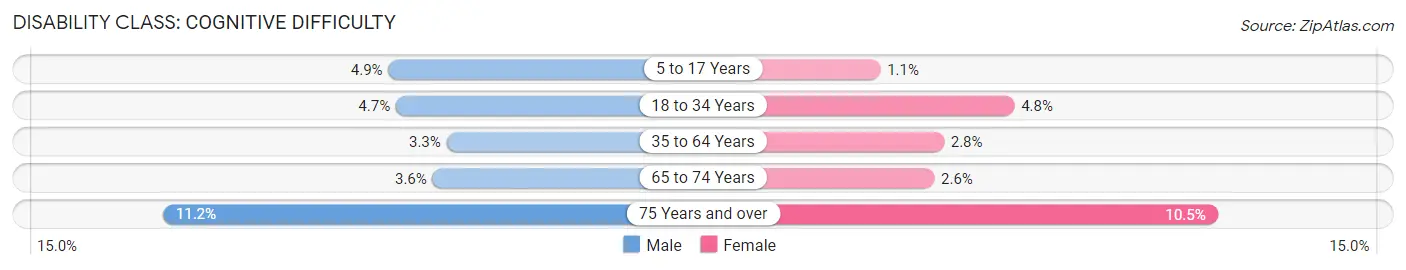
| Age Bracket | Male | Female |
| 5 to 17 Years | 195 (4.9%) | 43 (1.1%) |
| 18 to 34 Years | 252 (4.7%) | 216 (4.8%) |
| 35 to 64 Years | 273 (3.3%) | 262 (2.8%) |
| 65 to 74 Years | 68 (3.6%) | 70 (2.6%) |
| 75 Years and over | 166 (11.2%) | 290 (10.5%) |
Disability Class: Ambulatory Difficulty
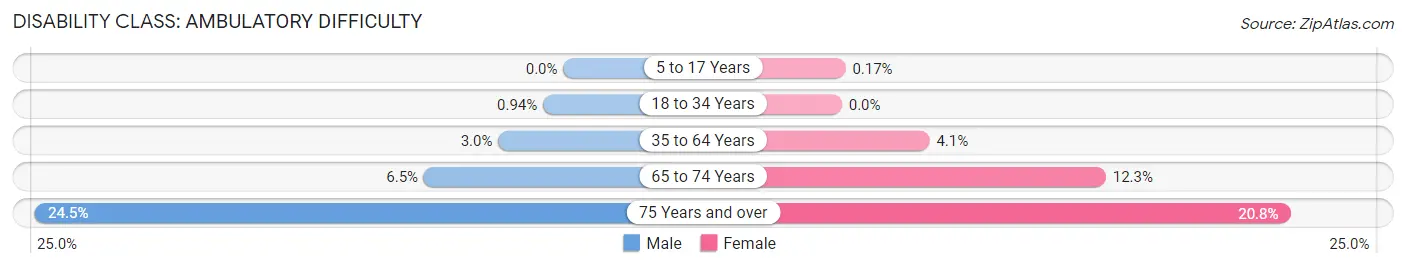
| Age Bracket | Male | Female |
| 5 to 17 Years | 0 (0.0%) | 7 (0.2%) |
| 18 to 34 Years | 51 (0.9%) | 0 (0.0%) |
| 35 to 64 Years | 253 (3.0%) | 376 (4.1%) |
| 65 to 74 Years | 121 (6.5%) | 333 (12.2%) |
| 75 Years and over | 365 (24.5%) | 577 (20.8%) |
Disability Class: Self-Care Difficulty
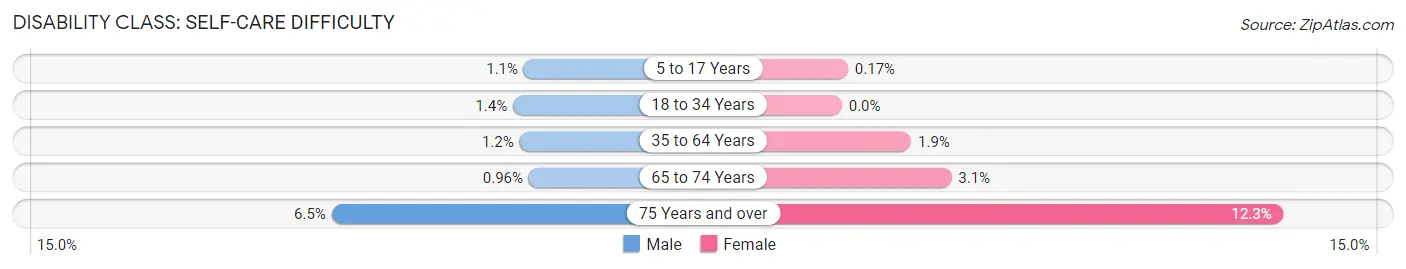
| Age Bracket | Male | Female |
| 5 to 17 Years | 44 (1.1%) | 7 (0.2%) |
| 18 to 34 Years | 76 (1.4%) | 0 (0.0%) |
| 35 to 64 Years | 102 (1.2%) | 178 (1.9%) |
| 65 to 74 Years | 18 (1.0%) | 83 (3.0%) |
| 75 Years and over | 96 (6.5%) | 341 (12.3%) |
Technology Access in Tuckahoe
Computing Device Access in Tuckahoe
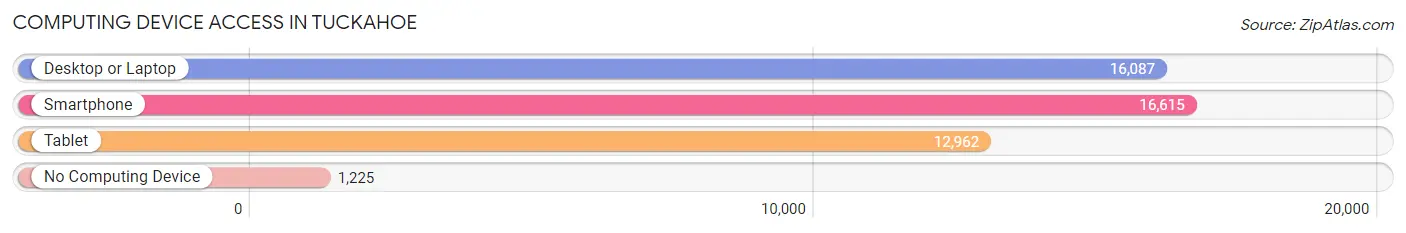
| Device Type | # Households | % Households |
| Desktop or Laptop | 16,087 | 83.6% |
| Smartphone | 16,615 | 86.4% |
| Tablet | 12,962 | 67.4% |
| No Computing Device | 1,225 | 6.4% |
| Total | 19,236 | 100.0% |
Internet Access in Tuckahoe
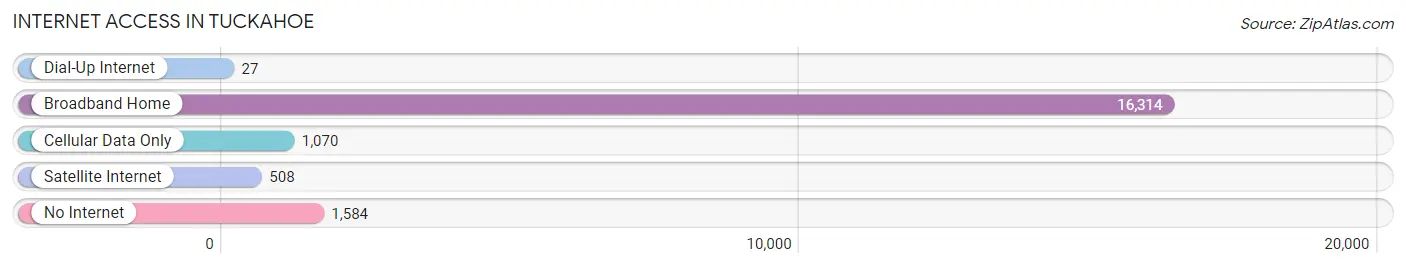
| Internet Type | # Households | % Households |
| Dial-Up Internet | 27 | 0.1% |
| Broadband Home | 16,314 | 84.8% |
| Cellular Data Only | 1,070 | 5.6% |
| Satellite Internet | 508 | 2.6% |
| No Internet | 1,584 | 8.2% |
| Total | 19,236 | 100.0% |
Tuckahoe Summary
Tuckahoe is a small unincorporated community located in Henrico County, Virginia. It is situated just east of Richmond, the state capital, and is part of the Greater Richmond Region. The community is bordered by the city of Richmond to the west, the city of Henrico to the north, and the city of Chesterfield to the south.
History
Tuckahoe was first settled in the early 1700s by English colonists. The name “Tuckahoe” is derived from the Algonquian language and means “a place of many deer.” The area was originally part of Henrico County, but was annexed by the city of Richmond in 1910.
Tuckahoe was home to a number of prominent Virginians, including Thomas Jefferson, who lived in the area from 1770 to 1774. During this time, Jefferson attended the Tuckahoe Academy, a school for boys founded by his father, Peter Jefferson.
In the late 19th century, Tuckahoe became a popular summer resort for wealthy Richmonders. The area was home to several grand hotels, including the Tuckahoe Hotel, which was built in 1891 and was the largest hotel in the state at the time.
Geography
Tuckahoe is located in Henrico County, Virginia, just east of Richmond. The community is bordered by the city of Richmond to the west, the city of Henrico to the north, and the city of Chesterfield to the south.
The area is mostly flat, with an elevation of about 200 feet above sea level. The soil is mostly sandy loam, with some clay and gravel. The climate is humid subtropical, with hot, humid summers and mild winters.
Economy
Tuckahoe’s economy is largely based on retail and services. The area is home to several shopping centers, including the Tuckahoe Village Shopping Center, which features a variety of stores and restaurants.
The area is also home to several corporate offices, including the headquarters of the Dominion Energy Corporation. The area is also home to several medical facilities, including the Tuckahoe Medical Center.
Demographics
As of the 2010 census, the population of Tuckahoe was 8,902. The racial makeup of the area was 79.3% White, 14.2% African American, 0.3% Native American, 2.2% Asian, and 4.0% from other races.
The median household income in Tuckahoe was $63,945, and the median family income was $76,945. The per capita income was $31,945. The unemployment rate was 4.2%.
Conclusion
Tuckahoe is a small unincorporated community located in Henrico County, Virginia. It is situated just east of Richmond, the state capital, and is part of the Greater Richmond Region. The community is bordered by the city of Richmond to the west, the city of Henrico to the north, and the city of Chesterfield to the south. Tuckahoe was first settled in the early 1700s by English colonists, and was home to a number of prominent Virginians, including Thomas Jefferson. The area is mostly flat, with an elevation of about 200 feet above sea level. The climate is humid subtropical, with hot, humid summers and mild winters. Tuckahoe’s economy is largely based on retail and services, and the area is home to several corporate offices and medical facilities. As of the 2010 census, the population of Tuckahoe was 8,902. The racial makeup of the area was 79.3% White, 14.2% African American, 0.3% Native American, 2.2% Asian, and 4.0% from other races. The median household income in Tuckahoe was $63,945, and the median family income was $76,945. The per capita income was $31,945. The unemployment rate was 4.2%.
Common Questions
What is Per Capita Income in Tuckahoe?
Per Capita income in Tuckahoe is $57,684.
What is the Median Family Income in Tuckahoe?
Median Family Income in Tuckahoe is $117,413.
What is the Median Household income in Tuckahoe?
Median Household Income in Tuckahoe is $89,920.
What is Income or Wage Gap in Tuckahoe?
Income or Wage Gap in Tuckahoe is 25.1%.
Women in Tuckahoe earn 74.9 cents for every dollar earned by a man.
What is Family Income Deficit in Tuckahoe?
Family Income Deficit in Tuckahoe is $8,154.
Families that are below poverty line in Tuckahoe earn $8,154 less on average than the poverty threshold level.
What is Inequality or Gini Index in Tuckahoe?
Inequality or Gini Index in Tuckahoe is 0.51.
What is the Total Population of Tuckahoe?
Total Population of Tuckahoe is 48,049.
What is the Total Male Population of Tuckahoe?
Total Male Population of Tuckahoe is 22,489.
What is the Total Female Population of Tuckahoe?
Total Female Population of Tuckahoe is 25,560.
What is the Ratio of Males per 100 Females in Tuckahoe?
There are 87.99 Males per 100 Females in Tuckahoe.
What is the Ratio of Females per 100 Males in Tuckahoe?
There are 113.66 Females per 100 Males in Tuckahoe.
What is the Median Population Age in Tuckahoe?
Median Population Age in Tuckahoe is 39.9 Years.
What is the Average Family Size in Tuckahoe
Average Family Size in Tuckahoe is 3.1 People.
What is the Average Household Size in Tuckahoe
Average Household Size in Tuckahoe is 2.5 People.
How Large is the Labor Force in Tuckahoe?
There are 24,954 People in the Labor Forcein in Tuckahoe.
What is the Percentage of People in the Labor Force in Tuckahoe?
65.7% of People are in the Labor Force in Tuckahoe.
What is the Unemployment Rate in Tuckahoe?
Unemployment Rate in Tuckahoe is 4.5%.