Chatham, VA Map & Demographics
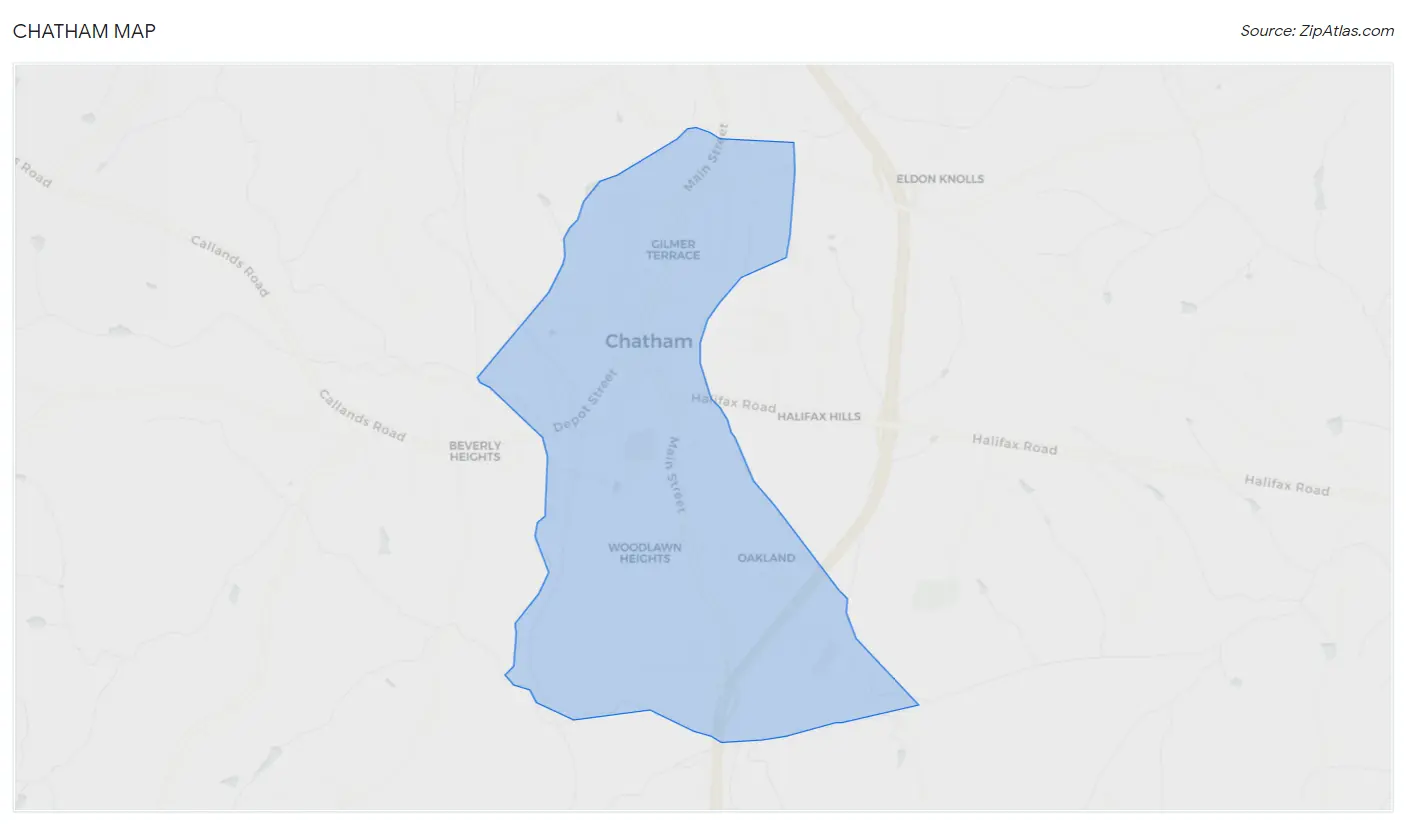
Chatham Map
Chatham Overview
$26,755
PER CAPITA INCOME
$69,375
AVG FAMILY INCOME
$55,865
AVG HOUSEHOLD INCOME
23.9%
WAGE / INCOME GAP [ % ]
76.1¢/ $1
WAGE / INCOME GAP [ $ ]
0.38
INEQUALITY / GINI INDEX
1,637
TOTAL POPULATION
838
MALE POPULATION
799
FEMALE POPULATION
104.88
MALES / 100 FEMALES
95.35
FEMALES / 100 MALES
36.5
MEDIAN AGE
3.3
AVG FAMILY SIZE
2.6
AVG HOUSEHOLD SIZE
655
LABOR FORCE [ PEOPLE ]
50.3%
PERCENT IN LABOR FORCE
2.9%
UNEMPLOYMENT RATE
Chatham Zip Codes
Chatham Area Codes
Income in Chatham
Income Overview in Chatham
Per Capita Income in Chatham is $26,755, while median incomes of families and households are $69,375 and $55,865 respectively.
| Characteristic | Number | Measure |
| Per Capita Income | 1,637 | $26,755 |
| Median Family Income | 372 | $69,375 |
| Mean Family Income | 372 | $88,211 |
| Median Household Income | 577 | $55,865 |
| Mean Household Income | 577 | $71,644 |
| Income Deficit | 372 | $0 |
| Wage / Income Gap (%) | 1,637 | 23.92% |
| Wage / Income Gap ($) | 1,637 | 76.08¢ per $1 |
| Gini / Inequality Index | 1,637 | 0.38 |
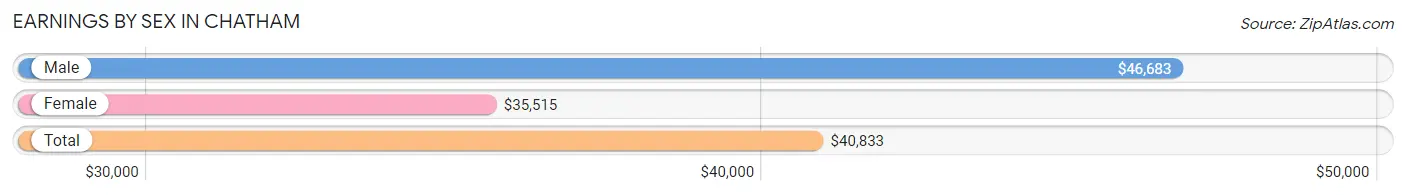
Earnings by Sex in Chatham
Average Earnings in Chatham are $40,833, $46,683 for men and $35,515 for women, a difference of 23.9%.
| Sex | Number | Average Earnings |
| Male | 405 (55.3%) | $46,683 |
| Female | 327 (44.7%) | $35,515 |
| Total | 732 (100.0%) | $40,833 |
Earnings by Sex by Income Bracket in Chatham
The most common earnings brackets in Chatham are $65,000 to $74,999 for men (59 | 14.6%) and $20,000 to $22,499 for women (55 | 16.8%).
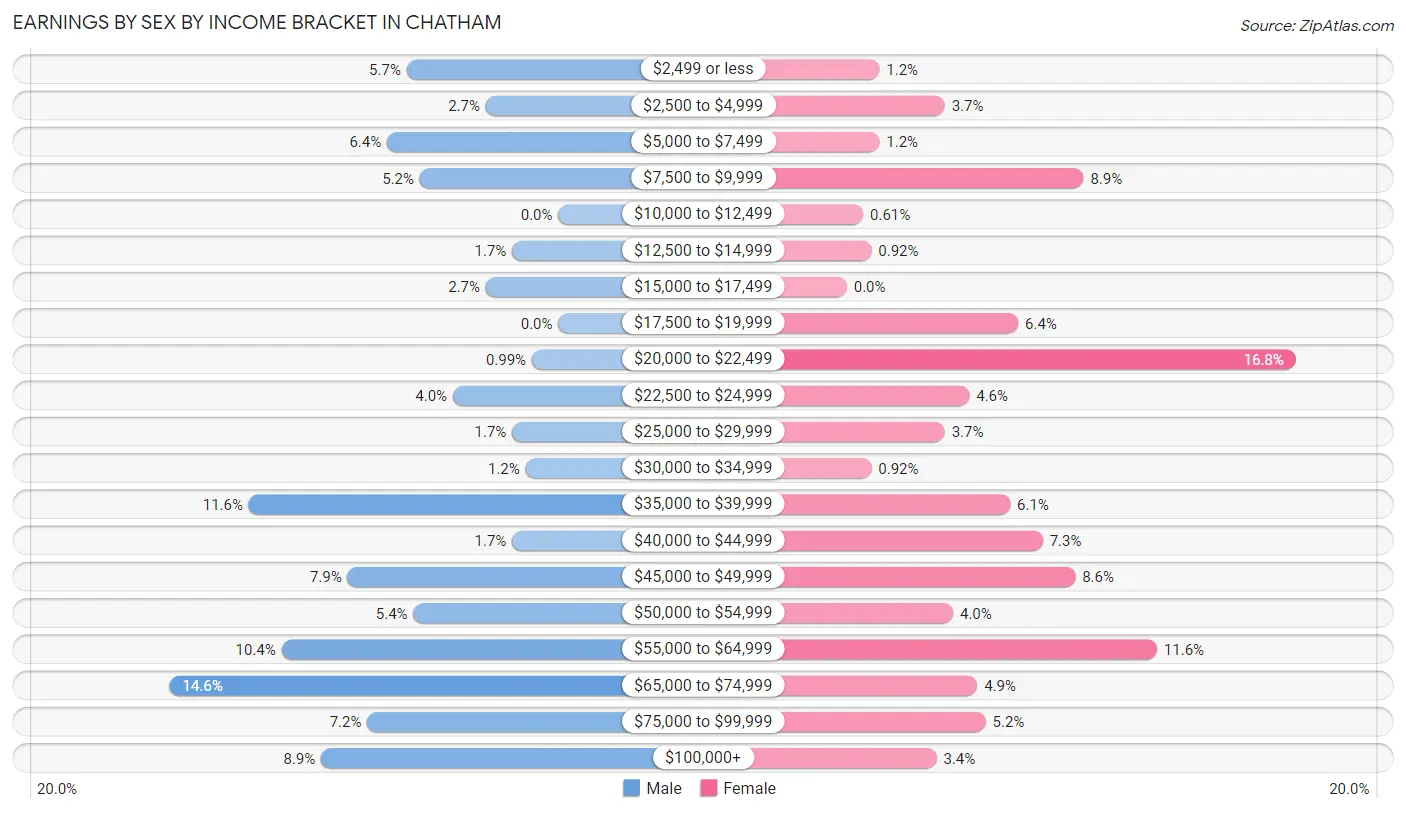
| Income | Male | Female |
| $2,499 or less | 23 (5.7%) | 4 (1.2%) |
| $2,500 to $4,999 | 11 (2.7%) | 12 (3.7%) |
| $5,000 to $7,499 | 26 (6.4%) | 4 (1.2%) |
| $7,500 to $9,999 | 21 (5.2%) | 29 (8.9%) |
| $10,000 to $12,499 | 0 (0.0%) | 2 (0.6%) |
| $12,500 to $14,999 | 7 (1.7%) | 3 (0.9%) |
| $15,000 to $17,499 | 11 (2.7%) | 0 (0.0%) |
| $17,500 to $19,999 | 0 (0.0%) | 21 (6.4%) |
| $20,000 to $22,499 | 4 (1.0%) | 55 (16.8%) |
| $22,500 to $24,999 | 16 (4.0%) | 15 (4.6%) |
| $25,000 to $29,999 | 7 (1.7%) | 12 (3.7%) |
| $30,000 to $34,999 | 5 (1.2%) | 3 (0.9%) |
| $35,000 to $39,999 | 47 (11.6%) | 20 (6.1%) |
| $40,000 to $44,999 | 7 (1.7%) | 24 (7.3%) |
| $45,000 to $49,999 | 32 (7.9%) | 28 (8.6%) |
| $50,000 to $54,999 | 22 (5.4%) | 13 (4.0%) |
| $55,000 to $64,999 | 42 (10.4%) | 38 (11.6%) |
| $65,000 to $74,999 | 59 (14.6%) | 16 (4.9%) |
| $75,000 to $99,999 | 29 (7.2%) | 17 (5.2%) |
| $100,000+ | 36 (8.9%) | 11 (3.4%) |
| Total | 405 (100.0%) | 327 (100.0%) |
Earnings by Sex by Educational Attainment in Chatham
Average earnings in Chatham are $50,511 for men and $38,333 for women, a difference of 24.1%. Men with an educational attainment of graduate degree enjoy the highest average annual earnings of $69,750, while those with less than high school education earn the least with $38,333. Women with an educational attainment of graduate degree earn the most with the average annual earnings of $56,400, while those with college or associate's degree education have the smallest earnings of $23,500.
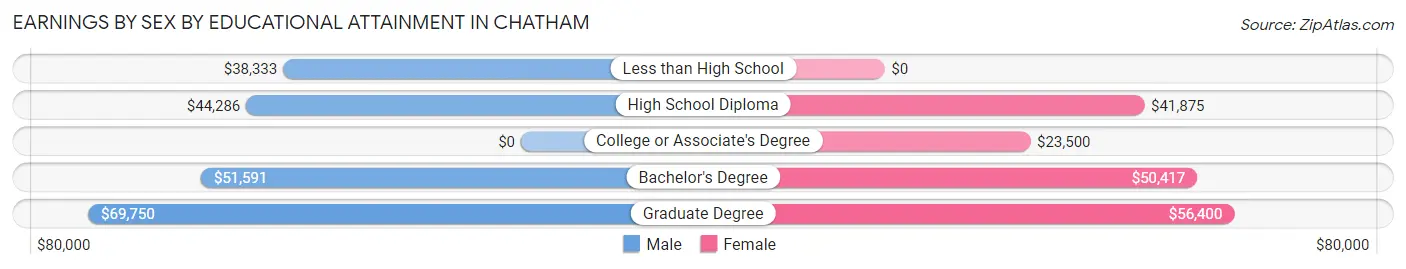
| Educational Attainment | Male Income | Female Income |
| Less than High School | $38,333 | $0 |
| High School Diploma | $44,286 | $41,875 |
| College or Associate's Degree | - | - |
| Bachelor's Degree | $51,591 | $50,417 |
| Graduate Degree | $69,750 | $56,400 |
| Total | $50,511 | $38,333 |
Family Income in Chatham
Family Income Brackets in Chatham
According to the Chatham family income data, there are 89 families falling into the $100,000 to $149,999 income range, which is the most common income bracket and makes up 23.9% of all families.
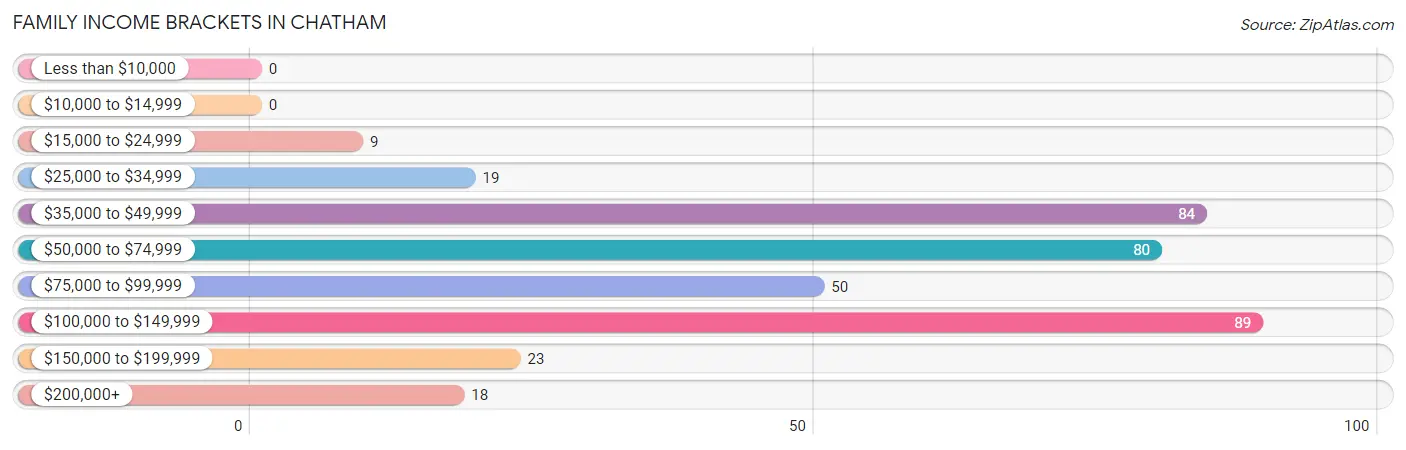
| Income Bracket | # Families | % Families |
| Less than $10,000 | 0 | 0.0% |
| $10,000 to $14,999 | 0 | 0.0% |
| $15,000 to $24,999 | 9 | 2.4% |
| $25,000 to $34,999 | 19 | 5.1% |
| $35,000 to $49,999 | 84 | 22.6% |
| $50,000 to $74,999 | 80 | 21.5% |
| $75,000 to $99,999 | 50 | 13.4% |
| $100,000 to $149,999 | 89 | 23.9% |
| $150,000 to $199,999 | 23 | 6.2% |
| $200,000+ | 18 | 4.8% |
Family Income by Famaliy Size in Chatham
4-person families (84 | 22.6%) account for the highest median family income in Chatham with $130,938 per family, while 4-person families (84 | 22.6%) have the highest median income of $32,734 per family member.
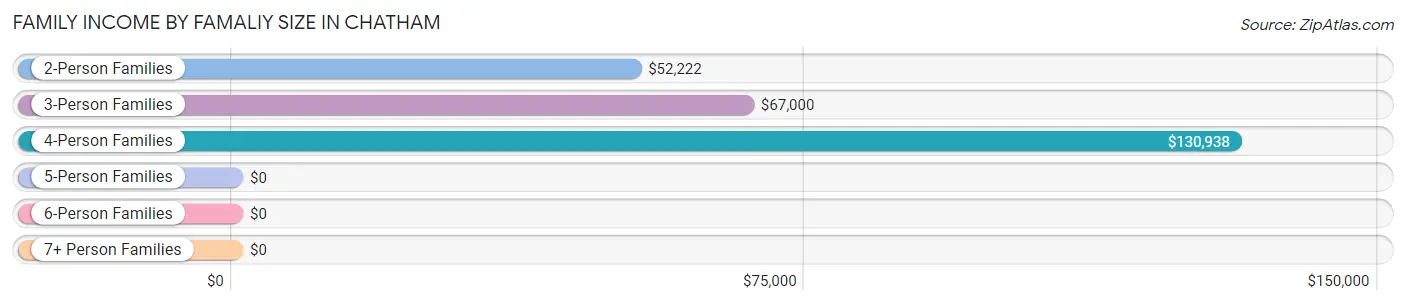
| Income Bracket | # Families | Median Income |
| 2-Person Families | 150 (40.3%) | $52,222 |
| 3-Person Families | 88 (23.7%) | $67,000 |
| 4-Person Families | 84 (22.6%) | $130,938 |
| 5-Person Families | 34 (9.1%) | $0 |
| 6-Person Families | 16 (4.3%) | $0 |
| 7+ Person Families | 0 (0.0%) | $0 |
| Total | 372 (100.0%) | $69,375 |
Family Income by Number of Earners in Chatham
The median family income in Chatham is $69,375, with families comprising 2 earners (128) having the highest median family income of $114,444, while families with no earners (59) have the lowest median family income of $50,114, accounting for 34.4% and 15.9% of families, respectively.
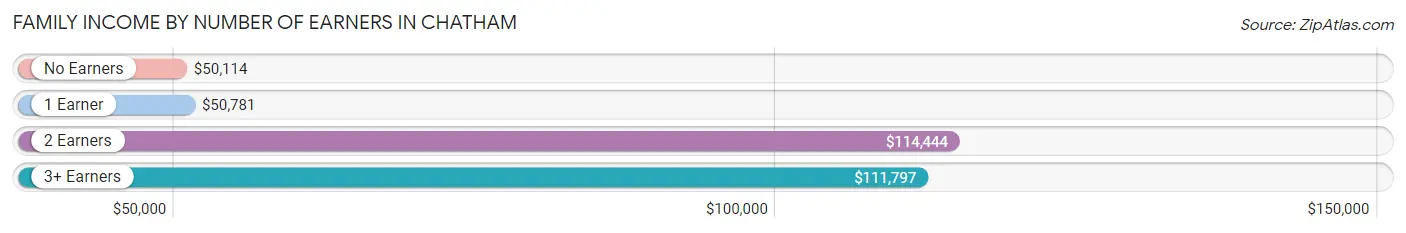
| Number of Earners | # Families | Median Income |
| No Earners | 59 (15.9%) | $50,114 |
| 1 Earner | 158 (42.5%) | $50,781 |
| 2 Earners | 128 (34.4%) | $114,444 |
| 3+ Earners | 27 (7.3%) | $111,797 |
| Total | 372 (100.0%) | $69,375 |
Household Income in Chatham
Household Income Brackets in Chatham
With 142 households falling in the category, the $50,000 to $74,999 income range is the most frequent in Chatham, accounting for 24.6% of all households. In contrast, only 11 households (1.9%) fall into the $10,000 to $14,999 income bracket, making it the least populous group.
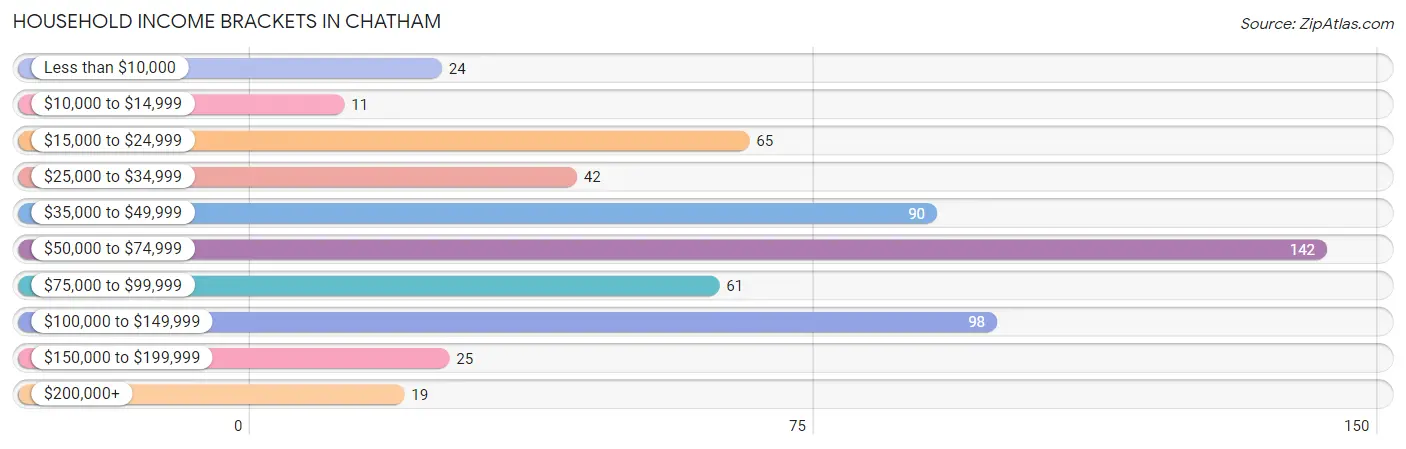
| Income Bracket | # Households | % Households |
| Less than $10,000 | 24 | 4.2% |
| $10,000 to $14,999 | 11 | 1.9% |
| $15,000 to $24,999 | 65 | 11.3% |
| $25,000 to $34,999 | 42 | 7.3% |
| $35,000 to $49,999 | 90 | 15.6% |
| $50,000 to $74,999 | 142 | 24.6% |
| $75,000 to $99,999 | 61 | 10.6% |
| $100,000 to $149,999 | 98 | 17.0% |
| $150,000 to $199,999 | 25 | 4.3% |
| $200,000+ | 19 | 3.3% |
Household Income by Householder Age in Chatham
The median household income in Chatham is $55,865, with the highest median household income of $67,865 found in the 45 to 64 years age bracket for the primary householder. A total of 183 households (31.7%) fall into this category. Meanwhile, the 65+ years age bracket for the primary householder has the lowest median household income of $47,083, with 179 households (31.0%) in this group.
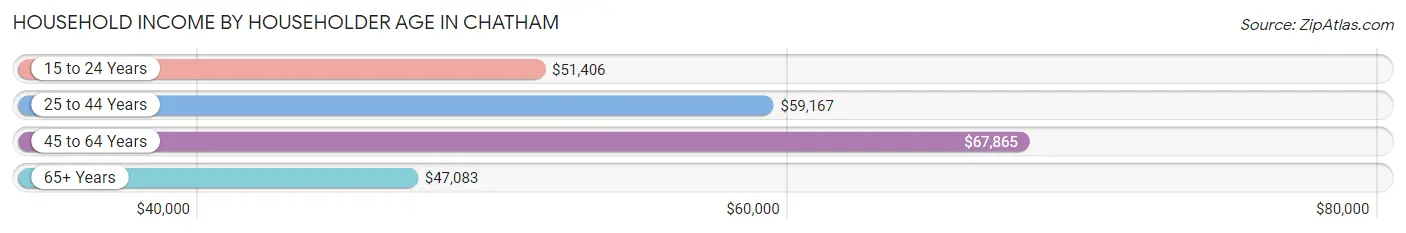
| Income Bracket | # Households | Median Income |
| 15 to 24 Years | 11 (1.9%) | $51,406 |
| 25 to 44 Years | 204 (35.4%) | $59,167 |
| 45 to 64 Years | 183 (31.7%) | $67,865 |
| 65+ Years | 179 (31.0%) | $47,083 |
| Total | 577 (100.0%) | $55,865 |
Poverty in Chatham
Income Below Poverty by Sex and Age in Chatham
With 6.1% poverty level for males and 6.7% for females among the residents of Chatham, 25 to 34 year old males and 18 to 24 year old females are the most vulnerable to poverty, with 21 males (16.8%) and 15 females (32.6%) in their respective age groups living below the poverty level.
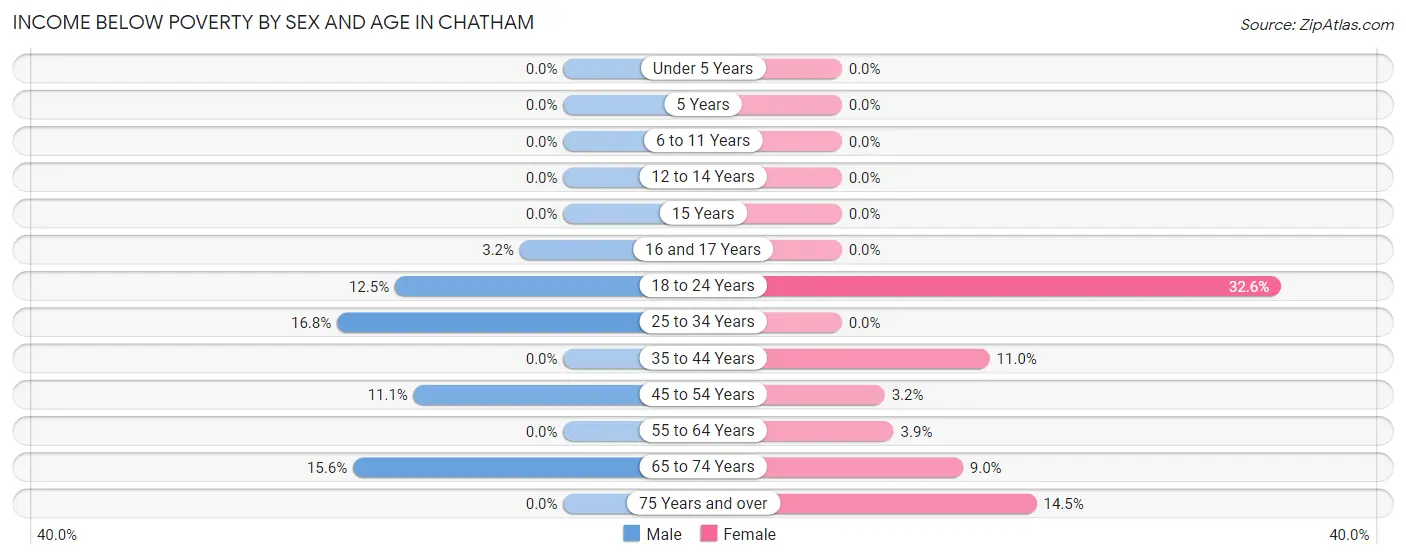
| Age Bracket | Male | Female |
| Under 5 Years | 0 (0.0%) | 0 (0.0%) |
| 5 Years | 0 (0.0%) | 0 (0.0%) |
| 6 to 11 Years | 0 (0.0%) | 0 (0.0%) |
| 12 to 14 Years | 0 (0.0%) | 0 (0.0%) |
| 15 Years | 0 (0.0%) | 0 (0.0%) |
| 16 and 17 Years | 2 (3.2%) | 0 (0.0%) |
| 18 to 24 Years | 4 (12.5%) | 15 (32.6%) |
| 25 to 34 Years | 21 (16.8%) | 0 (0.0%) |
| 35 to 44 Years | 0 (0.0%) | 9 (11.0%) |
| 45 to 54 Years | 8 (11.1%) | 3 (3.2%) |
| 55 to 64 Years | 0 (0.0%) | 3 (3.8%) |
| 65 to 74 Years | 10 (15.6%) | 8 (9.0%) |
| 75 Years and over | 0 (0.0%) | 12 (14.5%) |
| Total | 45 (6.1%) | 50 (6.7%) |
Income Above Poverty by Sex and Age in Chatham
According to the poverty statistics in Chatham, males aged under 5 years and females aged under 5 years are the age groups that are most secure financially, with 100.0% of males and 100.0% of females in these age groups living above the poverty line.
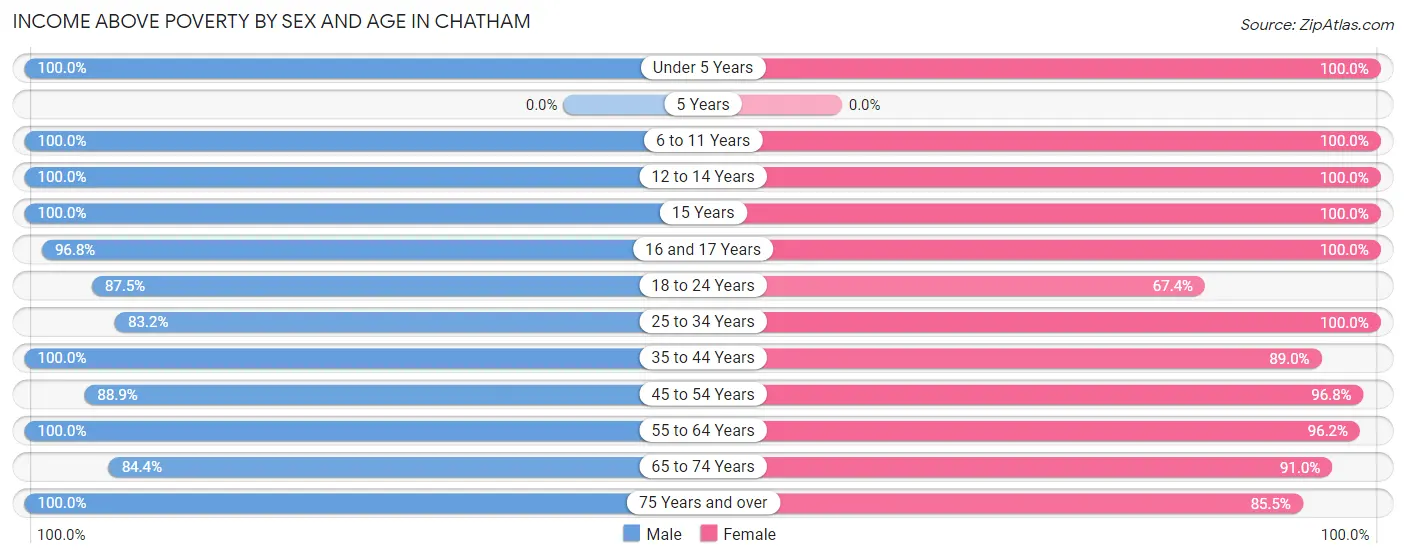
| Age Bracket | Male | Female |
| Under 5 Years | 106 (100.0%) | 22 (100.0%) |
| 5 Years | 0 (0.0%) | 0 (0.0%) |
| 6 to 11 Years | 54 (100.0%) | 87 (100.0%) |
| 12 to 14 Years | 19 (100.0%) | 20 (100.0%) |
| 15 Years | 13 (100.0%) | 11 (100.0%) |
| 16 and 17 Years | 60 (96.8%) | 6 (100.0%) |
| 18 to 24 Years | 28 (87.5%) | 31 (67.4%) |
| 25 to 34 Years | 104 (83.2%) | 133 (100.0%) |
| 35 to 44 Years | 99 (100.0%) | 73 (89.0%) |
| 45 to 54 Years | 64 (88.9%) | 91 (96.8%) |
| 55 to 64 Years | 23 (100.0%) | 75 (96.2%) |
| 65 to 74 Years | 54 (84.4%) | 81 (91.0%) |
| 75 Years and over | 67 (100.0%) | 71 (85.5%) |
| Total | 691 (93.9%) | 701 (93.3%) |
Income Below Poverty Among Married-Couple Families in Chatham
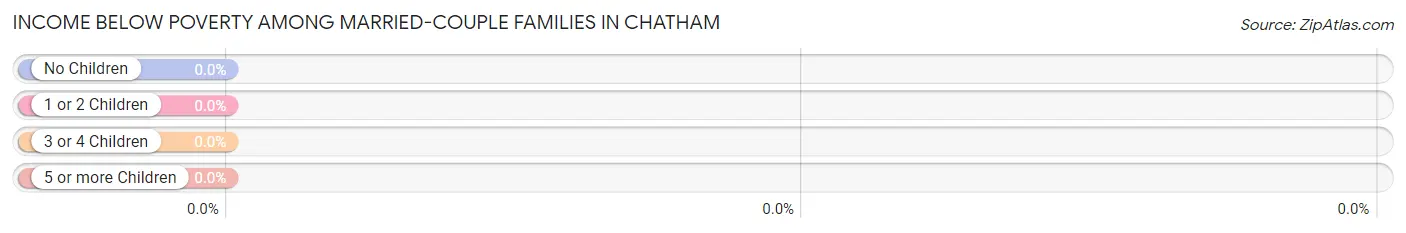
| Children | Above Poverty | Below Poverty |
| No Children | 124 (100.0%) | 0 (0.0%) |
| 1 or 2 Children | 123 (100.0%) | 0 (0.0%) |
| 3 or 4 Children | 50 (100.0%) | 0 (0.0%) |
| 5 or more Children | 0 (0.0%) | 0 (0.0%) |
| Total | 297 (100.0%) | 0 (0.0%) |
Income Below Poverty Among Single-Parent Households in Chatham
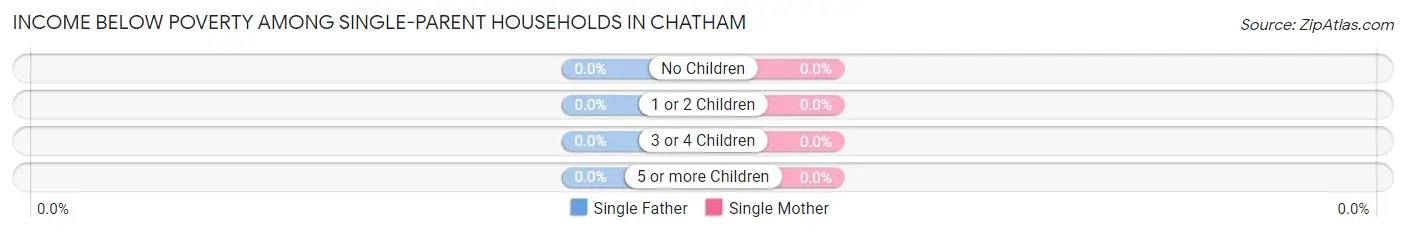
| Children | Single Father | Single Mother |
| No Children | 0 (0.0%) | 0 (0.0%) |
| 1 or 2 Children | 0 (0.0%) | 0 (0.0%) |
| 3 or 4 Children | 0 (0.0%) | 0 (0.0%) |
| 5 or more Children | 0 (0.0%) | 0 (0.0%) |
| Total | 0 (0.0%) | 0 (0.0%) |
Income Below Poverty Among Married-Couple vs Single-Parent Households in Chatham
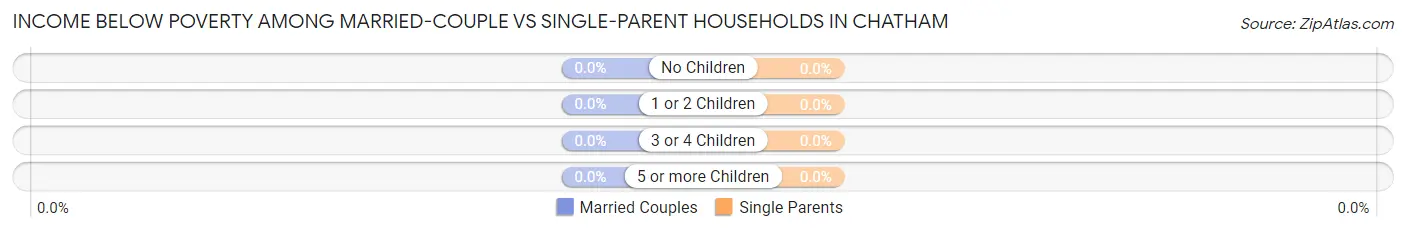
| Children | Married-Couple Families | Single-Parent Households |
| No Children | 0 (0.0%) | 0 (0.0%) |
| 1 or 2 Children | 0 (0.0%) | 0 (0.0%) |
| 3 or 4 Children | 0 (0.0%) | 0 (0.0%) |
| 5 or more Children | 0 (0.0%) | 0 (0.0%) |
| Total | 0 (0.0%) | 0 (0.0%) |
Race in Chatham
The most populous races in Chatham are White / Caucasian (1,176 | 71.8%), Black / African American (327 | 20.0%), and Two or more Races (97 | 5.9%).
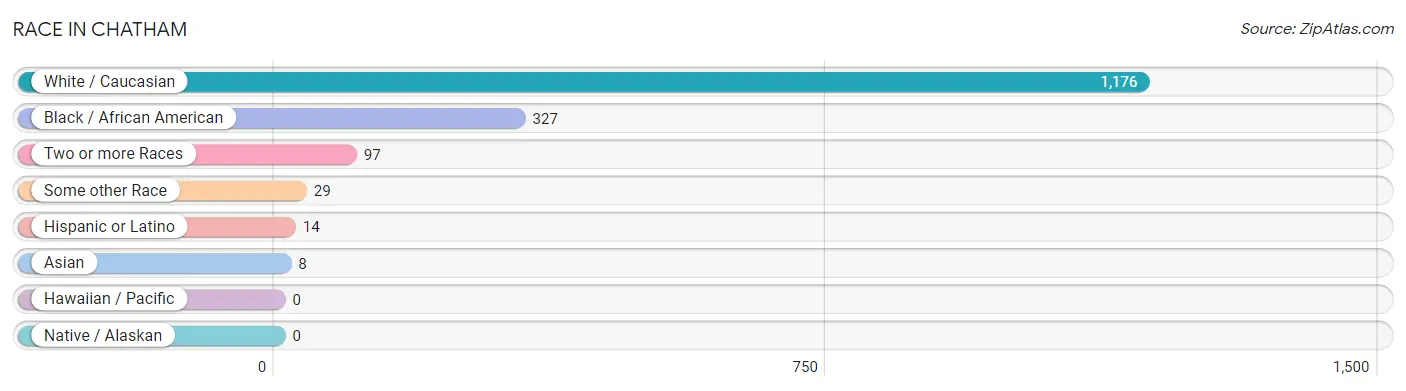
| Race | # Population | % Population |
| Asian | 8 | 0.5% |
| Black / African American | 327 | 20.0% |
| Hawaiian / Pacific | 0 | 0.0% |
| Hispanic or Latino | 14 | 0.9% |
| Native / Alaskan | 0 | 0.0% |
| White / Caucasian | 1,176 | 71.8% |
| Two or more Races | 97 | 5.9% |
| Some other Race | 29 | 1.8% |
| Total | 1,637 | 100.0% |
Ancestry in Chatham
The most populous ancestries reported in Chatham are English (401 | 24.5%), American (269 | 16.4%), German (163 | 10.0%), Irish (136 | 8.3%), and Scotch-Irish (120 | 7.3%), together accounting for 66.5% of all Chatham residents.
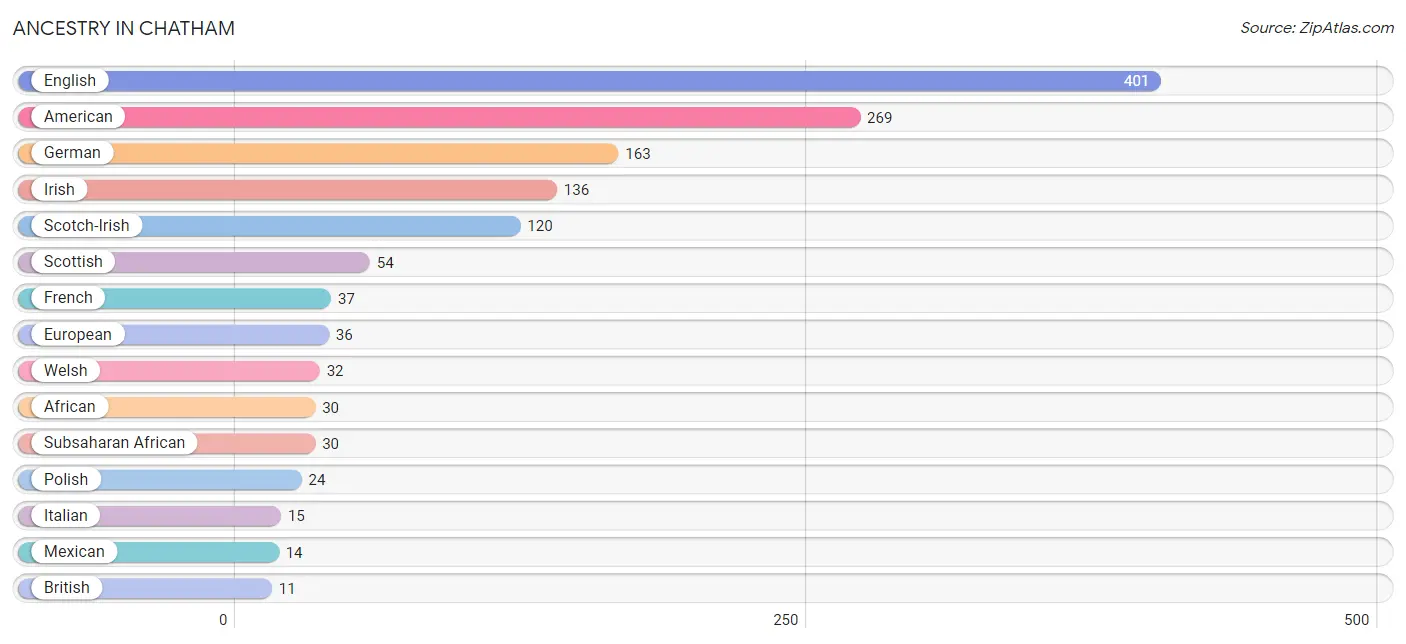
| Ancestry | # Population | % Population |
| African | 30 | 1.8% |
| American | 269 | 16.4% |
| British | 11 | 0.7% |
| Canadian | 3 | 0.2% |
| Czechoslovakian | 4 | 0.2% |
| Danish | 2 | 0.1% |
| Dutch | 8 | 0.5% |
| English | 401 | 24.5% |
| European | 36 | 2.2% |
| French | 37 | 2.3% |
| French Canadian | 9 | 0.5% |
| German | 163 | 10.0% |
| Irish | 136 | 8.3% |
| Italian | 15 | 0.9% |
| Mexican | 14 | 0.9% |
| Northern European | 3 | 0.2% |
| Polish | 24 | 1.5% |
| Russian | 7 | 0.4% |
| Scandinavian | 6 | 0.4% |
| Scotch-Irish | 120 | 7.3% |
| Scottish | 54 | 3.3% |
| Subsaharan African | 30 | 1.8% |
| Swiss | 6 | 0.4% |
| Thai | 8 | 0.5% |
| Trinidadian and Tobagonian | 3 | 0.2% |
| Welsh | 32 | 1.9% | View All 26 Rows |
Immigrants in Chatham
The most numerous immigrant groups reported in Chatham came from Asia (14 | 0.9%), Malaysia (8 | 0.5%), South Eastern Asia (8 | 0.5%), Europe (7 | 0.4%), and China (6 | 0.4%), together accounting for 2.6% of all Chatham residents.
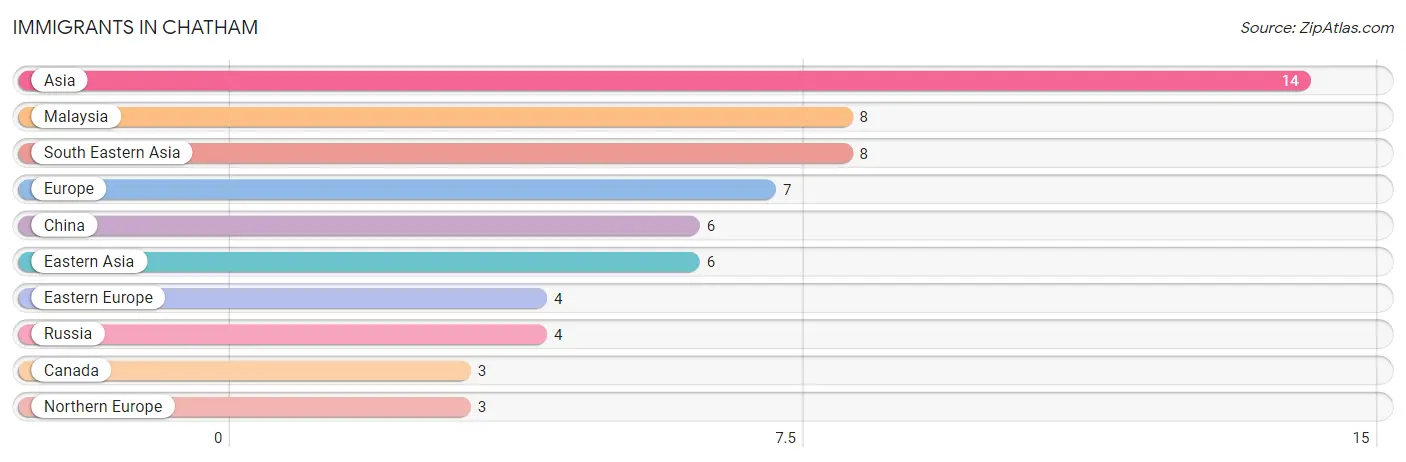
| Immigration Origin | # Population | % Population |
| Asia | 14 | 0.9% |
| Canada | 3 | 0.2% |
| China | 6 | 0.4% |
| Eastern Asia | 6 | 0.4% |
| Eastern Europe | 4 | 0.2% |
| Europe | 7 | 0.4% |
| Malaysia | 8 | 0.5% |
| Northern Europe | 3 | 0.2% |
| Russia | 4 | 0.2% |
| South Eastern Asia | 8 | 0.5% | View All 10 Rows |
Sex and Age in Chatham
Sex and Age in Chatham
The most populous age groups in Chatham are 30 to 34 Years (108 | 12.9%) for men and 25 to 29 Years (103 | 12.9%) for women.
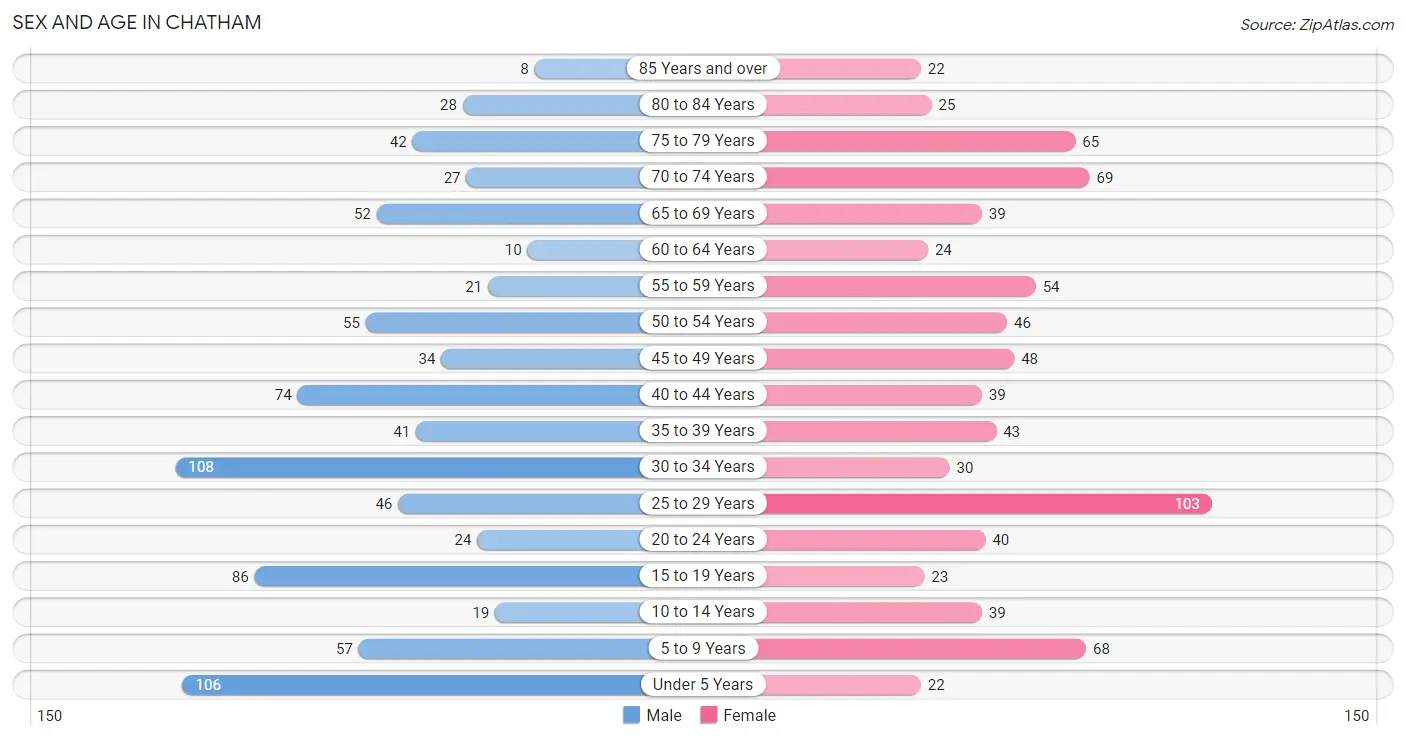
| Age Bracket | Male | Female |
| Under 5 Years | 106 (12.7%) | 22 (2.8%) |
| 5 to 9 Years | 57 (6.8%) | 68 (8.5%) |
| 10 to 14 Years | 19 (2.3%) | 39 (4.9%) |
| 15 to 19 Years | 86 (10.3%) | 23 (2.9%) |
| 20 to 24 Years | 24 (2.9%) | 40 (5.0%) |
| 25 to 29 Years | 46 (5.5%) | 103 (12.9%) |
| 30 to 34 Years | 108 (12.9%) | 30 (3.7%) |
| 35 to 39 Years | 41 (4.9%) | 43 (5.4%) |
| 40 to 44 Years | 74 (8.8%) | 39 (4.9%) |
| 45 to 49 Years | 34 (4.1%) | 48 (6.0%) |
| 50 to 54 Years | 55 (6.6%) | 46 (5.8%) |
| 55 to 59 Years | 21 (2.5%) | 54 (6.8%) |
| 60 to 64 Years | 10 (1.2%) | 24 (3.0%) |
| 65 to 69 Years | 52 (6.2%) | 39 (4.9%) |
| 70 to 74 Years | 27 (3.2%) | 69 (8.6%) |
| 75 to 79 Years | 42 (5.0%) | 65 (8.1%) |
| 80 to 84 Years | 28 (3.3%) | 25 (3.1%) |
| 85 Years and over | 8 (0.9%) | 22 (2.8%) |
| Total | 838 (100.0%) | 799 (100.0%) |
Families and Households in Chatham
Median Family Size in Chatham
The median family size in Chatham is 3.26 persons per family, with married-couple families (297 | 79.8%) accounting for the largest median family size of 3.45 persons per family. On the other hand, single male/father families (40 | 10.7%) represent the smallest median family size with 2.18 persons per family.
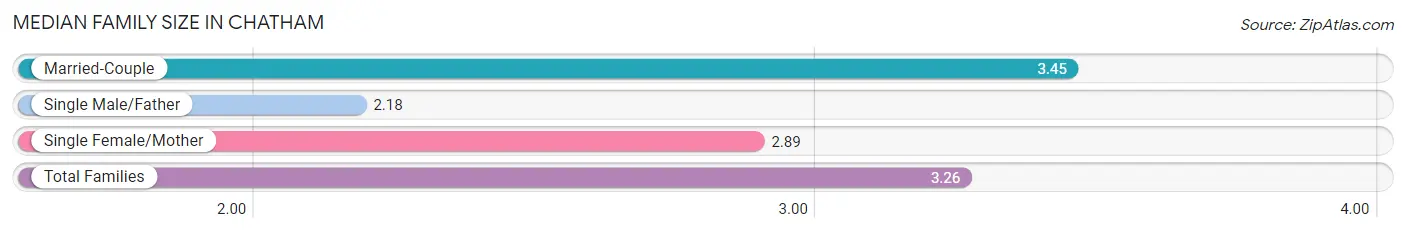
| Family Type | # Families | Family Size |
| Married-Couple | 297 (79.8%) | 3.45 |
| Single Male/Father | 40 (10.7%) | 2.18 |
| Single Female/Mother | 35 (9.4%) | 2.89 |
| Total Families | 372 (100.0%) | 3.26 |
Median Household Size in Chatham
The median household size in Chatham is 2.58 persons per household, with married-couple households (297 | 51.5%) accounting for the largest median household size of 3.46 persons per household. non-family households (205 | 35.5%) represent the smallest median household size with 1.20 persons per household.
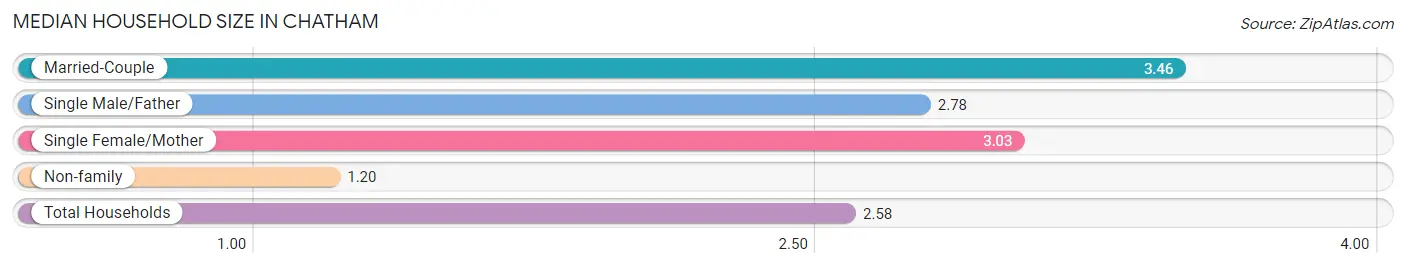
| Household Type | # Households | Household Size |
| Married-Couple | 297 (51.5%) | 3.46 |
| Single Male/Father | 40 (6.9%) | 2.78 |
| Single Female/Mother | 35 (6.1%) | 3.03 |
| Non-family | 205 (35.5%) | 1.20 |
| Total Households | 577 (100.0%) | 2.58 |
Household Size by Marriage Status in Chatham
Out of a total of 577 households in Chatham, 372 (64.5%) are family households, while 205 (35.5%) are nonfamily households. The most numerous type of family households are 2-person households, comprising 136, and the most common type of nonfamily households are 1-person households, comprising 194.
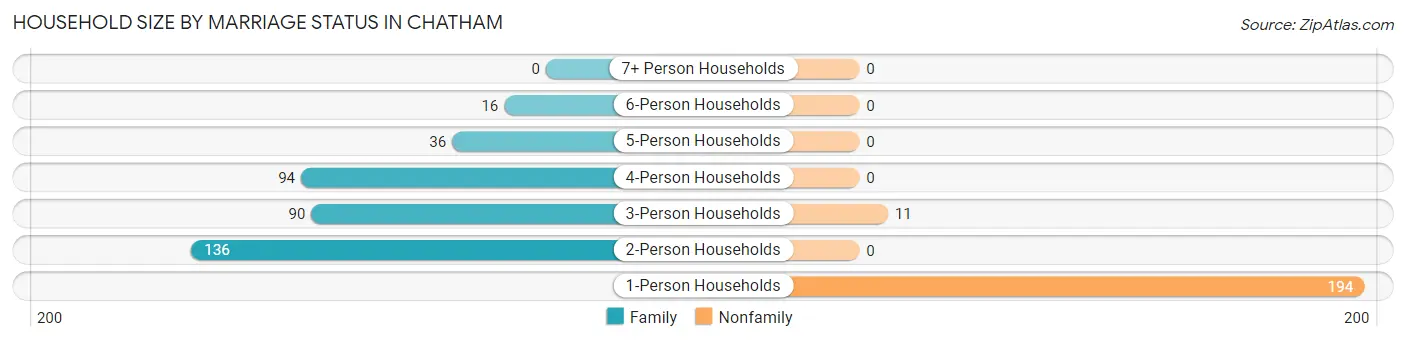
| Household Size | Family Households | Nonfamily Households |
| 1-Person Households | - | 194 (33.6%) |
| 2-Person Households | 136 (23.6%) | 0 (0.0%) |
| 3-Person Households | 90 (15.6%) | 11 (1.9%) |
| 4-Person Households | 94 (16.3%) | 0 (0.0%) |
| 5-Person Households | 36 (6.2%) | 0 (0.0%) |
| 6-Person Households | 16 (2.8%) | 0 (0.0%) |
| 7+ Person Households | 0 (0.0%) | 0 (0.0%) |
| Total | 372 (64.5%) | 205 (35.5%) |
Female Fertility in Chatham
Fertility by Age in Chatham
Average fertility rate in Chatham is 102.0 births per 1,000 women. Women in the age bracket of 20 to 34 years have the highest fertility rate with 202.0 births per 1,000 women. Women in the age bracket of 20 to 34 years acount for 100.0% of all women with births.
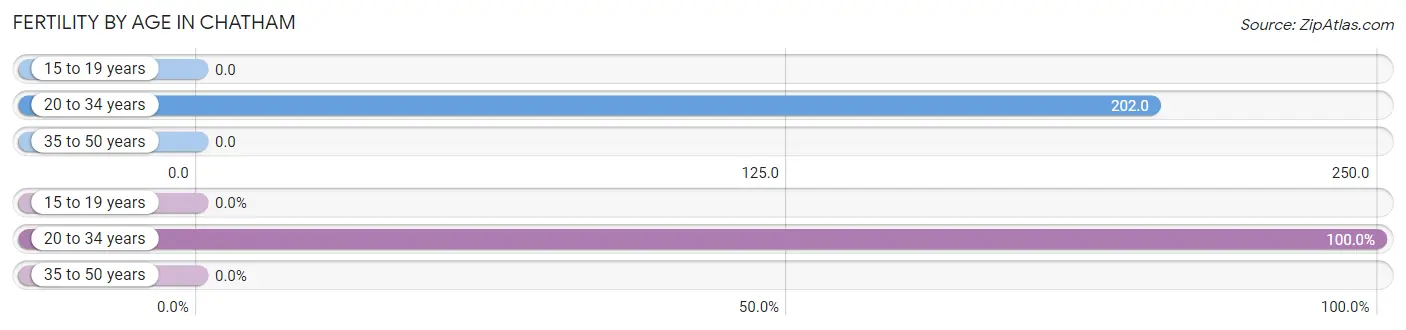
| Age Bracket | Women with Births | Births / 1,000 Women |
| 15 to 19 years | 0 (0.0%) | 0.0 |
| 20 to 34 years | 35 (100.0%) | 202.0 |
| 35 to 50 years | 0 (0.0%) | 0.0 |
| Total | 35 (100.0%) | 102.0 |
Fertility by Age by Marriage Status in Chatham
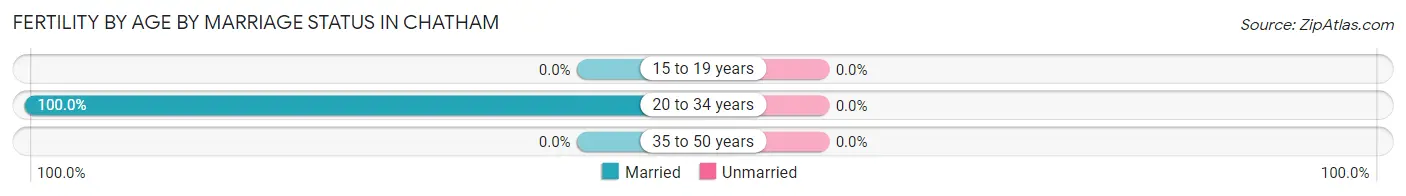
| Age Bracket | Married | Unmarried |
| 15 to 19 years | 0 (0.0%) | 0 (0.0%) |
| 20 to 34 years | 35 (100.0%) | 0 (0.0%) |
| 35 to 50 years | 0 (0.0%) | 0 (0.0%) |
| Total | 35 (100.0%) | 0 (0.0%) |
Fertility by Education in Chatham
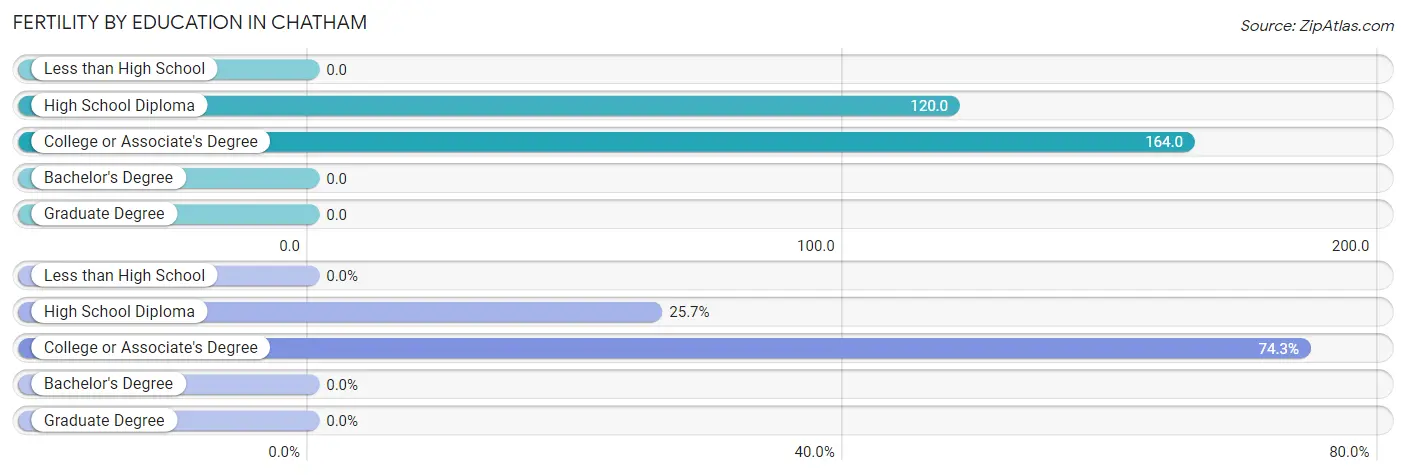
| Educational Attainment | Women with Births | Births / 1,000 Women |
| Less than High School | 0 (0.0%) | 0.0 |
| High School Diploma | 9 (25.7%) | 120.0 |
| College or Associate's Degree | 26 (74.3%) | 164.0 |
| Bachelor's Degree | 0 (0.0%) | 0.0 |
| Graduate Degree | 0 (0.0%) | 0.0 |
| Total | 35 (100.0%) | 102.0 |
Fertility by Education by Marriage Status in Chatham
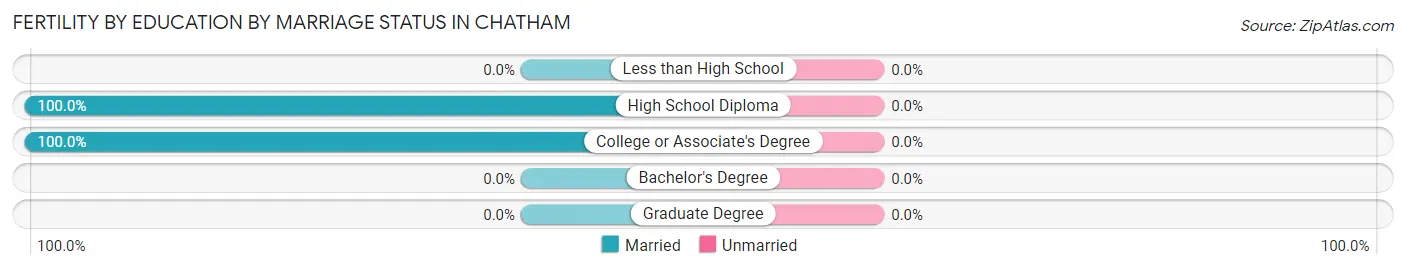
| Educational Attainment | Married | Unmarried |
| Less than High School | 0 (0.0%) | 0 (0.0%) |
| High School Diploma | 9 (100.0%) | 0 (0.0%) |
| College or Associate's Degree | 26 (100.0%) | 0 (0.0%) |
| Bachelor's Degree | 0 (0.0%) | 0 (0.0%) |
| Graduate Degree | 0 (0.0%) | 0 (0.0%) |
| Total | 35 (100.0%) | 0 (0.0%) |
Employment Characteristics in Chatham
Employment by Class of Employer in Chatham
Among the 636 employed individuals in Chatham, private company employees (354 | 55.7%), local government employees (148 | 23.3%), and not-for-profit organizations (58 | 9.1%) make up the most common classes of employment.
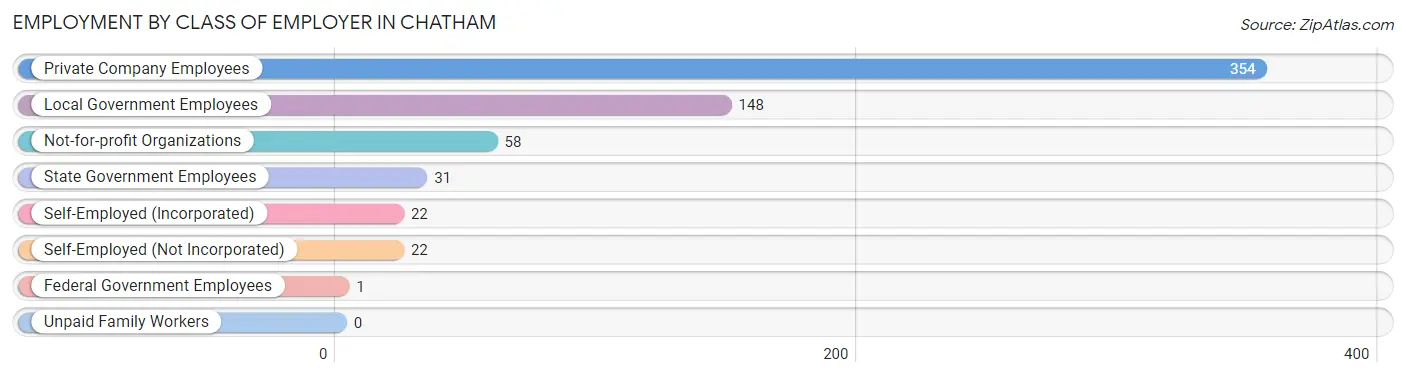
| Employer Class | # Employees | % Employees |
| Private Company Employees | 354 | 55.7% |
| Self-Employed (Incorporated) | 22 | 3.5% |
| Self-Employed (Not Incorporated) | 22 | 3.5% |
| Not-for-profit Organizations | 58 | 9.1% |
| Local Government Employees | 148 | 23.3% |
| State Government Employees | 31 | 4.9% |
| Federal Government Employees | 1 | 0.2% |
| Unpaid Family Workers | 0 | 0.0% |
| Total | 636 | 100.0% |
Employment Status by Age in Chatham
According to the labor force statistics for Chatham, out of the total population over 16 years of age (1,302), 50.3% or 655 individuals are in the labor force, with 2.9% or 19 of them unemployed. The age group with the highest labor force participation rate is 20 to 24 years, with 84.4% or 54 individuals in the labor force. Within the labor force, the 20 to 24 years age range has the highest percentage of unemployed individuals, with 24.1% or 13 of them being unemployed.
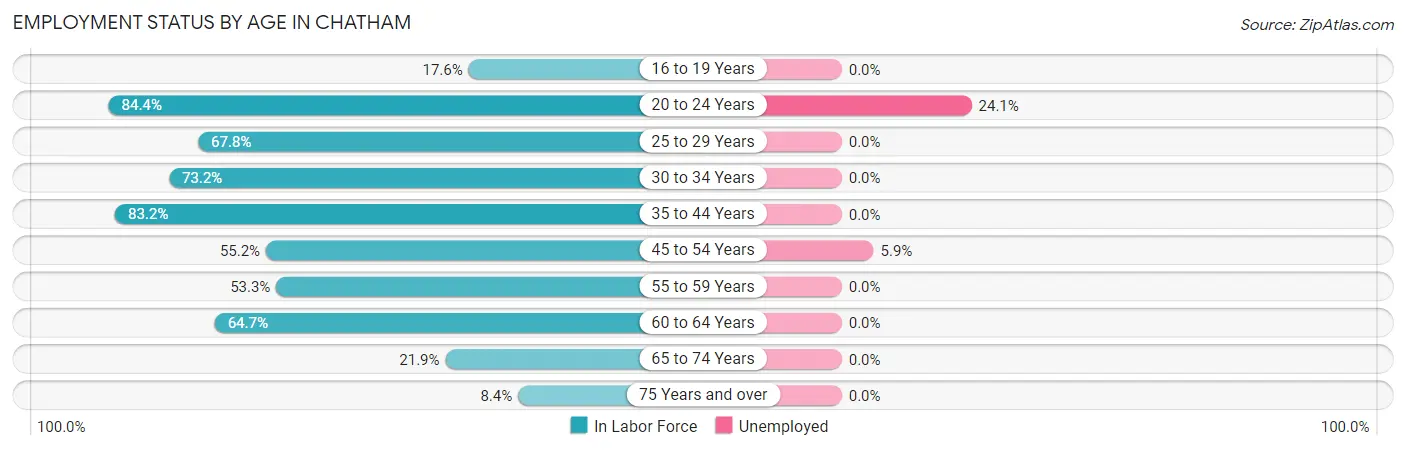
| Age Bracket | In Labor Force | Unemployed |
| 16 to 19 Years | 15 (17.6%) | 0 (0.0%) |
| 20 to 24 Years | 54 (84.4%) | 13 (24.1%) |
| 25 to 29 Years | 101 (67.8%) | 0 (0.0%) |
| 30 to 34 Years | 101 (73.2%) | 0 (0.0%) |
| 35 to 44 Years | 164 (83.2%) | 0 (0.0%) |
| 45 to 54 Years | 101 (55.2%) | 6 (5.9%) |
| 55 to 59 Years | 40 (53.3%) | 0 (0.0%) |
| 60 to 64 Years | 22 (64.7%) | 0 (0.0%) |
| 65 to 74 Years | 41 (21.9%) | 0 (0.0%) |
| 75 Years and over | 16 (8.4%) | 0 (0.0%) |
| Total | 655 (50.3%) | 19 (2.9%) |
Employment Status by Educational Attainment in Chatham
According to labor force statistics for Chatham, 68.2% of individuals (529) out of the total population between 25 and 64 years of age (776) are in the labor force, with 1.1% or 6 of them being unemployed. The group with the highest labor force participation rate are those with the educational attainment of bachelor's degree or higher, with 92.7% or 228 individuals in the labor force. Within the labor force, individuals with bachelor's degree or higher education have the highest percentage of unemployment, with 2.6% or 6 of them being unemployed.
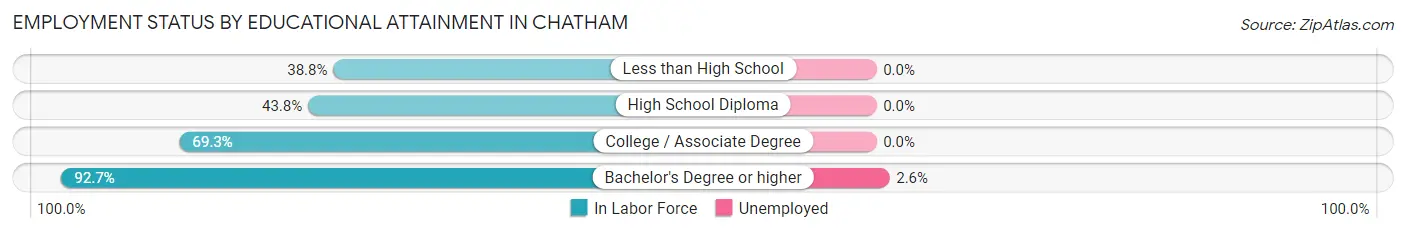
| Educational Attainment | In Labor Force | Unemployed |
| Less than High School | 19 (38.8%) | 0 (0.0%) |
| High School Diploma | 88 (43.8%) | 0 (0.0%) |
| College / Associate Degree | 194 (69.3%) | 0 (0.0%) |
| Bachelor's Degree or higher | 228 (92.7%) | 6 (2.6%) |
| Total | 529 (68.2%) | 9 (1.1%) |
Employment Occupations by Sex in Chatham
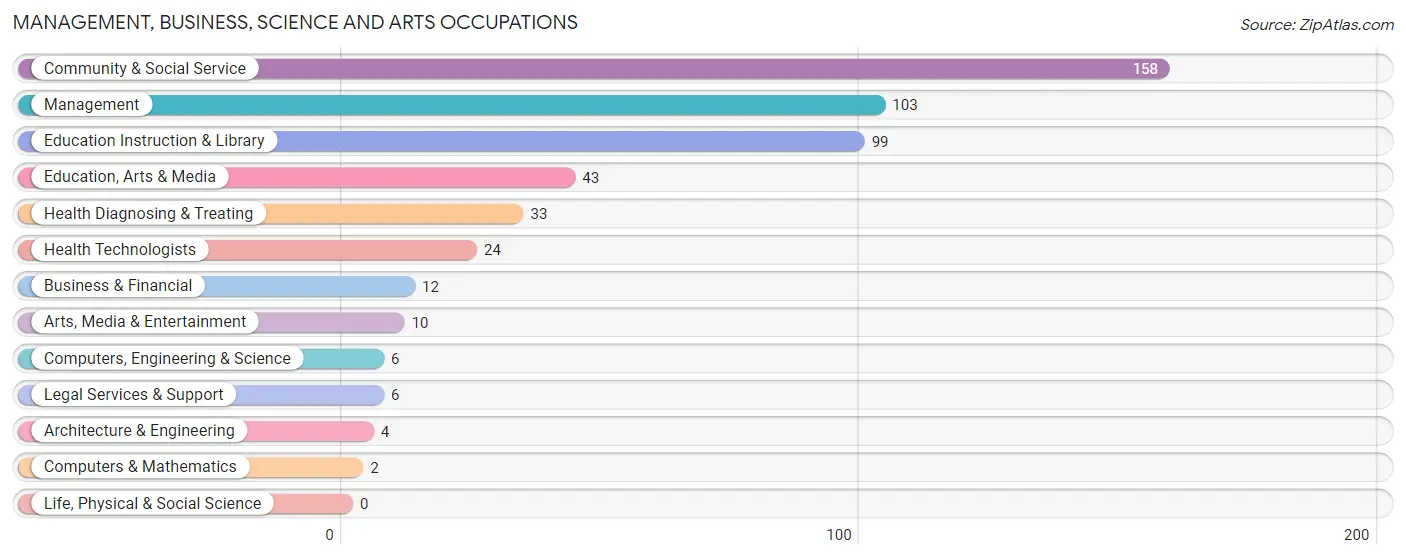
Management, Business, Science and Arts Occupations
The most common Management, Business, Science and Arts occupations in Chatham are Community & Social Service (158 | 24.8%), Management (103 | 16.2%), Education Instruction & Library (99 | 15.6%), Education, Arts & Media (43 | 6.8%), and Health Diagnosing & Treating (33 | 5.2%).
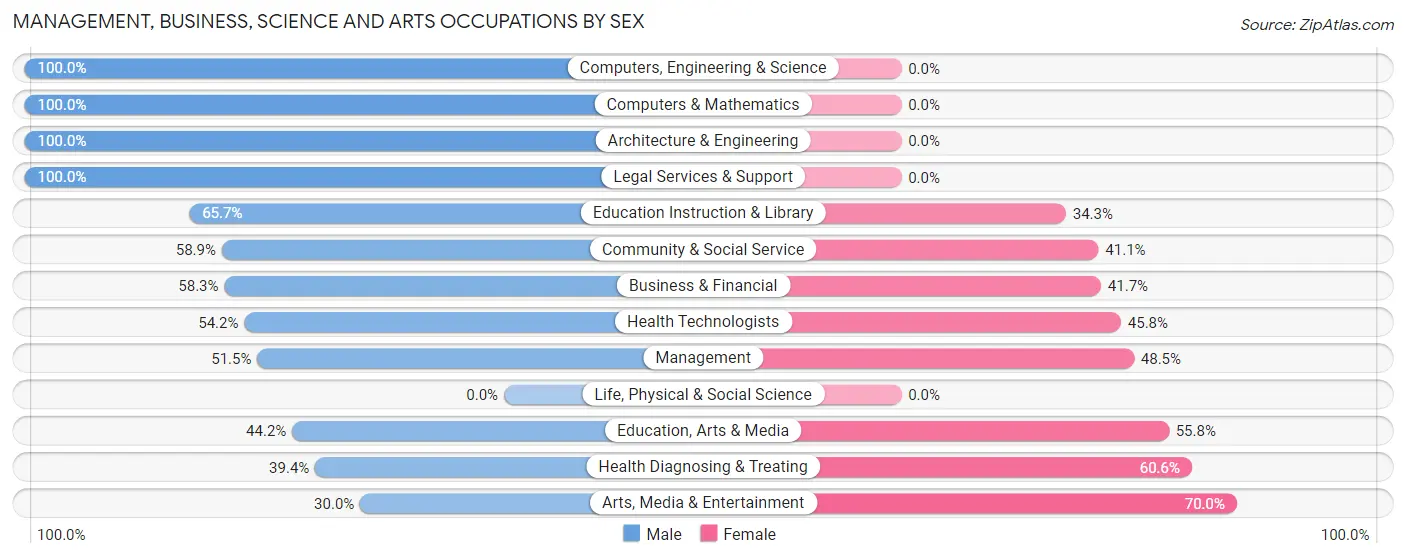
Management, Business, Science and Arts Occupations by Sex
Within the Management, Business, Science and Arts occupations in Chatham, the most male-oriented occupations are Computers, Engineering & Science (100.0%), Computers & Mathematics (100.0%), and Architecture & Engineering (100.0%), while the most female-oriented occupations are Arts, Media & Entertainment (70.0%), Health Diagnosing & Treating (60.6%), and Education, Arts & Media (55.8%).
| Occupation | Male | Female |
| Management | 53 (51.5%) | 50 (48.5%) |
| Business & Financial | 7 (58.3%) | 5 (41.7%) |
| Computers, Engineering & Science | 6 (100.0%) | 0 (0.0%) |
| Computers & Mathematics | 2 (100.0%) | 0 (0.0%) |
| Architecture & Engineering | 4 (100.0%) | 0 (0.0%) |
| Life, Physical & Social Science | 0 (0.0%) | 0 (0.0%) |
| Community & Social Service | 93 (58.9%) | 65 (41.1%) |
| Education, Arts & Media | 19 (44.2%) | 24 (55.8%) |
| Legal Services & Support | 6 (100.0%) | 0 (0.0%) |
| Education Instruction & Library | 65 (65.7%) | 34 (34.3%) |
| Arts, Media & Entertainment | 3 (30.0%) | 7 (70.0%) |
| Health Diagnosing & Treating | 13 (39.4%) | 20 (60.6%) |
| Health Technologists | 13 (54.2%) | 11 (45.8%) |
| Total (Category) | 172 (55.1%) | 140 (44.9%) |
| Total (Overall) | 331 (52.0%) | 305 (48.0%) |
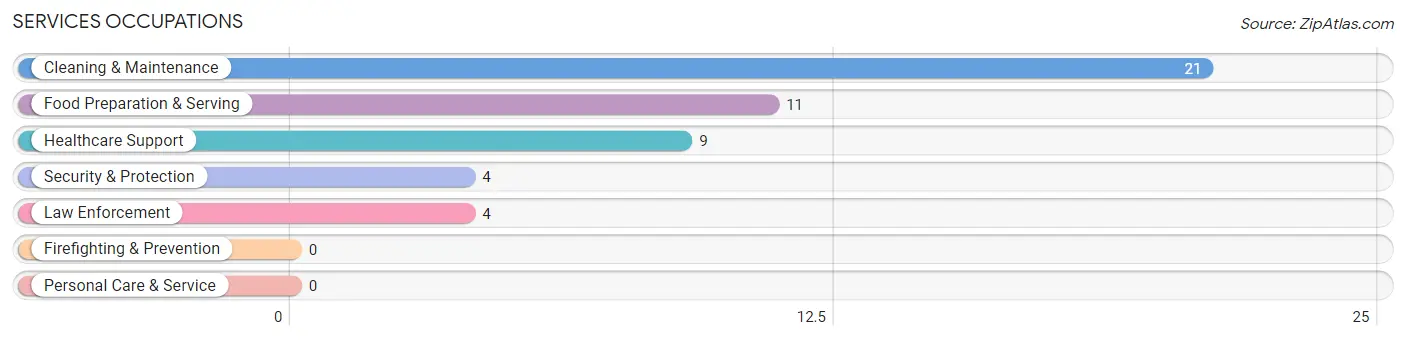
Services Occupations
The most common Services occupations in Chatham are Cleaning & Maintenance (21 | 3.3%), Food Preparation & Serving (11 | 1.7%), Healthcare Support (9 | 1.4%), Security & Protection (4 | 0.6%), and Law Enforcement (4 | 0.6%).
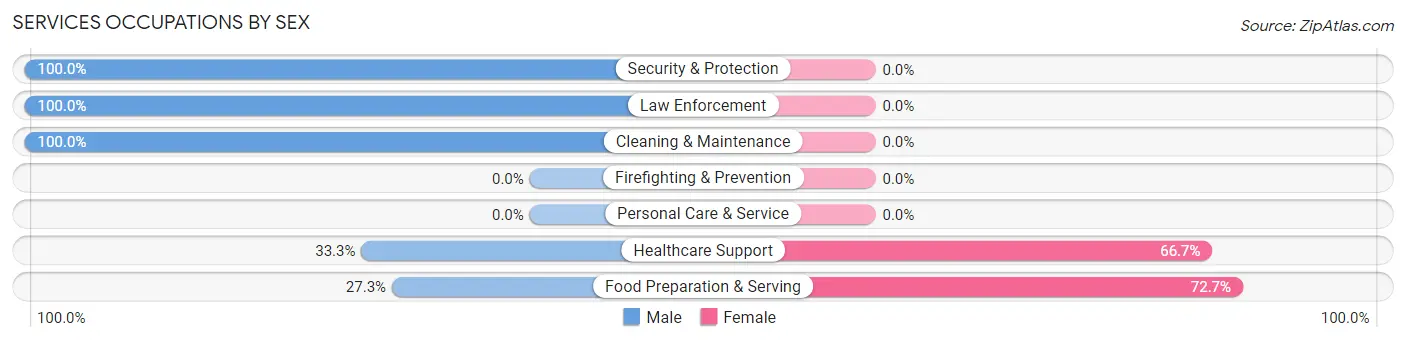
Services Occupations by Sex
Within the Services occupations in Chatham, the most male-oriented occupations are Security & Protection (100.0%), Law Enforcement (100.0%), and Cleaning & Maintenance (100.0%), while the most female-oriented occupations are Food Preparation & Serving (72.7%), and Healthcare Support (66.7%).
| Occupation | Male | Female |
| Healthcare Support | 3 (33.3%) | 6 (66.7%) |
| Security & Protection | 4 (100.0%) | 0 (0.0%) |
| Firefighting & Prevention | 0 (0.0%) | 0 (0.0%) |
| Law Enforcement | 4 (100.0%) | 0 (0.0%) |
| Food Preparation & Serving | 3 (27.3%) | 8 (72.7%) |
| Cleaning & Maintenance | 21 (100.0%) | 0 (0.0%) |
| Personal Care & Service | 0 (0.0%) | 0 (0.0%) |
| Total (Category) | 31 (68.9%) | 14 (31.1%) |
| Total (Overall) | 331 (52.0%) | 305 (48.0%) |
Sales and Office Occupations
The most common Sales and Office occupations in Chatham are Office & Administration (127 | 20.0%), and Sales & Related (36 | 5.7%).
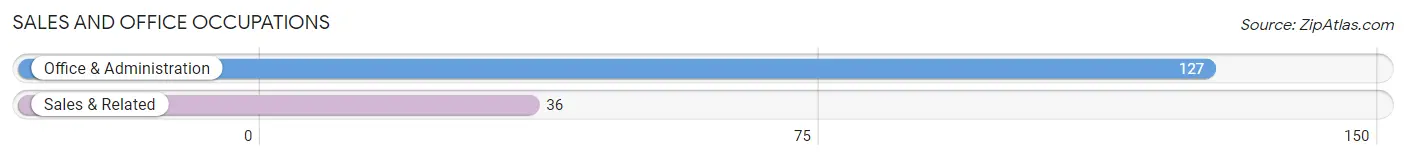
Sales and Office Occupations by Sex
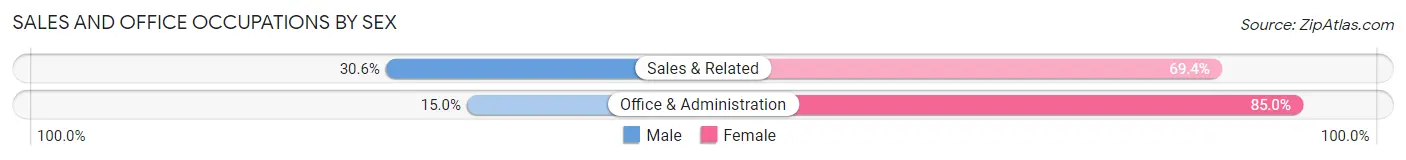
| Occupation | Male | Female |
| Sales & Related | 11 (30.6%) | 25 (69.4%) |
| Office & Administration | 19 (15.0%) | 108 (85.0%) |
| Total (Category) | 30 (18.4%) | 133 (81.6%) |
| Total (Overall) | 331 (52.0%) | 305 (48.0%) |
Natural Resources, Construction and Maintenance Occupations
The most common Natural Resources, Construction and Maintenance occupations in Chatham are Installation, Maintenance & Repair (58 | 9.1%), and Construction & Extraction (14 | 2.2%).
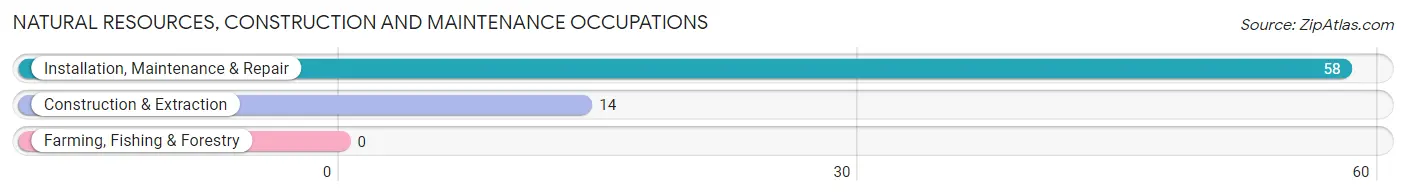
Natural Resources, Construction and Maintenance Occupations by Sex
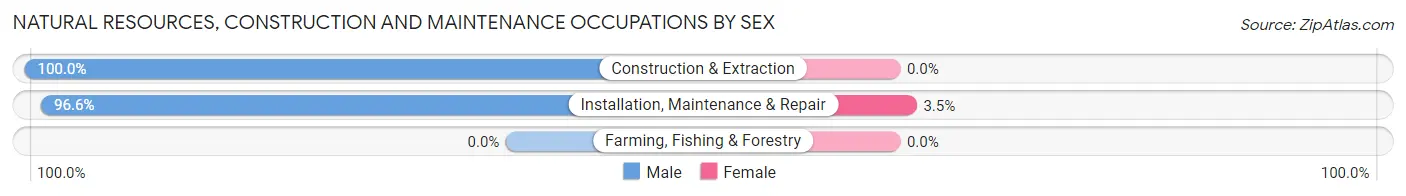
| Occupation | Male | Female |
| Farming, Fishing & Forestry | 0 (0.0%) | 0 (0.0%) |
| Construction & Extraction | 14 (100.0%) | 0 (0.0%) |
| Installation, Maintenance & Repair | 56 (96.6%) | 2 (3.5%) |
| Total (Category) | 70 (97.2%) | 2 (2.8%) |
| Total (Overall) | 331 (52.0%) | 305 (48.0%) |
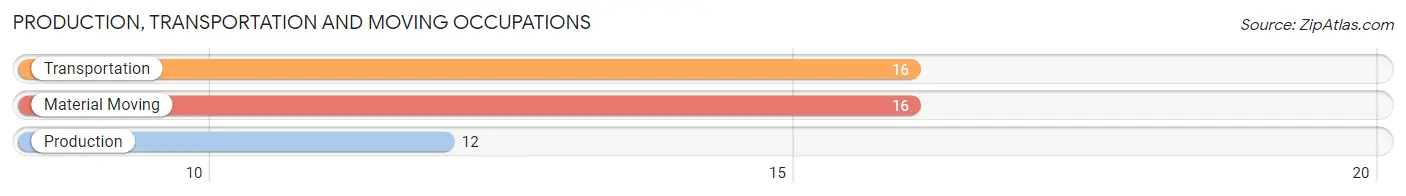
Production, Transportation and Moving Occupations
The most common Production, Transportation and Moving occupations in Chatham are Transportation (16 | 2.5%), Material Moving (16 | 2.5%), and Production (12 | 1.9%).
Production, Transportation and Moving Occupations by Sex
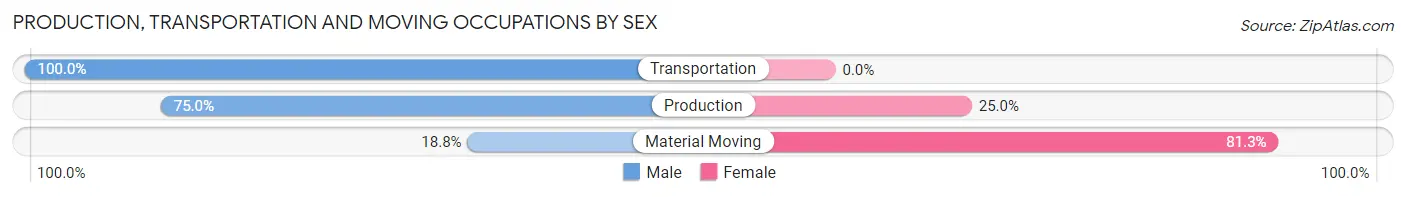
| Occupation | Male | Female |
| Production | 9 (75.0%) | 3 (25.0%) |
| Transportation | 16 (100.0%) | 0 (0.0%) |
| Material Moving | 3 (18.8%) | 13 (81.2%) |
| Total (Category) | 28 (63.6%) | 16 (36.4%) |
| Total (Overall) | 331 (52.0%) | 305 (48.0%) |
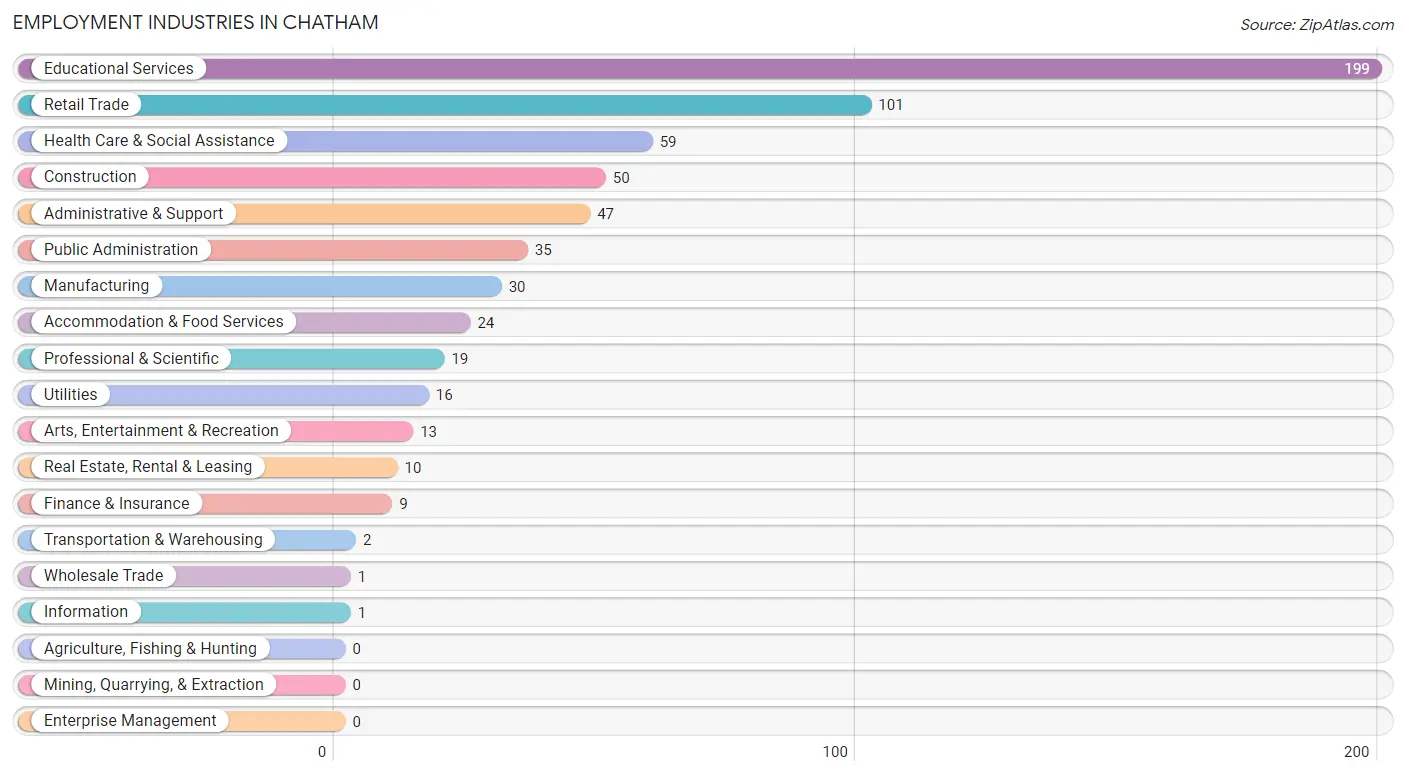
Employment Industries by Sex in Chatham
Employment Industries in Chatham
The major employment industries in Chatham include Educational Services (199 | 31.3%), Retail Trade (101 | 15.9%), Health Care & Social Assistance (59 | 9.3%), Construction (50 | 7.9%), and Administrative & Support (47 | 7.4%).
Employment Industries by Sex in Chatham
The Chatham industries that see more men than women are Wholesale Trade (100.0%), Transportation & Warehousing (100.0%), and Information (100.0%), whereas the industries that tend to have a higher number of women are Utilities (100.0%), Finance & Insurance (100.0%), and Real Estate, Rental & Leasing (100.0%).
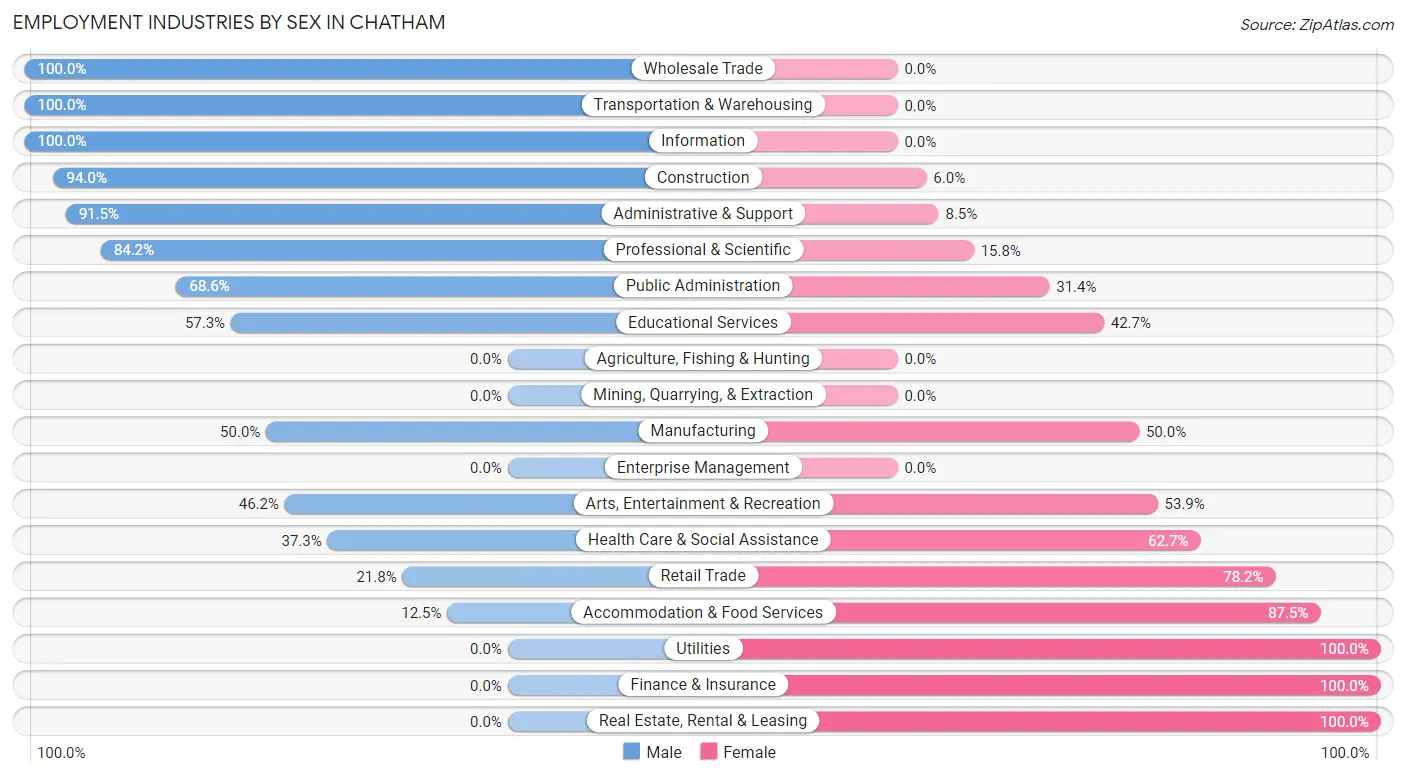
| Industry | Male | Female |
| Agriculture, Fishing & Hunting | 0 (0.0%) | 0 (0.0%) |
| Mining, Quarrying, & Extraction | 0 (0.0%) | 0 (0.0%) |
| Construction | 47 (94.0%) | 3 (6.0%) |
| Manufacturing | 15 (50.0%) | 15 (50.0%) |
| Wholesale Trade | 1 (100.0%) | 0 (0.0%) |
| Retail Trade | 22 (21.8%) | 79 (78.2%) |
| Transportation & Warehousing | 2 (100.0%) | 0 (0.0%) |
| Utilities | 0 (0.0%) | 16 (100.0%) |
| Information | 1 (100.0%) | 0 (0.0%) |
| Finance & Insurance | 0 (0.0%) | 9 (100.0%) |
| Real Estate, Rental & Leasing | 0 (0.0%) | 10 (100.0%) |
| Professional & Scientific | 16 (84.2%) | 3 (15.8%) |
| Enterprise Management | 0 (0.0%) | 0 (0.0%) |
| Administrative & Support | 43 (91.5%) | 4 (8.5%) |
| Educational Services | 114 (57.3%) | 85 (42.7%) |
| Health Care & Social Assistance | 22 (37.3%) | 37 (62.7%) |
| Arts, Entertainment & Recreation | 6 (46.2%) | 7 (53.8%) |
| Accommodation & Food Services | 3 (12.5%) | 21 (87.5%) |
| Public Administration | 24 (68.6%) | 11 (31.4%) |
| Total | 331 (52.0%) | 305 (48.0%) |
Education in Chatham
School Enrollment in Chatham
The most common levels of schooling among the 276 students in Chatham are high school (114 | 41.3%), elementary school (54 | 19.6%), and middle school (43 | 15.6%).
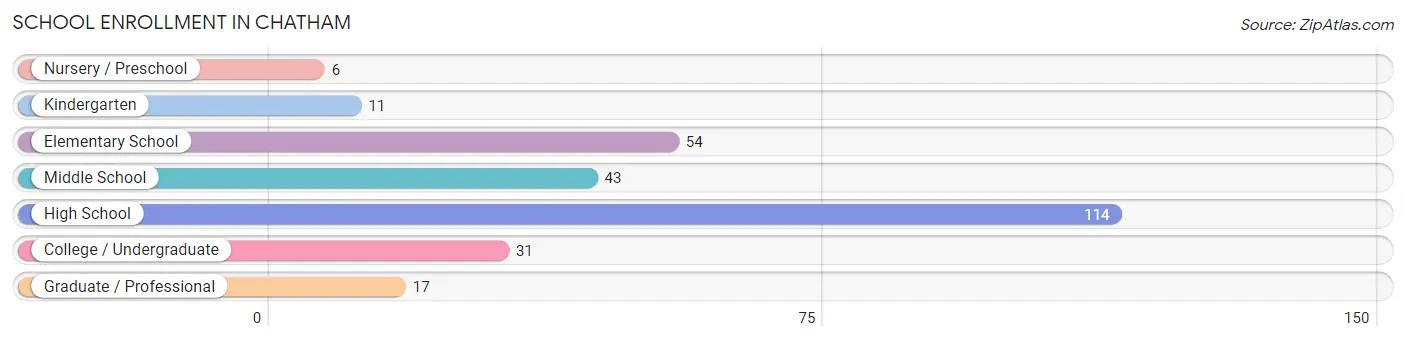
| School Level | # Students | % Students |
| Nursery / Preschool | 6 | 2.2% |
| Kindergarten | 11 | 4.0% |
| Elementary School | 54 | 19.6% |
| Middle School | 43 | 15.6% |
| High School | 114 | 41.3% |
| College / Undergraduate | 31 | 11.2% |
| Graduate / Professional | 17 | 6.2% |
| Total | 276 | 100.0% |
School Enrollment by Age by Funding Source in Chatham
Out of a total of 276 students who are enrolled in schools in Chatham, 62 (22.5%) attend a private institution, while the remaining 214 (77.5%) are enrolled in public schools. The age group of 25 to 34 year olds has the highest likelihood of being enrolled in private schools, with 21 (100.0% in the age bracket) enrolled. Conversely, the age group of 18 to 19 year olds has the lowest likelihood of being enrolled in a private school, with 9 (100.0% in the age bracket) attending a public institution.
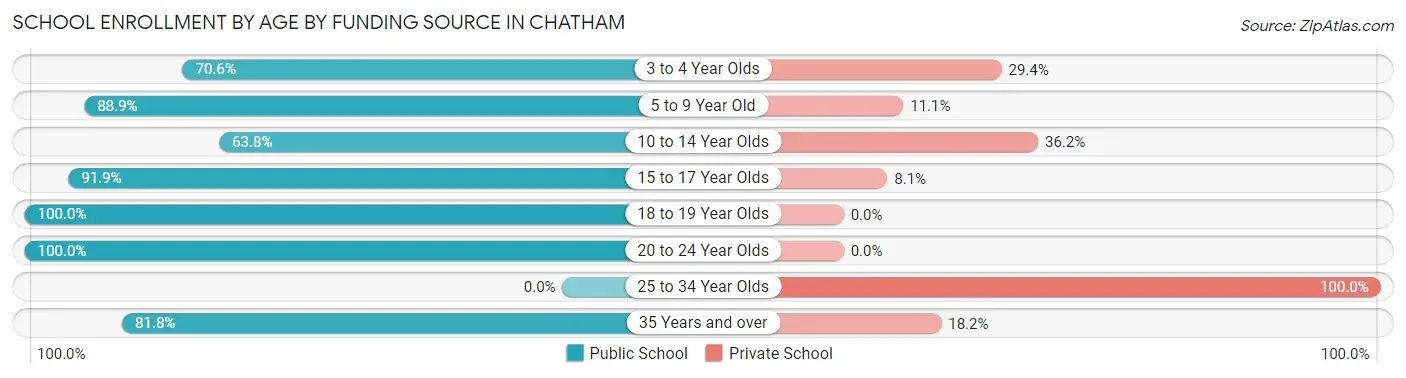
| Age Bracket | Public School | Private School |
| 3 to 4 Year Olds | 12 (70.6%) | 5 (29.4%) |
| 5 to 9 Year Old | 48 (88.9%) | 6 (11.1%) |
| 10 to 14 Year Olds | 37 (63.8%) | 21 (36.2%) |
| 15 to 17 Year Olds | 79 (91.9%) | 7 (8.1%) |
| 18 to 19 Year Olds | 9 (100.0%) | 0 (0.0%) |
| 20 to 24 Year Olds | 20 (100.0%) | 0 (0.0%) |
| 25 to 34 Year Olds | 0 (0.0%) | 21 (100.0%) |
| 35 Years and over | 9 (81.8%) | 2 (18.2%) |
| Total | 214 (77.5%) | 62 (22.5%) |
Educational Attainment by Field of Study in Chatham
Education (85 | 19.6%), business (80 | 18.4%), literature & languages (64 | 14.7%), liberal arts & history (52 | 12.0%), and science & technology (38 | 8.8%) are the most common fields of study among 434 individuals in Chatham who have obtained a bachelor's degree or higher.
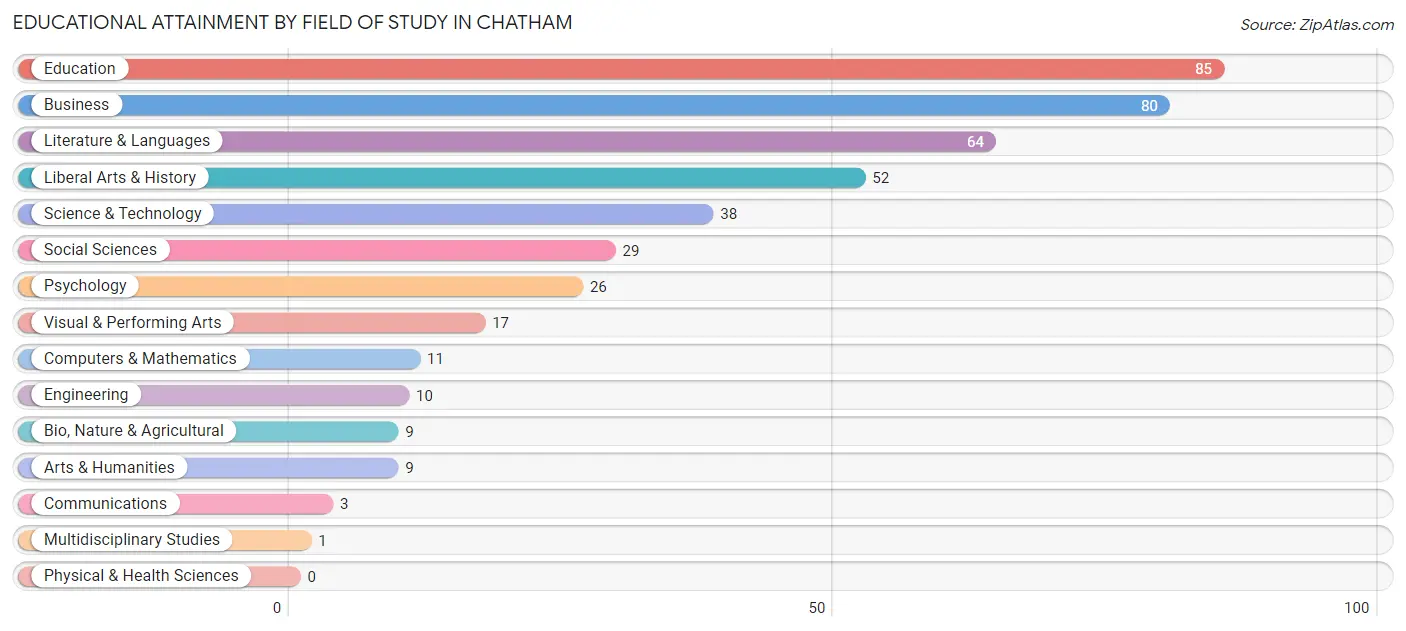
| Field of Study | # Graduates | % Graduates |
| Computers & Mathematics | 11 | 2.5% |
| Bio, Nature & Agricultural | 9 | 2.1% |
| Physical & Health Sciences | 0 | 0.0% |
| Psychology | 26 | 6.0% |
| Social Sciences | 29 | 6.7% |
| Engineering | 10 | 2.3% |
| Multidisciplinary Studies | 1 | 0.2% |
| Science & Technology | 38 | 8.8% |
| Business | 80 | 18.4% |
| Education | 85 | 19.6% |
| Literature & Languages | 64 | 14.7% |
| Liberal Arts & History | 52 | 12.0% |
| Visual & Performing Arts | 17 | 3.9% |
| Communications | 3 | 0.7% |
| Arts & Humanities | 9 | 2.1% |
| Total | 434 | 100.0% |
Transportation & Commute in Chatham
Vehicle Availability by Sex in Chatham
The most prevalent vehicle ownership categories in Chatham are males with 3 vehicles (130, accounting for 39.3%) and females with 3 vehicles (96, making up 42.6%).
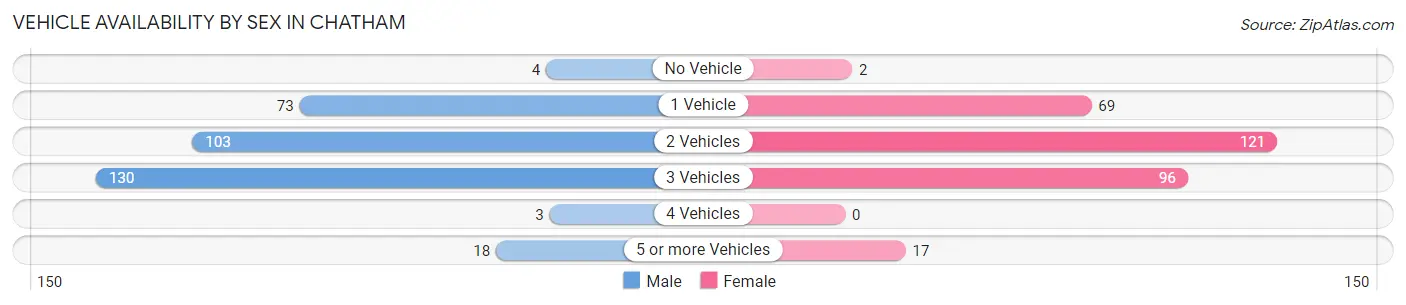
| Vehicles Available | Male | Female |
| No Vehicle | 4 (1.2%) | 2 (0.7%) |
| 1 Vehicle | 73 (22.1%) | 69 (22.6%) |
| 2 Vehicles | 103 (31.1%) | 121 (39.7%) |
| 3 Vehicles | 130 (39.3%) | 96 (31.5%) |
| 4 Vehicles | 3 (0.9%) | 0 (0.0%) |
| 5 or more Vehicles | 18 (5.4%) | 17 (5.6%) |
| Total | 331 (100.0%) | 305 (100.0%) |
Commute Time in Chatham
The most frequently occuring commute durations in Chatham are 5 to 9 minutes (106 commuters, 16.9%), 15 to 19 minutes (105 commuters, 16.8%), and 20 to 24 minutes (91 commuters, 14.5%).
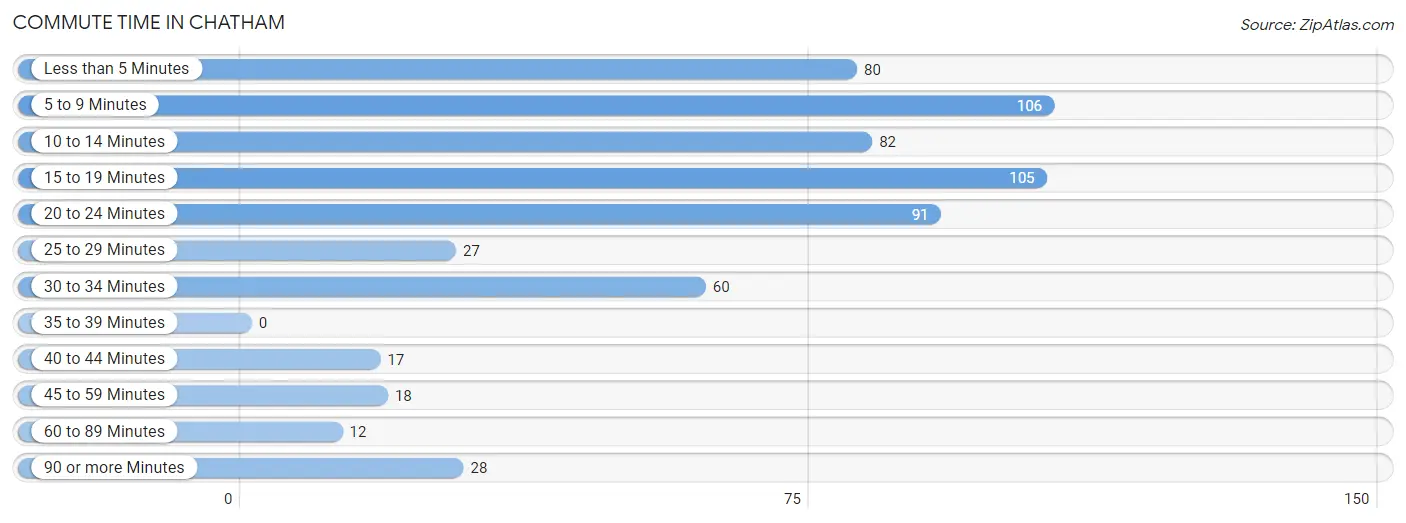
| Commute Time | # Commuters | % Commuters |
| Less than 5 Minutes | 80 | 12.8% |
| 5 to 9 Minutes | 106 | 16.9% |
| 10 to 14 Minutes | 82 | 13.1% |
| 15 to 19 Minutes | 105 | 16.8% |
| 20 to 24 Minutes | 91 | 14.5% |
| 25 to 29 Minutes | 27 | 4.3% |
| 30 to 34 Minutes | 60 | 9.6% |
| 35 to 39 Minutes | 0 | 0.0% |
| 40 to 44 Minutes | 17 | 2.7% |
| 45 to 59 Minutes | 18 | 2.9% |
| 60 to 89 Minutes | 12 | 1.9% |
| 90 or more Minutes | 28 | 4.5% |
Commute Time by Sex in Chatham
The most common commute times in Chatham are 10 to 14 minutes (69 commuters, 21.3%) for males and 15 to 19 minutes (85 commuters, 28.1%) for females.
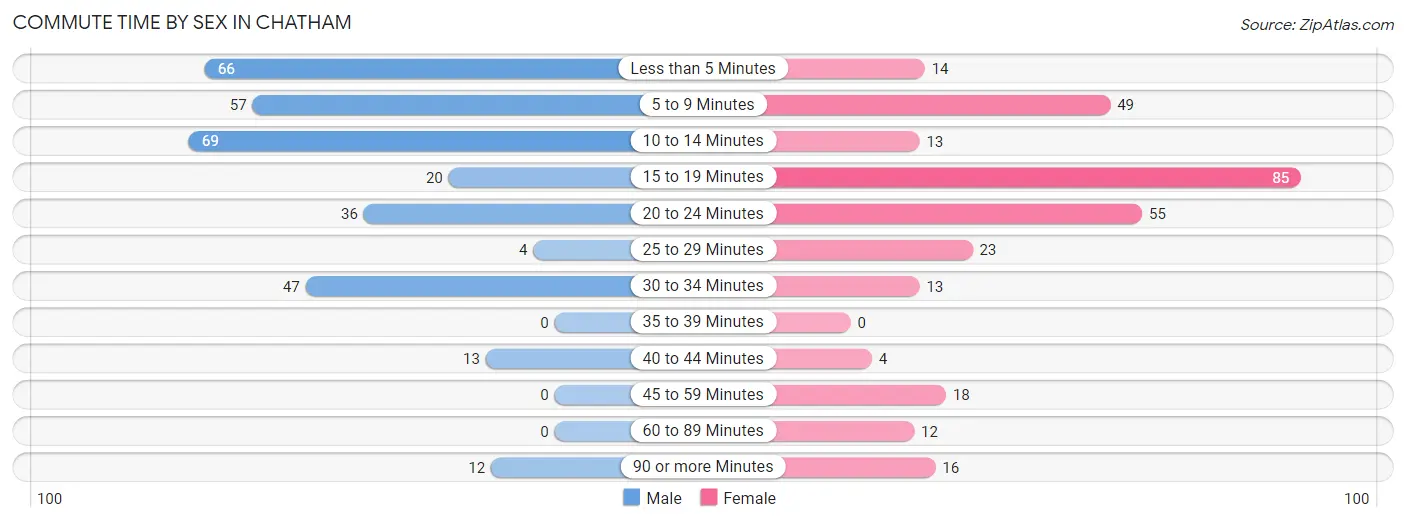
| Commute Time | Male | Female |
| Less than 5 Minutes | 66 (20.4%) | 14 (4.6%) |
| 5 to 9 Minutes | 57 (17.6%) | 49 (16.2%) |
| 10 to 14 Minutes | 69 (21.3%) | 13 (4.3%) |
| 15 to 19 Minutes | 20 (6.2%) | 85 (28.1%) |
| 20 to 24 Minutes | 36 (11.1%) | 55 (18.2%) |
| 25 to 29 Minutes | 4 (1.2%) | 23 (7.6%) |
| 30 to 34 Minutes | 47 (14.5%) | 13 (4.3%) |
| 35 to 39 Minutes | 0 (0.0%) | 0 (0.0%) |
| 40 to 44 Minutes | 13 (4.0%) | 4 (1.3%) |
| 45 to 59 Minutes | 0 (0.0%) | 18 (6.0%) |
| 60 to 89 Minutes | 0 (0.0%) | 12 (4.0%) |
| 90 or more Minutes | 12 (3.7%) | 16 (5.3%) |
Time of Departure to Work by Sex in Chatham
The most frequent times of departure to work in Chatham are 7:30 AM to 7:59 AM (89, 27.5%) for males and 7:30 AM to 7:59 AM (168, 55.6%) for females.
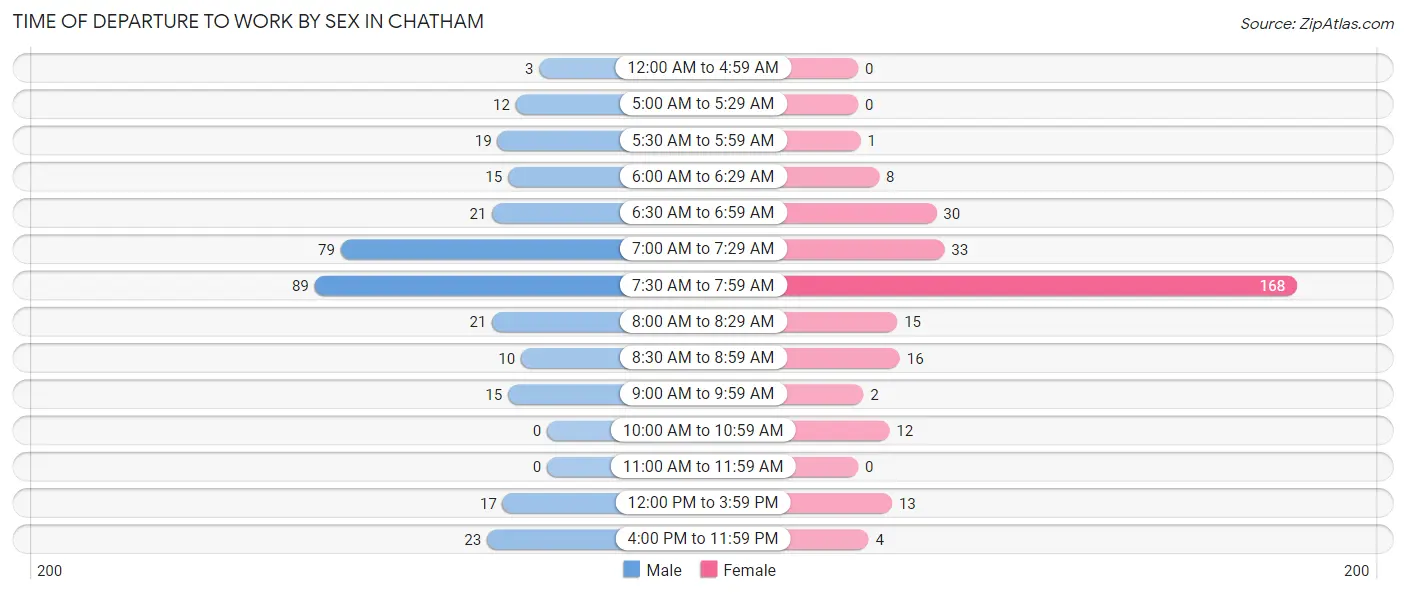
| Time of Departure | Male | Female |
| 12:00 AM to 4:59 AM | 3 (0.9%) | 0 (0.0%) |
| 5:00 AM to 5:29 AM | 12 (3.7%) | 0 (0.0%) |
| 5:30 AM to 5:59 AM | 19 (5.9%) | 1 (0.3%) |
| 6:00 AM to 6:29 AM | 15 (4.6%) | 8 (2.6%) |
| 6:30 AM to 6:59 AM | 21 (6.5%) | 30 (9.9%) |
| 7:00 AM to 7:29 AM | 79 (24.4%) | 33 (10.9%) |
| 7:30 AM to 7:59 AM | 89 (27.5%) | 168 (55.6%) |
| 8:00 AM to 8:29 AM | 21 (6.5%) | 15 (5.0%) |
| 8:30 AM to 8:59 AM | 10 (3.1%) | 16 (5.3%) |
| 9:00 AM to 9:59 AM | 15 (4.6%) | 2 (0.7%) |
| 10:00 AM to 10:59 AM | 0 (0.0%) | 12 (4.0%) |
| 11:00 AM to 11:59 AM | 0 (0.0%) | 0 (0.0%) |
| 12:00 PM to 3:59 PM | 17 (5.2%) | 13 (4.3%) |
| 4:00 PM to 11:59 PM | 23 (7.1%) | 4 (1.3%) |
| Total | 324 (100.0%) | 302 (100.0%) |
Housing Occupancy in Chatham
Occupancy by Ownership in Chatham
Of the total 577 dwellings in Chatham, owner-occupied units account for 341 (59.1%), while renter-occupied units make up 236 (40.9%).
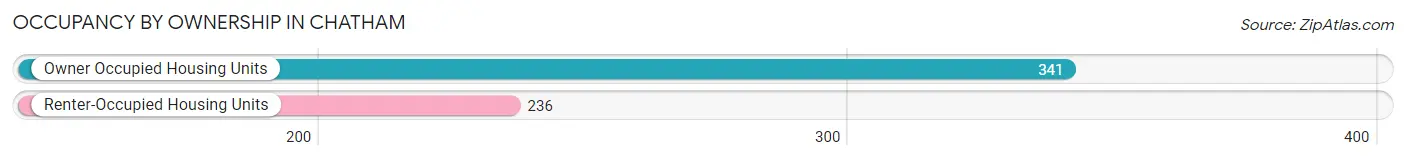
| Occupancy | # Housing Units | % Housing Units |
| Owner Occupied Housing Units | 341 | 59.1% |
| Renter-Occupied Housing Units | 236 | 40.9% |
| Total Occupied Housing Units | 577 | 100.0% |
Occupancy by Household Size in Chatham
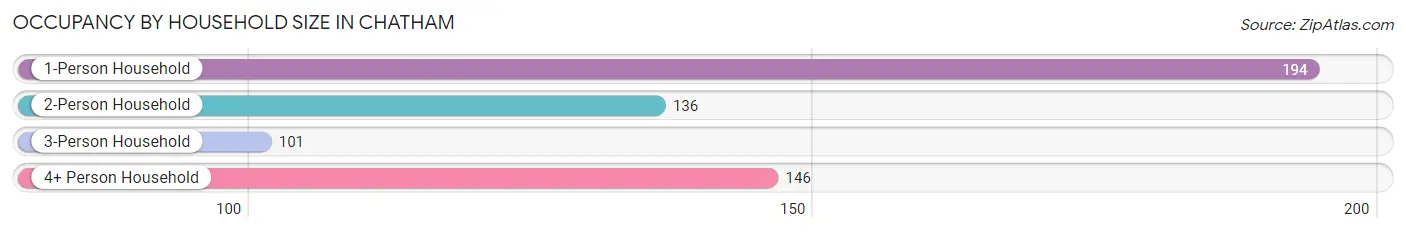
| Household Size | # Housing Units | % Housing Units |
| 1-Person Household | 194 | 33.6% |
| 2-Person Household | 136 | 23.6% |
| 3-Person Household | 101 | 17.5% |
| 4+ Person Household | 146 | 25.3% |
| Total Housing Units | 577 | 100.0% |
Occupancy by Ownership by Household Size in Chatham
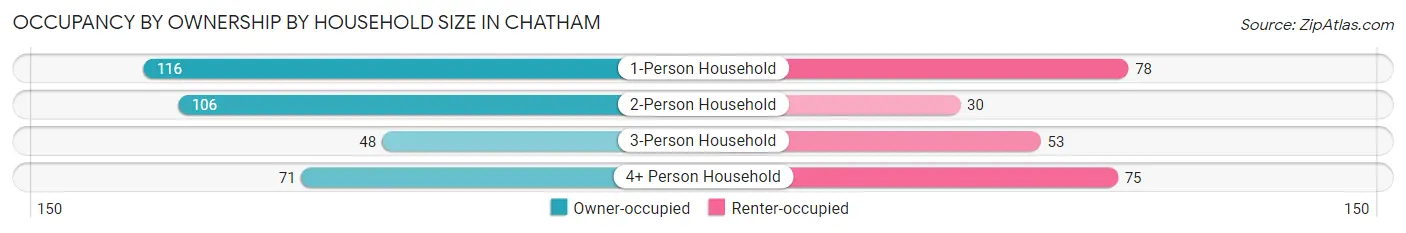
| Household Size | Owner-occupied | Renter-occupied |
| 1-Person Household | 116 (59.8%) | 78 (40.2%) |
| 2-Person Household | 106 (77.9%) | 30 (22.1%) |
| 3-Person Household | 48 (47.5%) | 53 (52.5%) |
| 4+ Person Household | 71 (48.6%) | 75 (51.4%) |
| Total Housing Units | 341 (59.1%) | 236 (40.9%) |
Occupancy by Educational Attainment in Chatham
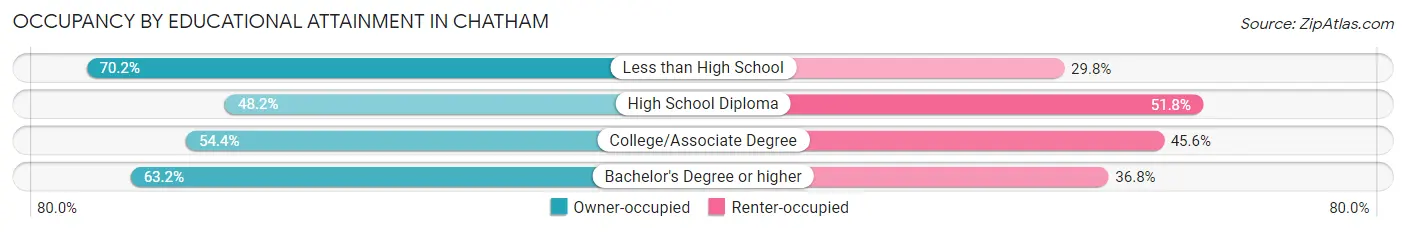
| Household Size | Owner-occupied | Renter-occupied |
| Less than High School | 40 (70.2%) | 17 (29.8%) |
| High School Diploma | 40 (48.2%) | 43 (51.8%) |
| College/Associate Degree | 93 (54.4%) | 78 (45.6%) |
| Bachelor's Degree or higher | 168 (63.2%) | 98 (36.8%) |
Occupancy by Age of Householder in Chatham
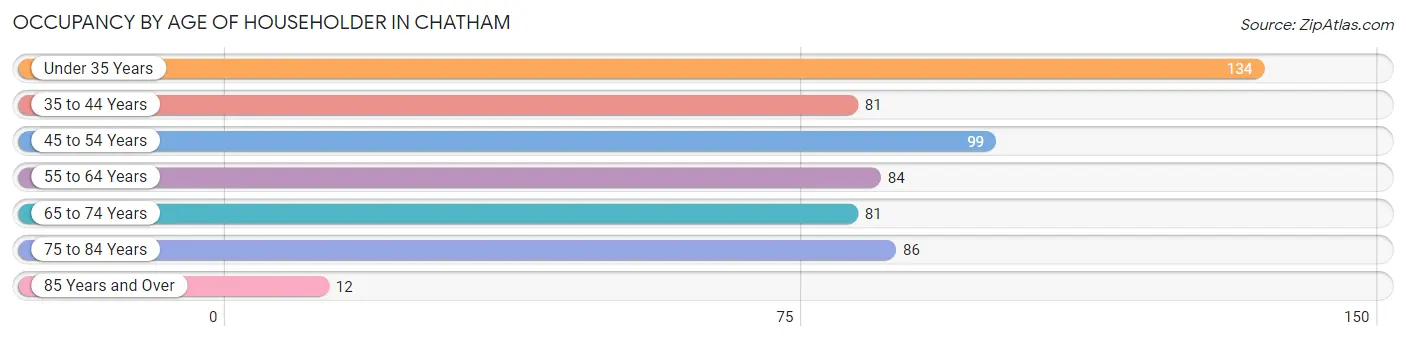
| Age Bracket | # Households | % Households |
| Under 35 Years | 134 | 23.2% |
| 35 to 44 Years | 81 | 14.0% |
| 45 to 54 Years | 99 | 17.2% |
| 55 to 64 Years | 84 | 14.6% |
| 65 to 74 Years | 81 | 14.0% |
| 75 to 84 Years | 86 | 14.9% |
| 85 Years and Over | 12 | 2.1% |
| Total | 577 | 100.0% |
Housing Finances in Chatham
Median Income by Occupancy in Chatham
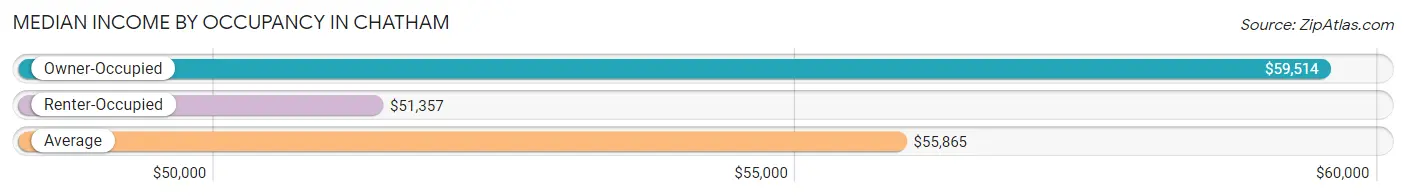
| Occupancy Type | # Households | Median Income |
| Owner-Occupied | 341 (59.1%) | $59,514 |
| Renter-Occupied | 236 (40.9%) | $51,357 |
| Average | 577 (100.0%) | $55,865 |
Occupancy by Householder Income Bracket in Chatham
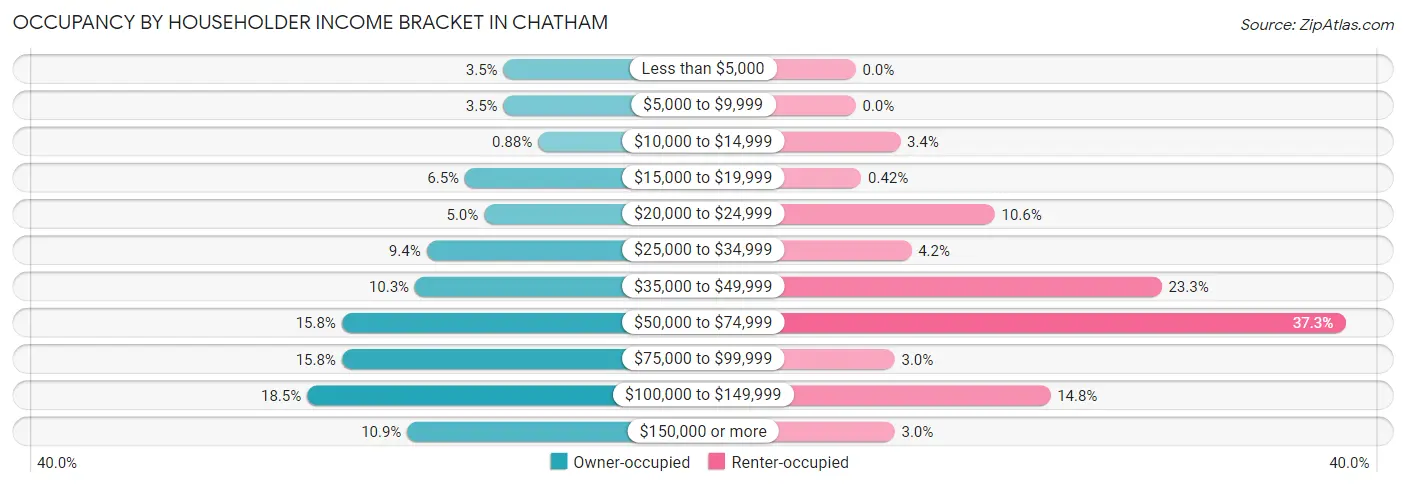
| Income Bracket | Owner-occupied | Renter-occupied |
| Less than $5,000 | 12 (3.5%) | 0 (0.0%) |
| $5,000 to $9,999 | 12 (3.5%) | 0 (0.0%) |
| $10,000 to $14,999 | 3 (0.9%) | 8 (3.4%) |
| $15,000 to $19,999 | 22 (6.5%) | 1 (0.4%) |
| $20,000 to $24,999 | 17 (5.0%) | 25 (10.6%) |
| $25,000 to $34,999 | 32 (9.4%) | 10 (4.2%) |
| $35,000 to $49,999 | 35 (10.3%) | 55 (23.3%) |
| $50,000 to $74,999 | 54 (15.8%) | 88 (37.3%) |
| $75,000 to $99,999 | 54 (15.8%) | 7 (3.0%) |
| $100,000 to $149,999 | 63 (18.5%) | 35 (14.8%) |
| $150,000 or more | 37 (10.8%) | 7 (3.0%) |
| Total | 341 (100.0%) | 236 (100.0%) |
Monthly Housing Cost Tiers in Chatham
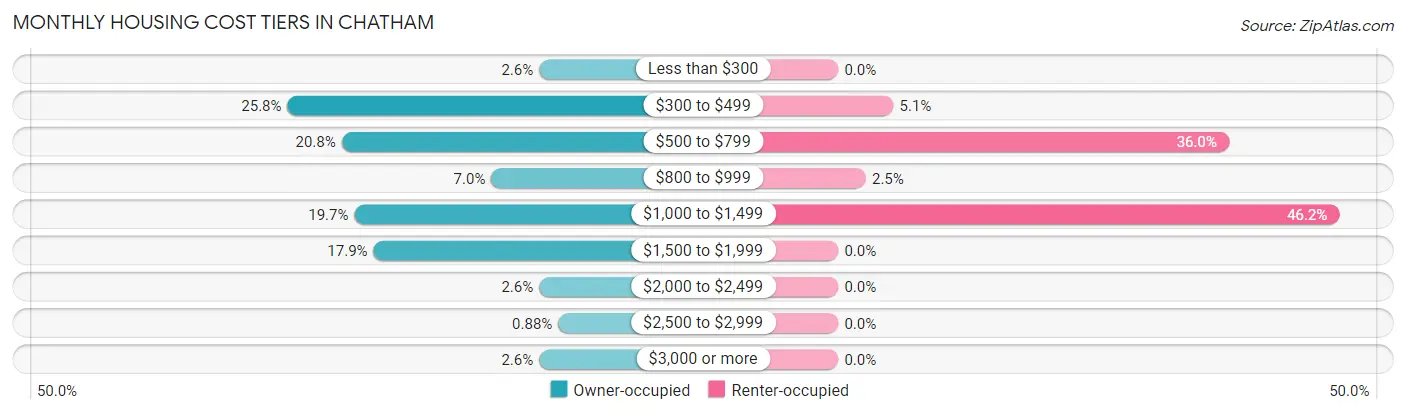
| Monthly Cost | Owner-occupied | Renter-occupied |
| Less than $300 | 9 (2.6%) | 0 (0.0%) |
| $300 to $499 | 88 (25.8%) | 12 (5.1%) |
| $500 to $799 | 71 (20.8%) | 85 (36.0%) |
| $800 to $999 | 24 (7.0%) | 6 (2.5%) |
| $1,000 to $1,499 | 67 (19.7%) | 109 (46.2%) |
| $1,500 to $1,999 | 61 (17.9%) | 0 (0.0%) |
| $2,000 to $2,499 | 9 (2.6%) | 0 (0.0%) |
| $2,500 to $2,999 | 3 (0.9%) | 0 (0.0%) |
| $3,000 or more | 9 (2.6%) | 0 (0.0%) |
| Total | 341 (100.0%) | 236 (100.0%) |
Physical Housing Characteristics in Chatham
Housing Structures in Chatham
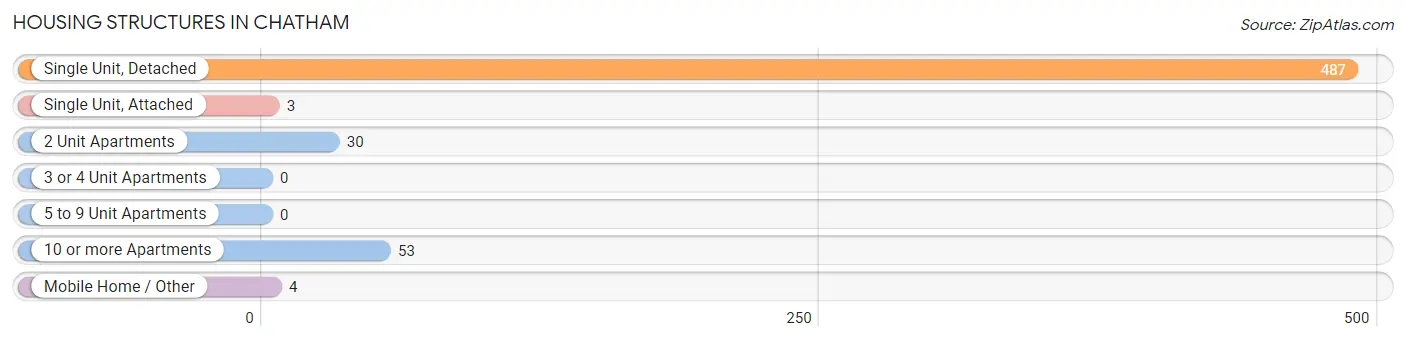
| Structure Type | # Housing Units | % Housing Units |
| Single Unit, Detached | 487 | 84.4% |
| Single Unit, Attached | 3 | 0.5% |
| 2 Unit Apartments | 30 | 5.2% |
| 3 or 4 Unit Apartments | 0 | 0.0% |
| 5 to 9 Unit Apartments | 0 | 0.0% |
| 10 or more Apartments | 53 | 9.2% |
| Mobile Home / Other | 4 | 0.7% |
| Total | 577 | 100.0% |
Housing Structures by Occupancy in Chatham
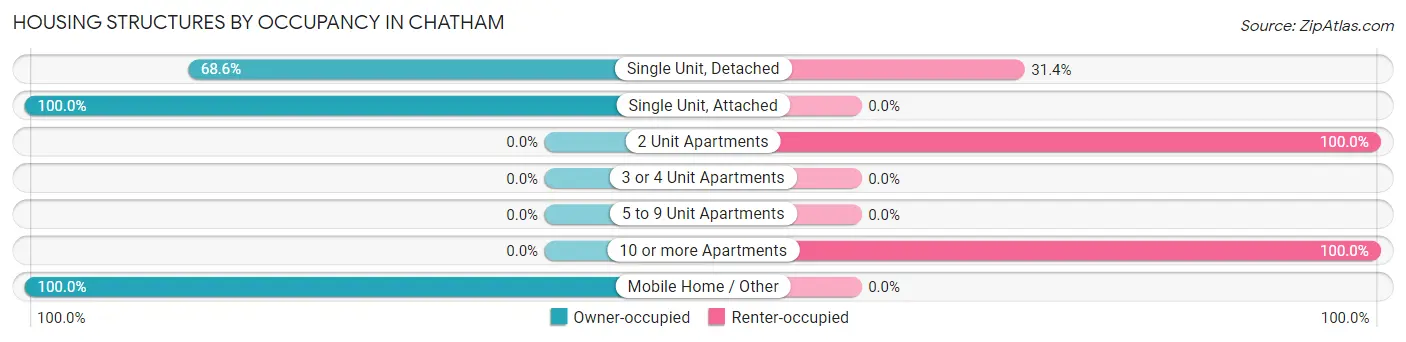
| Structure Type | Owner-occupied | Renter-occupied |
| Single Unit, Detached | 334 (68.6%) | 153 (31.4%) |
| Single Unit, Attached | 3 (100.0%) | 0 (0.0%) |
| 2 Unit Apartments | 0 (0.0%) | 30 (100.0%) |
| 3 or 4 Unit Apartments | 0 (0.0%) | 0 (0.0%) |
| 5 to 9 Unit Apartments | 0 (0.0%) | 0 (0.0%) |
| 10 or more Apartments | 0 (0.0%) | 53 (100.0%) |
| Mobile Home / Other | 4 (100.0%) | 0 (0.0%) |
| Total | 341 (59.1%) | 236 (40.9%) |
Housing Structures by Number of Rooms in Chatham
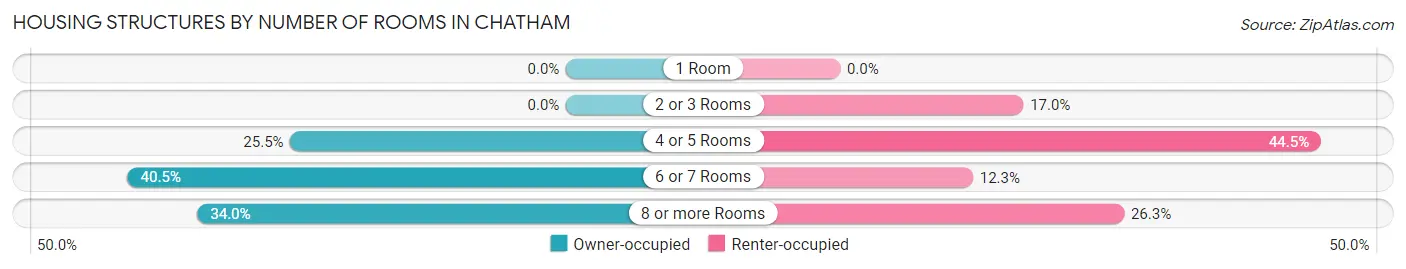
| Number of Rooms | Owner-occupied | Renter-occupied |
| 1 Room | 0 (0.0%) | 0 (0.0%) |
| 2 or 3 Rooms | 0 (0.0%) | 40 (17.0%) |
| 4 or 5 Rooms | 87 (25.5%) | 105 (44.5%) |
| 6 or 7 Rooms | 138 (40.5%) | 29 (12.3%) |
| 8 or more Rooms | 116 (34.0%) | 62 (26.3%) |
| Total | 341 (100.0%) | 236 (100.0%) |
Housing Structure by Heating Type in Chatham
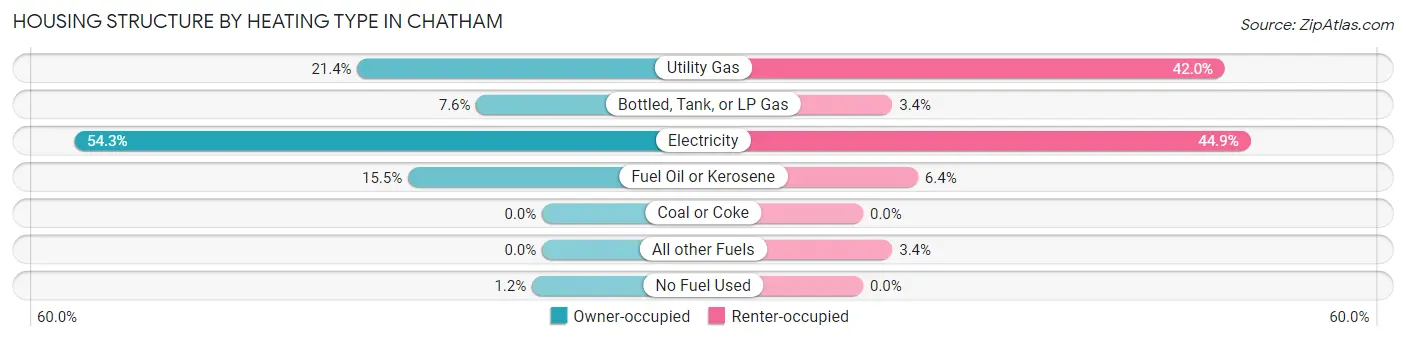
| Heating Type | Owner-occupied | Renter-occupied |
| Utility Gas | 73 (21.4%) | 99 (41.9%) |
| Bottled, Tank, or LP Gas | 26 (7.6%) | 8 (3.4%) |
| Electricity | 185 (54.2%) | 106 (44.9%) |
| Fuel Oil or Kerosene | 53 (15.5%) | 15 (6.4%) |
| Coal or Coke | 0 (0.0%) | 0 (0.0%) |
| All other Fuels | 0 (0.0%) | 8 (3.4%) |
| No Fuel Used | 4 (1.2%) | 0 (0.0%) |
| Total | 341 (100.0%) | 236 (100.0%) |
Household Vehicle Usage in Chatham
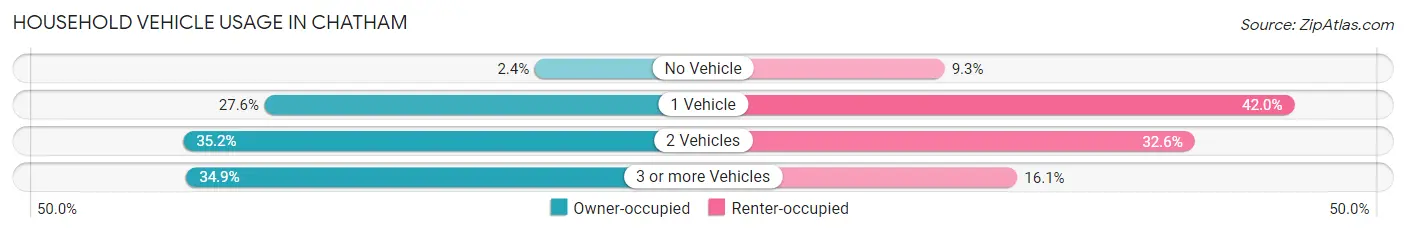
| Vehicles per Household | Owner-occupied | Renter-occupied |
| No Vehicle | 8 (2.4%) | 22 (9.3%) |
| 1 Vehicle | 94 (27.6%) | 99 (41.9%) |
| 2 Vehicles | 120 (35.2%) | 77 (32.6%) |
| 3 or more Vehicles | 119 (34.9%) | 38 (16.1%) |
| Total | 341 (100.0%) | 236 (100.0%) |
Real Estate & Mortgages in Chatham
Real Estate and Mortgage Overview in Chatham
| Characteristic | Without Mortgage | With Mortgage |
| Housing Units | 180 | 161 |
| Median Property Value | $165,400 | $152,400 |
| Median Household Income | $44,375 | $29 |
| Monthly Housing Costs | $484 | $9 |
| Real Estate Taxes | $1,336 | $3 |
Property Value by Mortgage Status in Chatham
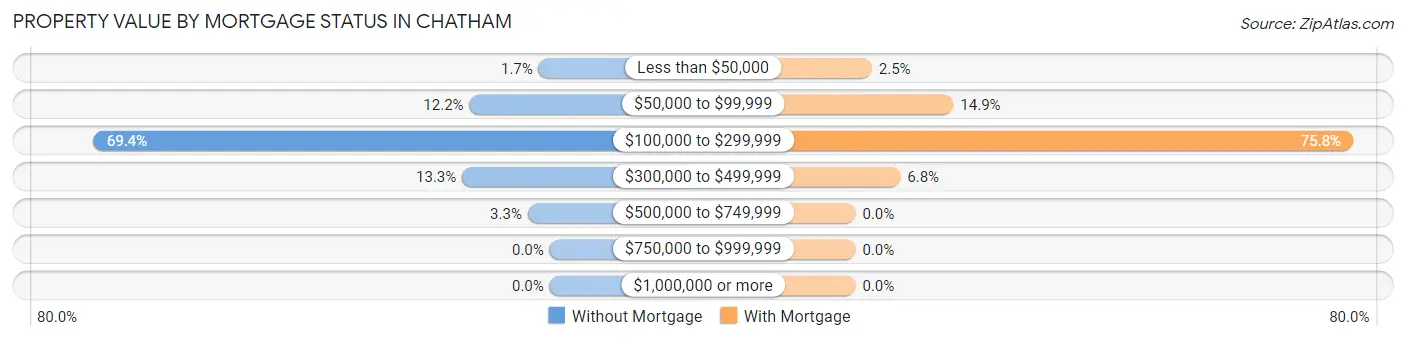
| Property Value | Without Mortgage | With Mortgage |
| Less than $50,000 | 3 (1.7%) | 4 (2.5%) |
| $50,000 to $99,999 | 22 (12.2%) | 24 (14.9%) |
| $100,000 to $299,999 | 125 (69.4%) | 122 (75.8%) |
| $300,000 to $499,999 | 24 (13.3%) | 11 (6.8%) |
| $500,000 to $749,999 | 6 (3.3%) | 0 (0.0%) |
| $750,000 to $999,999 | 0 (0.0%) | 0 (0.0%) |
| $1,000,000 or more | 0 (0.0%) | 0 (0.0%) |
| Total | 180 (100.0%) | 161 (100.0%) |
Household Income by Mortgage Status in Chatham
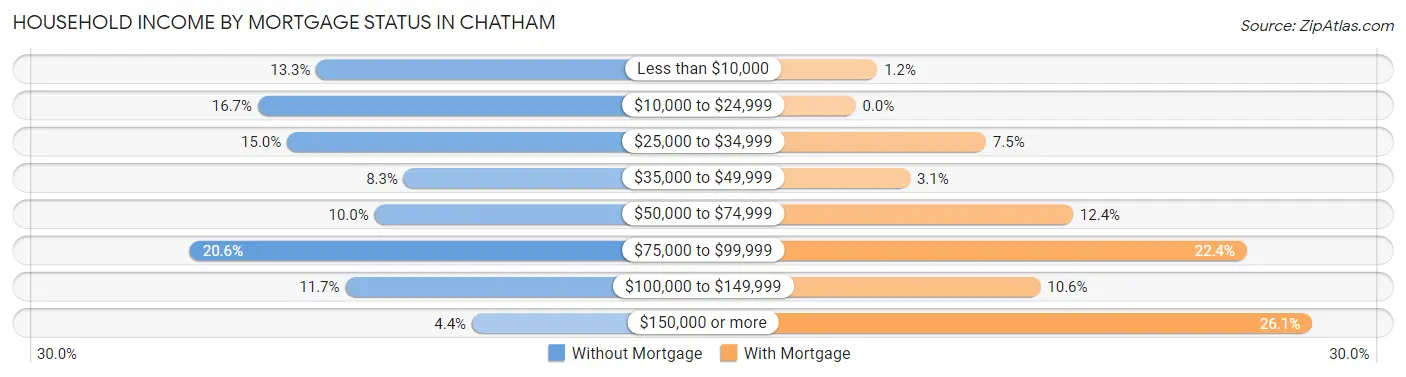
| Household Income | Without Mortgage | With Mortgage |
| Less than $10,000 | 24 (13.3%) | 2 (1.2%) |
| $10,000 to $24,999 | 30 (16.7%) | 0 (0.0%) |
| $25,000 to $34,999 | 27 (15.0%) | 12 (7.4%) |
| $35,000 to $49,999 | 15 (8.3%) | 5 (3.1%) |
| $50,000 to $74,999 | 18 (10.0%) | 20 (12.4%) |
| $75,000 to $99,999 | 37 (20.6%) | 36 (22.4%) |
| $100,000 to $149,999 | 21 (11.7%) | 17 (10.6%) |
| $150,000 or more | 8 (4.4%) | 42 (26.1%) |
| Total | 180 (100.0%) | 161 (100.0%) |
Property Value to Household Income Ratio in Chatham
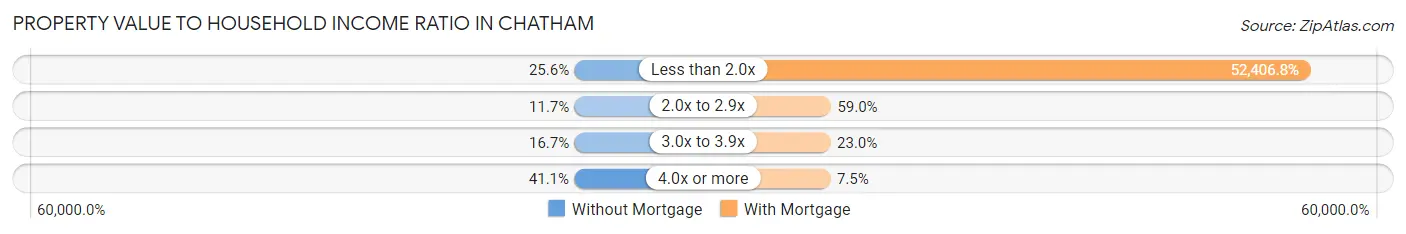
| Value-to-Income Ratio | Without Mortgage | With Mortgage |
| Less than 2.0x | 46 (25.6%) | 84,375 (52,406.8%) |
| 2.0x to 2.9x | 21 (11.7%) | 95 (59.0%) |
| 3.0x to 3.9x | 30 (16.7%) | 37 (23.0%) |
| 4.0x or more | 74 (41.1%) | 12 (7.4%) |
| Total | 180 (100.0%) | 161 (100.0%) |
Real Estate Taxes by Mortgage Status in Chatham
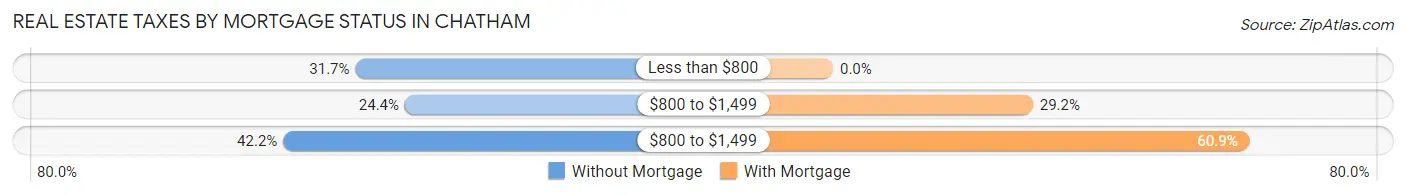
| Property Taxes | Without Mortgage | With Mortgage |
| Less than $800 | 57 (31.7%) | 0 (0.0%) |
| $800 to $1,499 | 44 (24.4%) | 47 (29.2%) |
| $800 to $1,499 | 76 (42.2%) | 98 (60.9%) |
| Total | 180 (100.0%) | 161 (100.0%) |
Health & Disability in Chatham
Health Insurance Coverage by Age in Chatham
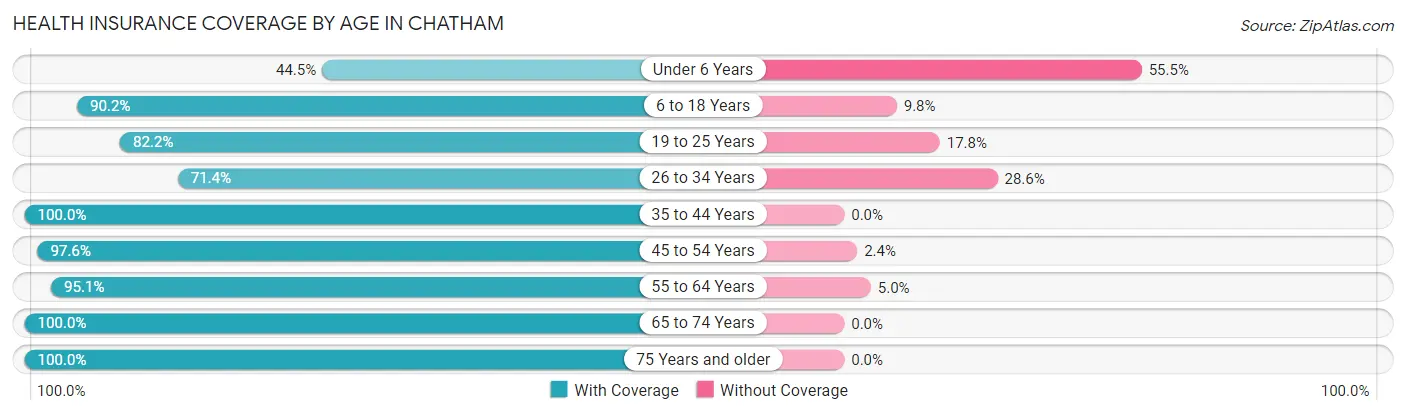
| Age Bracket | With Coverage | Without Coverage |
| Under 6 Years | 57 (44.5%) | 71 (55.5%) |
| 6 to 18 Years | 258 (90.2%) | 28 (9.8%) |
| 19 to 25 Years | 60 (82.2%) | 13 (17.8%) |
| 26 to 34 Years | 180 (71.4%) | 72 (28.6%) |
| 35 to 44 Years | 181 (100.0%) | 0 (0.0%) |
| 45 to 54 Years | 162 (97.6%) | 4 (2.4%) |
| 55 to 64 Years | 96 (95.1%) | 5 (5.0%) |
| 65 to 74 Years | 153 (100.0%) | 0 (0.0%) |
| 75 Years and older | 150 (100.0%) | 0 (0.0%) |
| Total | 1,297 (87.1%) | 193 (13.0%) |
Health Insurance Coverage by Citizenship Status in Chatham
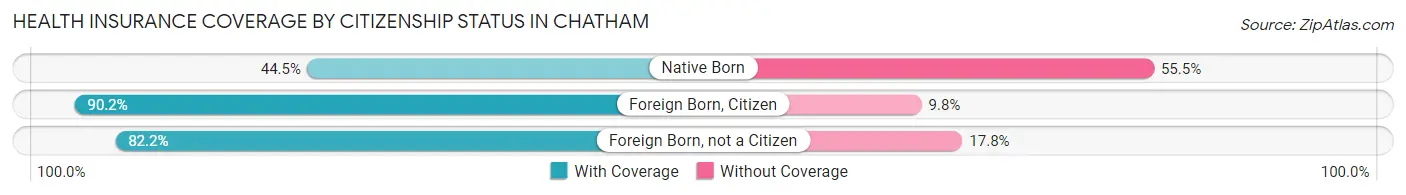
| Citizenship Status | With Coverage | Without Coverage |
| Native Born | 57 (44.5%) | 71 (55.5%) |
| Foreign Born, Citizen | 258 (90.2%) | 28 (9.8%) |
| Foreign Born, not a Citizen | 60 (82.2%) | 13 (17.8%) |
Health Insurance Coverage by Household Income in Chatham
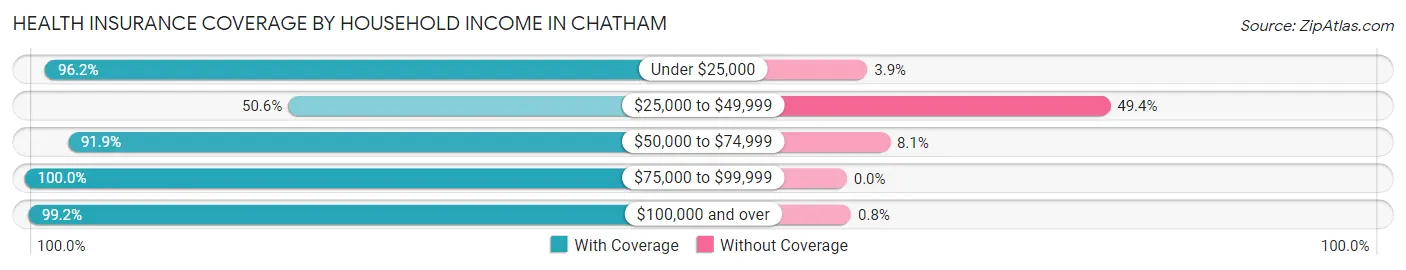
| Household Income | With Coverage | Without Coverage |
| Under $25,000 | 150 (96.2%) | 6 (3.8%) |
| $25,000 to $49,999 | 159 (50.6%) | 155 (49.4%) |
| $50,000 to $74,999 | 318 (91.9%) | 28 (8.1%) |
| $75,000 to $99,999 | 171 (100.0%) | 0 (0.0%) |
| $100,000 and over | 499 (99.2%) | 4 (0.8%) |
Public vs Private Health Insurance Coverage by Age in Chatham
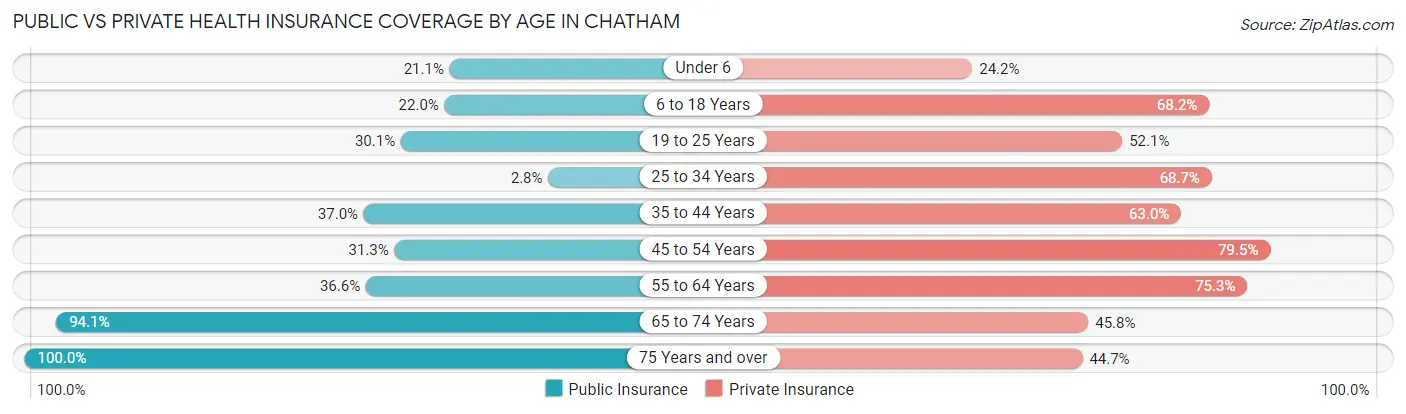
| Age Bracket | Public Insurance | Private Insurance |
| Under 6 | 27 (21.1%) | 31 (24.2%) |
| 6 to 18 Years | 63 (22.0%) | 195 (68.2%) |
| 19 to 25 Years | 22 (30.1%) | 38 (52.0%) |
| 25 to 34 Years | 7 (2.8%) | 173 (68.6%) |
| 35 to 44 Years | 67 (37.0%) | 114 (63.0%) |
| 45 to 54 Years | 52 (31.3%) | 132 (79.5%) |
| 55 to 64 Years | 37 (36.6%) | 76 (75.2%) |
| 65 to 74 Years | 144 (94.1%) | 70 (45.8%) |
| 75 Years and over | 150 (100.0%) | 67 (44.7%) |
| Total | 569 (38.2%) | 896 (60.1%) |
Disability Status by Sex by Age in Chatham
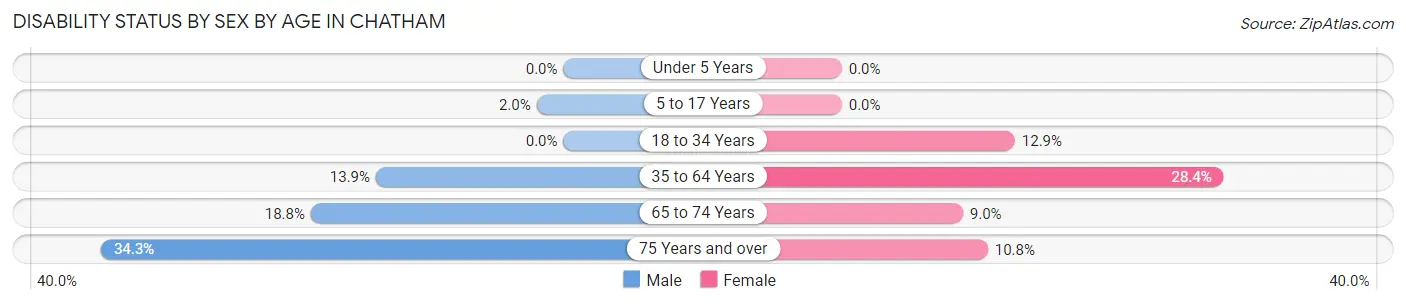
| Age Bracket | Male | Female |
| Under 5 Years | 0 (0.0%) | 0 (0.0%) |
| 5 to 17 Years | 3 (2.0%) | 0 (0.0%) |
| 18 to 34 Years | 0 (0.0%) | 23 (12.9%) |
| 35 to 64 Years | 27 (13.9%) | 72 (28.3%) |
| 65 to 74 Years | 12 (18.8%) | 8 (9.0%) |
| 75 Years and over | 23 (34.3%) | 9 (10.8%) |
Disability Class by Sex by Age in Chatham
Disability Class: Hearing Difficulty
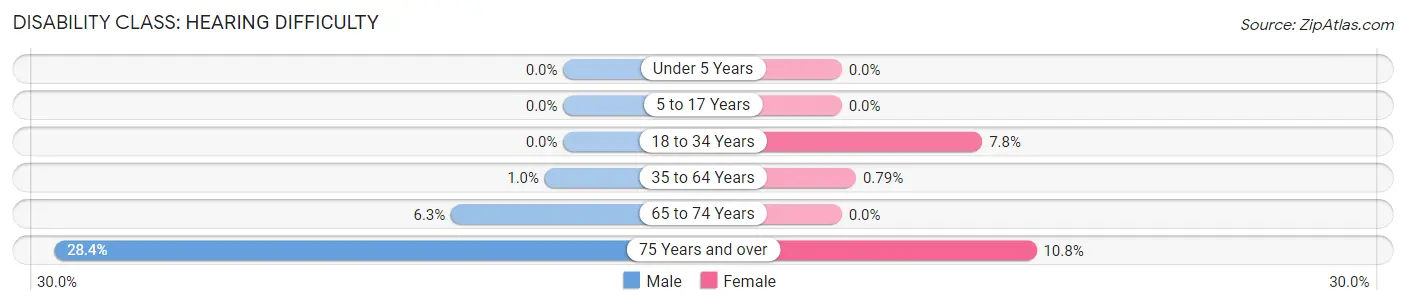
| Age Bracket | Male | Female |
| Under 5 Years | 0 (0.0%) | 0 (0.0%) |
| 5 to 17 Years | 0 (0.0%) | 0 (0.0%) |
| 18 to 34 Years | 0 (0.0%) | 14 (7.8%) |
| 35 to 64 Years | 2 (1.0%) | 2 (0.8%) |
| 65 to 74 Years | 4 (6.2%) | 0 (0.0%) |
| 75 Years and over | 19 (28.4%) | 9 (10.8%) |
Disability Class: Vision Difficulty
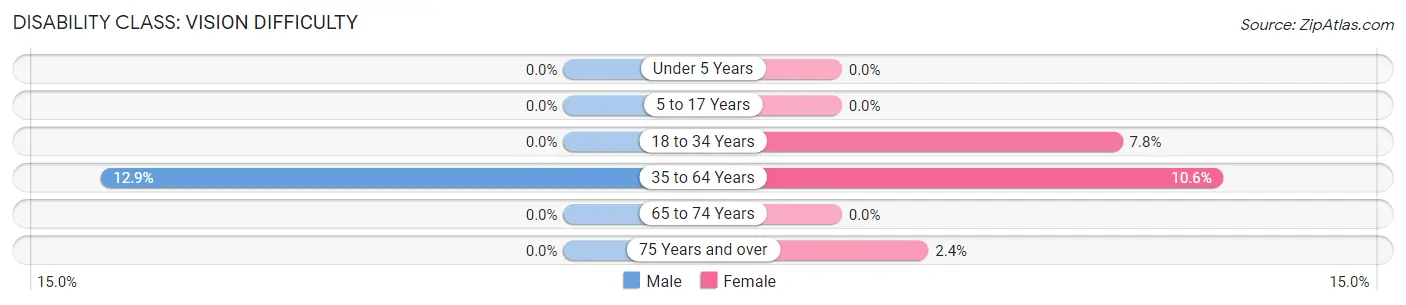
| Age Bracket | Male | Female |
| Under 5 Years | 0 (0.0%) | 0 (0.0%) |
| 5 to 17 Years | 0 (0.0%) | 0 (0.0%) |
| 18 to 34 Years | 0 (0.0%) | 14 (7.8%) |
| 35 to 64 Years | 25 (12.9%) | 27 (10.6%) |
| 65 to 74 Years | 0 (0.0%) | 0 (0.0%) |
| 75 Years and over | 0 (0.0%) | 2 (2.4%) |
Disability Class: Cognitive Difficulty
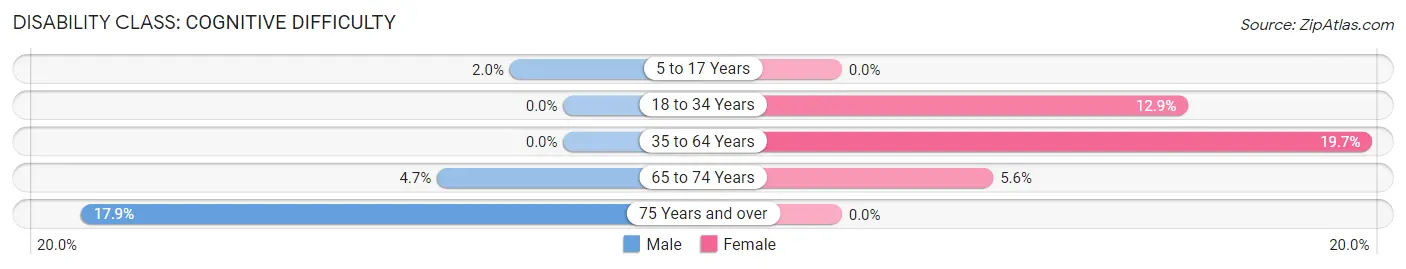
| Age Bracket | Male | Female |
| 5 to 17 Years | 3 (2.0%) | 0 (0.0%) |
| 18 to 34 Years | 0 (0.0%) | 23 (12.9%) |
| 35 to 64 Years | 0 (0.0%) | 50 (19.7%) |
| 65 to 74 Years | 3 (4.7%) | 5 (5.6%) |
| 75 Years and over | 12 (17.9%) | 0 (0.0%) |
Disability Class: Ambulatory Difficulty
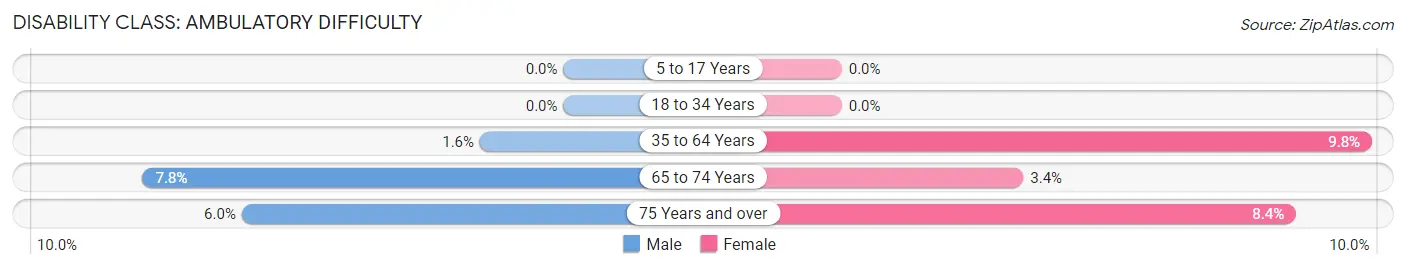
| Age Bracket | Male | Female |
| 5 to 17 Years | 0 (0.0%) | 0 (0.0%) |
| 18 to 34 Years | 0 (0.0%) | 0 (0.0%) |
| 35 to 64 Years | 3 (1.5%) | 25 (9.8%) |
| 65 to 74 Years | 5 (7.8%) | 3 (3.4%) |
| 75 Years and over | 4 (6.0%) | 7 (8.4%) |
Disability Class: Self-Care Difficulty
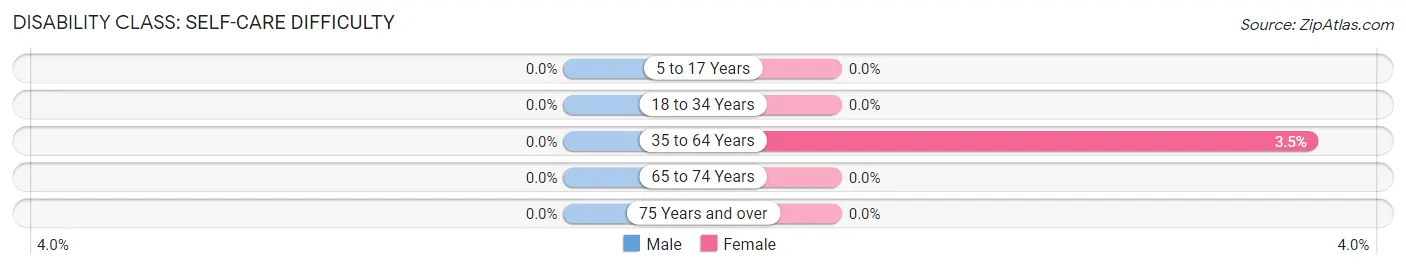
| Age Bracket | Male | Female |
| 5 to 17 Years | 0 (0.0%) | 0 (0.0%) |
| 18 to 34 Years | 0 (0.0%) | 0 (0.0%) |
| 35 to 64 Years | 0 (0.0%) | 9 (3.5%) |
| 65 to 74 Years | 0 (0.0%) | 0 (0.0%) |
| 75 Years and over | 0 (0.0%) | 0 (0.0%) |
Technology Access in Chatham
Computing Device Access in Chatham
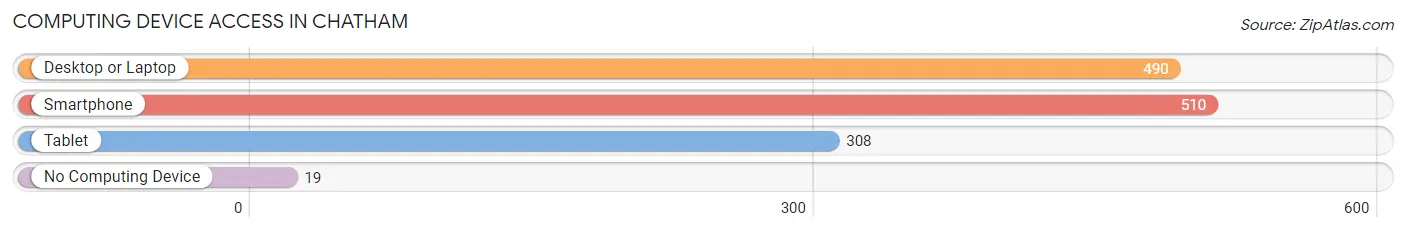
| Device Type | # Households | % Households |
| Desktop or Laptop | 490 | 84.9% |
| Smartphone | 510 | 88.4% |
| Tablet | 308 | 53.4% |
| No Computing Device | 19 | 3.3% |
| Total | 577 | 100.0% |
Internet Access in Chatham
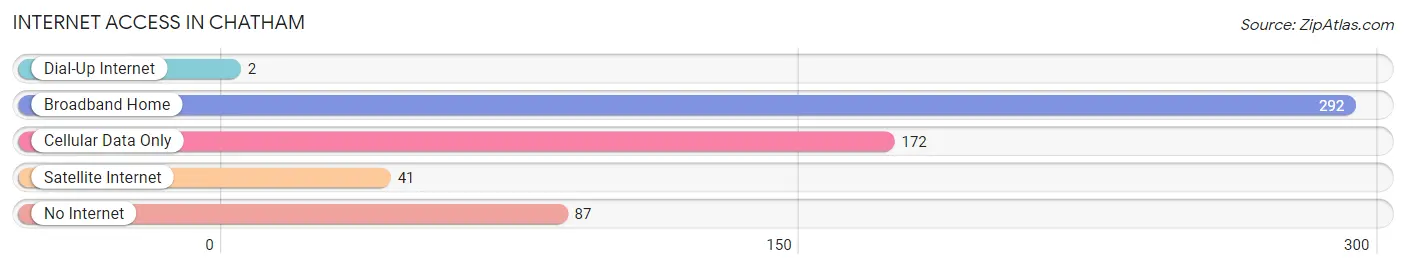
| Internet Type | # Households | % Households |
| Dial-Up Internet | 2 | 0.4% |
| Broadband Home | 292 | 50.6% |
| Cellular Data Only | 172 | 29.8% |
| Satellite Internet | 41 | 7.1% |
| No Internet | 87 | 15.1% |
| Total | 577 | 100.0% |
Chatham Summary
Chatham is a small town located in Pittsylvania County, Virginia. It is situated in the foothills of the Blue Ridge Mountains and is part of the Danville, Virginia Metropolitan Statistical Area. The town has a population of approximately 1,400 people and is known for its rural charm and small-town atmosphere.
History
Chatham was founded in 1777 by William Chatham, a Revolutionary War veteran. The town was originally known as Chatham Court House, as it served as the county seat of Pittsylvania County. In 1845, the town was renamed Chatham, and it has remained so ever since.
The town was an important center of commerce and industry during the 19th century. It was home to several mills, including a cotton mill, a woolen mill, and a grist mill. The town also had a number of stores, including a general store, a drug store, and a hardware store.
In the early 20th century, Chatham experienced a period of decline. The mills closed, and the town’s population began to decline. However, in recent years, the town has experienced a resurgence. The downtown area has been revitalized, and the town has become a popular tourist destination.
Geography
Chatham is located in the foothills of the Blue Ridge Mountains in southwestern Virginia. The town is situated at the intersection of U.S. Route 29 and State Route 57. The town is surrounded by rolling hills and farmland. The nearby Dan River provides a scenic backdrop.
The climate in Chatham is mild and temperate. Summers are warm and humid, while winters are cold and snowy. The average annual temperature is around 55 degrees Fahrenheit.
Economy
The economy of Chatham is largely based on tourism. The town is home to several historic sites, including the Chatham Manor, the Chatham Railroad Museum, and the Chatham Historic District. The town also has several wineries and breweries, as well as a number of restaurants and shops.
In addition to tourism, Chatham is home to several small businesses. These include a furniture store, a hardware store, and a number of antique stores. The town also has a number of manufacturing companies, including a woodworking company and a printing company.
Demographics
As of the 2010 census, the population of Chatham was 1,393. The racial makeup of the town was 94.3% White, 3.2% African American, 0.3% Native American, 0.3% Asian, 0.1% Pacific Islander, 0.7% from other races, and 1.2% from two or more races. Hispanic or Latino of any race were 1.7% of the population.
The median household income in Chatham was $37,917, and the median family income was $45,625. The per capita income was $20,945. About 11.2% of families and 14.2% of the population were below the poverty line, including 19.2% of those under age 18 and 8.2% of those age 65 or over.
Chatham is a small town with a rich history and a vibrant economy. It is a popular tourist destination, and its downtown area has been revitalized in recent years. The town has a diverse population and a strong sense of community.
Common Questions
What is Per Capita Income in Chatham?
Per Capita income in Chatham is $26,755.
What is the Median Family Income in Chatham?
Median Family Income in Chatham is $69,375.
What is the Median Household income in Chatham?
Median Household Income in Chatham is $55,865.
What is Income or Wage Gap in Chatham?
Income or Wage Gap in Chatham is 23.9%.
Women in Chatham earn 76.1 cents for every dollar earned by a man.
What is Inequality or Gini Index in Chatham?
Inequality or Gini Index in Chatham is 0.38.
What is the Total Population of Chatham?
Total Population of Chatham is 1,637.
What is the Total Male Population of Chatham?
Total Male Population of Chatham is 838.
What is the Total Female Population of Chatham?
Total Female Population of Chatham is 799.
What is the Ratio of Males per 100 Females in Chatham?
There are 104.88 Males per 100 Females in Chatham.
What is the Ratio of Females per 100 Males in Chatham?
There are 95.35 Females per 100 Males in Chatham.
What is the Median Population Age in Chatham?
Median Population Age in Chatham is 36.5 Years.
What is the Average Family Size in Chatham
Average Family Size in Chatham is 3.3 People.
What is the Average Household Size in Chatham
Average Household Size in Chatham is 2.6 People.
How Large is the Labor Force in Chatham?
There are 655 People in the Labor Forcein in Chatham.
What is the Percentage of People in the Labor Force in Chatham?
50.3% of People are in the Labor Force in Chatham.
What is the Unemployment Rate in Chatham?
Unemployment Rate in Chatham is 2.9%.