Petersburg, VA Map & Demographics
Petersburg Map
Petersburg Overview
$28,146
PER CAPITA INCOME
$62,385
AVG FAMILY INCOME
$46,930
AVG HOUSEHOLD INCOME
12.6%
WAGE / INCOME GAP [ % ]
87.4¢/ $1
WAGE / INCOME GAP [ $ ]
$11,189
FAMILY INCOME DEFICIT
0.45
INEQUALITY / GINI INDEX
33,261
TOTAL POPULATION
15,163
MALE POPULATION
18,098
FEMALE POPULATION
83.78
MALES / 100 FEMALES
119.36
FEMALES / 100 MALES
36.6
MEDIAN AGE
3.4
AVG FAMILY SIZE
2.2
AVG HOUSEHOLD SIZE
16,568
LABOR FORCE [ PEOPLE ]
62.4%
PERCENT IN LABOR FORCE
11.3%
UNEMPLOYMENT RATE
Petersburg Area Codes
Income in Petersburg
Income Overview in Petersburg
Per Capita Income in Petersburg is $28,146, while median incomes of families and households are $62,385 and $46,930 respectively.
| Characteristic | Number | Measure |
| Per Capita Income | 33,261 | $28,146 |
| Median Family Income | 6,416 | $62,385 |
| Mean Family Income | 6,416 | $74,221 |
| Median Household Income | 14,703 | $46,930 |
| Mean Household Income | 14,703 | $59,456 |
| Income Deficit | 6,416 | $11,189 |
| Wage / Income Gap (%) | 33,261 | 12.60% |
| Wage / Income Gap ($) | 33,261 | 87.40¢ per $1 |
| Gini / Inequality Index | 33,261 | 0.45 |
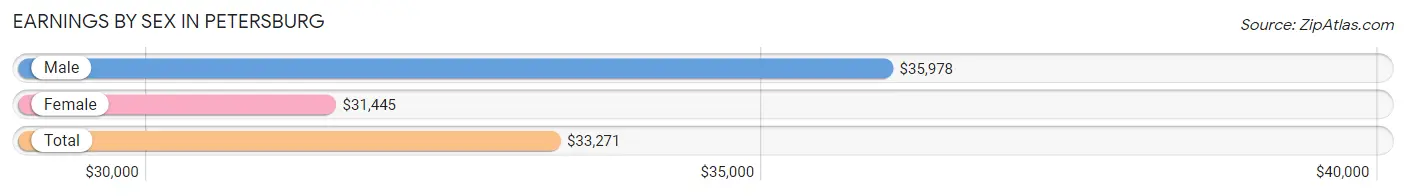
Earnings by Sex in Petersburg
Average Earnings in Petersburg are $33,271, $35,978 for men and $31,445 for women, a difference of 12.6%.
| Sex | Number | Average Earnings |
| Male | 7,397 (44.3%) | $35,978 |
| Female | 9,310 (55.7%) | $31,445 |
| Total | 16,707 (100.0%) | $33,271 |
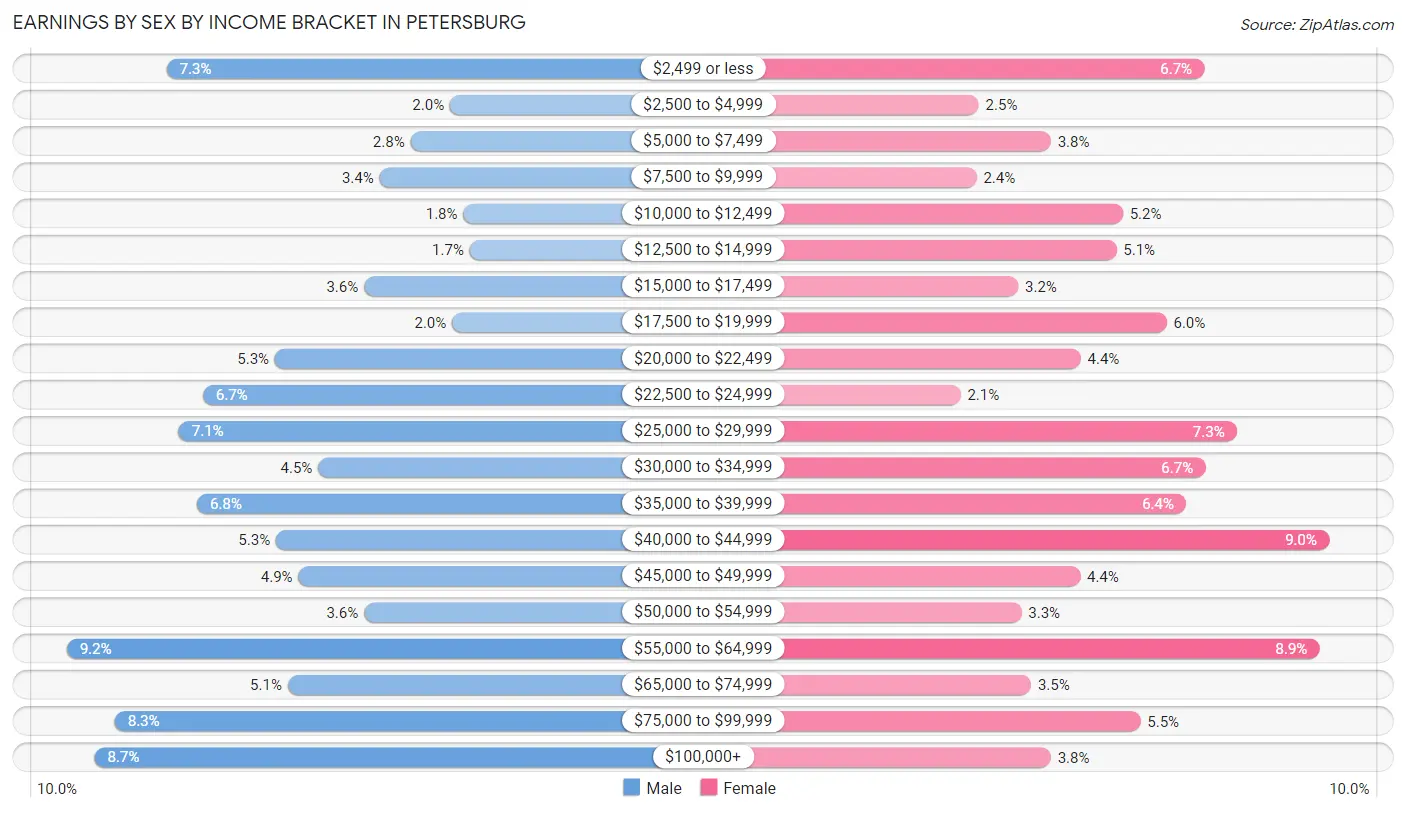
Earnings by Sex by Income Bracket in Petersburg
The most common earnings brackets in Petersburg are $55,000 to $64,999 for men (681 | 9.2%) and $40,000 to $44,999 for women (841 | 9.0%).
| Income | Male | Female |
| $2,499 or less | 543 (7.3%) | 623 (6.7%) |
| $2,500 to $4,999 | 150 (2.0%) | 230 (2.5%) |
| $5,000 to $7,499 | 205 (2.8%) | 356 (3.8%) |
| $7,500 to $9,999 | 248 (3.4%) | 226 (2.4%) |
| $10,000 to $12,499 | 132 (1.8%) | 481 (5.2%) |
| $12,500 to $14,999 | 123 (1.7%) | 470 (5.1%) |
| $15,000 to $17,499 | 269 (3.6%) | 299 (3.2%) |
| $17,500 to $19,999 | 147 (2.0%) | 558 (6.0%) |
| $20,000 to $22,499 | 393 (5.3%) | 408 (4.4%) |
| $22,500 to $24,999 | 493 (6.7%) | 198 (2.1%) |
| $25,000 to $29,999 | 526 (7.1%) | 680 (7.3%) |
| $30,000 to $34,999 | 333 (4.5%) | 625 (6.7%) |
| $35,000 to $39,999 | 501 (6.8%) | 591 (6.4%) |
| $40,000 to $44,999 | 391 (5.3%) | 841 (9.0%) |
| $45,000 to $49,999 | 360 (4.9%) | 407 (4.4%) |
| $50,000 to $54,999 | 269 (3.6%) | 304 (3.3%) |
| $55,000 to $64,999 | 681 (9.2%) | 824 (8.8%) |
| $65,000 to $74,999 | 375 (5.1%) | 321 (3.5%) |
| $75,000 to $99,999 | 615 (8.3%) | 512 (5.5%) |
| $100,000+ | 643 (8.7%) | 356 (3.8%) |
| Total | 7,397 (100.0%) | 9,310 (100.0%) |
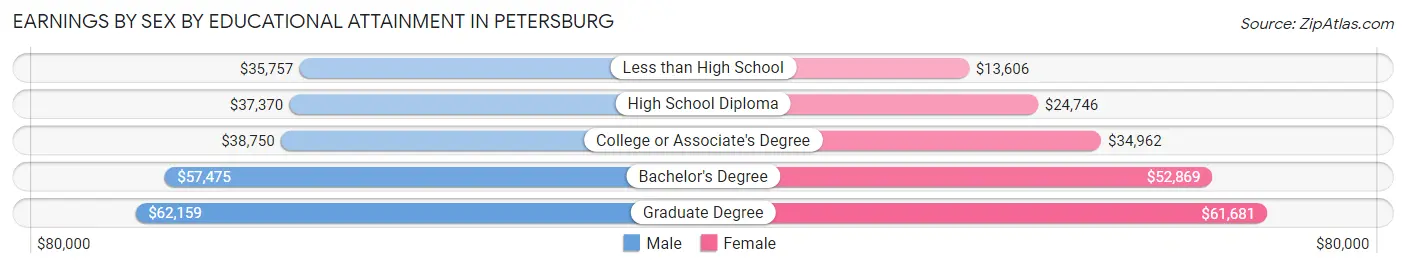
Earnings by Sex by Educational Attainment in Petersburg
Average earnings in Petersburg are $41,174 for men and $35,083 for women, a difference of 14.8%. Men with an educational attainment of graduate degree enjoy the highest average annual earnings of $62,159, while those with less than high school education earn the least with $35,757. Women with an educational attainment of graduate degree earn the most with the average annual earnings of $61,681, while those with less than high school education have the smallest earnings of $13,606.
| Educational Attainment | Male Income | Female Income |
| Less than High School | $35,757 | $13,606 |
| High School Diploma | $37,370 | $24,746 |
| College or Associate's Degree | $38,750 | $34,962 |
| Bachelor's Degree | $57,475 | $52,869 |
| Graduate Degree | $62,159 | $61,681 |
| Total | $41,174 | $35,083 |
Family Income in Petersburg
Family Income Brackets in Petersburg
According to the Petersburg family income data, there are 1,110 families falling into the $75,000 to $99,999 income range, which is the most common income bracket and makes up 17.3% of all families. Conversely, the $200,000+ income bracket is the least frequent group with only 250 families (3.9%) belonging to this category.
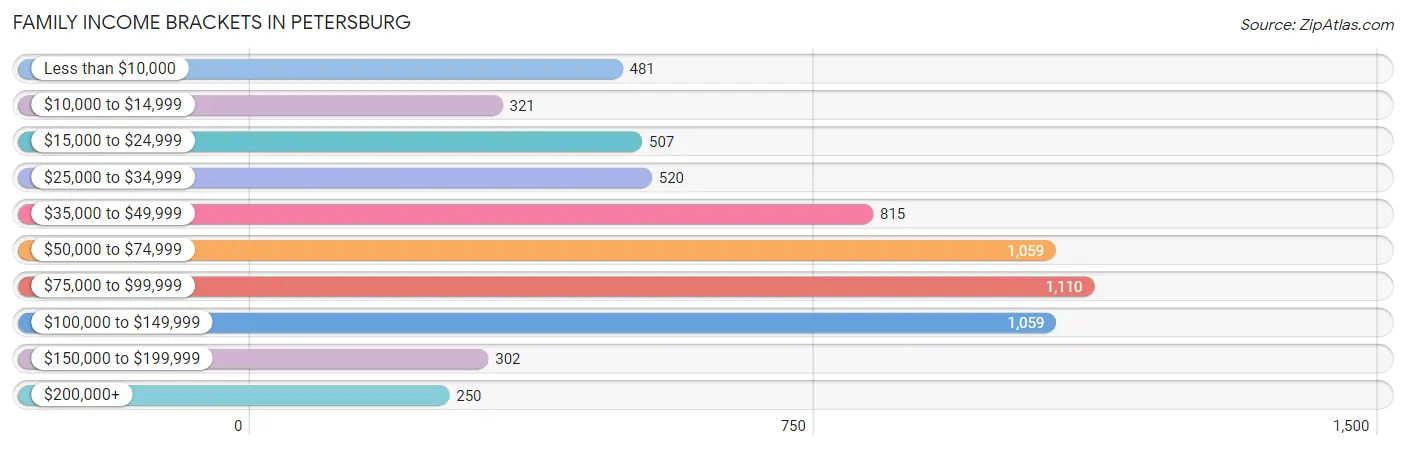
| Income Bracket | # Families | % Families |
| Less than $10,000 | 481 | 7.5% |
| $10,000 to $14,999 | 321 | 5.0% |
| $15,000 to $24,999 | 507 | 7.9% |
| $25,000 to $34,999 | 520 | 8.1% |
| $35,000 to $49,999 | 815 | 12.7% |
| $50,000 to $74,999 | 1,059 | 16.5% |
| $75,000 to $99,999 | 1,110 | 17.3% |
| $100,000 to $149,999 | 1,059 | 16.5% |
| $150,000 to $199,999 | 302 | 4.7% |
| $200,000+ | 250 | 3.9% |
Family Income by Famaliy Size in Petersburg
7+ person families (107 | 1.7%) account for the highest median family income in Petersburg with $108,222 per family, while 2-person families (3,518 | 54.8%) have the highest median income of $30,931 per family member.
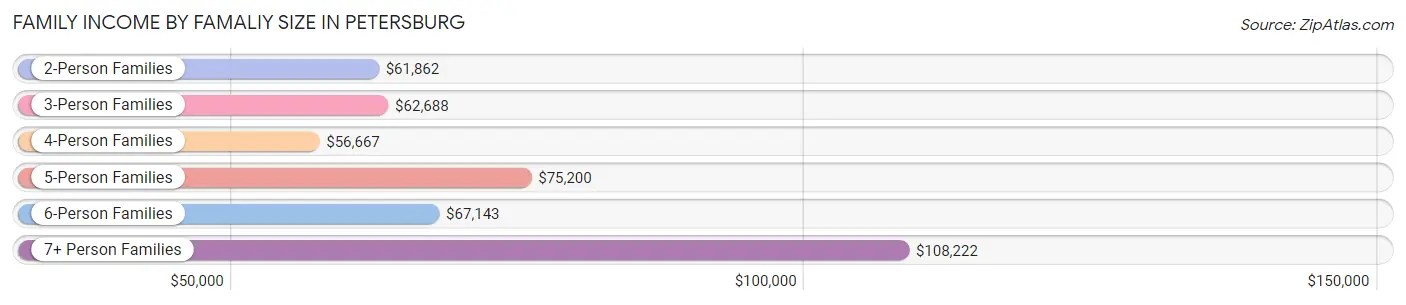
| Income Bracket | # Families | Median Income |
| 2-Person Families | 3,518 (54.8%) | $61,862 |
| 3-Person Families | 1,423 (22.2%) | $62,688 |
| 4-Person Families | 996 (15.5%) | $56,667 |
| 5-Person Families | 166 (2.6%) | $75,200 |
| 6-Person Families | 206 (3.2%) | $67,143 |
| 7+ Person Families | 107 (1.7%) | $108,222 |
| Total | 6,416 (100.0%) | $62,385 |
Family Income by Number of Earners in Petersburg
The median family income in Petersburg is $62,385, with families comprising 3+ earners (601) having the highest median family income of $108,222, while families with no earners (947) have the lowest median family income of $26,773, accounting for 9.4% and 14.8% of families, respectively.
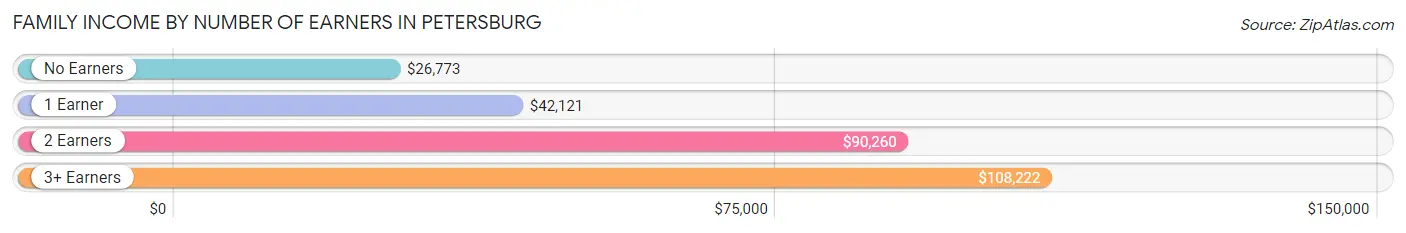
| Number of Earners | # Families | Median Income |
| No Earners | 947 (14.8%) | $26,773 |
| 1 Earner | 2,895 (45.1%) | $42,121 |
| 2 Earners | 1,973 (30.7%) | $90,260 |
| 3+ Earners | 601 (9.4%) | $108,222 |
| Total | 6,416 (100.0%) | $62,385 |
Household Income in Petersburg
Household Income Brackets in Petersburg
With 2,955 households falling in the category, the $50,000 to $74,999 income range is the most frequent in Petersburg, accounting for 20.1% of all households. In contrast, only 338 households (2.3%) fall into the $200,000+ income bracket, making it the least populous group.
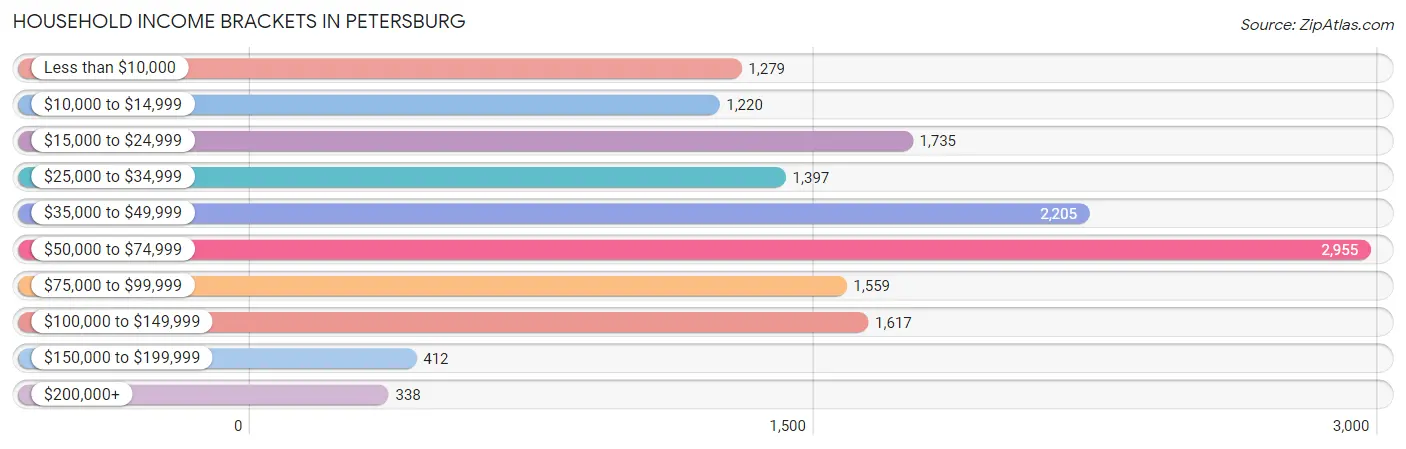
| Income Bracket | # Households | % Households |
| Less than $10,000 | 1,279 | 8.7% |
| $10,000 to $14,999 | 1,220 | 8.3% |
| $15,000 to $24,999 | 1,735 | 11.8% |
| $25,000 to $34,999 | 1,397 | 9.5% |
| $35,000 to $49,999 | 2,205 | 15.0% |
| $50,000 to $74,999 | 2,955 | 20.1% |
| $75,000 to $99,999 | 1,559 | 10.6% |
| $100,000 to $149,999 | 1,617 | 11.0% |
| $150,000 to $199,999 | 412 | 2.8% |
| $200,000+ | 338 | 2.3% |
Household Income by Householder Age in Petersburg
The median household income in Petersburg is $46,930, with the highest median household income of $57,588 found in the 45 to 64 years age bracket for the primary householder. A total of 5,095 households (34.6%) fall into this category. Meanwhile, the 15 to 24 years age bracket for the primary householder has the lowest median household income of $27,227, with 833 households (5.7%) in this group.
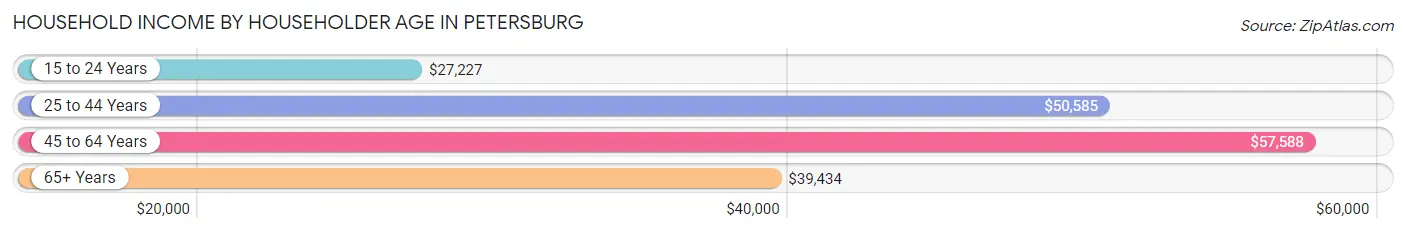
| Income Bracket | # Households | Median Income |
| 15 to 24 Years | 833 (5.7%) | $27,227 |
| 25 to 44 Years | 4,861 (33.1%) | $50,585 |
| 45 to 64 Years | 5,095 (34.6%) | $57,588 |
| 65+ Years | 3,914 (26.6%) | $39,434 |
| Total | 14,703 (100.0%) | $46,930 |
Poverty in Petersburg
Income Below Poverty by Sex and Age in Petersburg
With 20.8% poverty level for males and 23.4% for females among the residents of Petersburg, 16 and 17 year old males and 5 year old females are the most vulnerable to poverty, with 175 males (46.5%) and 213 females (75.3%) in their respective age groups living below the poverty level.
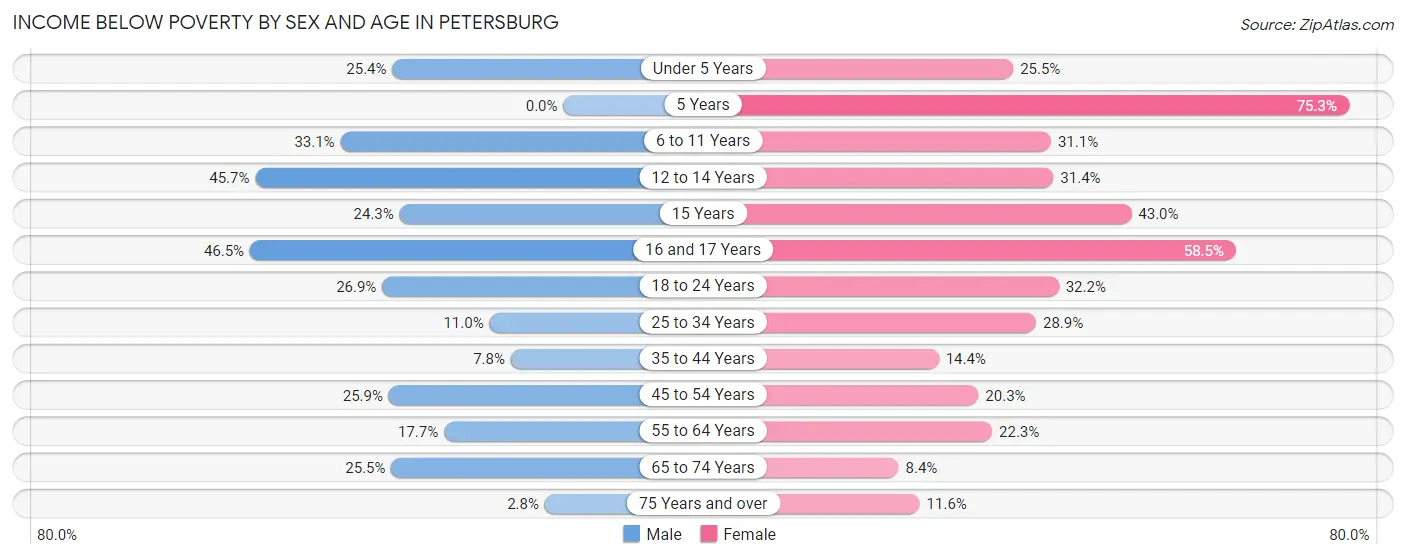
| Age Bracket | Male | Female |
| Under 5 Years | 310 (25.4%) | 312 (25.5%) |
| 5 Years | 0 (0.0%) | 213 (75.3%) |
| 6 to 11 Years | 477 (33.1%) | 382 (31.1%) |
| 12 to 14 Years | 172 (45.7%) | 93 (31.4%) |
| 15 Years | 44 (24.3%) | 86 (43.0%) |
| 16 and 17 Years | 175 (46.5%) | 148 (58.5%) |
| 18 to 24 Years | 382 (26.9%) | 507 (32.2%) |
| 25 to 34 Years | 261 (11.0%) | 859 (28.8%) |
| 35 to 44 Years | 132 (7.8%) | 286 (14.4%) |
| 45 to 54 Years | 435 (25.9%) | 411 (20.3%) |
| 55 to 64 Years | 351 (17.7%) | 542 (22.3%) |
| 65 to 74 Years | 353 (25.5%) | 158 (8.4%) |
| 75 Years and over | 19 (2.8%) | 167 (11.6%) |
| Total | 3,111 (20.8%) | 4,164 (23.4%) |
Income Above Poverty by Sex and Age in Petersburg
According to the poverty statistics in Petersburg, males aged 5 years and females aged 65 to 74 years are the age groups that are most secure financially, with 100.0% of males and 91.6% of females in these age groups living above the poverty line.
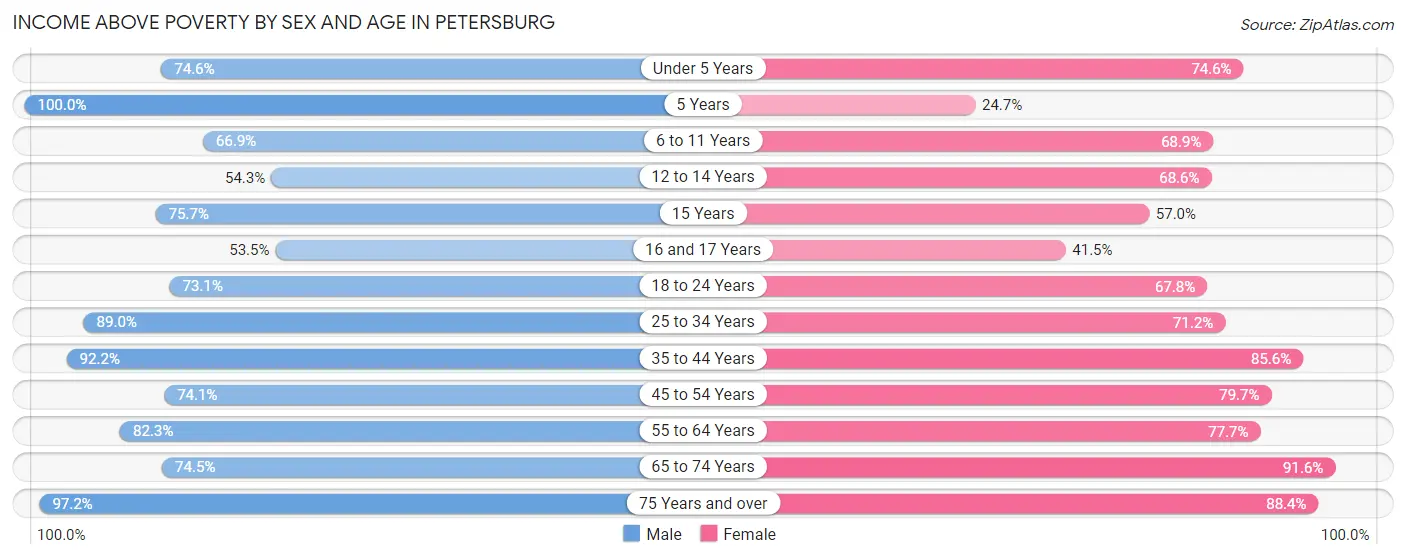
| Age Bracket | Male | Female |
| Under 5 Years | 911 (74.6%) | 914 (74.6%) |
| 5 Years | 138 (100.0%) | 70 (24.7%) |
| 6 to 11 Years | 964 (66.9%) | 848 (68.9%) |
| 12 to 14 Years | 204 (54.3%) | 203 (68.6%) |
| 15 Years | 137 (75.7%) | 114 (57.0%) |
| 16 and 17 Years | 201 (53.5%) | 105 (41.5%) |
| 18 to 24 Years | 1,038 (73.1%) | 1,067 (67.8%) |
| 25 to 34 Years | 2,119 (89.0%) | 2,118 (71.2%) |
| 35 to 44 Years | 1,559 (92.2%) | 1,701 (85.6%) |
| 45 to 54 Years | 1,243 (74.1%) | 1,615 (79.7%) |
| 55 to 64 Years | 1,630 (82.3%) | 1,886 (77.7%) |
| 65 to 74 Years | 1,029 (74.5%) | 1,717 (91.6%) |
| 75 Years and over | 670 (97.2%) | 1,278 (88.4%) |
| Total | 11,843 (79.2%) | 13,636 (76.6%) |
Income Below Poverty Among Married-Couple Families in Petersburg
The poverty statistics for married-couple families in Petersburg show that 4.9% or 122 of the total 2,485 families live below the poverty line. Families with 1 or 2 children have the highest poverty rate of 8.2%, comprising of 61 families. On the other hand, families with 3 or 4 children have the lowest poverty rate of 1.9%, which includes 2 families.
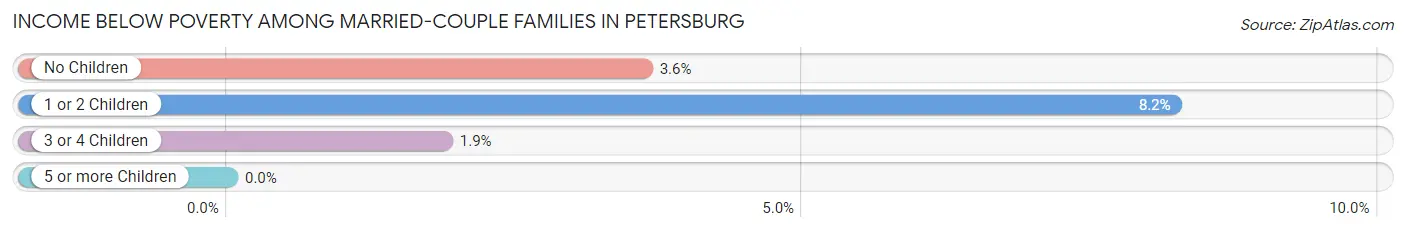
| Children | Above Poverty | Below Poverty |
| No Children | 1,577 (96.4%) | 59 (3.6%) |
| 1 or 2 Children | 681 (91.8%) | 61 (8.2%) |
| 3 or 4 Children | 105 (98.1%) | 2 (1.9%) |
| 5 or more Children | 0 (0.0%) | 0 (0.0%) |
| Total | 2,363 (95.1%) | 122 (4.9%) |
Income Below Poverty Among Single-Parent Households in Petersburg
According to the poverty data in Petersburg, 5.9% or 42 single-father households and 33.1% or 1,064 single-mother households are living below the poverty line. Among single-father households, those with 1 or 2 children have the highest poverty rate, with 20 households (10.3%) experiencing poverty. Likewise, among single-mother households, those with 5 or more children have the highest poverty rate, with 36 households (100.0%) falling below the poverty line.
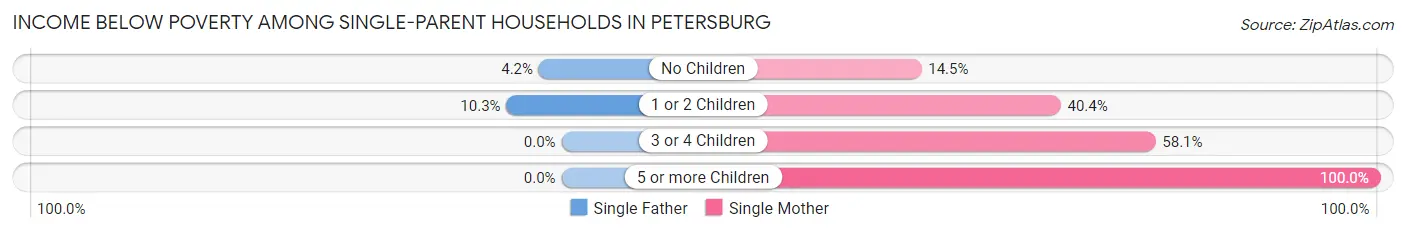
| Children | Single Father | Single Mother |
| No Children | 22 (4.2%) | 184 (14.4%) |
| 1 or 2 Children | 20 (10.3%) | 599 (40.4%) |
| 3 or 4 Children | 0 (0.0%) | 245 (58.1%) |
| 5 or more Children | 0 (0.0%) | 36 (100.0%) |
| Total | 42 (5.9%) | 1,064 (33.1%) |
Income Below Poverty Among Married-Couple vs Single-Parent Households in Petersburg
The poverty data for Petersburg shows that 122 of the married-couple family households (4.9%) and 1,106 of the single-parent households (28.1%) are living below the poverty level. Within the married-couple family households, those with 1 or 2 children have the highest poverty rate, with 61 households (8.2%) falling below the poverty line. Among the single-parent households, those with 5 or more children have the highest poverty rate, with 36 household (100.0%) living below poverty.
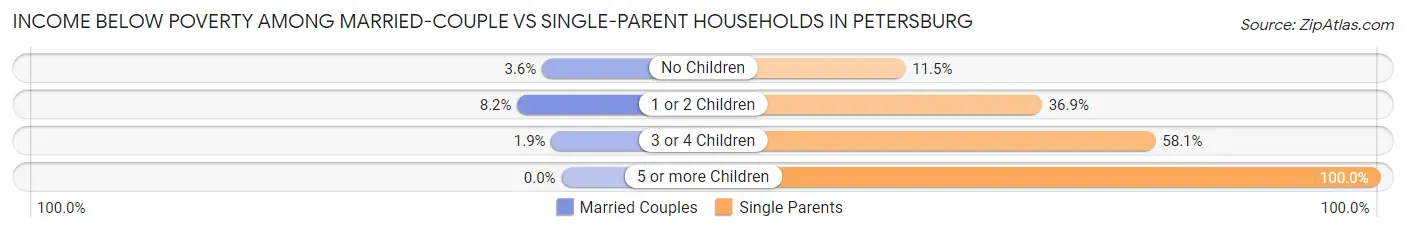
| Children | Married-Couple Families | Single-Parent Households |
| No Children | 59 (3.6%) | 206 (11.5%) |
| 1 or 2 Children | 61 (8.2%) | 619 (36.9%) |
| 3 or 4 Children | 2 (1.9%) | 245 (58.1%) |
| 5 or more Children | 0 (0.0%) | 36 (100.0%) |
| Total | 122 (4.9%) | 1,106 (28.1%) |
Race in Petersburg
The most populous races in Petersburg are Black / African American (25,698 | 77.3%), White / Caucasian (5,532 | 16.6%), and Hispanic or Latino (1,765 | 5.3%).
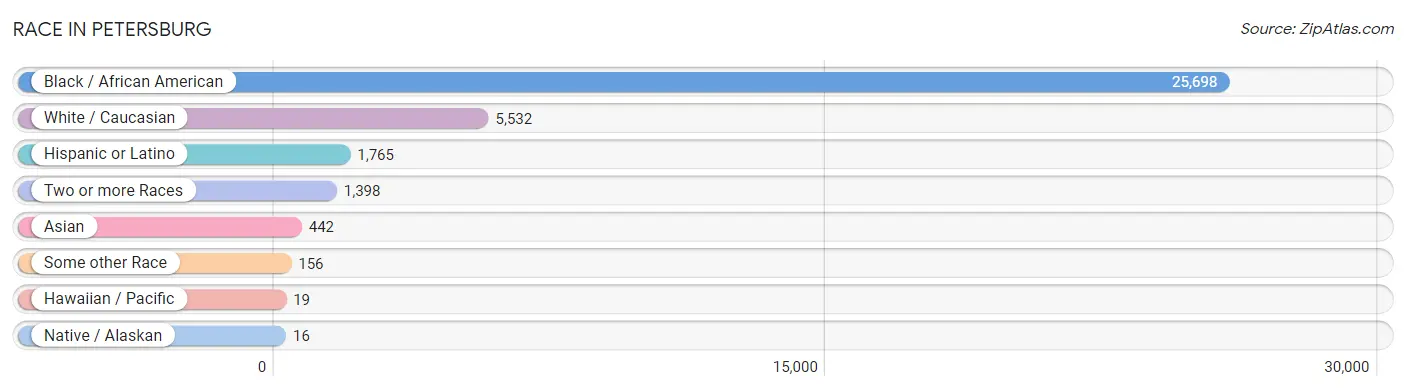
| Race | # Population | % Population |
| Asian | 442 | 1.3% |
| Black / African American | 25,698 | 77.3% |
| Hawaiian / Pacific | 19 | 0.1% |
| Hispanic or Latino | 1,765 | 5.3% |
| Native / Alaskan | 16 | 0.1% |
| White / Caucasian | 5,532 | 16.6% |
| Two or more Races | 1,398 | 4.2% |
| Some other Race | 156 | 0.5% |
| Total | 33,261 | 100.0% |
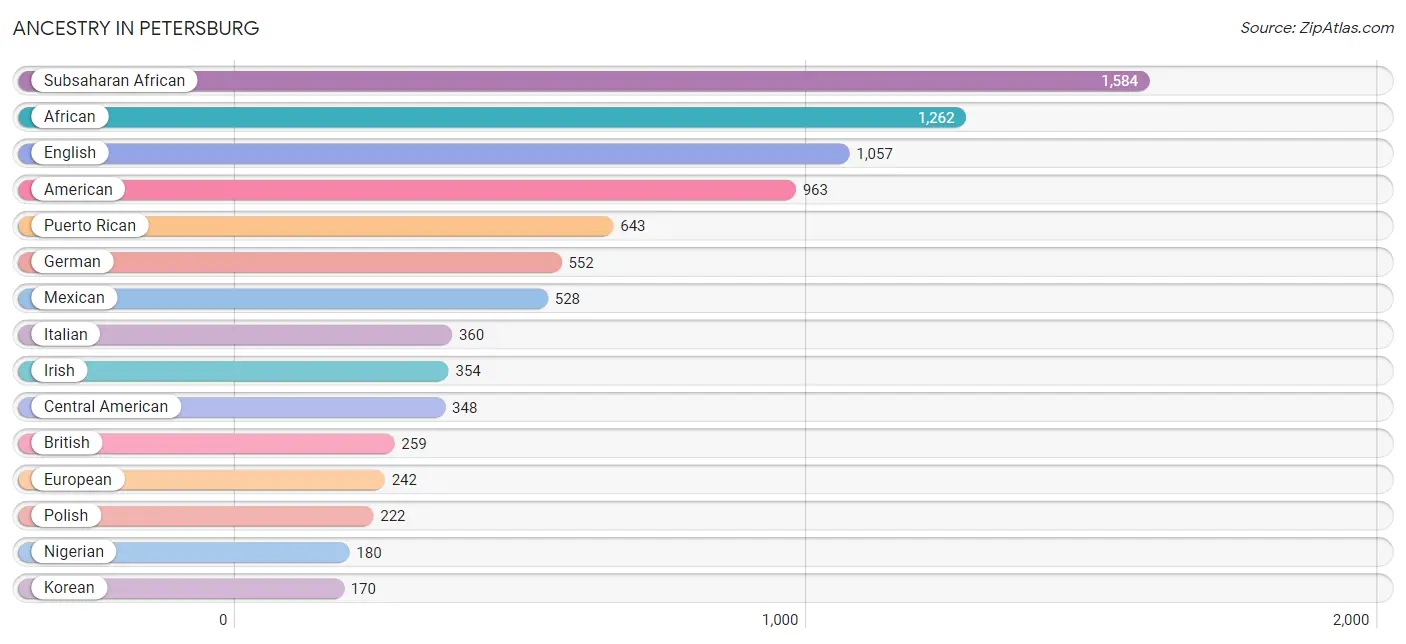
Ancestry in Petersburg
The most populous ancestries reported in Petersburg are Subsaharan African (1,584 | 4.8%), African (1,262 | 3.8%), English (1,057 | 3.2%), American (963 | 2.9%), and Puerto Rican (643 | 1.9%), together accounting for 16.6% of all Petersburg residents.
| Ancestry | # Population | % Population |
| African | 1,262 | 3.8% |
| American | 963 | 2.9% |
| Arab | 1 | 0.0% |
| Argentinean | 24 | 0.1% |
| Austrian | 15 | 0.1% |
| Barbadian | 16 | 0.1% |
| Blackfeet | 15 | 0.1% |
| British | 259 | 0.8% |
| Burmese | 126 | 0.4% |
| Canadian | 22 | 0.1% |
| Central American | 348 | 1.1% |
| Cherokee | 24 | 0.1% |
| Chickasaw | 10 | 0.0% |
| Cuban | 54 | 0.2% |
| Czech | 31 | 0.1% |
| Dominican | 39 | 0.1% |
| Dutch West Indian | 14 | 0.0% |
| Eastern European | 54 | 0.2% |
| English | 1,057 | 3.2% |
| European | 242 | 0.7% |
| French | 115 | 0.4% |
| French American Indian | 4 | 0.0% |
| French Canadian | 11 | 0.0% |
| German | 552 | 1.7% |
| Greek | 27 | 0.1% |
| Guamanian / Chamorro | 16 | 0.1% |
| Guatemalan | 138 | 0.4% |
| Haitian | 47 | 0.1% |
| Honduran | 56 | 0.2% |
| Indian (Asian) | 14 | 0.0% |
| Irish | 354 | 1.1% |
| Italian | 360 | 1.1% |
| Jamaican | 68 | 0.2% |
| Korean | 170 | 0.5% |
| Laotian | 57 | 0.2% |
| Lithuanian | 35 | 0.1% |
| Malaysian | 53 | 0.2% |
| Mexican | 528 | 1.6% |
| Nigerian | 180 | 0.5% |
| Northern European | 30 | 0.1% |
| Norwegian | 33 | 0.1% |
| Pakistani | 26 | 0.1% |
| Panamanian | 34 | 0.1% |
| Polish | 222 | 0.7% |
| Portuguese | 135 | 0.4% |
| Puerto Rican | 643 | 1.9% |
| Russian | 53 | 0.2% |
| Salvadoran | 120 | 0.4% |
| Scandinavian | 27 | 0.1% |
| Scotch-Irish | 78 | 0.2% |
| Scottish | 152 | 0.5% |
| Slovak | 19 | 0.1% |
| South American | 24 | 0.1% |
| Spaniard | 13 | 0.0% |
| Sri Lankan | 33 | 0.1% |
| Subsaharan African | 1,584 | 4.8% |
| Sudanese | 97 | 0.3% |
| Swedish | 120 | 0.4% |
| Swiss | 24 | 0.1% |
| Thai | 136 | 0.4% |
| Turkish | 20 | 0.1% |
| U.S. Virgin Islander | 15 | 0.1% |
| Ukrainian | 19 | 0.1% |
| West Indian | 39 | 0.1% | View All 64 Rows |
Immigrants in Petersburg
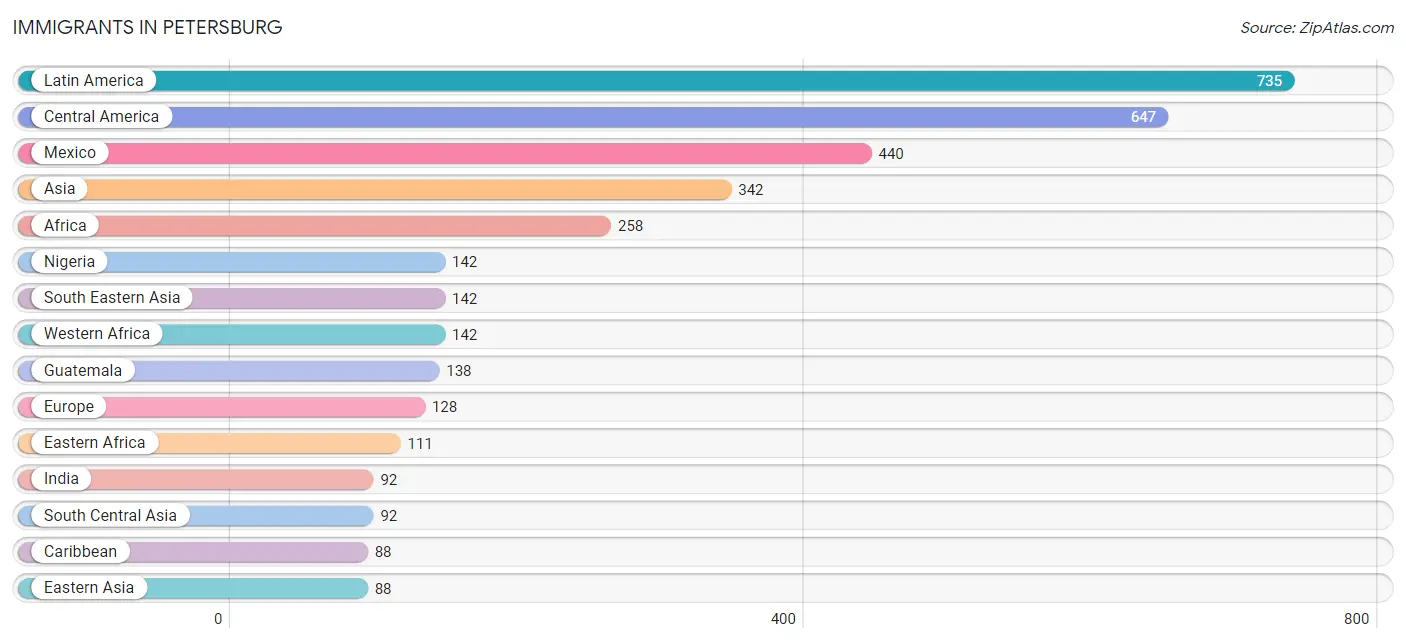
The most numerous immigrant groups reported in Petersburg came from Latin America (735 | 2.2%), Central America (647 | 1.9%), Mexico (440 | 1.3%), Asia (342 | 1.0%), and Africa (258 | 0.8%), together accounting for 7.3% of all Petersburg residents.
| Immigration Origin | # Population | % Population |
| Africa | 258 | 0.8% |
| Asia | 342 | 1.0% |
| Barbados | 16 | 0.1% |
| Canada | 6 | 0.0% |
| Caribbean | 88 | 0.3% |
| Central America | 647 | 1.9% |
| China | 28 | 0.1% |
| Congo | 1 | 0.0% |
| Dominican Republic | 19 | 0.1% |
| Eastern Africa | 111 | 0.3% |
| Eastern Asia | 88 | 0.3% |
| Eastern Europe | 8 | 0.0% |
| Egypt | 3 | 0.0% |
| El Salvador | 46 | 0.1% |
| England | 9 | 0.0% |
| Europe | 128 | 0.4% |
| Germany | 42 | 0.1% |
| Guatemala | 138 | 0.4% |
| Haiti | 27 | 0.1% |
| Honduras | 23 | 0.1% |
| India | 92 | 0.3% |
| Indonesia | 57 | 0.2% |
| Italy | 69 | 0.2% |
| Jamaica | 26 | 0.1% |
| Korea | 60 | 0.2% |
| Laos | 26 | 0.1% |
| Latin America | 735 | 2.2% |
| Mexico | 440 | 1.3% |
| Middle Africa | 1 | 0.0% |
| Nigeria | 142 | 0.4% |
| Northern Africa | 4 | 0.0% |
| Northern Europe | 9 | 0.0% |
| South Central Asia | 92 | 0.3% |
| South Eastern Asia | 142 | 0.4% |
| Southern Europe | 69 | 0.2% |
| Thailand | 26 | 0.1% |
| Turkey | 20 | 0.1% |
| Ukraine | 8 | 0.0% |
| Vietnam | 33 | 0.1% |
| Western Africa | 142 | 0.4% |
| Western Asia | 20 | 0.1% |
| Western Europe | 42 | 0.1% | View All 42 Rows |
Sex and Age in Petersburg
Sex and Age in Petersburg
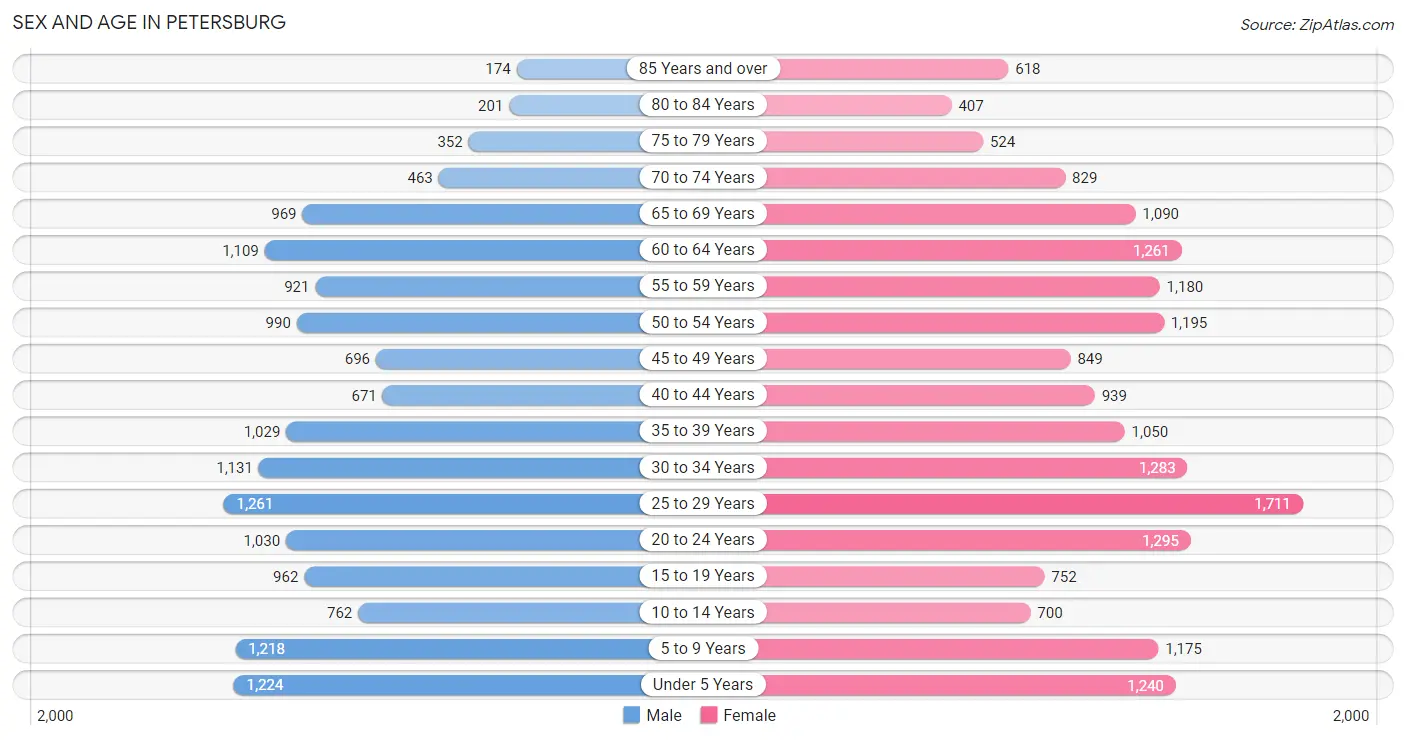
The most populous age groups in Petersburg are 25 to 29 Years (1,261 | 8.3%) for men and 25 to 29 Years (1,711 | 9.5%) for women.
| Age Bracket | Male | Female |
| Under 5 Years | 1,224 (8.1%) | 1,240 (6.9%) |
| 5 to 9 Years | 1,218 (8.0%) | 1,175 (6.5%) |
| 10 to 14 Years | 762 (5.0%) | 700 (3.9%) |
| 15 to 19 Years | 962 (6.3%) | 752 (4.2%) |
| 20 to 24 Years | 1,030 (6.8%) | 1,295 (7.2%) |
| 25 to 29 Years | 1,261 (8.3%) | 1,711 (9.5%) |
| 30 to 34 Years | 1,131 (7.5%) | 1,283 (7.1%) |
| 35 to 39 Years | 1,029 (6.8%) | 1,050 (5.8%) |
| 40 to 44 Years | 671 (4.4%) | 939 (5.2%) |
| 45 to 49 Years | 696 (4.6%) | 849 (4.7%) |
| 50 to 54 Years | 990 (6.5%) | 1,195 (6.6%) |
| 55 to 59 Years | 921 (6.1%) | 1,180 (6.5%) |
| 60 to 64 Years | 1,109 (7.3%) | 1,261 (7.0%) |
| 65 to 69 Years | 969 (6.4%) | 1,090 (6.0%) |
| 70 to 74 Years | 463 (3.0%) | 829 (4.6%) |
| 75 to 79 Years | 352 (2.3%) | 524 (2.9%) |
| 80 to 84 Years | 201 (1.3%) | 407 (2.2%) |
| 85 Years and over | 174 (1.1%) | 618 (3.4%) |
| Total | 15,163 (100.0%) | 18,098 (100.0%) |
Families and Households in Petersburg
Median Family Size in Petersburg
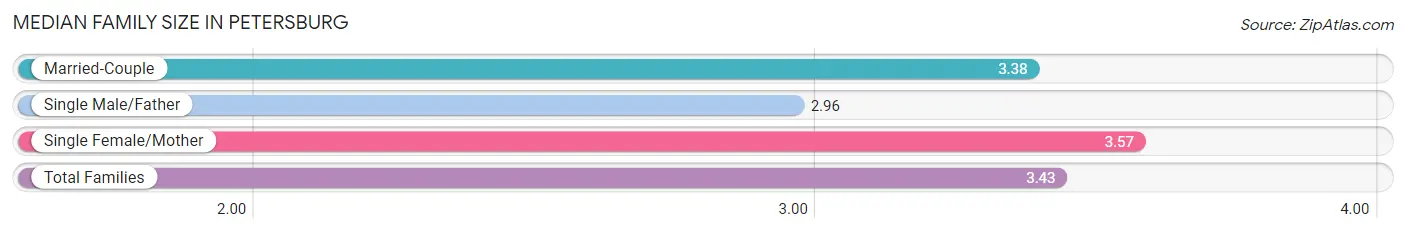
The median family size in Petersburg is 3.43 persons per family, with single female/mother families (3,214 | 50.1%) accounting for the largest median family size of 3.57 persons per family. On the other hand, single male/father families (717 | 11.2%) represent the smallest median family size with 2.96 persons per family.
| Family Type | # Families | Family Size |
| Married-Couple | 2,485 (38.7%) | 3.38 |
| Single Male/Father | 717 (11.2%) | 2.96 |
| Single Female/Mother | 3,214 (50.1%) | 3.57 |
| Total Families | 6,416 (100.0%) | 3.43 |
Median Household Size in Petersburg
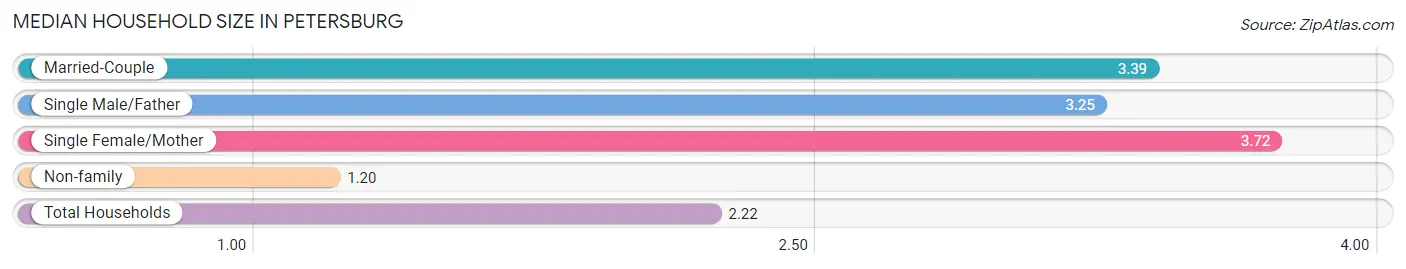
The median household size in Petersburg is 2.22 persons per household, with single female/mother households (3,214 | 21.9%) accounting for the largest median household size of 3.72 persons per household. non-family households (8,287 | 56.4%) represent the smallest median household size with 1.20 persons per household.
| Household Type | # Households | Household Size |
| Married-Couple | 2,485 (16.9%) | 3.39 |
| Single Male/Father | 717 (4.9%) | 3.25 |
| Single Female/Mother | 3,214 (21.9%) | 3.72 |
| Non-family | 8,287 (56.4%) | 1.20 |
| Total Households | 14,703 (100.0%) | 2.22 |
Household Size by Marriage Status in Petersburg
Out of a total of 14,703 households in Petersburg, 6,416 (43.6%) are family households, while 8,287 (56.4%) are nonfamily households. The most numerous type of family households are 2-person households, comprising 3,273, and the most common type of nonfamily households are 1-person households, comprising 7,304.
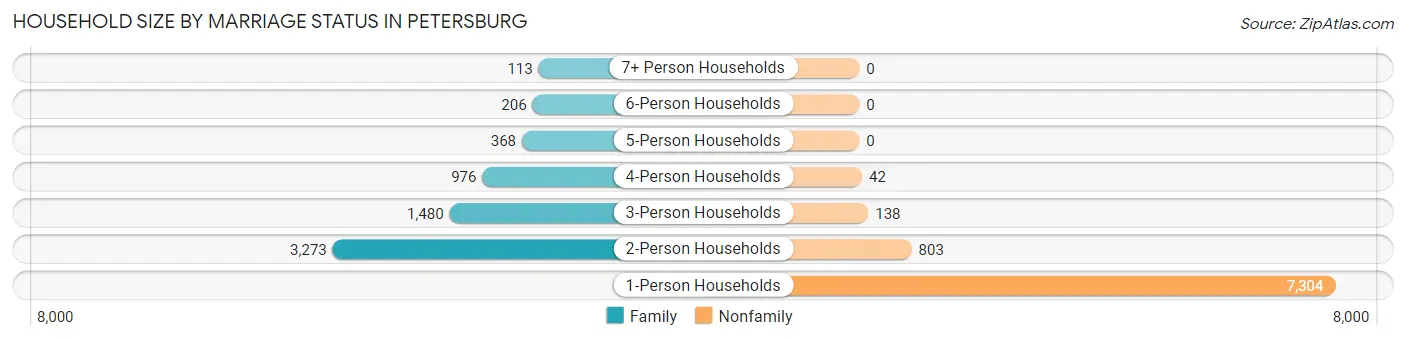
| Household Size | Family Households | Nonfamily Households |
| 1-Person Households | - | 7,304 (49.7%) |
| 2-Person Households | 3,273 (22.3%) | 803 (5.5%) |
| 3-Person Households | 1,480 (10.1%) | 138 (0.9%) |
| 4-Person Households | 976 (6.6%) | 42 (0.3%) |
| 5-Person Households | 368 (2.5%) | 0 (0.0%) |
| 6-Person Households | 206 (1.4%) | 0 (0.0%) |
| 7+ Person Households | 113 (0.8%) | 0 (0.0%) |
| Total | 6,416 (43.6%) | 8,287 (56.4%) |
Female Fertility in Petersburg
Fertility by Age in Petersburg
Average fertility rate in Petersburg is 43.0 births per 1,000 women. Women in the age bracket of 20 to 34 years have the highest fertility rate with 63.0 births per 1,000 women. Women in the age bracket of 20 to 34 years acount for 76.9% of all women with births.
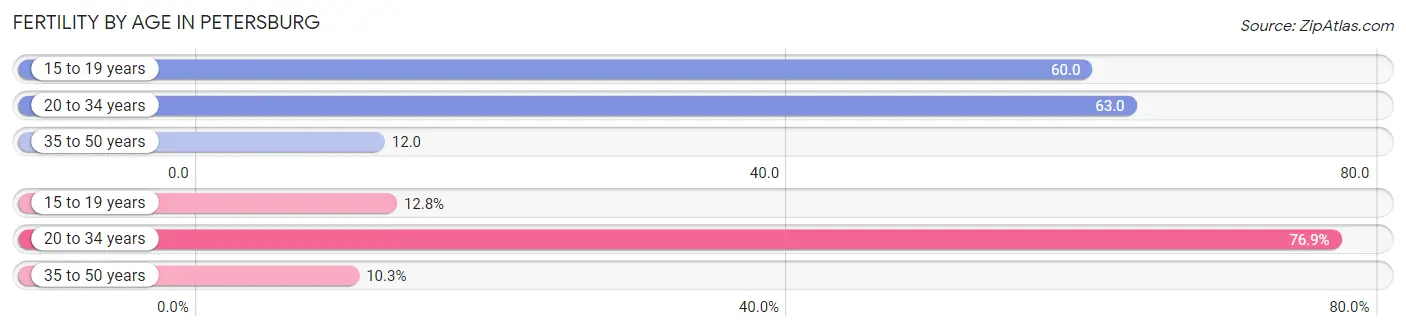
| Age Bracket | Women with Births | Births / 1,000 Women |
| 15 to 19 years | 45 (12.8%) | 60.0 |
| 20 to 34 years | 270 (76.9%) | 63.0 |
| 35 to 50 years | 36 (10.3%) | 12.0 |
| Total | 351 (100.0%) | 43.0 |
Fertility by Age by Marriage Status in Petersburg
20.5% of women with births (351) in Petersburg are married. The highest percentage of unmarried women with births falls into 15 to 19 years age bracket with 100.0% of them unmarried at the time of birth, while the lowest percentage of unmarried women with births belong to 20 to 34 years age bracket with 75.6% of them unmarried.
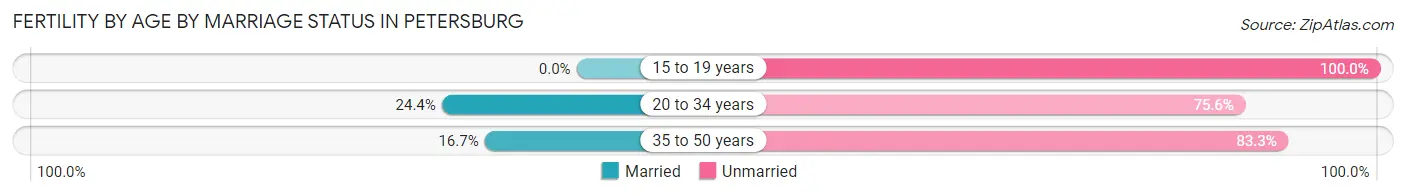
| Age Bracket | Married | Unmarried |
| 15 to 19 years | 0 (0.0%) | 45 (100.0%) |
| 20 to 34 years | 66 (24.4%) | 204 (75.6%) |
| 35 to 50 years | 6 (16.7%) | 30 (83.3%) |
| Total | 72 (20.5%) | 279 (79.5%) |
Fertility by Education in Petersburg
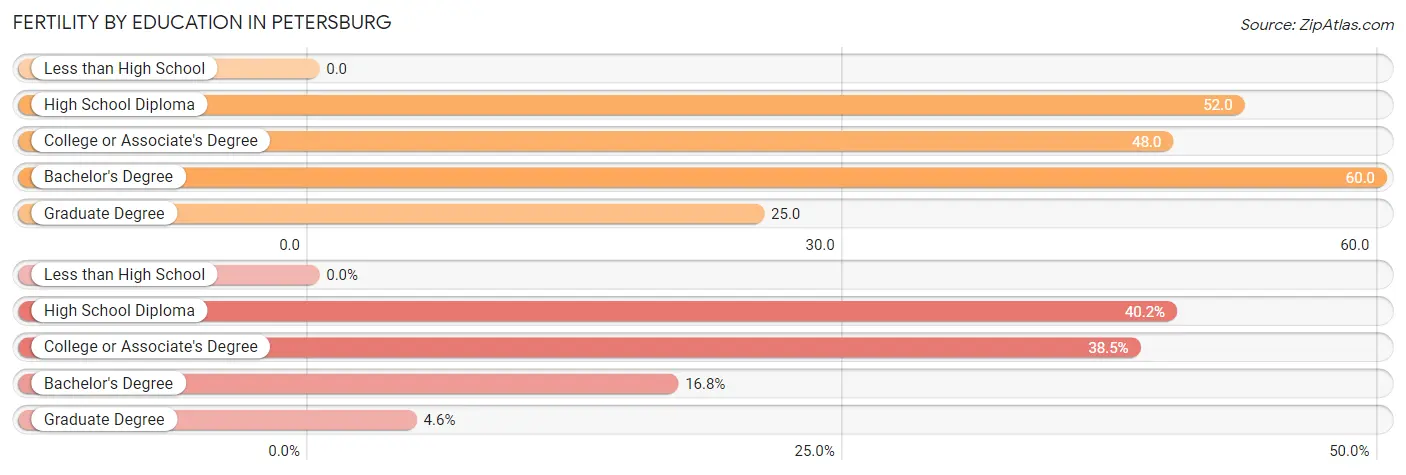
| Educational Attainment | Women with Births | Births / 1,000 Women |
| Less than High School | 0 (0.0%) | 0.0 |
| High School Diploma | 141 (40.2%) | 52.0 |
| College or Associate's Degree | 135 (38.5%) | 48.0 |
| Bachelor's Degree | 59 (16.8%) | 60.0 |
| Graduate Degree | 16 (4.6%) | 25.0 |
| Total | 351 (100.0%) | 43.0 |
Fertility by Education by Marriage Status in Petersburg
79.5% of women with births in Petersburg are unmarried. Women with the educational attainment of college or associate's degree are most likely to be married with 42.2% of them married at childbirth, while women with the educational attainment of graduate degree are least likely to be married with 100.0% of them unmarried at childbirth.
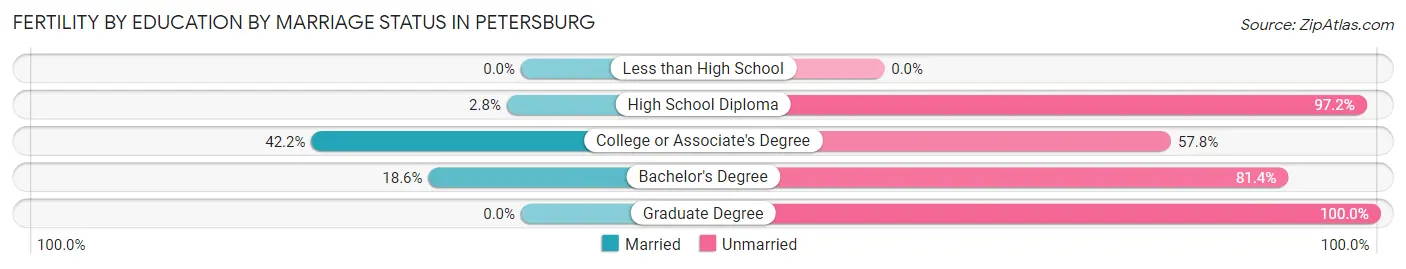
| Educational Attainment | Married | Unmarried |
| Less than High School | 0 (0.0%) | 0 (0.0%) |
| High School Diploma | 4 (2.8%) | 137 (97.2%) |
| College or Associate's Degree | 57 (42.2%) | 78 (57.8%) |
| Bachelor's Degree | 11 (18.6%) | 48 (81.4%) |
| Graduate Degree | 0 (0.0%) | 16 (100.0%) |
| Total | 72 (20.5%) | 279 (79.5%) |
Employment Characteristics in Petersburg
Employment by Class of Employer in Petersburg
Among the 14,304 employed individuals in Petersburg, private company employees (9,512 | 66.5%), federal government employees (1,390 | 9.7%), and local government employees (1,245 | 8.7%) make up the most common classes of employment.
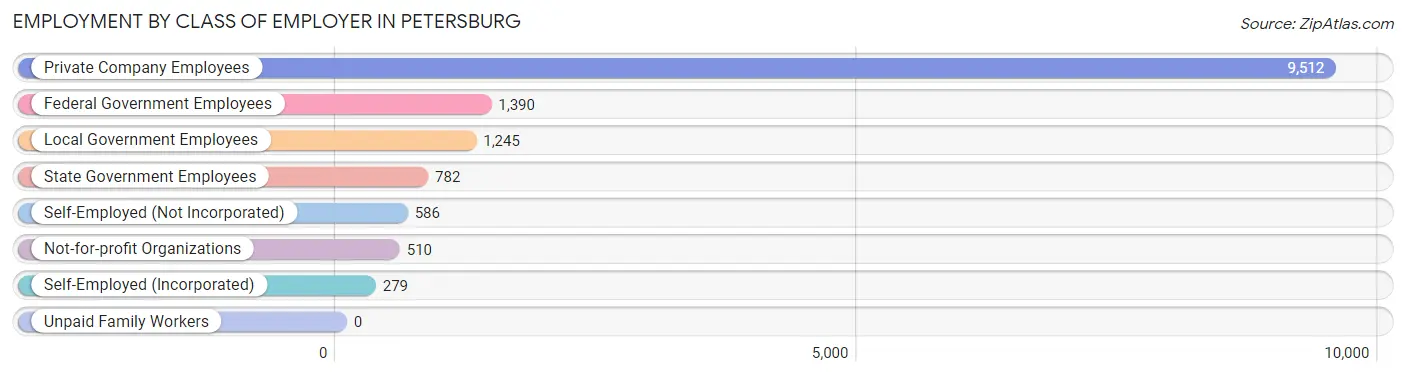
| Employer Class | # Employees | % Employees |
| Private Company Employees | 9,512 | 66.5% |
| Self-Employed (Incorporated) | 279 | 1.9% |
| Self-Employed (Not Incorporated) | 586 | 4.1% |
| Not-for-profit Organizations | 510 | 3.6% |
| Local Government Employees | 1,245 | 8.7% |
| State Government Employees | 782 | 5.5% |
| Federal Government Employees | 1,390 | 9.7% |
| Unpaid Family Workers | 0 | 0.0% |
| Total | 14,304 | 100.0% |
Employment Status by Age in Petersburg
According to the labor force statistics for Petersburg, out of the total population over 16 years of age (26,552), 62.4% or 16,568 individuals are in the labor force, with 11.3% or 1,872 of them unemployed. The age group with the highest labor force participation rate is 25 to 29 years, with 87.1% or 2,589 individuals in the labor force. Within the labor force, the 20 to 24 years age range has the highest percentage of unemployed individuals, with 22.9% or 413 of them being unemployed.
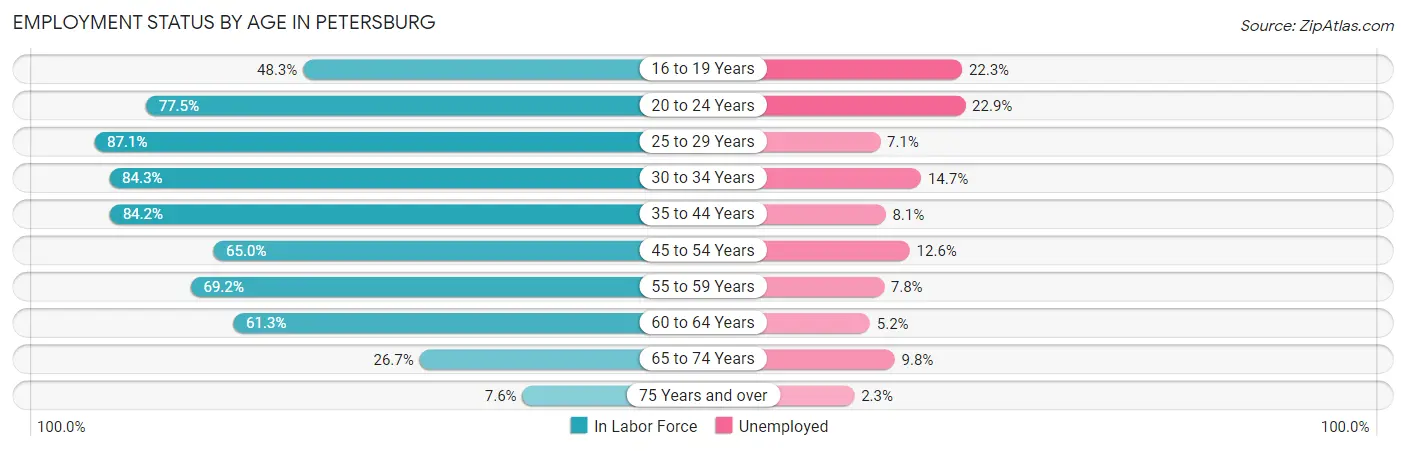
| Age Bracket | In Labor Force | Unemployed |
| 16 to 19 Years | 639 (48.3%) | 142 (22.3%) |
| 20 to 24 Years | 1,802 (77.5%) | 413 (22.9%) |
| 25 to 29 Years | 2,589 (87.1%) | 184 (7.1%) |
| 30 to 34 Years | 2,035 (84.3%) | 299 (14.7%) |
| 35 to 44 Years | 3,106 (84.2%) | 252 (8.1%) |
| 45 to 54 Years | 2,424 (65.0%) | 305 (12.6%) |
| 55 to 59 Years | 1,454 (69.2%) | 113 (7.8%) |
| 60 to 64 Years | 1,453 (61.3%) | 76 (5.2%) |
| 65 to 74 Years | 895 (26.7%) | 88 (9.8%) |
| 75 Years and over | 173 (7.6%) | 4 (2.3%) |
| Total | 16,568 (62.4%) | 1,872 (11.3%) |
Employment Status by Educational Attainment in Petersburg
According to labor force statistics for Petersburg, 75.6% of individuals (13,061) out of the total population between 25 and 64 years of age (17,276) are in the labor force, with 9.4% or 1,228 of them being unemployed. The group with the highest labor force participation rate are those with the educational attainment of bachelor's degree or higher, with 85.3% or 3,196 individuals in the labor force. Within the labor force, individuals with less than high school education have the highest percentage of unemployment, with 24.7% or 240 of them being unemployed.
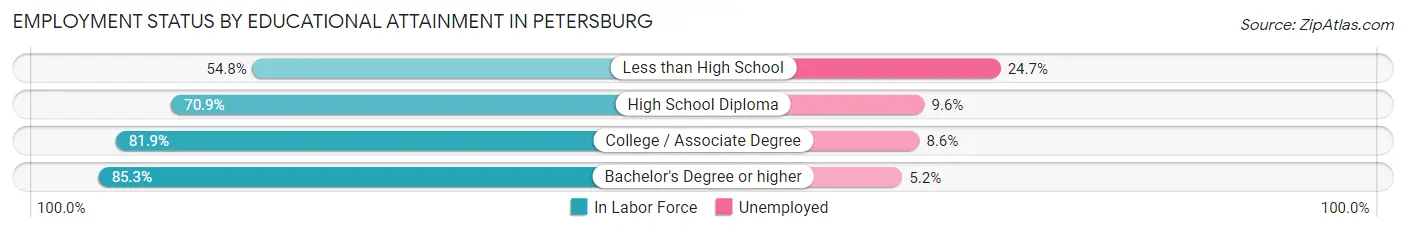
| Educational Attainment | In Labor Force | Unemployed |
| Less than High School | 973 (54.8%) | 438 (24.7%) |
| High School Diploma | 4,740 (70.9%) | 642 (9.6%) |
| College / Associate Degree | 4,151 (81.9%) | 436 (8.6%) |
| Bachelor's Degree or higher | 3,196 (85.3%) | 195 (5.2%) |
| Total | 13,061 (75.6%) | 1,624 (9.4%) |
Employment Occupations by Sex in Petersburg
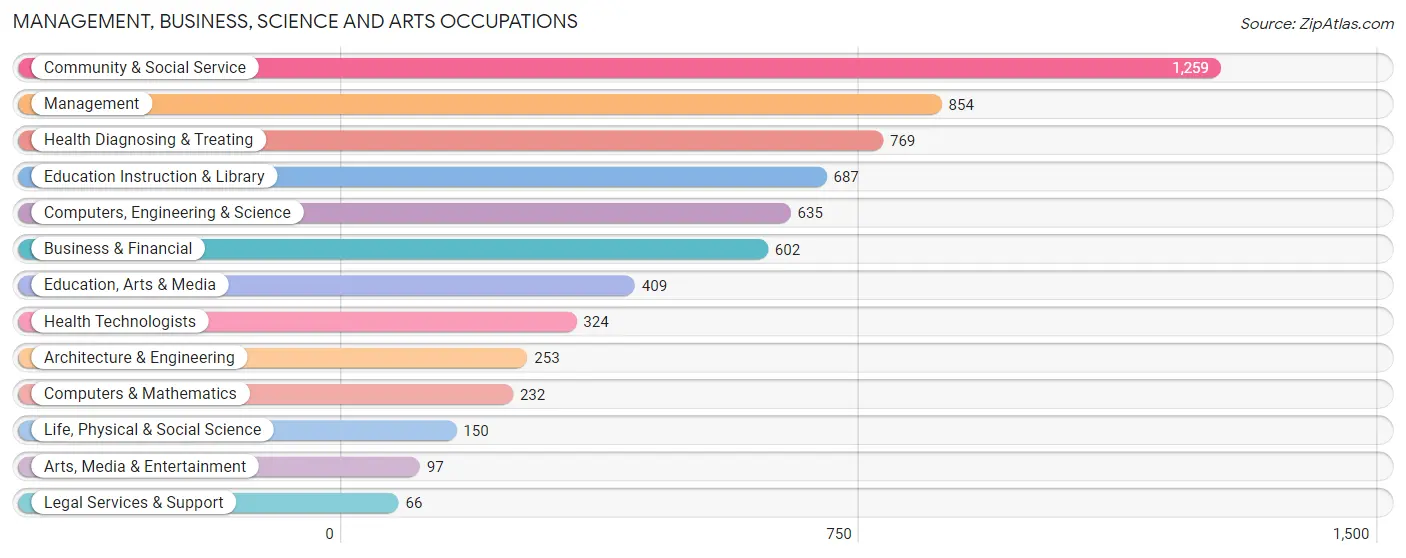
Management, Business, Science and Arts Occupations
The most common Management, Business, Science and Arts occupations in Petersburg are Community & Social Service (1,259 | 8.8%), Management (854 | 5.9%), Health Diagnosing & Treating (769 | 5.3%), Education Instruction & Library (687 | 4.8%), and Computers, Engineering & Science (635 | 4.4%).
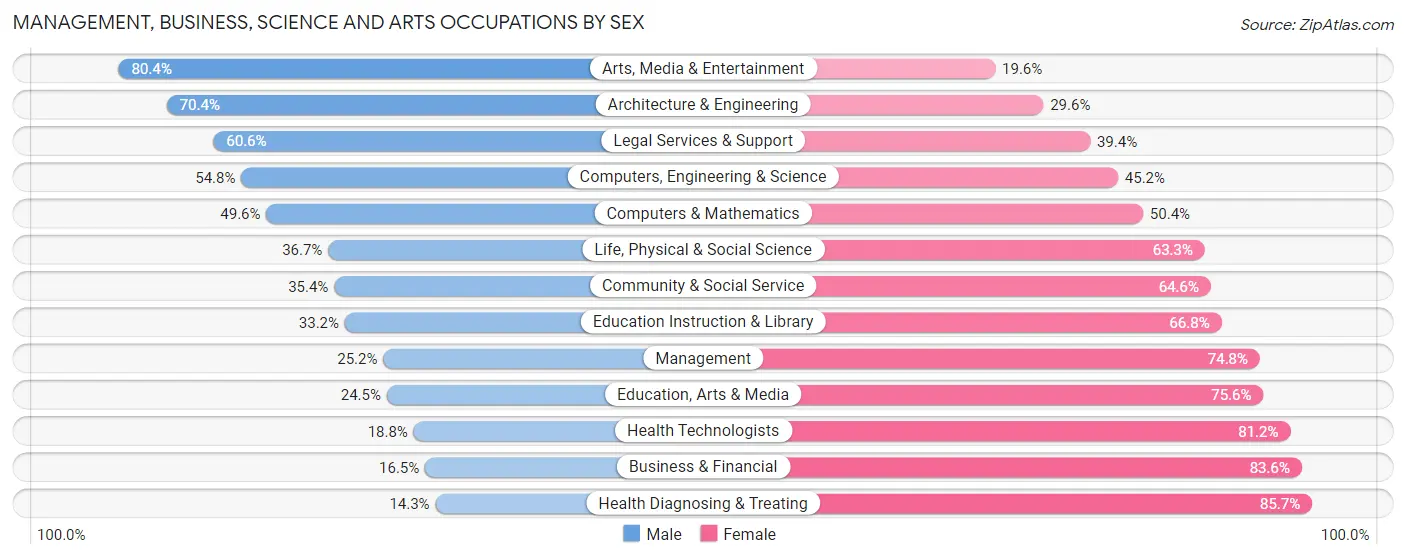
Management, Business, Science and Arts Occupations by Sex
Within the Management, Business, Science and Arts occupations in Petersburg, the most male-oriented occupations are Arts, Media & Entertainment (80.4%), Architecture & Engineering (70.4%), and Legal Services & Support (60.6%), while the most female-oriented occupations are Health Diagnosing & Treating (85.7%), Business & Financial (83.6%), and Health Technologists (81.2%).
| Occupation | Male | Female |
| Management | 215 (25.2%) | 639 (74.8%) |
| Business & Financial | 99 (16.5%) | 503 (83.6%) |
| Computers, Engineering & Science | 348 (54.8%) | 287 (45.2%) |
| Computers & Mathematics | 115 (49.6%) | 117 (50.4%) |
| Architecture & Engineering | 178 (70.4%) | 75 (29.6%) |
| Life, Physical & Social Science | 55 (36.7%) | 95 (63.3%) |
| Community & Social Service | 446 (35.4%) | 813 (64.6%) |
| Education, Arts & Media | 100 (24.4%) | 309 (75.5%) |
| Legal Services & Support | 40 (60.6%) | 26 (39.4%) |
| Education Instruction & Library | 228 (33.2%) | 459 (66.8%) |
| Arts, Media & Entertainment | 78 (80.4%) | 19 (19.6%) |
| Health Diagnosing & Treating | 110 (14.3%) | 659 (85.7%) |
| Health Technologists | 61 (18.8%) | 263 (81.2%) |
| Total (Category) | 1,218 (29.6%) | 2,901 (70.4%) |
| Total (Overall) | 6,092 (42.4%) | 8,275 (57.6%) |
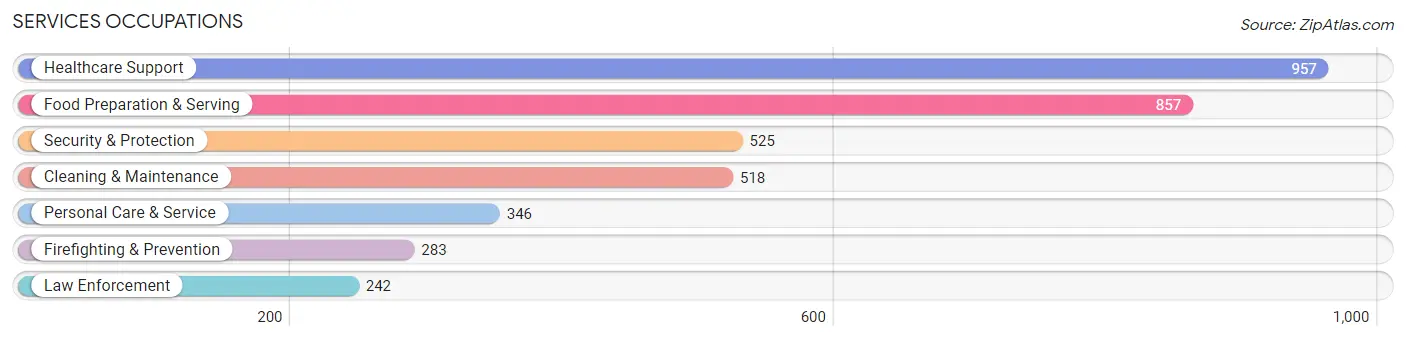
Services Occupations
The most common Services occupations in Petersburg are Healthcare Support (957 | 6.7%), Food Preparation & Serving (857 | 6.0%), Security & Protection (525 | 3.6%), Cleaning & Maintenance (518 | 3.6%), and Personal Care & Service (346 | 2.4%).
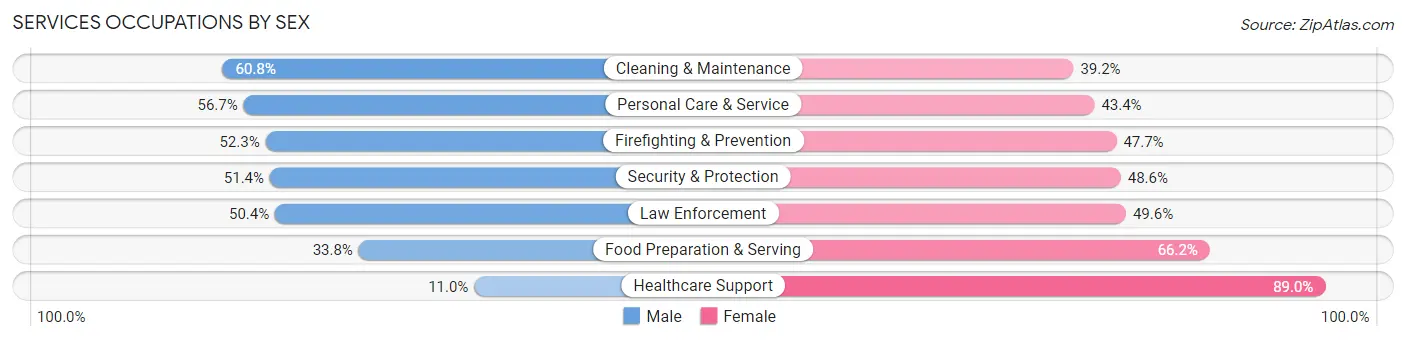
Services Occupations by Sex
Within the Services occupations in Petersburg, the most male-oriented occupations are Cleaning & Maintenance (60.8%), Personal Care & Service (56.7%), and Firefighting & Prevention (52.3%), while the most female-oriented occupations are Healthcare Support (89.0%), Food Preparation & Serving (66.2%), and Law Enforcement (49.6%).
| Occupation | Male | Female |
| Healthcare Support | 105 (11.0%) | 852 (89.0%) |
| Security & Protection | 270 (51.4%) | 255 (48.6%) |
| Firefighting & Prevention | 148 (52.3%) | 135 (47.7%) |
| Law Enforcement | 122 (50.4%) | 120 (49.6%) |
| Food Preparation & Serving | 290 (33.8%) | 567 (66.2%) |
| Cleaning & Maintenance | 315 (60.8%) | 203 (39.2%) |
| Personal Care & Service | 196 (56.7%) | 150 (43.3%) |
| Total (Category) | 1,176 (36.7%) | 2,027 (63.3%) |
| Total (Overall) | 6,092 (42.4%) | 8,275 (57.6%) |
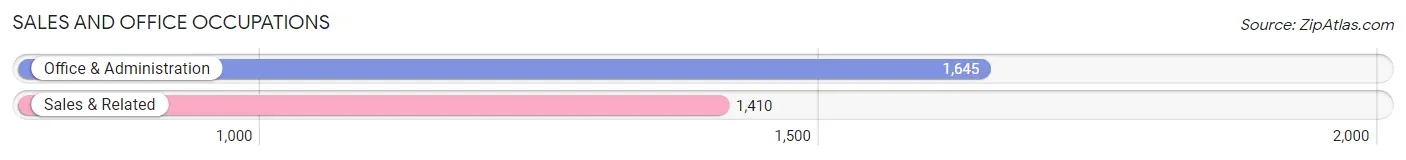
Sales and Office Occupations
The most common Sales and Office occupations in Petersburg are Office & Administration (1,645 | 11.5%), and Sales & Related (1,410 | 9.8%).
Sales and Office Occupations by Sex

| Occupation | Male | Female |
| Sales & Related | 252 (17.9%) | 1,158 (82.1%) |
| Office & Administration | 418 (25.4%) | 1,227 (74.6%) |
| Total (Category) | 670 (21.9%) | 2,385 (78.1%) |
| Total (Overall) | 6,092 (42.4%) | 8,275 (57.6%) |
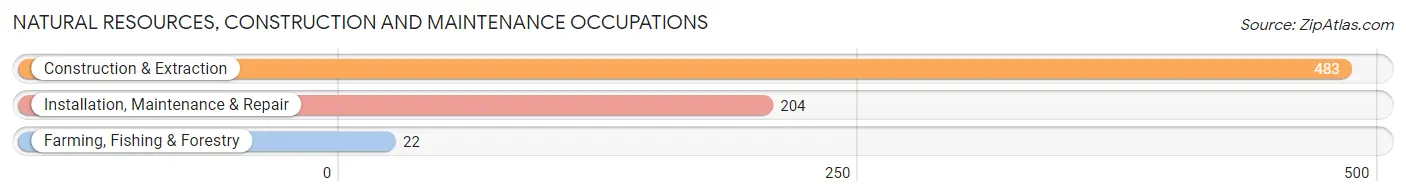
Natural Resources, Construction and Maintenance Occupations
The most common Natural Resources, Construction and Maintenance occupations in Petersburg are Construction & Extraction (483 | 3.4%), Installation, Maintenance & Repair (204 | 1.4%), and Farming, Fishing & Forestry (22 | 0.2%).
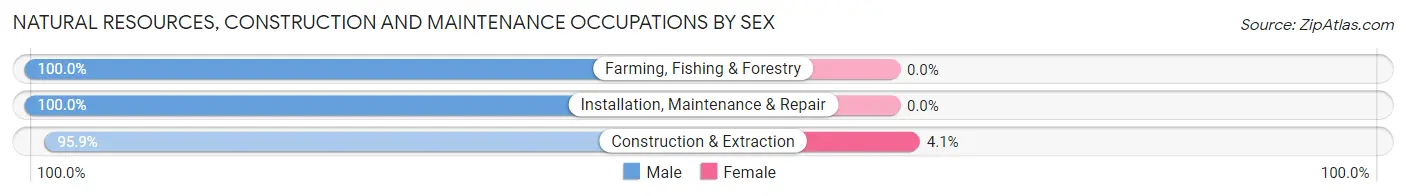
Natural Resources, Construction and Maintenance Occupations by Sex
| Occupation | Male | Female |
| Farming, Fishing & Forestry | 22 (100.0%) | 0 (0.0%) |
| Construction & Extraction | 463 (95.9%) | 20 (4.1%) |
| Installation, Maintenance & Repair | 204 (100.0%) | 0 (0.0%) |
| Total (Category) | 689 (97.2%) | 20 (2.8%) |
| Total (Overall) | 6,092 (42.4%) | 8,275 (57.6%) |
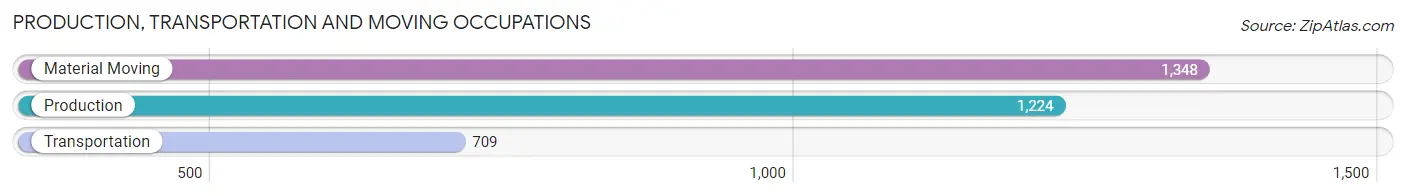
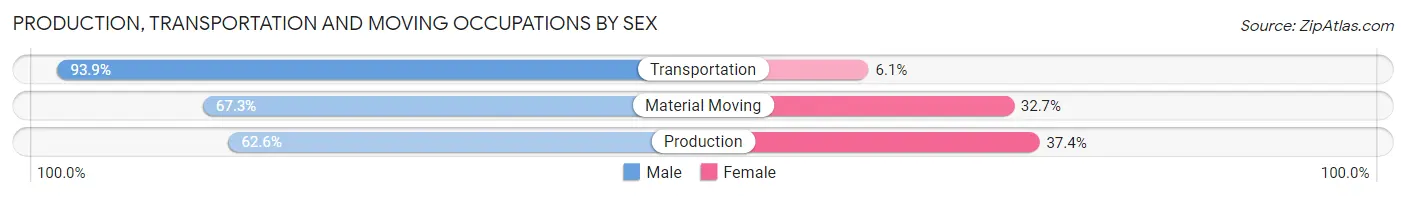
Production, Transportation and Moving Occupations
The most common Production, Transportation and Moving occupations in Petersburg are Material Moving (1,348 | 9.4%), Production (1,224 | 8.5%), and Transportation (709 | 4.9%).
Production, Transportation and Moving Occupations by Sex
| Occupation | Male | Female |
| Production | 766 (62.6%) | 458 (37.4%) |
| Transportation | 666 (93.9%) | 43 (6.1%) |
| Material Moving | 907 (67.3%) | 441 (32.7%) |
| Total (Category) | 2,339 (71.3%) | 942 (28.7%) |
| Total (Overall) | 6,092 (42.4%) | 8,275 (57.6%) |
Employment Industries by Sex in Petersburg
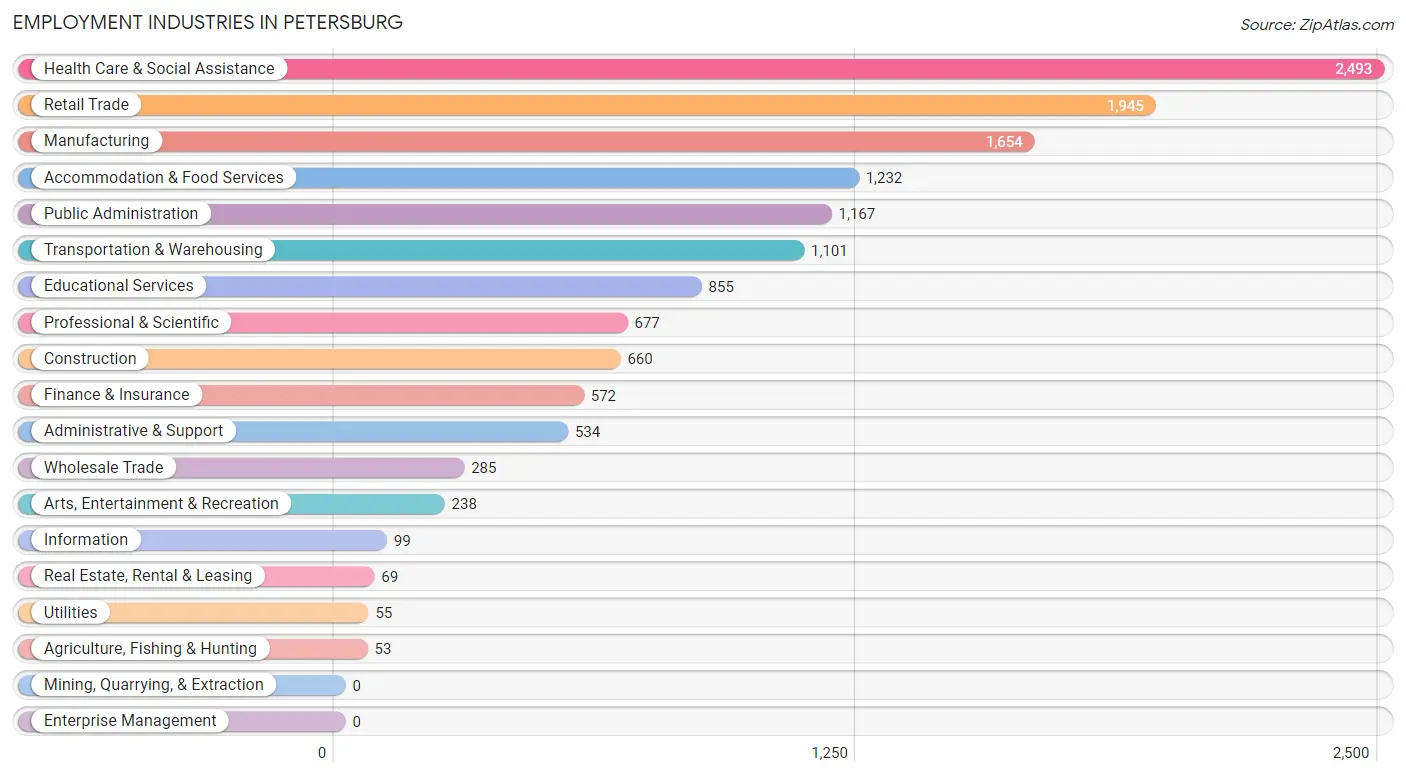
Employment Industries in Petersburg
The major employment industries in Petersburg include Health Care & Social Assistance (2,493 | 17.3%), Retail Trade (1,945 | 13.5%), Manufacturing (1,654 | 11.5%), Accommodation & Food Services (1,232 | 8.6%), and Public Administration (1,167 | 8.1%).
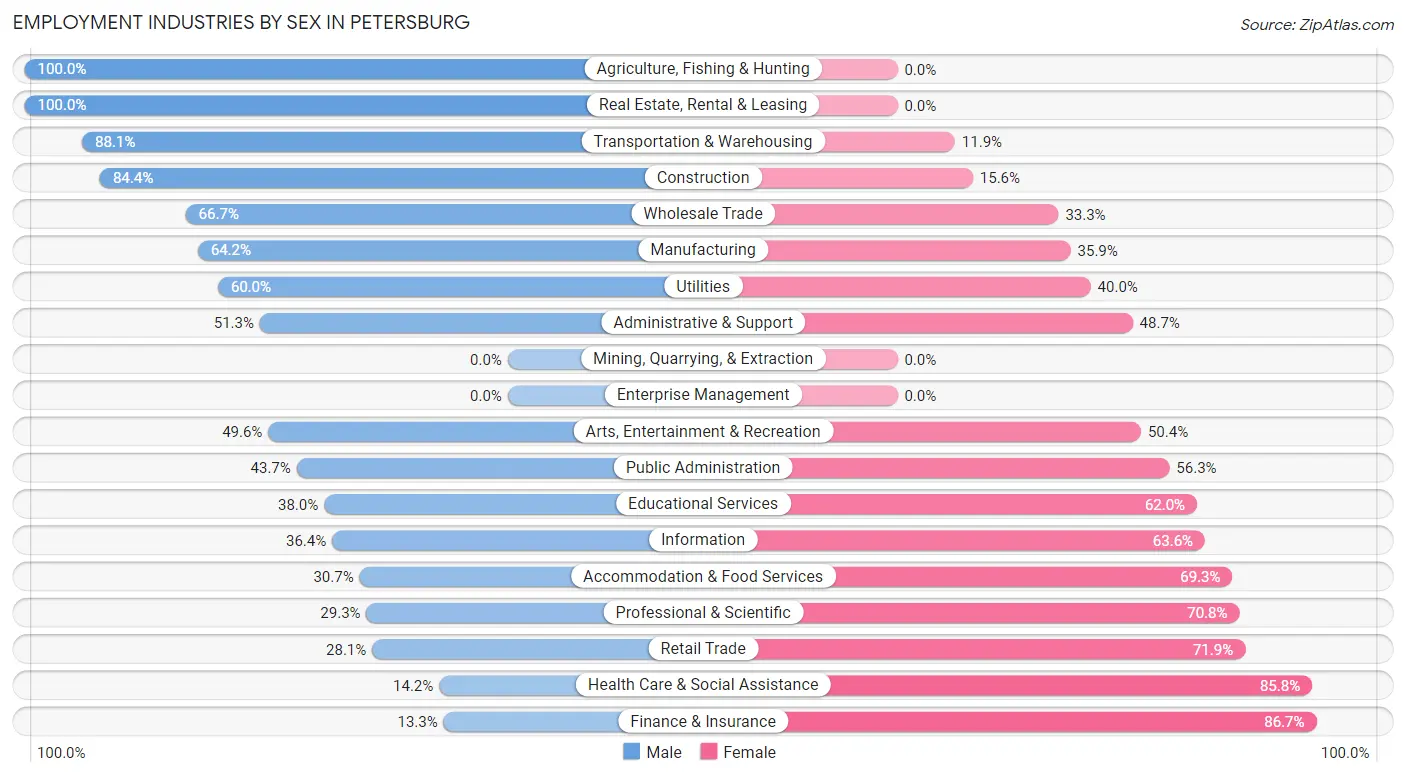
Employment Industries by Sex in Petersburg
The Petersburg industries that see more men than women are Agriculture, Fishing & Hunting (100.0%), Real Estate, Rental & Leasing (100.0%), and Transportation & Warehousing (88.1%), whereas the industries that tend to have a higher number of women are Finance & Insurance (86.7%), Health Care & Social Assistance (85.8%), and Retail Trade (71.9%).
| Industry | Male | Female |
| Agriculture, Fishing & Hunting | 53 (100.0%) | 0 (0.0%) |
| Mining, Quarrying, & Extraction | 0 (0.0%) | 0 (0.0%) |
| Construction | 557 (84.4%) | 103 (15.6%) |
| Manufacturing | 1,061 (64.1%) | 593 (35.8%) |
| Wholesale Trade | 190 (66.7%) | 95 (33.3%) |
| Retail Trade | 546 (28.1%) | 1,399 (71.9%) |
| Transportation & Warehousing | 970 (88.1%) | 131 (11.9%) |
| Utilities | 33 (60.0%) | 22 (40.0%) |
| Information | 36 (36.4%) | 63 (63.6%) |
| Finance & Insurance | 76 (13.3%) | 496 (86.7%) |
| Real Estate, Rental & Leasing | 69 (100.0%) | 0 (0.0%) |
| Professional & Scientific | 198 (29.2%) | 479 (70.8%) |
| Enterprise Management | 0 (0.0%) | 0 (0.0%) |
| Administrative & Support | 274 (51.3%) | 260 (48.7%) |
| Educational Services | 325 (38.0%) | 530 (62.0%) |
| Health Care & Social Assistance | 354 (14.2%) | 2,139 (85.8%) |
| Arts, Entertainment & Recreation | 118 (49.6%) | 120 (50.4%) |
| Accommodation & Food Services | 378 (30.7%) | 854 (69.3%) |
| Public Administration | 510 (43.7%) | 657 (56.3%) |
| Total | 6,092 (42.4%) | 8,275 (57.6%) |
Education in Petersburg
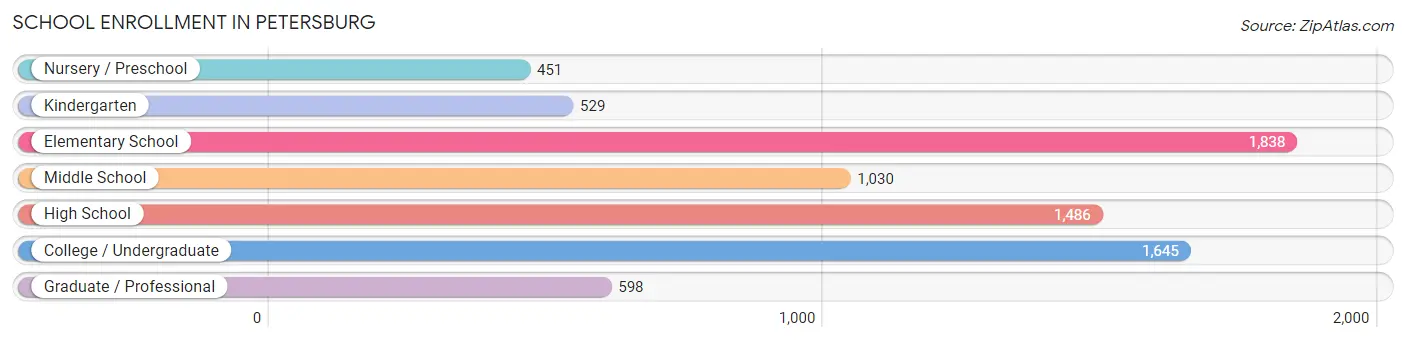
School Enrollment in Petersburg
The most common levels of schooling among the 7,577 students in Petersburg are elementary school (1,838 | 24.3%), college / undergraduate (1,645 | 21.7%), and high school (1,486 | 19.6%).
| School Level | # Students | % Students |
| Nursery / Preschool | 451 | 5.9% |
| Kindergarten | 529 | 7.0% |
| Elementary School | 1,838 | 24.3% |
| Middle School | 1,030 | 13.6% |
| High School | 1,486 | 19.6% |
| College / Undergraduate | 1,645 | 21.7% |
| Graduate / Professional | 598 | 7.9% |
| Total | 7,577 | 100.0% |
School Enrollment by Age by Funding Source in Petersburg
Out of a total of 7,577 students who are enrolled in schools in Petersburg, 879 (11.6%) attend a private institution, while the remaining 6,698 (88.4%) are enrolled in public schools. The age group of 18 to 19 year olds has the highest likelihood of being enrolled in private schools, with 114 (33.0% in the age bracket) enrolled. Conversely, the age group of 25 to 34 year olds has the lowest likelihood of being enrolled in a private school, with 921 (96.1% in the age bracket) attending a public institution.
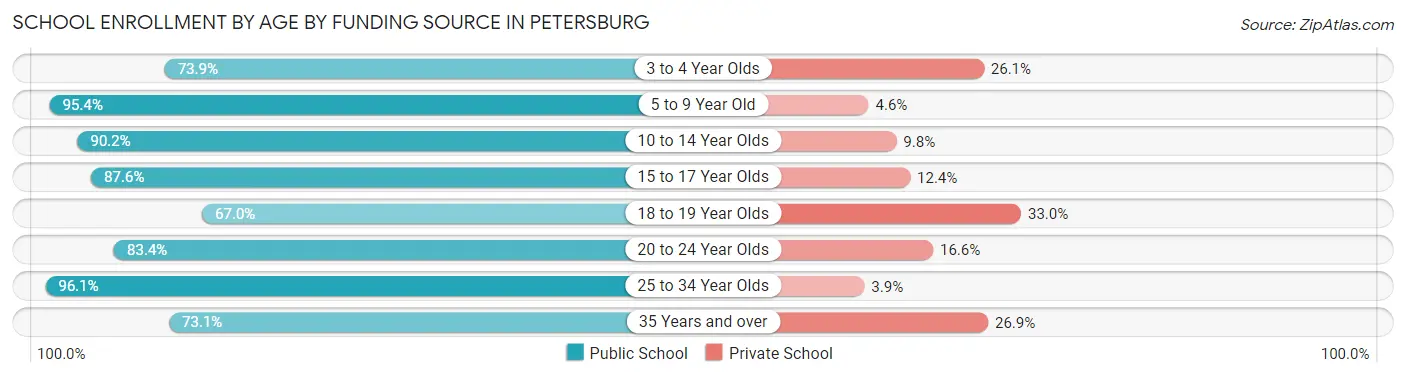
| Age Bracket | Public School | Private School |
| 3 to 4 Year Olds | 283 (73.9%) | 100 (26.1%) |
| 5 to 9 Year Old | 2,197 (95.4%) | 107 (4.6%) |
| 10 to 14 Year Olds | 1,230 (90.2%) | 134 (9.8%) |
| 15 to 17 Year Olds | 900 (87.6%) | 127 (12.4%) |
| 18 to 19 Year Olds | 231 (67.0%) | 114 (33.0%) |
| 20 to 24 Year Olds | 501 (83.4%) | 100 (16.6%) |
| 25 to 34 Year Olds | 921 (96.1%) | 37 (3.9%) |
| 35 Years and over | 435 (73.1%) | 160 (26.9%) |
| Total | 6,698 (88.4%) | 879 (11.6%) |
Educational Attainment by Field of Study in Petersburg
Business (837 | 15.1%), social sciences (678 | 12.3%), education (645 | 11.7%), liberal arts & history (642 | 11.6%), and arts & humanities (522 | 9.5%) are the most common fields of study among 5,525 individuals in Petersburg who have obtained a bachelor's degree or higher.
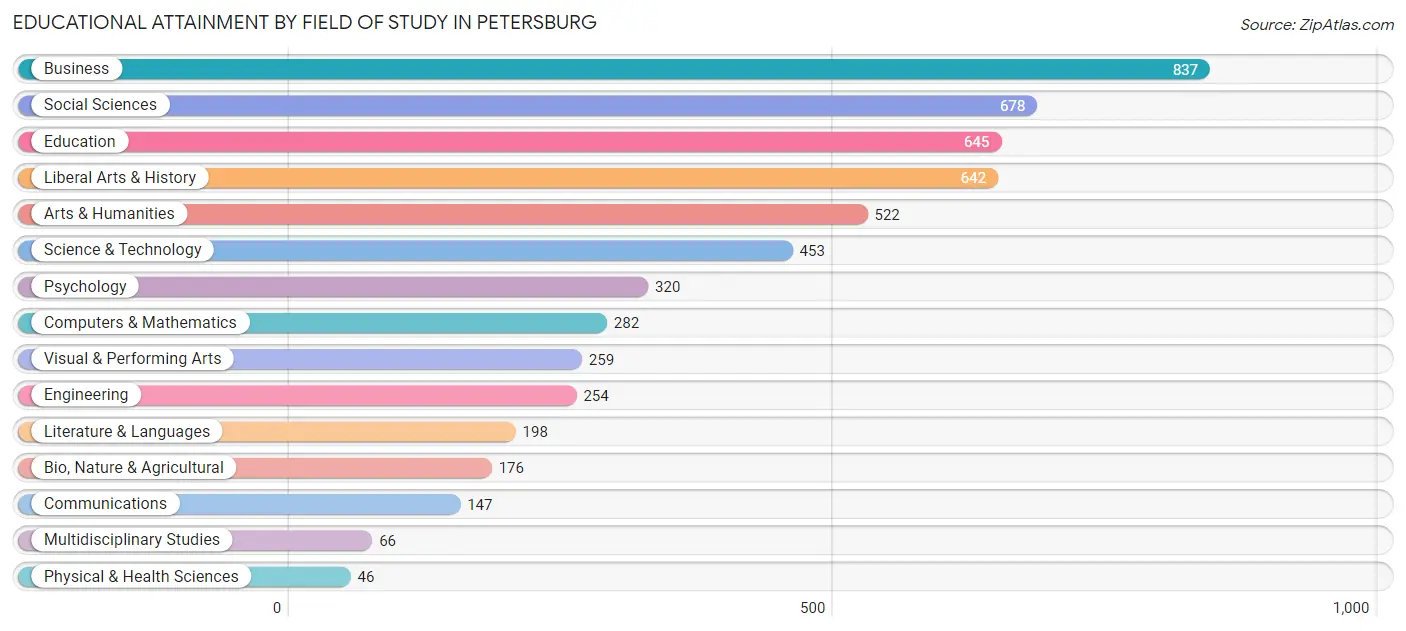
| Field of Study | # Graduates | % Graduates |
| Computers & Mathematics | 282 | 5.1% |
| Bio, Nature & Agricultural | 176 | 3.2% |
| Physical & Health Sciences | 46 | 0.8% |
| Psychology | 320 | 5.8% |
| Social Sciences | 678 | 12.3% |
| Engineering | 254 | 4.6% |
| Multidisciplinary Studies | 66 | 1.2% |
| Science & Technology | 453 | 8.2% |
| Business | 837 | 15.1% |
| Education | 645 | 11.7% |
| Literature & Languages | 198 | 3.6% |
| Liberal Arts & History | 642 | 11.6% |
| Visual & Performing Arts | 259 | 4.7% |
| Communications | 147 | 2.7% |
| Arts & Humanities | 522 | 9.5% |
| Total | 5,525 | 100.0% |
Transportation & Commute in Petersburg
Vehicle Availability by Sex in Petersburg
The most prevalent vehicle ownership categories in Petersburg are males with 2 vehicles (2,319, accounting for 37.0%) and females with 2 vehicles (2,345, making up 28.9%).
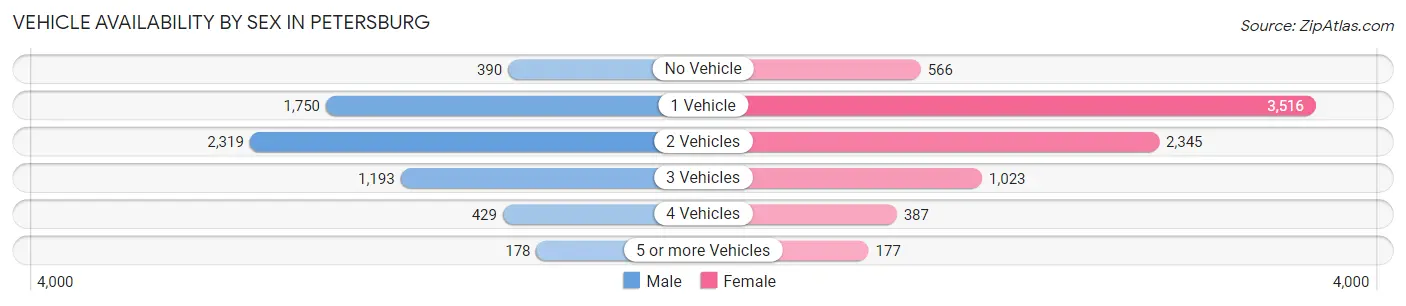
| Vehicles Available | Male | Female |
| No Vehicle | 390 (6.2%) | 566 (7.1%) |
| 1 Vehicle | 1,750 (28.0%) | 3,516 (43.9%) |
| 2 Vehicles | 2,319 (37.0%) | 2,345 (29.3%) |
| 3 Vehicles | 1,193 (19.1%) | 1,023 (12.8%) |
| 4 Vehicles | 429 (6.9%) | 387 (4.8%) |
| 5 or more Vehicles | 178 (2.8%) | 177 (2.2%) |
| Total | 6,259 (100.0%) | 8,014 (100.0%) |
Commute Time in Petersburg
The most frequently occuring commute durations in Petersburg are 10 to 14 minutes (2,535 commuters, 19.1%), 15 to 19 minutes (2,498 commuters, 18.8%), and 30 to 34 minutes (1,736 commuters, 13.1%).
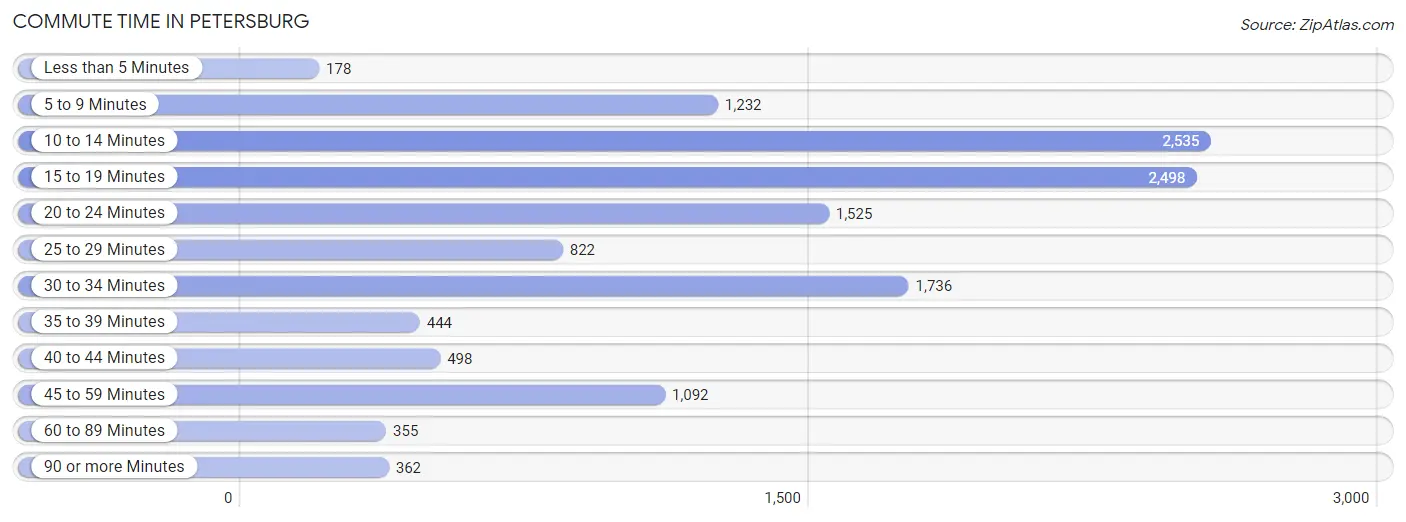
| Commute Time | # Commuters | % Commuters |
| Less than 5 Minutes | 178 | 1.3% |
| 5 to 9 Minutes | 1,232 | 9.3% |
| 10 to 14 Minutes | 2,535 | 19.1% |
| 15 to 19 Minutes | 2,498 | 18.8% |
| 20 to 24 Minutes | 1,525 | 11.5% |
| 25 to 29 Minutes | 822 | 6.2% |
| 30 to 34 Minutes | 1,736 | 13.1% |
| 35 to 39 Minutes | 444 | 3.3% |
| 40 to 44 Minutes | 498 | 3.7% |
| 45 to 59 Minutes | 1,092 | 8.2% |
| 60 to 89 Minutes | 355 | 2.7% |
| 90 or more Minutes | 362 | 2.7% |
Commute Time by Sex in Petersburg
The most common commute times in Petersburg are 15 to 19 minutes (1,269 commuters, 21.0%) for males and 10 to 14 minutes (1,351 commuters, 18.7%) for females.
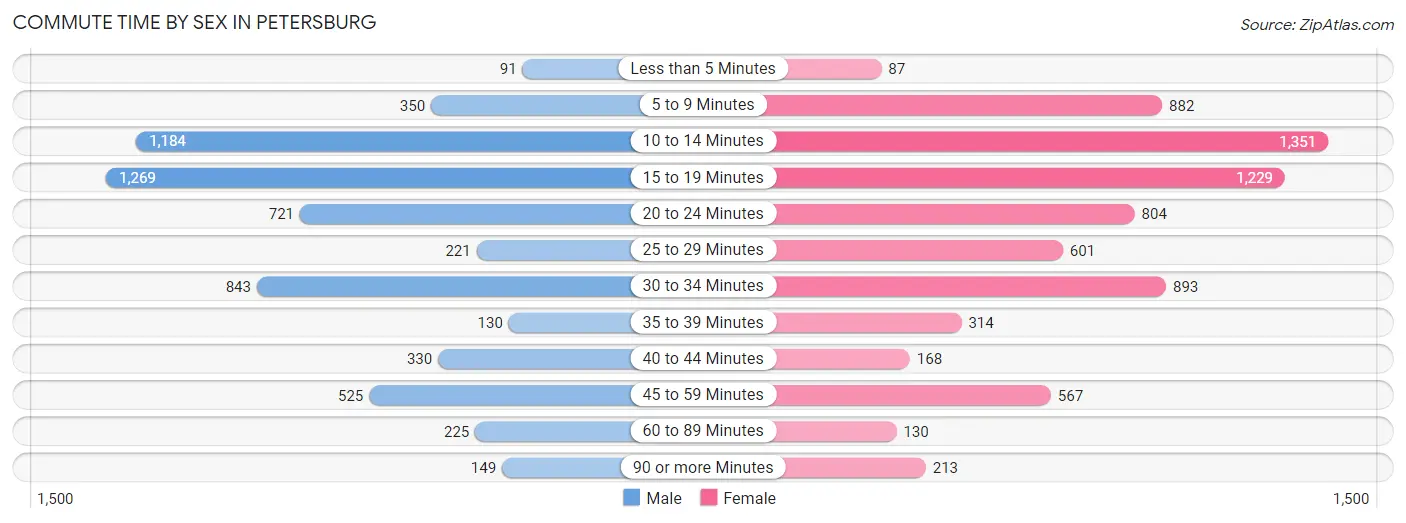
| Commute Time | Male | Female |
| Less than 5 Minutes | 91 (1.5%) | 87 (1.2%) |
| 5 to 9 Minutes | 350 (5.8%) | 882 (12.2%) |
| 10 to 14 Minutes | 1,184 (19.6%) | 1,351 (18.7%) |
| 15 to 19 Minutes | 1,269 (21.0%) | 1,229 (17.0%) |
| 20 to 24 Minutes | 721 (11.9%) | 804 (11.1%) |
| 25 to 29 Minutes | 221 (3.7%) | 601 (8.3%) |
| 30 to 34 Minutes | 843 (14.0%) | 893 (12.3%) |
| 35 to 39 Minutes | 130 (2.1%) | 314 (4.3%) |
| 40 to 44 Minutes | 330 (5.5%) | 168 (2.3%) |
| 45 to 59 Minutes | 525 (8.7%) | 567 (7.8%) |
| 60 to 89 Minutes | 225 (3.7%) | 130 (1.8%) |
| 90 or more Minutes | 149 (2.5%) | 213 (2.9%) |
Time of Departure to Work by Sex in Petersburg
The most frequent times of departure to work in Petersburg are 6:30 AM to 6:59 AM (735, 12.2%) for males and 4:00 PM to 11:59 PM (943, 13.0%) for females.
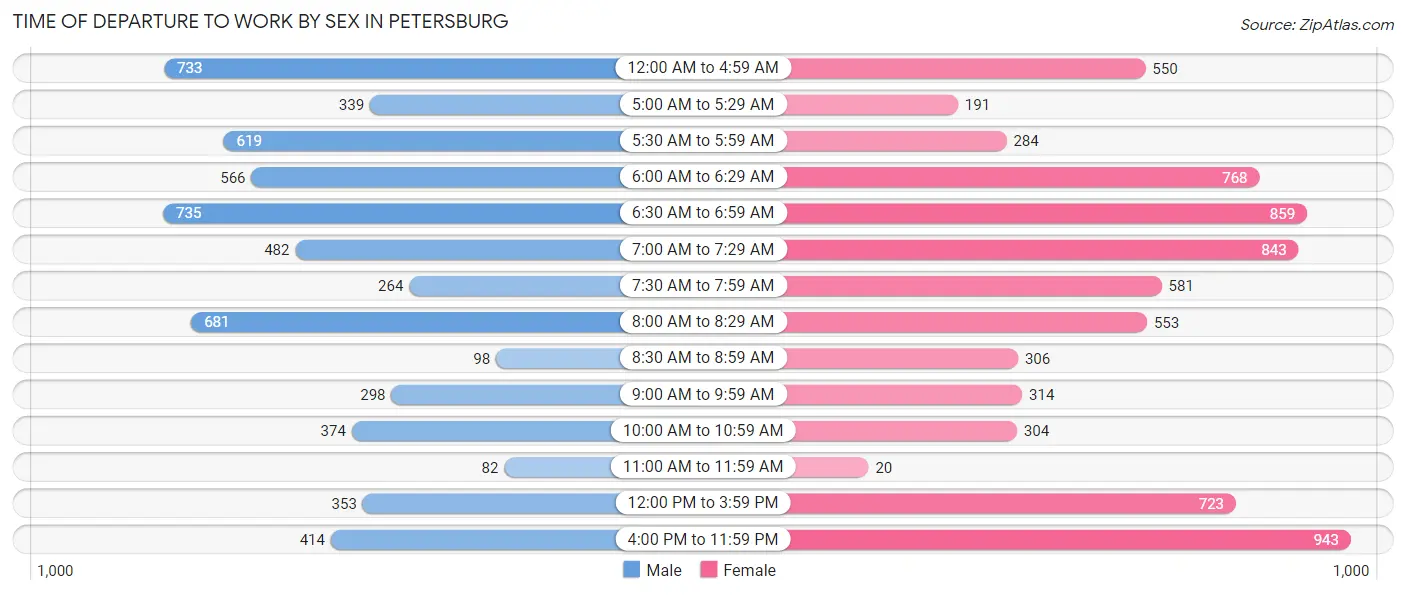
| Time of Departure | Male | Female |
| 12:00 AM to 4:59 AM | 733 (12.1%) | 550 (7.6%) |
| 5:00 AM to 5:29 AM | 339 (5.6%) | 191 (2.6%) |
| 5:30 AM to 5:59 AM | 619 (10.2%) | 284 (3.9%) |
| 6:00 AM to 6:29 AM | 566 (9.4%) | 768 (10.6%) |
| 6:30 AM to 6:59 AM | 735 (12.2%) | 859 (11.9%) |
| 7:00 AM to 7:29 AM | 482 (8.0%) | 843 (11.7%) |
| 7:30 AM to 7:59 AM | 264 (4.4%) | 581 (8.0%) |
| 8:00 AM to 8:29 AM | 681 (11.3%) | 553 (7.6%) |
| 8:30 AM to 8:59 AM | 98 (1.6%) | 306 (4.2%) |
| 9:00 AM to 9:59 AM | 298 (4.9%) | 314 (4.3%) |
| 10:00 AM to 10:59 AM | 374 (6.2%) | 304 (4.2%) |
| 11:00 AM to 11:59 AM | 82 (1.4%) | 20 (0.3%) |
| 12:00 PM to 3:59 PM | 353 (5.9%) | 723 (10.0%) |
| 4:00 PM to 11:59 PM | 414 (6.9%) | 943 (13.0%) |
| Total | 6,038 (100.0%) | 7,239 (100.0%) |
Housing Occupancy in Petersburg
Occupancy by Ownership in Petersburg
Of the total 14,703 dwellings in Petersburg, owner-occupied units account for 5,503 (37.4%), while renter-occupied units make up 9,200 (62.6%).
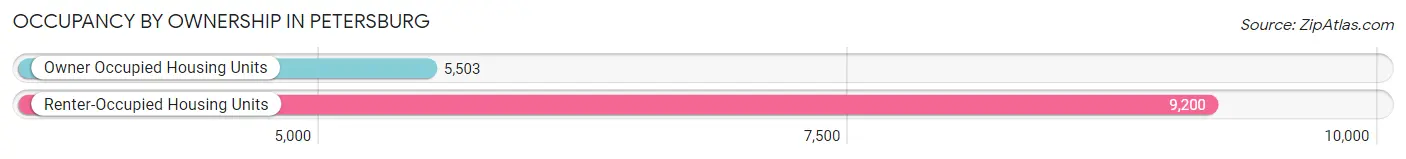
| Occupancy | # Housing Units | % Housing Units |
| Owner Occupied Housing Units | 5,503 | 37.4% |
| Renter-Occupied Housing Units | 9,200 | 62.6% |
| Total Occupied Housing Units | 14,703 | 100.0% |
Occupancy by Household Size in Petersburg
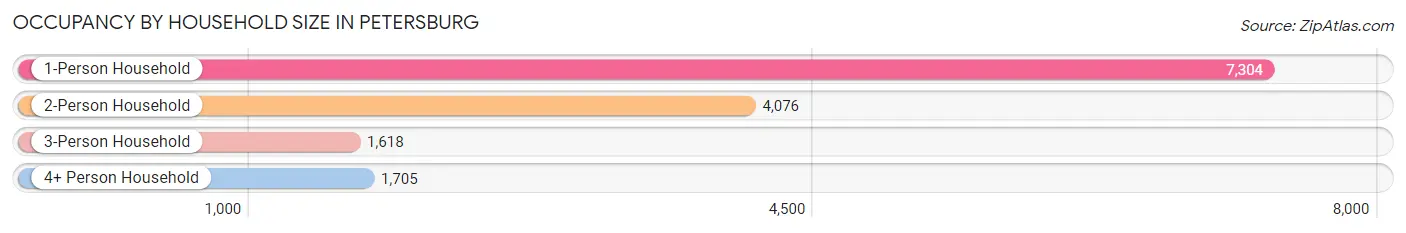
| Household Size | # Housing Units | % Housing Units |
| 1-Person Household | 7,304 | 49.7% |
| 2-Person Household | 4,076 | 27.7% |
| 3-Person Household | 1,618 | 11.0% |
| 4+ Person Household | 1,705 | 11.6% |
| Total Housing Units | 14,703 | 100.0% |
Occupancy by Ownership by Household Size in Petersburg
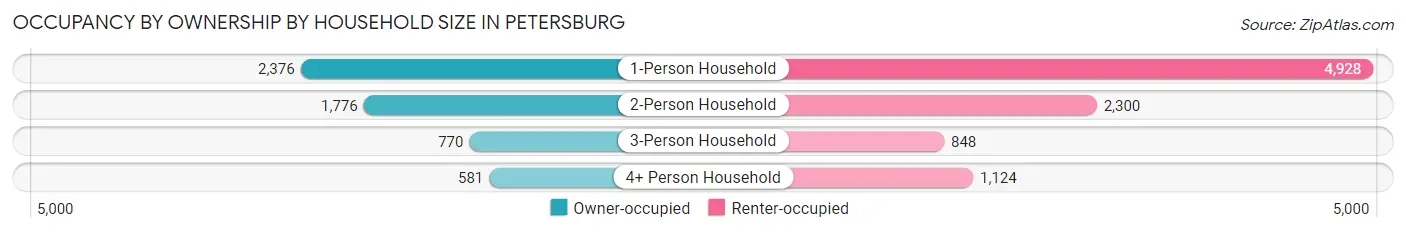
| Household Size | Owner-occupied | Renter-occupied |
| 1-Person Household | 2,376 (32.5%) | 4,928 (67.5%) |
| 2-Person Household | 1,776 (43.6%) | 2,300 (56.4%) |
| 3-Person Household | 770 (47.6%) | 848 (52.4%) |
| 4+ Person Household | 581 (34.1%) | 1,124 (65.9%) |
| Total Housing Units | 5,503 (37.4%) | 9,200 (62.6%) |
Occupancy by Educational Attainment in Petersburg
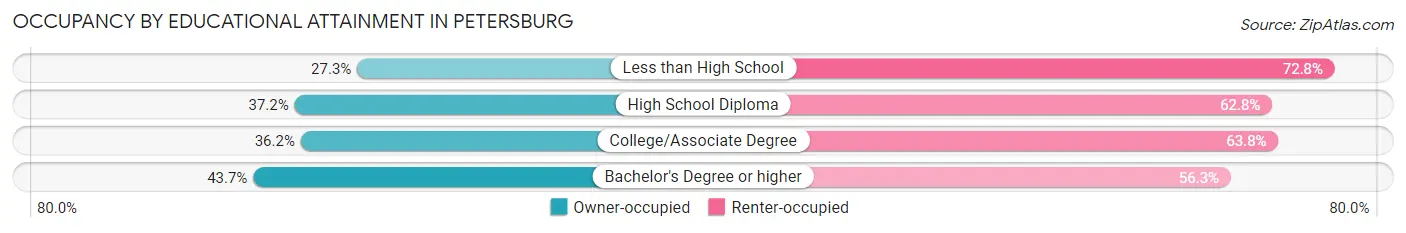
| Household Size | Owner-occupied | Renter-occupied |
| Less than High School | 451 (27.3%) | 1,204 (72.8%) |
| High School Diploma | 1,568 (37.2%) | 2,648 (62.8%) |
| College/Associate Degree | 1,820 (36.2%) | 3,208 (63.8%) |
| Bachelor's Degree or higher | 1,664 (43.7%) | 2,140 (56.3%) |
Occupancy by Age of Householder in Petersburg
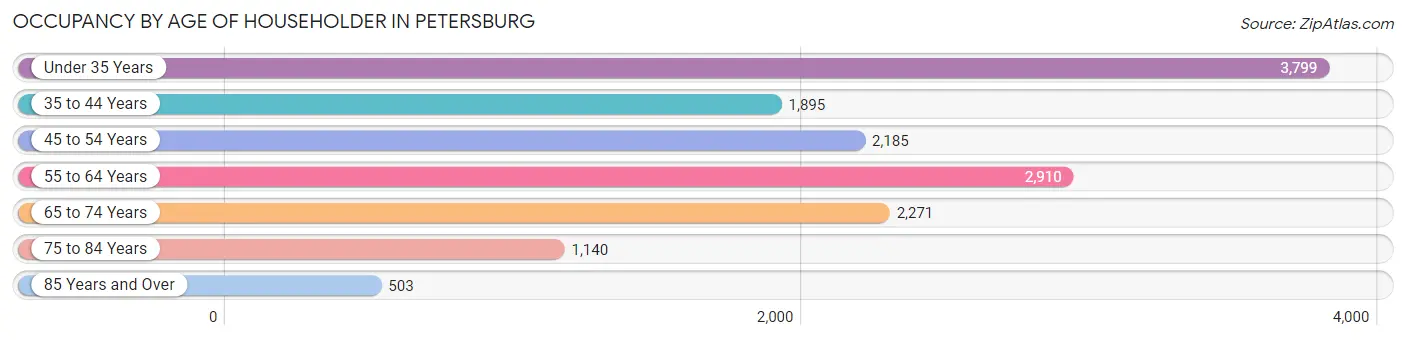
| Age Bracket | # Households | % Households |
| Under 35 Years | 3,799 | 25.8% |
| 35 to 44 Years | 1,895 | 12.9% |
| 45 to 54 Years | 2,185 | 14.9% |
| 55 to 64 Years | 2,910 | 19.8% |
| 65 to 74 Years | 2,271 | 15.4% |
| 75 to 84 Years | 1,140 | 7.7% |
| 85 Years and Over | 503 | 3.4% |
| Total | 14,703 | 100.0% |
Housing Finances in Petersburg
Median Income by Occupancy in Petersburg
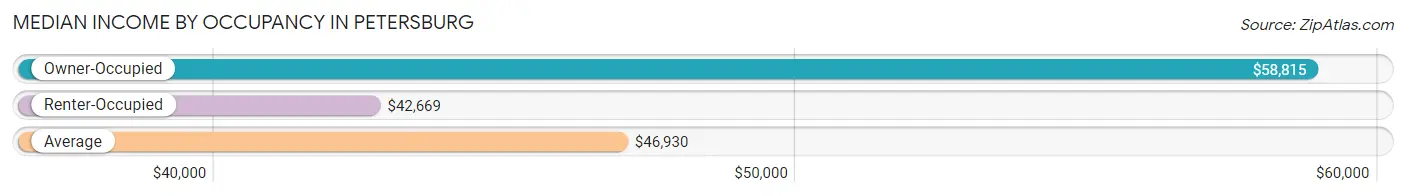
| Occupancy Type | # Households | Median Income |
| Owner-Occupied | 5,503 (37.4%) | $58,815 |
| Renter-Occupied | 9,200 (62.6%) | $42,669 |
| Average | 14,703 (100.0%) | $46,930 |
Occupancy by Householder Income Bracket in Petersburg
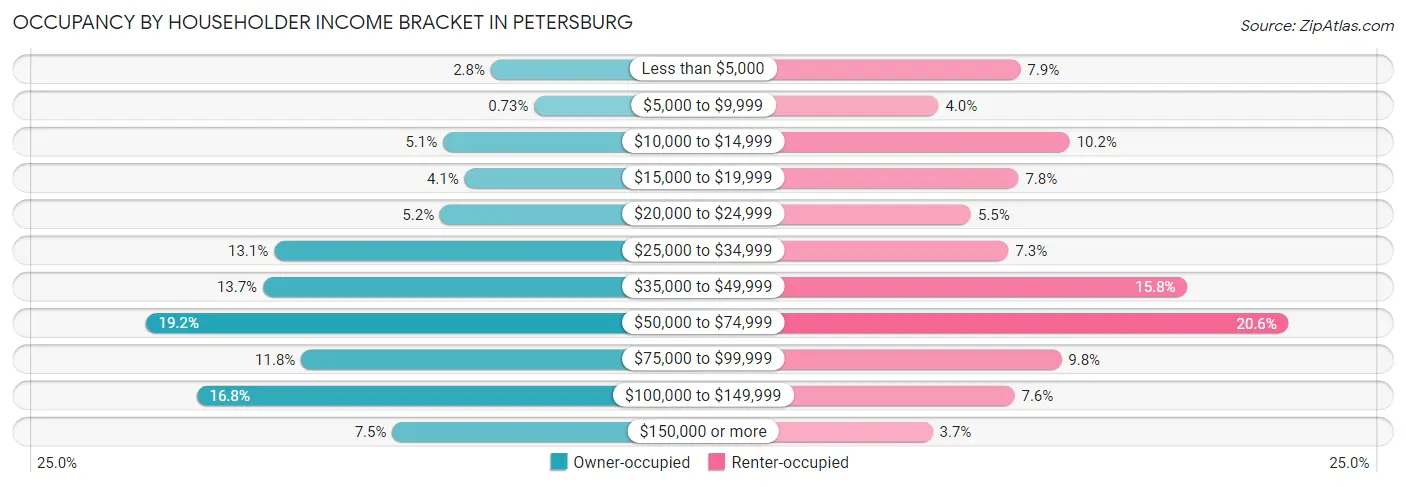
| Income Bracket | Owner-occupied | Renter-occupied |
| Less than $5,000 | 154 (2.8%) | 722 (7.9%) |
| $5,000 to $9,999 | 40 (0.7%) | 363 (4.0%) |
| $10,000 to $14,999 | 279 (5.1%) | 938 (10.2%) |
| $15,000 to $19,999 | 223 (4.1%) | 714 (7.8%) |
| $20,000 to $24,999 | 287 (5.2%) | 506 (5.5%) |
| $25,000 to $34,999 | 722 (13.1%) | 670 (7.3%) |
| $35,000 to $49,999 | 751 (13.7%) | 1,454 (15.8%) |
| $50,000 to $74,999 | 1,059 (19.2%) | 1,897 (20.6%) |
| $75,000 to $99,999 | 651 (11.8%) | 902 (9.8%) |
| $100,000 to $149,999 | 925 (16.8%) | 696 (7.6%) |
| $150,000 or more | 412 (7.5%) | 338 (3.7%) |
| Total | 5,503 (100.0%) | 9,200 (100.0%) |
Monthly Housing Cost Tiers in Petersburg
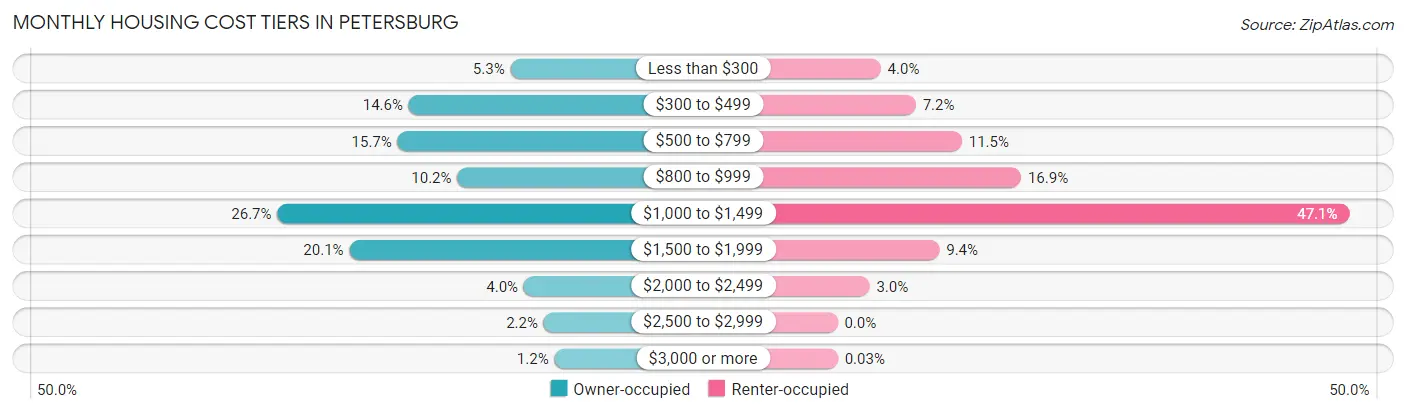
| Monthly Cost | Owner-occupied | Renter-occupied |
| Less than $300 | 290 (5.3%) | 366 (4.0%) |
| $300 to $499 | 805 (14.6%) | 663 (7.2%) |
| $500 to $799 | 862 (15.7%) | 1,053 (11.5%) |
| $800 to $999 | 559 (10.2%) | 1,555 (16.9%) |
| $1,000 to $1,499 | 1,471 (26.7%) | 4,335 (47.1%) |
| $1,500 to $1,999 | 1,106 (20.1%) | 863 (9.4%) |
| $2,000 to $2,499 | 222 (4.0%) | 271 (2.9%) |
| $2,500 to $2,999 | 121 (2.2%) | 0 (0.0%) |
| $3,000 or more | 67 (1.2%) | 3 (0.0%) |
| Total | 5,503 (100.0%) | 9,200 (100.0%) |
Physical Housing Characteristics in Petersburg
Housing Structures in Petersburg
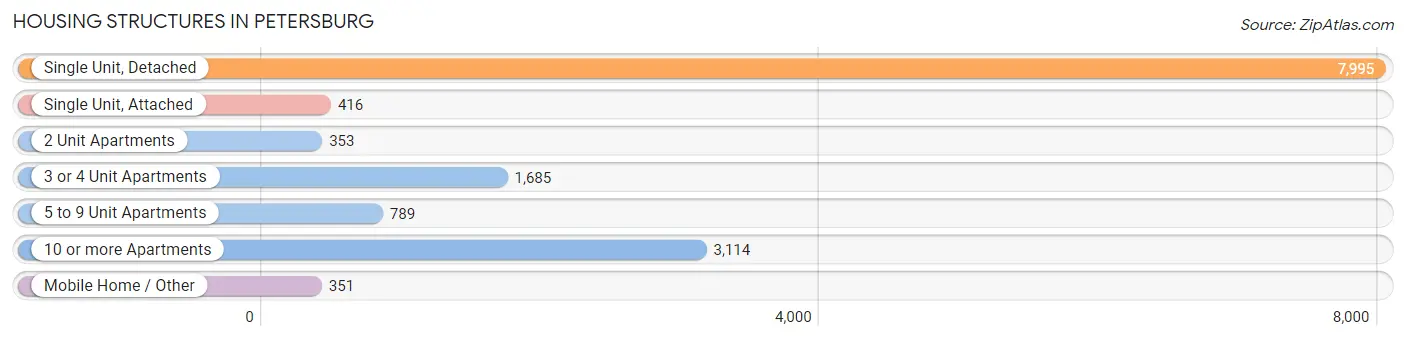
| Structure Type | # Housing Units | % Housing Units |
| Single Unit, Detached | 7,995 | 54.4% |
| Single Unit, Attached | 416 | 2.8% |
| 2 Unit Apartments | 353 | 2.4% |
| 3 or 4 Unit Apartments | 1,685 | 11.5% |
| 5 to 9 Unit Apartments | 789 | 5.4% |
| 10 or more Apartments | 3,114 | 21.2% |
| Mobile Home / Other | 351 | 2.4% |
| Total | 14,703 | 100.0% |
Housing Structures by Occupancy in Petersburg
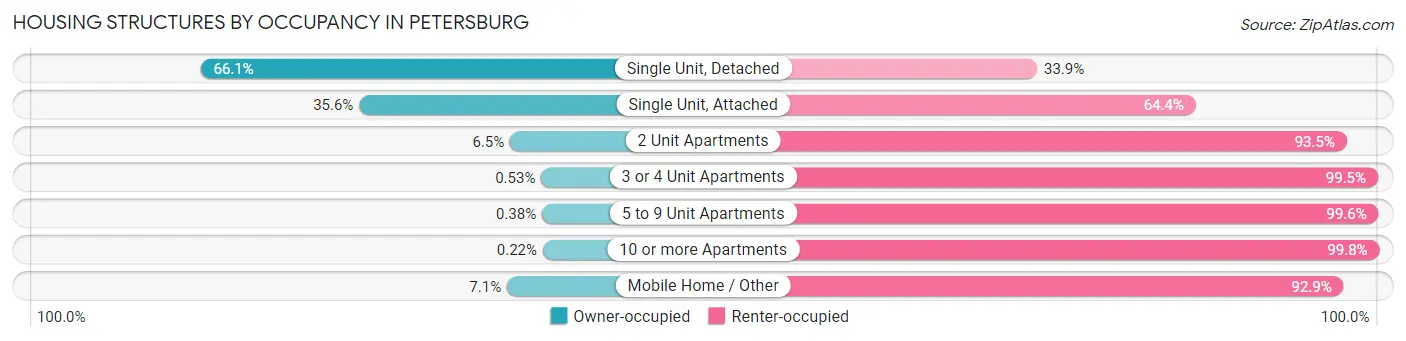
| Structure Type | Owner-occupied | Renter-occupied |
| Single Unit, Detached | 5,288 (66.1%) | 2,707 (33.9%) |
| Single Unit, Attached | 148 (35.6%) | 268 (64.4%) |
| 2 Unit Apartments | 23 (6.5%) | 330 (93.5%) |
| 3 or 4 Unit Apartments | 9 (0.5%) | 1,676 (99.5%) |
| 5 to 9 Unit Apartments | 3 (0.4%) | 786 (99.6%) |
| 10 or more Apartments | 7 (0.2%) | 3,107 (99.8%) |
| Mobile Home / Other | 25 (7.1%) | 326 (92.9%) |
| Total | 5,503 (37.4%) | 9,200 (62.6%) |
Housing Structures by Number of Rooms in Petersburg
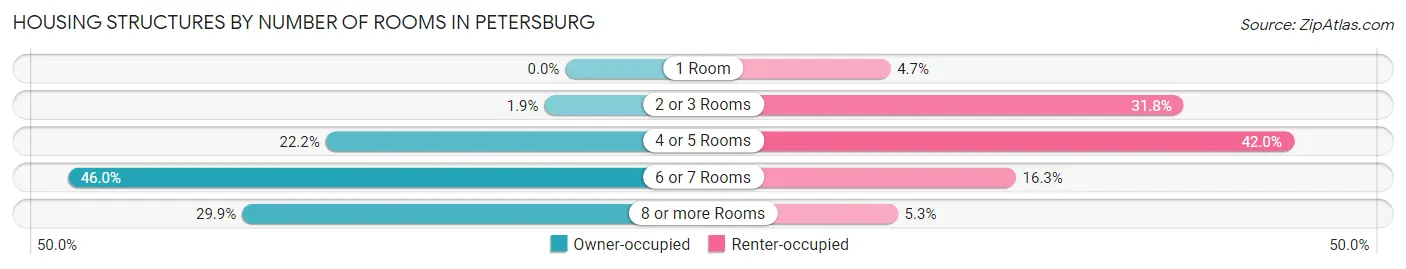
| Number of Rooms | Owner-occupied | Renter-occupied |
| 1 Room | 0 (0.0%) | 428 (4.6%) |
| 2 or 3 Rooms | 106 (1.9%) | 2,925 (31.8%) |
| 4 or 5 Rooms | 1,220 (22.2%) | 3,861 (42.0%) |
| 6 or 7 Rooms | 2,532 (46.0%) | 1,495 (16.3%) |
| 8 or more Rooms | 1,645 (29.9%) | 491 (5.3%) |
| Total | 5,503 (100.0%) | 9,200 (100.0%) |
Housing Structure by Heating Type in Petersburg
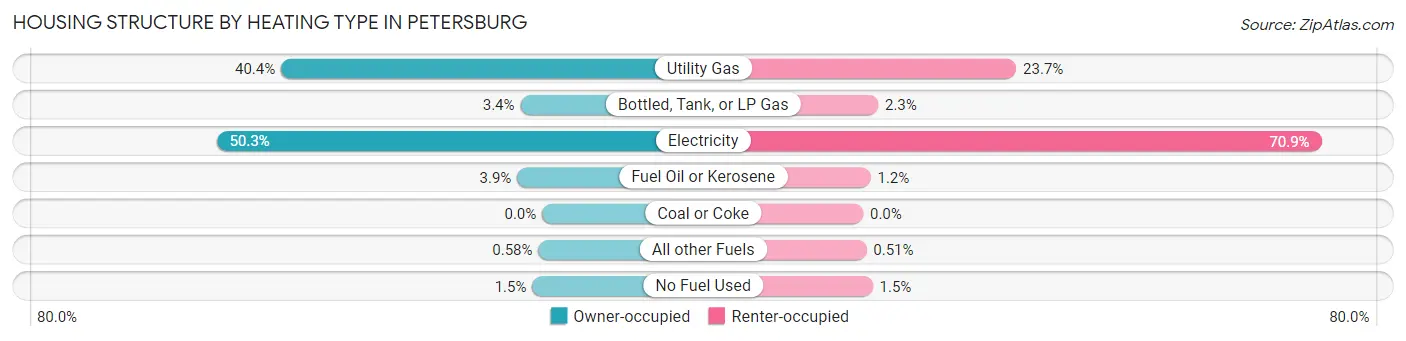
| Heating Type | Owner-occupied | Renter-occupied |
| Utility Gas | 2,221 (40.4%) | 2,178 (23.7%) |
| Bottled, Tank, or LP Gas | 185 (3.4%) | 213 (2.3%) |
| Electricity | 2,770 (50.3%) | 6,519 (70.9%) |
| Fuel Oil or Kerosene | 212 (3.8%) | 107 (1.2%) |
| Coal or Coke | 0 (0.0%) | 0 (0.0%) |
| All other Fuels | 32 (0.6%) | 47 (0.5%) |
| No Fuel Used | 83 (1.5%) | 136 (1.5%) |
| Total | 5,503 (100.0%) | 9,200 (100.0%) |
Household Vehicle Usage in Petersburg
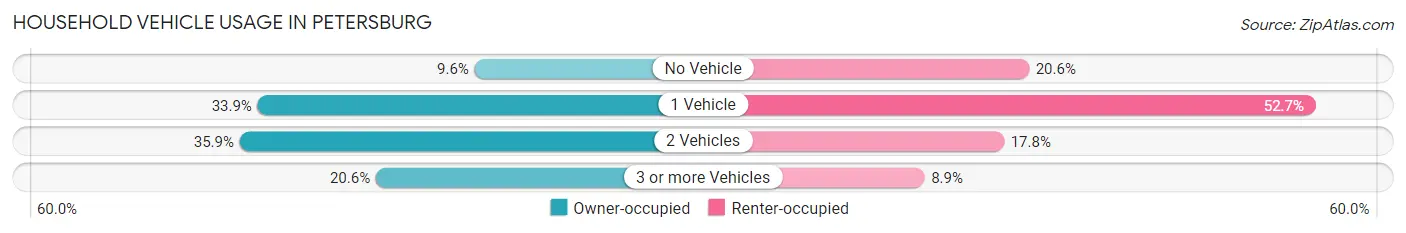
| Vehicles per Household | Owner-occupied | Renter-occupied |
| No Vehicle | 527 (9.6%) | 1,894 (20.6%) |
| 1 Vehicle | 1,865 (33.9%) | 4,852 (52.7%) |
| 2 Vehicles | 1,975 (35.9%) | 1,637 (17.8%) |
| 3 or more Vehicles | 1,136 (20.6%) | 817 (8.9%) |
| Total | 5,503 (100.0%) | 9,200 (100.0%) |
Real Estate & Mortgages in Petersburg
Real Estate and Mortgage Overview in Petersburg
| Characteristic | Without Mortgage | With Mortgage |
| Housing Units | 1,824 | 3,679 |
| Median Property Value | $108,500 | $165,500 |
| Median Household Income | $53,707 | $323 |
| Monthly Housing Costs | $463 | $67 |
| Real Estate Taxes | $1,347 | $229 |
Property Value by Mortgage Status in Petersburg
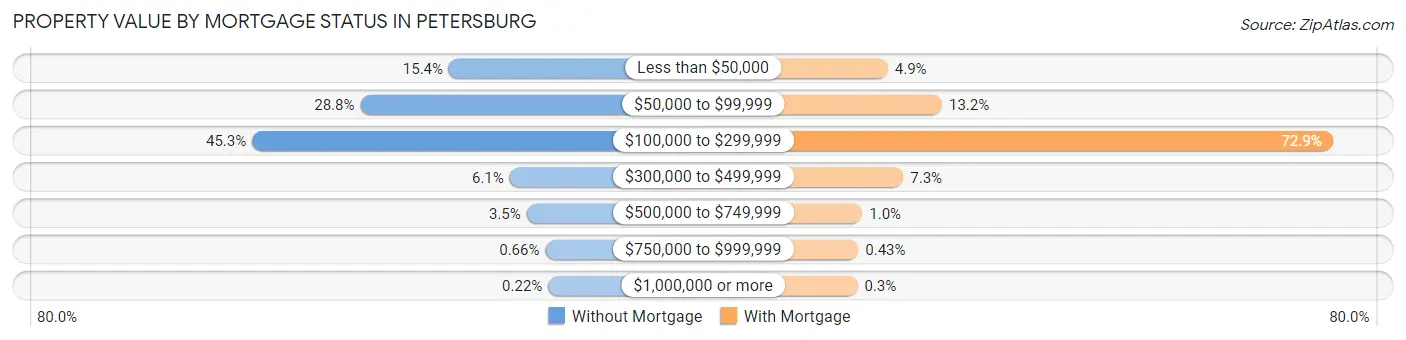
| Property Value | Without Mortgage | With Mortgage |
| Less than $50,000 | 280 (15.3%) | 181 (4.9%) |
| $50,000 to $99,999 | 526 (28.8%) | 485 (13.2%) |
| $100,000 to $299,999 | 827 (45.3%) | 2,680 (72.9%) |
| $300,000 to $499,999 | 111 (6.1%) | 268 (7.3%) |
| $500,000 to $749,999 | 64 (3.5%) | 38 (1.0%) |
| $750,000 to $999,999 | 12 (0.7%) | 16 (0.4%) |
| $1,000,000 or more | 4 (0.2%) | 11 (0.3%) |
| Total | 1,824 (100.0%) | 3,679 (100.0%) |
Household Income by Mortgage Status in Petersburg
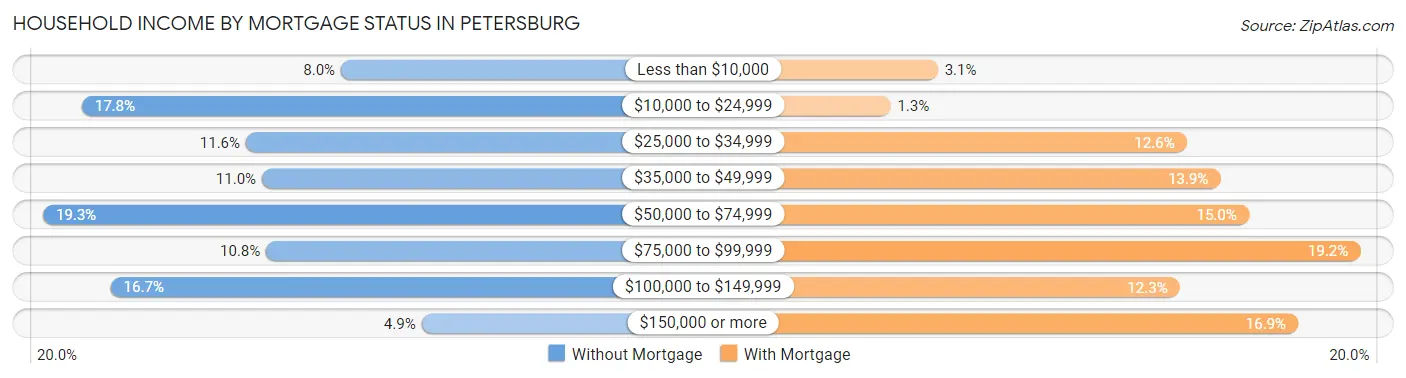
| Household Income | Without Mortgage | With Mortgage |
| Less than $10,000 | 145 (8.0%) | 115 (3.1%) |
| $10,000 to $24,999 | 325 (17.8%) | 49 (1.3%) |
| $25,000 to $34,999 | 211 (11.6%) | 464 (12.6%) |
| $35,000 to $49,999 | 200 (11.0%) | 511 (13.9%) |
| $50,000 to $74,999 | 352 (19.3%) | 551 (15.0%) |
| $75,000 to $99,999 | 197 (10.8%) | 707 (19.2%) |
| $100,000 to $149,999 | 305 (16.7%) | 454 (12.3%) |
| $150,000 or more | 89 (4.9%) | 620 (16.9%) |
| Total | 1,824 (100.0%) | 3,679 (100.0%) |
Property Value to Household Income Ratio in Petersburg
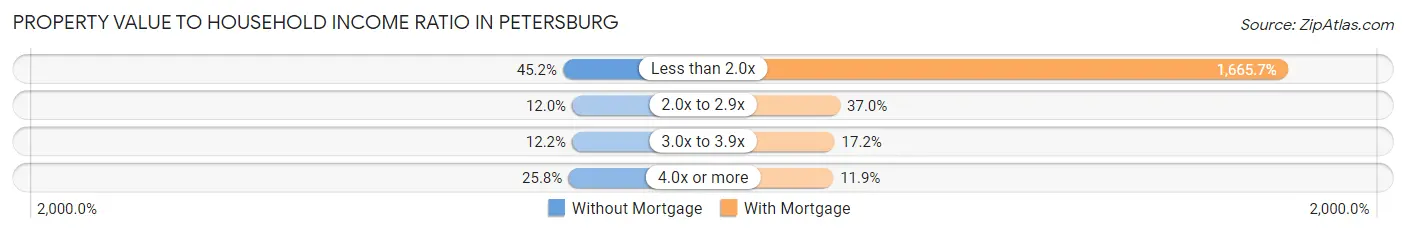
| Value-to-Income Ratio | Without Mortgage | With Mortgage |
| Less than 2.0x | 824 (45.2%) | 61,281 (1,665.7%) |
| 2.0x to 2.9x | 218 (11.9%) | 1,361 (37.0%) |
| 3.0x to 3.9x | 223 (12.2%) | 631 (17.2%) |
| 4.0x or more | 470 (25.8%) | 438 (11.9%) |
| Total | 1,824 (100.0%) | 3,679 (100.0%) |
Real Estate Taxes by Mortgage Status in Petersburg
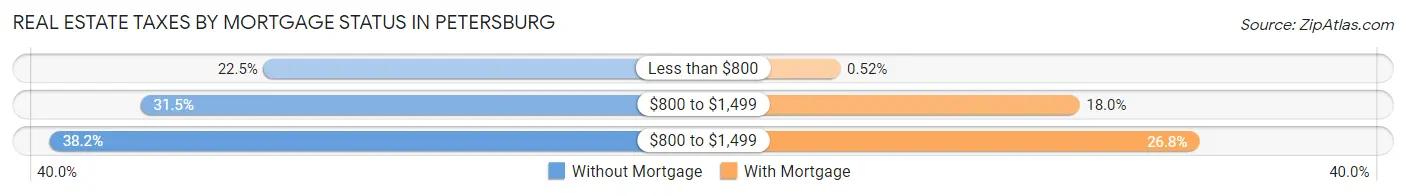
| Property Taxes | Without Mortgage | With Mortgage |
| Less than $800 | 411 (22.5%) | 19 (0.5%) |
| $800 to $1,499 | 575 (31.5%) | 662 (18.0%) |
| $800 to $1,499 | 696 (38.2%) | 984 (26.8%) |
| Total | 1,824 (100.0%) | 3,679 (100.0%) |
Health & Disability in Petersburg
Health Insurance Coverage by Age in Petersburg
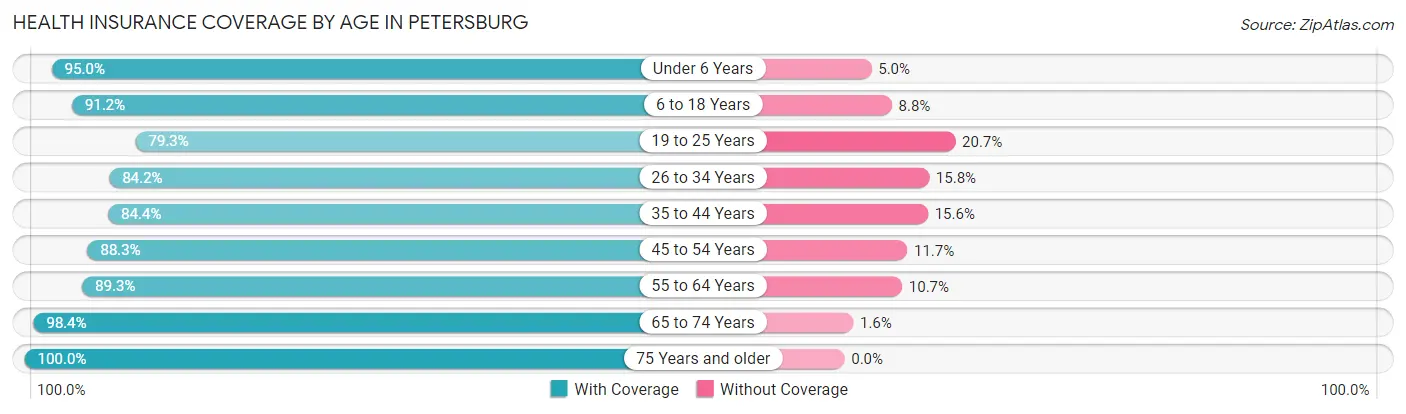
| Age Bracket | With Coverage | Without Coverage |
| Under 6 Years | 2,777 (95.0%) | 147 (5.0%) |
| 6 to 18 Years | 4,240 (91.2%) | 410 (8.8%) |
| 19 to 25 Years | 2,738 (79.3%) | 713 (20.7%) |
| 26 to 34 Years | 3,730 (84.2%) | 699 (15.8%) |
| 35 to 44 Years | 3,065 (84.4%) | 565 (15.6%) |
| 45 to 54 Years | 3,184 (88.3%) | 422 (11.7%) |
| 55 to 64 Years | 3,936 (89.3%) | 473 (10.7%) |
| 65 to 74 Years | 3,204 (98.4%) | 53 (1.6%) |
| 75 Years and older | 2,134 (100.0%) | 0 (0.0%) |
| Total | 29,008 (89.3%) | 3,482 (10.7%) |
Health Insurance Coverage by Citizenship Status in Petersburg
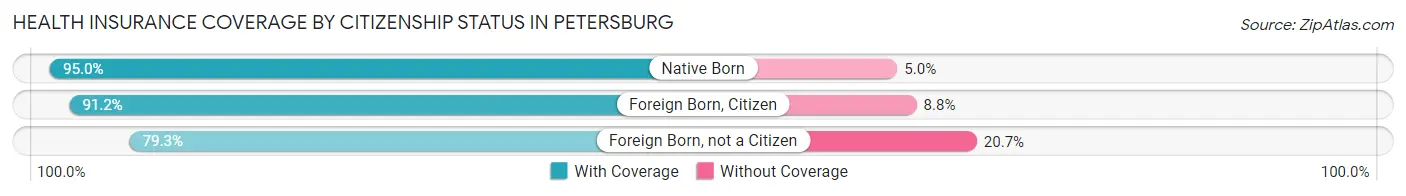
| Citizenship Status | With Coverage | Without Coverage |
| Native Born | 2,777 (95.0%) | 147 (5.0%) |
| Foreign Born, Citizen | 4,240 (91.2%) | 410 (8.8%) |
| Foreign Born, not a Citizen | 2,738 (79.3%) | 713 (20.7%) |
Health Insurance Coverage by Household Income in Petersburg
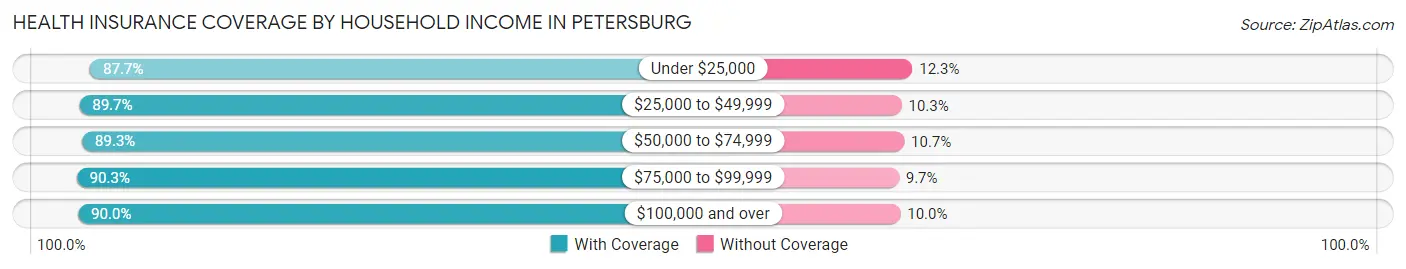
| Household Income | With Coverage | Without Coverage |
| Under $25,000 | 6,093 (87.7%) | 853 (12.3%) |
| $25,000 to $49,999 | 6,316 (89.7%) | 722 (10.3%) |
| $50,000 to $74,999 | 6,331 (89.3%) | 762 (10.7%) |
| $75,000 to $99,999 | 4,022 (90.3%) | 434 (9.7%) |
| $100,000 and over | 6,052 (90.0%) | 675 (10.0%) |
Public vs Private Health Insurance Coverage by Age in Petersburg
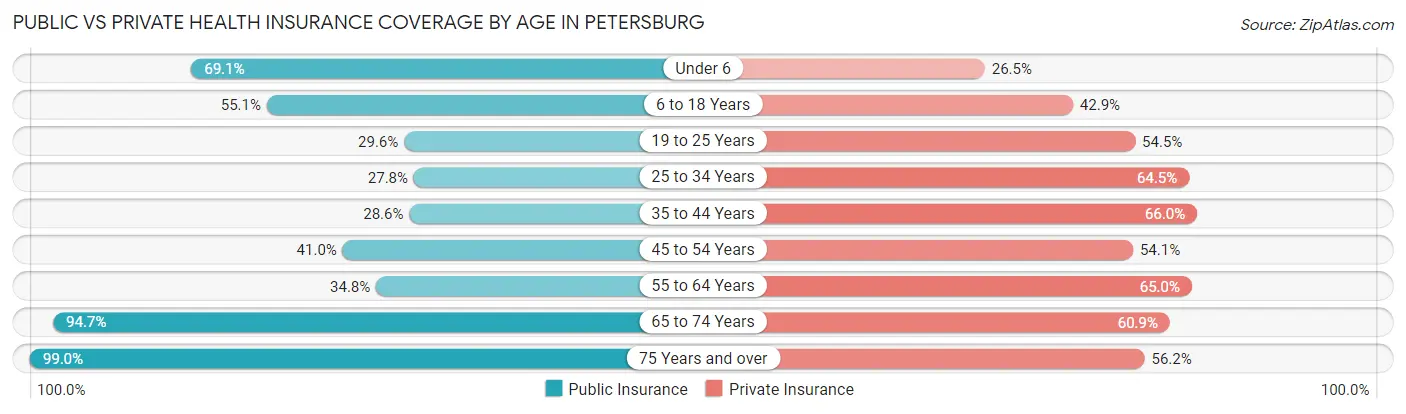
| Age Bracket | Public Insurance | Private Insurance |
| Under 6 | 2,019 (69.1%) | 776 (26.5%) |
| 6 to 18 Years | 2,560 (55.0%) | 1,995 (42.9%) |
| 19 to 25 Years | 1,020 (29.6%) | 1,879 (54.4%) |
| 25 to 34 Years | 1,229 (27.8%) | 2,855 (64.5%) |
| 35 to 44 Years | 1,038 (28.6%) | 2,394 (65.9%) |
| 45 to 54 Years | 1,477 (41.0%) | 1,949 (54.0%) |
| 55 to 64 Years | 1,532 (34.7%) | 2,864 (65.0%) |
| 65 to 74 Years | 3,085 (94.7%) | 1,983 (60.9%) |
| 75 Years and over | 2,113 (99.0%) | 1,199 (56.2%) |
| Total | 16,073 (49.5%) | 17,894 (55.1%) |
Disability Status by Sex by Age in Petersburg
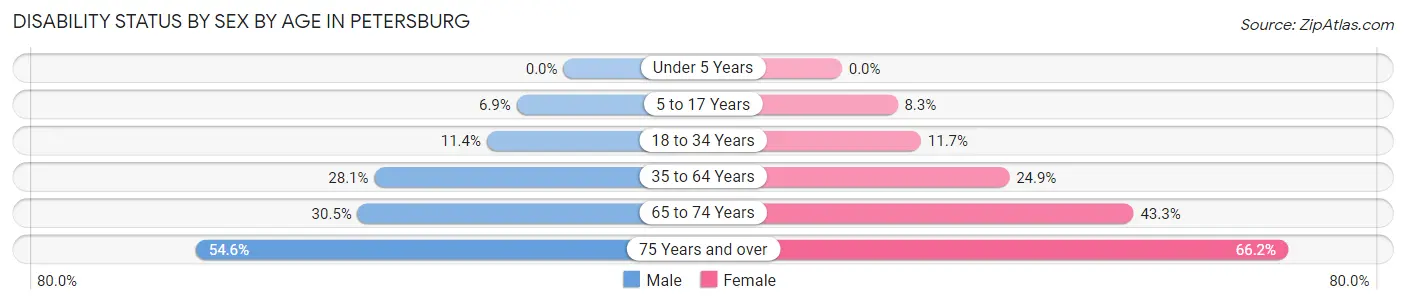
| Age Bracket | Male | Female |
| Under 5 Years | 0 (0.0%) | 0 (0.0%) |
| 5 to 17 Years | 176 (6.9%) | 192 (8.3%) |
| 18 to 34 Years | 409 (11.4%) | 532 (11.7%) |
| 35 to 64 Years | 1,460 (28.1%) | 1,601 (24.9%) |
| 65 to 74 Years | 422 (30.5%) | 812 (43.3%) |
| 75 Years and over | 376 (54.6%) | 957 (66.2%) |
Disability Class by Sex by Age in Petersburg
Disability Class: Hearing Difficulty
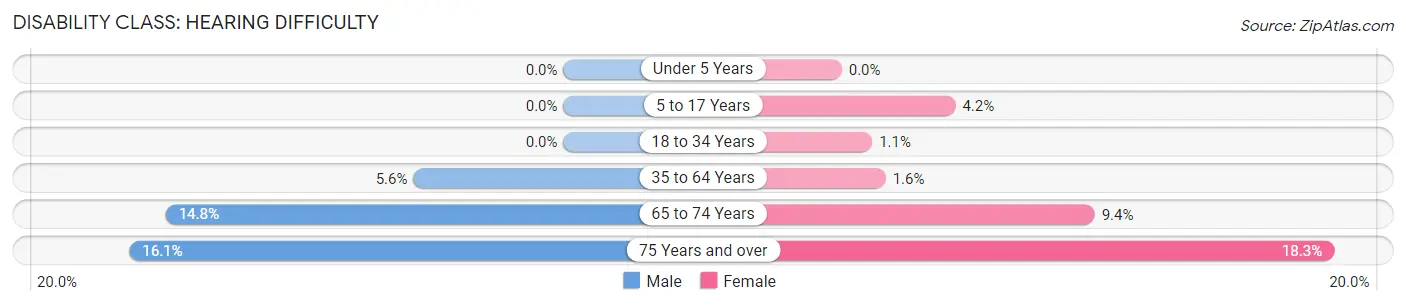
| Age Bracket | Male | Female |
| Under 5 Years | 0 (0.0%) | 0 (0.0%) |
| 5 to 17 Years | 0 (0.0%) | 98 (4.2%) |
| 18 to 34 Years | 0 (0.0%) | 51 (1.1%) |
| 35 to 64 Years | 290 (5.6%) | 105 (1.6%) |
| 65 to 74 Years | 204 (14.8%) | 176 (9.4%) |
| 75 Years and over | 111 (16.1%) | 264 (18.3%) |
Disability Class: Vision Difficulty
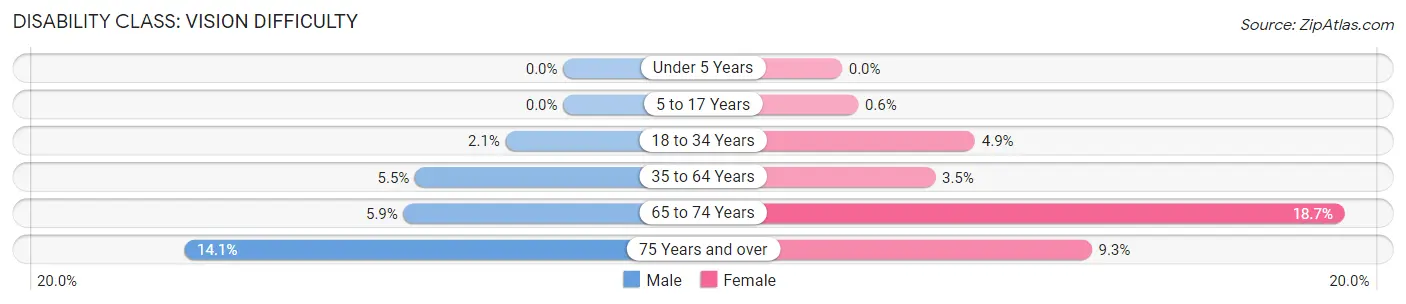
| Age Bracket | Male | Female |
| Under 5 Years | 0 (0.0%) | 0 (0.0%) |
| 5 to 17 Years | 0 (0.0%) | 14 (0.6%) |
| 18 to 34 Years | 77 (2.1%) | 224 (4.9%) |
| 35 to 64 Years | 286 (5.5%) | 223 (3.5%) |
| 65 to 74 Years | 82 (5.9%) | 350 (18.7%) |
| 75 Years and over | 97 (14.1%) | 134 (9.3%) |
Disability Class: Cognitive Difficulty
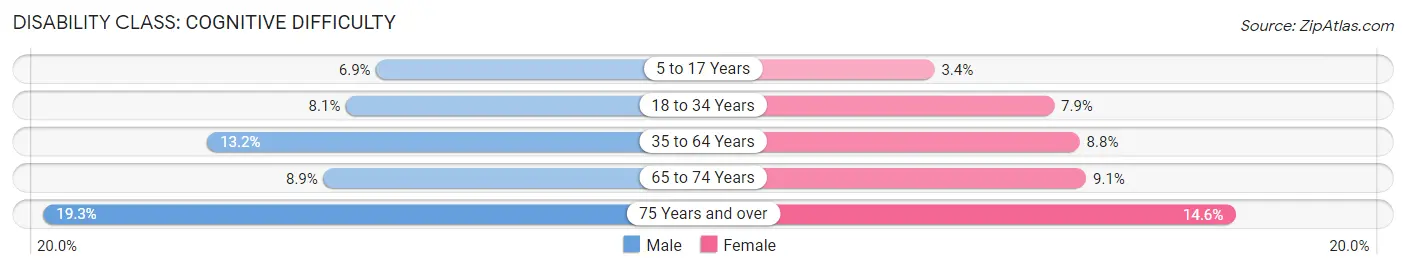
| Age Bracket | Male | Female |
| 5 to 17 Years | 176 (6.9%) | 80 (3.4%) |
| 18 to 34 Years | 290 (8.1%) | 357 (7.9%) |
| 35 to 64 Years | 688 (13.2%) | 569 (8.8%) |
| 65 to 74 Years | 123 (8.9%) | 170 (9.1%) |
| 75 Years and over | 133 (19.3%) | 211 (14.6%) |
Disability Class: Ambulatory Difficulty
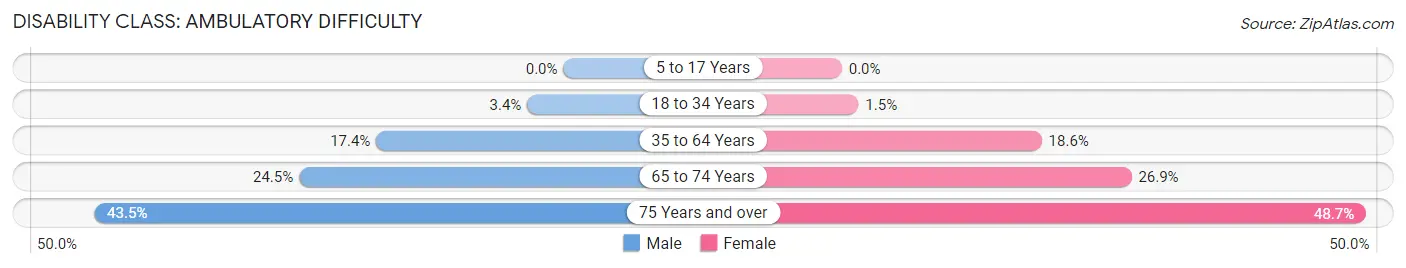
| Age Bracket | Male | Female |
| 5 to 17 Years | 0 (0.0%) | 0 (0.0%) |
| 18 to 34 Years | 121 (3.4%) | 70 (1.5%) |
| 35 to 64 Years | 904 (17.4%) | 1,195 (18.5%) |
| 65 to 74 Years | 339 (24.5%) | 504 (26.9%) |
| 75 Years and over | 300 (43.5%) | 703 (48.6%) |
Disability Class: Self-Care Difficulty
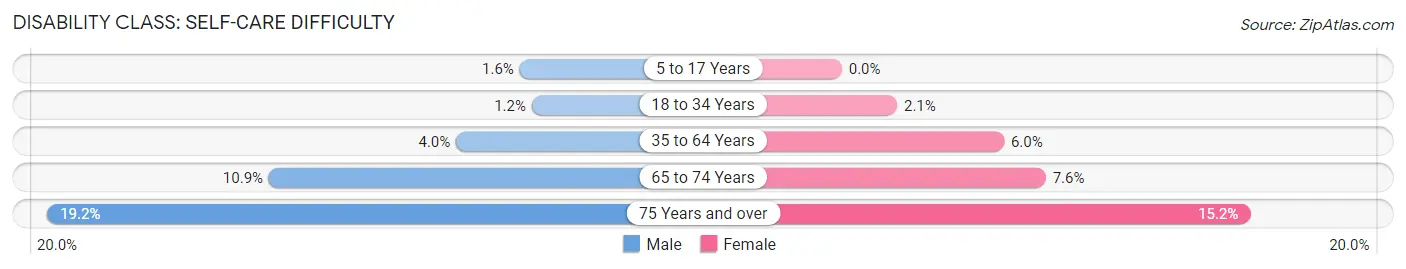
| Age Bracket | Male | Female |
| 5 to 17 Years | 41 (1.6%) | 0 (0.0%) |
| 18 to 34 Years | 42 (1.2%) | 93 (2.1%) |
| 35 to 64 Years | 207 (4.0%) | 388 (6.0%) |
| 65 to 74 Years | 151 (10.9%) | 142 (7.6%) |
| 75 Years and over | 132 (19.2%) | 219 (15.2%) |
Technology Access in Petersburg
Computing Device Access in Petersburg
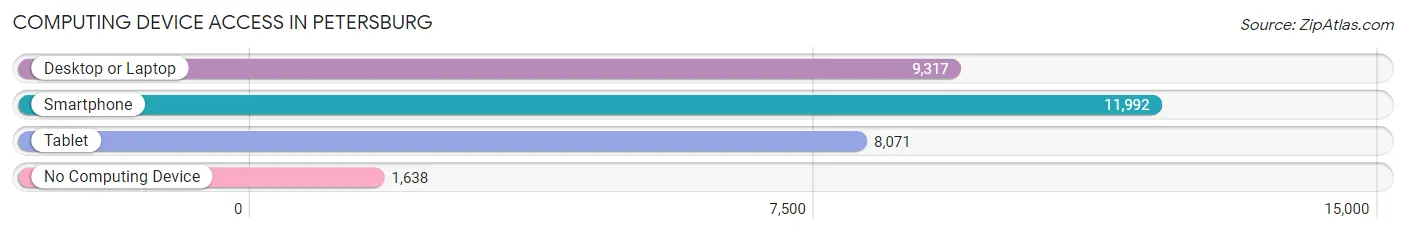
| Device Type | # Households | % Households |
| Desktop or Laptop | 9,317 | 63.4% |
| Smartphone | 11,992 | 81.6% |
| Tablet | 8,071 | 54.9% |
| No Computing Device | 1,638 | 11.1% |
| Total | 14,703 | 100.0% |
Internet Access in Petersburg
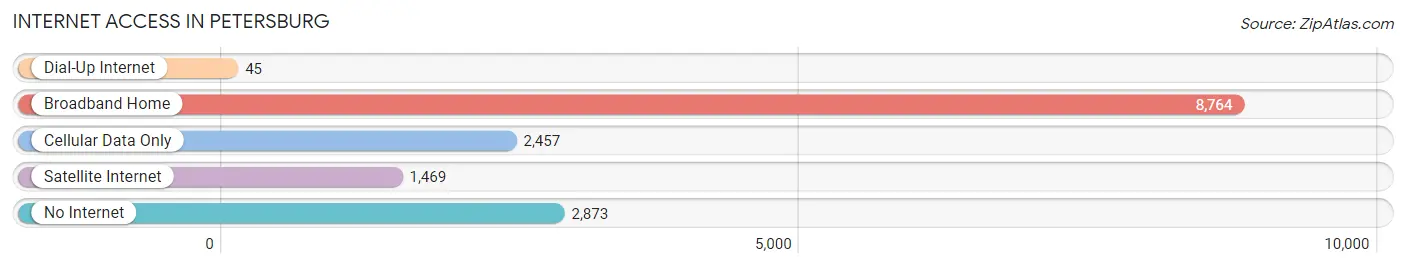
| Internet Type | # Households | % Households |
| Dial-Up Internet | 45 | 0.3% |
| Broadband Home | 8,764 | 59.6% |
| Cellular Data Only | 2,457 | 16.7% |
| Satellite Internet | 1,469 | 10.0% |
| No Internet | 2,873 | 19.5% |
| Total | 14,703 | 100.0% |
Petersburg Summary
Petersburg, Virginia is a city located in the Commonwealth of Virginia, in the United States. It is located in the south-central part of the state, about 20 miles south of Richmond, the state capital. Petersburg is the county seat of Dinwiddie County, and is part of the Richmond-Petersburg metropolitan area. As of the 2010 census, the population of Petersburg was 32,420.
History
Petersburg was founded in 1748 by William Byrd II, a planter and surveyor from Charles City County, Virginia. He named the city after Peter Jones, a slave who had been freed by Byrd's father. The city was incorporated in 1784, and became an important trading center for tobacco and other goods. During the American Revolution, Petersburg was the site of several battles, including the Battle of Petersburg in 1781.
In the 19th century, Petersburg became an important railroad hub, and was the site of the Battle of the Crater during the Civil War. After the war, the city experienced a period of economic growth, and by the early 20th century, it was a major industrial center.
Geography
Petersburg is located in south-central Virginia, about 20 miles south of Richmond. It is situated on the Appomattox River, which forms the boundary between Dinwiddie and Prince George counties. The city has a total area of 16.3 square miles, of which 16.2 square miles is land and 0.1 square miles is water.
Climate
Petersburg has a humid subtropical climate, with hot, humid summers and mild winters. The average annual temperature is 57.2°F, and the average annual precipitation is 43.3 inches.
Economy
Petersburg's economy is largely based on manufacturing and services. The city is home to several large manufacturing companies, including Philip Morris USA, which produces cigarettes, and the Virginia State University Research and Technology Park, which houses several technology companies. The city is also home to several hospitals and medical centers, as well as a number of retail stores and restaurants.
Demographics
As of the 2010 census, there were 32,420 people, 11,945 households, and 7,845 families living in Petersburg. The population density was 1,988.3 people per square mile. The racial makeup of the city was 54.3% African American, 37.7% White, 0.3% Native American, 0.7% Asian, 0.1% Pacific Islander, 4.2% from other races, and 2.9% from two or more races. Hispanic or Latino of any race were 8.2% of the population.
The median income for a household in Petersburg was $31,945, and the median income for a family was $37,945. The per capita income for the city was $17,845. About 22.3% of families and 25.7% of the population were below the poverty line, including 37.2% of those under age 18 and 16.2% of those age 65 or over.
Common Questions
What is Per Capita Income in Petersburg?
Per Capita income in Petersburg is $28,146.
What is the Median Family Income in Petersburg?
Median Family Income in Petersburg is $62,385.
What is the Median Household income in Petersburg?
Median Household Income in Petersburg is $46,930.
What is Income or Wage Gap in Petersburg?
Income or Wage Gap in Petersburg is 12.6%.
Women in Petersburg earn 87.4 cents for every dollar earned by a man.
What is Family Income Deficit in Petersburg?
Family Income Deficit in Petersburg is $11,189.
Families that are below poverty line in Petersburg earn $11,189 less on average than the poverty threshold level.
What is Inequality or Gini Index in Petersburg?
Inequality or Gini Index in Petersburg is 0.45.
What is the Total Population of Petersburg?
Total Population of Petersburg is 33,261.
What is the Total Male Population of Petersburg?
Total Male Population of Petersburg is 15,163.
What is the Total Female Population of Petersburg?
Total Female Population of Petersburg is 18,098.
What is the Ratio of Males per 100 Females in Petersburg?
There are 83.78 Males per 100 Females in Petersburg.
What is the Ratio of Females per 100 Males in Petersburg?
There are 119.36 Females per 100 Males in Petersburg.
What is the Median Population Age in Petersburg?
Median Population Age in Petersburg is 36.6 Years.
What is the Average Family Size in Petersburg
Average Family Size in Petersburg is 3.4 People.
What is the Average Household Size in Petersburg
Average Household Size in Petersburg is 2.2 People.
How Large is the Labor Force in Petersburg?
There are 16,568 People in the Labor Forcein in Petersburg.
What is the Percentage of People in the Labor Force in Petersburg?
62.4% of People are in the Labor Force in Petersburg.
What is the Unemployment Rate in Petersburg?
Unemployment Rate in Petersburg is 11.3%.