Germantown, OH Map & Demographics
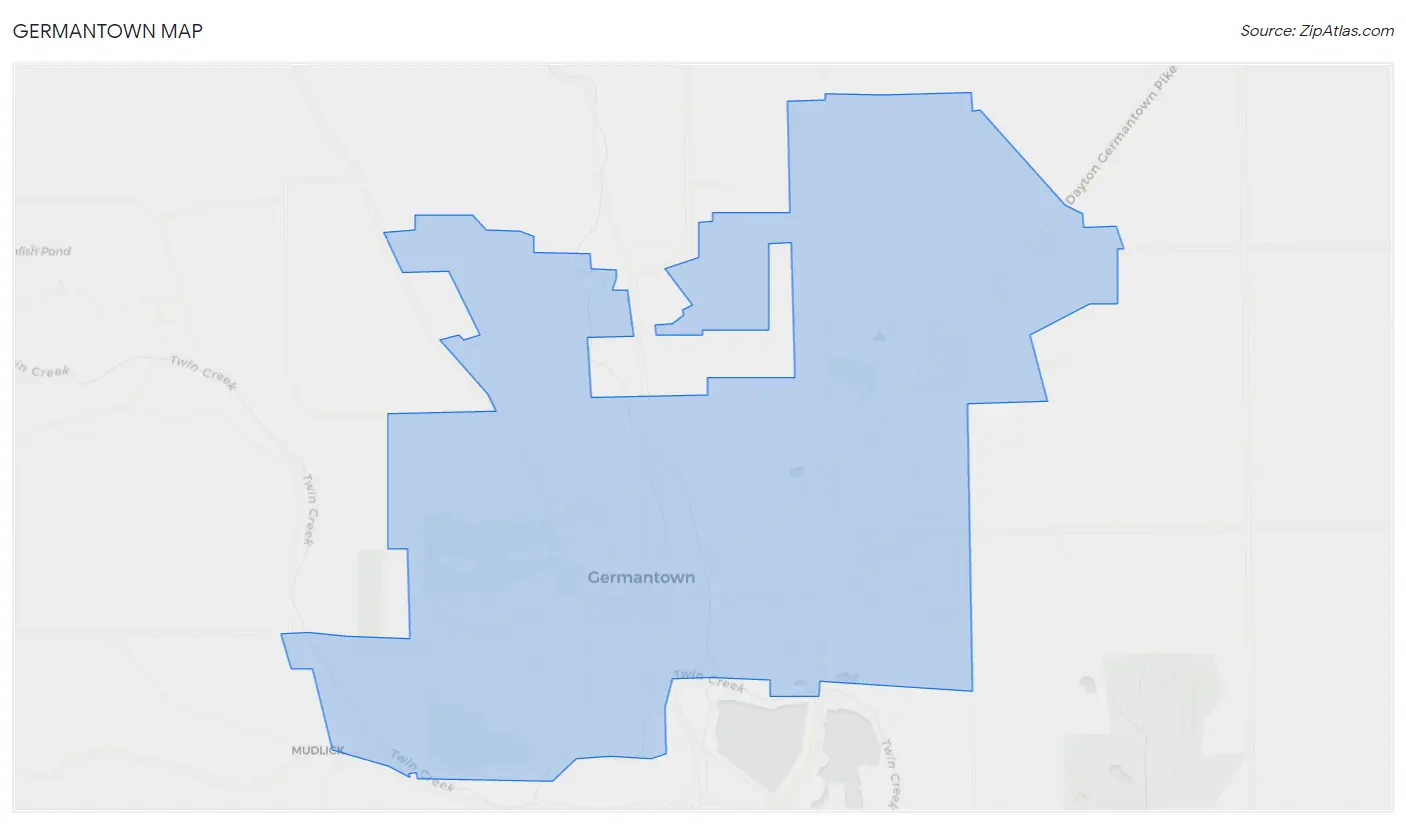
Germantown Map
Germantown Overview
$33,006
PER CAPITA INCOME
$98,839
AVG FAMILY INCOME
$86,524
AVG HOUSEHOLD INCOME
41.5%
WAGE / INCOME GAP [ % ]
58.5¢/ $1
WAGE / INCOME GAP [ $ ]
$7,170
FAMILY INCOME DEFICIT
0.33
INEQUALITY / GINI INDEX
5,784
TOTAL POPULATION
2,707
MALE POPULATION
3,077
FEMALE POPULATION
87.98
MALES / 100 FEMALES
113.67
FEMALES / 100 MALES
43.6
MEDIAN AGE
3.1
AVG FAMILY SIZE
2.6
AVG HOUSEHOLD SIZE
3,035
LABOR FORCE [ PEOPLE ]
66.1%
PERCENT IN LABOR FORCE
6.6%
UNEMPLOYMENT RATE
Germantown Zip Codes
Germantown Area Codes
Income in Germantown
Income Overview in Germantown
Per Capita Income in Germantown is $33,006, while median incomes of families and households are $98,839 and $86,524 respectively.
| Characteristic | Number | Measure |
| Per Capita Income | 5,784 | $33,006 |
| Median Family Income | 1,566 | $98,839 |
| Mean Family Income | 1,566 | $97,269 |
| Median Household Income | 2,212 | $86,524 |
| Mean Household Income | 2,212 | $84,449 |
| Income Deficit | 1,566 | $7,170 |
| Wage / Income Gap (%) | 5,784 | 41.49% |
| Wage / Income Gap ($) | 5,784 | 58.51¢ per $1 |
| Gini / Inequality Index | 5,784 | 0.33 |
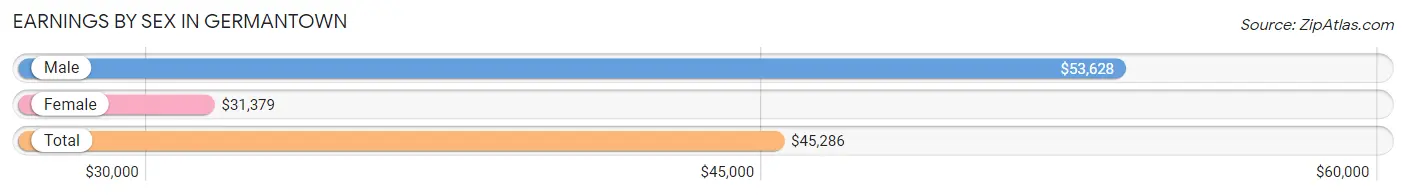
Earnings by Sex in Germantown
Average Earnings in Germantown are $45,286, $53,628 for men and $31,379 for women, a difference of 41.5%.
| Sex | Number | Average Earnings |
| Male | 1,514 (45.1%) | $53,628 |
| Female | 1,841 (54.9%) | $31,379 |
| Total | 3,355 (100.0%) | $45,286 |
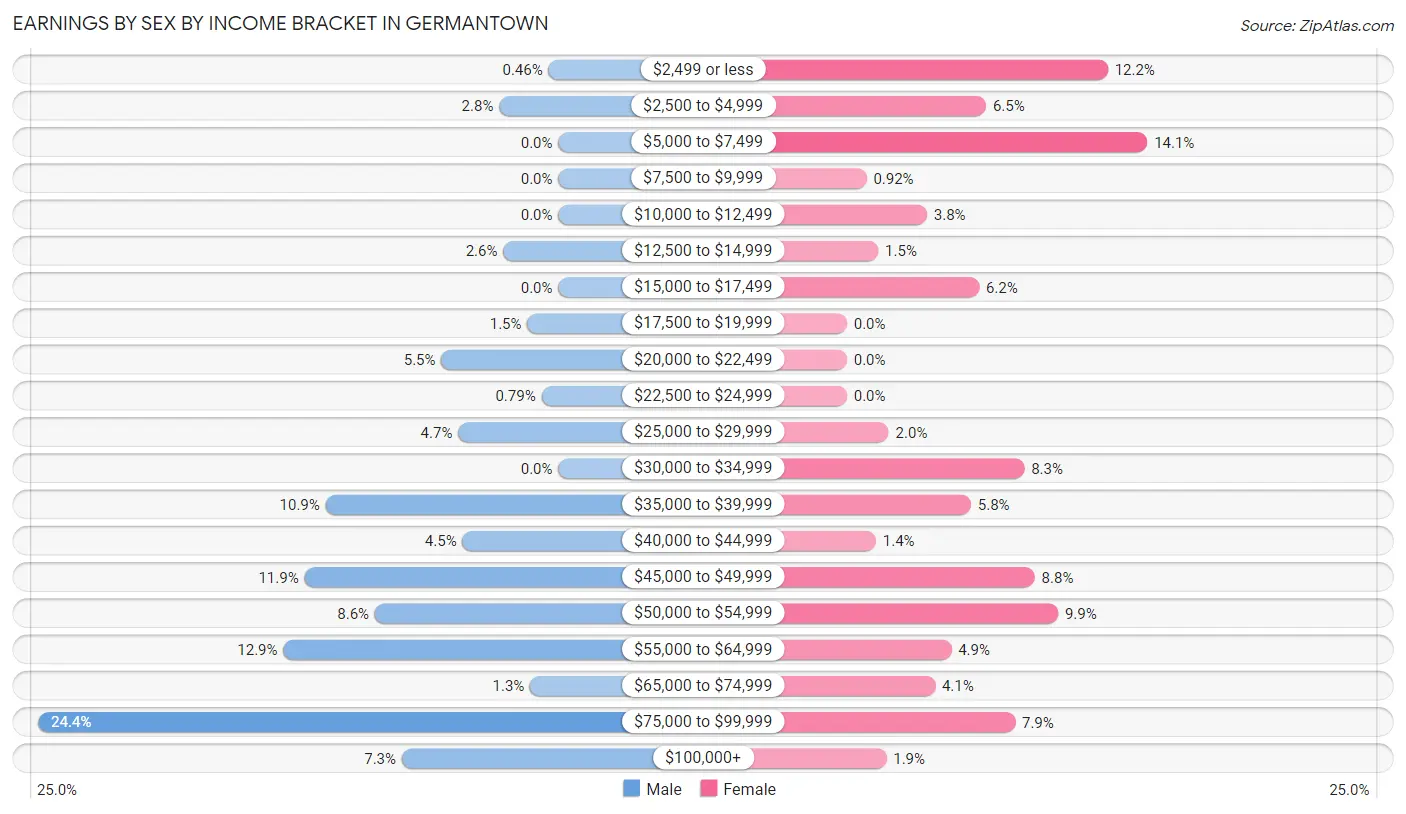
Earnings by Sex by Income Bracket in Germantown
The most common earnings brackets in Germantown are $75,000 to $99,999 for men (369 | 24.4%) and $5,000 to $7,499 for women (259 | 14.1%).
| Income | Male | Female |
| $2,499 or less | 7 (0.5%) | 225 (12.2%) |
| $2,500 to $4,999 | 42 (2.8%) | 120 (6.5%) |
| $5,000 to $7,499 | 0 (0.0%) | 259 (14.1%) |
| $7,500 to $9,999 | 0 (0.0%) | 17 (0.9%) |
| $10,000 to $12,499 | 0 (0.0%) | 69 (3.7%) |
| $12,500 to $14,999 | 39 (2.6%) | 27 (1.5%) |
| $15,000 to $17,499 | 0 (0.0%) | 114 (6.2%) |
| $17,500 to $19,999 | 22 (1.5%) | 0 (0.0%) |
| $20,000 to $22,499 | 83 (5.5%) | 0 (0.0%) |
| $22,500 to $24,999 | 12 (0.8%) | 0 (0.0%) |
| $25,000 to $29,999 | 71 (4.7%) | 36 (2.0%) |
| $30,000 to $34,999 | 0 (0.0%) | 153 (8.3%) |
| $35,000 to $39,999 | 165 (10.9%) | 107 (5.8%) |
| $40,000 to $44,999 | 68 (4.5%) | 25 (1.4%) |
| $45,000 to $49,999 | 180 (11.9%) | 162 (8.8%) |
| $50,000 to $54,999 | 130 (8.6%) | 182 (9.9%) |
| $55,000 to $64,999 | 195 (12.9%) | 90 (4.9%) |
| $65,000 to $74,999 | 20 (1.3%) | 76 (4.1%) |
| $75,000 to $99,999 | 369 (24.4%) | 145 (7.9%) |
| $100,000+ | 111 (7.3%) | 34 (1.8%) |
| Total | 1,514 (100.0%) | 1,841 (100.0%) |
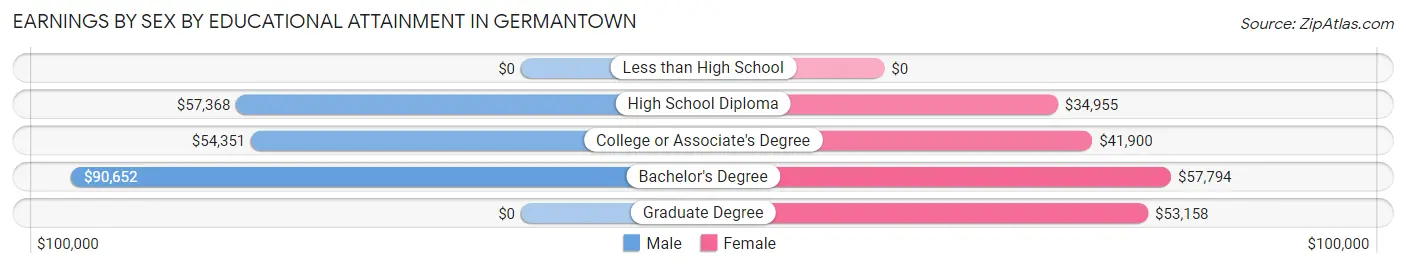
Earnings by Sex by Educational Attainment in Germantown
Average earnings in Germantown are $57,434 for men and $45,655 for women, a difference of 20.5%. Men with an educational attainment of bachelor's degree enjoy the highest average annual earnings of $90,652, while those with college or associate's degree education earn the least with $54,351. Women with an educational attainment of bachelor's degree earn the most with the average annual earnings of $57,794, while those with high school diploma education have the smallest earnings of $34,955.
| Educational Attainment | Male Income | Female Income |
| Less than High School | - | - |
| High School Diploma | $57,368 | $34,955 |
| College or Associate's Degree | $54,351 | $41,900 |
| Bachelor's Degree | $90,652 | $57,794 |
| Graduate Degree | - | - |
| Total | $57,434 | $45,655 |
Family Income in Germantown
Family Income Brackets in Germantown
According to the Germantown family income data, there are 622 families falling into the $100,000 to $149,999 income range, which is the most common income bracket and makes up 39.7% of all families.
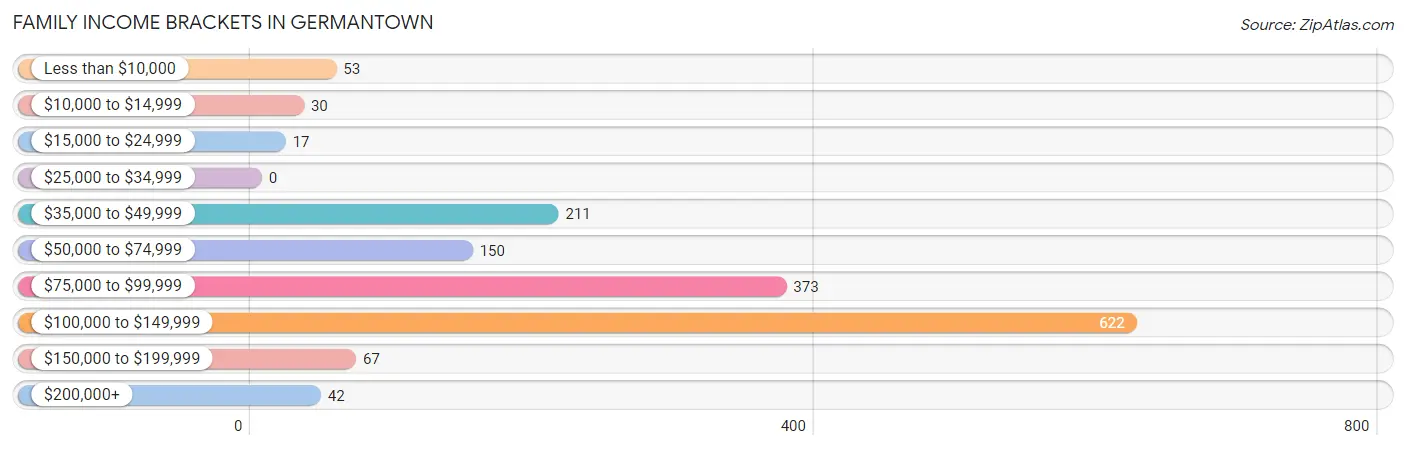
| Income Bracket | # Families | % Families |
| Less than $10,000 | 53 | 3.4% |
| $10,000 to $14,999 | 30 | 1.9% |
| $15,000 to $24,999 | 17 | 1.1% |
| $25,000 to $34,999 | 0 | 0.0% |
| $35,000 to $49,999 | 211 | 13.5% |
| $50,000 to $74,999 | 150 | 9.6% |
| $75,000 to $99,999 | 373 | 23.8% |
| $100,000 to $149,999 | 622 | 39.7% |
| $150,000 to $199,999 | 67 | 4.3% |
| $200,000+ | 42 | 2.7% |
Family Income by Famaliy Size in Germantown
3-person families (381 | 24.3%) account for the highest median family income in Germantown with $117,120 per family, while 2-person families (746 | 47.6%) have the highest median income of $41,166 per family member.
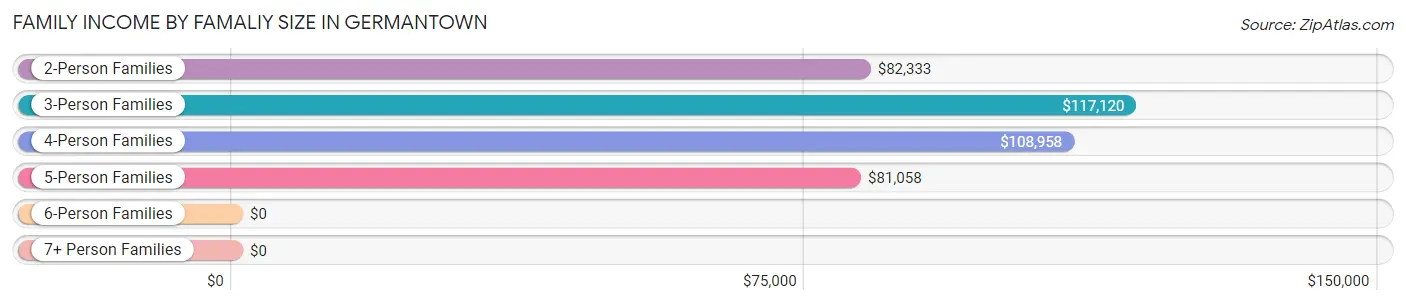
| Income Bracket | # Families | Median Income |
| 2-Person Families | 746 (47.6%) | $82,333 |
| 3-Person Families | 381 (24.3%) | $117,120 |
| 4-Person Families | 208 (13.3%) | $108,958 |
| 5-Person Families | 145 (9.3%) | $81,058 |
| 6-Person Families | 86 (5.5%) | $0 |
| 7+ Person Families | 0 (0.0%) | $0 |
| Total | 1,566 (100.0%) | $98,839 |
Family Income by Number of Earners in Germantown
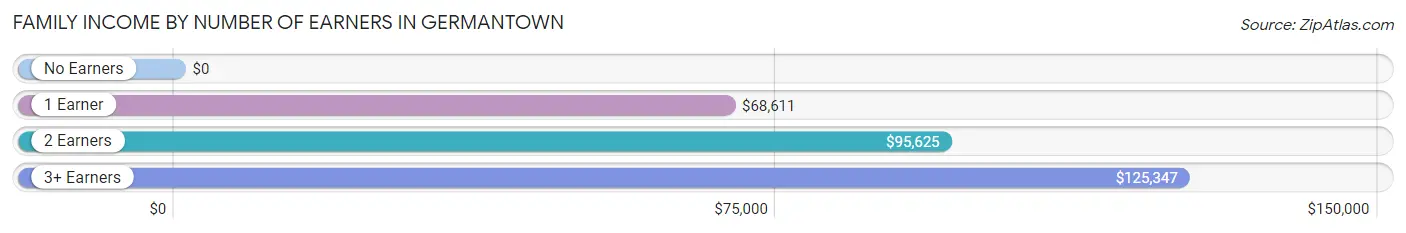
| Number of Earners | # Families | Median Income |
| No Earners | 206 (13.2%) | $0 |
| 1 Earner | 448 (28.6%) | $68,611 |
| 2 Earners | 543 (34.7%) | $95,625 |
| 3+ Earners | 369 (23.6%) | $125,347 |
| Total | 1,566 (100.0%) | $98,839 |
Household Income in Germantown
Household Income Brackets in Germantown
With 686 households falling in the category, the $100,000 to $149,999 income range is the most frequent in Germantown, accounting for 31.0% of all households. In contrast, only 31 households (1.4%) fall into the less than $10,000 income bracket, making it the least populous group.
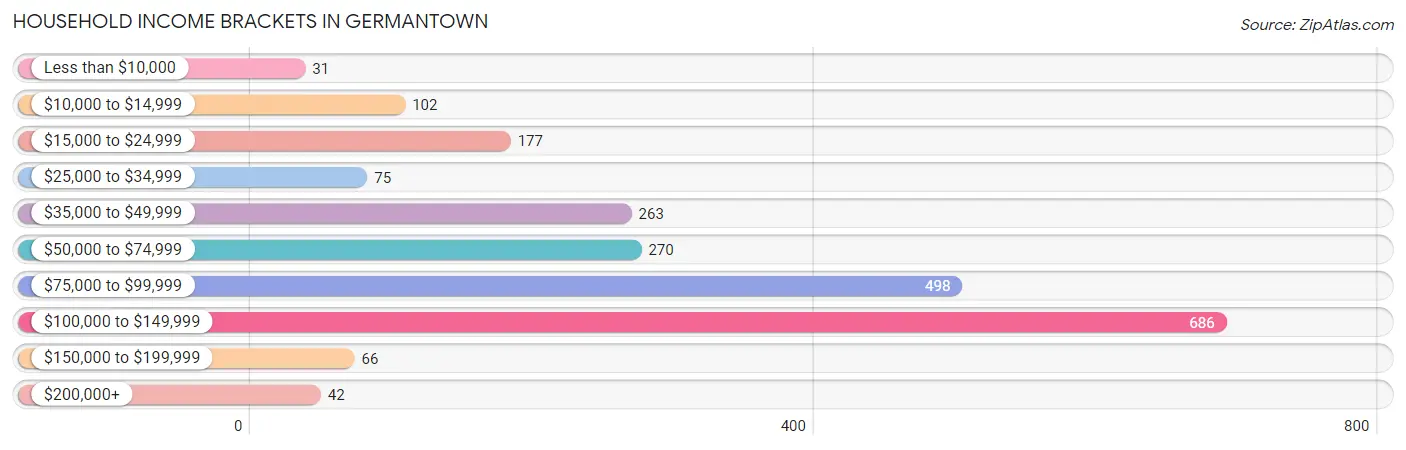
| Income Bracket | # Households | % Households |
| Less than $10,000 | 31 | 1.4% |
| $10,000 to $14,999 | 102 | 4.6% |
| $15,000 to $24,999 | 177 | 8.0% |
| $25,000 to $34,999 | 75 | 3.4% |
| $35,000 to $49,999 | 263 | 11.9% |
| $50,000 to $74,999 | 270 | 12.2% |
| $75,000 to $99,999 | 498 | 22.5% |
| $100,000 to $149,999 | 686 | 31.0% |
| $150,000 to $199,999 | 66 | 3.0% |
| $200,000+ | 42 | 1.9% |
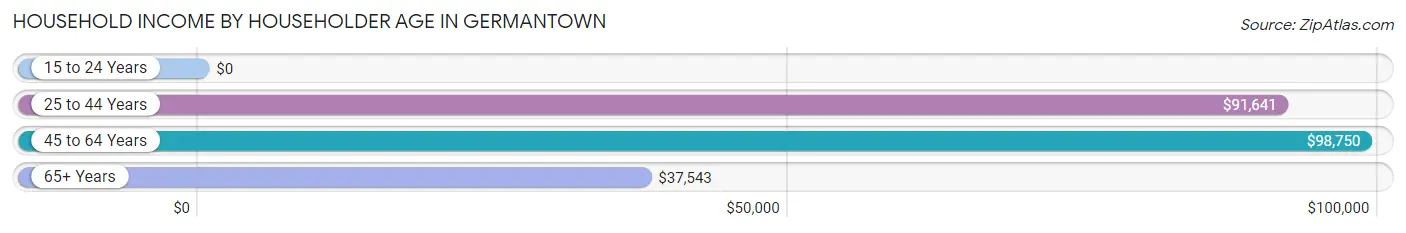
Household Income by Householder Age in Germantown
The median household income in Germantown is $86,524, with the highest median household income of $98,750 found in the 45 to 64 years age bracket for the primary householder. A total of 1,068 households (48.3%) fall into this category. Meanwhile, the 15 to 24 years age bracket for the primary householder has the lowest median household income of $0, with 22 households (1.0%) in this group.
| Income Bracket | # Households | Median Income |
| 15 to 24 Years | 22 (1.0%) | $0 |
| 25 to 44 Years | 465 (21.0%) | $91,641 |
| 45 to 64 Years | 1,068 (48.3%) | $98,750 |
| 65+ Years | 657 (29.7%) | $37,543 |
| Total | 2,212 (100.0%) | $86,524 |
Poverty in Germantown
Income Below Poverty by Sex and Age in Germantown
With 12.7% poverty level for males and 14.0% for females among the residents of Germantown, under 5 year old males and under 5 year old females are the most vulnerable to poverty, with 110 males (47.8%) and 118 females (57.0%) in their respective age groups living below the poverty level.
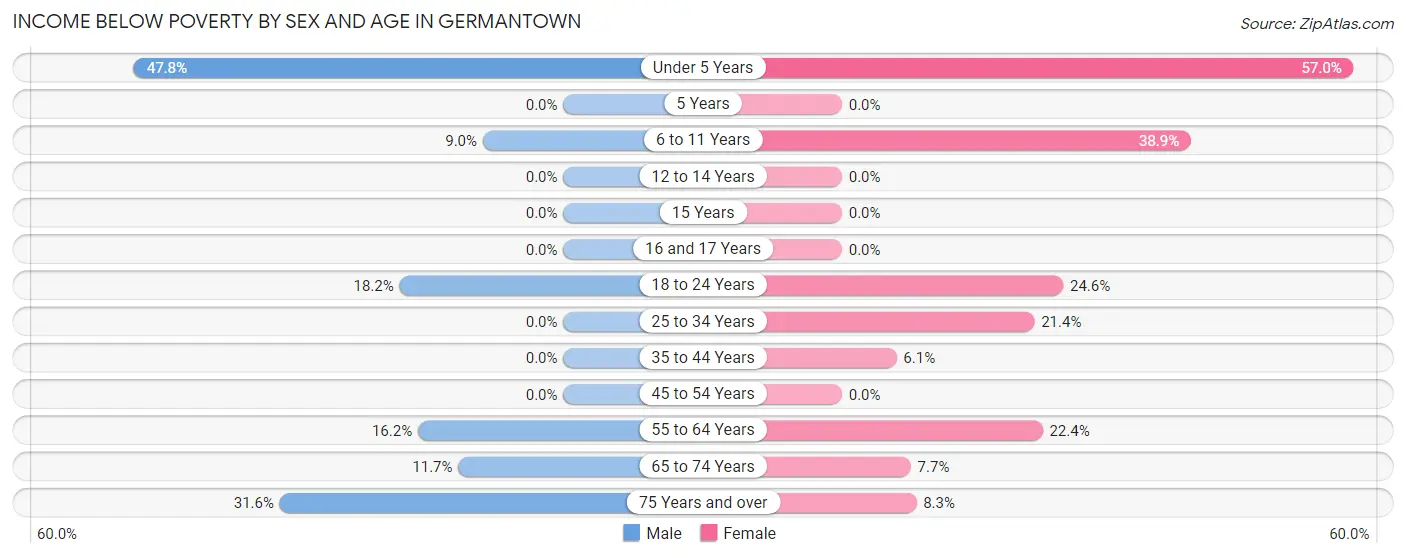
| Age Bracket | Male | Female |
| Under 5 Years | 110 (47.8%) | 118 (57.0%) |
| 5 Years | 0 (0.0%) | 0 (0.0%) |
| 6 to 11 Years | 24 (9.0%) | 35 (38.9%) |
| 12 to 14 Years | 0 (0.0%) | 0 (0.0%) |
| 15 Years | 0 (0.0%) | 0 (0.0%) |
| 16 and 17 Years | 0 (0.0%) | 0 (0.0%) |
| 18 to 24 Years | 60 (18.2%) | 85 (24.6%) |
| 25 to 34 Years | 0 (0.0%) | 51 (21.4%) |
| 35 to 44 Years | 0 (0.0%) | 11 (6.1%) |
| 45 to 54 Years | 0 (0.0%) | 0 (0.0%) |
| 55 to 64 Years | 73 (16.2%) | 76 (22.4%) |
| 65 to 74 Years | 27 (11.7%) | 31 (7.7%) |
| 75 Years and over | 48 (31.6%) | 17 (8.3%) |
| Total | 342 (12.7%) | 424 (14.0%) |
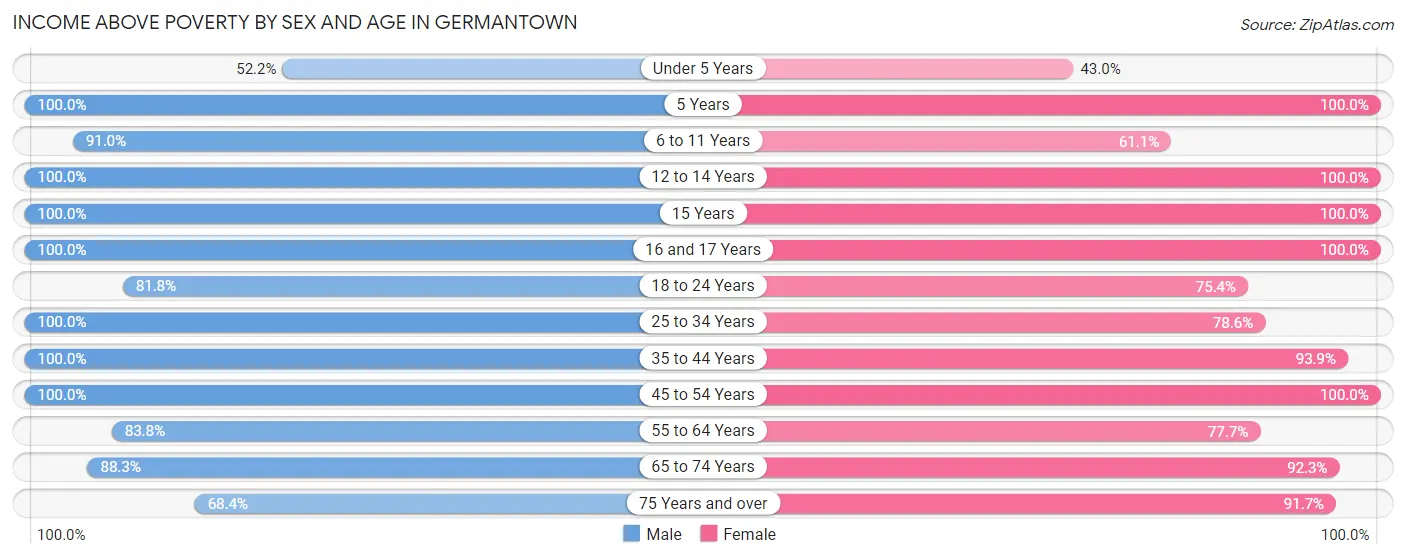
Income Above Poverty by Sex and Age in Germantown
According to the poverty statistics in Germantown, males aged 5 years and females aged 5 years are the age groups that are most secure financially, with 100.0% of males and 100.0% of females in these age groups living above the poverty line.
| Age Bracket | Male | Female |
| Under 5 Years | 120 (52.2%) | 89 (43.0%) |
| 5 Years | 15 (100.0%) | 52 (100.0%) |
| 6 to 11 Years | 244 (91.0%) | 55 (61.1%) |
| 12 to 14 Years | 62 (100.0%) | 13 (100.0%) |
| 15 Years | 75 (100.0%) | 161 (100.0%) |
| 16 and 17 Years | 42 (100.0%) | 191 (100.0%) |
| 18 to 24 Years | 269 (81.8%) | 260 (75.4%) |
| 25 to 34 Years | 184 (100.0%) | 187 (78.6%) |
| 35 to 44 Years | 266 (100.0%) | 170 (93.9%) |
| 45 to 54 Years | 385 (100.0%) | 601 (100.0%) |
| 55 to 64 Years | 378 (83.8%) | 264 (77.6%) |
| 65 to 74 Years | 204 (88.3%) | 373 (92.3%) |
| 75 Years and over | 104 (68.4%) | 188 (91.7%) |
| Total | 2,348 (87.3%) | 2,604 (86.0%) |
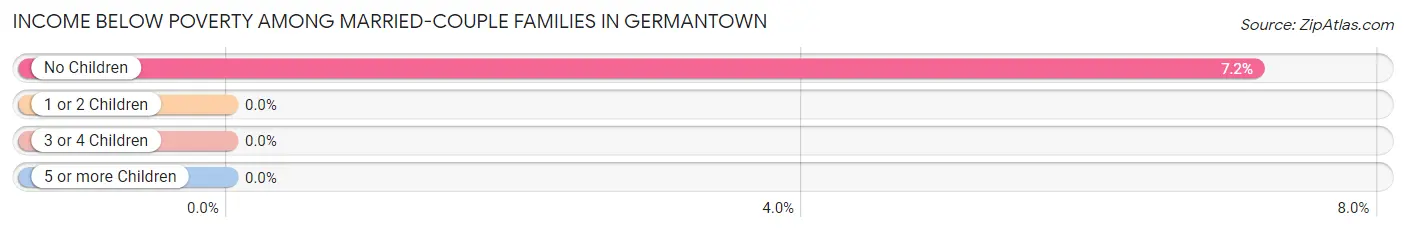
Income Below Poverty Among Married-Couple Families in Germantown
The poverty statistics for married-couple families in Germantown show that 4.5% or 50 of the total 1,102 families live below the poverty line. Families with no children have the highest poverty rate of 7.1%, comprising of 50 families. On the other hand, families with 1 or 2 children have the lowest poverty rate of 0.0%, which includes 0 families.
| Children | Above Poverty | Below Poverty |
| No Children | 649 (92.8%) | 50 (7.1%) |
| 1 or 2 Children | 310 (100.0%) | 0 (0.0%) |
| 3 or 4 Children | 93 (100.0%) | 0 (0.0%) |
| 5 or more Children | 0 (0.0%) | 0 (0.0%) |
| Total | 1,052 (95.5%) | 50 (4.5%) |
Income Below Poverty Among Single-Parent Households in Germantown
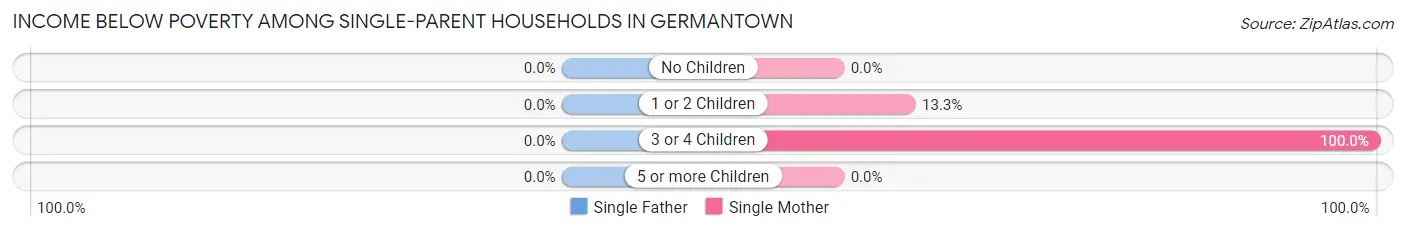
| Children | Single Father | Single Mother |
| No Children | 0 (0.0%) | 0 (0.0%) |
| 1 or 2 Children | 0 (0.0%) | 33 (13.3%) |
| 3 or 4 Children | 0 (0.0%) | 73 (100.0%) |
| 5 or more Children | 0 (0.0%) | 0 (0.0%) |
| Total | 0 (0.0%) | 106 (28.5%) |
Income Below Poverty Among Married-Couple vs Single-Parent Households in Germantown
The poverty data for Germantown shows that 50 of the married-couple family households (4.5%) and 106 of the single-parent households (22.8%) are living below the poverty level. Within the married-couple family households, those with no children have the highest poverty rate, with 50 households (7.1%) falling below the poverty line. Among the single-parent households, those with 3 or 4 children have the highest poverty rate, with 73 household (100.0%) living below poverty.
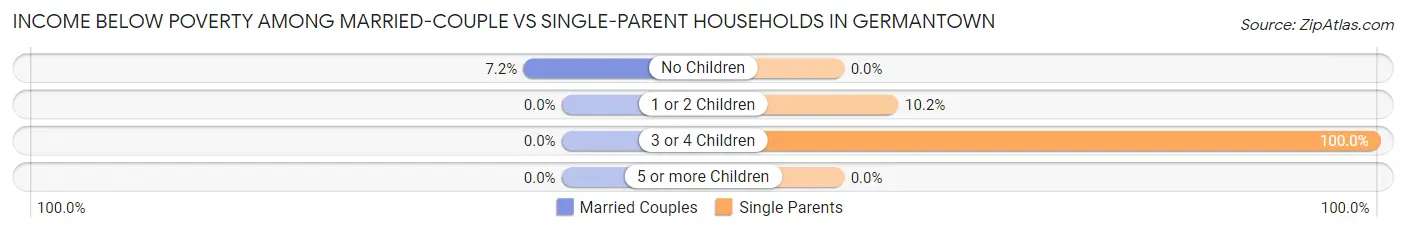
| Children | Married-Couple Families | Single-Parent Households |
| No Children | 50 (7.1%) | 0 (0.0%) |
| 1 or 2 Children | 0 (0.0%) | 33 (10.2%) |
| 3 or 4 Children | 0 (0.0%) | 73 (100.0%) |
| 5 or more Children | 0 (0.0%) | 0 (0.0%) |
| Total | 50 (4.5%) | 106 (22.8%) |
Race in Germantown
The most populous races in Germantown are White / Caucasian (5,539 | 95.8%), Two or more Races (220 | 3.8%), and Hispanic or Latino (103 | 1.8%).
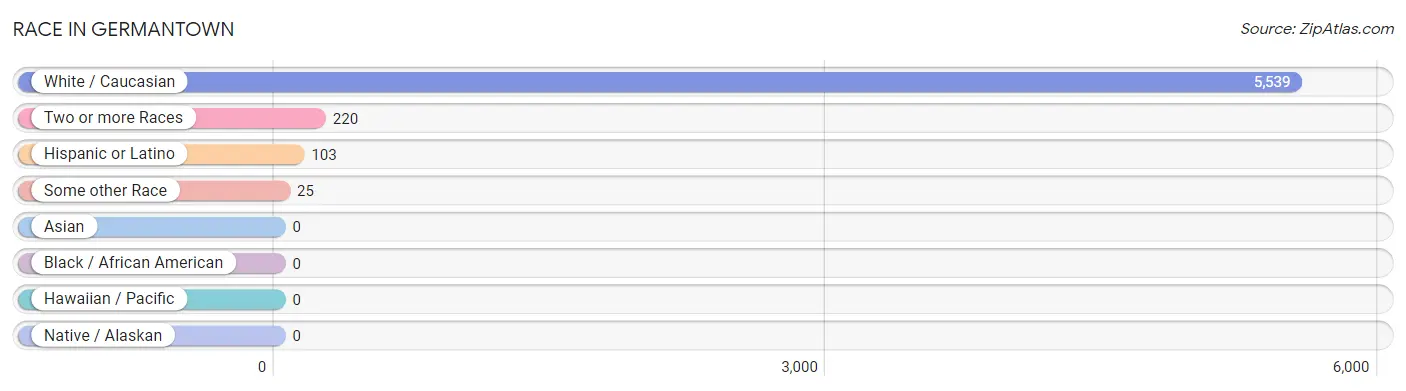
| Race | # Population | % Population |
| Asian | 0 | 0.0% |
| Black / African American | 0 | 0.0% |
| Hawaiian / Pacific | 0 | 0.0% |
| Hispanic or Latino | 103 | 1.8% |
| Native / Alaskan | 0 | 0.0% |
| White / Caucasian | 5,539 | 95.8% |
| Two or more Races | 220 | 3.8% |
| Some other Race | 25 | 0.4% |
| Total | 5,784 | 100.0% |
Ancestry in Germantown
The most populous ancestries reported in Germantown are German (1,994 | 34.5%), English (1,113 | 19.2%), Irish (644 | 11.1%), American (465 | 8.0%), and Scottish (244 | 4.2%), together accounting for 77.1% of all Germantown residents.
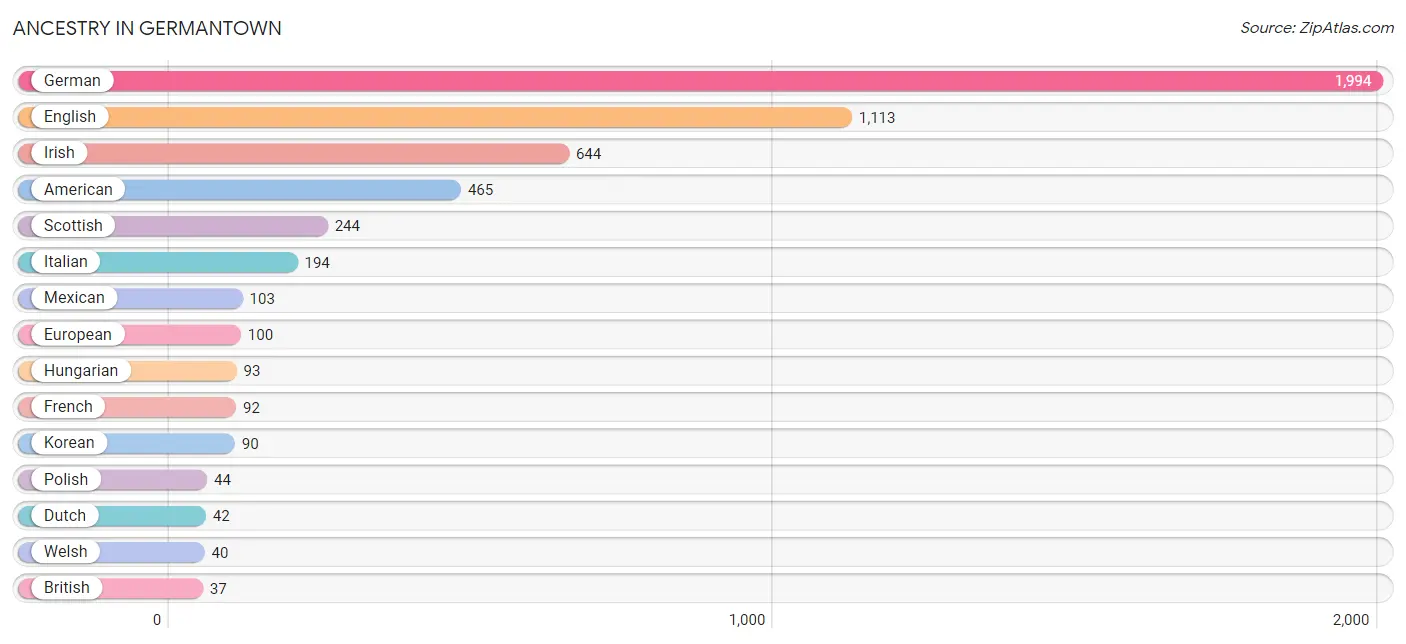
| Ancestry | # Population | % Population |
| American | 465 | 8.0% |
| Austrian | 12 | 0.2% |
| British | 37 | 0.6% |
| Danish | 19 | 0.3% |
| Dutch | 42 | 0.7% |
| English | 1,113 | 19.2% |
| European | 100 | 1.7% |
| French | 92 | 1.6% |
| German | 1,994 | 34.5% |
| Greek | 9 | 0.2% |
| Hungarian | 93 | 1.6% |
| Irish | 644 | 11.1% |
| Italian | 194 | 3.4% |
| Korean | 90 | 1.6% |
| Mexican | 103 | 1.8% |
| Polish | 44 | 0.8% |
| Scotch-Irish | 17 | 0.3% |
| Scottish | 244 | 4.2% |
| Swedish | 16 | 0.3% |
| Swiss | 20 | 0.4% |
| Welsh | 40 | 0.7% | View All 21 Rows |
Immigrants in Germantown
The most numerous immigrant groups reported in Germantown came from Europe (9 | 0.2%), Greece (9 | 0.2%), and Southern Europe (9 | 0.2%), together accounting for 0.5% of all Germantown residents.
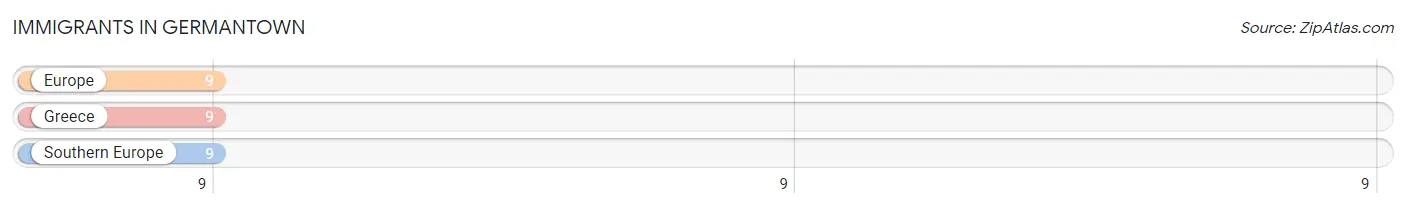
| Immigration Origin | # Population | % Population |
| Europe | 9 | 0.2% |
| Greece | 9 | 0.2% |
| Southern Europe | 9 | 0.2% | View All 3 Rows |
Sex and Age in Germantown
Sex and Age in Germantown
The most populous age groups in Germantown are 45 to 49 Years (303 | 11.2%) for men and 15 to 19 Years (531 | 17.3%) for women.
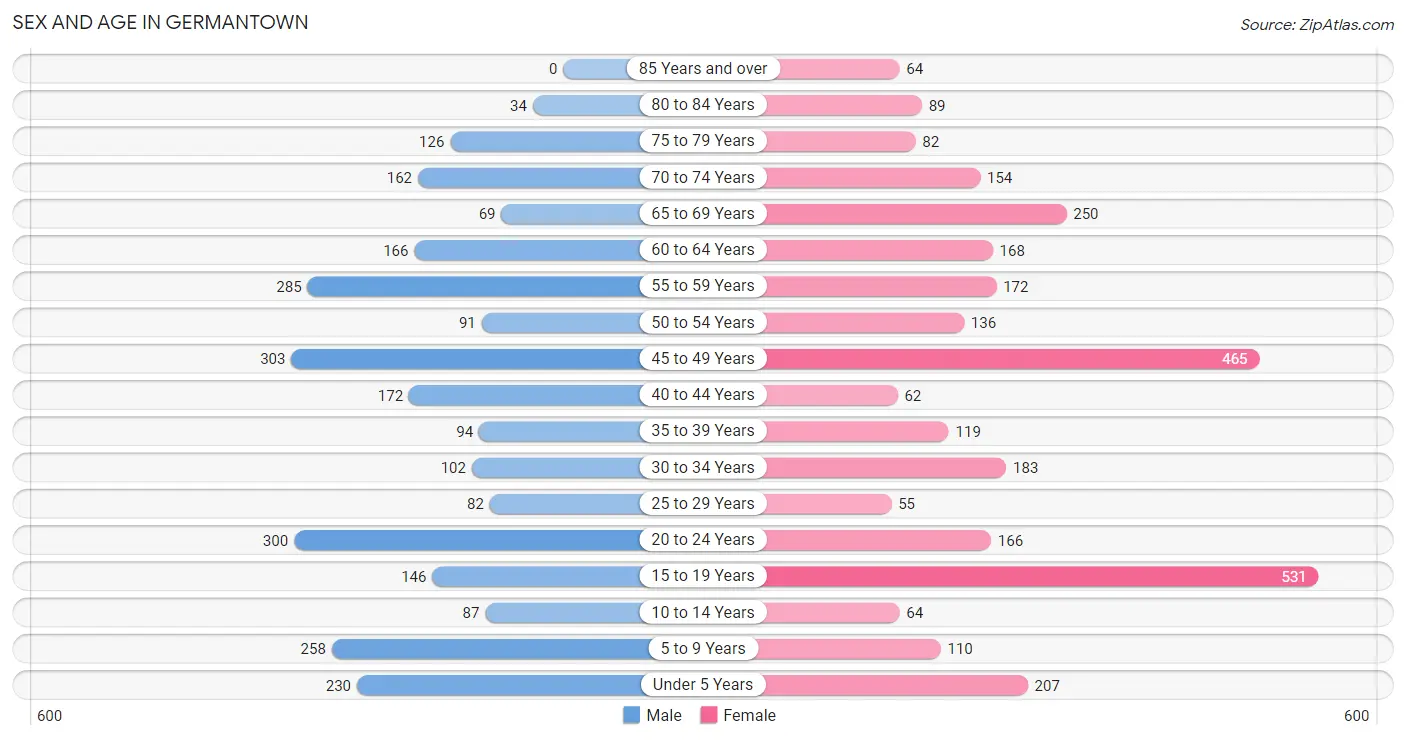
| Age Bracket | Male | Female |
| Under 5 Years | 230 (8.5%) | 207 (6.7%) |
| 5 to 9 Years | 258 (9.5%) | 110 (3.6%) |
| 10 to 14 Years | 87 (3.2%) | 64 (2.1%) |
| 15 to 19 Years | 146 (5.4%) | 531 (17.3%) |
| 20 to 24 Years | 300 (11.1%) | 166 (5.4%) |
| 25 to 29 Years | 82 (3.0%) | 55 (1.8%) |
| 30 to 34 Years | 102 (3.8%) | 183 (5.9%) |
| 35 to 39 Years | 94 (3.5%) | 119 (3.9%) |
| 40 to 44 Years | 172 (6.4%) | 62 (2.0%) |
| 45 to 49 Years | 303 (11.2%) | 465 (15.1%) |
| 50 to 54 Years | 91 (3.4%) | 136 (4.4%) |
| 55 to 59 Years | 285 (10.5%) | 172 (5.6%) |
| 60 to 64 Years | 166 (6.1%) | 168 (5.5%) |
| 65 to 69 Years | 69 (2.5%) | 250 (8.1%) |
| 70 to 74 Years | 162 (6.0%) | 154 (5.0%) |
| 75 to 79 Years | 126 (4.6%) | 82 (2.7%) |
| 80 to 84 Years | 34 (1.3%) | 89 (2.9%) |
| 85 Years and over | 0 (0.0%) | 64 (2.1%) |
| Total | 2,707 (100.0%) | 3,077 (100.0%) |
Families and Households in Germantown
Median Family Size in Germantown
The median family size in Germantown is 3.08 persons per family, with single female/mother families (372 | 23.7%) accounting for the largest median family size of 3.27 persons per family. On the other hand, single male/father families (92 | 5.9%) represent the smallest median family size with 2.43 persons per family.
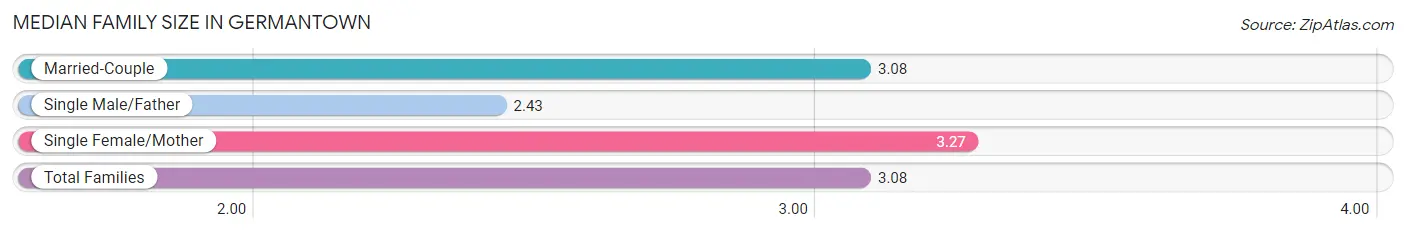
| Family Type | # Families | Family Size |
| Married-Couple | 1,102 (70.4%) | 3.08 |
| Single Male/Father | 92 (5.9%) | 2.43 |
| Single Female/Mother | 372 (23.7%) | 3.27 |
| Total Families | 1,566 (100.0%) | 3.08 |
Median Household Size in Germantown
The median household size in Germantown is 2.59 persons per household, with single female/mother households (372 | 16.8%) accounting for the largest median household size of 3.63 persons per household. non-family households (646 | 29.2%) represent the smallest median household size with 1.14 persons per household.
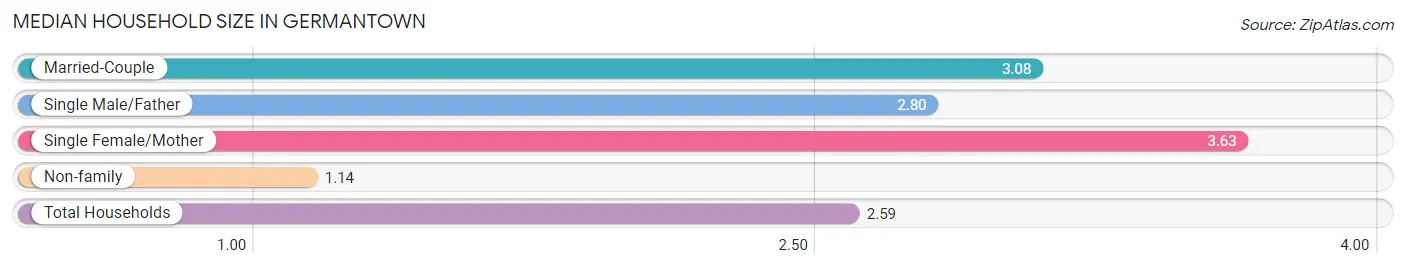
| Household Type | # Households | Household Size |
| Married-Couple | 1,102 (49.8%) | 3.08 |
| Single Male/Father | 92 (4.2%) | 2.80 |
| Single Female/Mother | 372 (16.8%) | 3.63 |
| Non-family | 646 (29.2%) | 1.14 |
| Total Households | 2,212 (100.0%) | 2.59 |
Household Size by Marriage Status in Germantown
Out of a total of 2,212 households in Germantown, 1,566 (70.8%) are family households, while 646 (29.2%) are nonfamily households. The most numerous type of family households are 2-person households, comprising 686, and the most common type of nonfamily households are 1-person households, comprising 558.
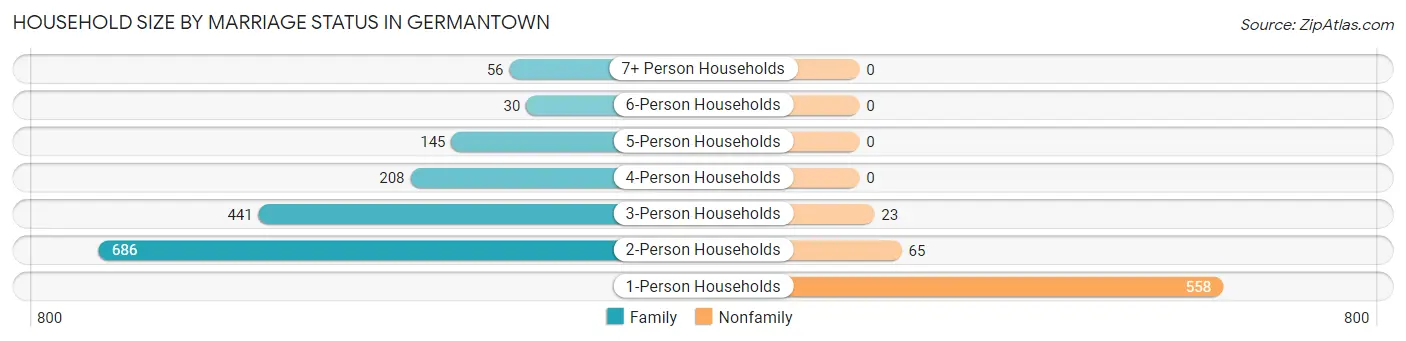
| Household Size | Family Households | Nonfamily Households |
| 1-Person Households | - | 558 (25.2%) |
| 2-Person Households | 686 (31.0%) | 65 (2.9%) |
| 3-Person Households | 441 (19.9%) | 23 (1.0%) |
| 4-Person Households | 208 (9.4%) | 0 (0.0%) |
| 5-Person Households | 145 (6.6%) | 0 (0.0%) |
| 6-Person Households | 30 (1.4%) | 0 (0.0%) |
| 7+ Person Households | 56 (2.5%) | 0 (0.0%) |
| Total | 1,566 (70.8%) | 646 (29.2%) |
Female Fertility in Germantown
Fertility by Age in Germantown
Average fertility rate in Germantown is 79.0 births per 1,000 women. Women in the age bracket of 20 to 34 years have the highest fertility rate with 317.0 births per 1,000 women. Women in the age bracket of 20 to 34 years acount for 100.0% of all women with births.
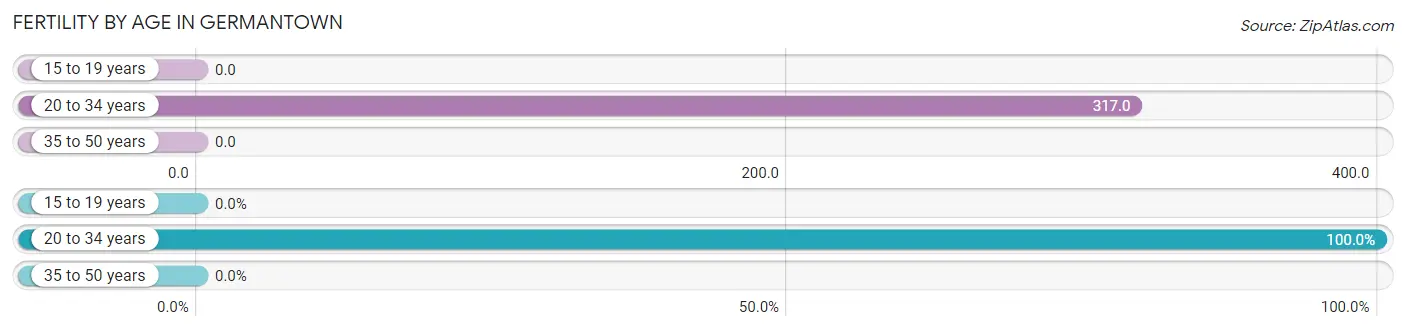
| Age Bracket | Women with Births | Births / 1,000 Women |
| 15 to 19 years | 0 (0.0%) | 0.0 |
| 20 to 34 years | 128 (100.0%) | 317.0 |
| 35 to 50 years | 0 (0.0%) | 0.0 |
| Total | 128 (100.0%) | 79.0 |
Fertility by Age by Marriage Status in Germantown
33.6% of women with births (128) in Germantown are married. The highest percentage of unmarried women with births falls into 20 to 34 years age bracket with 66.4% of them unmarried at the time of birth, while the lowest percentage of unmarried women with births belong to 20 to 34 years age bracket with 66.4% of them unmarried.
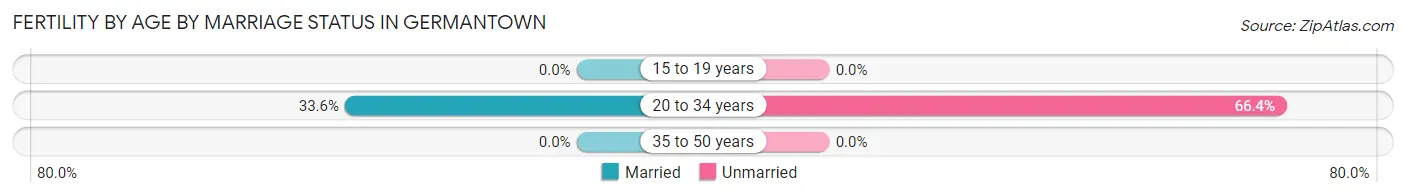
| Age Bracket | Married | Unmarried |
| 15 to 19 years | 0 (0.0%) | 0 (0.0%) |
| 20 to 34 years | 43 (33.6%) | 85 (66.4%) |
| 35 to 50 years | 0 (0.0%) | 0 (0.0%) |
| Total | 43 (33.6%) | 85 (66.4%) |
Fertility by Education in Germantown
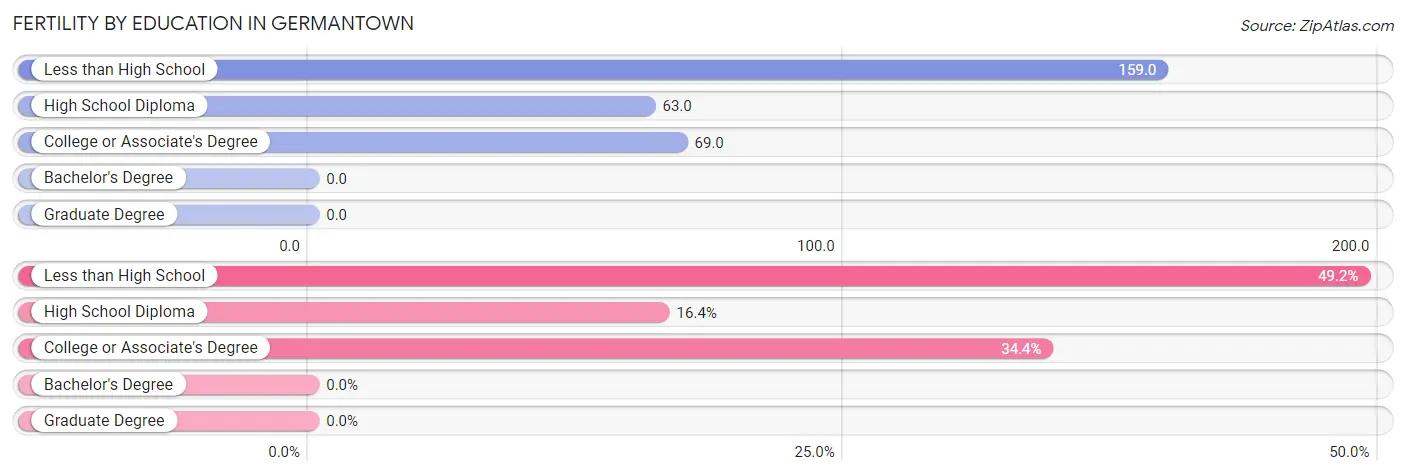
| Educational Attainment | Women with Births | Births / 1,000 Women |
| Less than High School | 63 (49.2%) | 159.0 |
| High School Diploma | 21 (16.4%) | 63.0 |
| College or Associate's Degree | 44 (34.4%) | 69.0 |
| Bachelor's Degree | 0 (0.0%) | 0.0 |
| Graduate Degree | 0 (0.0%) | 0.0 |
| Total | 128 (100.0%) | 79.0 |
Fertility by Education by Marriage Status in Germantown
66.4% of women with births in Germantown are unmarried. Women with the educational attainment of high school diploma are most likely to be married with 100.0% of them married at childbirth, while women with the educational attainment of less than high school are least likely to be married with 100.0% of them unmarried at childbirth.
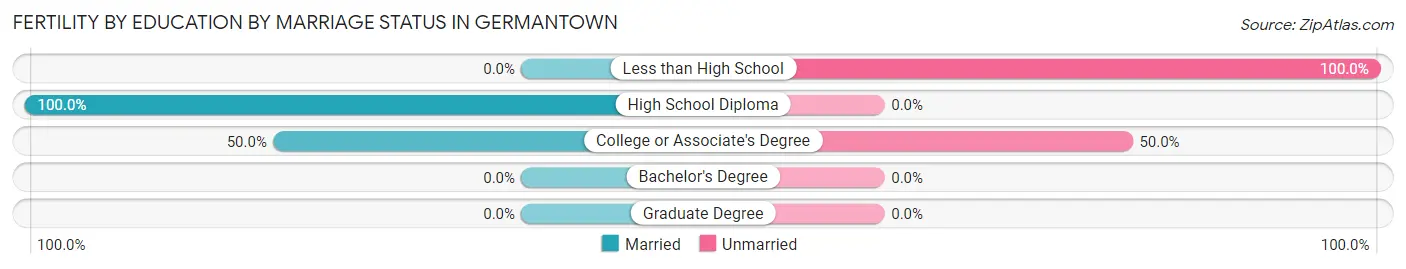
| Educational Attainment | Married | Unmarried |
| Less than High School | 0 (0.0%) | 63 (100.0%) |
| High School Diploma | 21 (100.0%) | 0 (0.0%) |
| College or Associate's Degree | 22 (50.0%) | 22 (50.0%) |
| Bachelor's Degree | 0 (0.0%) | 0 (0.0%) |
| Graduate Degree | 0 (0.0%) | 0 (0.0%) |
| Total | 43 (33.6%) | 85 (66.4%) |
Employment Characteristics in Germantown
Employment by Class of Employer in Germantown
Among the 2,649 employed individuals in Germantown, private company employees (2,002 | 75.6%), not-for-profit organizations (275 | 10.4%), and local government employees (240 | 9.1%) make up the most common classes of employment.
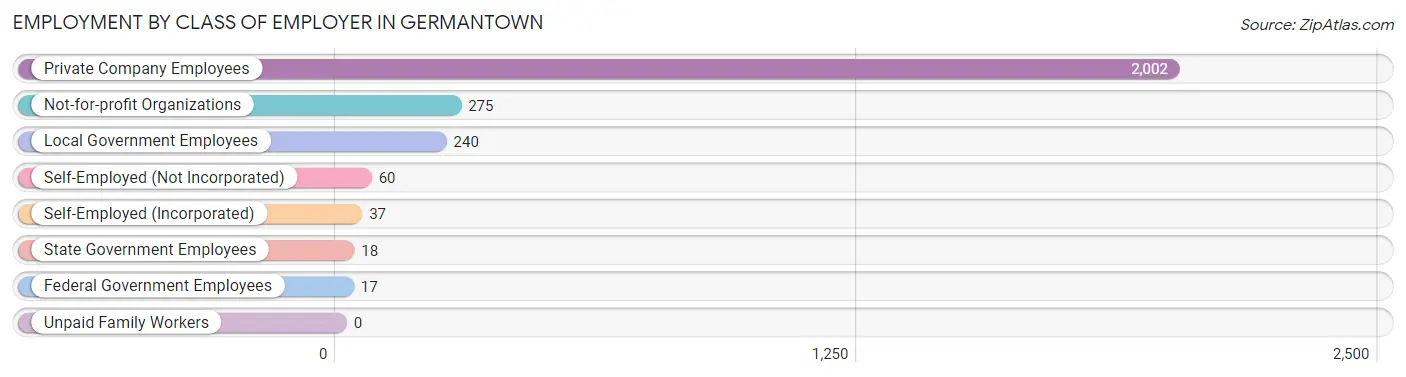
| Employer Class | # Employees | % Employees |
| Private Company Employees | 2,002 | 75.6% |
| Self-Employed (Incorporated) | 37 | 1.4% |
| Self-Employed (Not Incorporated) | 60 | 2.3% |
| Not-for-profit Organizations | 275 | 10.4% |
| Local Government Employees | 240 | 9.1% |
| State Government Employees | 18 | 0.7% |
| Federal Government Employees | 17 | 0.6% |
| Unpaid Family Workers | 0 | 0.0% |
| Total | 2,649 | 100.0% |
Employment Status by Age in Germantown
According to the labor force statistics for Germantown, out of the total population over 16 years of age (4,592), 66.1% or 3,035 individuals are in the labor force, with 6.6% or 200 of them unemployed. The age group with the highest labor force participation rate is 35 to 44 years, with 97.3% or 435 individuals in the labor force. Within the labor force, the 16 to 19 years age range has the highest percentage of unemployed individuals, with 58.1% or 179 of them being unemployed.
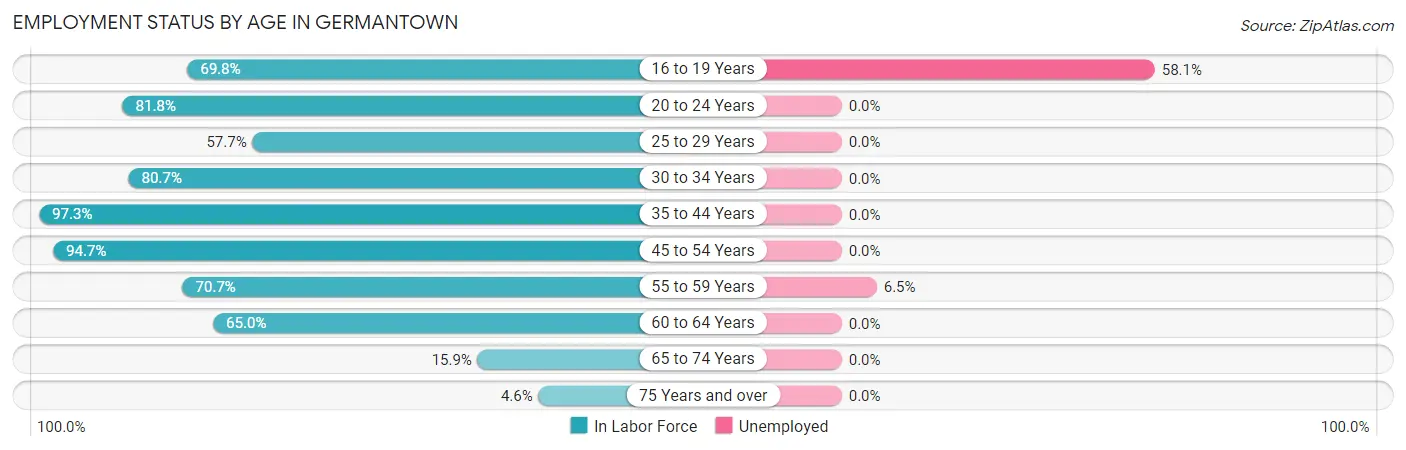
| Age Bracket | In Labor Force | Unemployed |
| 16 to 19 Years | 308 (69.8%) | 179 (58.1%) |
| 20 to 24 Years | 381 (81.8%) | 0 (0.0%) |
| 25 to 29 Years | 79 (57.7%) | 0 (0.0%) |
| 30 to 34 Years | 230 (80.7%) | 0 (0.0%) |
| 35 to 44 Years | 435 (97.3%) | 0 (0.0%) |
| 45 to 54 Years | 942 (94.7%) | 0 (0.0%) |
| 55 to 59 Years | 323 (70.7%) | 21 (6.5%) |
| 60 to 64 Years | 217 (65.0%) | 0 (0.0%) |
| 65 to 74 Years | 101 (15.9%) | 0 (0.0%) |
| 75 Years and over | 18 (4.6%) | 0 (0.0%) |
| Total | 3,035 (66.1%) | 200 (6.6%) |
Employment Status by Educational Attainment in Germantown
According to labor force statistics for Germantown, 83.8% of individuals (2,225) out of the total population between 25 and 64 years of age (2,655) are in the labor force, with 0.9% or 20 of them being unemployed. The group with the highest labor force participation rate are those with the educational attainment of college / associate degree, with 97.2% or 803 individuals in the labor force. Within the labor force, individuals with college / associate degree education have the highest percentage of unemployment, with 2.6% or 21 of them being unemployed.
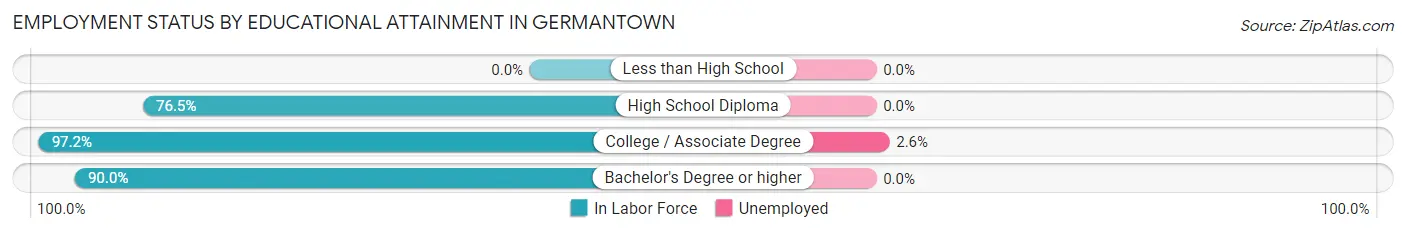
| Educational Attainment | In Labor Force | Unemployed |
| Less than High School | 0 (0.0%) | 0 (0.0%) |
| High School Diploma | 877 (76.5%) | 0 (0.0%) |
| College / Associate Degree | 803 (97.2%) | 21 (2.6%) |
| Bachelor's Degree or higher | 546 (90.0%) | 0 (0.0%) |
| Total | 2,225 (83.8%) | 24 (0.9%) |
Employment Occupations by Sex in Germantown
Management, Business, Science and Arts Occupations
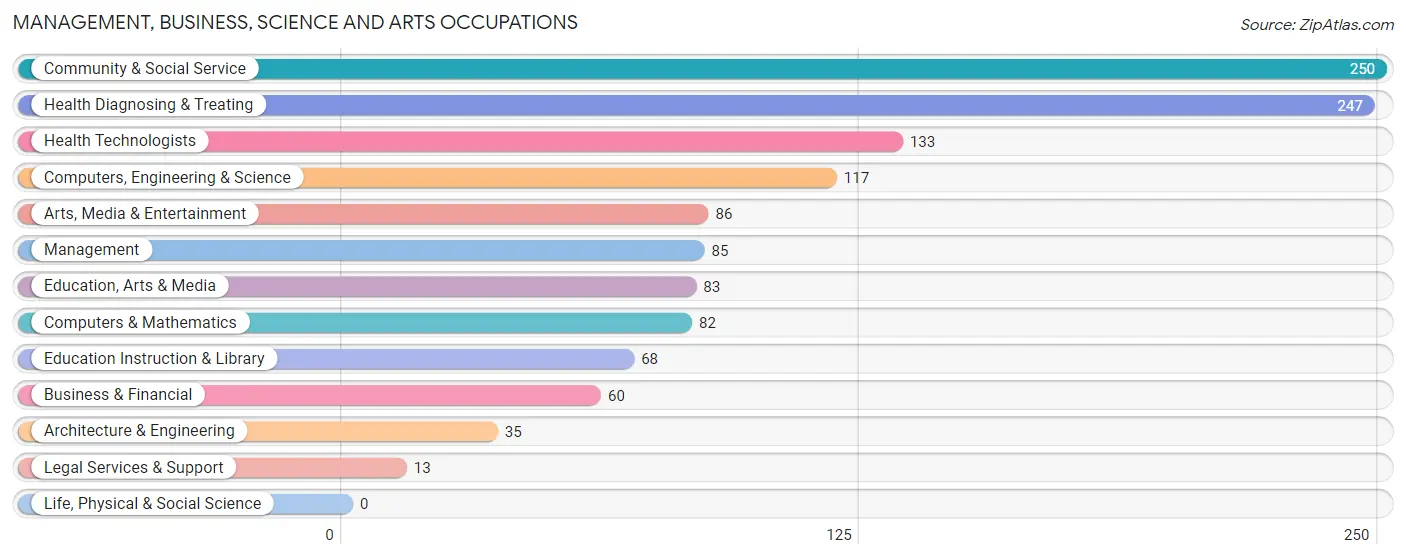
The most common Management, Business, Science and Arts occupations in Germantown are Community & Social Service (250 | 8.8%), Health Diagnosing & Treating (247 | 8.7%), Health Technologists (133 | 4.7%), Computers, Engineering & Science (117 | 4.1%), and Arts, Media & Entertainment (86 | 3.0%).
Management, Business, Science and Arts Occupations by Sex
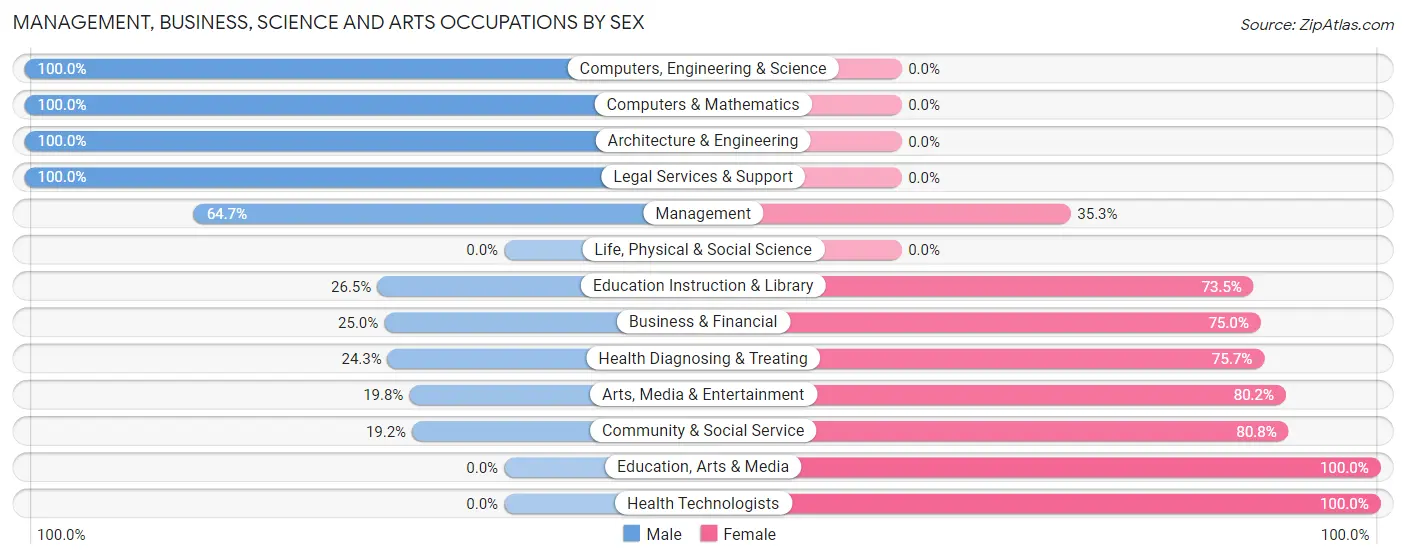
Within the Management, Business, Science and Arts occupations in Germantown, the most male-oriented occupations are Computers, Engineering & Science (100.0%), Computers & Mathematics (100.0%), and Architecture & Engineering (100.0%), while the most female-oriented occupations are Education, Arts & Media (100.0%), Health Technologists (100.0%), and Community & Social Service (80.8%).
| Occupation | Male | Female |
| Management | 55 (64.7%) | 30 (35.3%) |
| Business & Financial | 15 (25.0%) | 45 (75.0%) |
| Computers, Engineering & Science | 117 (100.0%) | 0 (0.0%) |
| Computers & Mathematics | 82 (100.0%) | 0 (0.0%) |
| Architecture & Engineering | 35 (100.0%) | 0 (0.0%) |
| Life, Physical & Social Science | 0 (0.0%) | 0 (0.0%) |
| Community & Social Service | 48 (19.2%) | 202 (80.8%) |
| Education, Arts & Media | 0 (0.0%) | 83 (100.0%) |
| Legal Services & Support | 13 (100.0%) | 0 (0.0%) |
| Education Instruction & Library | 18 (26.5%) | 50 (73.5%) |
| Arts, Media & Entertainment | 17 (19.8%) | 69 (80.2%) |
| Health Diagnosing & Treating | 60 (24.3%) | 187 (75.7%) |
| Health Technologists | 0 (0.0%) | 133 (100.0%) |
| Total (Category) | 295 (38.9%) | 464 (61.1%) |
| Total (Overall) | 1,433 (50.6%) | 1,401 (49.4%) |
Services Occupations
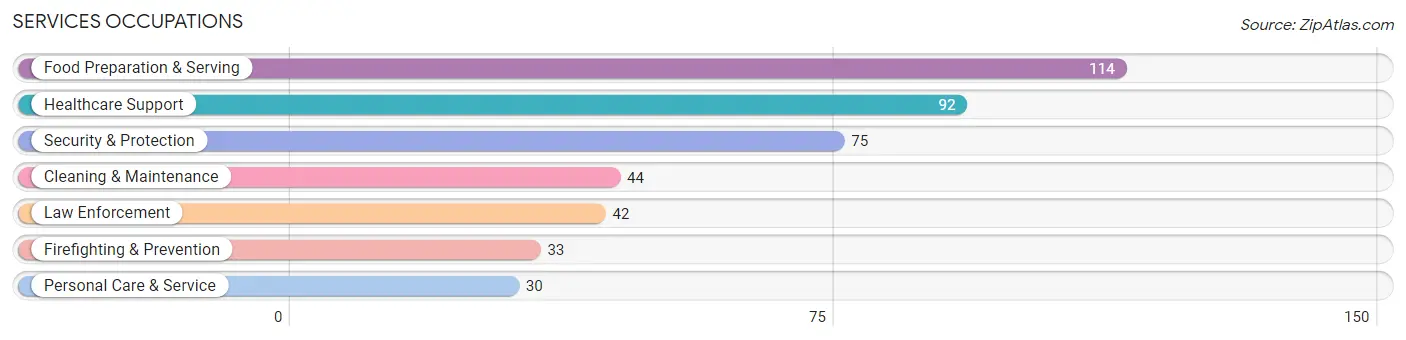
The most common Services occupations in Germantown are Food Preparation & Serving (114 | 4.0%), Healthcare Support (92 | 3.3%), Security & Protection (75 | 2.6%), Cleaning & Maintenance (44 | 1.5%), and Law Enforcement (42 | 1.5%).
Services Occupations by Sex
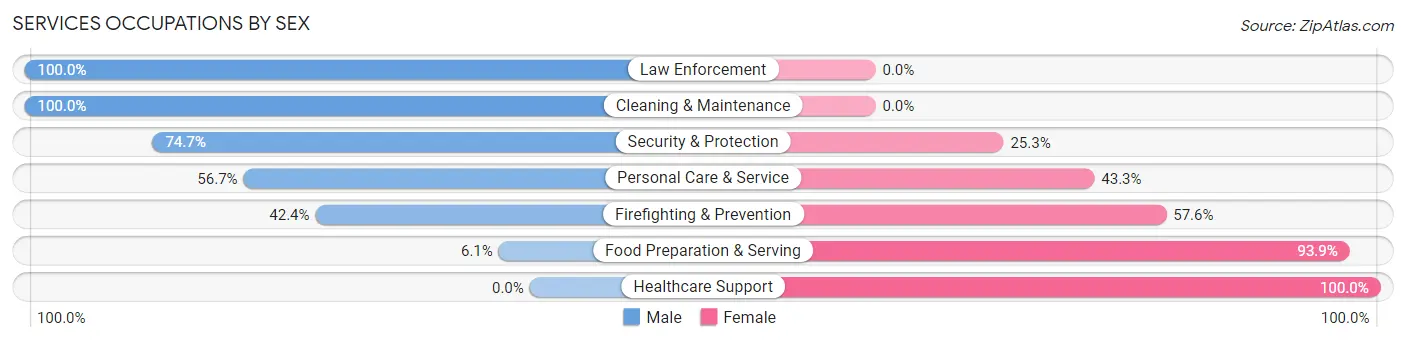
Within the Services occupations in Germantown, the most male-oriented occupations are Law Enforcement (100.0%), Cleaning & Maintenance (100.0%), and Security & Protection (74.7%), while the most female-oriented occupations are Healthcare Support (100.0%), Food Preparation & Serving (93.9%), and Firefighting & Prevention (57.6%).
| Occupation | Male | Female |
| Healthcare Support | 0 (0.0%) | 92 (100.0%) |
| Security & Protection | 56 (74.7%) | 19 (25.3%) |
| Firefighting & Prevention | 14 (42.4%) | 19 (57.6%) |
| Law Enforcement | 42 (100.0%) | 0 (0.0%) |
| Food Preparation & Serving | 7 (6.1%) | 107 (93.9%) |
| Cleaning & Maintenance | 44 (100.0%) | 0 (0.0%) |
| Personal Care & Service | 17 (56.7%) | 13 (43.3%) |
| Total (Category) | 124 (34.9%) | 231 (65.1%) |
| Total (Overall) | 1,433 (50.6%) | 1,401 (49.4%) |
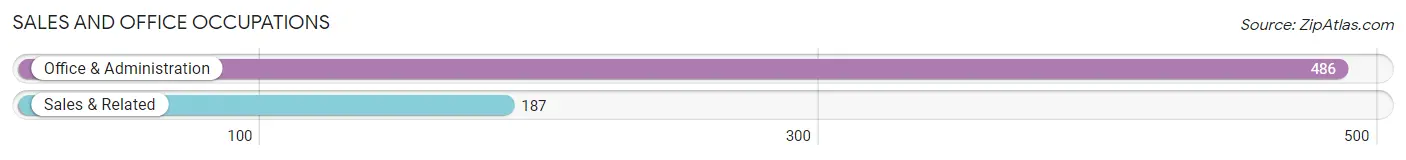
Sales and Office Occupations
The most common Sales and Office occupations in Germantown are Office & Administration (486 | 17.2%), and Sales & Related (187 | 6.6%).
Sales and Office Occupations by Sex
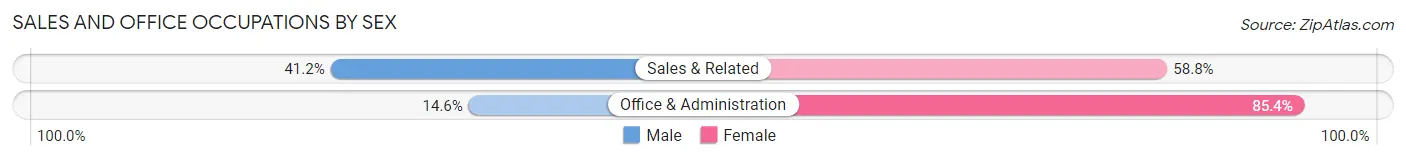
| Occupation | Male | Female |
| Sales & Related | 77 (41.2%) | 110 (58.8%) |
| Office & Administration | 71 (14.6%) | 415 (85.4%) |
| Total (Category) | 148 (22.0%) | 525 (78.0%) |
| Total (Overall) | 1,433 (50.6%) | 1,401 (49.4%) |
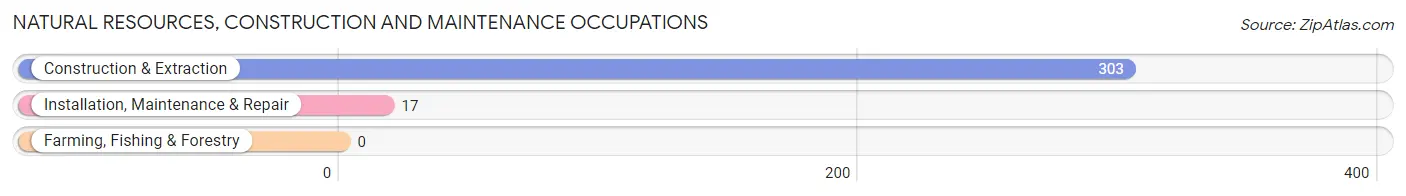
Natural Resources, Construction and Maintenance Occupations
The most common Natural Resources, Construction and Maintenance occupations in Germantown are Construction & Extraction (303 | 10.7%), and Installation, Maintenance & Repair (17 | 0.6%).
Natural Resources, Construction and Maintenance Occupations by Sex
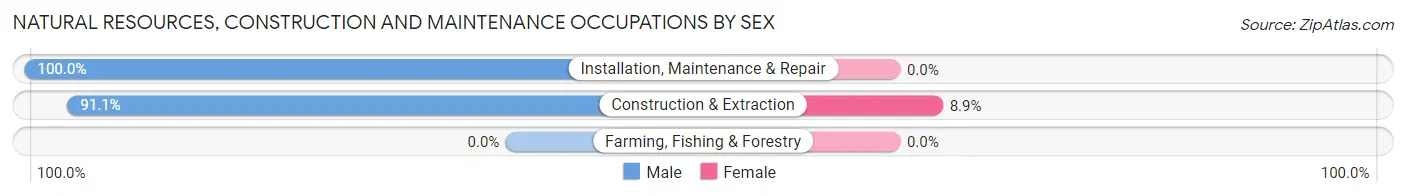
| Occupation | Male | Female |
| Farming, Fishing & Forestry | 0 (0.0%) | 0 (0.0%) |
| Construction & Extraction | 276 (91.1%) | 27 (8.9%) |
| Installation, Maintenance & Repair | 17 (100.0%) | 0 (0.0%) |
| Total (Category) | 293 (91.6%) | 27 (8.4%) |
| Total (Overall) | 1,433 (50.6%) | 1,401 (49.4%) |
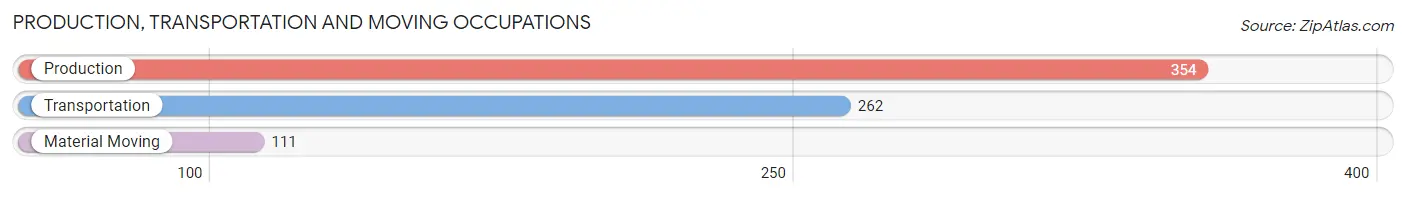
Production, Transportation and Moving Occupations
The most common Production, Transportation and Moving occupations in Germantown are Production (354 | 12.5%), Transportation (262 | 9.2%), and Material Moving (111 | 3.9%).
Production, Transportation and Moving Occupations by Sex
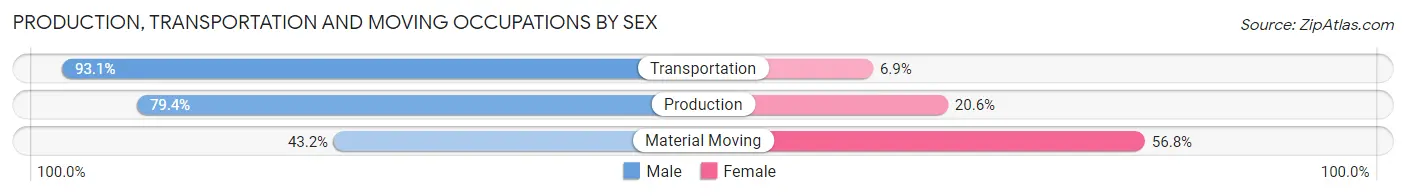
| Occupation | Male | Female |
| Production | 281 (79.4%) | 73 (20.6%) |
| Transportation | 244 (93.1%) | 18 (6.9%) |
| Material Moving | 48 (43.2%) | 63 (56.8%) |
| Total (Category) | 573 (78.8%) | 154 (21.2%) |
| Total (Overall) | 1,433 (50.6%) | 1,401 (49.4%) |
Employment Industries by Sex in Germantown
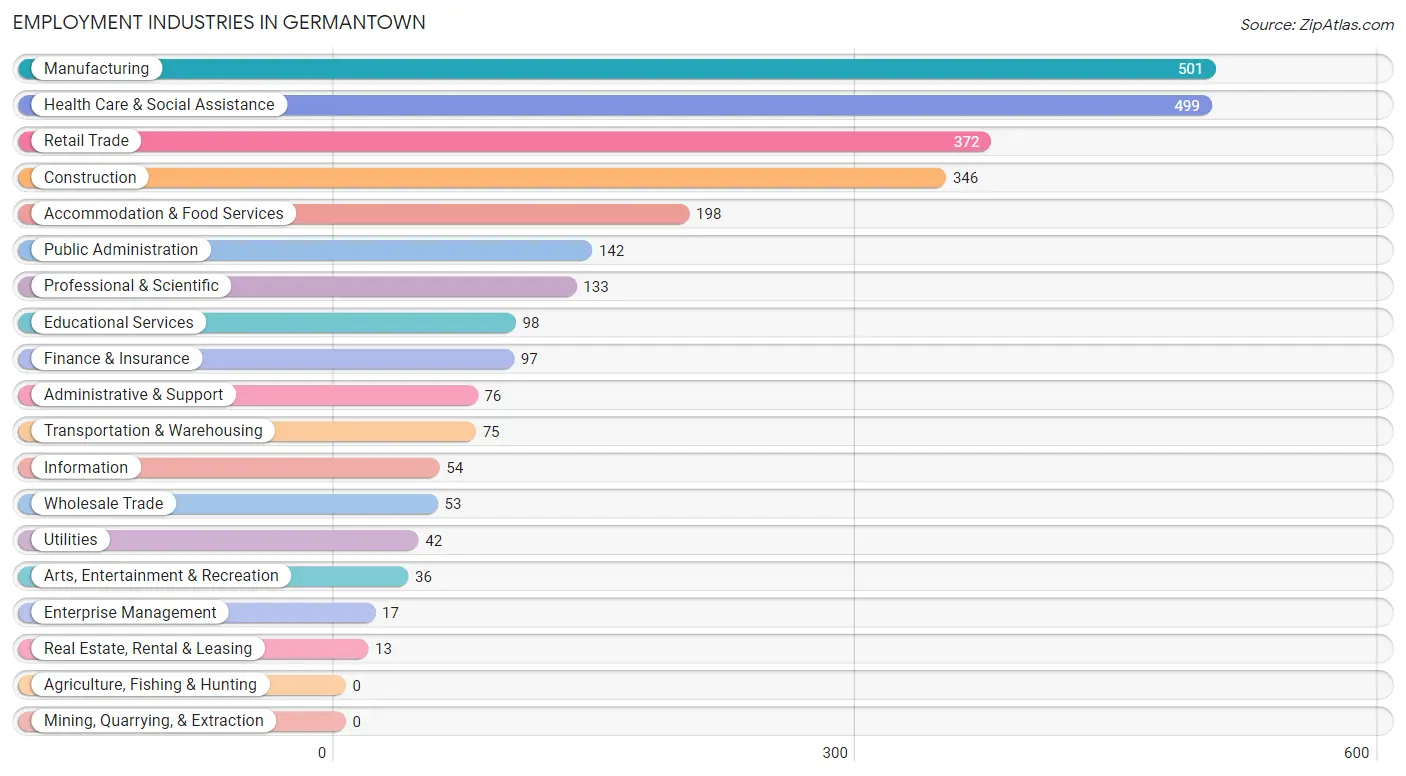
Employment Industries in Germantown
The major employment industries in Germantown include Manufacturing (501 | 17.7%), Health Care & Social Assistance (499 | 17.6%), Retail Trade (372 | 13.1%), Construction (346 | 12.2%), and Accommodation & Food Services (198 | 7.0%).
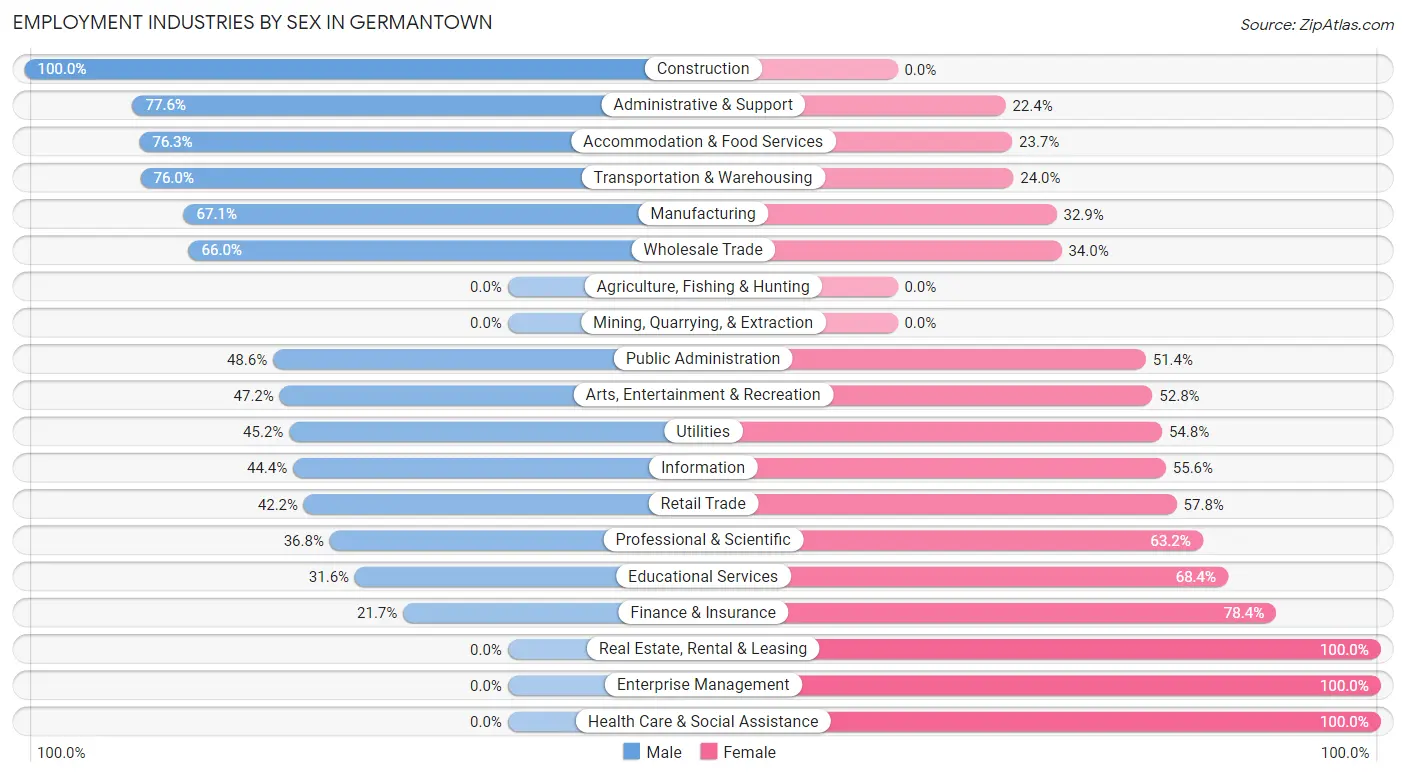
Employment Industries by Sex in Germantown
The Germantown industries that see more men than women are Construction (100.0%), Administrative & Support (77.6%), and Accommodation & Food Services (76.3%), whereas the industries that tend to have a higher number of women are Real Estate, Rental & Leasing (100.0%), Enterprise Management (100.0%), and Health Care & Social Assistance (100.0%).
| Industry | Male | Female |
| Agriculture, Fishing & Hunting | 0 (0.0%) | 0 (0.0%) |
| Mining, Quarrying, & Extraction | 0 (0.0%) | 0 (0.0%) |
| Construction | 346 (100.0%) | 0 (0.0%) |
| Manufacturing | 336 (67.1%) | 165 (32.9%) |
| Wholesale Trade | 35 (66.0%) | 18 (34.0%) |
| Retail Trade | 157 (42.2%) | 215 (57.8%) |
| Transportation & Warehousing | 57 (76.0%) | 18 (24.0%) |
| Utilities | 19 (45.2%) | 23 (54.8%) |
| Information | 24 (44.4%) | 30 (55.6%) |
| Finance & Insurance | 21 (21.6%) | 76 (78.3%) |
| Real Estate, Rental & Leasing | 0 (0.0%) | 13 (100.0%) |
| Professional & Scientific | 49 (36.8%) | 84 (63.2%) |
| Enterprise Management | 0 (0.0%) | 17 (100.0%) |
| Administrative & Support | 59 (77.6%) | 17 (22.4%) |
| Educational Services | 31 (31.6%) | 67 (68.4%) |
| Health Care & Social Assistance | 0 (0.0%) | 499 (100.0%) |
| Arts, Entertainment & Recreation | 17 (47.2%) | 19 (52.8%) |
| Accommodation & Food Services | 151 (76.3%) | 47 (23.7%) |
| Public Administration | 69 (48.6%) | 73 (51.4%) |
| Total | 1,433 (50.6%) | 1,401 (49.4%) |
Education in Germantown
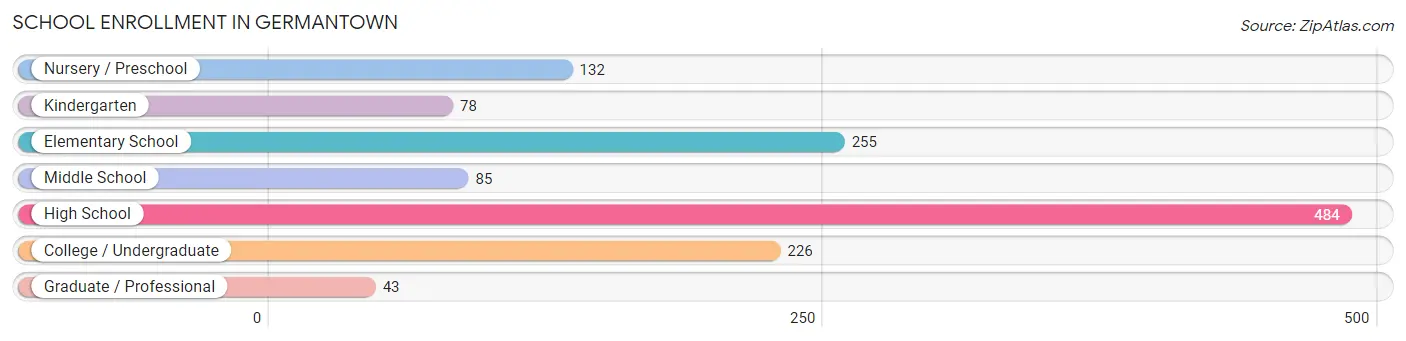
School Enrollment in Germantown
The most common levels of schooling among the 1,303 students in Germantown are high school (484 | 37.1%), elementary school (255 | 19.6%), and college / undergraduate (226 | 17.3%).
| School Level | # Students | % Students |
| Nursery / Preschool | 132 | 10.1% |
| Kindergarten | 78 | 6.0% |
| Elementary School | 255 | 19.6% |
| Middle School | 85 | 6.5% |
| High School | 484 | 37.1% |
| College / Undergraduate | 226 | 17.3% |
| Graduate / Professional | 43 | 3.3% |
| Total | 1,303 | 100.0% |
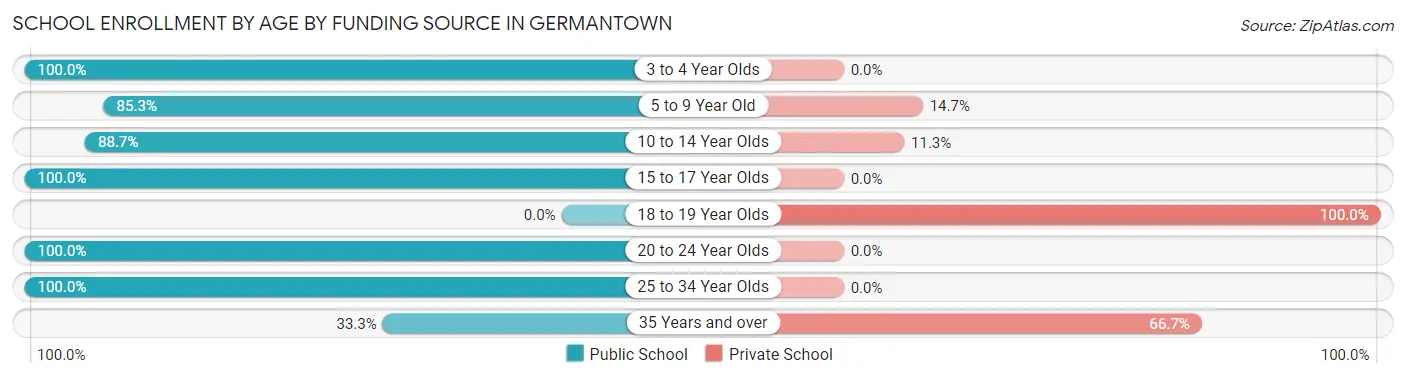
School Enrollment by Age by Funding Source in Germantown
Out of a total of 1,303 students who are enrolled in schools in Germantown, 275 (21.1%) attend a private institution, while the remaining 1,028 (78.9%) are enrolled in public schools. The age group of 18 to 19 year olds has the highest likelihood of being enrolled in private schools, with 186 (100.0% in the age bracket) enrolled. Conversely, the age group of 3 to 4 year olds has the lowest likelihood of being enrolled in a private school, with 80 (100.0% in the age bracket) attending a public institution.
| Age Bracket | Public School | Private School |
| 3 to 4 Year Olds | 80 (100.0%) | 0 (0.0%) |
| 5 to 9 Year Old | 301 (85.3%) | 52 (14.7%) |
| 10 to 14 Year Olds | 134 (88.7%) | 17 (11.3%) |
| 15 to 17 Year Olds | 469 (100.0%) | 0 (0.0%) |
| 18 to 19 Year Olds | 0 (0.0%) | 186 (100.0%) |
| 20 to 24 Year Olds | 21 (100.0%) | 0 (0.0%) |
| 25 to 34 Year Olds | 13 (100.0%) | 0 (0.0%) |
| 35 Years and over | 10 (33.3%) | 20 (66.7%) |
| Total | 1,028 (78.9%) | 275 (21.1%) |
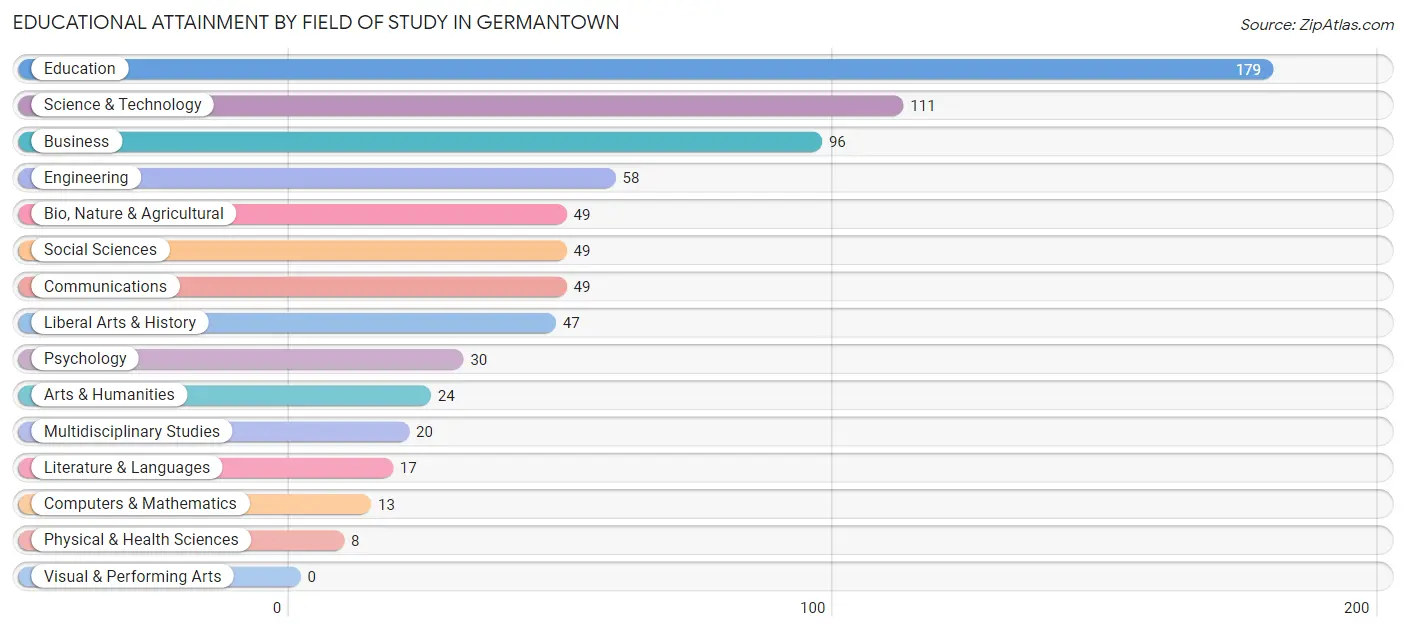
Educational Attainment by Field of Study in Germantown
Education (179 | 23.9%), science & technology (111 | 14.8%), business (96 | 12.8%), engineering (58 | 7.7%), and bio, nature & agricultural (49 | 6.5%) are the most common fields of study among 750 individuals in Germantown who have obtained a bachelor's degree or higher.
| Field of Study | # Graduates | % Graduates |
| Computers & Mathematics | 13 | 1.7% |
| Bio, Nature & Agricultural | 49 | 6.5% |
| Physical & Health Sciences | 8 | 1.1% |
| Psychology | 30 | 4.0% |
| Social Sciences | 49 | 6.5% |
| Engineering | 58 | 7.7% |
| Multidisciplinary Studies | 20 | 2.7% |
| Science & Technology | 111 | 14.8% |
| Business | 96 | 12.8% |
| Education | 179 | 23.9% |
| Literature & Languages | 17 | 2.3% |
| Liberal Arts & History | 47 | 6.3% |
| Visual & Performing Arts | 0 | 0.0% |
| Communications | 49 | 6.5% |
| Arts & Humanities | 24 | 3.2% |
| Total | 750 | 100.0% |
Transportation & Commute in Germantown
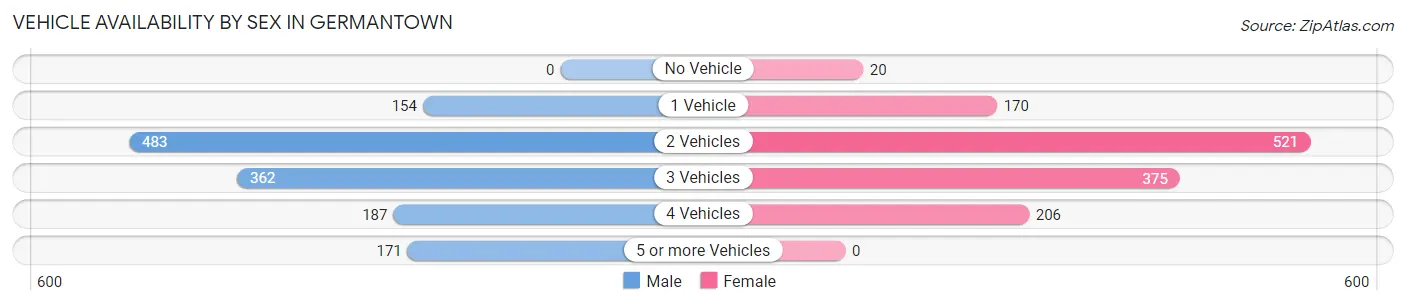
Vehicle Availability by Sex in Germantown
The most prevalent vehicle ownership categories in Germantown are males with 2 vehicles (483, accounting for 35.6%) and females with 2 vehicles (521, making up 37.4%).
| Vehicles Available | Male | Female |
| No Vehicle | 0 (0.0%) | 20 (1.5%) |
| 1 Vehicle | 154 (11.4%) | 170 (13.2%) |
| 2 Vehicles | 483 (35.6%) | 521 (40.3%) |
| 3 Vehicles | 362 (26.7%) | 375 (29.0%) |
| 4 Vehicles | 187 (13.8%) | 206 (15.9%) |
| 5 or more Vehicles | 171 (12.6%) | 0 (0.0%) |
| Total | 1,357 (100.0%) | 1,292 (100.0%) |
Commute Time in Germantown
The most frequently occuring commute durations in Germantown are 20 to 24 minutes (562 commuters, 22.9%), 30 to 34 minutes (398 commuters, 16.2%), and 5 to 9 minutes (303 commuters, 12.4%).
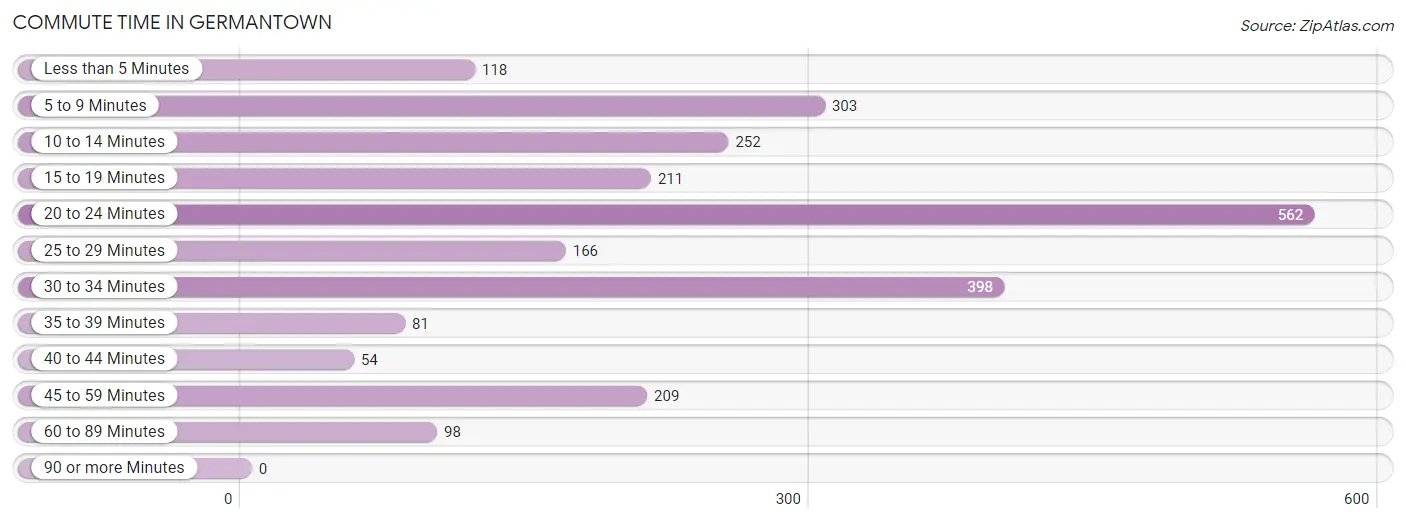
| Commute Time | # Commuters | % Commuters |
| Less than 5 Minutes | 118 | 4.8% |
| 5 to 9 Minutes | 303 | 12.4% |
| 10 to 14 Minutes | 252 | 10.3% |
| 15 to 19 Minutes | 211 | 8.6% |
| 20 to 24 Minutes | 562 | 22.9% |
| 25 to 29 Minutes | 166 | 6.8% |
| 30 to 34 Minutes | 398 | 16.2% |
| 35 to 39 Minutes | 81 | 3.3% |
| 40 to 44 Minutes | 54 | 2.2% |
| 45 to 59 Minutes | 209 | 8.5% |
| 60 to 89 Minutes | 98 | 4.0% |
| 90 or more Minutes | 0 | 0.0% |
Commute Time by Sex in Germantown
The most common commute times in Germantown are 5 to 9 minutes (266 commuters, 20.1%) for males and 20 to 24 minutes (419 commuters, 37.0%) for females.
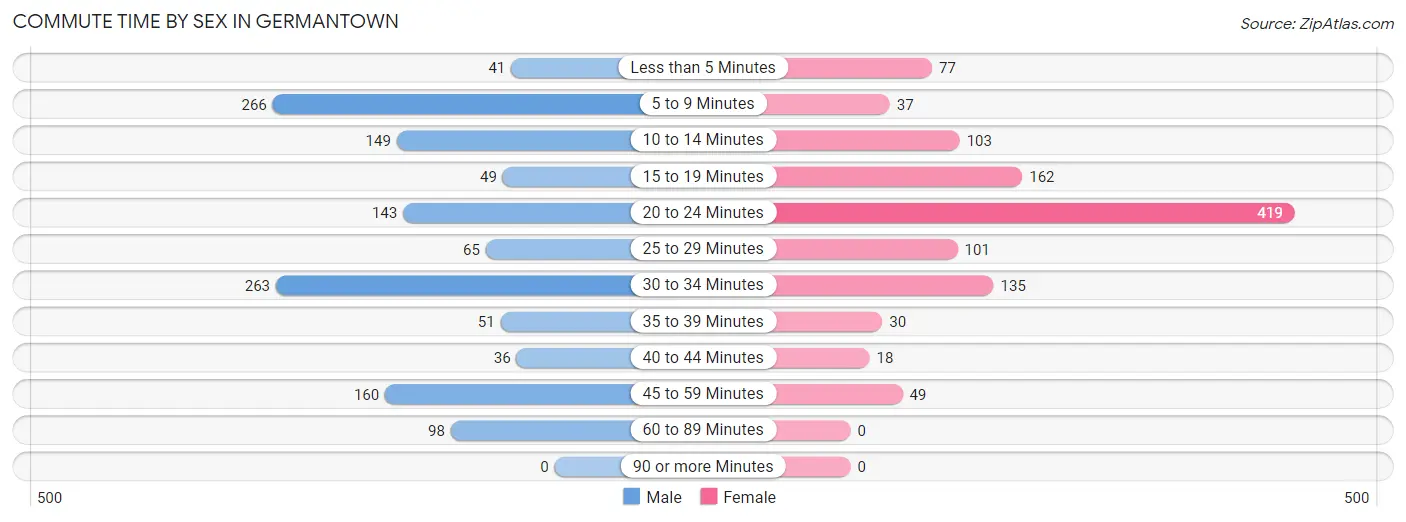
| Commute Time | Male | Female |
| Less than 5 Minutes | 41 (3.1%) | 77 (6.8%) |
| 5 to 9 Minutes | 266 (20.1%) | 37 (3.3%) |
| 10 to 14 Minutes | 149 (11.3%) | 103 (9.1%) |
| 15 to 19 Minutes | 49 (3.7%) | 162 (14.3%) |
| 20 to 24 Minutes | 143 (10.8%) | 419 (37.0%) |
| 25 to 29 Minutes | 65 (4.9%) | 101 (8.9%) |
| 30 to 34 Minutes | 263 (19.9%) | 135 (11.9%) |
| 35 to 39 Minutes | 51 (3.9%) | 30 (2.6%) |
| 40 to 44 Minutes | 36 (2.7%) | 18 (1.6%) |
| 45 to 59 Minutes | 160 (12.1%) | 49 (4.3%) |
| 60 to 89 Minutes | 98 (7.4%) | 0 (0.0%) |
| 90 or more Minutes | 0 (0.0%) | 0 (0.0%) |
Time of Departure to Work by Sex in Germantown
The most frequent times of departure to work in Germantown are 6:00 AM to 6:29 AM (224, 17.0%) for males and 8:30 AM to 8:59 AM (197, 17.4%) for females.
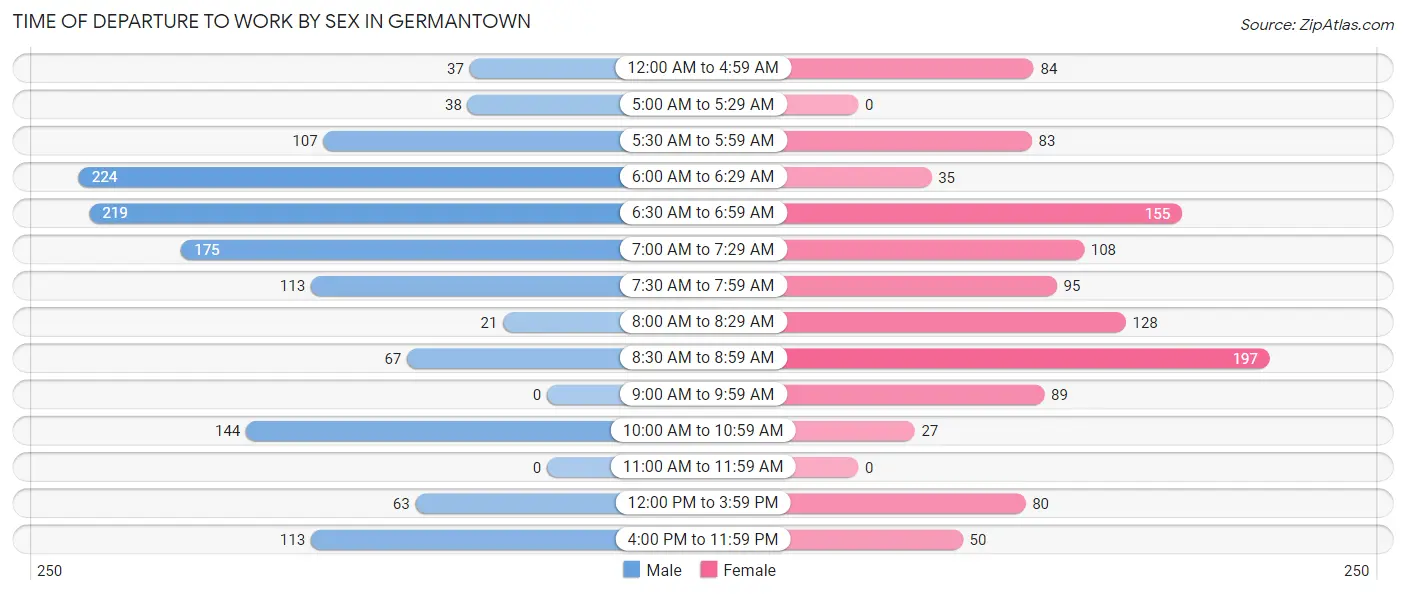
| Time of Departure | Male | Female |
| 12:00 AM to 4:59 AM | 37 (2.8%) | 84 (7.4%) |
| 5:00 AM to 5:29 AM | 38 (2.9%) | 0 (0.0%) |
| 5:30 AM to 5:59 AM | 107 (8.1%) | 83 (7.3%) |
| 6:00 AM to 6:29 AM | 224 (17.0%) | 35 (3.1%) |
| 6:30 AM to 6:59 AM | 219 (16.6%) | 155 (13.7%) |
| 7:00 AM to 7:29 AM | 175 (13.3%) | 108 (9.6%) |
| 7:30 AM to 7:59 AM | 113 (8.6%) | 95 (8.4%) |
| 8:00 AM to 8:29 AM | 21 (1.6%) | 128 (11.3%) |
| 8:30 AM to 8:59 AM | 67 (5.1%) | 197 (17.4%) |
| 9:00 AM to 9:59 AM | 0 (0.0%) | 89 (7.9%) |
| 10:00 AM to 10:59 AM | 144 (10.9%) | 27 (2.4%) |
| 11:00 AM to 11:59 AM | 0 (0.0%) | 0 (0.0%) |
| 12:00 PM to 3:59 PM | 63 (4.8%) | 80 (7.1%) |
| 4:00 PM to 11:59 PM | 113 (8.6%) | 50 (4.4%) |
| Total | 1,321 (100.0%) | 1,131 (100.0%) |
Housing Occupancy in Germantown
Occupancy by Ownership in Germantown
Of the total 2,212 dwellings in Germantown, owner-occupied units account for 1,841 (83.2%), while renter-occupied units make up 371 (16.8%).
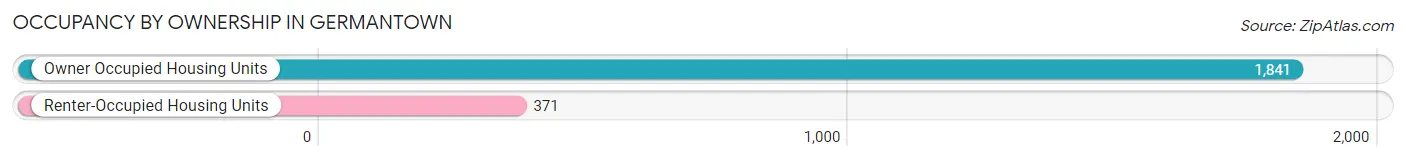
| Occupancy | # Housing Units | % Housing Units |
| Owner Occupied Housing Units | 1,841 | 83.2% |
| Renter-Occupied Housing Units | 371 | 16.8% |
| Total Occupied Housing Units | 2,212 | 100.0% |
Occupancy by Household Size in Germantown
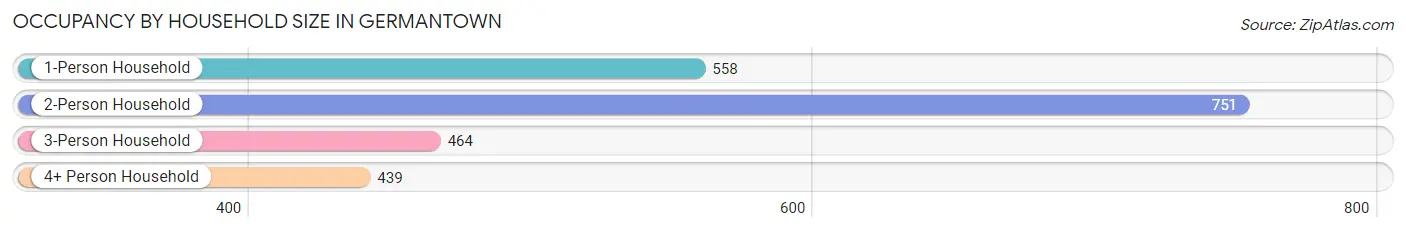
| Household Size | # Housing Units | % Housing Units |
| 1-Person Household | 558 | 25.2% |
| 2-Person Household | 751 | 34.0% |
| 3-Person Household | 464 | 21.0% |
| 4+ Person Household | 439 | 19.9% |
| Total Housing Units | 2,212 | 100.0% |
Occupancy by Ownership by Household Size in Germantown
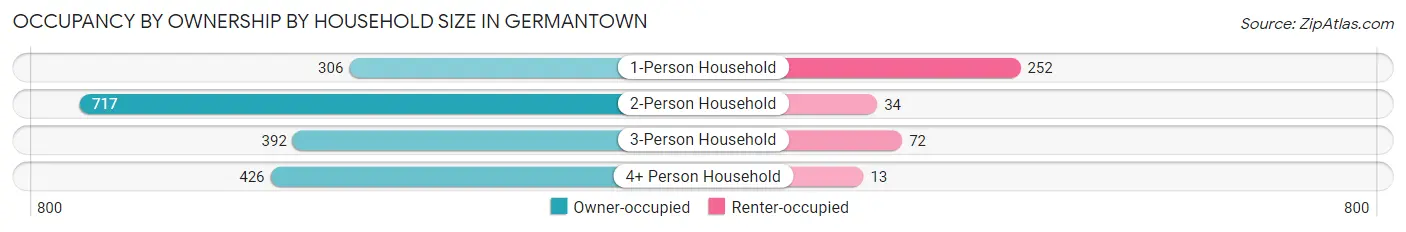
| Household Size | Owner-occupied | Renter-occupied |
| 1-Person Household | 306 (54.8%) | 252 (45.2%) |
| 2-Person Household | 717 (95.5%) | 34 (4.5%) |
| 3-Person Household | 392 (84.5%) | 72 (15.5%) |
| 4+ Person Household | 426 (97.0%) | 13 (3.0%) |
| Total Housing Units | 1,841 (83.2%) | 371 (16.8%) |
Occupancy by Educational Attainment in Germantown
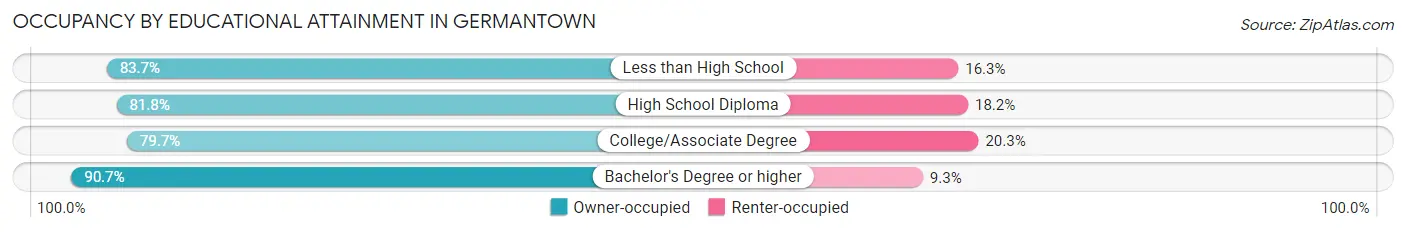
| Household Size | Owner-occupied | Renter-occupied |
| Less than High School | 108 (83.7%) | 21 (16.3%) |
| High School Diploma | 660 (81.8%) | 147 (18.2%) |
| College/Associate Degree | 613 (79.7%) | 156 (20.3%) |
| Bachelor's Degree or higher | 460 (90.7%) | 47 (9.3%) |
Occupancy by Age of Householder in Germantown
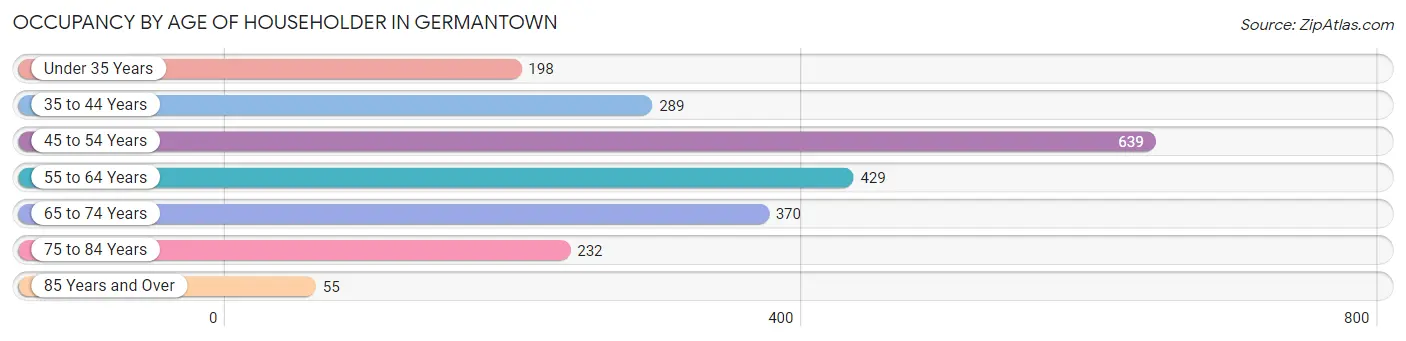
| Age Bracket | # Households | % Households |
| Under 35 Years | 198 | 8.9% |
| 35 to 44 Years | 289 | 13.1% |
| 45 to 54 Years | 639 | 28.9% |
| 55 to 64 Years | 429 | 19.4% |
| 65 to 74 Years | 370 | 16.7% |
| 75 to 84 Years | 232 | 10.5% |
| 85 Years and Over | 55 | 2.5% |
| Total | 2,212 | 100.0% |
Housing Finances in Germantown
Median Income by Occupancy in Germantown
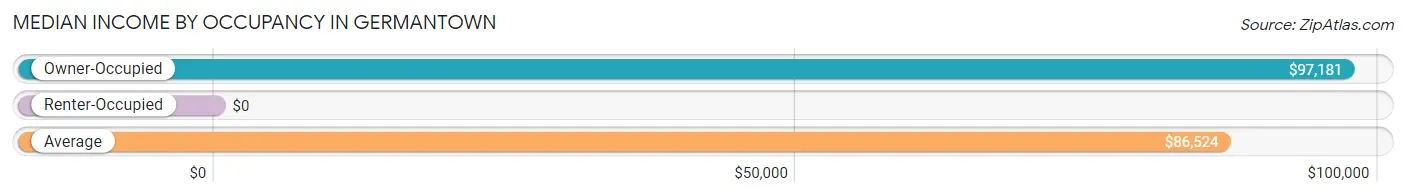
| Occupancy Type | # Households | Median Income |
| Owner-Occupied | 1,841 (83.2%) | $97,181 |
| Renter-Occupied | 371 (16.8%) | $0 |
| Average | 2,212 (100.0%) | $86,524 |
Occupancy by Householder Income Bracket in Germantown
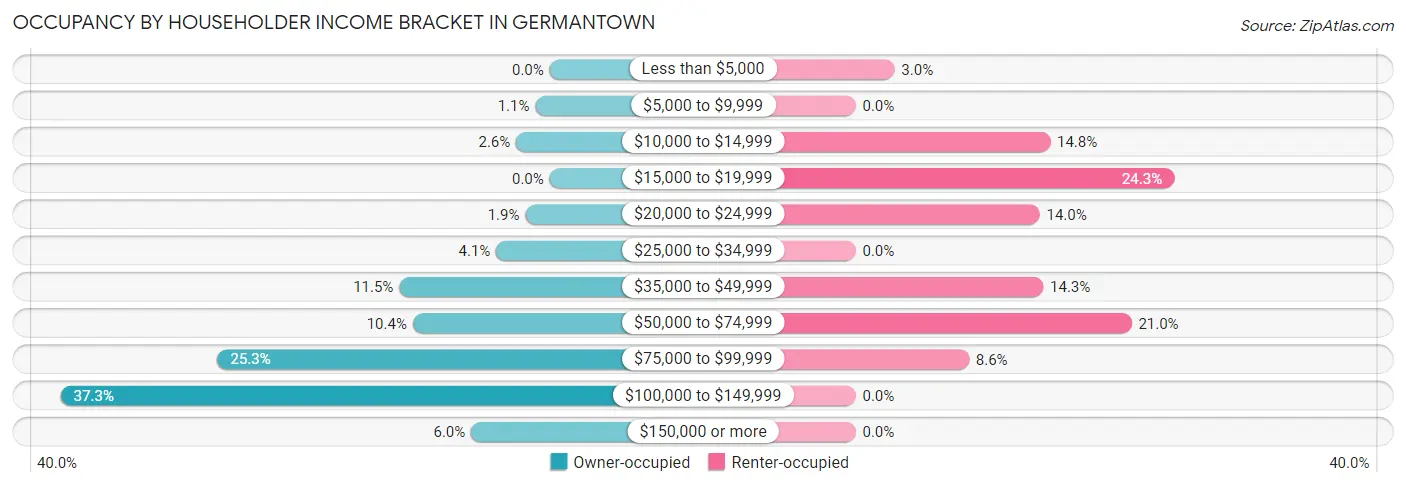
| Income Bracket | Owner-occupied | Renter-occupied |
| Less than $5,000 | 0 (0.0%) | 11 (3.0%) |
| $5,000 to $9,999 | 20 (1.1%) | 0 (0.0%) |
| $10,000 to $14,999 | 47 (2.5%) | 55 (14.8%) |
| $15,000 to $19,999 | 0 (0.0%) | 90 (24.3%) |
| $20,000 to $24,999 | 34 (1.8%) | 52 (14.0%) |
| $25,000 to $34,999 | 75 (4.1%) | 0 (0.0%) |
| $35,000 to $49,999 | 211 (11.5%) | 53 (14.3%) |
| $50,000 to $74,999 | 192 (10.4%) | 78 (21.0%) |
| $75,000 to $99,999 | 466 (25.3%) | 32 (8.6%) |
| $100,000 to $149,999 | 686 (37.3%) | 0 (0.0%) |
| $150,000 or more | 110 (6.0%) | 0 (0.0%) |
| Total | 1,841 (100.0%) | 371 (100.0%) |
Monthly Housing Cost Tiers in Germantown
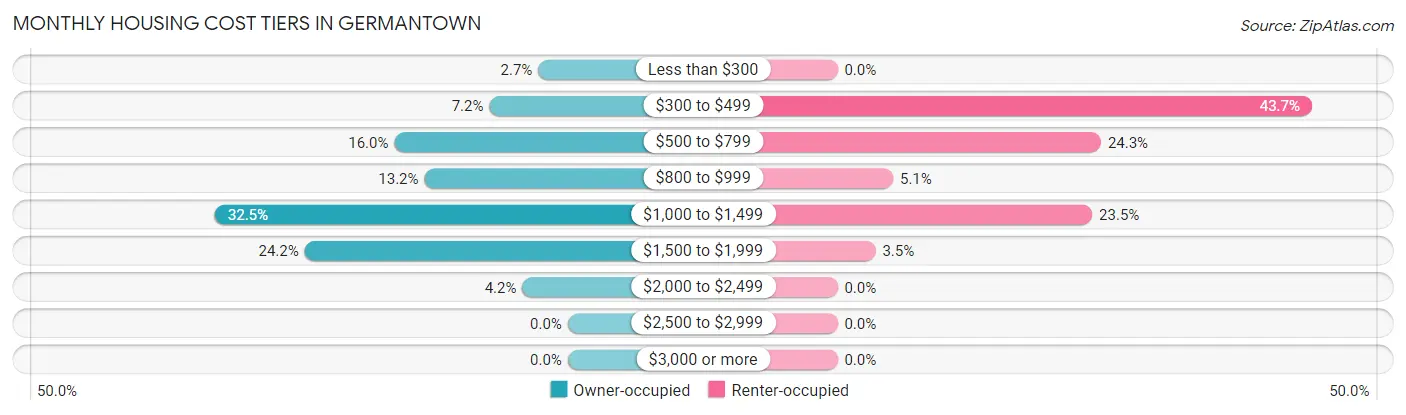
| Monthly Cost | Owner-occupied | Renter-occupied |
| Less than $300 | 50 (2.7%) | 0 (0.0%) |
| $300 to $499 | 133 (7.2%) | 162 (43.7%) |
| $500 to $799 | 294 (16.0%) | 90 (24.3%) |
| $800 to $999 | 243 (13.2%) | 19 (5.1%) |
| $1,000 to $1,499 | 598 (32.5%) | 87 (23.4%) |
| $1,500 to $1,999 | 446 (24.2%) | 13 (3.5%) |
| $2,000 to $2,499 | 77 (4.2%) | 0 (0.0%) |
| $2,500 to $2,999 | 0 (0.0%) | 0 (0.0%) |
| $3,000 or more | 0 (0.0%) | 0 (0.0%) |
| Total | 1,841 (100.0%) | 371 (100.0%) |
Physical Housing Characteristics in Germantown
Housing Structures in Germantown
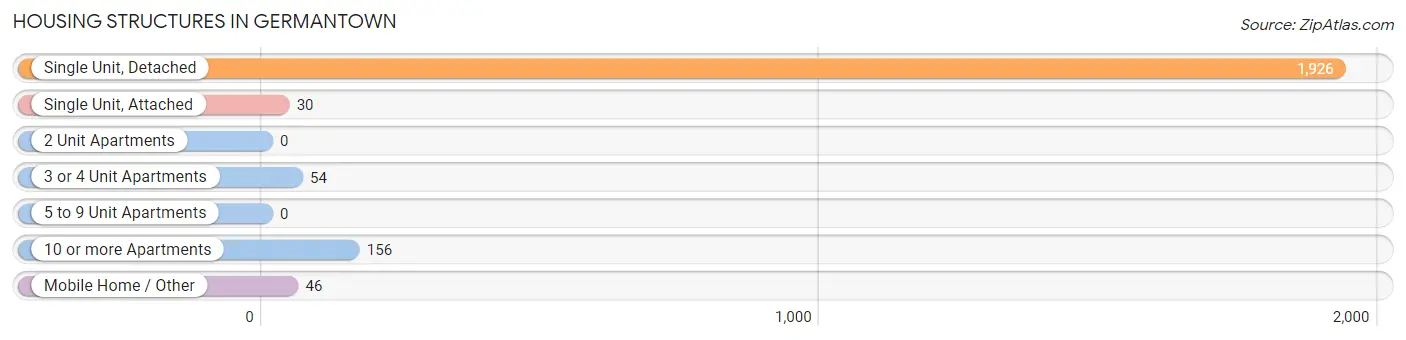
| Structure Type | # Housing Units | % Housing Units |
| Single Unit, Detached | 1,926 | 87.1% |
| Single Unit, Attached | 30 | 1.4% |
| 2 Unit Apartments | 0 | 0.0% |
| 3 or 4 Unit Apartments | 54 | 2.4% |
| 5 to 9 Unit Apartments | 0 | 0.0% |
| 10 or more Apartments | 156 | 7.0% |
| Mobile Home / Other | 46 | 2.1% |
| Total | 2,212 | 100.0% |
Housing Structures by Occupancy in Germantown
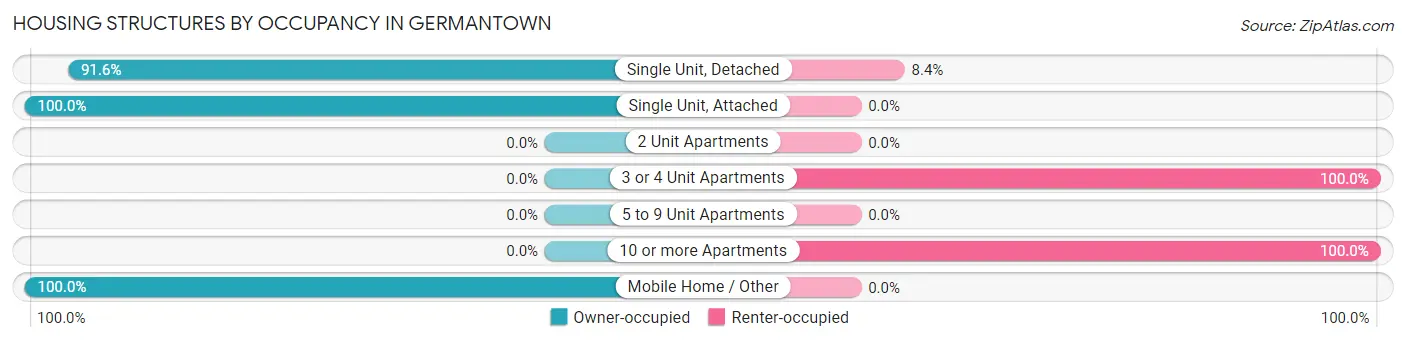
| Structure Type | Owner-occupied | Renter-occupied |
| Single Unit, Detached | 1,765 (91.6%) | 161 (8.4%) |
| Single Unit, Attached | 30 (100.0%) | 0 (0.0%) |
| 2 Unit Apartments | 0 (0.0%) | 0 (0.0%) |
| 3 or 4 Unit Apartments | 0 (0.0%) | 54 (100.0%) |
| 5 to 9 Unit Apartments | 0 (0.0%) | 0 (0.0%) |
| 10 or more Apartments | 0 (0.0%) | 156 (100.0%) |
| Mobile Home / Other | 46 (100.0%) | 0 (0.0%) |
| Total | 1,841 (83.2%) | 371 (16.8%) |
Housing Structures by Number of Rooms in Germantown
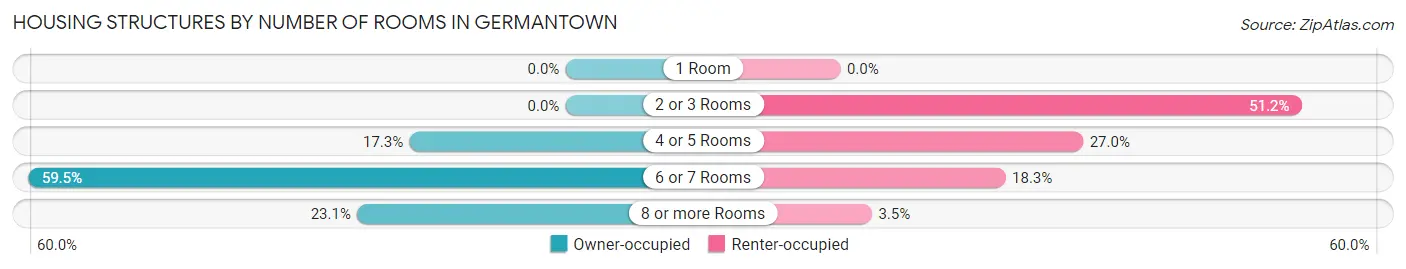
| Number of Rooms | Owner-occupied | Renter-occupied |
| 1 Room | 0 (0.0%) | 0 (0.0%) |
| 2 or 3 Rooms | 0 (0.0%) | 190 (51.2%) |
| 4 or 5 Rooms | 319 (17.3%) | 100 (27.0%) |
| 6 or 7 Rooms | 1,096 (59.5%) | 68 (18.3%) |
| 8 or more Rooms | 426 (23.1%) | 13 (3.5%) |
| Total | 1,841 (100.0%) | 371 (100.0%) |
Housing Structure by Heating Type in Germantown
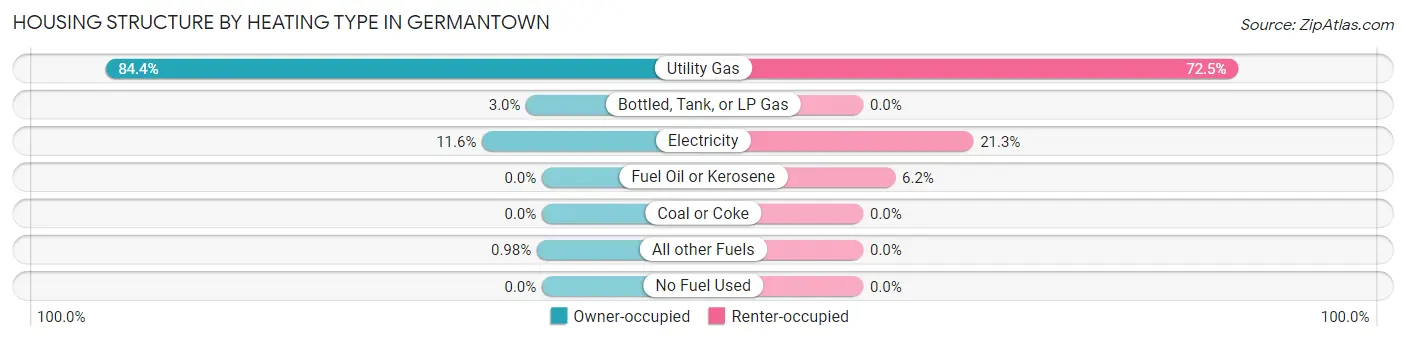
| Heating Type | Owner-occupied | Renter-occupied |
| Utility Gas | 1,554 (84.4%) | 269 (72.5%) |
| Bottled, Tank, or LP Gas | 56 (3.0%) | 0 (0.0%) |
| Electricity | 213 (11.6%) | 79 (21.3%) |
| Fuel Oil or Kerosene | 0 (0.0%) | 23 (6.2%) |
| Coal or Coke | 0 (0.0%) | 0 (0.0%) |
| All other Fuels | 18 (1.0%) | 0 (0.0%) |
| No Fuel Used | 0 (0.0%) | 0 (0.0%) |
| Total | 1,841 (100.0%) | 371 (100.0%) |
Household Vehicle Usage in Germantown
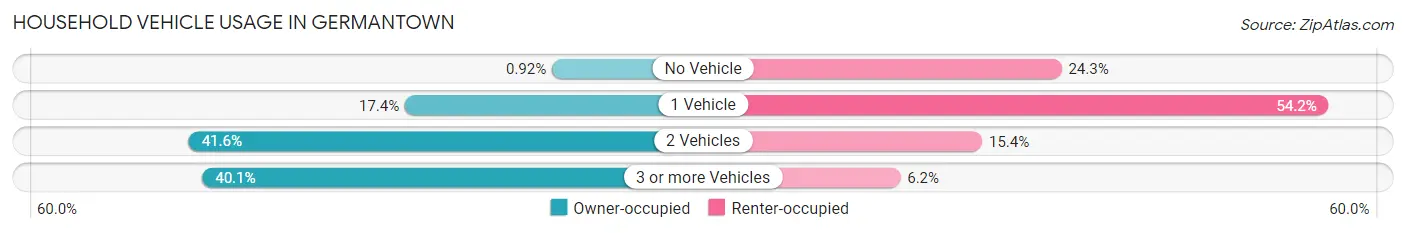
| Vehicles per Household | Owner-occupied | Renter-occupied |
| No Vehicle | 17 (0.9%) | 90 (24.3%) |
| 1 Vehicle | 320 (17.4%) | 201 (54.2%) |
| 2 Vehicles | 766 (41.6%) | 57 (15.4%) |
| 3 or more Vehicles | 738 (40.1%) | 23 (6.2%) |
| Total | 1,841 (100.0%) | 371 (100.0%) |
Real Estate & Mortgages in Germantown
Real Estate and Mortgage Overview in Germantown
| Characteristic | Without Mortgage | With Mortgage |
| Housing Units | 486 | 1,355 |
| Median Property Value | $166,100 | $163,300 |
| Median Household Income | $87,955 | $74 |
| Monthly Housing Costs | $558 | $0 |
| Real Estate Taxes | $2,494 | $16 |
Property Value by Mortgage Status in Germantown
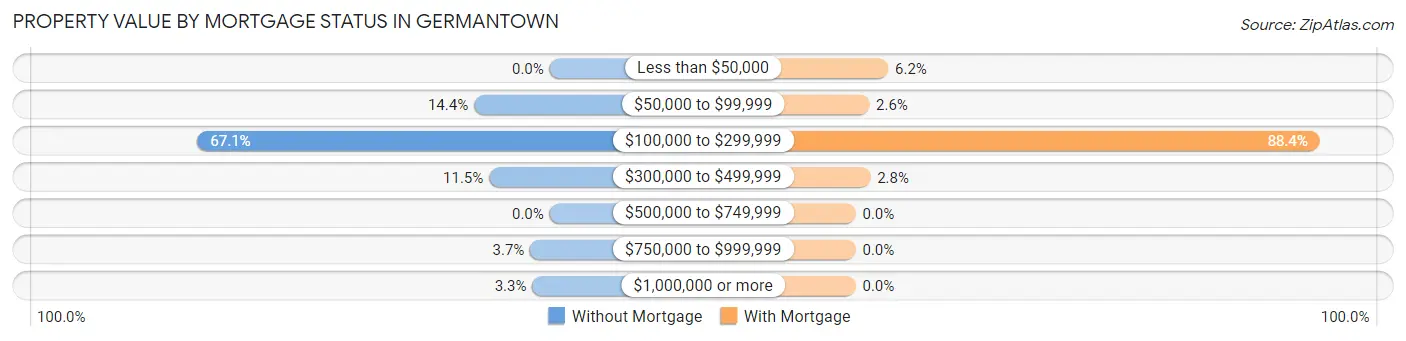
| Property Value | Without Mortgage | With Mortgage |
| Less than $50,000 | 0 (0.0%) | 84 (6.2%) |
| $50,000 to $99,999 | 70 (14.4%) | 35 (2.6%) |
| $100,000 to $299,999 | 326 (67.1%) | 1,198 (88.4%) |
| $300,000 to $499,999 | 56 (11.5%) | 38 (2.8%) |
| $500,000 to $749,999 | 0 (0.0%) | 0 (0.0%) |
| $750,000 to $999,999 | 18 (3.7%) | 0 (0.0%) |
| $1,000,000 or more | 16 (3.3%) | 0 (0.0%) |
| Total | 486 (100.0%) | 1,355 (100.0%) |
Household Income by Mortgage Status in Germantown
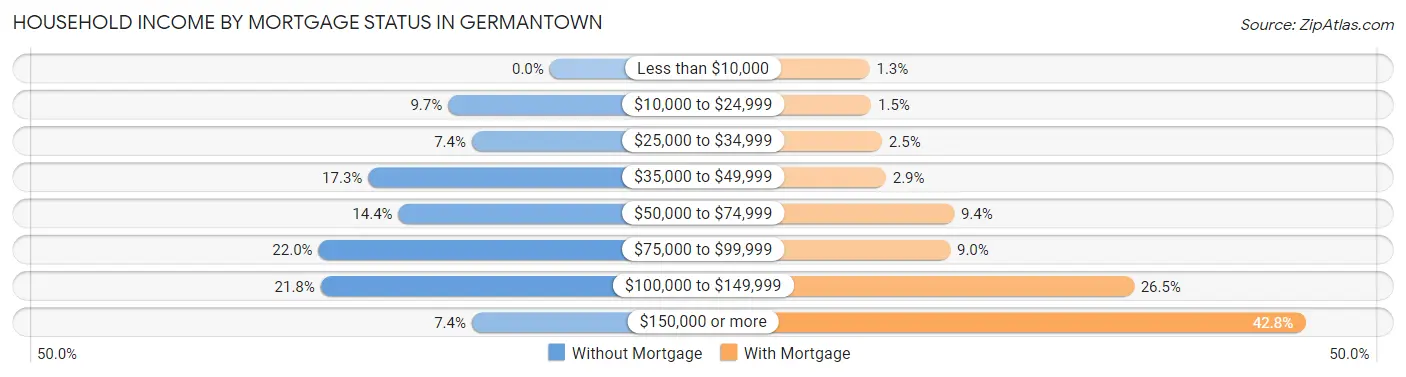
| Household Income | Without Mortgage | With Mortgage |
| Less than $10,000 | 0 (0.0%) | 18 (1.3%) |
| $10,000 to $24,999 | 47 (9.7%) | 20 (1.5%) |
| $25,000 to $34,999 | 36 (7.4%) | 34 (2.5%) |
| $35,000 to $49,999 | 84 (17.3%) | 39 (2.9%) |
| $50,000 to $74,999 | 70 (14.4%) | 127 (9.4%) |
| $75,000 to $99,999 | 107 (22.0%) | 122 (9.0%) |
| $100,000 to $149,999 | 106 (21.8%) | 359 (26.5%) |
| $150,000 or more | 36 (7.4%) | 580 (42.8%) |
| Total | 486 (100.0%) | 1,355 (100.0%) |
Property Value to Household Income Ratio in Germantown
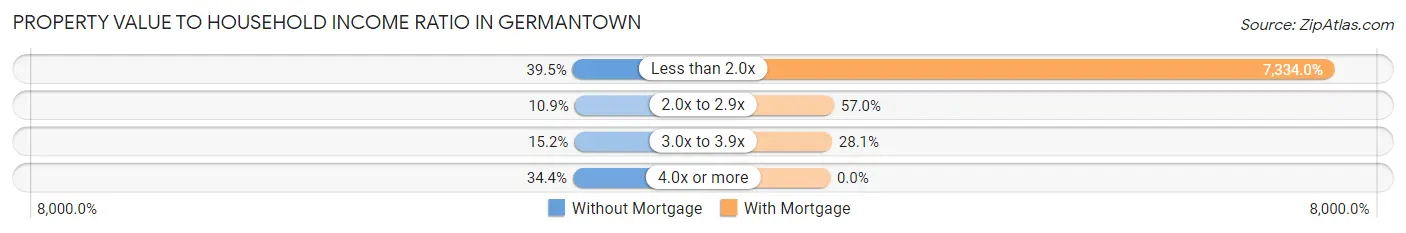
| Value-to-Income Ratio | Without Mortgage | With Mortgage |
| Less than 2.0x | 192 (39.5%) | 99,375 (7,334.0%) |
| 2.0x to 2.9x | 53 (10.9%) | 772 (57.0%) |
| 3.0x to 3.9x | 74 (15.2%) | 381 (28.1%) |
| 4.0x or more | 167 (34.4%) | 0 (0.0%) |
| Total | 486 (100.0%) | 1,355 (100.0%) |
Real Estate Taxes by Mortgage Status in Germantown
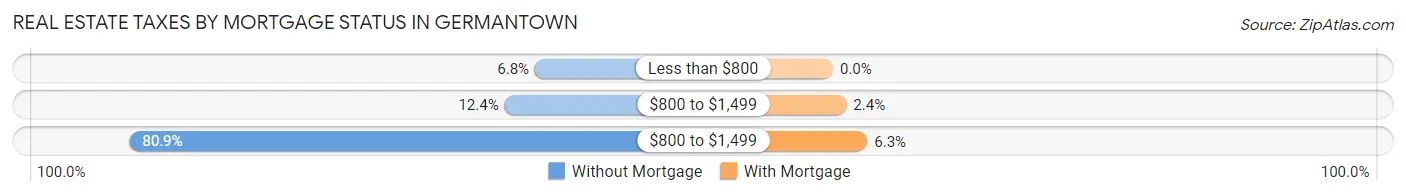
| Property Taxes | Without Mortgage | With Mortgage |
| Less than $800 | 33 (6.8%) | 0 (0.0%) |
| $800 to $1,499 | 60 (12.3%) | 33 (2.4%) |
| $800 to $1,499 | 393 (80.9%) | 85 (6.3%) |
| Total | 486 (100.0%) | 1,355 (100.0%) |
Health & Disability in Germantown
Health Insurance Coverage by Age in Germantown
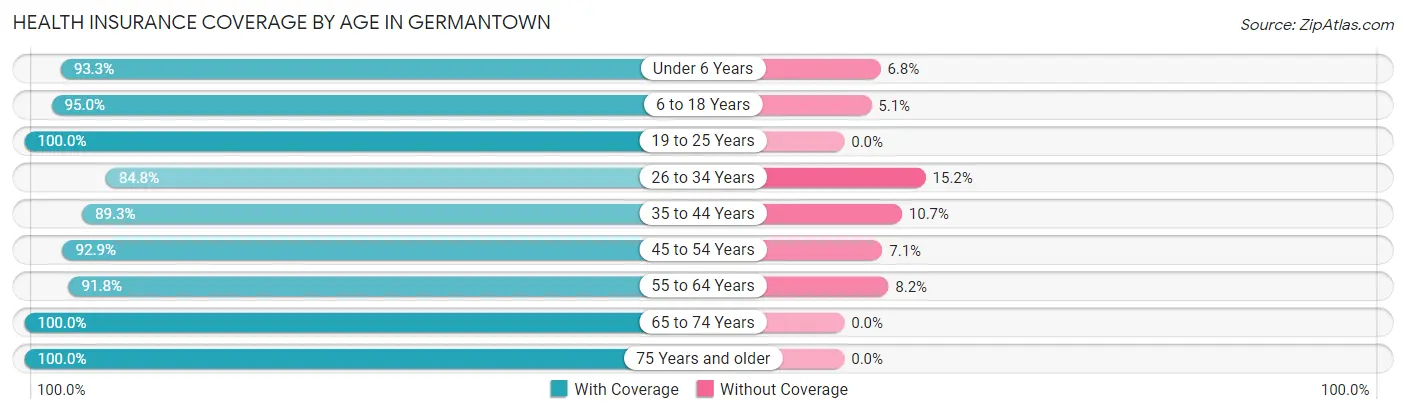
| Age Bracket | With Coverage | Without Coverage |
| Under 6 Years | 470 (93.2%) | 34 (6.8%) |
| 6 to 18 Years | 1,072 (95.0%) | 57 (5.1%) |
| 19 to 25 Years | 479 (100.0%) | 0 (0.0%) |
| 26 to 34 Years | 347 (84.8%) | 62 (15.2%) |
| 35 to 44 Years | 399 (89.3%) | 48 (10.7%) |
| 45 to 54 Years | 916 (92.9%) | 70 (7.1%) |
| 55 to 64 Years | 726 (91.8%) | 65 (8.2%) |
| 65 to 74 Years | 635 (100.0%) | 0 (0.0%) |
| 75 Years and older | 357 (100.0%) | 0 (0.0%) |
| Total | 5,401 (94.1%) | 336 (5.9%) |
Health Insurance Coverage by Citizenship Status in Germantown

| Citizenship Status | With Coverage | Without Coverage |
| Native Born | 470 (93.2%) | 34 (6.8%) |
| Foreign Born, Citizen | 1,072 (95.0%) | 57 (5.1%) |
| Foreign Born, not a Citizen | 479 (100.0%) | 0 (0.0%) |
Health Insurance Coverage by Household Income in Germantown
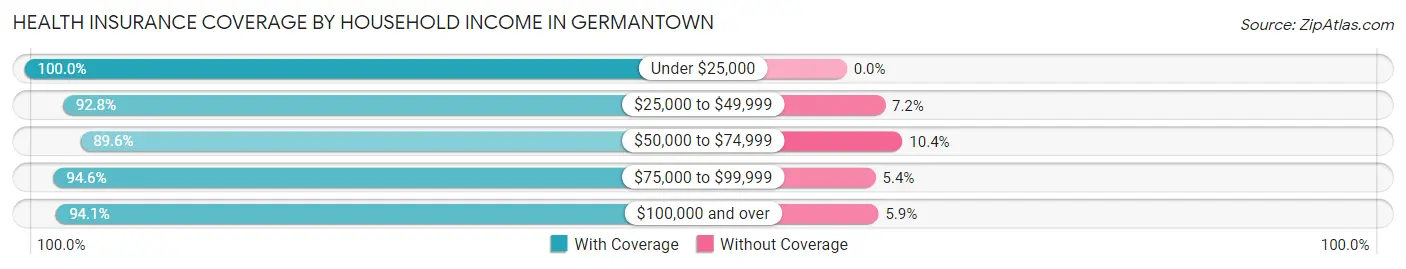
| Household Income | With Coverage | Without Coverage |
| Under $25,000 | 444 (100.0%) | 0 (0.0%) |
| $25,000 to $49,999 | 506 (92.8%) | 39 (7.2%) |
| $50,000 to $74,999 | 490 (89.6%) | 57 (10.4%) |
| $75,000 to $99,999 | 1,612 (94.6%) | 92 (5.4%) |
| $100,000 and over | 2,349 (94.1%) | 148 (5.9%) |
Public vs Private Health Insurance Coverage by Age in Germantown
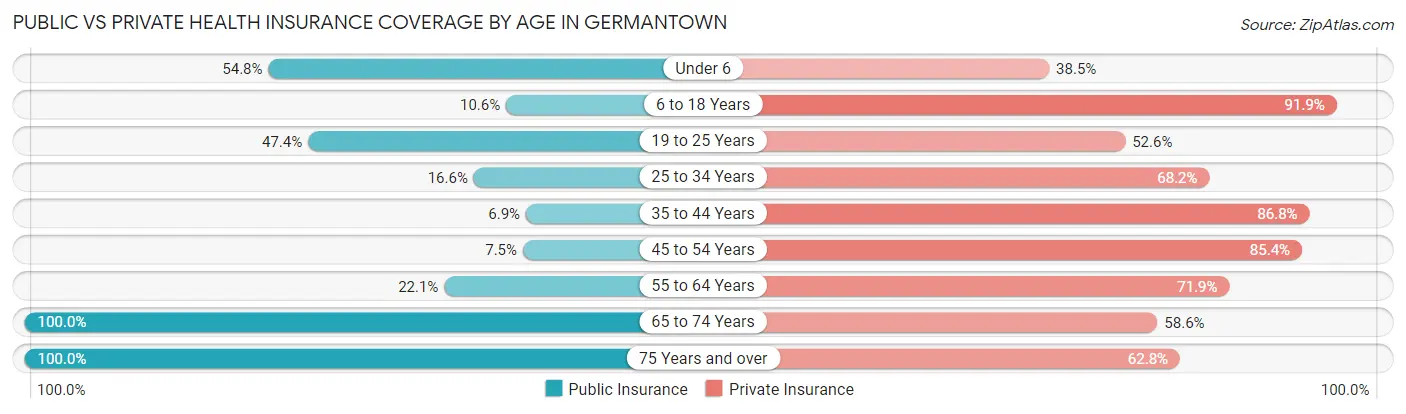
| Age Bracket | Public Insurance | Private Insurance |
| Under 6 | 276 (54.8%) | 194 (38.5%) |
| 6 to 18 Years | 120 (10.6%) | 1,037 (91.8%) |
| 19 to 25 Years | 227 (47.4%) | 252 (52.6%) |
| 25 to 34 Years | 68 (16.6%) | 279 (68.2%) |
| 35 to 44 Years | 31 (6.9%) | 388 (86.8%) |
| 45 to 54 Years | 74 (7.5%) | 842 (85.4%) |
| 55 to 64 Years | 175 (22.1%) | 569 (71.9%) |
| 65 to 74 Years | 635 (100.0%) | 372 (58.6%) |
| 75 Years and over | 357 (100.0%) | 224 (62.7%) |
| Total | 1,963 (34.2%) | 4,157 (72.5%) |
Disability Status by Sex by Age in Germantown
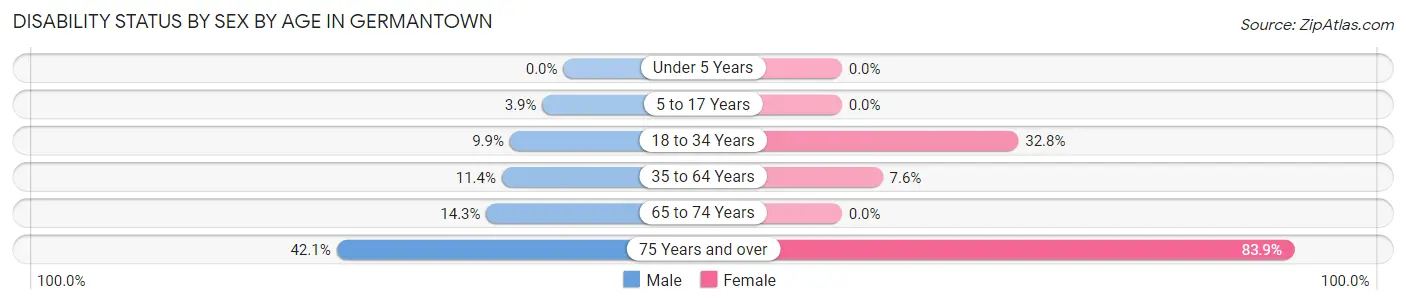
| Age Bracket | Male | Female |
| Under 5 Years | 0 (0.0%) | 0 (0.0%) |
| 5 to 17 Years | 18 (3.9%) | 0 (0.0%) |
| 18 to 34 Years | 51 (9.9%) | 191 (32.8%) |
| 35 to 64 Years | 126 (11.4%) | 85 (7.6%) |
| 65 to 74 Years | 33 (14.3%) | 0 (0.0%) |
| 75 Years and over | 64 (42.1%) | 172 (83.9%) |
Disability Class by Sex by Age in Germantown
Disability Class: Hearing Difficulty
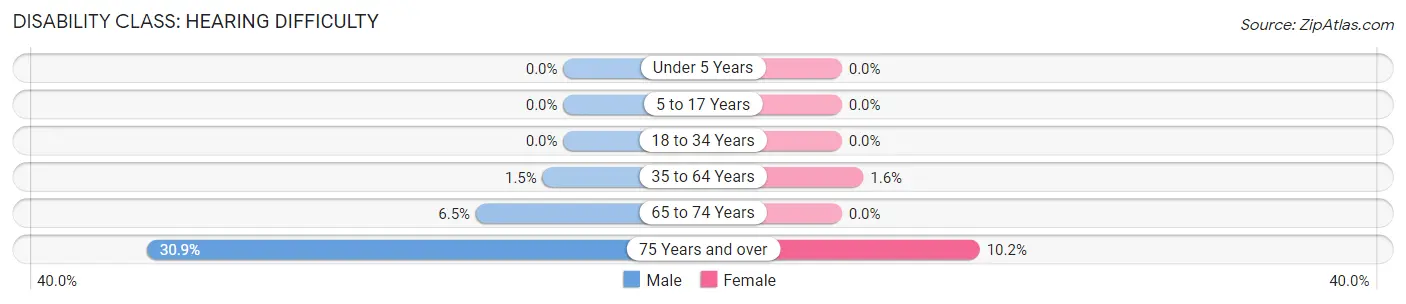
| Age Bracket | Male | Female |
| Under 5 Years | 0 (0.0%) | 0 (0.0%) |
| 5 to 17 Years | 0 (0.0%) | 0 (0.0%) |
| 18 to 34 Years | 0 (0.0%) | 0 (0.0%) |
| 35 to 64 Years | 17 (1.5%) | 18 (1.6%) |
| 65 to 74 Years | 15 (6.5%) | 0 (0.0%) |
| 75 Years and over | 47 (30.9%) | 21 (10.2%) |
Disability Class: Vision Difficulty
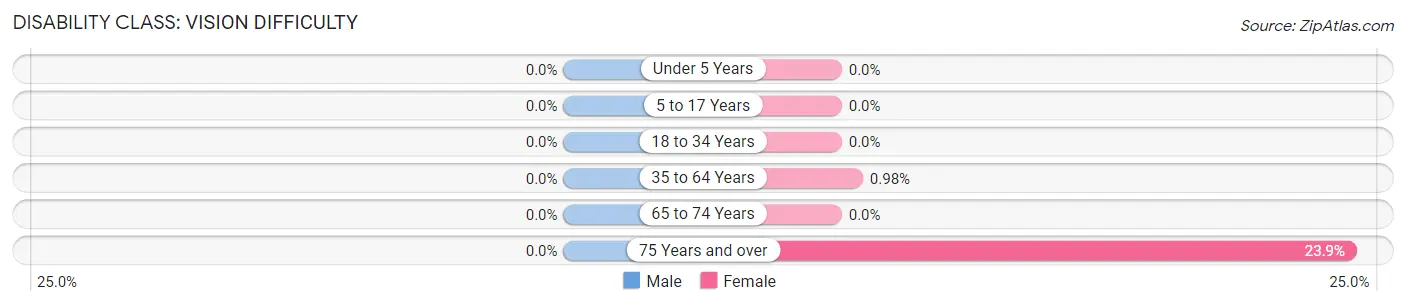
| Age Bracket | Male | Female |
| Under 5 Years | 0 (0.0%) | 0 (0.0%) |
| 5 to 17 Years | 0 (0.0%) | 0 (0.0%) |
| 18 to 34 Years | 0 (0.0%) | 0 (0.0%) |
| 35 to 64 Years | 0 (0.0%) | 11 (1.0%) |
| 65 to 74 Years | 0 (0.0%) | 0 (0.0%) |
| 75 Years and over | 0 (0.0%) | 49 (23.9%) |
Disability Class: Cognitive Difficulty
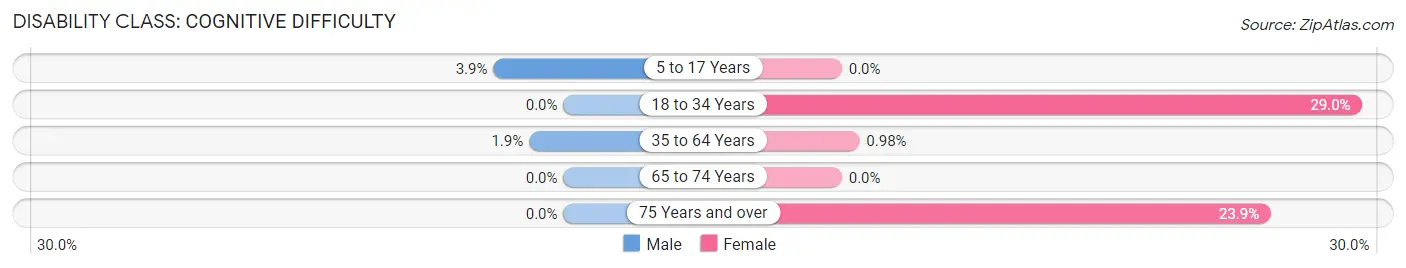
| Age Bracket | Male | Female |
| 5 to 17 Years | 18 (3.9%) | 0 (0.0%) |
| 18 to 34 Years | 0 (0.0%) | 169 (29.0%) |
| 35 to 64 Years | 21 (1.9%) | 11 (1.0%) |
| 65 to 74 Years | 0 (0.0%) | 0 (0.0%) |
| 75 Years and over | 0 (0.0%) | 49 (23.9%) |
Disability Class: Ambulatory Difficulty
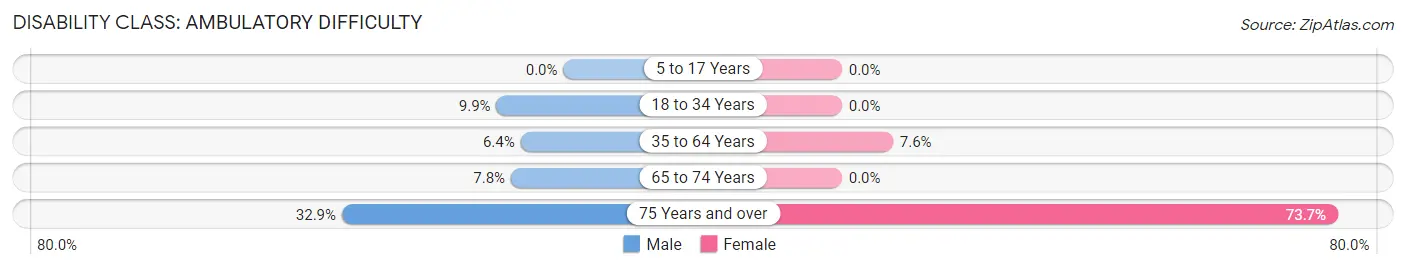
| Age Bracket | Male | Female |
| 5 to 17 Years | 0 (0.0%) | 0 (0.0%) |
| 18 to 34 Years | 51 (9.9%) | 0 (0.0%) |
| 35 to 64 Years | 70 (6.4%) | 85 (7.6%) |
| 65 to 74 Years | 18 (7.8%) | 0 (0.0%) |
| 75 Years and over | 50 (32.9%) | 151 (73.7%) |
Disability Class: Self-Care Difficulty
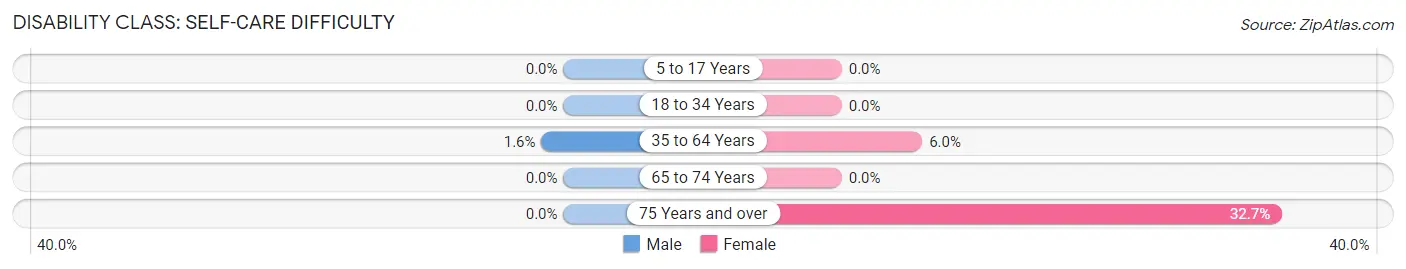
| Age Bracket | Male | Female |
| 5 to 17 Years | 0 (0.0%) | 0 (0.0%) |
| 18 to 34 Years | 0 (0.0%) | 0 (0.0%) |
| 35 to 64 Years | 18 (1.6%) | 67 (6.0%) |
| 65 to 74 Years | 0 (0.0%) | 0 (0.0%) |
| 75 Years and over | 0 (0.0%) | 67 (32.7%) |
Technology Access in Germantown
Computing Device Access in Germantown
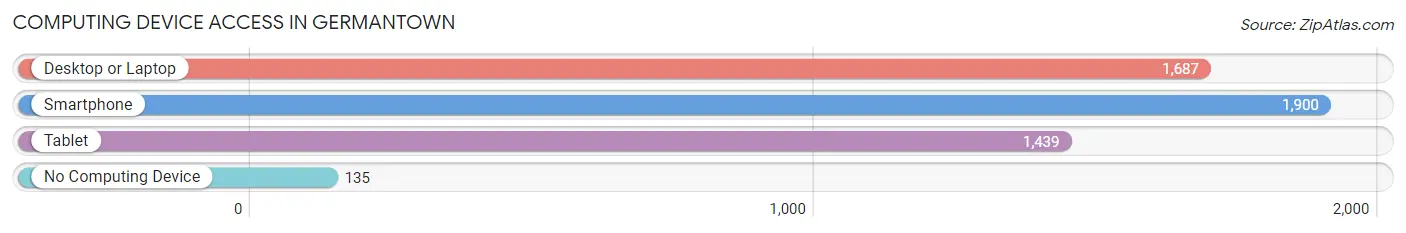
| Device Type | # Households | % Households |
| Desktop or Laptop | 1,687 | 76.3% |
| Smartphone | 1,900 | 85.9% |
| Tablet | 1,439 | 65.0% |
| No Computing Device | 135 | 6.1% |
| Total | 2,212 | 100.0% |
Internet Access in Germantown
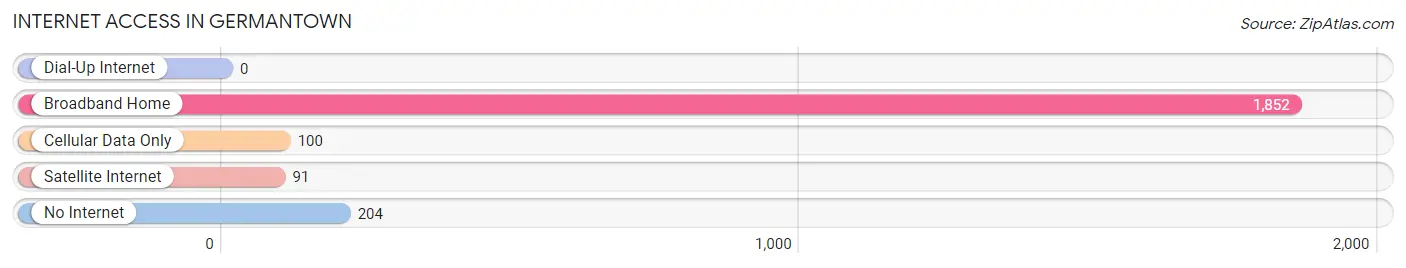
| Internet Type | # Households | % Households |
| Dial-Up Internet | 0 | 0.0% |
| Broadband Home | 1,852 | 83.7% |
| Cellular Data Only | 100 | 4.5% |
| Satellite Internet | 91 | 4.1% |
| No Internet | 204 | 9.2% |
| Total | 2,212 | 100.0% |
Germantown Summary
Germantown is a small village located in Montgomery County, Ohio, United States. It is situated approximately 25 miles north of Dayton and is part of the Dayton Metropolitan Statistical Area. The village has a population of 5,541 as of the 2010 census.
History
Germantown was founded in 1804 by German immigrants who had settled in the area. The village was originally known as German Town, but the name was changed to Germantown in 1845. The village was incorporated in 1866.
Germantown was a major center of German culture in the 19th century. The village was home to several German-language newspapers, churches, and schools. The village also had a large brewery, which was a major employer in the area.
Geography
Germantown is located at 39°41'25" North, 84°25'17" West (39.690278, -84.421389). The village is situated in the Miami Valley region of Ohio, approximately 25 miles north of Dayton. The village is located in the Great Miami River watershed.
The village has a total area of 2.2 square miles, all of which is land. The village is located in a rural area, with the nearest major city being Dayton.
Economy
Germantown’s economy is largely based on agriculture and manufacturing. The village is home to several small businesses, including a grocery store, a hardware store, and a restaurant. The village also has a few small industrial parks.
The village is home to several large employers, including the Germantown Manufacturing Company, which produces automotive parts, and the Germantown Tool and Die Company, which produces industrial tools.
Demographics
As of the 2010 census, the village had a population of 5,541. The racial makeup of the village was 95.3% White, 1.2% African American, 0.3% Native American, 0.7% Asian, 0.1% Pacific Islander, 0.7% from other races, and 1.9% from two or more races. Hispanic or Latino of any race were 2.2% of the population.
The median income for a household in the village was $45,938, and the median income for a family was $54,844. The per capita income for the village was $20,945. About 6.2% of families and 8.2% of the population were below the poverty line, including 10.2% of those under age 18 and 6.2% of those age 65 or over.
Education
Germantown is served by the Valley View Local School District. The district operates two elementary schools, one middle school, and one high school. The village is also home to the Miami Valley Career Technology Center, which provides vocational and technical training.
Common Questions
What is Per Capita Income in Germantown?
Per Capita income in Germantown is $33,006.
What is the Median Family Income in Germantown?
Median Family Income in Germantown is $98,839.
What is the Median Household income in Germantown?
Median Household Income in Germantown is $86,524.
What is Income or Wage Gap in Germantown?
Income or Wage Gap in Germantown is 41.5%.
Women in Germantown earn 58.5 cents for every dollar earned by a man.
What is Family Income Deficit in Germantown?
Family Income Deficit in Germantown is $7,170.
Families that are below poverty line in Germantown earn $7,170 less on average than the poverty threshold level.
What is Inequality or Gini Index in Germantown?
Inequality or Gini Index in Germantown is 0.33.
What is the Total Population of Germantown?
Total Population of Germantown is 5,784.
What is the Total Male Population of Germantown?
Total Male Population of Germantown is 2,707.
What is the Total Female Population of Germantown?
Total Female Population of Germantown is 3,077.
What is the Ratio of Males per 100 Females in Germantown?
There are 87.98 Males per 100 Females in Germantown.
What is the Ratio of Females per 100 Males in Germantown?
There are 113.67 Females per 100 Males in Germantown.
What is the Median Population Age in Germantown?
Median Population Age in Germantown is 43.6 Years.
What is the Average Family Size in Germantown
Average Family Size in Germantown is 3.1 People.
What is the Average Household Size in Germantown
Average Household Size in Germantown is 2.6 People.
How Large is the Labor Force in Germantown?
There are 3,035 People in the Labor Forcein in Germantown.
What is the Percentage of People in the Labor Force in Germantown?
66.1% of People are in the Labor Force in Germantown.
What is the Unemployment Rate in Germantown?
Unemployment Rate in Germantown is 6.6%.