Zip Codes with the Highest Percentage of Population Employed in Education, Arts & Media in Bowling Green, OH
RELATED REPORTS & OPTIONS
Education, Arts & Media
Bowling Green
Compare Zip Codes
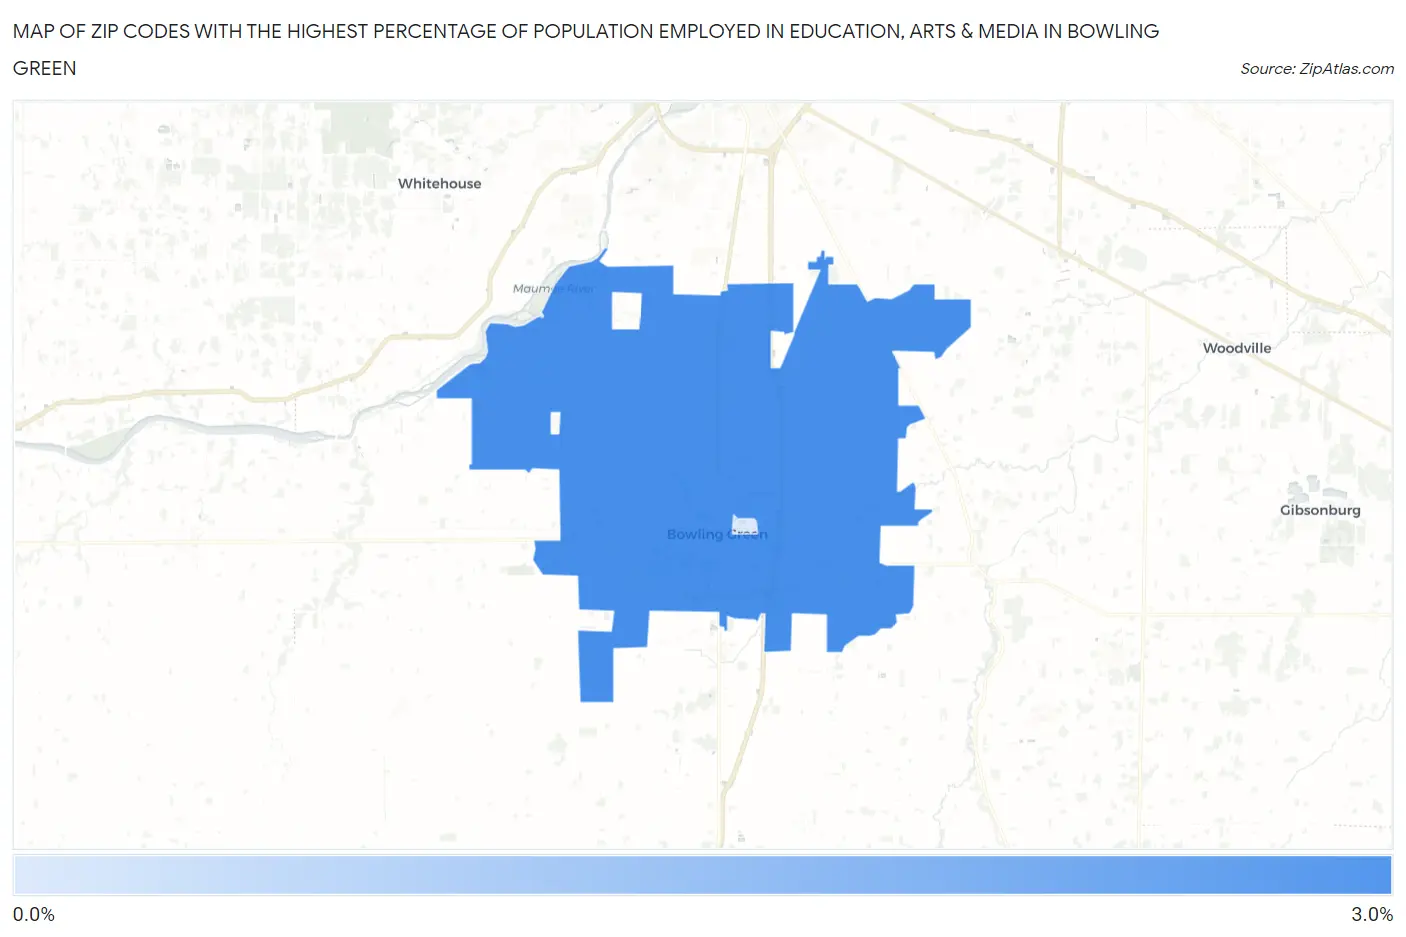
Map of Zip Codes with the Highest Percentage of Population Employed in Education, Arts & Media in Bowling Green
0.38%
2.7%
Zip Codes with the Highest Percentage of Population Employed in Education, Arts & Media in Bowling Green, OH
| Zip Code | % Employed | vs State | vs National | |
| 1. | 43402 | 2.7% | 1.8%(+0.828)#223 | 1.8%(+0.869)#5,794 |
| 2. | 43403 | 0.38% | 1.8%(-1.44)#871 | 1.8%(-1.40)#23,037 |
1
Common Questions
What are the Top Zip Codes with the Highest Percentage of Population Employed in Education, Arts & Media in Bowling Green, OH?
Top Zip Codes with the Highest Percentage of Population Employed in Education, Arts & Media in Bowling Green, OH are:
What zip code has the Highest Percentage of Population Employed in Education, Arts & Media in Bowling Green, OH?
43402 has the Highest Percentage of Population Employed in Education, Arts & Media in Bowling Green, OH with 2.7%.
What is the Percentage of Population Employed in Education, Arts & Media in Bowling Green, OH?
Percentage of Population Employed in Education, Arts & Media in Bowling Green is 2.5%.
What is the Percentage of Population Employed in Education, Arts & Media in Ohio?
Percentage of Population Employed in Education, Arts & Media in Ohio is 1.8%.
What is the Percentage of Population Employed in Education, Arts & Media in the United States?
Percentage of Population Employed in Education, Arts & Media in the United States is 1.8%.