Mercersville, MD Map & Demographics
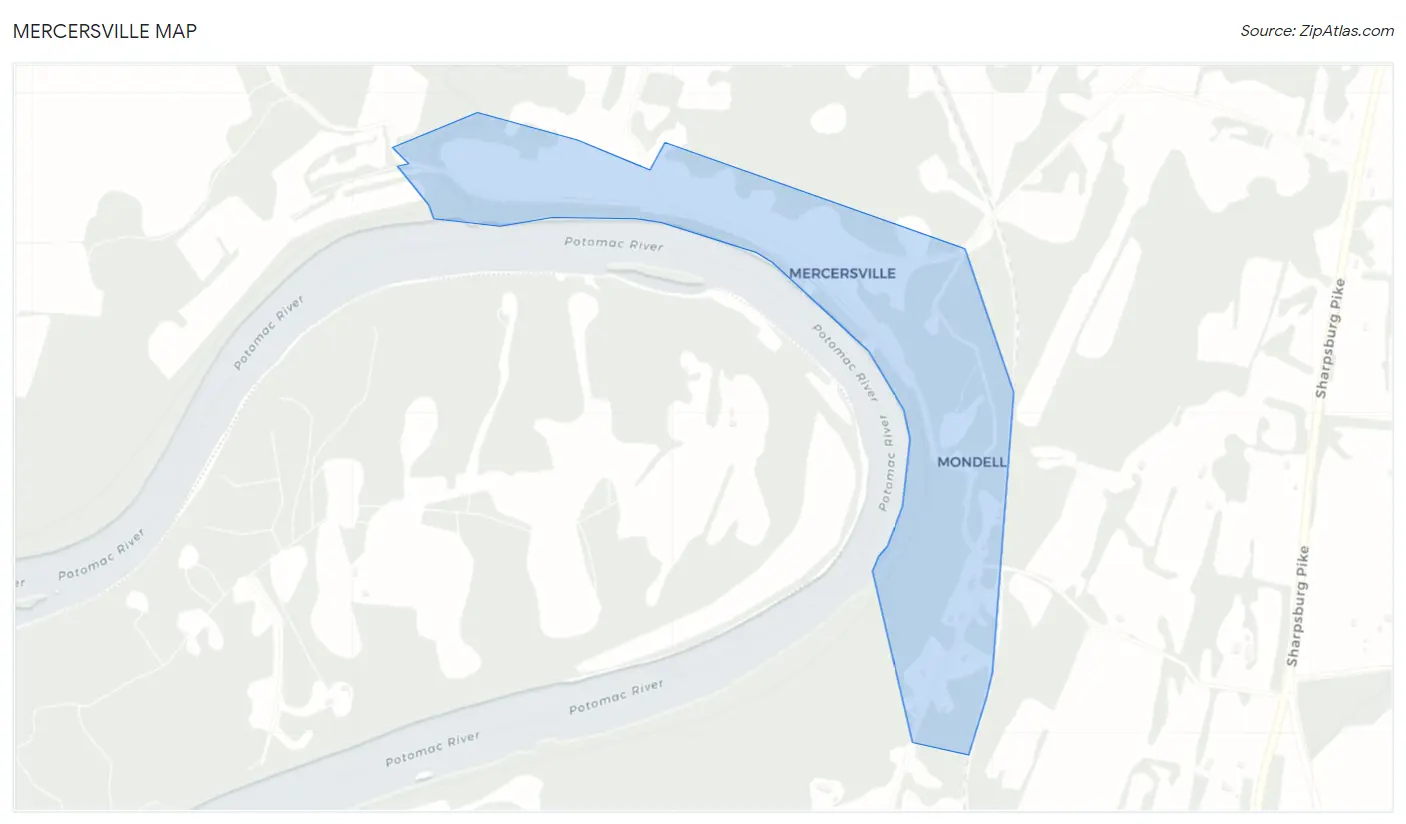
Mercersville Map
Mercersville Overview
$24,190
PER CAPITA INCOME
$47,159
AVG FAMILY INCOME
$47,143
AVG HOUSEHOLD INCOME
0.23
INEQUALITY / GINI INDEX
322
TOTAL POPULATION
139
MALE POPULATION
183
FEMALE POPULATION
75.96
MALES / 100 FEMALES
131.65
FEMALES / 100 MALES
35.9
MEDIAN AGE
2.7
AVG FAMILY SIZE
2.3
AVG HOUSEHOLD SIZE
110
LABOR FORCE [ PEOPLE ]
44.2%
PERCENT IN LABOR FORCE
Income in Mercersville
Income Overview in Mercersville
Per Capita Income in Mercersville is $24,190, while median incomes of families and households are $47,159 and $47,143 respectively.
| Characteristic | Number | Measure |
| Per Capita Income | 322 | $24,190 |
| Median Family Income | 101 | $47,159 |
| Mean Family Income | 101 | $47,082 |
| Median Household Income | 140 | $47,143 |
| Mean Household Income | 140 | $52,669 |
| Income Deficit | 101 | $0 |
| Wage / Income Gap (%) | 322 | 0.00% |
| Wage / Income Gap ($) | 322 | 100.00¢ per $1 |
| Gini / Inequality Index | 322 | 0.23 |
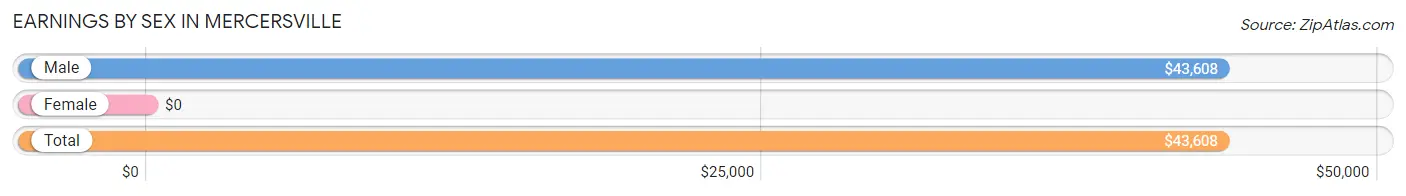
Earnings by Sex in Mercersville
| Sex | Number | Average Earnings |
| Male | 69 (59.0%) | $43,608 |
| Female | 48 (41.0%) | $0 |
| Total | 117 (100.0%) | $43,608 |
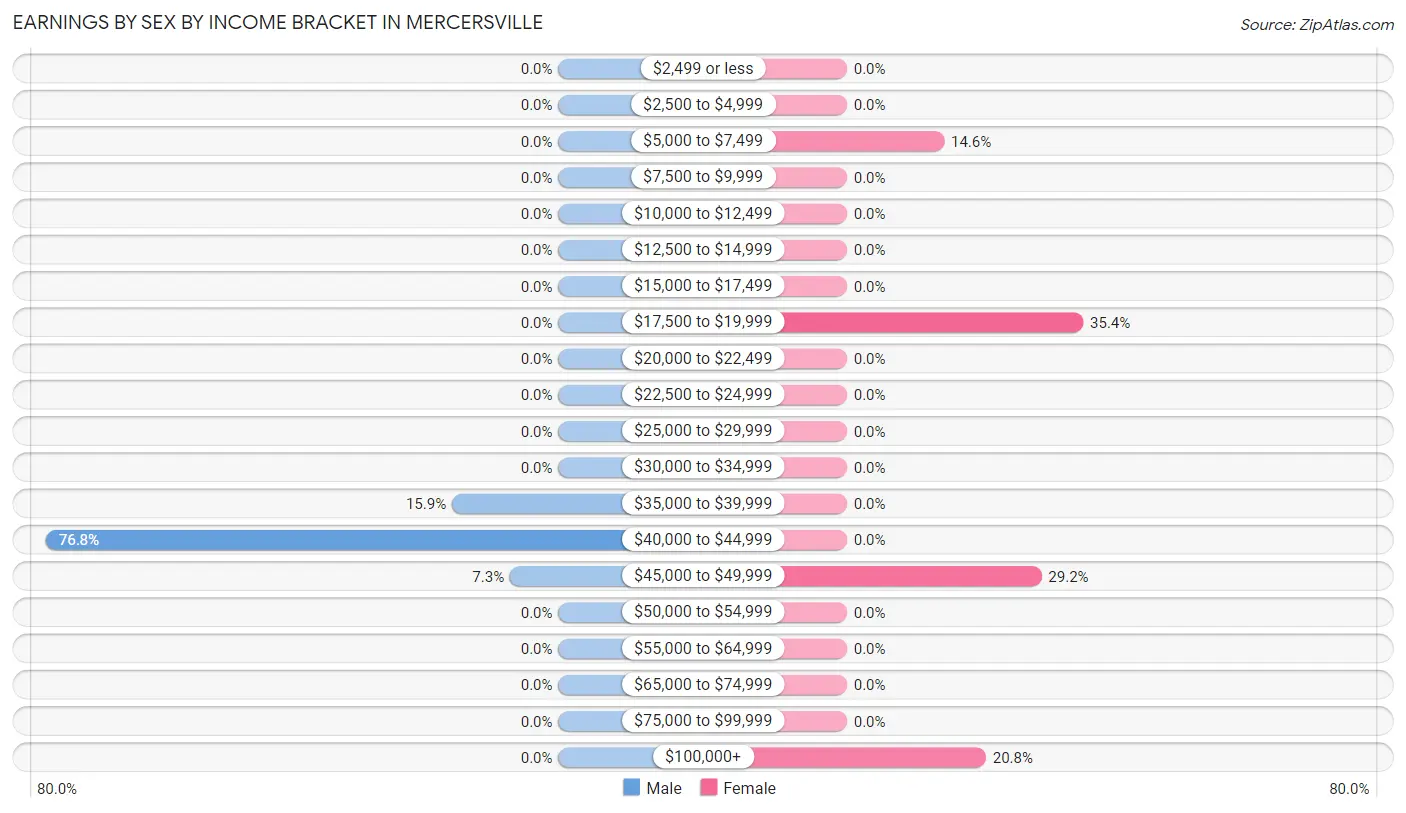
Earnings by Sex by Income Bracket in Mercersville
The most common earnings brackets in Mercersville are $40,000 to $44,999 for men (53 | 76.8%) and $17,500 to $19,999 for women (17 | 35.4%).
| Income | Male | Female |
| $2,499 or less | 0 (0.0%) | 0 (0.0%) |
| $2,500 to $4,999 | 0 (0.0%) | 0 (0.0%) |
| $5,000 to $7,499 | 0 (0.0%) | 7 (14.6%) |
| $7,500 to $9,999 | 0 (0.0%) | 0 (0.0%) |
| $10,000 to $12,499 | 0 (0.0%) | 0 (0.0%) |
| $12,500 to $14,999 | 0 (0.0%) | 0 (0.0%) |
| $15,000 to $17,499 | 0 (0.0%) | 0 (0.0%) |
| $17,500 to $19,999 | 0 (0.0%) | 17 (35.4%) |
| $20,000 to $22,499 | 0 (0.0%) | 0 (0.0%) |
| $22,500 to $24,999 | 0 (0.0%) | 0 (0.0%) |
| $25,000 to $29,999 | 0 (0.0%) | 0 (0.0%) |
| $30,000 to $34,999 | 0 (0.0%) | 0 (0.0%) |
| $35,000 to $39,999 | 11 (15.9%) | 0 (0.0%) |
| $40,000 to $44,999 | 53 (76.8%) | 0 (0.0%) |
| $45,000 to $49,999 | 5 (7.2%) | 14 (29.2%) |
| $50,000 to $54,999 | 0 (0.0%) | 0 (0.0%) |
| $55,000 to $64,999 | 0 (0.0%) | 0 (0.0%) |
| $65,000 to $74,999 | 0 (0.0%) | 0 (0.0%) |
| $75,000 to $99,999 | 0 (0.0%) | 0 (0.0%) |
| $100,000+ | 0 (0.0%) | 10 (20.8%) |
| Total | 69 (100.0%) | 48 (100.0%) |
Earnings by Sex by Educational Attainment in Mercersville
| Educational Attainment | Male Income | Female Income |
| Less than High School | - | - |
| High School Diploma | - | - |
| College or Associate's Degree | - | - |
| Bachelor's Degree | - | - |
| Graduate Degree | - | - |
| Total | $43,608 | $0 |
Family Income in Mercersville
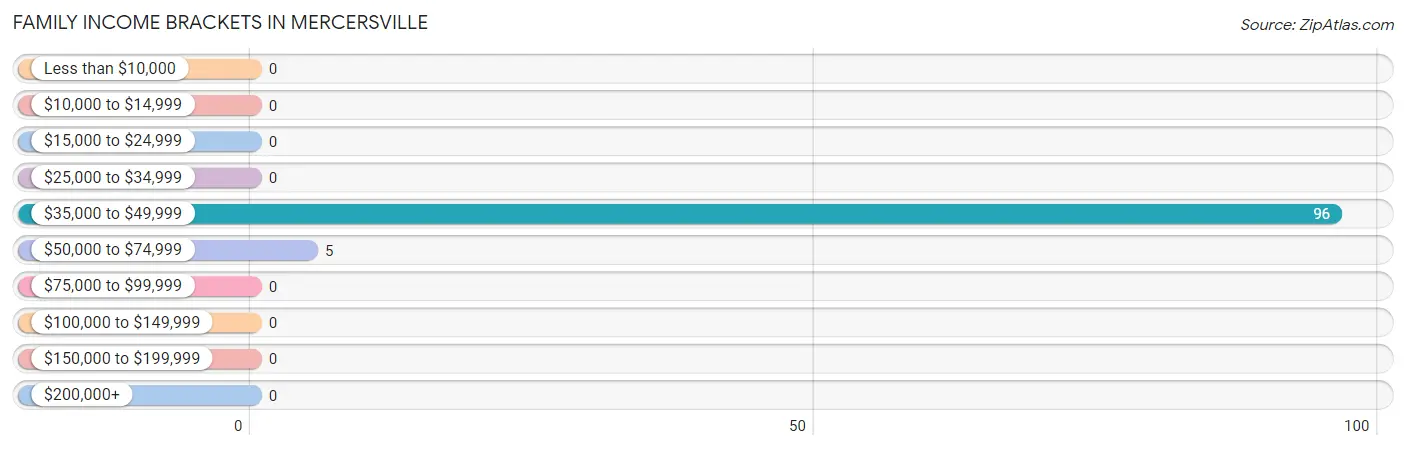
Family Income Brackets in Mercersville
According to the Mercersville family income data, there are 96 families falling into the $35,000 to $49,999 income range, which is the most common income bracket and makes up 95.1% of all families.
| Income Bracket | # Families | % Families |
| Less than $10,000 | 0 | 0.0% |
| $10,000 to $14,999 | 0 | 0.0% |
| $15,000 to $24,999 | 0 | 0.0% |
| $25,000 to $34,999 | 0 | 0.0% |
| $35,000 to $49,999 | 96 | 95.0% |
| $50,000 to $74,999 | 5 | 5.0% |
| $75,000 to $99,999 | 0 | 0.0% |
| $100,000 to $149,999 | 0 | 0.0% |
| $150,000 to $199,999 | 0 | 0.0% |
| $200,000+ | 0 | 0.0% |
Family Income by Famaliy Size in Mercersville
| Income Bracket | # Families | Median Income |
| 2-Person Families | 49 (48.5%) | $0 |
| 3-Person Families | 41 (40.6%) | $0 |
| 4-Person Families | 11 (10.9%) | $0 |
| 5-Person Families | 0 (0.0%) | $0 |
| 6-Person Families | 0 (0.0%) | $0 |
| 7+ Person Families | 0 (0.0%) | $0 |
| Total | 101 (100.0%) | $47,159 |
Family Income by Number of Earners in Mercersville
| Number of Earners | # Families | Median Income |
| No Earners | 44 (43.6%) | $0 |
| 1 Earner | 52 (51.5%) | $0 |
| 2 Earners | 5 (5.0%) | $0 |
| 3+ Earners | 0 (0.0%) | $0 |
| Total | 101 (100.0%) | $47,159 |
Household Income in Mercersville
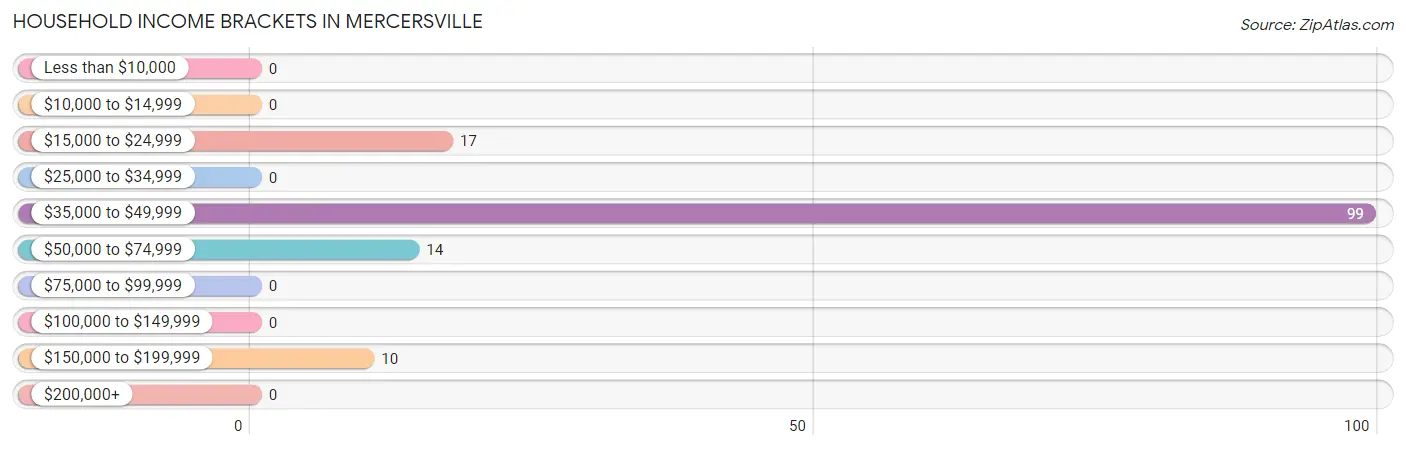
Household Income Brackets in Mercersville
With 99 households falling in the category, the $35,000 to $49,999 income range is the most frequent in Mercersville, accounting for 70.7% of all households.
| Income Bracket | # Households | % Households |
| Less than $10,000 | 0 | 0.0% |
| $10,000 to $14,999 | 0 | 0.0% |
| $15,000 to $24,999 | 17 | 12.1% |
| $25,000 to $34,999 | 0 | 0.0% |
| $35,000 to $49,999 | 99 | 70.7% |
| $50,000 to $74,999 | 14 | 10.0% |
| $75,000 to $99,999 | 0 | 0.0% |
| $100,000 to $149,999 | 0 | 0.0% |
| $150,000 to $199,999 | 10 | 7.1% |
| $200,000+ | 0 | 0.0% |
Household Income by Householder Age in Mercersville
The median household income in Mercersville is $47,143, with the highest median household income of $48,097 found in the 45 to 64 years age bracket for the primary householder. A total of 77 households (55.0%) fall into this category.
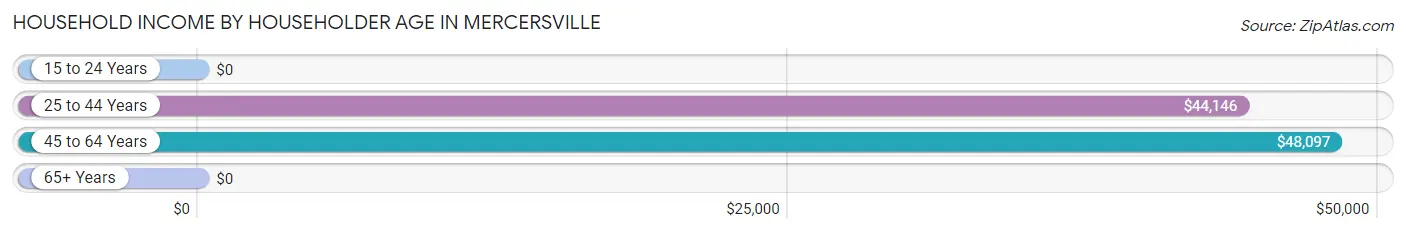
| Income Bracket | # Households | Median Income |
| 15 to 24 Years | 0 (0.0%) | $0 |
| 25 to 44 Years | 54 (38.6%) | $44,146 |
| 45 to 64 Years | 77 (55.0%) | $48,097 |
| 65+ Years | 9 (6.4%) | $0 |
| Total | 140 (100.0%) | $47,143 |
Poverty in Mercersville
Income Below Poverty by Sex and Age in Mercersville
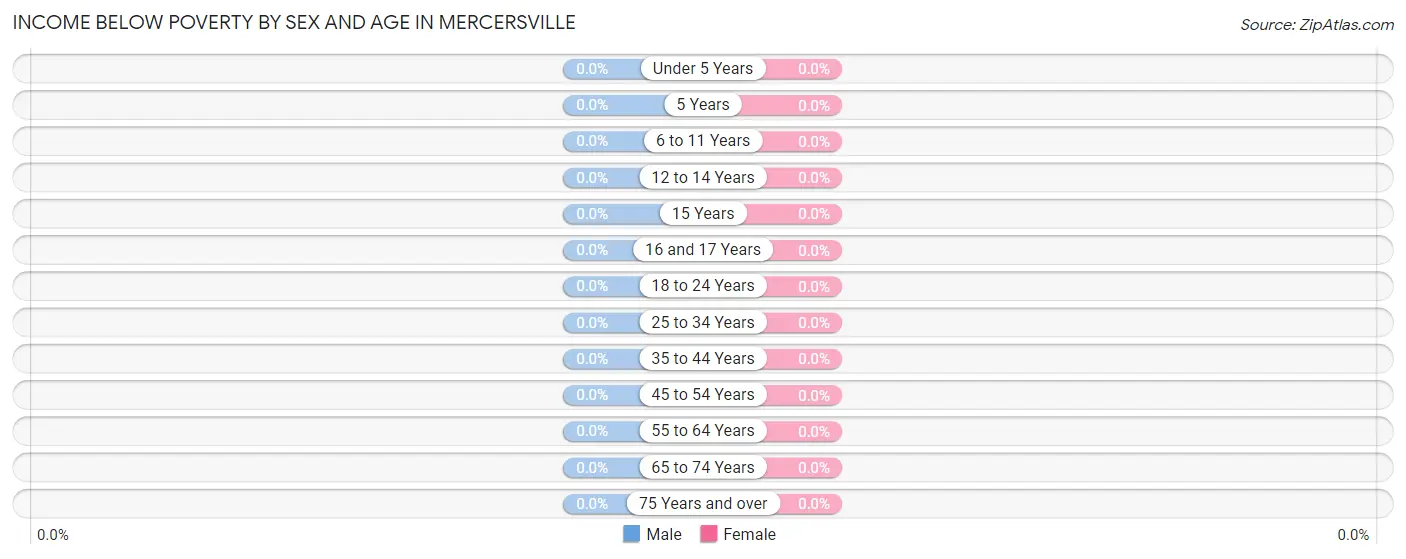
| Age Bracket | Male | Female |
| Under 5 Years | 0 (0.0%) | 0 (0.0%) |
| 5 Years | 0 (0.0%) | 0 (0.0%) |
| 6 to 11 Years | 0 (0.0%) | 0 (0.0%) |
| 12 to 14 Years | 0 (0.0%) | 0 (0.0%) |
| 15 Years | 0 (0.0%) | 0 (0.0%) |
| 16 and 17 Years | 0 (0.0%) | 0 (0.0%) |
| 18 to 24 Years | 0 (0.0%) | 0 (0.0%) |
| 25 to 34 Years | 0 (0.0%) | 0 (0.0%) |
| 35 to 44 Years | 0 (0.0%) | 0 (0.0%) |
| 45 to 54 Years | 0 (0.0%) | 0 (0.0%) |
| 55 to 64 Years | 0 (0.0%) | 0 (0.0%) |
| 65 to 74 Years | 0 (0.0%) | 0 (0.0%) |
| 75 Years and over | 0 (0.0%) | 0 (0.0%) |
| Total | 0 (0.0%) | 0 (0.0%) |
Income Above Poverty by Sex and Age in Mercersville
According to the poverty statistics in Mercersville, males aged 6 to 11 years and females aged under 5 years are the age groups that are most secure financially, with 100.0% of males and 100.0% of females in these age groups living above the poverty line.
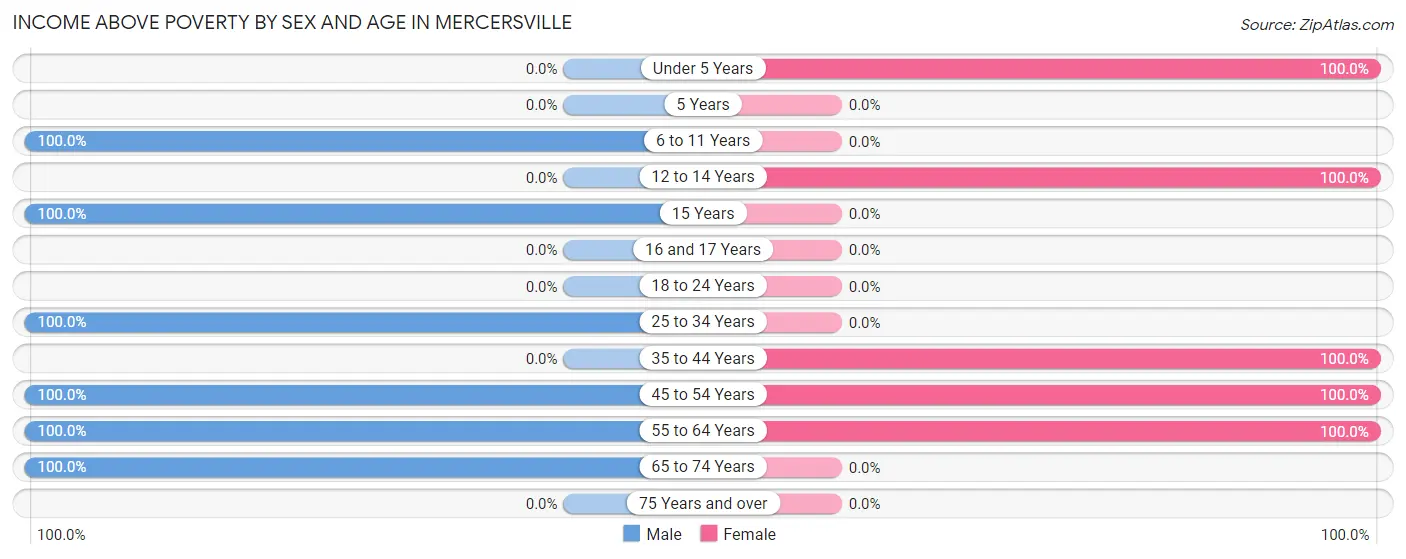
| Age Bracket | Male | Female |
| Under 5 Years | 0 (0.0%) | 39 (100.0%) |
| 5 Years | 0 (0.0%) | 0 (0.0%) |
| 6 to 11 Years | 10 (100.0%) | 0 (0.0%) |
| 12 to 14 Years | 0 (0.0%) | 11 (100.0%) |
| 15 Years | 13 (100.0%) | 0 (0.0%) |
| 16 and 17 Years | 0 (0.0%) | 0 (0.0%) |
| 18 to 24 Years | 0 (0.0%) | 0 (0.0%) |
| 25 to 34 Years | 53 (100.0%) | 0 (0.0%) |
| 35 to 44 Years | 0 (0.0%) | 54 (100.0%) |
| 45 to 54 Years | 11 (100.0%) | 28 (100.0%) |
| 55 to 64 Years | 5 (100.0%) | 51 (100.0%) |
| 65 to 74 Years | 47 (100.0%) | 0 (0.0%) |
| 75 Years and over | 0 (0.0%) | 0 (0.0%) |
| Total | 139 (100.0%) | 183 (100.0%) |
Income Below Poverty Among Married-Couple Families in Mercersville
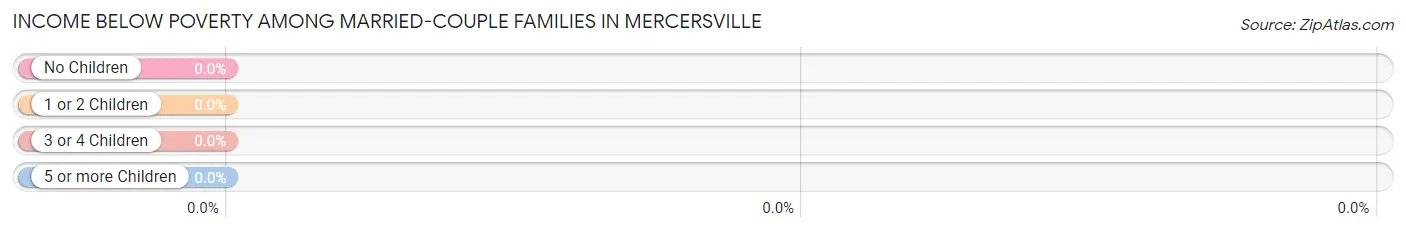
| Children | Above Poverty | Below Poverty |
| No Children | 49 (100.0%) | 0 (0.0%) |
| 1 or 2 Children | 41 (100.0%) | 0 (0.0%) |
| 3 or 4 Children | 0 (0.0%) | 0 (0.0%) |
| 5 or more Children | 0 (0.0%) | 0 (0.0%) |
| Total | 90 (100.0%) | 0 (0.0%) |
Income Below Poverty Among Single-Parent Households in Mercersville
| Children | Single Father | Single Mother |
| No Children | 0 (0.0%) | 0 (0.0%) |
| 1 or 2 Children | 0 (0.0%) | 0 (0.0%) |
| 3 or 4 Children | 0 (0.0%) | 0 (0.0%) |
| 5 or more Children | 0 (0.0%) | 0 (0.0%) |
| Total | 0 (0.0%) | 0 (0.0%) |
Income Below Poverty Among Married-Couple vs Single-Parent Households in Mercersville
| Children | Married-Couple Families | Single-Parent Households |
| No Children | 0 (0.0%) | 0 (0.0%) |
| 1 or 2 Children | 0 (0.0%) | 0 (0.0%) |
| 3 or 4 Children | 0 (0.0%) | 0 (0.0%) |
| 5 or more Children | 0 (0.0%) | 0 (0.0%) |
| Total | 0 (0.0%) | 0 (0.0%) |
Race in Mercersville
The most populous races in Mercersville are , and White / Caucasian (322 | 100.0%).
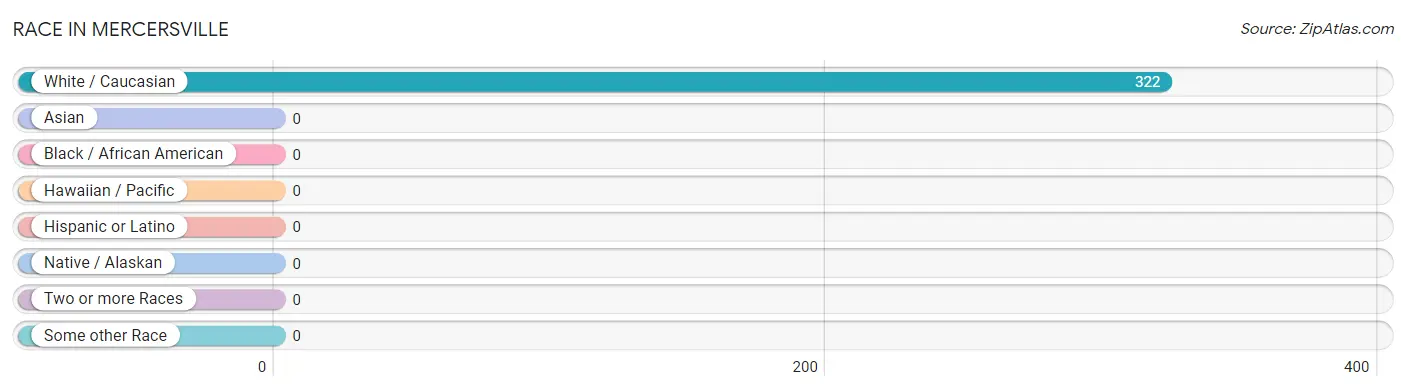
| Race | # Population | % Population |
| Asian | 0 | 0.0% |
| Black / African American | 0 | 0.0% |
| Hawaiian / Pacific | 0 | 0.0% |
| Hispanic or Latino | 0 | 0.0% |
| Native / Alaskan | 0 | 0.0% |
| White / Caucasian | 322 | 100.0% |
| Two or more Races | 0 | 0.0% |
| Some other Race | 0 | 0.0% |
| Total | 322 | 100.0% |
Ancestry in Mercersville
The most populous ancestries reported in Mercersville are English (82 | 25.5%), European (17 | 5.3%), German (11 | 3.4%), Swiss (11 | 3.4%), and British (10 | 3.1%), together accounting for 40.7% of all Mercersville residents.
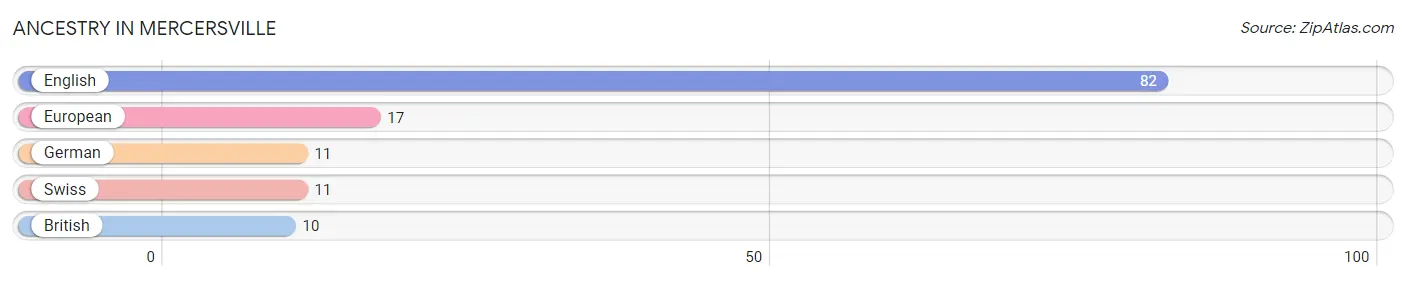
| Ancestry | # Population | % Population |
| British | 10 | 3.1% |
| English | 82 | 25.5% |
| European | 17 | 5.3% |
| German | 11 | 3.4% |
| Swiss | 11 | 3.4% | View All 5 Rows |
Immigrants in Mercersville

| Immigration Origin | # Population | % Population | View All 0 Rows |
Sex and Age in Mercersville
Sex and Age in Mercersville
The most populous age groups in Mercersville are 30 to 34 Years (53 | 38.1%) for men and 60 to 64 Years (51 | 27.9%) for women.
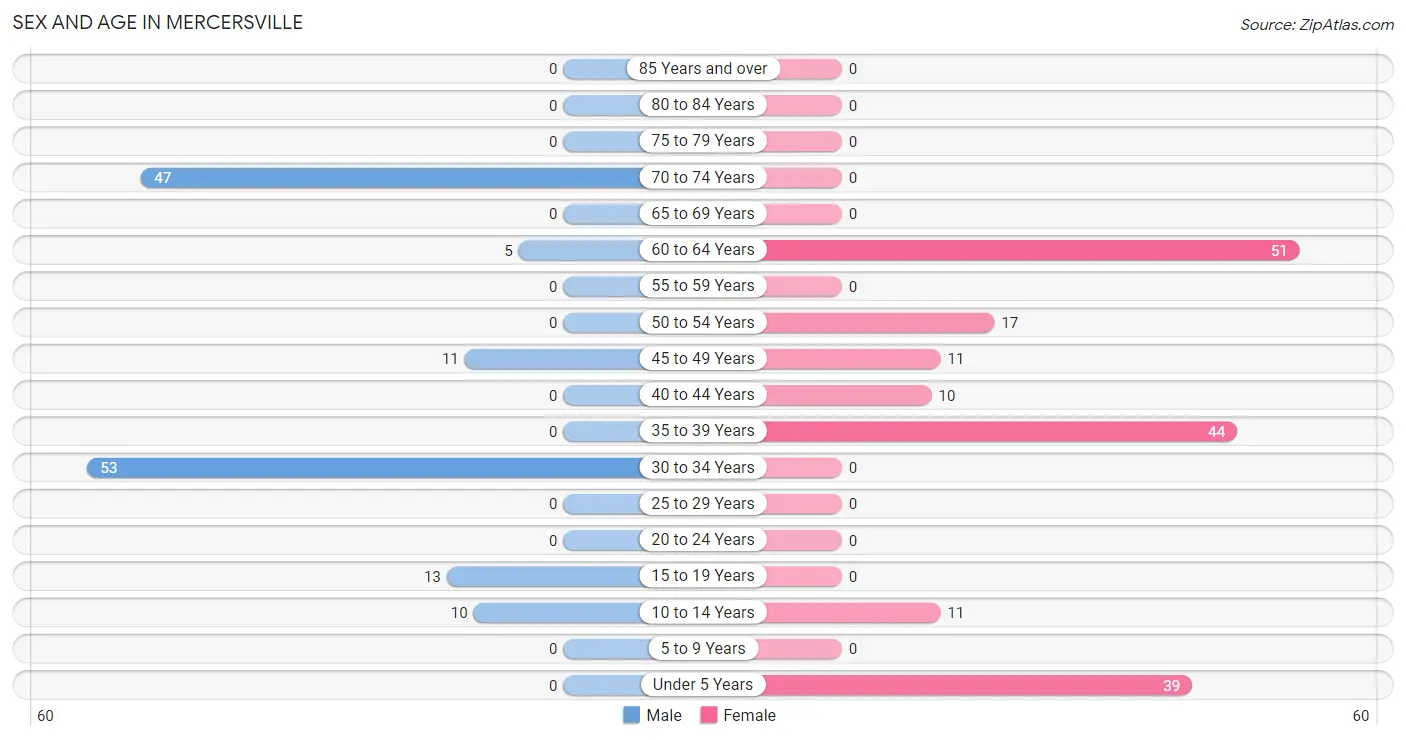
| Age Bracket | Male | Female |
| Under 5 Years | 0 (0.0%) | 39 (21.3%) |
| 5 to 9 Years | 0 (0.0%) | 0 (0.0%) |
| 10 to 14 Years | 10 (7.2%) | 11 (6.0%) |
| 15 to 19 Years | 13 (9.3%) | 0 (0.0%) |
| 20 to 24 Years | 0 (0.0%) | 0 (0.0%) |
| 25 to 29 Years | 0 (0.0%) | 0 (0.0%) |
| 30 to 34 Years | 53 (38.1%) | 0 (0.0%) |
| 35 to 39 Years | 0 (0.0%) | 44 (24.0%) |
| 40 to 44 Years | 0 (0.0%) | 10 (5.5%) |
| 45 to 49 Years | 11 (7.9%) | 11 (6.0%) |
| 50 to 54 Years | 0 (0.0%) | 17 (9.3%) |
| 55 to 59 Years | 0 (0.0%) | 0 (0.0%) |
| 60 to 64 Years | 5 (3.6%) | 51 (27.9%) |
| 65 to 69 Years | 0 (0.0%) | 0 (0.0%) |
| 70 to 74 Years | 47 (33.8%) | 0 (0.0%) |
| 75 to 79 Years | 0 (0.0%) | 0 (0.0%) |
| 80 to 84 Years | 0 (0.0%) | 0 (0.0%) |
| 85 Years and over | 0 (0.0%) | 0 (0.0%) |
| Total | 139 (100.0%) | 183 (100.0%) |
Families and Households in Mercersville
Median Family Size in Mercersville
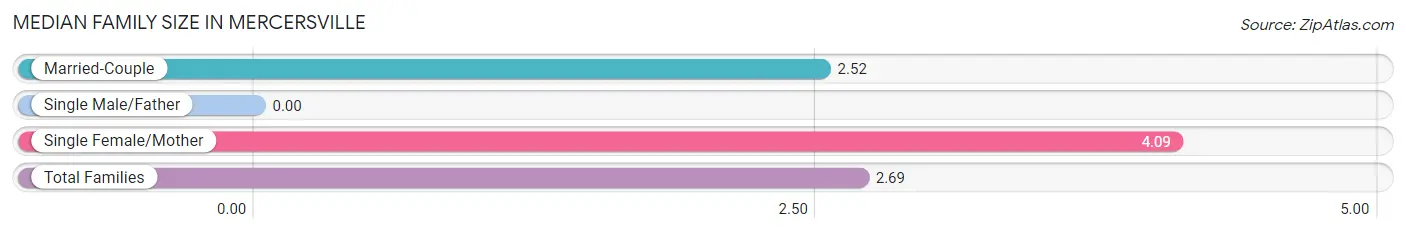
| Family Type | # Families | Family Size |
| Married-Couple | 90 (89.1%) | 2.52 |
| Single Male/Father | 0 (0.0%) | - |
| Single Female/Mother | 11 (10.9%) | 4.09 |
| Total Families | 101 (100.0%) | 2.69 |
Median Household Size in Mercersville
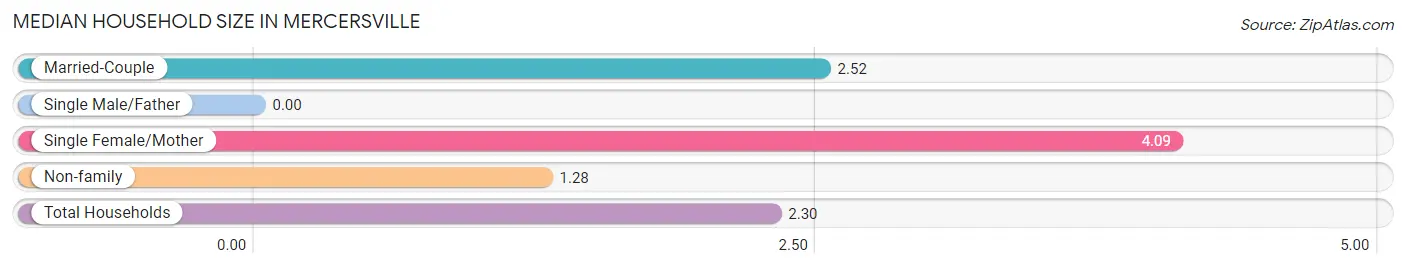
| Household Type | # Households | Household Size |
| Married-Couple | 90 (64.3%) | 2.52 |
| Single Male/Father | 0 (0.0%) | - |
| Single Female/Mother | 11 (7.9%) | 4.09 |
| Non-family | 39 (27.9%) | 1.28 |
| Total Households | 140 (100.0%) | 2.30 |
Household Size by Marriage Status in Mercersville
Out of a total of 140 households in Mercersville, 101 (72.1%) are family households, while 39 (27.9%) are nonfamily households. The most numerous type of family households are 2-person households, comprising 49, and the most common type of nonfamily households are 1-person households, comprising 29.
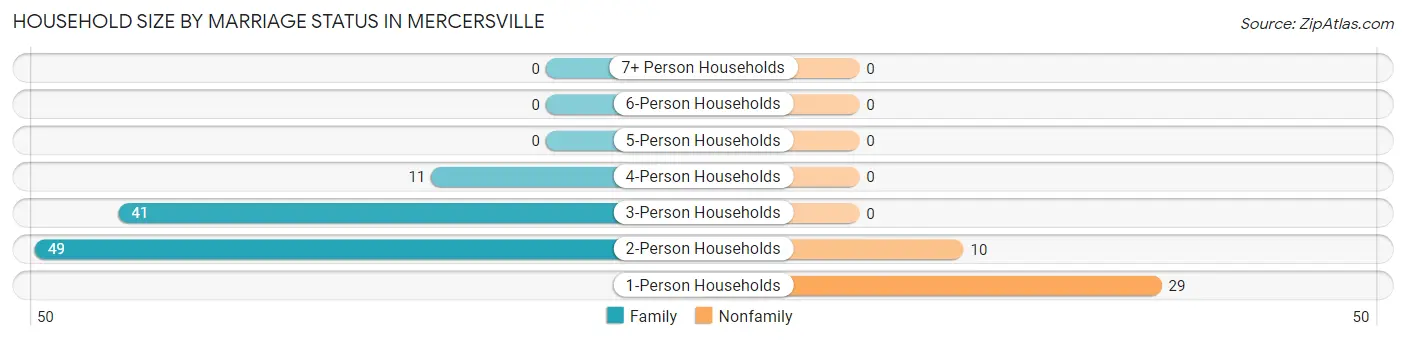
| Household Size | Family Households | Nonfamily Households |
| 1-Person Households | - | 29 (20.7%) |
| 2-Person Households | 49 (35.0%) | 10 (7.1%) |
| 3-Person Households | 41 (29.3%) | 0 (0.0%) |
| 4-Person Households | 11 (7.9%) | 0 (0.0%) |
| 5-Person Households | 0 (0.0%) | 0 (0.0%) |
| 6-Person Households | 0 (0.0%) | 0 (0.0%) |
| 7+ Person Households | 0 (0.0%) | 0 (0.0%) |
| Total | 101 (72.1%) | 39 (27.9%) |
Female Fertility in Mercersville
Fertility by Age in Mercersville
| Age Bracket | Women with Births | Births / 1,000 Women |
| 15 to 19 years | 0 (0.0%) | 0.0 |
| 20 to 34 years | 0 (0.0%) | 0.0 |
| 35 to 50 years | 0 (0.0%) | 0.0 |
| Total | 0 (0.0%) | 0.0 |
Fertility by Age by Marriage Status in Mercersville
| Age Bracket | Married | Unmarried |
| 15 to 19 years | 0 (0.0%) | 0 (0.0%) |
| 20 to 34 years | 0 (0.0%) | 0 (0.0%) |
| 35 to 50 years | 0 (0.0%) | 0 (0.0%) |
| Total | 0 (0.0%) | 0 (0.0%) |
Fertility by Education in Mercersville
| Educational Attainment | Women with Births | Births / 1,000 Women |
| Less than High School | 0 (0.0%) | 0.0 |
| High School Diploma | 0 (0.0%) | 0.0 |
| College or Associate's Degree | 0 (0.0%) | 0.0 |
| Bachelor's Degree | 0 (0.0%) | 0.0 |
| Graduate Degree | 0 (0.0%) | 0.0 |
| Total | 0 (0.0%) | 0.0 |
Fertility by Education by Marriage Status in Mercersville
| Educational Attainment | Married | Unmarried |
| Less than High School | 0 (0.0%) | 0 (0.0%) |
| High School Diploma | 0 (0.0%) | 0 (0.0%) |
| College or Associate's Degree | 0 (0.0%) | 0 (0.0%) |
| Bachelor's Degree | 0 (0.0%) | 0 (0.0%) |
| Graduate Degree | 0 (0.0%) | 0 (0.0%) |
| Total | 0 (0.0%) | 0 (0.0%) |
Employment Characteristics in Mercersville
Employment by Class of Employer in Mercersville
Among the 110 employed individuals in Mercersville, private company employees (72 | 65.4%), self-employed (not incorporated) (17 | 15.4%), and self-employed (incorporated) (11 | 10.0%) make up the most common classes of employment.
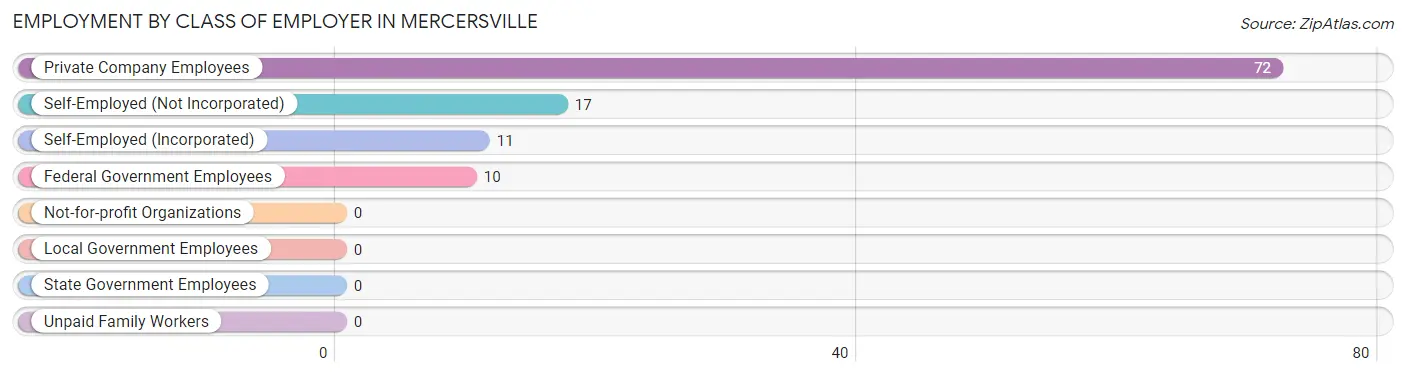
| Employer Class | # Employees | % Employees |
| Private Company Employees | 72 | 65.4% |
| Self-Employed (Incorporated) | 11 | 10.0% |
| Self-Employed (Not Incorporated) | 17 | 15.4% |
| Not-for-profit Organizations | 0 | 0.0% |
| Local Government Employees | 0 | 0.0% |
| State Government Employees | 0 | 0.0% |
| Federal Government Employees | 10 | 9.1% |
| Unpaid Family Workers | 0 | 0.0% |
| Total | 110 | 100.0% |
Employment Status by Age in Mercersville
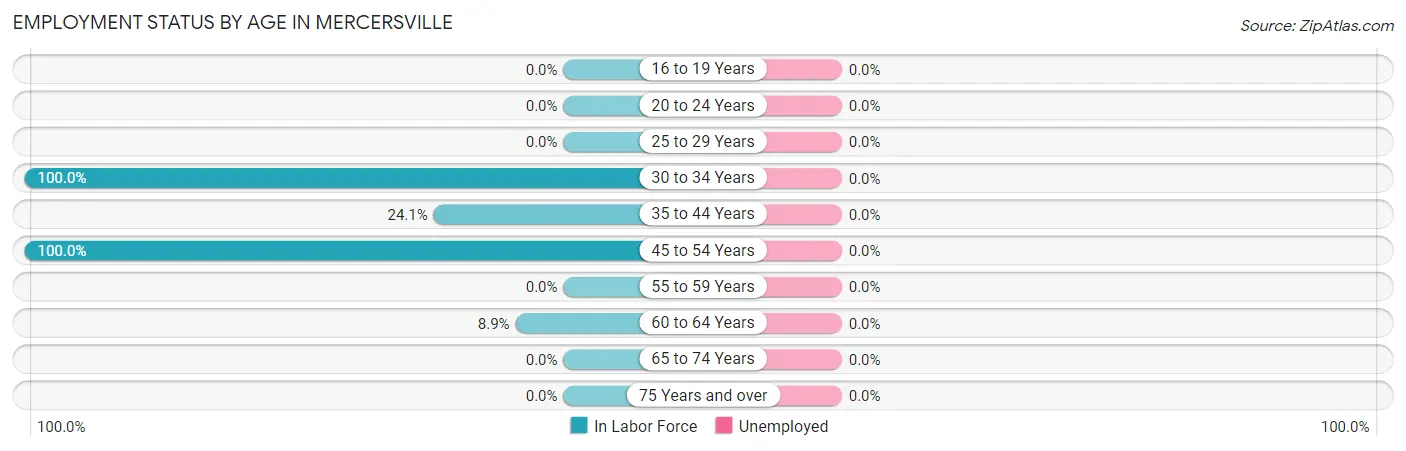
| Age Bracket | In Labor Force | Unemployed |
| 16 to 19 Years | 0 (0.0%) | 0 (0.0%) |
| 20 to 24 Years | 0 (0.0%) | 0 (0.0%) |
| 25 to 29 Years | 0 (0.0%) | 0 (0.0%) |
| 30 to 34 Years | 53 (100.0%) | 0 (0.0%) |
| 35 to 44 Years | 13 (24.1%) | 0 (0.0%) |
| 45 to 54 Years | 39 (100.0%) | 0 (0.0%) |
| 55 to 59 Years | 0 (0.0%) | 0 (0.0%) |
| 60 to 64 Years | 5 (8.9%) | 0 (0.0%) |
| 65 to 74 Years | 0 (0.0%) | 0 (0.0%) |
| 75 Years and over | 0 (0.0%) | 0 (0.0%) |
| Total | 110 (44.2%) | 0 (0.0%) |
Employment Status by Educational Attainment in Mercersville
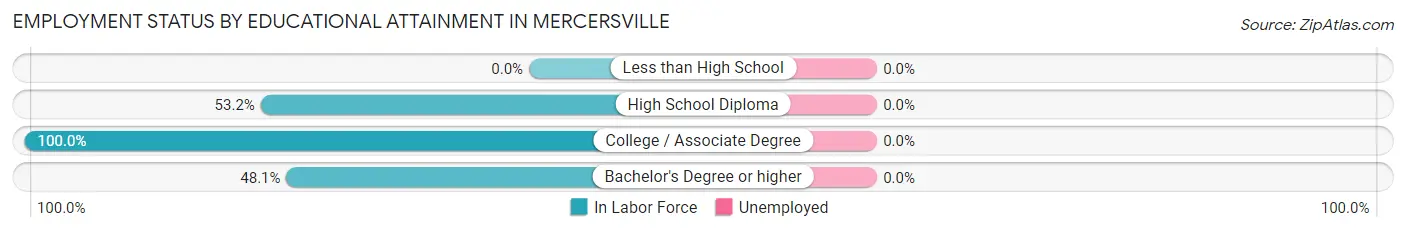
| Educational Attainment | In Labor Force | Unemployed |
| Less than High School | 0 (0.0%) | 0 (0.0%) |
| High School Diploma | 58 (53.2%) | 0 (0.0%) |
| College / Associate Degree | 14 (100.0%) | 0 (0.0%) |
| Bachelor's Degree or higher | 38 (48.1%) | 0 (0.0%) |
| Total | 110 (54.5%) | 0 (0.0%) |
Employment Occupations by Sex in Mercersville
Management, Business, Science and Arts Occupations
The most common Management, Business, Science and Arts occupations in Mercersville are Computers, Engineering & Science (53 | 48.2%), Architecture & Engineering (53 | 48.2%), and Management (10 | 9.1%).
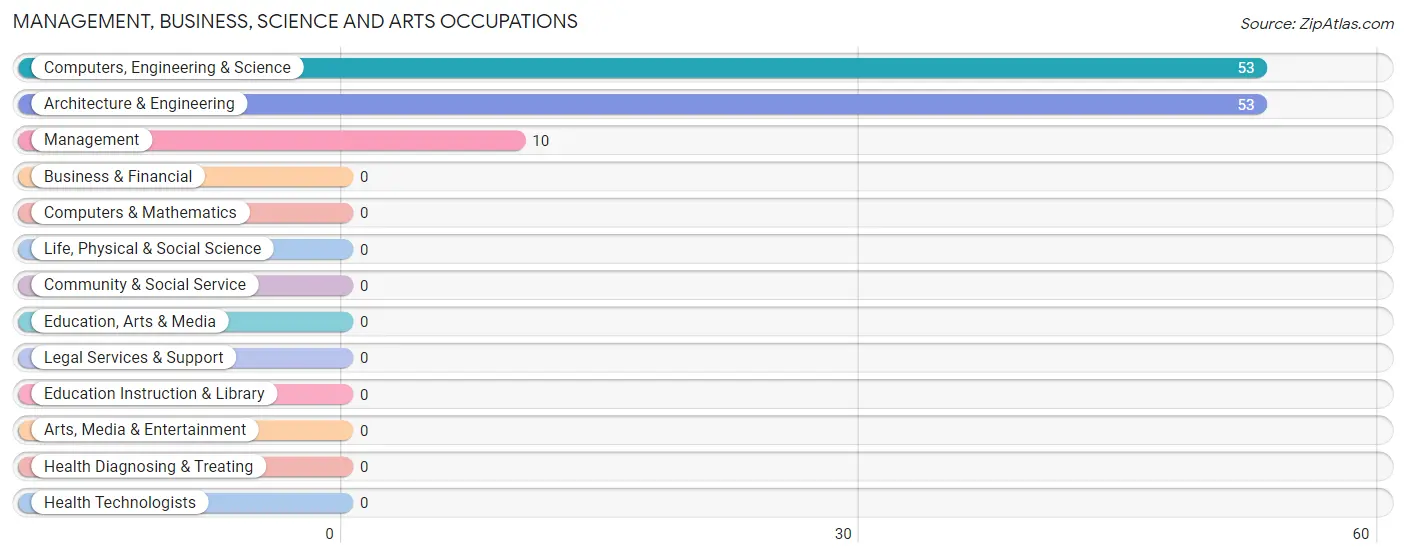
Management, Business, Science and Arts Occupations by Sex
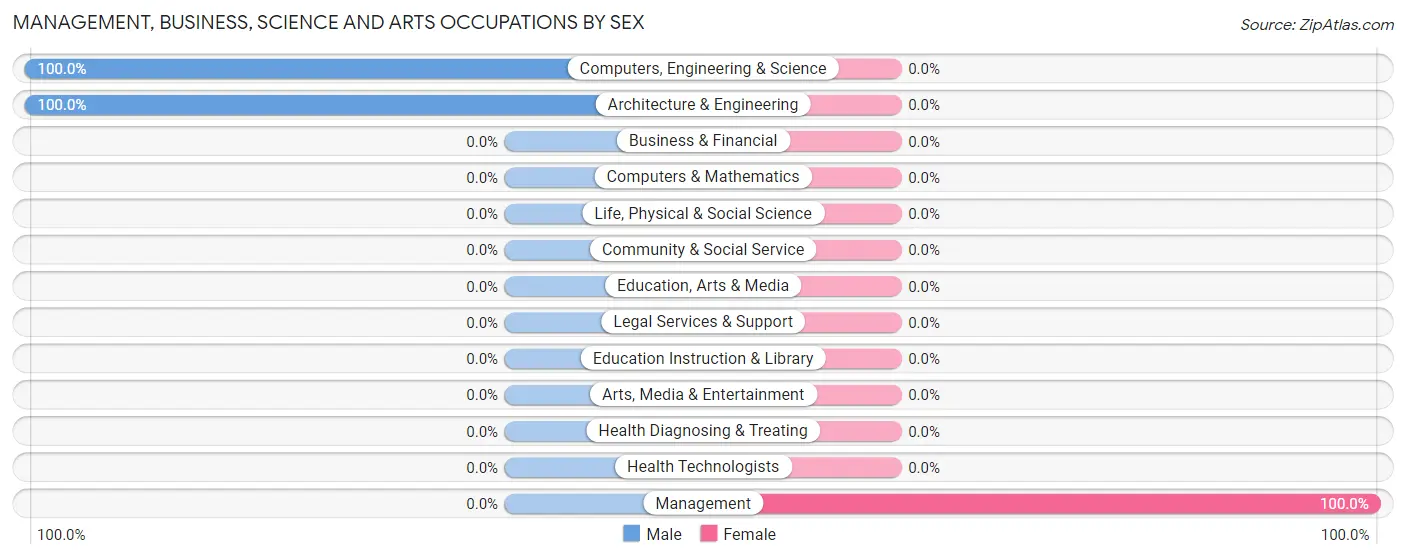
| Occupation | Male | Female |
| Management | 0 (0.0%) | 10 (100.0%) |
| Business & Financial | 0 (0.0%) | 0 (0.0%) |
| Computers, Engineering & Science | 53 (100.0%) | 0 (0.0%) |
| Computers & Mathematics | 0 (0.0%) | 0 (0.0%) |
| Architecture & Engineering | 53 (100.0%) | 0 (0.0%) |
| Life, Physical & Social Science | 0 (0.0%) | 0 (0.0%) |
| Community & Social Service | 0 (0.0%) | 0 (0.0%) |
| Education, Arts & Media | 0 (0.0%) | 0 (0.0%) |
| Legal Services & Support | 0 (0.0%) | 0 (0.0%) |
| Education Instruction & Library | 0 (0.0%) | 0 (0.0%) |
| Arts, Media & Entertainment | 0 (0.0%) | 0 (0.0%) |
| Health Diagnosing & Treating | 0 (0.0%) | 0 (0.0%) |
| Health Technologists | 0 (0.0%) | 0 (0.0%) |
| Total (Category) | 53 (84.1%) | 10 (15.9%) |
| Total (Overall) | 69 (62.7%) | 41 (37.3%) |
Services Occupations
The most common Services occupations in Mercersville are , and Cleaning & Maintenance (16 | 14.5%).
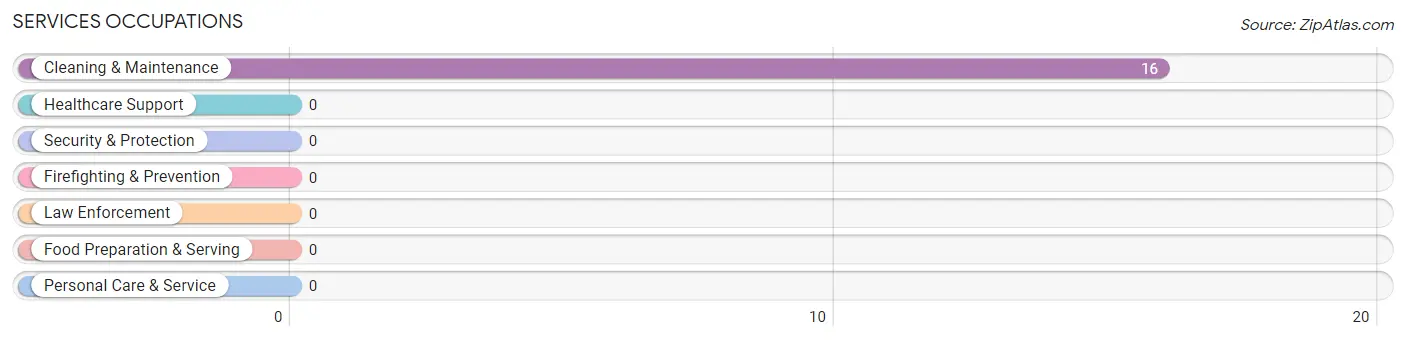
Services Occupations by Sex
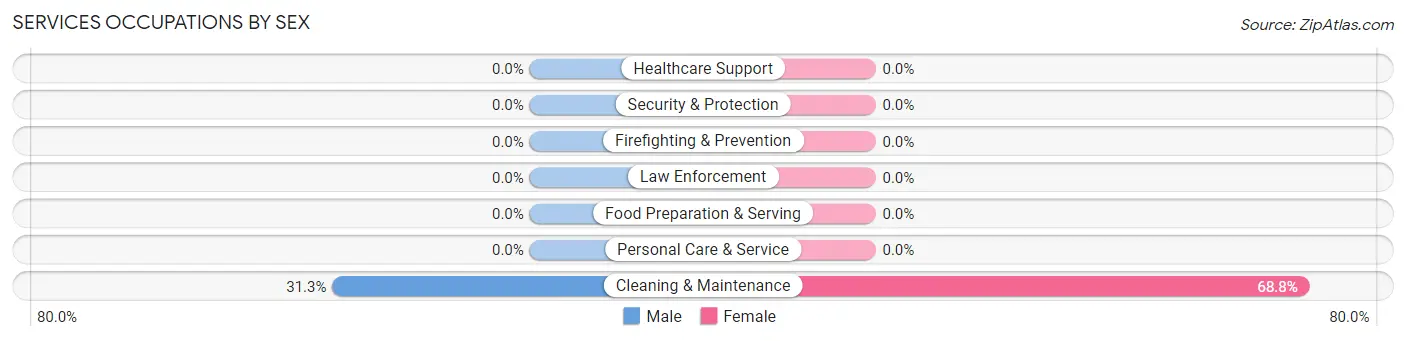
| Occupation | Male | Female |
| Healthcare Support | 0 (0.0%) | 0 (0.0%) |
| Security & Protection | 0 (0.0%) | 0 (0.0%) |
| Firefighting & Prevention | 0 (0.0%) | 0 (0.0%) |
| Law Enforcement | 0 (0.0%) | 0 (0.0%) |
| Food Preparation & Serving | 0 (0.0%) | 0 (0.0%) |
| Cleaning & Maintenance | 5 (31.2%) | 11 (68.8%) |
| Personal Care & Service | 0 (0.0%) | 0 (0.0%) |
| Total (Category) | 5 (31.2%) | 11 (68.8%) |
| Total (Overall) | 69 (62.7%) | 41 (37.3%) |
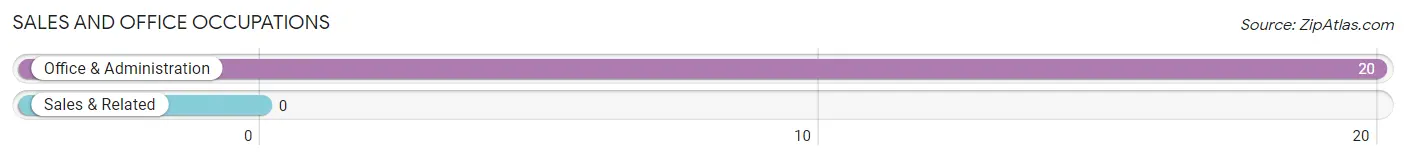
Sales and Office Occupations
The most common Sales and Office occupations in Mercersville are , and Office & Administration (20 | 18.2%).
Sales and Office Occupations by Sex

| Occupation | Male | Female |
| Sales & Related | 0 (0.0%) | 0 (0.0%) |
| Office & Administration | 0 (0.0%) | 20 (100.0%) |
| Total (Category) | 0 (0.0%) | 20 (100.0%) |
| Total (Overall) | 69 (62.7%) | 41 (37.3%) |
Natural Resources, Construction and Maintenance Occupations
The most common Natural Resources, Construction and Maintenance occupations in Mercersville are , and Farming, Fishing & Forestry (11 | 10.0%).

Natural Resources, Construction and Maintenance Occupations by Sex
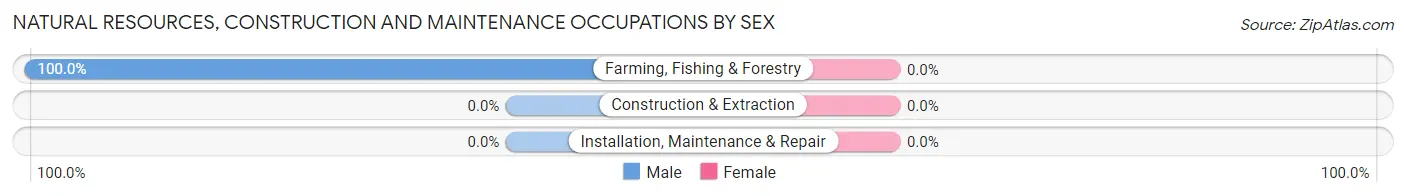
| Occupation | Male | Female |
| Farming, Fishing & Forestry | 11 (100.0%) | 0 (0.0%) |
| Construction & Extraction | 0 (0.0%) | 0 (0.0%) |
| Installation, Maintenance & Repair | 0 (0.0%) | 0 (0.0%) |
| Total (Category) | 11 (100.0%) | 0 (0.0%) |
| Total (Overall) | 69 (62.7%) | 41 (37.3%) |
Production, Transportation and Moving Occupations
Production, Transportation and Moving Occupations by Sex
| Occupation | Male | Female |
| Production | 0 (0.0%) | 0 (0.0%) |
| Transportation | 0 (0.0%) | 0 (0.0%) |
| Material Moving | 0 (0.0%) | 0 (0.0%) |
| Total (Category) | 0 (0.0%) | 0 (0.0%) |
| Total (Overall) | 69 (62.7%) | 41 (37.3%) |
Employment Industries by Sex in Mercersville
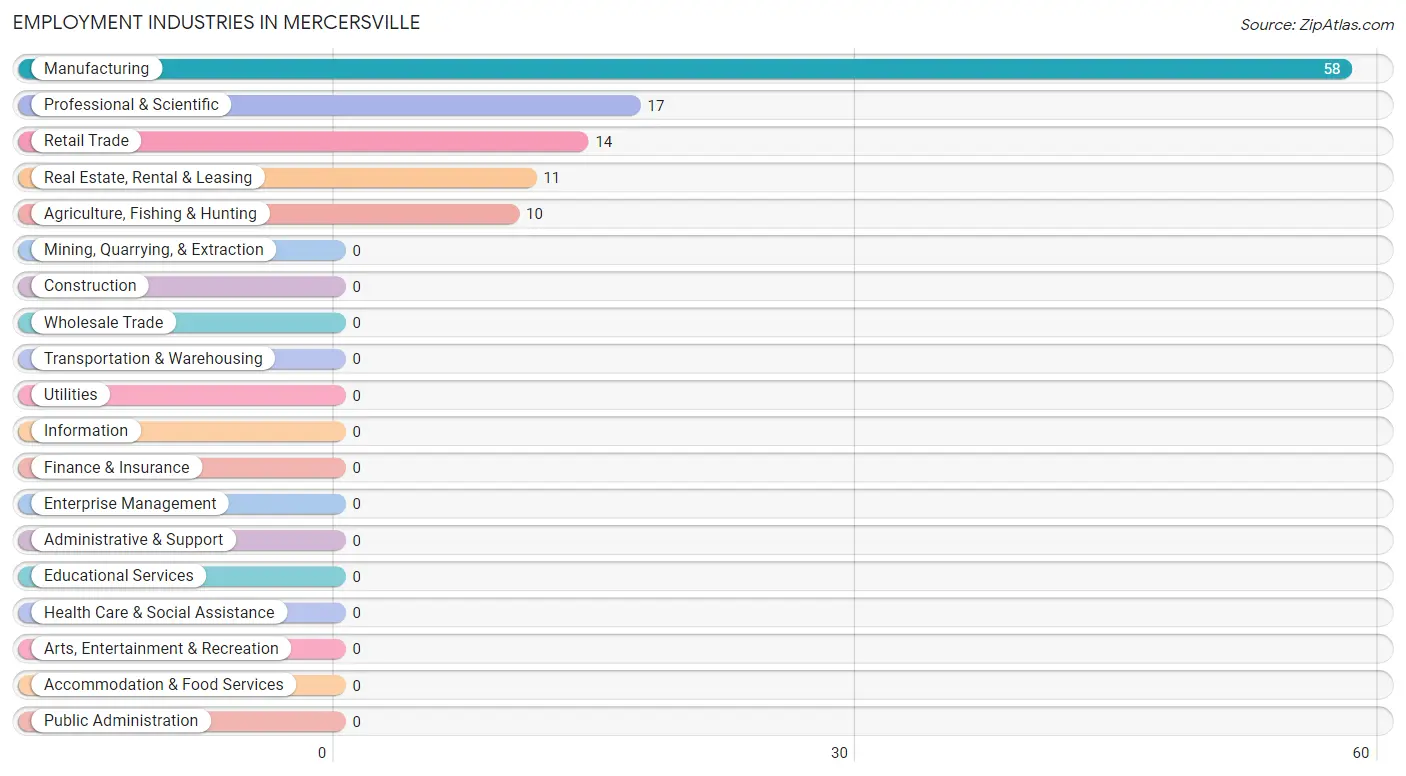
Employment Industries in Mercersville
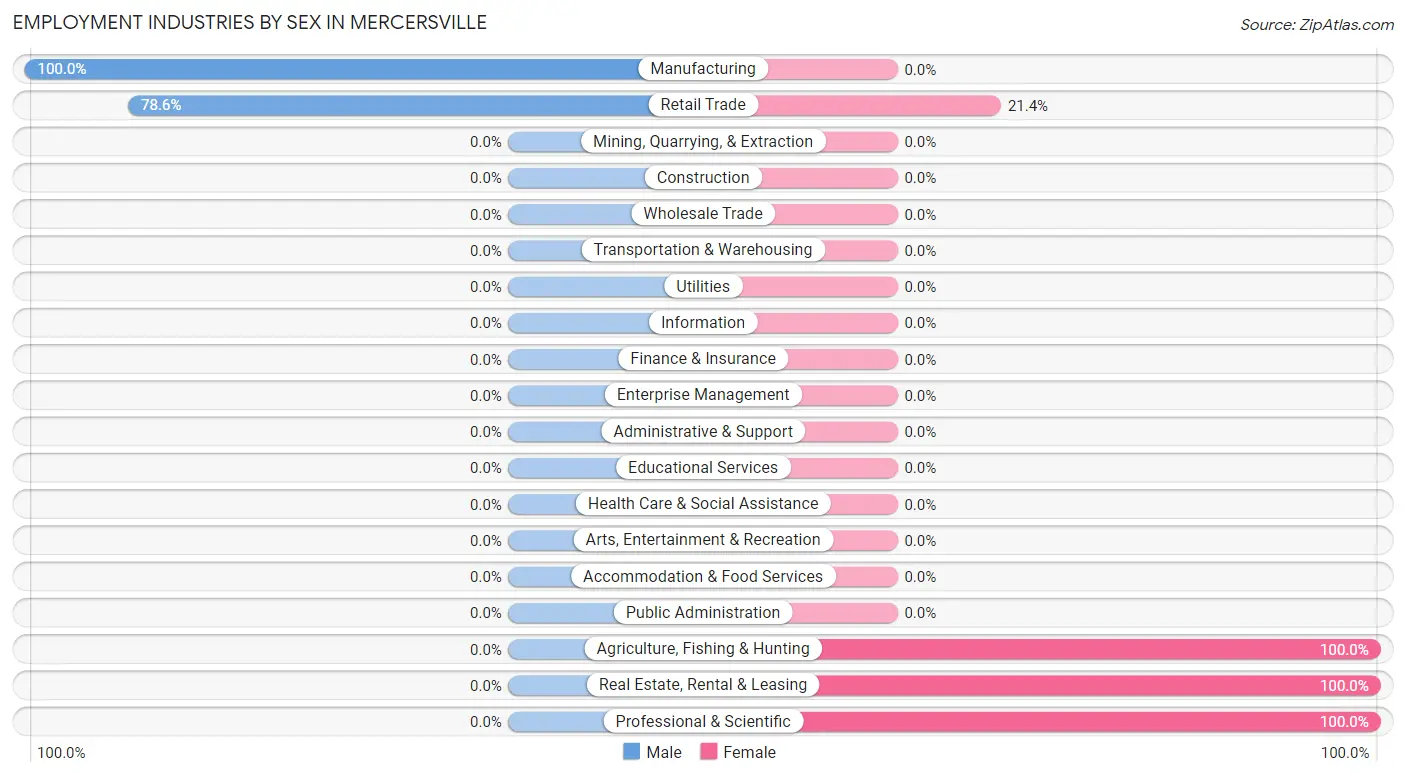
The major employment industries in Mercersville include Manufacturing (58 | 52.7%), Professional & Scientific (17 | 15.4%), Retail Trade (14 | 12.7%), Real Estate, Rental & Leasing (11 | 10.0%), and Agriculture, Fishing & Hunting (10 | 9.1%).
Employment Industries by Sex in Mercersville
The Mercersville industries that see more men than women are Manufacturing (100.0%), and Retail Trade (78.6%), whereas the industries that tend to have a higher number of women are Agriculture, Fishing & Hunting (100.0%), Real Estate, Rental & Leasing (100.0%), and Professional & Scientific (100.0%).
| Industry | Male | Female |
| Agriculture, Fishing & Hunting | 0 (0.0%) | 10 (100.0%) |
| Mining, Quarrying, & Extraction | 0 (0.0%) | 0 (0.0%) |
| Construction | 0 (0.0%) | 0 (0.0%) |
| Manufacturing | 58 (100.0%) | 0 (0.0%) |
| Wholesale Trade | 0 (0.0%) | 0 (0.0%) |
| Retail Trade | 11 (78.6%) | 3 (21.4%) |
| Transportation & Warehousing | 0 (0.0%) | 0 (0.0%) |
| Utilities | 0 (0.0%) | 0 (0.0%) |
| Information | 0 (0.0%) | 0 (0.0%) |
| Finance & Insurance | 0 (0.0%) | 0 (0.0%) |
| Real Estate, Rental & Leasing | 0 (0.0%) | 11 (100.0%) |
| Professional & Scientific | 0 (0.0%) | 17 (100.0%) |
| Enterprise Management | 0 (0.0%) | 0 (0.0%) |
| Administrative & Support | 0 (0.0%) | 0 (0.0%) |
| Educational Services | 0 (0.0%) | 0 (0.0%) |
| Health Care & Social Assistance | 0 (0.0%) | 0 (0.0%) |
| Arts, Entertainment & Recreation | 0 (0.0%) | 0 (0.0%) |
| Accommodation & Food Services | 0 (0.0%) | 0 (0.0%) |
| Public Administration | 0 (0.0%) | 0 (0.0%) |
| Total | 69 (62.7%) | 41 (37.3%) |
Education in Mercersville
School Enrollment in Mercersville
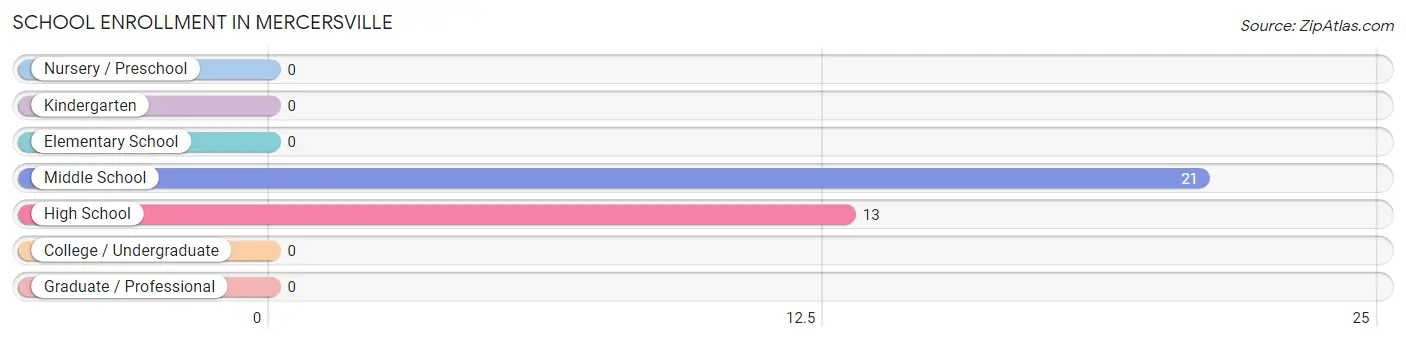
The most common levels of schooling among the 34 students in Mercersville are middle school (21 | 61.8%), and high school (13 | 38.2%).
| School Level | # Students | % Students |
| Nursery / Preschool | 0 | 0.0% |
| Kindergarten | 0 | 0.0% |
| Elementary School | 0 | 0.0% |
| Middle School | 21 | 61.8% |
| High School | 13 | 38.2% |
| College / Undergraduate | 0 | 0.0% |
| Graduate / Professional | 0 | 0.0% |
| Total | 34 | 100.0% |
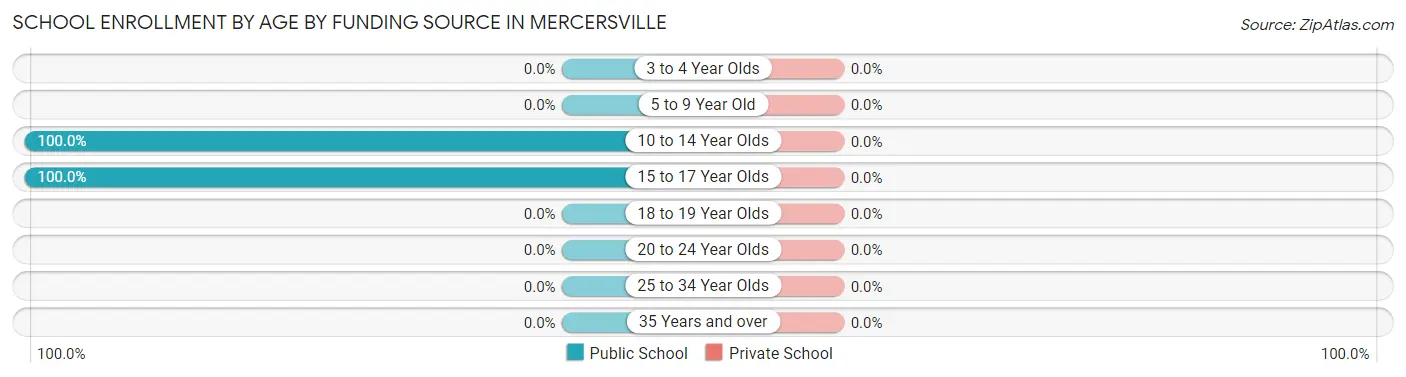
School Enrollment by Age by Funding Source in Mercersville
| Age Bracket | Public School | Private School |
| 3 to 4 Year Olds | 0 (0.0%) | 0 (0.0%) |
| 5 to 9 Year Old | 0 (0.0%) | 0 (0.0%) |
| 10 to 14 Year Olds | 21 (100.0%) | 0 (0.0%) |
| 15 to 17 Year Olds | 13 (100.0%) | 0 (0.0%) |
| 18 to 19 Year Olds | 0 (0.0%) | 0 (0.0%) |
| 20 to 24 Year Olds | 0 (0.0%) | 0 (0.0%) |
| 25 to 34 Year Olds | 0 (0.0%) | 0 (0.0%) |
| 35 Years and over | 0 (0.0%) | 0 (0.0%) |
| Total | 34 (100.0%) | 0 (0.0%) |
Educational Attainment by Field of Study in Mercersville
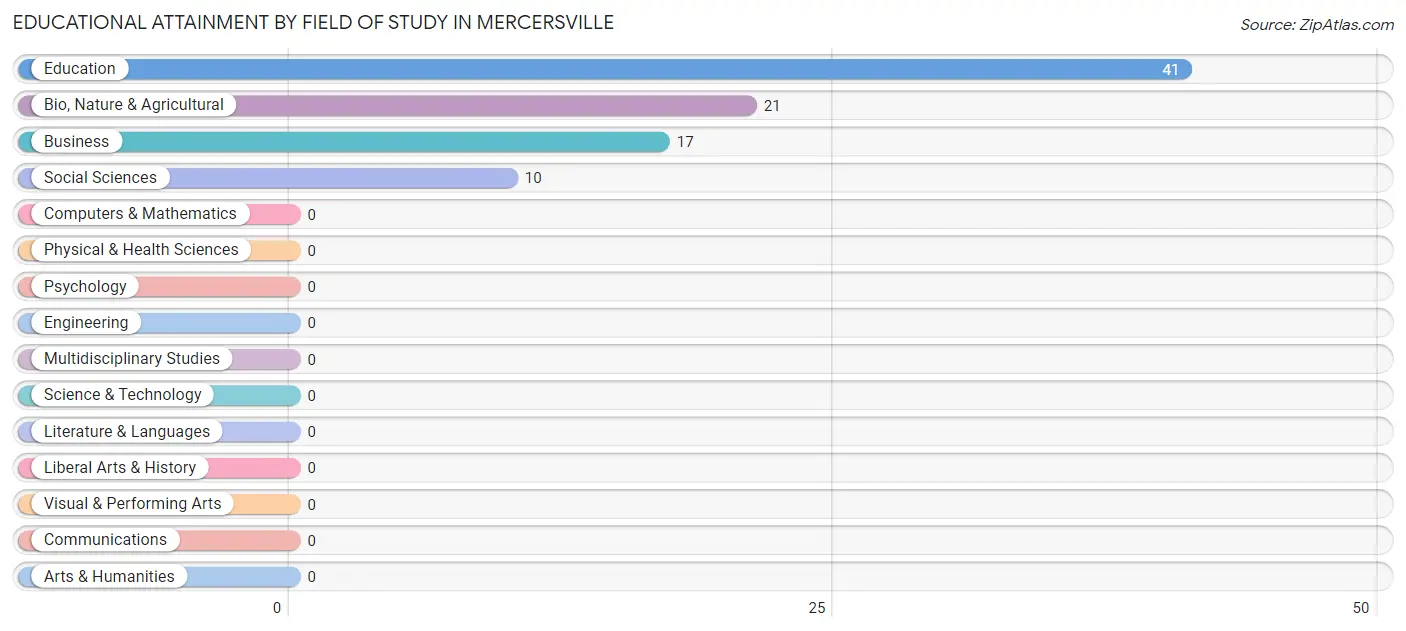
Education (41 | 46.1%), bio, nature & agricultural (21 | 23.6%), business (17 | 19.1%), and social sciences (10 | 11.2%) are the most common fields of study among 89 individuals in Mercersville who have obtained a bachelor's degree or higher.
| Field of Study | # Graduates | % Graduates |
| Computers & Mathematics | 0 | 0.0% |
| Bio, Nature & Agricultural | 21 | 23.6% |
| Physical & Health Sciences | 0 | 0.0% |
| Psychology | 0 | 0.0% |
| Social Sciences | 10 | 11.2% |
| Engineering | 0 | 0.0% |
| Multidisciplinary Studies | 0 | 0.0% |
| Science & Technology | 0 | 0.0% |
| Business | 17 | 19.1% |
| Education | 41 | 46.1% |
| Literature & Languages | 0 | 0.0% |
| Liberal Arts & History | 0 | 0.0% |
| Visual & Performing Arts | 0 | 0.0% |
| Communications | 0 | 0.0% |
| Arts & Humanities | 0 | 0.0% |
| Total | 89 | 100.0% |
Transportation & Commute in Mercersville
Vehicle Availability by Sex in Mercersville
The most prevalent vehicle ownership categories in Mercersville are males with 2 vehicles (53, accounting for 76.8%) and females with 2 vehicles (3, making up 129.3%).
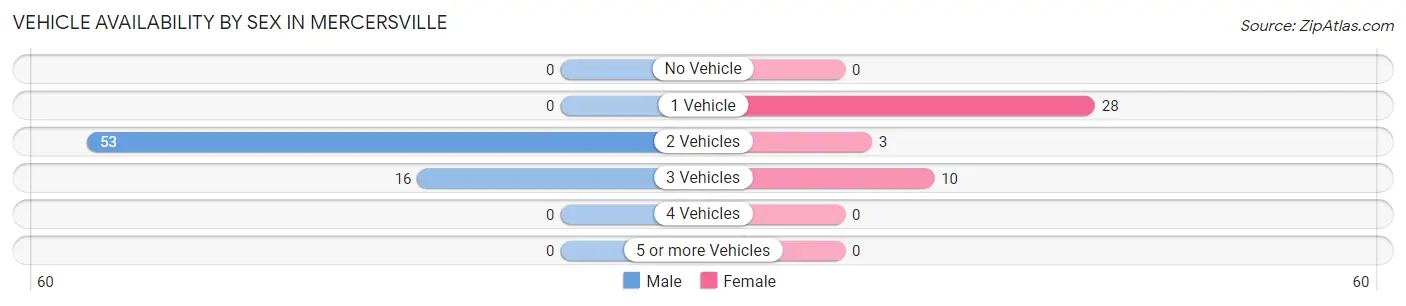
| Vehicles Available | Male | Female |
| No Vehicle | 0 (0.0%) | 0 (0.0%) |
| 1 Vehicle | 0 (0.0%) | 28 (68.3%) |
| 2 Vehicles | 53 (76.8%) | 3 (7.3%) |
| 3 Vehicles | 16 (23.2%) | 10 (24.4%) |
| 4 Vehicles | 0 (0.0%) | 0 (0.0%) |
| 5 or more Vehicles | 0 (0.0%) | 0 (0.0%) |
| Total | 69 (100.0%) | 41 (100.0%) |
Commute Time in Mercersville
The most frequently occuring commute durations in Mercersville are 25 to 29 minutes (53 commuters, 73.6%), 20 to 24 minutes (16 commuters, 22.2%), and 90 or more minutes (3 commuters, 4.2%).
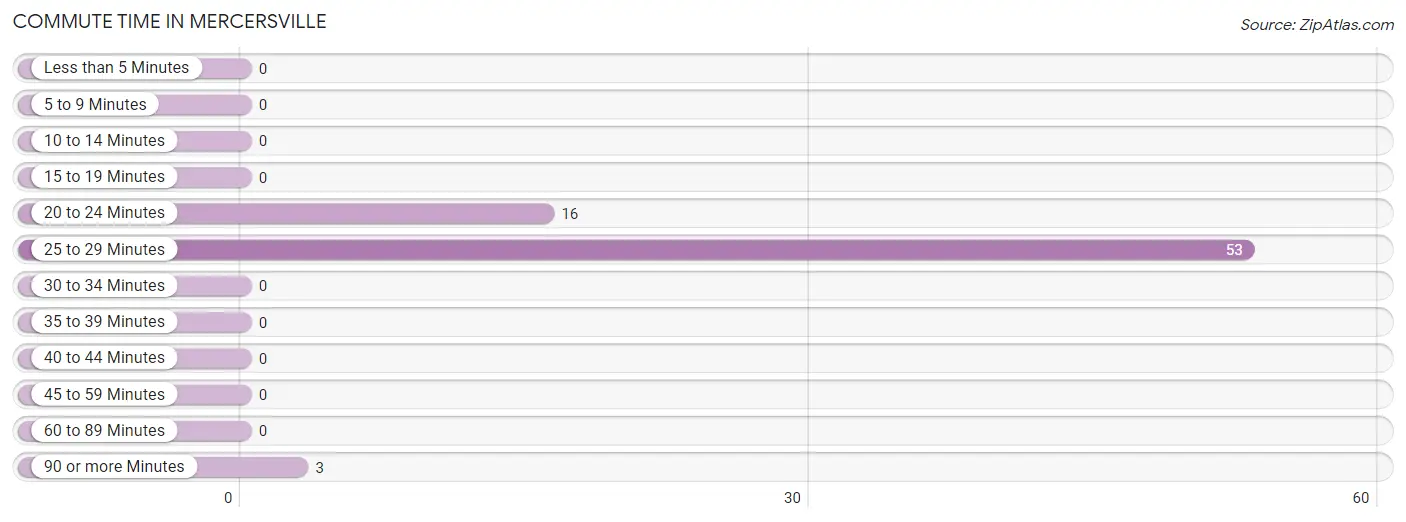
| Commute Time | # Commuters | % Commuters |
| Less than 5 Minutes | 0 | 0.0% |
| 5 to 9 Minutes | 0 | 0.0% |
| 10 to 14 Minutes | 0 | 0.0% |
| 15 to 19 Minutes | 0 | 0.0% |
| 20 to 24 Minutes | 16 | 22.2% |
| 25 to 29 Minutes | 53 | 73.6% |
| 30 to 34 Minutes | 0 | 0.0% |
| 35 to 39 Minutes | 0 | 0.0% |
| 40 to 44 Minutes | 0 | 0.0% |
| 45 to 59 Minutes | 0 | 0.0% |
| 60 to 89 Minutes | 0 | 0.0% |
| 90 or more Minutes | 3 | 4.2% |
Commute Time by Sex in Mercersville
The most common commute times in Mercersville are 25 to 29 minutes (53 commuters, 91.4%) for males and 20 to 24 minutes (11 commuters, 78.6%) for females.
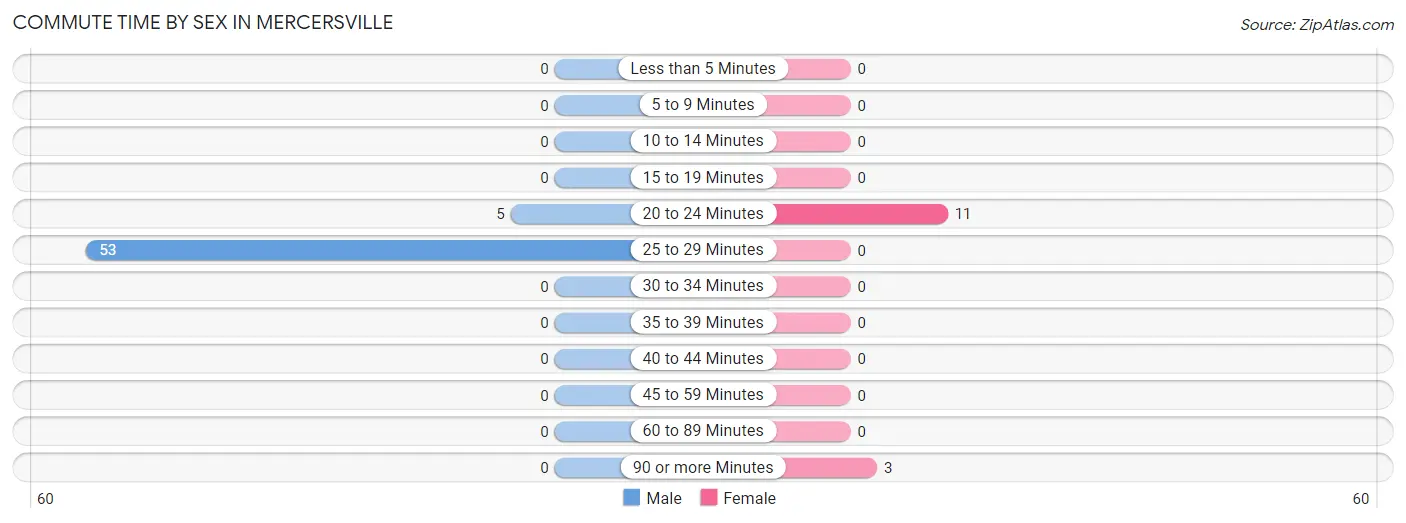
| Commute Time | Male | Female |
| Less than 5 Minutes | 0 (0.0%) | 0 (0.0%) |
| 5 to 9 Minutes | 0 (0.0%) | 0 (0.0%) |
| 10 to 14 Minutes | 0 (0.0%) | 0 (0.0%) |
| 15 to 19 Minutes | 0 (0.0%) | 0 (0.0%) |
| 20 to 24 Minutes | 5 (8.6%) | 11 (78.6%) |
| 25 to 29 Minutes | 53 (91.4%) | 0 (0.0%) |
| 30 to 34 Minutes | 0 (0.0%) | 0 (0.0%) |
| 35 to 39 Minutes | 0 (0.0%) | 0 (0.0%) |
| 40 to 44 Minutes | 0 (0.0%) | 0 (0.0%) |
| 45 to 59 Minutes | 0 (0.0%) | 0 (0.0%) |
| 60 to 89 Minutes | 0 (0.0%) | 0 (0.0%) |
| 90 or more Minutes | 0 (0.0%) | 3 (21.4%) |
Time of Departure to Work by Sex in Mercersville
The most frequent times of departure to work in Mercersville are 8:00 AM to 8:29 AM (58, 100.0%) for males and 8:00 AM to 8:29 AM (11, 78.6%) for females.
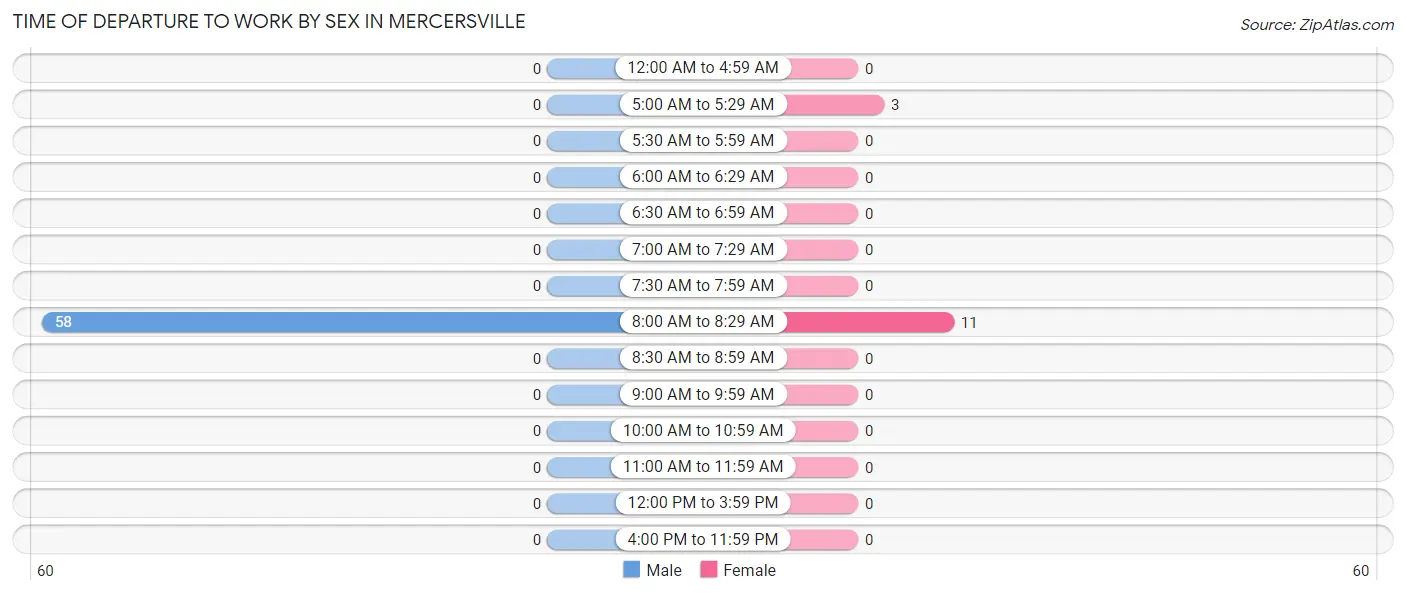
| Time of Departure | Male | Female |
| 12:00 AM to 4:59 AM | 0 (0.0%) | 0 (0.0%) |
| 5:00 AM to 5:29 AM | 0 (0.0%) | 3 (21.4%) |
| 5:30 AM to 5:59 AM | 0 (0.0%) | 0 (0.0%) |
| 6:00 AM to 6:29 AM | 0 (0.0%) | 0 (0.0%) |
| 6:30 AM to 6:59 AM | 0 (0.0%) | 0 (0.0%) |
| 7:00 AM to 7:29 AM | 0 (0.0%) | 0 (0.0%) |
| 7:30 AM to 7:59 AM | 0 (0.0%) | 0 (0.0%) |
| 8:00 AM to 8:29 AM | 58 (100.0%) | 11 (78.6%) |
| 8:30 AM to 8:59 AM | 0 (0.0%) | 0 (0.0%) |
| 9:00 AM to 9:59 AM | 0 (0.0%) | 0 (0.0%) |
| 10:00 AM to 10:59 AM | 0 (0.0%) | 0 (0.0%) |
| 11:00 AM to 11:59 AM | 0 (0.0%) | 0 (0.0%) |
| 12:00 PM to 3:59 PM | 0 (0.0%) | 0 (0.0%) |
| 4:00 PM to 11:59 PM | 0 (0.0%) | 0 (0.0%) |
| Total | 58 (100.0%) | 14 (100.0%) |
Housing Occupancy in Mercersville
Occupancy by Ownership in Mercersville
Of the total 140 dwellings in Mercersville, owner-occupied units account for 96 (68.6%), while renter-occupied units make up 44 (31.4%).
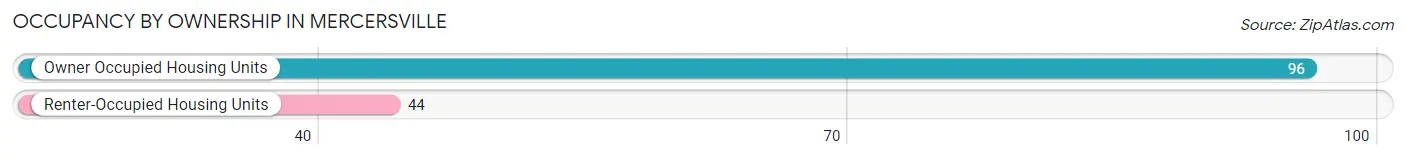
| Occupancy | # Housing Units | % Housing Units |
| Owner Occupied Housing Units | 96 | 68.6% |
| Renter-Occupied Housing Units | 44 | 31.4% |
| Total Occupied Housing Units | 140 | 100.0% |
Occupancy by Household Size in Mercersville
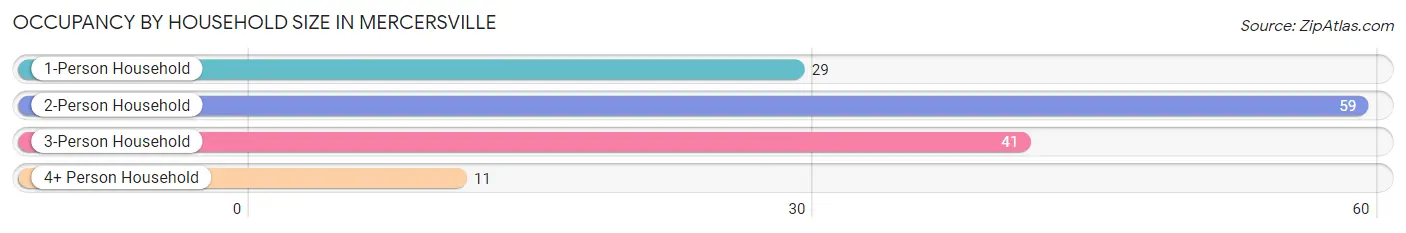
| Household Size | # Housing Units | % Housing Units |
| 1-Person Household | 29 | 20.7% |
| 2-Person Household | 59 | 42.1% |
| 3-Person Household | 41 | 29.3% |
| 4+ Person Household | 11 | 7.9% |
| Total Housing Units | 140 | 100.0% |
Occupancy by Ownership by Household Size in Mercersville
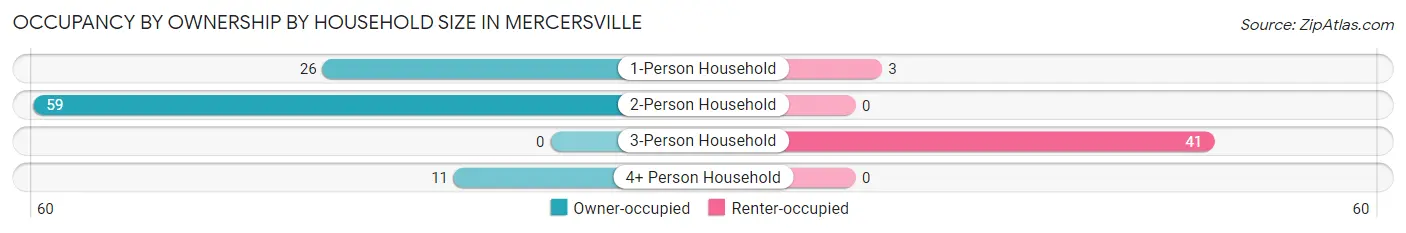
| Household Size | Owner-occupied | Renter-occupied |
| 1-Person Household | 26 (89.7%) | 3 (10.3%) |
| 2-Person Household | 59 (100.0%) | 0 (0.0%) |
| 3-Person Household | 0 (0.0%) | 41 (100.0%) |
| 4+ Person Household | 11 (100.0%) | 0 (0.0%) |
| Total Housing Units | 96 (68.6%) | 44 (31.4%) |
Occupancy by Educational Attainment in Mercersville
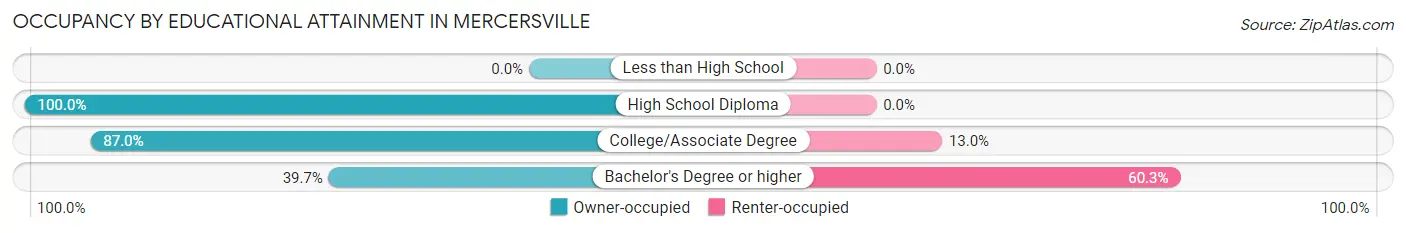
| Household Size | Owner-occupied | Renter-occupied |
| Less than High School | 0 (0.0%) | 0 (0.0%) |
| High School Diploma | 49 (100.0%) | 0 (0.0%) |
| College/Associate Degree | 20 (87.0%) | 3 (13.0%) |
| Bachelor's Degree or higher | 27 (39.7%) | 41 (60.3%) |
Occupancy by Age of Householder in Mercersville
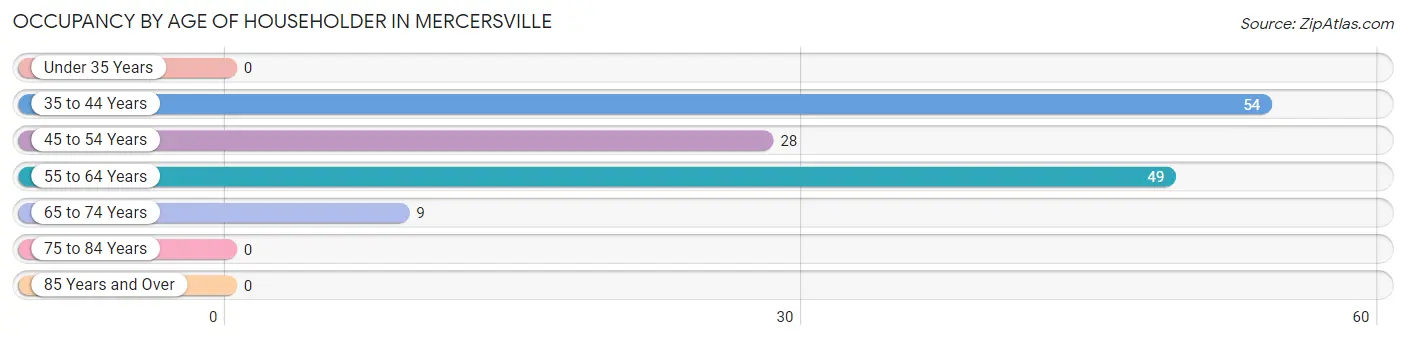
| Age Bracket | # Households | % Households |
| Under 35 Years | 0 | 0.0% |
| 35 to 44 Years | 54 | 38.6% |
| 45 to 54 Years | 28 | 20.0% |
| 55 to 64 Years | 49 | 35.0% |
| 65 to 74 Years | 9 | 6.4% |
| 75 to 84 Years | 0 | 0.0% |
| 85 Years and Over | 0 | 0.0% |
| Total | 140 | 100.0% |
Housing Finances in Mercersville
Median Income by Occupancy in Mercersville
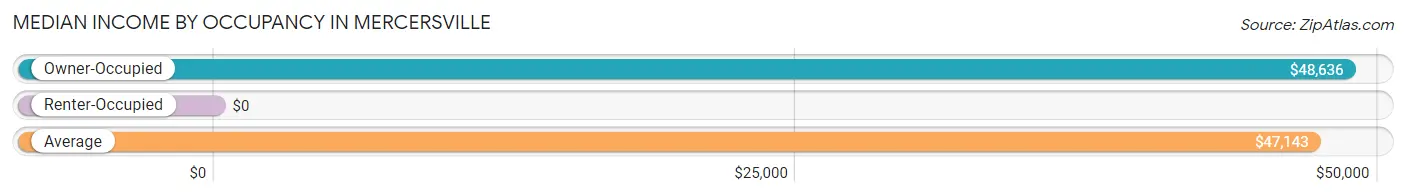
| Occupancy Type | # Households | Median Income |
| Owner-Occupied | 96 (68.6%) | $48,636 |
| Renter-Occupied | 44 (31.4%) | $0 |
| Average | 140 (100.0%) | $47,143 |
Occupancy by Householder Income Bracket in Mercersville
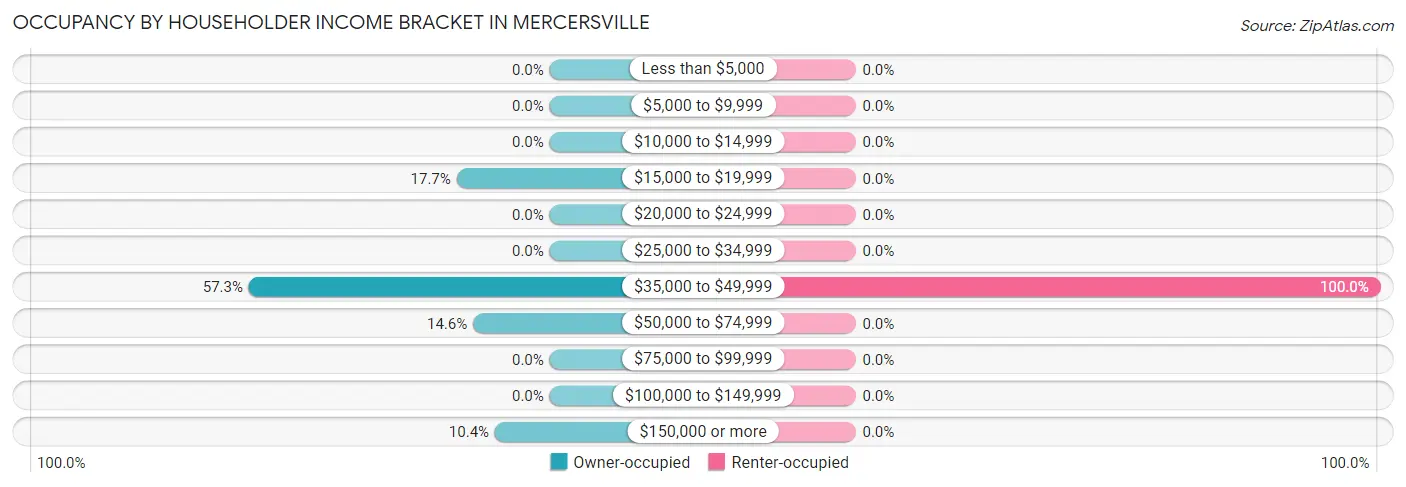
| Income Bracket | Owner-occupied | Renter-occupied |
| Less than $5,000 | 0 (0.0%) | 0 (0.0%) |
| $5,000 to $9,999 | 0 (0.0%) | 0 (0.0%) |
| $10,000 to $14,999 | 0 (0.0%) | 0 (0.0%) |
| $15,000 to $19,999 | 17 (17.7%) | 0 (0.0%) |
| $20,000 to $24,999 | 0 (0.0%) | 0 (0.0%) |
| $25,000 to $34,999 | 0 (0.0%) | 0 (0.0%) |
| $35,000 to $49,999 | 55 (57.3%) | 44 (100.0%) |
| $50,000 to $74,999 | 14 (14.6%) | 0 (0.0%) |
| $75,000 to $99,999 | 0 (0.0%) | 0 (0.0%) |
| $100,000 to $149,999 | 0 (0.0%) | 0 (0.0%) |
| $150,000 or more | 10 (10.4%) | 0 (0.0%) |
| Total | 96 (100.0%) | 44 (100.0%) |
Monthly Housing Cost Tiers in Mercersville
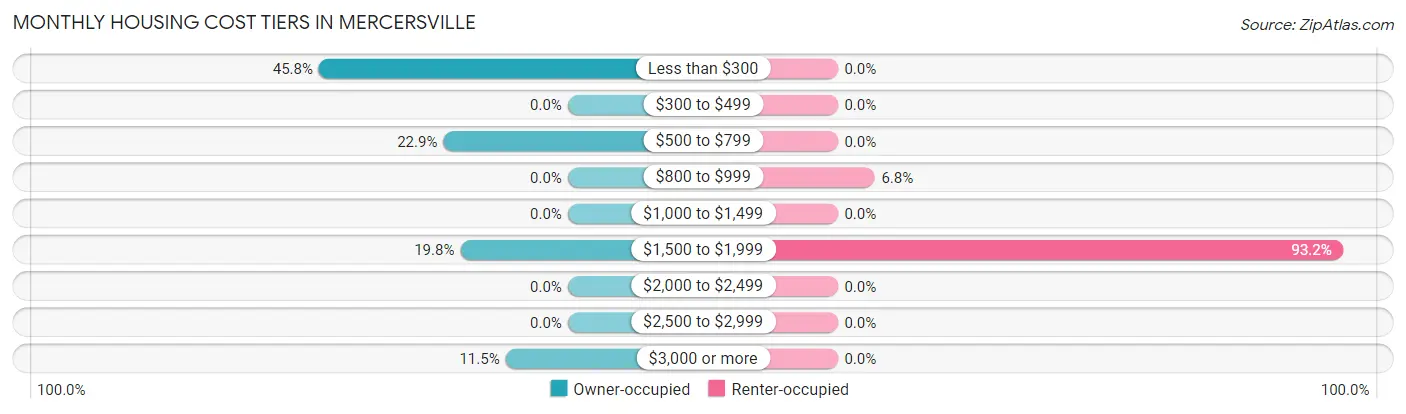
| Monthly Cost | Owner-occupied | Renter-occupied |
| Less than $300 | 44 (45.8%) | 0 (0.0%) |
| $300 to $499 | 0 (0.0%) | 0 (0.0%) |
| $500 to $799 | 22 (22.9%) | 0 (0.0%) |
| $800 to $999 | 0 (0.0%) | 3 (6.8%) |
| $1,000 to $1,499 | 0 (0.0%) | 0 (0.0%) |
| $1,500 to $1,999 | 19 (19.8%) | 41 (93.2%) |
| $2,000 to $2,499 | 0 (0.0%) | 0 (0.0%) |
| $2,500 to $2,999 | 0 (0.0%) | 0 (0.0%) |
| $3,000 or more | 11 (11.5%) | 0 (0.0%) |
| Total | 96 (100.0%) | 44 (100.0%) |
Physical Housing Characteristics in Mercersville
Housing Structures in Mercersville
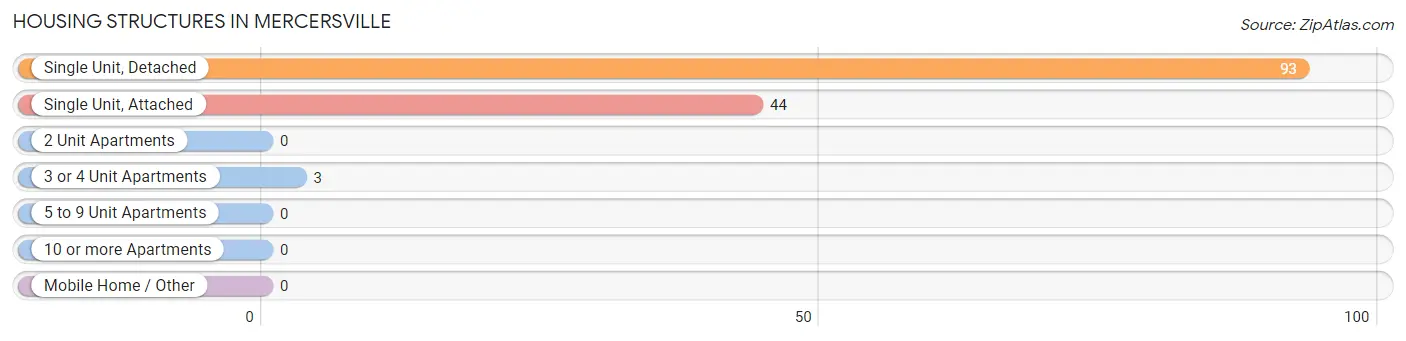
| Structure Type | # Housing Units | % Housing Units |
| Single Unit, Detached | 93 | 66.4% |
| Single Unit, Attached | 44 | 31.4% |
| 2 Unit Apartments | 0 | 0.0% |
| 3 or 4 Unit Apartments | 3 | 2.1% |
| 5 to 9 Unit Apartments | 0 | 0.0% |
| 10 or more Apartments | 0 | 0.0% |
| Mobile Home / Other | 0 | 0.0% |
| Total | 140 | 100.0% |
Housing Structures by Occupancy in Mercersville
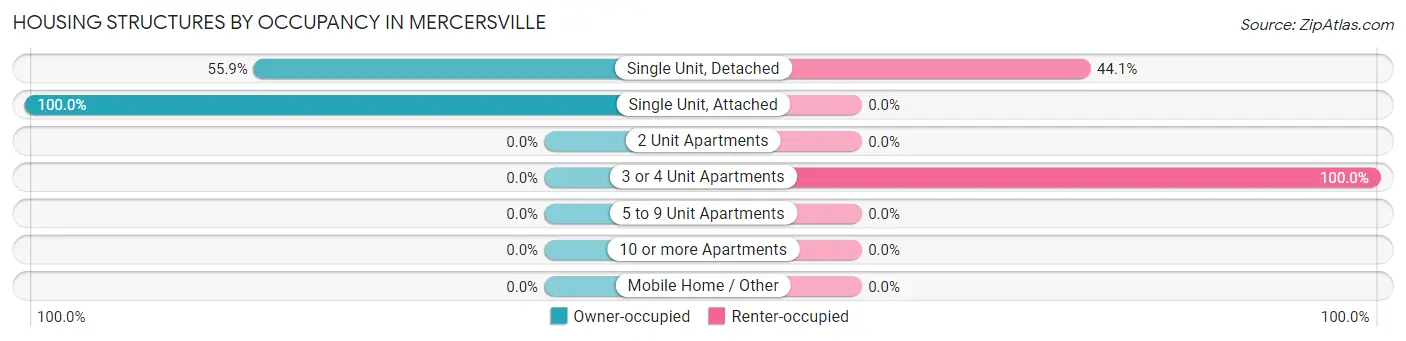
| Structure Type | Owner-occupied | Renter-occupied |
| Single Unit, Detached | 52 (55.9%) | 41 (44.1%) |
| Single Unit, Attached | 44 (100.0%) | 0 (0.0%) |
| 2 Unit Apartments | 0 (0.0%) | 0 (0.0%) |
| 3 or 4 Unit Apartments | 0 (0.0%) | 3 (100.0%) |
| 5 to 9 Unit Apartments | 0 (0.0%) | 0 (0.0%) |
| 10 or more Apartments | 0 (0.0%) | 0 (0.0%) |
| Mobile Home / Other | 0 (0.0%) | 0 (0.0%) |
| Total | 96 (68.6%) | 44 (31.4%) |
Housing Structures by Number of Rooms in Mercersville
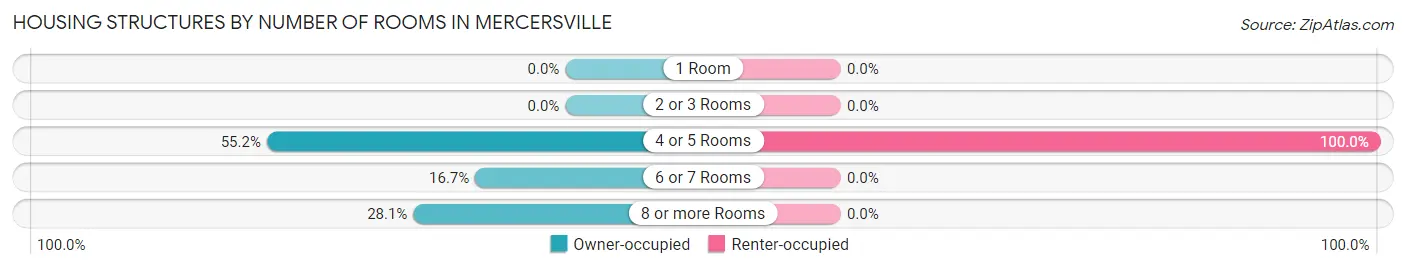
| Number of Rooms | Owner-occupied | Renter-occupied |
| 1 Room | 0 (0.0%) | 0 (0.0%) |
| 2 or 3 Rooms | 0 (0.0%) | 0 (0.0%) |
| 4 or 5 Rooms | 53 (55.2%) | 44 (100.0%) |
| 6 or 7 Rooms | 16 (16.7%) | 0 (0.0%) |
| 8 or more Rooms | 27 (28.1%) | 0 (0.0%) |
| Total | 96 (100.0%) | 44 (100.0%) |
Housing Structure by Heating Type in Mercersville
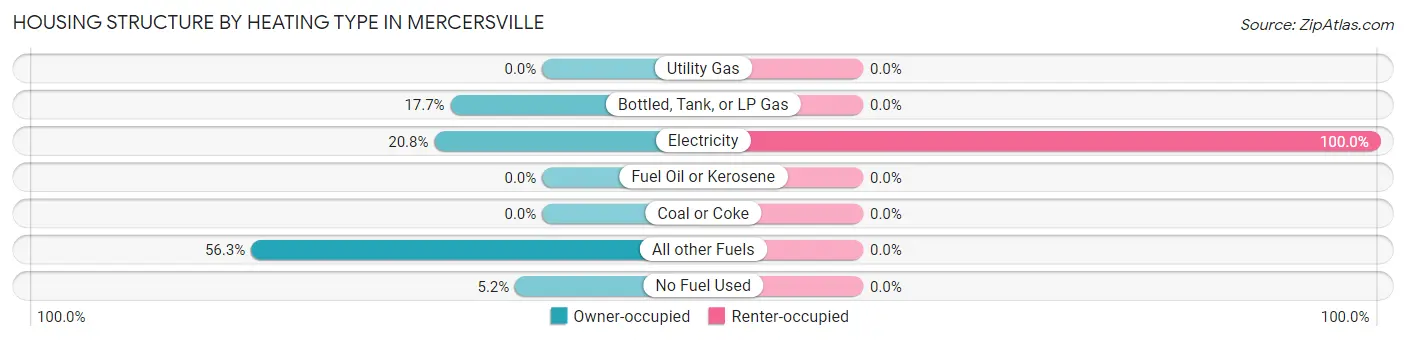
| Heating Type | Owner-occupied | Renter-occupied |
| Utility Gas | 0 (0.0%) | 0 (0.0%) |
| Bottled, Tank, or LP Gas | 17 (17.7%) | 0 (0.0%) |
| Electricity | 20 (20.8%) | 44 (100.0%) |
| Fuel Oil or Kerosene | 0 (0.0%) | 0 (0.0%) |
| Coal or Coke | 0 (0.0%) | 0 (0.0%) |
| All other Fuels | 54 (56.2%) | 0 (0.0%) |
| No Fuel Used | 5 (5.2%) | 0 (0.0%) |
| Total | 96 (100.0%) | 44 (100.0%) |
Household Vehicle Usage in Mercersville
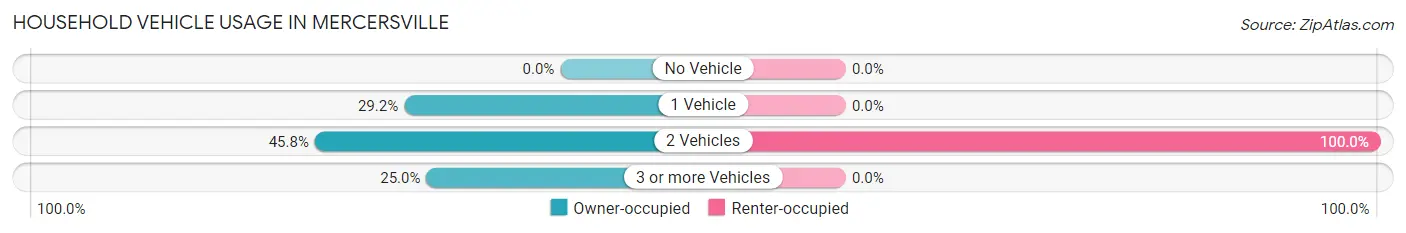
| Vehicles per Household | Owner-occupied | Renter-occupied |
| No Vehicle | 0 (0.0%) | 0 (0.0%) |
| 1 Vehicle | 28 (29.2%) | 0 (0.0%) |
| 2 Vehicles | 44 (45.8%) | 44 (100.0%) |
| 3 or more Vehicles | 24 (25.0%) | 0 (0.0%) |
| Total | 96 (100.0%) | 44 (100.0%) |
Real Estate & Mortgages in Mercersville
Real Estate and Mortgage Overview in Mercersville
| Characteristic | Without Mortgage | With Mortgage |
| Housing Units | 66 | 30 |
| Median Property Value | $118,800 | $571,400 |
| Median Household Income | $48,409 | $10 |
| Monthly Housing Costs | - | - |
| Real Estate Taxes | - | - |
Property Value by Mortgage Status in Mercersville
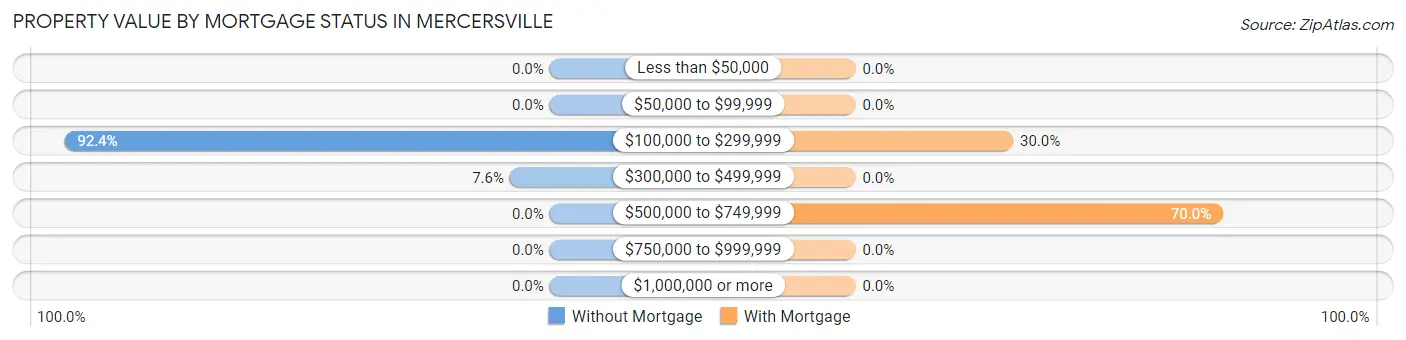
| Property Value | Without Mortgage | With Mortgage |
| Less than $50,000 | 0 (0.0%) | 0 (0.0%) |
| $50,000 to $99,999 | 0 (0.0%) | 0 (0.0%) |
| $100,000 to $299,999 | 61 (92.4%) | 9 (30.0%) |
| $300,000 to $499,999 | 5 (7.6%) | 0 (0.0%) |
| $500,000 to $749,999 | 0 (0.0%) | 21 (70.0%) |
| $750,000 to $999,999 | 0 (0.0%) | 0 (0.0%) |
| $1,000,000 or more | 0 (0.0%) | 0 (0.0%) |
| Total | 66 (100.0%) | 30 (100.0%) |
Household Income by Mortgage Status in Mercersville
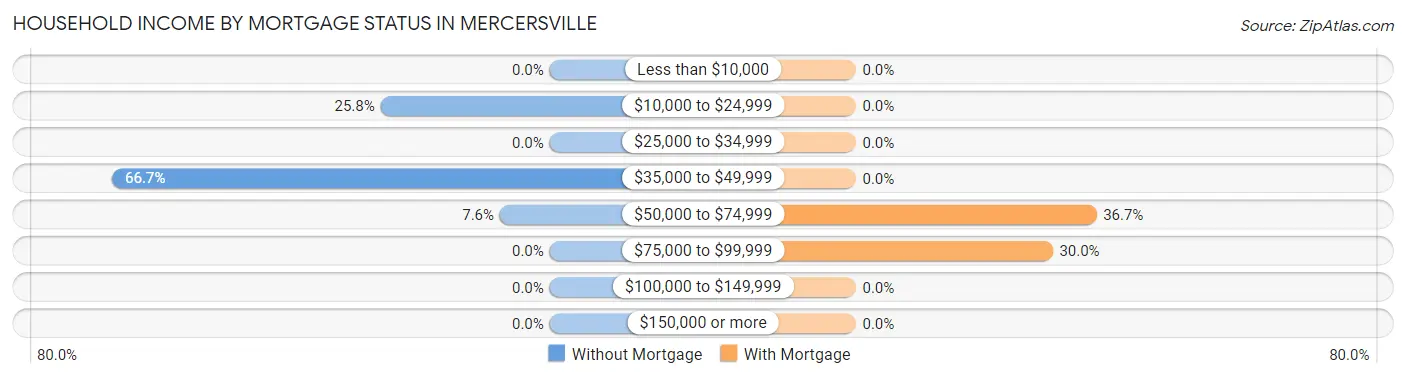
| Household Income | Without Mortgage | With Mortgage |
| Less than $10,000 | 0 (0.0%) | 0 (0.0%) |
| $10,000 to $24,999 | 17 (25.8%) | 0 (0.0%) |
| $25,000 to $34,999 | 0 (0.0%) | 0 (0.0%) |
| $35,000 to $49,999 | 44 (66.7%) | 0 (0.0%) |
| $50,000 to $74,999 | 5 (7.6%) | 11 (36.7%) |
| $75,000 to $99,999 | 0 (0.0%) | 9 (30.0%) |
| $100,000 to $149,999 | 0 (0.0%) | 0 (0.0%) |
| $150,000 or more | 0 (0.0%) | 0 (0.0%) |
| Total | 66 (100.0%) | 30 (100.0%) |
Property Value to Household Income Ratio in Mercersville
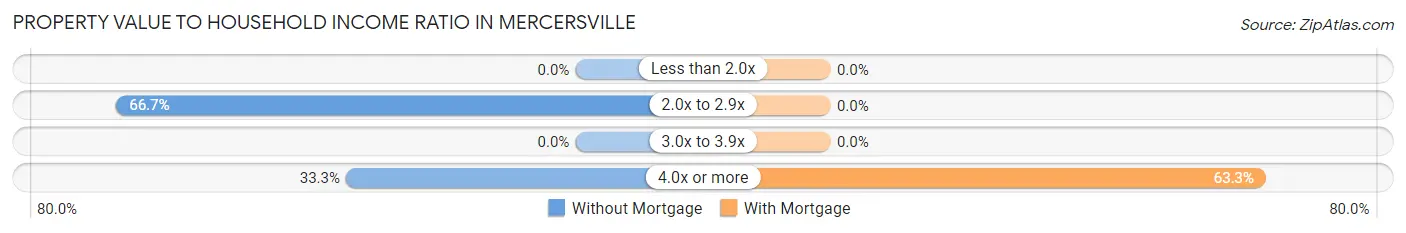
| Value-to-Income Ratio | Without Mortgage | With Mortgage |
| Less than 2.0x | 0 (0.0%) | 0 (0.0%) |
| 2.0x to 2.9x | 44 (66.7%) | 0 (0.0%) |
| 3.0x to 3.9x | 0 (0.0%) | 0 (0.0%) |
| 4.0x or more | 22 (33.3%) | 19 (63.3%) |
| Total | 66 (100.0%) | 30 (100.0%) |
Real Estate Taxes by Mortgage Status in Mercersville
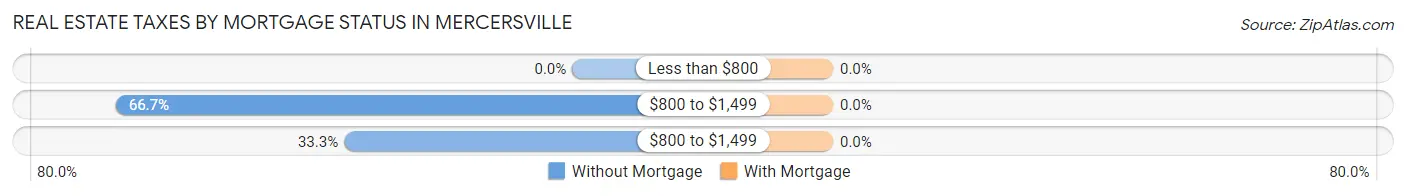
| Property Taxes | Without Mortgage | With Mortgage |
| Less than $800 | 0 (0.0%) | 0 (0.0%) |
| $800 to $1,499 | 44 (66.7%) | 0 (0.0%) |
| $800 to $1,499 | 22 (33.3%) | 0 (0.0%) |
| Total | 66 (100.0%) | 30 (100.0%) |
Health & Disability in Mercersville
Health Insurance Coverage by Age in Mercersville
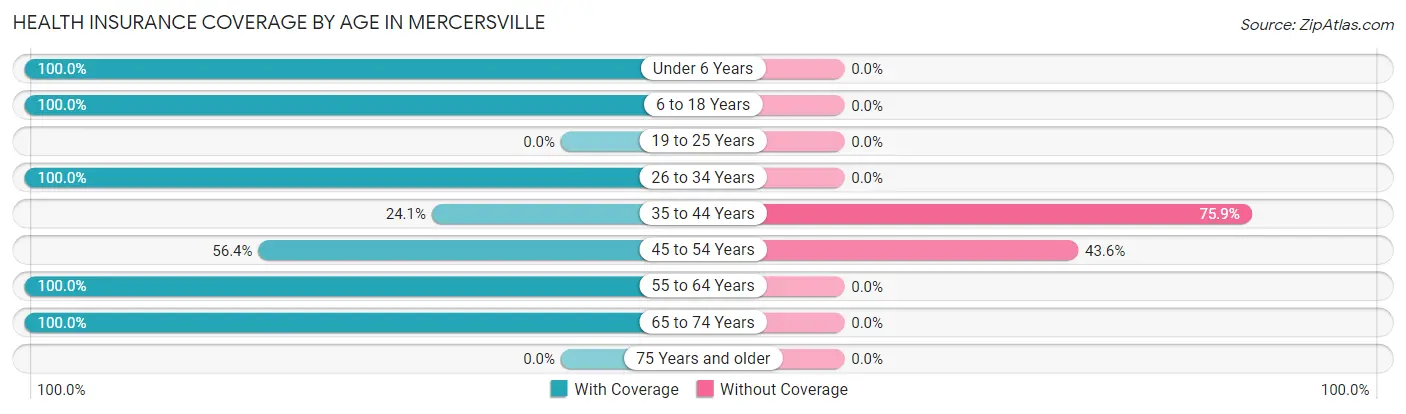
| Age Bracket | With Coverage | Without Coverage |
| Under 6 Years | 39 (100.0%) | 0 (0.0%) |
| 6 to 18 Years | 34 (100.0%) | 0 (0.0%) |
| 19 to 25 Years | 0 (0.0%) | 0 (0.0%) |
| 26 to 34 Years | 53 (100.0%) | 0 (0.0%) |
| 35 to 44 Years | 13 (24.1%) | 41 (75.9%) |
| 45 to 54 Years | 22 (56.4%) | 17 (43.6%) |
| 55 to 64 Years | 56 (100.0%) | 0 (0.0%) |
| 65 to 74 Years | 47 (100.0%) | 0 (0.0%) |
| 75 Years and older | 0 (0.0%) | 0 (0.0%) |
| Total | 264 (82.0%) | 58 (18.0%) |
Health Insurance Coverage by Citizenship Status in Mercersville
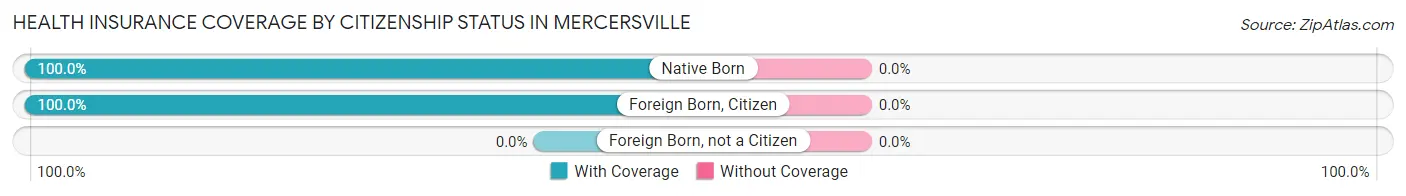
| Citizenship Status | With Coverage | Without Coverage |
| Native Born | 39 (100.0%) | 0 (0.0%) |
| Foreign Born, Citizen | 34 (100.0%) | 0 (0.0%) |
| Foreign Born, not a Citizen | 0 (0.0%) | 0 (0.0%) |
Health Insurance Coverage by Household Income in Mercersville
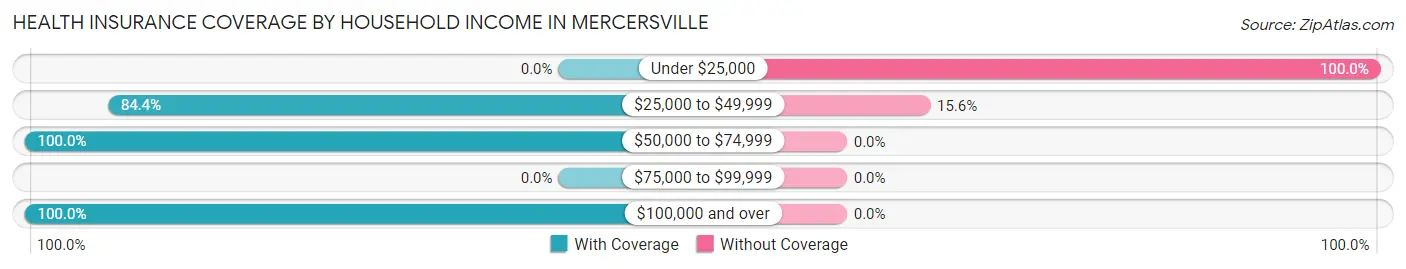
| Household Income | With Coverage | Without Coverage |
| Under $25,000 | 0 (0.0%) | 17 (100.0%) |
| $25,000 to $49,999 | 222 (84.4%) | 41 (15.6%) |
| $50,000 to $74,999 | 21 (100.0%) | 0 (0.0%) |
| $75,000 to $99,999 | 0 (0.0%) | 0 (0.0%) |
| $100,000 and over | 21 (100.0%) | 0 (0.0%) |
Public vs Private Health Insurance Coverage by Age in Mercersville
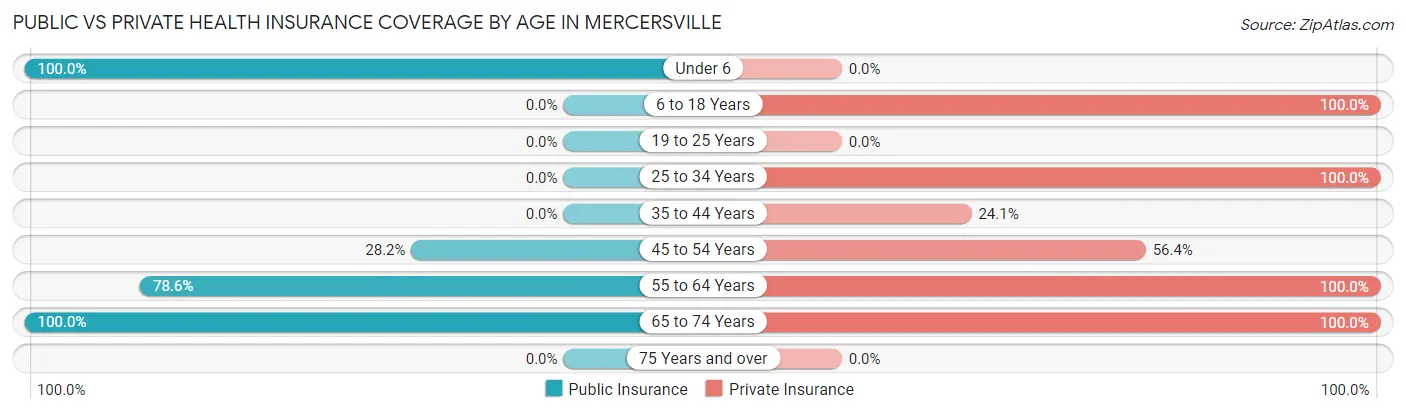
| Age Bracket | Public Insurance | Private Insurance |
| Under 6 | 39 (100.0%) | 0 (0.0%) |
| 6 to 18 Years | 0 (0.0%) | 34 (100.0%) |
| 19 to 25 Years | 0 (0.0%) | 0 (0.0%) |
| 25 to 34 Years | 0 (0.0%) | 53 (100.0%) |
| 35 to 44 Years | 0 (0.0%) | 13 (24.1%) |
| 45 to 54 Years | 11 (28.2%) | 22 (56.4%) |
| 55 to 64 Years | 44 (78.6%) | 56 (100.0%) |
| 65 to 74 Years | 47 (100.0%) | 47 (100.0%) |
| 75 Years and over | 0 (0.0%) | 0 (0.0%) |
| Total | 141 (43.8%) | 225 (69.9%) |
Disability Status by Sex by Age in Mercersville
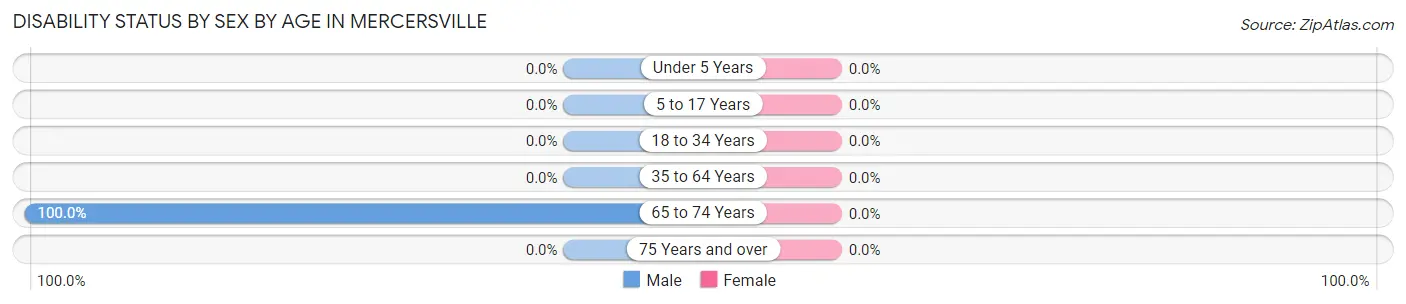
| Age Bracket | Male | Female |
| Under 5 Years | 0 (0.0%) | 0 (0.0%) |
| 5 to 17 Years | 0 (0.0%) | 0 (0.0%) |
| 18 to 34 Years | 0 (0.0%) | 0 (0.0%) |
| 35 to 64 Years | 0 (0.0%) | 0 (0.0%) |
| 65 to 74 Years | 47 (100.0%) | 0 (0.0%) |
| 75 Years and over | 0 (0.0%) | 0 (0.0%) |
Disability Class by Sex by Age in Mercersville
Disability Class: Hearing Difficulty
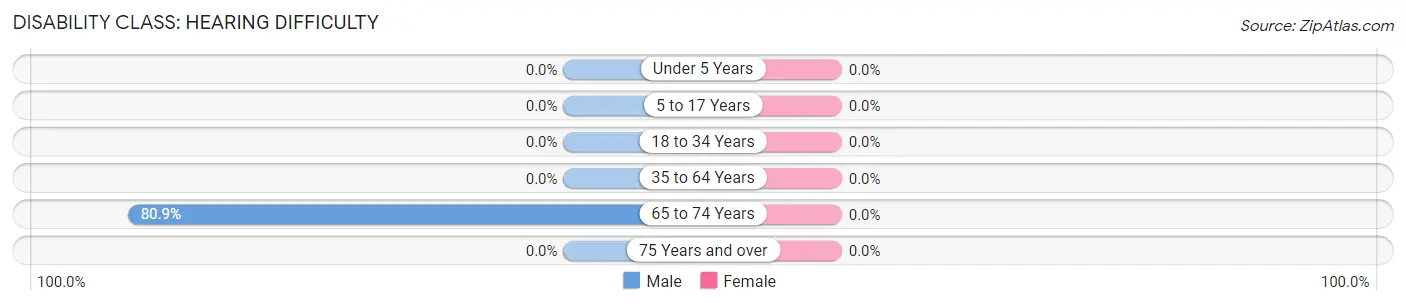
| Age Bracket | Male | Female |
| Under 5 Years | 0 (0.0%) | 0 (0.0%) |
| 5 to 17 Years | 0 (0.0%) | 0 (0.0%) |
| 18 to 34 Years | 0 (0.0%) | 0 (0.0%) |
| 35 to 64 Years | 0 (0.0%) | 0 (0.0%) |
| 65 to 74 Years | 38 (80.8%) | 0 (0.0%) |
| 75 Years and over | 0 (0.0%) | 0 (0.0%) |
Disability Class: Vision Difficulty
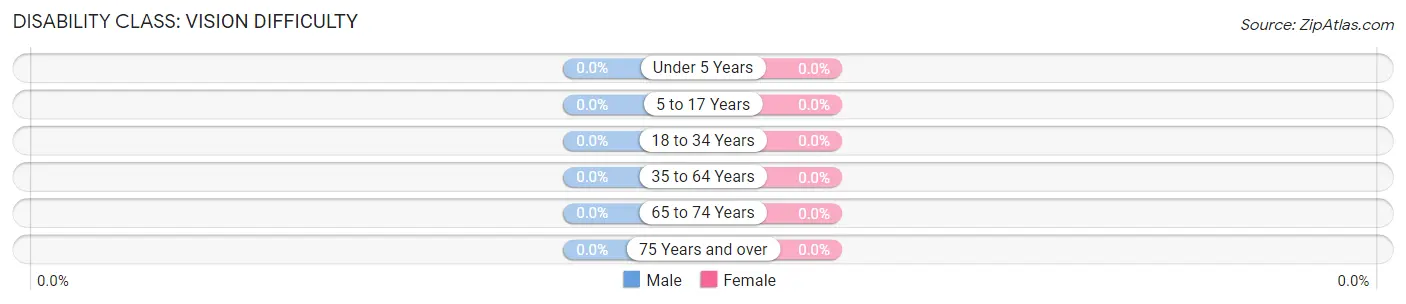
| Age Bracket | Male | Female |
| Under 5 Years | 0 (0.0%) | 0 (0.0%) |
| 5 to 17 Years | 0 (0.0%) | 0 (0.0%) |
| 18 to 34 Years | 0 (0.0%) | 0 (0.0%) |
| 35 to 64 Years | 0 (0.0%) | 0 (0.0%) |
| 65 to 74 Years | 0 (0.0%) | 0 (0.0%) |
| 75 Years and over | 0 (0.0%) | 0 (0.0%) |
Disability Class: Cognitive Difficulty
| Age Bracket | Male | Female |
| 5 to 17 Years | 0 (0.0%) | 0 (0.0%) |
| 18 to 34 Years | 0 (0.0%) | 0 (0.0%) |
| 35 to 64 Years | 0 (0.0%) | 0 (0.0%) |
| 65 to 74 Years | 0 (0.0%) | 0 (0.0%) |
| 75 Years and over | 0 (0.0%) | 0 (0.0%) |
Disability Class: Ambulatory Difficulty
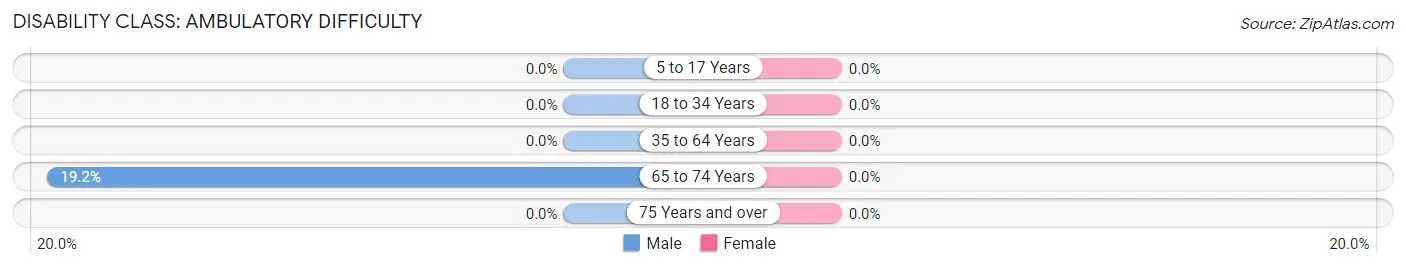
| Age Bracket | Male | Female |
| 5 to 17 Years | 0 (0.0%) | 0 (0.0%) |
| 18 to 34 Years | 0 (0.0%) | 0 (0.0%) |
| 35 to 64 Years | 0 (0.0%) | 0 (0.0%) |
| 65 to 74 Years | 9 (19.2%) | 0 (0.0%) |
| 75 Years and over | 0 (0.0%) | 0 (0.0%) |
Disability Class: Self-Care Difficulty
| Age Bracket | Male | Female |
| 5 to 17 Years | 0 (0.0%) | 0 (0.0%) |
| 18 to 34 Years | 0 (0.0%) | 0 (0.0%) |
| 35 to 64 Years | 0 (0.0%) | 0 (0.0%) |
| 65 to 74 Years | 0 (0.0%) | 0 (0.0%) |
| 75 Years and over | 0 (0.0%) | 0 (0.0%) |
Technology Access in Mercersville
Computing Device Access in Mercersville
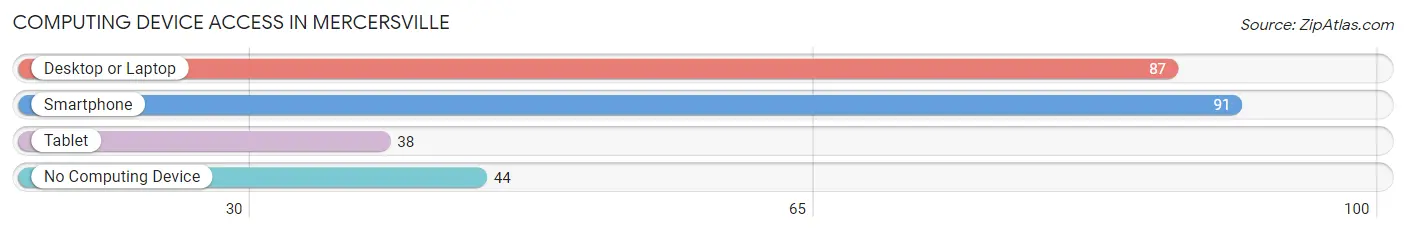
| Device Type | # Households | % Households |
| Desktop or Laptop | 87 | 62.1% |
| Smartphone | 91 | 65.0% |
| Tablet | 38 | 27.1% |
| No Computing Device | 44 | 31.4% |
| Total | 140 | 100.0% |
Internet Access in Mercersville
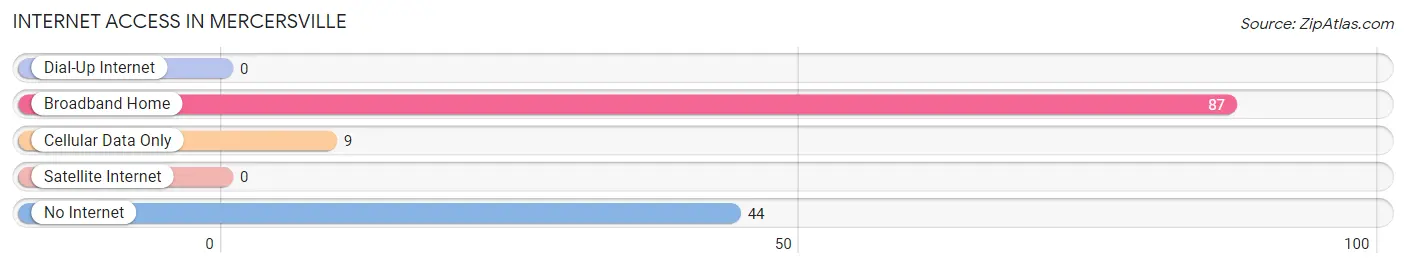
| Internet Type | # Households | % Households |
| Dial-Up Internet | 0 | 0.0% |
| Broadband Home | 87 | 62.1% |
| Cellular Data Only | 9 | 6.4% |
| Satellite Internet | 0 | 0.0% |
| No Internet | 44 | 31.4% |
| Total | 140 | 100.0% |
Mercersville Summary
Mercersville is a small unincorporated community located in Washington County, Maryland. It is situated in the northern part of the county, near the Pennsylvania border. The community is located along the Conococheague Creek, which is a tributary of the Potomac River. The population of Mercersville was estimated to be around 200 people in 2020.
History
Mercersville was first settled in the late 1700s by German immigrants. The community was named after the Mercer family, who were among the first settlers. The Mercer family owned a large amount of land in the area, and the community was named after them.
The first post office in Mercersville was established in 1820. The community was a small farming village until the late 1800s, when the railroad was built through the area. This allowed for the development of the town, and it soon became a popular stop for travelers.
Geography
Mercersville is located in northern Washington County, Maryland. It is situated along the Conococheague Creek, which is a tributary of the Potomac River. The community is located about 10 miles north of Hagerstown, Maryland.
The terrain of Mercersville is mostly flat, with some rolling hills. The area is mostly rural, with some small farms and wooded areas. The climate is temperate, with hot summers and cold winters.
Economy
The economy of Mercersville is largely based on agriculture. The area is home to several small farms, which produce a variety of crops, including corn, soybeans, and hay. The community also has a few small businesses, including a general store and a gas station.
Demographics
The population of Mercersville was estimated to be around 200 people in 2020. The racial makeup of the community is mostly white, with a small percentage of African Americans. The median household income in Mercersville is around $50,000, which is slightly lower than the national average.
Conclusion
Mercersville is a small unincorporated community located in Washington County, Maryland. It is situated along the Conococheague Creek, and has a population of around 200 people. The economy of Mercersville is largely based on agriculture, and the racial makeup of the community is mostly white. Mercersville is a small, rural community with a rich history and a bright future.
Common Questions
What is Per Capita Income in Mercersville?
Per Capita income in Mercersville is $24,190.
What is the Median Family Income in Mercersville?
Median Family Income in Mercersville is $47,159.
What is the Median Household income in Mercersville?
Median Household Income in Mercersville is $47,143.
What is Inequality or Gini Index in Mercersville?
Inequality or Gini Index in Mercersville is 0.23.
What is the Total Population of Mercersville?
Total Population of Mercersville is 322.
What is the Total Male Population of Mercersville?
Total Male Population of Mercersville is 139.
What is the Total Female Population of Mercersville?
Total Female Population of Mercersville is 183.
What is the Ratio of Males per 100 Females in Mercersville?
There are 75.96 Males per 100 Females in Mercersville.
What is the Ratio of Females per 100 Males in Mercersville?
There are 131.65 Females per 100 Males in Mercersville.
What is the Median Population Age in Mercersville?
Median Population Age in Mercersville is 35.9 Years.
What is the Average Family Size in Mercersville
Average Family Size in Mercersville is 2.7 People.
What is the Average Household Size in Mercersville
Average Household Size in Mercersville is 2.3 People.
How Large is the Labor Force in Mercersville?
There are 110 People in the Labor Forcein in Mercersville.
What is the Percentage of People in the Labor Force in Mercersville?
44.2% of People are in the Labor Force in Mercersville.