Cape St Claire, MD Map & Demographics
Cape St Claire Map
Cape St Claire Overview
$57,107
PER CAPITA INCOME
$138,495
AVG FAMILY INCOME
$127,708
AVG HOUSEHOLD INCOME
41.9%
WAGE / INCOME GAP [ % ]
58.1¢/ $1
WAGE / INCOME GAP [ $ ]
0.40
INEQUALITY / GINI INDEX
9,212
TOTAL POPULATION
4,614
MALE POPULATION
4,598
FEMALE POPULATION
100.35
MALES / 100 FEMALES
99.65
FEMALES / 100 MALES
41.3
MEDIAN AGE
3.1
AVG FAMILY SIZE
2.7
AVG HOUSEHOLD SIZE
5,043
LABOR FORCE [ PEOPLE ]
70.3%
PERCENT IN LABOR FORCE
5.8%
UNEMPLOYMENT RATE
Income in Cape St Claire
Income Overview in Cape St Claire
Per Capita Income in Cape St Claire is $57,107, while median incomes of families and households are $138,495 and $127,708 respectively.
| Characteristic | Number | Measure |
| Per Capita Income | 9,212 | $57,107 |
| Median Family Income | 2,615 | $138,495 |
| Mean Family Income | 2,615 | $168,095 |
| Median Household Income | 3,413 | $127,708 |
| Mean Household Income | 3,413 | $152,662 |
| Income Deficit | 2,615 | $0 |
| Wage / Income Gap (%) | 9,212 | 41.92% |
| Wage / Income Gap ($) | 9,212 | 58.08¢ per $1 |
| Gini / Inequality Index | 9,212 | 0.40 |
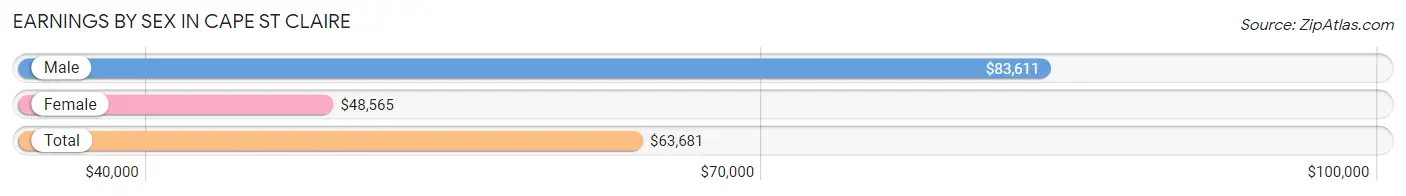
Earnings by Sex in Cape St Claire
Average Earnings in Cape St Claire are $63,681, $83,611 for men and $48,565 for women, a difference of 41.9%.
| Sex | Number | Average Earnings |
| Male | 2,748 (51.1%) | $83,611 |
| Female | 2,633 (48.9%) | $48,565 |
| Total | 5,381 (100.0%) | $63,681 |
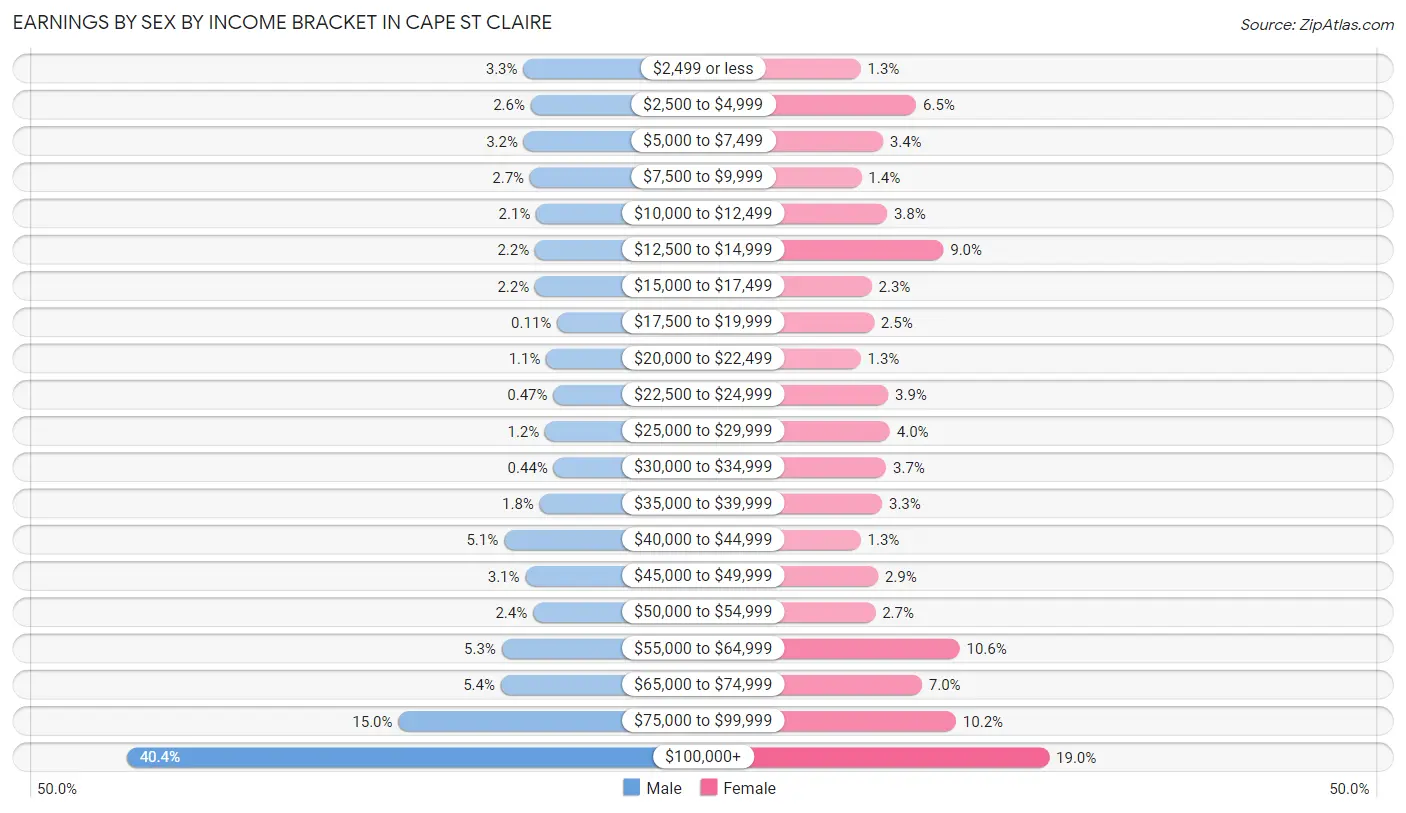
Earnings by Sex by Income Bracket in Cape St Claire
The most common earnings brackets in Cape St Claire are $100,000+ for men (1,111 | 40.4%) and $100,000+ for women (499 | 19.0%).
| Income | Male | Female |
| $2,499 or less | 90 (3.3%) | 34 (1.3%) |
| $2,500 to $4,999 | 71 (2.6%) | 171 (6.5%) |
| $5,000 to $7,499 | 89 (3.2%) | 89 (3.4%) |
| $7,500 to $9,999 | 73 (2.7%) | 36 (1.4%) |
| $10,000 to $12,499 | 57 (2.1%) | 99 (3.8%) |
| $12,500 to $14,999 | 60 (2.2%) | 238 (9.0%) |
| $15,000 to $17,499 | 60 (2.2%) | 61 (2.3%) |
| $17,500 to $19,999 | 3 (0.1%) | 67 (2.5%) |
| $20,000 to $22,499 | 31 (1.1%) | 34 (1.3%) |
| $22,500 to $24,999 | 13 (0.5%) | 102 (3.9%) |
| $25,000 to $29,999 | 34 (1.2%) | 106 (4.0%) |
| $30,000 to $34,999 | 12 (0.4%) | 97 (3.7%) |
| $35,000 to $39,999 | 48 (1.8%) | 87 (3.3%) |
| $40,000 to $44,999 | 140 (5.1%) | 34 (1.3%) |
| $45,000 to $49,999 | 85 (3.1%) | 77 (2.9%) |
| $50,000 to $54,999 | 65 (2.4%) | 70 (2.7%) |
| $55,000 to $64,999 | 146 (5.3%) | 278 (10.6%) |
| $65,000 to $74,999 | 148 (5.4%) | 185 (7.0%) |
| $75,000 to $99,999 | 412 (15.0%) | 269 (10.2%) |
| $100,000+ | 1,111 (40.4%) | 499 (19.0%) |
| Total | 2,748 (100.0%) | 2,633 (100.0%) |
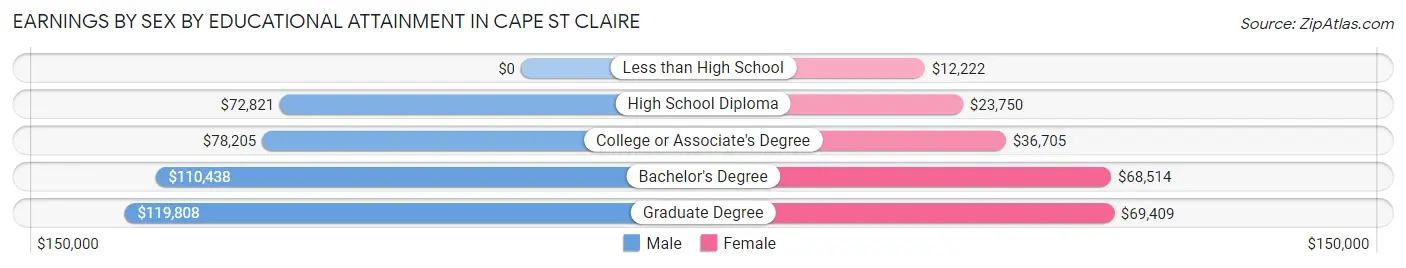
Earnings by Sex by Educational Attainment in Cape St Claire
Average earnings in Cape St Claire are $94,596 for men and $57,988 for women, a difference of 38.7%. Men with an educational attainment of graduate degree enjoy the highest average annual earnings of $119,808, while those with high school diploma education earn the least with $72,821. Women with an educational attainment of graduate degree earn the most with the average annual earnings of $69,409, while those with less than high school education have the smallest earnings of $12,222.
| Educational Attainment | Male Income | Female Income |
| Less than High School | - | - |
| High School Diploma | $72,821 | $23,750 |
| College or Associate's Degree | $78,205 | $36,705 |
| Bachelor's Degree | $110,438 | $68,514 |
| Graduate Degree | $119,808 | $69,409 |
| Total | $94,596 | $57,988 |
Family Income in Cape St Claire
Family Income Brackets in Cape St Claire
According to the Cape St Claire family income data, there are 688 families falling into the $100,000 to $149,999 income range, which is the most common income bracket and makes up 26.3% of all families.
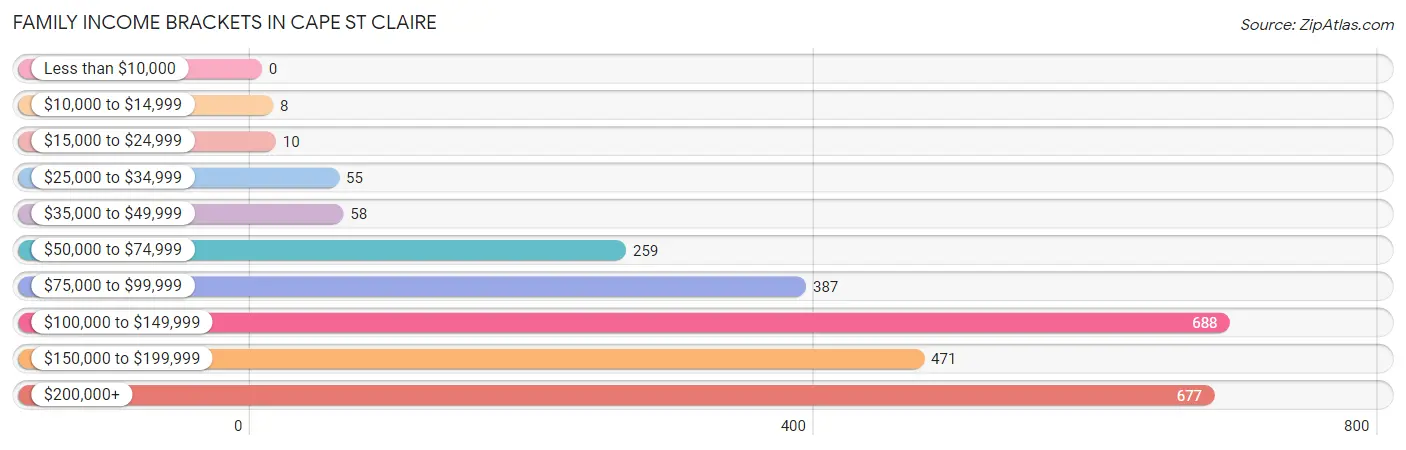
| Income Bracket | # Families | % Families |
| Less than $10,000 | 0 | 0.0% |
| $10,000 to $14,999 | 8 | 0.3% |
| $15,000 to $24,999 | 10 | 0.4% |
| $25,000 to $34,999 | 55 | 2.1% |
| $35,000 to $49,999 | 58 | 2.2% |
| $50,000 to $74,999 | 259 | 9.9% |
| $75,000 to $99,999 | 387 | 14.8% |
| $100,000 to $149,999 | 688 | 26.3% |
| $150,000 to $199,999 | 471 | 18.0% |
| $200,000+ | 677 | 25.9% |
Family Income by Famaliy Size in Cape St Claire
7+ person families (34 | 1.3%) account for the highest median family income in Cape St Claire with $250,001 per family, while 2-person families (1,087 | 41.6%) have the highest median income of $62,438 per family member.
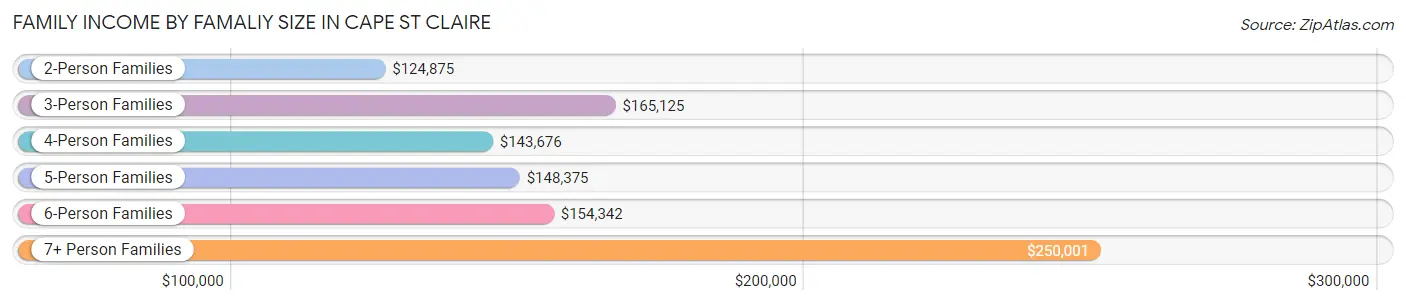
| Income Bracket | # Families | Median Income |
| 2-Person Families | 1,087 (41.6%) | $124,875 |
| 3-Person Families | 579 (22.1%) | $165,125 |
| 4-Person Families | 734 (28.1%) | $143,676 |
| 5-Person Families | 139 (5.3%) | $148,375 |
| 6-Person Families | 42 (1.6%) | $154,342 |
| 7+ Person Families | 34 (1.3%) | $250,001 |
| Total | 2,615 (100.0%) | $138,495 |
Family Income by Number of Earners in Cape St Claire
The median family income in Cape St Claire is $138,495, with families comprising 3+ earners (351) having the highest median family income of $219,028, while families with no earners (205) have the lowest median family income of $85,417, accounting for 13.4% and 7.8% of families, respectively.
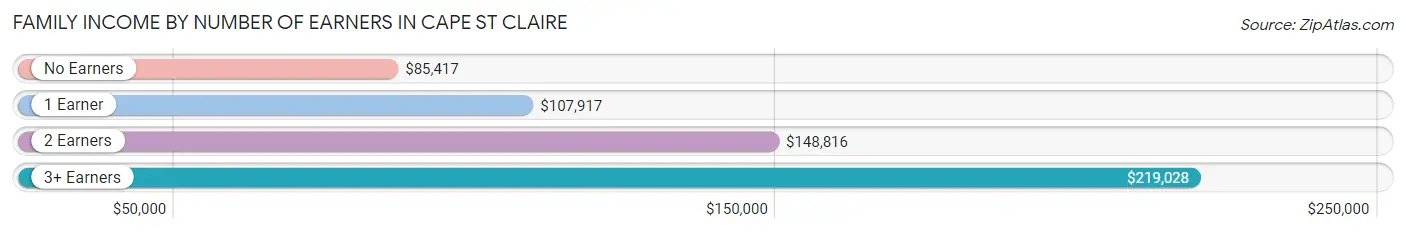
| Number of Earners | # Families | Median Income |
| No Earners | 205 (7.8%) | $85,417 |
| 1 Earner | 741 (28.3%) | $107,917 |
| 2 Earners | 1,318 (50.4%) | $148,816 |
| 3+ Earners | 351 (13.4%) | $219,028 |
| Total | 2,615 (100.0%) | $138,495 |
Household Income in Cape St Claire
Household Income Brackets in Cape St Claire
With 751 households falling in the category, the $100,000 to $149,999 income range is the most frequent in Cape St Claire, accounting for 22.0% of all households. In contrast, only 24 households (0.7%) fall into the less than $10,000 income bracket, making it the least populous group.
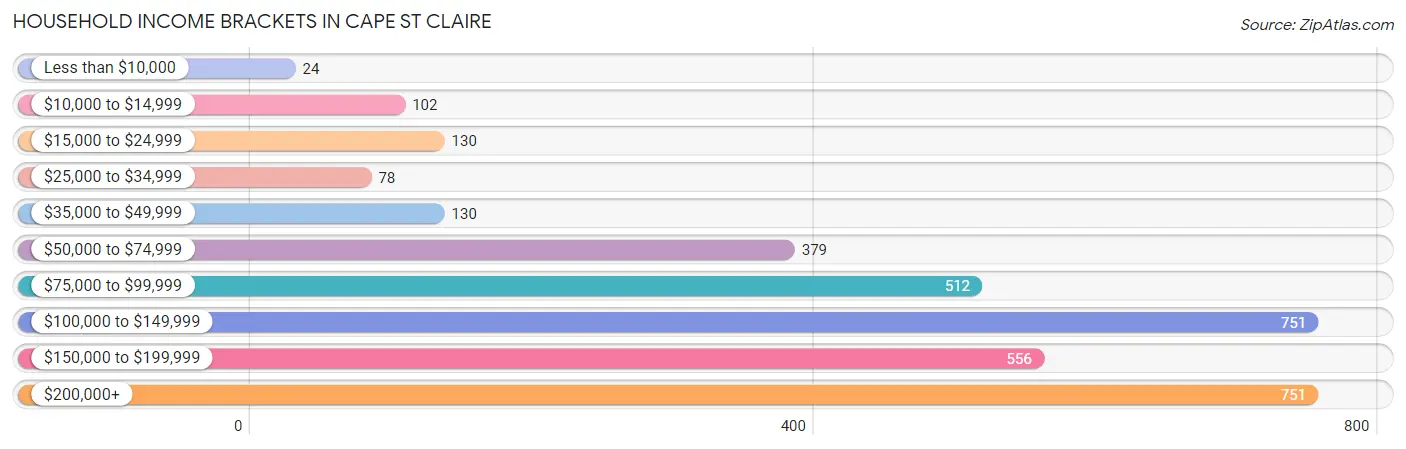
| Income Bracket | # Households | % Households |
| Less than $10,000 | 24 | 0.7% |
| $10,000 to $14,999 | 102 | 3.0% |
| $15,000 to $24,999 | 130 | 3.8% |
| $25,000 to $34,999 | 78 | 2.3% |
| $35,000 to $49,999 | 130 | 3.8% |
| $50,000 to $74,999 | 379 | 11.1% |
| $75,000 to $99,999 | 512 | 15.0% |
| $100,000 to $149,999 | 751 | 22.0% |
| $150,000 to $199,999 | 556 | 16.3% |
| $200,000+ | 751 | 22.0% |
Household Income by Householder Age in Cape St Claire
The median household income in Cape St Claire is $127,708, with the highest median household income of $134,813 found in the 45 to 64 years age bracket for the primary householder. A total of 1,439 households (42.2%) fall into this category. Meanwhile, the 15 to 24 years age bracket for the primary householder has the lowest median household income of $0, with 24 households (0.7%) in this group.
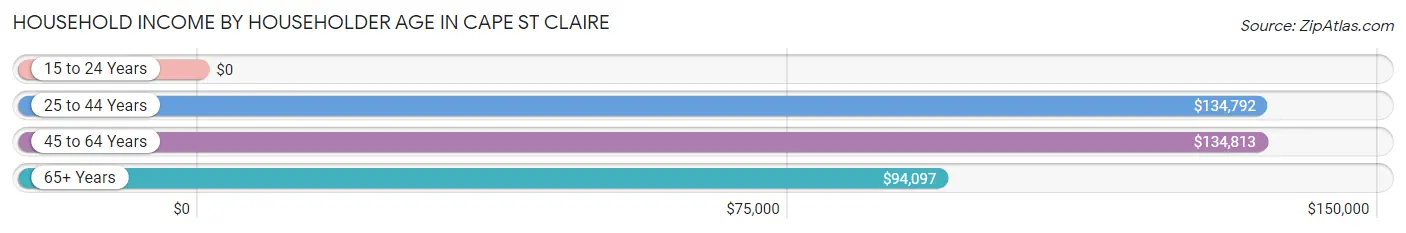
| Income Bracket | # Households | Median Income |
| 15 to 24 Years | 24 (0.7%) | $0 |
| 25 to 44 Years | 1,015 (29.7%) | $134,792 |
| 45 to 64 Years | 1,439 (42.2%) | $134,813 |
| 65+ Years | 935 (27.4%) | $94,097 |
| Total | 3,413 (100.0%) | $127,708 |
Poverty in Cape St Claire
Income Below Poverty by Sex and Age in Cape St Claire
With 2.6% poverty level for males and 3.7% for females among the residents of Cape St Claire, 12 to 14 year old males and 18 to 24 year old females are the most vulnerable to poverty, with 29 males (13.6%) and 29 females (11.2%) in their respective age groups living below the poverty level.
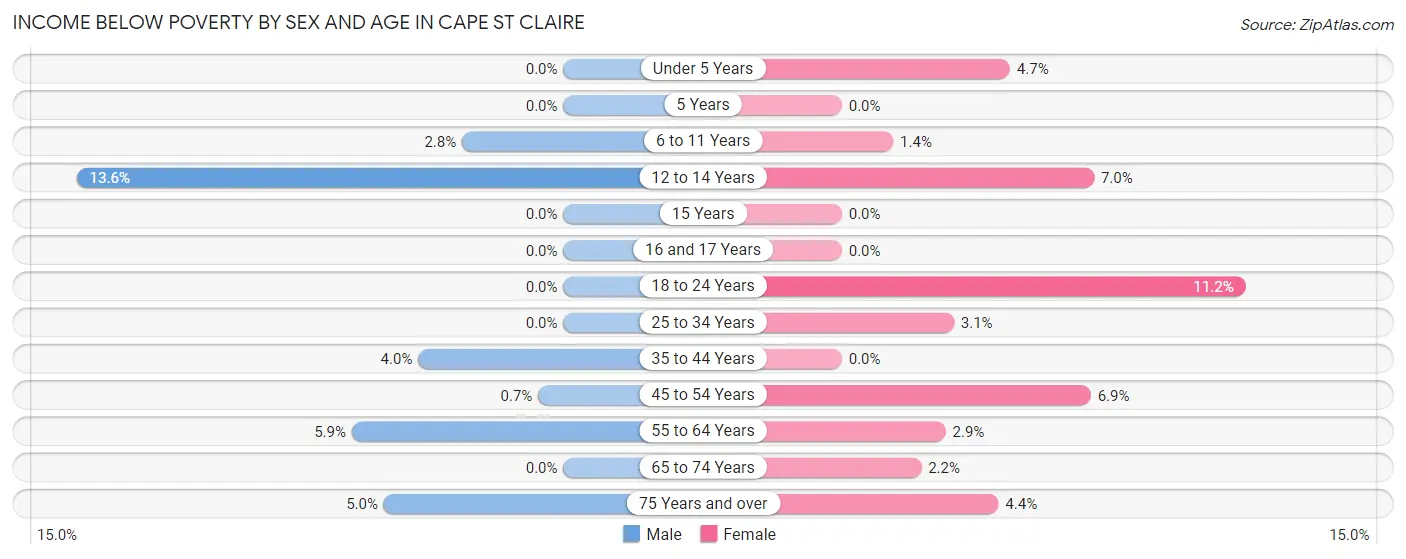
| Age Bracket | Male | Female |
| Under 5 Years | 0 (0.0%) | 14 (4.7%) |
| 5 Years | 0 (0.0%) | 0 (0.0%) |
| 6 to 11 Years | 12 (2.8%) | 4 (1.4%) |
| 12 to 14 Years | 29 (13.6%) | 16 (7.0%) |
| 15 Years | 0 (0.0%) | 0 (0.0%) |
| 16 and 17 Years | 0 (0.0%) | 0 (0.0%) |
| 18 to 24 Years | 0 (0.0%) | 29 (11.2%) |
| 25 to 34 Years | 0 (0.0%) | 17 (3.1%) |
| 35 to 44 Years | 27 (4.0%) | 0 (0.0%) |
| 45 to 54 Years | 4 (0.7%) | 51 (6.9%) |
| 55 to 64 Years | 39 (5.9%) | 18 (2.9%) |
| 65 to 74 Years | 0 (0.0%) | 11 (2.2%) |
| 75 Years and over | 10 (5.0%) | 12 (4.4%) |
| Total | 121 (2.6%) | 172 (3.7%) |
Income Above Poverty by Sex and Age in Cape St Claire
According to the poverty statistics in Cape St Claire, males aged under 5 years and females aged 5 years are the age groups that are most secure financially, with 100.0% of males and 100.0% of females in these age groups living above the poverty line.
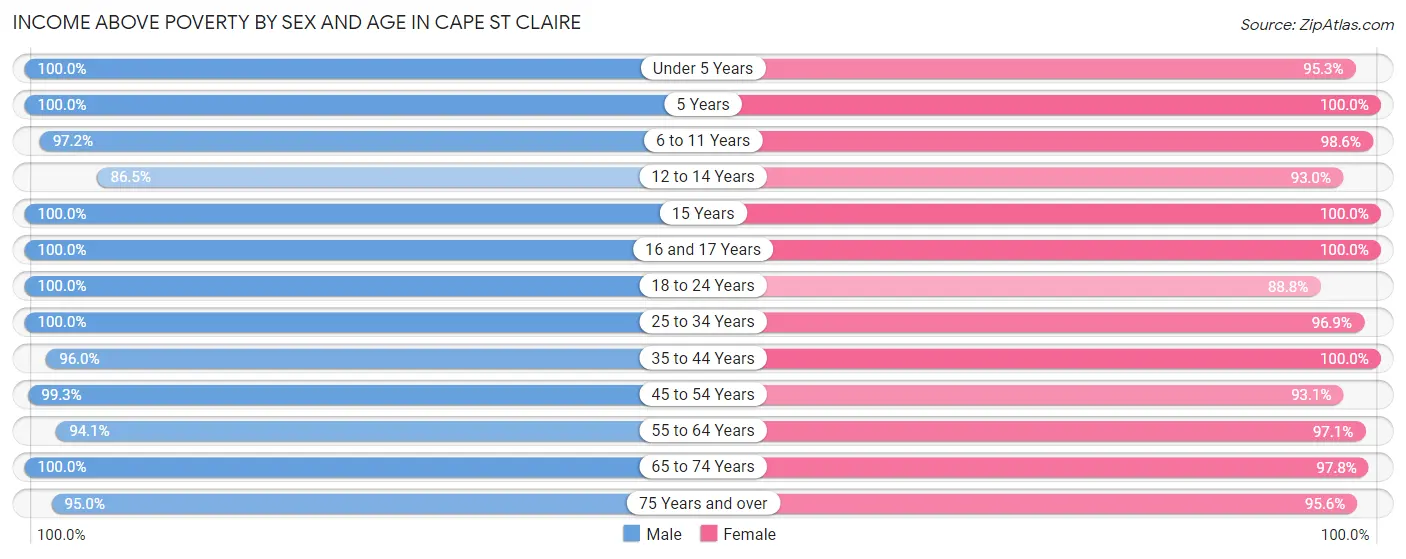
| Age Bracket | Male | Female |
| Under 5 Years | 300 (100.0%) | 285 (95.3%) |
| 5 Years | 83 (100.0%) | 30 (100.0%) |
| 6 to 11 Years | 414 (97.2%) | 276 (98.6%) |
| 12 to 14 Years | 185 (86.5%) | 212 (93.0%) |
| 15 Years | 72 (100.0%) | 84 (100.0%) |
| 16 and 17 Years | 253 (100.0%) | 79 (100.0%) |
| 18 to 24 Years | 228 (100.0%) | 229 (88.8%) |
| 25 to 34 Years | 388 (100.0%) | 528 (96.9%) |
| 35 to 44 Years | 641 (96.0%) | 658 (100.0%) |
| 45 to 54 Years | 570 (99.3%) | 685 (93.1%) |
| 55 to 64 Years | 623 (94.1%) | 604 (97.1%) |
| 65 to 74 Years | 530 (100.0%) | 486 (97.8%) |
| 75 Years and over | 190 (95.0%) | 263 (95.6%) |
| Total | 4,477 (97.4%) | 4,419 (96.3%) |
Income Below Poverty Among Married-Couple Families in Cape St Claire
The poverty statistics for married-couple families in Cape St Claire show that 0.6% or 13 of the total 2,059 families live below the poverty line. Families with no children have the highest poverty rate of 0.9%, comprising of 9 families. On the other hand, families with 3 or 4 children have the lowest poverty rate of 0.0%, which includes 0 families.
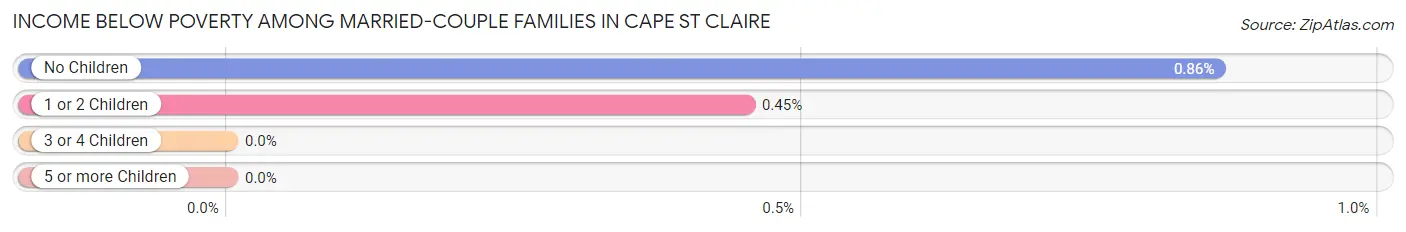
| Children | Above Poverty | Below Poverty |
| No Children | 1,041 (99.1%) | 9 (0.9%) |
| 1 or 2 Children | 885 (99.6%) | 4 (0.4%) |
| 3 or 4 Children | 120 (100.0%) | 0 (0.0%) |
| 5 or more Children | 0 (0.0%) | 0 (0.0%) |
| Total | 2,046 (99.4%) | 13 (0.6%) |
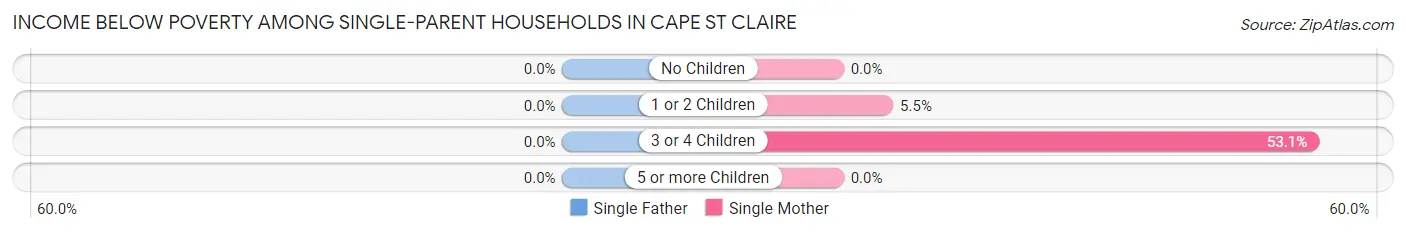
Income Below Poverty Among Single-Parent Households in Cape St Claire
| Children | Single Father | Single Mother |
| No Children | 0 (0.0%) | 0 (0.0%) |
| 1 or 2 Children | 0 (0.0%) | 11 (5.5%) |
| 3 or 4 Children | 0 (0.0%) | 17 (53.1%) |
| 5 or more Children | 0 (0.0%) | 0 (0.0%) |
| Total | 0 (0.0%) | 28 (8.2%) |
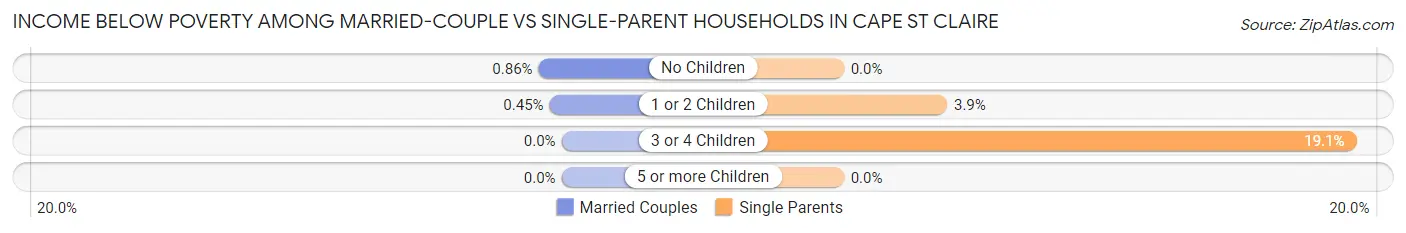
Income Below Poverty Among Married-Couple vs Single-Parent Households in Cape St Claire
The poverty data for Cape St Claire shows that 13 of the married-couple family households (0.6%) and 28 of the single-parent households (5.0%) are living below the poverty level. Within the married-couple family households, those with no children have the highest poverty rate, with 9 households (0.9%) falling below the poverty line. Among the single-parent households, those with 3 or 4 children have the highest poverty rate, with 17 household (19.1%) living below poverty.
| Children | Married-Couple Families | Single-Parent Households |
| No Children | 9 (0.9%) | 0 (0.0%) |
| 1 or 2 Children | 4 (0.4%) | 11 (3.8%) |
| 3 or 4 Children | 0 (0.0%) | 17 (19.1%) |
| 5 or more Children | 0 (0.0%) | 0 (0.0%) |
| Total | 13 (0.6%) | 28 (5.0%) |
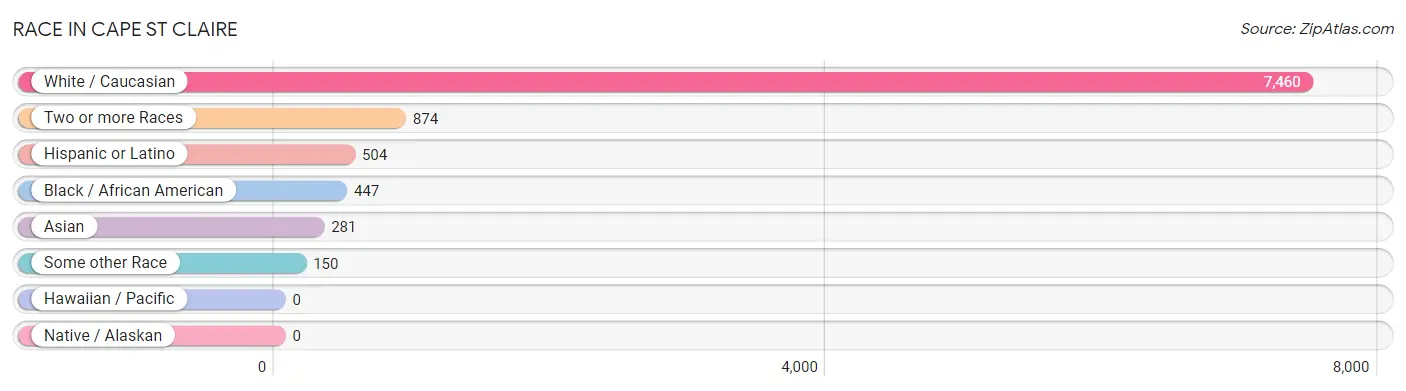
Race in Cape St Claire
The most populous races in Cape St Claire are White / Caucasian (7,460 | 81.0%), Two or more Races (874 | 9.5%), and Hispanic or Latino (504 | 5.5%).
| Race | # Population | % Population |
| Asian | 281 | 3.0% |
| Black / African American | 447 | 4.9% |
| Hawaiian / Pacific | 0 | 0.0% |
| Hispanic or Latino | 504 | 5.5% |
| Native / Alaskan | 0 | 0.0% |
| White / Caucasian | 7,460 | 81.0% |
| Two or more Races | 874 | 9.5% |
| Some other Race | 150 | 1.6% |
| Total | 9,212 | 100.0% |
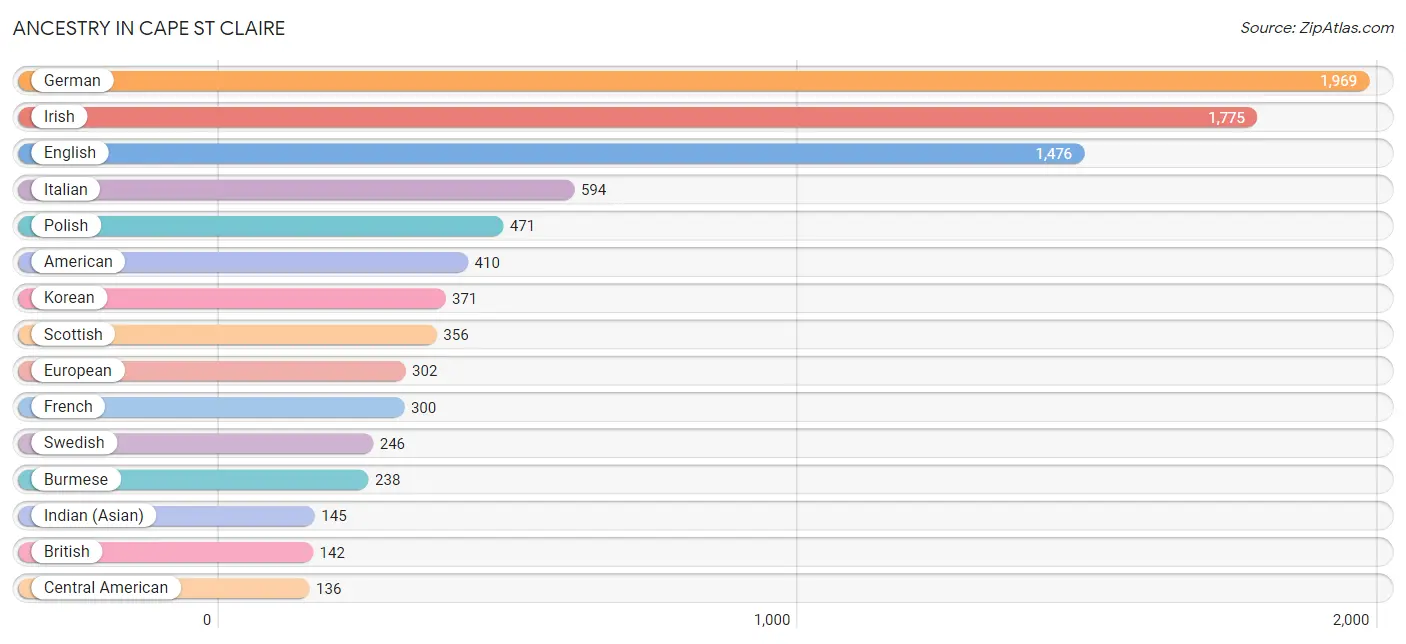
Ancestry in Cape St Claire
The most populous ancestries reported in Cape St Claire are German (1,969 | 21.4%), Irish (1,775 | 19.3%), English (1,476 | 16.0%), Italian (594 | 6.5%), and Polish (471 | 5.1%), together accounting for 68.2% of all Cape St Claire residents.
| Ancestry | # Population | % Population |
| African | 49 | 0.5% |
| American | 410 | 4.4% |
| Arab | 6 | 0.1% |
| Argentinean | 25 | 0.3% |
| Austrian | 35 | 0.4% |
| Belgian | 12 | 0.1% |
| Bermudan | 10 | 0.1% |
| Blackfeet | 11 | 0.1% |
| British | 142 | 1.5% |
| Burmese | 238 | 2.6% |
| Central American | 136 | 1.5% |
| Colombian | 29 | 0.3% |
| Croatian | 67 | 0.7% |
| Czech | 40 | 0.4% |
| Czechoslovakian | 16 | 0.2% |
| Danish | 72 | 0.8% |
| Dutch | 63 | 0.7% |
| Eastern European | 47 | 0.5% |
| English | 1,476 | 16.0% |
| Ethiopian | 9 | 0.1% |
| European | 302 | 3.3% |
| Finnish | 100 | 1.1% |
| French | 300 | 3.3% |
| French Canadian | 96 | 1.0% |
| German | 1,969 | 21.4% |
| Greek | 76 | 0.8% |
| Guamanian / Chamorro | 18 | 0.2% |
| Guatemalan | 81 | 0.9% |
| Honduran | 22 | 0.2% |
| Hungarian | 12 | 0.1% |
| Indian (Asian) | 145 | 1.6% |
| Iranian | 8 | 0.1% |
| Irish | 1,775 | 19.3% |
| Italian | 594 | 6.5% |
| Korean | 371 | 4.0% |
| Lithuanian | 44 | 0.5% |
| Lumbee | 82 | 0.9% |
| Maltese | 8 | 0.1% |
| Mexican | 103 | 1.1% |
| Northern European | 12 | 0.1% |
| Norwegian | 52 | 0.6% |
| Pakistani | 46 | 0.5% |
| Pennsylvania German | 26 | 0.3% |
| Peruvian | 52 | 0.6% |
| Polish | 471 | 5.1% |
| Portuguese | 19 | 0.2% |
| Puerto Rican | 22 | 0.2% |
| Romanian | 5 | 0.1% |
| Salvadoran | 33 | 0.4% |
| Scandinavian | 90 | 1.0% |
| Scotch-Irish | 92 | 1.0% |
| Scottish | 356 | 3.9% |
| Sioux | 11 | 0.1% |
| Slovak | 10 | 0.1% |
| Slovene | 27 | 0.3% |
| South American | 106 | 1.1% |
| Spanish | 66 | 0.7% |
| Sri Lankan | 33 | 0.4% |
| Subsaharan African | 58 | 0.6% |
| Swedish | 246 | 2.7% |
| Thai | 11 | 0.1% |
| Turkish | 68 | 0.7% |
| Ukrainian | 49 | 0.5% |
| Welsh | 106 | 1.1% | View All 64 Rows |
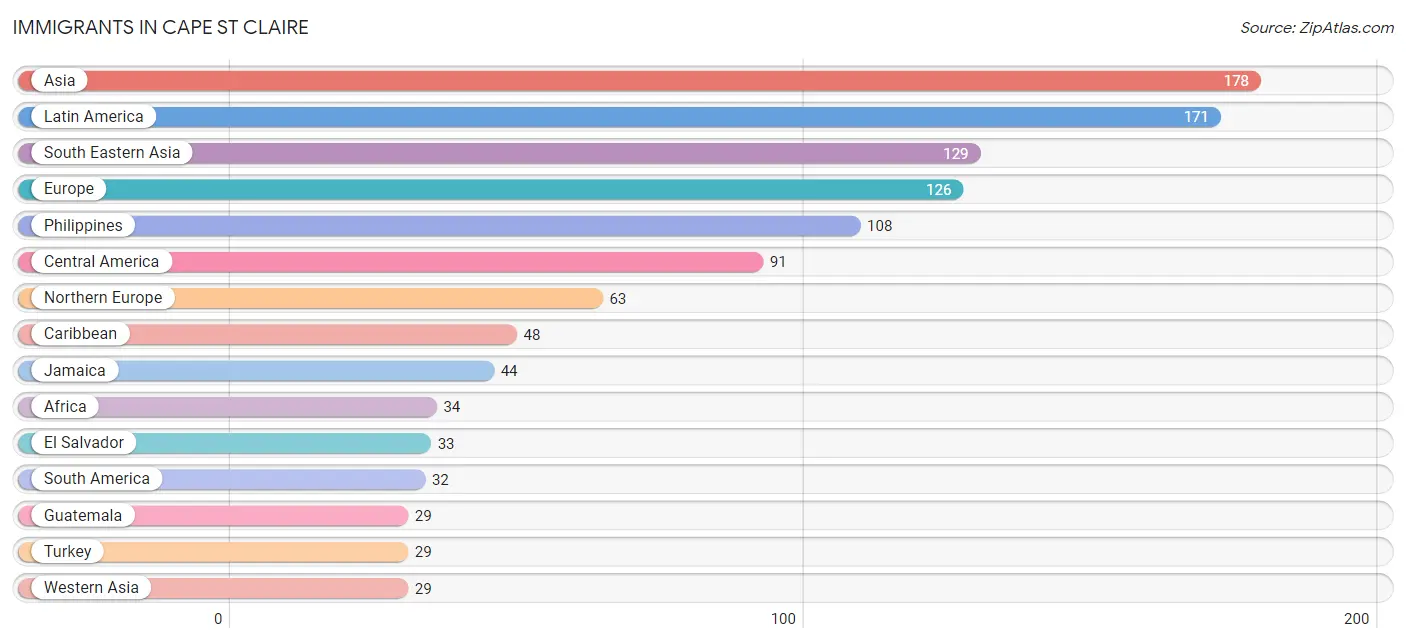
Immigrants in Cape St Claire
The most numerous immigrant groups reported in Cape St Claire came from Asia (178 | 1.9%), Latin America (171 | 1.9%), South Eastern Asia (129 | 1.4%), Europe (126 | 1.4%), and Philippines (108 | 1.2%), together accounting for 7.7% of all Cape St Claire residents.
| Immigration Origin | # Population | % Population |
| Africa | 34 | 0.4% |
| Asia | 178 | 1.9% |
| Austria | 9 | 0.1% |
| Canada | 7 | 0.1% |
| Caribbean | 48 | 0.5% |
| Central America | 91 | 1.0% |
| China | 13 | 0.1% |
| Colombia | 10 | 0.1% |
| Denmark | 10 | 0.1% |
| Eastern Africa | 9 | 0.1% |
| Eastern Asia | 13 | 0.1% |
| Eastern Europe | 15 | 0.2% |
| El Salvador | 33 | 0.4% |
| Ethiopia | 9 | 0.1% |
| Europe | 126 | 1.4% |
| Germany | 19 | 0.2% |
| Greece | 9 | 0.1% |
| Guatemala | 29 | 0.3% |
| Honduras | 20 | 0.2% |
| India | 7 | 0.1% |
| Ireland | 18 | 0.2% |
| Jamaica | 44 | 0.5% |
| Latin America | 171 | 1.9% |
| Mexico | 9 | 0.1% |
| Morocco | 6 | 0.1% |
| Northern Africa | 6 | 0.1% |
| Northern Europe | 63 | 0.7% |
| Peru | 22 | 0.2% |
| Philippines | 108 | 1.2% |
| Romania | 5 | 0.1% |
| South Africa | 14 | 0.2% |
| South America | 32 | 0.4% |
| South Central Asia | 7 | 0.1% |
| South Eastern Asia | 129 | 1.4% |
| Southern Europe | 20 | 0.2% |
| Spain | 11 | 0.1% |
| Trinidad and Tobago | 4 | 0.0% |
| Turkey | 29 | 0.3% |
| Ukraine | 10 | 0.1% |
| Vietnam | 21 | 0.2% |
| Western Asia | 29 | 0.3% |
| Western Europe | 28 | 0.3% | View All 42 Rows |
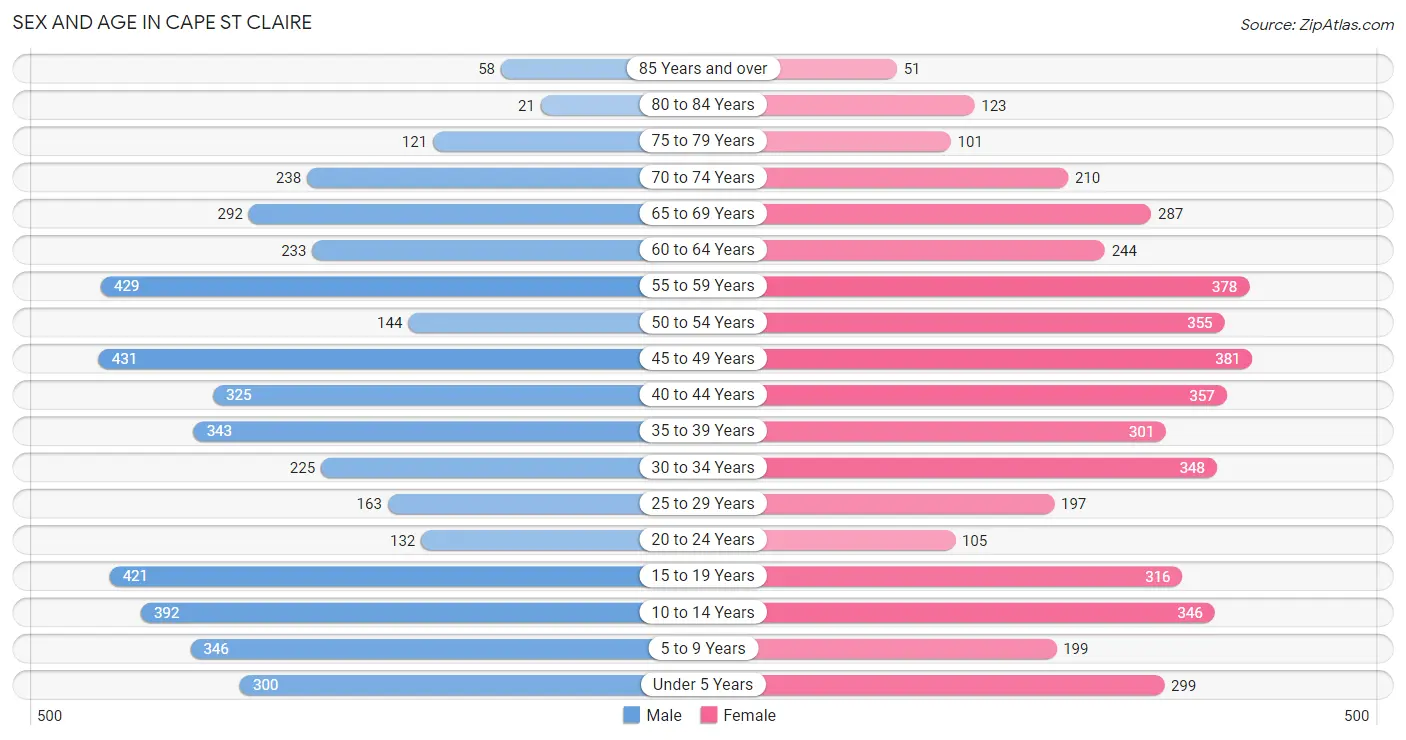
Sex and Age in Cape St Claire
Sex and Age in Cape St Claire
The most populous age groups in Cape St Claire are 45 to 49 Years (431 | 9.3%) for men and 45 to 49 Years (381 | 8.3%) for women.
| Age Bracket | Male | Female |
| Under 5 Years | 300 (6.5%) | 299 (6.5%) |
| 5 to 9 Years | 346 (7.5%) | 199 (4.3%) |
| 10 to 14 Years | 392 (8.5%) | 346 (7.5%) |
| 15 to 19 Years | 421 (9.1%) | 316 (6.9%) |
| 20 to 24 Years | 132 (2.9%) | 105 (2.3%) |
| 25 to 29 Years | 163 (3.5%) | 197 (4.3%) |
| 30 to 34 Years | 225 (4.9%) | 348 (7.6%) |
| 35 to 39 Years | 343 (7.4%) | 301 (6.6%) |
| 40 to 44 Years | 325 (7.0%) | 357 (7.8%) |
| 45 to 49 Years | 431 (9.3%) | 381 (8.3%) |
| 50 to 54 Years | 144 (3.1%) | 355 (7.7%) |
| 55 to 59 Years | 429 (9.3%) | 378 (8.2%) |
| 60 to 64 Years | 233 (5.1%) | 244 (5.3%) |
| 65 to 69 Years | 292 (6.3%) | 287 (6.2%) |
| 70 to 74 Years | 238 (5.2%) | 210 (4.6%) |
| 75 to 79 Years | 121 (2.6%) | 101 (2.2%) |
| 80 to 84 Years | 21 (0.5%) | 123 (2.7%) |
| 85 Years and over | 58 (1.3%) | 51 (1.1%) |
| Total | 4,614 (100.0%) | 4,598 (100.0%) |
Families and Households in Cape St Claire
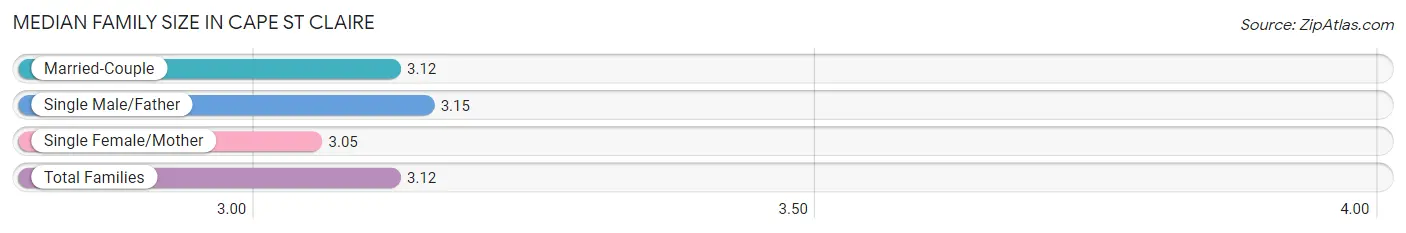
Median Family Size in Cape St Claire
The median family size in Cape St Claire is 3.12 persons per family, with single male/father families (213 | 8.2%) accounting for the largest median family size of 3.15 persons per family. On the other hand, single female/mother families (343 | 13.1%) represent the smallest median family size with 3.05 persons per family.
| Family Type | # Families | Family Size |
| Married-Couple | 2,059 (78.7%) | 3.12 |
| Single Male/Father | 213 (8.2%) | 3.15 |
| Single Female/Mother | 343 (13.1%) | 3.05 |
| Total Families | 2,615 (100.0%) | 3.12 |
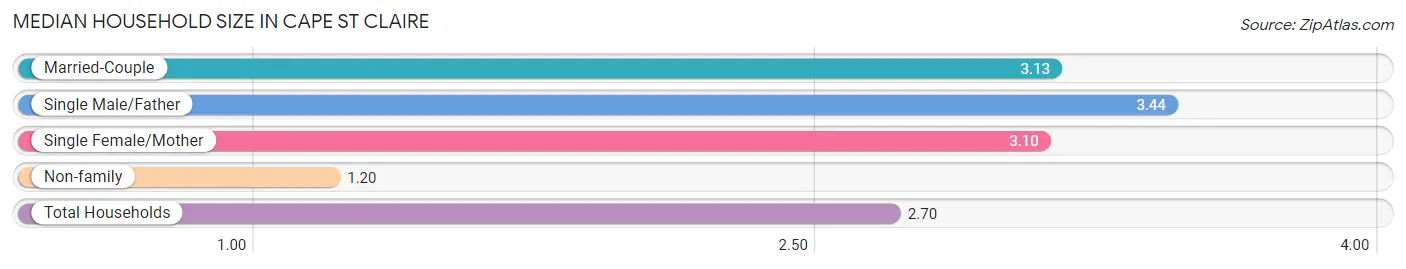
Median Household Size in Cape St Claire
The median household size in Cape St Claire is 2.70 persons per household, with single male/father households (213 | 6.2%) accounting for the largest median household size of 3.44 persons per household. non-family households (798 | 23.4%) represent the smallest median household size with 1.20 persons per household.
| Household Type | # Households | Household Size |
| Married-Couple | 2,059 (60.3%) | 3.13 |
| Single Male/Father | 213 (6.2%) | 3.44 |
| Single Female/Mother | 343 (10.1%) | 3.10 |
| Non-family | 798 (23.4%) | 1.20 |
| Total Households | 3,413 (100.0%) | 2.70 |
Household Size by Marriage Status in Cape St Claire
Out of a total of 3,413 households in Cape St Claire, 2,615 (76.6%) are family households, while 798 (23.4%) are nonfamily households. The most numerous type of family households are 2-person households, comprising 1,058, and the most common type of nonfamily households are 1-person households, comprising 669.
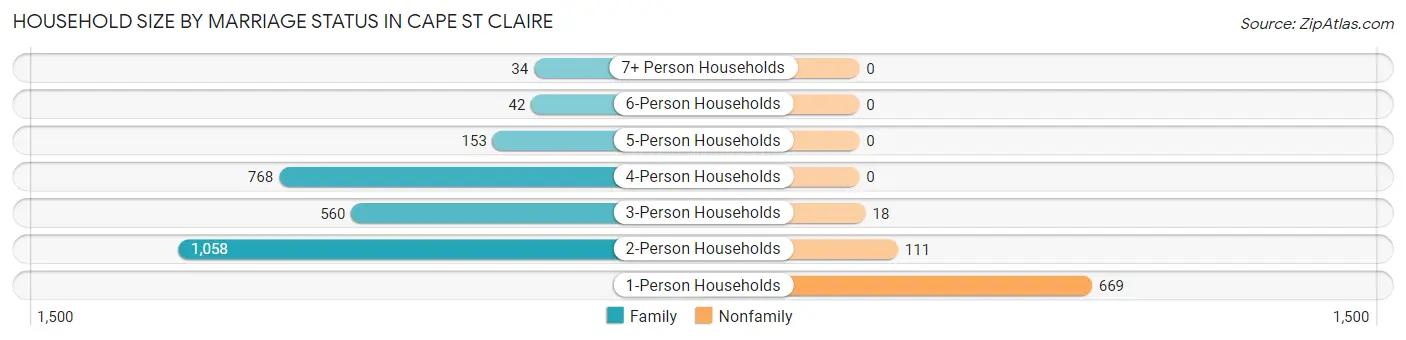
| Household Size | Family Households | Nonfamily Households |
| 1-Person Households | - | 669 (19.6%) |
| 2-Person Households | 1,058 (31.0%) | 111 (3.3%) |
| 3-Person Households | 560 (16.4%) | 18 (0.5%) |
| 4-Person Households | 768 (22.5%) | 0 (0.0%) |
| 5-Person Households | 153 (4.5%) | 0 (0.0%) |
| 6-Person Households | 42 (1.2%) | 0 (0.0%) |
| 7+ Person Households | 34 (1.0%) | 0 (0.0%) |
| Total | 2,615 (76.6%) | 798 (23.4%) |
Female Fertility in Cape St Claire
Fertility by Age in Cape St Claire
Average fertility rate in Cape St Claire is 45.0 births per 1,000 women. Women in the age bracket of 20 to 34 years have the highest fertility rate with 120.0 births per 1,000 women. Women in the age bracket of 20 to 34 years acount for 82.1% of all women with births.
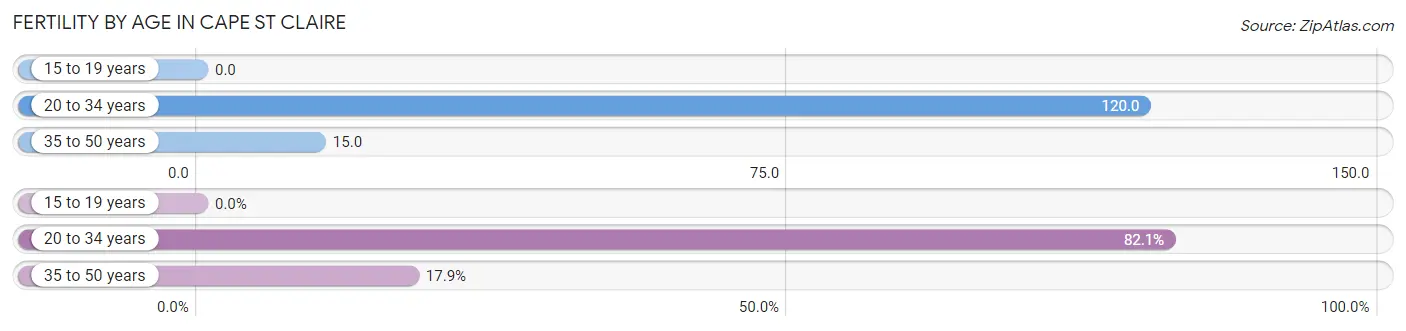
| Age Bracket | Women with Births | Births / 1,000 Women |
| 15 to 19 years | 0 (0.0%) | 0.0 |
| 20 to 34 years | 78 (82.1%) | 120.0 |
| 35 to 50 years | 17 (17.9%) | 15.0 |
| Total | 95 (100.0%) | 45.0 |
Fertility by Age by Marriage Status in Cape St Claire
88.4% of women with births (95) in Cape St Claire are married. The highest percentage of unmarried women with births falls into 20 to 34 years age bracket with 14.1% of them unmarried at the time of birth, while the lowest percentage of unmarried women with births belong to 35 to 50 years age bracket with 0.0% of them unmarried.
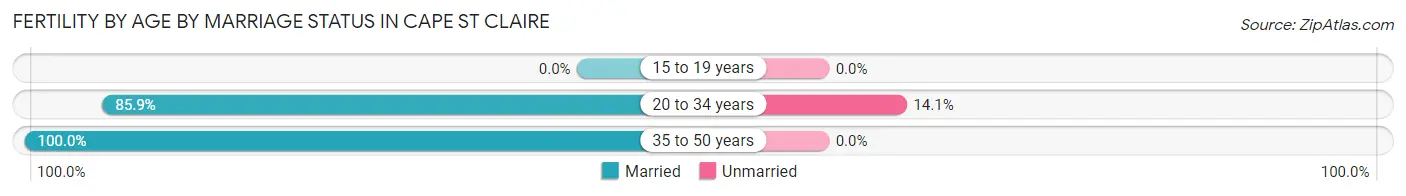
| Age Bracket | Married | Unmarried |
| 15 to 19 years | 0 (0.0%) | 0 (0.0%) |
| 20 to 34 years | 67 (85.9%) | 11 (14.1%) |
| 35 to 50 years | 17 (100.0%) | 0 (0.0%) |
| Total | 84 (88.4%) | 11 (11.6%) |
Fertility by Education in Cape St Claire
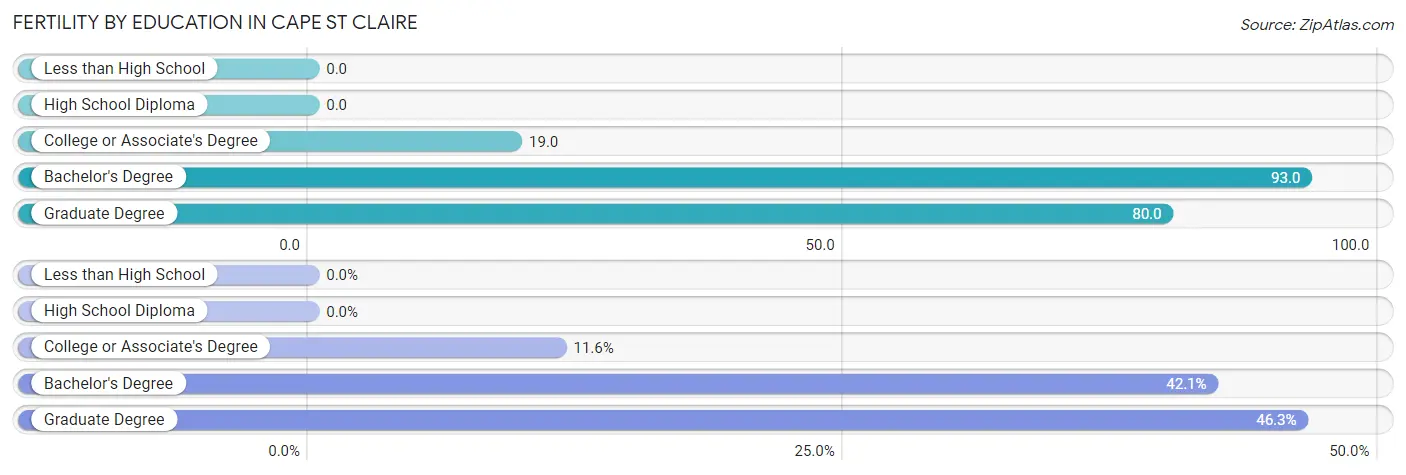
| Educational Attainment | Women with Births | Births / 1,000 Women |
| Less than High School | 0 (0.0%) | 0.0 |
| High School Diploma | 0 (0.0%) | 0.0 |
| College or Associate's Degree | 11 (11.6%) | 19.0 |
| Bachelor's Degree | 40 (42.1%) | 93.0 |
| Graduate Degree | 44 (46.3%) | 80.0 |
| Total | 95 (100.0%) | 45.0 |
Fertility by Education by Marriage Status in Cape St Claire
11.6% of women with births in Cape St Claire are unmarried. Women with the educational attainment of bachelor's degree are most likely to be married with 100.0% of them married at childbirth, while women with the educational attainment of college or associate's degree are least likely to be married with 100.0% of them unmarried at childbirth.
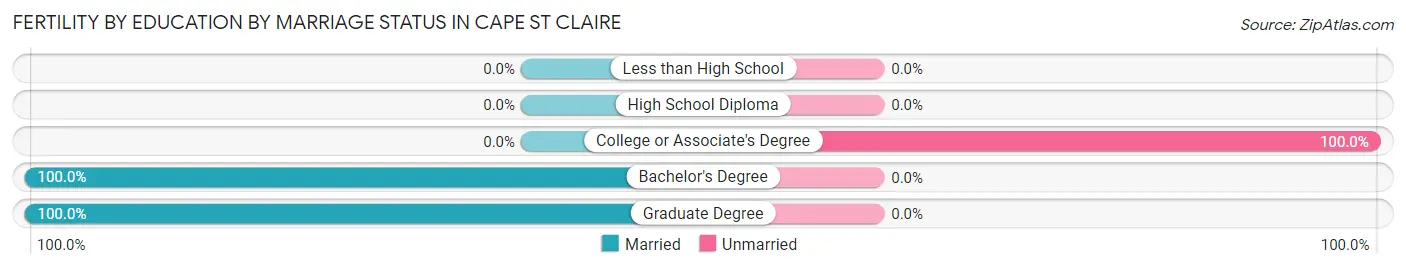
| Educational Attainment | Married | Unmarried |
| Less than High School | 0 (0.0%) | 0 (0.0%) |
| High School Diploma | 0 (0.0%) | 0 (0.0%) |
| College or Associate's Degree | 0 (0.0%) | 11 (100.0%) |
| Bachelor's Degree | 40 (100.0%) | 0 (0.0%) |
| Graduate Degree | 44 (100.0%) | 0 (0.0%) |
| Total | 84 (88.4%) | 11 (11.6%) |
Employment Characteristics in Cape St Claire
Employment by Class of Employer in Cape St Claire
Among the 4,713 employed individuals in Cape St Claire, private company employees (2,383 | 50.6%), federal government employees (866 | 18.4%), and local government employees (412 | 8.7%) make up the most common classes of employment.
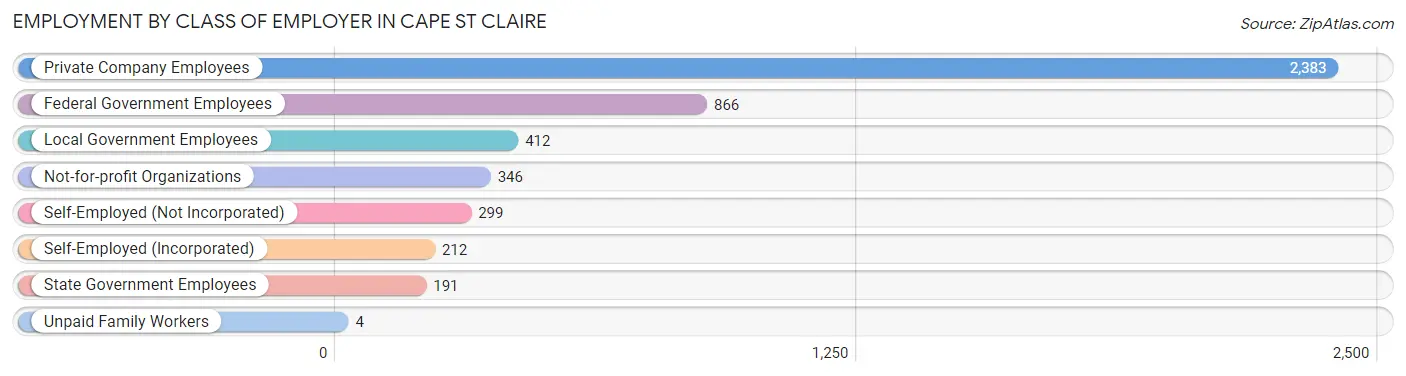
| Employer Class | # Employees | % Employees |
| Private Company Employees | 2,383 | 50.6% |
| Self-Employed (Incorporated) | 212 | 4.5% |
| Self-Employed (Not Incorporated) | 299 | 6.3% |
| Not-for-profit Organizations | 346 | 7.3% |
| Local Government Employees | 412 | 8.7% |
| State Government Employees | 191 | 4.1% |
| Federal Government Employees | 866 | 18.4% |
| Unpaid Family Workers | 4 | 0.1% |
| Total | 4,713 | 100.0% |
Employment Status by Age in Cape St Claire
According to the labor force statistics for Cape St Claire, out of the total population over 16 years of age (7,174), 70.3% or 5,043 individuals are in the labor force, with 5.8% or 292 of them unemployed. The age group with the highest labor force participation rate is 25 to 29 years, with 96.7% or 348 individuals in the labor force. Within the labor force, the 16 to 19 years age range has the highest percentage of unemployed individuals, with 29.5% or 54 of them being unemployed.
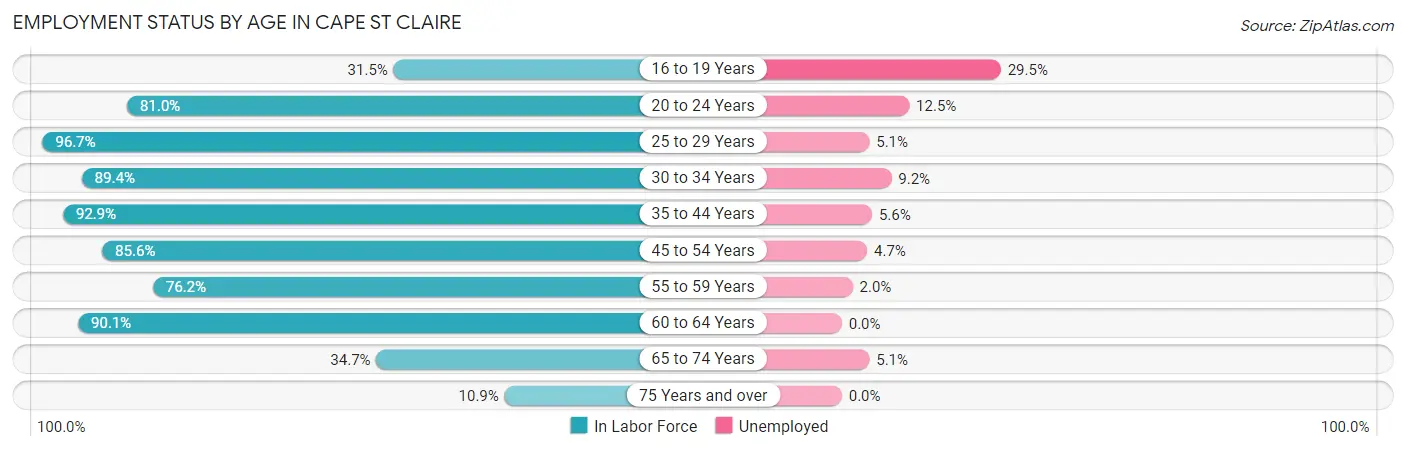
| Age Bracket | In Labor Force | Unemployed |
| 16 to 19 Years | 183 (31.5%) | 54 (29.5%) |
| 20 to 24 Years | 192 (81.0%) | 24 (12.5%) |
| 25 to 29 Years | 348 (96.7%) | 18 (5.1%) |
| 30 to 34 Years | 512 (89.4%) | 47 (9.2%) |
| 35 to 44 Years | 1,232 (92.9%) | 69 (5.6%) |
| 45 to 54 Years | 1,122 (85.6%) | 53 (4.7%) |
| 55 to 59 Years | 615 (76.2%) | 12 (2.0%) |
| 60 to 64 Years | 430 (90.1%) | 0 (0.0%) |
| 65 to 74 Years | 356 (34.7%) | 18 (5.1%) |
| 75 Years and over | 52 (10.9%) | 0 (0.0%) |
| Total | 5,043 (70.3%) | 292 (5.8%) |
Employment Status by Educational Attainment in Cape St Claire
According to labor force statistics for Cape St Claire, 87.7% of individuals (4,257) out of the total population between 25 and 64 years of age (4,854) are in the labor force, with 4.6% or 196 of them being unemployed. The group with the highest labor force participation rate are those with the educational attainment of bachelor's degree or higher, with 91.8% or 2,433 individuals in the labor force. Within the labor force, individuals with high school diploma education have the highest percentage of unemployment, with 9.6% or 52 of them being unemployed.
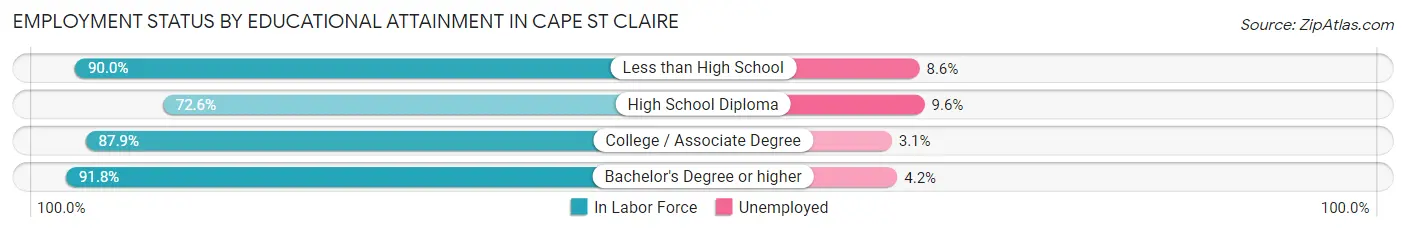
| Educational Attainment | In Labor Force | Unemployed |
| Less than High School | 81 (90.0%) | 8 (8.6%) |
| High School Diploma | 539 (72.6%) | 71 (9.6%) |
| College / Associate Degree | 1,206 (87.9%) | 43 (3.1%) |
| Bachelor's Degree or higher | 2,433 (91.8%) | 111 (4.2%) |
| Total | 4,257 (87.7%) | 223 (4.6%) |
Employment Occupations by Sex in Cape St Claire
Management, Business, Science and Arts Occupations
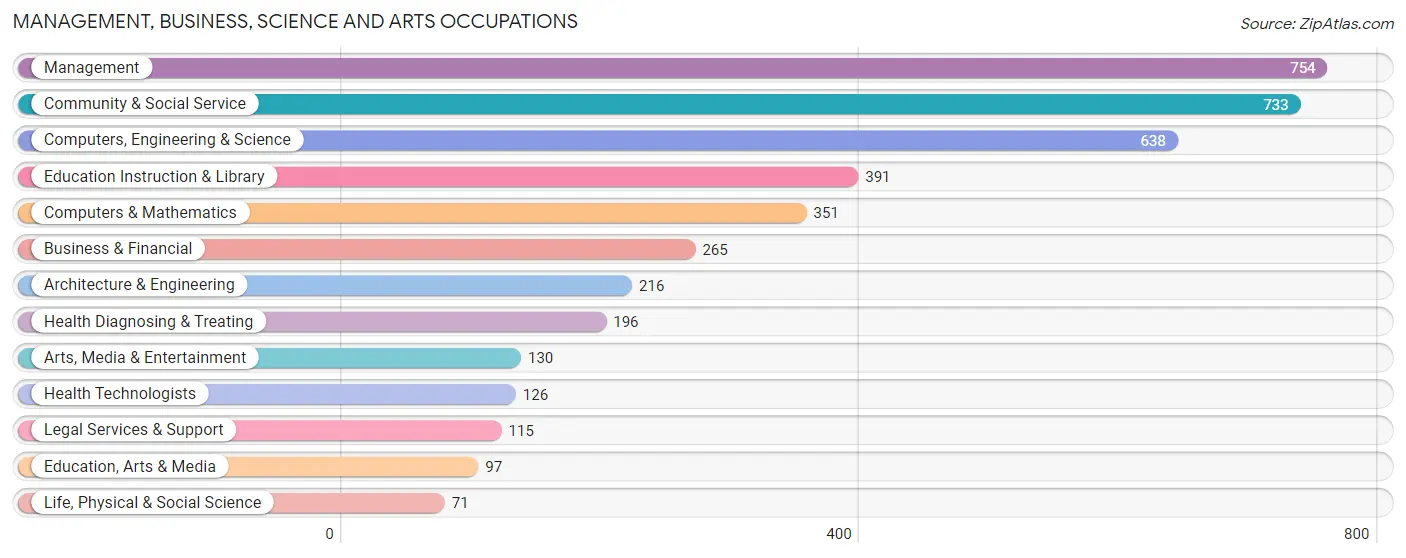
The most common Management, Business, Science and Arts occupations in Cape St Claire are Management (754 | 16.2%), Community & Social Service (733 | 15.7%), Computers, Engineering & Science (638 | 13.7%), Education Instruction & Library (391 | 8.4%), and Computers & Mathematics (351 | 7.5%).
Management, Business, Science and Arts Occupations by Sex
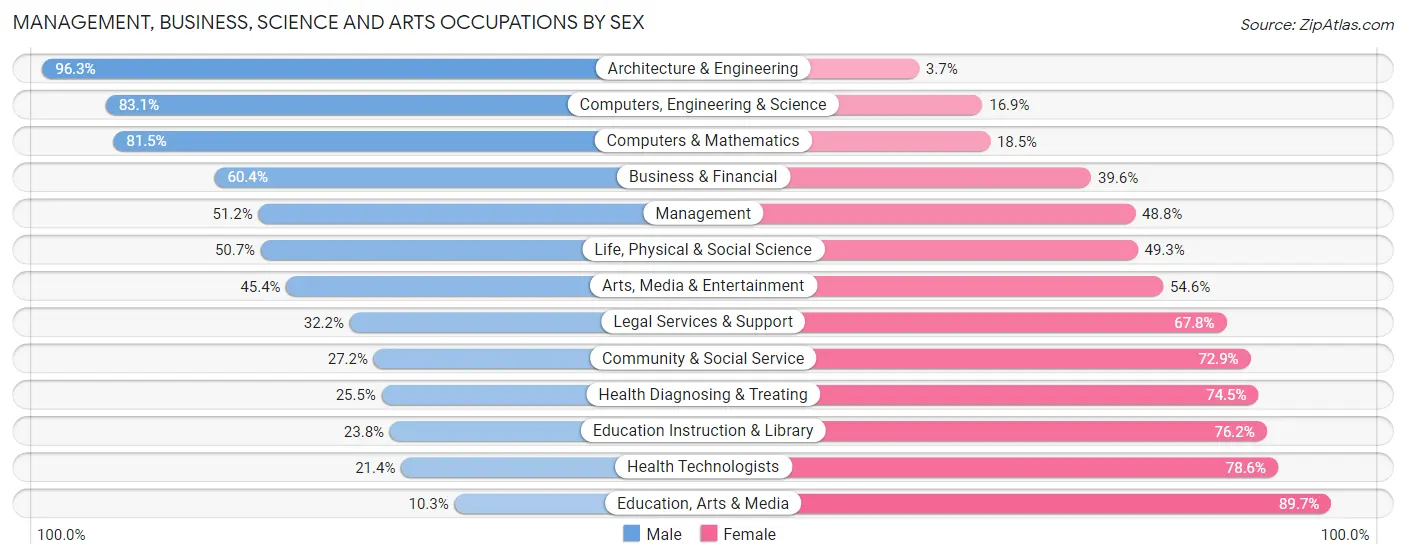
Within the Management, Business, Science and Arts occupations in Cape St Claire, the most male-oriented occupations are Architecture & Engineering (96.3%), Computers, Engineering & Science (83.1%), and Computers & Mathematics (81.5%), while the most female-oriented occupations are Education, Arts & Media (89.7%), Health Technologists (78.6%), and Education Instruction & Library (76.2%).
| Occupation | Male | Female |
| Management | 386 (51.2%) | 368 (48.8%) |
| Business & Financial | 160 (60.4%) | 105 (39.6%) |
| Computers, Engineering & Science | 530 (83.1%) | 108 (16.9%) |
| Computers & Mathematics | 286 (81.5%) | 65 (18.5%) |
| Architecture & Engineering | 208 (96.3%) | 8 (3.7%) |
| Life, Physical & Social Science | 36 (50.7%) | 35 (49.3%) |
| Community & Social Service | 199 (27.2%) | 534 (72.9%) |
| Education, Arts & Media | 10 (10.3%) | 87 (89.7%) |
| Legal Services & Support | 37 (32.2%) | 78 (67.8%) |
| Education Instruction & Library | 93 (23.8%) | 298 (76.2%) |
| Arts, Media & Entertainment | 59 (45.4%) | 71 (54.6%) |
| Health Diagnosing & Treating | 50 (25.5%) | 146 (74.5%) |
| Health Technologists | 27 (21.4%) | 99 (78.6%) |
| Total (Category) | 1,325 (51.2%) | 1,261 (48.8%) |
| Total (Overall) | 2,342 (50.2%) | 2,324 (49.8%) |
Services Occupations
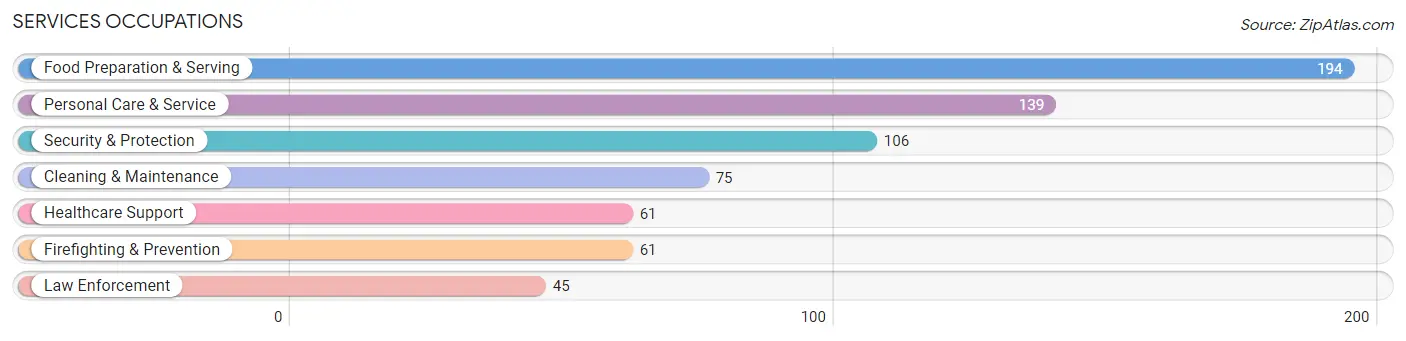
The most common Services occupations in Cape St Claire are Food Preparation & Serving (194 | 4.2%), Personal Care & Service (139 | 3.0%), Security & Protection (106 | 2.3%), Cleaning & Maintenance (75 | 1.6%), and Healthcare Support (61 | 1.3%).
Services Occupations by Sex
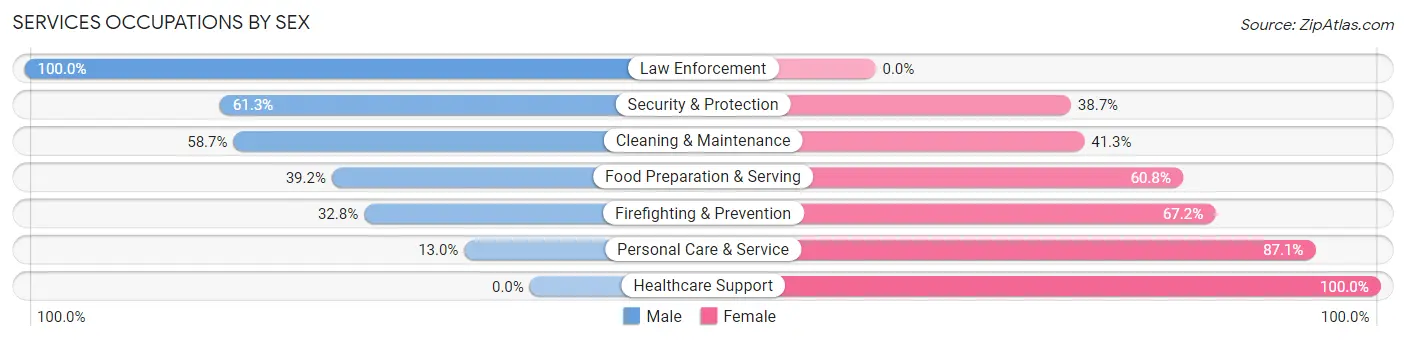
Within the Services occupations in Cape St Claire, the most male-oriented occupations are Law Enforcement (100.0%), Security & Protection (61.3%), and Cleaning & Maintenance (58.7%), while the most female-oriented occupations are Healthcare Support (100.0%), Personal Care & Service (87.1%), and Firefighting & Prevention (67.2%).
| Occupation | Male | Female |
| Healthcare Support | 0 (0.0%) | 61 (100.0%) |
| Security & Protection | 65 (61.3%) | 41 (38.7%) |
| Firefighting & Prevention | 20 (32.8%) | 41 (67.2%) |
| Law Enforcement | 45 (100.0%) | 0 (0.0%) |
| Food Preparation & Serving | 76 (39.2%) | 118 (60.8%) |
| Cleaning & Maintenance | 44 (58.7%) | 31 (41.3%) |
| Personal Care & Service | 18 (13.0%) | 121 (87.1%) |
| Total (Category) | 203 (35.3%) | 372 (64.7%) |
| Total (Overall) | 2,342 (50.2%) | 2,324 (49.8%) |
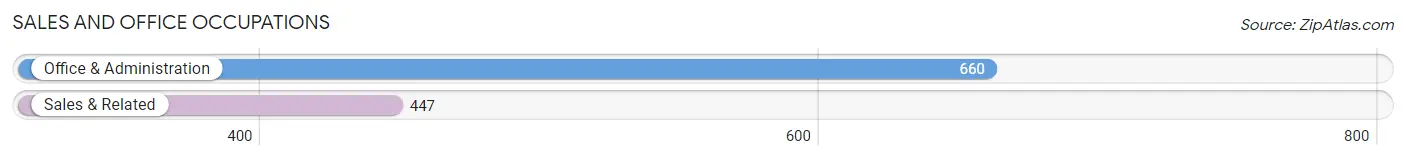
Sales and Office Occupations
The most common Sales and Office occupations in Cape St Claire are Office & Administration (660 | 14.1%), and Sales & Related (447 | 9.6%).
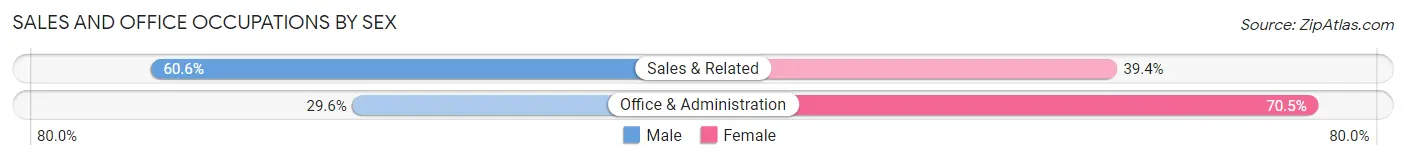
Sales and Office Occupations by Sex
| Occupation | Male | Female |
| Sales & Related | 271 (60.6%) | 176 (39.4%) |
| Office & Administration | 195 (29.5%) | 465 (70.5%) |
| Total (Category) | 466 (42.1%) | 641 (57.9%) |
| Total (Overall) | 2,342 (50.2%) | 2,324 (49.8%) |
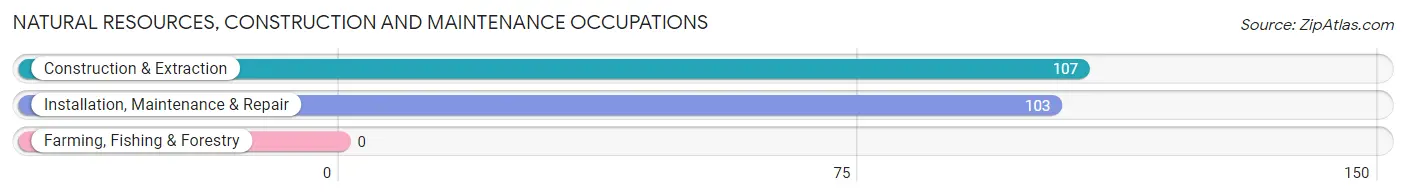
Natural Resources, Construction and Maintenance Occupations
The most common Natural Resources, Construction and Maintenance occupations in Cape St Claire are Construction & Extraction (107 | 2.3%), and Installation, Maintenance & Repair (103 | 2.2%).
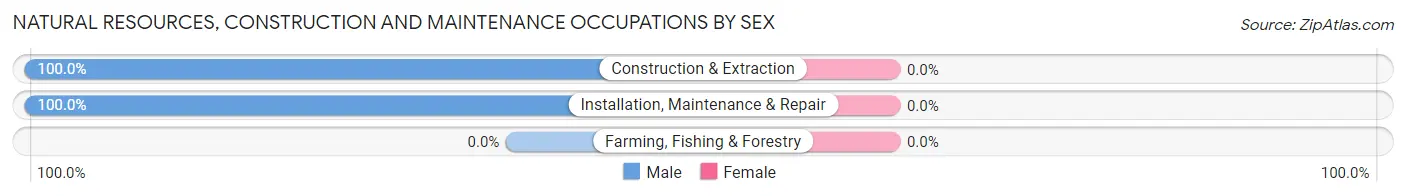
Natural Resources, Construction and Maintenance Occupations by Sex
| Occupation | Male | Female |
| Farming, Fishing & Forestry | 0 (0.0%) | 0 (0.0%) |
| Construction & Extraction | 107 (100.0%) | 0 (0.0%) |
| Installation, Maintenance & Repair | 103 (100.0%) | 0 (0.0%) |
| Total (Category) | 210 (100.0%) | 0 (0.0%) |
| Total (Overall) | 2,342 (50.2%) | 2,324 (49.8%) |
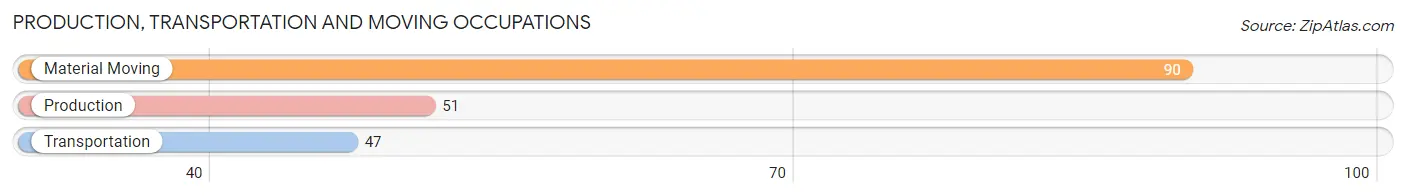
Production, Transportation and Moving Occupations
The most common Production, Transportation and Moving occupations in Cape St Claire are Material Moving (90 | 1.9%), Production (51 | 1.1%), and Transportation (47 | 1.0%).
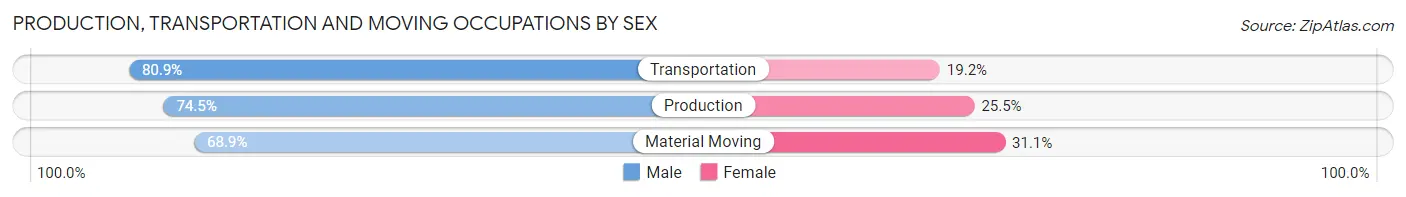
Production, Transportation and Moving Occupations by Sex
| Occupation | Male | Female |
| Production | 38 (74.5%) | 13 (25.5%) |
| Transportation | 38 (80.8%) | 9 (19.2%) |
| Material Moving | 62 (68.9%) | 28 (31.1%) |
| Total (Category) | 138 (73.4%) | 50 (26.6%) |
| Total (Overall) | 2,342 (50.2%) | 2,324 (49.8%) |
Employment Industries by Sex in Cape St Claire
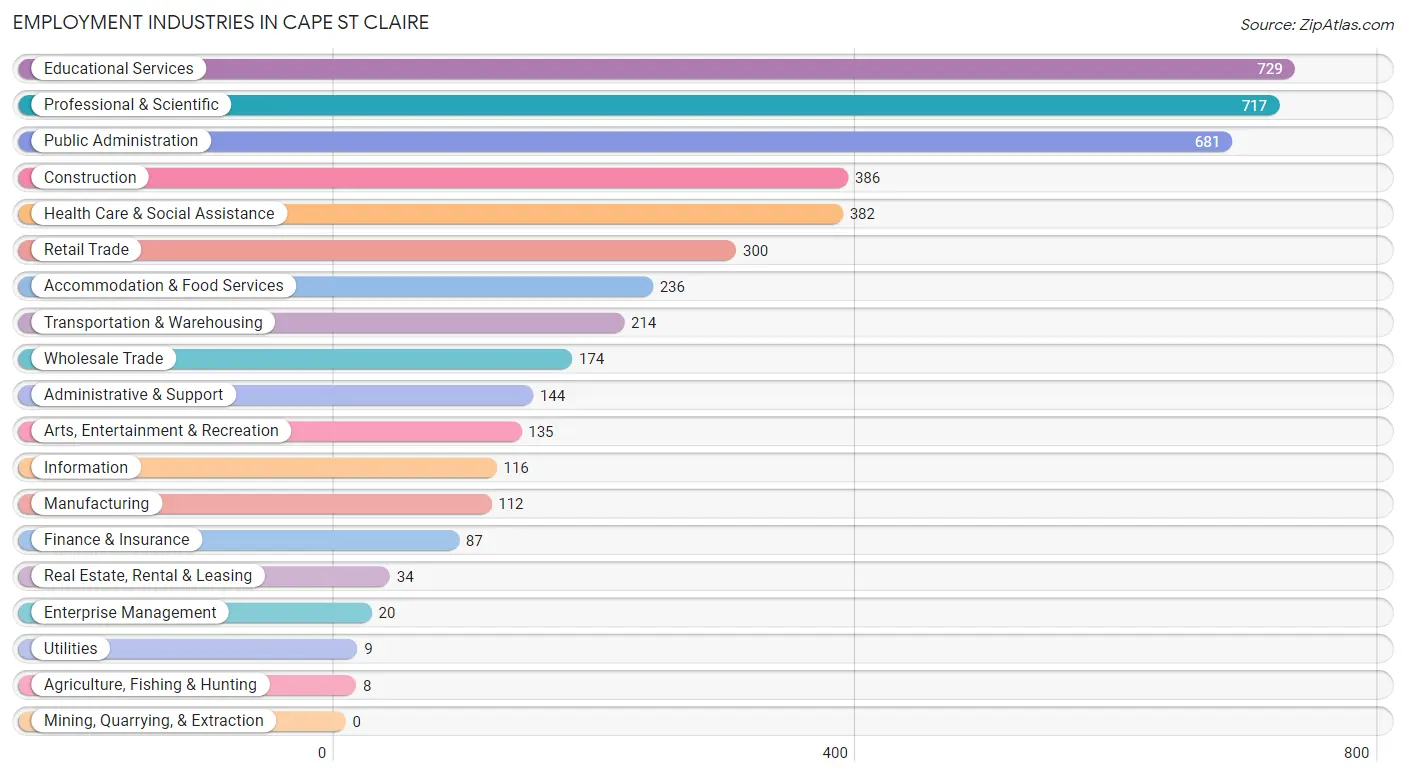
Employment Industries in Cape St Claire
The major employment industries in Cape St Claire include Educational Services (729 | 15.6%), Professional & Scientific (717 | 15.4%), Public Administration (681 | 14.6%), Construction (386 | 8.3%), and Health Care & Social Assistance (382 | 8.2%).
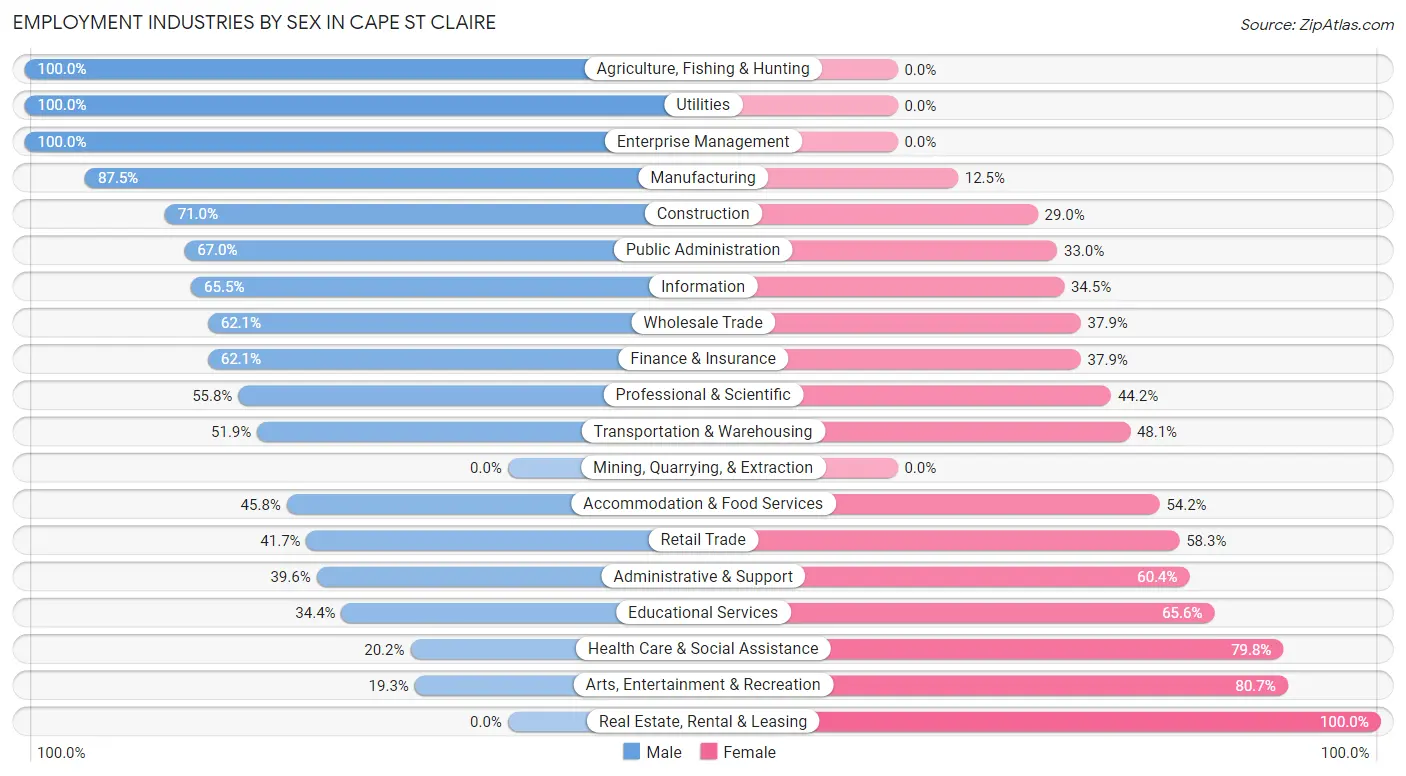
Employment Industries by Sex in Cape St Claire
The Cape St Claire industries that see more men than women are Agriculture, Fishing & Hunting (100.0%), Utilities (100.0%), and Enterprise Management (100.0%), whereas the industries that tend to have a higher number of women are Real Estate, Rental & Leasing (100.0%), Arts, Entertainment & Recreation (80.7%), and Health Care & Social Assistance (79.8%).
| Industry | Male | Female |
| Agriculture, Fishing & Hunting | 8 (100.0%) | 0 (0.0%) |
| Mining, Quarrying, & Extraction | 0 (0.0%) | 0 (0.0%) |
| Construction | 274 (71.0%) | 112 (29.0%) |
| Manufacturing | 98 (87.5%) | 14 (12.5%) |
| Wholesale Trade | 108 (62.1%) | 66 (37.9%) |
| Retail Trade | 125 (41.7%) | 175 (58.3%) |
| Transportation & Warehousing | 111 (51.9%) | 103 (48.1%) |
| Utilities | 9 (100.0%) | 0 (0.0%) |
| Information | 76 (65.5%) | 40 (34.5%) |
| Finance & Insurance | 54 (62.1%) | 33 (37.9%) |
| Real Estate, Rental & Leasing | 0 (0.0%) | 34 (100.0%) |
| Professional & Scientific | 400 (55.8%) | 317 (44.2%) |
| Enterprise Management | 20 (100.0%) | 0 (0.0%) |
| Administrative & Support | 57 (39.6%) | 87 (60.4%) |
| Educational Services | 251 (34.4%) | 478 (65.6%) |
| Health Care & Social Assistance | 77 (20.2%) | 305 (79.8%) |
| Arts, Entertainment & Recreation | 26 (19.3%) | 109 (80.7%) |
| Accommodation & Food Services | 108 (45.8%) | 128 (54.2%) |
| Public Administration | 456 (67.0%) | 225 (33.0%) |
| Total | 2,342 (50.2%) | 2,324 (49.8%) |
Education in Cape St Claire
School Enrollment in Cape St Claire
The most common levels of schooling among the 2,443 students in Cape St Claire are high school (687 | 28.1%), middle school (563 | 23.1%), and elementary school (421 | 17.2%).
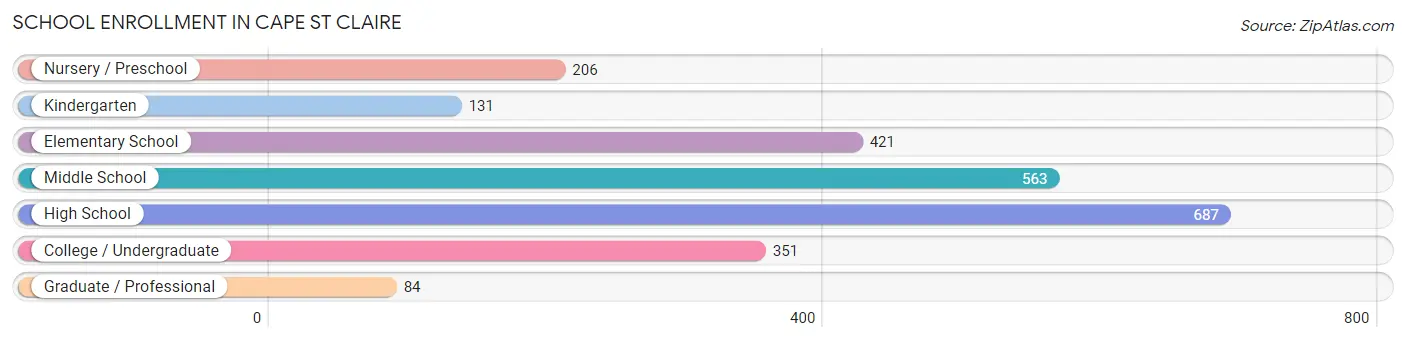
| School Level | # Students | % Students |
| Nursery / Preschool | 206 | 8.4% |
| Kindergarten | 131 | 5.4% |
| Elementary School | 421 | 17.2% |
| Middle School | 563 | 23.1% |
| High School | 687 | 28.1% |
| College / Undergraduate | 351 | 14.4% |
| Graduate / Professional | 84 | 3.4% |
| Total | 2,443 | 100.0% |
School Enrollment by Age by Funding Source in Cape St Claire
Out of a total of 2,443 students who are enrolled in schools in Cape St Claire, 621 (25.4%) attend a private institution, while the remaining 1,822 (74.6%) are enrolled in public schools. The age group of 3 to 4 year olds has the highest likelihood of being enrolled in private schools, with 128 (87.7% in the age bracket) enrolled. Conversely, the age group of 10 to 14 year olds has the lowest likelihood of being enrolled in a private school, with 659 (90.4% in the age bracket) attending a public institution.
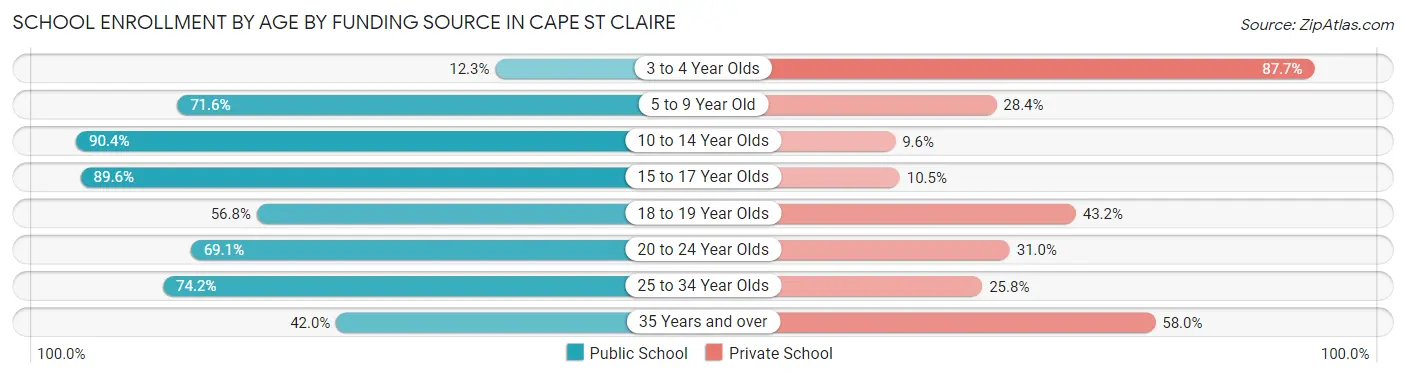
| Age Bracket | Public School | Private School |
| 3 to 4 Year Olds | 18 (12.3%) | 128 (87.7%) |
| 5 to 9 Year Old | 385 (71.6%) | 153 (28.4%) |
| 10 to 14 Year Olds | 659 (90.4%) | 70 (9.6%) |
| 15 to 17 Year Olds | 437 (89.5%) | 51 (10.4%) |
| 18 to 19 Year Olds | 126 (56.8%) | 96 (43.2%) |
| 20 to 24 Year Olds | 58 (69.1%) | 26 (30.9%) |
| 25 to 34 Year Olds | 92 (74.2%) | 32 (25.8%) |
| 35 Years and over | 47 (42.0%) | 65 (58.0%) |
| Total | 1,822 (74.6%) | 621 (25.4%) |
Educational Attainment by Field of Study in Cape St Claire
Business (499 | 13.7%), engineering (445 | 12.2%), education (334 | 9.2%), computers & mathematics (325 | 8.9%), and social sciences (316 | 8.7%) are the most common fields of study among 3,637 individuals in Cape St Claire who have obtained a bachelor's degree or higher.
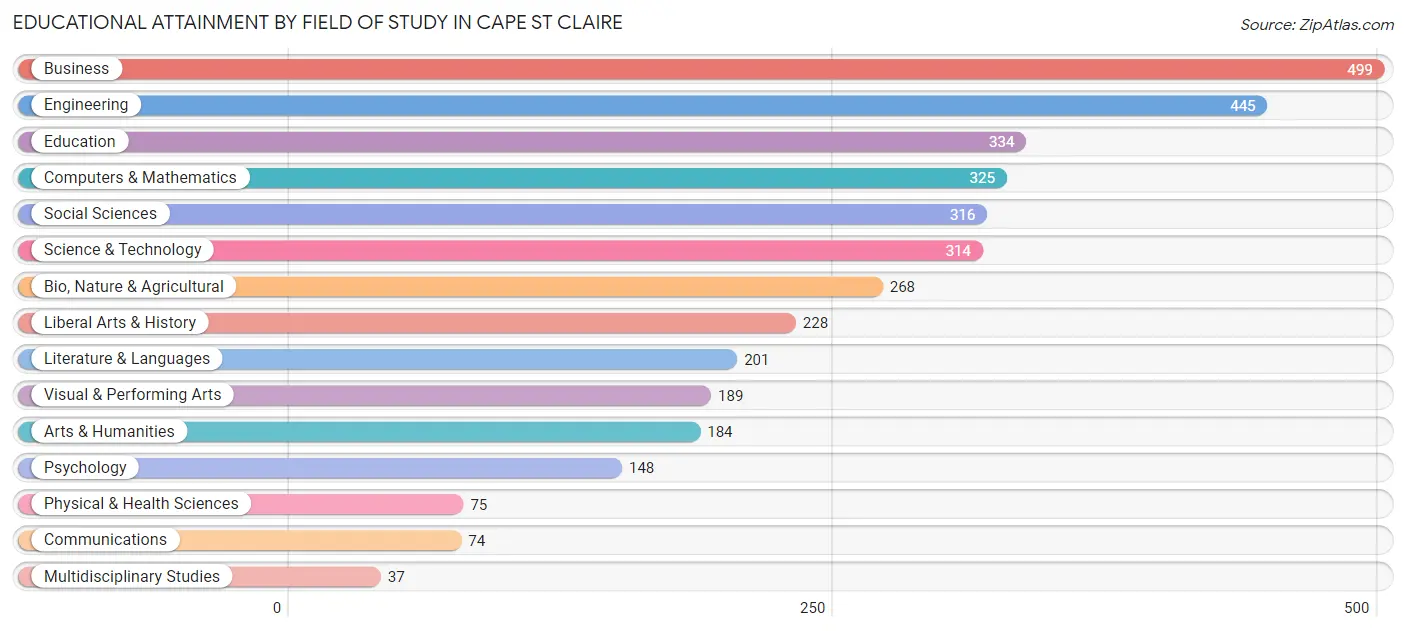
| Field of Study | # Graduates | % Graduates |
| Computers & Mathematics | 325 | 8.9% |
| Bio, Nature & Agricultural | 268 | 7.4% |
| Physical & Health Sciences | 75 | 2.1% |
| Psychology | 148 | 4.1% |
| Social Sciences | 316 | 8.7% |
| Engineering | 445 | 12.2% |
| Multidisciplinary Studies | 37 | 1.0% |
| Science & Technology | 314 | 8.6% |
| Business | 499 | 13.7% |
| Education | 334 | 9.2% |
| Literature & Languages | 201 | 5.5% |
| Liberal Arts & History | 228 | 6.3% |
| Visual & Performing Arts | 189 | 5.2% |
| Communications | 74 | 2.0% |
| Arts & Humanities | 184 | 5.1% |
| Total | 3,637 | 100.0% |
Transportation & Commute in Cape St Claire
Vehicle Availability by Sex in Cape St Claire
The most prevalent vehicle ownership categories in Cape St Claire are males with 2 vehicles (1,095, accounting for 45.9%) and females with 2 vehicles (1,059, making up 47.0%).
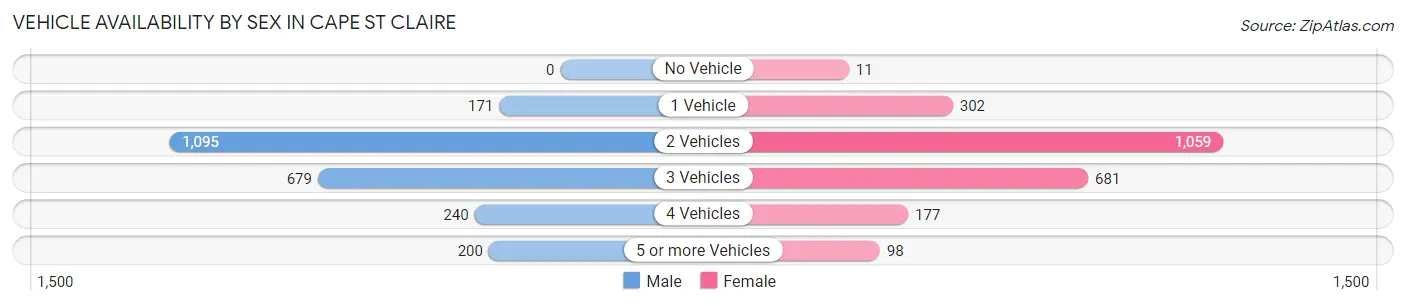
| Vehicles Available | Male | Female |
| No Vehicle | 0 (0.0%) | 11 (0.5%) |
| 1 Vehicle | 171 (7.2%) | 302 (13.0%) |
| 2 Vehicles | 1,095 (45.9%) | 1,059 (45.5%) |
| 3 Vehicles | 679 (28.5%) | 681 (29.2%) |
| 4 Vehicles | 240 (10.1%) | 177 (7.6%) |
| 5 or more Vehicles | 200 (8.4%) | 98 (4.2%) |
| Total | 2,385 (100.0%) | 2,328 (100.0%) |
Commute Time in Cape St Claire
The most frequently occuring commute durations in Cape St Claire are 15 to 19 minutes (627 commuters, 16.6%), 30 to 34 minutes (575 commuters, 15.2%), and 45 to 59 minutes (458 commuters, 12.1%).
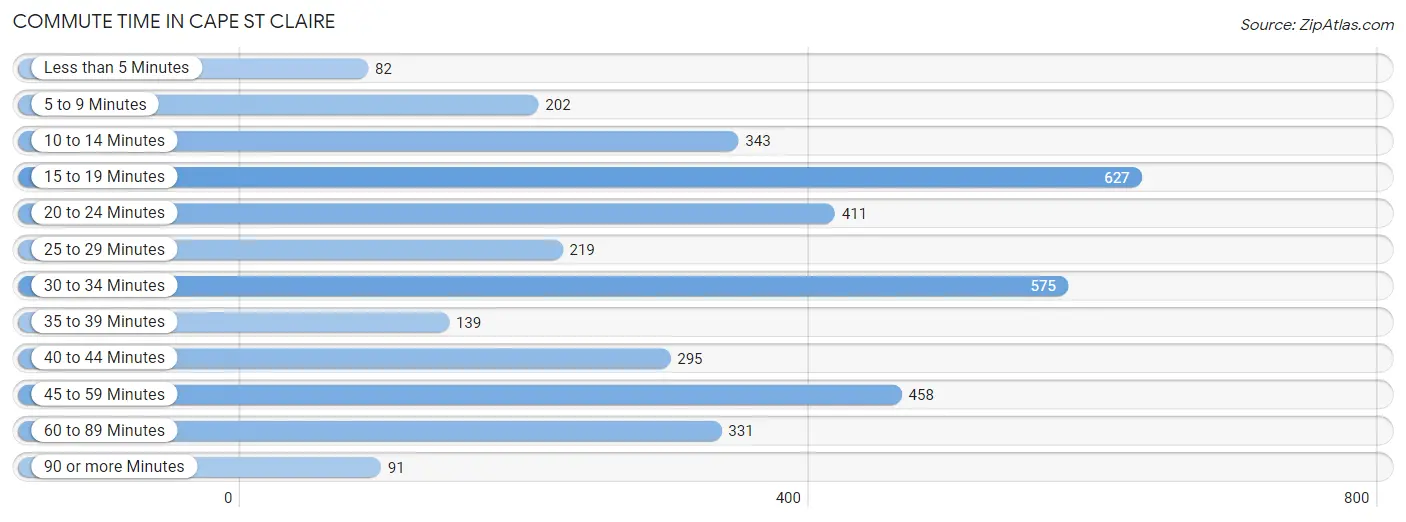
| Commute Time | # Commuters | % Commuters |
| Less than 5 Minutes | 82 | 2.2% |
| 5 to 9 Minutes | 202 | 5.3% |
| 10 to 14 Minutes | 343 | 9.1% |
| 15 to 19 Minutes | 627 | 16.6% |
| 20 to 24 Minutes | 411 | 10.9% |
| 25 to 29 Minutes | 219 | 5.8% |
| 30 to 34 Minutes | 575 | 15.2% |
| 35 to 39 Minutes | 139 | 3.7% |
| 40 to 44 Minutes | 295 | 7.8% |
| 45 to 59 Minutes | 458 | 12.1% |
| 60 to 89 Minutes | 331 | 8.8% |
| 90 or more Minutes | 91 | 2.4% |
Commute Time by Sex in Cape St Claire
The most common commute times in Cape St Claire are 45 to 59 minutes (340 commuters, 17.1%) for males and 15 to 19 minutes (371 commuters, 20.8%) for females.
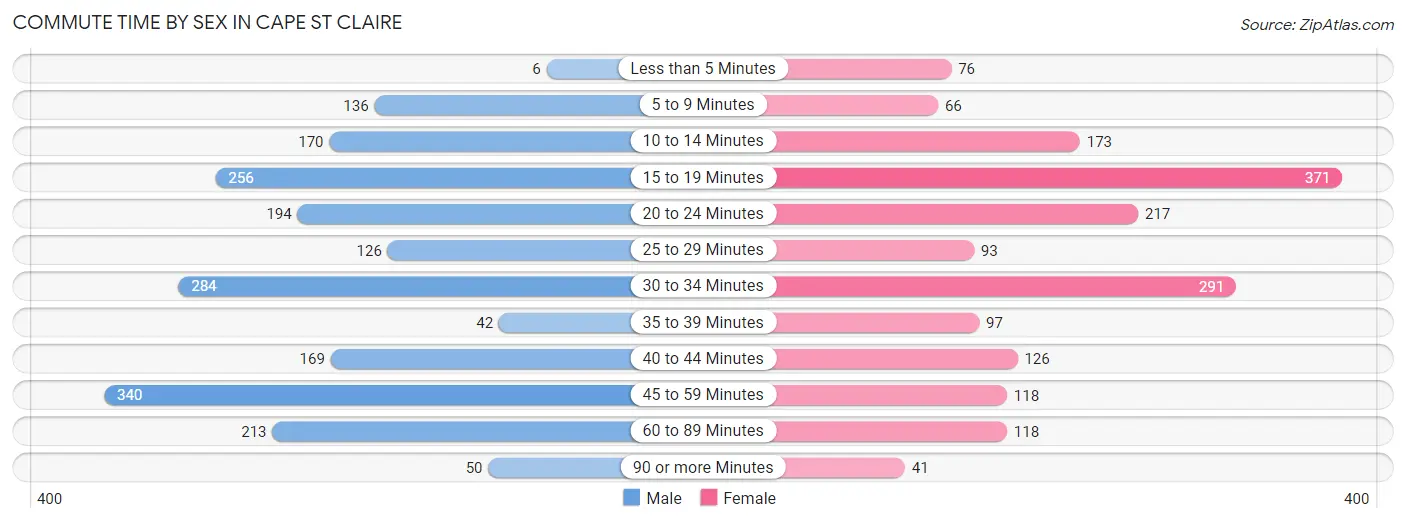
| Commute Time | Male | Female |
| Less than 5 Minutes | 6 (0.3%) | 76 (4.3%) |
| 5 to 9 Minutes | 136 (6.9%) | 66 (3.7%) |
| 10 to 14 Minutes | 170 (8.6%) | 173 (9.7%) |
| 15 to 19 Minutes | 256 (12.9%) | 371 (20.8%) |
| 20 to 24 Minutes | 194 (9.8%) | 217 (12.1%) |
| 25 to 29 Minutes | 126 (6.3%) | 93 (5.2%) |
| 30 to 34 Minutes | 284 (14.3%) | 291 (16.3%) |
| 35 to 39 Minutes | 42 (2.1%) | 97 (5.4%) |
| 40 to 44 Minutes | 169 (8.5%) | 126 (7.0%) |
| 45 to 59 Minutes | 340 (17.1%) | 118 (6.6%) |
| 60 to 89 Minutes | 213 (10.7%) | 118 (6.6%) |
| 90 or more Minutes | 50 (2.5%) | 41 (2.3%) |
Time of Departure to Work by Sex in Cape St Claire
The most frequent times of departure to work in Cape St Claire are 7:00 AM to 7:29 AM (289, 14.5%) for males and 7:30 AM to 7:59 AM (314, 17.6%) for females.
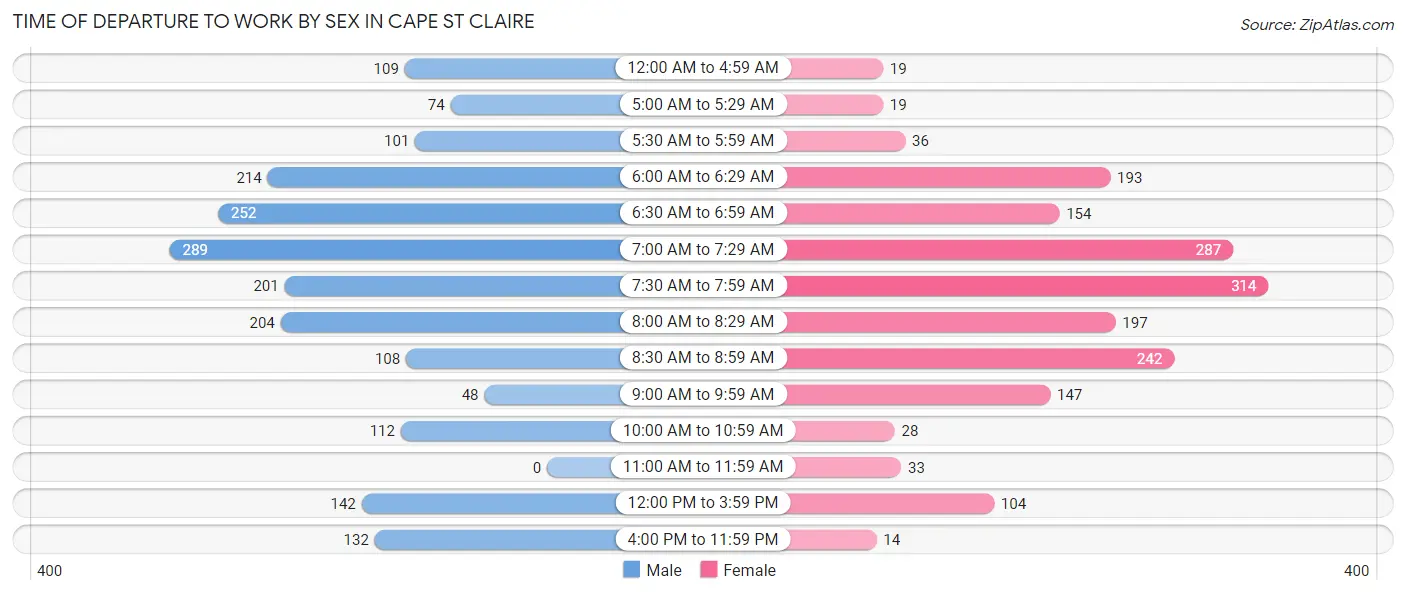
| Time of Departure | Male | Female |
| 12:00 AM to 4:59 AM | 109 (5.5%) | 19 (1.1%) |
| 5:00 AM to 5:29 AM | 74 (3.7%) | 19 (1.1%) |
| 5:30 AM to 5:59 AM | 101 (5.1%) | 36 (2.0%) |
| 6:00 AM to 6:29 AM | 214 (10.8%) | 193 (10.8%) |
| 6:30 AM to 6:59 AM | 252 (12.7%) | 154 (8.6%) |
| 7:00 AM to 7:29 AM | 289 (14.5%) | 287 (16.1%) |
| 7:30 AM to 7:59 AM | 201 (10.1%) | 314 (17.6%) |
| 8:00 AM to 8:29 AM | 204 (10.3%) | 197 (11.0%) |
| 8:30 AM to 8:59 AM | 108 (5.4%) | 242 (13.5%) |
| 9:00 AM to 9:59 AM | 48 (2.4%) | 147 (8.2%) |
| 10:00 AM to 10:59 AM | 112 (5.6%) | 28 (1.6%) |
| 11:00 AM to 11:59 AM | 0 (0.0%) | 33 (1.8%) |
| 12:00 PM to 3:59 PM | 142 (7.1%) | 104 (5.8%) |
| 4:00 PM to 11:59 PM | 132 (6.7%) | 14 (0.8%) |
| Total | 1,986 (100.0%) | 1,787 (100.0%) |
Housing Occupancy in Cape St Claire
Occupancy by Ownership in Cape St Claire
Of the total 3,413 dwellings in Cape St Claire, owner-occupied units account for 2,892 (84.7%), while renter-occupied units make up 521 (15.3%).
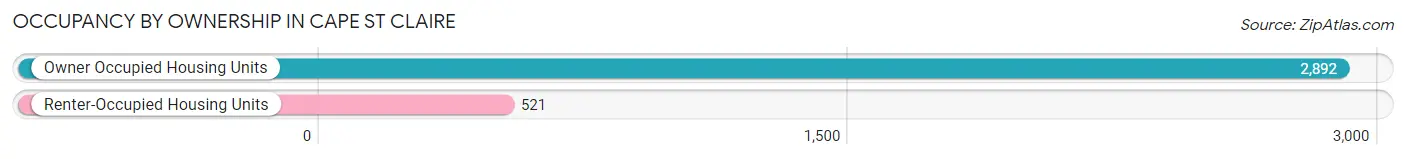
| Occupancy | # Housing Units | % Housing Units |
| Owner Occupied Housing Units | 2,892 | 84.7% |
| Renter-Occupied Housing Units | 521 | 15.3% |
| Total Occupied Housing Units | 3,413 | 100.0% |
Occupancy by Household Size in Cape St Claire
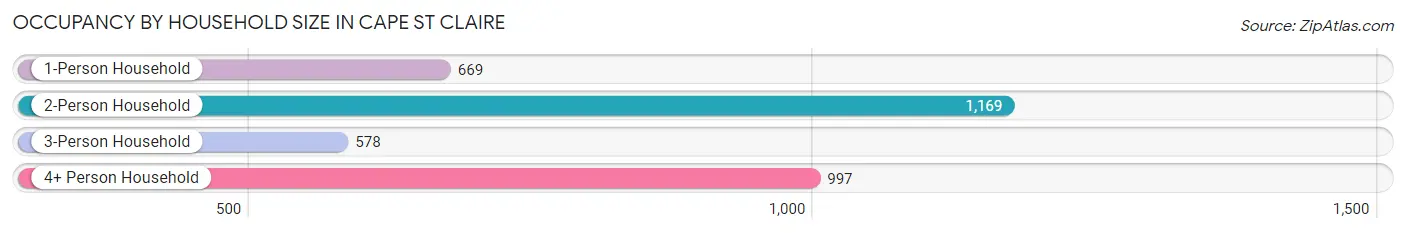
| Household Size | # Housing Units | % Housing Units |
| 1-Person Household | 669 | 19.6% |
| 2-Person Household | 1,169 | 34.3% |
| 3-Person Household | 578 | 16.9% |
| 4+ Person Household | 997 | 29.2% |
| Total Housing Units | 3,413 | 100.0% |
Occupancy by Ownership by Household Size in Cape St Claire
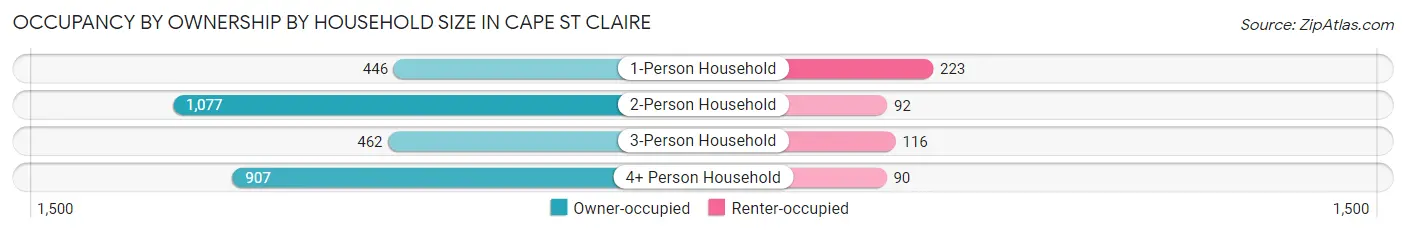
| Household Size | Owner-occupied | Renter-occupied |
| 1-Person Household | 446 (66.7%) | 223 (33.3%) |
| 2-Person Household | 1,077 (92.1%) | 92 (7.9%) |
| 3-Person Household | 462 (79.9%) | 116 (20.1%) |
| 4+ Person Household | 907 (91.0%) | 90 (9.0%) |
| Total Housing Units | 2,892 (84.7%) | 521 (15.3%) |
Occupancy by Educational Attainment in Cape St Claire
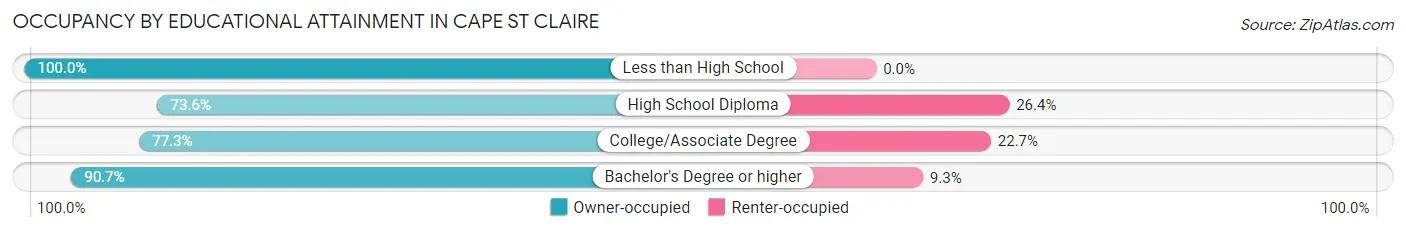
| Household Size | Owner-occupied | Renter-occupied |
| Less than High School | 68 (100.0%) | 0 (0.0%) |
| High School Diploma | 388 (73.6%) | 139 (26.4%) |
| College/Associate Degree | 693 (77.3%) | 204 (22.7%) |
| Bachelor's Degree or higher | 1,743 (90.7%) | 178 (9.3%) |
Occupancy by Age of Householder in Cape St Claire
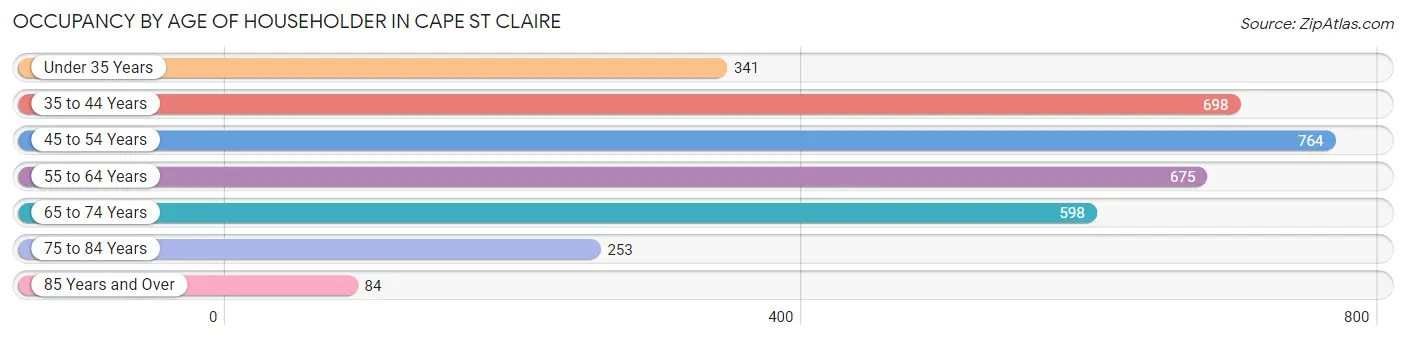
| Age Bracket | # Households | % Households |
| Under 35 Years | 341 | 10.0% |
| 35 to 44 Years | 698 | 20.4% |
| 45 to 54 Years | 764 | 22.4% |
| 55 to 64 Years | 675 | 19.8% |
| 65 to 74 Years | 598 | 17.5% |
| 75 to 84 Years | 253 | 7.4% |
| 85 Years and Over | 84 | 2.5% |
| Total | 3,413 | 100.0% |
Housing Finances in Cape St Claire
Median Income by Occupancy in Cape St Claire
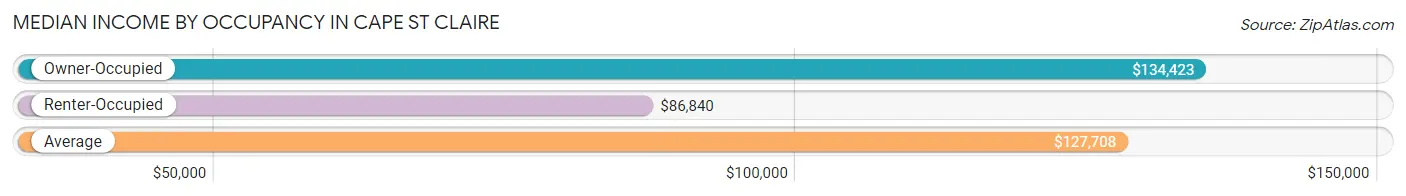
| Occupancy Type | # Households | Median Income |
| Owner-Occupied | 2,892 (84.7%) | $134,423 |
| Renter-Occupied | 521 (15.3%) | $86,840 |
| Average | 3,413 (100.0%) | $127,708 |
Occupancy by Householder Income Bracket in Cape St Claire
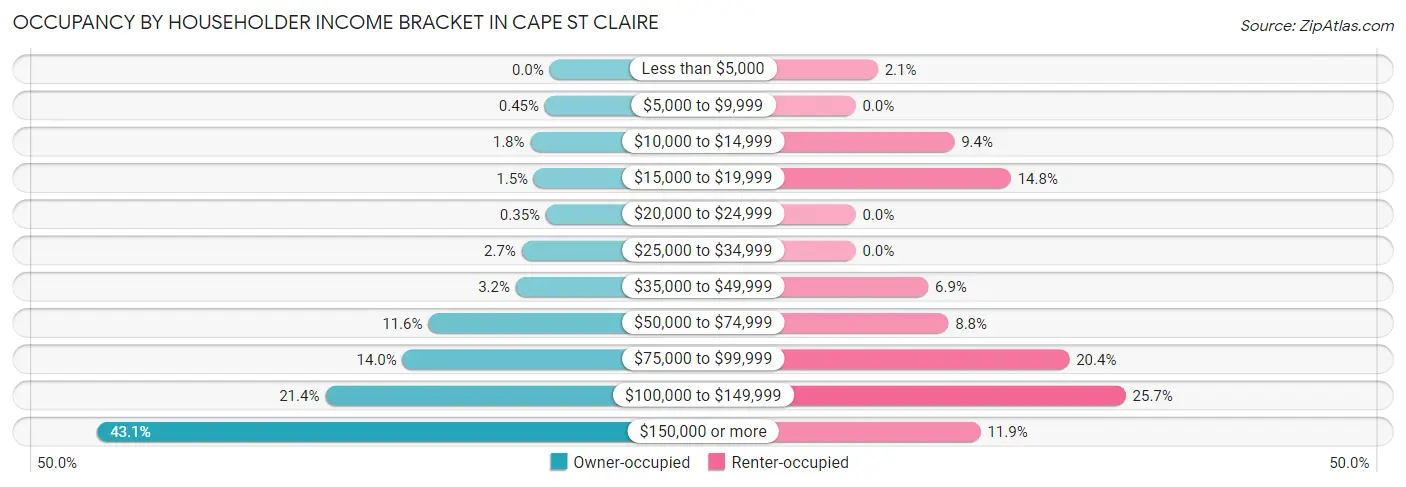
| Income Bracket | Owner-occupied | Renter-occupied |
| Less than $5,000 | 0 (0.0%) | 11 (2.1%) |
| $5,000 to $9,999 | 13 (0.4%) | 0 (0.0%) |
| $10,000 to $14,999 | 53 (1.8%) | 49 (9.4%) |
| $15,000 to $19,999 | 43 (1.5%) | 77 (14.8%) |
| $20,000 to $24,999 | 10 (0.4%) | 0 (0.0%) |
| $25,000 to $34,999 | 77 (2.7%) | 0 (0.0%) |
| $35,000 to $49,999 | 93 (3.2%) | 36 (6.9%) |
| $50,000 to $74,999 | 334 (11.6%) | 46 (8.8%) |
| $75,000 to $99,999 | 405 (14.0%) | 106 (20.3%) |
| $100,000 to $149,999 | 618 (21.4%) | 134 (25.7%) |
| $150,000 or more | 1,246 (43.1%) | 62 (11.9%) |
| Total | 2,892 (100.0%) | 521 (100.0%) |
Monthly Housing Cost Tiers in Cape St Claire
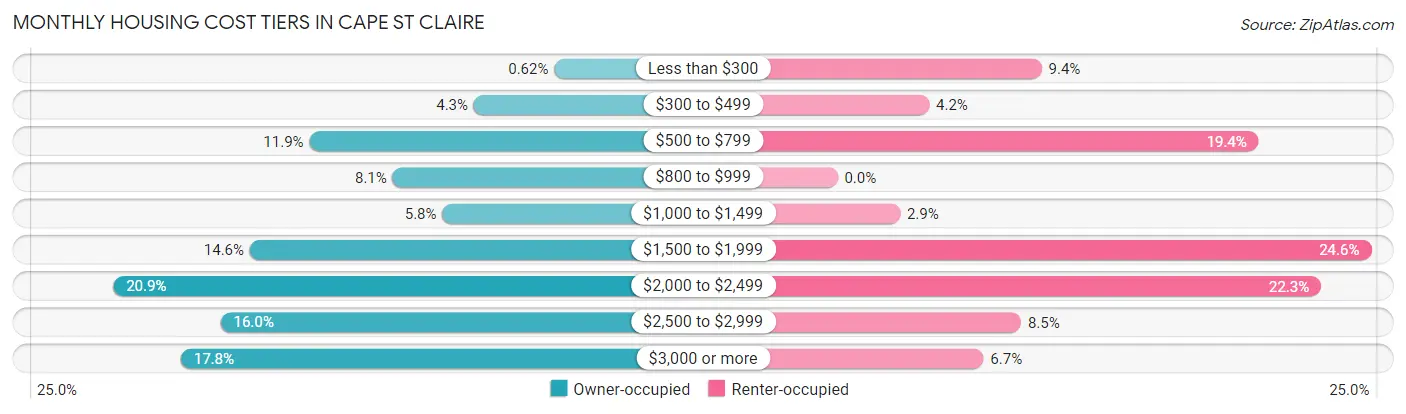
| Monthly Cost | Owner-occupied | Renter-occupied |
| Less than $300 | 18 (0.6%) | 49 (9.4%) |
| $300 to $499 | 125 (4.3%) | 22 (4.2%) |
| $500 to $799 | 344 (11.9%) | 101 (19.4%) |
| $800 to $999 | 233 (8.1%) | 0 (0.0%) |
| $1,000 to $1,499 | 167 (5.8%) | 15 (2.9%) |
| $1,500 to $1,999 | 423 (14.6%) | 128 (24.6%) |
| $2,000 to $2,499 | 605 (20.9%) | 116 (22.3%) |
| $2,500 to $2,999 | 462 (16.0%) | 44 (8.5%) |
| $3,000 or more | 515 (17.8%) | 35 (6.7%) |
| Total | 2,892 (100.0%) | 521 (100.0%) |
Physical Housing Characteristics in Cape St Claire
Housing Structures in Cape St Claire
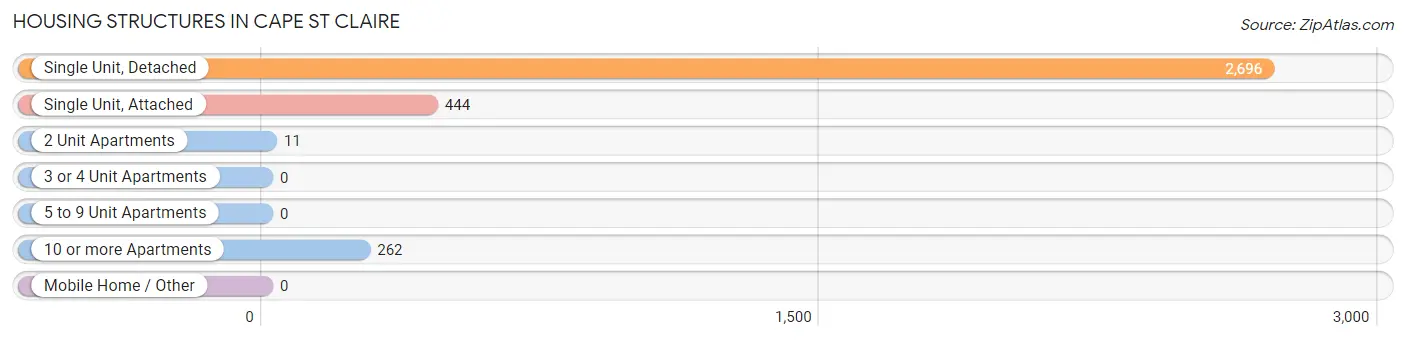
| Structure Type | # Housing Units | % Housing Units |
| Single Unit, Detached | 2,696 | 79.0% |
| Single Unit, Attached | 444 | 13.0% |
| 2 Unit Apartments | 11 | 0.3% |
| 3 or 4 Unit Apartments | 0 | 0.0% |
| 5 to 9 Unit Apartments | 0 | 0.0% |
| 10 or more Apartments | 262 | 7.7% |
| Mobile Home / Other | 0 | 0.0% |
| Total | 3,413 | 100.0% |
Housing Structures by Occupancy in Cape St Claire
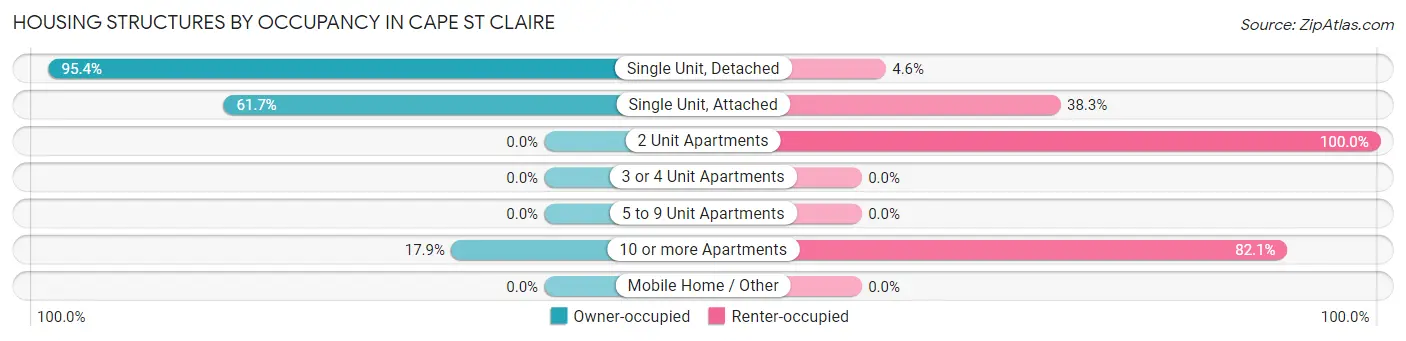
| Structure Type | Owner-occupied | Renter-occupied |
| Single Unit, Detached | 2,571 (95.4%) | 125 (4.6%) |
| Single Unit, Attached | 274 (61.7%) | 170 (38.3%) |
| 2 Unit Apartments | 0 (0.0%) | 11 (100.0%) |
| 3 or 4 Unit Apartments | 0 (0.0%) | 0 (0.0%) |
| 5 to 9 Unit Apartments | 0 (0.0%) | 0 (0.0%) |
| 10 or more Apartments | 47 (17.9%) | 215 (82.1%) |
| Mobile Home / Other | 0 (0.0%) | 0 (0.0%) |
| Total | 2,892 (84.7%) | 521 (15.3%) |
Housing Structures by Number of Rooms in Cape St Claire
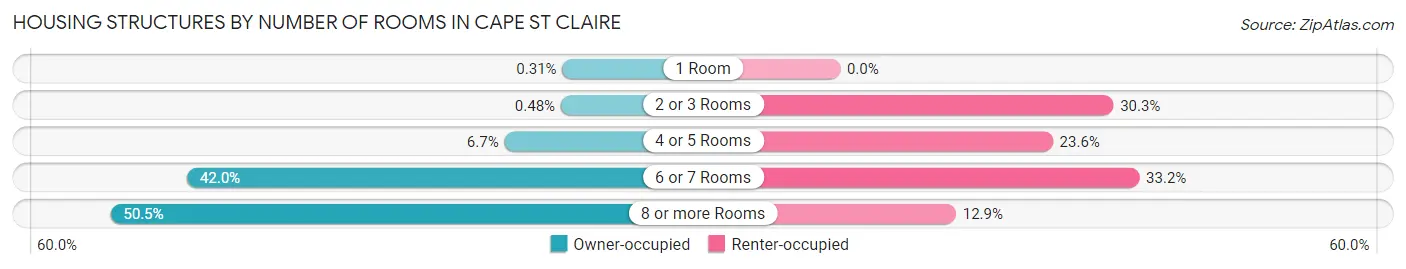
| Number of Rooms | Owner-occupied | Renter-occupied |
| 1 Room | 9 (0.3%) | 0 (0.0%) |
| 2 or 3 Rooms | 14 (0.5%) | 158 (30.3%) |
| 4 or 5 Rooms | 195 (6.7%) | 123 (23.6%) |
| 6 or 7 Rooms | 1,214 (42.0%) | 173 (33.2%) |
| 8 or more Rooms | 1,460 (50.5%) | 67 (12.9%) |
| Total | 2,892 (100.0%) | 521 (100.0%) |
Housing Structure by Heating Type in Cape St Claire
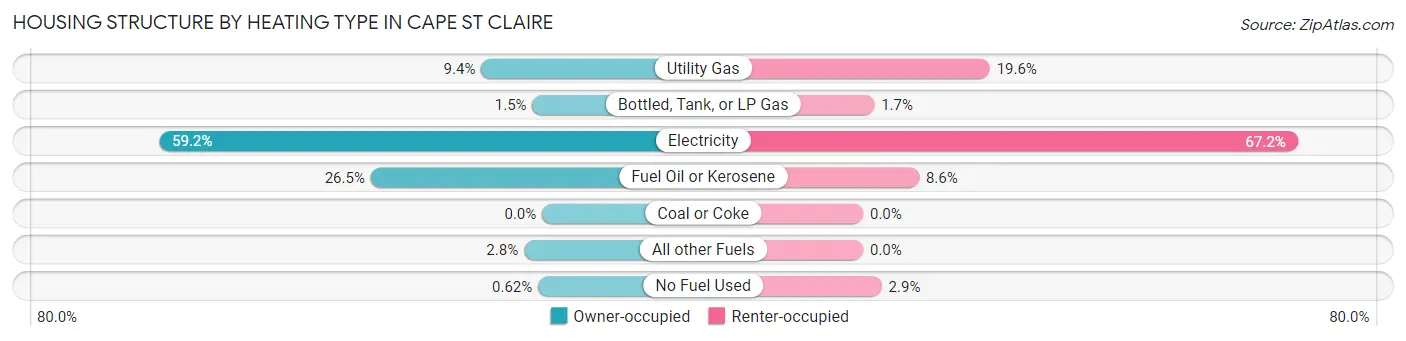
| Heating Type | Owner-occupied | Renter-occupied |
| Utility Gas | 272 (9.4%) | 102 (19.6%) |
| Bottled, Tank, or LP Gas | 43 (1.5%) | 9 (1.7%) |
| Electricity | 1,712 (59.2%) | 350 (67.2%) |
| Fuel Oil or Kerosene | 766 (26.5%) | 45 (8.6%) |
| Coal or Coke | 0 (0.0%) | 0 (0.0%) |
| All other Fuels | 81 (2.8%) | 0 (0.0%) |
| No Fuel Used | 18 (0.6%) | 15 (2.9%) |
| Total | 2,892 (100.0%) | 521 (100.0%) |
Household Vehicle Usage in Cape St Claire
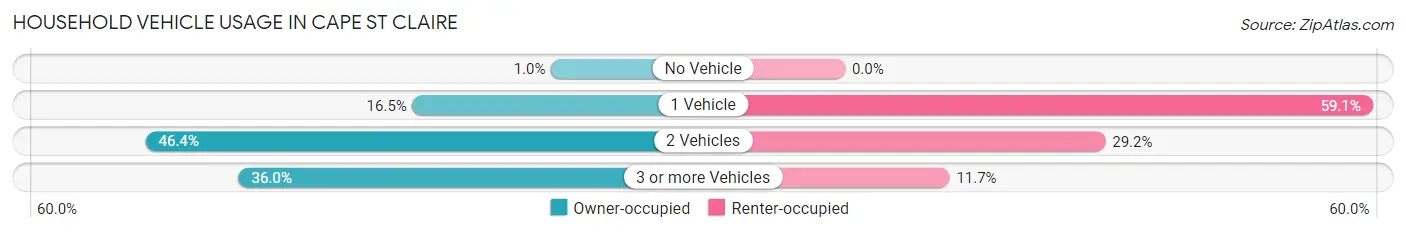
| Vehicles per Household | Owner-occupied | Renter-occupied |
| No Vehicle | 29 (1.0%) | 0 (0.0%) |
| 1 Vehicle | 478 (16.5%) | 308 (59.1%) |
| 2 Vehicles | 1,343 (46.4%) | 152 (29.2%) |
| 3 or more Vehicles | 1,042 (36.0%) | 61 (11.7%) |
| Total | 2,892 (100.0%) | 521 (100.0%) |
Real Estate & Mortgages in Cape St Claire
Real Estate and Mortgage Overview in Cape St Claire
| Characteristic | Without Mortgage | With Mortgage |
| Housing Units | 704 | 2,188 |
| Median Property Value | $445,500 | $465,100 |
| Median Household Income | $93,391 | $1,036 |
| Monthly Housing Costs | $763 | $485 |
| Real Estate Taxes | $3,878 | $12 |
Property Value by Mortgage Status in Cape St Claire
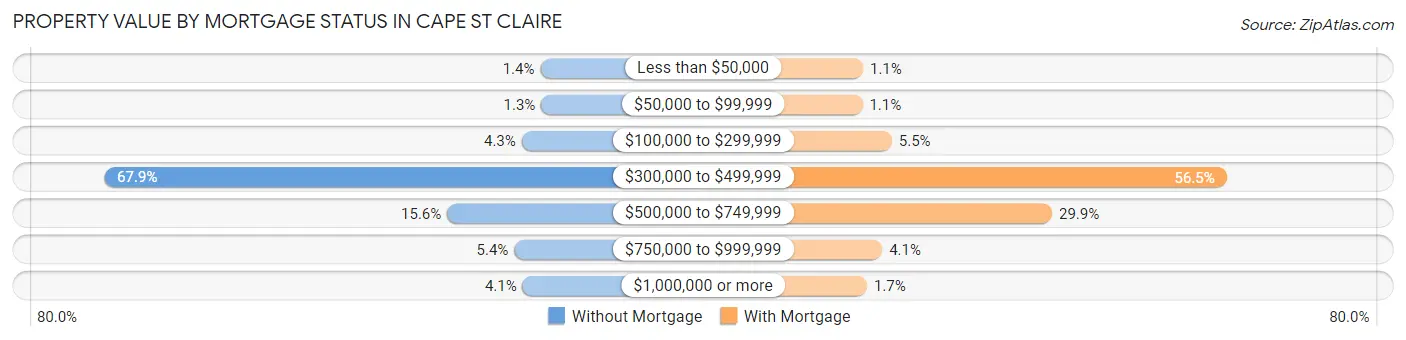
| Property Value | Without Mortgage | With Mortgage |
| Less than $50,000 | 10 (1.4%) | 25 (1.1%) |
| $50,000 to $99,999 | 9 (1.3%) | 23 (1.1%) |
| $100,000 to $299,999 | 30 (4.3%) | 121 (5.5%) |
| $300,000 to $499,999 | 478 (67.9%) | 1,237 (56.5%) |
| $500,000 to $749,999 | 110 (15.6%) | 655 (29.9%) |
| $750,000 to $999,999 | 38 (5.4%) | 89 (4.1%) |
| $1,000,000 or more | 29 (4.1%) | 38 (1.7%) |
| Total | 704 (100.0%) | 2,188 (100.0%) |
Household Income by Mortgage Status in Cape St Claire
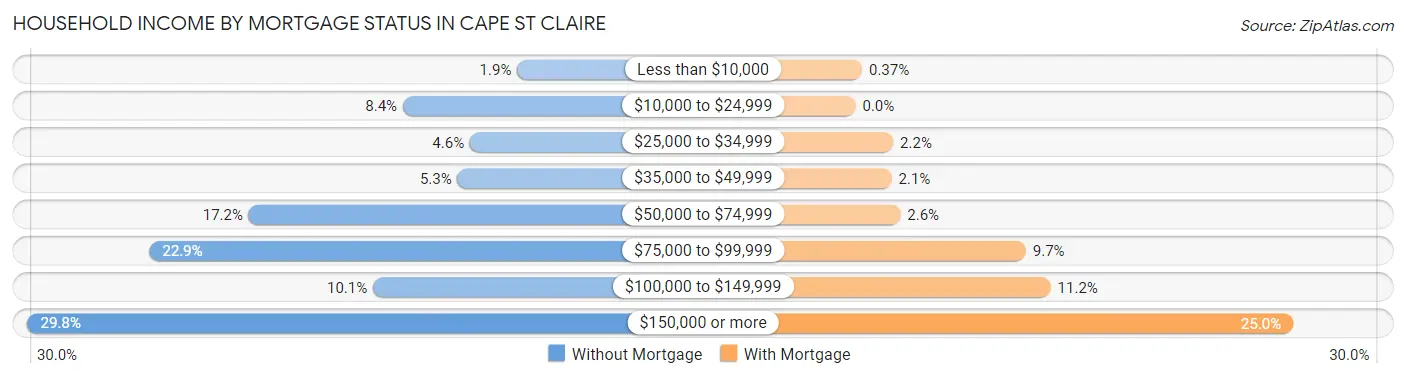
| Household Income | Without Mortgage | With Mortgage |
| Less than $10,000 | 13 (1.8%) | 8 (0.4%) |
| $10,000 to $24,999 | 59 (8.4%) | 0 (0.0%) |
| $25,000 to $34,999 | 32 (4.5%) | 47 (2.1%) |
| $35,000 to $49,999 | 37 (5.3%) | 45 (2.1%) |
| $50,000 to $74,999 | 121 (17.2%) | 56 (2.6%) |
| $75,000 to $99,999 | 161 (22.9%) | 213 (9.7%) |
| $100,000 to $149,999 | 71 (10.1%) | 244 (11.2%) |
| $150,000 or more | 210 (29.8%) | 547 (25.0%) |
| Total | 704 (100.0%) | 2,188 (100.0%) |
Property Value to Household Income Ratio in Cape St Claire
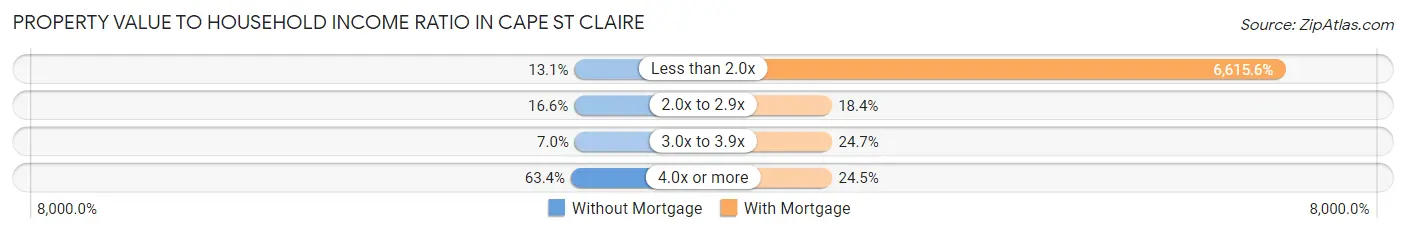
| Value-to-Income Ratio | Without Mortgage | With Mortgage |
| Less than 2.0x | 92 (13.1%) | 144,750 (6,615.6%) |
| 2.0x to 2.9x | 117 (16.6%) | 403 (18.4%) |
| 3.0x to 3.9x | 49 (7.0%) | 540 (24.7%) |
| 4.0x or more | 446 (63.3%) | 537 (24.5%) |
| Total | 704 (100.0%) | 2,188 (100.0%) |
Real Estate Taxes by Mortgage Status in Cape St Claire
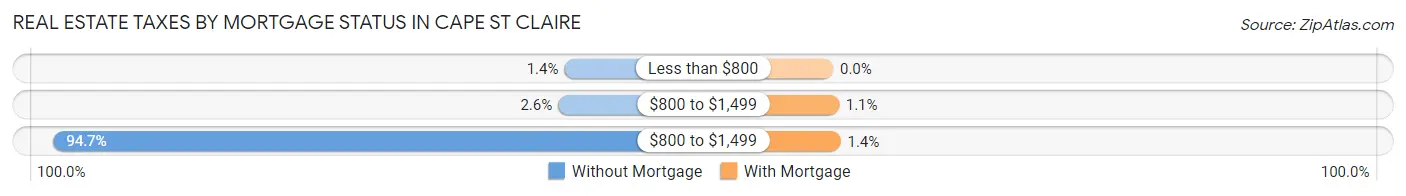
| Property Taxes | Without Mortgage | With Mortgage |
| Less than $800 | 10 (1.4%) | 0 (0.0%) |
| $800 to $1,499 | 18 (2.6%) | 23 (1.1%) |
| $800 to $1,499 | 667 (94.7%) | 30 (1.4%) |
| Total | 704 (100.0%) | 2,188 (100.0%) |
Health & Disability in Cape St Claire
Health Insurance Coverage by Age in Cape St Claire
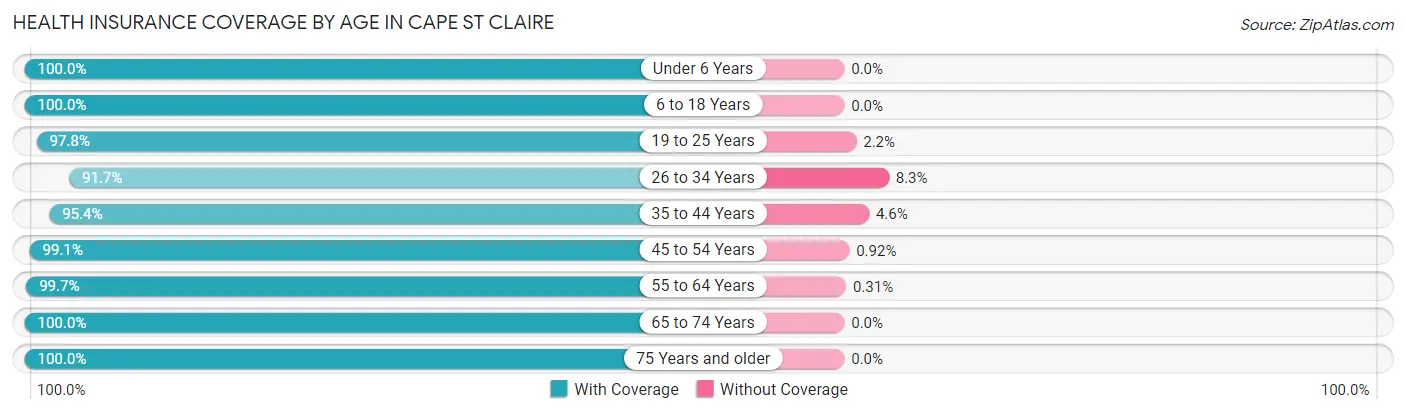
| Age Bracket | With Coverage | Without Coverage |
| Under 6 Years | 719 (100.0%) | 0 (0.0%) |
| 6 to 18 Years | 1,793 (100.0%) | 0 (0.0%) |
| 19 to 25 Years | 483 (97.8%) | 11 (2.2%) |
| 26 to 34 Years | 707 (91.7%) | 64 (8.3%) |
| 35 to 44 Years | 1,202 (95.4%) | 58 (4.6%) |
| 45 to 54 Years | 1,289 (99.1%) | 12 (0.9%) |
| 55 to 64 Years | 1,280 (99.7%) | 4 (0.3%) |
| 65 to 74 Years | 1,027 (100.0%) | 0 (0.0%) |
| 75 Years and older | 475 (100.0%) | 0 (0.0%) |
| Total | 8,975 (98.4%) | 149 (1.6%) |
Health Insurance Coverage by Citizenship Status in Cape St Claire
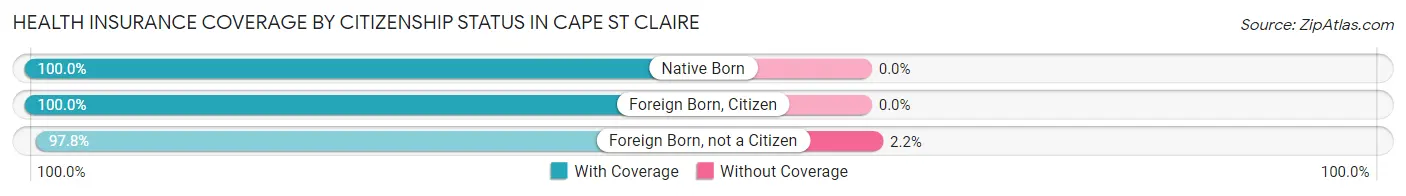
| Citizenship Status | With Coverage | Without Coverage |
| Native Born | 719 (100.0%) | 0 (0.0%) |
| Foreign Born, Citizen | 1,793 (100.0%) | 0 (0.0%) |
| Foreign Born, not a Citizen | 483 (97.8%) | 11 (2.2%) |
Health Insurance Coverage by Household Income in Cape St Claire
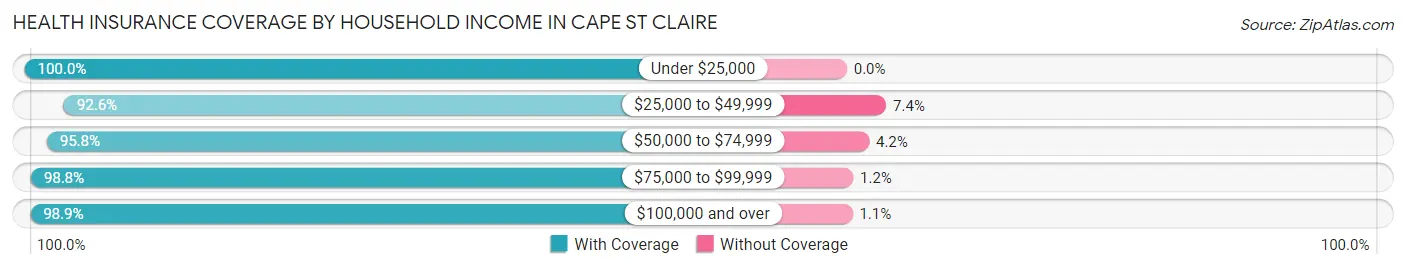
| Household Income | With Coverage | Without Coverage |
| Under $25,000 | 326 (100.0%) | 0 (0.0%) |
| $25,000 to $49,999 | 377 (92.6%) | 30 (7.4%) |
| $50,000 to $74,999 | 896 (95.8%) | 39 (4.2%) |
| $75,000 to $99,999 | 1,088 (98.8%) | 13 (1.2%) |
| $100,000 and over | 6,277 (98.9%) | 67 (1.1%) |
Public vs Private Health Insurance Coverage by Age in Cape St Claire
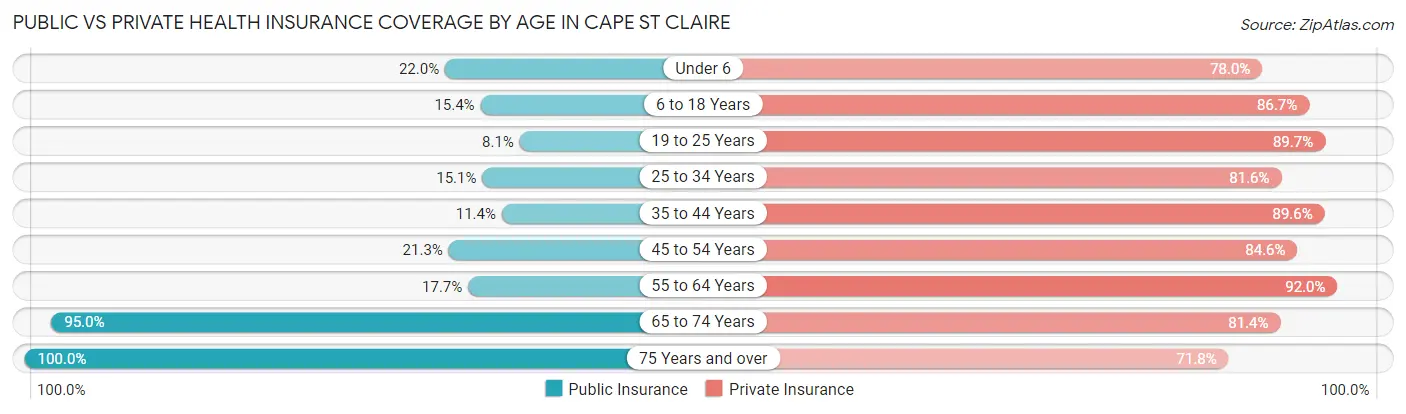
| Age Bracket | Public Insurance | Private Insurance |
| Under 6 | 158 (22.0%) | 561 (78.0%) |
| 6 to 18 Years | 276 (15.4%) | 1,555 (86.7%) |
| 19 to 25 Years | 40 (8.1%) | 443 (89.7%) |
| 25 to 34 Years | 116 (15.0%) | 629 (81.6%) |
| 35 to 44 Years | 144 (11.4%) | 1,129 (89.6%) |
| 45 to 54 Years | 277 (21.3%) | 1,100 (84.6%) |
| 55 to 64 Years | 227 (17.7%) | 1,181 (92.0%) |
| 65 to 74 Years | 976 (95.0%) | 836 (81.4%) |
| 75 Years and over | 475 (100.0%) | 341 (71.8%) |
| Total | 2,689 (29.5%) | 7,775 (85.2%) |
Disability Status by Sex by Age in Cape St Claire
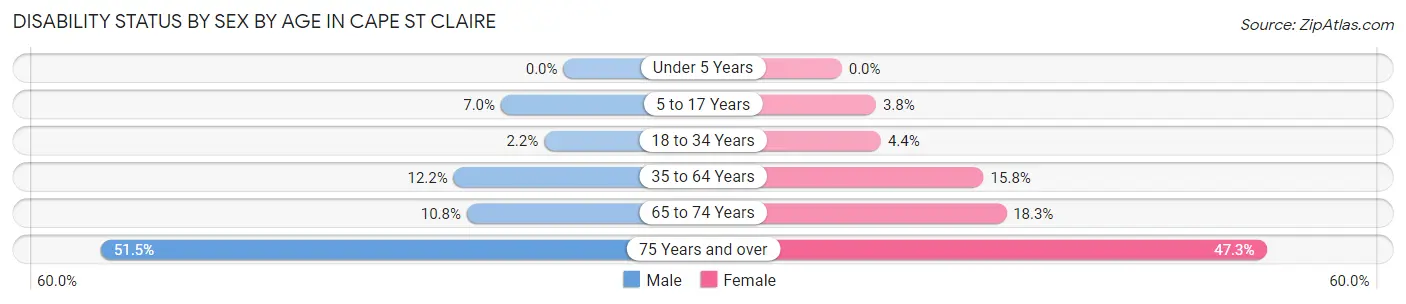
| Age Bracket | Male | Female |
| Under 5 Years | 0 (0.0%) | 0 (0.0%) |
| 5 to 17 Years | 74 (7.0%) | 27 (3.8%) |
| 18 to 34 Years | 13 (2.1%) | 35 (4.4%) |
| 35 to 64 Years | 225 (12.2%) | 317 (15.8%) |
| 65 to 74 Years | 57 (10.7%) | 91 (18.3%) |
| 75 Years and over | 103 (51.5%) | 130 (47.3%) |
Disability Class by Sex by Age in Cape St Claire
Disability Class: Hearing Difficulty
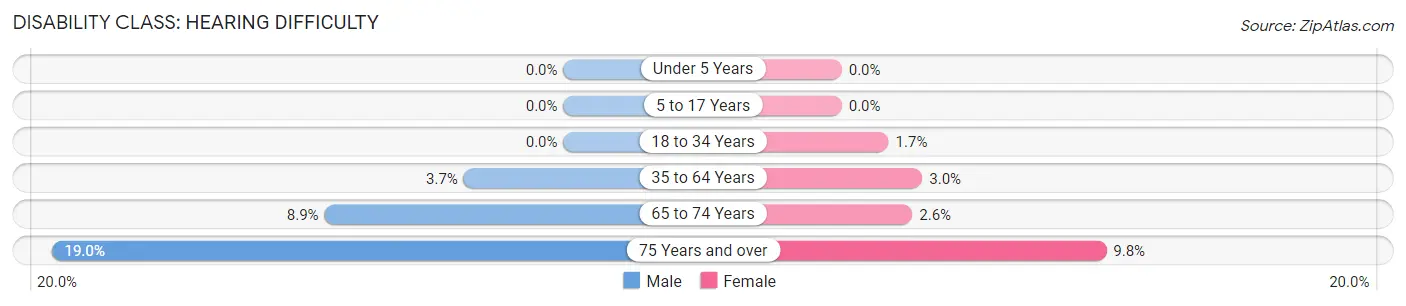
| Age Bracket | Male | Female |
| Under 5 Years | 0 (0.0%) | 0 (0.0%) |
| 5 to 17 Years | 0 (0.0%) | 0 (0.0%) |
| 18 to 34 Years | 0 (0.0%) | 14 (1.7%) |
| 35 to 64 Years | 68 (3.7%) | 60 (3.0%) |
| 65 to 74 Years | 47 (8.9%) | 13 (2.6%) |
| 75 Years and over | 38 (19.0%) | 27 (9.8%) |
Disability Class: Vision Difficulty
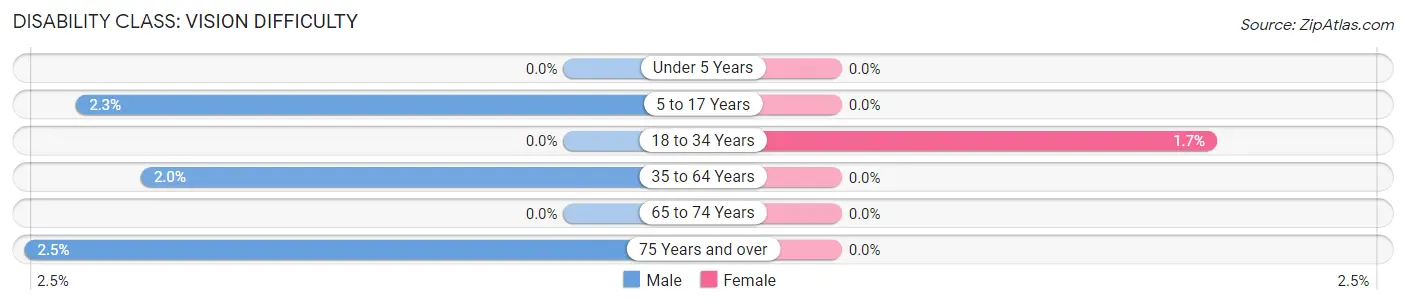
| Age Bracket | Male | Female |
| Under 5 Years | 0 (0.0%) | 0 (0.0%) |
| 5 to 17 Years | 24 (2.3%) | 0 (0.0%) |
| 18 to 34 Years | 0 (0.0%) | 14 (1.7%) |
| 35 to 64 Years | 36 (2.0%) | 0 (0.0%) |
| 65 to 74 Years | 0 (0.0%) | 0 (0.0%) |
| 75 Years and over | 5 (2.5%) | 0 (0.0%) |
Disability Class: Cognitive Difficulty
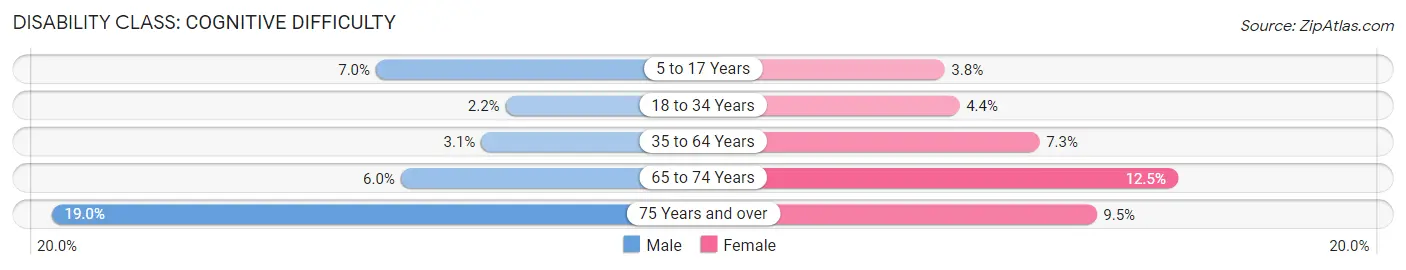
| Age Bracket | Male | Female |
| 5 to 17 Years | 74 (7.0%) | 27 (3.8%) |
| 18 to 34 Years | 13 (2.1%) | 35 (4.4%) |
| 35 to 64 Years | 56 (3.0%) | 147 (7.3%) |
| 65 to 74 Years | 32 (6.0%) | 62 (12.5%) |
| 75 Years and over | 38 (19.0%) | 26 (9.5%) |
Disability Class: Ambulatory Difficulty
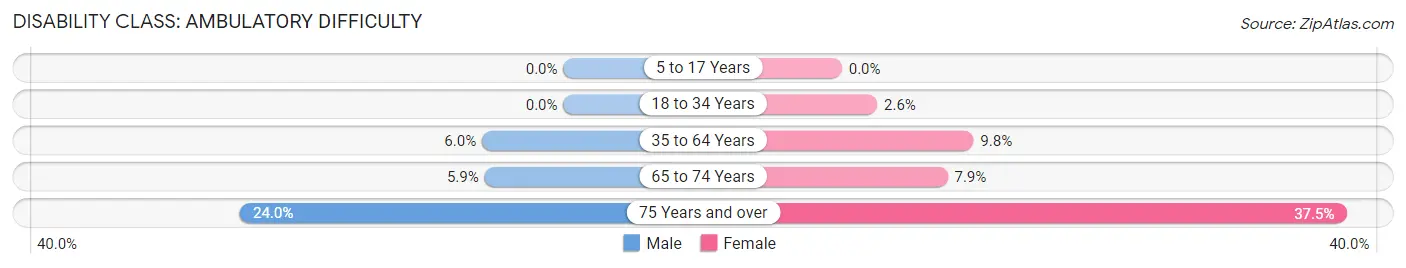
| Age Bracket | Male | Female |
| 5 to 17 Years | 0 (0.0%) | 0 (0.0%) |
| 18 to 34 Years | 0 (0.0%) | 21 (2.6%) |
| 35 to 64 Years | 111 (6.0%) | 196 (9.8%) |
| 65 to 74 Years | 31 (5.9%) | 39 (7.9%) |
| 75 Years and over | 48 (24.0%) | 103 (37.4%) |
Disability Class: Self-Care Difficulty
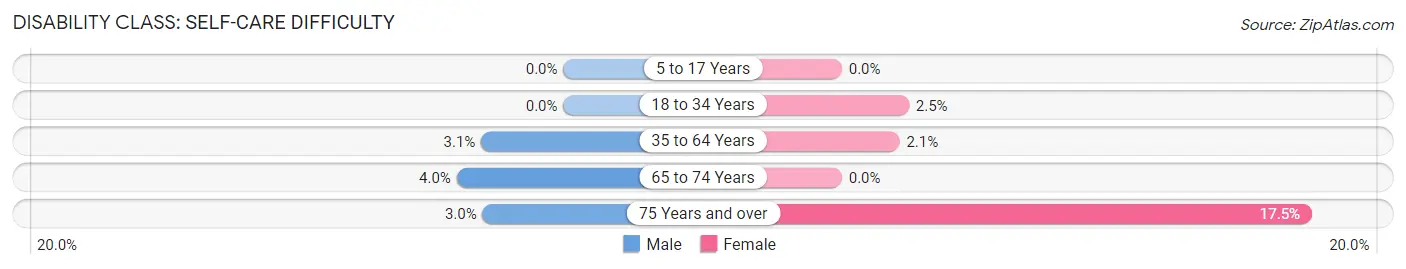
| Age Bracket | Male | Female |
| 5 to 17 Years | 0 (0.0%) | 0 (0.0%) |
| 18 to 34 Years | 0 (0.0%) | 20 (2.5%) |
| 35 to 64 Years | 56 (3.0%) | 43 (2.1%) |
| 65 to 74 Years | 21 (4.0%) | 0 (0.0%) |
| 75 Years and over | 6 (3.0%) | 48 (17.4%) |
Technology Access in Cape St Claire
Computing Device Access in Cape St Claire
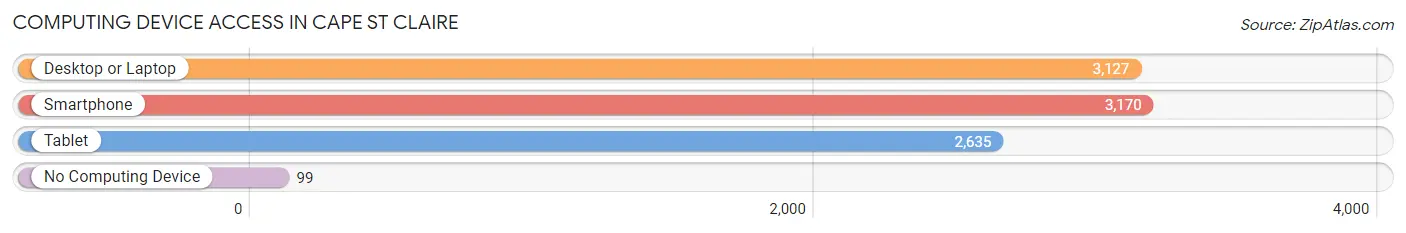
| Device Type | # Households | % Households |
| Desktop or Laptop | 3,127 | 91.6% |
| Smartphone | 3,170 | 92.9% |
| Tablet | 2,635 | 77.2% |
| No Computing Device | 99 | 2.9% |
| Total | 3,413 | 100.0% |
Internet Access in Cape St Claire
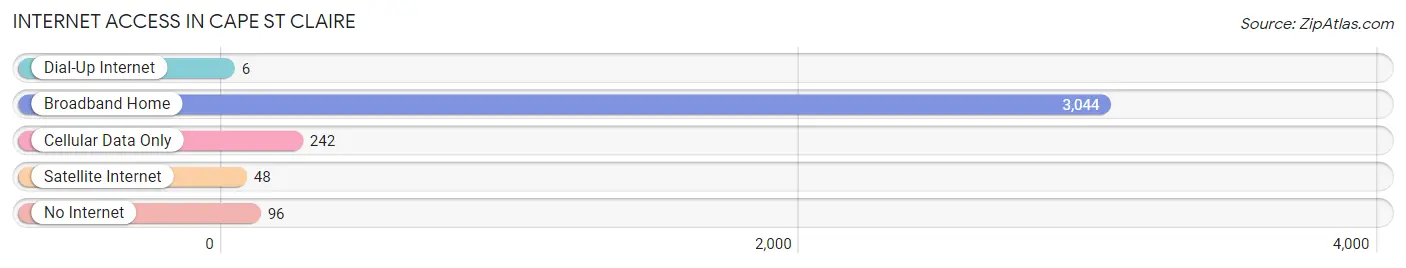
| Internet Type | # Households | % Households |
| Dial-Up Internet | 6 | 0.2% |
| Broadband Home | 3,044 | 89.2% |
| Cellular Data Only | 242 | 7.1% |
| Satellite Internet | 48 | 1.4% |
| No Internet | 96 | 2.8% |
| Total | 3,413 | 100.0% |
Cape St Claire Summary
Cape St Claire is a census-designated place (CDP) located in Anne Arundel County, Maryland. It is situated on the western shore of the Chesapeake Bay, approximately 10 miles south of Annapolis. The population of Cape St Claire was 8,945 at the 2010 census.
Geography
Cape St Claire is located at 39°02'45"N 76°31'45"W (39.04583, -76.52917). According to the United States Census Bureau, the CDP has a total area of 4.3 square miles (11.2 km2), of which 3.9 square miles (10.1 km2) is land and 0.4 square miles (1.1 km2) (9.17%) is water.
The community is bordered by the Magothy River to the north, the Chesapeake Bay to the east, and the South River to the south. It is located in the Severn River watershed.
History
Cape St Claire was first settled in the early 1700s by English colonists. The area was originally known as "Cape St. Claire" after the nearby St. Claire Creek. The creek was named after the French explorer Pierre St. Claire, who explored the area in 1608.
The area was primarily a farming community until the 1950s, when it began to experience rapid growth due to its proximity to Annapolis and Washington, D.C. The population of Cape St Claire increased from 1,000 in 1950 to 8,945 in 2010.
Economy
Cape St Claire is primarily a residential community, with most of its residents commuting to nearby cities for work. The largest employers in the area are the Anne Arundel County Public Schools, Anne Arundel Medical Center, and the U.S. Naval Academy.
Demographics
As of the 2010 census, there were 8,945 people, 3,845 households, and 2,717 families residing in the CDP. The population density was 2,310.3 people per square mile (894.2/km2). There were 4,093 housing units at an average density of 1,053.3 per square mile (406.7/km2). The racial makeup of the CDP was 92.2% White, 3.3% African American, 0.2% Native American, 2.2% Asian, 0.3% Pacific Islander, 0.7% from other races, and 1.3% from two or more races. Hispanic or Latino of any race were 2.7% of the population.
There were 3,845 households, out of which 28.2% had children under the age of 18 living with them, 58.2% were married couples living together, 8.2% had a female householder with no husband present, and 30.3% were non-families. 24.2% of all households were made up of individuals, and 10.2% had someone living alone who was 65 years of age or older. The average household size was 2.32 and the average family size was 2.77.
In the CDP, the population was spread out, with 21.2% under the age of 18, 5.2% from 18 to 24, 25.2% from 25 to 44, 30.2% from 45 to 64, and 18.2% who were 65 years of age or older. The median age was 43 years. For every 100 females, there were 94.2 males. For every 100 females age 18 and over, there were 91.2 males.
The median income for a household in the CDP was $87,917, and the median income for a family was $102,917. Males had a median income of $71,250 versus $50,000 for females. The per capita income for the CDP was $45,917. About 2.2% of families and 3.2% of the population were below the poverty line, including 4.2% of those under age 18 and 2.2% of those age 65 or over.
Common Questions
What is Per Capita Income in Cape St Claire?
Per Capita income in Cape St Claire is $57,107.
What is the Median Family Income in Cape St Claire?
Median Family Income in Cape St Claire is $138,495.
What is the Median Household income in Cape St Claire?
Median Household Income in Cape St Claire is $127,708.
What is Income or Wage Gap in Cape St Claire?
Income or Wage Gap in Cape St Claire is 41.9%.
Women in Cape St Claire earn 58.1 cents for every dollar earned by a man.
What is Inequality or Gini Index in Cape St Claire?
Inequality or Gini Index in Cape St Claire is 0.40.
What is the Total Population of Cape St Claire?
Total Population of Cape St Claire is 9,212.
What is the Total Male Population of Cape St Claire?
Total Male Population of Cape St Claire is 4,614.
What is the Total Female Population of Cape St Claire?
Total Female Population of Cape St Claire is 4,598.
What is the Ratio of Males per 100 Females in Cape St Claire?
There are 100.35 Males per 100 Females in Cape St Claire.
What is the Ratio of Females per 100 Males in Cape St Claire?
There are 99.65 Females per 100 Males in Cape St Claire.
What is the Median Population Age in Cape St Claire?
Median Population Age in Cape St Claire is 41.3 Years.
What is the Average Family Size in Cape St Claire
Average Family Size in Cape St Claire is 3.1 People.
What is the Average Household Size in Cape St Claire
Average Household Size in Cape St Claire is 2.7 People.
How Large is the Labor Force in Cape St Claire?
There are 5,043 People in the Labor Forcein in Cape St Claire.
What is the Percentage of People in the Labor Force in Cape St Claire?
70.3% of People are in the Labor Force in Cape St Claire.
What is the Unemployment Rate in Cape St Claire?
Unemployment Rate in Cape St Claire is 5.8%.